UNIVERSITY OF CALIFORNIA SAN DIEGO Fluorine-19 ...
186
UNIVERSITY OF CALIFORNIA SAN DIEGO Fluorine-19 Magnetic Resonance Imaging platform to quantify T cell therapy biodistribution, persistence and efficacy A dissertation submitted in partial satisfaction of the requirements for the degree of Doctor of Philosophy in Bioengineering by Fanny Chapelin Committee in charge: Professor Pedro Cabrales, Chair Professor Eric T. Ahrens, Co-Chair Professor David Dubowitz Professor Stephen Schoenberger Professor Yingxiao Wang 2019
-
Upload
khangminh22 -
Category
Documents
-
view
1 -
download
0
Transcript of UNIVERSITY OF CALIFORNIA SAN DIEGO Fluorine-19 ...

UNIVERSITY OF CALIFORNIA SAN DIEGO
Fluorine-19 Magnetic Resonance Imaging platform to quantify T cell therapy
biodistribution, persistence and efficacy
A dissertation submitted in partial satisfaction of the
requirements for the degree of
Doctor of Philosophy
in
Bioengineering
by
Fanny Chapelin
Committee in charge:
Professor Pedro Cabrales, Chair
Professor Eric T. Ahrens, Co-Chair
Professor David Dubowitz
Professor Stephen Schoenberger
Professor Yingxiao Wang
2019

Copyright
Fanny Chapelin, 2019
All rights reserved

iii
The Dissertation of Fanny Chapelin is approved, and it is acceptable in quality and form
for publication on microfilm and electronically:
Co-Chair
Chair
University of California San Diego
2019
iv
EPIGRAPH
But blessed is the one who trusts in the Lord,
whose confidence is in him.
They will be like a tree planted by the water
that sends out its roots by the stream.
It does not fear when heat comes;
its leaves are always green.
It has no worries in a year of drought
and never fails to bear fruit.
Jeremiah 17:7-8

v
TABLE OF CONTENTS
SIGNATURE PAGE ............................................................................................................ iii
EPIGRAPH .......................................................................................................................... iv
TABLE OF CONTENTS ....................................................................................................... v
LIST OF ABBREVIATIONS ............................................................................................. vii
LIST OF FIGURES ............................................................................................................. ix
LIST OF TABLES ............................................................................................................... xi
ACKOWLEDGEMENTS ................................................................................................... xii
VITA .................................................................................................................................. xvi
ABSTRACT OF THE DISSERTATION ............................................................................ xx
CHAPTER 1: INTRODUCTION .......................................................................................... 1
1.1. The immune landscape of human tumors ................................................................... 1
1.2. Adoptive cell therapy for cancer ................................................................................. 5
1.3. Rationale for in vivo cell tracking ............................................................................... 9
1.4. Magnetic resonance imaging..................................................................................... 11
CHAPTER 2: EXPERIMENTAL METHODS FOCUS ..................................................... 24
2.1. CAR T cell engineering ............................................................................................ 24
2.2. Perfluorocarbon emulsion formulation ..................................................................... 34
2.3. Immune cell labeling ................................................................................................. 40
2.4. Fluorine imaging methods ........................................................................................ 44
CHAPTER 3: FLUORINE-19 NUCLEAR MAGNETIC RESONANCE OF CHIMERIC
ANTIGEN RECEPTOR T CELL BIODISTRIBUTION IN MURINE CANCER MODEL
.............................................................................................................................................. 60
3.1 Introduction ............................................................................................................... 60
3.2 Methods ..................................................................................................................... 62
3.3 Results ....................................................................................................................... 70
3.4 Discussion ................................................................................................................. 81
CHAPTER 4: CELL PENETRATING PEPTIDE FUNCTIONALIZED
PERFLUOROCARBON NANOEMULSION FOR TARGETED CELL LABELING AND
ENHANCED FLUORINE-19 MRI DETECTION. ............................................................. 89
4.1 Introduction ............................................................................................................... 89
4.2 Methods ..................................................................................................................... 90

vi
4.3 Results ..................................................................................................................... 104
4.4 Discussion ............................................................................................................... 114
CHAPTER 5: MAGNETIC RESONANCE IMAGING MONITORING OF IN VIVO
INTRACELLULAR OXIMETRY RESPONSE TO CHIMERIC ANTIGEN RECEPTOR T
CELL IMMUNOTHERAPY AGAINST GLIOMA .......................................................... 131
5.1 Introduction ............................................................................................................. 131
5.2 Methods ................................................................................................................... 133
5.3 Results ..................................................................................................................... 140
5.4 Discussion ............................................................................................................... 147
CHAPTER 6: CONCLUSIONS ........................................................................................ 155
6.1. Summary of research............................................................................................... 155
6.2. Limitations of infusing PFC-labeled cells .............................................................. 158
6.3. Future perspectives.................................................................................................. 159
6.4. Clinical translation .................................................................................................. 161
vii
LIST OF ABBREVIATIONS
ACT Adoptive Cell Transfer/Therapy
ANOVA Analysis of Variance
BLI Bioluminescence Imaging
CAR Chimeric Antigen Receptor
CFSE 5(6)-Carboxyluorescein N-hydroxySuccinimidyl Ester
CPP Cell penetrating peptide
CO2 Carbon Dioxide
D2O Deuterated water
DC Dendritic cell
DLS Dynamic Light Scattering
DMEM Dulbecco’s Modified Eagle Medium
EGFRvIII Epidermal Growth Factor Receptor variant three
EYP Egg Yolk Phospholipid
F68 Polyethylene-Polypropylene
FBS Foetal Bovine Serum
FACS Fluorescence-Activated Cell Sorting
FDA Food and Drug Administration
FID Free Induction Decay
FITC Fluorescein Isothiocyanate
FOV Field Of View
IACUC Institutional Animal Care and Use Committee
IND Investigational new drug
IL-2 Recombinant human Interleukin 2
IV Intra-Venously
IT Intra-Tumorally
LOD Limit of Detection
MACS Magnetic-Activated Cell Sorting
MHC Major Histocompatibility Complex
MRI Magnetic Resonance Imaging
NK Natural Killer
NMR Nuclear Magnetic Resonance
NOD/SCID Non-Obese Diabetic/Severe Combined ImmunoDeficiency
OptiMEM Optimized Minimal Essential Medium
PBMC Peripheral Blood Mononuclear Cells
PBS Phosphate Buffered Saline
PCE Perfluoro-15-crown-5-ether
PdI Polydispersity Index
PET Positron Emission Tomography
PFC Perfluorocarbon
PFPE Perfluoropolyether
pO2 Partial pressure of oxygen
PRESS Point-RESolved Spectroscopy
PSI Pounds per square inch
RARE Rapid Acquisition with Relaxation Enhancement

viii
RES Reticulo-Endothelial System
ROI Region Of Interest
RPMI Roswell Park Memorial Institute medium
SC Subcutaneously
scFv single chain variable Fragment
SCID Severe Combined Immunodeficiency
SNR Signal to Noise Ratio
TAT Trans-Activator of Transcription
TATA Perfluoroheptyl TAT
TATP PerfluoroPEG TAT
TCR (engineered) T Cell Receptor
TE Echo Time
TFA Trifluoroacetic Acid/Sodium trifluoroacetate
TIL Tumor Infiltrating Lymphocyte
TLC Thin Layer Chromatography
TR Repetition Time

ix
LIST OF FIGURES
Figure 1.2: General approach for CAR T cell therapy …………………………….…..……8
Figure 2.1: Schematic diagram of lentiviral pELNS-3C10-CAR vector …………...…..….24
Figure 2.2: CAR T cell appearance in culture ……………………………………….……..28
Figure 2.3: Flow characterization of untransduced human T cells …………………………32
Figure 2.4: Flow characterization of CAR T cells ……………………………………...….33
Figure 2.5: Molecular structure of PFPE and PCE …………………………………….…..34
Figure 2.6: Molecular structure of pluronic F68 and egg yolk phospholipid (EYP) …..…..37
Figure 2.7: Nanoemulsion design for MR sensitivity enhancement ……………….………41
Figure 2.8: CAR T cell labeling with PFC nanoemulsion ………………………………….43
Figure 2.9: Confirmation of intracellular localization of PFC nanoemulsion in CAR T cells
………………………………………………………………………………………….….44
Figure 2.10: Representative 19F NMR spectrum (9.4T) of CAR T cell pellet labeled with
PFPE emulsion ……………………………………………………………………….……46
Figure 2.11: Fluorine-19 NMR limit of detection (LOD) estimation …………………..….47
Figure 2.12: MRI system and coils for in vivo imaging …………………………...……….49
Figure 2.13: Representative spectrum of isoflurane contamination with surface coil ……..50
Figure 2.14: Mouse monitoring setup …………………………………………..…………51
Figure 2.15: Determination of voxel R1 ………………………….................……………..52
Figure 2.16: In vitro calibration curve of R1 versus pO2 at 11.7 T and 37 °C ………………53
Figure 2.17: Quantification of apparent cell numbers from MRI images ………..………..54
Figure 3.1: CAR T cell transduction and characterization ……………………..…………..71
Figure 3.2: Confirmation of intracellular localization of PFC ……………………………..73
Figure 3.3: Human CAR T cell cytotoxicity assay in vitro ……………………………..…74
Figure 3.4: Impact of cell therapy on tumor growth in vivo ……………………………….76
Figure 3.5: Biodistribution of tissue samples by 19F NMR at 2, 7 and 14 days post-treatment
……………………………………………………………………………………………..77
Figure 3.6: Histological correlation of tumor tissue of T cell treated SCID mice …………79
Figure 3.7: Histology in spleen and liver tissue of T cell treated SCID mice …………..…80
Figure 4.1: Synthesis of TAT functionalized perflurocarbon nanoemulsions ………...….105

x
Figure 4.2: Jurkat cell labeling with TATA-F68-PFC and TATP-F68-PFC nanoemulsions
……………………………………………………………………………………………107
Figure 4.3: Jurkat cell labeling with lipid-TAT-PFC emulsion ………………....…….…108
Figure 4.4: Microscopy of CAR T cells labeled with TAT-F68-PFC nanoemulsions …...110
Figure 4.5: Phenotype of CAR T cells labeled with TAT-F68-PFC nanoemulsions ……..111
Figure 4.6: In vivo 19F MRI signal enhancement in TATP-F68-PFC labeled human CAR T
cells ………………………………………………………………………………..……..113
Figure 4.S1: Synthesis scheme of F68-TAT co-surfactant ………………………...……..117
Figure 4.S2: Size stability of TAT-F68-PFC nanoemulsions …………………………….118
Figure 4.S3: Optimization of lipid-TAT-PFC incubation time in Jurkat cells ……………118
Figure 4.S4: Cy5-TATA,P-F68-PFC synthesis scheme …………………………………119
Figure 4.S5: Localization impact of incorporation of fluorescent dye into surfactant layer
during nanoemulsion preparation ………………………………………………...………120
Figure 4.S6: Fluorescent dye conjugate nanoemulsions without TAT do not get internalized
into CAR T cells …………………………………………………………………………121
Figure 4.S7: CAR T cell killing assay in vitro …………………………………………..122
Figure 4.S8: Ex vivo 3D microimaging of excised glioma tumors harboring PFC labeled
CAR T cells ………………………………………………………………………….…..122
Figure 5.1: Glioma cell labeling with PCE emulsion …………………………….……….141
Figure 5.2: In vivo 19F/1H MRI of human glioma showing labeled tumor cells at different
time points ………………………………………………………………………..…….142
Figure 5.3: In vivo R1 and pO2 changes of glioma tumor after CAR T cell therapy ….143
Figure 5.4: Confirmation of intracellular localization of PCE emulsion ………………..144
Figure 5.5: Tumor and fluorine atom reduction after CAR T cell therapy ……………145
Figure 5.6: Histological correlation of T cell infiltration in tumor and resulting cell death
……………………………………………………………………………………………147

xi
LIST OF TABLES
Table 1.1: Overview of 19F MRI applications in cell therapy for cancer …………..……..15
Table 2.1: Longitudinal characterization of PFC-labeled CAR T cells …………….…….44

xii
ACKOWLEDGEMENTS
The success of this thesis work emanated from an essential collaborative effort and
would not have been possible without the support and discussions with individuals across
disciplines and institutions. First and foremost, I would like to thank my advisor, Dr. Eric
Ahrens, for his guidance and support over the years and the opportunities to present my work
and learn from experts in their field.
I’d like to thank all the members, past and present, of the Ahrens lab for their help
and friendship over the past four years. Special thanks to Emma, for your enthusiasm and
positivity and for teaching me so much about emulsion making. Das, thank you for your
career advice and tips in NMR. Shang, thank you for your patient instruction in plasmid and
virus making. Wenlian, for teaching me most of the hands-on MR I know, and Deanne for
being so flexible and always helping me on the animal experiments with a smile. Vivie,
thank you for your friendship and outstanding help with admin/grant issues.
I’d also want to thank all members of my thesis committee, for their helpful feedback
throughout my thesis. In particular, thank you Dr. Peter Wang, for the privilege of teaching
with and for you, and for all your support and career advice, and for always having a positive
and encouraging word when I needed it. Dr. Schoenberger, thank you for giving me the
opportunity to learn more about immunology and flow cytometry. To Jan Lenington, thank
you for steadfast admin support through my visas and other paperwork.
To our collaborator, Dr. Okada for providing the CAR construct used in all these
experiments. To Jesus and Codi at the flow cytometry core, for their positive attitude and

xiii
always helping hand. To the staff at Invicro for keeping me company in the imaging facility
and helping me figure some things out.
To my friends in the building and in the department, for reminding me there is a life
outside the lab. Especially Alexandra, thank you for teaching me some mouse handling tips
and histo protocols, but most importantly for your friendship through the hard times of this
thesis, wedding planning, and marathon training in Torrey pines. Nikki, thanks for moral
support and company during the late evenings in the lab.
To all my friends (Viola, Shari, Heidi, etc.) and family (Khuranas) near and far, thank
you for all your love, prayers and positive reinforcement. Papa, Maman, thanks for always
believing in me and supporting my ambitions, even if it meant going across the world away
from you. Audrey, for being the sister I never had and loving and supporting me just the
same. To my husband, Aman Khurana, thank you for being my biggest supporter and a
shoulder I can always come and cry on or complain. But most importantly, thank you for
being the best partner in life and in lab!
Chapter 1, in part, contains text as it appears in two manuscripts: Springer book
chapter entitled “Magnetic resonance imaging of immune cell trafficking in response to
chemical agents in experimental autoimmune encephalomyelitis”, Chapelin F, Ahrens E.T
from “Visualizing chemical communication among migratory cells in vivo” (2019), and
review paper entitled “Fluorine-19 MRI for detection and quantification of immune cell
therapy for cancer” Chapelin F, Capitini C, Ahrens E.T, JITC (2018) with revisions and

xiv
formatting changes for this dissertation. Besides this, the content of Chapter 1 is original.
The dissertation author was the primary author of this book chapter and review paper.
Chapter 2, in part, contains text as it appears in two manuscripts. Springer book
chapter entitled “Magnetic resonance imaging of immune cell trafficking in response to
chemical agents in experimental autoimmune encephalomyelitis”, Chapelin F, Ahrens E.T
from “Visualizing chemical communication among migratory cells in vivo” (2019), and
review paper entitled “Fluorine-19 MRI for detection and quantification of immune cell
therapy for cancer” Chapelin F, Capitini C, Ahrens E.T. Chapter 2 also contains figures from
supplemental material of published material in the journal Scientific Reports 2017, with
revisions and formatting changes for this dissertation. The authors and title of the manuscript
are as follows: Chapelin F, Gao S, Okada H, Weber T, Messer K, Ahrens E.T. Fluorine-19
nuclear magnetic resonance of chimeric antigen receptor T cell biodistribution in murine
cancer model. Scientific Reports, (2017). Besides this, the content of Chapter 2 is original.
The dissertation author was the primary author of these papers.
Chapter 3, in full, is a reprint of the material as it appears in the journal Scientific
Reports 2017, with minor revisions and formatting changes for this dissertation. The authors
and title of the manuscript are as follows: Chapelin F, Gao S, Okada H, Weber T, Messer K,
Ahrens E.T. Fluorine-19 nuclear magnetic resonance of chimeric antigen receptor T cell
biodistribution in murine cancer model. Scientific Reports, (2017). The authors
acknowledge technical support from Ms Hongyan Xu. The dissertation author was the
primary investigator and author of this paper.
Chapter 4, in full, contains text submitted for publication of the material. Hingorani
D*, Chapelin F*, Stares E, Adams E, Okada H, Ahrens E.T. Cell Penetrating Peptide

xv
Functionalized Perfluorocarbon Nanoemulsions for Targeted Cell labeling and Enhanced
Fluorine-19 MRI Detection *Authors contributed equally. The authors acknowledge
technical support from Ms Hongyan Xu. The dissertation author was the primary
investigator and author of this paper.
Chapter 5, in full is currently being prepared for submission for publication of the
material. Chapelin F, Zhu W, Chen R, Lister D, Stares E, Messer K, Okada H, Ahrens E.T.
Magnetic resonance imaging monitoring of in vivo intracellular oximetry response to
chimeric antigen receptor T cell immunotherapy against glioma. The dissertation author was
the primary investigator and author of this paper.
Chapter 6, in part contains text as it appears in the Journal for ImmunoTherapy of
Cancer 2018. “Fluorine-19 MRI for detection and quantification of immune cell therapy for
cancer” Chapelin F, Capitini C, Ahrens E.T. The dissertation author was the primary
investigator and author of this paper.

xvi
VITA
2009 Bachelor of Science in Biology, University of Paris V, France
2012 Master of Science in Biomedical Engineering, Biomaterials, University of
Technology of Compiegne, France
2012-2014 Research Assistant, Stanford University
2015-2017 Teaching Assistant, Department of Bioengineering, University of California
San Diego
2019 Doctor of Philosophy in Bioengineering, University of California San Diego

xvii
PUBLICATIONS
1. Hingorani D*, Chapelin F*, Stares E, Adams E, Okada H, Ahrens E.T. Cell penetrating
peptide functionalized perfluorocarbon nanoemulsions for targeted cell labeling and
enhanced fluorine-19 MRI detection. Under review at MRM.
2. Chapelin F, Zhu W, Chen R, Lister D, Stares E, Messer K, Okada H, Ahrens E.T.
Magnetic resonance imaging monitoring of in vivo intracellular oximetry response to
chimeric antigen receptor T cell immunotherapy against glioma. In preparation.
3. Chapelin F, Capitini C, Ahrens E.T. Fluorine-19 MRI for detection and quantification
of immune cell therapy for cancer. JITC, (2018).
4. Chapelin F, Khurana A, Moneeb M, Hazard F, Chan C, Nejadnik H, Gratzinger D,
Messing S, Erdmann J, Gaur A, Daldrup-Link H.E. Tumor Formation of adult stem cell
transplants in rodent arthritic joints. MIBI, (2018).
5. Chapelin F, Gao S, Okada H, Weber T, Messer K, Ahrens E.T. Fluorine-19 nuclear
magnetic resonance of chimeric antigen receptor T cell biodistribution in murine cancer
model. Scientific Reports, (2017).
6. Khurana A, Chapelin F, Xu H, Acevedo JR, Molinolo A, Nguyen Q, Ahrens E.T.
Visualization of macrophage recruitment in head and neck carcinoma model using
fluorine-19 magnetic resonance imaging. MRM, (2017).
7. Chapelin F, Ahrens E.T. Magnetic Resonance Imaging of immune cell trafficking in
response to chemical agents in experimental autoimmune encephalomyelitis. Prescher,
J, Contag, C.H’s Visualizing chemical communication among migratory cells in vivo.
Springer Press, (2019).
8. Daldrup-link H.E, Chan C, Lenkov O, Taghavigarmestani S, Nazekati T, Nejadnik H,
Chapelin F, Khurana A, Tong X, Yang F, Pisani L, Longaker M, Gambhir S.S.
Detection of Stem Cell Transplant Rejection with Ferumoxytol MR Imaging: Correlation
of MR Imaging findings with Those at Intravital Microscopy. Radiology, (2017).
9. Nejadnik H, Diecke S, Lenkov O.D, Chapelin F, Donig J, Tong X, Derugin N, Chan
R.C, Gaur A, Yang F, Wu J.C, Daldrup-Link H.E. Improved Approach for Chondrogenic
Differentiation of Human Induced Pluripotent Stem Cells. Stem Cell Rev, (2015).
10. Khurana A, Chapelin F, Daldrup-link H.E. Mesenchymal Hamartoma and embryonal
sarcoma of the liver. In: H Daldrup-Link, B Newman’s Pearls and Pitfalls in Pediatric
Radiology. Cambridge: Cambridge University Press. (2014).

xviii
11. Chapelin F, Beck G, Lenkov O.D, Daldrup-Link H.E. Laboratory Protocols, a
Collection of Cell Tracking Protocols for Imaging and Stem Cell Researchers. Ebook on
the iBooks store, Nov. 2013 (700 downloads as of 1/1/2018).
12. Khurana A, Chapelin F, Beck G, Lenkov O.D, Donig J, Nejadnik H, Messing S, Derugin
N, Chan R.C, Gaur A, Sennino B, McDonald D.M, Kempen PJ, Tikhomirov G.A, Rao
J, Daldrup-Link H.E. Iron Administration before Stem Cell Harvest Enables MR
Imaging Tracking after Transplantation. Radiology, (2013).
13. Khurana A*, Nejadnik H*, Chapelin F, Lenkov OD, Gawande R, Lee S, Gupta SN,
Aflakian N, Derugin N, Messing S, Lin G, Lue TF, Pisani L, Daldrup-Link
HE. Ferumoxytol: A new, clinically applicable label for stem cell tracking in arthritic
joints with MRI. Nanomedicine, (2013).

xix
SELECTED POSTERS AND PRESENTATIONS
1. Chapelin F. Tracking immunotherapeutic T cells using MRI. ISMRM member-initiated
symposium (Paris, France), 2018, Invited speaker.
2. Chapelin F, Zhu W, Okada H, Ahrens E. In vivo monitoring of intracellular pO2 in
response to CAR T cell immunotherapy against glioma. ISMRM conference (Paris,
France), 2018, oral presentation.
3. Chapelin F. 19F Magnetic Resonance Imaging platform to quantify T cell therapy
biodistribution, persistence and efficacy, Sanford Consortium Seminar Series, UCSD
(San Diego, USA), 2018, oral presentation.
4. Chapelin F, Zhu W, Okada H, Ahrens E. In vivo monitoring of intracellular pO2 in
response to CAR T cell immunotherapy against glioma. Bioengineering Day, UC San
Diego, USA, 2018, poster.
5. Chapelin F, Zhu W, Okada H, Ahrens E. In vivo monitoring of intracellular pO2 in
response to CAR T cell immunotherapy against glioma, AACR Workshop on
Immunobiology of primary and metastatic CNS cancer (San Diego, USA), 2018, poster.
6. Chapelin F, Gao S, Okada H, Ahrens E. Fluorine-19 nuclear magnetic resonance (NMR)
cytometry to track human CAR T-cell biodistribution in murine studies of glioblastoma
immunotherapy. Mechanisms and Models of Cancer Symposium, Salk Institute (San
Diego, USA), 2017, poster.
7. Chapelin F, Okada H, Ahrens E. Fluorine-19 NMR cytometry to quantify human
transgenic CAR T-cell biodistribution in murine studies of glioblastoma immunotherapy.
ISMRM Conference (Hawaii, USA), 2017, oral presentation.
8. Chapelin F, Okada H, Ahrens E. Fluorine-19 nuclear magnetic resonance (NMR)
cytometry to track human CAR T-cell biodistribution in murine studies of glioblastoma
immunotherapy. SITC Conference (National Harbor, USA), 2016, poster.
9. Chapelin F, Okada H, Ahrens E. Fluorine-19 nuclear magnetic resonance (NMR) to
track human transgenic T-cell biodistribution in murine studies of glioblastoma
immunotherapy. Sanford Consortium Seminar Series, October, UCSD (San Diego,
USA), 2016, oral presentation.
10. Chapelin F, Weber T, Xu H, Ahrens E. In vivo monitoring of intracellular pO2 changes
and cell apoptosis during CAR T-cell therapy against cancer. ISMRM Workshop (San
Diego, USA) 2015, poster.
11. Chapelin F, Weber T, Xu H, Ahrens E. In vivo monitoring of intracellular pO2 changes
and cell apoptosis during CAR T-cell therapy against cancer. Stem Cell Meeting on the
Mesa (San Diego, USA) 2015, poster.
xx
ABSTRACT OF THE DISSERTATION
Fluorine-19 Magnetic Resonance Imaging platform to quantify T cell therapy
biodistribution, persistence and efficacy
by
Fanny Chapelin
Doctor of Philosophy in Bioengineering
University of California San Diego, 2019
Professor Pedro Cabrales, Chair
Professor Eric T. Ahrens, Co-Chair
Cancer is responsible for over 8 million deaths annually and the number of new cases
is expected to increase by approximately 70% over the next 20 years. Surgery, chemotherapy
and radiotherapy have been used for decades as primary strategies against cancer in patients;

xxi
however, cancer cell drug and radiation resistance development often leads to lower
remission and higher relapse incidence. Cell therapies for cancer are emerging approaches
to enhance tumor-specific killing and include expansion of patients’ tumor-infiltrating
lymphocytes or complex engineering of the T cell receptor or Chimeric Antigen Receptors
(CAR). The latter have shown unprecedented progress towards treating incurable cancers
and are currently being examined in over 200 clinical trials. Developing successful
therapeutic strategies using live cells entails the ability to determine their in vivo
biodistribution and persistence after systemic administration. Non-invasive imaging
techniques such as Magnetic Resonance Imaging (MRI) and Positron Emission Tomography
are the best candidates for real time, quantitative assessment of tumor response.
Perfluorocarbon (PFC) probes are composed of numerous fluorine atoms, which are not
naturally present in the body and allow for background free quantitation by MRI. This thesis
describes fluorinated imaging probes and methods for labeled cell tracking by 19F MR
imaging and spectroscopy. Firstly, we show that, following transfer to the subject, 19F
nuclear magnetic resonance allows quantification of local and systemic accumulation PFC-
labeled CAR T cells in a murine cancer model. As a second step, we report strategies to
increase cell loading through cell penetrating peptides, enabling unbiased detection of
lymphocytes in vivo. Finally, we exploit the property of PFC nanoemulsions to dissolve
paramagnetic oxygen to measure tumor intracellular oxygenation changes in response to
therapy. Overall, 19F MR imaging is a versatile technique that can provide insights into the
survival and modes of actions of cell therapy against cancer.

1
Chapter 1: Introduction
Considerable effort is being invested on the design of novel cellular based therapeutic
strategies to treat individuals with genetic disorders, neurological disorders, and chronic
conditions such as cancer and autoimmunity. Cancer immunotherapy is a relatively young
field of research directing specific immune entities against cancer cells. Among those,
adoptive T cell transfer has the potential to provide personalized less toxic and more
efficacious treatment through the repair or activation of endogenous functions. Developing
smarter, potent therapies could be accelerated by the ability to rapidly determine
biodistribution and persistence in vivo. Cell labeling probes using perfluorocarbon
nanoemulsions, paired with fluorine-19 (19F) MRI detection, enables quantification of cell
localization and survival. This thesis focuses on developing 19F magnetic resonance imaging
platforms to quantify T cell therapy biodistribution, persistence and efficacy in murine
cancer model.
1.1. The immune landscape of human tumors
1.1.1. Mechanisms of immune escape in cancer
The central dogma of immunology has long been that when functioning correctly,
the immune system is a powerful force actively preventing disease and neoplastic
development through immunosurveillance1, 2. Immune cells such as T cells, natural killer
(NK) cells, and dendritic cells (DCs) are critically involved in the elimination of foreign
pathogens, recognition and removal of transformed cells, and repair of damaged tissue. The

2
innate immune system, including monocytes, macrophages, DCs and NK cells, provide
front line protection through cancer cell recognition, lysis, and pro-inflammatory cytokine
production3. T and B cells are the main effectors of the adaptive immune system and mediate
antigen-specific responses and long term memory4.
In the early 2000s, it was established that the immune system has a dual role in
cancer. Not only is it involved in preventing tumor progression, it is also promoting its
outgrowth5, 6. This refined hypothesis, coined as cancer immunoediting, describes the
dynamic process in three phases: elimination, equilibrium, and escape. The elimination
phase corresponds to the antitumor response by the immune system when detecting tissue
damage engendered by neoplastic outgrowth. If the immunosurveillance effectors fail to
eradicate all transformed cells, the surviving tumors cells enter the phase of equilibrium with
the immune system7. The immune system continues to target highly immunogenic
transformed cells while increasing the selection pressure placed on the remaining tumor
cells. The latter accumulate mutations eventually leading to antigen loss or non-presentation
and are therefore no longer recognized by immune cells7. A trait shared by 40-90% of human
cancers is MHC downregulation, which plays a major role in future tumor escape8. Cytokine
secretion by the tumor cells creates an immunopriviledged microenvironment8, increasing
resistance to immune cell attacks. The escape phase corresponds to the stage when tumor
outgrowth is no longer hampered by the immune system. Tumor cells begin to recruit anti-
inflammatory immune cells (tumor associated macrophages, regulatory T cells) that inhibit
anti-tumor responses9. While the equilibrium phase can last several years, the escape phase
usually correlates with rapid development of clinical symptoms. Mechanisms of tumor

3
editing continue to be heavily investigated as well as numerous strategies to regulate or
counteract these effects.
1.1.2. Glioblastoma multiforme
Glioma is a type of tumor originating from the glial cells in the brain. The World
Health Organization (WHO) categorizes glioma as grades I-IV based on histopathology
findings. This classification indicates tumor aggressiveness, prognosis and survival.
Glioblastoma multiforme (GBM) is a grade VI glioma, meaning the most aggressive and
most common (~54%) brain cancer10. According to the Central Brain Tumor Registry of the
United States (CBTRUS), GBM incidence rate is about 3 per 100,000 people10. GBMs can
occur spontaneously and referred to as ‘primary’ GBM or transform from lower grade
gliomas and therefore termed ‘secondary’ GBMs. The mean GBM incidence age is 62-65
years but still represents up to 8% of pediatric brain tumors10-12. Indicative symptoms include
headaches, seizures and neurologic deficits. Diagnosis is then confirmed by abnormal
findings on magnetic resonance images. In histopathology, GBM presents with irregular cell
and nuclear shapes (atypia), high microvascular density and necrotic cores13. The median
survival time is less than three months without treatment and 12-14 months with surgical
resection and radiation therapy and/or chemotherapy14.
1.1.3. Pillars of cancer therapy
Standard of care for primary GBMs involves surgical resection followed by
radiotherapy and chemotherapy. This strategy has been used for decades against cancer in
patients15 Surgery is a necessary, albeit not sufficient, procedure due to ill-defined tumor

4
border. Aggressive radiotherapy prolongs survival but some tumor cells develop resistance,
preventing full recovery. Chemotherapy, including temozolomide (TMZ) and O6-
methylguanine DNA methyltransferase (MGMT) treatment also showed increased median
survival (14 and 22 months respectively)16, 17. Numerous chemotherapy candidates now
target tumor metabolism, survival, proliferation, apoptosis and angiogenesis.
Despite combination of these therapies, prognosis of GBM remains dismal, in part
due to its highly proliferative and heterogeneous nature and ability to evade the immune
system. Overall, non-specific cell toxicities and side effects from chemotherapy and
radiation, as well as drug and radiation cancer cell resistance, has motivated investigators to
seek new treatment approaches to achieve greater incidence of curative outcomes and
improved quality of life.
1.1.4. First strides in immunotherapy
In the 1990s, immunotherapy emerged as a means to engage the immune system in
the fight against cancer. Antibodies specifically target tumor or immune cell receptors to
block tumor function or recruit immune cells that will kill the target cancer cells. This
strategy reduces off-site toxicities and side effects compared to traditional therapies.
Immunotherapy proved successful in several solid tumors with the most notable examples
being antibodies blocking immune-checkpoint proteins CTLA-4 and PD-118-20. Most
immunotherapy strategies are nonetheless ineffective in GBM. It is postulated that the
immunopriviledged status of the brain and the immunosuppressive environment created by
tumor cells contribute to the lack of positive outcomes.

5
GBM aside, one of the main disadvantages of this form of therapy is that tumor
penetration is low, preventing full remission21. In addition, antibody clearance occurs
rapidly, necessitating repeated treatments, leading to overall high therapy costs. In order to
correct for this, the idea has been to use cells to continuously express these antibodies and
therefore reduce the overall cost if curative.
1.2. Adoptive cell therapy for cancer
Adoptive cell therapy focuses on utilizing the body’s natural immune defenses to
treat cancer. The source of therapy is the patient himself and aims to counterbalance immune
privilege by providing ‘new’ reactive cells to the body.
1.2.1. Tumor infiltrating lymphocytes (TIL)
Initial adoptive cell transfer therapy was developed by Rosenberg et al. in 1988 and
comprised T-cells derived from the tumor-bearing host, referred to as tumor-infiltrating
lymphocytes (TIL)22. The strategy is to obtain cancer biopsies from patients, cut them into
pieces, and digest them, followed by culture in T cell medium containing large amounts of
IL2 for a few weeks to stimulate T cell expansion. TILs were shown to confer improved
prognosis in melanoma patients but remained unsuccessful in fully clearing the tumor due
to immunosuppressive tumor microenvironment and lack of TIL persistence in vivo23, 24.
Chemotherapy or radiotherapy lymphodepletion prior to TIL infusion was shown to improve
efficacy25. Although TILs can effectively be expanded from most solid tumors, so far
melanoma appears to be the only cancer for which TILs are capable of specific tumor
cytotoxicity and durable responses in patients.

6
1.2.2. Engineered T cell receptors (TCR)
The earliest engineered T cell trials relied on in vitro gene transfer of synthetic T cell
receptor (TCR) for improved antigen affinity. They consist of an - and - chain associated
with the CD3 receptor on the cell surface. TCRs are either cloned from TILs and transduced
into blood-derived T cells or generated by immunizing HLA-I/II transgenic mice with cancer
antigens later transduced into human T cells26. These synthetic antigen receptors recognize
intracellular or extracellular antigens presented by the major histocompatibility complex
class I (MHC-I) at the surface of the cell the T cell binds to. An important limitation of this
system is that many tumors downregulate MHC expression to evade recognition by TCR
engineered T cells. In addition, lack of TCR affinity for cancer antigens is hypothesized to
be a reason for lack of efficacy but high affinity increases chances of adverse events such as
cross-reactivity in non-cancerous cells27, 28.
1.2.3. Chimeric antigen receptors (CAR)
Chimeric antigen receptors consist of extracellular single-chain variable fragment
(scFv) for antigen binding and intracellular costimulatory domains (CD28, 4-1BB, OX40,
etc.)29, 30. Unlike TCRs, CARs are highly specific towards their antigen and can initiate the
killing cascade in an MHC-independent fashion (Fig. 1.1). Chimeric antigen receptor design
has been somewhat empiric in order to determine which elements of the CAR influence its
signaling. The progress in design of CARs included first antigen specificity, then T cell
activation mechanism, effector function and T cell persistence31. So far, CARs have only
been able to target extracellular antigens, which limits the number of possible candidates. In

7
addition, antigen targets are rarely expressed throughout the tumor, which may explain the
so far limited effectiveness in patients.
Figure 1.1: MHC-independent antitumor effects of CAR T cells against cancer cells.
The antigen-specific scFv domain of the CAR recognizes its antigen on the target cancer
cell. Using the co-stimulatory domains, the CAR receptor signals production of pro-
inflammatory cytokines, granzyme and perforin release, and expression of FasL and tumor
necrosis factor–related apoptosis inducing ligand (TRAIL). As a result of these processes,
cancer cells are eradicated. Adapted from Cartellieri et al.32
Of interest for the treatment of glioblastoma multiforme is the Epidermal growth
factor variant III (EGFRvIII). EGFRvIII originates from a mutation in EGFR resulting in a
coding sequence deletion and expression of a surface neoantigen. EGFRvIII is only
expressed on malignant tissue and occurs in about 24-60% of GBMs33. EGFRvIII-targeted
CAR T cells have shown significant tumor reduction in preclinical models34-36 and phase I
clinical trials are currently underway to determine safety and efficacy in patients. Of note,
8
the CAR construct used throughout this thesis work targets EGFRvIII and was kindly
provided by Dr. Okada at UCSF. Specifics of the construct are discussed in Chapter 2.
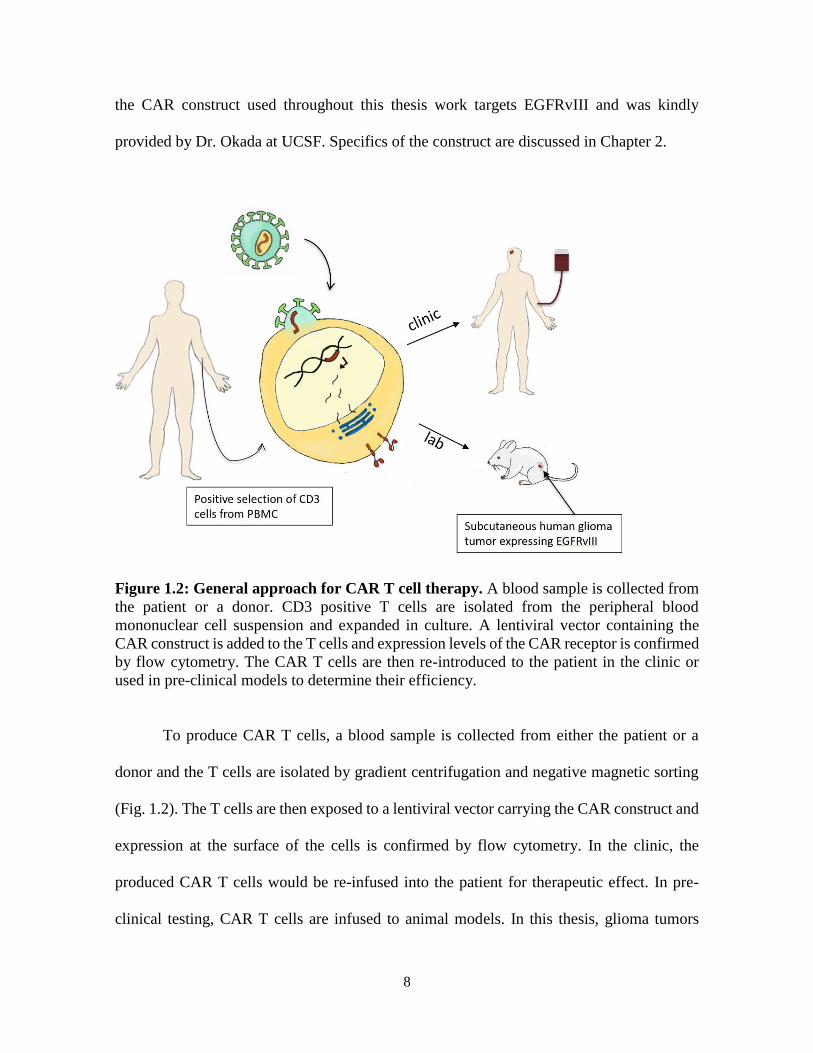
Figure 1.2: General approach for CAR T cell therapy. A blood sample is collected from
the patient or a donor. CD3 positive T cells are isolated from the peripheral blood
mononuclear cell suspension and expanded in culture. A lentiviral vector containing the
CAR construct is added to the T cells and expression levels of the CAR receptor is confirmed
by flow cytometry. The CAR T cells are then re-introduced to the patient in the clinic or
used in pre-clinical models to determine their efficiency.
To produce CAR T cells, a blood sample is collected from either the patient or a
donor and the T cells are isolated by gradient centrifugation and negative magnetic sorting
(Fig. 1.2). The T cells are then exposed to a lentiviral vector carrying the CAR construct and
expression at the surface of the cells is confirmed by flow cytometry. In the clinic, the
produced CAR T cells would be re-infused into the patient for therapeutic effect. In pre-
clinical testing, CAR T cells are infused to animal models. In this thesis, glioma tumors

9
(U87-EGFRvIII-Luc) expressing EGFRvIII and a luciferase reporter were injected
subcutaneously in the flank of immune-compromized mice.
TCR and CAR T cell therapies are currently under investigation in over 300 clinical
trials37. Combination of cell therapy with checkpoint blockade may enhance anti-tumor
efficacy and remission rates38. All in all, immunotherapeutic strategies have emerged as the
fourth pillar for cancer treatment which holds promise for fewer treatment side effects and
more durable curative protections against residual primary cancers and metastases.
1.3. Rationale for in vivo cell tracking
1.3.1. Need for non-invasive tools to track cell therapy
A common assumption in preclinical and clinical research is that cell trafficking
behavior in vivo may be predictive of therapeutic outcomes. For example, in CAR T cell
trials against solid tumors39, a reasonable assumption is that therapeutic cell survival and
trafficking to the tumor sites is required for a putative therapeutic effect. However, clinicians
are currently in the blind as to whether cells actually reach their desired tissue targets.
Conventional methods to evaluate efficacy and survival of treatments include invasive
biopsies followed by histopathology or flow cytometry. Histology is laborious and only
semi-quantitative, and flow cytometry only provides partial information from tissue biopsy
or peripheral blood sample. A surrogate biomarker capable of visualizing and quantifying
sites harboring cells in vivo as well as survival of ACT at tumor and lymphoid organ regions
would be invaluable for the assessment of putative therapeutic activity following systemic
administration. In addition to diagnostic feedback, there is also a need to image off-target
effects of therapies tested pre-clinically and clinically. All in all, non-invasive imaging

10
methods could help accelerate therapy development and improve patient management, while
identifying key players in cancer response to therapy.
1.3.2. In vivo imaging modalities
There are multiple established methods to track cells in vivo non-invasively. These
include optical imaging, tomography with radioactive tracers and magnetic resonance
imaging. Optical imaging was the first non-invasive method developed using fluorescent
moieties (Cydyes, DiO, DiD, etc.). Discovery of green fluorescent proteins (GFP) in the
1950s and bioluminescence from luciferases in the 1960s40, 41 and engineering for imaging
applications in the 1980s has made it the most used imaging method in preclinical research.
Fluorescence and bioluminescence measurement accuracy is limited by depth attenuation;
therefore, quantitative measurements should be limited to subcutaneous signals. Finally,
optical imaging is not currently translatable to clinical practice or only for very limited
applications such as lighting up cancer cells to guide surgeons during resection42.
Magnetic Resonance Imaging (MRI) and PET are the best candidates for real time,
quantitative assessment of tumor response43-45. PET and single-photon emission computed
tomography (SPECT) provide functional information with modest spatial resolution and
high sensitivity46, 47, however, these modalities involve ionizing radiation shown to be
detrimental to cells 48, 49 and label loss and decay limits longitudinal applications50. In
addition, systemic injection of PET tracers such as 18F-FDG may reveal false-positive hot
spots at inflammatory sites as well as tumor sites which can confound image interpretation51.
MRI allows anatomical and functional investigation as well as disease diagnosis and

11
progression assessment. Therefore, it is widely used in clinical practice and is often preferred
over other diagnostic tools.
1.4. Magnetic resonance imaging
1.4.1. Metal-ion-based contrast agents for MR imaging
Due to its routine use in the clinics, conventional 1H MRI contrast agents have long
been the preferred probe choice for the development of contrasts agents highlighting cell
sub-populations in vivo. The key constituents of 1H MRI contrast agents are paramagnetic
metals ions (e.g., Gd or Fe) that are conjugated to metal binding ligands or formulated as
nanoparticles. Metal ions interact with surrounding mobile water molecules by through-
space and contact magnetic interactions between the outer electrons and the water 1H and/or
by disruption of the local magnetic field in proximity to the probe 52. The first generation of
contrast agents consisted of gadolinium chelates, providing T1 contrast 53. Many compounds
received FDA approval and are widely used in the clinic. Nonetheless, the modest sensitivity
of gadolinium chelates for cell tracking applications and the difficulty in labeling specific
cell populations led to the use of super-paramagnetic iron oxide nanoparticles (SPIO). With
a mean diameter of >5 nm, they can be taken up by cells, often with the aid of transfection
procedures if cells are labeled ex vivo, and provide strong T2 and T2* contrast enhancement.
Ultrasmall superparamagnetic iron oxide nanoparticles (USPIO) have also been
investigated, but one of the major limitation of these labeling agents remains sensitivity.
Larger, micron-sized particles of iron oxide (MPIOs) provide greater contrast, but their large
size restricts internalization in certain cells. USPIOs and MPIOs’ large magnetic
susceptibility can be exploited to create blooming artifacts and improve detection.

12
Gadolinium contrast media is routinely used in the clinic to improve image clarity but isn’t
suitable for ex vivo cell labeling. Gadolinium nanoparticles are not easily endocytosed by
cells and is known to diffuse out of the cells. In addition, Gadolinium exhibits low magnetic
susceptibility and therefore, signal enhancement by blooming artifact is impossible. In
recent years there has been a large body of effort to design probes de novo that are optimized
for the purpose of cell tracking using MRI 52. Often these new materials are formulated as
colloidal suspensions or nanoparticles that strive for improved cell deliverability, as well as
image sensitivity and specificity.
1.4.2. Perfluorocarbon (PFC) probes for 19F MR imaging
Shortly after the introduction of proton MRI, the feasibility of fluorine-19 (19F) MRI
was demonstrated by Holland et al.54. 19F is a natural halogen, non-radioactive isotope of
fluorine. 19F has a relative sensitivity of 83% compared to 1H and essentially devoid in
biological tissues of interest55, enabling background-free quantification of signals in vivo.
One drawback of fluorine detection is the relative insensitivity of the signal, due to the low
number of spins in the sample/animal. Perfluorocarbon (PFC) nanoemulsions containing
large amounts of fluorine are specifically engineered to be endocytosed, even by non-
phagocytic cells56. 19F MRI signal intensity is linearly proportional to 19F-atom
concentration, enabling unbiased and specific measurements of cell numbers from the
acquired images57. These materials are therefore referred to as ‘tracer agents’ rather than
contrast agents. PFCs are generally biochemically inert and non-toxic in vivo. Their MRI
sensitivity depends on their chemical structure. Cyclic PFCs such as perfluoro-15-crown-5-
ether (PCE) and linear molecules such as perfluoropolyether (PFPE) are often used, with the

13
latter materials having desirable short T1/T2 ratios and endgroups that can be coupled with
fluorescent dyes58. PFCs are formulated into small (<200 nm) nanoemulsions using
surfactants. Key design considerations are discussed in Chapter 2.
1.4.3. Therapeutic cell labeling and tracking
Primary methods of probe delivery include labeling a cell population of interest ex
vivo and delivering these cells intravenously or locally. The first application of 19F MRI cell
tracking was demonstrated by Ahrens et al. in 200559. The alternative is in vivo labeling,
which consists of direct intravenous (IV) injection of the agent that generally leads to
labeling of the recipient’s phagocytic cells in the reticulo-endothelial system. This enables
imaging of inflammation in various disease models such as cancer, auto-immunity and graft
rejection. Specifically, 19F signal in foci of inflammation is linearly proportional to
macrophage burden, which is an indicator of tumor aggressiveness or disease severity60, 61.
Aside from inflammation imaging, a body of work exists detecting various types of
stem and progenitor cells using 19F MRI62-67. An early study used human hematopoietic stem
cell (CD34+) to demonstrate that 19F labeling does not impact the differentiation potential
of the CD34+ cells to fully form the full repertoire of immune cell types in an irradiated
mouse68. Others have shown the feasibility of mesenchymal stem cell imaging62-64 with 19F
MRI. Similarly, Boehm-Sturm and coworkers as well as Bible et al. tracked PFC-labeled
human neural stem cells after stroke induction in mice65-67
More recently, unprecedented efforts have been implemented to determine in vivo
biodistribution, efficacy and persistence of immune cells using advanced MRI techniques.

14
Perfluorocarbon probes and 19F MRI have enabled cell tracking in numerous preclinical and
clinical studies for adoptive cell transfer employing T lymphocytes (TILs, TCRs, CARs)56,
69-72, natural killer73, 74, PBMC75 and dendritic cell43, 76, 77 therapies (Table 1.1). The recent
first use of PFC MRI cell tracking in the clinic points to future developments of such
compounds for numerous clinical applications43.

15
Tab
le 1
.1:
Over
vie
w o
f 1
9F
MR
I ap
pli
cati
on
s in
cel
l th
erap
y f
or
can
cer.
SC
= s
ubcu
taneo
usl
y,
LN
= l
ym
ph n
ode,
CN
S =
cen
tral
ner
vous
syst
em,
* =
cli
nic
al t
rial
16
Acknowledgements
Chapter 1, in part, contains text as it appears in two manuscripts: Springer book
chapter entitled “Magnetic resonance imaging of immune cell trafficking in response to
chemical agents in experimental autoimmune encephalomyelitis”, Chapelin F, Ahrens E.T
from “Visualizing chemical communication among migratory cells in vivo” (2018), and
review paper entitled “Fluorine-19 MRI for detection and quantification of immune cell
therapy for cancer” Chapelin F, Capitini C, Ahrens E.T, JITC 2018 with revisions and
formatting changes for this dissertation. Besides this, the content of Chapter 1 is original.
The dissertation author was the primary author of this book chapter and review paper.
References
1. Burnet, F.M. The concept of immunological surveillance. Prog Exp Tumor Res 13,
1-27 (1970).
2. Thomas, L. On immunosurveillance in human cancer. Yale J Biol Med 55, 329-333
(1982).
3. Liu, Y. & Zeng, G. Cancer and innate immune system interactions: translational
potentials for cancer immunotherapy. Journal of immunotherapy 35, 299-308 (2012).
4. Borghaei, H., Smith, M.R. & Campbell, K.S. Immunotherapy of cancer. European
journal of pharmacology 625, 41-54 (2009).
5. Dunn, G.P., Bruce, A.T., Ikeda, H., Old, L.J. & Schreiber, R.D. Cancer
immunoediting: from immunosurveillance to tumor escape. Nat Immunol 3, 991-998
(2002).
6. Shankaran, V., Ikeda, H., Bruce, A.T., White, J.M., Swanson, P.E., Old, L.J. &
Schreiber, R.D. IFNgamma and lymphocytes prevent primary tumour development
and shape tumour immunogenicity. Nature 410, 1107-1111 (2001).
7. Schreiber, R.D., Old, L.J. & Smyth, M.J. Cancer immunoediting: integrating
immunity's roles in cancer suppression and promotion. Science 331, 1565-1570
(2011).

17
8. Bubenik, J. Tumour MHC class I downregulation and immunotherapy (Review).
Oncology reports 10, 2005-2008 (2003).
9. Dunn, G.P., Old, L.J. & Schreiber, R.D. The three Es of cancer immunoediting. Annu
Rev Immunol 22, 329-360 (2004).
10. Dolecek, T.A., Propp, J.M., Stroup, N.E. & Kruchko, C. CBTRUS statistical report:
primary brain and central nervous system tumors diagnosed in the United States in
2005-2009. Neuro Oncol 14 Suppl 5, v1-49 (2012).
11. Dohrmann, G.J., Farwell, J.R. & Flannery, J.T. Glioblastoma multiforme in children.
J Neurosurg 44, 442-448 (1976).
12. Ohgaki, H. Genetic pathways to glioblastomas. Neuropathology 25, 1-7 (2005).
13. Louis, D.N., Perry, A., Reifenberger, G., von Deimling, A., Figarella-Branger, D.,
Cavenee, W.K., Ohgaki, H., Wiestler, O.D., Kleihues, P. & Ellison, D.W. The 2016
World Health Organization Classification of Tumors of the Central Nervous System:
a summary. Acta Neuropathol 131, 803-820 (2016).
14. Johnson, D.R. & O'Neill, B.P. Glioblastoma survival in the United States before and
during the temozolomide era. J Neurooncol 107, 359-364 (2012).
15. Fine, H.A., Dear, K.B., Loeffler, J.S., Black, P.M. & Canellos, G.P. Meta-analysis
of radiation therapy with and without adjuvant chemotherapy for malignant gliomas
in adults. Cancer 71, 2585-2597 (1993).
16. Stupp, R., van den Bent, M.J. & Hegi, M.E. Optimal role of temozolomide in the
treatment of malignant gliomas. Curr Neurol Neurosci Rep 5, 198-206 (2005).
17. Hegi, M.E., Diserens, A.C., Gorlia, T., Hamou, M.F., de Tribolet, N., Weller, M.,
Kros, J.M., Hainfellner, J.A., Mason, W., Mariani, L., Bromberg, J.E., Hau, P.,
Mirimanoff, R.O., Cairncross, J.G., Janzer, R.C. & Stupp, R. MGMT gene silencing
and benefit from temozolomide in glioblastoma. N Engl J Med 352, 997-1003
(2005).
18. Lipson, E.J., Forde, P.M., Hammers, H.J., Emens, L.A., Taube, J.M. & Topalian,
S.L. Antagonists of PD-1 and PD-L1 in Cancer Treatment. Semin Oncol 42, 587-600
(2015).
19. Luke, J.J., Flaherty, K.T., Ribas, A. & Long, G.V. Targeted agents and
immunotherapies: optimizing outcomes in melanoma. Nat Rev Clin Oncol 14, 463-
482 (2017).
20. Topalian, S.L., Taube, J.M., Anders, R.A. & Pardoll, D.M. Mechanism-driven
biomarkers to guide immune checkpoint blockade in cancer therapy. Nat Rev Cancer
16, 275-287 (2016).

18
21. Tabrizi, M., Bornstein, G.G. & Suria, H. Biodistribution mechanisms of therapeutic
monoclonal antibodies in health and disease. AAPS J 12, 33-43 (2010).
22. Rosenberg, S.A., Packard, B.S., Aebersold, P.M., Solomon, D., Topalian, S.L., Toy,
S.T., Simon, P., Lotze, M.T., Yang, J.C., Seipp, C.A. & et al. Use of tumor-
infiltrating lymphocytes and interleukin-2 in the immunotherapy of patients with
metastatic melanoma. A preliminary report. N Engl J Med 319, 1676-1680 (1988).
23. Disis, M.L., Wallace, D.R., Gooley, T.A., Dang, Y., Slota, M., Lu, H., Coveler, A.L.,
Childs, J.S., Higgins, D.M., Fintak, P.A., dela Rosa, C., Tietje, K., Link, J., Waisman,
J. & Salazar, L.G. Concurrent trastuzumab and HER2/neu-specific vaccination in
patients with metastatic breast cancer. J Clin Oncol 27, 4685-4692 (2009).
24. Webb, J.R., Milne, K., Watson, P., Deleeuw, R.J. & Nelson, B.H. Tumor-infiltrating
lymphocytes expressing the tissue resident memory marker CD103 are associated
with increased survival in high-grade serous ovarian cancer. Clin Cancer Res 20,
434-444 (2014).
25. Dudley, M.E., Wunderlich, J.R., Robbins, P.F., Yang, J.C., Hwu, P.,
Schwartzentruber, D.J., Topalian, S.L., Sherry, R., Restifo, N.P., Hubicki, A.M.,
Robinson, M.R., Raffeld, M., Duray, P., Seipp, C.A., Rogers-Freezer, L., Morton,
K.E., Mavroukakis, S.A., White, D.E. & Rosenberg, S.A. Cancer regression and
autoimmunity in patients after clonal repopulation with antitumor lymphocytes.
Science 298, 850-854 (2002).
26. Wang, M., Yin, B., Wang, H.Y. & Wang, R.F. Current advances in T-cell-based
cancer immunotherapy. Immunotherapy 6, 1265-1278 (2014).
27. Linette, G.P., Stadtmauer, E.A., Maus, M.V., Rapoport, A.P., Levine, B.L., Emery,
L., Litzky, L., Bagg, A., Carreno, B.M., Cimino, P.J., Binder-Scholl, G.K.,
Smethurst, D.P., Gerry, A.B., Pumphrey, N.J., Bennett, A.D., Brewer, J.E., Dukes,
J., Harper, J., Tayton-Martin, H.K., Jakobsen, B.K., Hassan, N.J., Kalos, M. & June,
C.H. Cardiovascular toxicity and titin cross-reactivity of affinity-enhanced T cells in
myeloma and melanoma. Blood 122, 863-871 (2013).
28. Morgan, R.A., Chinnasamy, N., Abate-Daga, D., Gros, A., Robbins, P.F., Zheng, Z.,
Dudley, M.E., Feldman, S.A., Yang, J.C., Sherry, R.M., Phan, G.Q., Hughes, M.S.,
Kammula, U.S., Miller, A.D., Hessman, C.J., Stewart, A.A., Restifo, N.P., Quezado,
M.M., Alimchandani, M., Rosenberg, A.Z., Nath, A., Wang, T., Bielekova, B.,
Wuest, S.C., Akula, N., McMahon, F.J., Wilde, S., Mosetter, B., Schendel, D.J.,
Laurencot, C.M. & Rosenberg, S.A. Cancer regression and neurological toxicity
following anti-MAGE-A3 TCR gene therapy. Journal of immunotherapy 36, 133-
151 (2013).
29. Berry, L.J., Moeller, M. & Darcy, P.K. Adoptive immunotherapy for cancer: the next
generation of gene-engineered immune cells. Tissue antigens 74, 277-289 (2009).

19
30. Dotti, G., Savoldo, B. & Brenner, M. Fifteen years of gene therapy based on chimeric
antigen receptors: "are we nearly there yet?". Human gene therapy 20, 1229-1239
(2009).
31. Fesnak, A.D., June, C.H. & Levine, B.L. Engineered T cells: the promise and
challenges of cancer immunotherapy. Nat Rev Cancer 16, 566-581 (2016).
32. Cartellieri, M., Bachmann, M., Feldmann, A., Bippes, C., Stamova, S., Wehner, R.,
Temme, A. & Schmitz, M. Chimeric antigen receptor-engineered T cells for
immunotherapy of cancer. J Biomed Biotechnol 2010, 956304 (2010).
33. Heimberger, A.B., Suki, D., Yang, D., Shi, W. & Aldape, K. The natural history of
EGFR and EGFRvIII in glioblastoma patients. J Transl Med 3, 38 (2005).
34. Johnson, L.A., Scholler, J., Ohkuri, T., Kosaka, A., Patel, P.R., McGettigan, S.E.,
Nace, A.K., Dentchev, T., Thekkat, P., Loew, A., Boesteanu, A.C., Cogdill, A.P.,
Chen, T., Fraietta, J.A., Kloss, C.C., Posey, A.D., Jr., Engels, B., Singh, R., Ezell,
T., Idamakanti, N., Ramones, M.H., Li, N., Zhou, L., Plesa, G., Seykora, J.T., Okada,
H., June, C.H., Brogdon, J.L. & Maus, M.V. Rational development and
characterization of humanized anti-EGFR variant III chimeric antigen receptor T
cells for glioblastoma. Sci Transl Med 7, 275ra222 (2015).
35. Miao, H., Choi, B.D., Suryadevara, C.M., Sanchez-Perez, L., Yang, S., De Leon, G.,
Sayour, E.J., McLendon, R., Herndon, J.E., 2nd, Healy, P., Archer, G.E., Bigner,
D.D., Johnson, L.A. & Sampson, J.H. EGFRvIII-specific chimeric antigen receptor
T cells migrate to and kill tumor deposits infiltrating the brain parenchyma in an
invasive xenograft model of glioblastoma. PLoS One 9, e94281 (2014).
36. Sampson, J.H., Choi, B.D., Sanchez-Perez, L., Suryadevara, C.M., Snyder, D.J.,
Flores, C.T., Schmittling, R.J., Nair, S.K., Reap, E.A., Norberg, P.K., Herndon, J.E.,
2nd, Kuan, C.T., Morgan, R.A., Rosenberg, S.A. & Johnson, L.A. EGFRvIII mCAR-
modified T-cell therapy cures mice with established intracerebral glioma and
generates host immunity against tumor-antigen loss. Clin Cancer Res 20, 972-984
(2014).
37. Sotak, C.H., Hees, P.S., Huang, H.N., Hung, M.H., Krespan, C.G. & Raynolds, S. A
new perfluorocarbon for use in fluorine-19 magnetic resonance imaging and
spectroscopy. Magnetic Resonance in Medicine 29, 188-195 (1993).
38. John, L.B., Kershaw, M.H. & Darcy, P.K. Blockade of PD-1 immunosuppression
boosts CAR T-cell therapy. Oncoimmunology 2, e26286 (2013).
39. O'Rourke, D.M., Nasrallah, M.P., Desai, A., Melenhorst, J.J., Mansfield, K.,
Morrissette, J.J.D., Martinez-Lage, M., Brem, S., Maloney, E., Shen, A., Isaacs, R.,
Mohan, S., Plesa, G., Lacey, S.F., Navenot, J.M., Zheng, Z., Levine, B.L., Okada,
H., June, C.H., Brogdon, J.L. & Maus, M.V. A single dose of peripherally infused
EGFRvIII-directed CAR T cells mediates antigen loss and induces adaptive
resistance in patients with recurrent glioblastoma. Sci Transl Med 9 (2017).

20
40. Greer, L.F., 3rd & Szalay, A.A. Imaging of light emission from the expression of
luciferases in living cells and organisms: a review. Luminescence 17, 43-74 (2002).
41. Shimomura, O. Discovery of green fluorescent protein (GFP) (Nobel Lecture).
Angew Chem Int Ed Engl 48, 5590-5602 (2009).
42. van Dam, G.M., Themelis, G., Crane, L.M., Harlaar, N.J., Pleijhuis, R.G., Kelder,
W., Sarantopoulos, A., de Jong, J.S., Arts, H.J., van der Zee, A.G., Bart, J., Low, P.S.
& Ntziachristos, V. Intraoperative tumor-specific fluorescence imaging in ovarian
cancer by folate receptor-alpha targeting: first in-human results. Nat Med 17, 1315-
1319 (2011).
43. Ahrens, E.T., Helfer, B.M., O'Hanlon, C.F. & Schirda, C. Clinical cell therapy
imaging using a perfluorocarbon tracer and fluorine-19 MRI. Magn Reson Med 72,
1696-1701 (2014).
44. Kircher, M.F., Gambhir, S.S. & Grimm, J. Noninvasive cell-tracking methods. Nat
Rev Clin Oncol 8, 677-688 (2011).
45. Meller, B., Frohn, C., Brand, J.M., Lauer, I., Schelper, L.F., von Hof, K., Kirchner,
H., Richter, E. & Baehre, M. Monitoring of a new approach of immunotherapy with
allogenic (111)In-labelled NK cells in patients with renal cell carcinoma. European
journal of nuclear medicine and molecular imaging 31, 403-407 (2004).
46. Palestro, C.J., Love, C. & Bhargava, K.K. Labeled leukocyte imaging: current status
and future directions. The quarterly journal of nuclear medicine and molecular
imaging : official publication of the Italian Association of Nuclear Medicine 53, 105-
123 (2009).
47. Zhang, Y., Ruel, M., Beanlands, R.S., deKemp, R.A., Suuronen, E.J. & DaSilva, J.N.
Tracking stem cell therapy in the myocardium: applications of positron emission
tomography. Current pharmaceutical design 14, 3835-3853 (2008).
48. Klenk, C., Gawande, R., Uslu, L., Khurana, A., Qiu, D., Quon, A., Donig, J.,
Rosenberg, J., Luna-Fineman, S., Moseley, M. & Daldrup-Link, H.E. Ionising
radiation-free whole-body MRI versus (18)F-fluorodeoxyglucose PET/CT scans for
children and young adults with cancer: a prospective, non-randomised, single-centre
study. The Lancet. Oncology 15, 275-285 (2014).
49. Brenner, W., Aicher, A., Eckey, T., Massoudi, S., Zuhayra, M., Koehl, U., Heeschen,
C., Kampen, W.U., Zeiher, A.M., Dimmeler, S. & Henze, E. 111In-labeled CD34+
hematopoietic progenitor cells in a rat myocardial infarction model. Journal of
nuclear medicine : official publication, Society of Nuclear Medicine 45, 512-518
(2004).
50. Melder, R.J., Elmaleh, D., Brownell, A.L., Brownell, G.L. & Jain, R.K. A method
for labeling cells for positron emission tomography (PET) studies. Journal of
immunological methods 175, 79-87 (1994).

21
51. Juweid, M.E. & Cheson, B.D. Positron-emission tomography and assessment of
cancer therapy. N Engl J Med 354, 496-507 (2006).
52. Ahrens, E.T. & Bulte, J.W. Tracking immune cells in vivo using magnetic resonance
imaging. Nature reviews. Immunology 13, 755-763 (2013).
53. Caravan, P., Ellison, J.J., McMurry, T.J. & Lauffer, R.B. Gadolinium(III) Chelates
as MRI Contrast Agents: Structure, Dynamics, and Applications. Chemical reviews
99, 2293-2352 (1999).
54. Holland G.N, B.P.A., Hinshaw W.S 19F magnetic resonance imaging Journal of
Magnetic Resonance 28, 133-136 (1977).
55. P., B. Pharmacokinetics using fluorine NMR in vivo. Progress in Nuclear Magnetic
Resonance Spectroscopy 33, 1-5 (1998).
56. Janjic, J.M., Srinivas, M., Kadayakkara, D.K. & Ahrens, E.T. Self-delivering
nanoemulsions for dual fluorine-19 MRI and fluorescence detection. Journal of the
American Chemical Society 130, 2832-2841 (2008).
57. Srinivas, M., Morel, P.A., Ernst, L.A., Laidlaw, D.H. & Ahrens, E.T. Fluorine-19
MRI for visualization and quantification of cell migration in a diabetes model. Magn
Reson Med 58, 725-734 (2007).
58. Ahrens, E.T. & Zhong, J. In vivo MRI cell tracking using perfluorocarbon probes
and fluorine-19 detection. NMR in biomedicine 26, 860-871 (2013).
59. Ahrens, E.T., Flores, R., Xu, H. & Morel, P.A. In vivo imaging platform for tracking
immunotherapeutic cells. Nature biotechnology 23, 983-987 (2005).
60. Ahrens, E.T., Young, W.B., Xu, H. & Pusateri, L.K. Rapid quantification of
inflammation in tissue samples using perfluorocarbon emulsion and fluorine-19
nuclear magnetic resonance. Biotechniques 50, 229-234 (2011).
61. Khurana, A., Chapelin, F., Xu, H., Acevedo, J.R., Molinolo, A., Nguyen, Q. &
Ahrens, E.T. Visualization of macrophage recruitment in head and neck carcinoma
model using fluorine-19 magnetic resonance imaging. Magn Reson Med 79, 1972-
1980 (2018).
62. Gaudet, J.M., Ribot, E.J., Chen, Y., Gilbert, K.M. & Foster, P.J. Tracking the fate of
stem cell implants with fluorine-19 MRI. PLoS One 10, e0118544 (2015).
63. Ribot, E.J., Gaudet, J.M., Chen, Y., Gilbert, K.M. & Foster, P.J. In vivo MR detection
of fluorine-labeled human MSC using the bSSFP sequence. International journal of
nanomedicine 9, 1731-1739 (2014).
64. Rizzo, S., Petrella, F., Zucca, I., Rinaldi, E., Barbaglia, A., Padelli, F., Baggi, F.,
Spaggiari, L., Bellomi, M. & Bruzzone, M.G. In vitro labelling and detection of

22
mesenchymal stromal cells: a comparison between magnetic resonance imaging of
iron-labelled cells and magnetic resonance spectroscopy of fluorine-labelled cells.
Eur Radiol Exp 1, 6 (2017).
65. Bible, E., Dell'Acqua, F., Solanky, B., Balducci, A., Crapo, P.M., Badylak, S.F.,
Ahrens, E.T. & Modo, M. Non-invasive imaging of transplanted human neural stem
cells and ECM scaffold remodeling in the stroke-damaged rat brain by (19)F- and
diffusion-MRI. Biomaterials 33, 2858-2871 (2012).
66. Boehm-Sturm, P., Aswendt, M., Minassian, A., Michalk, S., Mengler, L., Adamczak,
J., Mezzanotte, L., Lowik, C. & Hoehn, M. A multi-modality platform to image stem
cell graft survival in the naive and stroke-damaged mouse brain. Biomaterials 35,
2218-2226 (2014).
67. Boehm-Sturm, P., Mengler, L., Wecker, S., Hoehn, M. & Kallur, T. In vivo tracking
of human neural stem cells with 19F magnetic resonance imaging. PLoS One 6,
e29040 (2011).
68. van der Kolk, A.G., Hendrikse, J., Zwanenburg, J.J., Visser, F. & Luijten, P.R.
Clinical applications of 7 T MRI in the brain. Eur J Radiol 82, 708-718 (2013).
69. Chapelin, F., Gao, S., Okada, H., Weber, T.G., Messer, K. & Ahrens, E.T. Fluorine-
19 nuclear magnetic resonance of chimeric antigen receptor T cell biodistribution in
murine cancer model. Scientific Reports 7 (2017).
70. Gonzales, C., Yoshihara, H.A., Dilek, N., Leignadier, J., Irving, M., Mieville, P.,
Helm, L., Michielin, O. & Schwitter, J. In-Vivo Detection and Tracking of T Cells
in Various Organs in a Melanoma Tumor Model by 19F-Fluorine MRS/MRI. PLoS
One 11, e0164557 (2016).
71. Srinivas, M., Turner, M.S., Janjic, J.M., Morel, P.A., Laidlaw, D.H. & Ahrens, E.T.
In vivo cytometry of antigen-specific t cells using 19F MRI. Magn Reson Med 62,
747-753 (2009).
72. Zhong, J., Sakaki, M., Okada, H. & Ahrens, E.T. In vivo intracellular oxygen
dynamics in murine brain glioma and immunotherapeutic response of cytotoxic T
cells observed by fluorine-19 magnetic resonance imaging. PLoS One 8, e59479
(2013).
73. Bouchlaka, M.N., Ludwig, K.D., Gordon, J.W., Kutz, M.P., Bednarz, B.P., Fain, S.B.
& Capitini, C.M. (19)F-MRI for monitoring human NK cells in vivo.
Oncoimmunology 5, e1143996 (2016).
74. Somanchi, S.S., Kennis, B.A., Gopalakrishnan, V., Lee, D.A. & Bankson, J.A. In
Vivo (19)F-Magnetic Resonance Imaging of Adoptively Transferred NK Cells.
Methods in molecular biology 1441, 317-332 (2016).

23
75. Fink, C., Gaudet, J.M., Fox, M.S., Bhatt, S., Viswanathan, S., Smith, M., Chin, J.,
Foster, P.J. & Dekaban, G.A. (19)F-perfluorocarbon-labeled human peripheral blood
mononuclear cells can be detected in vivo using clinical MRI parameters in a
therapeutic cell setting. Sci Rep 8, 590 (2018).
76. Ku, M.C., Edes, I., Bendix, I., Pohlmann, A., Waiczies, H., Prozorovski, T., Gunther,
M., Martin, C., Pages, G., Wolf, S.A., Kettenmann, H., Uckert, W., Niendorf, T. &
Waiczies, S. ERK1 as a Therapeutic Target for Dendritic Cell Vaccination against
High-Grade Gliomas. Molecular cancer therapeutics 15, 1975-1987 (2016).
77. Waiczies, H., Lepore, S., Janitzek, N., Hagen, U., Seifert, F., Ittermann, B., Purfurst,
B., Pezzutto, A., Paul, F., Niendorf, T. & Waiczies, S. Perfluorocarbon Particle Size
Influences Magnetic Resonance Signal and Immunological Properties of Dendritic
Cells. PLoS ONE 6 (2011).
24
Chapter 2: Experimental methods focus
2.1. CAR T cell engineering
2.1.1. Construct
In order to optimize efficiency and cost, viral vector-based protocols are the most
commonly employed for T cell transduction1. Lentiviral vectors can integrate large CAR
constructs and continuously express the receptor after integration in the host cell DNA. CAR
receptors are generally composed of (1) an extracellular antibody single chain variable
fragment (scFv) specific to a given cancer antigen, (2) a CD3z domain to mimic the TCR
intracellular signal-transduction pathway, (3) and a couple intracellular co-stimulatory
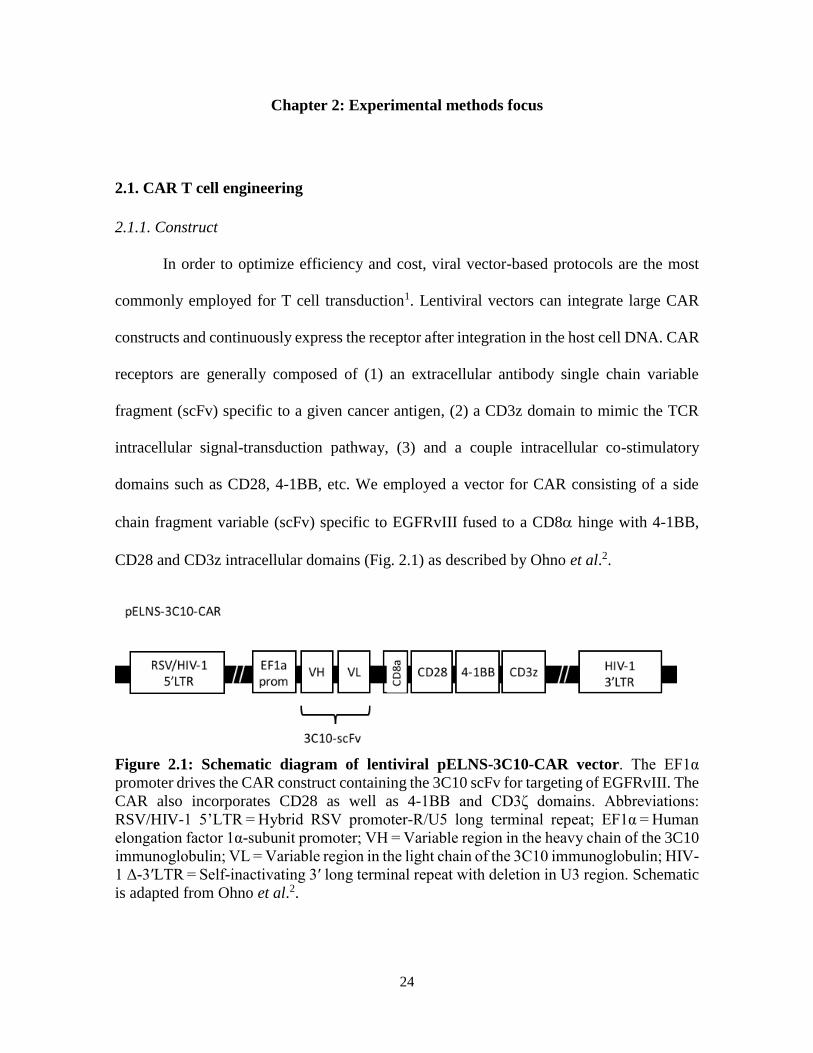
domains such as CD28, 4-1BB, etc. We employed a vector for CAR consisting of a side
chain fragment variable (scFv) specific to EGFRvIII fused to a CD8 hinge with 4-1BB,
CD28 and CD3z intracellular domains (Fig. 2.1) as described by Ohno et al.2.
Figure 2.1: Schematic diagram of lentiviral pELNS-3C10-CAR vector. The EF1α
promoter drives the CAR construct containing the 3C10 scFv for targeting of EGFRvIII. The
CAR also incorporates CD28 as well as 4-1BB and CD3ζ domains. Abbreviations:
RSV/HIV-1 5’LTR = Hybrid RSV promoter-R/U5 long terminal repeat; EF1α = Human
elongation factor 1α-subunit promoter; VH = Variable region in the heavy chain of the 3C10
immunoglobulin; VL = Variable region in the light chain of the 3C10 immunoglobulin; HIV-
1 Δ-3′LTR = Self-inactivating 3′ long terminal repeat with deletion in U3 region. Schematic
is adapted from Ohno et al.2.
25
pELNS-3C10-CAR bacterial streak was kindly provided by Dr. Okada at UCSF. A
single colony is harvested with a pipette tip and expanded overnight in 3 ml of Luria Bertani
media (BD, Sparks, MD) with 100 mg/ml Carbenicillin (Sigma Aldrich, St Louis, MO) in a
shaking incubator at 37 C. Transformed E-Coli are further expanded in 250 ml of Luria
Bertani media overnight to obtain sufficient yield. Plasmid is then purified by Midiprep
using the Nucleobond Xtra Midi kit (#740410.10, Macherey Nagel, Bethlehem, PA).
Plasmid is reconstituted in 350 l autoclaved water and kept at -20 C before use. A 2 l
aliquot is used to determine yield on a Nanodrop 2000 spectrophotometer (Thermofisher,
Waltham, MA). Packaging and envelope plasmids psPAX2 and pMD2.G are produced using
the same protocol.
2.1.2. Virus production
The standard cell line for virus production is human embryonic kidney 293 cells
(ATCC, Manassas, VA), referred to as 293T. They are renowned for transfection efficacy
and high viral yields. For viral production, ten million 293T cells are plated in a T175 flask
to establish ~ 70% confluence. Two transfection solutions are then prepared: (A) 4.5 ml of
OptiMEM media (Gibco, Waltham, MA) with 180 l of Lipofectamine 2000 (Invitrogen,
Carlsbas, CA) and (B) 4.5 ml of OptiMEM media with 2.03 g of pELNS-3C10-CAR, 1.57
g psPAX2 and 0.41 g pMD2.G. After a few minutes, (A) and (B) are combined and
incubated for 20 minutes at room temperature. Media is then removed from the 293T cells
and replaced with the transfection cocktail. Five hours later, transfection cocktail is aspirated
and replaced by full Dulbecco’s Modified Eagle’s Medium (DMEM, Gibco) media. At 24
and 48 hours, 293T viral supernatant is harvested and filtered through a 0.22 m filter.

26
Supernatant is then transferred to ultracentrifuge tubes and centrifuged at 16,000 rpm for 2
hours at 4C. Tube supernatant is aspirated without disturbing the viral pellet. Pellet is
resuspended in 150 l Phosphate-Buffered Saline (PBS, Gibco) and used immediately.
Transduction efficiency was first tested on Jurkat cells and then on primary human T cells.
The optimal efficiency/viability was determined to correspond to 30 l of virus per 1 million
cells.
2.1.3. Human T cell isolation
Human T cells for CAR transduction are usually isolated from peripheral blood
mononuclear cell (PBMC) preps for preclinical and clinical studies. In the lab, T cells are
usually purified via gradient density centrifugation followed by negative magnetic sorting.
Gradient density centrifugation:
One unit of leuko-reduction system-white blood cell (LRS-WBC) blood is obtained
from the San Diego Blood Bank. This blood sample is enriched in white blood cells (average
1.3x10⁹ per unit). In the biosafety cabinet, LRS-WBC blood is resuspended in sterile PBS
without calcium and magnesium at 1:4 ratio. A 50 ml conical tube containing 16 ml of Ficoll
(HiSep # LS001, Sigma Aldrich) is prepared and the diluted blood sample is gently added
on the Ficoll layer to avoid mixing. The tube is centrifuged for 30 min at 300 g at room
temperature without brakes. After centrifugation, the plasma layer sits on top of the tube,
followed by the lymphocyte and monocyte layer, and finally the Ficoll with erythrocytes.
The plasma layer is aspirated and the buffy coat (mononuclear cells) is gently collected. The
layer gathered is rinsed with washing buffer (PBS + 0.5% bovine serum albumin + 2mM

27
EDTA) and centrifuged at 300 g for 10 minutes with regular brakes. The pellet is
resuspended in 5 ml washing buffer and ready for magnetic sorting.
Magnetic-activated cell sorting (MACS)
For this step, the Miltenyi Pan T Cell Isolation kit (#130-096-535, MiltenyiBiotech
Inc., Auburn, CA) is used, following the protocol provided by the supplier. Briefly, the cell
suspension is filtered through a 40 m filter to obtain a single cell suspension and counted.
The cell suspension is resuspended in T Cell Biotin-Antibody Cocktail. This cocktail
captures all CD3-negative cells. The Microbead Cocktail is then added and incubated to affix
a magnetic bead to the antibodies that bound to cells. The cell suspension is then passed on
a ferromagnetic column affixed to a magnet (MidiMACS Separator # 130-042-302). The
flow through consists of the non-magnetically labeled T-cells. Isolated T-cells are counted
and are expected to be about half of the initial cell count.
T cell culture conditions
T-cells need to be stimulated with IL2, CD3 and CD28 to maintain activity and grow
in culture. Dynabeads Human T-activator CD3/CD28 (Gibco # 11131D) are used for this
purpose. For fresh/thawed T cells, experience has shown that a concentration of 1-2 million
T cells per ml of culture media is required for further expansion. Usually, 5-10 million cells
are resuspended in 5 ml of full media (Roswell Park Memorial Institute (RPMI), 10% fetal
bovine serum (FBS), 1% Penicillin/Streptomycin (Gibco) and 100 units/ml of human
recombinant interleukin 2 (IL2, Peprotech, Rocky Hill, NJ). CD3/CD28 dynabeads (10 l)
are also added to the media for initial stimulation but not in subsequent media changes,
unless T cell growth slows. Manufacturer recommends re-stimulation every 7-10 days. After

28
overnight culture, cells should appear as multi-cellular clumps or grapes around the
dynabeads (Fig. 2.2). This is an indication of healthy culture conditions. Media is changed
every other day to renew IL-2 until cells are used or frozen down.
Figure 2.2: CAR T cell appearance in culture. (a) After initial stimulation, CAR T cells
form clumps/grapes around the dynabeads. (b) After a couple weeks in culture, CAR T cells
detached from dynabeads and appear as individual cells.
The dynabeads used for T cell activation are composed for superparamagnetic
paramagnetic iron oxides and therefore create image artifacts on MR images. To remove
dynabeads prior to in vivo use of T cells, cell suspension is transferred to a 15 ml conical
tube and placed in a DynaMag-15 magnet for one minute. The magnet is tipped over a clean
conical tube to collect cell suspension devoid of dynabeads. This step is repeated three times
to guaranty removal of virtually all dynabeads.

29
2.1.4. Human T cell transduction
While in exponential growth phase and at the earliest passage possible (P1), human
T cells are transduced with the CAR virus freshly produced. T cells are seeded in 6 well
plates at a density of 1 million cells in 2 ml of full media (as above) and 3 g/ml Polybrene
(Polybrene Transfection Reagent, Millipore, Billerica, MA). 30 l of CAR virus is added to
each well and the 6-well plate is spinoculated for 1 hour at 1000 g at room temperature. The
plate is then placed back in the incubator overnight. The next day, cells are centrifuged to
remove the viral supernatant and resuspended in full media. Transduction efficacy is
assessed after 5 days.
2.1.5. Expression of CAR
To obtain significant anti-tumor results, a population of T cells comprising at least
70%+ CAR T cells is desirable. Two flow cytometry methods enable CAR expression
assessment on the surface of T cells. The first strategy is to co-incubate the transduced cells
with a biotinylated EGFRvIII protein and detect bound cells with a fluorescent streptavidin
secondary. The second strategy is to consider the mouse backbone of the CAR receptor and
target it with an anti-mouse F(ab’) antibody fragment. The latter is very specific and ~ 100
times cheaper than the modified EGFRvIII protein.
For flow analyses, newly generated CAR T cells and untransduced human T cells
(negative control) are needed. Compensation beads are also used to minimize fluorescence
spillover.

30
Flow markers used:
- hCD3- APC-Cy7 (Biolegend, San Diego, CA)
- hCD4-BV421 (Biolegend)
- hCD8-FITC (Biolegend)
- ‘CAR’-PE
Incubation with primary antibody Biotin-SP-conjugated Affinipure F(ab’)2
Fragment Goat Anti-Mouse IgG, F(ab’)2 fragment (dilution 1:200, 30 min at
RT, Jackson Laboratories, Cat n. 115-066-006) followed by wash and
secondary antibody Streptavidin-PE (dilution of 1:200, 15 min at 4 degrees, BD
Pharmingen, Cat n. 554061).
- 7-AAD (viability, PerCP-Cy5.5): added just prior to FACS acquisition (Biolegend)
Conditions tested:
- CAR T cell sample: Unstained/Single color CD3/Single color CD4/Single color
CD8/Single color ‘CAR’/All colors
- Untransduced T cell sample: Unstained/All colors
- The viability marker 7-AAD can be added later on to the unstained sample for
single color 7-AAD control as well as to ‘All colors’ sample.
Cell samples are resuspend cells to final concentration of 5×10⁵ cells in 200 μl FACS
buffer (# 4222-26, Invitrogen) + 1:100 heat inactivated human serum (Corning, NY) +1:100
FC Block (CD16/32 mouse, Biolegend) optional since cells are human) per tube. Tubes are

31
kept on ice 10 min in the dark. ‘CAR’ primary antibody is added to ‘single color ‘CAR’’
and ‘all colors’ tubes. Tubes are incubated 30 min at RT, rinsed with FACS buffer and spun
5 min at 1,000 rpm. Cells are resuspended in 200 μl FACS buffer + 1:100 heat inactivated
human serum. Antibody cocktails are added to each tube at 1:200 dilution and incubated 15
min in dark on ice. Samples are rinsed twice with FACS buffer and spun 5 min at 1,000 rpm.
Cells are resuspended in 600 μl of FACS buffer and transfered to clear FACS tubes with
cell-strainer cap. Cell are kept in dark and on ice and resuspend gently before analysis on
the Fortessa FACS machine (BD Biosciences, San Diego, CA). 5,000 events are recorded
for the compensation samples and 10,000 events are acquired for all other samples. 7-AAD
viability marker is added to the samples minutes before recording viability data.
Gates are established based on the unstained and untransduced T cell control (Fig.
2.3 and 2.4) and the fraction of PE-positive events (CAR-T cells) is then determined. For
each batch of CAR T cells produced, initial transduction efficacy was measured ~5 days
after addition of the virus and at regular intervals until administration to the mouse.

32
Fig
ure
2.3
: F
low
ch
ara
cter
iza
tion
of
un
tran
sdu
ced
hu
man
T c
ells
. T
he
pan
els
dis
pla
yed
corr
esp
ond t
o h
um
an T
cel
ls
afte
r 4 p
assa
ges
in c
ult
ure
. T
he
top p
anel
show
s st
ained
T c
ells
and t
he
bott
om
pan
el s
how
s co
rres
po
ndin
g u
nst
ained
contr
ol.
Untr
ansd
uce
d T
cel
ls a
re 9
9 %
CD
3 +
, 89
% C
D4+
and 9
% C
D8
+ a
nd C
AR
neg
ativ
e.

33
Fig
ure
2.4
: F
low
ch
ara
cter
iza
tion
of
CA
R T
cel
ls.
The
pan
els
dis
pla
yed
corr
esp
on
d t
o T
cel
ls 4
pas
sag
es a
fter
tran
sduct
ion w
ith C
AR
. T
he
top p
anel
show
s st
ained
CA
R T
cel
ls a
nd t
he
bott
om
pan
el s
how
s co
rres
pondin
g
unst
ained
contr
ol.
CA
R T
cel
ls a
re 9
9 %
CD
3 +
, 74%
CD
4+
, 22 %
CD
8+
and 8
5 %
CA
R +
.
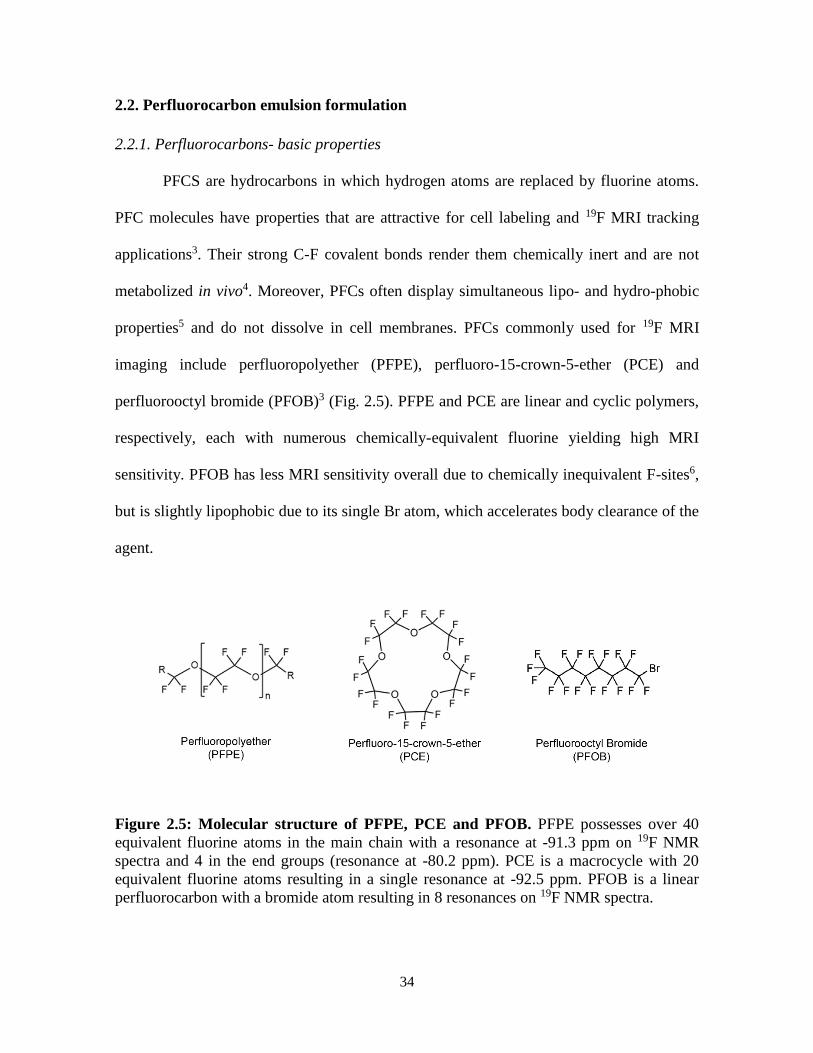
34
2.2. Perfluorocarbon emulsion formulation
2.2.1. Perfluorocarbons- basic properties
PFCS are hydrocarbons in which hydrogen atoms are replaced by fluorine atoms.
PFC molecules have properties that are attractive for cell labeling and 19F MRI tracking
applications3. Their strong C-F covalent bonds render them chemically inert and are not
metabolized in vivo4. Moreover, PFCs often display simultaneous lipo- and hydro-phobic
properties5 and do not dissolve in cell membranes. PFCs commonly used for 19F MRI
imaging include perfluoropolyether (PFPE), perfluoro-15-crown-5-ether (PCE) and
perfluorooctyl bromide (PFOB)3 (Fig. 2.5). PFPE and PCE are linear and cyclic polymers,
respectively, each with numerous chemically-equivalent fluorine yielding high MRI
sensitivity. PFOB has less MRI sensitivity overall due to chemically inequivalent F-sites6,
but is slightly lipophobic due to its single Br atom, which accelerates body clearance of the
agent.
Figure 2.5: Molecular structure of PFPE, PCE and PFOB. PFPE possesses over 40
equivalent fluorine atoms in the main chain with a resonance at -91.3 ppm on 19F NMR
spectra and 4 in the end groups (resonance at -80.2 ppm). PCE is a macrocycle with 20
equivalent fluorine atoms resulting in a single resonance at -92.5 ppm. PFOB is a linear
perfluorocarbon with a bromide atom resulting in 8 resonances on 19F NMR spectra.

35
An interesting intrinsic property of PFCs is that they display weak molecular
cohesion, enabling gas dissolution 5. In fact, extensive work was conducted in the late 1990’s
7, 8 to emulsify PFCs into biocompatible, excretable, and readily injectable blood substitutes
to address hospital blood shortages 9. Building on in vivo cytometry technology, a logical
extension is to exploit known bio-sensing properties of the PFC molecules inside the cell.
Specifically, certain PFC molecules readily coordinate paramagnetic oxygen, which
shortens the 19F spin-lattice relaxation time (T1), where T1 varies linearly with the absolute
partial pressure of oxygen (pO2) 10. (T1 is the characteristic time constant for the 19F nuclei
to align along the MRI’s magnetic field, on the order of 0.5 to 2 s.) PFC emulsions have
previously been used to measure pO2 in vivo using MR techniques 11-14. However, a novel
use of 19F-based cell tracking is to use 19F T1 measurements to monitor intracellular
oximetry. This will be the subject of Chapter 4.
2.2.2. Key engineering properties of nanoemulsions for cell labeling
Key design considerations in nanoemulsion formulation include a small droplet size
(typically 50-200 nm), a narrow size range (e.g., polydispersity index <0.2) and a high
fluorine concentration (~20-30% w/v) to minimize volume added to culture. Nanoemulsion
formulations may also be complexed with fluorophores, for example near infrared dyes, to
create ‘dual-mode’ agents 3, 15, 16. Recent reviews exhaustively cover PFC nanoemulsion
design 3, 17.
Different published studies use a range of emulsion particle sizes 16, 18. The resulting
mean emulsion droplet size can impact the cell labeling process. Larger oil droplets (>200

36
nm) experience a larger centrifugal force during washing, and this force can potentially pellet
the labeling agent along with the cells thereby confounding the wash process 19. Larger
particle sizes are effective in labeling flask-adherent cells, such as DCs, where successful
wash steps can be implemented. A smaller droplet size (<180 nm) allows excess agent not
taken up by cells to be discarded with the supernatant during wash. Emulsion production
ideally yields a homogenous size distribution, which is easier to achieve with smaller droplet
sizes. Unintended, outlying large droplets (‘stability demons’) may evade detection in
dynamic light scattering particle size measurements of the batches. These demons can lead
to emulsion instability over time 20 and may spin-down with the cells. Overall, in properly
designed experiments, any free residual emulsion in the cell inoculant is de minimis and
inconsequential in view of detection limits of the MRI technique.
2.2.3. Surfactants
Neat PFC materials are dense oils. Emulsification is used to make a colloidal
suspension of the PFC oil that is stabilized using a surfactant. Surfactants reduce the
interfacial tension between water and PFC oils, thereby stabilizing the oil droplets. The
surfactant coat can also impart desirable surface properties that promote cell uptake in
culture 21, 22. The most commonly used classes of surfactants are pluronics and phospholipids
23. Pluronics are commercially available block co-polymers that come in different chain
lengths and hydrophilic/hydrophobic properties. F68 is a common pluronic (Fig. 2.6) for
emulsion formulation and was used in the experiments of Chapters 4 and 5.

37
Figure 2.6: Molecular structure of pluronic F68 and egg yolk phospholipid (EYP). F68
consists of hydrophilic ethylene oxide (x and z) and hydrophobic propylene oxide (y) repeats
conferring optimal surfactant properties. EYP is an amphipathic structure comprising a
hydrophilic polar head followed by saturated and unsaturated lipophilic fatty acid chains.
Egg yolk phospholipid is a common amphipathic lipid surfactant (Fig. 2.6). It is
purified from egg yolks by column chromatography to remove neutral lipids and cholesterol.
These are already used clinically in injectables as they enable long circulation in plasma.24.
Nonetheless, our experience has shown that EYP is not an ideal candidate for cell labeling
in vitro with occurrences of coalescence on the cell membrane instead of internalization.
Another limitation that will be further discussed in Chapter 4 is that the unsaturated fatty
acid tails oxidize in the presence of metals, creating toxic products.
2.2.4. Emulsion formulation and characterization
Sonication is a routine technique to formulate emulsions. Ultrasonic waves break
intermolecular bonds and disperse the molecules in solution. Nonetheless, sonication
engenders significant heat release, which may be detrimental for certain surfactants. In
addition, sonication is uniform only for small volumes, which limits the scale up and
reproducibility. Finally, sonication alone usually yields emulsions with wide size
distributions25, 26, which is detrimental for cell labeling applications. Microfluidization, a

38
high shear homogeneization technique, is another common method for emulsion
formulation. A pre-mix of PFC, surfactant, and water is pushed through an inlet reservoir
and forced into a fixed-geometry chamber by a high pressure pump. Microfluidization
produces smaller size nanoemulsions with narrow size distributions, which are better suited
for cell labeling applications. For the experiments in chapters 4 and 5, two-minute sonication
followed by 4 passes on the microfluidizer (LV1, Microfluidics, Westwood, MA) were used
to formulate the crown-ether emulsions. Microfluidizer stroke was 6 ml, piston diameter was
11 mm, pump pressure was set at 20,000 PSI and the interaction chamber and cooling coil
were kept on ice to avoid heating of the emulsion.
Emulsion size and polydispersity index (PdI) are measured by dynamic light
scattering (DLS, Zetasizer, Malvern, Northhampton, MA). These are acquired at different
time intervals and in different conditions (storage temperature, serum vs plain emulsion, etc.)
to evaluate stability. In the lab, emulsions with a ratio of surfactant (F68) between 5-10%
yielded emulsion sizes of 170-190 nm and a PdI of 0.08-0.12. PCE-F68 emulsions were
stable for >3 weeks at 4C and at room temperature.
Eventually, nanoemulsions degrade via coalescence and Ostwald ripening27.
Nanodroplets spontaneously attempt to reduce the interfacial surface area by coalescence,
thereby increasing the mean droplet size. Ostwald ripening consists of smaller droplets being
more soluble in the bulk phase and diffusing to larger droplets, raising their diameter. These
are major challenges in emulsion formulation and engineering strategies to delay this process
are heavily investigated to enable long shelf life of future clinical products.

39
2.2.5. Enhanced nanoemulsions
The principle bottleneck that remains for longitudinal tracking of transferred immune
cells is 19F MRI sensitivity. Strategies to increase cell loading include but are not limited to
the use of transfection agents, electroporation, metalation, and coating of the nanoemulsions
with cell penetrating peptides. Transfection agents and electroporation have not been shown
to drastically improve fluorine uptake in conditions that preserve cell viability and function.
Cell penetrating peptides such as the transactivator of transcription (TAT) from human
immunodeficiency virus can be employed to enhance PFC cell loading. TAT peptides have
been heavily studied and are known to facilitate cell loading of a range of cargo, including
micelles and polymersomes28, 29. Incorporation of TAT peptide into nanoemulsions
formulated with either lipid or pluronic (block co-polymer) surfactants is explored in
Chapter 4 (Figure 2.7).
Figure 2.7: Nanoemulsion design for MR sensitivity enhancement. Diketone chelator is
blended with the fluorous phase of the emulsion. The resulting blend is formulated into a
nanoemulsion incorporating TAT-surfactant moieties, and subsequently metalated with iron.
Iron(III)-bound fluorinated chelates, localized within the fluorous phase of a PFC
nanoemulsion, have been shown to be relatively stable and induce strong spin-lattice
relaxation time (T1) reduction, thereby increasing cell detection sensitivity30.

40
2.3 Immune cell labeling
2.3.1. Determinants of cell uptake
Cell labeling in culture is generally performed by simple co-incubation with
contrast/tracer agent as another factor in the media, followed by a wash step. Physical
techniques such as hypotonic swelling or electroporation have been used31, but chemical
transfection techniques are most common. In the case of superparamagnetic iron oxide
nanoparticles for proton imaging, the idea is to balance the negative charge of the particle
surface with cationic transfection agents such as protamine sulfate or Fugene32 to improve
cell loading. Though necessary, these labeling techniques remain controversial since the use
of transfection agents or other physical manipulations increase the risk of diminished cellular
viability and phenotype alterations. In the case of PFC cell labeling, generally the same
labeling methodology considerations apply. However, we note that ‘self-delivering’16 PFC
cell labeling agents have been devised that do not require any extra transfection agents or
mechanical cell perturbations.
Labeling periods range from several hours 33-36 to a day or more 37-39 to allow for
endocytic uptake to occur. Determinants of obtainable PFC cell uptake include (i) dose of
PFC in media, (ii) cell cytoplasmic volume and (iii) phagocytic properties of cells. Typically,
several concentrations and incubation times are tested to optimize uptake while minimizing
potential cell viability and phenotype alterations 16.

41
2.3.2. Specific case of lymphocytes
Phagocytic cells such as macrophages and DCs possess a large cytoplasmic volume
40 and thus are readily labeled to high levels of PFC. In contrast, lymphocyte labeling can
be challenging due to their small cellular and cytoplasmic size that limits the number of
probe droplets it can hold. In addition, lymphocytes are not naturally phagocytic. Optimal
labeling efficiency is attained when cells are in log phase of division. PFC uptake will follow
a dose response in the shape of a sigmoidal curve (Fig. 2.8) 39. A critical factor for strong
labeling of lymphocytes is that the culture must be viable and actively expanding, typically
aided by aggressive cytokine and co-stimulatory molecule engagement (e.g., irradiated 4-
1BBL/IL-15 expressing feeder cells, CD3/CD28 beads, etc.) as discussed elsewhere 37, 41.
Engineered PFC probes enable labeling of lymphocytes for in vivo tracking without the use
of transfection agents 16, as shown in preclinical studies 3, 42.
Figure 2.8: CAR T cell labeling with PFC nanoemulsion. (a) CAR T cell sigmoidal
uptake of a PCE-F68 emulsion as measured by 19F NMR and (b) corresponding cell viability.

42
2.3.3. Confirmation of intracellular uptake
After washes, cell labeling levels can be measured in a pellet sample using
conventional 19F NMR spectroscopy to yield the mean 19F/cell. Various cell microscopy
methods have been used to validate intracellular compartmentalization of PFC droplets.
Using transmission electron microscopy, the emulsion droplets appear as electron-sparse
ovoids against counterstain 18, 43, 44. Emulsion droplets often coalesce into encapsulated
vesicles consistent with lysosomal storage in lymphoid-type and stem cells 45.
Dual-mode, PFC-fluorescence emulsions 16 containing bright fluorescent dyes
enable flow cytometry of labeled cells, as well as optical microscopy in histology tissues.
Confocal microscopy images of labeled immune cells clearly show intracellular localization
(Fig. 2.9a). PFC localization is inconsistent with dominate cell surface labeling, which has
been confirmed by explicit cell membrane staining using a second fluorescent dye targeting
cell surface markers (Fig. 2.9a), or cellular proliferation dyes such as 5(6)-
Carboxyfluorescein N-hydroxysuccinimidyl ester (CFSE)37. Detailed fluorescent
microscopy studies using a dual-mode emulsion with a pH sensitive dye confirm that the
PFC emulsion traffics into low-pH (lysosomal) vesicles over time 45. This intracellular
compartmentalization is the steady-state in living cells, as the PFC is not degraded in the cell
and there is no evidence for active exocytosis 45. Thus, verification of PFC nanoemulsion
location within a cell is not typically necessary given its aggregation tendency and it is
compartmentalized in a manner consistent with other nanostructures of similar size.

43
Figure 2.9: Confirmation of intracellular localization of PFC nanoemulsion in CAR T
cells. Panel (a) is a confocal microscopy image depicting CAR T cells with internalized dual
mode PFC-Red agent. The nuclei are labeled with Hoeschst Nuclear stain and the membrane
with CD3-FITC.
2.3.4. Viability and phenotype testing
Cell labeling should not alter cell viability, proliferation, phenotypic markers, or
function, as described in several reports 46, 47. PFCs have not been shown to change any of
these characteristics in the multiple cell lines tested. The most detailed in vitro study to date
involved PFC labeled primary human DCs 39; cells were assayed for viability, maturation
phenotype, cytokine production, T cell stimulatory capacity, and chemotaxis 39, and no
differences in these parameters were observed between labeled and unlabeled cells 39.
In the study described in Chapter 3, potential impact of PFC labeling was evaluated
by measuring CD4, CD8, and 7-AAD viability marker by flow cytometry, as well as CAR
T cell proliferation rate, at day 2, 7 and 14 post-labeling and compared to unlabeled control.
Labeling experiments with PFC nanoemulsions at 10 mg/ml over a period of 12-hour co-
incubation displayed minimal viability impairment as assessed by Trypan blue exclusion test

44
(Average 95±1%, N=3 replicates) and flow cytometry viability measurements (Table 2.1,
p>0.05). Moreover, PFC labeling does not appear to alter T cell phenotype as defined by
CD4+ and CD8+ expression (Table 2.1, p>0.05).
Table 2.1. Longitudinal characterization of PFC-labeled CAR T cells. Table displays
average doubling time, CD4/CD8 ratio and viability as measured by flow cytometry of PFC
labeled CAR T cells and control unlabeled CAR T cells at days 2, 7 and 14 after PFC labeling
(N=3 replicates). No significant differences were seen between labeled and unlabeled CAR
T cells for all criteria.
2.4. Fluorine imaging methods
2.4.1. Quantification of emulsion concentration and cell uptake by NMR
19F NMR measurements were gathered using a 400 MHz Bruker Advance NMR
spectrometer. The 19F NMR spectra were acquired using: 17 μs pulse, 32,000 points acquired
for free induction decay (FID), 100 ppm spectral width, 32 averages, and a recycle delay of
15 s. For emulsion concentration calculation, 30 μl PFC nanoemulsion was added to 270 μl
0.1% (w/v) Sodium Trifluoroacetate (TFA) in D2O. Perfluorocarbon concentration (CPFC,
mg/mL) was determined by using the relative integrals of the TFA signal (ITFA = 1, -76.6
ppm) and the perfluorocarbon signal (IPFC). As per the following equation:

45
𝐶𝑃𝐹𝐶 = 𝐴 𝐼𝑃𝐹𝐶 𝐶𝑇𝐹𝐴𝑉𝑇𝐹𝐴
𝐵𝑉𝑃𝐹𝐶
CPFC and CTFA represent the concentration of perfluorocarbon emulsion and TFA
respectively in mg/ml in the NMR sample, VPFC and VTFA indicate the respective volumes
of nanoemulsion and TFA solution in ml in the NMR sample, A and B are constants to
account for the percentage of fluorine by mass in TFA and PFC respectively (A = 42, B =
65.5 for PCE and 58 for PFPE).
For uptake experiments, 1 million cells were plated in 1 ml full media in 24 well
plates (n=3 wells per condition). PCE emulsions were added to each well and incubated
overnight (16 h) at 37 oC, 5% CO2. The cells were then washed three times with phosphate
buffered saline (PBS) to rinse free emulsion. Cells were counted and viability was assessed
by trypan blue staining. Thereafter, the cells were spun down, resuspended in 150 l lysis
buffer (1% Triton X in PBS) and transferred to a 5mm NMR tube. Fifty microliter 0.1%
TFA was added to each tube and 19F NMR spectra were acquired (Fig. 2.10). Number of 19F
atoms per cell was determined with the same equation as above and divided by the number
of cells in each NMR tube.

46
Figure 2.10: Representative 19F NMR spectrum (9.4T) of CAR T cell pellet labeled with
PFPE emulsion. The TFA reference registers at -76 ppm and the labeled cell pellet at -91.3
ppm. The ratio of integrals multiplied by the number of TFA atoms and divided by the
number of cells in the NMR tube yields the average uptake per cell.
2.4.2. NMR cytometry limits of detection (LOD)
Limits of detection were also assessed on the 400 MHz NMR spectrometer.
Exchangeable 5 mm and 10 mm sample-NMR probes (Bruker models BBFO and BBO,
respectively) were evaluated. Sample standards with varying 19F content were prepared from
serial dilutions of 0.05 to 0.5% TFA/D2O in volumes of 250 or 1,500 μl for 5 or 10 mm
probes, respectively. All sample spins were contained within the receptive field of the NMR
probe. The 19F NMR spectra were acquired using: 17 μs pulse, 32,000 points acquired for
free induction decay (FID), 100 ppm spectral width, 128 averages, 20 min acquisition time,
and a recycle delay of 10 s. The signal-to-noise ratio (SNR) of the TFA spectra were
calculated using TopSpin software (Bruker, Billerica, MA). The results were plotted as the
SNR versus 19F content measured for each NMR sample probe (5 or 10 mm), and LOD was
defined as the 19F atom count where the extrapolated SNR=2 (Fig. 2.11). LOD were

47
approximately ~ 1014 and ~1015 19F atoms for the 5 and 10 mm probe respectively,
corresponding to ~7103 and ~4104 cells assuming typical 19F labeling levels in T cells.
Figure 2.11: Fluorine-19 NMR limit of detection (LOD) estimation. Panels display the
signal to noise ratio (SNR) as a function of fluorine concentration in TFA reference for a
standard 5 and 10 mm probe (left and right, respectively). After a linear fit, the LOD is
defined as the 19F atom count where the extrapolated SNR=2. The results yield a LOD of
approximately ~ 1014 and ~1015 19F atoms for the 5 and 10 mm probe respectively,
corresponding to ~7103 and ~4104 cells assuming typical 19F labeling levels in T cells.
All 19F NMR data were acquired on at 376.3 MHz with a 20 min acquisition time and using
a 17 s pulse, 32,000 points of free induction decay (FID), 100 ppm spectral width, 128
averages, and recycle delay of 10 s.
2.4.3. Quantification of apparent cell numbers by NMR
Following the same principle as emulsion concentration and cell uptake
determination by 19F NMR, tissue panel necropsies can be harvested from animals receiving
labeled CAR T cells and fluorine content determined by NMR. Each tissue is placed in a 5
or 10 mm NMR tube depending on organ size. Blood collected by cardiac puncture can also
be measured by NMR. A sealed glass reference capillary containing a mixture of 0.1% (w/v)
TFA as well as 0.325 mM MnCl2 is placed beside the organ sample in the NMR tube. MnCl2

48
enables shortening of the TFA’s T1 relaxation to match that of PFC nanoemulsion (T1 = 470
ms at 9.4 Tesla) according to the following equation48:
1
𝑇1=
1
𝑇1𝑜+ 𝑟1[𝑀𝑛𝐶𝑙2]
T1 is the target we want to reduce the spin-lattice relaxation time of TFA to (470 ms at 9,4
Tesla), T1o is the TFA spin-lattice relaxation time at baseline, r1 is the manganese chloride
relaxivity, [MnCl2] is the concentration needed to shorten the T1 to expected value.
After shimming, the 19F NMR spectra were acquired with a 17 s pulse, 32,000 FID
points, 100 ppm spectral width, 32 to 1024 averages( depending on SNR) and a recycle delay
of 1.5 s. Phase and baseline corrections were performed to improve measurement accuracy.
19F content of each tissue was determined by calculating the ratio of the PFC peak integrated
area to the TFA reference integral and multiplied by the number of fluorine atoms in the
reference. The apparent cell number per organ was calculated by dividing the number
obtained by the mean 19F/cell of T cells measured after labeling.
2.4.4. In vivo MRI methods
The Molecular Imaging Center at the Sanford consortium (MICS) is equipped with
an 11.7 T horizontal (16 cm bore) Bruker Biospec preclinical scanner (Fig.2.12a). All in vivo
experiments were conducted on that system. Scans were acquired using a 40 mm dual-tuned
1H/19F birdcage transmit-receive volume coil (Bruker #T12800V3, Fig 2.12b) or a 20 mm
custom-built transmit-receive surface coil (Fig. 2.12c)

49
Figure 2.12: MRI system and coils for in vivo imaging. (a) 11.7 T horizontal (16 cm bore)
Bruker Biospec preclinical scanner. (b) 40 mm dual-tuned 1H/19F birdcage transmit-receive
volume coil used for tumor pO2 measurements. (c) 20 mm custom-built transmit-receive
surface coil used for CAR T cell pO2 measurements.
When imaging with the volume coil, mice were anesthetized with 2% isoflurane in
pure oxygen for no longer than 90 minutes per imaging session. For the surface coil,
isoflurane signal impeded accurate image acquisition and R1 measurements (Fig. 2.13).
Therefore, we pursued with injectable anesthesia, first via ketamine/xylazine and
metedomidine (0.2mg/ml, 0.01 ml/g) bolus intraperitoneal (IP) injection and maintained by
an IP catheter of metedomidine (0.4mg/ml, 0.2ml/h).
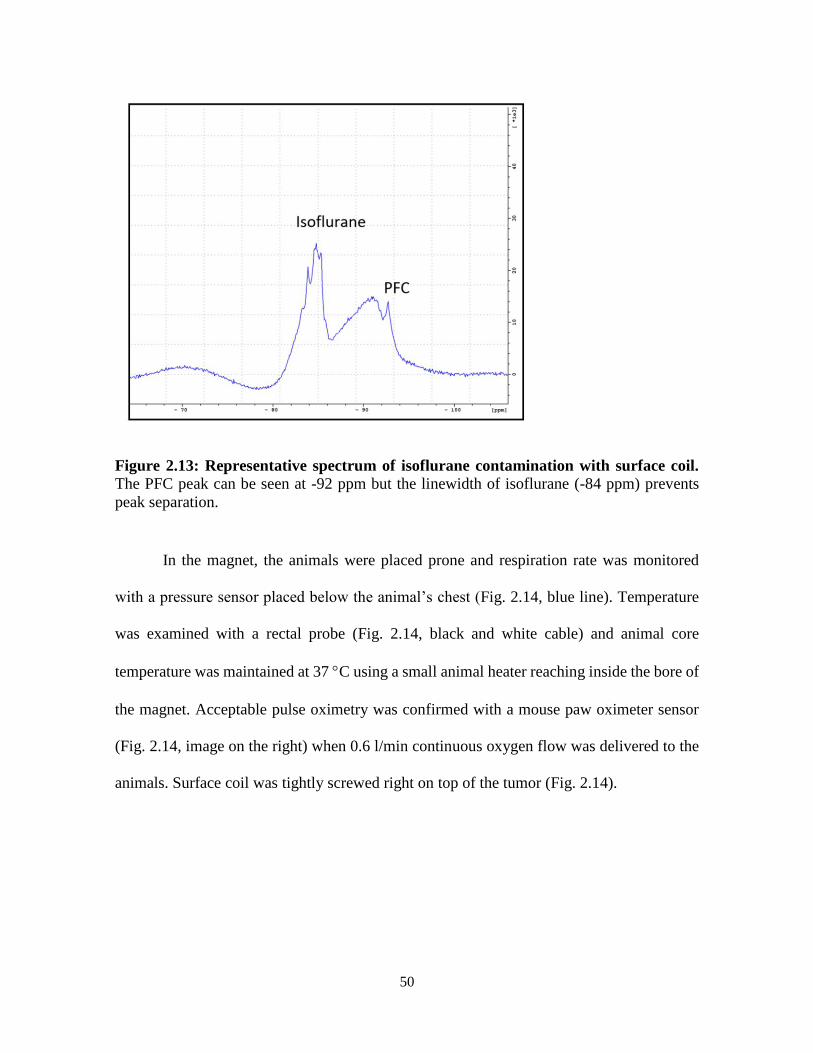
50
Figure 2.13: Representative spectrum of isoflurane contamination with surface coil.
The PFC peak can be seen at -92 ppm but the linewidth of isoflurane (-84 ppm) prevents
peak separation.
In the magnet, the animals were placed prone and respiration rate was monitored
with a pressure sensor placed below the animal’s chest (Fig. 2.14, blue line). Temperature
was examined with a rectal probe (Fig. 2.14, black and white cable) and animal core
temperature was maintained at 37 C using a small animal heater reaching inside the bore of
the magnet. Acceptable pulse oximetry was confirmed with a mouse paw oximeter sensor
(Fig. 2.14, image on the right) when 0.6 l/min continuous oxygen flow was delivered to the
animals. Surface coil was tightly screwed right on top of the tumor (Fig. 2.14).

51
Figure 2.14: Mouse monitoring setup. Mouse is placed prone on a pressure pad (blue line)
to monitor respiration. The black and white cable monitors animal temperature. On the right,
a sensor is placed on the mouse paw to monitor blood oxygenation. The surface coil is tightly
screwed right above the tumor to obtain optimal signal.
RARE (Rapid Acquisition with Relaxation Enhancement) is an enhanced spin echo
MR sequence where multiple echoes (number of echoes = rare factor) are used to contribute
to the same image. This reduces the imaging time compared to traditional spin echo
sequences. Rare factor, repetition time (TR) and number of averages (NA) was optimized to
yield highest signal to noise ratio per unit time (SNR/t). Excitation time (TE) was set at the
minimum. TR is usually chosen between 1.2 and 3 times the PFC T1 to maximize signal in
minimal time.
PRESS (Point-RESolved Spectroscopy) is a localized (single voxel) spectroscopy
method consisting of three slice selective pulses in orthogonal planes. Signal comes from
the intersection of the three planes. PRESS provides the highest SNR amongst localized
spectroscopy sequences, but results in higher specific absorption rate (energy absorbed by
the sample/subject when exposed to the radio frequency). For pO2 experiments, a voxel
encompassing the whole tumor is defined and twelve TR values are used to measure the R1
relaxation rate, ranging between 0.1 and 6 s.

52
2.4.5. R1 determination and pO2 extrapolation
PCE nanoemulsion dissolves oxygen, resulting in a linear increase in the 19F spin-
lattice relaxation rate (R1) with increasing pO2. A calibration curve was established by
subjecting emulsion to different pressures of oxygen. Triplicate emulsion samples were
placed in 5 mm NMR tubes and bubbled for 15 min with mixtures of oxygen and nitrogen
ranging from 0% to 100%. Tubes were then sealed, placed in the 11.7T MRI instrument, and
equilibrated to 37 °C. The R1 of each individual tube was measured using a PRESS sequence
and calculated by integrating the 19F peak acquired at different TR values (Fig. 2.15), and
the resulting values are fit using a three-parameter single exponential equation in MNova
6.0.2 software (Mestrelab, Spain). The signal is proportional to the exponential of -TRR1.
Using the same methodology, PCE-labeled cancer or T cell pO2 can be determined using the
calibration curve (Fig. 2.16) 49, 50.
Figure 2.15: Determination of voxel R1. The signal acquired for each repetition time value
is integrated and fitted to a three-parameter single exponential equation, yielding the voxel
R1.
19F chemical shift (ppm)
TR (
0.1
to
6 s
)

53
Figure 2.16: In vitro calibration curve of R1 versus pO2 at 11.7 T and 37 °C. Individual
points represent triplicate R1 measurements of emulsions with different partial oxygen
pressures. The solid line represents the resulting linear fit (R2 = 0.98).
2.4.6. Quantification of fluorine atoms from MRI images
Quantification of cell numbers or total fluorine atoms from MRI images follows the
same principle as emulsion concentration determination or cell number determination by
NMR. In this case, any perfluorocarbon mixture with a known 19F spin concentration can be
placed in a reference tube beside the animal. To limit scanning time, PCE or PFPE dilutions
are preferred to match the cell labeling agent.
Raw MRI images are loaded in the VoxelTrackerTM (Celsense Inc., Pittsburgh, PA)
software (Fig. 2.17). Structures including “Reference”, “Noise”, and “Signal” (Fig. 2.17,
colored structures) are defined manually by covering the region of interest (ROI). The
software algorithm corrects for the Rician-distributed noise present in low-SNR datasets and
provides accurate quantification of fluorine atoms in the Signal ROIs33. The apparent cell
count can be determined from the initial cell loading experiment.

54
Figure 2.17: Quantification of apparent cell numbers from MRI images. Raw MRI
images are loaded in the VoxelTracker software (left panel). Structures including
“Reference”, “Noise”, and “Signal” are defined manually by covering the region of interest
(ROI). The blue ROI corresponds to the Reference tube (REF) used for fluorine atoms
quantification. The green ROI corresponds to the Noise (#), devoid of signal. The purple and
yellow ROIs correspond to two areas with signal to be quantitated (*).
Acknowledgments
Chapter 2, in part, contains text as it appears in two manuscripts: Springer book
chapter entitled “Magnetic resonance imaging of immune cell trafficking in response to
chemical agents in experimental autoimmune encephalomyelitis”, Chapelin F, Ahrens E.T
from “Visualizing chemical communication among migratory cells in vivo” (2019), and
review paper entitled “Fluorine-19 MRI for detection and quantification of immune cell
therapy for cancer” Chapelin F, Capitini C, Ahrens E.T, JITC 2018. Chapter 2 also contains
figures from supplemental material of published material in the journal Scientific Reports
2017, with revisions and formatting changes for this dissertation. The authors and title of the
manuscript are as follows: Chapelin F, Gao S, Okada H, Weber T, Messer K, Ahrens E.T.
Fluorine-19 nuclear magnetic resonance of chimeric antigen receptor T cell biodistribution
in murine cancer model. Scientific Reports, (2017). Besides this, the content of Chapter 2 is
original. The dissertation author was the primary author of these papers.
REF
*
*
#
REF
*
*
#

55
References
1. Kay, M.A. State-of-the-art gene-based therapies: the road ahead. Nat Rev Genet 12,
316-328 (2011).
2. Ohno, M., Ohkuri, T., Kosaka, A., Tanahashi, K., June, C.H., Natsume, A. & Okada,
H. Expression of miR-17-92 enhances anti-tumor activity of T-cells transduced with
the anti-EGFRvIII chimeric antigen receptor in mice bearing human GBM
xenografts. Journal for immunotherapy of cancer 1, 21 (2013).
3. Janjic, J.M. & Ahrens, E.T. Fluorine-containing nanoemulsions for MRI cell
tracking. Wiley interdisciplinary reviews. Nanomedicine and nanobiotechnology 1,
492-501 (2009).
4. Krafft, M.P. Fluorocarbons and fluorinated amphiphiles in drug delivery and
biomedical research. Advanced drug delivery reviews 47, 209-228 (2001).
5. Riess, J.G. Understanding the fundamentals of perfluorocarbons and perfluorocarbon
emulsions relevant to in vivo oxygen delivery. Artificial cells, blood substitutes, and
immobilization biotechnology 33, 47-63 (2005).
6. Partlow, K.C., Chen, J., Brant, J.A., Neubauer, A.M., Meyerrose, T.E., Creer, M.H.,
Nolta, J.A., Caruthers, S.D., Lanza, G.M. & Wickline, S.A. 19F magnetic resonance
imaging for stem/progenitor cell tracking with multiple unique perfluorocarbon
nanobeacons. FASEB journal : official publication of the Federation of American
Societies for Experimental Biology 21, 1647-1654 (2007).
7. Garrelts, J.C. Fluosol: an oxygen-delivery fluid for use in percutaneous transluminal
coronary angioplasty. DICP : the annals of pharmacotherapy 24, 1105-1112 (1990).
8. Ilgiavishute Ia, S., Zhukauskas, G., Dapshis, K.L. & Onishchenko, N.A. [The use of
perfluorocarbon emulsions for suppression of rejection reaction in kidney
allotransplantation]. Khirurgiia, 16-18 (1993).
9. Riess, J.G. Oxygen carriers ("blood substitutes")--raison d'etre, chemistry, and some
physiology. Chemical reviews 101, 2797-2920 (2001).
10. Sotak, C.H., Hees, P.S., Huang, H.N., Hung, M.H., Krespan, C.G. & Raynolds, S. A
new perfluorocarbon for use in fluorine-19 magnetic resonance imaging and
spectroscopy. Magnetic Resonance in Medicine 29, 188-195 (1993).
11. Dardzinski, B.J. & Sotak, C.H. Rapid tissue oxygen tension mapping using 19F
inversion-recovery echo- planar imaging of perfluoro-15-crown-5-ether. Magn
Reson Med 32, 88-97 (1994).

56
12. Hees, P.S. & Sotak, C.H. Assessment of changes in murine tumor oxygenation in
response to nicotinamide using 19F NMR relaxometry of a perfluorocarbon
emulsion. Magnetic Resonance in Medicine 29, 303-310 (1993).
13. Mason, R.P., Antich, P.P., Babcock, E.E., Constantinescu, A., Peschke, P. & Hahn,
E.W. Non-invasive determination of tumor oxygen tension and local variation with
growth. Int J Radiat Oncol Biol Phys 29, 95-103 (1994).
14. Noth, U., Morrissey, S.P., Deichmann, R., Adolf, H., Schwarzbauer, C., Lutz, J. &
Haase, A. In vivo measurement of partial oxygen pressure in large vessels and in the
reticuloendothelial system using fast 19F-MRI. Magn Reson Med 34, 738-745
(1995).
15. Balducci, A., Wen, Y., Zhang, Y., Helfer, B.M., Hitchens, T.K., Meng, W.S., Wesa,
A.K. & Janjic, J.M. A novel probe for the non-invasive detection of tumor-associated
inflammation. Oncoimmunology 2, e23034 (2013).
16. Janjic, J.M., Srinivas, M., Kadayakkara, D.K. & Ahrens, E.T. Self-delivering
nanoemulsions for dual fluorine-19 MRI and fluorescence detection. Journal of the
American Chemical Society 130, 2832-2841 (2008).
17. Stares, E., Rho, J., Ahrens, E.T., Foster, P., Li, A. & Bartha, R. in Contrast Agents
for MRI: Experimental Methods 479-498 (The Royal Society of Chemistry, 2018).
18. Waiczies, H., Lepore, S., Janitzek, N., Hagen, U., Seifert, F., Ittermann, B., Purfurst,
B., Pezzutto, A., Paul, F., Niendorf, T. & Waiczies, S. Perfluorocarbon Particle Size
Influences Magnetic Resonance Signal and Immunological Properties of Dendritic
Cells. PLoS ONE 6 (2011).
19. Waiczies, S., Niendorf, T. & Lombardi, G. Labeling of cell therapies: How can we
get it right? Oncoimmunology 6, e1345403 (2017).
20. Kabalnov, A.S. & Shchukin, E.D. Ostwald ripening theory: applications to
fluorocarbon emulsion stability. Advances in colloid and interface science 38, 69-97
(1992).
21. Maa, Y.F. & Hsu, C.C. Performance of sonication and microfluidization for liquid-
liquid emulsification. Pharmaceutical development and technology 4, 233-240
(1999).
22. Varescon, C., Arlen, C., Leblanc, M. & Riess, J.G. An Easy, Convenient Way of
Describing the Stability of Fluorocarbon Emulsions. J Chim Phys Pcb 86, 2111-2117
(1989).
23. Lowe, K.C. Engineering blood: synthetic substitutes from fluorinated compounds.
Tissue engineering 9, 389-399 (2003).

57
24. Spahn, D.R. Blood substitutes. Artificial oxygen carriers: perfluorocarbon
emulsions. Crit Care 3, R93-97 (1999).
25. Jafari, S.M., He, Y.H. & Bhandari, B. Nano-emulsion production by sonication and
microfluidization - A comparison. Int J Food Prop 9, 475-485 (2006).
26. Riess, J.G. Oxygen carriers ("blood substitutes") - Raison d'Etre, chemistry, and
some physiology. Chemical reviews 101, 2797-2919 (2001).
27. Taylor, P. Ostwald ripening in emulsions. Advances in Colloid and Interface Science
75, 107-163 (1998).
28. Christian, N.A., Milone, M.C., Ranka, S.S., Li, G.Z., Frail, P.R., Davis, K.P., Bates,
F.S., Therien, M.J., Ghoroghchian, P.P., June, C.H. & Hammer, D.A. Tat-
functionalized near-infrared emissive polymersomes for dendritic cell labeling.
Bioconjugate Chem 18, 31-40 (2007).
29. Nam, Y.S., Park, J.Y., Han, S.H. & Chang, I.S. Intracellular drug delivery using
poly(D,L-lactide-co-glycolide) nanoparticles derivatized with a peptide from a
transcriptional activator protein of HIV-1. Biotechnol Lett 24, 2093-2098 (2002).
30. Kislukhin, A.A., Xu, H., Adams, S.R., Narsinh, K.H., Tsien, R.Y. & Ahrens, E.T.
Paramagnetic fluorinated nanoemulsions for sensitive cellular fluorine-19 magnetic
resonance imaging. Nat Mater 15, 662-668 (2016).
31. Walczak, P., Ruiz-Cabello, J., Kedziorek, D.A., Gilad, A.A., Lin, S., Barnett, B.,
Qin, L., Levitsky, H. & Bulte, J.W. Magnetoelectroporation: improved labeling of
neural stem cells and leukocytes for cellular magnetic resonance imaging using a
single FDA-approved agent. Nanomedicine 2, 89-94 (2006).
32. Thu, M.S., Bryant, L.H., Coppola, T., Jordan, E.K., Budde, M.D., Lewis, B.K.,
Chaudhry, A., Ren, J., Varma, N.R., Arbab, A.S. & Frank, J.A. Self-assembling
nanocomplexes by combining ferumoxytol, heparin and protamine for cell tracking
by magnetic resonance imaging. Nat Med 18, 463-467 (2012).
33. Srinivas, M., Morel, P.A., Ernst, L.A., Laidlaw, D.H. & Ahrens, E.T. Fluorine-19
MRI for visualization and quantification of cell migration in a diabetes model. Magn
Reson Med 58, 725-734 (2007).
34. Ruiz-Cabello, J., Walczak, P., Kedziorek, D.A., Chacko, V.P., Schmieder, A.H.,
Wickline, S.A., Lanza, G.M. & Bulte, J.W. In vivo "hot spot" MR imaging of neural
stem cells using fluorinated nanoparticles. Magn Reson Med 60, 1506-1511 (2008).
35. Srinivas, M., Turner, M.S., Janjic, J.M., Morel, P.A., Laidlaw, D.H. & Ahrens, E.T.
In vivo cytometry of antigen-specific t cells using 19F MRI. Magn Reson Med 62,
747-753 (2009).

58
36. Somanchi, S.S., Kennis, B.A., Gopalakrishnan, V., Lee, D.A. & Bankson, J.A. In
Vivo (19)F-Magnetic Resonance Imaging of Adoptively Transferred NK Cells.
Methods in molecular biology 1441, 317-332 (2016).
37. Bouchlaka, M.N., Ludwig, K.D., Gordon, J.W., Kutz, M.P., Bednarz, B.P., Fain, S.B.
& Capitini, C.M. (19)F-MRI for monitoring human NK cells in vivo.
Oncoimmunology 5, e1143996 (2016).
38. Bible, E., Dell'Acqua, F., Solanky, B., Balducci, A., Crapo, P.M., Badylak, S.F.,
Ahrens, E.T. & Modo, M. Non-invasive imaging of transplanted human neural stem
cells and ECM scaffold remodeling in the stroke-damaged rat brain by (19)F- and
diffusion-MRI. Biomaterials 33, 2858-2871 (2012).
39. Helfer, B.M., Balducci, A., Nelson, A.D., Janjic, J.M., Gil, R.R., Kalinski, P., de
Vries, I.J., Ahrens, E.T. & Mailliard, R.B. Functional assessment of human dendritic
cells labeled for in vivo (19)F magnetic resonance imaging cell tracking. Cytotherapy
12, 238-250 (2010).
40. Alberts B., J.A., Lewis J., Alberts B., Raff M., Roberts K., Walter P. Lymphocytes
and the Cellular Basis of Adaptive Immunity. (Molecular Biology of the Cell. 4th
edition, 2002).
41. Chapelin, F., Gao, S., Okada, H., Weber, T.G., Messer, K. & Ahrens, E.T. Fluorine-
19 nuclear magnetic resonance of chimeric antigen receptor T cell biodistribution in
murine cancer model. Scientific Reports 7 (2017).
42. Gonzales, C., Yoshihara, H.A., Dilek, N., Leignadier, J., Irving, M., Mieville, P.,
Helm, L., Michielin, O. & Schwitter, J. In-Vivo Detection and Tracking of T Cells
in Various Organs in a Melanoma Tumor Model by 19F-Fluorine MRS/MRI. PLoS
One 11, e0164557 (2016).
43. Ahrens, E.T., Flores, R., Xu, H. & Morel, P.A. In vivo imaging platform for tracking
immunotherapeutic cells. Nature biotechnology 23, 983-987 (2005).
44. Hitchens, T.K., Liu, L., Foley, L.M., Simplaceanu, V., Ahrens, E.T. & Ho, C.
Combining perfluorocarbon and superparamagnetic iron-oxide cell labeling for
improved and expanded applications of cellular MRI. Magn Reson Med 73, 367-375
(2015).
45. Patrick, M.J., Janjic, J.M., Teng, H., O'Hear, M.R., Brown, C.W., Stokum, J.A.,
Schmidt, B.F., Ahrens, E.T. & Waggoner, A.S. Intracellular pH measurements using
perfluorocarbon nanoemulsions. Journal of the American Chemical Society 135,
18445-18457 (2013).
46. Srinivas, M., Boehm-Sturm, P., Figdor, C.G., de Vries, I.J. & Hoehn, M. Labeling
cells for in vivo tracking using (19)F MRI. Biomaterials 33, 8830-8840 (2012).

59
47. Kalos, M. & June, C.H. Adoptive T cell transfer for cancer immunotherapy in the
era of synthetic biology. Immunity 39, 49-60 (2013).
48. Nofiele, J.T. & Cheng, H.L.M. Ultrashort Echo Time for Improved Positive-Contrast
Manganese-Enhanced MRI of Cancer. Plos One 8 (2013).
49. Zhong, J., Sakaki, M., Okada, H. & Ahrens, E.T. In vivo intracellular oxygen
dynamics in murine brain glioma and immunotherapeutic response of cytotoxic T
cells observed by fluorine-19 magnetic resonance imaging. PLoS One 8, e59479
(2013).
50. Kadayakkara, D.K., Janjic, J.M., Pusateri, L.K., Young, W.B. & Ahrens, E.T. In vivo
observation of intracellular oximetry in perfluorocarbon-labeled glioma cells and
chemotherapeutic response in the CNS using fluorine-19 MRI. Magn Reson Med 64,
1252-1259 (2010).

60
Chapter 3: Fluorine-19 nuclear magnetic resonance of chimeric antigen receptor T
cell biodistribution in murine cancer model
3.1. Introduction
Immunotherapy, using engineered T cells harboring receptors targeting specific
tumor antigens, has opened the path to new treatments for incurable cancers1. Cancer cells
secrete cytokines that render the host’s innate and adaptive immune system ‘tolerant’ to the
tumor, which weakens the intrinsic immunity2. In an emerging approach, autologous T cells
are genetically modified ex vivo to constitutively express a chimeric antigen receptor (CAR)
that can help bind T cells to a specific tumor target and overcome tolerance. By delivering
high numbers of CAR T cells and stimulating their clonal expansion in situ, specific and
durable cytotoxicity toward cancer cells has been observed3. This strategy has been
translated to many types of cancers including leukemia, lymphomas and sarcomas, with
custom made receptors for each application4-6.
Adoptive cell cancer therapy is currently being used in at least 270 active clinical
trials worldwide7. However, variability in clinical outcomes and the incidence of harmful
side effects has challenged researchers to implement methods to validate cell biodistribution
and pharmacokinetics in the body3. In fact, the United States Food and Drug Administration
(FDA) published guidelines8 specifying that investigational cell therapy should incorporate
some means of cell tracking to determine in vivo cell survival, anatomic engraftment and
biologic activity throughout the product development cycle, preferably starting at the
preclinical stage. Indeed, the current gold standard to assess cell biodistribution preclinically
involves time-consuming necropsy and histopathological staining of numerous tissue slices,

61
which, in addition to being tissue-disruptive, only provides quantitative cell information on
small tissue ‘bites’ which is prone to sampling error. Developing a rapid and quantitative
preclinical technique for screening new therapeutic cell subtype candidates by assessing cell
biodistribution and survival would be highly useful.
Here, we describe the use of nuclear magnetic resonance (NMR) ‘cytometry’9 to
assay immunotherapeutic cell biodistribution. This technology employs a perfluorocarbon
(PFC) nanoemulsion tracer that labels cells via simple co-incubation in culture prior to in
vivo delivery. Liquid-state 19F NMR spectroscopy of intact, excised organ and tissue panels
is used to measure the effective number of transferred cells within each sample10-12.
Consequently, the cell biodistribution and survival can be rapidly measured, and specific T
cells homing to the tumor and lymphoid organs can be measured, which is presumably
predictive of a positive clinical response. We employ a murine model of subcutaneous
human glioblastoma treated with CAR T cells expressing Epidermal Growth Factor
Receptor variant III (EGFRvIII) transgene13, 14. In solid tumors, EGFRvIII is a common
tumor-specific variant associated with poor long-term survival15. EGFRvIII is present in
~20% of glioblastoma multiforme (GBM) patients; GBM is the most common and
aggressive brain cancer16, 17. Prior to CAR T cell infusion, the cells are intracellularly tagged
with PFC emulsion in vitro, and the 19F labeling efficiency, cellular function, and phenotype
is verified post-labeling. Following infusion, CAR T cell efficacy is monitored by
bioluminescence imaging (BLI) in vivo, and CAR T cell biodistribution and
pharmacokinetics are quantitated using ex vivo 19F NMR. Overall, NMR cytometry may
accelerate the timeline to evaluate and screen new engineered cell therapeutic candidates.

62
3.2. Methods
3.2.1. Chimeric antigen receptor (CAR) lentiviral vector
We employed a vector for CAR consisting of a side chain fragment variable (scFv)
specific to EGFR-vIII fused to a CD8 hinge with 4-1BB, CD28 and CD3z intracellular
domains as described by Ohno et al.18. With this construct, lentivirus was produced using
ten million human embryonic kidney (HEK) 293T cells (ATCC, Manassas, VA) that were
plated in a 175 cm2 flask with 9 ml of OptiMEM (Gibco) media. The psPAX2, pMD2.G and
pELNS-3C10CD28-41BBz plasmids were added to the flask with 120 μl of Lipofectamine
(Invitrogen, Carlsbad, CA) as described elsewhere18. After 24 hours, the supernatant was
harvested and centrifuged at 16,000 rpm for 2 hours at 4 °C. The viral pellet was resuspended
in 100 μl of phosphate buffered saline (PBS) and used immediately to transduce human T
cells (described below).
3.2.2. Human T cell isolation
Peripheral blood mononuclear cells (PBMCs) were isolated from anonymous donor
human blood (San Diego Blood Bank, San Diego, CA) by Ficoll (Histopaque 1077, Sigma
Aldrich, St Louis, MO) gradient density centrifugation. T cell enrichment from PBMCs was
performed by Pan T cell magnetic cell sorting (Miltenyi Biotech Inc., Auburn, CA). Cell
phenotype was confirmed by flow cytometry (LSR Fortessa, BD Biosciences, San Diego,
CA) using FITC anti-human CD3 antibody (Biolegend, San Diego, CA). T cells were
expanded for two days in Roswell Park Memorial Institute (RPMI) media (Gibco)
supplemented with 10% Fetal Bovine Serum (FBS) and 100 units/ml of recombinant human

63
Intereukin 2 (IL-2, Peprotech, Rocky Hill, NJ) while being activated with dynabeads
harboring human T cell CD3/CD28 (Gibco).
3.2.3. CAR transduction and PFC labeling
The T cells were added to 6-well plates at a density of 1×10⁶ cells per well and
transduced with CAR lentivirus; 30 μl of virus in PBS was added to each well along with 6
μg/ml Polybrene transfection agent (EMD Millipore, Billerica, MA). The T cell transduction
efficacy was determined by flow cytometry at 5 and 14 days after virus addition using a
primary biotin-SP-AffiniPure F(ab')2 fragment-specific goat anti-mouse antibody (Jackson
Immuno Research Laboratories, West Grove, PA) and streptavidin-PE served as the
secondary antibody (BD Pharmingen, San Diego, CA).
To label T cells for NMR cytometry, CAR T cells and untransduced T cells (control)
were plated at a density of 10 million cells in 5 ml of RPMI in 6-well plates and incubated
for 12 h with 10 mg/ml of PFC nanoemulsion (CS-1000 or CS-ATM DM Red, Celsense,
Inc., Pittsburgh, PA). Subsequently, labeled cell aliquots were assayed for viability via the
Trypan blue assay, as well as CD4/CD8 phenotype by flow cytometry using PE/Cy5 anti-
human CD4 clone OKT4 and Alexa 488 anti-human CD8 clone SK1 (Biolegend). In these
assays, T cells minus PFC label, with and without CAR transgene, were evaluated alongside
as controls.
To quantitatively assay PFC cell uptake, triplicates of 1.5 million cells were
resuspended in 150 l PBS with 0.5% Triton X-100 (Sigma Aldrich) and transferred to a 5
mm NMR tube. Also, a 50 l solution of 0.1% sodium trifluoroacetate (TFA, Sigma Aldrich)

64
in D2O (Acros Organics, Geel, Belgium) was added to each tube and vortexed. 19F NMR
spectra were acquired for each sample using a 400 MHz (9.4 Tesla) Bruker AVANCE III
HD-NanoBay spectrometer (Bruker, Inc., Billerica, MA) with: 17 s pulse, 32,000 FID
points, 100 ppm spectral width, 32 averages, and a recycle delay of 5 s. Two peaks were
observed, with the TFA reference and PFC peaks at -76 ppm and -91.58 ppm, respectively.
The 19F content of each sample was determined by calculating the ratio of the PFC peak
integrated area to the reference integral multiplied by the number of fluorine atoms in the
TFA aliquot. The mean 19F/cell was calculated from the 19F content divided by the cell count
in the sample.
3.2.4. Flow cytometry assays
CD4/CD8 phenotype and viability was also validated by flow cytometry using
PE/Cy5 anti-human CD4 clone OKT4, Alexa 488 anti-human CD8 clone SK1 and 7-AAD
viability marker (Biolegend). In these assays, T cells minus PFC label, with and without
CAR transgene, were evaluated alongside as controls. Persistence of dual-mode PFC (CS-
ATM-DM-Red) label in CAR T cells was assessed by flow cytometry over 14 days after
wash.
3.2.5. Confocal microscopy
Aliquots of CAR T cells (N=6, 1 million cells) labeled with dual-mode PFC emulsion
or unlabeled were harvested one day post-labeling, fixed with 4% paraformaldehyde
(Affimetrix Inc., Cleveland, OH) for 10 min and stained with CD3-FITC as above and

65
Hoechst dye nuclear stain (#33342, 1:500 dilution, Thermo Fisher Scientific). Cells were
mounted in media (Lerner Laboratories, Cheshire, WA) and slides were imaged using a
confocal Leica DM 6000 CFS microscope with a ×63 immersion objective
To quantitatively assay PFC cell uptake, triplicates of 1.5 million cells were
resuspended in 150 l PBS with 0.5% Triton X-100 (Sigma Aldrich) and transferred to a 5
mm NMR tube. Also, a 50 l solution of 0.1% sodium trifluoroacetate (TFA, Sigma Aldrich)
in D2O (Acros Organics, Geel, Belgium) was added to each tube and vortexed. 19F NMR
spectra were acquired for each sample using a 400 MHz (9.4 Tesla) Bruker AVANCE III
HD-NanoBay spectrometer (Bruker, Inc., Billerica, MA) with: 17 s pulse, 32,000 FID
points, 100 ppm spectral width, 32 averages, and a recycle delay of 5 s. Two peaks were
observed, with the TFA reference and PFC peaks at -76 ppm and -91.58 ppm, respectively.
The 19F content of each sample was determined by calculating the ratio of the PFC peak
integrated area to the reference integral multiplied by the number of fluorine atoms in the
TFA aliquot. The mean 19F/cell was calculated from the 19F content divided by the cell count
in the sample.
3.2.6. Electron microscopy
We examined CAR T cells labeled with PFC nanoemulsion by electron microscopy.
Pelleted cells were fixed in PBS containing 2% glutaraldehyde in 0.1M sodium cacodylate
(SC) buffer at room temperature for 30 min and held overnight at 4C. The cells were washed
five times in 0.1M SC buffer on ice and treated with 1% OsO4 in 0.1M SC buffer for 1 hour.
All of the samples were washed in dH2O and treated with 2% uranyl acetate for 1 hour on

66
ice. Pellets were then dehydrated in an ascending series of ethanol and finally 2 dry acetone
at room temperature. The cells were infiltrated overnight in a solution containing a 1:1
mixture of dry acetone and Durcupan for 2 hours on a rotator and in 100% Durcupan
overnight. The next day, the mixture was replaced with 100% Durpucan twice, and pellets
were embedded in Durpucan and incubated in an oven for 36-48 hours. Ultra-thin (60 nm)
sections were cut using a diamond knife and collected on mesh Cu grids. The samples were
stained with 1% aqueous uranyl acetate and Reynolds lead citrate. Sections were imaged
using a Tecnai Spirit electron microscope at 80KV (FEI company).
3.2.7. Glioblastoma cells
Frozen U87-EGFRvIII-Luc glioblastoma cells18 overexpressing EGFRvIII, as well
as the luciferase gene, were thawed and maintained in RPMI media containing 10% FBS
and 1% penicillin/streptomycin (Gibco) in T75 flasks (Sigma).
3.2.8. In vitro T cell cytotoxicity assay
U87-EGFRvIII-Luc cells were plated at a density of 30,000 cells per well (18 wells
total) in clear bottom 96-well plates (Corning, Inc., Corning, NY) and were allowed to
adhere. Wells (n=6, per condition) received: (i) 5:1 ratio of CAR T cells to cancer cells, (ii)
5:1 ratio of untransduced T cells to cancer cells, or (iii) cancer cells alone to calculate
baseline viability. After adding D-luciferin (300 μg/ml) to each well, bioluminescence
signals were measured with a Tecan plate reader (Infinite M200PRO, Morrisville, NC) at 6,
12, and 24 hours post T cell addition. The relative glioma cell cytotoxicity was obtained

67
from the mean photon count for groups (i-iii), and the ratio of treated versus untreated means
are displayed as percentages.
3.2.9. Murine model of subcutaneous glioblastoma
Animal protocols were approved by the University of California San Diego
Institutional Animal Care and Use Committee (IACUC). In vivo studies were performed to
confirm anti-cancer efficacy of PFC-labeled CAR T cells. Female (n=45) SCID mice 6-8
weeks of age (Jackson Laboratories, Bar Harbor, ME) received bilateral sub-cutaneous flank
injections, each containing 5×10⁶ U87-EGFRvIII-Luc cells in buffered 50% Matrigel
(Corning, Tewksbury, MA). Once tumors were established (~4 mm size), mice were divided
into 3 groups (n=15 per group), with Group 1 receiving 20×106 PFC labeled CAR T cells
intravenously (IV) via tail vein, Group 2 receiving the same number of PFC-labeled
untransduced T cells IV, and Group 3 was untreated. For histology purposes, one additional
animal in Groups 1-2 received T cells labeled with a fluorescent dye-conjugated PFC
nanoemulsion (CS-ATM DM Red, ex/em 596/615, Celsense Inc.), to enable histological
validation of colocalization of imaging agent and transferred labeled T cells.
3.2.10. In vivo bioluminescence imaging (BLI)
All mice underwent serial BLI using an IVIS Spectrum (Perkin Elmer, Waltham,
MA) at day 0, 3, 7, 10 and 14 after receiving T cells. Prior to BLI, mice received 150 mg/kg
of D-Luciferin (Intrace Medical, Lauzanne, Switzerland) intraperitoneally, and images were
acquired 10 to 15 min after injection to measure total flux. A white-light body surface image

68
was collected with a field of view to fit five mice, followed by an image of the spatial
distribution of photon counts rendered in pseudo-color, which was overlaid onto the surface
image. Quantitative analysis of the radiance flux (photons/s) was performed with the Living
Image Software (Perkin Elmer, Waltham, MA) by defining identical regions of interest
covering the tumor area. Following BLI, tumor sizes were measured using a caliper.
3.2.11. Ex vivo 19F NMR
In each animal group, five mice were euthanized at days 2, 7 or 14 after treatment
infusion to evaluate cell biodistribution. Mice were sacrificed by CO2 inhalation, and intact
tissues of interest (brain, thymus, heart, lungs, liver, spleen, tumors, lymph nodes, kidneys,
small intestine, spinal cord, femur, tail and blood) were harvested. All organs were fixed in
4% paraformaldehyde (Affimetrix Inc., Cleveland, OH) overnight, rinsed in PBS and
weighed before transfer to either 5 or 10 mm glass NMR tubes (Wilman Labglass, Vineland,
NJ), depending on organ size. Importantly, the specimen size fit entirely within the
manufacturer-specified receptive field of the NMR detector coil, which spanned ~2 cm
length from the bottom of the NMR tube, thereby ensuring that all 19F nuclei in the sample
are detected. Also, a sealed glass reference capillary (Kimble Kontes, Vineland, NJ)
containing a mixture of 0.1% (w/v) TFA, as well as 0.325 mM MnCl2 to shorten the TFA’s
19F T1 relaxation to match that of the PFC nanoemulsion (T1~470 ms at 9.4 Tesla)19, was
placed inside the NMR tube with the sample. All samples were first measured individually,
and for organs/tissues with very low 19F signal, multiple specimens were pooled into a single
NMR tube to boost sensitivity. After shimming, the 19F NMR spectra were acquired using a
400 MHz spectrometer with: 17 s pulse, 32,000 FID points, 100 ppm spectral width, 32 to

69
1024 averages (depending on SNR), and a recycle delay of 1.5 s. Phase and baseline
corrections were performed to improve measurement accuracy. The 19F content of each
tissue sample was determined by calculating the ratio of the PFC peak (-91.58 ppm)
integrated area to the TFA reference (-76 ppm) integral, multiplied by the number of fluorine
atoms in the reference. The apparent cell number per tissue sample was calculated by
dividing the 19F content of each tissue sample by the mean 19F/cell of T cells measured after
labeling (above).
3.2.12. Histological analyses
In the one animal per experimental group receiving fluorescent PFC nanoemulsion
(CS-ATM DM Red, Celsense) spleens, tumors and livers were embedded in optimal cutting
temperature (OCT) compound (Sakura Finetek USA, Inc., Torrance, CA) and stored at -80
°C. All tissues were cryosectioned (CM1950, Leica Microsystems Inc., Buffalo Grove, IL)
at 10 μm thickness. Sections were fixed with 4% paraformaldehyde, stained for T cells using
FITC anti-human CD3 (UCHT1, 1:500 dilution, Biolegend) and for nuclei using Hoechst
dye (#33342, 1:500 dilution, Thermo Fisher Scientific) and then mounted. Liver sections
were stained for macrophages with an Alexa 488 anti-mouse F4/80 antibody (BM8, 1:200
dilution, Biolegend)20. Fluorescence images were acquired on an Axiovert 40 CFL
microscope (Zeiss, Thornwood, NY) using a ×5 objective. Confocal images were acquired
on a Leica SP5 2 confocal system with a Leica DM 6000 CFS microscope and a ×63
immersion objective. For direct cell counts in tumor, we used sections (two per tumor)
stained against CD3 from five tumors total, three from day 2 and one each from days 7 and

70
14. We counted T cells in six high power fields per slice (×20 magnification, 120 high power
fields total).
3.2.13. Statistical analyses
Generally, measurements are presented as mean ± standard error. A one-way
ANOVA along with unpaired T-tests with unequal variances were performed to compare
groups as a whole and by pairs, respectively, for bioluminescence and tumor volume
measurements. For ANOVAs, we used the Bonferroni correction for multiple comparisons,
thereby controlling the family-wise error rate at 5%. Unpaired T-tests were used to compare
the apparent cell numbers between groups. P-values <0.05 are considered statistically
significant. ANOVA results are expressed as an F-statistic and its associated degrees of
freedom and P-value. For pooled samples (thymus and lymph nodes), an estimate of the
NMR measurement error is displayed, which was calculated from the standard error of the
baseline noise signal over the same integral interval width used to measure the 19F tissue
peak. Average 19F NMR signal in tumors was correlated with the number of CAR or
untransduced T cells count by histopathology using a Pearson’s correlation coefficient test.
3.3. Results
3.3.1. In vitro characterization of CAR-expressing T cells
Initially, we assessed the phenotype and PFC labeling levels in T cells. The
lymphocyte isolation from PBMC yields a pure population of CD3+ T cells with an
approximate 2/3 CD4+ and 1/3 CD8+ phenotype distribution (Fig. 3.1a and b). In T cells
transduced with lentivirus harboring EGFRvIII antibody, transgene expression levels persist,

71
with >70% of the human T cells expressing the CAR receptor after two weeks in vitro (Fig.
3.1c). For in vivo animal studies (below), infused T cells were 85±10% CAR-positive.
Figure 3.1: CAR T cell transduction and characterization. (a) Scatter plot showing the
pure population of human T cells (CD3) after magnetic assisted cell sorting of blood
samples. (b) Isolated T cell flow analysis for expression of CD4/CD8 shows that 2/3 of T
cells are CD4+ and 1/3 are CD8+. (c) CAR T cell population 2 weeks after transduction
shows 85% CAR-expressing T cells. (d) 19F NMR spectrum showing PFC uptake of CAR
T cells (peak at -91 ppm, 2×10¹¹ atoms/cells) normalized to the TFA reference (peak at -76
ppm). (e) Flow cytometry histogram showing similar repartition of CD4+ and CD8+ CAR
T cells after transduction compared to untransduced T cells (b). (f) CAR T cells labeled with
PFC ex vivo exhibit comparable phenotype to unlabeled cells.
Labeling experiments with PFC nanoemulsions at 10 mg/ml over a period of 12 hours
co-incubation display minimal viability impairment as assessed by Trypan blue exclusion
test (Average 95±1%, N=3 replicates) and flow cytometry viability measurements (p>0.05).
These conditions yield an average labeling efficiency of 2±0.5×10¹¹ atoms of fluorine per
cell (N=3 replicates, Fig. 3.1d), as determined by 19F NMR. Moreover, PFC labeling does

72
not appear to alter T cell phenotype as defined by CD4+ and CD8+ expression (Fig. 3.1e
and f, p>0.05).
Intracellular and perinuclear localization of PFC label in CAR T cells was confirmed
by confocal microscopy (Fig.3.2a-b) using a dual-mode MRI-fluorescent PFC
nanoemulsion. This result was corroborated by electron microscopy (Fig. 3.2c-d). Bright
spheroids corresponding to electron-sparse scattering perfluorocarbon droplets were found
in most labeled cells (Fig.3.2c, see inset, 11,000) but not in control unlabeled cells (Fig
3.2d). Flow cytometry (Fig. 3.2e-f) measurement of CAR T cells labeled with the dual mode
agent revealed a shift in red fluorescence compared to control unlabeled cells indicating that
essentially 100% of CAR T cells are labeled with PFC one day after labeling (Fig. 3.2e).
The fluorescence shift remains discernable for several days after labeling but returns to
unlabeled baseline by day 14 due to cell division and agent dilution; the degree rate of label
dilution is consistent with the CAR T cell division rate in vitro.

73
Figure 3.2. Confirmation of intracellular localization of PFC. (a) Confocal image (×63)
showing perinuclear localization of dual-mode PFC nanoemulsion (in red) in CAR T cells.
Nucleus is stained in blue and cell membrane in green via CD3-FITC (b) Control unlabeled
CAR T cells do not exhibit red fluorescence. (c) Electron microscopy (EM) micrograph of
ultra-thin PFC-labeled CAR T cells reveals the presence of bright vesicles (inset = ×11,000)
corresponding to internalized PFC droplets. (d) In control unlabeled cells, no PFC vesicles
are found ( 4800, scale bars = 1 m). (e) Flow cytometry scatter plot showing the resulting
shift in red fluorescence of CAR T cells after labeling. All cells are labeled after overnight
incubation as evidenced by fluorescence gap between labeled (e) and unlabeled (f) CAR T
cells. (g) Longitudinal red fluorescence measurement after labeling shows persistent signal
and consistent decrease of fluorescence intensity due to cell division.

74
3.3.2. CAR T cells exhibit cytotoxicity against U87-EGFRvIII glioma cells
CAR T cells exhibit significant, antigen specific, cytotoxic activity against U87-
EGFRvIII-Luc cells in vitro (Fig. 3.3). Ultraviolet-visible (UV-Vis) spectroscopy
measurements show that CAR T cells induce 93% tumor cell death compared to 53% for
untransduced T cells at 24 h (Fig. 3.3). These results are statistically significant at all time
points (p<0.0001). Untransduced T cells generated notable non-specific tumor cell death,
but apoptosis induction plateaued rapidly to 50%. Pro-inflammatory cytokines present in the
media, including IL-2 and CD3/CD28 beads, may have contributed to untransduced T cell
activation, leading to granzyme and perforin release and detectable cancer cell death21.
Nonetheless, these in vitro results confirmed the targeted cytotoxic activity of CAR T cells
against EGFRvIII+ glioma cells.
Figure 3.3: Human CAR T cell cytotoxicity assay in vitro. Co-incubation of CAR T cells
or untransduced T cells with human U87-EGFRvIII-Luc glioma cells resulted in significant
cell death at 6, 12 and 24 h. The CAR T cells exhibit significant tumor killing ability (93%)
compared to untransduced T cells (53%, p<0.0001 indicated by *). The relative glioma cell
cytotoxicity was obtained from the mean photon count, and the ratio of treated versus
untreated means are displayed as percentages.

75
3.3.3. CAR T cells inhibit tumor growth
The anti-tumor efficacy of PFC-labeled CAR T cells was verified using
immunocompromised SCID mice bearing bilateral subcutaneous U87-EGFRvIII tumors.
Engraftment of tumors was confirmed by BLI and caliper measurements just prior to T cell
infusion (day 0). Longitudinal BLI and tumor measurements show considerably reduced
tumor growth as early as 7 days after CAR treatment (Fig. 3.4a) compared to controls. The
radiance of CAR-treated tumors average 2.9±0.4×10¹⁰ photons/s, which was three times
lower than the luminescence for both the T cell treated (1.06±0.1×10¹¹ photons/s) and
untreated (1.01±0.1×10¹¹ photons/s) groups (Fig. 3.4b, F-statistic F(2,29)=18.06, p<0.0003).
Similarly, the mean tumor volume at day 7 in the CAR-treated group is 226±28 mm3,
compared to 497±50 mm3 and 502±41 mm3 for untransduced T cells and untreated groups,
respectively (Fig. 3.4c, p<0.003). The disparity among groups grew until the last
measurement on day 14, where the mean luminescence in the CAR-treated group is
2.33±0.3×10¹¹ photons/s, and the untransduced T cell and untreated groups is 9.08±0.6×10¹¹
and 8.21±0.8×10¹¹ photons/s, respectively. The T-test p-value between CAR treated and
untransduced T cell treated or untreated is ≤0.0001; the corresponding ANOVA test of the
three groups F(2,29)=18.06-37.29, p<0.0003 is extremely significant at 7, 10 and 14 days
post-treatment, using a Bonferroni correction.
The cancer cells in a solid tumor, in particular in the necrotic center, are much less
accessible to the T cell pool compared to the in vitro case where the cancer cells are directly
in contact with T cells. In fact, cell quantitation shows that the number of cells reaching the
tumor in vivo is fairly low, and this is one of the plausible explanations as to why the CAR
T cells fail to completely ‘reverse’ tumor growth (Fig. 3.4).

76
Figure 3.4: Impact of cell therapy on tumor growth in vivo. (a) Representative
bioluminescence images at day 0, 3, 7, 10 and 14 after cell therapy for all three groups show
tumor growth reduction for the CAR T cell treated mice compared to untransduced T cell
treated or untreated mice. (b) Bioluminescence signal is significantly lower in the CAR T
cell treated group starting at day 7 compared to controls. CAR T cell treated animals display
a radiance four times lower than untransduced T cell treated animals or untreated animals at
day 14 (* indicates p<0.0003 at day 7,10 and 14). (c) Corresponding tumor volume
measurements show 50% reduction in tumor growth for the CAR T cell treated group at day
7, 10 and 14 (* indicates p<0.0003) and no significant difference between untransduced T
cell treated and untreated groups (p=0.38). 19F NMR cytometry of T cell biodistribution
NMR measurements on intact tissue samples enable quantification of the total 19F
content and the apparent number of labeled T cells infiltrating the tissue (Fig. 3.5). The
results at day 2 post-treatment show greater CAR T cell homing to the tumors and spleen
compared to untransduced T cells (p=0.01 and 0.04, respectively). Approximately
85,000±14,000 CAR-T cells are found in the tumors at day 2. The number of apparent CAR
T cells in the tumor is stable until day 7, whereas untransduced T cells are below the LOD,

77
which is estimated to be on the order of ~7103 cells per sample for the 5 mm probe and
~4104 for the 10 mm probe (see Fig. 2.10). On average, 5±0.7×10⁵ CAR T cells (i.e., the
equivalent amount of 19F signal) is found in the spleen at day 2 and 14, whereas only half
this amount is observed in untransduced T cell treated animals. These NMR cytometry
measurements do not account for possible T cell division in vivo; cell division can diminish
the accuracy of the apparent total cell count per tissue, particularly at later time points.
Figure 3.5: Biodistribution of tissue samples by 19F NMR at 2, 7 and 14 days post-
treatment. 19F NMR measurements of organ biodistribution of the PFC-labeled cells show
greater CAR T cell homing to the spleen and tumors compared to untransduced T cells at
day 2. The liver signal likely represents the dead T cell fraction. These measurements do not
account for cell division, thus referred to as ‘apparent’ cell number. LN indicates lymph
nodes, (*) indicate significance, and (♦) indicate pooled samples.
The average 19F signal in the liver is approximately 15% of the injected dose at day 2
in both groups. At day 14, 33% of the fluorine signal is found in the liver. The liver 19F signal
(Fig. 3.5) presumably represents the dead T cell fraction, as PFC droplets from dead cells

78
are taken up predominantly by Kupffer cells of the liver22. No significant differences are
found in the lymph node signals between groups (Fig. 3.5). The tail 19F signal (Fig. 3.5)
represents the fraction of cells that are ‘mis-injected’ during tail vein delivery and
presumably resides in local subcutaneous tissue; using this measured value one can in
principle calculate the actual T cell dose delivered intravenously in each subject by
subtracting out this missed cell fraction. All measurements presented are above our LOD of
~7103 to ~4104 cells per sample (for 5 mm and 10 mm probes, respectively) for a 20 min
acquisition time (see Fig. 2.10). Organs with undetectable fluorine levels in all animals are
not displayed (brain, heart, small intestine, spinal cord, femur, blood). In the recovered blood
samples, the 19F NMR displayed signal below the LOD, thus residual blood in tissue samples
would not be a significant source of false-positive signal.
3.3.4. Histopathology
Histopathological staining confirms the presence of numerous CAR T cell infiltrates
in the tumors as evident by the fluorescent green signal targeting human CD3 (Fig. 3.6a). In
comparison, untransduced T cell infiltrates are sparser in these tissues (Fig. 3.6b). At day 2,
both CAR-T cells and untransduced T cells show persisting red fluorescent signal
corresponding to the dual-mode (CS-ATM DM Red) PFC nanoemulsion (Fig. 3.6c-d). No
endogenous T cells are present in untreated SCID mice (Fig. 3.6e). Quantitative analysis of
the number of CAR or untransduced T cells per high power field show significantly higher
CAR T cell numbers in the tumor tissue than untransduced T cells at all time points (Fig.
3.6f). In addition, histology counts strongly correlate to the average NMR fluorine signal
measured in tumors (Pearson’s r = 0.89, Fig 3.6g).

79
Figure 3.6. Histological correlation of tumor tissue of T cell treated SCID mice. (a) Low
magnification (×5) fluorescent image of the tumor tissue displays prominent CD3+ CAR T
cell infiltrates (green). (b) Conversely, sparse untransduced T cells localize to the tumor
(scale bars = 100 μm). (c). Confocal images (×63) show that dual-mode PFC nanoemulsion
(red) remains colocalized within CAR T cells (green, c) and untransduced T cells (d) at day
2 after infusion. (e) Untreated mice do not exhibit green or red fluorescence due to absence
of treatment and endogenous T cells in SCID mice (scale bars = 25 μm). (f) Histological T
cell count in high power fields of tumor sections shows greater CAR T cell numbers at all
time points compared to sections from untransduced T cell-treated animals (* indicates p
<0.001). (g) Plot showing strong positive correlation (r = 0.89) between average 19F atoms
in tumors as measured by NMR and T cell count (N=120, HPF = high power fields)

80
CAR T cells and untransduced T cells are also present in large numbers in the spleen
(Fig. 3.7a-b). Red fluorescence does not colocalize to phagocytic cells in the tumor and
spleen (Fig. 3.7c-d), which indicates minimal contamination of dead T cell signal in these
tissues, contrary to phagocytic Kupffer cells in the liver (Fig. 3.7e), which contain red
fluorescence signal from dead T cells.
Figure 3.7. Histology in spleen and liver tissue of T cell treated SCID mice. (a) Low
magnification (×5) fluorescent image of the spleen tissue displays prominent CD3+ CAR T
cell infiltrates (green). (b) Untransduced T cells also localize to the spleen (scale bars = 50
μm). (c). Confocal images (×63) show that dual-mode PFC nanoemulsion (red) does not
colocalize within phagocytic cells (F4/80 staining, green) in the tumor (c) and spleen (d) at
day 2 after infusion. (e) Conversely, F4/80 staining in the liver tissue displays dual-mode
PFC (red) colocalizing with Kupffer cells or liver macrophages (scale bars = 25 μm).

81
3.4. Discussion
We describe the use of NMR cytometry for quantifying the apparent biodistribution
of human CAR T cell therapy in a murine xenograft model of glioma. We compared CAR
T cell biodistribution and efficacy to untransduced T cells. Tumor growth and volume was
assessed by bioluminescence imaging and caliper measurements. NMR measurements in
whole organs demonstrated significantly higher CAR T cell homing to tumors and spleen
compared to untransduced T cells, consistent with conventional histopathology staining. Our
results corroborate the importance of the EGFRvIII receptor as a target for immunotherapy
and the efficacy of CAR T cells against these tumors. Injection of untransduced lymphocytes
did not result in enhanced tumor inhibition over untreated mice and appeared to have a lower
and more transient accumulation at tumor sites compared to CAR T cells.
Our view is that NMR cytometry is an option for discovery and preclinical evaluation
of emerging immunotherapeutic cell candidates by helping to streamline the evaluation of
cell biodistribution and survival. One of the key advantages is that the analysis is in intact
tissues, with the only treatment being an optional fixation step. PFC nanoemulsion
internalized in cells does not alter the PFC chemical shift of the NMR spectrum which is
defined by their molecular structure23-25. Moreover, The PFC label in tissue T cells is stable
and can be stored or frozen indefinitely without signal loss26-28. Measurement of 19F content
of a sample can be accomplished using conventional NMR spectroscopy in tens of minutes
or less, and data acquisition can be automated with robotic sample changers and auto-
shimming. Programing automated data analyses routines to extract the PFC 19F peak
integrals and apparent cell counts is straightforward. Generally, NMR instrumentation is a
routine analytic tool for molecule structure elucidation and is commonplace in virtually

82
every major chemistry lab, with tens of thousands of such instruments sited worldwide. Use
of in vitro NMR cytometry as described herein has the advantage of higher sensitivity to
sparser cell numbers compared to MRI by an order magnitude9. We note that the use of
preclinical 19F MRI in murine models of CAR T cell therapy remains a topic of future study.
If cell division occurs, the accuracy of the absolute T cell counts for NMR cytometry
may diminish, particularly at later time points, thus we describe these as ‘apparent’ cell
counts. The impact of cell division on PFC labeled T cell quantification during longitudinal
studies in mouse is described in detail elsewhere29. Potentially a carboxyfluorescein
succinimidyl ester (CFSE) assay can be used to determine mitosis rates in vivo30. However,
considering the heterogeneity of cell phenotypes used in CAR T cell therapies, as well as
differential division rates in different tissues, estimation of whole-body CAR T cell division
rates in vivo remains challenging.
Labeling of T cells, which have weak phagocytic properties and a small cytoplasm,
will always be a challenge, in contrast to phagocytic cells such as DCs. Nonetheless, authors
have successfully labeled T cells in vitro using iron-based nanoparticles31 or fluorinated
nanoemulsions32 and later tracked them in vivo by MRI. Similarly, natural killer (NK) cells
have also been labeled with PFC and imaged longitudinally after intratumoral injection in
mice33. The PFC nanoemulsion used in this study (CS-1000) has previously been used for
numerous preclinical 19F magnetic resonance imaging (MRI) studies of immune and stem
cells in various disease models26, 32-40. By means of fluorescence and electron microscopy
and flow cytometry, the dual-mode PFC nanoemulsion agent has been shown to be
internalized by immune cells in multiple studies12, 23, 32, 38, 41, 42. Immune cell labeling with
the nanoemulsion used (CS-1000) does not alter cell viability, phenotype or cytokine
83
production26, 32, 33, 38. In addition, the same imaging agent has been used in a clinical trial
monitoring a PFC-labeled dendritic cell immunotherapy in colorectal cancer patients7.
Moreover, CS-1000 is the subject of an FDA Drug Master File (DMF), as well as a similar
DMF at Health Canada. Thus, the safety of this PFC nanoemulsion to cells and organisms
at appropriate doses used in cell therapy has been extensively investigated. Utmost care and
caution should nonetheless be applied before proceeding with any in vivo application of 19F-
labeled CAR T cells in human subjects.
Alternative methods for assessing cell distribution in preclinical studies often involve
laborious and tissue-destructive histopathology, or flow cytometry measurements in blood
and tissue samples prepared as single cell suspensions3, 43, 44. Analyses of tissues requires
multiple manual processing and chemical treatment steps, as well as human input in the data
collection and computer analysis, all of which are time-intensive. Histopathology remains
semi-quantitative for analysis of multi-organ tissue panels, and is often limited by a finite
number of tissue slices leading to potential sampling error, as well as confounding factors
such as tissue autofluorescence45. Flow cytometry is most often used to measure remaining
circulating T cells in blood. Others have reported that the average LOD for circulating T
cells by flow cytometry is on the order of 3-10 CAR T cells per microliter of blood44, 46, 47.
Thus, flow cytometry, as well as histology, may enable the detection of ‘rare’ cells in tissues.
To conclude, 19F NMR cytometry is a rapid and quantitative technique to evaluate
adoptive cell transfer biodistribution in intact tissues. This technique provides unbiased
quantification in samples. Overall, 19F NMR cytometry may accelerate the timeline to
evaluate new immunotherapeutic cell candidates by providing a straightforward method to
evaluate cell therapy biodistribution and cell fate.

84
Acknowledgements
Chapter 3, in full, is a reprint of the material as it appears in the journal Scientific
Reports 2017, with minor revisions and formatting changes for this dissertation. The authors
and title of the manuscript are as follows: Chapelin F, Gao S, Okada H, Weber T, Messer K,
Ahrens E.T. Fluorine-19 nuclear magnetic resonance of chimeric antigen receptor T cell
biodistribution in murine cancer model; Scientific Reports 2017. The authors acknowledge
technical support from Mrs Hongyan Xu. The dissertation author was the primary
investigator and author of this paper.
References
1. Rosenberg, S.A., Restifo, N.P., Yang, J.C., Morgan, R.A. & Dudley, M.E. Adoptive
cell transfer: a clinical path to effective cancer immunotherapy. Nat Rev Cancer 8,
299-308 (2008).
2. Razavi, S.M., Lee, K.E., Jin, B.E., Aujla, P.S., Gholamin, S. & Li, G. Immune
Evasion Strategies of Glioblastoma. Front Surg 3, 11 (2016).
3. Turtle, C.J., Hanafi, L.A., Berger, C., Gooley, T.A., Cherian, S., Hudecek, M.,
Sommermeyer, D., Melville, K., Pender, B., Budiarto, T.M., Robinson, E., Steevens,
N.N., Chaney, C., Soma, L., Chen, X., Yeung, C., Wood, B., Li, D., Cao, J.,
Heimfeld, S., Jensen, M.C., Riddell, S.R. & Maloney, D.G. CD19 CAR-T cells of
defined CD4+:CD8+ composition in adult B cell ALL patients. J Clin Invest 126,
2123-2138 (2016).
4. Ahmed, N., Brawley, V.S., Hegde, M., Robertson, C., Ghazi, A., Gerken, C., Liu, E.,
Dakhova, O., Ashoori, A., Corder, A., Gray, T., Wu, M.F., Liu, H., Hicks, J.,
Rainusso, N., Dotti, G., Mei, Z., Grilley, B., Gee, A., Rooney, C.M., Brenner, M.K.,
Heslop, H.E., Wels, W.S., Wang, L.L., Anderson, P. & Gottschalk, S. Human
Epidermal Growth Factor Receptor 2 (HER2) -Specific Chimeric Antigen Receptor-
Modified T Cells for the Immunotherapy of HER2-Positive Sarcoma. J Clin Oncol
33, 1688-1696 (2015).

85
5. Liu, X., Barrett, D.M., Jiang, S., Fang, C., Kalos, M., Grupp, S.A., June, C.H. &
Zhao, Y. Improved anti-leukemia activities of adoptively transferred T cells
expressing bispecific T-cell engager in mice. Blood Cancer J 6, e430 (2016).
6. Magnani, C.F., Turazzi, N., Benedicenti, F., Calabria, A., Tenderini, E., Tettamanti,
S., Giordano Attianese, G.M., Cooper, L.J., Aiuti, A., Montini, E., Biondi, A. &
Biagi, E. Immunotherapy of acute leukemia by chimeric antigen receptor-modified
lymphocytes using an improved Sleeping Beauty transposon platform. Oncotarget
(2016).
7. Ahrens, E.T., Helfer, B.M., O'Hanlon, C.F. & Schirda, C. Clinical cell therapy
imaging using a perfluorocarbon tracer and fluorine-19 MRI. Magnetic resonance in
medicine 72, 1696-1701 (2014).
8. FDA, C.f.B.E.a.R. (2013).
9. Ahrens, E.T. & Zhong, J. In vivo MRI cell tracking using perfluorocarbon probes
and fluorine-19 detection. NMR in biomedicine 26, 860-871 (2013).
10. Ahrens, E.T., Young, W.B., Xu, H. & Pusateri, L.K. Rapid quantification of
inflammation in tissue samples using perfluorocarbon emulsion and fluorine-19
nuclear magnetic resonance. Biotechniques 50, 229-234 (2011).
11. Kadayakkara, D.K., Beatty, P.L., Turner, M.S., Janjic, J.M., Ahrens, E.T. & Finn,
O.J. Inflammation driven by overexpression of the hypoglycosylated abnormal
mucin 1 (MUC1) links inflammatory bowel disease and pancreatitis. Pancreas 39,
510-515 (2010).
12. Srinivas, M., Morel, P.A., Ernst, L.A., Laidlaw, D.H. & Ahrens, E.T. Fluorine-19
MRI for visualization and quantification of cell migration in a diabetes model.
Magnetic resonance in medicine 58, 725-734 (2007).
13. Johnson, L.A., Scholler, J., Ohkuri, T., Kosaka, A., Patel, P.R., McGettigan, S.E.,
Nace, A.K., Dentchev, T., Thekkat, P., Loew, A., Boesteanu, A.C., Cogdill, A.P.,
Chen, T., Fraietta, J.A., Kloss, C.C., Posey, A.D., Jr., Engels, B., Singh, R., Ezell,
T., Idamakanti, N., Ramones, M.H., Li, N., Zhou, L., Plesa, G., Seykora, J.T., Okada,
H., June, C.H., Brogdon, J.L. & Maus, M.V. Rational development and
characterization of humanized anti-EGFR variant III chimeric antigen receptor T
cells for glioblastoma. Science translational medicine 7, 275ra222 (2015).
14. Carpenito, C., Milone, M.C., Hassan, R., Simonet, J.C., Lakhal, M., Suhoski, M.M.,
Varela-Rohena, A., Haines, K.M., Heitjan, D.F., Albelda, S.M., Carroll, R.G., Riley,
J.L., Pastan, I. & June, C.H. Control of large, established tumor xenografts with
genetically retargeted human T cells containing CD28 and CD137 domains. Proc
Natl Acad Sci U S A 106, 3360-3365 (2009).

86
15. Heimberger, A.B., Hlatky, R., Suki, D., Yang, D., Weinberg, J., Gilbert, M., Sawaya,
R. & Aldape, K. Prognostic effect of epidermal growth factor receptor and EGFRvIII
in glioblastoma multiforme patients. Clin Cancer Res 11, 1462-1466 (2005).
16. Okada, H. & Kasahara, N. in Cancer Immunotherapy Principles and Practice. (eds.
L.H. Butterfield, H.L. Kaufman & F. Marincola) In Press (Demos Medical
Publishing, 2017).
17. Thorne, A.H., Zanca, C. & Furnari, F. Epidermal growth factor receptor targeting
and challenges in glioblastoma. Neuro Oncol 18, 914-918 (2016).
18. Ohno, M., Ohkuri, T., Kosaka, A., Tanahashi, K., June, C.H., Natsume, A. & Okada,
H. Expression of miR-17-92 enhances anti-tumor activity of T-cells transduced with
the anti-EGFRvIII chimeric antigen receptor in mice bearing human GBM
xenografts. Journal for immunotherapy of cancer 1, 21 (2013).
19. Kadayakkara, D.K., Damodaran, K., Hitchens, T.K., Bulte, J.W. & Ahrens, E.T.
(19)F spin-lattice relaxation of perfluoropolyethers: Dependence on temperature and
magnetic field strength (7.0-14.1T). J Magn Reson 242, 18-22 (2014).
20. Nakashima, H., Ogawa, Y., Shono, S., Kinoshita, M., Nakashima, M., Sato, A.,
Ikarashi, M. & Seki, S. Activation of CD11b+ Kupffer cells/macrophages as a
common cause for exacerbation of TNF/Fas-ligand-dependent hepatitis in
hypercholesterolemic mice. PloS one 8, e49339 (2013).
21. Seyda, M., Elkhal, A., Quante, M., Falk, C.S. & Tullius, S.G. T Cells Going Innate.
Trends Immunol 37, 546-556 (2016).
22. Yanagisawa, K., Moriyasu, F., Miyahara, T., Yuki, M. & Iijima, H. Phagocytosis of
ultrasound contrast agent microbubbles by Kupffer cells. Ultrasound Med Biol 33,
318-325 (2007).
23. Ahrens, E.T., Flores, R., Xu, H. & Morel, P.A. In vivo imaging platform for tracking
immunotherapeutic cells. Nature biotechnology 23, 983-987 (2005).
24. Partlow, K.C., Chen, J., Brant, J.A., Neubauer, A.M., Meyerrose, T.E., Creer, M.H.,
Nolta, J.A., Caruthers, S.D., Lanza, G.M. & Wickline, S.A. 19F magnetic resonance
imaging for stem/progenitor cell tracking with multiple unique perfluorocarbon
nanobeacons. FASEB journal : official publication of the Federation of American
Societies for Experimental Biology 21, 1647-1654 (2007).
25. Riess, J.G. Perfluorocarbon-based oxygen delivery. Artificial cells, blood substitutes,
and immobilization biotechnology 34, 567-580 (2006).
26. Helfer, B.M., Balducci, A., Nelson, A.D., Janjic, J.M., Gil, R.R., Kalinski, P., de
Vries, I.J., Ahrens, E.T. & Mailliard, R.B. Functional assessment of human dendritic
cells labeled for in vivo (19)F magnetic resonance imaging cell tracking. Cytotherapy
12, 238-250 (2010).

87
27. Riess, J.G. Understanding the fundamentals of perfluorocarbons and perfluorocarbon
emulsions relevant to in vivo oxygen delivery. Artificial cells, blood substitutes, and
immobilization biotechnology 33, 47-63 (2005).
28. Patrick, M.J., Janjic, J.M., Teng, H., O'Hear, M.R., Brown, C.W., Stokum, J.A.,
Schmidt, B.F., Ahrens, E.T. & Waggoner, A.S. Intracellular pH measurements using
perfluorocarbon nanoemulsions. Journal of the American Chemical Society 135,
18445-18457 (2013).
29. Srinivas, M., Turner, M.S., Janjic, J.M., Morel, P.A., Laidlaw, D.H. & Ahrens, E.T.
In vivo cytometry of antigen-specific t cells using 19F MRI. Magnetic resonance in
medicine 62, 747-753 (2009).
30. Quah, B.J., Warren, H.S. & Parish, C.R. Monitoring lymphocyte proliferation in
vitro and in vivo with the intracellular fluorescent dye carboxyfluorescein diacetate
succinimidyl ester. Nature protocols 2, 2049-2056 (2007).
31. Yeh, T.C., Zhang, W., Ildstad, S.T. & Ho, C. In vivo dynamic MRI tracking of rat
T-cells labeled with superparamagnetic iron-oxide particles. Magnetic resonance in
medicine 33, 200-208 (1995).
32. Gonzales, C., Yoshihara, H.A., Dilek, N., Leignadier, J., Irving, M., Mieville, P.,
Helm, L., Michielin, O. & Schwitter, J. In-Vivo Detection and Tracking of T Cells
in Various Organs in a Melanoma Tumor Model by 19F-Fluorine MRS/MRI. PloS
one 11, e0164557 (2016).
33. Bouchlaka, M.N., Ludwig, K.D., Gordon, J.W., Kutz, M.P., Bednarz, B.P., Fain, S.B.
& Capitini, C.M. (19)F-MRI for monitoring human NK cells in vivo.
Oncoimmunology 5, e1143996 (2016).
34. Gaudet, J.M., Hamilton, A.M., Chen, Y., Fox, M.S. & Foster, P.J. Application of
dual 19 F and iron cellular MRI agents to track the infiltration of immune cells to the
site of a rejected stem cell transplant. Magnetic resonance in medicine (2016).
35. Somanchi, S.S., Kennis, B.A., Gopalakrishnan, V., Lee, D.A. & Bankson, J.A. In
Vivo (19)F-Magnetic Resonance Imaging of Adoptively Transferred NK Cells.
Methods in molecular biology 1441, 317-332 (2016).
36. Rose, L.C., Kadayakkara, D.K., Wang, G., Bar-Shir, A., Helfer, B.M., O'Hanlon,
C.F., Kraitchman, D.L., Rodriguez, R.L. & Bulte, J.W. Fluorine-19 Labeling of
Stromal Vascular Fraction Cells for Clinical Imaging Applications. Stem Cells
Transl Med 4, 1472-1481 (2015).
37. Ribot, E.J., Gaudet, J.M., Chen, Y., Gilbert, K.M. & Foster, P.J. In vivo MR detection
of fluorine-labeled human MSC using the bSSFP sequence. International journal of
nanomedicine 9, 1731-1739 (2014).

88
38. Helfer, B.M., Balducci, A., Sadeghi, Z., O'Hanlon, C., Hijaz, A., Flask, C.A. &
Wesa, A. (1)(9)F MRI tracer preserves in vitro and in vivo properties of
hematopoietic stem cells. Cell transplantation 22, 87-97 (2013).
39. Bible, E., Dell'Acqua, F., Solanky, B., Balducci, A., Crapo, P.M., Badylak, S.F.,
Ahrens, E.T. & Modo, M. Non-invasive imaging of transplanted human neural stem
cells and ECM scaffold remodeling in the stroke-damaged rat brain by (19)F- and
diffusion-MRI. Biomaterials 33, 2858-2871 (2012).
40. Boehm-Sturm, P., Mengler, L., Wecker, S., Hoehn, M. & Kallur, T. In vivo tracking
of human neural stem cells with 19F magnetic resonance imaging. PloS one 6,
e29040 (2011).
41. Waiczies, H., Lepore, S., Janitzek, N., Hagen, U., Seifert, F., Ittermann, B., Purfurst,
B., Pezzutto, A., Paul, F., Niendorf, T. & Waiczies, S. Perfluorocarbon particle size
influences magnetic resonance signal and immunological properties of dendritic
cells. PloS one 6, e21981 (2011).
42. Janjic, J.M., Srinivas, M., Kadayakkara, D.K. & Ahrens, E.T. Self-delivering
nanoemulsions for dual fluorine-19 MRI and fluorescence detection. Journal of the
American Chemical Society 130, 2832-2841 (2008).
43. Lee, D.W., Kochenderfer, J.N., Stetler-Stevenson, M., Cui, Y.K., Delbrook, C.,
Feldman, S.A., Fry, T.J., Orentas, R., Sabatino, M., Shah, N.N., Steinberg, S.M.,
Stroncek, D., Tschernia, N., Yuan, C., Zhang, H., Zhang, L., Rosenberg, S.A.,
Wayne, A.S. & Mackall, C.L. T cells expressing CD19 chimeric antigen receptors
for acute lymphoblastic leukaemia in children and young adults: a phase 1 dose-
escalation trial. Lancet 385, 517-528 (2015).
44. Kunkele, A., Taraseviciute, A., Finn, L.S., Johnson, A.J., Berger, C., Finney, O.,
Chang, C.A., Rolczynski, L.S., Brown, C., Mgebroff, S., Berger, M., Park, J.R. &
Jensen, M.C. Preclinical Assessment of CD171-Directed CAR T Cell Adoptive
Therapy For Childhood Neuroblastoma: CE7 Epitope Target Safety and Product
Manufacturing Feasibility. Clin Cancer Res (2016).
45. Stack, E.C., Wang, C., Roman, K.A. & Hoyt, C.C. Multiplexed
immunohistochemistry, imaging, and quantitation: A review, with an assessment of
Tyramide signal amplification, multispectral imaging and multiplex analysis.
Methods 70, 46-58 (2014).
46. Davila, M.L., Kloss, C.C., Gunset, G. & Sadelain, M. CD19 CAR-targeted T cells
induce long-term remission and B Cell Aplasia in an immunocompetent mouse
model of B cell acute lymphoblastic leukemia. PloS one 8, e61338 (2013).
47. Hobbs, T.R., Blue, S.W., Park, B.S., Greisel, J.J., Conn, P.M. & Pau, F.K.
Measurement of Blood Volume in Adult Rhesus Macaques (Macaca mulatta). J Am
Assoc Lab Anim Sci 54, 687-693 (2015).

89
Chapter 4: Cell penetrating peptide functionalized perfluorocarbon nanoemulsions
for targeted cell labeling and enhanced fluorine-19 MRI detection
4.1. Introduction
Noninvasive methods for tracking cell therapy grafts are an urgent unmet clinical
need1, 2. With the development of adoptive immunotherapy against cancer, such as using
chimeric antigen receptor (CAR) T cell therapy3, 4, there is a need to determine the initial
biodistribution and survival of the therapeutic cells5. Visualizing cell populations in vivo can
also provide insights into off-site toxicities and help refine dosing regimens to enhance
therapeutic efficacy6, 7.
Noninvasive imaging techniques for cell detection post-transfer often employ
radioisotopes8, 9, bioluminescence reporters10, and fluorescence probes11, 12. Magnetic
resonance imaging (MRI) is also being adapted to visualize cells13. MRI has no depth
penetration limitations, displays anatomy with clarity, and can be used with in conjunction
with imaging agents clinically1, 14.
Fluorine-19 based MRI nanoemulsion probes are an option for non-invasively
imaging of cell populations15-21. The 19F nuclei have high intrinsic sensitivity, with 89%
relative sensitivity compared to 1H. De minimis endogenous 19F in the body ensures that any
MRI signals collected are from the introduced tracer probe. F-dense perfluorocarbon (PFC)
molecules are often used to form nanoemulsion imaging probes that can be endocytosed by
cells. As PFCs are mostly chemically inert, lipophobic, hydrophobic, and nanemulsions do
not osmotically diffuse out of viable cells thereby ensuring lasting labeling. Detailed reviews
of the biomedical applications of 19F cell detection and tracking are found elsewhere22-24.

90
Engineered lymphocytes commonly used in immunotherapy25 have an intrinsically
small cytoplasmic volume and are weakly phagocytic, thereby restricting uptake of
intracellular PFC label. The limits of cell detection in spin-density weighted 19F MRI is
linearly proportional to the cell labeling levels. Thus, to boost cell labeling, we designed
PFC nanoemulsion imaging probes displaying a cell penetrating peptide (CPP) from the
transactivator of transcription (TAT) component of the human immunodeficiency virus type-
126. TAT is an 86 amino acid protein, and residues 49-58 [Arg-Lys-Lys-Arg-Arg-Gln-Arg-
Arg-Arg] are positively charged and carry a nuclear localization signal sequence facilitating
endocytosis27. We report the synthesis schemes and physical characterizations of three novel
TAT co-surfactants for PFC nanoemulsion formulation. For PFC, we employ
perfluoropolyether (PFPE, a perfluorinated polyethylene glycol) or perfluoro-15-crown-5-
ether (PFCE); both molecules are used for 19F MRI due to unitary major fluorine peaks and
high sensitivity28, 29. The efficacy of TAT co-surfactants was tested by measuring cell uptake
in Jurkat cells and in human primary CAR T cells. In vitro functional cell (glioma) killing
assays were performed using TAT-PFC labeled CAR T cells. The intracellular localization
of PFC oil droplets in labeled CAR T cells was investigated by fluorescence and electron
microscopy. Additionally, we conducted proof-of-concept in vivo 19F MRI sensitivity studies
in CAR T cells labeled with TAT-PFC injected into flank gliomas.
4.2. Materials and Methods
4.2.1. Synthesis of F68-TAT
3.78 g of polyethylene-polypropylene (F68, 1 equiv, 0.0453 mmol, mol wt = 8350
g/mol, Spectrum Chemicals, Gardena, CA), purchased as a solid, was further dried under

91
high vacuum for 1 hour prior to use. To this dried white powder, 25 mL of anhydrous
dichloromethane was added and stirred until dissolution, yielding a clear solution. Reaction
was maintained under dry conditions using a steady stream of N2 gas. 172 mg of 6-
maleimidohexanoic acid (1.8 equiv, 0.815 mmol) was added in one portion yielding a pale
yellow solution. 0.906 mL of N, N'-Dicyclohexylcarbodiimide (DCC) was added dropwise;
solution cloudiness and formation of precipitate was observed almost immediately. The
reaction was stirred overnight at room temperature under inert gas. Reaction was monitored
by thin layer chromatography (TLC) with product retention factor (Rf) = 0.1 in 20:80:0.5
mix of MeOH:CHCl3:AcOH. Reaction byproduct was removed by filtration. To the filtrate,
an excess of hexanes was added causing the product to crash out which is collected by
filtration. Product is a pale pink solid, 10 (yield = 2.183 g, mol wt = 8493 g/mol). To 2.5 mg
of 10 (1 equiv, 0.00029 mmol) prepared as a 5 mg/mL solution in distilled water, 0.3 mg of
Cys-TAT (0.68 equiv, 0.00020 mmol) prepared as a 2 mg/mL solution in HEPES buffer was
added and allowed to stir overnight. Thereafter, 10 equiv of cysteine was added to cap any
remaining maleimide groups. The contents of the reaction vessel were dialyzed (Slide-A-
Lyzer Dialysis Cassettes, 3.5K MWCO, 3 mL, Thermo Scientific, Rockford, IL) to remove
residual Cys-Tat (mol wt = 1661.99 g/mol) and cysteine (mol wt = 121 g/mol).
4.2.2. Synthesis of Perfluorocarbon (PFC) Nanoemulsions with Cell-Penetrating Peptide
(CPP) and Poloxamer Surfactants
To prepare CPP surfactant, 1 mmol of 1H,1H-perfluoro-1-heptanol (0.350 g, 1 mmol,
mol wt = 350 g/mol) or 1H,1H-perfluoro-3,6,9-trioxadecan-1-ol (0.398 g, 1 mmol, mol wt
= 398 g/mol, Exfluor Research Corporation, Round Rock, TX) was added to a 25 mL round

92
bottom flask along with 232 mg 6-maleimidohexanoic acid (232 mg, 1.1 equiv, 1.1 mmol,
mol wt = 211.32 g/mol, TCI America, Portland, OR). Anhydrous dichloromethane (5 mL)
was added, and the flask was maintained under a constant stream of N2 gas while stirring.
Once the reactants dissolved, 572.4 mg benzotriazol-1-yl-oxytripyrrolidinophosphonium
hexafluorophosphate (PyBOP, 572.4 mg, 1.1 equiv, 1.1 mmol, mol wt = 520.39 g/mol,
Bachem, Torrance, CA) was added in one portion. After 2 min for the coupling reagent to
dissolve, 350 µL of diisopropylethylamine (DIEA, 2 equiv, 2 mmol, Sigma Aldrich, St
Louis, MO) was added to start the reaction. The flask was left under a slow N2 stream with
constant stirring at room temperature for 16 h. The reaction completion was monitored by
TLC (Rf = 0.4, 3:7 EtOAc: hexanes). Purification and solvent removal were accomplished
using a Combiflash Rf Lumen (Teledyne Isco, Lincoln, NE) silica gel column (12 g, silica
Redisep column) using a hexane and ethyl acetate gradient with 1:0 hexane:EtOAc for 3
min, followed by an increase in polarity to 1:1 hexane:EtOAc from 3 min to 14 min, followed
by a 0:1 hexane:EtOAc wash for 1 min. An evaporative light scattering (ELS) detector was
used for monitoring product peaks, at 250 nm and 280 nm wavelengths, which elute at
retention times (tR) = 9 min (1) and tR = 10.5 min (2), respectively. The collected fractions
were concentrated with a rotary evaporator followed by drying on high vacuum overnight.
The products are a clear oil with mol wt = 591.28 g/mol (1) (yield = 325 mg) and mol wt =
543.28 g/mol (2) (yield = 380.1 mg).
Cys-TAT.9TFA (30 mg, 0.016 mmol, 1 equiv, mol wt = 2688.16 g/mol, Biomatik,
Wilmington, DL) and dissolved in 464 µL of 0.05% TFA-water. A solution of 1 or 2 (0.014
mmol) in trifluoroethanol (556 µL) was then added to the solution of Cys-TAT, followed by
the addition of 116 µL of 1 M 3-(N-morpholino)propanesulfonic acid (MOPS) buffer at pH

93
= 7.4. Reaction completion was assessed by liquid chromatography mass spectroscopy (LC-
MS, Model 1100 with LC/MSD Trap, Agilent, Santa Clara, CA) using a 95:5 gradient of
water + 0.05% TFA: acetonitrile + 0.05% TFA for 5 min, then 95:5 to 10:90 in 20 min,
followed by 10:90 to 0:100 in 10 min, tR = 18.5 min (1) and tR = 18.6 min (2)] and stopped
after 30 min by addition of 100 µL of glacial acetic acid. Following filtration (0.22 µm nylon
filter), the crude mixture was purified by semi-prep high pressure liquid chromatography
[HPLC, gradients used: 90:10 descending to 10:90 water + 0.05% TFA, acetonitrile + 0.05%
TFA in 20 min, tR = 12.5 min, m/z = 1127.4, mol wt = 2254.28 g/mol (1a, TATP) and tR =
13.7, m/z = 1103.5, mol wt = 2206.28 g/mol (2a, TATA)].
To prepare nanoemulsions, a 5% w/w ratio of total surfactant to PFC was used. For
4 mL of nanoemulsion product, 40 mg of F68 in 400 µL of water was added to a glass vial
containing 465 µL perfluo-15-crown-5-ether (PFCE, Exfluor Research, Round Rock, TX).
To this solution, 4 mg (1.21 µmol) of TATP (1a) or TATA (2a) (1.23 µmol) was added
followed by 3.135 mL of purified water. The solution was ultrasonicated (30% power, 1
min, Omni Ruptor 250W, Kennesaw, GA) and then passed through a microfluidizer (LV1,
Microfluidics, Westwood, MA) at 10,000 psi pressure four times. The TATA- and TATP-
F68-PFC (3) nanoemulsions were sterile filtered using a 0.22 µm syringe filter (Acrodisc
PF, Pall, Port Washington, NY) and bottled in autoclaved glass vials. The capped vials were
stored at 4 °C until use.
4.2.3. Synthesis of PFC Nanoemulsions with CPP-Phospholipid Surfactants
For CPP-phospholipid surfactant, 1,2-distearoyl-sn-glycero-3-
phosphoethanolamine-N-[maleimide(polyethyleneglycol)-2000] (DSPE-PEG2000-

94
maleimide, 1.8 equiv., 0.00217 mmol, 6.5 mg, Avanti Polar Lipids, Alabaster, AL) was
suspended in HEPES buffer (0.05 M, 500 µL, pH = 7.5) by sonication. A fresh solution of
Cys-TAT (1 equiv, 0.0012 mmol, 2.0 mg) in HEPES buffer (0.05 M, 300 μL, pH = 7.5) was
added in one portion, and the mixture was agitated on a shaker at 37 °C for 6 hours. 2-
Mercaptoethanol (0.8 μL, 10 equiv, 0.012 mmol, Sigma Aldrich) was added to react with
any remaining maleimide groups, and the solution was agitated further for 30 min.
The conjugate was de-salted and purified in deionized water using a dialysis cassette
(Slide-A-Lyzer #2K MWCO, cassette size = 3 mL, Thermo Scientific) at room temperature.
Water was replaced at 2, 4 and 22 hours (volume 300:1 compared to cassette size). The
sample was recovered from cassette and analyzed by matrix assisted laser
desorption/ionization (MALDI) mass spectrometry (Biflex IV MALDI-TOFMS, Bruker,
Billerica, MA) and identified as a mixture of the desired product, DSPE-PEG(2000)-Cys-
TAT (mol wt= 4660 g/mol) 4 and DSPE-PEG(2000)-mercaptoethanol (mol wt= 3020
g/mol). The solution was lyophilized to a dry powder to give a near-quantitative yield of the
desired product, 4.
The phospholipid-PEG-TAT conjugate was incorporated into egg yolk phospholipid
(EYP) by the two methods described below. For both methods, compound 1 (2.8 mg, 0.6
mol) and EYP (304 mg, 0.4 mmol, Sigma Aldrich) were mixed resulting in a TAT to lipid
surfactant ratio of 0.15 mol %. Thereafter, perfluoropolyether (PFPE) oil (1.18 g, 0.87 mmol,
mol wt = 1300-1400 g/mol, Exfluor) was added to obtain a 26% w/w ratio of phospholipid
to PFC. Sterile water was added to obtain a 120-150 mg/mL concentration of PFC. The
nanoemulsions were then sterile-filtered through (0.2 μm, Pall) into glass vials, capped, and
95
stored at 4 °C until use. Following formulation and filtration, each nanoemulsion was
characterized by dynamic light scattering (DLS) particle analysis and 19F NMR.
Method 1: Direct Insertion of Peptide Conjugate
Compound 4 was added to a solution of EYP in chloroform (5 mL), vortexed on
medium for 1 min, and the resulting solution evaporated with a stream of nitrogen while
manually rotating the vial to evenly coat the vessel. The vial was then placed under high
vacuum overnight to give a dry lipid film. Sterile water was added to hydrate the lipid film
for 5 min followed by vortexing on medium for 2 min and then ultrasonication (30% power,
4 min). PFPE was added to the vial in one portion, vortexed briefly, and then ultrasonicated
(30% power, 2 min). The crude emulsion (5) was passed four times through a microfluidizer
at 20,000 psi with the reaction chamber cooled on ice.
Method 2: Post-Insertion of Peptide Conjugate
A suspension of EYP in sterile water was formed by ultrasonication (30% power, 4
min), and PFPE oil was added to the vial in one portion, vortexed briefly, and then
ultrasonicated (30% power, 2 min). The crude emulsion was passed four times through a
microfluidizer as in Method 1. To add TAT, solutions of 1 based on mol% of total EYP
surfactant were prepared in sterile water. The solution of 1 is added to the preformed
nanoemulsion and agitated on a bioshaker at 37 ºC for 5 h to obtain (5) nanoemulsion.
96
4.2.4. Nanoemulsion Size and Homogeneity
DLS instrumentation (Zetasizer ZS, Malvern Panalytical, Malvern, UK) was used to
determine the particle size, polydispersity index (PDI) and zeta potential for the samples.
Nanoemulsions were diluted to 0.5% v/v in water and transferred to low volume (1.5 mL)
disposable cuvettes. Measurements were performed in triplicate samples for each
nanoemulsion.
4.2.5. 19F NMR Measurement of Nanoemulsion Fluorine Concentration
The 19F NMR spectral data were acquired using a 400 MHz Bruker NanoBay
Spectrometer (Bruker BioSpin, Billerica, MA) with a single 17 μs pulse, 32,000 free
induction decay points, 100 ppm spectral width, 32 averages and 15 s repetition time. NMR
samples were prepared by adding 0.1% (w/v) sodium TFA in D2O to nanoemulsion (10%
v/v). The concentration of PFC in nanoemulsion (CF) was calculated from the integrals of
the TFA signal (normalized to 1) and the major PFC peak (IPFC) using the relation CF = a
IPFCCTFAVTFA(bVPFC)-1, where CTFA is the concentration of TFA in mg/mL, VTFA and VPFC
respective volumes of nanoemulsion and 0.1% TFA solution in mL in the NMR sample, and
a and b are constants representing the 19F mass fraction of TFA (0.42) and PFC (e.g., 0.655
for PFCE and 0.58 for PFPE), respectively.
4.2.6. T Cell Preparation
The Jurkat T cell line was obtained commercially (#TIB-152, ATCC, Manassas, VA)
for initial nanoemulsion cell labeling characterizations. Jurkat cells were grown in RPMI-
1640 media (Gibco, Waltham, MA) plus 10% fetal bovine serum (FBS), 10 mM HEPES

97
buffer (4-(2-hydroxyethyl)-1-piperazineethanesulfonic acid), 1 mM sodium pyruvate and
1.5 mg/mL sodium bicarbonate media.
Primary human T cells were obtained from blood samples sourced from the San
Diego Blood Bank and enriched for T cells by Ficoll (Histopaque 1077, Sigma Aldrich)
gradient density centrifugation and magnetic assisted cell sorting (Dynabeads, Thermo
Fisher). T-cells were then activated with human T-activator CD3/CD28 Dynabeads and
allowed to expand for two days in RPMI-1640 supplemented with 10% FBS and 100
units/mL of recombinant human interleukin 2 (IL-2, Peprotech, Rocky Hill, NJ). For
transduction, we employed a vector specific to epidermal growth factor receptor variant III
(EGFR-vIII) as described by Johnson et al30. A detailed protocol for chimeric antigen
receptor (CAR) virus production and human T cell transduction is available elsewhere31.
CAR receptor expression was confirmed by flow cytometry. We used T cell populations
with >70% CAR+ expression.
4.2.7. Glioma Cell Line
A human glioblastoma multiform (U87-EGFRvIII-Luc) cell line overexpressing
EGFR-vIII32 and the luciferase reporter gene (Luc) were used. Cells were incubated (37 ºC,
5% CO2) and cultured in T-75 flasks (Thermo Fisher) in RPMI-1640 medium supplemented
with 10% FBS.
4.2.8. In Vitro T Cell Labeling
For initial uptake experiments, 1 million Jurkat or CAR T cells were plated in 1 mL
full media in 24 well plates (n = 3 wells per condition). PFC nanoemulsion was added to

98
each well and incubated overnight (16 h) at 37 oC and 5% CO2. The cells were then washed
three times with phosphate buffered saline (PBS) to rinse free nanoemulsion. Cells were
counted and viability was assessed by Trypan blue staining. Thereafter, the cells were spun
down, resuspended in 150 μL lysis buffer (1% Triton X in PBS) and transferred to a 5 mm
NMR tube. 50 μL 0.1% TFA was added to each NMR tube, and spectra were acquired as
described above. Total fluorine atom count was divided by the sample cell number to yield
the average number of fluorine atoms per cell.
For in vivo experiments, CAR T cells were plated at a density of 10 million cells in
5 mL of media per well of a 6-well plate and incubated overnight with 15 mg/mL of
nanoemulsion. Cells were washed as described above and an aliquot of 1 million cells was
set aside to measure cell uptake by 19F NMR.
4.2.9. Synthesis of Cyanine-5 (Cy5) Fluorescence Nanoemulsions
TAT-PFC nanoemulsions were prepared with Cy5 dye attached. To 0.5 mmol of
1H,1H-Perfluoro-1-heptanol (mol wt = 350.08 g/mol) or 1H,1H-Perfluoro-3,6,9-
trioxadecan-1-ol (mol wt = 398.08 g/mol), we added 0.55 mmol of 6-(Boc-amino)caproic
acid (mol wt = 231.29 g/mol, Sigma Aldrich); this mixture was dissolved in a minimum
amount of dry dichloromethane (DCM), and the reaction mix was stirred under N2 gas. 0.55
mmol pyBOB (benzotriazol-1-yl-oxytripyrrolidinophosphonium hexafluorophosphate) was
added, followed by 0.74 mmol of diisopropylethylamine (DIEA), and mixture was stirred
under inert gas overnight at room temperature. Reaction completion was monitored by TLC.
The solvent was removed with a rotary evaporator, and sample was dissolved in minimum
amount of DCM. Wet crude sample was loaded on a 4 gm silica gel Redisep column for
purification using the Combiflash Rf Lumen. We eluted with 100% hexane for 2 min, then
99
70%:30% EtOAc:hexane over 10 min. The desired product 6 or 7 was eluted between 30-
40% EtOAc and tR = 6-7.5 min, as monitored by ELS detector.
Boc protecting group in compound 6 or 7 was removed by adding 1 mL of TFA and
3 mL of DCM while stirring at room temperature for 1 h. The TFA was removed by forming
an azeotrope with toluene, and the sample was dried under a rotary evaporator followed by
high vacuum to extract all solvents. LC-MS used 10:90 to 90:10 Acetonitrile + 0.05%
TFA:H2O in 20 min. The purified compound eluted at tR = 15.3 min, m/z = 515.3 (6a) and
tR = 16.6 min, m/z = 564.0 (7a) using the 215 nm detector.
A 25 mM stock solution of 6a or 7a was prepared by dissolving weighed oil in
calculated amount of trifluoroethanol. We used 8 µL of 6 mM Cy5-N-hydroxysuccinimide
(Cy5-NHS, 48 nmol, GE Healthcare, Chicago, IL) and an excess of 6a or 7a (approximately
20 equiv, 960 nmol or 38.5 µl of 25 mM stock prepared above) was added. The molar
equivalent amount of N-methyl morpholine was added, prepared as a 50 mM solution in
DMSO. The reaction was stirred at room temperature overnight. Thereafter, 2 µl of acetic
acid was added, and the reaction mix was purified by HPLC (gradient 10:90 to 90:10 water
+ 0.05% TFA:Acetonitrile + 0.05% in 20 min and retain at 90:10 for an additional 10 min
on a Phenomenex Luna 5 µm C18(2) 100 Å, 250 x 10 mm column). The desired product
was eluted at tR = 21.6 min, m/z = 1150.3 (8) and tR = 20.3 min, m/z = 1102.3 min (9), as
monitored by UV absorbance at 650 nm.
To prepare nanoemulsions, we used the procedure as described above. Prior to
sonication, 0.3 µM of 8 is added to cocktail where TATP is used as the chosen anchor.
Similarly, 0.3 µM of 9 is added to cocktail using TATA. Following sonication and
microfluidization a faint blue nanoemulsion is obtained.

100
4.2.10. Fluorescence Microscopy
Aliquots of CAR T cells (1×10⁶ cells, N = 3) were labeled with Cy5-TATP-F68-PFC
nanoemulsion or mock-labeled for a 24 h period and then fixed with 4% paraformaldehyde
for 20 min. Cells were stained with CD3-Alexa488 (1:200 dilution, Biolegend, San Diego,
CA) and Hoechst dye nuclear stain (#33342, 1:500 dilution, Thermo Fisher). Cells were then
mounted in Aqua-Mount media (Lerner Laboratories, Cheshire, WA), and slides were
imaged using a confocal microscope (Model A1, Nikon Instruments, Melville, NY) with a
40× water immersion objective and 405 nm, 488 nm and 640 nm lasers for excitation.
4.2.11. Tumor Cell Killing Assay
U87-EGFRvIII-Luc cells were plated at a density of 30,000 cells per well in clear
bottom 96-well plates (Corning, Inc., Corning, NY) and were allowed to adhere overnight
(60 wells total for two time points). Wells (n = 6, per condition) received: (i) 5:1 ratio of
CAR T cells to cancer cells, (ii) 5:1 ratio of TATP-F68-PFC-labeled CAR T cells to cancer
cells, (iii) 5:1 ratio of untransduced T cells to cancer cells, (iv) 5:1 ratio of TATP-F68-PFC-
labeled untransduced T cells to cancer cells or (v) untreated cancer cells for baseline signal.
At 12 and 24 hours post T cell treatment, D-luciferin (300 μg/mL, Biosynth International,
Itasca, IL) was added to wells and bioluminescence signals were immediately measured with
a plate reader (Infinite M200PRO, Tecan, Morrisville, NC). The relative U87-EGFRvIII-
Luc cell killing efficacy was obtained from the mean photon count for groups (i-iv); the
numerical differences between treated versus untreated (v) means are displayed as
percentages.

101
4.2.12. Electron Microscopy
To confirm intracellular PFC localization, we examined CAR T cells labeled with
TATP-F68-PFC or TATA-F68-PFC alongside unlabeled CAR T cells using electron
microscopy. Cells were labeled as above. CAR T cell pellets were fixed in PBS containing
2% glutaraldehyde in 0.1 M sodium cacodylate (SC) buffer at room temperature for 30 min
and stored overnight at 4 °C. The cells were washed five times in 0.1 M SC buffer on ice
and treated with 1% OsO4 in 0.1 M SC buffer for 1 hour. All samples were washed in
deionized water and treated with 2% uranyl acetate for 1 hour on ice. Pellets were dehydrated
in ethanol and then anhydrous acetone. The cells were embedded in a solution containing a
1:1 mixture of acetone and Durcupan resin (Sigma-Aldrich) for 2 h on a tube rotator and
then in 100% Durcupan overnight. The next day, cell pellets were embedded in Durcupan
resin and polymerized over 36 h at 60 oC. Ultra-thin (60 nm) sections were cut using a
diamond knife and collected on Cu mesh grids. The samples were stained with 1% aqueous
uranyl acetate and Reynolds lead citrate. Sections were imaged using a Tecnai Spirit electron
microscope (FEI, Hillsboro, OR) at 80 kV.
4.2.13. Flow Cytometry
Potential impact of TATP-F68-PFC on CAR T cell phenotype and viability was
evaluated by measuring surface expression levels of CD3, CD4, CD8, and 7-AAD (viability
marker) by flow cytometry (LSR Fortessa, BD Biosciences, San Jose, CA). We used
Alexa488 anti-human CD3 clone HIT3a, Phycoerythrin-cyanine 5 (PE-Cy5) anti-human
CD4 clone OKT4, Fluorescein isothiocyanate (FITC) anti-human CD8 clone SK1, and 7-

102
Aminoactinomycin D (7-AAD) viability marker (all purchased from Biolegend, San Diego,
CA). In these assays, we evaluated CAR T cells without PFC label as controls. Flow
cytometry data processing used FlowJo software (FlowJo, Ashland, OR).
4.2.14. In Vivo MRI
All animal protocols were approved by the University of California, San Diego,
Institutional Animal Care and Use Committee (IACUC). Bilateral subcutaneous flank
tumors were implanted in N = 4 female NOD/SCID 4-6 week old mice (Jackson
Laboratories, Bar Harbor, ME). Tumor inoculant consisted of 5×10⁶ U87-EGFRvIII-Luc
tumor cells in 100 μL matrigel (Corning, Tweksbury, MA) in PBS (1:1). Five days later,
mice received intra-tumoral injection of 1×10⁷ labeled CAR T cells labeled with either
TATP-F68-PFC or PFC-F68 nanoemulsion. Two hours after intratumoral injection, mice
were anesthetized with 1-2% isoflurane in O2 and positioned an 11.7 T Bruker BioSpec
preclinical scanner with a dual-tuned 1H/19F birdcage volume coil. Animal temperature was
regulated, and respiration was monitored during scans. A reference capillary with dilute PFC
nanoemulsion was positioned along the animal in the image field of view (FOV). The 1H
anatomical images were acquired using the RARE (rapid acquisition with relaxation
enhancement) sequence with TR/TE = 2000/13 ms, RARE factor 4, matrix 256×184, FOV
38×30 mm2, slice thickness 1 mm, 18 slices, and 4 averages. The 19F images were also
acquired using a RARE sequence with parameters TR/TE = 1500/4.7 ms, RARE factor 8,
matrix 64×46, FOV 38×30 mm2, slice thickness 1 mm, 18 slices, and 400 averages. The total
number of fluorine atoms per voxel in tumor regions were estimated directly from the vivo
19F image hot-spots using the software program Voxel Tracker (Celsense, Pittsburgh, PA),

103
which also employs image measurements of the external 19F reference capillary signal and
noise as inputs, and yields a statistical uncertainty of 19F-count; additional details about this
analysis are published elsewhere33. For display, 19F images were manually thresholded to
remove background noise, and 1H/19F renderings were performed in ImageJ by overlaying
1H (grayscale) and 19F (hot-iron, pseudo-color scale) slices. The fluorine images were also
resampled in ImageJ to obtain a matrix size of 2048×2048 and converted to 32 bit images to
keep the number of pixels constant. Regions of interest (ROI) were segmented around
relevant 19F signals (right tumor, left tumor and noise) on slices, and ROI voxel intensities
were displayed as histograms.
4.2.15. Ex Vivo Microimaging of Tumors
Two days after intratumoral injection, animals were sacrificed by CO2 inhalation and
tumors were excised with the surrounding skin tissue. Tumors were fixed in 4%
paraformaldehyde overnight, rinsed in PBS, and transferred to a 10 mm NMR tube (Wilman
Labglass, Vineland, NJ) containing a 2% agarose solution (Fisher Scientific, Hampton, NH).
Images of the tumors were acquired on a Bruker 400 MHz NanoBay NMR spectrometer
equipped with microimaging accessories and a 10 mm 19F/1H microimaging coil. Proton
anatomical images were acquired with a three-dimensional (3D) spin-echo sequence using
TR/TE = 800/25 ms, matrix 256×128×128, FOV 9.5×9.5×12 mm3 and 1 average. Fluorine
images were acquired with a 3D RARE sequence using TR/TE = 2000/9.7 ms, RARE factor
4, matrix 128×64×64, FOV 9.5×9.5×12 mm3 and 35 averages. The 1H/19F image overlays
were performed in ImageJ.

104
4.2.16. Statistical Analyses
Measurements are presented as mean ± standard deviation. We performed unpaired
T-tests with unequal variances to compare in vivo groups. Two tailed P-values < 0.05 were
considered statistically significant.
4.3. Results
To increase the cellular uptake of PFC nanoemulsion, we chemically modified and
attached the TAT peptide to the surfactant to display the hydrophilic and positively charged
cell penetrating moiety on the nanoemulsion surface. We tested two general methods (Fig.
4.1) for peptide incorporation into PFC nanoemulsions; these were formed with either
polyethylene polypropylene glycol block polymer (Pluronic F68) or phospholipid. For the
poloxamer surfactant, we first conjugated TAT with a terminal cysteine (TAT-cys) directly
to F68 functionalized with a maleimide group (F68-TAT) (Fig. 4.S1)34. However, PFC
nanoemulsions formed with F68-TAT incorporated at ≥2% w/w of the F68 surfactant lacked
long term stability and emulsions that had <1% F68-TAT resulted in negligible cell uptake
(data not shown). A successful approach involved conjugation of Cys-TAT to one of two
small fluorous molecule anchors via a short hydrocarbon linker (Fig. 4.1a) bearing a
maleimide group that was synthesized from the corresponding alcohols and 6-
maleimidocaproic acid using benzotriazol-1-yl-oxytripyrrolidinophosphonium
hexafluorophosphate (PyBOP) as a condensation agent. The two anchors consisted of either
a perfluoroheptyl (TATA) or a short perfluoroPEG (seven atom backbone) group (TATP),

105
designated TATA-F68-PFC and TATP-F68-PFC, respectively, with variable percentages by
weight (% w/w). Following emulsification of PFC and surfactants, both nanoemulsion
formulations yielded an average size particle of 180 nm (Figs. 4.S2a, b) with a polydispersity
index (PDI) of ~0.0795-0.095, measured by light scattering methods, and particle size
slightly increased by an average of 9% by day 45 post synthesis, but stabilized, and did not
separate into fluorous and aqueous phases over three months (Figs. 4.S2c, d).
Figure 4.1. Synthesis of TAT functionalized perflurocarbon nanoemulsions. Panel (a)
displays synthesis of TAT conjugates with fluorous anchors, TATP and TATA and
poloxamer surfactant formulated PLC nanoemulsions. Panel (b) shows scheme for TAT-
phospholipid anchor conjugation for EYP surfactant formulated PFC nanoemulsion.

106
Incorporation of the TAT anchored co-surfactants into F68 formulated PFC
nanoemulsions resulted in significantly enhanced uptake by Jurkat cells following an 18 hour
incubation (Fig. 4.2). At low CPP stoichiometry in nanoemulsion (2.5% w/w TAT), 5.33
(±0.71) ×1011 19F/cell for TATP-F68-PFC and 4.67 (±0.59) ×1011 19F/cell for TATA-F68-
PFC (dose 10 mg/ml in media, Fig. 4.2A) was measured using 19F NMR of cell pellets. For
higher nanoemulsion CPP content (10% w/w TATP), cell uptake was increased to 6.82
(±1.92) ×1011 F/cell compared to 2.25 (±0.15) ×1011 19F/cell for control F68-PFC
nanoemulsion; similarly, TATA-F68-PFC nanoemulsion yielded uptake values of 5.26
(±0.86) ×1011 19F/cell (Fig. 4.2A). Addition of either TATP or TATA did not impair cell
viability (Fig. 4.2B) as measured by permeability to Trypan blue. Incubation of Jurkat cells
with TATP-F68-PFC or TATA-F68-PFC with increasing concentrations of nanoemulsion in
culture displays a canonical sigmoidal uptake pattern (Fig. 4.2C). CAR T cells labeled with
TATP-F68-PFC at 15 mg/ml exhibit an average 8.2-fold uptake improvement compared to
control F68-PFC-labeled cells (Fig. 4.2E). TATA-harboring nanoemulsions exhibited mild
toxicity to cells with a decrease in cell viability to 85.3% at 10 mg/mL and 83% at 20 mg/mL
compared to 97.7% for untreated cells (Fig. 4.2D). At the same doses, TATP containing
nanoemulsions remained non-toxic to the cells with viability of 92% for 10 mg/mL dose and
91.7% for 20 mg/mL dose (Fig. 4.2D).

107
Figure 4.2. Jurkat cell labeling with TATA-F68-PFC and TATP-F68-PFC
nanoemulsions. The TAT anchor stoichiometry is optimized by measuring uptake (a) and
viability (b) in Jurkat cells while varying the percent by weight of TAT in pluronic surfactant
PFC nanoemulsion, namely TATP-F68-PFC (black bars) and TATA-F68-PFC (grey bars).
Cell uptake (c) and viability (d) for varying dosages (in mg/mL) of 10% w/w TATP-F68-
PFC and TATA-F68-PFC after 18 hour incubation are shown. CAR T cells labeled in the
same conditions exhibit an average 8.2-fold uptake improvement compared to control F68-
PFC-labeled cells at a dose of 15 mg/ml (dashed bars, e). Average viability of labeled CAR
T cells is displayed above the bar graph. Uptake was measured from 19F NMR spectra of cell
pellets, and viability was measured by trypan blue assay and direct cell counts.
Alternative PFC nanoemulsions were also formed with the egg yolk phospholipid
(EYP) surfactant, where cys-TAT was conjugated to commercially available 1,2-Distearoyl-
sn-glycero-3-phosphoethanolamine-peg2000-maleimide35 (Fig. 4.1B), and the product 4
was confirmed by Matrix Assisted Laser Desorption/Ionization mass spectrometry.
Conjugate 4 was inserted into nanoemulsion either into the crude mix prior to emulsification
(“direct insertion”) or after emulsification (“post-insertion”). Formed nanoemulsions
containing the adduct up to 0.15 mol % (of EYP) averaged 160 nm in size with a PDI~0.2
immediately after emulsification; particle size did not change significantly over >10 weeks

108
post-production. No differences in size or zeta potential were observed for lipid-based
nanoemulsions prepared with or without anchored TAT.
Cell labeling using TAT-modified pegylated phospholipid incorporated into EYP-
surfactant nanoemulsions also resulted in greater uptake in Jurkat cells (Fig. 4.3A). Uptake
was comparable for nanoemulsions irrespective of the method of incorporation (i.e., direct
insertion or post-insertion, Fig. 4.3A). The ‘optimal’ incubation time was approximately 18
hours for 0.15 mol% phospholipid-TAT-PFC resulting in 1.23 (±0.85) ×1012 19F/cell. Shorter
incubation times of 2 and 4 hours displayed lower uptake of 6.32 (±0.86) ×1011 19F/cell and
5.15 (±1.06) ×1011 19F/cell, respectively (Fig. 4.S3A). Following 18 hours of incubation, a
modest reduction in cell viability was noticed and measured to be 79 (±5.65) % for
phospholipid-TAT-PFC compared to 93.5 (±0.71) % for control nanoemulsion (Fig. 4.S3B).
To test dose-dependent uptake, phospholipid-TAT-PFC (0.15 mol % of EYP) nanoemulsion
were incubated with Jurkat cells for 18 hours at varying doses of 2.5, 5, 10 and 20 mg/mL.
Uptake values followed a sigmoidal increase where cell uptake saturated at a dose of 10-15
mg/mL (Fig. 4.3B), with minimal loss in cell viability even at high doses (Fig. 4.3C).
Figure 4.3. Jurkat cell labeling with lipid-TAT-PFC emulsion. The TAT anchor
stoichiometry is optimized by measuring uptake (a) in cells while varying the percent by
molarity of TAT in phospholipid surfactant PFC nanoemulsions using two different methods
of preparation including post-insertion (dark grey) and direct insertion (light grey) of TAT
conjugate. The cell uptake (b) and viability (c) with varying dosage of 0.1 mol% lipid-TAT-
PFC after 18 hour incubation are presented.

109
We next investigated cellular localization of TATP- and TATA-F68-PFC
nanoemulsions in primary T cells using high-resolution fluorescence and electron
microscopy. We synthesized fluorescently labeled co-surfactants 8 and 9 consisting of Cy5
dye attached to the respective fluorous anchors (Fig. 4.S4) for incorporation into TATP-F68-
PFC and TATA-F68-PFC nanoemulsions, respectively. Confocal microscopy of CAR T
cells incubated with fluorescent nanoemulsions reveal intracellular and partial cell
membrane localization of nanoemulsion (Fig. 4.4B) compared to untreated control cells (Fig.
4.4A); cells were co-stained with Hoechst nuclei stain and anti-CD3 fluorescent antibody
for cell surface. As a further control, we tested whether the introduction of a surface dye on
nanoemulsions enhanced cell uptake or causes overt cytotoxicity (Fig. 4.S5). The uptake of
nanoemulsions formulated with dye co-surfactant are comparable to TATP-F68-PFC
(p>0.05, Fig. 4.S5A), retains cell viability (Fig. 4.S5B), and compounds 8 and 9 do not
appear to enhance internalization into live cells (Fig. 4.S6).
To substantiate the intracellular localization of TAT nanoemulsion in CAR T cells,
electron microscopy was performed. The TATP-F68-PFC nanoemulsion droplets are present
intracellularly and appear as clusters of small (~100-200 nm) punctate regions of
hyperintensity in micrographs (Figs. 4.4E, F), along with a few larger PFC deposits (~1 m)
(Figs. 4.4G, H), presumably coalesced droplets, consistent with previous studies29, 36.
Untreated control cells did not contain these hyperintense features in micrographs (Figs.
4.4C, D). Similar findings were observed for CAR T cells labeled with TATA-F68-naPFC
nanoemulsion (Figs. 4.4I-L). Normal cellular, mitochondrial and Golgi body morphologies
are observed, consistent with minimal toxicity to labeled CAR T cells (Figs. 4.4E, L)37.

110
Figure 4.4. Microscopy of CAR T cells labeled with TAT-F68-PFC nanoemulsions. Confocal microscopy images of untreated CAR T cells are displayed in (a), and CAR T cells
labeled with (15 mg/mL) of Cy5-TATP-F68-PFC nanoemulsions (red) are shown in (b).
Data show intracellular localization of Cy5-TATP-F68-PFC emulsion, where Hoescht dye
(blue) stains nuclei and Alexa488 anti-human CD3 antibody (green) delineates cell
membrane. Electron microscopy of untreated CAR T cells is shown in (c), magnified in (d).
CAR T labeled with TATP-F68-PFC (e-h) show numerous bright ~100 nm nanoemulsion
droplets (e, magnified in f, arrows) and occasional ~1 μm coalesced droplets (g, magnified
in h, arrows). CAR T cells labeled with TATA-F68-PFC (i-l) shows similar emulsion
droplets as with TATP-F68-PFC emulsion. Large coalesced droplets (i, inset j) as well as
numerous smaller droplets (k, inset l) are found in the cytoplasm.

111
Expression of CD3, CD4 and CD8 CAR T cell surface markers is not altered by
uptake of TATA-F68-PFC and TATP-F68-PFC nanoemulsions via flow cytometry (Fig.
4.5). Furthermore, CAR T cell killing function against glioma cells remains intact following
labeling with TATP-F68-PFC nanoemulsion (Fig. 4.S7).
Figure 4.5. Phenotype of CAR T cells labeled with TAT-F68-PFC nanoemulsions. Scatter plots confirm pure population of CAR T cells (CD3) (a-c). CD3 expression is
unaltered after labeling with TATP-F68-PFC (a) or TATA-F68-PFC (b) nanoemulsions
compared to unlabeled cells (c). Flow analysis for expression of CD4/CD8 shows a ~ 90/10
ratio of CD4+ to CD8+ positive cells (d-f). CAR T cells labeled with TATP-F68-PFC (d) or
TATA-F68-PFC (e) ex vivo exhibit comparable phenotype to unlabeled cells (f). FSC-A
indicates forward scatter, FITC stands for fluorescein isothiocyanate, and PE/Cy5 stands for
phycoerythrin-cyanine 5.
To demonstrate the utility of TAT PFC nanoemulsion for in vivo MRI, we
investigated 19F signal detection from CAR T cells implanted into a rodent model. Mice
bearing bilateral flank glioma tumors were injected intra-tumorally with CAR T cells (1×10⁷
cells) labeled with either TATP-F68-PFC or F68-PFC (control) nanoemulsion. Figures 4.6A,

112
B display spin-density weighted 19F images (pseudo-color) of injected cells, along with T2-
weighted 1H images (grayscale) showing tumors in flanks. Qualitative analysis of MRI slices
revealed greater number of high intensity pixels for TAT-F68-PFC-labeled CAR T cells
compared to F68-PFC-labeled CAR T cells and noise (Fig. 4.6C). With aid of the calibrated
19F reference in the image field of view, quantification of the three-dimensional 19F images
was performed (Fig. 4.6D); the right and left tumors display 17.9 (±2.1) ×1018 and 2.1 (±0.2)
×1018 19F atoms per tumor, respectively, revealing a significant (p<0.01) 8.5-fold sensitivity
improvement in detection of CAR T cells labeled with TAT PFC nanoemulsion. This
sensitivity increase is predicted, based on uptake analysis by 19F NMR of pelleted cells prior
to injection, showing ~8.2-fold increase in average fluorine content per cell for TATP-F68-
PFC versus control nanoemulsion. Of note, the 19F/cell measured after labeling was observed
to be greater for CAR T cells compared to the Jurkat cell line, ~8.2-fold and ~5-fold (Fig.
4.2C, E), respectively, when both are labeled with TATP-F68-PFC nanoemulsion. Tumors
were resected after imaging to verify intratumoral delivery of CAR T cells via extremely
high-resolution ex vivo MRI (Figs. 4.6E, F, 4.S8).

113
Figure 4.6. In vivo 19F MRI signal enhancement in TATP-F68-PFC labeled human
CAR T cells. Panel (a) displays composite 19F (hot-iron pseudo-color) and 1H (grayscale)
contiguous slices of a mouse with bilateral gliomas in the flanks, where the left and right
tumor (LT, RT) each received 1×10⁷ CAR T cells labeled with either F68-PFC (control) or
TATP-F68-PFC nanoemulsions, respectively. An external capillary reference (REF) is also
shown in the field of view consisting of 1:20 dilution of F68-PFC in agarose. Panel (b)
displays a three-dimensional rendering of the MRI data shown in (a). A histogram of the 19F
signal-to-noise ratio for each image voxel in the tumors is displayed in (c) and shows
sensitivity improvement of the TATP-containing nanoemulsion compared to control.
Comparison of apparent 19F atoms per tumor, as measured in vivo for N = 4 mice, is
displayed in (d) showing ~8 fold sensitivity enhancement (p<0.001) for TAT-F68-PFC
nanoemulsions compared to control. To verify intratumoral delivery of CAR T cells, two
days after CAR T cell injection, tumors were excised and fixed for extremely high-resolution
MRI. Panels (e, f) show composite 19F/1H three-dimensional rendering of intratumoral CAR
T cells labeled with control and TAT-F68-PFC nanoemulsions, respectively, and shows
successful delivery.

114
4.4. Discussion
Fluorine-19 MRI methods have shown promise for the detection of cell therapy
products post-transfer15-20, 38, 39, inflammatory infiltrates23, 40-42 and molecular targets43 in
vivo in preclinical models. Moreover, first-generation 19F probes based on PFC
nanoemulsions have been used in a pilot clinical trial14, with additional trials planned44.
Overall, the utility of 19F MRI could be expanded by increasing the sensitivity of 19F probes
via molecular design. Towards this goal, we aim to increase the cell adhesion and resulting
endocytosis of PFC nanoemulsions by non-phagocytic cells, especially engineered
lymphocytes with therapeutic potential. We synthesized three different surfactant-anchored
cell penetrating TAT peptides using small molecules that either mimic the common
surfactants used in emulsion formulations, namely phospholipids and poloxamers, or the
fluorous environment of the nanoemulsion droplet. We compared the efficacy of poloxamer
and phospholipid based surfactants doped with TAT-conjugates and investigated
nanoemulsion formation, droplet size, stability, cell uptake and viability ex vivo. Overall,
nanoemulsions harboring TAT peptides led to a 4- to 8-fold cell loading improvement in T
cells compared to the corresponding unmodified nanoemulsions. The droplet size, charge
and initial cell safety was generally unaffected by the presence of TAT, presumably due to
the low TAT to surfactant ratio in the nanoemulsions.
Phospholipid surfactants are often chosen to mimic the membranes of live cells and
impart biocompatibility.45, 46 Nonetheless, phospholipid-formulated nanoemulsions are
prone to instability under storage conditions due to oxidation-mediated changes to the
lipid47, and lipid oxidation by-products may lead to cytotoxicity upon cell contact48. Indeed,
a recent study has shown that formulations of lipid-surfactant paramagnetic nanoemulsions

115
that incorporate iron(III) bound to a fluorous diketonate (FDK) are prone to fatty acyl chain
oxidative damage49, 50. Additionally, the formulation of phospholipid-based nanoemulsions
requires a time consuming multi-step chemical process. For these reasons, we investigated
the novel TAT conjugates for use with synthetic polymeric co-surfactants such as
poloxamers (e.g., F68) in detail.
Direct conjugation of TAT to the pluronic F68 (TAT-F68) as a co-surfactant resulted
in nanoemulsion instability (data not shown), thus instead we conjugated TAT to short linear
fluorous molecules via a short aliphatic hydrocarbon linker. The nanoemulsions prepared
with TATP (1a) or TATA (2a) were stable for several months at 4 oC (Fig. S2).
As anticipated, increasing the percentage of TAT on the surface of the nanoemulsions
enhanced cell uptake. However, levels >20 % w/w of TAT to pluronic surfactant resulted in
increased cell-cell adhesion with formation of large cell clumps during labeling in vitro, thus
a lower percent of TAT was used for further studies.
To validate internalization of the TAT nanoemulsions into CAR T cells, we prepared
a comparable probe modified by the addition of a Cy5 fluorescent conjugate. The addition
of this moiety did not alter the overall 19F uptake levels in T cells. Fluorescence microscopy
of labeled cells shows that nanoemulsion droplets are present at the cell membrane and in
the cytosol, perhaps in endosomal compartments and in various stages of internalization and
cellular processing in early to late endosomes51. It has been noted that the TAT peptide can
translocate nanoparticles to the nucleus52, 53, however, in our imaging studies we did not find
nuclear localization of the TAT nanoemulsion probe. We note that TATP-F68-PFC-labeled
cells can optionally be washed with a diluted trypsin solution to assist with removal of
surface-adhered TAT emulsion. Nonetheless, presumably given sufficient time for

116
incubation, complete endocytosis of any membrane-bound TAT nanoemulsion should occur.
Definitive evidence for internalized nanoemulsions in small (~100-200 nm) to large vesicles
(~1 µm) was provided by electron microscopy. We speculate that small vesicles eventually
coalesce into larger ones to minimize their hydrophobic surface area in contact with the
aqueous cytosol, as cells have no mechanism for metabolizing PFCs54, 55.
While the exact mechanism of TAT- and other CPP-mediated internalization into
cells remains unknown56, a substantial number of studies have been carried out to
demonstrate its ability to drag a payload into the cytosol. CPPs’ ability to translocate
molecules of various sizes from small molecules57, proteins58, nucleic acids and liposomes59,
many of which have been studied in vivo60, makes their use for nanoemulsions attractive,
with adjustments in the amount of TAT required based on the cargo to be delivered56. In
addition to the pre-clinical successes with TAT peptides61-64, four compounds conjugated to
TAT are currently being tested in the clinic65 for conditions such as myocardial infarction66,
pain67, hearing loss68, and inflammation69; preliminary results of phase I clinical trials
indicate that TAT peptides exhibit acceptable safety profiles.
Our in vivo model shows that CAR T cells carrying TAT functionalized emulsions
give increased 19F MRI signal when injected into a tumor. Intratumoral immune cell delivery
has successfully shown anti-tumor effects in mice70-72 and has been considered as an
approach for patients73 as it may minimize toxicity from cytokine release syndrome upon
treatment with high doses of T cells. For example, Phase 1 trials are ongoing to test the
efficacy of intratumoral delivery in humans with ErbB targeted T4+ T cells in recurrent head
and neck cancer74. In another example, dendritic cells were isolated from patients and

117
injected intratumorally to induce an immune response75. Localized intrathecal delivery of
natural killer cells to treat medulloblastoma in pediatric patients is also under investigation76.
Overall, we have shown that incorporating the TAT cell penetrating peptide in PFC
nanoemulsions significantly enhances cell uptake by lymphocytes and subsequently
increased their detectability in vivo using 19F MRI. These same agents should be useful for
tagging other weakly phagocytic cells such as stem and progenitor cells. Moreover, the
peptide-PFC nanoemulsion synthesis scheme presented is generalizable for a multitude of
ex vivo and in vivo targeted 19F MRI probes and offers new avenues for cellular-molecular
imaging.
Figure 4.S1. Synthesis scheme of F68-TAT co-surfactant. F68 is functionalized with a
maleimide group to enable addition of the TAT peptide with a terminal cysteine (Cys-TAT).

118
Figure 4.S2. Size stability of TAT-F68-PFC nanoemulsions. The effect of % TAT
incorporation on size (a) and polydispersity index (PDI, b) of nanoemulsions is shown. The
nanoemulsion size (c) and PDI (d) of nanoemulsions over time while stored at 4 oC is
displayed.
Figure 4.S3. Optimization of lipid-TAT-PFC incubation time in Jurkat cells. Incubation
times of 2, 4 and 18 hours are tested as shown in (a), and the highest uptake is observed at
18 hours. Jurkat cell viability is not altered by labeling for different durations (b).
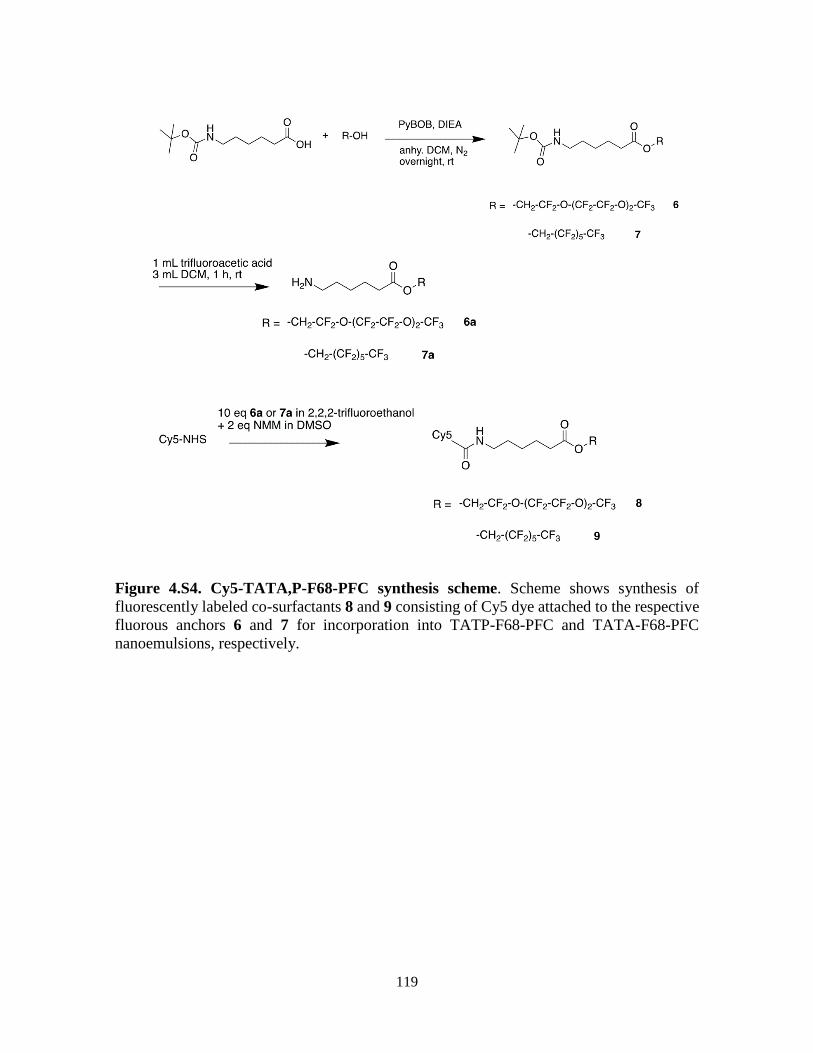
119
Figure 4.S4. Cy5-TATA,P-F68-PFC synthesis scheme. Scheme shows synthesis of
fluorescently labeled co-surfactants 8 and 9 consisting of Cy5 dye attached to the respective
fluorous anchors 6 and 7 for incorporation into TATP-F68-PFC and TATA-F68-PFC
nanoemulsions, respectively.

120
Figure 4.S5. Localization impact of incorporation of fluorescent dye into surfactant
layer during nanoemulsion preparation. Panel (a) displays 19F uptake for cells treated
with nanoemulsions prepared with and without anchored Cy5 at 10 mg/mL and 20 mg/mL
doses; no significant differences are observed. Additionally, CAR T cell viability is not
affected as shown in (b). Panel (c) shows intracellular localization of the nanoemulsion (Cy5
in red) in CAR T cells via confocal microscopy. Hoescht dye (nuclei, blue) and Alexa488
dye (cell membrane, green) is used to delineate cell structures.

121
Figure 4.S6. Fluorescent dye conjugate nanoemulsions without TAT do not get
internalized into CAR T cells. Panels show that dye compounds 8 and 9 do not induce non-
specific internalization into live cells. Hoescht dye (nuclei, blue) and Alexa488 dye (cell
membrane, green) are used to delineate the cells.

122
Figure 4.S7. CAR T cell killing assay in vitro. Co-incubation of human U87-EGFRvIII-
Luc glioma cells with TATP-F68-PFC-labeled or unlabeled CAR T cells, or untransduced
T cells results in significant cell death at 12 and 24 h. CAR T cells exhibit significant tumor
killing ability (~ 98%) compared to untransduced T cells (~ 60%). Killing efficacy is
unaltered by nanoemulsion labeling of the cells.
Figure 4.S8. Ex vivo 3D microimaging of excised glioma tumors harboring PFC labeled
CAR T cells. Contiguous images show overlays of 19F (pseudo-color) and 1H (grayscale)
slices of right tumor receiving an intratumoral injection of 107 TATP-F68-PFC labeled CAR
T cells (a), and the left tumor with the same number of F68-PFC labeled CAR T cells (b).

123
Acknowledgements
Chapter 4, in full, contains text submitted for publication of the material. Hingorani
D*, Chapelin F*, Stares E, Adams E, Okada H, Ahrens E.T. Cell Penetrating Peptide
Functionalized Perfluorocarbon Nanoemulsions for Targeted Cell labeling and Enhanced
Fluorine-19 MRI Detection *Authors contributed equally. The authors acknowledge
technical support from Ms Hongyan Xu. The dissertation author was the primary
investigator and author of this paper.
References
1. Kircher, M.F., Gambhir, S.S. & Grimm, J. Noninvasive cell-tracking methods.
Nature reviews Clinical oncology 8, 677 (2011).
2. Jha, P., Golovko, D., Bains, S., Hostetter, D., Meier, R., Wendland, M.F. & Daldrup-
Link, H.E. Monitoring of natural killer cell immunotherapy using noninvasive
imaging modalities. Cancer research 70, 6109-6113 (2010).
3. June, C.H., O'Connor, R.S., Kawalekar, O.U., Ghassemi, S. & Milone, M.C. CAR T
cell immunotherapy for human cancer. Science 359, 1361-1365 (2018).
4. Townsend, M.H., Shrestha, G., Robison, R.A. & O'Neill, K.L. The expansion of
targetable biomarkers for CAR T cell therapy. J Exp Clin Cancer Res 37, 163 (2018).
5. Bonifant, C.L., Jackson, H.J., Brentjens, R.J. & Curran, K.J. Toxicity and
management in CAR T-cell therapy. Molecular Therapy-Oncolytics 3 (2016).
6. Chang, Z.L. & Chen, Y.Y. CARs: synthetic immunoreceptors for cancer therapy and
beyond. Trends in molecular medicine 23, 430-450 (2017).
7. Hartmann, J., Schüßler‐Lenz, M., Bondanza, A. & Buchholz, C.J. Clinical
development of CAR T cells—challenges and opportunities in translating innovative
treatment concepts. EMBO molecular medicine, e201607485 (2017).
8. Tarantal, A.F., Lee, C.C.I., Kukis, D.L. & Cherry, S.R. Radiolabeling human
peripheral blood stem cells for positron emission tomography (PET) imaging in
young rhesus monkeys. PloS one 8, e77148 (2013).

124
9. Wolfs, E., Struys, T., Notelaers, T., Roberts, S.J., Sohni, A., Bormans, G., Van Laere,
K., Luyten, F.P., Gheysens, O. & Lambrichts, I. 18F-FDG labeling of mesenchymal
stem cells and multipotent adult progenitor cells for PET imaging: effects on
ultrastructure and differentiation capacity. Journal of Nuclear Medicine, jnumed-112
(2013).
10. Wang, X., Rosol, M., Ge, S., Peterson, D., McNamara, G., Pollack, H., Kohn, D.B.,
Nelson, M.D. & Crooks, G.M. Dynamic tracking of human hematopoietic stem cell
engraftment using in vivo bioluminescence imaging. Blood 102, 3478-3482 (2003).
11. Xiong, T., Zhang, Z., Liu, B.-F., Zeng, S., Chen, Y., Chu, J. & Luo, Q. In vivo optical
imaging of human adenoid cystic carcinoma cell metastasis. Oral oncology 41, 709-
715 (2005).
12. Giepmans, B.N.G., Adams, S.R., Ellisman, M.H. & Tsien, R.Y. The fluorescent
toolbox for assessing protein location and function. science 312, 217-224 (2006).
13. Ahrens, E.T. & Bulte, J.W. Tracking immune cells in vivo using magnetic resonance
imaging. Nature reviews. Immunology 13, 755-763 (2013).
14. Ahrens, E.T., Helfer, B.M., O'Hanlon, C.F. & Schirda, C. Clinical cell therapy
imaging using a perfluorocarbon tracer and fluorine-19 MRI. Magnetic resonance in
medicine 72, 1696-1701 (2014).
15. Bouchlaka, M.N., Ludwig, K.D., Gordon, J.W., Kutz, M.P., Bednarz, B.P., Fain, S.B.
& Capitini, C.M. (19)F-MRI for monitoring human NK cells in vivo.
Oncoimmunology 5, e1143996 (2016).
16. Fink, C., Gaudet, J.M., Fox, M.S., Bhatt, S., Viswanathan, S., Smith, M., Chin, J.,
Foster, P.J. & Dekaban, G.A. (19)F-perfluorocarbon-labeled human peripheral blood
mononuclear cells can be detected in vivo using clinical MRI parameters in a
therapeutic cell setting. Scientific reports 8, 590 (2018).
17. Janjic, J.M. & Ahrens, E.T. Fluorine-containing nanoemulsions for MRI cell
tracking. Wiley interdisciplinary reviews. Nanomedicine and nanobiotechnology 1,
492-501 (2009).
18. Ku, M.C., Edes, I., Bendix, I., Pohlmann, A., Waiczies, H., Prozorovski, T., Gunther,
M., Martin, C., Pages, G., Wolf, S.A., Kettenmann, H., Uckert, W., Niendorf, T. &
Waiczies, S. ERK1 as a Therapeutic Target for Dendritic Cell Vaccination against
High-Grade Gliomas. Molecular cancer therapeutics 15, 1975-1987 (2016).
19. Somanchi, S.S., Kennis, B.A., Gopalakrishnan, V., Lee, D.A. & Bankson, J.A. In
Vivo (19)F-Magnetic Resonance Imaging of Adoptively Transferred NK Cells.
Methods in molecular biology 1441, 317-332 (2016).

125
20. Srinivas, M., Turner, M.S., Janjic, J.M., Morel, P.A., Laidlaw, D.H. & Ahrens, E.T.
In vivo cytometry of antigen-specific t cells using 19F MRI. Magnetic resonance in
medicine 62, 747-753 (2009).
21. Waiczies, H., Lepore, S., Janitzek, N., Hagen, U., Seifert, F., Ittermann, B., Purfurst,
B., Pezzutto, A., Paul, F., Niendorf, T. & Waiczies, S. Perfluorocarbon Particle Size
Influences Magnetic Resonance Signal and Immunological Properties of Dendritic
Cells. PLoS ONE 6 (2011).
22. Xander Staal, O.K., Mangala Srinivas in Fluorine in Life Sciences: Pharmaceuticals,
Medicinal Diagnostics, and Agrochemicals. (ed. F.R.L. Günter Haufe) (2019).
23. Khurana, A., Chapelin, F., Xu, H., Acevedo, J.R., Molinolo, A., Nguyen, Q. &
Ahrens, E.T. Visualization of macrophage recruitment in head and neck carcinoma
model using fluorine-19 magnetic resonance imaging. Magnetic resonance in
medicine 79, 1972-1980 (2018).
24. Ruiz‐Cabello, J., Barnett, B.P., Bottomley, P.A. & Bulte, J.W.M. Fluorine (19F)
MRS and MRI in biomedicine. NMR in Biomedicine 24, 114-129 (2011).
25. Lim, W.A. & June, C.H. The Principles of Engineering Immune Cells to Treat
Cancer. Cell 168, 724-740 (2017).
26. Lindgren, M., Hällbrink, M., Prochiantz, A. & Langel, Ü. Cell-penetrating peptides.
Trends in pharmacological sciences 21, 99-103 (2000).
27. Vives, E., Brodin, P. & Lebleu, B. A truncated HIV-1 Tat protein basic domain
rapidly translocates through the plasma membrane and accumulates in the cell
nucleus. Journal of Biological Chemistry 272, 16010-16017 (1997).
28. Jacoby, C., Temme, S., Mayenfels, F., Benoit, N., Krafft, M.P., Schubert, R.,
Schrader, J. & Flogel, U. Probing different perfluorocarbons for in vivo
inflammation imaging by 19F MRI: image reconstruction, biological half-lives and
sensitivity. NMR Biomed 27, 261-271 (2014).
29. Ahrens, E.T., Flores, R., Xu, H. & Morel, P.A. In vivo imaging platform for tracking
immunotherapeutic cells. Nature biotechnology 23, 983-987 (2005).
30. Johnson, L.A., Scholler, J., Ohkuri, T., Kosaka, A., Patel, P.R., McGettigan, S.E.,
Nace, A.K., Dentchev, T., Thekkat, P. & Loew, A. Rational development and
characterization of humanized anti–EGFR variant III chimeric antigen receptor T
cells for glioblastoma. Science translational medicine 7, 275ra222-275ra222 (2015).
31. Chapelin, F., Gao, S., Okada, H., Weber, T.G., Messer, K. & Ahrens, E.T. Fluorine-
19 nuclear magnetic resonance of chimeric antigen receptor T cell biodistribution in
murine cancer model. Scientific reports 7, 17748 (2017).

126
32. Ohno, M., Ohkuri, T., Kosaka, A., Tanahashi, K., June, C.H., Natsume, A. & Okada,
H. Expression of miR-17-92 enhances anti-tumor activity of T-cells transduced with
the anti-EGFRvIII chimeric antigen receptor in mice bearing human GBM
xenografts. J Immunother Cancer 1, 21 (2013).
33. Srinivas, M., Morel, P.A., Ernst, L.A., Laidlaw, D.H. & Ahrens, E.T. Fluorine-19
MRI for visualization and quantification of cell migration in a diabetes model.
Magnetic resonance in medicine 58, 725-734 (2007).
34. Howard, M.D., Hood, E.D., Greineder, C.F., Alferiev, I.S., Chorny, M. &
Muzykantov, V. Targeting to endothelial cells augments the protective effect of
novel dual bioactive antioxidant/anti-inflammatory nanoparticles. Molecular
pharmaceutics 11, 2262-2270 (2014).
35. Hu, S., Wang, T., Pei, X., Cai, H., Chen, J., Zhang, X., Wan, Q. & Wang, J.
Synergistic Enhancement of Antitumor Efficacy by PEGylated Multi-walled Carbon
Nanotubes Modified with Cell-Penetrating Peptide TAT. Nanoscale Res Lett 11, 452
(2016).
36. Hitchens, T.K., Liu, L., Foley, L.M., Simplaceanu, V., Ahrens, E.T. & Ho, C.
Combining perfluorocarbon and superparamagnetic iron-oxide cell labeling for
improved and expanded applications of cellular MRI. Magnetic resonance in
medicine 73, 367-375 (2015).
37. van Eeden, S.F., Klut Me Fau - Leal, M.A., Leal Ma Fau - Alexander, J., Alexander
J Fau - Zonis, Z., Zonis Z Fau - Skippen, P. & Skippen, P. Partial liquid ventilation
with perfluorocarbon in acute lung injury: light and transmission electron
microscopy studies.
38. Chapelin, F., Gao, S., Okada, H., Weber, T.G., Messer, K. & Ahrens, E.T. Fluorine-
19 nuclear magnetic resonance of chimeric antigen receptor T cell biodistribution in
murine cancer model. Scientific Reports 7 (2017).
39. Gonzales, C., Yoshihara, H.A., Dilek, N., Leignadier, J., Irving, M., Mieville, P.,
Helm, L., Michielin, O. & Schwitter, J. In-Vivo Detection and Tracking of T Cells
in Various Organs in a Melanoma Tumor Model by 19F-Fluorine MRS/MRI. PLoS
One 11, e0164557 (2016).
40. Ahrens, E.T., Young, W.B., Xu, H. & Pusateri, L.K. Rapid quantification of
inflammation in tissue samples using perfluorocarbon emulsion and fluorine-19
nuclear magnetic resonance. Biotechniques 50, 229-234 (2011).
41. Kadayakkara, D.K., Ranganathan, S., Young, W.B. & Ahrens, E.T. Assaying
macrophage activity in a murine model of inflammatory bowel disease using
fluorine-19 MRI. Lab Invest 92, 636-645 (2012).
42. Zhong, J., Narsinh, K., Morel, P.A., Xu, H. & Ahrens, E.T. In Vivo Quantification
of Inflammation in Experimental Autoimmune Encephalomyelitis Rats Using
127
Fluorine-19 Magnetic Resonance Imaging Reveals Immune Cell Recruitment
outside the Nervous System. PLoS One 10, e0140238 (2015).
43. Temme, S., Grapentin, C., Quast, C., Jacoby, C., Grandoch, M., Ding, Z., Owenier,
C., Mayenfels, F., Fischer, J.W., Schubert, R., Schrader, J. & Flogel, U. Noninvasive
Imaging of Early Venous Thrombosis by 19F Magnetic Resonance Imaging With
Targeted Perfluorocarbon Nanoemulsions. Circulation 131, 1405-1414 (2015).
44. Bulte, J.W.M. & Daldrup-Link, H.E. Clinical Tracking of Cell Transfer and Cell
Transplantation: Trials and Tribulations. Radiology 289, 604-615 (2018).
45. Grapentin, C.M., Friederike; Barnert, Sabine; A Süss, Regine; Schubert, Rolf;
Temme, Sebastian; Jacoby, Christoph; Schrader, Juergen; Flögel, Ulrich (2015).
46. Temme, S., Baran, P., Bouvain, P., Grapentin, C., Kramer, W., Knebel, B., Al-
Hasani, H., Moll, J.M., Floss, D., Schrader, J., Schubert, R., Flogel, U. & Scheller,
J. Synthetic Cargo Internalization Receptor System for Nanoparticle Tracking of
Individual Cell Populations by Fluorine Magnetic Resonance Imaging. ACS Nano
12, 11178-11192 (2018).
47. Girotti, A.W. Mechanisms of lipid peroxidation. Journal of free radicals in biology
& medicine 1, 87-95 (1985).
48. Schaich, K.M. Metals and lipid oxidation. Contemporary issues. Lipids 27, 209-218
(1992).
49. Kislukhin, A.A., Xu, H., Adams, S.R., Narsinh, K.H., Tsien, R.Y. & Ahrens, E.T.
Paramagnetic fluorinated nanoemulsions for sensitive cellular fluorine-19 magnetic
resonance imaging. Nature materials 15, 662 (2016).
50. Rho, J.S., E; Adams, S.R; Zhu, W; Ahrens, E.T (2019).
51. Fretz, M., Jin, J., Conibere, R., Penning, N.A., Al-Taei, S., Storm, G., Futaki, S.,
Takeuchi, T., Nakase, I. & Jones, A.T. Effects of Na+/H+ exchanger inhibitors on
subcellular localisation of endocytic organelles and intracellular dynamics of protein
transduction domains HIV–TAT peptide and octaarginine. Journal of controlled
release 116, 247-254 (2006).
52. Vives, E., Brodin P Fau - Lebleu, B. & Lebleu, B. A truncated HIV-1 Tat protein
basic domain rapidly translocates through the plasma membrane and accumulates in
the cell nucleus.
53. de la Fuente, J.M. & Berry, C.C. Tat peptide as an efficient molecule to translocate
gold nanoparticles into the cell nucleus.
54. Krafft, M.P. Fluorocarbons and fluorinated amphiphiles in drug delivery and
biomedical research. Adv Drug Deliv Rev 47, 209-228 (2001).

128
55. Krafft, M.P. & Riess, J.G. Perfluorocarbons: Life sciences and biomedical uses -
Dedicated to the memory of Professor Guy Ourisson, a true RENAISSANCE man.
J Polym Sci Pol Chem 45, 1185-1198 (2007).
56. Brooks, H., Lebleu, B. & Vivès, E. Tat peptide-mediated cellular delivery: back to
basics. Advanced drug delivery reviews 57, 559-577 (2005).
57. Mazel, M., Clair, P., Rousselle, C., Vidal, P., Scherrmann, J.-M., Mathieu, D. &
Temsamani, J. Doxorubicin-peptide conjugates overcome multidrug resistance. Anti-
cancer drugs 12, 107-116 (2001).
58. Fawell, S., Seery, J., Daikh, Y., Moore, C., Chen, L.L., Pepinsky, B. & Barsoum, J.
Tat-mediated delivery of heterologous proteins into cells. Proceedings of the
National Academy of Sciences 91, 664-668 (1994).
59. Torchilin, V.P., Levchenko, T.S., Rammohan, R., Volodina, N., Papahadjopoulos-
Sternberg, B. & D'Souza, G.G.M. Cell transfection in vitro and in vivo with nontoxic
TAT peptide-liposome–DNA complexes. Proceedings of the National Academy of
Sciences 100, 1972-1977 (2003).
60. Foged, C. & Nielsen, H.M. Cell-penetrating peptides for drug delivery across
membrane barriers. Expert opinion on drug delivery 5, 105-117 (2008).
61. Boisguerin, P., Redt-Clouet, C., Franck-Miclo, A., Licheheb, S., Nargeot, J., Barrère-
Lemaire, S. & Lebleu, B. Systemic delivery of BH4 anti-apoptotic peptide using
CPPs prevents cardiac ischemia–reperfusion injuries in vivo. Journal of controlled
release 156, 146-153 (2011).
62. Borsello, T., Clarke, P.G.H., Hirt, L., Vercelli, A., Repici, M., Schorderet, D.F.,
Bogousslavsky, J. & Bonny, C. A peptide inhibitor of c-Jun N-terminal kinase
protects against excitotoxicity and cerebral ischemia. Nature medicine 9, 1180
(2003).
63. Michiue, H., Eguchi, A., Scadeng, M. & Dowdy, S.F. Induction of in vivo synthetic
lethal RNAi responses to treat glioblastoma. Cancer biology & therapy 8, 2304-2311
(2009).
64. Yang, D., Sun, Y.-Y., Lin, X., Baumann, J.M., Dunn, R.S., Lindquist, D.M. & Kuan,
C.-Y. Intranasal delivery of cell-penetrating anti-NF-κB peptides (Tat-NBD)
alleviates infection-sensitized hypoxic–ischemic brain injury. Experimental
neurology 247, 447-455 (2013).
65. Direct Inhibition of delta-Protein Kinase, C.E.t.L.T.I.S.i.A.M.I.I., Bates, E., Bode,
C., Costa, M., Gibson, C.M., Granger, C., Green, C., Grimes, K., Harrington, R.,
Huber, K., Kleiman, N., Mochly-Rosen, D., Roe, M., Sadowski, Z., Solomon, S. &
Widimsky, P. Intracoronary KAI-9803 as an adjunct to primary percutaneous
coronary intervention for acute ST-segment elevation myocardial infarction.
Circulation 117, 886-896 (2008).

129
66. Cousins, M.J., Pickthorn, K., Huang, S., Critchley, L. & Bell, G. The safety and
efficacy of KAI-1678- an inhibitor of epsilon protein kinase C (epsilonPKC)-versus
lidocaine and placebo for the treatment of postherpetic neuralgia: a crossover study
design. Pain Med 14, 533-540 (2013).
67. Suckfuell, M., Lisowska, G., Domka, W., Kabacinska, A., Morawski, K., Bodlaj, R.,
Klimak, P., Kostrica, R. & Meyer, T. Efficacy and safety of AM-111 in the treatment
of acute sensorineural hearing loss: a double-blind, randomized, placebo-controlled
phase II study. Otology & neurotology 35, 1317-1326 (2014).
68. Suckfuell, M., Lisowska, G., Domka, W., Kabacinska, A., Morawski, K., Bodlaj, R.,
Klimak, P., Kostrica, R. & Meyer, T. Efficacy and safety of AM-111 in the treatment
of acute sensorineural hearing loss: a double-blind, randomized, placebo-controlled
phase II study. Otol Neurotol 35, 1317-1326 (2014).
69. Deloche, C., Lopez‐Lazaro, L., Mouz, S., Perino, J., Abadie, C. & Combette, J.M.
XG‐102 administered to healthy male volunteers as a single intravenous infusion: a
randomized, double‐blind, placebo‐controlled, dose‐escalating study. Pharmacology
research & perspectives 2, e00020 (2014).
70. Tatsumi, T., Huang, J., Gooding, W.E., Gambotto, A., Robbins, P.D., Vujanovic,
N.L., Alber, S.M., Watkins, S.C., Okada, H. & Storkus, W.J. Intratumoral delivery
of dendritic cells engineered to secrete both interleukin (IL)-12 and IL-18 effectively
treats local and distant disease in association with broadly reactive Tc1-type
immunity. Cancer research 63, 6378-6386 (2003).
71. Kennis, B.A., Michel, K.A., Brugmann, W.B., Laureano, A., Tao, R.H., Somanchi,
S.S., Einstein, S.A., Bravo-Alegria, J.B., Maegawa, S., Wahba, A., Kiany, S.,
Gordon, N., Silla, L., Schellingerhout, D., Khatua, S., Zaky, W., Sandberg, D.,
Cooper, L., Lee, D.A., Bankson, J.A. & Gopalakrishnan, V. Monitoring of
intracerebellarly-administered natural killer cells with fluorine-19 MRI. J
Neurooncol 142, 395-407 (2019).
72. Melero, I., Duarte, M., Ruiz, J., Sangro, B., Galofre, J., Mazzolini, G., Bustos, M.,
Qian, C. & Prieto, J. Intratumoral injection of bone-marrow derived dendritic cells
engineered to produce interleukin-12 induces complete regression of established
murine transplantable colon adenocarcinomas. Gene Ther 6, 1779-1784 (1999).
73. Ngwa, W., Irabor, O.C., Schoenfeld, J.D., Hesser, J., Demaria, S. & Formenti, S.C.
Using immunotherapy to boost the abscopal effect. Nature Reviews Cancer (2018).
74. van Schalkwyk, M.C.I., Papa, S.E., Jeannon, J.-P., Urbano, T.G., Spicer, J.F. &
Maher, J. Design of a phase I clinical trial to evaluate intratumoral delivery of ErbB-
targeted chimeric antigen receptor T-cells in locally advanced or recurrent head and
neck cancer. Human Gene Therapy Clinical Development 24, 134-142 (2013).

130
75. Triozzi, P.L., Khurram, R., Aldrich, W.A., Walker, M.J., Kim, J.A. & Jaynes, S.
Intratumoral injection of dendritic cells derived in vitro in patients with metastatic
cancer. Cancer 89, 2646-2654 (2000).
76. https://clinicaltrials.gov/ct2/show/NCT02271711 (accessed 04/30-19)
131
Chapter 5: Magnetic resonance imaging monitoring of in vivo intracellular oximetry
response to chimeric antigen receptor T cell immunotherapy against glioma
5.1. Introduction
Cancer is one of the leading causes of death worldwide. Despite unprecedented
investments, cancer therapy research remains arduous and prevalent clinical benefit remains
unfulfilled. Growing evidence suggests that the major obstacle for cancer therapy is the
tumor microenvironment. Tumor mechanisms of immunosuppression generate chronic
inflammation and hypoxia in its vicinity and results in increased tumor angiogenesis,
recurrence, and malignant progression1, 2.
In the recent years, cancer therapy efforts have been shared between efficient and
targeted tumor cell killing and hypoxia reduction2, 3. Adoptive cell therapy has emerged as
the fourth pillar of cancer therapy, offering specific eradication of hematological cancers.
Therapeutic cell engineering is now tackling with solid tumors, proving more challenging.
Roadblocks include tumor-induced immunosuppression, ineffective trafficking, poor tumor
penetration and persistence. Importantly, these characteristics may be predictive of
therapeutic outcome. Successful infiltration of therapeutic cells in tumors and subsequent
specific cytotoxic activity in vivo is expected to induce tumor cell apoptosis. We hypothesize
that cancer cell pO2 increase is an indirect consequence of apoptotic processes and that
imaging could provide real time readout of the effectiveness of emerging immunotherapeutic
strategies4.
Perfluorocarbons (PFC) exhibit weak molecular cohesion, enabling gas dissolution5-
7. This intrinsic property was exploited in the 1990’s8-10 to emulsify PFC into biocompatible
and injectable blood substitutes and breathing liquids11, 12. Gas dissolved in fluorinated

132
emulsions is not bound to the carrier but can be exchanged with the local environment13.
Dissolution of paramagnetic oxygen in PFC lowers the 19F spin-lattice relaxation time (T1)12,
14. T1 varies linearly with the absolute partial pressure of oxygen15 (pO2) and can be
calculated from a calibration curve.
Perfluoro-15-crown-5-ether (PCE) is a macrocyclic structure resulting in only one
resonance frequency at -92.5 ppm; conferring greater sensitivity and straightforward
quantification over other perfluorocarbons with complex spectra. PCE oil can be emulsified
into well-defined, stable nanoemulsions by means of emulsifiers11, specifically pluronic
surfactants16, 17. Such nanoemulsions are effective in labeling adherent or suspended cells by
simple addition to the culture media. Therefore, intracellular oxygen tension of PCE-labeled
cells can be calculated after in vivo administration.
In early studies, perfluorocarbon emulsion intravenous injection, followed by
fluorine magnetic resonance imaging (MRI), enabled vasculature imaging18-20 and tissue
oximetry measurement in vivo21-24. This method is nonetheless imperfect, since contrast
distribution throughout tissues of interest remains uneven. Kadayakkara et al. labeled glioma
cells with PCE emulsion prior to implantation and showed persistent tumor oxygenation
increase after chemotherapy treatment25. Zhong et al. showed that as few as tens of
thousands of cytotoxic T cells infiltrating CNS tumors could cause a significant spike in
tumor pO226. However, correlation between increased tumor oxygenation and apoptotic
processes has not been established to date.
Noninvasive monitoring of tumor pO2 levels during treatment can provide a
preclinical surrogate biomarker for the effectiveness of emerging immunotherapeutic
strategies and can be used to optimize therapeutic course and dosage4. We tested the

133
hypothesis that a measurable increase in tumor pO2 is commensurate with CAR T cell
apoptotic processes in a mouse model of sub-cutaneous glioblastoma (U87-EGFRvIII-Luc)
treated with human CAR T cells. Using 19F MRI/MRS, we measured the pO2 time-course in
flank glioma cells that were intracellularly labeled with PCE nanoemulsions and treated with
intravenously-infused CAR T cells.
5.2. Materials and methods
5.2.1. PCE formulation
The perfluorocarbon emulsion was gravimetrically prepared from perfluoro-15-
crown-5 ether (PCE, Exfluor, Round Rock, TX) and pluronic F68 to obtain a 5 weight
percent F68 emulsion. This ratio has been shown to yield optimal droplet size and
polydispersity index (PdI)27. In short, 1.25 g of PCE was added to 625 μl of 100 mg/ml F68
solution in a 10 ml glass vial (Wheaton, Millville, NJ) and vortexed 10 s. Water (5.45 ml)
was added and the solution was subsequently vortexed (10 s) and ultrasonicated (Omni
Ruptor 250 W, 30% power, 2 minutes, Omni International). The emulsion was then aspirated
with a 10 ml syringe and underwent 4 passages on a microfluidizer (Microfluidics) equipped
with a cooling coil and operating at 20K psi. The emulsion was immediately sterile filtered
on a 0.2 μm polyethersulfone membrane (PES, Millex, Ireland) into a sterile glass vial. A 7
μl aliquot was kept aside and diluted in water and transferred to a cuvette for dynamic light
scattering (DLS, Zetasizer Nano Z, Malvern, UK) measurement. Droplet size and
polydispersity index were acquired in triplicates.
Emulsion concentration was determined by diluting 30 μl of emulsion in 270 μl of
0.1 % sodium trifluoroacetate (TFA, Sigma Aldrich) in D2O (Acros Organics, Geel,

134
Belgium) into a 5 mm NMR tube (Wilman Labglass, Vineland, NJ). NMR quantification
was performed on a 400 MHz (9.4 Tesla) Bruker AVANCE III HD-NanoBay spectrometer
(Bruker, Inc., Billerica, MA) with: 17 s pulse, 32,000 FID points, 100 ppm spectral width,
32 averages, and a recycle delay of 15 s. On the acquired 19F NMR spectra, the TFA
reference peak registers at -76 ppm and PCE at -92.5 ppm. The 19F content of the
nanoemulsion is determined by calculating the ratio of the PCE peak integrated area to the
reference integral multiplied by the number of fluorine atoms in the TFA aliquot.
5.2.2. Human T cells and CAR transduction
Primary human T cells were enriched by Ficoll (Histopaque 1077, Sigma Aldrich, St
Louis, MO) gradient density centrifugation and Magnetic Assisted Cell Sorting (MACS,
Miltenyi Biotech Inc., Auburn, CA) from anonymous donor human blood (San Diego Blood
Bank, San Diego, CA). T cells were then activated with dynabeads human T-activator
CD3/CD28 (Gibco, Waltham, MA) and allowed to expand for 2 days in Roswell Park
Memorial Institute media (RPMI, Gibco) supplemented with 10% FBS and 100 units/ml of
recombinant human interleukin 2 (IL-2, Peprotech, Rocky Hill, NJ). For transduction, we
employed a vector for CAR specific to EGFR-vIII as described by Johnson et al.28. Detailed
protocol for CAR virus production and human T cell transduction is available elsewhere29.
Briefly, plasmids psPAX2, pMD2.G and pELNS-3C10CD28–41BBz were used for virus
production and 30 μl of virus yield with 3 μg/ml of Polybrene transfection agent (EMD
Millipore, Billerica, MA) was applied to T cells overnight.

135
5.2.3. Glioblastoma cells
A human glioblastoma multiform (U87-EGFRvIII-Luc) cell line overexpressing the
epidermal growth receptor variant III and the luciferase gene was kindly provided by Dr.
Okada (UCSF) and maintained in T75 flasks (Sigma) in RPMI medium (Gibco),
supplemented with 10% FBS.
5.2.4. Ex vivo cell labeling
For PCE labeling experiments, U87-EGFRvIII-Luc were plated at 90% confluence
(triplicates of 1106 cells in 1 ml in 6 well plate) and incubated overnight with different
concentrations ranging from 2.5 mg/ml to 20 mg/ml of PCE emulsion as described
elsewhere25. The absence of viability impairment due to intracellular PCE was confirmed by
Trypan Blue exclusion assay. The cells were washed 3 times in PBS before NMR
measurement of uptake or inoculation into the animal.
To measure the average PCE uptake, cells were counted, pelleted and resuspended
in 150 l lysis buffer (0.5% triton X in PBS) and transferred to a 5 mm NMR tube. Also, 50
l of 0.1% TFA in D2O was added to each tube and vortexed. NMR measurement and
quantification was performed as described above. The mean 19F/cell was calculated from the
19F content divided by the cell count in the sample.
5.2.5. Flow cytometry assays
Transduction efficacy of the T cells was confirmed by flow cytometry with a biotin-
SP-AffiniPure F(ab')2 fragment-specific goat anti-mouse antibody (Jackson Immuno

136
Research Laboratories, West Grove, PA) and a streptavidin-PE secondary (BD Pharmingen,
San Diego, CA). For in vivo experiments, a population of at least 70% CAR positive T cells
was used.
5.2.6. Murine model of subcutaneous glioblastoma
Animal protocols were approved by the University of California San Diego
Institutional Animal Care and Use Committee (IACUC). For in vivo experiments, an optimal
concentration of 20 mg/ml PCE was added overnight to U87-EGFRvIII-Luc or T cell media.
Female (N=15) SCID 6-8 weeks old mice (Jackson Laboratories, Bar Harbor, ME) received
subcutaneous unilateral flank tumor injection comprised of 5106 PCE-labeled glioma cells
in buffered 50% matrigel (Corning, Tewksbury, MA). Five days post-tumor inoculation (day
0 time point), mice were divided in three groups. Group 1 (N=5) received 2107 CAR T cells
injected intravenously (IV) in PBS. Group 2 (N=5) mice received the same number of naïve
T cells IV. A second control group (Group 3) remained untreated (N=5).
5.2.7. In vivo Bioluminescence imaging (BLI)
Longitudinal BLI was performed at day 0, 1, 3, 7 and 10 using an IVIS Spectrum
system (PerkinElmer, Waltham, MA). D-luciferin (Intrace Medical, Switzerland) was
administered intraperitoneally, at a dose of 150 mg/kg 10 minutes prior to imaging.
Anesthesia was induced with 2% isoflurane in an anesthesia box, and animals were then
transferred to the IVIS chamber. Field of view was adjusted to allow imaging of five animals
at once. Regions of interest (ROI) were defined as a circle encompassing the luminescent

137
signal from each tumor and the total flux (photons/s) was calculated using Living Image
Software (PerkinElmer).
5.2.8. MRI
Animal preparation
MRI was performed on same days as BLI. Mice were anesthetized with 2%
isoflurane in pure oxygen (1 L/min), transferred to the MRI bed and maintained on 1-1.5%
isoflurane. Mice were positioned prone on an MRI bed with legs extended caudally. Animal
vitals were monitored with an encoder receiver transmitter module (ERT Model 1030, SA
Instruments, Inc., Stony Brook, NY) via a pneumatic pillow sensor for respiration and a
rectal thermistor probe for temperature. Pulse oximetry was monitored with a MouseSTAT
Jr. oximeter (Kent Scientific). An inbuilt warm water circuit in the MRI bed and a small
animal heater (#770100, SA Instruments, Inc.) were used to maintain body temperature at
37 C. A reference tube with PCE nanoemulsion (1:20) diluted in 2% agarose was taped
beside the animal in the image field of view (FOV). MRI measurements were performed
with an 11.7 T Bruker BioSpec preclinical scanner (Bruker, Billerica, MA) with a dual-tuned
1H/19F birdcage volume coil (Bruker).
Anatomical and spectroscopy sequences for tumor pO2
The 19F images were acquired using a RARE (Rapid Acquisition with Relaxation
Enhancement) sequence with parameters TR/TE=400/23 ms, RARE factor 4, matrix 64×64,
FOV 28×28 mm2, slice thickness 1 mm, and 6 slices. The 1H anatomical images were also

138
acquired using the RARE sequence with TR/TE=1400/7.8 ms, RARE factor 2, matrix
256×256, FOV 30×30 mm2, slice thickness 1 mm, and 12 slices.
The 19F R1 values were measured using a point resolved spectroscopy (PRESS)
sequence, by defining a voxel encompassing the entire tumor mass (8×8×8 mm3). Twelve
TR values were used to measure the R1 relaxation rate, ranging between 0.1 and 6 s (total
acquisition time ~30 min).
Data analysis
19F images were manually thresholded for visualization purposes to remove
background noise and rendered in pseudo-color using ImageJ software30. Anatomically-
corresponding 1H images remained unaltered and were super-imposed to the fluorine images
with ImageJ. The tumor longitudinal fluorine signal was calculated based on the signal of a
standard external reference using the Voxel Tracker software (Celsense, Pittsburgh, PA).
The R1 of each individual tumor was calculated by integrating the 19F peak acquired at
different TR values, and the resulting values were fit using a three-parameter single
exponential equation in MNova 6.0.2 software (Mestrelab, Spain). The mean pO2 of the
tumor cells was then calculated using an established calibration curve25, 26.
5.2.9. Histological correlation
At the experimental endpoint, animals were euthanized by CO2 inhalation and tumors
were excised, embedded in optimal cutting temperature (OCT) compound (Sakura Finetek
USA, Inc., Torrance, CA) and stored at -80 °C. All tissues were cryosectioned (CM1950,
Leica Microsystems Inc., Buffalo Grove, IL) at 10 μm thickness. Sections were fixed with

139
4% paraformaldehyde, stained for T cells using FITC anti-human CD3 (UCHT1, 1:500
dilution, Biolegend), apoptotic cells using TMR red TUNEL (Roche) and nuclei using
Hoechst dye (#33342, 1:500 dilution, Thermo Fisher Scientific) and then mounted.
Fluorescence images were acquired on an Axiovert 40 CFL microscope (Zeiss, Thornwood,
NY) using a ×5 objective. Confocal images were acquired on a Leica SP5 2 confocal system
with a Leica DM 6000 CFS microscope and a ×63 immersion objective.
For direct cell counts in tumor, we used sections (two per tumor) stained against CD3
or TUNEL from three tumors of animals sacrificed at Day 3 post T cell infusion. We counted
T cells and apoptotic cells in six high power fields per slice (×63 magnification, 72 high
power fields total).
5.2.10. Statistical Analyses
All measurements are presented as mean standard error. Acceptance criteria for R1
measurement accuracy was defined as fit R2>0.995 and R1 standard error <0.05. A one-way
ANOVA along with unpaired T-tests with unequal variances were performed to compare
groups as a whole and by pairs respectively for bioluminescence, tumor volume and pO2
measurements. For ANOVAs, we used the Bonferroni correction for multiple comparisons,
thereby controlling the family-wise error rate at 5%. P-values less than 0.05 were considered
statistically significant. ANOVA results are expressed as an F-statistic and its associated
degrees of freedom and P-value.
For tumor pO2 measurements, we also used linear mixed effects (LME) models to
investigate differences in R1 between mice treated with CAR T cells and the two control
groups, i.e., mice treated with untransduced T cells and untreated mice. A separate model
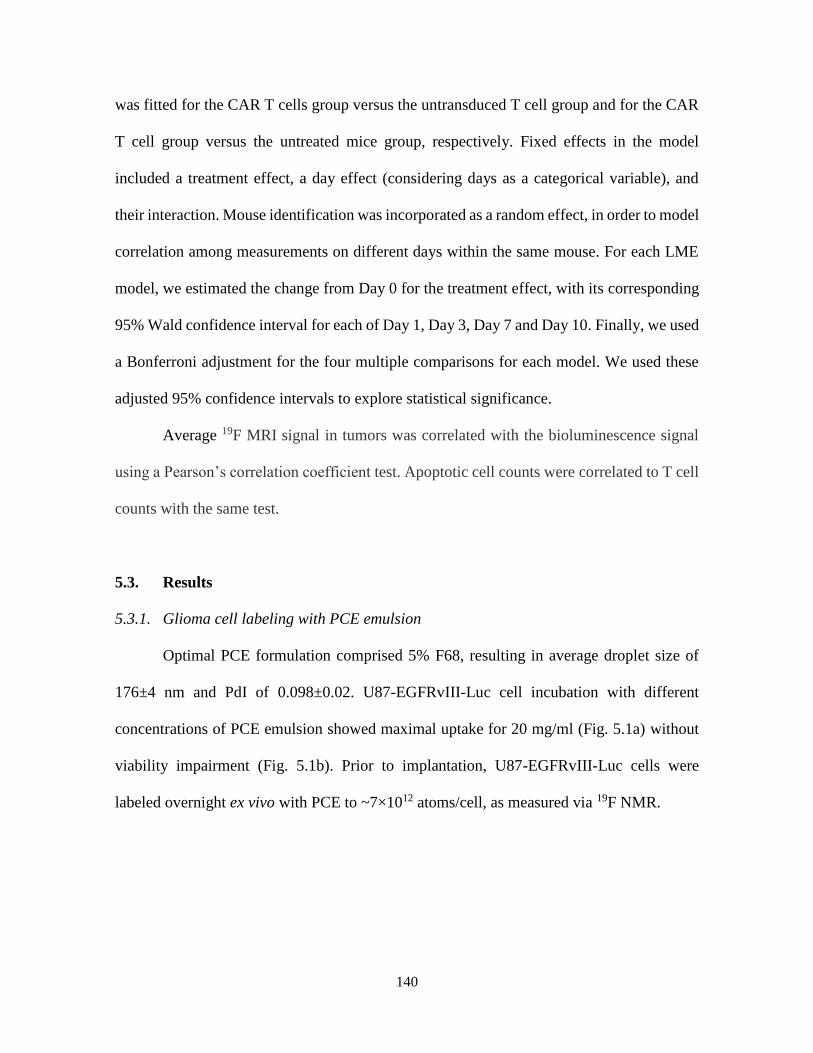
140
was fitted for the CAR T cells group versus the untransduced T cell group and for the CAR
T cell group versus the untreated mice group, respectively. Fixed effects in the model
included a treatment effect, a day effect (considering days as a categorical variable), and
their interaction. Mouse identification was incorporated as a random effect, in order to model
correlation among measurements on different days within the same mouse. For each LME
model, we estimated the change from Day 0 for the treatment effect, with its corresponding
95% Wald confidence interval for each of Day 1, Day 3, Day 7 and Day 10. Finally, we used
a Bonferroni adjustment for the four multiple comparisons for each model. We used these
adjusted 95% confidence intervals to explore statistical significance.
Average 19F MRI signal in tumors was correlated with the bioluminescence signal
using a Pearson’s correlation coefficient test. Apoptotic cell counts were correlated to T cell
counts with the same test.
5.3. Results
5.3.1. Glioma cell labeling with PCE emulsion
Optimal PCE formulation comprised 5% F68, resulting in average droplet size of
176±4 nm and PdI of 0.098±0.02. U87-EGFRvIII-Luc cell incubation with different
concentrations of PCE emulsion showed maximal uptake for 20 mg/ml (Fig. 5.1a) without
viability impairment (Fig. 5.1b). Prior to implantation, U87-EGFRvIII-Luc cells were
labeled overnight ex vivo with PCE to ~7×10¹² atoms/cell, as measured via 19F NMR.
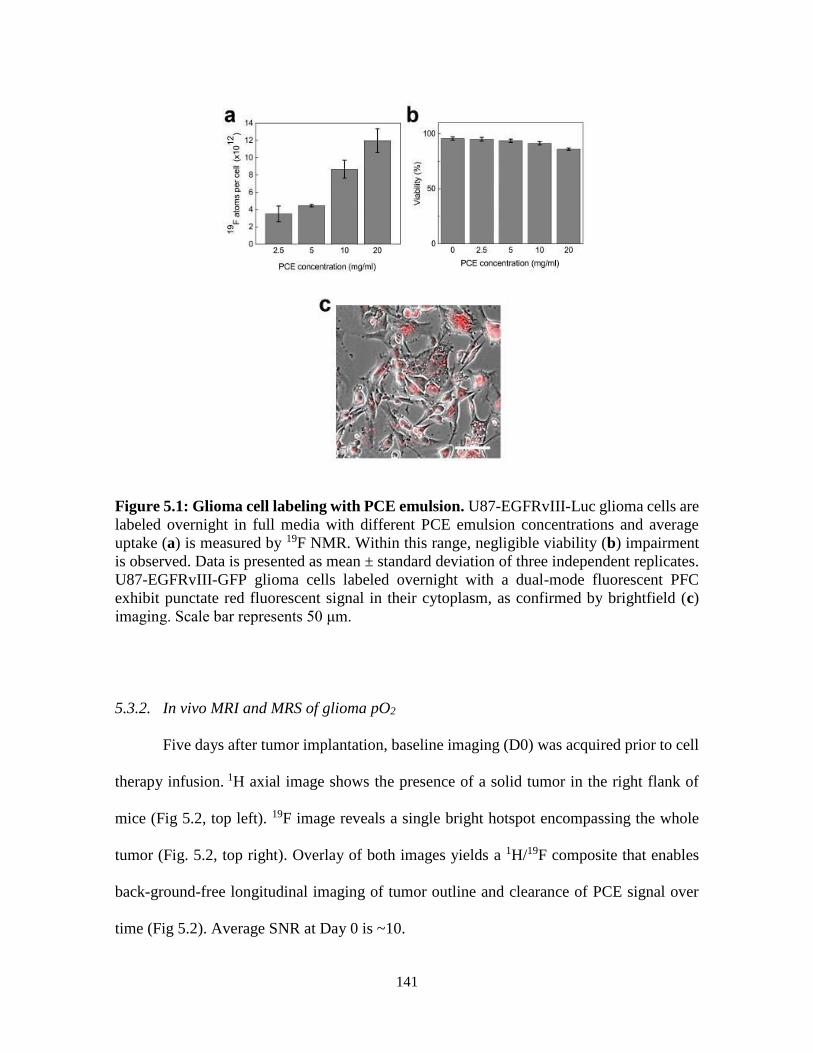
141
Figure 5.1: Glioma cell labeling with PCE emulsion. U87-EGFRvIII-Luc glioma cells are
labeled overnight in full media with different PCE emulsion concentrations and average
uptake (a) is measured by 19F NMR. Within this range, negligible viability (b) impairment
is observed. Data is presented as mean ± standard deviation of three independent replicates.
U87-EGFRvIII-GFP glioma cells labeled overnight with a dual-mode fluorescent PFC
exhibit punctate red fluorescent signal in their cytoplasm, as confirmed by brightfield (c)
imaging. Scale bar represents 50 μm.
5.3.2. In vivo MRI and MRS of glioma pO2
Five days after tumor implantation, baseline imaging (D0) was acquired prior to cell
therapy infusion. 1H axial image shows the presence of a solid tumor in the right flank of
mice (Fig 5.2, top left). 19F image reveals a single bright hotspot encompassing the whole
tumor (Fig. 5.2, top right). Overlay of both images yields a 1H/19F composite that enables
back-ground-free longitudinal imaging of tumor outline and clearance of PCE signal over
time (Fig 5.2). Average SNR at Day 0 is ~10.

142
Figure 5.2: In vivo 19F/1H MRI of human glioma showing labeled tumor cells at
different time points. Top left panel shows 1H axial image the mouse abdomen with flank
tumor (*). PCE-labeled glioma cells appear as a bright hotspot on 19F images, delineating
the tumor (top right panel, unthresholded). Both slices can be overlaid to yield a 1H/19F
composite image (1H/19F CAR T Day 0). Representative longitudinal overlays of CAR T
cell treated mouse show modestly growing tumor and decrease in 19F signal as a result of
cytotoxic efficacy of CAR therapy (Day 7, 10 panels). In comparison, mice receiving
untransduced T cells exhibit persistent fluorine signal at Day 10 and larger tumor volume.
Localized, 19F spectroscopy using the PRESS pulse sequence and a single voxel
encompassing a tumor was used to measure R1 values used to calculate pO2. The R1
measurements for each group are displayed as boxplots in Fig. 5.3a. The LME statistical
model demonstrates a significant difference in R1 between CAR T cell treated and
untransduced T cell treated mice (treatment effect: 0.23, adjusted 95% CI: 0.01, 0.45) and
untreated mice (treatment effect: 0.26, adjusted 95% CI: 0.05, 0.47) on Day 3 with respect
to Day 0. This corresponds to a transient spike in tumor pO2 three days after CAR T cell

143
infusion (R1=0.990.12 s-1, pO2=13425 mmHg) compared to untransduced T cells
(pO2=6120 mmHg) and control (pO2=409 mmHg, p = 0.026, Fig. 5.3a,b). There is no
significant pO2 change in the control groups at Day 3 (p=0.35). The average T1 (1/R1)
recovery curve three days post-treatment (Fig. 5.3c) shows evident T1 shortening in the CAR
T cell treated group compared to controls.
Figure 5.3: In vivo R1 and pO2 changes of glioma tumor after CAR T cell therapy. Panel (a) shows boxplots of raw data for each experimental group on days 0, 1, 3, 7, and 10.
The upper line, middle line and bottom line of each box indicates the 75th, 50th and 25th
percentile, respectively. The ends of the lines outside of the box show the maximum and the
minimum value of the data on that day, for that group. Panel (b) shows corresponding
longitudinal tumor pO2 measurements following delivery of CAR T cells, untransduced T
cells or untreated controls. A significant increase in tumor pO2 in CAR T cell-treated animals
is observed at day 3 post-infusion (*, p = 0.022). Panel (c) depicts average T1 (1/R1) recovery
for all groups at day 3 post-treatment.

144
These data suggest specific CAR T cell homing to the tumor tissue, presumably
initiating a target killing cascade, and altering intracellular pO2. Histological analyses of
tumor tissue at Day 3 confirms intracellular localization of PFC droplets and supports the
assumption that pO2 value measured is that of cancer cells (Figure 5.4), consistent with prior
observations25. By day 7, tumor oxygenation returned to baseline in the CAR T cell Group
(Fig. 5.3b).
Figure 5.4: Confirmation of intracellular localization of PCE nanoemulsion. Confocal
microscopy of tumor sections three days after CAR T cell treatment confirms intracellular
localization of PCE (red) emulsion in tumor cells expressing GFP (green). Nuclei are
stained with Hoescht (blue). Representative images of the tumor periphery (a) and tumor
center (b) are shown. Magnification is 63× and scale bar = 25 μm.

145
Figure 5.5: Tumor and fluorine atom reduction after CAR T cell therapy.
Bioluminescence intensity (a) shows twice lower radiance in CAR-treated animals
compared to controls at day 7 (*, p = 0.01). By day 10, the radiance gap widens, representing
significant tumor growth reduction in the CAR-treated group (*, p= 0.01). Total fluorine
content in the tumors was also evaluated longitudinally (b) in all three groups. Control
groups did not exhibit significant 19F signal loss over ten days, whereas CAR T treated group 19F signal decreased by ~60% in the same period (p=0.0012). Comparison of total fluorine
atoms to bioluminescence signal in tumors (c) showed strong negative correlation (Pearson’s
R: -0.85<R<-0.98) in all groups, suggesting that total fluorine signal is an indicator of
therapeutic efficacy.
Longitudinal bioluminescence measurements show significant tumor growth
reduction 7 days post CAR treatment with an average radiance of 4*1010 photons/sec, which
is half the amount measured for both naïve T-cell treated and untreated groups (p=0.012,
Fig. 5.4a).

146
Absolute fluorine content in the two control groups does not change significantly
over 10 days (p=0.1 and 0.2, Fig. 5.5b), whereas the CAR T cell treated tumors exhibit
significant fluorine signal loss (~ 60% signal loss, p=0.0012, Fig. 5.5b). Signal loss between
groups is significant as early as day 3 (p=0.03, Fig. 5.5b). There is a strong negative
correlation between absolute fluorine content in tumor and tumor radiance in all groups
(Pearson’s R: -0.85<R<-0.98, Fig. 5.5c). The PFC droplets are neither broken-down or
exocytosed by the cell31. Signal loss is therefore attributable to cancer cell death and
scavenging of cell contents by macrophages and subsequent uptake in the liver. A fluorine
signal decrease is thus an additional indicator of therapy efficacy, inversely proportional to
tumor growth.
5.3.3. Histological correlation
Histopathological staining of tumors three days post-therapeutic cell infusion
confirms the presence of numerous CAR T cells in the tumor, and to a lesser extent,
untransduced T cells (Fig. 5.6a). TUNEL staining reveals numerous apoptotic cells in the
vicinity of CAR T cells but few to no apoptotic cells are seen in untransduced T cell treated
tumors. Quantitatively, more than twice the number of CAR T cells infiltrate the tumor
compared to untransduced T cells (p=0.0002, Fig. 5.6b). CAR T cell treated tumor sections
exhibit numerous apoptotic tumor cells whereas few apoptotic cells are found in
untransduced T cell treated tumors, consistent with the magnetic resonance spectroscopy
results (p=0.0001, Fig. 5.6c). The number of CAR T cells present correlates to the number
of apoptotic cells per field (R=0.67) whereas untransduced T cells do not (R= -0.31, Fig.
5.6d). This indicates that CAR T cells exhibit specific cytotoxic activity towards cancer cells

147
in vivo. Untransduced T cells, despite reaching the tumor site, do not induce detectable
cancer cell apoptosis.
Figure 5.6: Histological correlation of T cell infiltration in tumor and resulting cell
death. Confocal microscopy (×64, a) of tumor tissues shows prominent CAR T cell
infiltrates (green) at day 2 after infusion in the proximity of apoptotic cells (red) as evidenced
by positive TUNEL stain. Untransduced T cell-treated tumor exhibit sparser T cells and
apoptotic signals. High power field (HPF) quantitation of T cell numbers (b) showed twice
as many CAR T cells per HPF on average compared to untransduced T cells (p=0.0002).
Numerous apoptotic cells (c) are found in CAR T cell treated tumors, contrary to
untransduced T cell treated tumors (p=0.0001) The number of CAR T cells present
correlated (d) to the number of apoptotic cells per field (R=0.67) whereas untransduced T
cells did not (R= -0.31).
5.4. Discussion
In this study, we show that 19F MRI enables real time quantitative measurement of
tumor cell death in response to CAR T cell therapy and associated intracellular tumor pO2

148
changes. Peak pO2 was observed three days post-infusion and suggests significant CAR T
cell infiltration and targeted tumor cell killing, compared to untransduced T cells. Loss of
fluorine signal in the tumor, indicative of cancer cell death, correlated to bioluminescence
measurements. In addition, CAR T cell numbers in the tumor at day 3 correlated to cancer
cell apoptosis, whereas untransduced T cells did not generate significant apoptosis.
Established methods of oxygenation measurement, such as electrodes or fiber-optic
sensors32, 33 require invasive insertion of probes in tumors, resulting in tissue and vascular
damage, inflammation, and partial tumor volume readout. Application of non-invasive MRI
methods for imaging of tumor oxygenation is desirable as it eliminates tissue injury and
measurement errors34. In addition, MRI does not involve radioactive isotopes. One can
indirectly measure blood oxygen level by measuring differences between hemoglobin and
paramagnetic deoxyhemoglobin (shortens the spin-spin relaxation time T2 of surrounding
protons). Blood oxygen level dependent (BOLD) MRI is qualitative with regards to pO2
determination, since BOLD changes reflect vasculature oxygenation and not intracellular
partial pressure. In addition, poorly vascularized tumors may not show a BOLD effect.
Dynamic contrast-enhanced (DCE) MRI relies on tumor perfusion to gage hypoxic tumors.
DCE MRI has been shown to correlate to Eppendorf probe measurements35 but not to
hypoxia (pimonidazole) staining or PET probes in few cancer types36-38.
Perfluorocarbon nanoemulsions dissolve oxygen resulting in a linear increase in the
19F spin-lattice relaxation rate (R1) with increasing pO2. PFC-labeling of tumor cells prior
injection enables uniform label distribution within the tumor and circumvents biases
resulting from local or systemic injection of tracer agent. Accurate pO2 determination also
entails control of the subject’s temperature and blood oxygenation level. In our experiments,

149
temperature of the animals was kept at 37 °C throughout the measurements. Both isoflurane
and injectable anesthesia doses were adjusted to maintain blood oxygen saturation of ~99%.
The pO2 measurements presented are in accordance with previously reported results
of tumor oxygenation changes in response to chemotherapy25, 26 and cytotoxic T-cells26.
Using similar methods, Kadayakkara et al.25 reported rat glioma cells basal pO2 of ~45
mmHg. Treatment with chemotherapeutic agent resulted in sustained pO2 increase to ~165
mmHg over 72 hours. Zhong et al.26 used a mouse model of glioma treated with Pmel-1
cytotoxic T cells and showed transient pO2 increase (~94 mmHg) two days post-infusion.
Similarly to Zhong et al., pO2 increase in the CAR T cell treated group was short-
lived, suggesting insufficient therapeutic cell homing to the tumor and possible CAR T cell
exhaustion or tumor immunosuppression39; all being perceived as important bottlenecks in
successful adoptive cell therapy. The persistence of 19F signal in the core of CAR-treated
tumors is also an indicator of low immune cell infiltration. Conversely, reduced 19F signal
in the periphery of CAR-treated tumors suggests active cytotoxic activity of CAR T cells
and PFC scavenging by local macrophages, followed by PFC clearance to liver tissue.
Therefore, remaining PFC-containing tumor cells may predominantly be located in the
hypoxic core and contribute to the decreased pO2 readout (Fig. 5.4). We also observed
significant fluorine signal loss in CAR T cell-treated tumors, whereas control groups did not
show significant reduction. These results correlated to bioluminescence measurements.
Therefore, fluorine MRI, combined with MRS measurement is an effective method to image
therapeutic efficacy.
A notable limitation of this technique is that it is only applicable to preclinical models
in its current form. Nonetheless, this method is not restricted to tumor models and could be

150
extended to more cell types, including immune cells and stem cells to monitor oxygen
changes in tissue engineering and other disease models. In addition, this method yields bulk
tumor pO2 number, although tumor aggressiveness and therapy efficacy assessments would
benefit from discrete information. Improvements in MRI sensitivity and data sampling
methods could enable pO2 map delineation. Considerable effort is underway to implement
fast imaging methods40-42.
Strategies to increase tumor penetration and oxygenation are paramount in
contemporary cancer research. Overall, we show that 19F MRI enables temporal
measurements of tumor cell oxygen tension in response to CAR T cell therapy. These data
support the view that 19F pO2 MRI and MRS can serve as a biomarker for cell-mediated
apoptosis in preclinical tumor models and provide insight into the modes of action of
engineered T cell immunotherapy against cancer.
Acknowledgements
Chapter 5, in full is currently being prepared for submission for publication of the
material. Chapelin F, Zhu W, Chen R, Lister D, Stares E, Messer K, Okada H, Ahrens E.T.
Magnetic resonance imaging monitoring of in vivo intracellular oximetry response to
chimeric antigen receptor T cell immunotherapy against glioma. The dissertation author was
the primary investigator and author of this paper.
151
References
1. Tatum, J.L., Kelloff, G.J., Gillies, R.J., Arbeit, J.M., Brown, J.M., Chao, K.S.,
Chapman, J.D., Eckelman, W.C., Fyles, A.W., Giaccia, A.J., Hill, R.P., Koch, C.J.,
Krishna, M.C., Krohn, K.A., Lewis, J.S., Mason, R.P., Melillo, G., Padhani, A.R.,
Powis, G., Rajendran, J.G., Reba, R., Robinson, S.P., Semenza, G.L., Swartz, H.M.,
Vaupel, P., Yang, D., Croft, B., Hoffman, J., Liu, G., Stone, H. & Sullivan, D.
Hypoxia: importance in tumor biology, noninvasive measurement by imaging, and
value of its measurement in the management of cancer therapy. Int J Radiat Biol 82,
699-757 (2006).
2. Teicher, B.A. A systems approach to cancer therapy. (Antioncogenics + standard
cytotoxics-->mechanism(s) of interaction). Cancer Metastasis Rev 15, 247-272
(1996).
3. Jain, R.K. Normalization of tumor vasculature: an emerging concept in
antiangiogenic therapy. Science 307, 58-62 (2005).
4. Matsuo, M., Matsumoto, S., Mitchell, J.B., Krishna, M.C. & Camphausen, K.
Magnetic resonance imaging of the tumor microenvironment in radiotherapy:
perfusion, hypoxia, and metabolism. Semin Radiat Oncol 24, 210-217 (2014).
5. Riess, J.G. Understanding the fundamentals of perfluorocarbons and perfluorocarbon
emulsions relevant to in vivo oxygen delivery. Artificial cells, blood substitutes, and
immobilization biotechnology 33, 47-63 (2005).
6. Hamza, M.A., Serratrice, G., Stebe, M.J. & Delpuech, J.J. Fluorocarbons as Oxygen
Carriers .2. An Nmr-Study of Partially or Totally Fluorinated Alkanes and Alkenes.
J Magn Reson 42, 227-241 (1981).
7. Hamza, M.A., Serratrice, G., Stebe, M.J. & Delpuech, J.J. Solute-Solvent
Interactions in Perfluorocarbon Solutions of Oxygen - an Nmr-Study. J Am Chem
Soc 103, 3733-3738 (1981).
8. Garrelts, J.C. Fluosol: an oxygen-delivery fluid for use in percutaneous transluminal
coronary angioplasty. DICP : the annals of pharmacotherapy 24, 1105-1112 (1990).
9. Ilgiavishute Ia, S., Zhukauskas, G., Dapshis, K.L. & Onishchenko, N.A. [The use of
perfluorocarbon emulsions for suppression of rejection reaction in kidney
allotransplantation]. Khirurgiia, 16-18 (1993).
10. Mason, R.P. Noninvasive Physiology - F-19 Nmr of Perfluorocarbons. Artif Cell
Blood Sub 22, 1141-1153 (1994).
11. Riess, J.G. Oxygen carriers ("blood substitutes")--raison d'etre, chemistry, and some
physiology. Chemical reviews 101, 2797-2920 (2001).

152
12. Delpuech, J.J., Hamza, M.A., Serratrice, G. & Stebe, M.J. Fluorocarbons as Oxygen
Carriers .1. Nmr-Study of Oxygen Solutions in Hexafluorobenzene. J Chem Phys 70,
2680-2687 (1979).
13. LoNostro, P., Choi, S.M., Ku, C.Y. & Chen, S.H. Fluorinated microemulsions: A
study of the phase behavior and structure. J Phys Chem B 103, 5347-5352 (1999).
14. Delpuech, J.J., Hamza, M.A. & Serratrice, G. Determination of Oxygen by a Nuclear
Magnetic-Resonance Method. J Magn Reson 36, 173-179 (1979).
15. Sotak, C.H., Hees, P.S., Huang, H.N., Hung, M.H., Krespan, C.G. & Raynolds, S. A
new perfluorocarbon for use in fluorine-19 magnetic resonance imaging and
spectroscopy. Magnetic Resonance in Medicine 29, 188-195 (1993).
16. Janjic, J.M., Srinivas, M., Kadayakkara, D.K.K. & Ahrens, E.T. Self-delivering
nanoemulsions for dual fluorine-19 MRI and fluorescence detection. J Am Chem Soc
130, 2832-2841 (2008).
17. Sharts, C.M., Reese, H.R., Ginsberg, K.A., Multer, F.K., Nielson, M.D., Greenburg,
A.G., Peskin, G.W. & Long, D.M. Solubility of Oxygen in Aqueous Fluorocarbon
Emulsions. J Fluorine Chem 11, 637-641 (1978).
18. Fishman, J.E., Joseph, P.M., Floyd, T.F., Mukherji, B. & Sloviter, H.A. Oxygen-
sensitive 19F NMR imaging of the vascular system in vivo. Magn Reson Imaging 5,
279-285 (1987).
19. Duong, T.Q., Iadecola, C. & Kim, S.G. Effect of hyperoxia, hypercapnia, and
hypoxia on cerebral interstitial oxygen tension and cerebral blood flow. Magn Reson
Med 45, 61-70 (2001).
20. Duong, T.Q. & Kim, S.G. In vivo MR measurements of regional arterial and venous
blood volume fractions in intact rat brain. Magn Reson Med 43, 393-402 (2000).
21. Dardzinski, B.J. & Sotak, C.H. Rapid tissue oxygen tension mapping using 19F
inversion-recovery echo-planar imaging of perfluoro-15-crown-5-ether. Magn Reson
Med 32, 88-97 (1994).
22. Hees, P.S. & Sotak, C.H. Assessment of changes in murine tumor oxygenation in
response to nicotinamide using 19F NMR relaxometry of a perfluorocarbon
emulsion. Magn Reson Med 29, 303-310 (1993).
23. van der Sanden, B.P., Heerschap, A., Simonetti, A.W., Rijken, P.F., Peters, H.P.,
Stuben, G. & van der Kogel, A.J. Characterization and validation of noninvasive
oxygen tension measurements in human glioma xenografts by 19F-MR relaxometry.
Int J Radiat Oncol Biol Phys 44, 649-658 (1999).

153
24. Shukla, H.P., Mason, R.P., Bansal, N. & Antich, P.P. Regional myocardial oxygen
tension: 19F MRI of sequestered perfluorocarbon. Magn Reson Med 35, 827-833
(1996).
25. Kadayakkara, D.K., Janjic, J.M., Pusateri, L.K., Young, W.B. & Ahrens, E.T. In vivo
observation of intracellular oximetry in perfluorocarbon-labeled glioma cells and
chemotherapeutic response in the CNS using fluorine-19 MRI. Magn Reson Med 64,
1252-1259 (2010).
26. Zhong, J., Sakaki, M., Okada, H. & Ahrens, E.T. In vivo intracellular oxygen
dynamics in murine brain glioma and immunotherapeutic response of cytotoxic T
cells observed by fluorine-19 magnetic resonance imaging. PloS one 8, e59479
(2013).
27. Janjic, J.M. & Ahrens, E.T. Fluorine-containing nanoemulsions for MRI cell
tracking. Wiley interdisciplinary reviews. Nanomedicine and nanobiotechnology 1,
492-501 (2009).
28. Johnson, L.A., Scholler, J., Ohkuri, T., Kosaka, A., Patel, P.R., McGettigan, S.E.,
Nace, A.K., Dentchev, T., Thekkat, P., Loew, A., Boesteanu, A.C., Cogdill, A.P.,
Chen, T., Fraietta, J.A., Kloss, C.C., Posey, A.D., Jr., Engels, B., Singh, R., Ezell,
T., Idamakanti, N., Ramones, M.H., Li, N., Zhou, L., Plesa, G., Seykora, J.T., Okada,
H., June, C.H., Brogdon, J.L. & Maus, M.V. Rational development and
characterization of humanized anti-EGFR variant III chimeric antigen receptor T
cells for glioblastoma. Science translational medicine 7, 275ra222 (2015).
29. Chapelin, F., Gao, S., Okada, H., Weber, T.G., Messer, K. & Ahrens, E.T. Fluorine-
19 nuclear magnetic resonance of chimeric antigen receptor T cell biodistribution in
murine cancer model. Scientific Reports 7, 17748 (2017).
30. Schneider, C.A., Rasband, W.S. & Eliceiri, K.W. NIH Image to ImageJ: 25 years of
image analysis. Nature methods 9, 671-675 (2012).
31. Ahrens, E.T., Flores, R., Xu, H. & Morel, P.A. In vivo imaging platform for tracking
immunotherapeutic cells. Nat Biotechnol 23, 983-987 (2005).
32. Braun, R.D., Lanzen, J.L., Snyder, S.A. & Dewhirst, M.W. Comparison of tumor
and normal tissue oxygen tension measurements using OxyLite or microelectrodes
in rodents. Am J Physiol Heart Circ Physiol 280, H2533-2544 (2001).
33. Seddon, B.M., Honess, D.J., Vojnovic, B., Tozer, G.M. & Workman, P.
Measurement of tumor oxygenation: in vivo comparison of a luminescence fiber-
optic sensor and a polarographic electrode in the p22 tumor. Radiat Res 155, 837-
846 (2001).
34. O'Hara, J.A., Hou, H., Demidenko, E., Springett, R.J., Khan, N. & Swartz, H.M.
Simultaneous measurement of rat brain cortex PtO2 using EPR oximetry and a

154
fluorescence fiber-optic sensor during normoxia and hyperoxia. Physiol Meas 26,
203-213 (2005).
35. Cooper, R.A., Carrington, B.M., Loncaster, J.A., Todd, S.M., Davidson, S.E., Logue,
J.P., Luthra, A.D., Jones, A.P., Stratford, I., Hunter, R.D. & West, C.M. Tumour
oxygenation levels correlate with dynamic contrast-enhanced magnetic resonance
imaging parameters in carcinoma of the cervix. Radiother Oncol 57, 53-59 (2000).
36. Hoskin, P.J., Carnell, D.M., Taylor, N.J., Smith, R.E., Stirling, J.J., Daley, F.M.,
Saunders, M.I., Bentzen, S.M., Collins, D.J., d'Arcy, J.A. & Padhani, A.P. Hypoxia
in prostate cancer: correlation of BOLD-MRI with pimonidazole
immunohistochemistry-initial observations. Int J Radiat Oncol Biol Phys 68, 1065-
1071 (2007).
37. Newbold, K., Castellano, I., Charles-Edwards, E., Mears, D., Sohaib, A., Leach, M.,
Rhys-Evans, P., Clarke, P., Fisher, C., Harrington, K. & Nutting, C. An exploratory
study into the role of dynamic contrast-enhanced magnetic resonance imaging or
perfusion computed tomography for detection of intratumoral hypoxia in head-and-
neck cancer. Int J Radiat Oncol Biol Phys 74, 29-37 (2009).
38. Swanson, K.R., Chakraborty, G., Wang, C.H., Rockne, R., Harpold, H.L., Muzi, M.,
Adamsen, T.C., Krohn, K.A. & Spence, A.M. Complementary but distinct roles for
MRI and 18F-fluoromisonidazole PET in the assessment of human glioblastomas. J
Nucl Med 50, 36-44 (2009).
39. Fesnak, A.D., June, C.H. & Levine, B.L. Engineered T cells: the promise and
challenges of cancer immunotherapy. Nat Rev Cancer 16, 566-581 (2016).
40. Hunjan, S., Zhao, D., Constantinescu, A., Hahn, E.W., Antich, P.P. & Mason, R.P.
Tumor oximetry: demonstration of an enhanced dynamic mapping procedure using
fluorine-19 echo planar magnetic resonance imaging in the Dunning prostate R3327-
AT1 rat tumor. Int J Radiat Oncol Biol Phys 49, 1097-1108 (2001).
41. Jordan, B.F., Cron, G.O. & Gallez, B. Rapid monitoring of oxygenation by 19F
magnetic resonance imaging: Simultaneous comparison with fluorescence
quenching. Magn Reson Med 61, 634-638 (2009).
42. Zhong, J., Mills, P.H., Hitchens, T.K. & Ahrens, E.T. Accelerated fluorine-19 MRI
cell tracking using compressed sensing. Magn Reson Med 69, 1683-1690 (2013).

155
Chapter 6: Conclusions
6.1. Summary of research
19F MRI is a promising tool for imaging of cellular therapeutics and holds great
potential for clinical applications. The work in this thesis aimed to further develop fluorine
imaging platforms to aid in assessment of T cell therapy biodistribution, persistence and
efficacy.
6.1.1. 19F NMR of CAR T cell biodistribution in murine cancer model
As a first step, we used commercially available perfluorocarbon nanoemulsion to
intracellularly label human T cells and CAR T cells. We confirmed that such label was
internalized by means of fluorescence and electron microscopy. We also demonstrated that
PFC label does not alter T cell viability, division rate and phenotype (defined by
CD3/CD4/CD8 expression) for at least 14 days post-labeling. In vitro co-culture assays
showed that cytotoxic activity of CAR T cells against glioma cells remained comparable in
PFC-labeled cells compared to unlabeled cells.
When infused into a murine cancer model, CAR T cell systemic infusion induced
significant tumor growth decline compared to untransduced T cell and untreated controls.
19F NMR measurement enabled T cell biodistribution quantification in intact tissues with
sensitivity limits of detection of order 103 T cells per sample. Tissue panel spectra analysis
demonstrated significantly higher CAR T cell homing to tumors and spleen compared to
untransduced T cells. In addition, CAR T cell persistence surpassed that of naïve T cells.

156
Histology high power field counts strongly correlated to the average NMR fluorine signal
measured in tumors.
These findings implement 19F NMR cytometry as a rapid and quantitative technique
to evaluate adoptive cell transfer biodistribution in intact tissues. This technique provides
unbiased quantification in samples. Overall, 19F NMR cytometry may accelerate the timeline
to evaluate new immunotherapeutic cell candidates by providing a straightforward method
to evaluate cell therapy biodistribution and cell fate.
6.1.2. TAT-functionalized PFC nanoemulsion for 19F cell tracking
For clinical relevance, T cell biodistribution needs to be monitored in vivo by 19F
MRI cytometry. The persistent bottleneck that remains for tracking of transferred T cells is
19F MRI sensitivity. T cells are inherently smaller and less phagocytic than most cell types,
limiting the amount of PFC they can hold. To address this, we designed functionalized
probes that carry a cell internalizing peptide (TAT) on their surface. We optimized the
formulation for maximal MR sensitivity gain and optimal droplet size and stability.
Biocompatibility was tested in T cells and labeling protocol was established to preserve cell
viability and cytotoxic activity. Addition of TAT as a co-surfactant in PFC emulsions
resulted in 8-fold increase in T cell labeling efficiency.
Signal enhancement in vivo was obtained by delivering CAR T cells pre-labeled with
TAT-conjugated PFC emulsions or control PFC emulsions intratumorally in mice bearing
bilateral flank tumors. Signal detected from TAT-labeled CAR T cells two hours post-
injection was eight times higher than that of contralateral tumor injected with PFC-labeled
CAR T cells, rendering MRI signal unambiguous. The correlation between fluorine atoms
157
measured in tumors and number of injected cells confirms accuracy of cell delivery and
persistence of the CAR T cells at the tumor site for at least several hours post injection.
This new probe may enable longitudinal imaging of the fate of T cells in vivo and
enable treatment optimization from real-time readout. Additional incorporation of metal ions
within the core of PFC emulsions may open up tremendous future opportunities for the MRI
cell tracking field and enable accelerated MRI acquisitions and the detection of sparser cell
populations in vivo.
6.1.3. In vivo monitoring of tumor pO2 in response to CAR T cell immunotherapy
PFC nanoemulsions may assist in indirect detection of adoptive cell therapy
cytotoxicity against cancer cells. Tumor cells can be labeled similarly to T cells with
perfluoro-crown-ether (PCE) probes in vitro before injection into the animal model. The
spin-lattice relaxation rate (R1) of PCE is linearly proportional to the oxygen concentration
in its close proximity, allowing for tissue oxygenation sensing. We explored the temporal
dynamics of tumor intracellular pO2 in our murine glioma model.
We showed that 19F MRI enables real-time quantitative measurement of tumor cell
death in response to CAR T cell therapy via a pO2 change. Peak pO2 was observed 3 days
post-infusion and suggests significant CAR T cell infiltration and targeted tumor cell killing,
compared to untransduced T cells. Loss of fluorine signal in the tumor, indicative of cancer
cell death, correlated to bioluminescence measurements. In addition, CAR T cell numbers
in the tumor at day 3 correlated to cancer cell apoptosis, whereas untransduced T cells did
not generate significant apoptosis. This indicates that CAR T cells exhibit specific cytotoxic

158
activity towards cancer cells in vivo. Untransduced T cells, despite reaching the tumor site,
do not induce detectable cancer cell apoptosis.
Overall, we showed that 19F MRI enables temporal measurements of tumor cell
oxygen tension in response to CAR T cell therapy. These data support the view that 19F pO2
MRI can serve as a surrogate biomarker for cell-mediated apoptosis and provide insights
into the modes of action of engineered T cell immunotherapy against cancer.
6.2. Limitations of infusing PFC labeled cells
Generally, with PFC labeled cells having a mitotic phenotype, cell division and
subsequent dilution of the intracellular label can potentially limit long-term studies of
itinerant cells and decrease the accuracy of cell quantification1. There is no evidence for
active exocytosis or degradation of the PFC droplets once internalized by viable cells. Death
of labeled cells can lead to dispersion of the reagent and thus a loss of 19F signal. Potentially,
the PFC droplets can also be transferred to macrophages that have engulfed dead cells. If a
large number of macrophages remain in a region of interest, quantification accuracy will
suffer. Importantly, the 19F signal diminishes at cell injection sites over time if the cells are
apoptotic, and this cell loss is accurately quantifiable in longitudinal scans2, 3, which is an
advantage over prior-art iron-oxide nanoparticle based cell tracking approaches4, 5.
Ultimately, clearance of PFC agents from the body occurs via uptake by cells of the RES,
particularly Kupffer cells of the liver, followed by lung exhalation6. In fact, the 19F liver
signal, and the effective number of cells represented by this value, can be used as a proxy to
calculate the dead cell fraction of the infused cell product1.

159
6.3. Future perspectives
Since its introduction in clinical practice in the 1980s, MRI has experienced
remarkable growth and development. But implementation of new clinical applications
comes with challenges both technical and logistical in nature. Often a key limitation of 19F
MRI probes is sensitivity. Unlike conventional 1H MRI, where the probe (water)
concentration (>100 Molar 1H) and thus sensitivity is high, 19F MRI is limited by the total
amount and distribution of fluorine atoms introduced into the subject’s tissue. The limits of
detection using 19F-based imaging ranges from ~103 to ~105 cells per voxel7. For a given
experiment, results depend on specific details, such as the PFC molecule and nanoemulsion
used, the cell type labeled, viability of cell culture and commensurate label uptake, image
acquisition methods, magnetic field strength, and the MRI detector configuration1, 2, 8, 9.
Looking forward, there are multiple, technical avenues for improving cell detection
sensitivity that are vigorously being investigated involving new probe design and data
acquisition methods10-12. One approach that we explored in Chapter 4, is to formulate
imaging probes with cell penetrating peptides (CPP) to increase cell delivery. Besides TAT,
numerous CPPs with diverse chemical and biological properties are being investigated13 for
drug or DNA delivery. Testing of alternate CPPs may reveal more efficient cell loading.
Another scheme is to exploit the properties of metals to reduce the 19F spin-lattice
relaxation time (T1) and increase 19F detection sensitivity by several folds. Our lab recently
developed two distinct fluorous-soluble metal chelate formulations. The first one, referred
to as FETRIS, (metallated with ferric tris-diketonate) enabled three-to fivefold sensitivity

160
enhancement compared to non metallated equivalent12. The second metallated
nanoemulsion, featuring salicylidene-tris(aminomethyl)ethane chelating agent
(SALTAME), achieved a sensitivity enhancement of four-fold on a 3 Tesla magnet.
Moreover, pulse programming offers great opportunity to improve the signal to noise
ratio per acquisition time. Techniques such as compressed sensing, involving both
acquisition modification and more efficient hardware, have been investigated for the past
decade, yielding accelerated scan times up to 8 folds14. Development of smarter quantitation
algorithms could also reduce post-processing burden. Combination of the three strategies
described above; cell penetrating peptides, metal chelates and compressed sensing sequences
may improve the sensitivity limits of 19F MRI by an order of magnitude and enable detection
of sparse cells in vivo.
Another avenue that is heavily investigated is the development of PFCs with different
chemical shifts to potentially generate multicolor fluorine MRI images by tagging different
cell subtypes. This would allow to visualize different cell therapy interactions and migration
in vivo. Such application has already been demonstrated for stem cell/progenitor cell tracking
in vivo 15. One could imagine labeling macrophages or dendritic cells in situ by intravenous
injection of a given PFC and transferring CAR T cells or TILs labeled ex vivo with a different
PFC to visualize their interaction in the lymph nodes or their biodistribution to the tumor.
This would enable further understanding of different meeting points and partner interactions
and migration patterns in vivo.
Finally, an exciting development of 19F MRI would be targeted in vivo labeling of
cell populations of interest. Numerous PET tracers and a few SPIOs have been investigated
to target specific cells or proteins. Only a couple targeted fluorine nanoemulsions have been

161
developed so far, likely due to the technical challenge it represents. Specific in vivo labeling
would require specific blood circulation time, relative ‘invisibility’ towards monocytes and
macrophages to avoid non-specific signals and sufficient targeting efficiency to visualize
positive signal on MR images. Nonetheless, some effort is being spent on theranostic
fluorine emulsions, to enable both imaging of the recipient cells and delivery of specific
drugs16, 17.
6.5. Clinical translation
19F MRI cell detection techniques are just beginning to be employed in clinical trials,
and feasibility has been established in a first-in-human clinical study3. An autologous DC
vaccine was labeled with a PFC nanoemulsion ex vivo and re-injected into colorectal cancer
patients intradermally. 19F MRI enabled visualization of injected DCs and longitudinal
persistence evaluation.
There are numerous checkpoints before one can use 19F MRI cell tracking for cell
therapies in the clinic. When engaging cell therapy regulatory agencies, such as the US Food
and Drug Administration (FDA), safety is the primary concern. Within the FDA, 19F labeled
combination cell products are regulated at the Center for Biologics Evaluation of Biologics
Research (CBER). Usage of a nonradioactive PFC, like 19F, is appealing due to its safety
profile and presence in several FDA-approved medicines18, as well as their approved use for
contrast-enhanced ultrasound. For cellular therapies, the release criteria for PFC labeled cell
batches, which is viewed as a combination product, should match the release criteria
162
expected for the unlabeled cell product3, such as total nucleated cell count, cell viability,
Gram stain, bacterial contamination and endotoxin quantification.
Post infusion, cell viability and anti-tumor efficacy of PFC labeled cells may also be
examined in preclinical studies as part of the investigational new drug (IND) application for
the cell therapy product. However, imaging results in rodent models of cellular
immunotherapy can have significant limitations and may not well reflect how the cell
product will behave in patients. Besides the obvious immunological dissimilarities,
particularly with immunodeficient xenograft models, typical total cell number doses infused
in ACT trials are vastly higher in human trials compared to mice (~1010 versus 106,
respectively). Dosing on a cell number/kg basis can help predict translation to clinical
dosing. However, because tumor size may be of similar order of magnitude in size in rodent
and humans, scaling the absolute number of therapeutic cells homing to patients’ tumors
may be difficult to predict.
As experience with PFC labeling of cell therapy products grows, additional
considerations may also be needed, for example, in the clinical batch scale-up of the labeling
process19 in specialized facilities. Furthermore, one could imagine having a cell therapy
product expanded at a third-party site with a PFC label incorporated, and then shipped as a
refrigerated or cryopreserved pre-labeled cell product; similar workflows are already in
place for unlabeled, FDA-approved DC and CAR T cell products for cancer patients. Routine
labeling of large cell batches can be engineered into a well-controlled process that can be
exportable to multi-site clinical trials. Additional logistical limitations to the development
of routine fluorine imaging include the fact that clinical scanners are most often equipped
for proton scans only. 19F MRI requires specialized detection coils and hardware

163
modifications for image acquisition, which are not currently available in most MRI centers,
but can be sourced by third parties.
In conclusion, cell labeling with perfluorocarbons is a well-controlled and validated
process that has been reproduced by numerous laboratories. The properties of labeled cells,
such as labeling levels and intracellular localization of PFC, are predictable based on
intrinsic phagocytic tendencies, physical cell size, high-level function in the body, and cell
activation status and health during the labeling process. Fluorine MRI enables noninvasive
monitoring of in vivo survival and behavior of therapeutic cells, as well as their indirect
effect on cancer cells. Overall, the use of 19F-based MRI cell detection of cell therapy
products in vivo is still in the early adaptor phase, but holds promise for overcoming
regulatory barriers and advancing a wide range of cell therapy trials for cancer.
Acknowledgments
Chapter 6, in part contains text as it appears in a manuscript published in JITC
entitled “Fluorine-19 MRI for detection and quantification of immune cell therapy for
cancer” Chapelin F, Capitini C, Ahrens E.T. The dissertation author was the primary
investigator and author of this paper.
References
1. Chapelin, F., Gao, S., Okada, H., Weber, T.G., Messer, K. & Ahrens, E.T. Fluorine-
19 nuclear magnetic resonance of chimeric antigen receptor T cell biodistribution in
murine cancer model. Scientific Reports 7 (2017).

164
2. Ribot, E.J., Gaudet, J.M., Chen, Y., Gilbert, K.M. & Foster, P.J. In vivo MR detection
of fluorine-labeled human MSC using the bSSFP sequence. International journal of
nanomedicine 9, 1731-1739 (2014).
3. Ahrens, E.T., Helfer, B.M., O'Hanlon, C.F. & Schirda, C. Clinical cell therapy
imaging using a perfluorocarbon tracer and fluorine-19 MRI. Magnetic resonance in
medicine 72, 1696-1701 (2014).
4. Khurana, A., Chapelin, F., Beck, G., Lenkov, O.D., Donig, J., Nejadnik, H., Messing,
S., Derugin, N., Chan, R.C., Gaur, A., Sennino, B., McDonald, D.M., Kempen, P.J.,
Tikhomirov, G.A., Rao, J. & Daldrup-Link, H.E. Iron administration before stem cell
harvest enables MR imaging tracking after transplantation. Radiology 269, 186-197
(2013).
5. Makela, A.V., Gaudet, J.M. & Foster, P.J. Quantifying tumor associated
macrophages in breast cancer: a comparison of iron and fluorine-based MRI cell
tracking. Sci Rep 7, 42109 (2017).
6. Castro, O., Nesbitt, A.E. & Lyles, D. Effect of a perfluorocarbon emulsion (Fluosol‐
DA) on reticuloendothelial system clearance function. American journal of
hematology 16, 15-21 (1984).
7. Ahrens, E.T. & Bulte, J.W. Tracking immune cells in vivo using magnetic resonance
imaging. Nature reviews. Immunology 13, 755-763 (2013).
8. Fink, C., Gaudet, J.M., Fox, M.S., Bhatt, S., Viswanathan, S., Smith, M., Chin, J.,
Foster, P.J. & Dekaban, G.A. (19)F-perfluorocarbon-labeled human peripheral blood
mononuclear cells can be detected in vivo using clinical MRI parameters in a
therapeutic cell setting. Sci Rep 8, 590 (2018).
9. Srinivas, M., Boehm-Sturm, P., Figdor, C.G., de Vries, I.J. & Hoehn, M. Labeling
cells for in vivo tracking using (19)F MRI. Biomaterials 33, 8830-8840 (2012).
10. Stares, E., Rho, J., Ahrens, E.T., Foster, P., Li, A. & Bartha, R. in Contrast Agents
for MRI: Experimental Methods 479-498 (The Royal Society of Chemistry, 2018).
11. Zhong, J., Mills, P.H., Hitchens, T.K. & Ahrens, E.T. Accelerated fluorine-19 MRI
cell tracking using compressed sensing. Magnetic resonance in medicine 69, 1683-
1690 (2013).
12. Kislukhin, A.A., Xu, H., Adams, S.R., Narsinh, K.H., Tsien, R.Y. & Ahrens, E.T.
Paramagnetic fluorinated nanoemulsions for sensitive cellular fluorine-19 magnetic
resonance imaging. Nature materials 15, 662-668 (2016).
13. Guidotti, G., Brambilla, L. & Rossi, D. Cell-Penetrating Peptides: From Basic
Research to Clinics. Trends Pharmacol Sci 38, 406-424 (2017).

165
14. Lustig, M., Donoho, D.L., Santos, J.M. & Pauly, J.M. Compressed sensing MRI.
Ieee Signal Proc Mag 25, 72-82 (2008).
15. Partlow, K.C., Chen, J., Brant, J.A., Neubauer, A.M., Meyerrose, T.E., Creer, M.H.,
Nolta, J.A., Caruthers, S.D., Lanza, G.M. & Wickline, S.A. 19F magnetic resonance
imaging for stem/progenitor cell tracking with multiple unique perfluorocarbon
nanobeacons. FASEB journal : official publication of the Federation of American
Societies for Experimental Biology 21, 1647-1654 (2007).
16. Liu, L., Bagia, C. & Janjic, J.M. The First Scale-Up Production of Theranostic
Nanoemulsions. Biores Open Access 4, 218-228 (2015).
17. Patel, S.K., Beaino, W., Anderson, C.J. & Janjic, J.M. Theranostic nanoemulsions
for macrophage COX-2 inhibition in a murine inflammation model. Clin Immunol
160, 59-70 (2015).
18. Ruiz-Cabello, J., Barnett, B.P., Bottomley, P.A. & Bulte, J.W.M. Fluorine (F-19)
MRS and MRI in biomedicine. Nmr in Biomedicine 24, 114-129 (2011).
19. O'Hanlon, C.F., Fedczyna, T., Eaker, S., Shingleton, W.D. & Helfer, B.M.
Integrating a 19F MRI Tracer Agent into the Clinical Scale Manufacturing of a T-
Cell Immunotherapy. Contrast Media & Molecular Imaging (2017).