
San Diego Regional Decarbonization ... - County of San Diego
529
0 San Diego Regional Decarbonization Framework DRAFT – NOT FOR CITATION March 2022
-
Upload
khangminh22 -
Category
Documents
-
view
1 -
download
0
Transcript of San Diego Regional Decarbonization ... - County of San Diego
0
San Diego Regional Decarbonization Framework
DRAFT – NOT FOR CITATION
March 2022

1
Table of Contents Introduction……………………………………………………………………………………………………………………………….4 Project Team………………………………………………………………………………………………………………………..……5 1. Study Framework…………………………………………………………………………………………………………..………7 1.1 Introduction…………………………………………………………………………………………………………………..…….7 1.2 Study Questions……………………………………………………………………………………………………………..….10 1.3 The Role of Pathways Planning……………………………………………………………………………………..……11 1.4 Notes on reading this report………………………………………………………………………………………..…….13 2. Geospatial Analysis of Renewable Energy Production…………………………………………………..……..15 2.1 Introduction…………………………………………………………………………………………………………………..…..16 2.2 State-Level Context………………………………………………………………………………………………..….........17 2.3 Data……………………………………………………………………………………………………………………………...…..18 2.4 Methods………………………………………………………………………………………………………………………..…..19 2.5 Results and Discussion…………………………………………………………………………………………………..…..36 2.6 Conclusion…………………………………………………………………………………………………………………….…..48 Appendix 2.A Site Suitability Criteria…………………………………………………………………………………..…..52 Appendix 2.B Downscaling Method………………………………………………………………………………………...55 Appendix 2.C Vegetation Types in San Diego with High CO2 Sequestration Potential…………..….56 Appendix 2.D List of Key Assumptions…………………………………………………………………………………..…58 Appendix 2.E List of Spatial Data Sources……………………………………………………………………………..….59 Appendix 2.F QGIS Processing Modeler………………………………………………………………………………..….60 Appendix 2.G Transmission Upgrade Options and Costs……………………………………………………..…..61 3. Accelerating Deep Decarbonization in the Transportation Sector…………………………………..……62 3.1 Introduction……………………………………………………………………………………………………………………….62 3.2 Regional Policy Context………………………………………………………………………………………………………63 3.3 Transportation Modeling & Emissions Forecasts………………………………………………………………..70 3.4 Decarbonization Strategies: Policy Pathways to Close the Emissions Gap…………………………..73 3.5 Key Actions…………………………………………………………………………………………………………………………89 3.6 Remaining Challenges and Gaps…………………………………………………………………………………………95 Appendix 3.A A table showing the comparison of SANDAG 2021 Regional Model (ABM2+) and EnergyPATHWAYS Model……………………………………………………………………………………………………….100 4. Decarbonization of Buildings………………………………………………………………………………………………103 4.1 Introduction……………………………………………………………………………………………………………………..104 4.2 Buildings in San Diego County………………………………………………………………………………………....105 4.3 Technologies and Fuels for Decarbonizing Building………………………………………………………....114 4.4 Pathways to Decarbonization of San Diego’s Buildings…………………………………………………....126 4.5 Gas Utility and Rate Impacts………………………………………………………………………………………......139
2
4.6 Key Policy Actions……………………………………………………………………………………..........................152 5. Natural Climate Solutions and Other Land Use Considerations…………………..........................159 5.1 Introduction………………………………………………………………………………………................................160 5.2 Natural and working lands’ negative emissions…………………................................................167 5.3 Agriculture and working lands…………………………………………………………..................................176 5.4 Blue carbon and sea level rise…………………………………………………………..................................182 5.5 Urban trees…………………………………………………………...............................................................187 5.6 Additional Natural Climate Solutions………………...................................................................190 5.7 Regional Natural Climate Solutions Policy Recommendations and Conclusions………………………………………………………….....................................................................192 Appendix 5.A Methods, data, and sources for carbon stock and flow data and sources…........202 Appendix 5.B Blue carbon methodology details and carbon value sources for section 5.5....…207 6. Employment Impacts through Regional Decarbonization Framework for the San Diego Region……………………………………………………………..........................................................................209 6.1 Overview of Job Creation Estimates…………..........................................................................210 6.2 Methodological Issues in Estimating Employment Creation…..............................................211 6.3 Job Creation Estimates……………………………...........................................................................214 6.4 Job Quality Indicators in Energy Demand and Supply Employment…..................................218 6.5 Job Contraction for Workers in Fossil Fuel-Based Industries……..........................................230 Appendix 6.A Employment Impacts of Geothermal Energy Projects for Imperial County…......241 Appendix 6.B Estimating San Diego County-Specific Employment…..........................................243 7. Key Policy Consideration for the San Diego Region ……..........................................................247 7.1 Introduction………..........................................................……..................................................248 7.2 Achieving Deep Decarbonization across San Diego: the Need for more Experimentation, Collaboration and Learning….............................................……...................................................249 7.3 Case Studies for Regional Coordination….............................................................................257 7.4 Institutional Structure Built for Learning and Adaptation….................................................264 7.5 Creating Followership: Acting at Home but Impacting Outside the Region…......................269 7.6 Conclusion …….............................................……....................................................................273 8. Local Policy Opportunity….............................................……....................................................277 8.1 Key Findings…….............................................……..................................................................280 8.2 Authority of Local Jurisdictions and Agencies to Influence and Regulate GHG Emissions.…282 8.3 Comparative Analysis of Climate Action Plans in the San Diego Region …...........................287 8.4 Scenario Analysis of GHG Impacts from CAPs in the San Diego Region….............................308 8.5 Decarbonize Transportation……............................................................................................316 8.6 Decarbonize Buildings………..................................................................................................359 8.7 Decarbonize the Electricity Supply……..................................................................................400 8.8 Natural Climate Solutions……….............................................................................................419
3
8.9 Other Limitations………………………………………………………………………………………........................436 8.10 Conclusion……………………………………………………………………………………...................................437 Appendix 8.A Assumptions for Estimating GHG Impact of Best CAP Commitment….................438 Appendix 8.B Supporting Material for Decarbonize Transportation Policy Assessment Identified in Chapter 3…………………………………………………………………………………………...................445 9. The San Diego Region as a Model ……………………………………………………………………………...........450 9.1 Purpose…………………………………………………………………………………………....................................450 9.2 Opportunities for Scaling Impact……………………………………………………………………………...........451 9.3 Planning Across Jurisdictions – Horizontal and Vertical Alignment…...................................453 Appendix 9.A Relevant US and Global Communities of Practice Lists….....................................457 10. Conclusion…………………………………………………………………………………………...............................462 Appendix A: Summary of Statewide Energy System Modeling..................................................465 Appendix B: Review of Authority for Local Jurisdictions and Agencies to Influence and Regulate GHG Emissions…………………………………………………………………………………………...............................480
4
Introduction Recognizing the need for a regional approach to addressing climate change, on January 27th, 2021, the San Diego County Board of Supervisors voted to create a Regional Decarbonization Framework. This framework is intended to inform policy-making in regional, county and city governments towards reducing greenhouse gas emissions in the San Diego region. It is separate from but complements ongoing climate action planning efforts by local governments, as well as regional planning in energy, transportation and land use. This study is the first step in positioning the region as a global leader in climate planning. It is authored by a team led by the School of Global Policy and Strategy at the University of California San Diego, working in collaboration with the Energy Policy Initiatives Center at the University of San Diego School of Law and other consultants with technical expertise in energy, transportation and building systems. The analysis employs energy systems modeling to guide sector-specific analyses in the geospatial aspects of electricity infrastructure, potential for natural climate solutions, gaps in transportation sector strategic plans, opportunities and challenges in the building sectors, and an analysis of impact of jobs during the transition to decarbonization. It also suggests an institutional framework to promote coordination and learning across jurisdictions in the region, and a local policy analysis that is the most comprehensive overview of Climate Action Plans in the region. It is the first study of its kind to quantify the magnitude of the challenge in achieving meaningful reductions in regional greenhouse gas emissions. This framework shows that even if all the municipalities in the region met their current climate commitments, we would fall far short of our goals in reducing planet-heating gases in the four major sectors of San Diego region’s economy. Each of us clearly need to do more individually, however, that is still not going to be enough. We need to build cross-sectoral coalitions among public and private sector stakeholders to meet our regional emissions goals through collective action. This calls for a paradigm shift in our local economy. The scale and pace of this effort will require partnerships between public and private sectors, particularly, business, labor, and environmental communities. Therefore, the County will conduct regional community gatherings, sector-focused public workshops, speaker series, direct engagement meetings and presentations, regional implementation convenings and pop-up community events to engage every community, learn and deliberate together about the key findings of this report, and mobilize all of us for collective action. We now know what more needs to be done collectively, and because we collaborate well in this region, our greener future is bright. Murtaza H. Baxamusa, PhD, AICP Program Manager for Regional Sustainability Land Use and Environment Group County of San Diego
5
Project Team Project Director Gordon C. McCord Director, SDG Policy Initiative School of Global Policy and Strategy, University of California San Diego (UC San Diego) Project Manager Elise Hanson, UC San Diego San Diego County Representatives Sarah Aghassi, Deputy Chief Administrative Officer, Land Use and Environment Group (LUEG) Murtaza Baxamusa, Program Manager for Regional Sustainability, LUEG Rebeca Appel, Program Coordinator, LUEG Nicole Boghossian Ambrose, Group Program Manager, LUEG
Chapter authors: Study Approach Ryan Jones, Evolved Energy Research Geospatial Analysis of Renewable Energy Production Emily Leslie, Montara Mountain Energy Joseph Bettles, UC San Diego Accelerating Deep Decarbonization in the Transportation Sector Katy Cole, Fehr & Peers Chelsea Richer, Fehr & Peers Eleanor Hunts, Fehr & Peers Natural Climate Solutions and other Land Use Considerations Elise Hanson, UC San Diego Emily Leslie, Montara Mountain Energy Decarbonization of Buildings Asa Hopkins, Synapse Energy Economics Philip Eash-Gates, Synapse Energy Economics Jason Frost, Synapse Energy Economics Shelley Kwok, Synapse Energy Economics
6
Jackie Litynski, Synapse Energy Economics Kenji Takahashi, Synapse Energy Economics Employment Impacts through Decarbonization in the San Diego Region Robert Pollin, PERI, University of Massachusetts Amherst Jeannette Wicks-Lim, PERI, University of Massachusetts Amherst Shouvik Chakraborty, PERI, University of Massachusetts Amherst Gregor Semieniuk, PERI, University of Massachusetts Amherst Key Policy Considerations for the San Diego Region Joseph Bettles, UC San Diego Gordon C. McCord, UC San Diego David G. Victor, UC San Diego Emily Carlton, UC San Diego Local Policy Opportunity Analysis Scott Anders, Energy Policy Initiatives Center, University of San Diego Nilmini Silva Send, Energy Policy Initiatives Center, University of San Diego Joseph Kaatz, Energy Policy Initiatives Center, University of San Diego Yichao Gu, Energy Policy Initiatives Center, University of San Diego Marc Steele, Energy Policy Initiatives Center, University of San Diego The San Diego Region as a Model Elena Crete, UN Sustainable Development Solutions Network (SDSN) Julie Topf, UN Sustainable Development Solutions Network (SDSN) Appendix A: Summary of Statewide Energy System Modeling Ryan Jones, Evolved Energy Appendix B: Review of Authority for Local Jurisdictions and Agencies to Influence and Regulate GHG Emissions Joe Kaatz, Energy Policy Initiatives Center, University of San Diego Acknowledgements: The RDF team thanks David Victor for his advisory role across the project, as well as Joseph Bettles, Tyler Spencer, Emily Carlton, and Elissa Bozhkov for research and editorial support.
7
1. Study Framework
Ryan Jones, Evolved Energy Research
Key Takeaways
● Regional and local decarbonization policies should be informed by detailed analyses of the energy, transportation, and land use sectors, and these should be consistent with a system-wide path to decarbonization at regional, state, and national scales.
● Sectoral analyses in this report are informed by the results of energy system modeling at a state and national level that outline pathways to net zero emissions, described in more technical detail in Appendix A.
● Technical pathway studies are valuable for identifying dead-end strategies; identifying key decision points; identifying commonalities in pathways under sensitivity analyses; and situating near-term policy targets with respect to long-term goals.
● Uncertainty necessitates an ongoing and iterative planning process, with periodic updating as new information becomes available and as progress, or lack thereof, toward goals is achieved.
1.1 Introduction
The Paris Agreement calls for “holding the increase in the global average temperature to well below 2°C above pre-industrial levels and pursuing efforts to limit the temperature increase to 1.5°C.”1 Following the scientific evidence and consensus around climate change, countries, states, and local jurisdictions around the world have begun adopting the goal of reaching carbon neutrality, or “net zero.” Executive Order B-55-18 directs California to reach such a target by 2045.
The RDF begins with the premise that regional and local policies should be informed by detailed analysis of the energy system consistent with a system-wide path to decarbonization at regional, state, and national scales. The RDF focuses on the energy system, defined as the total production and consumption of energy in the electric power, transportation, and buildings sectors. The intent is to produce pathways for the San Diego region that are consistent with national-level and state-level pathways to reach net zero carbon dioxide emissions from the energy system by 2045. By “net zero,” this report means that anthropogenic carbon dioxide emissions from the energy system equal anthropogenic carbon sequestration and therefore do not contribute net emissions to the atmosphere. We note from the outset that the energy system does not represent the totality of greenhouse gas flows; GHGs are emitted from other sectors not considered in this report (waste, land use sectors), and there is ongoing carbon sequestration in natural ecosystems (as we discuss in Chapter 5).
8
This Regional Decarbonization Framework (RDF) presents a science-based approach to help governments in the San Diego region plan for policies and investments to achieve emissions reductions consistent with this state target. The analytical approach consists of three main pieces. First, models of the whole energy system, both at national and state levels, are used to identify five technically and economically feasible pathways for achieving net zero emissions. These models are presented in this chapter and in Appendix A. Second, these results are used to guide detailed sector-level analyses for the San Diego region, presented in Chapters 2 through 5, to best follow these pathways. Third, there are two analyses of policy strategies. The first is an analysis of key policy considerations in the region and a discussion of the political frameworks that may be possible to foster regional collaboration to achieve deep decarbonization, which is presented in Chapter 7. Additionally, there is an analysis of current Climate Action Plan (CAP) commitments throughout the region as well as identification of local opportunities and the associated legal and jurisdictional authority to institute decarbonization strategies. These are presented in Chapter 8 and in Appendix B.
Due to the complexity of our energy and climate systems, many analytical approaches examine a single sector at a time, often in great detail, but do not explicitly consider interactions between sectors. With such an approach, there is a risk that the cumulative actions from each sector are insufficient, that there are actions unbalanced with respect to cost and/or effort, or that the interactive effects lead to unintended negative consequences (for example, multiple sectors decarbonizing through the use of biomass to create alternative fuels, like biomethane for buildings or waste-to-energy for the grid, leading to unsustainable reliance on the resource). To help avoid such an outcome, sectoral analyses in the RDF are informed by five pathways to net zero emissions identified by state and national-level models of the whole energy system. This systems-level pathways analysis was performed by Evolved Energy Research, using the EnergyPATHWAYS and RIO models, and is based on the methodology and data in an earlier, national-level pathways analysis by Williams et al. (2021),2 which also used these models. The modeling effort will hereafter be called the Evolved Energy Research (EER) model. For the RDF, modeling tools were updated for consistency with the 2021 EIA Annual Energy Outlook3 and specific zones were created for Northern and Southern California to aid in downscaling the insights from the U.S. at large. Methods, key assumptions, and results of energy system modeling are presented for the state-level in Appendix A and for the national-level in Williams et al. (2021).2 Importantly, in instances where the particular circumstances in the region differed from those at a state or national level, the San Diego specific insights were retained. Thus, the pathways for the larger geographic areas were used to inform the San Diego region’s pathways, but not to prescribe.
Guided by the energy system decarbonization pathways for California as a whole, pathways analysis within each sector in the RDF details what is needed (e.g., infrastructure investments,
9
local policy commitments, or policy action in other domains) for the San Diego region to be in alignment with a net zero emissions trajectory for California. Sector-level pathways are necessary because technical and political challenges vary by sector, and so too will a practical policy strategy. Of note, each sector is not expected to arrive at net zero emissions independently; rather, each sector is expected to work in conjunction with other sectors and California regions as an interconnected system to reach decarbonization goals.
In line with California’s commitments and with the California-wide energy system analysis, the RDF is guided by a system-wide technical pathway that achieves decarbonization by 2045 - the system-wide approach helps to ensure consistency of effort and overall success in reducing emissions, but is not a binding policy solution that informs what must be done in each sector. Thus, national, state, and local governments need to move in concert in their policies and investments in order to achieve decarbonization, given the interconnected nature of the energy system.
The following chapters of this report detail how the electricity, transportation, buildings sectors contribute to technical pathways for arriving at net zero emissions. The RDF focuses on these sectors because they are major contributors of greenhouse gases, and each contain policy levers relevant to county and city government. Additionally, the report demonstrates the GHG consequences of losing natural land cover, and evaluates the potential for a range of natural climate solutions in the region. The report also includes a quantitative analysis of the employment impacts of the decarbonization of the energy sector, given model inputs from the EER model. Analysis of the qualitative effects of decarbonization on labor markets, as well as a workforce development strategy, are detailed in a separate report titled “Putting San Diego County on the High Road: Climate Workforce Recommendations for 2030 and 2050” by Inclusive Economics, which is available at the County of San Diego’s Integrated Regional Decarbonization Framework website.i
This report does not set out to identify which, if any, of the pathways is the “right” pathway for the San Diego region because the best pathway is, at this moment, impossible to know. Instead, it shows multiple ways forward in order to elucidate the tradeoffs, decision points, risks, and synergies in decarbonization. This is a unique effort to chart out how to reduce carbon dioxide emissions in the region, and it aims to foster collaboration among various municipalities, promote active learning and experiments to test diverse ideas, and position the region to attract state and federal resources. Decarbonization will require that each level of government utilize policy levers within its respective jurisdiction, while also collaborating vertically and horizontally across jurisdictions to align long-term goals. The RDF provides policymakers,
i https://www.sandiegocounty.gov/content/sdc/sustainability/regional-decarbonization.html

10
private industry, and stakeholders in the San Diego region the information needed to chart a path forward, starting with policies necessary to reach interim 2030 targets. It also proposes a framework of regional institutional governance that emphasizes collaborative policy experimentation and review across governments, industries, and academia, with the understanding that such cooperation can allow goals, strategies, and policies to improve over time as lessons are learned and circumstances change.
The boundary for this study is the San Diego region, which is defined by the boundaries with Orange County, Imperial County, and Mexico as well as the boundary with state waters. Thus, some emissions sources and solutions were not considered because they were outside of the jurisdictional boundaries of the study. For instance, offshore wind infrastructure must necessarily be sited in either state or federal waters, so San Diego regional jurisdictions have no ability to authorize offshore wind projects. Another example is that San Diego has some of the busiest land border crossings in the world, which generates additional emissions, but this study only considered vehicle ownership and vehicular traffic patterns for vehicles registered as belonging to a San Diego resident because San Diego jurisdictions do not have control over transportation decarbonization methods that are implemented in Mexico.
1.2 Study Questions
The research team set out to answer two primary questions: (1) what changes are required to renewable energy infrastructure, patterns of energy use in transportation and buildings, and modes of transportation for the San Diego region to decarbonize consistent with the state’s goals; and (2) what policy actions must be taken at a local level for the region to achieve these changes?
It is taken as a given based on past modeling exercises that reaching net zero in California by 2045 is both possible and can be done so at manageable cost—indeed, monetary savings from air quality improvements or avoided adaptation cost are expected to be larger than mitigation costs. At the same time, the RDF recognizes that many policies necessary for reaching net zero emissions are controlled at the state or federal level and not by local governments.i The San Diego region can and should be a vocal advocate for these policies (e.g., federal tax incentives), but the content of what needs to be achieved in these other jurisdictions are not a focus in the study.
i For a larger discussion of the authority of local jurisdictions to decarbonize, see Chapter 8 (Local Policy Opportunity) and Appendix B of this report.

11
1.3 The Role of Pathways in Planning
The discussion of the role of pathways in planning below draws heavily from a recent report from the Commonwealth of Massachusetts.4 Rather than simply referring the reader to that report, we have reproduced part of that text here to highlight key ideas.
The RDF uses the term “pathway” to mean a blueprint for the energy and land systems that reach future GHG reduction targets. The term can refer to both a specific strategy and to a set of different possible blueprints (as in, “multiple pathways to deep decarbonization”). The term “pathway” was first used by the Deep Decarbonization Pathways Project (DDPP) in 20145 and was coined to capture the path dependency within different decarbonization strategies. While the physical transformations represented by these pathways are informed by economic, social, and political constraints, they should not be mistaken for the impacts of a specific policy or market intervention.
The study of long-term decarbonization pathways has been a growing trend after early success using them in California.6 Modeling such decarbonization pathways depends on the ability to represent the existing energy system with a high degree of accuracy. Significant effort goes into benchmarking and stress testing the models of current energy systems until researchers have a high degree of confidence that changes in inputs will produce meaningful outputs. After California, other states (Washington, New York) followed suit with their own pathways analyses. Pathways analysis has become an integral part of energy planning processes, and yet, because of the breadth of topics covered, and the time horizon analyzed, it is still a unique activity within state-level public policy processes and merits some clarification.
The most critical clarification is that pathways are not forecasts of what will happen. While the energy system physics and emissions accounting that underpin our models are well-established, projecting technological progress (particularly cost) and energy service demand has a mixed track record, even over time spans much shorter than 30 years. This means that selecting a single pathway as the basis for public policy is fraught because the assumptions that cause it to be a better option in the present may shift over time. Uncertainty necessitates an ongoing planning process, with periodic updating as new information becomes available and as progress, or lack thereof, toward goals is achieved. Further, uncertainties in these pathways support the need for a flexible framework that allows for integration and adaptation to meet continuously changing political and technological realities.

12
Rather than providing a prediction of the future, pathway studies are valuable for four reasons: ● Identifying and decreasing the risk of dead-end strategies; ● Identifying key decision points; ● Identifying commonalities in pathways under sensitivity analyses; ● Situating near-term policy targets with respect to long-term goals.
Infrastructure that produces, delivers, and consumes energy is capital intensive and has long lifetimes. This is illustrated in Figure 1.1, which shows the number of replacement cycles for common infrastructure types between now and mid-century.4 If a pathways analysis looked only 10 to 15 years ahead, as is typical in electric utility integrated resource plans, and decisions were made that would efficiently reduce emissions to hit near-term targets but were inconsistent with long-term goals, then those decisions would lock in higher emissions or increase costs due to necessitating early retirement. Thus, a 30-year pathways study is able to test a given decarbonization strategy against this backdrop of infrastructure lifetimes in order to understand whether an emissions dead-end will be encountered on a given path. Knowing the timing of key decision points can also help to avoid stranded assets.
Figure 1.1. Overview of the lifetimes of common energy consuming or producing infrastructure. A simplified overview of the lifetimes of common energy consuming or producing infrastructure are compared against the 30-year time period left to reach the net zero target. The black vertical lines delineate points of natural retirement, and the number of segments correspond to the number of replacement cycles between now and 2050. The lifetime of vehicles by location and duty-cycle. The lifetime of power plants and pipelines is longer than 30 years and thus no natural retirement is shown on this figure.
As mentioned, the future trajectories of many variables, including technology cost and performance projections, are highly uncertain. However, it is possible to develop ranges of values in which the high and low estimates have a high probability of encapsulating the eventual revealed value for any variable. Creating multiple pathways within each sector allows us to test the sensitivity of results to a range of input assumptions. The most useful result is not a precise blueprint embodied in any specific pathway, but is a framework identifying those
13
strategies that are common across all pathways, as well as the drivers of differences among pathways. As will be detailed later in this report, a set of strategies can be identified over the next 10 years that are common to all modeled pathways that successfully reach the net zero target. Finally, pathways studies can be valuable in near-term target settings. Back casting from a mid-century net zero energy system to the present allows the identification of certain milestones or benchmark values (often ranges) that are consistent with being on track to reach the long-term goals. Near-term targets and policy recommendations will be discussed in more detail in Chapter 7, Key Policy Considerations for the San Diego Region.
1.4 Notes on reading this report Readers of this revised report should be aware of the following:
● This draft report will be open to feedback and comment through May 31st, 2022. ● This report provides technical analyses and is meant to inform decision-making and
implementation plans, but it is neither a decision-making document nor an implementation plan.
● Throughout the report, we use the term “San Diego region” when referring to the geographic extent of the county, and “San Diego County” to refer to the county government.
● Readers interested in high-level findings and recommendations for an institutional framework to promote decarbonization are encouraged to read Chapter 7 on Key Policy Considerations for the San Diego Region. To inform the institutional structure and processes, Chapter 7 provides an overview of key decarbonization actions, areas of uncertainty, and County leverage points from each of the four sectors: land use, buildings, transportation, electric sector. The overview in Table 7.1 provides the basis of several takeaways that are used to inform a proposed institutional structure to support decarbonization implementation among the range of policy actors in the San Diego region.

14
Works Cited 1. UNFCCC. Paris Agreement to the United Nations Framework Convention on Climate Change.; 2015.
https://unfccc.int/files/meetings/paris_nov_2015/application/pdf/paris_agreement_english_.pdf 2. Williams JH, Jones RA, Haley B, et al. Carbon-Neutral Pathways for the United States. AGU Adv. 2021;
2(1):e2020AV000284. doi:10.1029/2020AV000284 3. Nalley, S. & LaRose, A. Annual Energy Outlook 2021 (AEO2021); 2021.
https://www.eia.gov/pressroom/presentations/AEO2021_Release_Presentation.pdf 4. Jones R, Haley B, Williams J, Farbes J, Kwok G, Hargreaves J. Energy Pathways to Deep Decarbonization: A
Technical Report of the Massachusetts 2050 Decarbonization Roadmap Study. Commonwealth of Massachusetts; 2020.
5. Deep Decarbonization Pathways Project. Pathways to Deep Decarbonization 2015 Report. SDSN - IDDRI; 2015. 6. Energy and Environmental Economics, Inc. (E3). California Air Resources Board (CARB) Scoping Plan. NEWS:
DISTRIBUTED ENERGY RESOURCES, ENERGY AND ENVIRONMENTAL POLICY, RENEWABLES, RESOURCE PLANNING; https://www.ethree.com/california-air-resources-board-carb-scoping-plan/; 2017.

15
2. Geospatial Analysis of Renewable Energy Production Emily Leslie, Montara Mountain Energy Joseph Bettles, UC San Diego
Key Takeaways
● This chapter identifies low-impact, high-quality areas for wind and solar development in the San Diego region and neighboring Imperial County.
● The region has sufficient available land area for wind and solar generation to approach a fully decarbonized energy system in line with the California-wide system model in Appendix A.
● However, approaching a 100% decarbonized energy system that also meets societal expectations and regulatory standards for reliability will require significant but uncertain investments in a suite of additional resources, including excess intermittent and flexible generation, storage, and demand-side management.
● This chapter informs decision-making by providing a series of site-selection scenarios that prioritize land value, ease of development, infill solar development plus rooftop solar, and environmental impact as well as proposing a strategy for addressing reliability.
● The significant solar and geothermal potential of neighboring Imperial County is a large potential resource for the San Diego region that may require upgrades to the transmission network.
● San Diego regional jurisdictions should coordinate with state agencies (CPUC Integrated Resource Planning team, CPUC Resource Adequacy team, CAISO Transmission Planning Process team, CAISO Local Capacity Requirements team) to ensure the reliability of the system.
16
2.1 Introduction
Decarbonization of the electric sector in the San Diego region will require substantial deployment of new renewable resources: 90% of the electricity in most decarbonization scenarios in the literature come from commercially mature renewable technologies such as wind and solar. Decisions on where to site wind and solar photovoltaic (hereafter solar) facilities can have significant impacts on the environment1 and require development of new and upgraded transmission infrastructure.2 In this chapter we use the modeled electricity demand from the Central Case of Evolved Energy Research (EER) modeli and identify low-impact, high-quality areas for wind and solar development in the San Diego region. We also compare the resource potential to the modeled 2050 demand forecast for a fully decarbonized economy in order to comment on magnitude and scale of anticipated supply and demand. This report also considers alternate site selection scenarios with increased power transfer between San Diego and Imperial counties, and scenarios of more low-impact candidate project area selection based on environmental protection, pecuniary land value, carbon sequestration potential, and developable land. We estimate the costs and capacity of prioritizing urban infill and rooftop solar. We discuss the potential co-benefits of rooftop and urban infill ground-mounted solar, including equity benefits such as local economy job creation and pollution reduction. Finally, we present least-cost actions in the near-term which are valid across site selection scenarios. The electric sector spatial analysis is intended to inform planning and deployment of renewable electricity capacity in the region based on a range of techno-economic and environmental variables, including cost of energy, environmental impacts, and resource availability.
The purpose of this analysis is to identify plausible near-term options, and to provide visualizations indicating what a range of possible future scenarios might look like. Current commercially available technologies are the primary focus (onshore wind, utility scale solar, rooftop solar, renewable energy development on brownfields, battery energy storage, and long-duration energy storage). We also consider how offshore wind because offshore wind development is outside local jurisdictional authority but would affect requirements for land-based renewables. Clean energy supply technologies which are exploratory but which have not yet demonstrated commercial success at the time of this writing are considered out-of-scope (for example small modular nuclear reactors, wave energy, bioenergy, waste-to-energy, and mechanical direct air capture of carbon). The rationale is to utilize limited planning resources for efforts that are considered achievable with a high degree of confidence, and to limit
i For more information on the macro energy modeling, see Appendix A.
17
exposure to uncertainty regarding cost, schedule, and technology performance. Additional technology types could be incorporated into the analysis if they became proven and scalable.
The geographic extent of this analysis is limited to San Diego county in order to focus on options within jurisdictional control of the County and the cities therein. One exception is that geographic analysis additionally includes adjacent Imperial County for some scenarios, because Imperial County is strongly electrically interconnected with San Diego.
Finally, it is important to note that the scenarios, results, and maps in this chapter are not recommendations. Instead, they are examples of how, under current land use, technology, and grid conditions, the San Diego region can produce enough renewable energy to meet the projected 2050 energy demand and thereby power other important decarbonization efforts, like fueling electric vehicles, public transit, and buildings. Additional scenarios demonstrate the methodology and current results of prioritizing different aspects of public interest, such as minimizing impacts to natural and working lands or minimizing legal and social barriers to renewable energy development. It is also important to note that all analyses are snapshots of the current regional resources, infrastructure, and available technologies. These inputs will change and the resulting maps, analyses, and results will also change. This chapter is meant to demonstrate flexible pathways methodology for energy decarbonization for consideration by decision-makers.
2.2 State-Level Context
2.2.1 State-level renewable energy and electric sector decarbonization targets
California's Renewable Portfolio Standard (RPS) program was established in 2002 by Senate Bill (SB) 1078 3 with the initial requirement that 20% of electricity retail sales must be served by renewable resources by 2017. The program was accelerated in 2015 with SB 350,4 which mandated a 50% RPS by 2030. SB 350 includes interim annual RPS targets with three-year compliance periods and requires 65% of RPS procurement to be derived from long-term contracts of 10 or more years. In 2018, SB 1005 was signed into law, which again increases the RPS to 60% by 2030 and requires all the state's electricity to come from carbon-free resources by 2045.
The California Public Utilities Commission (CPUC) implements and administers RPS compliance rules for California’s retail sellers of electricity, which include large and small investor-owned utilities (IOUs), electric service providers (ESPs) and community choice aggregators (CCAs). The California Energy Commission (CEC) is responsible for the certification of electrical generation

18
facilities as eligible renewable energy resources and adopting regulations for the enforcement of RPS procurement requirements of public owned utilities (POUs).6
2.2.2 State-level regulatory proceedings implementing targets outlined above
Senate Bill (SB) 3507 created Public Utilities Code Sections 454.51 and 454.52 which mandated the “Integrated Resource Plan” (IRP) proceeding at the CPUC.8 The IRP proceeding ensures that load serving entities (LSEs) meet targets that allow the electricity sector to contribute to California’s economy-wide greenhouse gas emissions reductions goals. To evaluate need, the Proceeding takes a 10-year-ahead look at the following:
● System needs (reliability needs of the overall electric system) ● Local needs (reliability needs specific to areas with transmission limitations) ● Flexibility needs (such as the resources needed to integrate renewables)
When needs are identified, the CPUC authorizes procurement in the form of a Commission Decision.
IRP modeling produces ten-year look-ahead portfolios, which are refreshed every two years to incorporate the latest LSE procurement status and plan information. The current “Preferred System Plan” is available online at the IRP website.9 The CPUC regularly submits IRP portfolios to the California Independent System Operator (CAISO), in order to enable the CAISO to perform grid power flow modeling and identification of future transmission upgrades which may be needed to accommodate high levels of renewable energy infrastructure expansion. This power flow modeling occurs in the CAISO Transmission Planning Process (TPP).10 The CPUC submits a document summarizing the ten-year look-ahead portfolios for TPP in a regular report, “Modeling Assumptions for TPP.”11 This document specifies high-resolution location and magnitude of resources of each type needed to meet state GHG targets for the electric sector. This information helps the state agencies and the LSEs work together iteratively toward common goals.
For the San Diego RDF, the CPUC IRP modeling data9 were used as a starting point to take a closer look at existing conditions and current development activity at the county level.
2.3 Data
2.3.1 Candidate Project Areas
To identify the resource potential of utility-scale solar and wind candidate project areas (CPAs) in San Diego and Imperial counties, several data sources were considered: Princeton Net Zero
19
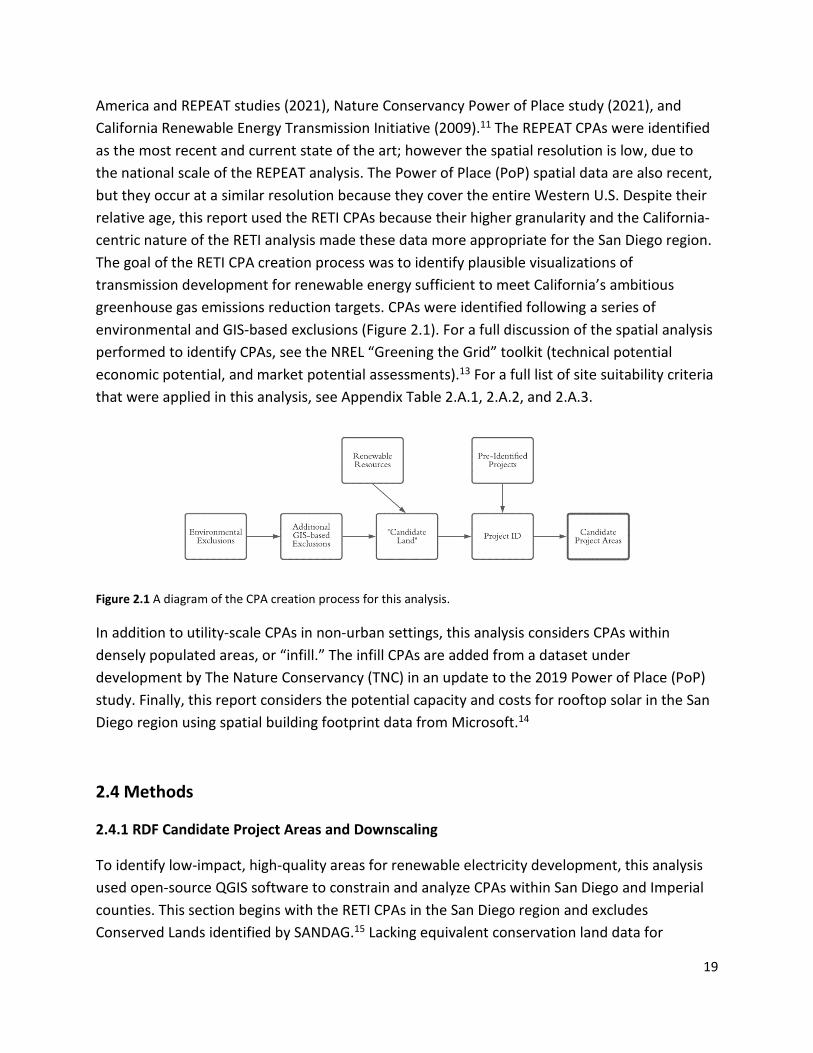
America and REPEAT studies (2021), Nature Conservancy Power of Place study (2021), and California Renewable Energy Transmission Initiative (2009).11 The REPEAT CPAs were identified as the most recent and current state of the art; however the spatial resolution is low, due to the national scale of the REPEAT analysis. The Power of Place (PoP) spatial data are also recent, but they occur at a similar resolution because they cover the entire Western U.S. Despite their relative age, this report used the RETI CPAs because their higher granularity and the California-centric nature of the RETI analysis made these data more appropriate for the San Diego region. The goal of the RETI CPA creation process was to identify plausible visualizations of transmission development for renewable energy sufficient to meet California’s ambitious greenhouse gas emissions reduction targets. CPAs were identified following a series of environmental and GIS-based exclusions (Figure 2.1). For a full discussion of the spatial analysis performed to identify CPAs, see the NREL “Greening the Grid” toolkit (technical potential economic potential, and market potential assessments).13 For a full list of site suitability criteria that were applied in this analysis, see Appendix Table 2.A.1, 2.A.2, and 2.A.3.
Figure 2.1 A diagram of the CPA creation process for this analysis.
In addition to utility-scale CPAs in non-urban settings, this analysis considers CPAs within densely populated areas, or “infill.” The infill CPAs are added from a dataset under development by The Nature Conservancy (TNC) in an update to the 2019 Power of Place (PoP) study. Finally, this report considers the potential capacity and costs for rooftop solar in the San Diego region using spatial building footprint data from Microsoft.14
2.4 Methods
2.4.1 RDF Candidate Project Areas and Downscaling
To identify low-impact, high-quality areas for renewable electricity development, this analysis used open-source QGIS software to constrain and analyze CPAs within San Diego and Imperial counties. This section begins with the RETI CPAs in the San Diego region and excludes Conserved Lands identified by SANDAG.15 Lacking equivalent conservation land data for
20
Imperial County, this analysis relies on the baseline RETI environmental exclusions (see Appendix 2.A Site Suitability Criteria). All utility-scale CPAs smaller than one square kilometer (km²) are excluded as unsuitable for development, whereas infill solar polygons of any size are retained. Areas of existing and planned solar and wind developments that total 266 Megawatts (MW) are removed (existing sites above 10MW were converted into files created from Google Satellite images and planned sites were digitized from EIR plant maps using the QGIS Georeferencer tool). To divide the CPAs into developable sites, a grid of 4 km² for solar and 36 km² for wind is overlaid on the sites. Using power density assumption of 30 MW per km² (MW/km²) for solar16 and 2.7 MW/km² for wind,17 CPAs that produce roughly 100 MW each are created, which is a typical capacity for project modeling. Finally, as utility-scale solar provides higher energy density per km², for all areas of overlap, solar is prioritized over wind and utility-scale over infill polygons.
The total annual electricity generation for each CPA polygon is identified using the formula below:
𝑃𝑃𝑃𝑃𝑃𝑃𝑃𝑃𝑃𝑃 𝑑𝑑𝑃𝑃𝑑𝑑𝑑𝑑𝑑𝑑𝑑𝑑𝑦𝑦 ∗ 𝑎𝑎𝑃𝑃𝑃𝑃𝑎𝑎 ∗ 𝑐𝑐𝑎𝑎𝑐𝑐𝑎𝑎𝑐𝑐𝑑𝑑𝑑𝑑𝑦𝑦 𝑓𝑓𝑎𝑎𝑐𝑐𝑑𝑑𝑃𝑃𝑃𝑃 ∗ 8760 (ℎ𝑃𝑃𝑜𝑜𝑃𝑃𝑑𝑑 𝑑𝑑𝑑𝑑 𝑎𝑎 𝑦𝑦𝑃𝑃𝑎𝑎𝑃𝑃) = 𝑎𝑎𝑑𝑑𝑑𝑑𝑜𝑜𝑎𝑎𝑎𝑎 𝑔𝑔𝑃𝑃𝑑𝑑𝑃𝑃𝑃𝑃𝑎𝑎𝑑𝑑𝑑𝑑𝑃𝑃𝑑𝑑
The nameplate capacity, or expected output, is calculated using the power density assumptions stated above. The annual generation in MW hours (MWh) is calculated for each CPA polygon by first multiplying the hours in a year (8,760 hours) and a given capacity factor, or percentage of time when the site is expected to produce electricity. For utility-scale solar, the capacity factor is assumed to be equal to the fixed-tilt solar value in the urban areas, and the tracking value in non-urban areas, where there is more likely to be larger developments on open land suitable for less-dense tracking technology. To identify urban areas, the 2019 US Census Urban areas dataset was used.18
For brownfield solar and wind, data from the USEPA “Repowering America” initiative are used. RE-Powering America’s Land is an EPA initiative that encourages renewable energy development on current and formerly contaminated lands, landfills, and mine sites when such development is aligned with the community’s vision for the site.19 For most sites, the available data include an estimated magnitude of the resource potential. For sites where there is no estimated resource potential, a generic value of 5 MW is assumed.
For offshore wind, data from the Princeton REPEAT study are used.20
For wave energy, data from the EPRI study “Mapping and Assessment of the United States Ocean Wave Energy Resource”21 are used. The total available wave energy resource along the outer continental shelf (notional 200 m depth contour) for the Southern California region is 43 TWh per year. The technically recoverable energy for this resource is 68%. This results in 29 TWh technically recoverable energy (assuming 15 MW/km packing density). The economically

21
viable wave resource potential for the San Diego region is unknown, and thus has not been incorporated into the scenario analysis, but their candidate project areas are shown for context. Wave and offshore wind energy technologies could be incorporated into the final scenarios if data become available, commercially viable, and scalable.
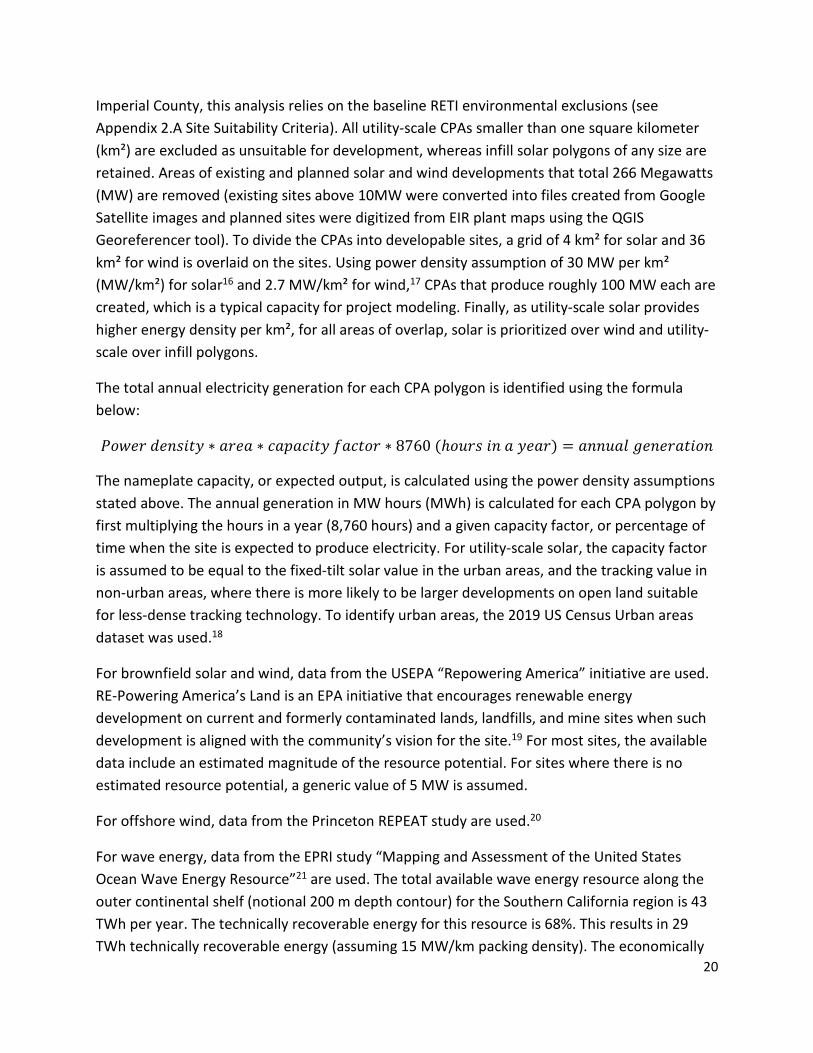
This analysis compares the estimated resource potential of renewables with the forecasted electricity demand for the San Diego region in 2050. Forecasted demand is based on the EER model, where the forecasted demand for Southern California is downscaled to San Diego by applying the percentage of Southern California population in San Diego (13.75%). Next, existing / planned wind and solar generation within the San Diego region is accounted for. Data from the EPA’s EIA-860 Form22 was used to find 470 MW of existing / planned wind and solar capacity. Excluding the 470 MW from the downscaled electricity demand, a balance of 49,979 gigawatt hours (GWh) of electricity generation is needed to achieve a 100% renewable target. Shown in Table 2.1, the total potential utility-scale and infill annual generation from wind and solar CPAs within the San Diego region is 67,062 GWh, or 17,083 GWh above forecasted demand. Figure 2.2 shows the relative capacities of solar and wind with and without infill compared to the estimated demand. Solar resources account for more than 80% of overall renewable resource potential in the region.
2.4.2 CPA cost estimates
To arrive at an estimate of the wholesale cost of electricity for utility-scale CPAs, the levelized cost of energy (LCOE), or the adjusted cost of electricity production per MWh, is calculated. Calculations first add the solar and wind plant capital cost and the costs of interconnection to the grid. The plant capital cost is based on a capital expenditure cost assumption for utility-scale solar (1,599 $/kW) and wind (1,556 $/kW) from NREL.23 The interconnection cost is based on the distance to the nearest substation and a transmission cost assumption of 2,948 $/MW-mile from the NREL ReDS model.24 In these calculations, a substation dataset from DHS25 is used and the Euclidian distance to the nearest substation is calculated to approximate the interconnection distance. The estimation of annual payments is based on a capital recovery factor of 7.36%.26 The LCOE is then calculated using the formula below to find the ratio of payments to generation, or the wholesale cost per MWh of electricity.
(𝑐𝑐𝑎𝑎𝑐𝑐𝑑𝑑𝑑𝑑𝑎𝑎𝑎𝑎 + 𝑑𝑑𝑑𝑑𝑑𝑑𝑃𝑃𝑃𝑃𝑐𝑐𝑃𝑃𝑑𝑑𝑑𝑑𝑃𝑃𝑐𝑐𝑑𝑑𝑑𝑑𝑃𝑃𝑑𝑑) ∗ 𝑐𝑐𝑎𝑎𝑐𝑐𝑑𝑑𝑑𝑑𝑎𝑎𝑎𝑎 𝑃𝑃𝑃𝑃𝑐𝑐𝑃𝑃𝑟𝑟𝑃𝑃𝑃𝑃𝑦𝑦 𝑓𝑓𝑎𝑎𝑐𝑐𝑑𝑑𝑃𝑃𝑃𝑃𝑎𝑎𝑑𝑑𝑑𝑑𝑜𝑜𝑎𝑎𝑎𝑎 𝑔𝑔𝑃𝑃𝑑𝑑𝑃𝑃𝑃𝑃𝑎𝑎𝑑𝑑𝑑𝑑𝑃𝑃𝑑𝑑
= 𝐿𝐿𝑃𝑃𝑟𝑟𝑃𝑃𝑎𝑎𝑑𝑑𝐿𝐿𝑃𝑃𝑑𝑑 𝑐𝑐𝑃𝑃𝑑𝑑𝑑𝑑 𝑃𝑃𝑓𝑓 𝑃𝑃𝑑𝑑𝑃𝑃𝑃𝑃𝑔𝑔𝑦𝑦
22
For infill solar development, the PoP CPAs are used and the annual generation formula above is applied. To calculate the LCOE, this analysis uses 2.7 $/W as the capital cost for solar installation, which is the average of large and small non-residential capital cost from Berkeley Lab (LBNL) Tracking the Sun Report.27 There is no additional interconnection cost, as it is assumed to be included in the LBNL capital cost. The same capital recovery factor of 7.36% is applied and the LCOE is calculated using the formula below. The range of LCOE across both infill and utility-scale CPAs in San Diego County is shown in Figures 2.3 and 2.4. Figure 2.5 shows the CPAs across San Diego and neighboring Imperial County.
𝑐𝑐𝑎𝑎𝑐𝑐𝑑𝑑𝑑𝑑𝑎𝑎𝑎𝑎 ∗ 𝑐𝑐𝑎𝑎𝑐𝑐𝑑𝑑𝑑𝑑𝑎𝑎𝑎𝑎 𝑃𝑃𝑃𝑃𝑐𝑐𝑃𝑃𝑟𝑟𝑃𝑃𝑃𝑃𝑦𝑦 𝑓𝑓𝑎𝑎𝑐𝑐𝑑𝑑𝑃𝑃𝑃𝑃𝑎𝑎𝑑𝑑𝑑𝑑𝑜𝑜𝑎𝑎𝑎𝑎 𝑔𝑔𝑃𝑃𝑑𝑑𝑃𝑃𝑃𝑃𝑎𝑎𝑑𝑑𝑑𝑑𝑃𝑃𝑑𝑑
= 𝐿𝐿𝑃𝑃𝑟𝑟𝑃𝑃𝑎𝑎𝑑𝑑𝐿𝐿𝑃𝑃𝑑𝑑 𝑐𝑐𝑃𝑃𝑑𝑑𝑑𝑑 𝑃𝑃𝑓𝑓 𝑃𝑃𝑑𝑑𝑃𝑃𝑃𝑃𝑔𝑔𝑦𝑦
Figure 2.2 San Diego region’s annual renewable resource energy potential (GWh) by resource type. The leftmost bar shows the annual generation in the base case, which is utility-scale production only (includes solar, onshore wind). Note that geothermal and offshore wind resources are not available in the San Diego region and are therefore not under any regional authorities). The middle bar shows the annual generation in the base case plus rooftop solar, solar infill, and brownfield development. The rightmost bar is the estimated 2050 electricity demand (gray) based on the downscaled Central Case scenario of the EER model for 2050. This figure shows that, in both cases, the resource potential in the region exceeds demand.
23
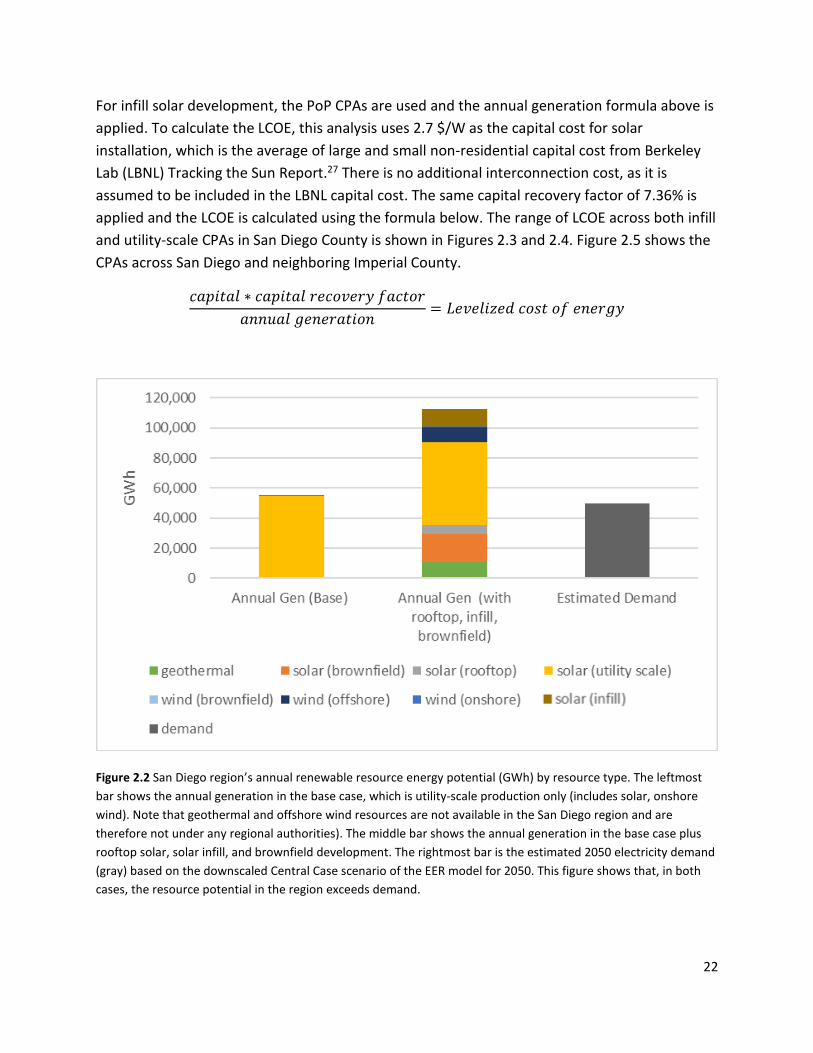
Table 2.1 Candidate project areas in the San Diego region.
In-county Including adjacent
county
Findings Units Utility-Scale
Only
With Rooftop, Infill, and
Brownfield
Utility-Scale Only
With Rooftop, Infill, and
Brownfield
Solar Area sq km 661 985 3,417 3,741
Onshore Wind Area sq km 86 86 3,712 3,749
Offshore Wind Area sq km 1,660 1,660 1,660 1,660
Solar Resource Potential GWh 54,784 102,925 84,888 109,742
Onshore Wind Resource Potential
GWh 730 730 22,540 22,572
Offshore Wind Resource Potential
GWh 9,869 9,869 9,869 9,869
Total Renewable Resource Potential
GWh 65,382 113,523 117,296 142,183
Estimated 2050 Electricity Demand
GWh 49,979 49,979 49,979 49,979
Electricity Resource Balance GWh 15,403 63,544 67,317 92,204

24
Figure 2.3 Utility-scale solar candidate project areas in the San Diego region by LCOE per CPA. Darker colors represent higher per CPA costs and the least cost CPAs are in yellow.
25
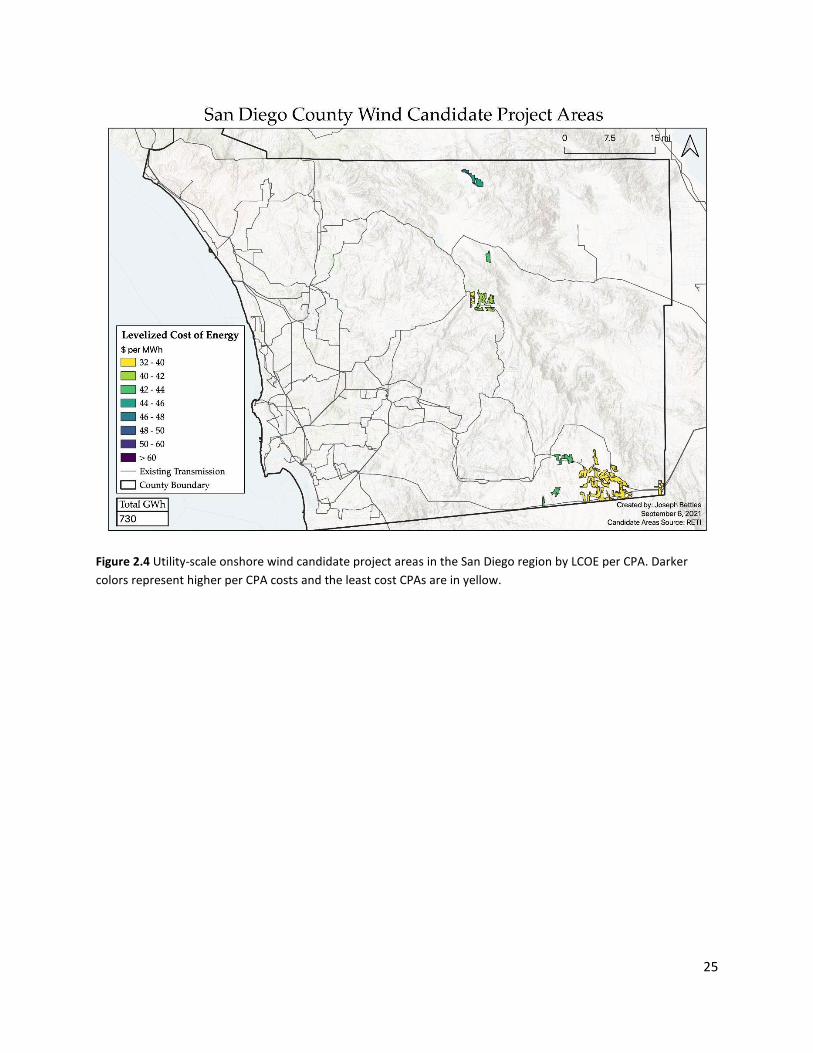
Figure 2.4 Utility-scale onshore wind candidate project areas in the San Diego region by LCOE per CPA. Darker colors represent higher per CPA costs and the least cost CPAs are in yellow.

26
Figure 2.5 Solar and wind candidate project areas in San Diego and Imperial counties by LCOE per CPA. Darker colors represent higher per CPA costs and the least cost CPAs are in yellow.
27
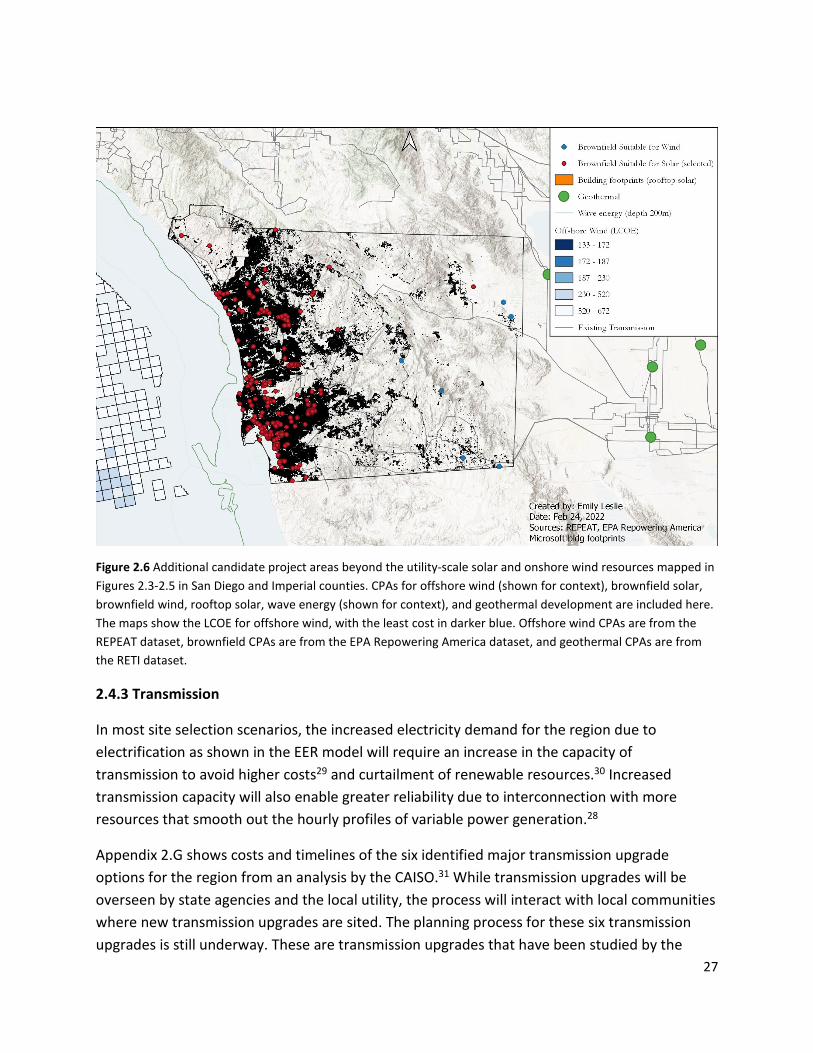
Figure 2.6 Additional candidate project areas beyond the utility-scale solar and onshore wind resources mapped in Figures 2.3-2.5 in San Diego and Imperial counties. CPAs for offshore wind (shown for context), brownfield solar, brownfield wind, rooftop solar, wave energy (shown for context), and geothermal development are included here. The maps show the LCOE for offshore wind, with the least cost in darker blue. Offshore wind CPAs are from the REPEAT dataset, brownfield CPAs are from the EPA Repowering America dataset, and geothermal CPAs are from the RETI dataset.
2.4.3 Transmission
In most site selection scenarios, the increased electricity demand for the region due to electrification as shown in the EER model will require an increase in the capacity of transmission to avoid higher costs29 and curtailment of renewable resources.30 Increased transmission capacity will also enable greater reliability due to interconnection with more resources that smooth out the hourly profiles of variable power generation.28
Appendix 2.G shows costs and timelines of the six identified major transmission upgrade options for the region from an analysis by the CAISO.31 While transmission upgrades will be overseen by state agencies and the local utility, the process will interact with local communities where new transmission upgrades are sited. The planning process for these six transmission upgrades is still underway. These are transmission upgrades that have been studied by the
28
CAISO, and they are upgrade options in state-level modeling for the state's Integrated Resource Plan (IRP). In the IRP proceeding, a statewide 2030 portfolio with high penetration of renewables is modeled and least-cost transmission upgrades are selected from this list of options to support and enable transmission planning for the state’s clean energy and climate goals.
The updated document “Modeling Assumptions for CAISO 2022-2023 Transmission Planning Process,” released in Q4 2021,32 sheds light on which of the list of transmission upgrades are identified as likely to be needed in IRP modeling: Greater Los Angeles area, Tehachapi, San Diego and Imperial, Southern Nevada, Southern PG&E, and Northern California. The report states that “the transmission constraint exceedance in the San Diego & Imperial area could be resolved by a transmission upgrade that would increase the estimated FCDS transmission capacity by 2,000 MW, with a CAISO estimated cost of $89 million and 18-month time to complete. This is upgrade number five (highlighted green) in Appendix 2.G, Table 2.G.4 ‘Transmission Upgrades and Costs in SDG&E Territory.’” However, it should be noted that the timeframe of IRP modeling ends in 2032, and further upgrades beyond this one are likely to be needed in the 2050 timeframe. The CAISO is separately undertaking a 20-yr transmission outlook study process and clean energy planning efforts in the San Diego region should incorporate findings from the CAISO 20-yr transmission outlook study as they come available.
2.4.4 Energy Storage
Any portfolio that includes high levels of wind and solar capacity will likely need energy storage to provide reliability and avoid energy curtailment. Energy storage in the 2032 IRP portfolio includes both battery energy storage (4-hr duration) and long duration energy storage. Their locations and amounts are shown in Figure 2.7 below.
2.4.5 Site Selection Scenarios
To sequence the CPA development needed to achieve 100% renewable energy by 2050, we use 10-year timesteps from the EER model’s Central Case. The estimated electric demand forecast for San Diego is identified starting in 2030. County-level demand is assumed to be a fraction of state demand in proportion to the county’s population as a fraction of the state. We implement a site selection algorithm modeled after Wu et al.1 and run two scenarios:
● Site Selection Scenario 1: San Diego-only (solar and wind resources within the San Diego region)
● Site Selection Scenario 2: San Diego and Imperial Scenario (solar, wind, and geothermal resources within San Diego and Imperial Counties)

29
For geothermal resource analysis, the E3 and CPUC statewide Integrated Resource Plan (R-20-05-003) estimated geothermal resource potential in neighboring Imperial County is used (no geothermal sites have been identified in San Diego county).34 Five geothermal sites are identified in Imperial county with total generation of 10,680 GWh/yr of electricity (seen as green points in Figures 2.6 and 2.11). This analysis assumes these plants become fully operational by 2030 and supply the remaining capacity to San Diego after satisfying Imperial’s electricity demand. The total available generation for the San Diego region is downscaled using methodology from Section 3.2 and it is assumed that 94.7% of the power generated will go to San Diego for an estimated geothermal resource of 10,113 GWh. In the San Diego and Imperial Scenario, 10,113 GWh is subtracted from all three time-steps of the forecasted electricity demand (Figure 2.11).
30
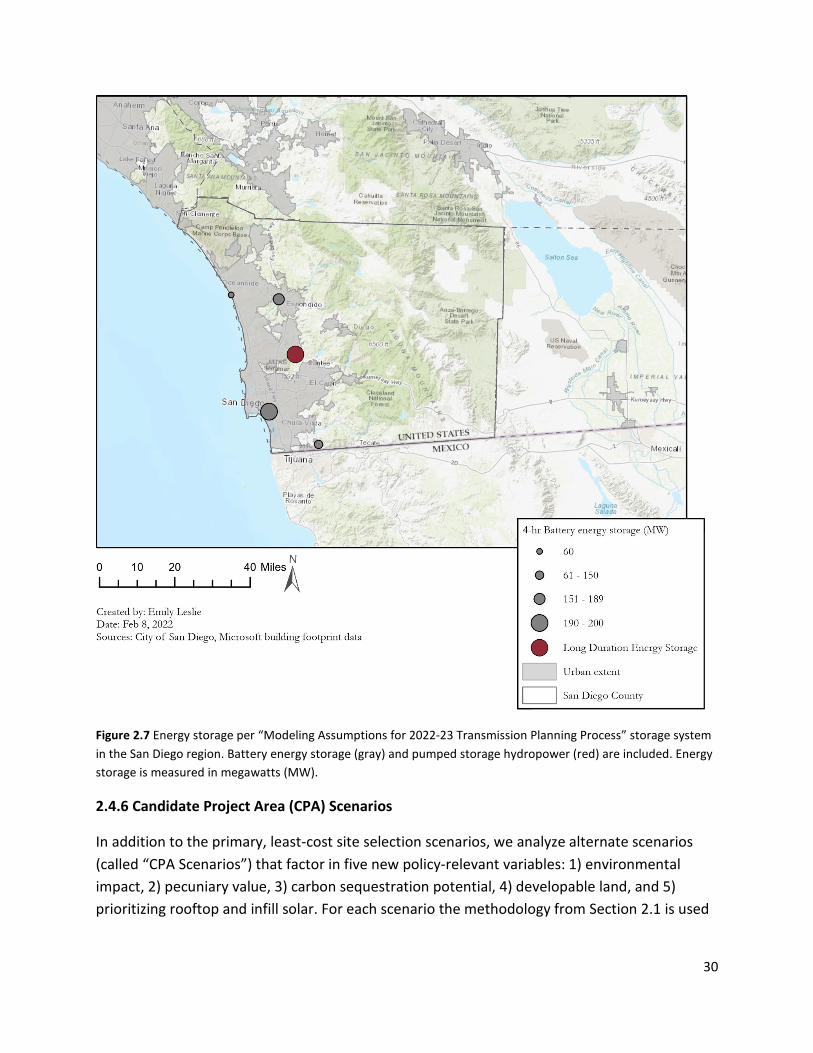
Figure 2.7 Energy storage per “Modeling Assumptions for 2022-23 Transmission Planning Process” storage system in the San Diego region. Battery energy storage (gray) and pumped storage hydropower (red) are included. Energy storage is measured in megawatts (MW).
2.4.6 Candidate Project Area (CPA) Scenarios
In addition to the primary, least-cost site selection scenarios, we analyze alternate scenarios (called “CPA Scenarios”) that factor in five new policy-relevant variables: 1) environmental impact, 2) pecuniary value, 3) carbon sequestration potential, 4) developable land, and 5) prioritizing rooftop and infill solar. For each scenario the methodology from Section 2.1 is used

31
to identify the LCOE and available capacity of CPAs under more constrained land-use assumptions within the boundaries of San Diego county.
CPA Scenario 1: Minimize Loss of Land with High Conservation Value
To show renewable site selection under a scenario in which environmental impact is highly prioritized, the most restrictive siting level areas for wind and solar resource potential areas in the West are used (SL 4) from the Wu et al.1 study of low-impact renewable energy siting. The study incorporated high-resolution ecological and agricultural datasets to identify sites with low impact on the environment. In this scenario all urban infill CPAs are included because of lower environmental impacts from siting in urban areas. Rooftop solar is not included because of its high costs.
CPA Scenario 2: Minimize Loss of Land with High Pecuniary Value
To identify CPAs that factor in the pecuniary value of land, the Cropland Data Layer raster from the US Department of Agriculture is used.35 To analyze the raster with the CPA sites, the zonal statistics tool is run on a 0.10 sq km grid to identify the mode land use within each cell. To restrict the CPAs to land with low pecuniary value, the data is filtered to include only “Fallow/Idle Cropland”, “Grassland/Pasture”, “Forest”, “Wetland”, “Shrubland”, and “Barren”. Urban infill is excluded in this scenario because of the higher relative value of land in the urban environment. Rooftop solar is not included because of its high costs.
CPA Scenario 3: Minimize Loss of Land with High Carbon Sequestration Potential
In the third scenario, lands which have high carbon sequestration potential are excluded. We rely on analysis from Chapter 5, which identifies carbon pools within San Diego County. SANDAG’s Vegetation Dataset is also used, which classifies the vegetation types in the County.36 The data are filtered to vegetation with high CO2 Sequestration potential (see Appendix 2.C for full list). These lands are excluded from the renewable resource potential to find CPAs under a scenario that prioritizes natural carbon sequestration. Urban infill sites are included in this scenario because of the lower carbon sequestration potential of infill land. Rooftop solar is not included because of its high costs.
CPA Scenario 4: Utilize only Developable Land
The fourth scenario minimizes legal and social barriers by selecting sites that exist on land that is identified as developable and is thus assumed to be subject to fewer legal and social barriers. SANDAG’s Developable Land data is utilized, which classifies “Vacant” and “Agricultural Redevelopment” as suitable for development.37 In this scenario, urban infill sites and rooftop solar are excluded as having higher barriers to development.
32
CPA Scenario 5: Infill and Rooftop Solar Scenario
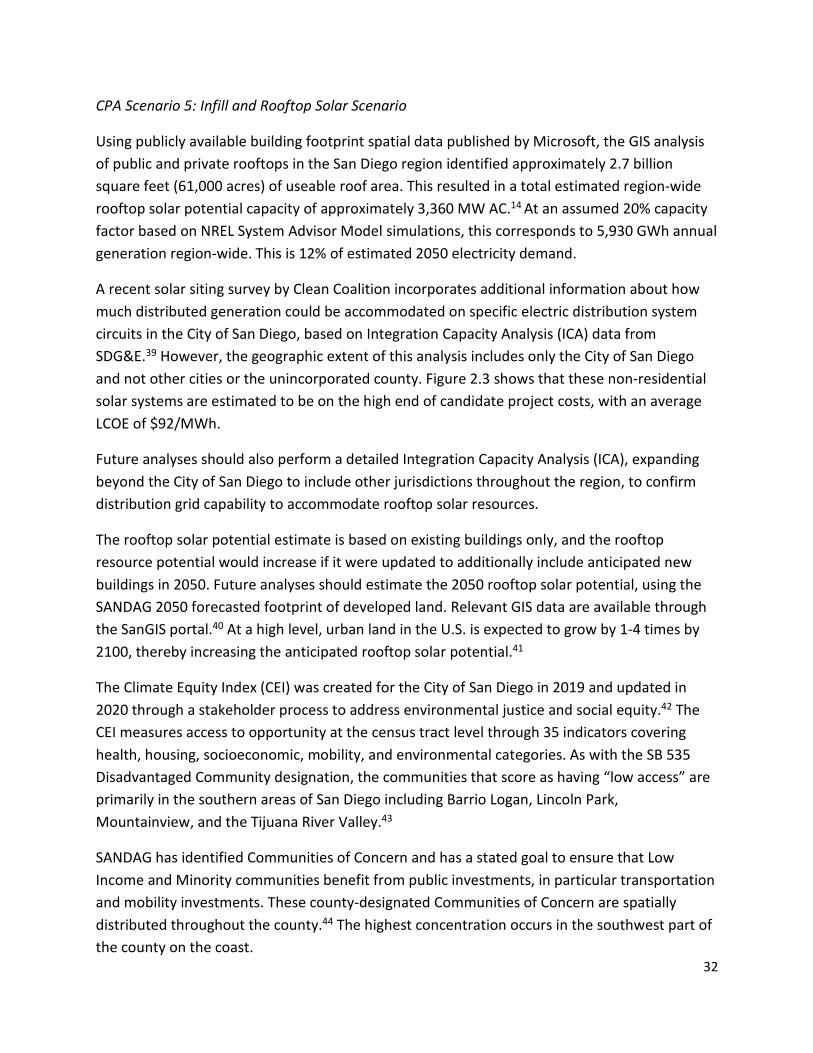
Using publicly available building footprint spatial data published by Microsoft, the GIS analysis of public and private rooftops in the San Diego region identified approximately 2.7 billion square feet (61,000 acres) of useable roof area. This resulted in a total estimated region-wide rooftop solar potential capacity of approximately 3,360 MW AC.14 At an assumed 20% capacity factor based on NREL System Advisor Model simulations, this corresponds to 5,930 GWh annual generation region-wide. This is 12% of estimated 2050 electricity demand.
A recent solar siting survey by Clean Coalition incorporates additional information about how much distributed generation could be accommodated on specific electric distribution system circuits in the City of San Diego, based on Integration Capacity Analysis (ICA) data from SDG&E.39 However, the geographic extent of this analysis includes only the City of San Diego and not other cities or the unincorporated county. Figure 2.3 shows that these non-residential solar systems are estimated to be on the high end of candidate project costs, with an average LCOE of $92/MWh.
Future analyses should also perform a detailed Integration Capacity Analysis (ICA), expanding beyond the City of San Diego to include other jurisdictions throughout the region, to confirm distribution grid capability to accommodate rooftop solar resources.
The rooftop solar potential estimate is based on existing buildings only, and the rooftop resource potential would increase if it were updated to additionally include anticipated new buildings in 2050. Future analyses should estimate the 2050 rooftop solar potential, using the SANDAG 2050 forecasted footprint of developed land. Relevant GIS data are available through the SanGIS portal.40 At a high level, urban land in the U.S. is expected to grow by 1-4 times by 2100, thereby increasing the anticipated rooftop solar potential.41
The Climate Equity Index (CEI) was created for the City of San Diego in 2019 and updated in 2020 through a stakeholder process to address environmental justice and social equity.42 The CEI measures access to opportunity at the census tract level through 35 indicators covering health, housing, socioeconomic, mobility, and environmental categories. As with the SB 535 Disadvantaged Community designation, the communities that score as having “low access” are primarily in the southern areas of San Diego including Barrio Logan, Lincoln Park, Mountainview, and the Tijuana River Valley.43
SANDAG has identified Communities of Concern and has a stated goal to ensure that Low Income and Minority communities benefit from public investments, in particular transportation and mobility investments. These county-designated Communities of Concern are spatially distributed throughout the county.44 The highest concentration occurs in the southwest part of the county on the coast.

33
These communities in the southwest part of the county are also designated Disadvantaged Communities (DAC) by the state (Figure 2.8). DACs are identified by the California Environmental Protection Authority to be disproportionately burdened by and vulnerable to multiple sources of pollution.45 Under California state law (SB 535 and AB 1550), DACs are specifically targeted for investment of proceeds from the State's cap-and-trade program. Known as California Climate Investments (CCI),46 these funds are aimed at improving public health, quality of life and economic opportunity in California's most burdened communities at the same time they are reducing pollution that causes climate change.
Figure 2.8 State-identified Disadvantaged Communities (Cal Enviroscreen 4.0) and state-identified Low-Income Communities (AB 1550). These communities have been specifically targeted for California Climate Investments, (Greenhouse Gas Reduction Fund and appropriated by the Legislature). These funds are aimed at improving public health, quality of life, and economic opportunity in California’s most burdened communities while reducing pollution that causes climate change. These funds must be used for programs that further reduce emissions of greenhouse gases.

34
Figure 2.9 Communities identified as having Very Low, Low, or Moderate access to opportunity through the San Diego Climate Equity Index. The CEI scoring is averaged across 41 indicators. For more details on each indicator, including source information and methods, refer to Appendix B of the City of San Diego's 2019 Climate Equity Index Report. The 2021 CEI version added three indicators (Ozone, PM2.5, and Diesel Particulate Matter), replaced the Heart Attack Fatalities indicator for Cardiovascular Disease, and separated the Proximity to Waste Sites indicator into four separate indicators: Toxic Releases from Facilities, Clean Up Sites, Hazardous Waste Generators and Facilities, and Solid Waste Sites and Facilities. Working with community-based organizations, the City has defined climate equity as efforts addressing historical inequities suffered by people of color, allowing everyone to fairly share the same benefits and burdens from climate solutions and attain full and equal access to opportunities regardless of one’s background and identity.
A scenario maximizing rooftop and urban infill solar and energy storage in these frontline communities could result in 5-30% reduction in impacts to previously undisturbed land (greenfield development). It could also have multiple co-benefits, including progress toward

35
county-level and higher-level equity goals, job creation in “green job” or “cleantech” sectors with corresponding well-paying wages,47 reduced GHG emissions from land use change for energy infrastructure, and availability of supplemental funding sources, for example from the state. Additionally, there is potential for rooftop solar programs to be designed in such a way that they can lower energy bills for low-income residents, for instance through rooftop solar incentive programs. Further study to quantify the local economic and public health benefits of such a scenario would be valuable; however, adequate information exists to support early action to pursue growth in rooftop solar, especially in communities overly burdened with pollution and having low access to opportunities.
CPA Scenario 6: Mid-range scenario
Because there are inherent tradeoffs between and across scenarios, a mid-range multi-benefit scenario is identified, in order to balance many competing priorities. This scenario includes:
● Rooftop solar throughout the county for the land-sparing benefits ● High utilization of brownfield wind and solar sites ● Lower-cost (but higher land-area) utility-scale wind and solar on SANDAG “developable”
lands ● Lower-cost utility-scale solar and geothermal from Imperial County, with corresponding
transmission upgrades ● 4-hr battery energy storage and long-duration energy storage (pumped hydropower
storage), for reliability
Energy storage in this scenario occurs at levels below the commercial interest indicated in the CAISO interconnection queue (7600 MW in San Diego county as of January 2022), but much higher than any deployment rate in history.
The level of rooftop solar in this scenario includes increased rooftop solar in the communities identified as having very low, low, and moderate access to opportunity (per the San Diego Climate Equity Index, as seen in Figure 2.9). This increase is driven by the state mandate requiring 25% of GHG Cap and Trade funds to be invested in and for Disadvantaged Communities per SB 535).
This scenario is the only one that includes the brownfield sites identified by the USEPA Repowering America Initiative, which encourages renewable energy development on current and formerly contaminated lands, landfills, and mine sites when such development is aligned with the community’s vision for the site.19 Due to the barriers to development known to occur on contaminated soils, the total solar brownfield resource potential was discounted by 50% to account for uncertainty.

36
2.5 Results and Discussion
2.5.1 Site Selection Scenarios
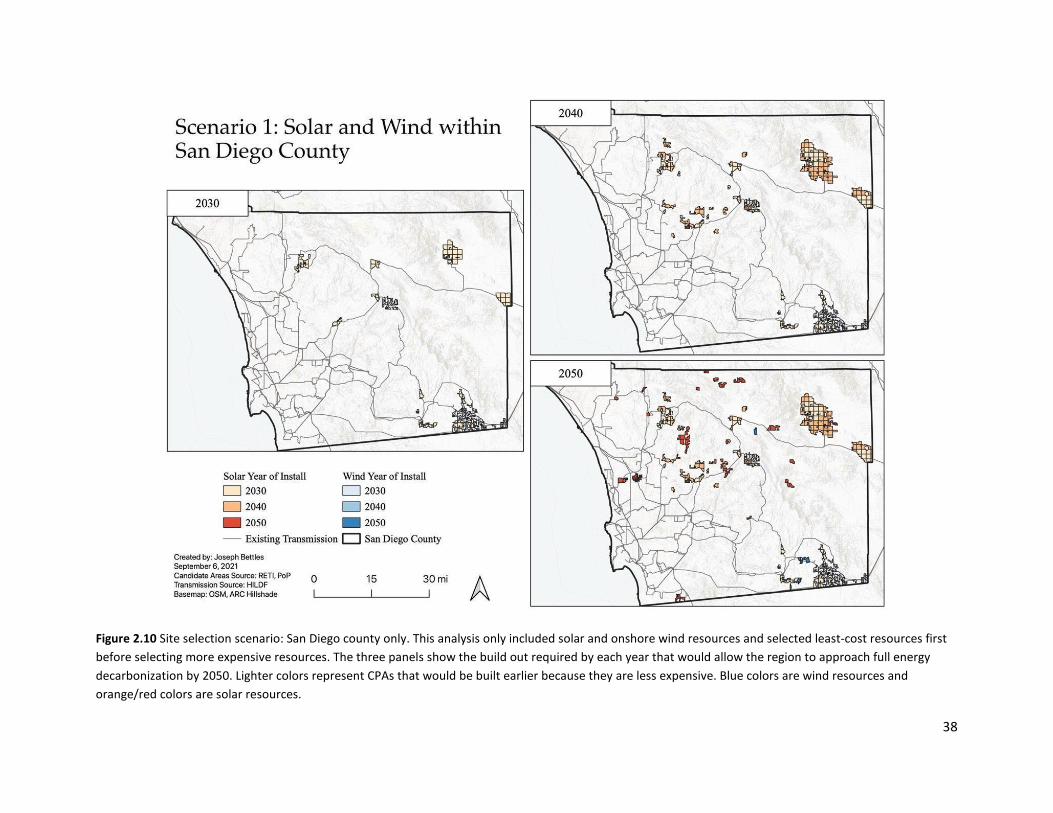
The results of the primary, least-cost site selection scenarios are shown in Figures 2.10 & 2.11 below. In the San Diego-only Scenario (Figure 2.10) the 2030 sites selected based on LCOE cluster largely around Jacumba Hot Springs in the southeast and Borrego Springs in the northeast parts of unincorporated San Diego county. In the 2040 and 2050 time-steps, CPAs closer to urban areas are selected. Few urban infill CPAs are selected in the San Diego scenario as the LCOE is relatively higher due to lower capacity factors in part from the use of fixed-tilt installations to maximize land utilization in densely populated areas. The San Diego scenario also requires higher overall electricity generation from renewable resources due to the lack of geothermal resources from Imperial County. The lack of firm power would also require higher storage capacity for 100% reliance on intermittent resources. Battery energy storage and long-duration energy storage could be deployed to meet this need. The 2020-2021 CAISO Transmission Planning modeling (base case) included 300 MW long-duration energy storage as well as 660 MW of 4-hr battery energy storage in San Diego county.37
In the San Diego and Imperial Scenario (Figure 2.11) geothermal and solar resources from Imperial County are factored into the resource potential to meet San Diego’s electricity demand. While the area east of Jacumba Hot Springs remains an area with high commercial interest for solar and wind development within the San Diego region, most other CPAs from the San Diego-only Scenario are not selected as the costs are higher than resources from Imperial County. Geothermal resources (green points) reduce the overall requirement for wind and solar resources. In the San Diego and Imperial Scenario, no infill resources are selected due to lower-cost sites in Imperial County.
While both scenarios meet forecasted electricity demands from the Central Case of the EER model, to ensure reliability for a 100% renewable energy supply, overcapacity is likely necessary. In their study of overcapacity and storage to meet reliability standards across the US, Shaner et al. (2018)28 find that, for a 75% solar 25% wind scenario, 50% overcapacity and 12 hours of storage results in 98.74% reliability. In both scenarios, there are additional CPAs available to meet necessary overcapacity. However, the amount of overcapacity needed is subject to uncertainty around the future availability of storage, upgrade of transmission systems, and development of clean firm power.
Additionally, it is important to note that these scenarios are snapshots of existing resource potential and availability. As more resources come online within the San Diego region or outside of the region, as would be the case for Imperial County resources but also for resources like offshore wind or resources from out of state or from Mexico, the results of these primary

37
scenarios and of the following scenarios would change. Generally, as more resources become available to the San Diego region for utilization, then the reliance on renewable resource development within the region can be adjusted accordingly.
2.5.2 Candidate Project Areas Scenarios
As policymakers consider alternate scenarios for siting renewable resources, priorities beyond the wholesale cost of energy may factor into decision-making. Figures 2.12 through 2.17 show solar and wind CPAs under five additional policy scenarios within the San Diego region. Table 2.5 shows a summary of the resource potential for each scenario.
Table 2.5 CPA scenarios summary. All values are in gigawatt hours (GWh). The deficit with demand values are based on the EER model’s Central Case demand estimates of 49,979 GWh for the San Diego region.
Scenario Resource Potential (GWh) Deficit with Demand
Low Environmental Impact 15,777 -34,202
Low Land Value 52,394 2,415
Carbon Sequestration Potential 22,844 -27,135
Developable 13,894 -36,085
Rooftop and infill solar 17,478 -32,501
Mid-range resource mix 50,147 168
38
Figure 2.10 Site selection scenario: San Diego county only. This analysis only included solar and onshore wind resources and selected least-cost resources first before selecting more expensive resources. The three panels show the build out required by each year that would allow the region to approach full energy decarbonization by 2050. Lighter colors represent CPAs that would be built earlier because they are less expensive. Blue colors are wind resources and orange/red colors are solar resources.

39
Figure 2.11 Site selection scenario: San Diego and Imperial counties. This analysis only included solar, onshore wind, and geothermal resources and selected least-cost resources first before selecting more expensive resources. As with Figure 2.10, this shows build out over three time periods where colors represent build out year (lighter colors are earlier) and resource (red/orange for solar, blue for wind, and green for geothermal). The inset shows the Jacumba Hot Springs area site selection by 2050 and the area that includes the proposed/planned JVR sites.
40
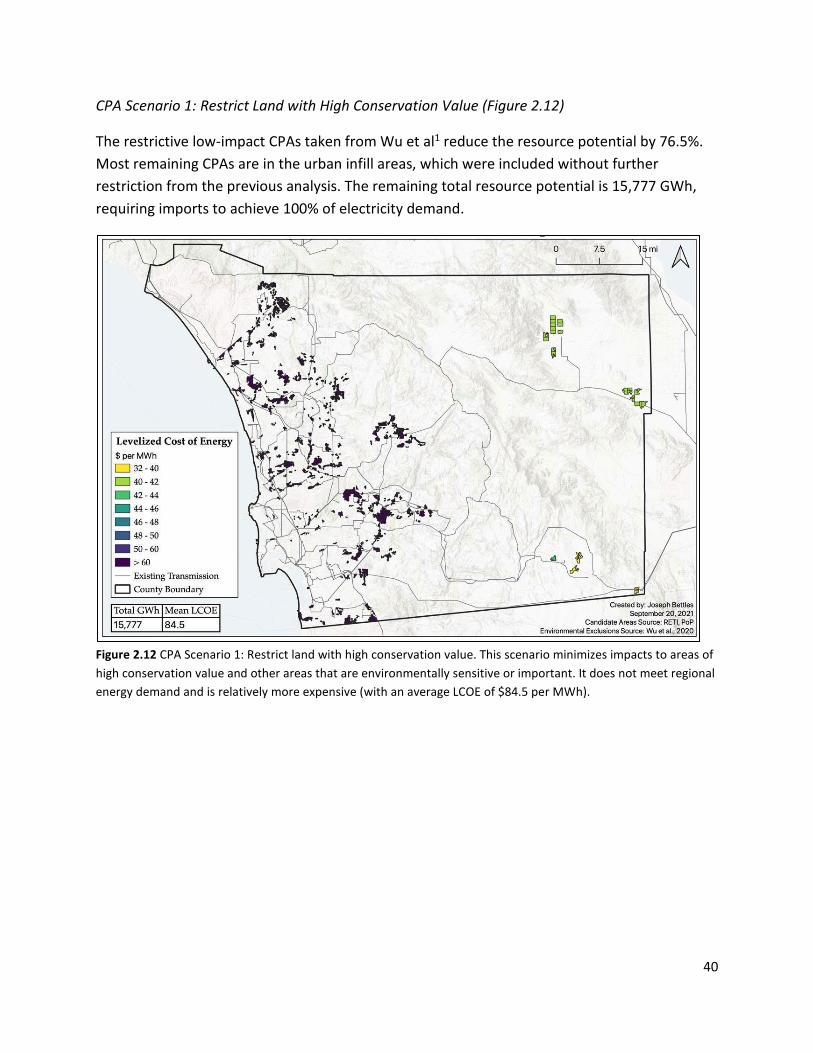
CPA Scenario 1: Restrict Land with High Conservation Value (Figure 2.12)
The restrictive low-impact CPAs taken from Wu et al1 reduce the resource potential by 76.5%. Most remaining CPAs are in the urban infill areas, which were included without further restriction from the previous analysis. The remaining total resource potential is 15,777 GWh, requiring imports to achieve 100% of electricity demand.
Figure 2.12 CPA Scenario 1: Restrict land with high conservation value. This scenario minimizes impacts to areas of high conservation value and other areas that are environmentally sensitive or important. It does not meet regional energy demand and is relatively more expensive (with an average LCOE of $84.5 per MWh).

41
CPA Scenario 2: Restrict Land with High Pecuniary Value (Figure 2.13)
The exclusion of land with high pecuniary value does not significantly lower the capacity of utility-scale renewable generation within the San Diego region. Most of the land identified in the previous scenarios was not on high-value cropland. The resulting total resource potential is 52,394 GWh. Therefore, if 95.4% of the resource potential on land with low value is developed, the region would be able to achieve 100% of electricity demands with only regional resources.
Figure 2.13 CPA Scenario 2: Restrict land with high pecuniary value. This scenario minimizes impacts to lands with high monetary values, such as agricultural lands or urban areas. It meets regional energy demand and is relatively less expensive (with a mean LCOE of $42.4/MWh).

42
CPA Scenario 3: Restrict Land with High Carbon Sequestration Potential (Figure 2.14)
When CPAs are restricted by land with high carbon sequestration potential, the resulting capacity is 22,844 GWh, or roughly one-third the original capacity. Much of the remaining CPAs are in the urban infill, which are included without further restrictions. In this scenario, the region would require imports to achieve 100% of electricity demand with renewable energy.
Figure 2.14 CPA Scenario 3: Restrict land with high carbon sequestration potential. This scenario minimizes impacts to lands with high carbon sequestration potential. It does not meet regional energy demand and is relatively expensive (with a mean LCOE of $80.7/MWh).
43
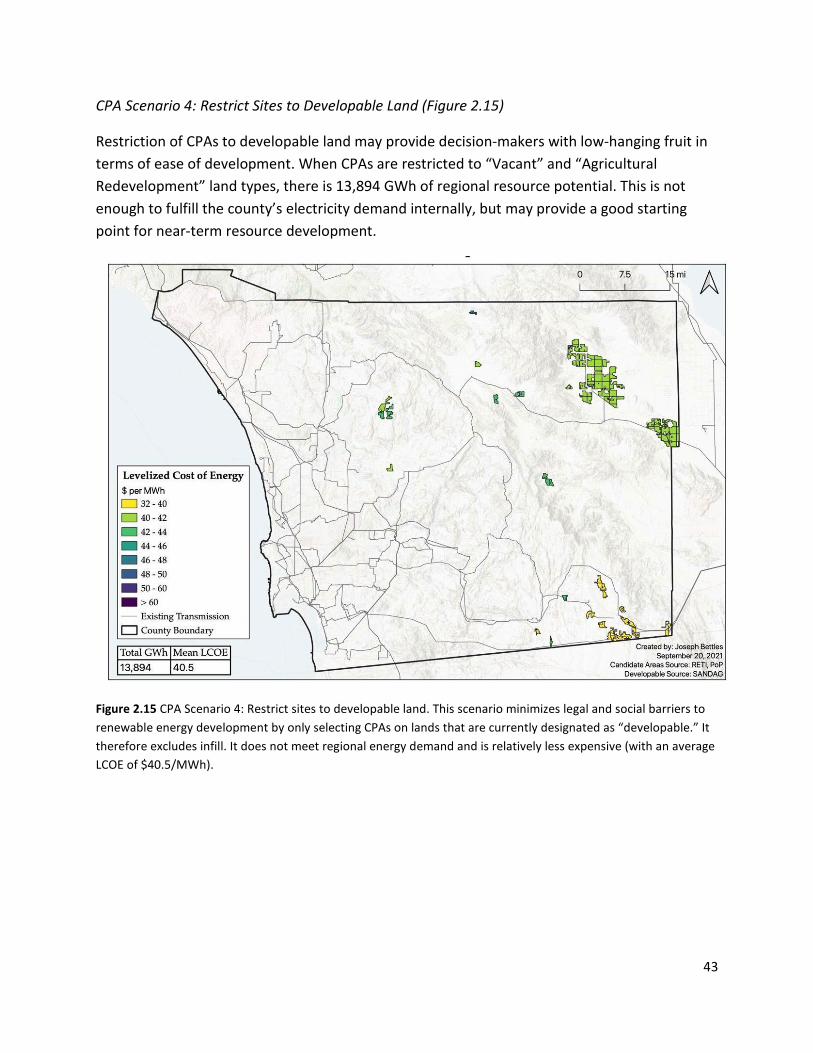
CPA Scenario 4: Restrict Sites to Developable Land (Figure 2.15)
Restriction of CPAs to developable land may provide decision-makers with low-hanging fruit in terms of ease of development. When CPAs are restricted to “Vacant” and “Agricultural Redevelopment” land types, there is 13,894 GWh of regional resource potential. This is not enough to fulfill the county’s electricity demand internally, but may provide a good starting point for near-term resource development.
Figure 2.15 CPA Scenario 4: Restrict sites to developable land. This scenario minimizes legal and social barriers to renewable energy development by only selecting CPAs on lands that are currently designated as “developable.” It therefore excludes infill. It does not meet regional energy demand and is relatively less expensive (with an average LCOE of $40.5/MWh).

44
CPA Scenario 5: Infill and Rooftop Solar Scenario (Figure 2.16)
Together, infill and rooftop solar resource potential throughout the county is 17,478 GWh, making up 35% of the estimated 2050 demand (12% and 23% respectively). A higher level of rooftop solar deployment is assumed in communities having very low, low, or moderate access to opportunity per the San Diego Climate Equity Index (assuming 50% of rooftop area is usable instead of 30% assumed elsewhere). The rooftop solar resource potential in these communities is estimated at 726 GWh, making it 1% of the estimated 2050 demand. Overall, this focus on maximum possible rooftop and infill solar leaves a deficit of 32,501 GWh, which would need to come from utility-scale renewable development or from resources outside of the San Diego region. Results of the analysis on rooftop solar are summarized in Table 2.6 below.
Figure 2.16 CPA Scenario 5: Infill and rooftop solar only. This scenario maximizes utilization of rooftop solar and infill solar development in the region. It does not meet regional energy demand and is relatively expensive (with an average LCOE of $114/MWh) because of the high costs of rooftop and urban infill solar development.
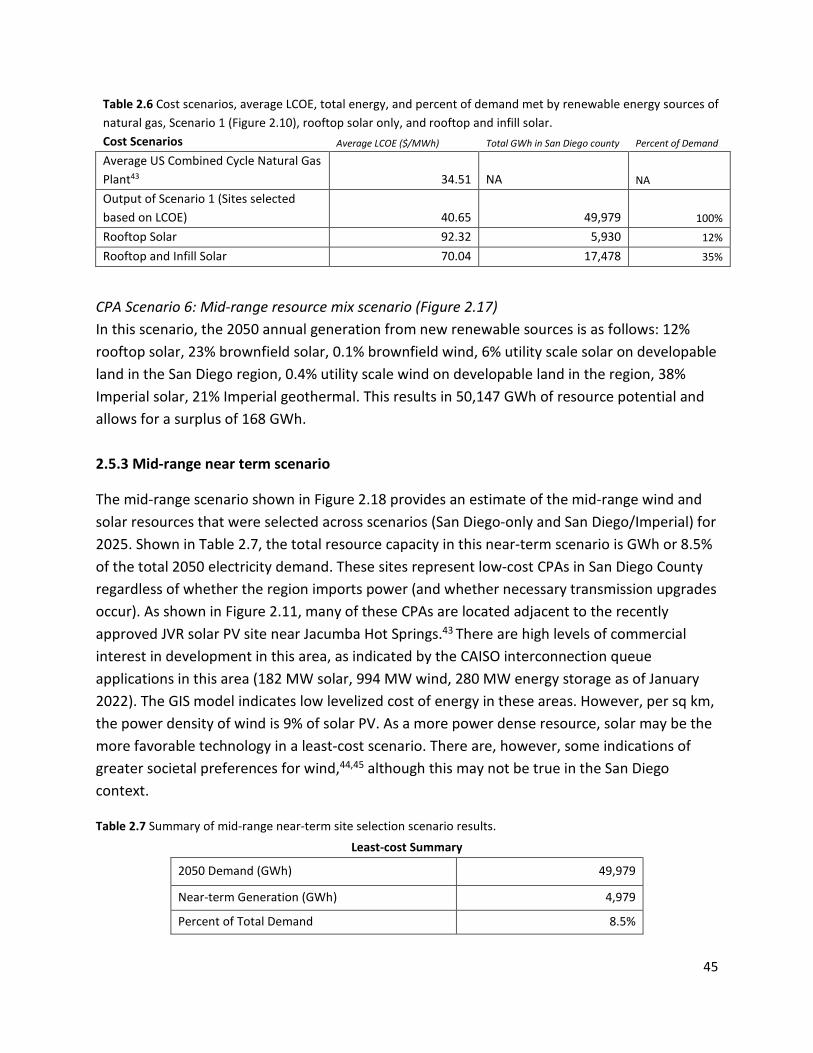
45
Table 2.6 Cost scenarios, average LCOE, total energy, and percent of demand met by renewable energy sources of natural gas, Scenario 1 (Figure 2.10), rooftop solar only, and rooftop and infill solar. Cost Scenarios Average LCOE ($/MWh) Total GWh in San Diego county Percent of Demand
Average US Combined Cycle Natural Gas Plant43 34.51 NA NA Output of Scenario 1 (Sites selected based on LCOE) 40.65 49,979 100% Rooftop Solar 92.32 5,930 12%
Rooftop and Infill Solar 70.04 17,478 35%
CPA Scenario 6: Mid-range resource mix scenario (Figure 2.17) In this scenario, the 2050 annual generation from new renewable sources is as follows: 12% rooftop solar, 23% brownfield solar, 0.1% brownfield wind, 6% utility scale solar on developable land in the San Diego region, 0.4% utility scale wind on developable land in the region, 38% Imperial solar, 21% Imperial geothermal. This results in 50,147 GWh of resource potential and allows for a surplus of 168 GWh. 2.5.3 Mid-range near term scenario
The mid-range scenario shown in Figure 2.18 provides an estimate of the mid-range wind and solar resources that were selected across scenarios (San Diego-only and San Diego/Imperial) for 2025. Shown in Table 2.7, the total resource capacity in this near-term scenario is GWh or 8.5% of the total 2050 electricity demand. These sites represent low-cost CPAs in San Diego County regardless of whether the region imports power (and whether necessary transmission upgrades occur). As shown in Figure 2.11, many of these CPAs are located adjacent to the recently approved JVR solar PV site near Jacumba Hot Springs.43 There are high levels of commercial interest in development in this area, as indicated by the CAISO interconnection queue applications in this area (182 MW solar, 994 MW wind, 280 MW energy storage as of January 2022). The GIS model indicates low levelized cost of energy in these areas. However, per sq km, the power density of wind is 9% of solar PV. As a more power dense resource, solar may be the more favorable technology in a least-cost scenario. There are, however, some indications of greater societal preferences for wind,44,45 although this may not be true in the San Diego context.
Table 2.7 Summary of mid-range near-term site selection scenario results.
Least-cost Summary
2050 Demand (GWh) 49,979
Near-term Generation (GWh) 4,979
Percent of Total Demand 8.5%
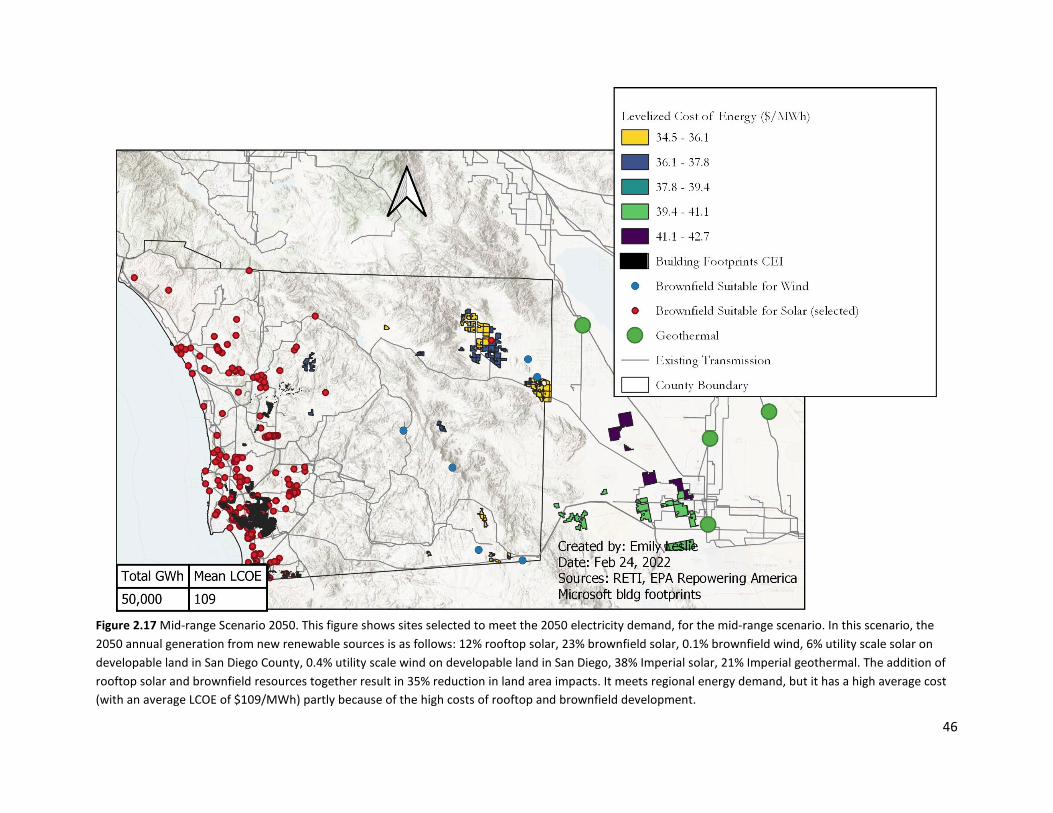
46
Figure 2.17 Mid-range Scenario 2050. This figure shows sites selected to meet the 2050 electricity demand, for the mid-range scenario. In this scenario, the 2050 annual generation from new renewable sources is as follows: 12% rooftop solar, 23% brownfield solar, 0.1% brownfield wind, 6% utility scale solar on developable land in San Diego County, 0.4% utility scale wind on developable land in San Diego, 38% Imperial solar, 21% Imperial geothermal. The addition of rooftop solar and brownfield resources together result in 35% reduction in land area impacts. It meets regional energy demand, but it has a high average cost (with an average LCOE of $109/MWh) partly because of the high costs of rooftop and brownfield development.

47
Figure 2.18 Mid-range Near-term Scenario (2025). The mid-range 2025 scenario shows sites that were selected to meet the 2025 electricity demand across multiple scenarios. They are a mix of the least cost CPAs in the eastern part of the county (with high levels of commercial interest indicated in the CAISO interconnection queue), rooftop solar in the frontline communities in the southwest, and brownfield sites identified by the USEPA Repowering America initiative which encourages renewable energy development on current and formerly contaminated lands, landfills, and mine sites when such development is aligned with the community’s vision for the site. These sites have high value regardless of whether electricity is imported from Imperial County.

48
2.6 Conclusion
To develop the necessary renewable resources that satisfy 100% of electricity demand by 2050, the San Diego region will need to engage in near- and long-term planning to ensure priorities such as environmental protection, cost, carbon sequestration potential, equity, and land value are considered adequately in deployment. This report has shown that balancing these priorities is possible with available resources in San Diego county and nearby Imperial County, although in certain cases there will be trade-offs including the need to import electricity and transmission upgrades needed to avoid congestion. There are opportunities for power transfer between San Diego and Imperial Counties, including solar and geothermal firm power which can reduce the storage requirement and increase reliability. Given the necessary expansion of the electricity supply to meet estimated ~50,000 GWh of demand (or ~5,700 MW of capacity) by 2050, there will need to be roughly two new operational 100 MW clean power plants every year between now and 2050 that supply electricity to the San Diego region. If the timeline is constrained to 2035, this would require roughly four new operational 100 MW clean power plants every year. Close coordination with state agencies such as the CAISO and the CPUC can help accelerate the deployment of clean energy infrastructure including transmission.
A scenario maximizing rooftop and urban infill solar and energy storage could result in 5-30% reduction in infrastructure development on previously undisturbed land (greenfield development). It could also have multiple co-benefits, including progress toward county-level and higher-level equity goals, job creation in “green job” or “cleantech” sectors with corresponding well-paying wages,i reduced GHG emissions from land use change for energy infrastructure, and availability of supplemental funding sources for example from the state. If coupled with apprenticeship programs, job training opportunities could be significant. Further study to quantify the local economic and public health benefits of such a scenario would be valuable; however, adequate information exists to support early action to promote growth in rooftop solar, especially in communities overly burdened with pollution and having low access to opportunities.
i San Diego’s jobs in these industry groups grew 17.6% from 2010 to 2018. https://www.sandiego.gov/sustainability/social-equity-and-job-creation

49
Works Cited 1. Wu, G. C., Leslie, E., Sawyerr, O., Cameron, D. R., Brand, E., Cohen, B., Allen, D., Ochoa, M., & Olson, A. (2020).
Low-impact land use pathways to deep decarbonization of electricity. Environmental Research Letters, 15(7), 074044. https://doi.org/10.1088/1748-9326/ab87d1
2. Zichella, C., & Hladik, J. (2013). Siting: Finding a Home for Renewable Energy and Transmission. The Electricity Journal, 26(8), 125–138. https://doi.org/10.1016/j.tej.2013.09.001
3. Senator Sher (2002); SB 1078 Renewable energy: California Renewables Portfolio Standard Program. http://www.leginfo.ca.gov/pub/01-02/bill/sen/sb_1051-1100/sb_1078_bill_20020912_chaptered.html
4. Senator De León. (2015) SB 350 Clean Energy and Pollution Reduction Act of 2015. https://leginfo.legislature.ca.gov/faces/billNavClient.xhtml?bill_id=201520160SB350
5. Senator De León (2018) SB 100 California Renewables Portfolio Standard Program: emissions of greenhouse gases. https://leginfo.legislature.ca.gov/faces/billNavClient.xhtml?bill_id=201720180SB100
6. Summary of state-level renewable energy goals provided by the California Public Utilities Commission (CPUC) https://www.cpuc.ca.gov/rps
7. Available online at the following URL: https://www.cpuc.ca.gov/industries-and-topics/electrical-energy/infrastructure/transportation-electrification/transportation-electrification-activities-pursuant-to-senate-bill-350
8. Available online at the following URL: https://www.cpuc.ca.gov/industries-and-topics/electrical-energy/electric-power-procurement/long-term-procurement-planning
9. Available online at the following URL: https://www.cpuc.ca.gov/industries-and-topics/electrical-energy/electric-power-procurement/long-term-procurement-planning/2019-20-irp-events-and-materials Accessed January 3, 2022
10. http://www.caiso.com/planning/Pages/TransmissionPlanning/Default.aspx 11. ftp://ftp.cpuc.ca.gov/energy/modeling/Modeling_Assumptions_2022_2023_TPP_V2021_12_16.pdf (must use
Internet Explorer browser to download this document) 12. RETI Coordinating Committee, RETI Stakeholder Steering Committee. “Renewable Energy Transmission
Initiative Phase 1B Final Report.” California Energy Commission, January 2009. 13. NREL “Greening the Grid” Toolkit https://greeningthegrid.org/Renewable-Energy-Zones-
Toolkit/topics/renewable-energy-resource-assessments 14. Microsoft Building Footprints – Features. 125 million building footprints deep learning generated by Microsoft
for the USA. https://hub.arcgis.com/datasets/esri::microsoft-building-footprints-features/about (accessed online December 1 2021.)
15. SANDAG, 2021, SanGIS; sangis.org 16. Ong, S., Campbell, C., Denholm, P., Margolis, R., & Heath, G. (2013). Land-Use Requirements for Solar Power
Plants in the United States (NREL/TP-6A20-56290, 1086349; p. NREL/TP-6A20-56290, 1086349). NREL. https://doi.org/10.2172/1086349
17. Denholm, P., Hand, M., Jackson, M., & Ong, S. (2009). Land Use Requirements of Modern Wind Power Plants in the United States (NREL/TP-6A2-45834, 964608; p. NREL/TP-6A2-45834, 964608). NREL. https://doi.org/10.2172/964608
18. US Census. (2019). TIGER/Line Shapefile, 2019, 2010 nation, U.S., 2010 Census Urban Area National [Data set]. Unknown. https://catalog.data.gov/dataset/tiger-line-shapefile-2019-2010-nation-u-s-2010-census-urban-area-national
19. “Repowering America’s Lands.” U.S. Environmental Protection Agency. Accessed February 21, 2022. https://www.epa.gov/re-powering.
20. Leslie, Emily, Pascale, Andrew, & Jenkins, Jesse. (2021). Wind and Solar Candidate Project Areas for Princeton REPEAT (Version 3) [Data set]. Zenodo. https://doi.org/10.5281/zenodo.5021146

50
21. “Mapping and Assessment of the United States Ocean Wave Energy Resource.” EPRI, 2011. https://www.osti.gov/servlets/purl/1060943.
22. U.S. Energy Information Administration (EIA). (2021). Form EIA-860 detailed data with previous form data (EIA-860A/860B). https://www.eia.gov/electricity/data/eia860/
23. U.S. National Renewable Energy Laboratory (NREL). (2020). Index | Electricity | 2020 | ATB | NREL. https://atb.nrel.gov/electricity/2020/index
24. Cohen, S. M., Becker, J., Bielen, D. A., Brown, M., Cole, W. J., Eurek, K. P., Frazier, A., Frew, B. A., Gagnon, P. J., Ho, J. L., Jadun, P., Mai, T. T., Mowers, M., Murphy, C., Reimers, A., Richards, J., Ryan, N., Spyrou, E., Steinberg, D. C. (ORCID:0000000317692261), … Zwerling, M. (2019). Regional Energy Deployment System (ReEDS) Model Documentation: Version 2018 (NREL/TP-6A20-72023). National Renewable Energy Lab. (NREL), Golden, CO (United States). https://doi.org/10.2172/1505935
25. U.S. Department of Homeland Services (DHS). (2020, June). Electric Substations. https://hifld-geoplatform.opendata.arcgis.com/datasets/electric-substations/explore
26. Masters, G. M. (2004). Renewable and Efficient Electric Power Systems: Masters/Electric Power Systems. John Wiley & Sons, Inc. https://doi.org/10.1002/0471668826
27. Barbose, G., Darghouth, N., O’Shaugnessey, E., & Forrester, S. (2020). Tracking the Sun | Electricity Markets and Policy Group. Berkeley Labs. https://emp.lbl.gov/tracking-the-sun
28. Shaner, M. R., Davis, S. J., Lewis, N. S., & Caldeira, K. (2018). Geophysical constraints on the reliability of solar and wind power in the United States. Energy & Environmental Science, 11(4), 914–925. https://doi.org/10.1039/C7EE03029K
29. Hamoud, G., & Bradley, I. (2004). Assessment of transmission congestion cost and locational marginal pricing in a competitive electricity market. IEEE Transactions on Power Systems, 19(2), 769–775. https://doi.org/10.1109/TPWRS.2004.825823
30. Gu, Y., Xie, L., Rollow, B., & Hesselbaek, B. (2011). Congestion-induced wind curtailment: Sensitivity analysis and case studies. 2011 North American Power Symposium, 1–7. https://doi.org/10.1109/NAPS.2011.6025167
31. CAISO. (2021). Transmission Capability Estimates for use in the CPUC’s Resource Planning Process. http://www.caiso.com/Documents/WhitePaper-2021TransmissionCapabilityEstimates-CPUCResourcePlanningProcess.pdf
32. CPUC “Preferred System Plan” https://www.cpuc.ca.gov/industries-and-topics/electrical-energy/electric-power-procurement/long-term-procurement-planning/2019-20-irp-events-and-materials and “Modeling Assumptions for 2022 -2023 Transmission Planning Process.” ftp://ftp.cpuc.ca.gov/energy/modeling/Modeling_Assumptions_2022_2023_TPP_V2021_12_16.pdf
33. CAISO. (2021). California ISO - 20-Year transmission outlook. https://stakeholdercenter.caiso.com/RecurringStakeholderProcesses/20-Year-transmission-outlook
34. RESOLVE: Renewable Energy Solutions Model. (n.d.). E3. Retrieved August 31, 2021, from https://www.ethree.com/tools/resolve-renewable-energy-solutions-model/
35. USDA. (2020). CropScape—NASS CDL Program. National Agricultural Statistics Service. https://nassgeodata.gmu.edu/CropScape/
36. SANDAG. (2021, August 26). Eco Vegetation Layer. SanGIS/SANDAG GIS Data Warehouse. https://rdw.sandag.org/Account/gisdtview?dir=Ecology
37. SANDAG. (2010). Developable Land. https://www.sandag.org/resources/maps_and_gis/gis_downloads/downloads/zip/Land/ForecastLand/devabledoc.htm#codes
38. Blair et al. “System Advisor Model (SAM) General Description (Version 2017.9.5).” National Renewable Energy Lab (NREL), 2018. https://sam.nrel.gov/.
39. Clean Coalition Solar Siting Survey (2019). https://clean-coalition.org/solar-siting-survey-san-diego/

51
40. SANDAG. Planned Land Use for the Series 13 Regional Growth Forecast (2050). LANDUSE_PLANNED_2050_SG. SanGIS/SANDAG GIS Data Warehouse. https://gissd.sandag.org/rdw/rest/services/Land_Use/Planned_Land_Use/MapServer/0
41. Gao, J., & O’Neill, B. C. (2020). Mapping global urban land for the 21st century with data-driven simulations and Shared Socioeconomic Pathways. Nature Communications, 11(1), 2302. https://doi.org/10.1038/s41467-020-15788-7
42. City of San Diego. (2021). Climate Equity and Jobs | Sustainability | City of San Diego Official Website. https://www.sandiego.gov/sustainability/social-equity-and-job-creation
43. City of San Diego. (2018). Climate Equity Index Report. https://www.sandiego.gov/sites/default/files/2019_climate_equity_index_report.pdf
44. SANDAG. (2011). Social Equity: Title VI and Environmental Justice. https://www.sandag.org/uploads/2050RTP/F2050rtp4.pdf
45. OEHHA, O. (2014, November 27). CalEnviroScreen. https://oehha.ca.gov/calenviroscreen 46. CalEPA. (2021). California Climate Investments to Benefit Disadvantaged Communities | CalEPA.
https://calepa.ca.gov/envjustice/ghginvest/ 47. San Diego’s jobs in these industry groups grew 17.6% from 2010 to 2018.
https://www.sandiego.gov/sustainability/social-equity-and-job-creation 48. “Modeling Assumptions for 2022 -2023 Transmission Planning Process.”
ftp://ftp.cpuc.ca.gov/energy/modeling/Modeling_Assumptions_2022_2023_TPP_V2021_12_16.pdf 49. Ireland, E. (2021, August 19). Supervisors OK Large Solar Project in Jacumba Hot Springs Over Residents’
Objections. Times of San Diego. https://timesofsandiego.com/politics/2021/08/18/supervisors-ok-large-solar-project-in-jacumba-hot-springs-residents-object/
50. Firestone, J., & Kirk, H. (2019). A strong relative preference for wind turbines in the United States among those who live near them. Nature Energy, 4(4), 311–320. https://doi.org/10.1038/s41560-019-0347-9
51. Sonnberger, M. (2019). Choosing the lesser of two evils? Nature Energy, 4(4), 265–266. https://doi.org/10.1038/s41560-019-0354-x
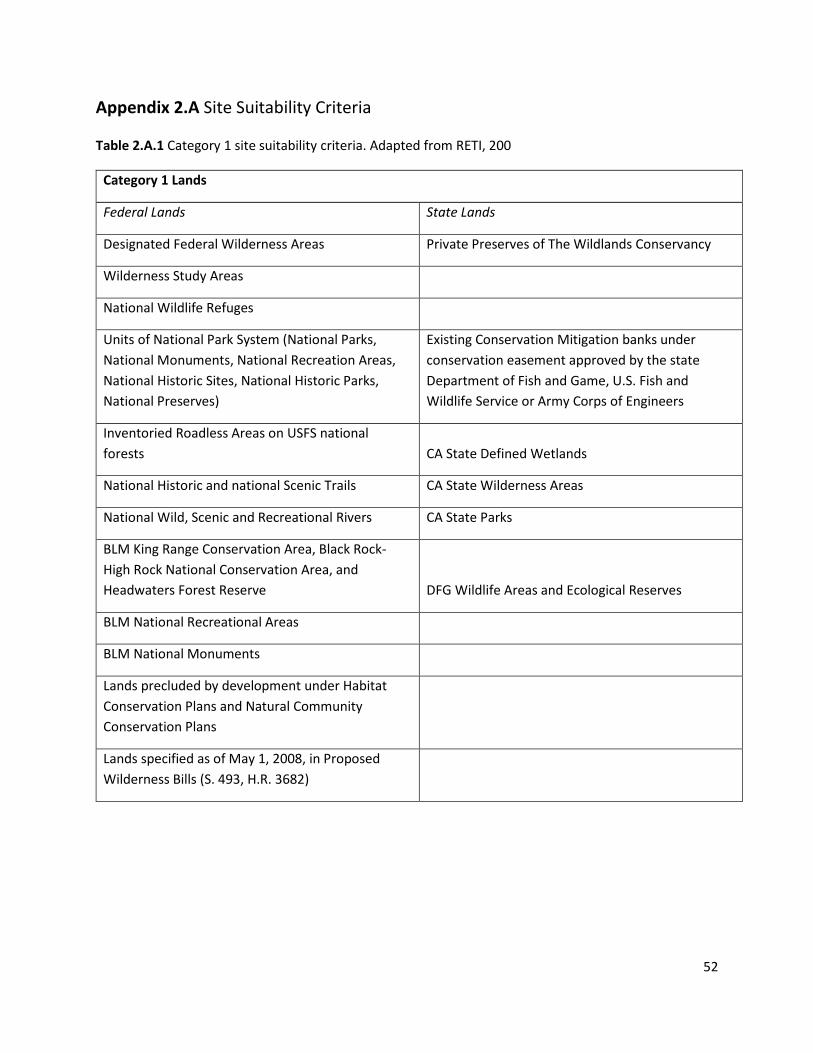
52
Appendix 2.A Site Suitability Criteria
Table 2.A.1 Category 1 site suitability criteria. Adapted from RETI, 200
Category 1 Lands
Federal Lands State Lands
Designated Federal Wilderness Areas Private Preserves of The Wildlands Conservancy
Wilderness Study Areas
National Wildlife Refuges
Units of National Park System (National Parks, National Monuments, National Recreation Areas, National Historic Sites, National Historic Parks, National Preserves)
Existing Conservation Mitigation banks under conservation easement approved by the state Department of Fish and Game, U.S. Fish and Wildlife Service or Army Corps of Engineers
Inventoried Roadless Areas on USFS national forests CA State Defined Wetlands
National Historic and national Scenic Trails CA State Wilderness Areas
National Wild, Scenic and Recreational Rivers CA State Parks
BLM King Range Conservation Area, Black Rock-High Rock National Conservation Area, and Headwaters Forest Reserve DFG Wildlife Areas and Ecological Reserves
BLM National Recreational Areas
BLM National Monuments
Lands precluded by development under Habitat Conservation Plans and Natural Community Conservation Plans
Lands specified as of May 1, 2008, in Proposed Wilderness Bills (S. 493, H.R. 3682)

53
Table 2.A.2 Category 2 site suitability criteria. Adapted from RETI, 200
Category 2 Lands
BLM Areas of Critical Environmental Concern
USFWS designated Critical Habitat for federally listed endangered and threatened species
Special wildlife management areas identified in BLM's West Mojave Resource Management Plan. I.e., Desert Wildlife Management Areas and Mojave Ground Squirrel Conservation Areas
Lands purchased by private funds and donated to BLM, specifically the California Desert Acquisition Project by The Wildlands Conservancy
"Proposed and Potential Conservation Reserves" in HCPs and NCCPs
9

54
Table 2.A.3 Full List of site suitability criteria for CPA Site Selection.
RETI Excluded Lands
Geothermal Solar PV Wind Notes
Category 1 lands Yes Yes Yes
Category 2 lands Yes Yes Yes Pre-identified projects OK
Wetlands and water bodies
Yes Yes Yes Dry lakes not excluded
Native American reservations
Yes Yes Yes Pre-identified projects OK
Military lands Yes Yes Yes Pre-identified projects OK
Mines (surface) Yes Yes Yes
Urban areas Yes Yes, + buffer
Yes, + buffer
buffer up to 3 miles depending on population
Airports Yes Yes Yes, + buffer
Major airports only. Wind buffer is up to 5 miles
Military flyways No No Yes Pre-identified projects OK in red zones. All other open
Williamson Act Prime Agricultural Land
No Yes No Pre-identified projects OK in red zones. All other open
Williamson Act Non-Prime Agricultural Land
No Yes No Excluded until 2018, pre-identified projects OK
Renewable resource quality
No No < 6.3 m/sec
Min. contiguous square acreage
No 160 none 640 acres = 1 section = 1 sq mile
Land slope No > 5% > 20% Geothermal evaluated on case by case basis
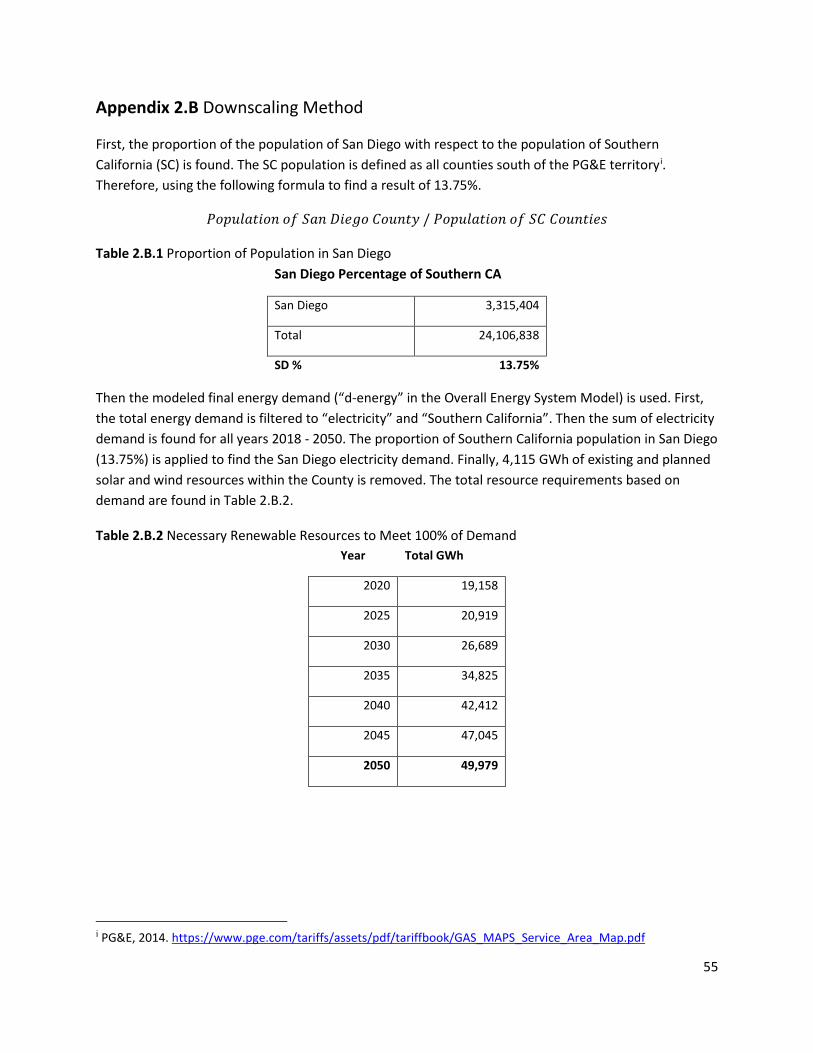
55
Appendix 2.B Downscaling Method
First, the proportion of the population of San Diego with respect to the population of Southern California (SC) is found. The SC population is defined as all counties south of the PG&E territoryi. Therefore, using the following formula to find a result of 13.75%.
𝑃𝑃𝑃𝑃𝑐𝑐𝑜𝑜𝑎𝑎𝑎𝑎𝑑𝑑𝑑𝑑𝑃𝑃𝑑𝑑 𝑃𝑃𝑓𝑓 𝑆𝑆𝑎𝑎𝑑𝑑 𝐷𝐷𝑑𝑑𝑃𝑃𝑔𝑔𝑃𝑃 𝐶𝐶𝑃𝑃𝑜𝑜𝑑𝑑𝑑𝑑𝑦𝑦 / 𝑃𝑃𝑃𝑃𝑐𝑐𝑜𝑜𝑎𝑎𝑎𝑎𝑑𝑑𝑑𝑑𝑃𝑃𝑑𝑑 𝑃𝑃𝑓𝑓 𝑆𝑆𝐶𝐶 𝐶𝐶𝑃𝑃𝑜𝑜𝑑𝑑𝑑𝑑𝑑𝑑𝑃𝑃𝑑𝑑
Table 2.B.1 Proportion of Population in San Diego San Diego Percentage of Southern CA
San Diego 3,315,404
Total 24,106,838
SD % 13.75%
Then the modeled final energy demand (“d-energy” in the Overall Energy System Model) is used. First, the total energy demand is filtered to “electricity” and “Southern California”. Then the sum of electricity demand is found for all years 2018 - 2050. The proportion of Southern California population in San Diego (13.75%) is applied to find the San Diego electricity demand. Finally, 4,115 GWh of existing and planned solar and wind resources within the County is removed. The total resource requirements based on demand are found in Table 2.B.2.
Table 2.B.2 Necessary Renewable Resources to Meet 100% of Demand Year Total GWh
2020 19,158
2025 20,919
2030 26,689
2035 34,825
2040 42,412
2045 47,045
2050 49,979
i PG&E, 2014. https://www.pge.com/tariffs/assets/pdf/tariffbook/GAS_MAPS_Service_Area_Map.pdf
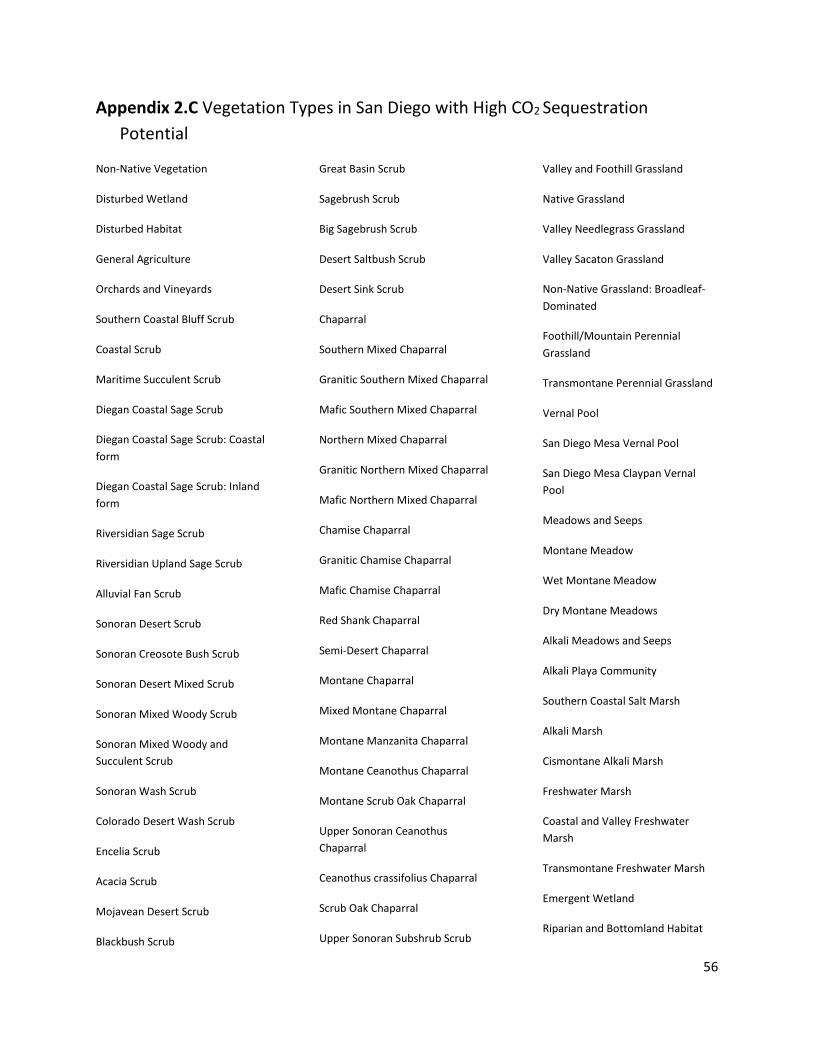
56
Appendix 2.C Vegetation Types in San Diego with High CO2 Sequestration Potential
Non-Native Vegetation
Disturbed Wetland
Disturbed Habitat
General Agriculture
Orchards and Vineyards
Southern Coastal Bluff Scrub
Coastal Scrub
Maritime Succulent Scrub
Diegan Coastal Sage Scrub
Diegan Coastal Sage Scrub: Coastal form
Diegan Coastal Sage Scrub: Inland form
Riversidian Sage Scrub
Riversidian Upland Sage Scrub
Alluvial Fan Scrub
Sonoran Desert Scrub
Sonoran Creosote Bush Scrub
Sonoran Desert Mixed Scrub
Sonoran Mixed Woody Scrub
Sonoran Mixed Woody and Succulent Scrub
Sonoran Wash Scrub
Colorado Desert Wash Scrub
Encelia Scrub
Acacia Scrub
Mojavean Desert Scrub
Blackbush Scrub
Great Basin Scrub
Sagebrush Scrub
Big Sagebrush Scrub
Desert Saltbush Scrub
Desert Sink Scrub
Chaparral
Southern Mixed Chaparral
Granitic Southern Mixed Chaparral
Mafic Southern Mixed Chaparral
Northern Mixed Chaparral
Granitic Northern Mixed Chaparral
Mafic Northern Mixed Chaparral
Chamise Chaparral
Granitic Chamise Chaparral
Mafic Chamise Chaparral
Red Shank Chaparral
Semi-Desert Chaparral
Montane Chaparral
Mixed Montane Chaparral
Montane Manzanita Chaparral
Montane Ceanothus Chaparral
Montane Scrub Oak Chaparral
Upper Sonoran Ceanothus Chaparral
Ceanothus crassifolius Chaparral
Scrub Oak Chaparral
Upper Sonoran Subshrub Scrub
Valley and Foothill Grassland
Native Grassland
Valley Needlegrass Grassland
Valley Sacaton Grassland
Non-Native Grassland: Broadleaf-Dominated
Foothill/Mountain Perennial Grassland
Transmontane Perennial Grassland
Vernal Pool
San Diego Mesa Vernal Pool
San Diego Mesa Claypan Vernal Pool
Meadows and Seeps
Montane Meadow
Wet Montane Meadow
Dry Montane Meadows
Alkali Meadows and Seeps
Alkali Playa Community
Southern Coastal Salt Marsh
Alkali Marsh
Cismontane Alkali Marsh
Freshwater Marsh
Coastal and Valley Freshwater Marsh
Transmontane Freshwater Marsh
Emergent Wetland
Riparian and Bottomland Habitat

57
Riparian Forests
Southern Riparian Forest
Southern Coast Live Oak Riparian Forest
Southern Arroyo Willow Riparian Forest
Southern Cottonwood-Willow Riparian Forest
White Alder Riparian Forest
Sonoran Cottonwood-Willow Riparian Forest
Mesquite Bosque
Riparian Woodlands
Desert Dry Wash Woodland
Desert Fan Palm Oasis Woodland
Southern Sycamore-Alder Riparian Woodland
Southern Riparian Woodland
Riparian Scrubs
Southern Riparian Scrub
Mule Fat Scrub
Southern Willow Scrub
Arundo donnax Dominant/Southern Willow Scrub
Great Valley Scrub
Great Valley Willow Scrub
Colorado Riparian Scrub
Arrowweed Scrub
Intertidal
Shallow Bay
Estuarine
Saltpan/Mudflats
Woodland
Cismontane Woodland
Oak Woodland
Black Oak Woodland
Coast Live Oak Woodland
Open Coast Live Oak Woodland
Dense Coast Live Oak Woodland
Engelmann Oak Woodland
Open Engelmann Oak Woodland
Dense Engelmann Oak Woodland
Peninsular Pinon and Juniper Woodlands
Peninsular Pinon Woodland
Peninsular Juniper Woodland and Scrub
Elephant Tree Woodland
Mixed Oak Woodland
Undifferentiated Open Woodland
Non-Native Woodland
Eucalyptus Woodland
Mixed Evergreen Forest
Oak Forest
Coast Live Oak Forest
Canyon Live Oak Forest
Black Oak Forest
Torrey Pine Forest
Southern Interior Cypress Forest
Lower Montane Coniferous Forest
Coast Range, Klamath and Peninsular Coniferous Forest
Coulter Pine Forest
Bigcone Spruce (Bigcone Douglas Fir)-Canyon Oak Forest
Sierran Mixed Coniferous Forest
Mixed Oak/Coniferous/Bigcone/Coulter Forest
Jeffrey Pine Forest
Interior Live Oak Chaparral
Southern Maritime Chaparral
Coastal Sage-Chaparral Transition
Montane Buckwheat Scrub

58
Appendix 2.D List of Key Assumptions
Key Assumptions
● Solar is prioritized over wind within San Diego County. ● For CPAs located in San Diego County, cost of transmission interconnection can be approximated
by cost of Euclidian distance from CPA to nearest substation. For CPAs located outside of the county, it is assumed that a transmission upgrade will be required to alleviate the San Diego Internal constraint (see line 5 in table listing transmission upgrade options).
● Total geothermal resource potential identified by E3 and CPUC as part of the statewide Integrated Resource Plan (R-20-05-003) will be operation by 2030.
● Geothermal supply in Imperial is shared with San Diego in an amount equivalent to the ratio of their combined population.
● Electricity demand model results can be downscaled by the ratio of San Diego population to total Southern California population.
● Storage and geothermal will help alleviate intermittency pressures on the grid. ● Cost is a very important criteria for site selection. ● The Overall Energy Model Central Case is the best forecast for the purposes of the spatial analysis. ● The capacity factor is equal to the fixed-tilt solar percentage in the urban areas and tracking solar
in non-urban areas. ● Infill solar sites are grid connected. ● All planned and permitted solar sites in San Diego County will be constructed. ● SANDAG’s Conserved Land areas are undesirable for renewable development.

59
Appendix 2.E List of Spatial Data Sources
Spatial Data Sources
1. Utility-Scale Wind and Solar Polygons: Princeton REPEAT, 2022. https://maps.princeton.edu/catalog?search_field=all_fields&q=netzeroamerica&utf8=%E2%9C%93
2. Infill Solar Polygons: The Nature Conservancy, Power of Place, 2019 (update to 2019 report, not published). https://www.nature.org/en-us/about-us/where-we-work/united-states/california/stories-in-california/clean-energy/
3. Conserved Lands Exclusions: San Diego Association of Governments, 2021. https://rdw.sandag.org/Account/gisdtview?dir=Ecology
4. Existing Utility-Scale Solar and Wind Polygons: Polygons created based on existing and planned sites identified by EIA, 2021 https://www.eia.gov/electricity/data/eia860/
5. Existing Substations: Department of Homeland Security, Homeland Infrastructure Foundation-Level Data, 2021. https://hifld-geoplatform.opendata.arcgis.com/datasets/electric-substations
6. Urban Areas: US Census, 2019. https://catalog.data.gov/dataset/tiger-line-shapefile-2019-2010-nation-u-s-2010-census-urban-area-national
7. Transmission Networks: Department of Homeland Security, Homeland Infrastructure Foundation-Level Data, 2021. https://hifld-geoplatform.opendata.arcgis.com/datasets/electric-power-transmission-lines/explore?location=25.606388%2C-7.477918%2C2.79
8. Geothermal Sites: Points created based on data from E3 and CPUC as part of the statewide Integrated Resource Plan (R-20-05-003) https://www.ethree.com/tools/resolve-renewable-energysolutions-model/
9. Low Environmental Impact CPAs: Wu et al., 2020 Data Github https://github.com/grace-cc-wu/LandUsePathwaysTo100
10. Land Value: USDA Cropland Data Layer https://www.nass.usda.gov/Research_and_Science/Cropland/SARS1a.php
11. High Sequestration Potential: Taken from analysis in the Land Use chapter, the SANDAG “Eco Veg” dataset is used. https://www.sangis.org/
12. Developable Land: Vacant or Agricultural Redevelopment Land Use. SANDAG, Developable Land, 2010. https://www.sandag.org/resources/maps_and_gis/gis_downloads/land.asp
13. Microsoft Building Footprints – Features. 125 million building footprints deep learning generated by Microsoft for the USA. https://hub.arcgis.com/datasets/esri::microsoft-building-footprints-features/about (accessed online December 1 2021.)

60
Appendix 2.F QGIS Processing Modeler
Solar CPAs Modeler
Wind CPAs Modeler
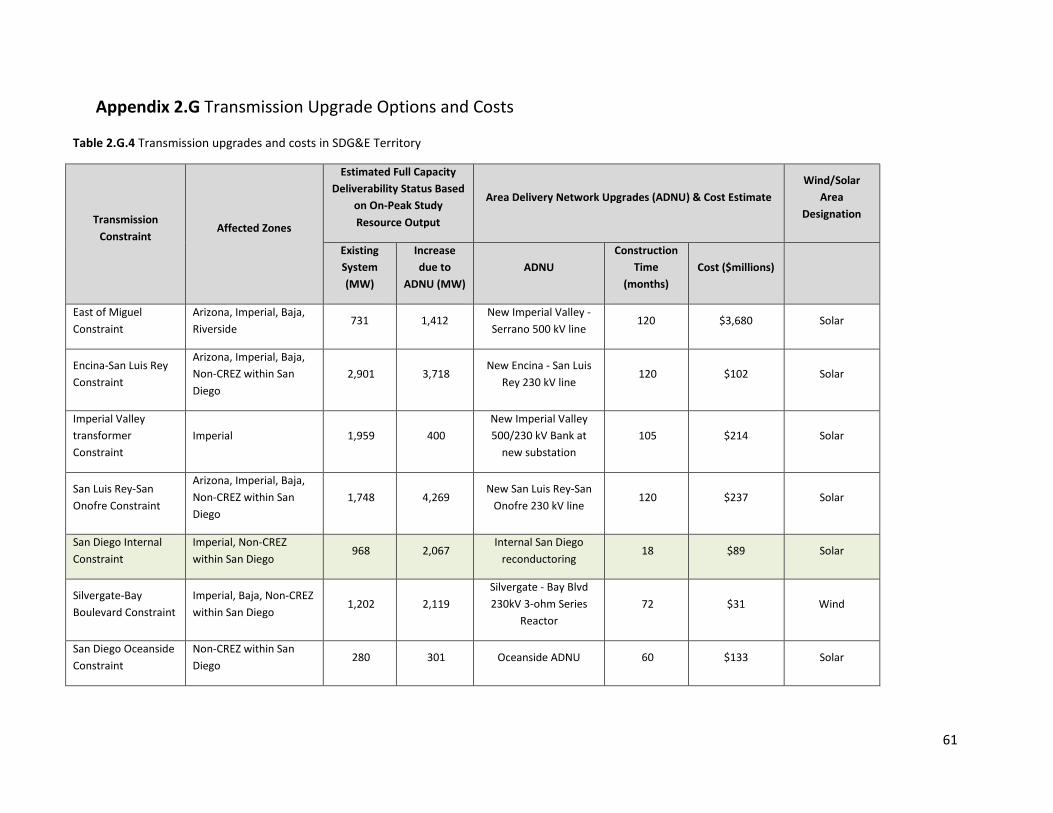
61
Appendix 2.G Transmission Upgrade Options and Costs
Table 2.G.4 Transmission upgrades and costs in SDG&E Territory
Transmission Constraint
Affected Zones
Estimated Full Capacity Deliverability Status Based
on On-Peak Study Resource Output
Area Delivery Network Upgrades (ADNU) & Cost Estimate Wind/Solar
Area Designation
Existing System (MW)
Increase due to
ADNU (MW) ADNU
Construction Time
(months) Cost ($millions)
East of Miguel Constraint
Arizona, Imperial, Baja, Riverside
731 1,412 New Imperial Valley - Serrano 500 kV line
120 $3,680 Solar
Encina-San Luis Rey Constraint
Arizona, Imperial, Baja, Non-CREZ within San Diego
2,901 3,718 New Encina - San Luis
Rey 230 kV line 120 $102 Solar
Imperial Valley transformer Constraint
Imperial 1,959 400 New Imperial Valley 500/230 kV Bank at
new substation 105 $214 Solar
San Luis Rey-San Onofre Constraint
Arizona, Imperial, Baja, Non-CREZ within San Diego
1,748 4,269 New San Luis Rey-San
Onofre 230 kV line 120 $237 Solar
San Diego Internal Constraint
Imperial, Non-CREZ within San Diego
968 2,067 Internal San Diego
reconductoring 18 $89 Solar
Silvergate-Bay Boulevard Constraint
Imperial, Baja, Non-CREZ within San Diego
1,202 2,119 Silvergate - Bay Blvd 230kV 3-ohm Series
Reactor 72 $31 Wind
San Diego Oceanside Constraint
Non-CREZ within San Diego
280 301 Oceanside ADNU 60 $133 Solar

62
3. Accelerating Deep Decarbonization in the Transportation Sector Chelsea Richer, Fehr & Peers Katy Cole, Fehr & Peers Eleanor Hunts, Fehr & Peers Key Takeaways
● Based on the regional policy context, including SANDAG’s 2021 Regional Plan, the County’s Electric Vehicle Roadmap, local jurisdiction policies and guiding documents, and the A2Z Gap Analysis, the region has a strong policy foundation for reducing emissions related to transportation.
● Nevertheless, projected annual emissions in 2045 and 2050 are inconsistent with the levels of reductions required by EO S-3-05, EO B-30-15, and EO-B-55-18 for carbon neutrality.
● This chapter shows where regional opportunity areas exist to accelerate electric vehicle (EV) adoption and vehicle miles traveled (VMT) reduction based on existing countywide policies and patterns of vehicle ownership, travel behavior, and land use development.
3.1 Introduction
Over the last two decades, California has led the country in pioneering a number of policy solutions to mitigate climate change-related hazards and create a sustainable economy. In 2006, the state legislature passed AB 32, which established a program to combat climate change and set a goal to reduce statewide greenhouse gas (GHG) emissions to 1990 levels by 2020. Recognizing that the transportation sector is the largest source of GHG emissions statewide,1 California has adopted several additional transportation-focused measures since that initial landmark climate bill. One such law is the Sustainable Communities and Climate Protection Act of 2008 (SB 375). SB 375 targets cars and light-duty trucks and directs the California Air Resources Board (CARB) to set regional GHG reduction targets for each metropolitan planning organization (MPO). It requires MPOs to incorporate a set of GHG reduction strategies, called a Sustainable Communities Strategy, into their Regional Transportation Plans (collectively known as RTP/SCS).
A series of executive orders signed over the years have further contributed to the state’s climate platform. EO S-3-05 set a goal to reduce GHG emissions to 80 percent below 1990 levels

63
by 2050, B-30-15 set an interim goal of reducing emissions to 40 percent below 1990 levels by 2030, and B-55-18 called for the state to achieve carbon neutrality by 2045 at the latest.
Electrification of end-use services, including vehicles, and decarbonization of electricity generation have been identified as key pathways to achieving a low-carbon future (Appendix A). Additional Executive Orders and state legislation have established targets for Zero Emission Vehicles (ZEVs), Electric Vehicles (EVs), and related charging infrastructure. EO B-48-18 established goals for 200 hydrogen fueling stations and 250,000 EV charging stations (including 10,000 DC fast chargers) to support 1.5 million ZEVs on the road in California by 2025 and 5 million ZEVs on the road by 2030. AB 2127, signed in 2018, requires the California Energy Commission, working with CARB and the Public Utilities Commission (PUC), to prepare a statewide assessment of EV charging infrastructure needed to support levels of EV adoption required to meet the goals of EO-B-48-18. Finally, EO N-79-20 laid out a set of transportation decarbonization targets, including a mandate that 100 percent of in-state sales of new passenger cars and trucks are zero emission vehicles by 2035 and that operations of medium- and heavy-duty vehicles are zero emission vehicles by 2045.
The remainder of this chapter describes the regional policy context for the transportation sector, the modeling efforts that underpin land use and transportation plans in the region, and policy pathways to decarbonization through accelerated adoption of EVs, accelerated reduction of vehicle miles traveled (VMT), and continued investment in vehicle and fuel technology.
3.2 Regional Policy Context
The San Diego region has undertaken a number of transportation decarbonization efforts to date, which have included a variety of VMT reduction strategies and vehicle electrification strategies. This section details the relevant policy documents that will continue to shape the San Diego region’s ability to reach accelerated decarbonization targets.
3.2.1 SANDAG’s 2021 Regional Plan & 5 Big Moves
The San Diego Association of Governments (SANDAG) is the MPO for the San Diego region and has recently adopted the 2021 Regional Plan, a blueprint for land use and transportation planning in the San Diego region through 2050. This plan serves as the RTP/SCS and provides the big-picture vision for the future as well as an implementation program to make the region’s transportation system “faster, fairer, and cleaner.” The 2021 Regional Plan identifies a 2030 target of 771,000 EVs on the road in the San Diego region, supported by 155,200 chargers.2

64
The 2021 Regional Plan articulates their future investments around the 5 Big Moves, an aspirational vision that provides a framework for the 2021 Regional Plan. The 5 Big Moves include VMT reduction strategies and strategies that encourage electrification of surface transportation vehicles.3 Over the next 30 years, SANDAG will refine the transportation network and discuss a set of policies and programs to support the following planned infrastructure and technology improvements. The five strategies in the plan are Complete Corridors, Transit Leap, Mobility Hubs, Flexible Fleets, and Next Operating System.
1. Complete Corridors would provide a balanced and inclusive road and highway network to maximize capacity, reduce congestion, and enable a variety of travel choices. Key features include managed lanes, Active Transportation and Demand Management (ATDM)i, smart high-speed communication networks, priority for shared transportation modes, and curb management. Complete Corridors are the backbone for the Flexible Fleets and Transit Leap strategies.
2. Transit Leap would complement Complete Corridors by creating a comprehensive network of high-speed, high-quality transit services that connect residential areas with employment centers and attractions. Future transit services would build upon existing ones through expanded service times, higher frequency and capacity, transit priority, and better integration with other services.
3. Mobility Hubs are envisioned as a network of connected places with land use supportive of integrated mobility services and amenities, reducing the distance people need to travel to reach key destinations and enabling more transit, walking and biking. Mobility hub area amenities include interactive trip planning kiosks, electric vehicle charging, passenger loading areas, and secure parking for bicycles. SANDAG’s proposed network is comprised of the San Diego urban core, plus 30 surrounding mobility hub areas. Mobility Hub prototypes have been developed for eight stops along the Mid-Coast Trolley route and eight additional locations across the region.
4. Flexible Fleets describes the strategy of shared, on-demand transportation services which include micromobility, rideshare, microtransit, ride hailing, and last-mile delivery. This strategy relies on public-private partnership and assumes many of the new modes introduced would be electric-powered.
5. Next Operating System (OS) is a digital platform that compiles information from various parts of the transportation system into a centralized data hub, linking residents, businesses, and operators to real-time transportation data, and providing planners and
i The Active Transportation and Demand Management (ATDM) program is intended to support agencies and regions considering moving toward an active management approach. It involves dynamic demand management, traffic management, parking management, and efficient utilization of other transportation modes and assets. Under an ATDM approach, the transportation system is continuously monitored and actions are performed in real-time to achieve or maintain system performance.
65
policymakers with a new repository for analysis. Next OS also includes Intelligent Transportation Systems (ITS) strategies that can reduce VMT, such as expansion of broadband to enable remote work and apps to enable payment for mobility services.
The 5 Big Moves are strategies that directly and indirectly reduce VMT and accelerate EV adoption. In addition, Next OS is an underpinning strategy to improve data about the transportation sector so that it can continue to be analyzed and optimized over time.
3.2.2 Accelerate to Zero Emissions Electric Vehicle Gap Analysis (2021)
The Accelerate to Zero (A2Z) Emissions Collaborative is an initiative by regional organizations invested in advancing transportation electrification, including the City and County of San Diego, the San Diego Air Pollution Control District, SANDAG, and San Diego Gas & Electric (SDG&E). In July 2021, it published the San Diego Regional Electric Vehicle Gap Analysis which identified existing efforts and conditions and evaluated zero-emission infrastructure gaps and barriers. As the A2Z Emissions Collaborative continues its work, the EV Gap Analysis will facilitate prioritizing “Communities of Concern” for transportation decarbonization investments. The Gap Analysis identifies a 2030 target of 771,000 EVs on the road in the San Diego region, supported by 139,000 Level 2 chargers, 16,200 DC fast chargers, and 47 hydrogen fueling stations.4 The A2Z Emissions Collaborative anticipates completing a Regional Strategy by April 2023, which will guide the region in electrifying light duty, medium duty, and heavy duty vehicles and infrastructure.
3.2.3 San Diego County’s Electric Vehicle Roadmap (2019)
The County of San Diego adopted an Electric Vehicle Roadmap in October 2019, which contains six goals and 11 recommendations that leverage the County’s land use authority, permitting processes, and outreach platforms in order to increase EV ownership and charging installations in the unincorporated area and at County facilities.5 These are summarized in Table 3.1, below. Because this document relates primarily to the unincorporated area of San Diego, the numbers reported for 2030 EV targets and charger targets are substantially different from the more current SANDAG or A2Z numbers. The EV Roadmap supports the 2018 Climate Action Plan adopted by the County of San Diego.

66
Table 3.1. Summary of actions in San Diego County’s 2019 Electric Vehicle Roadmap. This table shows the goals, associated targeted outcomes, and recommendations in the roadmap.
Goal Targeted Outcome Recommendations County Operations Recommendations 1. Further reduce the County’s fleet of gas-powered vehicles.
Increase the number of EVs in the County’s fleet to 501 by 2027.
Amend three Board policies to assist fleet EV conversion by requiring new light-duty vehicles to be EV. Convert 250 County fleet gas-powered vehicles to EVs by 2025 and install necessary infrastructure. Convert an additional 251 County fleet gas-powered vehicles to EVs for a total of 501 by 2027 and install necessary infrastructure. Keep pace with technological trends, track the costs and benefits of fleet conversion, and update the Green Fleet Action Plan no later than 2025 to set goals for medium- and heavy-duty fleet vehicle conversions.
2. Accelerate the installation of EV charging stations at public locations in County facilities and in the unincorporated County.
Contribute to the regional EV charging network by installing 2,040 Level II charging stations at County facilities and throughout the unincorporated area by 2028.
Amend Board policy G-15, “Design Standards for County Facilities” by 2019 to require charging infrastructure development at new County facilities. Install an additional 63 publicly accessible EV charging stations for a total of 100 chargers at County facilities by 2021.
Prepare an EV charger site assessment for County facilities and the unincorporated area and install 2,040 Level II chargers.
3. Promote and incentivize County employee EV ownership.
Increase County employee EV ownership and use to reduce employee commute emissions.
Promote and incentivize County employee EV use by developing partnerships with banks, credit unions, and dealerships to extend lending and pricing benefits.
Unincorporated Area Recommendations 4. Incentivize and/or require EV charging infrastructure in new and existing private multi-family residential and/or non-residential development.
Increase charging station installations in new and existing private development.
Prepare a cost-benefit analysis of options to incentivize and/or require EV charger installations in private development.

67
5. Fund EV expert/consumer advocate as a regional resource.
Increase EV ownership and charging station installations through education, outreach, regional collaboration, and incentives.
Identify regional partners and cost sharing opportunities to fund a regional EV expert/consumer advocate on an ongoing basis.
6. Collaborate with regional partners to support public and private fleet electrification.
Increase EV use in regional light-, medium-, and heavy-duty fleets.
Develop public and private regional partnerships to provide fleet electrification technical support on an ongoing basis.
3.2.4 San Diego County’s Climate Action Plan (2018)
Through Climate Action Plans (CAPs), both the County of San Diego and many cities within the region have set out a series of measures to reduce GHG emissions over the coming decades. The County’s 2018 CAP, which is currently being revised to achieve compliance with the California Environmental Quality Act (CEQA), included 11 strategies and 26 measures which focus on activities that occur within the unincorporated area of the region and within County-owned facilities.5 The framework for the 2018 CAP is the GHG emissions inventory (baseline year 2014) and the state’s GHG reduction targets. San Diego County set total emissions targets of 3,147,275 and 1,926,903 MTCO2e for 2020 and 2030, respectively. Measures in the Built Environment and Transportation GHG emissions sector specifically are projected to help the County achieve reductions of 233,758 MTCO2e in 2030.6
3.2.5 City of San Diego’s Climate Action Plan (2015)
The City of San Diego adopted its landmark CAP in 2015 and projected that its implementation would help the city surpass the target of 51 percent below 2010 GHG emissions by 2035 and maintain its trajectory to meet its proportional share of the 2050 state target. Among the local strategies for achieving the GHG reduction targets are a range of activities that aim to decrease transportation-related emissions by improving mobility and reducing VMT. Specific implementation measures involve changing land uses, promoting alternative modes of travel, and enhancing vehicle fuel efficiency. As the largest jurisdiction in the region, the policies and actions of the City of San Diego can help provide resources and examples against which other jurisdictions can model their approach (more details on regional collaboration can be found in Chapter 7).
3.2.6 Summary of Additional State, Regional, and Local Goals and Actions
In addition to the County and City of San Diego’s CAPs, the majority of jurisdictions in the region have also adopted CAPs, with relevant goals around VMT reduction, EV adoption, and emissions reductions for the transportation sector. Some have additionally developed targets and taken actions related to the adoption of EVs and/or the implementation of charging infrastructure.

68
This regional context was included in the A2Z Gap Analysis; the information in that document has been updated as part of this report and is summarized in Table 3.2 below. Table 3.2 San Diego regional jurisdictions’ relevant goals, targets, and actions that are relevant to transportation decarbonization.
Jurisdiction Relevant Goals, Targets, and Actions Regional and State Agencies Caltrans District 11 ● Currently partnering with SDG&E to provide charging at park and ride facilities
throughout the region. ● Installing corridor charging at rest areas and remote inter-city travel locations.
County of San Diego
● Established streamlined permitting processes in 2017, compliant with AB 1236, to encourage EV charging infrastructure in new developments.
● Adopted the Electric Vehicle Roadmap in 2019. North County Transit District
● Developed a Zero Emissions Bus Rollout Plan, detailing full transition by 2042. ● Planning to purchase six battery electric and eight hydrogen fueled buses by 2023.
Port of San Diego ● Adopted the Maritime Clean Air Strategy to help the Port identify future projects and initiatives to improve health through cleaner air for those who live, work, and play on and around San Diego Bay.
SANDAG ● Adopted Regional EV Readiness Plan in 2014 and launched Plug-In San Diego in 2015. ● Committed $2b for transportation electrification programs through 2050, including:
o $45m through 2025 to support build-out of Level 2 charger network. o $52m through 2025 to a new regional zero-emission vehicle incentive program. o $100m through 2025 for zero-emission buses, zero-emission trucks, and
associated infrastructure. ● Identified additional electrification and mode-shift opportunities through the 2021
Regional Transportation Plan and associated Big 5 Moves. ● Providing climate planning services for local jurisdictions, including the Regional
Climate Action Planning (ReCAP) Framework and preparation of ReCAP Snapshots to assist local jurisdiction in monitoring CAP implementation.
● Administering the Smart Growth Incentive Program, Active Transportation Grant Program, Housing Acceleration program, and iCommute programs.
San Diego County Air Pollution Control District (SDAPCD)
● Developed Community Emissions Reductions Plans to reduce cumulative exposure to air pollution in individual communities, such as the Portside Communities CERP in 2021.
● Administering grant funding through various incentive programs such as the Carl Moyer Program, which encourages a transition to cleaner-than-required engines, equipment, and other sources of air pollution.
San Diego Metropolitan Transit System
● Developed a transition plan to convert its fleet of 800 buses to zero emissions by 2040.
● Acquired thirteen battery electric buses by 2021 and will acquire a total of 25 by the end of 2022.
Cities Carlsbad ● Adopted residential and non-residential ordinances for EV parking.
● Adopted 2011 CAP goal to increase ZEV miles from 4.5% to 25% by 2035.

69
Chula Vista ● Currently, has 31% of alternatively-fueled fleet vehicles; continuing to work towards their CAP goal of 40% by 2020.
● Installed around 120 chargers for their fleet vehicles. Coronado ● Identified “greening” the city’s 100 fleet vehicles as a way to reduce transportation
emissions. Del Mar ● Adopted CAP goal to increase alternatively-fueled VMT to 20% in 2020 and 30% in
2035. ● Adopted CAP goal to set aside 10% of on-street parking and in city lots for high-
efficiency and clean vehicles by 2020. El Cajon ● Plans to install 128 new EV charging stations at commercial developments and 79
new EV charging stations at multi-family developments by 2030. Encinitas ● Requires new residential units to install EV charging infrastructure.
● Multi-family developments must include EV charging infrastructure at 5% of the total number of parking spaces.
Escondido ● Plans to install 281 EV charging stations in park and ride lots by 2035. Imperial Beach ● Encourages developers to install EV charging infrastructure for new and retrofit
developments. ● Planning to assess municipal fleet replacement timeline for switching to ZEVs.
La Mesa ● Partnered with SANDAG, SDAPCD, and local developers to develop strategies to increase EV infrastructure at existing multi-family complexes.
Lemon Grove ● Plans to adopt a zoning ordinance requiring installation of EV charging infrastructure at 5% of the total number of parking spaces at new multi-family and commercial developments.
National City ● Installed charging stations at City Hall. ● Partnered with SDG&E to install EV charging infrastructure across the City.
Oceanside ● Plans to require new single-family developments to include prewiring to enable 240-volt charging.
Poway ● Installed 11 EV charging stations around the City. San Diego ● Adopted CAP goal to convert 90% of gas-powered municipal fleet vehicles to zero
emission by 2035.i ● Installed 57 public EV charging stations at City facilities.
San Marcos ● Require new multi-family and commercial developments to include EV charging infrastructure at 5% of total number of parking spaces.
Santee ● Requires all new residential and commercial developments to install e-chargers. Solana Beach ● Collaborating with SANDAG to increase EVs in the City. Vista ● Requires new multi-family developments to have 3% of total parking spaces equipped
with EV charging infrastructure. ● Requires new commercial developments to have 6% of total parking spaces equipped
with EV charging infrastructure. Sources: San Diego Regional EV Gap Analysis, July 2021; SANDAG 2021 Regional Plan.
i The City of San Diego’s current CAP was adopted in 2015. At the time of this publication, the city was in the process of gathering public comment on its 2021 CAP. The finalized 2021 plan may include additional commitments and/or stronger commitments for municipal fleet vehicles.
70
3.3 Transportation Modeling & Emissions Forecasts
In support of this report, Fehr & Peers has undertaken a review of the assumptions and outcomes of the San Diego Association of Governments (SANDAG) regional model and Evolved Energy’s EnergyPATHWAYS model described in Appendix A. There are fundamental differences between the two models. SANDAG uses an activity-based model (ABM) that simulates individual and household transportation decisions at a detailed level. The most current model is ABM2+, which is being used to support the 2021 Regional Plan. EnergyPATHWAYS estimates energy use and GHG emissions given a specific electrification trajectory and fleet composition.
SANDAG’s ABM2+ simulates travel behavior in the San Diego region using land use and transportation network data to estimate VMT and estimate corresponding GHG emissions. ABM2+ starts with a street-based active transportation network, a highway network, and a transit network. The resident transportation model, disaggregate models, and aggregate models are executed, and the resulting trip tables are summed up and used by an iterative traffic assignment process. The outputs – specifically, VMT by speed bin and vehicle classification – are then converted off-model to greenhouse gas emissions using Emission Factors (EMFAC) emissions factors.
EnergyPATHWAYS is a stock accounting tool from Evolved Energy that quantifies all energy infrastructure. The transportation portion of the model uses service demand projections, existing vehicle stock, and efficiency measures to estimate total emissions. The model can be made applicable to varying geographies across the nation by modifying the underlying parameters. In the context of California, it uses the 100% zero-emission vehicle (ZEV) sales by 2035 goal and makes assumptions about adoption of EV technologies.i In this model, decarbonization comes from fuel shifts, not mode shifts. As such, many factors that are central to ABM2+, such as VMT, are not considered.
For the purposes of this chapter, the 2021 Regional Transportation Plan and SANDAG’s ABM2+ are discussed further. At the conclusion of this chapter, Appendix 3.A provides a summarized comparison between the two models. Appendix A of the report provides full technical documentation for the EnergyPATHWAYS model.
3.3.1 SANDAG Emissions Forecasts
As described above, SANDAG’s 2021 Regional Plan includes policy and transportation investment initiatives that are referred to as the 5 Big Moves, which include Complete Corridors, Transit Leap, Mobility Hubs, Flexible Fleets, and Next Operating System. Together, these five key strategies for mobility aim to deliver an efficient and equitable transportation
i For more information on the EER modeling assumptions, see Appendix A.

71
system that meets regional per capita GHG reduction targets assigned by the California Air Resources Board. However, these policies and actions are not sufficient on their own to meet the requirements of EO S-3-05 and EO B-55-18, as described in the emissions forecasts included in the 2021 Regional Plan EIR. In order to reach deep decarbonization goals, additional efforts such as the policies described in section 3.5 of this chapter will be necessary both to rapidly electrify the surface transportation sector and to reduce VMT.
The EIR for the 2021 Regional Plan evaluates environmental impacts related to regional growth and land use change as well as the transportation network improvements and programs of the 5 Big Moves together because the per-capita CO2 emissions from vehicles addressed by state targets are influenced by the combined effects of both components. ABM2+ models the effect of the 5 Big Moves in conjunction with the rest of the 2021 Regional Plan through four forecast scenarios: Baseline Year 2016, interim years 2025 and 2035, and Horizon Year 2050.
Compared to existing conditions, the EIR reports that the regional growth, land use change, and transportation network improvements included in the 2021 Regional Plan would result in a reduction of GHG emissions across all sectors for all interim and horizon years. These reductions are summarized in Figure 3.1, which shows GHG impact of Passenger Cars and Light-Duty Vehicles with and without the SAFE Rule Impact (the SAFE Rule sets national fuel economy standards instead of California standards). Passenger Cars and Light-Duty Vehicles emissions are also forecasted to decrease for all interim and horizon years. Heavy-Duty Trucks and Vehicles emissions are forecasted to remain the same from 2025 onward. Rail emissions are forecasted to increase between 2016 and 2050. Projected annual emissions in 2045 and 2050 (18 MMTCO2e across all sectors and 7.5 MMTCO2e for the Surface Transportation sector, including Passenger & Light-Duty with no SAFE Rule impact, Heavy-Duty & Trucks, and Rail) would be inconsistent with the levels of reductions required by EO S-3-05, EO B-30-15, and EO-B-55-18.i
Per SB 375, specific GHG emissions reduction targets for the transportation sector are not yet established for Horizon Year 2050, but the target established for SANDAG for 2035 is to reduce per capita CO2 emissions from passenger cars and light-duty vehicles to 19 percent below 2005 levels. As shown in Table 3.3, implementation of the 2021 Regional Plan would reduce per capita CO2 emissions from this sub-sector of Surface Transportation to 20 percent below 2005 levels by 2035, and therefore would meet SB 375 targets.
i EO S-3-05 requires a reduction of GHG emissions to 80 percent below 1990 levels by 2050. EO B-30-15 requires a reduction of GHG emissions to 40 percent below 1990 levels by 2030. EO B-55-18 requires carbon neutrality across all sectors by 2045.
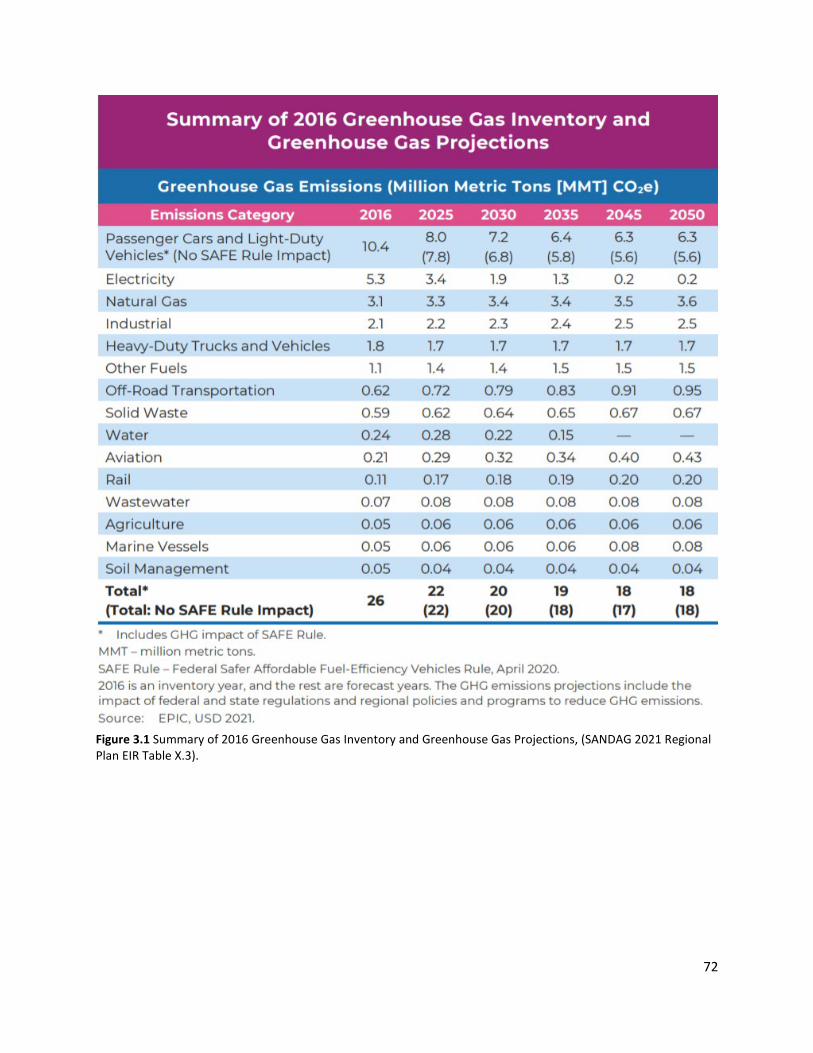
72
Figure 3.1 Summary of 2016 Greenhouse Gas Inventory and Greenhouse Gas Projections, (SANDAG 2021 Regional Plan EIR Table X.3).

73
Table 3.3 SB 375 GHG reduction targets under the proposed plan from passenger vehicles and light-duty trucks, 2035, (2021 Regional Plan EIR Table 4.8-9).
Per Capita Reductions from 2005 Levels
Per Capita Reduction under the Proposed Plan (On-Model Results Only) -19.30% Per Capita Reduction under the Proposed Plan (Off-Model Results Only) -3.03% CARB Adjustment Factor for EMFAC 2007–2014 1.70% Induced Demand Adjustment Factor 0.20% Per Capita Reductions -20.40% CARB Target -19%
3.4 Decarbonization Strategies: Policy Pathways to Close the Emissions Gap
Based on the regional policy context summarized above, including SANDAG’s 2021 Regional Plan, the County’s Electric Vehicle Roadmap, local jurisdiction policies and guiding documents, and the A2Z Gap Analysis, the San Diego region has a strong policy foundation for reducing emissions related to transportation. The remainder of this section describes the ways in which the region’s jurisdictions can accelerate actions needed to achieve regional decarbonization of the transportation sector through accelerated alternative vehicle and fuel technology improvements, and accelerated VMT reduction.
3.4.1 Accelerate Alternative Fuel and EV Adoption
Alternative fuels for transportation are those derived from sources other than petroleum. Electricity is a cost-effective, secure, and powerful alternative fuel that has been the focus of decarbonization in the transportation sector, especially in passenger vehicles and transit vehicles. Within the 5 Big Moves and the 2021 Regional Plan more broadly, electrification is identified as a major factor in reaching regional GHG emissions reduction targets in the following ways:
● Establishes programs to incorporate EVs into Flexible Fleets and Transit Leap
● Includes incentive programs that could increase the number of EVs and charging stations throughout the region and within Mobility Hub areas
Complete Corridors support alternatives to single occupancy driving, including modes such as transit, shared rides, and active transportation, and would help the San Diego region reach its 2030 electrification goals. The 2021 Regional Plan supports electrification of the region’s transit buses and supports the state’s Innovative Clean Transit regulation. Per the plan documentation, it is likely that future high-speed rail projects will be powered by a combination of both diesel and electricity. In order to accelerate electrification through this strategy, SANDAG would need to adopt an aggressive implementation timeline for Complete Corridors and Transit
74
Leap, focusing on implementation in the parts of the region where transit will be most viable and well-utilized.
The 5 Big Moves documentation also mentions several partnerships and policies that can assist with public charging and hydrogen fueling stations build-out. These include the CALeVIP San Diego County Incentive Project, which in late 2020 began providing rebates for placement of public level 2 and direct current fast charging stations, and coordination with SDG&E to manage the demands that EV charging places on the grid. SANDAG and SDG&E are also working to provide programs that install charging stations for workplaces, multi-unit dwelling communities, and medium- and heavy-duty vehicles. In order to accelerate electrification through this strategy, SANDAG and SDG&E would need to increase the levels of incentives and rapidly advance EV charging infrastructure installations, focusing first on Communities of Concern (CoCs) and then in places where transit is not yet viable.
In addition to the 5 Big Moves components related to electrification, San Diego regional actions and policies to accelerate EV adoption are articulated in the A2Z EV Gap Analysis. Although the main goal of the Gap Analysis was to identify needs in order to inform a long-term strategy, the report captured some initial solutions. These include:
● Decreasing the upfront costs of EV ownership through incentives, targeting the new and secondary market
● Leveraging cooperative buying for medium- and heavy-duty fleets
● Exploring alternatives to vehicle-purchase incentives, including low-emission zones, EV mandates, ordinances, or registration controls to enforce emissions standards
● Streamlining permitting for charging infrastructure
● Prioritizing infrastructure in communities of concern
● Coordinating education campaigns for end users, property owners, and frontline salespeople
● Providing workforce training for commercial drivers and automotive maintenance workers
3.4.2 Downscaled Geographic EV Adoption Targets The 2021 Regional Plan identifies an EV population target of 771,000 across the San Diego region by 2030, of which approximately 762,000 are light-duty vehicles or Transportation Network Companies (TNCs). Based on the current distribution of registered EVs in the region, we identified which jurisdictions will need to accelerate adoption policies most aggressively to meet the stated goals. Table 3.4 shows the share of regional population within each San Diego regional jurisdiction, the share of total regional VMT, the current number of EVs, the current number of vehicles, and the proportion of EVs as a share of each jurisdiction’s vehicle

75
population. Figure 3.2, following the table, shows the share of EVs as a proportion of all vehicles, by jurisdiction. Table 3.4 Jurisdiction-level EV population, population share, and VMT share in the San Diego region.
Jurisdiction Total # EVs
(2020)
Total # Vehicles
(including EVs) (2020)
Share % of Total Vehicles that are
EVs (2020)
Total Vehicle
Ownership Share % (2020)
Share of Regional
Population (2019)
Share of Regional
VMT (2012)
Unincorporated San Diego County
7,838 473,689 1.7% 16.9% 11.1% 15%
Carlsbad 3,804 92,092 4.1% 3.3% 3.5% 4.5% Chula Vista 2,708 205,797 1.3% 7.3% 8.0% 5.7% Coronado 395 12,727 3.1% 0.5% 0.7% 1.0% Del Mar 861 13,358 6.4% 0.5% 0.4% 0.3% El Cajon 1,183 126,488 0.9% 4.5% 5.2% 2.9% Encinitas 2,318 51,148 4.5% 1.8% 1.9% 2.1% Escondido 2,222 139,093 1.6% 5.0% 5.4% 4.5% Imperial Beach 128 17,299 0.7% 0.6% 0.8% [n.d.]i La Mesa 967 54,751 1.8% 2.0% 2.2% 1.9% Lemon Grove 145 20,861 0.7% 0.7% 0.8% 0.6% National City 145 42,934 0.3% 1.5% 1.9% 1.7% Oceanside 1,979 112,863 1.8% 4.0% 4.7% 4.3% Poway 1,240 40,736 3.0% 1.5% 1.5% 1.9% San Diego 25,337 1,179,150 2.1% 42.1% 43.1% 46.3% San Marcos 1,876 73,657 2.5% 2.6% 3.0% 2.7% Santee 544 44,691 1.2% 1.6% 1.7% 1.4% Solana Beach 554 10,580 5.2% 0.4% 0.4% 0.6% Vista 1,208 88,872 1.4% 3.2% 3.6% 2.6% TOTAL 55,452 2,800,786 n/a 100% 100% 100%
Notes: 1. EV population and total vehicle population data from California Energy Commission (2020).7 2. Population data from American Community Survey 5-Year Estimates (2015-2019),8 extracted by zip code. Zip codes were classified into the 19 jurisdictions above per the County of San Diego Superior Court zip code directory. Zip codes whose geographic boundaries fell into multiple jurisdictions were reviewed using aerial imagery to determine land use and classified into the jurisdiction with the greatest overlap of urban use. 3. VMT data from SANDAG ABM1 (2012).9 Total VMT is calculated using the Origin-Destination method at the TAZ level and then aggregated to the jurisdictional level, which may result in some double-counting of trips but overall reflects a reasonable proportional share of the County’s VMT.
i No VMT data were available for Imperial Beach at the time of the analysis.
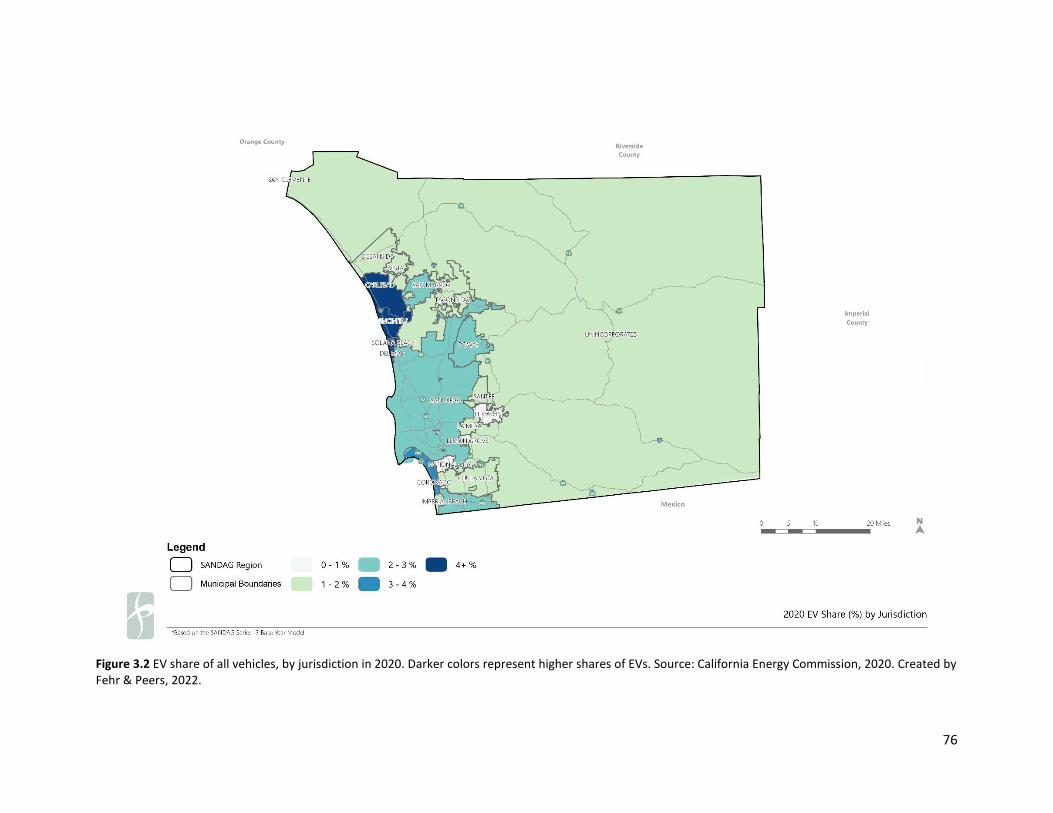
76
Figure 3.2 EV share of all vehicles, by jurisdiction in 2020. Darker colors represent higher shares of EVs. Source: California Energy Commission, 2020. Created by Fehr & Peers, 2022.

77
In order to show where policy efforts can be focused to help accelerate EV ownership efforts, the countywide 2030 EV targets can be downscaled to the jurisdictional level. Table 3.5 shows the future target number of EVs based on three alternative methods of calculation:
● Based on population share ● Based on VMT share ● Based on vehicle ownership share
There is no perfect way to downscale EV targets to the local jurisdictional level. Basing the future target on population would follow the A2Z approach to determining the target number of EVs in the San Diego region as a proportion of California’s targets. However, this would produce an overestimated target in places where vehicle ownership rates are lower than average. Basing the future target on VMT would produce more aggressive targets in places where people drive longer distances. Basing the future target on vehicle ownership would reify the existing vehicle ownership patterns, which reflect the current inequities of EV ownership due to the cost of purchasing a vehicle as well as existing land use and travel behavior patterns. These travel patterns may change in the future as a result of future land use development patterns, encouraging more transit-oriented development (discussed further in the section to follow). These downscaled targets are intended therefore to reflect a range of reasonable order of magnitude for each jurisdiction’s EV population in 2030. To support the local acceleration of EV adoption towards the targets identified above, it will also be necessary to accelerate the rollout of EV charging infrastructure. The County and SANDAG can enhance the Plug-In San Diego Electric Vehicle Charging Map to provide improved modeling for charging infrastructure location suitability at a regional scale.i SANDAG and the County can collaborate with local jurisdictions to encourage them to undertake a local EV Infrastructure Siting Plan, to identify more granular placement locations, and to support infrastructure investments in Communities of Concern.ii
i The Plug-In San Diego EV Charging Stations Map can be found at https://evcs.sandag.org/, which includes methodological information about how the TAZs were analyzed to identify EV trip end percentiles. ii Pursuant to Title VI, Executive Order 12898 and the 1999 Department of Transportation Memorandum “Implementing Title VI Requirements in Metropolitan and State Planning,” SANDAG’s Regional Planning Stakeholders Working Group defined four types of “Communities of Concern” (Low Income Community of Concern, Minority Community of Concern, Low Mobility Community of Concern, and Low Community Engagement Community of Concern) as part of its 2050 RTP social equity analysis. Selection criteria are detailed at length in Chapter 4 of the SANDAG 2050 Regional Transportation Plan.
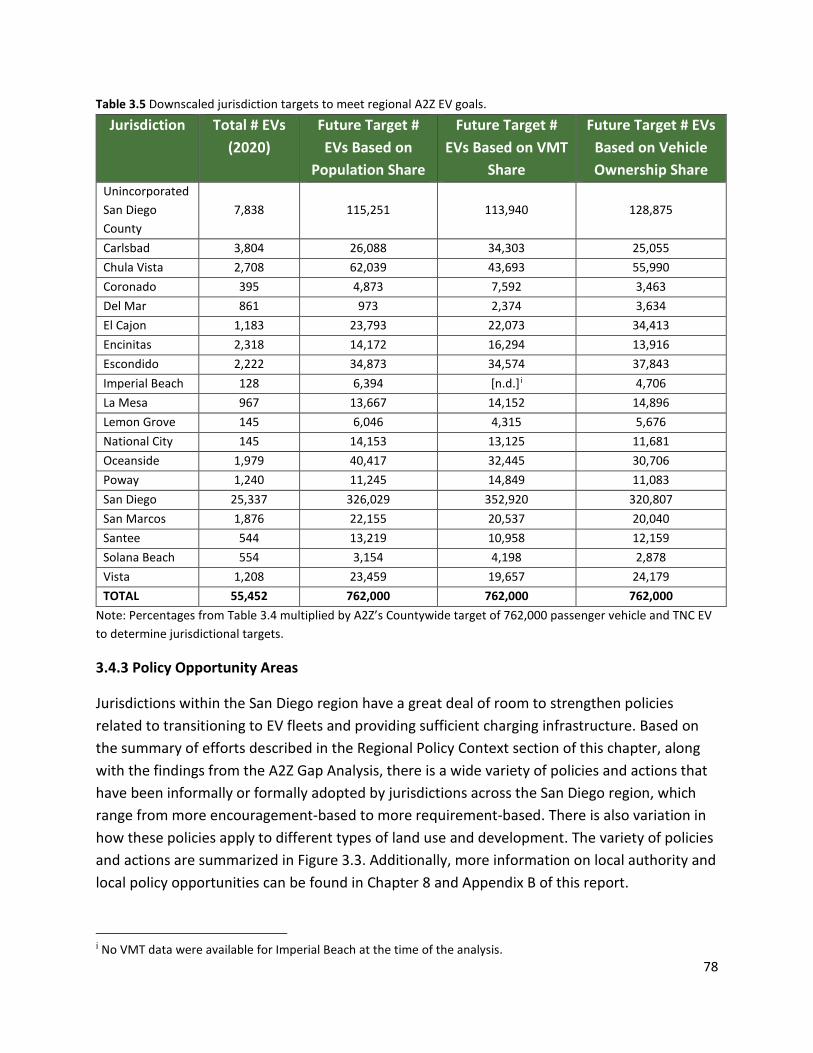
78
Table 3.5 Downscaled jurisdiction targets to meet regional A2Z EV goals.
Jurisdiction Total # EVs (2020)
Future Target # EVs Based on
Population Share
Future Target # EVs Based on VMT
Share
Future Target # EVs Based on Vehicle Ownership Share
Unincorporated San Diego County
7,838 115,251 113,940 128,875
Carlsbad 3,804 26,088 34,303 25,055 Chula Vista 2,708 62,039 43,693 55,990 Coronado 395 4,873 7,592 3,463 Del Mar 861 973 2,374 3,634 El Cajon 1,183 23,793 22,073 34,413 Encinitas 2,318 14,172 16,294 13,916 Escondido 2,222 34,873 34,574 37,843 Imperial Beach 128 6,394 [n.d.]i 4,706 La Mesa 967 13,667 14,152 14,896 Lemon Grove 145 6,046 4,315 5,676 National City 145 14,153 13,125 11,681 Oceanside 1,979 40,417 32,445 30,706 Poway 1,240 11,245 14,849 11,083 San Diego 25,337 326,029 352,920 320,807 San Marcos 1,876 22,155 20,537 20,040 Santee 544 13,219 10,958 12,159 Solana Beach 554 3,154 4,198 2,878 Vista 1,208 23,459 19,657 24,179 TOTAL 55,452 762,000 762,000 762,000
Note: Percentages from Table 3.4 multiplied by A2Z’s Countywide target of 762,000 passenger vehicle and TNC EV to determine jurisdictional targets.
3.4.3 Policy Opportunity Areas
Jurisdictions within the San Diego region have a great deal of room to strengthen policies related to transitioning to EV fleets and providing sufficient charging infrastructure. Based on the summary of efforts described in the Regional Policy Context section of this chapter, along with the findings from the A2Z Gap Analysis, there is a wide variety of policies and actions that have been informally or formally adopted by jurisdictions across the San Diego region, which range from more encouragement-based to more requirement-based. There is also variation in how these policies apply to different types of land use and development. The variety of policies and actions are summarized in Figure 3.3. Additionally, more information on local authority and local policy opportunities can be found in Chapter 8 and Appendix B of this report.
i No VMT data were available for Imperial Beach at the time of the analysis.

79
Policies shown on the left of Figure 3.3 will likely be insufficient to meet aggressive EV adoption goals, whereas policies shown on the right would be more effective at meeting aggressive EV adoption goals due to their more expansive coverage. Policies on the top of Figure 3.3 have a narrower application and policies on the bottom can be applied more broadly. Thus, policies farther to the right and farther to the bottom are likely to be both the most effective and to have the broadest impact. For example, policies that require jurisdictions to provide EV chargers in lots that they own and control may be easier to implement, but will have less of an impact compared to a policy that requires private developers to install chargers at a high percentage of their parking spaces, across all land use types (commercial, residential, etc.), at new development and retrofitting infill sites with additional support for multi-family and communities of concern.
Figure 3.3 A spectrum of policy options to accelerate EV adoption. Policies are likely to be more effective moving right and are likely to have a broader application moving down. Thus, the bottom right is predicted to be the most effective and to have the broadest application of the policy measure shown where the top left is predicted to be the least effective and to have the narrowest application of the policy measures shown.
In order to accelerate decarbonization most effectively, the regional jurisdictions can consider moving their own policies along the spectrum from more encouragement-based to more requirement-based, and by expanding the reach of requirements and ordinances to cover more land use contexts. To support the accelerated adoption of the strongest and most effective

80
policies, jurisdictions in the region can offer more appealing incentives to developers for installing charging equipment, streamline development processes and infill benefits, and provide readily accessible information for property owners and vehicle owners.
Where collaboration across jurisdictions is required, the County or a Decarbonization Regional Steering Committee proposed in Chapter 7 can promote partnership across jurisdictions to support workforce development goals, share information and lessons learned, and support state-level advocacy to bring implementation funding to the San Diego region. Table 3.6 summarizes ways in which the County and other jurisdictions within the region can implement these actions and policies or partner to make progress. 3.4.4 Alternative Fuels
For some transportation modes, the path to decarbonization may be a transition to renewable fuels such as hydrogen, natural gas, propane, and vegetable- and waste-derived oils, rather than a fully electrified fleet. Electricity-powered batteries currently do not have the capacity to support large elements of the regional transportation system such as shipping, long-haul trucking, and aviation. These elements may rely on alternative fuels other than electricity and development of technology and infrastructure to support them. Among the co-benefits of investing in alternative fuel production and transmission is the opportunity to transition workers out of gas and fossil fuel industries into new green jobs. A waste-to-energy fuel source would have the co-benefit of reduced waste in landfills. Though decarbonization of these transportation methods, such as aviation, shipping, and long-haul trucking, are outside of the scope of this analysis, they are worthy of additional study.
Many of these technologies are still under development. Until there is a clear pathway to deploying these alternative fuel options, the County and other jurisdictions can support these alternative fuels primarily through collaboration, investment, and partnership in research opportunities, and by participating in regional efforts to advance the field. Once technological solutions are available and commercially viable for these fuel sources, the Regional Decarbonization Framework and its implementation plans should be updated and revisit the approach to planning, funding, and coordinating infrastructure build outs with utility operators.

81
Table 3.6 Electrification strategies and implementation approach, including partnership opportunities across jurisdictions and with agencies.
Strategy Partnership Opportunity
County & Local Jurisdiction Implementation Approach
Set Public EV Charger Target
✔ Update 2019 EV Roadmap to include more aggressive targets; continue to partner with A2Z Collaborative to downscale jurisdictional targets on appropriate roadways; identify partnership opportunities with those jurisdictions that have made the least progress toward their targets to share information and successful implementation strategies
Set Fleet Adoption Target ✔ Update 2019 EV Roadmap to include more aggressive targets; identify partnership opportunities with those jurisdictions that have made the least progress toward their targets to share information and strategies to accelerate fleet transition
Set-Aside Public Parking Spots for Clean Vehicles
Adopt requirements in zoning codes that apply to clean air vehicles as defined by CalGreen
Encourage EV Charging Infrastructure at Development Projects
Encouragement through incentives can complement stronger policy requirements
Require New Development to be “EV-Ready”
Adopt requirements in zoning codes that apply to clean air vehicles as defined by CalGreen; adopt ordinance that requires retrofitting
Require EV Charging Infrastructure to be Installed at Developments
Adopt requirements in zoning codes; adopt ordinance that requires retrofitting
Offer Consumer Incentives to Purchase EVs
✔ Partner with SANDAG and SDAPCD to accelerate and increase the amount of incentives, reduce barriers to accessing incentives, and promote aggressively in CoCs
Provide Readily-Accessible Information to Property Owners and Vehicle Owners
✔ Partner with A2Z to reach private entities, local governments, SDG&E, CCAs, and community groups to understand information gaps; partner with SANDAG to produce coordinated educational materials and aggressively promote
Train Workforce to Support EV Ecosystem
✔ Partner with educational institutions to develop workforce training needs; increase funding to existing programs. Coordinate with SANDAG on workforce training on Electric Vehicle Infrastructure Training Program (EVITP).
Collaborate to Share Information Across Region
✔ Continue to partner with A2Z Collaborative
Engage in State-level Advocacy to Bring Implementation Funds to San Diego County
✔ Continue to partner with A2Z Collaborative

82
3.4.5 Accelerate Reduction of VMT
Current San Diego region actions and policies to reduce VMT are articulated in the 2021 Regional Plan across the 5 Big Moves and regional land use development policies. SANDAG is required to demonstrate how the region will reach targets by reducing VMT. As such, plans for the 5 Big Moves describe ways to influence behavior change and support denser land uses. To meet the targets, single occupancy vehicle trips need to be replaced with biking, walking, transit, and shared rides. The 2021 Regional Plan articulates the following strategies to reduce VMT:
● Complete Corridors support a greater variety of transportation options, and the initiative promises investments in infrastructure to make alternative transportation more attractive. Complete Corridors also explore congestion pricing as a tool for reducing demand and VMT during peak times.
● Flexible Fleets are to provide convenient and affordable alternatives to driving alone and to reach communities with limited transit access.
● Transit Leap calls for a multimodal high-speed, high-capacity, high-frequency transit network that appeals to people who otherwise drive alone. In the 5 Big Moves, SANDAG states that public transit will “continue to be the most efficient way to move many people,” therefore reducing VMT.
● Mobility Hub areas are communities with a high concentration of people, destinations, and travel choices. Higher density Mobility Hub areas have a supportive mix of land uses that can help to encourage ridership and usage of the Transit Leap system. Mobility Hub areas in less dense areas may rely more on Flexible Fleets in order to connect residents to transit.
Table 3.7 provides details on VMT-reduction strategies that would support acceleration of VMT reduction within the San Diego region. The County, cities, and jurisdictions can only influence the zoning code within their jurisdictional boundaries, however they should all promote information sharing, evaluation to prove effectiveness of strategies, and inter-jurisdictional collaboration to encourage denser, more walkable, and more transit-oriented development. SANDAG and the County can also initiate the exploration of cross-jurisdictional land use policies such as transfer of development rights to encourage densification in places where multi-modal investments are already underway, and also serve to preserve undeveloped and agricultural lands that can serve as carbon sinks.

83
Table 3.7 VMT reduction strategies and County & local jurisdiction implementation approach. Policy Strategy Electrification
Opportunity County & Local Jurisdiction Implementation
Approach Expand geographic reach of bus and rail services in areas where development can support transit use
✔ Identify corridors with land use patterns that can support transit; partner with transit agencies to fund additional miles of transit service
Invest additional transit service hours in places where transit is productive and high occupancy, focused on infill locations
✔ Identify highest-performing transit corridors; partner with transit agencies to fund additional hours of transit service
Provide incentives and regulatory relief to facilitate higher density infill and transit-oriented development
Modify zoning code along transit corridors to allow denser development; streamline permitting process for developments along transit corridors; leverage parking reductions, density bonuses, and other incentives to encourage development in transit corridors. Encourage local agencies to form partnerships with each other to explore the potential for a legal mechanism to transfer development rights from undeveloped or agricultural lands within one jurisdiction to infill areas in another jurisdiction.
Disincentivize development in rural (or non-infill) areas that cannot support efficient transit use or multi-modal transportation options
Utilize transit opportunity areas, infill areas, and VMT efficiency metrics to encourage compact development and discourage exurban and very rural development
In existing rural, non-infill, or underserved transit areas, invest in TNC partnerships to ensure sufficient access to opportunities
✔ Identify limited-access areas that would benefit from additional mobility resources; develop TNC partnerships to support travel using higher-occupancy vehicles
Incentivize high occupancy personal vehicle use
Investigate opportunities to implement pricing structures (cordon pricing, HOT lanes, etc.) that incentivize high occupancy vehicles
Design walkable communities, particularly in places where compact development patterns are already established
Adopt pedestrian-oriented design guidelines for all new development; reduce or remove parking minimums in walkable neighborhoods
Expand pedestrian and bicycle facilities, using a network approach to ensure destinations are served, corridors and intersections are equally comfortable and safe
Update county bicycle and pedestrian planning documents; partner with SANDAG to accelerate implementation of 2010 San Diego Regional Bicycle Plan; develop Pedestrian Safety and/or Vision Zero and/or Local Road Safety Plan
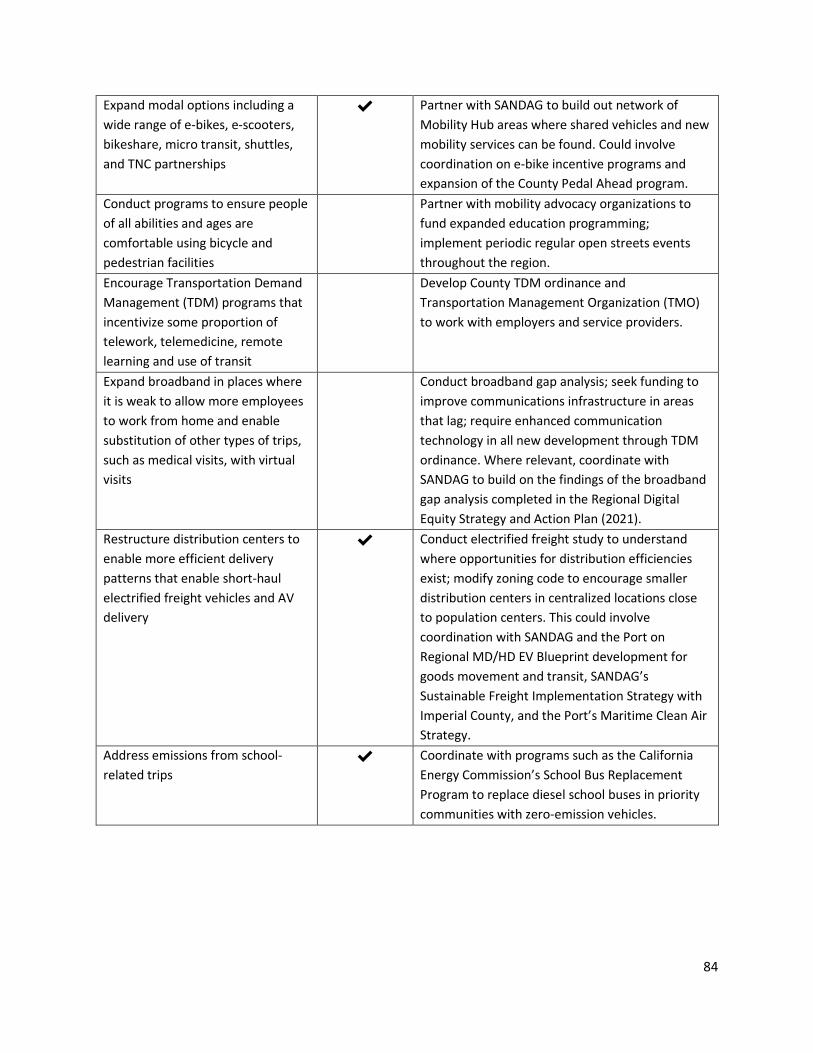
84
Expand modal options including a wide range of e-bikes, e-scooters, bikeshare, micro transit, shuttles, and TNC partnerships
✔ Partner with SANDAG to build out network of Mobility Hub areas where shared vehicles and new mobility services can be found. Could involve coordination on e-bike incentive programs and expansion of the County Pedal Ahead program.
Conduct programs to ensure people of all abilities and ages are comfortable using bicycle and pedestrian facilities
Partner with mobility advocacy organizations to fund expanded education programming; implement periodic regular open streets events throughout the region.
Encourage Transportation Demand Management (TDM) programs that incentivize some proportion of telework, telemedicine, remote learning and use of transit
Develop County TDM ordinance and Transportation Management Organization (TMO) to work with employers and service providers.
Expand broadband in places where it is weak to allow more employees to work from home and enable substitution of other types of trips, such as medical visits, with virtual visits
Conduct broadband gap analysis; seek funding to improve communications infrastructure in areas that lag; require enhanced communication technology in all new development through TDM ordinance. Where relevant, coordinate with SANDAG to build on the findings of the broadband gap analysis completed in the Regional Digital Equity Strategy and Action Plan (2021).
Restructure distribution centers to enable more efficient delivery patterns that enable short-haul electrified freight vehicles and AV delivery
✔ Conduct electrified freight study to understand where opportunities for distribution efficiencies exist; modify zoning code to encourage smaller distribution centers in centralized locations close to population centers. This could involve coordination with SANDAG and the Port on Regional MD/HD EV Blueprint development for goods movement and transit, SANDAG’s Sustainable Freight Implementation Strategy with Imperial County, and the Port’s Maritime Clean Air Strategy.
Address emissions from school-related trips
✔ Coordinate with programs such as the California Energy Commission’s School Bus Replacement Program to replace diesel school buses in priority communities with zero-emission vehicles.
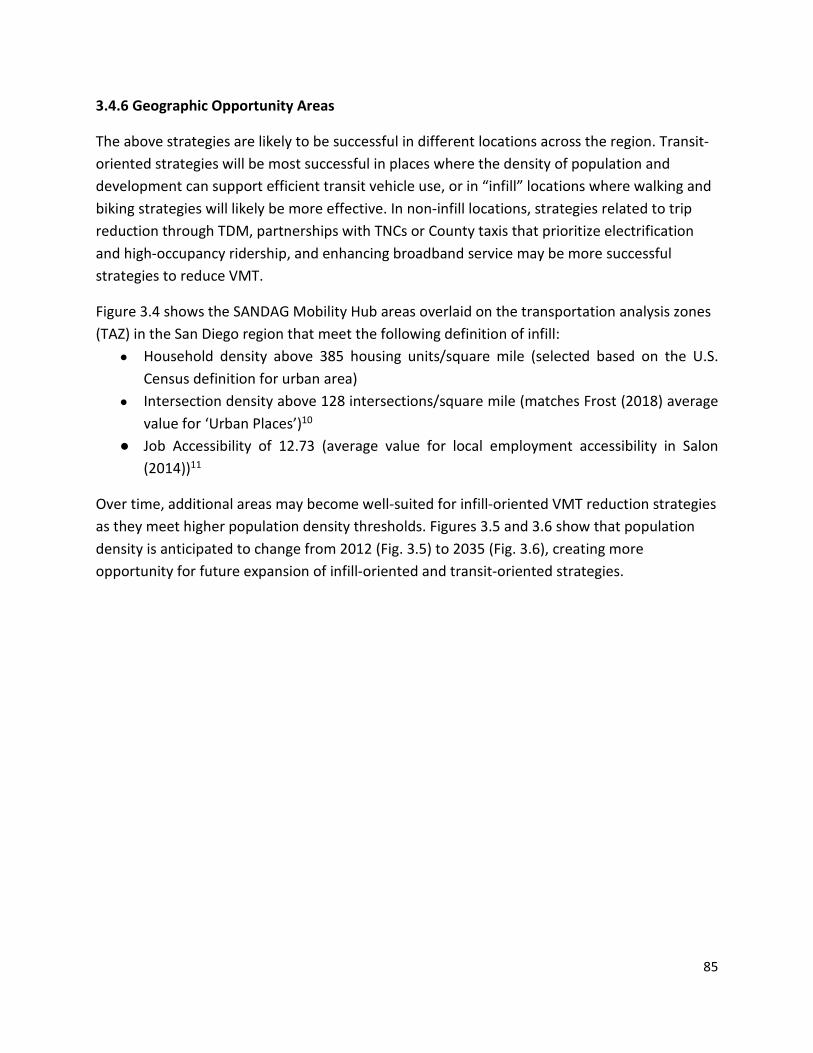
85
3.4.6 Geographic Opportunity Areas
The above strategies are likely to be successful in different locations across the region. Transit-oriented strategies will be most successful in places where the density of population and development can support efficient transit vehicle use, or in “infill” locations where walking and biking strategies will likely be more effective. In non-infill locations, strategies related to trip reduction through TDM, partnerships with TNCs or County taxis that prioritize electrification and high-occupancy ridership, and enhancing broadband service may be more successful strategies to reduce VMT.
Figure 3.4 shows the SANDAG Mobility Hub areas overlaid on the transportation analysis zones (TAZ) in the San Diego region that meet the following definition of infill:
● Household density above 385 housing units/square mile (selected based on the U.S. Census definition for urban area)
● Intersection density above 128 intersections/square mile (matches Frost (2018) average value for ‘Urban Places’)10
● Job Accessibility of 12.73 (average value for local employment accessibility in Salon (2014))11
Over time, additional areas may become well-suited for infill-oriented VMT reduction strategies as they meet higher population density thresholds. Figures 3.5 and 3.6 show that population density is anticipated to change from 2012 (Fig. 3.5) to 2035 (Fig. 3.6), creating more opportunity for future expansion of infill-oriented and transit-oriented strategies.
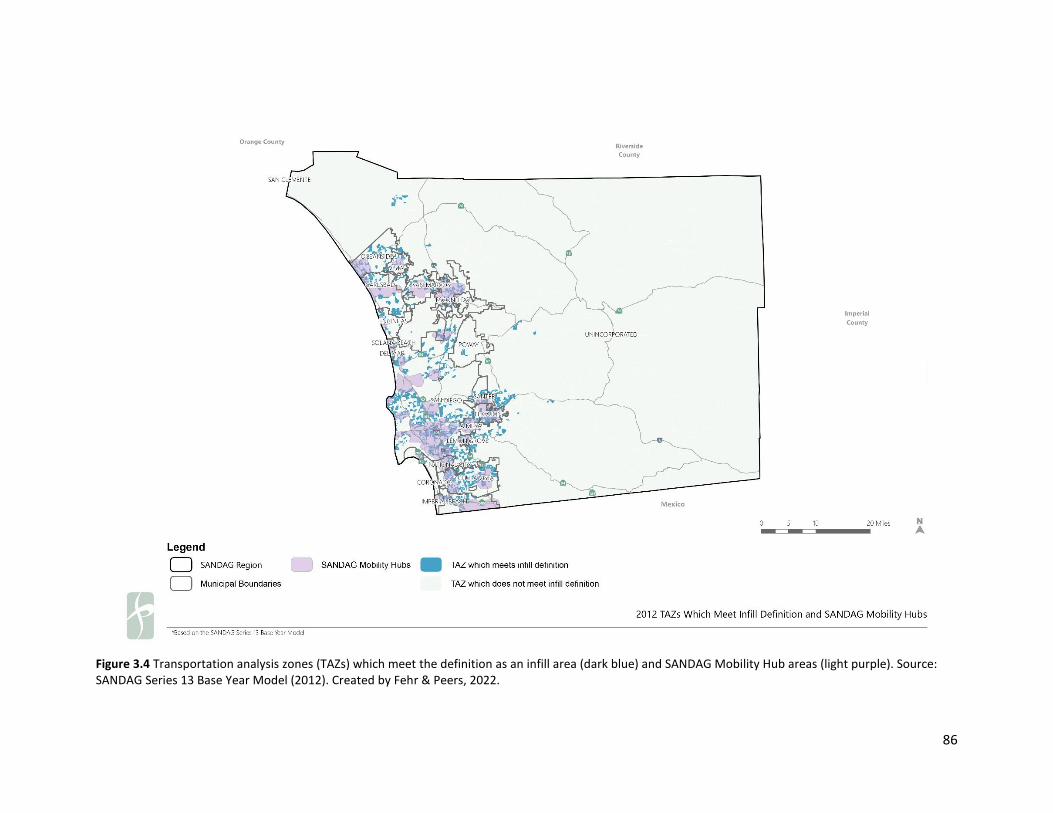
86
Figure 3.4 Transportation analysis zones (TAZs) which meet the definition as an infill area (dark blue) and SANDAG Mobility Hub areas (light purple). Source: SANDAG Series 13 Base Year Model (2012). Created by Fehr & Peers, 2022.
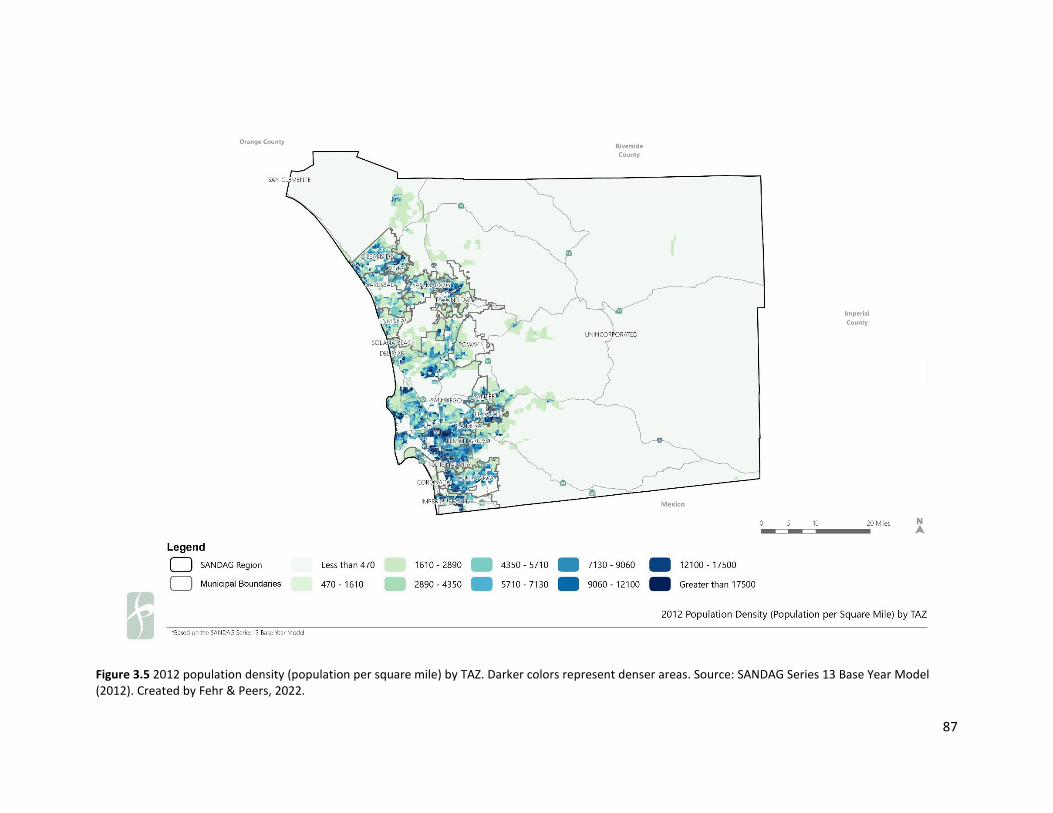
87
Figure 3.5 2012 population density (population per square mile) by TAZ. Darker colors represent denser areas. Source: SANDAG Series 13 Base Year Model (2012). Created by Fehr & Peers, 2022.

88
Figure 3.6 2035 Population Density (population per square mile) by TAZ. Darker colors represent denser areas. Source: SANDAG Series 13 Base Year Model (2035). Created by Fehr & Peers, 2022.
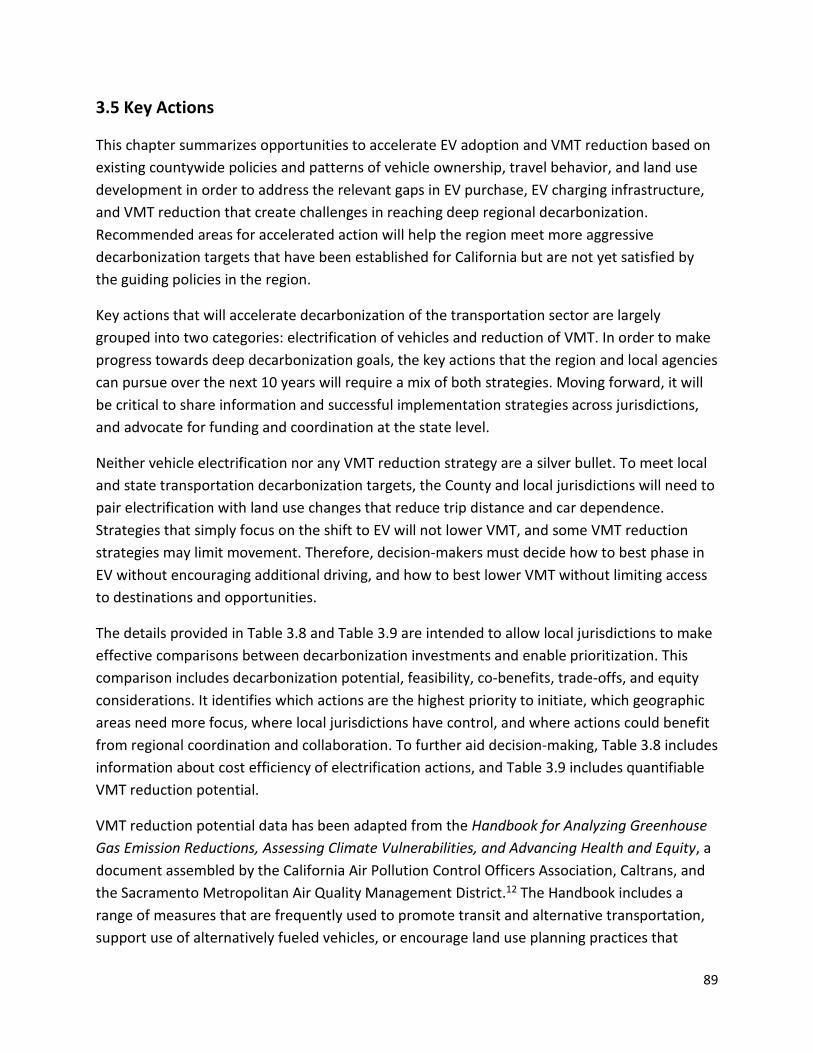
89
3.5 Key Actions
This chapter summarizes opportunities to accelerate EV adoption and VMT reduction based on existing countywide policies and patterns of vehicle ownership, travel behavior, and land use development in order to address the relevant gaps in EV purchase, EV charging infrastructure, and VMT reduction that create challenges in reaching deep regional decarbonization. Recommended areas for accelerated action will help the region meet more aggressive decarbonization targets that have been established for California but are not yet satisfied by the guiding policies in the region.
Key actions that will accelerate decarbonization of the transportation sector are largely grouped into two categories: electrification of vehicles and reduction of VMT. In order to make progress towards deep decarbonization goals, the key actions that the region and local agencies can pursue over the next 10 years will require a mix of both strategies. Moving forward, it will be critical to share information and successful implementation strategies across jurisdictions, and advocate for funding and coordination at the state level.
Neither vehicle electrification nor any VMT reduction strategy are a silver bullet. To meet local and state transportation decarbonization targets, the County and local jurisdictions will need to pair electrification with land use changes that reduce trip distance and car dependence. Strategies that simply focus on the shift to EV will not lower VMT, and some VMT reduction strategies may limit movement. Therefore, decision-makers must decide how to best phase in EV without encouraging additional driving, and how to best lower VMT without limiting access to destinations and opportunities.
The details provided in Table 3.8 and Table 3.9 are intended to allow local jurisdictions to make effective comparisons between decarbonization investments and enable prioritization. This comparison includes decarbonization potential, feasibility, co-benefits, trade-offs, and equity considerations. It identifies which actions are the highest priority to initiate, which geographic areas need more focus, where local jurisdictions have control, and where actions could benefit from regional coordination and collaboration. To further aid decision-making, Table 3.8 includes information about cost efficiency of electrification actions, and Table 3.9 includes quantifiable VMT reduction potential.
VMT reduction potential data has been adapted from the Handbook for Analyzing Greenhouse Gas Emission Reductions, Assessing Climate Vulnerabilities, and Advancing Health and Equity, a document assembled by the California Air Pollution Control Officers Association, Caltrans, and the Sacramento Metropolitan Air Quality Management District.12 The Handbook includes a range of measures that are frequently used to promote transit and alternative transportation, support use of alternatively fueled vehicles, or encourage land use planning practices that
90
reduce vehicle trips and VMT. It is worth noting that when considering which measures are applicable for a jurisdiction or implementation area, the locational context should be incorporated into the decision-making process. Many VMT reduction strategies are best suited for denser landscapes, and the quantification methods and assumptions used in the handbook to determine strategy effectiveness may not be representative when applied to all geographies. Further, the effects of combining measure reductions are not always linear or complementary. Decision-makers should be mindful of potential interactions among different measures, and should take care to avoid overestimating the VMT reduction potential of multiple strategies that target the same type of trip or the same population. Additionally, many of the strategies (for example land use related strategies) are already accounted for in the SANDAG regional travel demand model, so additional reductions to VMT produced by the model are not appropriate.

91
Table 3.8 Key electrification actions and selected opportunities, co-benefits, consideration, trade-offs, context, and effectiveness.
Action Opportunities and Co-
Benefits Considerations and Tradeoffs Context [a] Strategy
Effectiveness [b]
Strategies to Accelerate EV Infrastructure Buildout
Set and meet aggressive public EV charging target
Funding opportunities are available at multiple geographic scales.
Building out an effective network of EV charging infrastructure will have significant impacts on the transmission grid and its reliability, and deployment costs (including upfront unit cost, installation, operations, maintenance, etc.) may be prohibitive.
Roll-out in densely developed areas may require fewer infrastructure- and utilities-related costs.
Public chargers will not directly influence uptake, but a built-out EV charging network is critical for EV uptake.
Require new development to include EV charging and require existing development to retrofit parking with EV charging
Beginning January 1, 2023, the CALGreen building code will require EV charging spaces and chargers for new multifamily residential development and hotels/motels. Requirements for new development present the opportunity to coordinate with SDG&E to optimize efforts in unincorporated areas.
Additional requirements for new construction without incentives may dampen development. Retrofits may be cost-prohibitive for some.
Can be an effective strategy in urban and rural contexts.
Amendments to building codes will require a longer lead time, and will have an indirect influence on EV uptake. Retrofit requirements may be more costly but more immediate.
Increase dollar value of incentives, provide educational resources, and streamline permitting process for landowners to install EV charging in multi-family developments
SANDAG and the San Diego County Air Pollution Control District have already partnered with the California Electric Vehicle Infrastructure Project on the San Diego County Incentive Project.
Installation will require technical assistance services for electricians as well as local governments. Available funding is limited.
Can be an effective strategy in urban and rural contexts, especially in areas of high development.
Residential charging infrastructure is critical for electrification but only indirectly influences uptake.
Partner with educational institutions to develop programs to meet workforce development needs; increase funding to existing programs; require certification to install and maintain EV infrastructure
Infrastructure construction can employ California Certified Electricians with EVITP Certification. This work can support new green jobs creation, union job creation, and jobs for and in marginalized communities. Governments can facilitate partnerships with industry and trade groups as well as existing apprenticeship programs.
Electrification will necessitate a shift from carbon-based jobs, potentially risking temporary job displacement.
Can be an effective strategy in urban and rural contexts, with potential for greater opportunity near city centers where workforce may be located and educational institutions are present.
Does not directly influence EV uptake but building out the charging network relies on a large and skilled workforce.

92
Explore measures that would allow private parking lot owners to build solar arrays and sell electricity to EV owners who use their lots
Would not require new utility-owned infrastructure and would reduce the need for new infrastructure to support existing and future building loads. Would not impose a cost to ratepayers.
A predominantly solar renewable strategy is not consistent with nighttime EV charging, as it would require daytime storage of solar-generated electricity at the utility level, and nighttime release from utility storage to EV batteries. If large scale solar EV charging takes place at a work destination, it may not be feasible for employers to subsidize employee charging.
Would be most effective in densely populated areas with a high number of commercial and office destinations with parking lots.
Will not increase EV uptake but can increase charging supply. May be costly but can help build long-term energy resilience.
Strategies to Accelerate EV Uptake Increase dollar value and streamline consumer vehicle purchase incentives with application to both new and used vehicles, and increase dollar value and opportunities to retire gas vehicles.
The San Diego County Air Pollution Control District’s Clean Cars 4 All and Goods Movement Emission Reduction Program supports the acceleration of EV. 28% of the California Energy Commission’s Clean Transportation Program Funding is dedicated to projects located in disadvantaged and/or low-income communities. Further incentives may reduce barriers to access for priority communities.
Application processes could be streamlined. Coordination on eligibility requirements needs to be considered.
Can be an effective strategy in urban and rural contexts, and especially in disadvantaged or low-income communities.
Will directly accelerate EV uptake.
Set and meet aggressive (100%) fleet adoption target
EVs have the potential to improve fleet efficiency and reduce vehicle operation and maintenance costs.
EVs still have well-to-wheel emissions. Consideration must be given to the gas and diesel vehicles that are discarded when fleet upgrades are made. Programs by pollution control districts and others can help bear the financial and carbon cost of retiring them.
Can be an effective strategy in urban and rural contexts.
Will directly accelerate EV uptake.
Note: [a] Context in which the strategy or action will be the most impactful. [b] High-level assessment of how directly and how effectively this strategy will influence EV acceleration/uptake.

93
Table 3.9 Key VMT actions and selected opportunities, co-benefits, consideration, trade-offs, context, and VMT/GHG reduction potential.
Action Opportunities and Co-Benefits Considerations and Tradeoffs Context [a]
VMT & GHG Reduction
Potential [b] Provide incentives and regulatory relief to facilitate higher density infill and transit-oriented development
Areas that can support efficient transit use or multi-modal transportation options can prevent development into natural lands. Land use policies can facilitate the opportunity for affordable housing opportunities and assist in meeting the housing crisis. Opportunity for community benefits agreements to create opportunities for local workers and develop amenities tailored to the area.
Incentivizing infill and considering a regional VMT methodology may curtail development opportunities in more rural communities. Therefore, in existing rural, non-infill, or underserved transit areas, the County should invest in TNC partnerships prioritizing electric and high-occupancy vehicles to ensure sufficient and continued access to opportunities while reducing reliance on single-occupancy, combustion-engine vehicle trips.
Most effective in densely developed contexts.
Up to 31% of GHG emissions from project-scale VMT in urbanized areas.
Disincentivize development in rural (or non-infill) areas that cannot support efficient transit use or multi-modal transportation options
Potential for electrification and high-occupancy vehicles to be prioritized.
Prevents opportunity and necessary infrastructure for the entirety of San Diego County to shift to sustainable means.
N/A Captured in estimate above.
Partner with SANDAG to build out a network of Mobility Hub areas where shared vehicles and new mobility services can be found
Curtail urban sprawl, create opportunities for affordable housing near transit, and provide transportation options for zero vehicle households.
Mobility Hub areas tend to concentrate transit and mobility investments in areas that are already transit-supporting.
Only effective in densely developed contexts.
Up to 31% of GHG emissions from project-level VMT in urbanized areas.
Increase street connectivity, update county bicycle and pedestrian planning documents, and adopt pedestrian- and bicycle-oriented design guidelines for all new development
Bikeable, walkable neighborhoods near transit, jobs and amenities promote healthier lifestyles and social outcomes, in addition to reducing emissions and providing cleaner air, especially in frontline, working-class communities of color. Improvements to pedestrian and bicycle infrastructure can also improve roadway safety and reduce injuries and fatalities related to collisions.
May involve major expenses if building a new street network or retrofitting an existing street network to improve connectivity is required.
Most effective in urban or suburban contexts.
Up to 30% of GHG emissions from vehicle travel in the community, depending on extent of build-out.
Reduce or remove parking minimums in walkable neighborhoods
Parking lots can be converted into land uses more urgently needed by a community, potentially bringing higher tax revenues.
Reducing parking supply without providing alternative transportation modes will limit mobility/access, and may harm local businesses.
Only effective in densely developed contexts.
Up to 13.7% of GHG emissions from resident vehicles accessing the site.
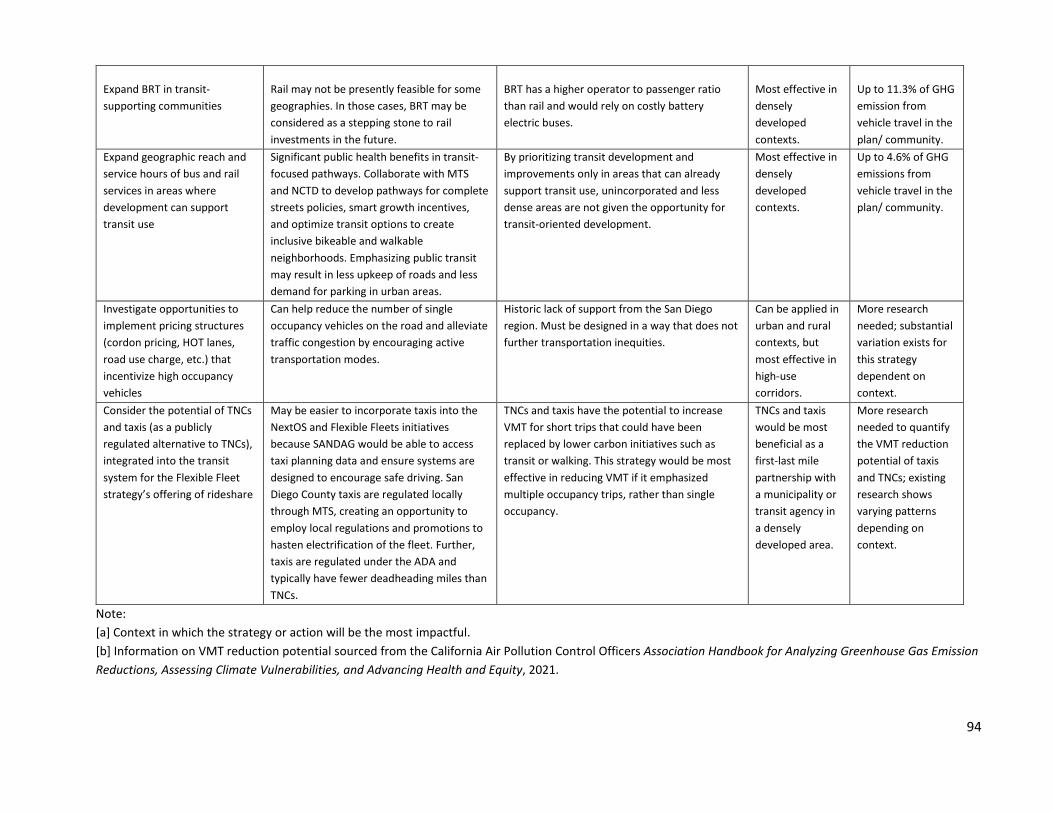
94
Expand BRT in transit-supporting communities
Rail may not be presently feasible for some geographies. In those cases, BRT may be considered as a stepping stone to rail investments in the future.
BRT has a higher operator to passenger ratio than rail and would rely on costly battery electric buses.
Most effective in densely developed contexts.
Up to 11.3% of GHG emission from vehicle travel in the plan/ community.
Expand geographic reach and service hours of bus and rail services in areas where development can support transit use
Significant public health benefits in transit-focused pathways. Collaborate with MTS and NCTD to develop pathways for complete streets policies, smart growth incentives, and optimize transit options to create inclusive bikeable and walkable neighborhoods. Emphasizing public transit may result in less upkeep of roads and less demand for parking in urban areas.
By prioritizing transit development and improvements only in areas that can already support transit use, unincorporated and less dense areas are not given the opportunity for transit-oriented development.
Most effective in densely developed contexts.
Up to 4.6% of GHG emissions from vehicle travel in the plan/ community.
Investigate opportunities to implement pricing structures (cordon pricing, HOT lanes, road use charge, etc.) that incentivize high occupancy vehicles
Can help reduce the number of single occupancy vehicles on the road and alleviate traffic congestion by encouraging active transportation modes.
Historic lack of support from the San Diego region. Must be designed in a way that does not further transportation inequities.
Can be applied in urban and rural contexts, but most effective in high-use corridors.
More research needed; substantial variation exists for this strategy dependent on context.
Consider the potential of TNCs and taxis (as a publicly regulated alternative to TNCs), integrated into the transit system for the Flexible Fleet strategy’s offering of rideshare
May be easier to incorporate taxis into the NextOS and Flexible Fleets initiatives because SANDAG would be able to access taxi planning data and ensure systems are designed to encourage safe driving. San Diego County taxis are regulated locally through MTS, creating an opportunity to employ local regulations and promotions to hasten electrification of the fleet. Further, taxis are regulated under the ADA and typically have fewer deadheading miles than TNCs.
TNCs and taxis have the potential to increase VMT for short trips that could have been replaced by lower carbon initiatives such as transit or walking. This strategy would be most effective in reducing VMT if it emphasized multiple occupancy trips, rather than single occupancy.
TNCs and taxis would be most beneficial as a first-last mile partnership with a municipality or transit agency in a densely developed area.
More research needed to quantify the VMT reduction potential of taxis and TNCs; existing research shows varying patterns depending on context.
Note: [a] Context in which the strategy or action will be the most impactful. [b] Information on VMT reduction potential sourced from the California Air Pollution Control Officers Association Handbook for Analyzing Greenhouse Gas Emission Reductions, Assessing Climate Vulnerabilities, and Advancing Health and Equity, 2021.
95
3.6 Remaining Challenges and Gaps
Additional challenges and major gaps remain which will require collaboration, coordination, and advances to vehicle technology beyond what exists on the road today. In addition, outstanding questions regarding environmental externalities are important to consider as the County accelerates electrification as a key pathway to decarbonize the transportation sector.
3.6.1 Cross-Border Transportation and Tribal Jurisdictions
The San Diego region’s location adjacent to the US-Mexico border creates opportunities and challenges for regional decarbonization. While the City of San Diego and Mexican border cities such as Tijuana are distinct political entities, transportation behavior on and around border crossings contributes to shared effects of carbon emissions. A major challenge of addressing these emissions is that there is limited jurisdictional control for directly influencing border crossings as this authority lies with federal government bodies. Since cross-border traffic is a critical piece of regional decarbonization, though, it is important for local jurisdictions to coordinate with federal decision-makers on emissions-reducing regulations wherever possible. Similarly, local and state governments do not have authority over the 17 tribal governments in the San Diego region, yet reducing transportation emissions related to tribal jurisdictions are important for regional decarbonization.
In an effort to coordinate regional planning, SANDAG created the Borders Committee, which provides oversight for planning activities that impact the borders of the San Diego region as well as government-to-government relations with tribal nations in the San Diego region. Membership includes representatives from Mexico, the County of San Diego, Orange County, Imperial County, Caltrans District 11, Southern California Association of Governments (SCAG), Southern California Tribal Chairmen’s Association, and several cities. The Borders Committee advises the SANDAG Board of Directors on major interregional planning policy-level matters, which are then forwarded to the SANDAG Board of Directors for action.
Another binational coordination effort is the California-Baja California 2021 Border Master Plan, developed by Caltrans in partnership with the U.S.-Mexico Joint Working Committee, the U.S. Federal Highway Administration, and Mexico’s Secretariat of Communications and Transportation. The Border Master Plan coordinates planning and delivery of land ports of entry and transportation infrastructure projects serving those ports of entry in the border region. The County and local jurisdictions can work to identify opportunities for efficiency in processing vehicles at ports of entry and advocate these plans to existing binational coordination efforts.

96
To achieve decarbonization, it will be important for regional jurisdictions to reinforce initiatives related to shared infrastructure, efficient transportation systems, and environmental planning. Outside of partnerships and direct authority over bi-national and tribal decisions, the County can further its active transportation work in the areas it has jurisdiction over. SANDAG’s Transit Leap and Mobility Hubs strategies can influence travel behavior of those proximate to its jurisdiction by continuing to make investments in complete streets, expanding high-quality transit options, and siting EV infrastructure in key areas. These strategies can support the communities that work and live around border crossings and tribal jurisdictions.
3.6.2 Freight and Trucking
The CARB Advanced Clean Truck Fleets rule requires that by 2045, medium- and heavy-duty trucks must run on alternative fuels. However, current technology is insufficient to support electrification of or a shift to alternative fuels for long-haul freight and trucking. In support of this shift, SB 671 (2021) established the Clean Freight Corridor Efficiency Assessment, to be developed by the California Transportation Commission in coordination with other state agencies. The assessment will identify freight corridors throughout the state that would be priority candidates for the deployment of zero-emission medium- and heavy-duty vehicles by December 1, 2023. The bill also requires the state freight plan to include a description of needed infrastructure, projects, and operations for the deployment of zero-emission medium- and heavy-duty vehicles and the development of freight corridors identified in the assessment. Existing law requires the California Transportation Commission to allocate certain revenues deposited in the Trade Corridor Enhancement Account and certain federal funds for eligible infrastructure projects to mitigate emissions from trucks located on or along specified transportation corridors. This bill would make projects eligible for funding if they employ advanced and innovative technology to improve the flow of freight, environmental and community mitigation, or efforts to reduce environmental impacts of freight movement.13
The County might also consider conducting a localized clean freight study to understand where opportunities for distribution efficiencies exist and modifying zoning code accordingly to encourage distribution centers in efficient locations. It can follow the lead of Los Angeles County, which set a goal of 25-50% of all medium-duty delivery trucks in the County to be electric, and 10-40% of heavy-duty regional drayage trucks to be zero emission by 2028. The Los Angeles Cleantech Incubator, together with CARB, the Ports of Los Angeles and Long Beach, and the California Energy Commission, issued a request for information from medium- and heavy-duty truck manufacturers, EV supply equipment manufacturers, EV charging station networks, fleet operators, and fleet charging companies to influence the market and uptake of electrification and alternative fuels. Other zero emission freight transportation pilot projects in Los Angeles County focus on seamless corridor approaches and last-mile solutions that

97
respond to community needs as well as technology, business model, and educational challenges.
Within the City of Los Angeles, a recently adopted maritime resolution calls on top importers to adopt 100% zero emissions ships by 2030. While the technology does not currently exist for this shift, and while the City does not have enforcement power over internationally-regulated ships, the goal is to create green shipping corridors that can transition to zero emissions corridors as technology improves. The City and the Port of Los Angeles hopes to exert influence on the shipping industry and on international regulators such as the International Maritime Organization to transition the industry to cleaner fuels. Local government has the ability to incentivize clean cargo transportation through grants and special rates. San Diego and its port can build on the lessons from these initiatives to inform its own projects and policy recommendations and support the push to widespread zero emission freight deployment.
3.6.3 Further Research
The following aspects of transportation decarbonization outside the scope of this framework but worthy of additional study by the County include:
● Environmental externalities of electrification, such as end-of-life waste, emissions associated with the extraction, processing, and distribution of the primary energy sources used for electricity production, and roadway maintenance emissions
● Lifestyle changes in the future that may not be reflected in today’s forecasts or assumptions, such as work from home patterns, home delivery of goods, and suburban migration
● Policy response to pandemic conditions by transit agencies to match service to lower ridership levels, or to attempt to recover lost ridership
● Transportation by and around local military bases
3.6.4 Cross-References
Transportation emissions are closely associated with other topics addressed in this Framework. For example, EV adoption is linked to emissions associated with electricity generation and VMT is heavily influenced by land use decisions and resulting development patterns. Collaboration between sectors and comprehensive approaches are necessary to achieve deep decarbonization. The table below summarizes how transportation decarbonization is linked to other chapters.

98
Chapter Reference Chapter 2: Geospatial Analysis of Renewable Energy Production
Additional details on the emissions reductions implications of EV adoption relative to electricity sector decarbonization, and discussion of alternative fuels.
Chapter 4: Decarbonization of Buildings Information on the cost of fully electrifying (including EV charging) new buildings and assumptions for growth.
Chapter 5: Natural Climate Solutions and Other Land Use Considerations
More information on how land use and transportation decarbonization pathways are linked.
Chapter 6: Employment Impacts through Decarbonization for the San Diego Region
More information about workforce development and new job opportunities related to EV and the charging network.
Chapter 7: Key Policy Considerations for the San Diego Region
Additional details on region-wide policy and legal authority to implement strategies related to transportation sector decarbonization.
Chapter 8: Local Policy Opportunity Additional details on local policy and legal authority to implement strategies related to transportation sector decarbonization.

99
Works Cited 1. UC Davis.Decarbonizing California Transportation by 2045.
https://www.ucdavis.edu/climate/news/decarbonizing-california-transportation-by-2045 (2021). 2. SANDAG. 2021 Regional Plan Programs and Policies - Electric Vehicles. https://sdforward.com/docs/default-
source/final-2021-regional-plan/appendix-b---implementation-actions.pdf?sfvrsn=f4c1fd65_2 (2021). 3. SANDAG. 5 Big Moves. San Diego Forward https://www.sdforward.com/mobility-planning/5-big-moves
(2021). 4. Black & Veatch Management Consulting. San Diego Regional Electric Vehicle Gap Analysis.
https://www.sdge.com/sites/default/files/2021-07/FINAL%20San%20Diego%20Regional%20EV%20Gap%20Analysis%20%281%29.pdf (2021).
5. County of San Diego. County of San Diego Electric Vehicle Roadmap. https://www.sandiegocounty.gov/content/dam/sdc/sustainability/EV-Roadmap/EV-Roadmap-October-2019.pdf (2019).
6. County of San Diego. County of San Diego Climate Action Plan - Final. https://www.sandiegocounty.gov/content/dam/sdc/pds/advance/cap/publicreviewdocuments/PostBOSDocs/San%20Diego%20County%20Final%20CAP.pdf (2018).
7. California Energy Commission. Zero Emission Vehicle and Infrastructure Statistics https://www.energy.ca.gov/data-reports/energy-insights/zero-emission-vehicle-and-infrastructure-statistics (2020).
8. United States Census Bureau. American Community Survey. https://www.census.gov/programs-surveys/acs (2015-2019).
9. SANDAG Activity Based Model. ABM1. https://www.sandag.org/index.asp?subclassid=120&fuseaction=home.subclasshome (2012).
10. Frost, A. R. (2017). Quantifying the sustainability performance of urban form in California / by Alexander Rijiro Frost. San Diego State University.
11. Salon, D. (2015). Heterogeneity in the relationship between the built environment and driving: Focus on neighborhood type and travel purpose. Research in Transportation Economics, 52, 34–45. https://doi.org/10.1016/j.retrec.2015.10.008
12. California Air Pollution Control Officers Association. Handbook for Analyzing Greenhouse Gas Emission Reductions, Assessing Climate Vulnerabilities, and Advancing Health and Equity. https://www.airquality.org/ClimateChange/Documents/Final%20Handbook_AB434.pdf (2021).
13. SB-671 Transportation: Clean Freight Corridor Efficiency Assessment. https://leginfo.legislature.ca.gov/faces/billNavClient.xhtml?bill_id=202120220SB671 (2021).
https://www.sandiegocounty.gov/content/dam/sdc/sustainability/EV-Roadmap/EV-Roadmap-October-2019.pdf
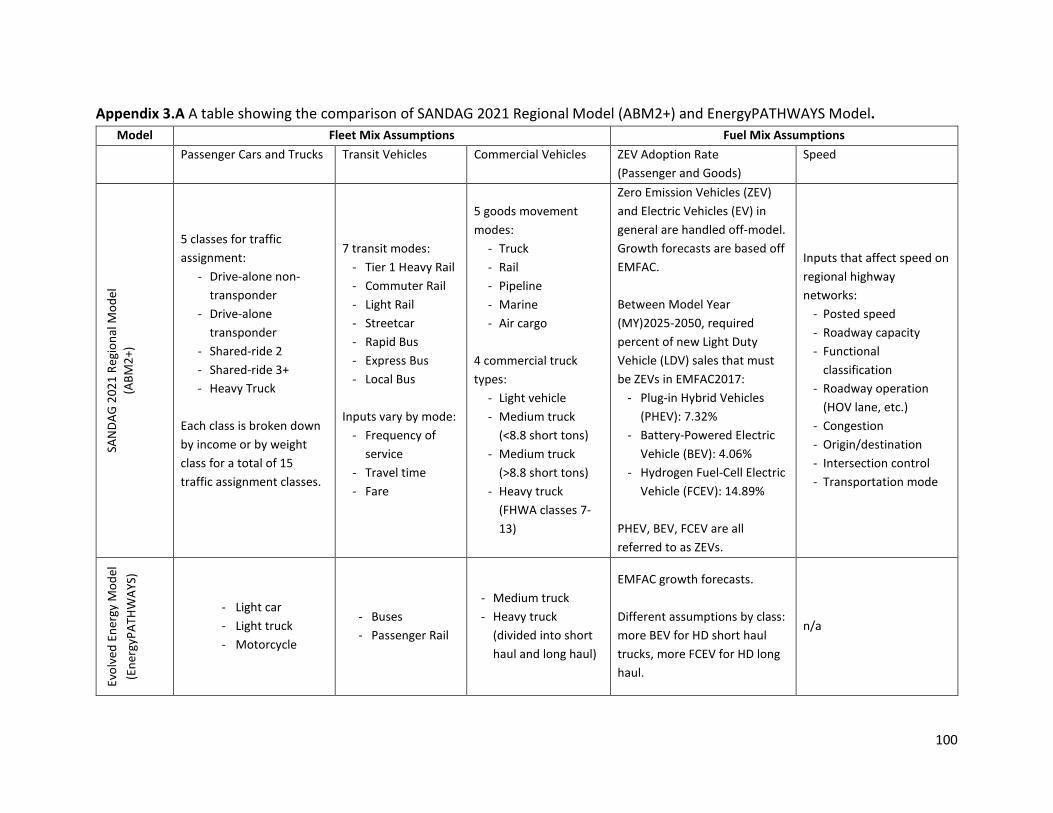
100
Appendix 3.A A table showing the comparison of SANDAG 2021 Regional Model (ABM2+) and EnergyPATHWAYS Model. Model Fleet Mix Assumptions Fuel Mix Assumptions
Passenger Cars and Trucks Transit Vehicles Commercial Vehicles ZEV Adoption Rate (Passenger and Goods)
Speed
SAN
DAG
2021
Reg
iona
l Mod
el
(ABM
2+)
5 classes for traffic assignment:
- Drive-alone non-transponder
- Drive-alone transponder
- Shared-ride 2 - Shared-ride 3+ - Heavy Truck
Each class is broken down by income or by weight class for a total of 15 traffic assignment classes.
7 transit modes: - Tier 1 Heavy Rail - Commuter Rail - Light Rail - Streetcar - Rapid Bus - Express Bus - Local Bus
Inputs vary by mode:
- Frequency of service
- Travel time - Fare
5 goods movement modes:
- Truck - Rail - Pipeline - Marine - Air cargo
4 commercial truck types:
- Light vehicle - Medium truck
(<8.8 short tons) - Medium truck
(>8.8 short tons) - Heavy truck
(FHWA classes 7-13)
Zero Emission Vehicles (ZEV) and Electric Vehicles (EV) in general are handled off-model. Growth forecasts are based off EMFAC. Between Model Year (MY)2025-2050, required percent of new Light Duty Vehicle (LDV) sales that must be ZEVs in EMFAC2017:
- Plug-in Hybrid Vehicles (PHEV): 7.32%
- Battery-Powered Electric Vehicle (BEV): 4.06%
- Hydrogen Fuel-Cell Electric Vehicle (FCEV): 14.89%
PHEV, BEV, FCEV are all referred to as ZEVs.
Inputs that affect speed on regional highway networks:
- Posted speed - Roadway capacity - Functional
classification - Roadway operation
(HOV lane, etc.) - Congestion - Origin/destination - Intersection control - Transportation mode
Evol
ved
Ener
gy M
odel
(E
nerg
yPAT
HWAY
S)
- Light car - Light truck - Motorcycle
- Buses - Passenger Rail
- Medium truck - Heavy truck
(divided into short haul and long haul)
EMFAC growth forecasts. Different assumptions by class: more BEV for HD short haul trucks, more FCEV for HD long haul.
n/a

101
Model VMT Accounting Resolution Method Scale Conversion to GHG Spatial Temporal
SAN
DAG
2021
Reg
iona
l Mod
el
(ABM
2+)
Accounting Methods for GHG calculations using Vehicle Miles Traveled (VMT):
- Internal-Internal: all VMT included in analysis (VMT that occurs from trips that start and end in the SANDAG region)
- Internal-External or External Internal: 50% of VMT included in analysis (VMT associated with trips with one trip end in the SANDAG region and one outside the SANDAG region)
- External-External: all VMT excluded in analysis (VMT associated with trips that start and end outside of the SANDAG region are not included).
- Total VMT and GHG and per-capita VMT and GHG.
VMT data tables are used within EMFAC for emissions calculations of cold starts (trips) and running emissions (VMT). Calculations are adjusted by transportation activity data (VMT, speed distribution) and vehicle populations. Emissions reductions associated with various ZEV policies also calculated outside of the travel demand model.
Different resolution levels for different steps of the model:
- Microanalysis zones: 23,002 Master Geographic Reference Area (MGRAs) zones (roughly equivalent to Census blocks)
- Traffic assignment demand and skims: 4,996 Transportation Analysis Zones
- Transit assignment demand and skims: 1,766 Transit Access Points
Treatment of space is slightly different for border crossing trips.
Transportation behavior is modeled every half hour.
Evol
ved
Ener
gy M
odel
(E
nerg
yPAT
HWAY
S)
n/a n/a Electricity and fuel emissions intensities determined by supply-side optimization subject to net-zero economy-wide constraints.
Vehicle stock is modeled for Southern California region (divide from Northern California is along PGE/SCE service boundary). Number of households is used to estimate vehicle stock.
Annual vehicle stock.
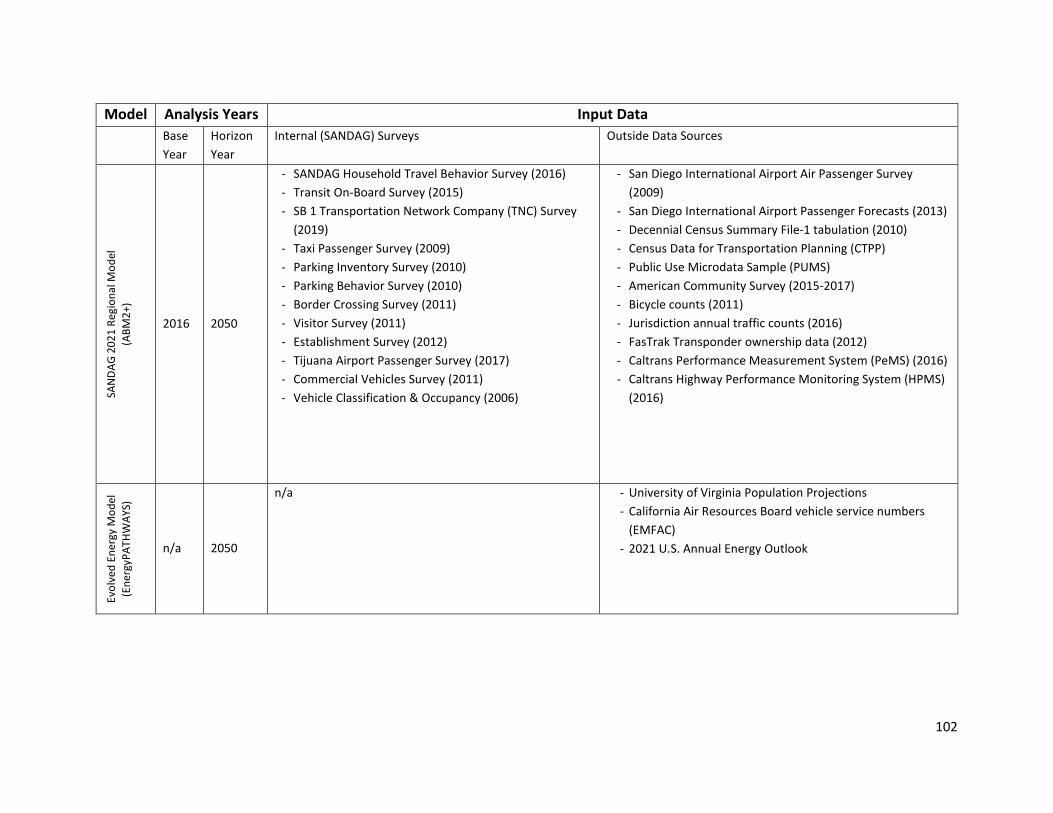
102
Model Analysis Years Input Data Base
Year Horizon Year
Internal (SANDAG) Surveys Outside Data Sources
SAN
DAG
2021
Reg
iona
l Mod
el
(ABM
2+)
2016 2050
- SANDAG Household Travel Behavior Survey (2016) - Transit On-Board Survey (2015) - SB 1 Transportation Network Company (TNC) Survey
(2019) - Taxi Passenger Survey (2009) - Parking Inventory Survey (2010) - Parking Behavior Survey (2010) - Border Crossing Survey (2011) - Visitor Survey (2011) - Establishment Survey (2012) - Tijuana Airport Passenger Survey (2017) - Commercial Vehicles Survey (2011) - Vehicle Classification & Occupancy (2006)
- San Diego International Airport Air Passenger Survey (2009)
- San Diego International Airport Passenger Forecasts (2013) - Decennial Census Summary File-1 tabulation (2010) - Census Data for Transportation Planning (CTPP) - Public Use Microdata Sample (PUMS) - American Community Survey (2015-2017) - Bicycle counts (2011) - Jurisdiction annual traffic counts (2016) - FasTrak Transponder ownership data (2012) - Caltrans Performance Measurement System (PeMS) (2016) - Caltrans Highway Performance Monitoring System (HPMS)
(2016)
Evol
ved
Ener
gy M
odel
(E
nerg
yPAT
HWAY
S)
n/a 2050
n/a - University of Virginia Population Projections - California Air Resources Board vehicle service numbers
(EMFAC) - 2021 U.S. Annual Energy Outlook

103
4. Decarbonization of Buildings Philip Eash-Gates, Synapse Energy Economics, Inc. Jason Frost, Synapse Energy Economics, Inc. Shelley Kwok, Synapse Energy Economics, Inc. Jackie Litynski, Synapse Energy Economics, Inc. Kenji Takahashi, Synapse Energy Economics, Inc. Asa Hopkins, PhD, Synapse Energy Economics, Inc.
Key Takeaways ● Reducing emissions from space heating and water heating due to fossil fuel combustion
should be a primary policy focus for buildings within the Regional Decarbonization Framework. Other uses of fossil fuels in buildings—cooking, laundry, and process loads—will need to be addressed as well.
● Policies should support increasing adoption of efficient heat pump-based space and water heating systems in both new and existing buildings, with particular focus on assistance for communities of concern and rental buildings.
● Setting “electrification-ready” or “all-electric” standards for new construction and major renovations through building energy codes will reduce costs associated with transitioning away from fossil fuels.
● Some existing fossil fuel equipment systems will only turn over once by 2050. Near-term action is needed to guide building owners to replace end-of-life fossil fuel equipment with electric equipment.
● Low-carbon gaseous fuels can be used for hard-to-electrify end uses, though these fuels are not proven and scalable, so research and piloting are required.
● The gas utility’s risk of not recovering its investment in assets (that is, its stranded cost risk) can be mitigated by minimizing unnecessary extensions or replacements of the gas pipeline system and by accelerating depreciation of existing utility assets.
● Improved data gathering is a low-cost, foundational action for future policy development.
104
4.1 Introduction
San Diego county is the fifth most populous county in the United States1 and boasts a large and diverse building stock.2 The unique geography and varied climates within the San Diego region have helped create an architectural montage, with distinct attributes across the county’s 18 municipalities and unincorporated areas.3,4 The local infrastructure is also shaped in part by the county’s 18 Native American tribal reservations5,6—the most in any U.S. county—and 16 military bases.7 While it is one of the county’s great assets, the building stock is also a key contributor to emissions: on-site fossil fuel combustion was responsible for about 300,000 metric tons of carbon dioxide equivalent emissions in 2014, or about 9 percent of the county’s total emissions.8 Decarbonizing existing and new buildings in the San Diego region will be a critical strategy within the Regional Decarbonization Framework. This chapter is focused on direct emissions from buildings, resulting from the combustion of fossil fuels, and what it would take to eliminate those emissions by 2045. Chapter 2 and Appendix A address emissions from electricity generation.
Options for decarbonizing San Diego’s buildings include electrifying end uses that are responsible for direct emissions, primarily space and water heating, and using lower-carbon fuels, such as biomethane and hydrogen, for hard-to-electrify end uses of energy. These are the primary strategies for displacing the use of natural gas, the dominant combustion fuel used in buildings in the region.i Demand reduction through traditional energy efficiency measures and programs, such as more efficient combustion equipment, improvements in building shells, and low-flow fixtures, is not sufficient to meet San Diego’s decarbonization objectives. Electrification to efficient electric technologies such as heat pumps and induction cooking results in both a substantial reduction in energy demand and the ability to utilize the increasingly renewable electric supply portfolio.
The relative costs of pathways taking different approaches to building sector decarbonization are similar, within the range of uncertainty. However, electrification-based approaches are generally lower-risk because they do not depend on technological innovation or the deployment of novel technologies at previously unseen scales.
All building decarbonization pathways cause a substantial change in the gas utility business due to changes in the amount and sources of the gas sold. Electrification pathways in particular would require fundamental changes in the gas utility business model because traditional pipeline gas sales would be virtually eliminated by mid-century. We conclude this chapter with an analysis of some simple near-term steps that San Diego Gas & Electric (SDG&E), its
i Natural gas is a fossil fuel which is predominantly methane and is a potent greenhouse gas itself when leaked into
the atmosphere.

105
regulators, and regional policymakers could take to mitigate risks associated with this transition and thereby make it easier to develop a long-term business transition plan.
4.2 Buildings in San Diego County
4.2.1 Residential Buildings
There are an estimated 1.3 million residential units across 0.9 million properties in San Diego County. These residences comprise approximately 1.7 billion square feet and are growing at a rate of 0.9 percent per year.i Multifamily properties represent 9 percent of the total residential floor area, but are growing at a quicker rate than single-family: 2.2 percent per year compared to 0.7 percent. The relative sizes of the residential building stock vary considerably by municipality, as depicted in Figure 4.1. The City of San Diego and the unincorporated areas of the county represent 57 percent of the total. The City and County therefore have a large opportunity to reduce emissions in this sector through targeted policies, such as building energy codes.
Figure 4.1 Residential building stock floor area (million ft2) by municipality in the San Diego region, 2021. Source: Synapse analysis of data provided by San Diego County Assessor's Office.
i Synapse analysis of data provided by San Diego County Assessor's Office.

106
Figure 4.2 provides a breakdown of the building stock by type of residence and over time for each jurisdiction. These distinctions may affect how quickly and at what cost a community will be able to decarbonize its buildings. Strategies for addressing emissions for single-family homes are dissimilar to strategies for multifamily apartments, due to differing ownership/occupancy paradigms and types of end-use energy equipment in the residences. Additionally, for communities with the fastest relative growth rates—which have recently been Imperial Beach, National City, Chula Vista, San Marcos, and Santee—more stringent building energy codes can play an important role locally.
Figure 4.2 Residential building stock floor area (million ft2) by municipality in the San Diego region, 2017–2021. Source: Synapse analysis of data provided by San Diego County Assessor's Office.
Figure 4.3 provides a breakdown of the average pipeline gas usage for each major gas end use by residential customers under three investor-owned utilities, based on the latest Residential Appliance Saturation Study (RASS).9, i As shown in this figure, the average gas usage for water heating is 200 therms and accounts for the largest share (about 59 percent) of the total usage
i Note that while this figure excludes minor end uses with low customer saturations such as spa and pool heat,
secondary heating, and gas backup for solar water heaters, the average natural gas consumption among all gas customers is lower than the estimates shown in this figure because some customers do not use gas for all major end uses.

107
for the major end uses in SDG&E’s jurisdiction. This share is much larger than the water heating usage share for Pacific Gas & Electric (PG&E), but very close to the usage share for SoCalGas. On the other hand, the average residential gas usage for space heating in the SDG&E area accounts for about 29 percent. These gas end-use profiles show that SDG&E residential customers have the greatest opportunity for GHG savings in water heating. Lastly, a jurisdictional comparison of the total gas usage data in this figure shows that households in the San Diego region are in more favorable positions to pursue building decarbonization because (1) their overall gas usage is lower and (2) it is easier for customers to reduce GHGs associated with water heating than space heating because water heating electrification is a comparatively low-cost and low-complexity upgrade in many cases.
Figure 4.3 Average annual natural gas usage (measured in therms) by end use and by utility for households who use gas as the primary fuel for major end uses. Source: DNV GL Energy Insights (2021). 2019 California Residential Appliance Saturation Study (RASS).9
Figure 4.4 presents residential fuel-use breakdowns for space and water heating end uses in terms of the number of utility accounts in the San Diego region. Data for this analysis are based on the 2019 RASS study. As shown in Figure 4.4, natural gas is the dominant fuel for both space and water heating, while its share for water heating (about 83 percent) is more dominant than for space heating (about 69 percent). Approximately 28 percent of total households use electric space heating, while electric water heating is used less than half as much: about 12 percent.

108
Figure 4.5 shows the breakdown of residential space heating equipment in terms of the number of utility accounts in SDG&E’s service area (which has a nearly perfect overlap with San Diego county). Electric heat pumps account for about 6.3 percent of all residential systems, up from 2 percent a decade earlier, as indicated by the 2009 RASS study. Central gas furnaces with ducts account for about 56 percent of the total systems. Three other heating systems that use ducts are central electric, LPG furnaces, and ducted air-source heat pumps (ASHPs). Together, the systems relying on ducts account for about 70 percent of the total residential space heaters. Excluding ducted ASHPs, such systems account for 66 percent of the total. These represent the prime candidates for fuel switching to ducted ASHP technologies. The rest of the space heaters, including electric unit heater (13 percent) and other fossil heaters (about 13.6 percent), can be converted to heat pumps through the use of ductless minisplit heat pumps.
Figure 4.4 Residential space and water heating by fuel type (% of customer accounts). Source: DNV GL Energy Insights (2021). 2019 California Residential Appliance Saturation Study (RASS).9

109
Figure 4.5 Residential space heating system share by equipment type. Source: DNV GL Energy Insights (2021). 2019 California Residential Appliance Saturation Study (RASS).9
4.2.2 Commercial Buildings
The commercial sector includes 158,000 building units across 36,000 properties in the county. Together, these properties represent an estimated 554 million square feet and are growing at a rate of 0.9 percent per year.i Figure 4.6 highlights the relative sizes of the commercial building stock in each area within the county. The City of San Diego, the unincorporated areas of the county, Chula Vista, Carlsbad, Escondido, and Oceanside have the largest total floor areas. Given the sizable stock of commercial buildings in the City of San Diego, its policies can have an outsized effect on reducing regional emissions. The City’s Building Energy Benchmarking Ordinance is an important step toward managing energy use and emissions in large buildings.10 The ordinance lays the foundation for future innovative policies such as building performance standards, which establish mandatory energy or emissions targets that improve over time.ii
i Synapse analysis of data provided by San Diego County Assessor's Office. ii The following resources provide additional information on building performance standards:
American Cities Climate Challenge. 2021. Building Performance Standards: A framework for Equitable Policies to Address Existing Buildings. Available at: https://www.usdn.org/uploads/cms/documents/bps-framework_july-2021_final.pdf. American Council for Energy-Efficient Economy. 2020. Mandatory Building Performance Standards: A Key Policy for Achieving Climate Goals. Available at: https://www.aceee.org/white-paper/2020/06/mandatory-building-performance-standards-key-policy-achieving-climate-goals.
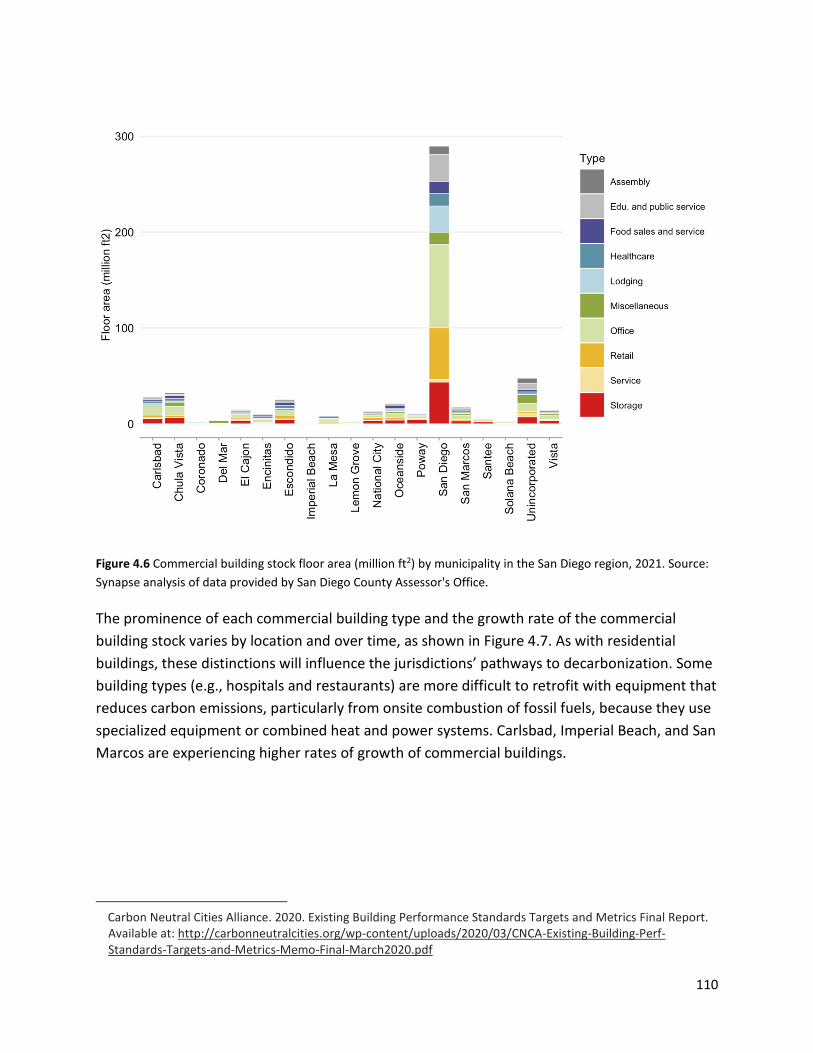
110
Figure 4.6 Commercial building stock floor area (million ft2) by municipality in the San Diego region, 2021. Source: Synapse analysis of data provided by San Diego County Assessor's Office.
The prominence of each commercial building type and the growth rate of the commercial building stock varies by location and over time, as shown in Figure 4.7. As with residential buildings, these distinctions will influence the jurisdictions’ pathways to decarbonization. Some building types (e.g., hospitals and restaurants) are more difficult to retrofit with equipment that reduces carbon emissions, particularly from onsite combustion of fossil fuels, because they use specialized equipment or combined heat and power systems. Carlsbad, Imperial Beach, and San Marcos are experiencing higher rates of growth of commercial buildings.
Carbon Neutral Cities Alliance. 2020. Existing Building Performance Standards Targets and Metrics Final Report. Available at: http://carbonneutralcities.org/wp-content/uploads/2020/03/CNCA-Existing-Building-Perf-Standards-Targets-and-Metrics-Memo-Final-March2020.pdf
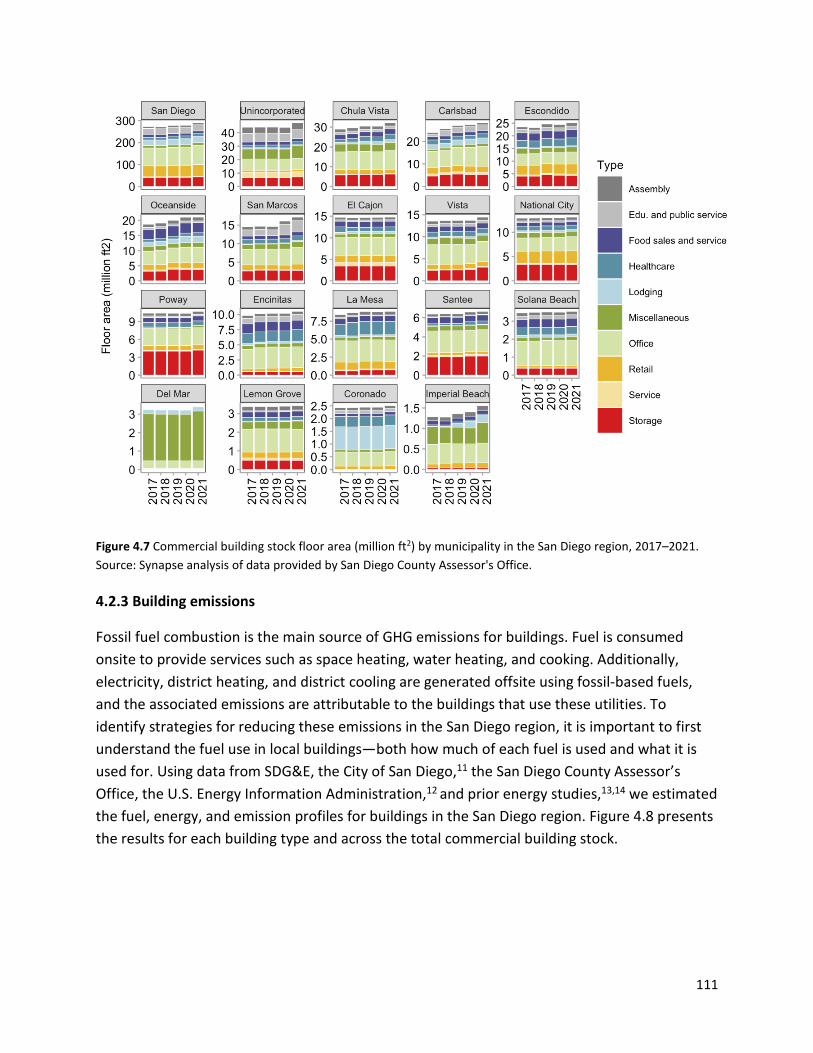
111
Figure 4.7 Commercial building stock floor area (million ft2) by municipality in the San Diego region, 2017–2021. Source: Synapse analysis of data provided by San Diego County Assessor's Office.
4.2.3 Building emissions
Fossil fuel combustion is the main source of GHG emissions for buildings. Fuel is consumed onsite to provide services such as space heating, water heating, and cooking. Additionally, electricity, district heating, and district cooling are generated offsite using fossil-based fuels, and the associated emissions are attributable to the buildings that use these utilities. To identify strategies for reducing these emissions in the San Diego region, it is important to first understand the fuel use in local buildings—both how much of each fuel is used and what it is used for. Using data from SDG&E, the City of San Diego,11 the San Diego County Assessor’s Office, the U.S. Energy Information Administration,12 and prior energy studies,13,14 we estimated the fuel, energy, and emission profiles for buildings in the San Diego region. Figure 4.8 presents the results for each building type and across the total commercial building stock.
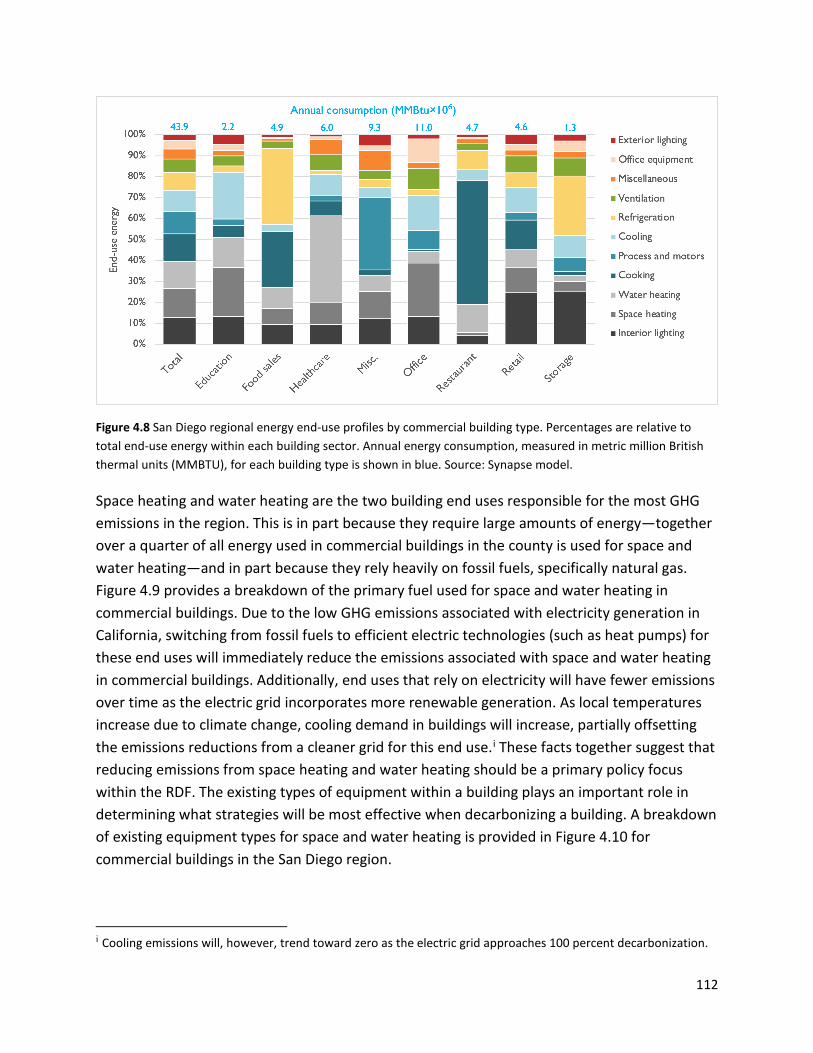
112
Figure 4.8 San Diego regional energy end-use profiles by commercial building type. Percentages are relative to total end-use energy within each building sector. Annual energy consumption, measured in metric million British thermal units (MMBTU), for each building type is shown in blue. Source: Synapse model.
Space heating and water heating are the two building end uses responsible for the most GHG emissions in the region. This is in part because they require large amounts of energy—together over a quarter of all energy used in commercial buildings in the county is used for space and water heating—and in part because they rely heavily on fossil fuels, specifically natural gas. Figure 4.9 provides a breakdown of the primary fuel used for space and water heating in commercial buildings. Due to the low GHG emissions associated with electricity generation in California, switching from fossil fuels to efficient electric technologies (such as heat pumps) for these end uses will immediately reduce the emissions associated with space and water heating in commercial buildings. Additionally, end uses that rely on electricity will have fewer emissions over time as the electric grid incorporates more renewable generation. As local temperatures increase due to climate change, cooling demand in buildings will increase, partially offsetting the emissions reductions from a cleaner grid for this end use.i These facts together suggest that reducing emissions from space heating and water heating should be a primary policy focus within the RDF. The existing types of equipment within a building plays an important role in determining what strategies will be most effective when decarbonizing a building. A breakdown of existing equipment types for space and water heating is provided in Figure 4.10 for commercial buildings in the San Diego region.
i Cooling emissions will, however, trend toward zero as the electric grid approaches 100 percent decarbonization.

113
Figure 4.9 San Diego region primary fuel used in commercial buildings (floor area, million ft2) by building type: space heating (left) and water heating (right). Source: Synapse model.
Figure 4.10 San Diego region natural gas equipment system used in commercial buildings (floor area, million ft2) by building type: space heating (left) and water heating (right). Source: Synapse model.
114
4.3 Technologies and Fuels for Decarbonizing Buildings
4.3.1 Space heating technologies
Electric heat pumps are energy-efficient heating and cooling systems that work for all climates. Unlike fossil fuel-based heaters that generate heat by burning fuels, heat pumps provide space heating by extracting heat from outside and transferring it to the inside, using a vapor-compression refrigerant cycle that connects an outdoor compressor with an indoor heat exchanger. Heat pumps also work as an efficient air conditioner by reversing the heat transfer process to remove heat and moisture from indoor air. Because of this heat transfer process, heat pump efficiency levels typically exceed 250 percent (a coefficient of performance, or COP, of 2.5) for heating and 400 percent (COP of 4) for cooling. That means for one unit of energy input, a heat pump can provide 2.5 or more units of heating. By comparison, the most efficient gas combustion heaters provide 0.98 units of heating for one unit of energy input. Switching from natural gas heating to heat pumps will increase the electricity demand on the grid in the winter. Notably, the electric grid in the San Diego region peaks in the summer and can accommodate additional winter load from electrification without substantial new investment in power transmission and distribution infrastructure.
Various types of heat pumps are available in the market. Heat pumps are primarily categorized by (a) the heat sources they draw from to heat buildings, (b) whether the systems heat air or water, and (c) how the extracted heat is distributed in the buildings. Primary heat pump technologies used for space heating include air-source heat pumps (ASHPs), ground-source heat pumps (GSHPs), water-source heat pumps (WSHPs), and air-to-water heat pump (AWHPs).
ASHPs are the most common heat pump system type used in the country. They move heat in the air between inside and outside. Because ASHPs use heat in the outdoor air, their performance (in terms of efficiency and capacity) degrades in cold temperatures. Thus, conventional ASHPs often have backup electric resistance heating strips for cold temperature operation. However, cold climate ASHPs that are now widely available in the market can provide comfortable heat even under freezing temperatures without a backup heater.i Notably, the winter climate in the populated regions of the San Diego region is very moderate, so there is little need for backup heat in most of the region.
i A field study in Vermont observed that cold climate ASHPs operated at 5° F with a COP of 1.6 and even at -20° F at
above 1 COP. See Cadmus (2017). Evaluation of Cold Climate Heat Pumps in Vermont. Prepared for the Vermont Public Service Department. Page 24. Available at: https://publicservice.vermont.gov/sites/dps/files/documents/Energy_Efficiency/Reports/Evaluation%20of%20Cold%20Climate%20Heat%20Pumps%20in%20Vermont.pdf.

115
ASHPs include ducted ASHPs, mini-split ductless heat pumps, packaged terminal heat pumps, and variable refrigerant flow (VRF) ASHPs. A short summary of these technologies is provided below.
● Ducted ASHPs are the most widely installed systems. Ducted ASHPs include split systems and packaged systems. Split heat pumps have an outdoor condenser and an air handling unit in the building to deliver heating or cooling through ducts similar to forced-air gas furnaces. Packaged heat pumps have all the components necessary for heating, cooling, and air circulation combined into a single system, usually mounted directly onto the building. They are typically installed on rooftops and thus are often called rooftop units (RTUs). Ducted ASHPs can be a suitable alternative to aging gas furnaces. Ducted ASHPs are installed in residential and small to medium commercial buildings.
● Mini-split ductless heat pumps are relatively new to the U.S. market, but have been gaining popularity over the past several years as new residential and small commercial heating systems across the country. Mini-split systems also have outdoor condensers, but use refrigerant pipes to deliver heating or cooling to each room where an indoor unit is installed. Because they use small refrigerant pipes and are relatively easy to install, they are suitable for heating system retrofits where ducts are not available. They also use variable speed compressors, which allow them to operate more efficiently and quietly than standard ducted ASHPs and to provide superior temperature controls.
● Packaged terminal heat pumps (PTHP) are all-in-one systems (including compressor, condenser and evaporator coils, fans, etc.), installed on an exterior wall. They are often installed in hotels and small apartment units. Compared to other heat pump systems, PTHPs do not perform well and their operating temperatures are typically limited. However, a few cold climate PTHP models recently have become available in the market.15
● Variable refrigerant flow (VRF) ASHPs can distribute heating and cooling to numerous indoor evaporator units through a main refrigerant line from a single outdoor system.16
Many VRFs can also provide heating and cooling simultaneously in different rooms by adding a heat recovery system, and thus are beneficial for buildings with diversely loaded zones.17 VRFs are generally suitable for medium to large commercial buildings, but especially for medium/high-rise multifamily buildings, office, schools, and lodging.18
Compared with ASHP, GSHPs and WSHPs provide better performance in cold temperatures because they use heat reservoirs that have a higher temperature than ambient air during the winter.i GSHPs use underground rock or groundwater as a heat reservoir. WSHPs use a well, lake, aquifer, or other source (e.g., wastewater, cooling loop system, etc.) as a heat reservoir. GSHPs need to drill holes or dig trenches in the ground to install a heat exchanging group loop
i GSHPs and WSHPs also typically provide better cooling performance in hot temperatures because the heat
reservoirs are generally lower temperature than ambient air during the summer.

116
and thus are considerably more expensive than other heat pump technologies; however, total lifecycle costs for GSHPs can sometimes be lower, due to high-efficiency operation.
AWHPs extract heat in the outdoor air and use water (or a mixture of water and glycol) as a heat transfer medium within the building instead of forced air. AWHPs are now widely available as heat pump water heaters for residential buildings. To date, their applications for space heating have been limited in the United States, although more systems are becoming commercially available in the early 2020s. For large commercial buildings with existing hot water heating systems (e.g., gas boilers), large-scale AWHPs can be a more energy-efficient alternative heating system or can provide supplemental heating.
GSHP, WSHPs, and even AWHPs can also produce temperatures high enough for a district heating energy system that circulates hot water. For example, Stanford University’s new district heating energy system includes three large-scale heat recovery chillers (a type of WSHPs) that extract heat from waste heat from the University’s cooling tower.19
4.3.2 Heat pump performance
For our building energy analysis, we developed average annual coefficient of performance (COP) values for heat pumps separately for the residential and commercial buildings for a Central case and for a Low Demand (high efficiency leading to low energy demand) case,i as shown in Table 4.1 below. We developed these estimates based on our assessment of various data sources. The data sources include our own calculation of COP values based on real-world heat pump performance data on residential-scale heat pumps in other states, combined with hourly temperatures in San Diego County.20-22 We also reviewed COP values in California23 and for the US market as a whole.24 For commercial buildings, we assumed that heat pumps are 20 percent more efficient than residential systems under the Central case due to the availability of high-temperature heat sources, VRF’s high COP values due to simultaneous heating and cooling functions, and advanced technologies such as multi-stage compressors. Finally, we developed projections of COP values through 2050 for the Central case and for the Low Demand case based on National Renewable Energy Laboratory’s COP forecasts in its Electrification Futures Study.25
i See Section 4.4 of this chapter for a discussion of the modeled cases.

117
Table 4.1.Synapse projection of COP values for heat pump space heating in the San Diego region.
2021 2030 2040 2050
Central case
Residential 3.3 3.6 3.8 3.8
Commercial 3.9 4.4 4.5 4.6
Low Demand case
Residential 3.3 3.8 4.4 5.0
Commercial 3.9 4.5 5.0 5.5
We also developed our forecasts of total installed costs for heat pumps and gas space heaters for single-family and multifamily buildings, as shown in Table 4.2 below. The installation costs include equipment and labor, but exclude operation and maintenance. We reviewed numerous data sources and developed the current cost estimates primarily based on a 2019 study by E3 which analyzed residential building electrification in California.26 The main reasons why we decided to use this data source are that (a) some cost estimates in this study aligned well with our knowledge of system installed costs and the cost estimates in other trusted data sources; (b) the study conducted a detailed bottom up approach to estimate heat pump costs; and (c) the study provided cost estimates by climate zone, type of building, and building vintage. We selected cost estimates for coastal Los Angeles and downtown Los Angeles to develop cost estimates for the San Diego region, as these areas have the most similar climate to San Diego. We then used various data sources to develop weighted average cost estimates for single-family and multifamily buildings in the San Diego region.i Next, we forecasted future total installed costs of these systems using data from NREL’s Electrification Future Study.25 Heat pump costs fall, in real terms, over the study period to reflect the increasing maturity of the technology along with technical and market advances as the equipment becomes much more widely adopted. (In contrast, gas furnace and boiler technology is largely mature and we project stable pricing.) Finally, we used the share of floor area between single-family and multifamily buildings (54 percent single-family and 46 percent multifamily) to develop per-unit costs for residential buildings on average, to align with how our decarbonization scenarios are defined. Equipment costs do not differ substantially between new construction and retrofits, provided
i We used the following sources to develop new construction and HVAC retrofit rates: Joint Center for Housing
Studies of Harvard University. 2021. Improving America's Housing. Available at: https://www.jchs.harvard.edu/sites/default/files/reports/files/harvard_jchs_improving_americas_housing_2021.pdf; Statista. 2021. "Number of housing units in the United States from 1975 to 2020. Accessed September 27, 2021. Available at: https://www.statista.com/statistics/240267/number-of-housing-units-in-the-united-states/; San Diego County’s tax assessor database. We also developed an estimate of HVAC retrofits by homes with ductless heaters (e.g., wall furnace, electric resistance heater etc.) in San Diego Country based on the 2019 RASS.
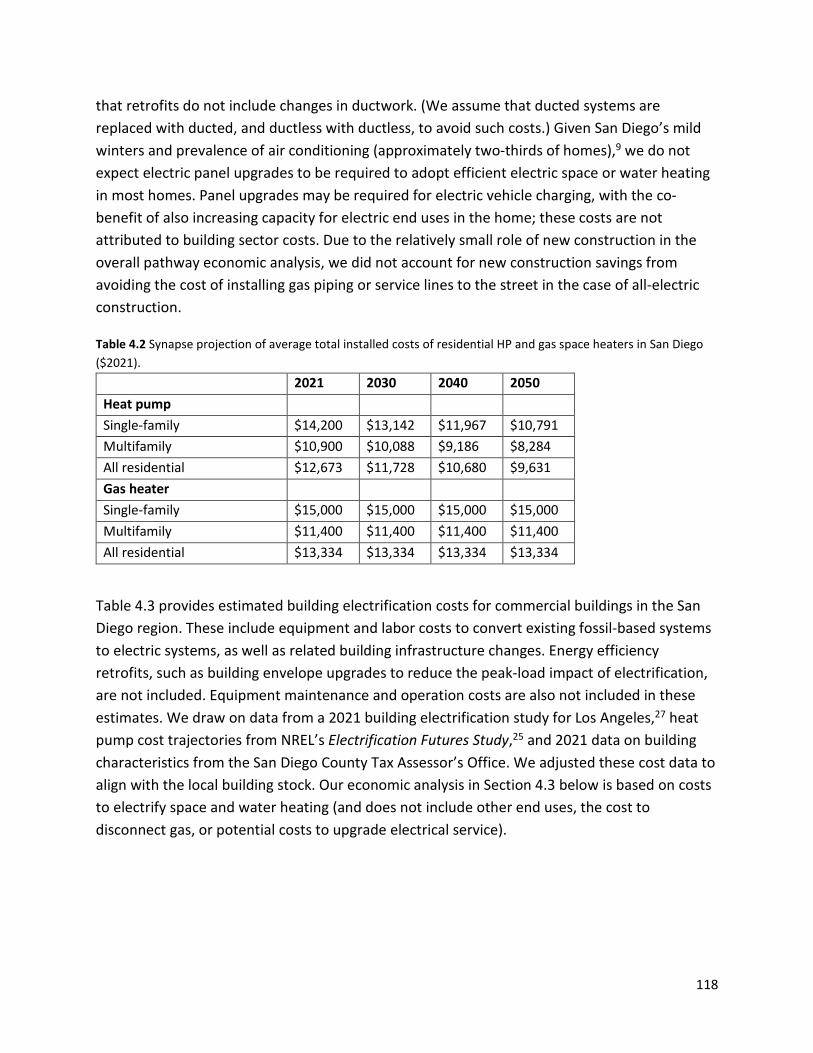
118
that retrofits do not include changes in ductwork. (We assume that ducted systems are replaced with ducted, and ductless with ductless, to avoid such costs.) Given San Diego’s mild winters and prevalence of air conditioning (approximately two-thirds of homes),9 we do not expect electric panel upgrades to be required to adopt efficient electric space or water heating in most homes. Panel upgrades may be required for electric vehicle charging, with the co-benefit of also increasing capacity for electric end uses in the home; these costs are not attributed to building sector costs. Due to the relatively small role of new construction in the overall pathway economic analysis, we did not account for new construction savings from avoiding the cost of installing gas piping or service lines to the street in the case of all-electric construction.
Table 4.2 Synapse projection of average total installed costs of residential HP and gas space heaters in San Diego ($2021).
2021 2030 2040 2050 Heat pump Single-family $14,200 $13,142 $11,967 $10,791 Multifamily $10,900 $10,088 $9,186 $8,284 All residential $12,673 $11,728 $10,680 $9,631 Gas heater Single-family $15,000 $15,000 $15,000 $15,000 Multifamily $11,400 $11,400 $11,400 $11,400 All residential $13,334 $13,334 $13,334 $13,334
Table 4.3 provides estimated building electrification costs for commercial buildings in the San Diego region. These include equipment and labor costs to convert existing fossil-based systems to electric systems, as well as related building infrastructure changes. Energy efficiency retrofits, such as building envelope upgrades to reduce the peak-load impact of electrification, are not included. Equipment maintenance and operation costs are also not included in these estimates. We draw on data from a 2021 building electrification study for Los Angeles,27 heat pump cost trajectories from NREL’s Electrification Futures Study,25 and 2021 data on building characteristics from the San Diego County Tax Assessor’s Office. We adjusted these cost data to align with the local building stock. Our economic analysis in Section 4.3 below is based on costs to electrify space and water heating (and does not include other end uses, the cost to disconnect gas, or potential costs to upgrade electrical service).

119
Table 4.3 Estimated commercial building electrification costs for San Diego County ($2021).
Item Units 2021 2030 2035 2040 2045 2050 Space heat $/sqft $15.83 $13.79 $13.03 $12.28 $11.80 $11.33 Water heat $/sqft $0.65 $0.57 $0.53 $0.49 $0.46 $0.42 Cooking $/sqft kitchen $18.00 $18.00 $18.00 $18.00 $18.00 $18.00 Gas disconnection $/property $922 $922 $922 $922 $922 $922 Electrical upgrades
$/property $32,975 $32,975 $32,975 $32,975 $32,975 $32,975
Other end uses, misc.
$/sqft $1.75 $1.75 $1.75 $1.75 $1.75 $1.75
Source: Synapse model based on data from Jones (2021),26 Mai et al. (2018),46 and San Diego County Tax Assessor’s Office (2021). Values represent total gross costs, not incremental cost to fossil fuel systems.
4.3.3 Water heating technologies
Residential water heating is the largest gas consuming end use in the San Diego region (Figure 4.3) and thus offers the largest GHG emissions savings opportunity through electrification of this end use.
Heat pump water heaters (HPWHs) have now become widely available in the market. HPWHs are very efficient water heating systems. Their efficiency is measured using a Uniform Energy Factor (UEF) which presents an efficiency rating based on certain testing conditions.i The majority of the available products have UEFs above 3, and several products with a UEF of 4 are now available in the market.28 Electric resistance-based and combustion-based water heaters, whether tanked or tankless, cannot exceed a UEF of 0.99.
The most popular HPWH technology is a hybrid HPWH which includes a heat pump, backup electric resistance coils, and hot water storage tanks. Hybrid HPWHs can be installed in many places, including garages, basements, back porches, and outdoor-vented closets. Depending on where they are installed, their performance differs widely because of differences in air temperature and ventilation. A garage is an optimal place for the best performance in warmer climates, while basements may be a better place in cooler climates.29, 30
Another HPWH technology is a split heat pump water heater with an outdoor compressor, sometimes called a “pure” HPWH because it does not need a backup resistance heater. As a split system, it offers more flexibility for placing the indoor unit within the living space. Sanden produces a split HWPH that uses CO2 as a refrigerant. This split heat pump water heater has
i UEF is comparable to coefficient of performance: it measures the ratio of the energy service output to the energy
input. It is not exactly equal to the coefficient of performance for a water heater’s heating element because it incorporates heat losses from the water storage tank.

120
several advantages over hybrid models: (a) it has a substantially higher capacity (approximately 3 times larger than hybrid models) and efficiency (with a rated COP of 5), (b) it only requires 13 Amp service, which could avoid upgrading an electrical panel (while a few new hybrid HPWH models also only require 15 Amps or so), and (c) it can raise water temperature up to 175° F and can operate in ambient temperatures down to -20° F.31, 32
Both hybrid and pure HPWHs can offer load flexibility and work as demand response resources by storing additional thermal energy when electricity rates are low to avoid energy usage during peak hours. A 2018 study by Ecotope, Inc. found that this HPWH load flexibility can result in customer bill savings of 15 to 20 percent, with about 35 percent utility marginal cost savings in California.33 The demand flexibility of HPWHs can help mitigate the grid impacts associated with electrification of water heating.
Several large-scale HPWHs (which are either AWHPs or WSHPs) are available for commercial buildings in the market (including large multifamily buildings), although to date such applications have been limited in the country. HPWH configurations for commercial buildings can be quite different from single-family homes because commercial buildings have a lot of variations in water use and building structures, and also because some buildings have unique opportunities to utilize different heat reservoirs. For example, HPWHs can be placed in a below-grade garage, if available, and take advantage of the milder temperatures in the garage to produce hot water.34 Mechanical rooms or laundry rooms can also be a suitable place for HPWHs installations if such those rooms are currently too hot or too humid, because HPWHs have the added benefit of cooling and dehumidifying the surrounding air. Further, HPWHs can be placed where they can utilize waste heat produced in certain commercial facilities such as spas, restaurant kitchens, or wastewater treatment facilities. Such HPWH applications provide space cooling benefits to the commercial facilities. Finally, large commercial and institutional buildings with a standard chiller system with a cooling tower could be a good candidate for installing HPWHs, more specifically heat recovery chillers. Heat recovery chillers can recover some of the waste heat from the electric chillers and produce hot water.35
4.3.4 Water heater performance
For our building energy analysis, we developed average annual COP values for HPWH separately for residential and commercial buildings for a Central case and for a Low Demand case, as shown in Table 4.4 below. We developed these values based on our assessment of a few different data sources. The primary source is NRDC and Ecotope’s analysis of HPWH performance in California, where they estimated COP values in 16 climate zones in the state.28 We selected climate zones suitable for the San Diego region from this study and estimated the average COP values for garage and vented closet placement. We then adjusted the COP values

121
upward to account for technology improvement, since the study was conducted using the UEF ratings for the HPWH products available at the time.27 Finally, we developed our COP projections and COP estimates for commercial systems loosely based on NREL’s COP forecasts for HWPH in its Electrification Futures Study.25 NREL’s COP estimates for commercial systems are generally lower than residential systems, with the difference ranging from 0 percent to about 14 percent, depending on the years. However, we assume commercial systems perform at least as well as residential systems and better than NREL’s projections because some commercial buildings have access to unique heat reservoirs, unlike residential buildings.
Table 4.4 Synapse’ projection of COP values for heat pump water heating in the San Diego region, for central case and high efficiency (low demand) case.
2021 2030 2040 2050 Central case
Residential 3.0 3.2 3.5 3.5 Commercial 3.0 3.2 3.5 3.5
Low Demand case Residential 3.0 3.3 3.6 4.0 Commercial 3.0 3.3 3.6 4.0
We also developed our forecasts of total installed costs for HPWHs and gas water heaters for single-family and multifamily buildings, as shown in Table 4.5 below. The installation costs include equipment and labor, but exclude operation and maintenance. We first developed the current cost estimates based on a literature review of a few different sources.36, 37 Next, we forecasted future total installed costs of these systems using data from NREL’s Electrification Future Study. Finally, we used the share of floor area between single-family and multifamily buildings (54 percent single-family and 46 percent multifamily) to develop per-unit costs for residential buildings on average, to align with how our decarbonization scenarios are defined. As with space heating, we do not find that costs differ substantially between new construction and retrofit applications. Cost data for water heating electrification for commercial buildings, including installing HPWHs, are provided in Table 4.3 above.
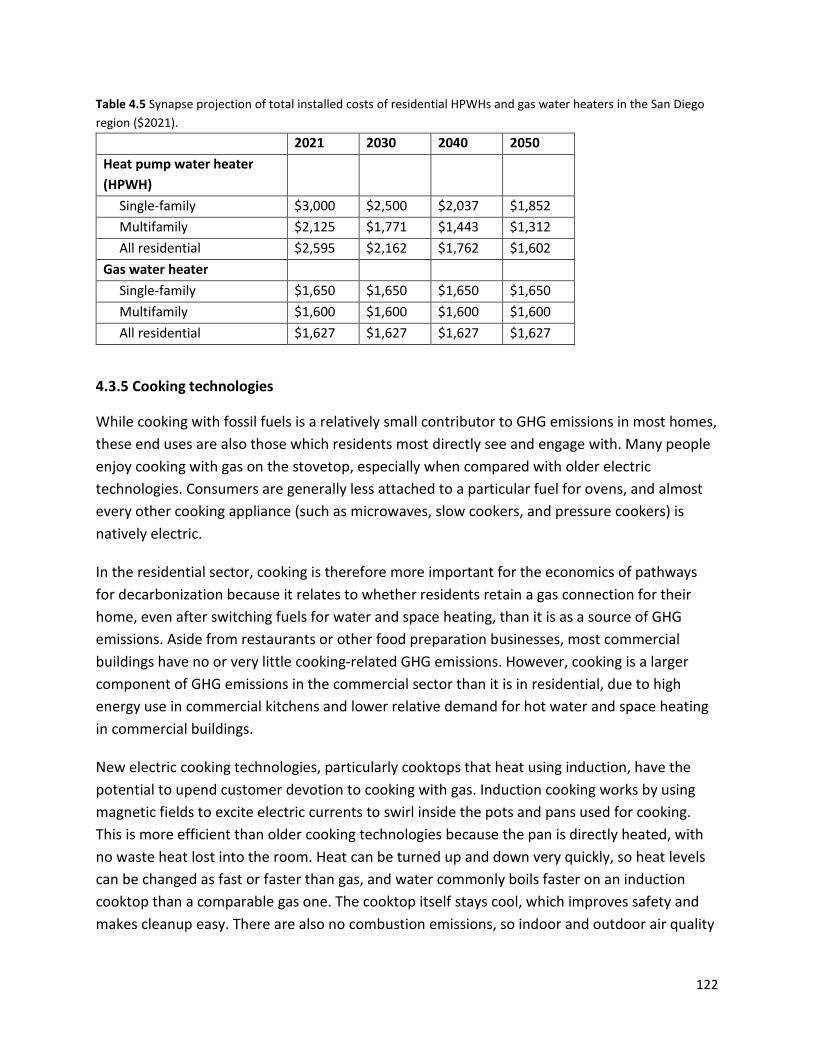
122
Table 4.5 Synapse projection of total installed costs of residential HPWHs and gas water heaters in the San Diego region ($2021).
2021 2030 2040 2050 Heat pump water heater (HPWH)
Single-family $3,000 $2,500 $2,037 $1,852 Multifamily $2,125 $1,771 $1,443 $1,312 All residential $2,595 $2,162 $1,762 $1,602
Gas water heater Single-family $1,650 $1,650 $1,650 $1,650 Multifamily $1,600 $1,600 $1,600 $1,600 All residential $1,627 $1,627 $1,627 $1,627
4.3.5 Cooking technologies
While cooking with fossil fuels is a relatively small contributor to GHG emissions in most homes, these end uses are also those which residents most directly see and engage with. Many people enjoy cooking with gas on the stovetop, especially when compared with older electric technologies. Consumers are generally less attached to a particular fuel for ovens, and almost every other cooking appliance (such as microwaves, slow cookers, and pressure cookers) is natively electric.
In the residential sector, cooking is therefore more important for the economics of pathways for decarbonization because it relates to whether residents retain a gas connection for their home, even after switching fuels for water and space heating, than it is as a source of GHG emissions. Aside from restaurants or other food preparation businesses, most commercial buildings have no or very little cooking-related GHG emissions. However, cooking is a larger component of GHG emissions in the commercial sector than it is in residential, due to high energy use in commercial kitchens and lower relative demand for hot water and space heating in commercial buildings.
New electric cooking technologies, particularly cooktops that heat using induction, have the potential to upend customer devotion to cooking with gas. Induction cooking works by using magnetic fields to excite electric currents to swirl inside the pots and pans used for cooking. This is more efficient than older cooking technologies because the pan is directly heated, with no waste heat lost into the room. Heat can be turned up and down very quickly, so heat levels can be changed as fast or faster than gas, and water commonly boils faster on an induction cooktop than a comparable gas one. The cooktop itself stays cool, which improves safety and makes cleanup easy. There are also no combustion emissions, so indoor and outdoor air quality
123
is improved. Electric ovens are comparably priced competitors to gas ovens, and do not face technology-specific market or customer adoption barriers.
Barriers to the adoption of induction cooking include relatively higher upfront prices, the fact that some pots and pans are not compatible with induction, and customer unfamiliarity with the new technology. Both electric cooktops and ovens (and combined systems) can require new electric circuits to be run to carry enough power, and they could even trigger the need for an electric panel upgrade (if the panel has not yet been upgraded to serve a fast electric vehicle charger and/or heat pump systems).
4.3.6 Laundry
Electric dryers have a large market share today; in the Pacific census region, the U.S. Energy Information Administration found that two-thirds of homes that have dryers use an electric one.38 Aside from potential building-specific barriers stemming from electric-panel capacity and new circuits, there are no substantial barriers to residential adoption of electric dryers. There are also new, more efficient, electric dryers that use heat pump technology. These pump heat into the drum, while the cool side of the heat pump is used to condense the water removed from the clothes. This eliminates the need for a vent, so heat pump dryers can be used very effectively in high-performance buildings with tight building envelopes. Heat pump dryers are gentler on clothes than traditional tumble dryers, but can also take a longer time to dry a load of laundry and are currently substantially more expensive than traditional dryers.
Commercial laundry systems face higher barriers to the adoption of electric options than do residential. Running many large electric dryers, as in a laundromat, could require substantial upgrades to a building’s electrical system if it is transitioning from gas equipment. The slower speed of heat pump dryers is also more of a challenge in throughput-limited commercial laundry systems than in residential applications.
4.3.7 Low-carbon fuels
One way to reduce the GHG emissions from buildings without changing building systems (or before changing those systems to non-emitting options) is to use a fuel that does not release net greenhouse gases into the atmosphere. The two primary ways to generate such a fuel are to process the waste from biological processes or to separate hydrogen from various feedstocks.
4.3.7.1 Biomethane
Biomethane is defined as methane recovered from or generated from a biological process. (Methane is the primary component of fossil natural gas.) Many microbes that digest organic
124
matter in the absence of oxygen (“anaerobic” digestion) release a combination of carbon dioxide and methane, called syngas. Biological feedstock can also be gasified into syngas using high heat processes (called “pyrolysis”). The carbon dioxide can be removed (called “scrubbing” the gas), leaving pipeline-quality methane.
Biomethane supply is currently very limited, and supply is expected to remain limited to well below the level of current fossil gas consumption. This limitation comes from both the lack of infrastructure to produce biomethane from biological feedstocks and the more fundamental limitation of the amount of feedstock biomass material that can be sustainably produced. In the face of limited supply, use in the building sector may not be prudent or economical because other sectors (such as industrial use) that have fewer low-carbon alternatives may require all the available supply.
Processing for pipeline use must also compete with the option to combust the unprocessed (or less processed) fuels at their site of production to generate electricity and transport the resulting low-carbon energy to customers that way. There are also concerns about leakage of biomethane and recovered methane. Fugitive emissions can be high in certain production processes, including digestate storage and biogas upgrading.39
Biomethane costs and emissions depend on the production pathway used. In general, though, biomethane has lower, but non-zero, GHG emissions (especially after leakage is considered), and costs range between $10 per MMBTU to over $50 per MMBTU.40 For reference, fossil natural gas currently costs less than $5 per MMBTU.
4.3.7.2 Hydrogen-based fuels
There are two primary methods used to produce low-carbon hydrogen. The first of these is electrolysis, in which water is split into hydrogen and oxygen by running electricity through the water. If the electricity for this purpose is low-carbon, then the hydrogen is low-carbon. This is referred to as “green” hydrogen. The second method builds on today’s methods for making hydrogen, which rely on splitting methane into carbon dioxide and hydrogen using “steam reformation.” So-called “blue” hydrogen is low-carbon if the resulting carbon dioxide is captured and permanently sequestered. There are no fundamental physical limits to the amount of green hydrogen that can be produced, so this energy carrier holds promise to meet combustion energy needs not met by biomethane. Today, approximately 99 percent of hydrogen produced in the United States is produced directly from fossil fuels, and about 1 percent from electricity (although not all this electricity is low-carbon).41 Green hydrogen production would need to increase spectacularly, alongside associated further increases in zero-carbon electricity generation beyond what was modeled for the RDF, in order to play an important role in building decarbonization.
125
Hydrogen can be blended with natural gas up to the level of about 20 percent by volume, or 7 percent by energy, without requiring changes in pipeline or customer infrastructure. However, at higher hydrogen concentrations, some pipeline materials could be damaged and customer appliances might fail to work safely. Using pure hydrogen (or high-hydrogen blends) would therefore require a substantial infrastructure investment to replace pipes and ensure that all customer cooktops, furnaces, water heaters, etc., were upgraded before the gas were sent to their buildings. Because hydrogen-ready appliances are only just being tested today, and pipeline systems would also need to be upgraded, this change-over is arguably a larger shift for customers than electrification would be.
One way to limit the need for infrastructure change to accommodate hydrogen would be to combine the hydrogen with carbon captured from a biological source or from direct air capture, to produce synthetic methane. When using biological sources, this fuel would face the same feedstock limits as biomethane. This means that for wholesale replacement of fossil natural gas with synthetic gas, the carbon would likely need to be captured from the air. Net lifecycle GHGs from these processes would depend on powering the air capture with zero-carbon sources of energy and limiting the leakage of the produced methane to low-enough levels so as to not fully counteract the climate benefits of the fuel.
One planning implication of using green hydrogen, especially paired with direct air capture, is the immense requirements for electricity to power the electrolysis and air capture processes. The amount of electricity to produce these fuels and meet customer needs would dwarf the amount of electricity that would be required to directly meet customer needs with the generated electricity. As shown in Figure 4.11, meeting the same energy demand with green hydrogen as with heat pumps would require almost six times as much renewable energy generation.
While the ability to store and ship hydrogen and synthetic methane allows the generation to be located in distant places, and not be aligned with seasonal needs for heating, the added land use and cost associated with this electricity production should not be overlooked. Overall, synthetic natural gas is expected to be more expensive than biomethane when using direct air capture: E3 recently estimated a cost of about $70 per MMBTU.42
In the San Diego region’s context, with the county’s good year-round renewable electricity resource and lack of strong seasonal heating demand, these technologies face an even greater competitive challenge. In addition, industrial and heavy duty transportation end uses that are difficult to electrify would be the first users of low-carbon hydrogen or synthetic fuels, so supply for buildings would be a secondary market and could be limited.

126
Figure 4.11 Comparison of efficiency of energy delivery between green hydrogen and heat pumps. Note that this figure does not include the added cost and efficiency loss from direct air capture and the manufacture of synthetic methane. Source: London Energy Transformation Initiative, 2021. “Hydrogen: A decarbonisation route for heat in buildings?,” Available at: https://b80d7a04-1c28-45e2-b904-e0715cface93.filesusr.com/ugd/252d09_54035c0c27684afca52c7634709b86ec.pdf. Reproduced with permission.
4.4 Pathways to Decarbonization of San Diego’s Buildings Synapse modeled three different trajectories to reach a carbon-free building sector in 2050. These scenarios were designed to align with multi-sector analysis performed by Evolved Energy Research, as detailed in Chapter 1 and Appendix A.i
1. Central (High Electrification). This pathway assumes that over 95 percent of space heating and water heating equipment sales are fully electric by 2030 and 2032, respectively. In 2050, no residential water heating is served by gas and only 8 percent of residential space heating systems are unelectrified. SDG&E adds about 44,000 new gas customers by 2030, and about 2,000 after.
2. Low Demand (High Efficiency). In this scenario, space and water heating system sales and stock numbers match the trajectories from the Central case. Heat pumps are assumed to perform at higher efficiencies, reducing electricity consumption and demand.
3. Partial Electrification. This case models an alternative approach, where less than half of space and water systems sales in 2030 are electric. In this case, a low-carbon gas to use as a natural gas alternative is required to achieve decarbonization within the study
i The Evolved Energy Research (EER) model assumptions are described in Appendix A Table 1.

127
period. The scenario assumes a linear increase in the use of a low-carbon gas,i starting in 2030 and reaching 100 percent in 2045 and later years. SDG&E adds about 60,000 new gas customers by 2030, and about 34,000 more by 2050.
Table 4.6 Some important differences between the three modeled scenarios.
Central Low Demand Partial Electrification Electric space heat equipment sales share in 2030
96% (84% heat pump)
96% (84% heat pump)
41% (17% heat pump)
Electric share of installed residential HVAC systems in 2050
92% (75% heat pump)
92% (75% heat pump)
75% (54% heat pump)
New residential space heating heat pump COP in 2050
3.51 5 3.51
Residential and commercial electricity consumption from space and water heating in 2050
4.6 TWh 4.2 TWh 4.3 TWh
We have not examined a reference case which fails to achieve zero emissions by 2045 (in line with California’s statewide net-zero goal). GHG reductions are required by the state, so the relevant questions for policymakers and the public relate to which pathway to decarbonization to choose, not whether to decarbonize at all. Comparing the decarbonization cases to a “reference” or “business as usual” case that fails to reduce emissions would not provide useful insights.
We have also not modeled a scenario that reduces emissions from the building sector to zero (or net-zero) by 2035. Achieving such a target within the San Diego region’s building stock itself would require either extensive retirement and replacement of operating fossil fuel equipment, such as furnaces and water heaters, before the end of its useful life, or a rapid and extensive uptake of low- or zero-emission combustion fuels. Either approach would create a cost that substantially exceeds the cost of replacing equipment with efficient electric options after a normal lifespan, as modeled here. It is likely that cost-effectively achieving a net-zero target for the buildings sector well in advance of 2045 or 2050 would require use of offsets from carbon removal or emission reductions in other sectors or locations. In the event that the San Diego region pursues this approach, it will be necessary to continue local emission reduction activities after 2035, such as those detailed in the scenarios considered here, in order to reduce the dependence on offsets.
Early policy interventions—such as updating building energy codes to require “electrification-ready” or “all-electric” in all new construction and major renovations—can help achieve the high market penetration of electric space and water heating equipment, as in the Central and
i Assumed to be a gas that reduces GHGs by 95 percent relative to fossil gas.

128
Low Demand scenarios. Harmonizing the region’s building codes to its decarbonization goals will reduce the overall costs of transitioning away from fossil fuels, aligning near-term investments to the 2050 vision. Further, building codes for new construction can help expedite the adoption of low-carbon technologies into the market, preparing the labor force and equipment distributors to supply these technologies to existing buildings as well.
The scenario results in the sections below include all equipment stock in buildings: existing buildings and new construction. We use population growth projections for California to evaluate the rate of new construction in the San Diego region.43, i We estimate that 8 percent of the residential and commercial building stock will be new by 2030, increasing to 18 percent by 2050.
4.4.1 Central Scenario (High Electrification) Results
This case illustrates a decarbonization pathway centered on switching space and water heating systems from natural gas (and delivered fuels) to electricity, predominantly heat pumps. Figure 4.12 shows the breakdown in annual sales for space and water heating in the residential and commercial markets.
Figure 4.12 Sales of space and water heating equipment, by fuel and type, in the Central case through 2050. Residential results are on the top and commercial results are on the bottom. Space heating results are on the left
i We assume 0.8 percent population growth during the period 2021–2030 and 0.6 percent population growth
thereafter until 2050.
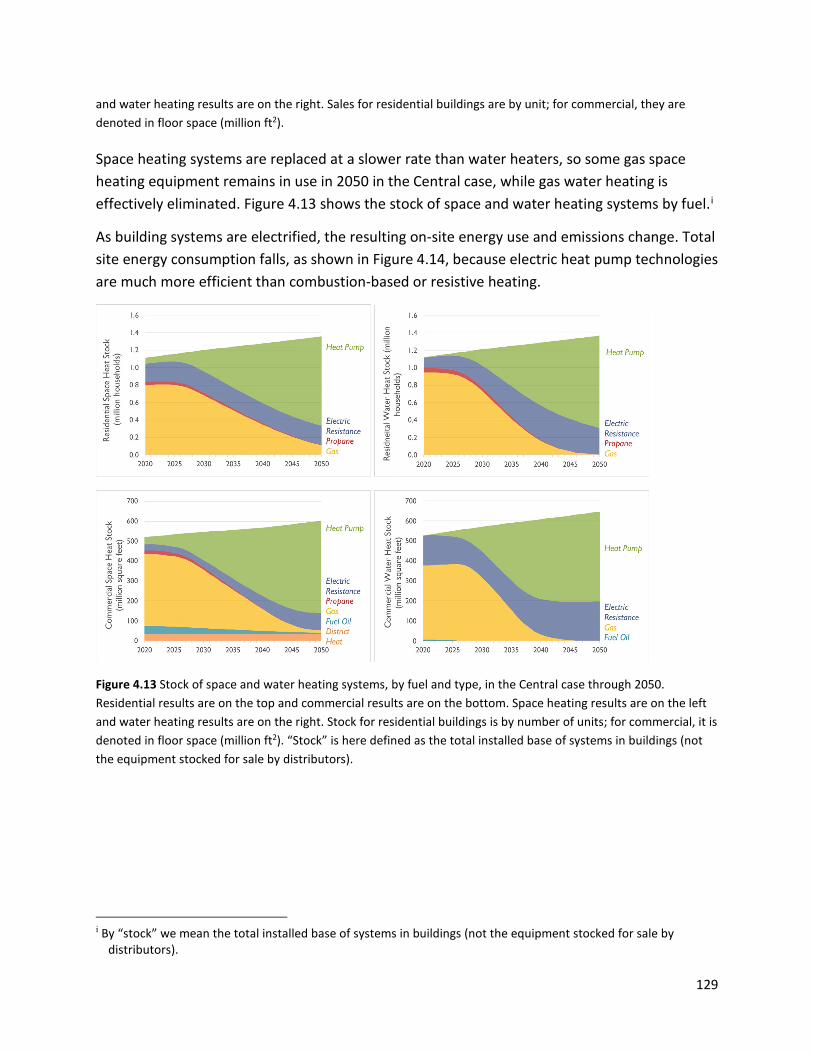
129
and water heating results are on the right. Sales for residential buildings are by unit; for commercial, they are denoted in floor space (million ft2).
Space heating systems are replaced at a slower rate than water heaters, so some gas space heating equipment remains in use in 2050 in the Central case, while gas water heating is effectively eliminated. Figure 4.13 shows the stock of space and water heating systems by fuel.i
As building systems are electrified, the resulting on-site energy use and emissions change. Total site energy consumption falls, as shown in Figure 4.14, because electric heat pump technologies are much more efficient than combustion-based or resistive heating.
Figure 4.13 Stock of space and water heating systems, by fuel and type, in the Central case through 2050. Residential results are on the top and commercial results are on the bottom. Space heating results are on the left and water heating results are on the right. Stock for residential buildings is by number of units; for commercial, it is denoted in floor space (million ft2). “Stock” is here defined as the total installed base of systems in buildings (not the equipment stocked for sale by distributors).
i By “stock” we mean the total installed base of systems in buildings (not the equipment stocked for sale by
distributors).

130
Figure 4.14 Total site energy consumption (measured in trillion British thermal units, TBTU) in the San Diego region for space and water heating in the Central case through 2050 by building type and end use.
Natural gas use would decline to about 3 percent of current levels, with remaining use primarily for residential space heating, as shown in Figure 4.15.
On-site GHG emissions, which are currently dominated by natural gas combustion, would follow a trajectory almost exactly aligned with the natural gas trajectory. Figure 4.16 shows the on-site emissions, by fuel. Remaining emissions in the natural gas sector could be reduced by using small amounts of low-carbon gas such as biomethane.
Electricity use for space and water heating, however, would increase substantially, as shown in Figure 4.17. Electric sector GHG emissions are set to decline to zero by 2045 as a result of California state electricity policy.
While this analysis shows an increase of more than a factor of three in electricity use for space and water heating, the overall effect on SDG&E electric sales would be more muted. SDG&E’s 2020 electric sales totaled slightly more than 14 terawatt hours (TWh).44 This is because electricity is used for many other purposes today, and those uses would continue. In addition, electric vehicles would drive an even greater increase in SDG&E’s electric sales. Our analysis does not extend to an hourly look at load shapes from different end uses. However, the increase in electric consumption shown here does not appear likely to drive a substantial increase in SDG&E’s peak electric demand. In 2020, SDG&E experienced a peak demand of

131
about 4,600 megawatts (MW), driven by summer air conditioning load, while its winter peak loads were less than 3,000 MW.44 This indicates there is substantial headroom for winter heating load without driving new distribution system or transmission system peaks. To the extent that new water heating loads could add to the summer peak, rate design and control technologies can help to shift these loads to off-peak hours.
Figure 4.15 Total consumption of natural gas (in TBTU) in the San Diego region for space and water heating in the Central case through 2050.

132
Figure 4.16 On-site GHG emissions (in million metric tons of carbon dioxide, MMT CO2) in the San Diego region from space and water heating by fuel in the Central scenario, without use of low-carbon gas, through 2050.
Figure 4.17 Consumption of electricity (measured in terawatt hours, TWh) for space and water heating in the Central scenario through 2050 by building type and end use. For context, SDG&E’s 2020 electric sales totaled slightly more than 14 TWh.

133
4.4.2 Low Demand Case Results
The primary difference between this case and the Central, or high electrification, case is that the electric equipment that replaces combustion-based space and water heating equipment is more efficient. This case has minimal changes in the sales and stock of natural gas equipment. Thus, the most substantial differences between the Central case and the Low Demand case is that the Low Demand case uses less electricity overall. There is no difference in emissions or natural gas use. Figure 4.18 shows the electricity demand trajectory for space and water heating in this case, compared to the Central case.
Figure 4.18 Total electricity consumption (in TWh) for space and water heating in the Low Demand scenario (blue) and the Central scenario (red).
The use of higher-efficiency equipment results in lower electric supply costs (see below) and a lower demand for the construction of zero-carbon electric generators. This has implications for the electricity supply analysis presented in Chapter 2. The electric consumption reduction in this case in 2050 relative to the Central case, about 330 gigawatt hours (GWh), is equivalent to avoiding the construction of about 124 MW of solar PV or 97 MW of onshore wind resources.
4.4.3 Partial Electrification Case Results In the Partial Electrification case, market share for electric technologies is smaller and increases later than in the Central case. Figure 4.19 shows the heat pump market shares for residential and commercial space and water heating used for this case.
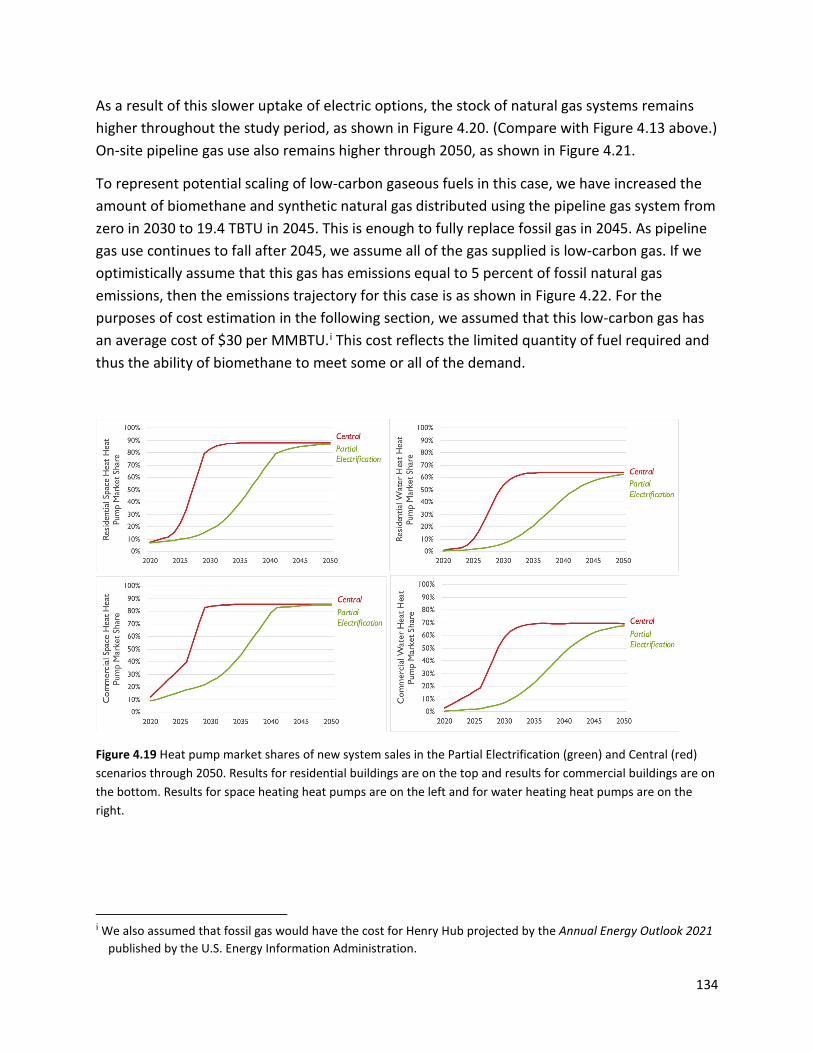
134
As a result of this slower uptake of electric options, the stock of natural gas systems remains higher throughout the study period, as shown in Figure 4.20. (Compare with Figure 4.13 above.) On-site pipeline gas use also remains higher through 2050, as shown in Figure 4.21.
To represent potential scaling of low-carbon gaseous fuels in this case, we have increased the amount of biomethane and synthetic natural gas distributed using the pipeline gas system from zero in 2030 to 19.4 TBTU in 2045. This is enough to fully replace fossil gas in 2045. As pipeline gas use continues to fall after 2045, we assume all of the gas supplied is low-carbon gas. If we optimistically assume that this gas has emissions equal to 5 percent of fossil natural gas emissions, then the emissions trajectory for this case is as shown in Figure 4.22. For the purposes of cost estimation in the following section, we assumed that this low-carbon gas has an average cost of $30 per MMBTU.i This cost reflects the limited quantity of fuel required and thus the ability of biomethane to meet some or all of the demand.
Figure 4.19 Heat pump market shares of new system sales in the Partial Electrification (green) and Central (red) scenarios through 2050. Results for residential buildings are on the top and results for commercial buildings are on the bottom. Results for space heating heat pumps are on the left and for water heating heat pumps are on the right.
i We also assumed that fossil gas would have the cost for Henry Hub projected by the Annual Energy Outlook 2021
published by the U.S. Energy Information Administration.
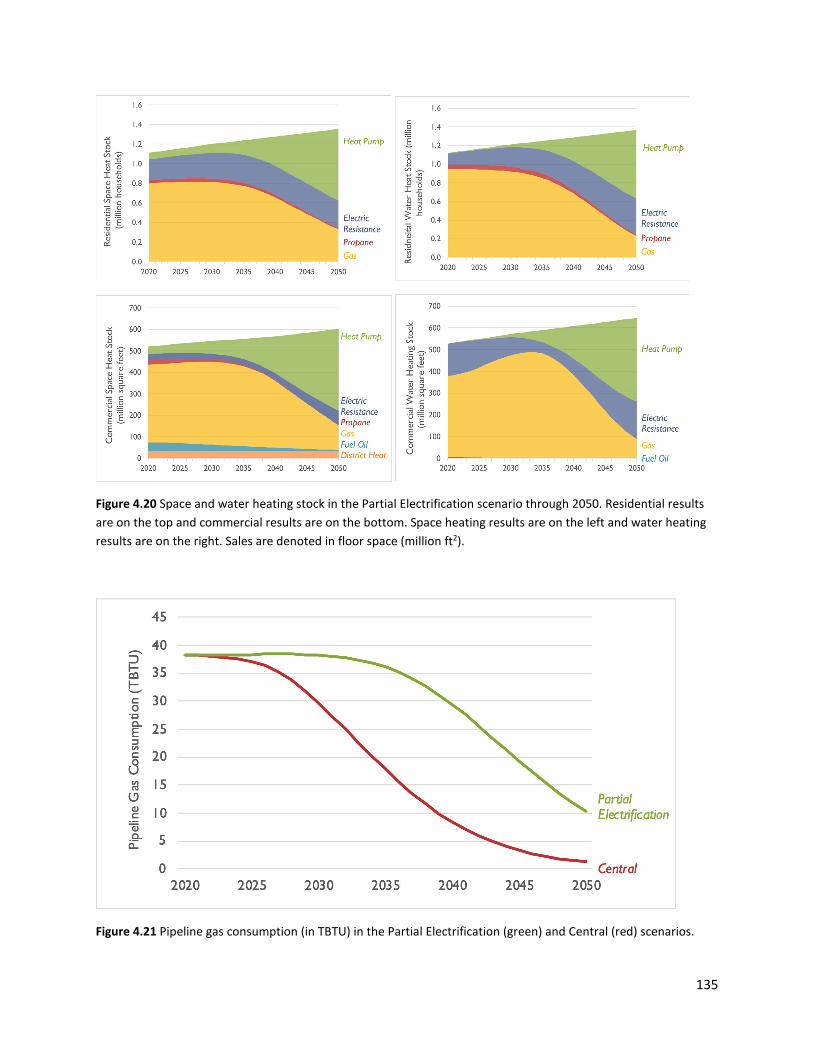
135
Figure 4.20 Space and water heating stock in the Partial Electrification scenario through 2050. Residential results are on the top and commercial results are on the bottom. Space heating results are on the left and water heating results are on the right. Sales are denoted in floor space (million ft2).
Figure 4.21 Pipeline gas consumption (in TBTU) in the Partial Electrification (green) and Central (red) scenarios.

136
Figure 4.22 Onsite GHG emissions in the Partial Electrification scenario (in million metric tons of carbon dioxide, MMT CO2), reflecting increasing use of low-carbon fuels in place of pipeline gas starting in 2030 and complete replacement of fossil gas with low-carbon fuels in 2045 and later.
4.4.4 Capital and Energy Costs
All the decarbonization scenarios considered here result in substantial changes in household and business spending on heating systems, water heaters, and the fuel and electricity to operate those systems. Space heating heat pumps displace the need to pay for separate air conditioning and furnace systems, thus offering substantial cost savings on purchasing other equipment. Heat pump water heaters are more expensive upfront than traditional electric resistance or gas storage water heaters, but cost less to operate.
Fuel and electricity costs are driven by the need to maintain the delivery infrastructure for each fuel, as well as the cost of low- to zero-carbon energy sources to reliably meet energy demands.
Table 4.7 shows the present value of estimated capital and energy costs between 2021 and 2050 for each case, using a 3 percent real discount rate. Interestingly, the three scenarios have almost indistinguishable present value costs—well within the margin of error of the numerous cost assumptions that went into developing them. As expected, the Partial Electrification case has lower building system capital costs (because it depends on mature technologies), but fuel costs are higher as a result of the need for low-carbon gas fuel. If low carbon gas were to become available at scale and at costs well below $30 per MMBTU, this case would be distinctly less expensive than shown here. Similarly, if low carbon gases are not available or only available at scale at costs above $30 per MMBTU, the high electrification cases would be comparatively
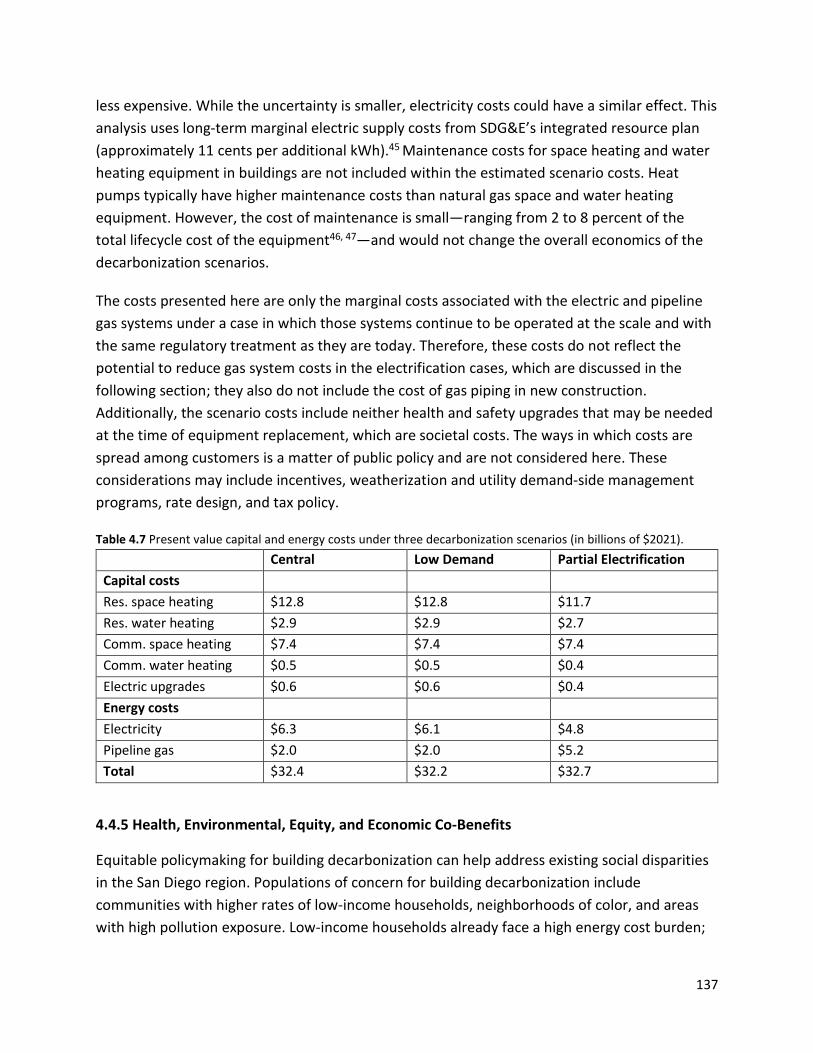
137
less expensive. While the uncertainty is smaller, electricity costs could have a similar effect. This analysis uses long-term marginal electric supply costs from SDG&E’s integrated resource plan (approximately 11 cents per additional kWh).45 Maintenance costs for space heating and water heating equipment in buildings are not included within the estimated scenario costs. Heat pumps typically have higher maintenance costs than natural gas space and water heating equipment. However, the cost of maintenance is small—ranging from 2 to 8 percent of the total lifecycle cost of the equipment46, 47—and would not change the overall economics of the decarbonization scenarios.
The costs presented here are only the marginal costs associated with the electric and pipeline gas systems under a case in which those systems continue to be operated at the scale and with the same regulatory treatment as they are today. Therefore, these costs do not reflect the potential to reduce gas system costs in the electrification cases, which are discussed in the following section; they also do not include the cost of gas piping in new construction. Additionally, the scenario costs include neither health and safety upgrades that may be needed at the time of equipment replacement, which are societal costs. The ways in which costs are spread among customers is a matter of public policy and are not considered here. These considerations may include incentives, weatherization and utility demand-side management programs, rate design, and tax policy.
Table 4.7 Present value capital and energy costs under three decarbonization scenarios (in billions of $2021). Central Low Demand Partial Electrification Capital costs Res. space heating $12.8 $12.8 $11.7 Res. water heating $2.9 $2.9 $2.7 Comm. space heating $7.4 $7.4 $7.4 Comm. water heating $0.5 $0.5 $0.4 Electric upgrades $0.6 $0.6 $0.4 Energy costs Electricity $6.3 $6.1 $4.8 Pipeline gas $2.0 $2.0 $5.2 Total $32.4 $32.2 $32.7
4.4.5 Health, Environmental, Equity, and Economic Co-Benefits
Equitable policymaking for building decarbonization can help address existing social disparities in the San Diego region. Populations of concern for building decarbonization include communities with higher rates of low-income households, neighborhoods of color, and areas with high pollution exposure. Low-income households already face a high energy cost burden;

138
due to capital limitations that may prohibit electrification, they are also at risk of being left to bear otherwise stranded costs for existing natural gas systems. Neighborhoods of color have higher rates of housing rental48 and are adversely impacted by substandard residences due to the history of redlining in the San Diego region.49 For these reasons, residents in areas with high pollution exposure are at heightened risk for adverse health impacts associated with combustion of fossil fuels in buildings. Building decarbonization across these communities of concern can create resilient and reliable buildings, reduce energy costs to occupants, improve residents’ wellbeing, alleviate impacts of climate change, and create high-quality jobs.
Reducing use of fossil fuels in buildings not only decreases greenhouse gas emissions, but it also reduces indoor and outdoor air pollutants that contribute to and exacerbate a variety of negative health and environmental impacts.50, 51 This is true for a range of pollutants: nitrogen oxides (NOX), carbon monoxide (CO), methane (CH4), nitrous oxide (N2O), volatile organic compounds (VOC), trace amounts of sulfur dioxide (SO2), and particulate matter (PM). Further, these combustion byproducts include precursors of ground-level ozone or photochemical smog. As a result, decarbonization of building heating and water heating would provide additional co-benefits for air quality.
Such reductions in indoor and outdoor air pollution will cause improved health outcomes in the San Diego region. The associated benefits include lower rates of mortality, cardiovascular disease, respiratory disease, emergency room visits, restricted physical activity, and lost work. The need is underscored by recent work showing the prevalence of unvented combustion in communities of concern in California and negative health impacts that this can cause.52
An additional benefit of replacing existing gas heating equipment with heat pumps is that this action will add cooling to houses that do not already have cooling equipment. Thus, space heating electrification has the potential to reduce heat-related illness in the region, an area of increasing risk due to climate change. According to the 2019 RASS, approximately one-third of households in the SDG&E service territory do not have air conditioners9 and the policies to replace fossil fuel-based space heating systems can target these households to offer both heating and cooling effects in an equitable way.
The barriers to retrofitting existing housing in communities of concern can be substantial, thus policies and programs to help ensure equitable access to decarbonization technologies among residents in the San Diego region may be necessary. Without targeted action by policymakers and community leaders, historical inequities in access to energy efficiency, renewable energy, and other decarbonization technologies are likely to persist.53 Initiatives should be developed in conjunction with local communities of concern and tailored to those communities’ needs and circumstances.54 Investing in retrofits for these communities can reduce energy costs for

139
residents, improve pollution exposure, and provide an opportunity to address deferred maintenance and other safety issues. Further, building decarbonization initiatives can create jobs through paired investments in workforce development and training programs that target residents of frontline communities where building investments are most needed.i
4.5 Gas Utility and Rate Impacts
4.5.1 Introduction to Utility Finance and Economics
No matter what pathway is pursued, decarbonizing San Diego’s buildings will transform the business of the county’s gas utility, SDG&E. In any scenario, SDG&E will transport much less gas to homes and businesses than it does today. This section focuses on the economics and business model of the gas utility portion of SDG&E. SDG&E as an enterprise also has the ability to coordinate its electric utility planning with changes on the gas side.
Considering the impact of decarbonization efforts on SDG&E is crucial because planning for decreased gas system utilization can limit the financial impact of SDG&E’s transformation on ratepayers, and particularly on low-income households. Increased planning would also decrease the risk of supply issues in the gas and electric utilities. In doing so, SDG&E can better help the county achieve its deep decarbonization goals. This analysis focuses on the utility as a business because of the nature of the relationship between a regulated utility and the residents for whom it provides services. The financial health of the county’s monopoly electric utility, as well as the safety of its electric and gas systems, are important to both residents and the utility’s investors.
SDG&E, like all investor-owned regulated utilities in the United States, is allowed to earn a rate of return based on the amount of capital that it has invested in the transmission and distribution assets that serve its customers. Under cost of service ratemaking, which is the standard approach across the United States, the utility’s rates are designed to recover the company’s “revenue requirement”—the amount of money it must collect from customers each year to pay for that year’s depreciation of its assets, cover operating costs, and leave a just and reasonable return on invested capital for its bondholders and shareholders. Gas rates are composed of the delivery rate, which covers the cost of the local transmission and distribution systems, and the supply rate, which covers the cost of the commodity fuel that flows through
i Employment impacts are addressed in Chapter 6 of this report.
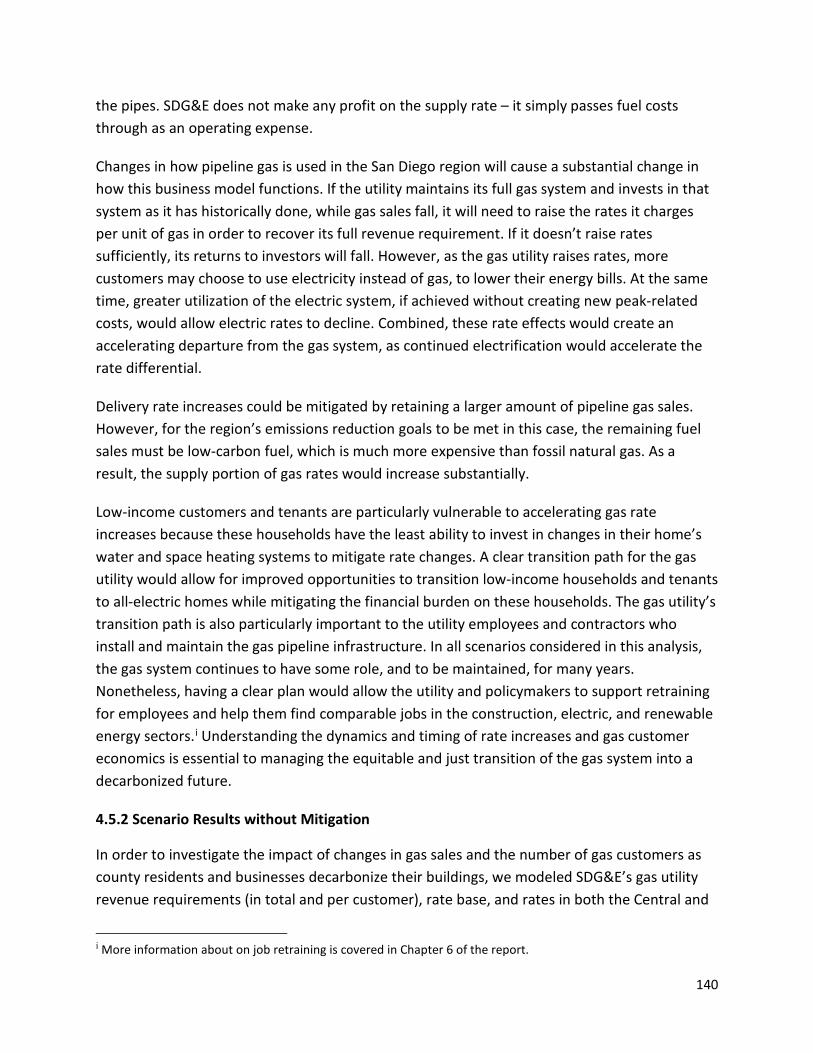
140
the pipes. SDG&E does not make any profit on the supply rate – it simply passes fuel costs through as an operating expense.
Changes in how pipeline gas is used in the San Diego region will cause a substantial change in how this business model functions. If the utility maintains its full gas system and invests in that system as it has historically done, while gas sales fall, it will need to raise the rates it charges per unit of gas in order to recover its full revenue requirement. If it doesn’t raise rates sufficiently, its returns to investors will fall. However, as the gas utility raises rates, more customers may choose to use electricity instead of gas, to lower their energy bills. At the same time, greater utilization of the electric system, if achieved without creating new peak-related costs, would allow electric rates to decline. Combined, these rate effects would create an accelerating departure from the gas system, as continued electrification would accelerate the rate differential.
Delivery rate increases could be mitigated by retaining a larger amount of pipeline gas sales. However, for the region’s emissions reduction goals to be met in this case, the remaining fuel sales must be low-carbon fuel, which is much more expensive than fossil natural gas. As a result, the supply portion of gas rates would increase substantially.
Low-income customers and tenants are particularly vulnerable to accelerating gas rate increases because these households have the least ability to invest in changes in their home’s water and space heating systems to mitigate rate changes. A clear transition path for the gas utility would allow for improved opportunities to transition low-income households and tenants to all-electric homes while mitigating the financial burden on these households. The gas utility’s transition path is also particularly important to the utility employees and contractors who install and maintain the gas pipeline infrastructure. In all scenarios considered in this analysis, the gas system continues to have some role, and to be maintained, for many years. Nonetheless, having a clear plan would allow the utility and policymakers to support retraining for employees and help them find comparable jobs in the construction, electric, and renewable energy sectors.i Understanding the dynamics and timing of rate increases and gas customer economics is essential to managing the equitable and just transition of the gas system into a decarbonized future.
4.5.2 Scenario Results without Mitigation
In order to investigate the impact of changes in gas sales and the number of gas customers as county residents and businesses decarbonize their buildings, we modeled SDG&E’s gas utility revenue requirements (in total and per customer), rate base, and rates in both the Central and
i More information about on job retraining is covered in Chapter 6 of the report.
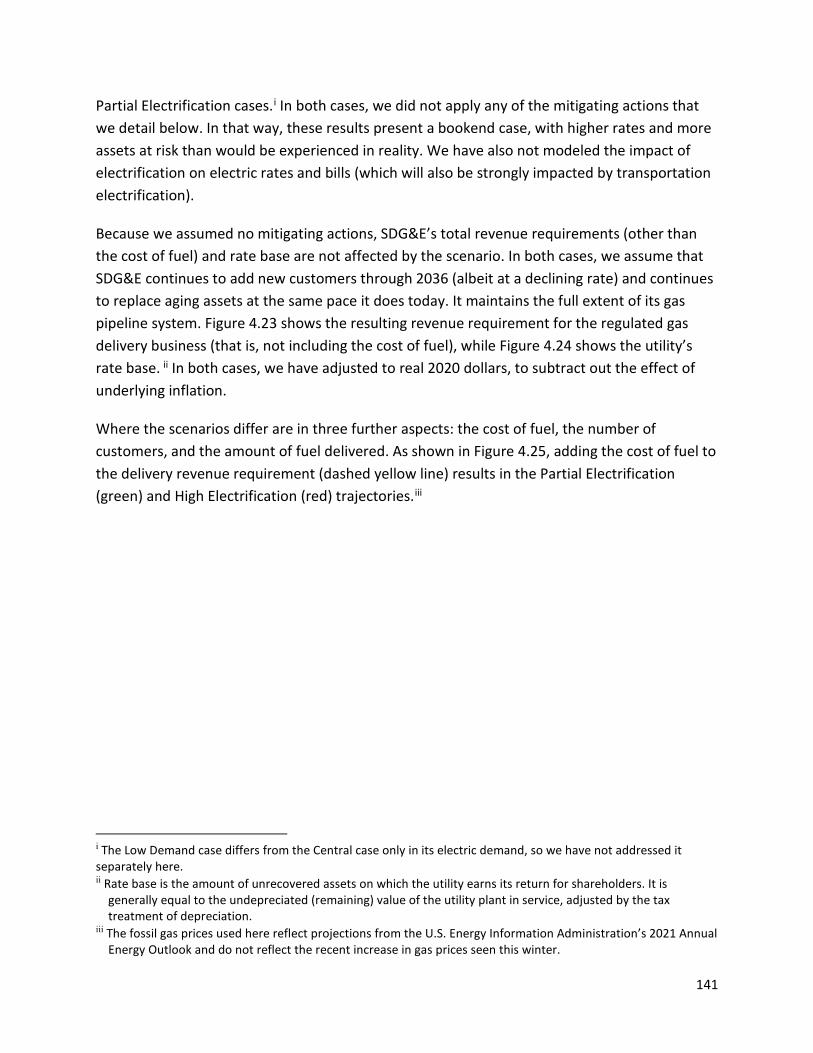
141
Partial Electrification cases.i In both cases, we did not apply any of the mitigating actions that we detail below. In that way, these results present a bookend case, with higher rates and more assets at risk than would be experienced in reality. We have also not modeled the impact of electrification on electric rates and bills (which will also be strongly impacted by transportation electrification).
Because we assumed no mitigating actions, SDG&E’s total revenue requirements (other than the cost of fuel) and rate base are not affected by the scenario. In both cases, we assume that SDG&E continues to add new customers through 2036 (albeit at a declining rate) and continues to replace aging assets at the same pace it does today. It maintains the full extent of its gas pipeline system. Figure 4.23 shows the resulting revenue requirement for the regulated gas delivery business (that is, not including the cost of fuel), while Figure 4.24 shows the utility’s rate base. ii In both cases, we have adjusted to real 2020 dollars, to subtract out the effect of underlying inflation.
Where the scenarios differ are in three further aspects: the cost of fuel, the number of customers, and the amount of fuel delivered. As shown in Figure 4.25, adding the cost of fuel to the delivery revenue requirement (dashed yellow line) results in the Partial Electrification (green) and High Electrification (red) trajectories.iii
i The Low Demand case differs from the Central case only in its electric demand, so we have not addressed it separately here. ii Rate base is the amount of unrecovered assets on which the utility earns its return for shareholders. It is
generally equal to the undepreciated (remaining) value of the utility plant in service, adjusted by the tax treatment of depreciation.
iii The fossil gas prices used here reflect projections from the U.S. Energy Information Administration’s 2021 Annual Energy Outlook and do not reflect the recent increase in gas prices seen this winter.
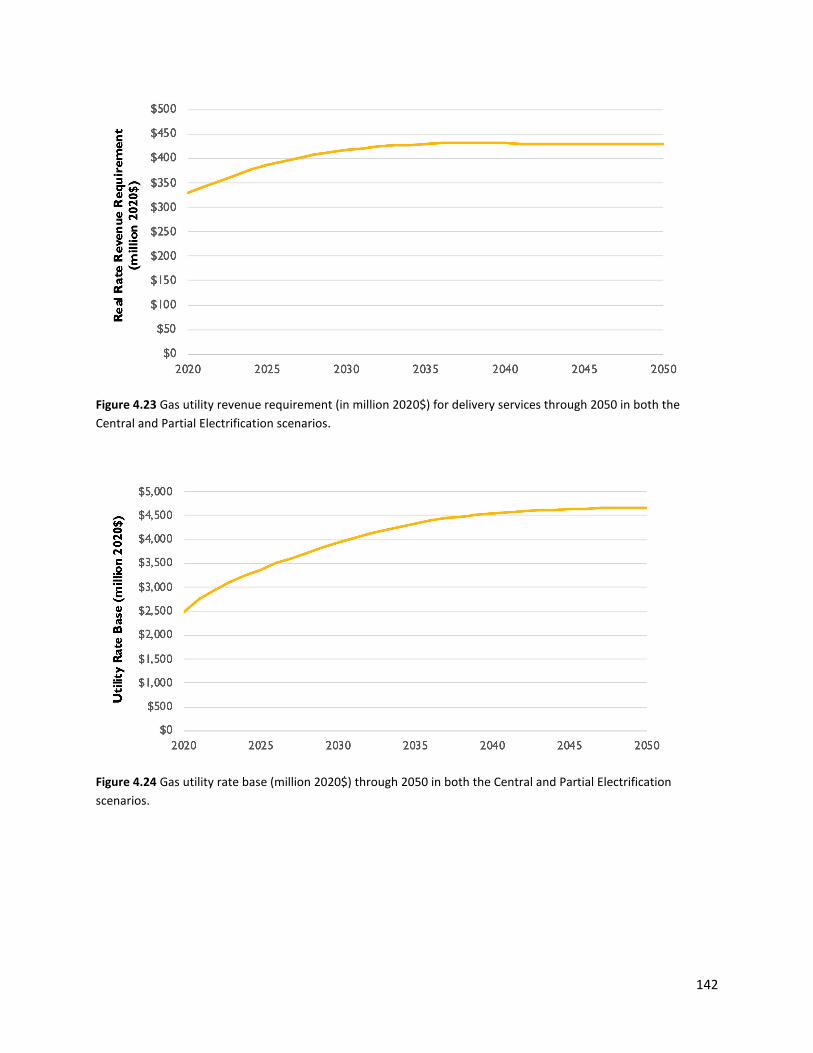
142
Figure 4.23 Gas utility revenue requirement (in million 2020$) for delivery services through 2050 in both the Central and Partial Electrification scenarios.
Figure 4.24 Gas utility rate base (million 2020$) through 2050 in both the Central and Partial Electrification scenarios.

143
Figure 4.25 Gas utility revenue (million 2020$), including fuel costs, for the Central (red) and Partial Electrification (green) scenarios. The delivery revenues only are the same for both scenarios and are shown in the dashed yellow line. The difference between the dashed line and the solid lines reflects the fuel costs.
To estimate the trajectory for delivered gas rates in each case, we divided the total revenue requirement by the total sales of pipeline gas in each case. This results in the forward rate curves shown in Figure 4.26. While the Partial Electrification case has lower rates than the Central case, it still shows rates that far exceed today’s average gas rates of just over $1 per therm. Both cases have rates that exceed $2 per therm by the 2030s (2033 in the Central case and 2038 in the Partial Electrification case). These higher per-unit rates could encourage customers to choose to heat with electricity, absent policy intervention to change the relative costs of fuels.i
However, customers do not pay rates–they pay bills. Therefore, it is necessary to multiply the rates by the average consumption per customer to evaluate the impact of each scenario on the total annual energy costs of the customers who remain connected to the gas system. Figure 4.27 shows the resulting energy bills.
i This analysis uses the total revenue requirement divided by total sales as a proxy for rate impacts. We do not
distinguish between rate classes, and we do not distinguish between the monthly customer charge and the marginal rate for consumption, which each send different signals that shape customer behavior. Rate designs that shift more costs into the monthly customer charge would strengthen gas in marginal competition with electricity for each end use, while simultaneously giving customers a stronger incentive to fully disconnect from the gas network.

144
Figure 4.26 Forward gas rate curves (measured in 2020$ revenue per therm) for the Central (red) and Partial Electrification (green) scenarios.
Figure 4.27 Average annual customer bills (2020$ per customer) for gas customers in the Central (red) and Partial Electrification (green) scenarios. This can be compared to the increase in electric utility bills from a home switching from gas to all-electric (blue dashed).
These bills illustrate the challenge facing SDG&E and its stakeholders as it plans a path forward: in both cases, the cost of gas service per customer increases substantially. While gas customer bills in the Partial Electrification scenario are lower than in the Central case, in both cases they

145
rise to far exceed the bills for equivalent service provided with all electric appliances (Figure 4.27, dashed blue line).i Additionally, low-income households are particularly vulnerable to the increasing gas bills because they will find it more difficult to invest in electric space and water heating. This energy burden becomes increasingly impactful as the annual all-electric home bill remains relatively constant and the gas bills in both the Central and Partial Electrification cases continue to rise.
Our analysis indicates that, absent policy intervention or mitigating actions, the level of electrification in 2050 in the Partial Electrification case is not a stable equilibrium. The customer savings from switching to electricity will continue to increase as more customers electrify, which will in turn drive further electrification. While some households will face barriers to electrification, the increasing savings will overcome more and more of those barriers.
4.5.3 Mitigation Approaches
SDG&E, its owners, and its regulators have numerous options to evolve the utility’s practices and business model to mitigate the rate trajectories that would result from decarbonization. The objectives of these approaches would be to more equitably share the cost of the existing gas system between today’s customers and future customers, as well as to limit the risk to residents and investors that the utility will leave substantial stranded assets. Stranded assets are investments that the utility made but which are retired before their full asset value has been recovered (see Figure 4.28 for an illustration of stranded assets).
The cost of stranded assets could be passed to utility investors, which would risk the financial viability of the company. This is not optimal because San Diego residents require SDG&E to be a viable enterprise to continue to provide electric service, at least, and if financial viability were threatened while there were still gas customers, their service would also be at risk. Safety of the electric and gas systems could also be at risk in such a case. The value of some stranded assets could instead be recovered from electric ratepayers or from taxpayers. Both approaches would require changes in fundamental approaches to utility ratemaking. One option would be securitization, wherein stranded assets are bought out by a public bond-backed entity with a lower cost of capital (thus lowering the total funds to be recovered), and then the bond is paid back over an appropriate timeframe using electric ratepayer funds or tax revenues. California is using securitization to address electric utility costs associated with wildfire risk reduction.ii
i The exact customer economics depend on rate design for both gas and electric utilities. Figure 4.27 reflects the
relevant per-customer costs of service (accounting for the fact that building electrification will not drive changes in electric transmission and distribution costs), as a proxy for the costs that would be assigned to each customer under a reasonable rate design.
ii See, for detail, California Assembly Bill 1054 (passed 2019) and California Public Utilities Code, Sec. 8386.3.
146
In order to limit the risk from and the amount of stranded assets whose fate must be resolved in groundbreaking ways, utility financial and infrastructure practices could be changed in the near term.i These approaches would have different effects on the utility’s annual revenue requirements. In some cases, stranded cost risks are mitigated by recovering funds sooner, while there is still extensive use of the gas system. In other cases, actions mitigate risks by reducing the size of the total investment at risk. Some actions do not change the total size of the investment or stranded cost risk, but they can mitigate rate impacts and thereby buy breathing room to use rates to recover invested capital. In each case below, we change one aspect of the utility’s action or accounting to illustrate the impact of each change. In reality, the utility’s management, along with its investors, regulators, and other stakeholders, would develop a portfolio of actions to best achieve their objectives.
Figure 4.28 Illustration of the amount of stranded asset risk when an asset is no longer used and useful, before the end of its planned lifetime. Source: Bilich, Colvin, and O’Connor (2019). “Managing the Transition: Proactive Solutions for Stranded Gas Asset Risk in California.” Environmental Defense Fund. Reproduced with permission.
i One resource to learn more about the options discussed here, and others, is Managing the Transition: Proactive
Solutions for Stranded Gas Asset Risk in California by Bilich, Colvin, and O’Connor (2019) for the Environmental Defense Fund (available at https://www.edf.org/sites/default/files/documents/Managing_the_Transition_new.pdf.) While the analysis in this report differs somewhat from that study, the general conclusions and analysis are compatible.
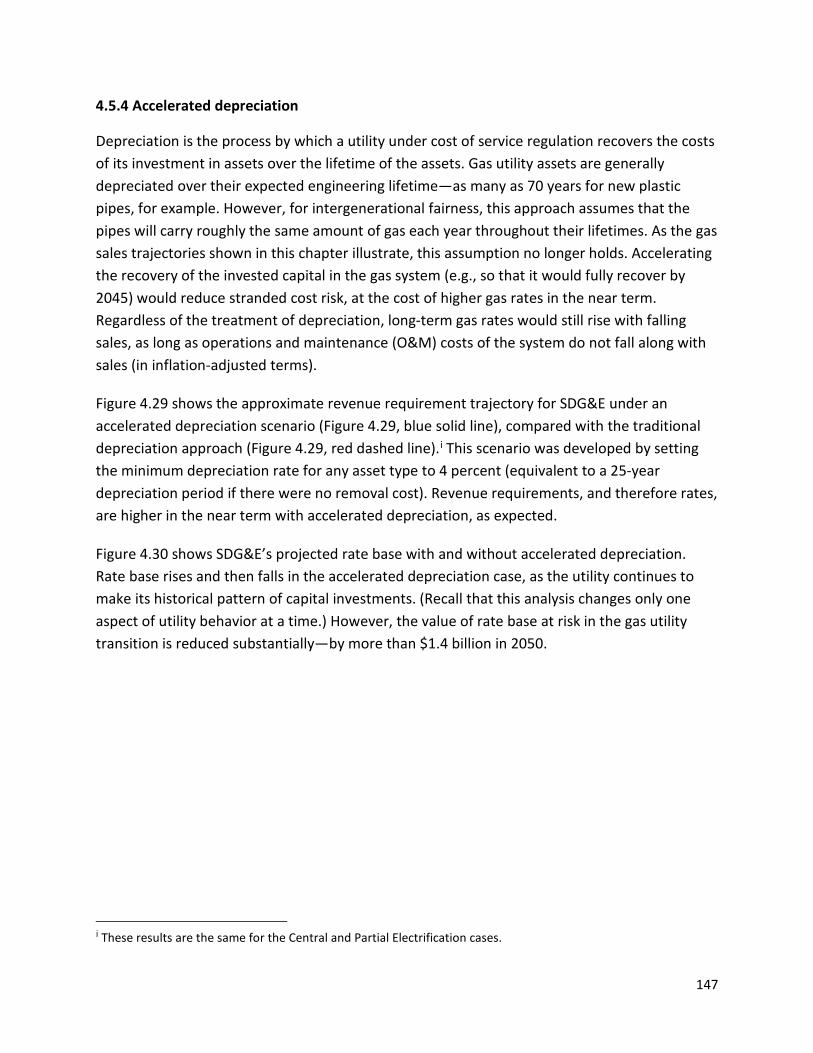
147
4.5.4 Accelerated depreciation
Depreciation is the process by which a utility under cost of service regulation recovers the costs of its investment in assets over the lifetime of the assets. Gas utility assets are generally depreciated over their expected engineering lifetime—as many as 70 years for new plastic pipes, for example. However, for intergenerational fairness, this approach assumes that the pipes will carry roughly the same amount of gas each year throughout their lifetimes. As the gas sales trajectories shown in this chapter illustrate, this assumption no longer holds. Accelerating the recovery of the invested capital in the gas system (e.g., so that it would fully recover by 2045) would reduce stranded cost risk, at the cost of higher gas rates in the near term. Regardless of the treatment of depreciation, long-term gas rates would still rise with falling sales, as long as operations and maintenance (O&M) costs of the system do not fall along with sales (in inflation-adjusted terms).
Figure 4.29 shows the approximate revenue requirement trajectory for SDG&E under an accelerated depreciation scenario (Figure 4.29, blue solid line), compared with the traditional depreciation approach (Figure 4.29, red dashed line).i This scenario was developed by setting the minimum depreciation rate for any asset type to 4 percent (equivalent to a 25-year depreciation period if there were no removal cost). Revenue requirements, and therefore rates, are higher in the near term with accelerated depreciation, as expected.
Figure 4.30 shows SDG&E’s projected rate base with and without accelerated depreciation. Rate base rises and then falls in the accelerated depreciation case, as the utility continues to make its historical pattern of capital investments. (Recall that this analysis changes only one aspect of utility behavior at a time.) However, the value of rate base at risk in the gas utility transition is reduced substantially—by more than $1.4 billion in 2050.
i These results are the same for the Central and Partial Electrification cases.
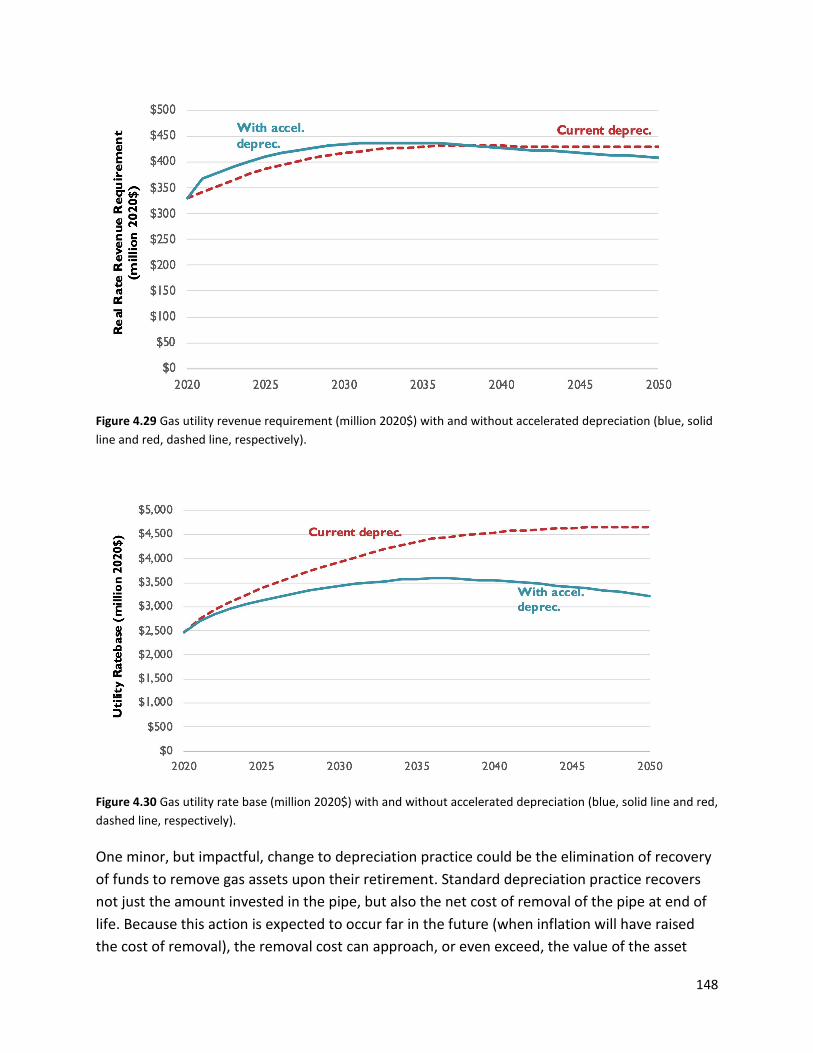
148
Figure 4.29 Gas utility revenue requirement (million 2020$) with and without accelerated depreciation (blue, solid line and red, dashed line, respectively).
Figure 4.30 Gas utility rate base (million 2020$) with and without accelerated depreciation (blue, solid line and red, dashed line, respectively).
One minor, but impactful, change to depreciation practice could be the elimination of recovery of funds to remove gas assets upon their retirement. Standard depreciation practice recovers not just the amount invested in the pipe, but also the net cost of removal of the pipe at end of life. Because this action is expected to occur far in the future (when inflation will have raised the cost of removal), the removal cost can approach, or even exceed, the value of the asset
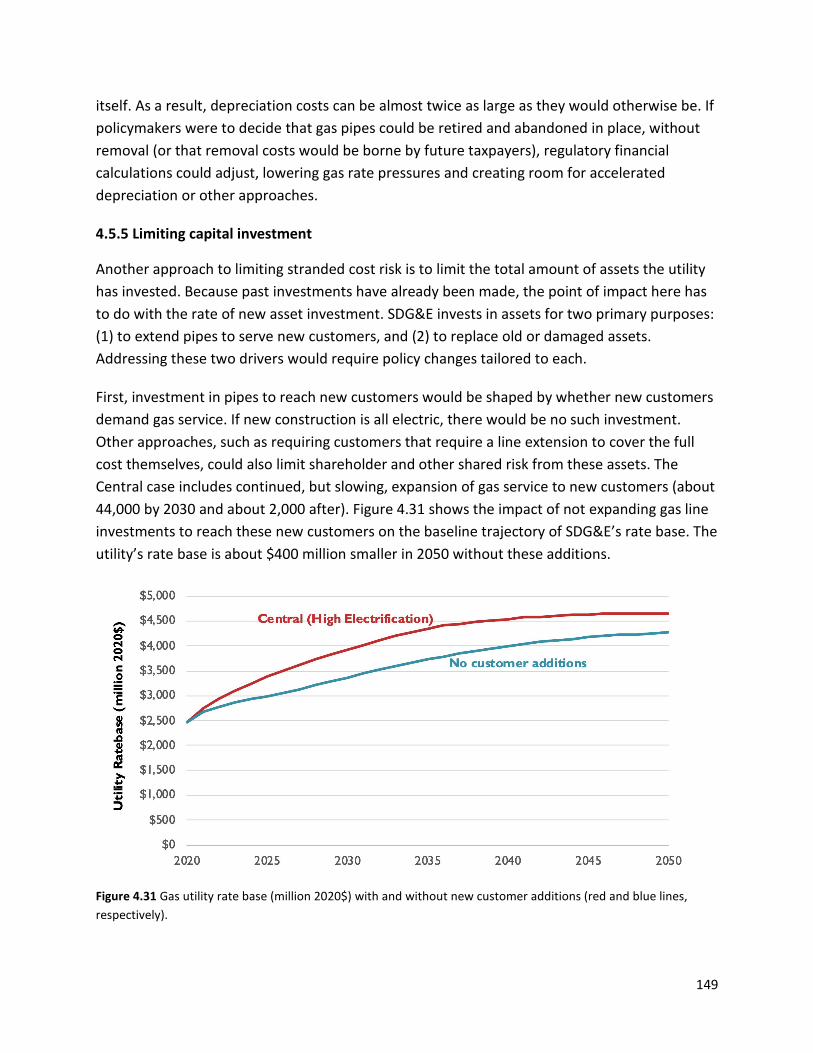
149
itself. As a result, depreciation costs can be almost twice as large as they would otherwise be. If policymakers were to decide that gas pipes could be retired and abandoned in place, without removal (or that removal costs would be borne by future taxpayers), regulatory financial calculations could adjust, lowering gas rate pressures and creating room for accelerated depreciation or other approaches.
4.5.5 Limiting capital investment
Another approach to limiting stranded cost risk is to limit the total amount of assets the utility has invested. Because past investments have already been made, the point of impact here has to do with the rate of new asset investment. SDG&E invests in assets for two primary purposes: (1) to extend pipes to serve new customers, and (2) to replace old or damaged assets. Addressing these two drivers would require policy changes tailored to each.
First, investment in pipes to reach new customers would be shaped by whether new customers demand gas service. If new construction is all electric, there would be no such investment. Other approaches, such as requiring customers that require a line extension to cover the full cost themselves, could also limit shareholder and other shared risk from these assets. The Central case includes continued, but slowing, expansion of gas service to new customers (about 44,000 by 2030 and about 2,000 after). Figure 4.31 shows the impact of not expanding gas line investments to reach these new customers on the baseline trajectory of SDG&E’s rate base. The utility’s rate base is about $400 million smaller in 2050 without these additions.
Figure 4.31 Gas utility rate base (million 2020$) with and without new customer additions (red and blue lines, respectively).

150
Second, most of SDG&E’s capital investments relate to replacing old assets with equivalent new ones. These replacements occur both reactively (to address actual leaks or damage to pipes) and proactively, and are justified on the basis of pipeline safety and leak reduction. We have not assessed the necessity of SDG&E’s pipeline replacements. However, in order to indicate the potential ratepayer impact of slowing the pace of these replacements (which could correspond to targeting replacement only to the most urgent locations), we modeled a reduction in the pace of these replacements by a factor of three. The results are shown in Figure 4.32. This figure also shows the combined effect of eliminating new gas lines and reducing investment in existing asset replacement by a factor of three. Together, these changes would reduce the utility’s rate base at risk in 2050 by $1.15 billion.
Figure 4.32 Gas utility rate base (million 2020$) with Central case findings (red line), reduced pipeline and service replacement rate (blue line), and combination of reduced replacements and no new customer additions (purple line).
4.5.6 Targeted system retirements
One way to reduce the need for new capital investment, while also reducing O&M costs, would be to retire gas system assets instead of replacing them, as seen in Figure 4.33. By targeting all buildings served by a particular gas system asset for electrification, that gas asset can be retired. Targeted retirement is likely to be a more cost-effective way to manage the gas transition than replacing assets, in the face of declining sales.

151
Figure 4.33 Illustration of the gas infrastructure implications of targeted vs. untargeted electrification. Source: Asa et al., 2020. “The Challenge of Retail Gas in California’s Low-Carbon Future: Technology Options, Customer Costs, and Public Health Benefits of Reducing Natural Gas Use.” E3 for the California Energy Commission.
One challenge with this approach is that the pace of natural system replacements in the San Diego region is much slower than the pace at which the system might be abandoned, particularly under a High Electrification decarbonization pathway. SDG&E is currently replacing an average of about 33 miles of distribution main pipes per year. We estimate that SDG&E is also replacing about 1,400 service lines each year.i If the customers served by these mains and services were electrified, rather than the pipes replaced, it would decrease the utility’s stranded cost risk by reducing its new investments.
While targeting electrification to the areas of pipe replacement would reduce stranded cost risk by limiting new capital investment, it does not eliminate the issue. Targeted electrification and pipeline retirement should also allow O&M costs to be reduced (since there are fewer miles of pipe to maintain), which could allow for either lower rates and thus a stronger competitive position vs. electricity (thus allowing departures and sales reductions to be more measured and planned) or for more room in constant gas rates to recover asset value that would otherwise be stranded.
i Services are the small pipes that connect customers to the mains.

152
Figure 4.34 illustrates the impact on the utility’s revenue requirements for gas distribution service (not fuel supply) in the Central case if targeted electrification and mains retirement substituted for mains replacement and if customers due for new service lines were electrified instead. As modeled, both transitions in utility practice would ramp in over the next decade. In this example, we have also modeled no new customer additions. In this case, the utility’s rate base in 2050 would be about $1.4 billion less than in the unmitigated case. Targeted electrification, which would involve retiring distribution mains not due for replacement, would create stranded costs that would need to be addressed in some fashion. Targeting electrification toward communities of concern could limit the risk that these populations face from increasing gas rates.
Figure 4.34 Gas utility delivery revenue requirement (without fuel costs, million 2020$) in the Central case (red) compared with a case where electrification is targeted to allow the utility to avoid rebuilding or replacing aging distribution mains (blue). The targeted electrification results also include no new customer additions.
4.6 Key Policy Actions
To put San Diego’s buildings on a course for decarbonization by mid-century, it is important to take action beginning immediately. This timeframe is driven by the long lifetime of building components such as HVAC systems and water heaters, along with the relatively nascent state of the market for efficient low-carbon technologies that can reduce direct emissions from the region’s buildings. By taking action that changes markets swiftly, local policymakers will reduce

153
the future costs of early equipment replacement and stranded assets. While the end state for the region’s buildings is not known, the initial steps policymakers can take are common across all pathways and are “low regret” policy choices. These include:
Equity: Leading with communities of concern as part of the market transformation can mitigate risks of communities being left behind and avoid social costs of helping them transition later. Investments in building energy efficiency and decarbonization provide an opportunity to simultaneously address deferred maintenance and existing health and safety issues in existing buildings, which are more common in buildings occupied by low-income families and neighborhoods of color. Paired investments in workforce development and job training programs that target residents can simultaneously create good-paying jobs.
Electrification: Increasing adoption of efficient heat pump-based space and water heating systems in both new and existing buildings, with particular focus on assistance for communities of concern and rental buildings, is a key first step. Approaches can focus on early replacement or end-of-life replacement based on the condition of existing space heating, water heating, and cooling systems.i Market forces alone cannot ensure a timely transition away from fossil fuel combustion in buildings. Examples of strategies to achieve broader electrification include building codes and ordinances to require electrification or “electrification readiness,” appliance replacement incentives, subsidized building retrofit programs, and building emissions performance standards. Building shell improvements, such as insulation and air sealing, can help reduce electric system peaks and manage system costs associated with building electrification. Other uses of fossil fuels in buildings—cooking, laundry, and process loads—will need to be addressed and can typically be electrified as well. Policymakers can look to examples of building electrification efforts across the country, as cataloged by various organizations including the American Council for an Energy-Efficient Economy, the Building Electrification Institute, the New Buildings Institute, the Institute for Market Transformation, and more.
Statewide building codes: The region can benefit from state-level action by working with state regulators and actively participating in the California Energy Commission’s stakeholder process to support building energy efficiency standards (Title 24) that prioritize building decarbonization. See Chapter 8 for a discussion of the local authority to establish building codes. Where local jurisdictions do not have authority, collective participation in state rulemaking processes may be useful.
Local building codes: Setting local “electrification-ready” or “all-electric” standards for new construction and major renovations through building energy codes would reduce costs associated with transitioning away from fossil fuels. Policymakers can benefit from lessons learned in the adoption of all-electric reach codes or ordinances—which are local codes or
i The end of life of an existing air conditioning system provides an opportunity to replace it with a heat pump and
simultaneously eliminate existing fossil fuel heating equipment.
154
ordinances that go beyond state or federal codes or ordinances—in the cities of Carlsbad, Encinitas, and Solana Beach. Local jurisdictions have authority to mandate electrification or expressly prohibit natural gas plumbing in buildings if all statutory requirements are met. For more information on local authority, see Chapter 8 of this report.
Existing buildings: Programs and policies must target eliminating combustion of fossil fuels in existing buildings, which turn over slowly and will continue to generate emissions for decades if left unchecked. Approximately 80 percent of the buildings that will exist in 2050 in the region have already been built. Energy efficiency improvements can reduce emissions associated with electricity use in existing buildings; however, this opportunity will decrease as the electric supply approaches 100 percent carbon-free. Therefore, electrification should also be a focus for existing buildings. Market barriers to electrifying the existing building stock include initial cost hurdles, consumer preferences and awareness, and workforce development needs. An integrated strategy for existing buildings should include education and outreach, financial incentives and financing, and mandatory requirements (such as building performance standards).
Gas pipelines: Utilities and regulators can mitigate stranded cost risk by minimizing unnecessary extensions or replacements of the gas pipeline system and by aligning depreciation of existing utility assets with their utilization lifetimes.
Geographic targeting: Focusing electrification and targeting retirement of gas pipeline segments (e.g., in neighborhood clusters) can help optimize available resources and reduce ratepayer burden for maintaining the gas distribution network.
Regional coordination: Accomplishing deep decarbonization of the buildings sector will require action by a diverse set of stakeholders in the region. Regional coordination, such as through existing or new governance structures, may help to sustain progress over time. For more discussion of this, see Chapter 7 of this report.
Low-carbon fuels: Research and pilot production and use of low-carbon gaseous fuels can prepare the region to decarbonize hard-to-electrify end uses in buildings.
Co-benefits: When evaluating prospective policies and programs, consider the full range of benefits created by building decarbonization, such as improved environmental and human health and equitable job creation.
Education: Inform building owners of the financial risks of installing new fossil fuel equipment, which may need to be replaced before the end of its useful life in order to meet regional decarbonization targets and may expose building occupants to the risk of high future gas rates. Teach owners about the co-benefits of eliminating fossil fuel combustion in buildings. Building owners with harder-to-decarbonize end uses may need resources and technical assistance to achieve full decarbonization. Expand building operator certification programs, with specific curriculum for building decarbonization and carbon-intensive end uses.
155
Outreach: Leverage the existing Regional Energy Network and community choice aggregation platform to promote building electrification through outreach, engagement, and direct enrollment. Look to building electrification initiatives among the following California providers for guidance: Central Coast Community Energy, East Bay Community Energy, MCE, Peninsula Clean Energy, Redwood Coast Energy Authority, Silicon Valley Clean Energy, Sonoma Clean Power, and Valley Clean Energy.
Information gathering: Improve existing data collection practices to inform future policies and programs. Local governments can begin identifying the fuel type for space heating and water heating systems and the capacity of electrical panels. This information can be collected through building permits and other administrative processes and can be mapped to existing property databases. Further, building energy benchmarking practices can lay the foundation for building performance standards, which establish mandatory energy or emissions targets that improve over time. Cities can build on the example of the City of San Diego’s building energy benchmarking ordinance and can lead by example by disclosing energy information for public buildings.55 Finally, collecting equity-related metrics is foundational to designing equitable initiatives and monitoring progress.
Embodied carbon: Targeting embodied carbon (the carbon intensity of building materials) in buildings through zoning or building codes can complement policies focused on operational carbon from energy use in buildings. Local policymakers can consider adopting “buy clean” policies such as Marin County’s Low Carbon Concrete Codei or work with state regulators to build on existing statewide legislation, including the Buy Clean California Act.
i See, for details, Marin County Code Chapter 19.07 Added To Marin County Code Title 19, available at
https://www.marincounty.org/-/media/files/departments/cd/planning/sustainability/low-carbon-concrete/12172019-update/low-carbon-concrete-code.pdf?la=en.
156
Works Cited
1. U.S. Census Bureau. 2021. County Population Totals: 2010-2019. Available at: https://www.census.gov/data/tables/time-series/demo/popest/2010s-counties-total.html#par_textimage_242301767.
2. U.S. Census Bureau. 2021. 2019 County Business Patterns. Available at: https://www.census.gov/programs-surveys/cbp.html. Synapse review of property data provided by San Diego County Assessor's Office
3. The City of San Diego. 2007. San Diego Modernism Historic Context Statement. Available at: https://www.sandiego.gov/sites/default/files/modernism_2007.pdf.
4. Sutro, Dirk. 2002. San Diego Architecture from Mission to Modern: Guide to the Buildings, Planning, People, and Spaces That Shape the Region. American Institute of Architects | San Diego. Sunbelt Publications.
5. University of San Diego. 2021. Indian Reservations in San Diego County. Available at: https://www.sandiego.edu/native-american/reservations.php
6. U.S. Census Bureau. 2021. 2020 Census - Census Tract Reference Map. Available at: https://www.census.gov/geographies/reference-maps/2020/geo/2020pl-maps/2020-census-tract.html.
7. DATA.GOV. 2021. Military Installations, Ranges, and Training Areas. Available at: https://catalog.data.gov/dataset/military-installations-ranges-and-training-areas.
8. County of San Diego. 2018. Greenhouse Gas Emissions Inventory, Projections, and Reduction Targets. Available at: https://www.sandiegocounty.gov/content/dam/sdc/pds/advance/cap/publicreviewdocuments/CAPfilespublicreview/Chapter%202%20Greenhouse%20Gas%20Emissions%20Inventory%2C%20Projections%20and%20Reduction%20Target.pdf.
9. DNV GL Energy Insights. 2021. 2019 California Residential Appliance Saturation Study (RASS). Available at: https://www.energy.ca.gov/data-reports/surveys/2019-residential-appliance-saturation-study.
10. City of San Diego. Building Energy Benchmarking. Accessed September 23, 2021. https://www.sandiego.gov/sustainability/energy-and-water-efficiency/benchmark.
11. City of San Diego. Building Energy Benchmarking. Accessed September 23, 2021. https://www.sandiego.gov/sustainability/energy-and-water-efficiency/benchmark.
12. U.S. Energy Information Administration (EIA). 2013. Commercial Buildings Energy Consumption Survey (CBECS), 2012. Available at: https://www.eia.gov/consumption/commercial/data/2012/. EIA Form 176, Years 2005–2019; Form 861 and 861S, Years 2005–2019 and Year 2020 early release.
13. Mahone, A., et al. 2018. Deep Decarbonization in a High Renewables Future. Prepared by Energy and Environmental Economics for the California Energy Commission. Available at: https://www.energy.ca.gov/publications/2018/deep-decarbonization-high-renewables-future-updated-results-california-pathways.
14. Itron, Inc. 2014. California Commercial Saturation Survey Report. Prepared for California Public Utilities Commission. Available at: http://capabilities.itron.com/wo024/Docs/California%20Commercial%20Saturation%20Study_Report_Final.pdf
15. Armstrong, S., et al. 2019. A Zero Emissions All-Electric Multifamily Construction Guide. Redwood Energy. Available at: https://fossilfreebuildings.org/ElectricMFGuide.pdf.
16. Mitsubishi . n.d., City Multi Brochure (CM11WD-I), p. 83, Available at: https://www.mitsubishielectric.com.au/assets/LEG/MEE10K026_CM11WD_I_w.pdf.
17. Northeast Energy Efficiency Partnership (NEEP). 2019. Variable Refrigerant Flow (VRF) Market Strategies Report. Available at: https://neep.org/sites/default/files/resources/NEEP_VRF%20Market%20Strategies%20Report_final5.pdf.
18. Bonneville Power Administration. 2018. HVAC Technology Guide. Page 106. Available at: https://www.bpa.gov/EE/Utility/Momentum-Savings/Documents/2018_BPA_HVAC_Technology_Guide.pdf.
19. Stagner, J.C. n.d. Stanford University’s “fourth generation” district energy system. Available at: https://sustainable.stanford.edu/sites/default/files/IDEA_Stagner_Stanford_fourth_Gen_DistrictEnergy.pdf.
20. Northwest Energy Efficiency Alliance. 2014. Final Summary Report for the Ductless Heat Pump Impact and Process Evaluation. Available at: https://neea.org/resources/final-summary-report-for-the-ductless-heat-pump-impact-and-process-evaluation;
157
21.Cadmus. 2016, Ductless Mini-Split Heat Pump Impact Evaluation. Available at: http://www.ripuc.ri.gov/eventsactions/docket/4755-TRM-DMSHP%20Evaluation%20Report%2012-30-2016.pdf
22. Schoenbauer, B. 2018. "Cold-Climate Air-Source Heat Pumps." Center for Energy and Environment. Available at: http://www.duluthenergydesign.com/Content/Documents/GeneralInfo/PresentationMaterials/2018/Day1/ccASHPs.pdf.
23. Mahone, A. et al. 2019. Residential Building Electrification in California - Consumer economics, greenhouse gases and grid impacts. Energy and Environmental Economics. Available at: https://www.ethree.com/wp-content/uploads/2019/04/E3_Residential_Building_Electrification_in_California_April_2019.pdf.
24. Air Conditioning, Heating, and Refrigeration Institute. 2021. Directory of Certified Product Performance. Available at: https://www.ahridirectory.org/Search/SearchHome.
25. Mai, T. T. et al. 2017. Electrification Futures Study: End-Use Electric Technology Cost and Performance Projections through 2050. National Renewable Energy Laboratory. Available at: https://www.nrel.gov/analysis/electrification-futures.html.
26. E3. 2019. Residential Building Electrification in California - Consumer economics, greenhouse gases and grid impacts. Available at: https://www.ethree.com/wp-content/uploads/2019/04/E3_Residential_Building_Electrification_in_California_April_2019.pdf.
27. Jones, Betony. 2021. Los Angeles Building Decarbonization: Community Concerns, Employment Impacts, Opportunities. Inclusive Economics.
28. U.S. EPA. 2021. “ENERGY STAR Certified Water Heaters.” Available at: https://www.energystar.gov/productfinder/product/certified-water-heaters/
29. Delforge, Pierre and Swanson C. 2016. “Very Cool: Heat Pump Water Heaters Save Energy and Money.” NRDC. Accessed September 27, 2021. Available at: https://www.nrdc.org/experts/pierre-delforge/very-cool-heat-pump-water-heaters-save-energy-and-money;
30. Hopkins, Asa S., et al. 2018. Decarbonization of Heating Energy Use in California Buildings – Technology, Markets, Impacts, and Policy Solutions, page 21. Available at: https://www.synapse-energy.com/sites/default/files/Decarbonization-Heating-CA-Buildings-17-092-1.pdf.
31. Armstrong, S., et al. 2019; Bruce Sullivan. 2017. “CO2 Takes Heat Pump Water Heaters to the Next Level.” Accessed September 27, 2021. Available at: https://zeroenergyproject.org/2017/05/22/co2-takes-heat-pump-water-heaters-next-level/
32. Steven Groves. 2018. “Mitigating the Parasitic Effect of Heat Pump Water Heaters on Home Heating Systems in Cold Climates” Fortis BC. Presentation at the 2018 ACEEE Hot Water Forum, March 21, 2018.
33. Carew, Nick. Et al. 2018. Heat Pump Water Heater Electric Load Shifting: A Modeling Study. Ecotope, Inc. Available at: https://ecotope-publications-database.ecotope.com/2018_001_HPWHLoadShiftingModelingStudy.pdf.
34. Ecotope. 2015. RCC Pilot Project: Multifamily Heat Pump Water Heaters in Below Grade Parking Garages in the Pacific Northwest.
35. Alan Meier et al. 2018. University of California Strategies for Decarbonization: Replacing Natural Gas, p. 76. Available at http://dms.hvacpartners.com/docs/1001/Public/0A/04-581025-01.pdf.
36. Gartman, M., S. Armstrong. 2020. “Heat Pumps for Hot Water: Installed Costs in New Homes”. Rocky Mountain Institute and Redwood Energy. Available at: https://rmi.org/insight/heat-pump-hot-water-cost/
37. Jones, B.. 2021. Los Angeles Building Decarbonization: Community Concerns, Employment Impacts, Opportunities. Inclusive Economics. Available at: https://drive.google.com/file/d/117bFbCLccCdu316IJAIHkRyoLMhQTQd3/view.
38. U.S. Energy Information Administration. 2015. “Table HC3.8 Appliances in homes in the South and West regions, 2015” Residential Energy Consumption Survey (RECS). Available at: https://www.eia.gov/consumption/residential/data/2015/hc/php/hc3.8.php
39. IEA Bioenergy. 2017. Methane emissions from Biogas Plants. Available at: https://task37.ieabioenergy.com/files/daten-redaktion/download/Technical%20Brochures/IEABioenergy_Task%2037_methane_emissions_2Psummary.pdf.
40. E3, 2018. Deep Decarbonization in a High Renewables Future: Updated Results from the California PATHWAYS Model. Prepared for the California Energy Commission. Available at
158
https://www.energy.ca.gov/publications/2018/deep-decarbonization-high-renewables-future-updated-results-california-pathways
41. U.S. Department of Energy, Office of Fossil Energy. 2020. Hydrogen strategy: enabling a low-carbon economy. Available at: https://www.energy.gov/sites/prod/files/2020/07/f76/USDOE_FE_Hydrogen_Strategy_July2020.pdf
42. E3. 2021. Maryland Building Decarbonization Study Final Report. Available at: https://mde.maryland.gov/programs/Air/ClimateChange/MCCC/Documents/MWG_Buildings%20Ad%20Hoc%20Group/Maryland%20Buildings%20Analysis%20Slide%20Report.pdf.
43. University of Virginia Weldon Cooper Center, Demographics Research Group. (2018). National Population Projections.
44. San Diego Gas & Electric Company. FERC FINANCIAL REPORT FERC FORM No. 1: Annual Report of Major Electric Utilities, Licensees and Others and Supplemental Form 3-Q: Quarterly Financial Report for end of 2020/Q4.
45. San Diego Gas & Electric. 2020. Attachment A to the 2020 Integrated Resource Plan. https://www.sdge.com/sites/default/files/regulatory/Attachment%20A_Cost%20Table%20%281%29_0.pdf
46. Mai, T. T. et al. 2018. Electrification Futures Study: Scenarios of electric technology adoption and power consumption for the United States. National Renewable Energy Laboratory. Available at: https://www.nrel.gov/docs/fy18osti/71500.pdf.
47. Jadun, Paige, Colin McMillan, Daniel Steinberg, Matteo Muratori, Laura Vimmerstedt, and Trieu Mai. 2017. Electrification Futures Study: End-Use Electric Technology Cost and Performance Projections through 2050. Golden, CO: National Renewable Energy Laboratory. NREL/TP-6A20-70485. https://www.nrel.gov/docs/fy18osti/70485.pdf.
48. U.S. Census Bureau. 2022. ACS 1-Year Estimates 1-Year Estimates-Public Use Microdata Sample, 2019. Available at: https://data.census.gov/mdat.
49. Nelson, R.K., Winling, L., Marciano, R., Connolly, N. and Ayers, E.L., 2020. Mapping inequality: Redlining in new deal America. American Panorama: An Atlas of United States History. University of Richmond: Digital Scholarship Lab.
50. Lin, W., Brunekreef, B. and U. Gehring. 2013. Meta-analysis of the effects of indoor nitrogen dioxide and gas cooking on asthma and wheeze in children. International journal of epidemiology, 42(6), pp.1724-1737.
51. Buonocore, J.J., Salimifard, P., Michanowicz, D.R. and J.G. Allen. 2021. A decade of the US energy mix transitioning away from coal: historical reconstruction of the reductions in the public health burden of energy. Environmental Research Letters, 16(5), p.054030.
52. Holm, S.M., Balmes, J., Gillette, D., Hartin, K., Seto, E., Lindeman, D., Polanco, D. and E. Fong. 2018. Cooking behaviors are related to household particulate matter exposure in children with asthma in the urban East Bay Area of Northern California. PloS one.
53. Fournier, E.D., Cudd, R., Federico, F., Pincetl, S., Iles, A. and D. Mulvaney. 2020. On energy sufficiency and the need for new policies to combat growing inequities in the residential energy sector. Elementa: Science of the Anthropocene, 8.
54. USDN. 2019. Facilitating Power, and Movement Strategy Center—From Community Engagement to Ownership: Tools for the Field with Case Studies of Four Municipal Community-Driven Environmental & Racial Equity Committees. Available at: https://www.usdn.org/uploads/cms/documents/community_engagement_to_ownership_-_tools_and_case_studies_final.pdf
55. City of San Diego. 2022. Building Energy Benchmarking. Available at: https://www.sandiego.gov/sustainability/energy-and-water-efficiency/benchmark.
159
5. Natural Climate Solutions and Other Land Use Considerations Elise Hanson, UC San Diego Emily Leslie, Montara Mountain Energy
Key Takeaways
● Natural climate solutions (NCSs) are an important component of decarbonization because they involve natural sequestration and medium to long-term storage of carbon dioxide in lands, but NCSs alone cannot generate enough negative emissions in the San Diego region to achieve net zero emissions.
● To contribute to net zero, natural and working lands (NWLs) need to act as stronger net sinks than they currently do, which will require investments in bolstering NCSs and minimizing carbon emissions from the land and land use activities. In order to accurately account for net carbon land use emissions, local data need to be collected and integrated into regional carbon calculations.
● The most effective and most inexpensive NCS in the San Diego region is to avoid land use change, except where land use change is required for other decarbonization actions, like siting renewable energy infrastructure. This report estimates that annual sequestration in NWLs may be up 2 million metric tons (MMT) of CO2 under ideal circumstances and that there may be 58 MMT of CO2 stored in vegetation, woody debris, leaf litter, and soils, some of which would be released with land use change.
● Other important regional NCSs considered here may be less effective and/or more expensive and include carbon farming, wetland protection and expansion, and urban forestry. For instance, urban forests in the region may sequester up to 2 MMT of CO2 a year, but there are large upfront and marginal costs of planting and maintaining an urban forest of that size. Large-scale habitat restoration and reforestation are expensive and may not be effective in the local context. Wildfire prevention will also be important for emissions and numerous other economic and social reasons. In general, these NCSs are less effective and more expensive, however they are still important NCSs with co-benefits.
● NCSs include co-benefits such as ecosystem services (e.g., water and air quality improvements, ecological resilience, biodiversity protection) and economic, social, and public health benefits (e.g., energy savings and localized public health improvements from increased urban tree cover). These co-benefits may help justify the cost of NCSs, even in circumstances where carbon sequestration and storage may be relatively low.

160
5.1 Introduction
5.1.1 San Diego region’s ecology
The San Diego region and the larger California Floristic Province are generally considered “biodiversity hotspots,” or areas characterized by high levels of endemism and habitat intactness while facing threats of extinction or biodiversity loss.1–3 San Diego county is widely regarded as the most biodiverse county in the nation, in large part due to its high diversity of plants, native bees, birds, reptiles, and mammals,2,4–7 and the region is characterized by being largely shrub-dominated, having cool, wet winters with warm, dry summers, and having highly fragmented habitats near urban and suburban development (Figure 5.1; Table 5.1).2,8 The San Diego region is also home to over 70 species that are listed as either threatened or endangered at either the state or federal level and over 100 more species that are considered to be at-risk.9
Further, the San Diego region contains areas that are considered refugia - or areas that are relatively protected from stressors that can negatively affect species or ecosystem survival - such as fire, climate change, water stress, and recreational impacts.10 These regions will be increasingly important for maintaining ecosystem functioning and for protecting ecosystem services, like carbon storage,10,11 thus highlighting the importance of land use planning at the ecosystem level across the entire region.12,13
Table 5.1. Areas (km2) and percent of total areas in the San Diego county boundary per vegetation category, calculated in QGIS 3.16 from Figure 5.1.
Vegetation Categories Regionwide totals Area (km2) Percent
Disturbed or Developed Areas, including Agriculture (pasture, orchards, row crops, etc.)
2218.226 20.1
Dune Community 190.471 1.726
Scrub and Chaparral 6503.742 58.932
Grasslands (not used for grazing or pasture), Vernal Pools, Meadows, and Other Herb Communities
655.067 5.936
Bog, Marsh, and Wetland 25.289 0.229
Riparian and Bottomland Habitat, including open water, bays, and freshwater
415.411 3.764
Woodland 681.826 6.178
Forest 345.971 3.135 TOTAL 11036.003 100%
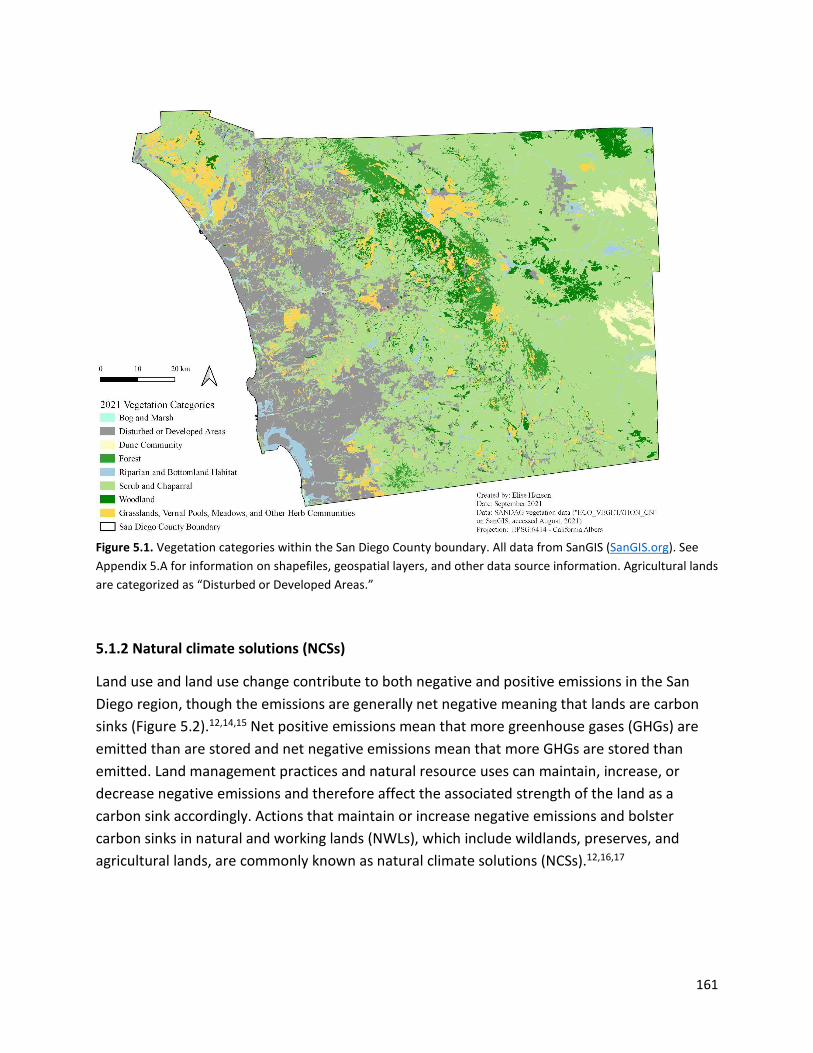
161
Figure 5.1. Vegetation categories within the San Diego County boundary. All data from SanGIS (SanGIS.org). See Appendix 5.A for information on shapefiles, geospatial layers, and other data source information. Agricultural lands are categorized as “Disturbed or Developed Areas.”
5.1.2 Natural climate solutions (NCSs)
Land use and land use change contribute to both negative and positive emissions in the San Diego region, though the emissions are generally net negative meaning that lands are carbon sinks (Figure 5.2).12,14,15 Net positive emissions mean that more greenhouse gases (GHGs) are emitted than are stored and net negative emissions mean that more GHGs are stored than emitted. Land management practices and natural resource uses can maintain, increase, or decrease negative emissions and therefore affect the associated strength of the land as a carbon sink accordingly. Actions that maintain or increase negative emissions and bolster carbon sinks in natural and working lands (NWLs), which include wildlands, preserves, and agricultural lands, are commonly known as natural climate solutions (NCSs).12,16,17

162
Figure 5.2. Total 2019 natural and working land (NWLs) carbon dioxide equivalent (CO2e) net emissions per land use and land use change sector and for total forestry and total agricultural sectors in the United States. Negative values are net negative emissions, or sequestration, and positive values are net positive emissions. Data are from the 2021 EPA report of national greenhouse gas emissions, tables 5-1 and 6-1.15 *The “existing settlements” sector includes urban trees, which offer large sequestration gains. Without urban trees, existing settlements would have net positive emissions.
NCSs will play a significant role in removing and storing atmospheric carbon dioxide (CO2) into the future. One study suggests that terrestrial and coastal lands and associated NCSs could contribute up to 30% of the global mitigation needed in 2050 to keep warming to 1.5 degrees.18 This finding, and others, demonstrate the importance of maintaining and enhancing ecosystem carbon sequestration. The finding also underscores the fact that other mitigation and negative emissions technologies will be needed to offset natural and anthropogenic emissions.12,16,18–20 In other words, NCSs are not a panacea.
Globally, nationally, and in California, most of the natural mitigation will occur through reforestation, afforestation, forest management, agroforestry, and other tree-based solutions.12,18,21,22 The San Diego region is shrub-dominated2 (Figure 5.1), so there are fewer tree-based NCSs beyond restoring riparian areas and increasing the urban tree canopy cover.12,17 Instead, local NCSs such as non-forest management of shrublands and shrubland restoration may be important, despite not being important globally.12 These warrant further research but are not considered in this report largely because there are few studies and data on the effectiveness of non-forest management.
There are two major considerations for land use and NCSs in the RDF: 1) maintaining or increasing annual GHG sequestration in NWLs and 2) decreasing or maintaining potential GHG
163
emissions from the land and coastal ecosystems and thereby protecting the stored carbon. This analysis focuses on net carbon dioxide equivalent (CO2e) emissions of land use and NCSs, though it is important to note that there are numerous co-benefits associated with land use management and NCSs including, but not limited to: biodiversity and endemism conservation, natural resource availability, ecological resilience, ecosystem services, and more.
5.1.2.1 Sequestration
Carbon sequestration is the flow of CO2 from the atmosphere into soils, biomass, geological formations, etc. Natural and working lands, the latter of which includes agricultural lands, like orchards, plant nurseries, row crops, and pasture lands, can sequester CO2 through photosynthesis and can sequester methane and nitrous oxide through bacterial metabolic reactions,23–25 though NWLs tend to be sources of methane and nitrous oxide rather than sinks.24,26–28 NWLs, as opposed to settlements or other built up areas, therefore can provide net negative emissions and counteract some GHG emissions in other sectors.20,21,24 Given that natural lands tend to only have net negative emissions of CO2, this report will focus on methods to sequester CO2 in these lands annually.
Annual carbon sequestration rates vary by prevailing climate, levels of disturbance, and dominant plant species,29 as will be described in some detail in section 5.3, but generally landscapes with older, more photosynthetic biomass (tissues and other materials from plants that are or were a part of an organism) have higher sequestration rates.29,30 As such, forests tend to have higher sequestration rates than grasslands, for instance, with forests being able to sequester up to twice as much carbon as grasslands.20,21,24 While the emphasis is often on simply planting trees, the International Panel on Climate Change’s most recent report highlights the scientific consensus that afforestation, or planting trees in lands like grasslands or savannas that historically did not have any or many trees, should be avoided, as it replaces native and adaptive vegetation with ill-adapted trees and is therefore more vulnerable to carbon emissions and provides fewer co-benefits.20,31 Further, the report, supported by numerous studies, emphasizes that the type of tree matters20,32 and that non-forest ecosystem protection and restoration are also critical.20
5.1.2.2 Storage
NWLs hold large quantities of carbon in both biomass, living and dead, and in soils.21,24 Carbon storage is an accumulated stock of CO2 stored as carbohydrates and other carbon-containing molecules. Carbon storage in plant tissues occurs when net primary production (NPP) is positive (i.e. when carbon sequestration occurs in the form of plant growth). Primary production is the process by which photosynthetic organisms create sugar and oxygen via sunlight, water and CO2. NPP is the sugar creation minus the CO2 released through respiration. When NPP is positive, the plant sequesters more CO2 through sugar production than it releases through
164
respiration.13–15 As plants grow, they store carbon in their tissues in both aboveground (stems, leaves, trunks, etc.) and belowground (roots) biomass. The fate of that carbon is highly dependent on local conditions, however, generally, some belowground biomass will become soil carbon as the root tissues die and are partially decomposed. Additionally, the complex soil ecology and fungal ecology interact with plant sugar production and also contribute to soil carbon storage. Aboveground biomass can store carbon in the system as dead/downed woody debris. This storage is especially important in low humidity systems where decomposition rates are lower, as they are in Southern California.
Despite the fact that natural systems are adept at storing carbon on average and in the long-term, there is large variability of total carbon storage contribution by ecosystem type in the San Diego region. For instance, though forests and woodlands store and sequester more carbon globally, they play a smaller role in Southern California. This is largely due to the relative lack of forests in the San Diego region (Figure 5.1, Table 5.1), but is also due to the fact that existing trees and forests grow more slowly in the majority of Southern California than in more humid regions.13,17,22
Similarly, the San Diego region is dominated by shrubs and other woody, non-tree plants, as nearly 60% of the region is classified as scrub or chaparral habitats (Table 5.1), which are locally important for carbon storage2,12,30 and for nitrogen storage.33 Scrub habitats, including coastal sage scrub (CSS) and chaparral, are somewhat unique in that they continue to provide high sequestration rates and storage even when they are invaded by non-native grasses, which are themselves inefficient carbon storage systems.33 Further, because Southern Californian scrub-dominated ecosystems have longer historic fire regimes than forest-dominated or more northerly regions,34–37 San Diego’s scrub ecosystems have low carbon “turnover” from their dead, woody tissues and therefore store that carbon for a longer time period.33
Though marsh and wetland ecosystems are slow to sequester carbon on an annual basis, they hold large quantities in stable reserves38,39 and can even transport some carbon to the deep ocean, thereby storing it for millennia or longer.40 For the San Diego region and for California as a whole, salt marshes, salt pans, mudflats, and eelgrass (or seagrass) beds are the crucial “blue carbon” ecosystems that store disproportionately high amounts of carbon for long time periods.39,41,42
5.1.2.3 Avoiding land use and land use change emissions
Avoided emissions refer to emissions that would have come from NWLs if not for some land use protection or land use change prevention. In California, the majority of avoidable emissions come from large-scale, crown wildfires in forests and from land use change in forests, shrub, wetlands, grasslands, and agricultural lands (roughly in that order) from natural to human-made environments.12,13,43 In the case of wildfires, centuries of fire suppression have left areas
165
with excess downed woody debris on the forest floor, which fuels faster, hotter fires.36 Additionally, pest and noxious weed invasions have fueled large, destructive fires - even in the face of forest management - by creating larger pools of downed woody debris through tree die-offs and swaths of dead grasses or excessively flammable leaf litter, respectively.36,44 Further, worsening droughts reduce the likelihood that a healthy forest or scrub ecosystem will withstand a wildfire or rebound quickly after a wildfire and therefore droughts drastically reduce the likelihood that an invaded forest or scrub will withstand a wildfire.12,36,44 This combination of drought and non-native weed species invasions and non-native insect invasions fueled San Diego’s 2003 and 2007 super fires, where large quantities of dead pine trees, oak trees, and annual grasses fueled historic fires and permanently altered ecosystems, where previously forested lands are now scrub-dominated.35,44 In the case of land use change, rapid development has fragmented the San Diego region’s natural ecosystems and has created large expanses of settled and built up areas that provide little carbon sequestration value or other ecosystem services.2,8,13,15
Beyond preventing “avoidable” emissions through land use and management practices, some emissions will be nearly or completely unavoidable. For instance, if there are not large-scale wetland management practices implemented in the region, there will be future emissions generated as sea levels rise. As seawater inundates intertidal zones, marshes, bogs, and wetlands, the associated plants will die and some portion of the carbon stored in the sediment and biomass will be emitted.42 These emissions will be unavoidable,45,46 but they can be mitigated through restoring upland habitats and allow for wetland migration, which would hypothetically result in net zero emissions from wetland loss due to sea level rise.17,42,47,48
5.1.2.4 Other considerations (co-benefits)
NWLs provide numerous societal benefits, beyond carbon sequestration and storage, as a result of natural ecosystem processes. These are called ecosystem services and include air and water quality improvements, reduced impacts from natural disasters, increased food and fiber production, groundwater recharging, increased biodiversity and ecological resilience, and improved public health. The majority of the proposed methods to increase carbon storage and sequestration naturally have co-benefits.17,20–22,49 For the NCSs considered in this report, each is reported by the California Air Resources Board (CARB) to improve water quality and/or increase water quantity; protect biodiversity, habitats, and ecosystem health; and improve public health and/or community resilience to climate change. Additionally, protecting NWLs from land use change improves air quality, as does urban forestry and chaparral restoration.49
While this report focuses on the carbon storage and sequestration aspects of NCSs, it will be important to characterize, quantify, and monetize the additional ecosystem services and co-benefits in the future in order to understand the full impacts of these actions. The full
166
understanding of NCS co-benefits will be especially important as the San Diego region prepares for a more uncertain climate and as it plans mitigation policies to address the possibility of longer and/or more severe droughts, more frequent and/or severe wildfires, and other natural disasters and changing baseline climatic realities.50
The rest of the chapter will focus on four NCSs that are implementable for the San Diego region and that would create negative emissions, maintain or increase carbon storage, and provide co-benefits. These four NCSs are: protection of natural lands from land use change; carbon farming; protection of blue carbon; and urban forestry.
5.1.3 Land Use Change and Growth, Development, and Sectoral Decarbonization
There are considerable trade-offs between preventing land use change and development that are not explicitly considered in the RDF, but that are worth further research and consideration. Namely, the development for regional decarbonization outlined in this report’s pathways will generally necessitate some degree of land use change.
5.1.3.1 Energy production and land use change
First, given the current technological availability of low-carbon energy production, Chapter 2 of this report finds that energy supply decarbonization will require some land use change in every investigated scenario to build renewable energy sites and transmission infrastructure. This is true even of those scenarios that do not allow the region to independently produce sufficient renewable energy by 2050 to meet the projected demand (see Section 2.5 and Table 2.5). From an NCS perspective, the scenario that prioritizes protecting lands with high sequestration falls far short of reaching 2050 regional energy demand and would require relatively expensive investments in developing urban renewable energy resources and significant energy imports from outside of the region. Even by avoiding lands with high sequestration potential, the scenario would still impact regional sequestration to some degree. This scenario underscores the fact that, under the current technological landscape and grid interconnections, there will be trade-offs between producing low-carbon energy and maintaining existing natural negative emissions in NWLs. Decision-makers will need to weigh the inherent trade-offs between reducing energy emissions and preventing land use change’s one-time emissions and lost sequestration potential.
5.1.3.1 Transportation and land use change
Second, Chapter 3 of this report shows that a decarbonized transportation sector will also require land use change, some of which may be in NWLs. Land use change may be required to update, expand, and improve public transit; build EV charging infrastructure; improve and/or expand regional bikeability and walkability; and to otherwise better connect communities to reduce VMT. As with decarbonizing energy, decarbonizing the transportation sector, which is

167
the largest regional GHG emitter, may require some trade-offs between reducing emissions and NCSs.
5.1.3.1 Development, housing, and land use change
Finally, as cities, towns, villages, and communities in the San Diego region continue to grow, land use change will be necessary to build housing, community buildings and other public areas, businesses, and critical infrastructure, among others. This is especially true as the region plans for housing development to address the regional housing shortage and as the region addresses housing equity and access for low-income residents. There are reports that explicitly examine land use change and housing in the San Diego region, including the Climate Action Campaign’s “Solving Sprawl” report.51 This chapter supports the report’s findings that community-centered growth that focuses on expanding or enhancing existing community footprints will by definition have fewer disruptions to NWLs than creating new communities in current natural or working lands. Although the RDF does not explicitly consider housing, this report acknowledges that housing is an important component of continued development, economic stability, social justice, and sustainability in the region. This chapter, along with other resources like the Solving Sprawl report, can offer decision-makers tools to understand the trade-offs of housing, transportation, renewable energy and land use change and the accompanying loss of NCSs associated with development in NWLs. This chapter highlights the negative emissions potential of the region’s NWLs in order to provide decision-makers with information on the trade-offs of preventing or allowing land use change. These trade-offs, as well as the emissions accounting, should be carefully considered.
5.2 Natural and working lands’ negative emissions
5.2.1 Introduction
NWLs are, on average, carbon sinks and are globally recognized for their ability to sequester and store CO2 in plant biomass and soils.14,20 The current level of global net negative emissions from NWLs is insufficient to offset anthropogenic emissions and are thus unable to begin drawing down atmospheric CO2 until positive emissions are drastically cut. However, NWLs represent an important tool for reaching net zero emissions globally, nationally, and locally.12,17,21,22,43 The NCSs for NWLs are to protect current NWLs from land use change to settlements or barren landscapes, to enhance lands’ ability to sequester and store carbon through land management, and to restore degraded or lost NWLs to their natural states.21,22,43
Protecting current NWLs from changing to less photosynthetically productive lands (i.e. settlements or barren landscapes) is consistently the least expensive NCS and is highly

168
effective.21,22 This section will focus on the NCS of protecting existing carbon pools and carbon sequestration potential in NWLs through preventing land use change.
Land use change is a global problem that leads to net emissions as more productive carbon sequestering lands, like forests or grasslands, are turned into less productive lands, like settlements or high emissions agriculture.14,20,24 The loss of NWLs that currently hold carbon and that sequester carbon annually is twofold: there is a one-time loss of carbon that is stored in soil and biomass and there is the lost sequestration potential of that land.14 Net zero emissions scenarios rely heavily on preventing land use change that would result in net emissions (e.g. urban expansion, land conversion to croplands) and promoting land use change that would result in net sequestration (e.g. reforestation).12,19,21,24
Nevertheless, it is important to discuss other common NCSs, even if they are not applicable to the San Diego region or if they were not analyzed here. While forest management and other land management techniques are effective tools in California and in the United States,17,22,43 they are less important in Southern California, which is shrub dominated and has few forests that would benefit from forest management on a large enough scale (Figure 5.1).17 Similarly, reforestation efforts are inappropriate in most of the San Diego region and are high cost.17,22,43 Other restoration efforts are also expensive, though some efforts, like restoring riparian zones, savannas, or woodlands, are relatively less expensive and can contribute significantly to negative emissions in the San Diego region.17,22,52 Riparian restoration is considered in the agriculture and carbon farming section and blue carbon restoration is discussed in the blue carbon section, while other restoration efforts are discussed briefly in Section 5.6 of this report. This section will focus on the negative emissions benefits of protecting existing carbon pools and carbon sequestration potential in natural and working lands through preventing land use change.
Among the NCSs listed above, preventing land use change is relatively inexpensive. National estimates for the U.S. suggest that over 60 MMT of CO2e can be sequestered in 2025 for marginal abatement costs of $10 or less per MT of CO2e simply through avoiding conversion of forest and grasslands.22 Comparatively, reforestation, which has the highest potential for sequestering and storing carbon of any NCSs that are considered at the global, national, or state level, is relatively expensive.12,20,22,29 In the United States, this is largely due to the high costs of collecting seeds, raising seedlings in nurseries, and planting saplings in reforestable areas. When additional costs, such as maintenance and program evaluation, are considered, the costs increase further.53 Additionally, costs vary by prevailing climatic conditions, infrastructure, workforce, and species, thus costs are likely to be higher in Southern California than in the Southeastern United States or Northern California, where conditions, infrastructure, and species are more amenable to reforestation.12,53

169
In the San Diego region, land use change occurs through natural processes, such as ecosystem succession after fires or pest invasions,34,36,44 and through settlement expansion, such as urban and transportation expansion.2,8,54 This section investigates the current approximate carbon storage and sequestration in the San Diego region using geospatially explicit vegetation data types from SANDAG’s GIS portal (SanGIS.org for more information of geospatial source data, see Appendix 5.A). It additionally considers approximate carbon storage and sequestration in eelgrass beds in the San Diego Bay based on survey results, rather than geospatially explicit data.
It should be noted that this analysis is not peer-reviewed nor is it a comprehensive analysis of the region’s carbon accounting in natural and working lands. Instead, it is intended to illustrate the following points: 1) the region’s NWLs are, on average, carbon sinks - meaning that they naturally capture and store CO2; 2) land use change in these NWLs will release stored carbon while simultaneously eliminating future sequestration in those areas; 3) land use decisions affect the carbon cost-benefit calculations of NWLs and, therefore, decision-makers should be aware of the broad carbon implications of the region’s NWLs.
5.2.2 Methods
All analyses, calculations, and data manipulation were done in QGIS 3.16 and Microsoft Excel. Carbon storage and sequestration values were taken from the literature (see Appendix 5.A for sources). Whenever possible, local data were chosen. If local data were not available, then state, Pacific Coast, Western U.S., U.S., and global data were used, in that order. When there were multiple estimates in the same geographic area or when there was a range of possible values, the most conservative value was chosen. All carbon storage values were converted to metric tonnes of CO2 equivalent or carbon per hectare (MT CO2e or C ha-1) and all carbon sequestration values were converted to metric tonnes of CO2 equivalent per hectare per year (MT CO2e ha-1 yr-1) if the data were not already reported as such. Total carbon storage and sequestration values for the entire region were converted into millions of metric tonnes (MMT) (See Appendix 5.A for methods details).
The total estimated eelgrass of 1,692.8 acres (685.05 ha) from the San Diego Bay were also included.55 Mission Bay eelgrass beds were not included because restoration and data collecting efforts are ongoing and not yet comprehensive, though more comprehensive data will be available in the near future and should be integrated into blue carbon and negative emission calculations.56–59 Marine eelgrass beds were also not included because they are in State waters and are outside of the jurisdiction of San Diego regional governments and agencies.
170
5.2.3 Results
The biodiverse and ecologically rich natural landscapes in the San Diego region have significant potential for both carbon storage and for annual carbon sequestration (Table 5.2). This analysis shows that there are approximately 58 MMT of carbon stored in San Diego’s biomass and soils. Scrub ecosystems, including chaparral and coastal sage scrub, contribute most significantly to carbon storage, due in large part to their abundance and their local adaptations (Figure 5.1). Per hectare, coastal wetlands store the most carbon of any system. They are followed by tree-dominated systems, like woodlands, forests, and riparian areas. Wetlands are one of the least abundant systems in the region, though tree-dominated systems also have relatively low coverage. This is all readily visible in Figure 5.3, which shows the highest carbon storage per hectare values are red and the lowest as blue.
In addition to storage, the region also has high sequestration values and may be able to sequester up to 2.25 MMT of carbon per year. An important caveat to this value is that it relies on several assumptions that may not reflect the biological realities, and this caveat is especially important in the scrub category because it is the dominant ecosystem type in the region (see Section 5.2.4 for more discussion of assumptions, caveats, and drawbacks). The largest sequestration potential is in scrublands, forests, woodlands, and riparian zones. However, settlements show some high sequestration potential because of urban trees (Table 5.2). Per polygon, forests and woodlands have the highest annual sequestration rates per hectare (Figure 5.4 – red values have the highest rates, blue have the lowest rates). Interestingly, disturbed wetlands have net positive emissions,42,48,60 so those polygons (Figure 5.4 – black polygons) have negative sequestration values, despite continuing to store carbon (Figure 5.3).
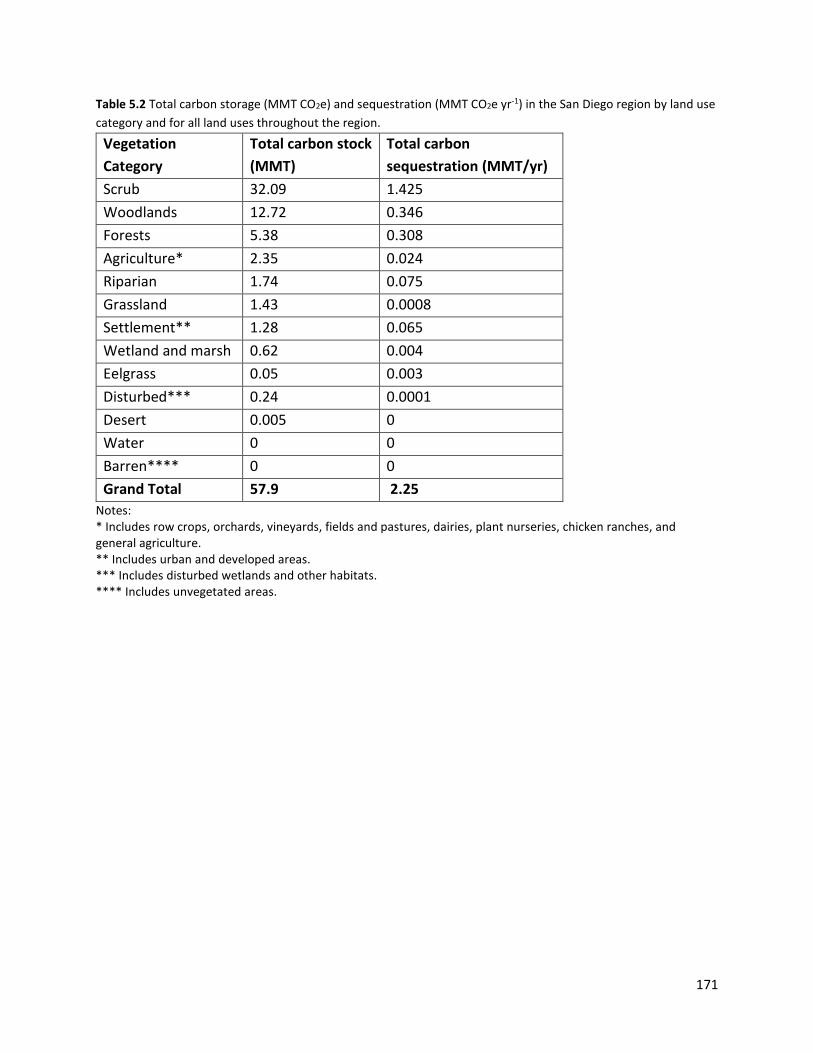
171
Table 5.2 Total carbon storage (MMT CO2e) and sequestration (MMT CO2e yr-1) in the San Diego region by land use category and for all land uses throughout the region.
Vegetation Category
Total carbon stock (MMT)
Total carbon sequestration (MMT/yr)
Scrub 32.09 1.425 Woodlands 12.72 0.346 Forests 5.38 0.308 Agriculture* 2.35 0.024 Riparian 1.74 0.075 Grassland 1.43 0.0008 Settlement** 1.28 0.065 Wetland and marsh 0.62 0.004 Eelgrass 0.05 0.003 Disturbed*** 0.24 0.0001 Desert 0.005 0 Water 0 0 Barren**** 0 0 Grand Total 57.9 2.25
Notes: * Includes row crops, orchards, vineyards, fields and pastures, dairies, plant nurseries, chicken ranches, and general agriculture. ** Includes urban and developed areas. *** Includes disturbed wetlands and other habitats. **** Includes unvegetated areas.

172
Figure 5.3 Total stored carbon (MT CO2e ha-1) estimates for the San Diego region. Warmer colors represent larger carbon stock estimates, cooler colors represent lower stock estimates, and white represents no carbon stock. Regionwide sequestration totals per vegetation category were calculated from these values and are in Table 5.2. Note that eelgrass beds were not included because they were not included in the SanGIS shapefiles. However, eelgrass beds are prevalent in both Mission and San Diego bays and are important blue carbon habitats.
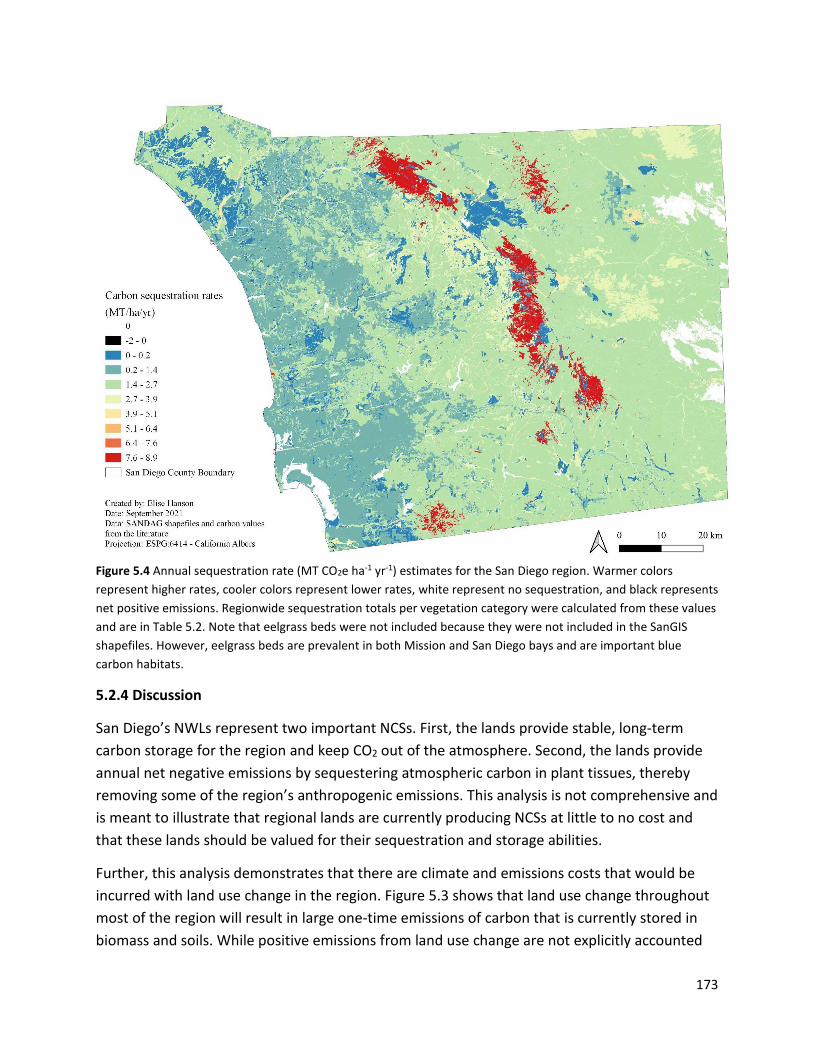
173
Figure 5.4 Annual sequestration rate (MT CO2e ha-1 yr-1) estimates for the San Diego region. Warmer colors represent higher rates, cooler colors represent lower rates, white represent no sequestration, and black represents net positive emissions. Regionwide sequestration totals per vegetation category were calculated from these values and are in Table 5.2. Note that eelgrass beds were not included because they were not included in the SanGIS shapefiles. However, eelgrass beds are prevalent in both Mission and San Diego bays and are important blue carbon habitats.
5.2.4 Discussion
San Diego’s NWLs represent two important NCSs. First, the lands provide stable, long-term carbon storage for the region and keep CO2 out of the atmosphere. Second, the lands provide annual net negative emissions by sequestering atmospheric carbon in plant tissues, thereby removing some of the region’s anthropogenic emissions. This analysis is not comprehensive and is meant to illustrate that regional lands are currently producing NCSs at little to no cost and that these lands should be valued for their sequestration and storage abilities.
Further, this analysis demonstrates that there are climate and emissions costs that would be incurred with land use change in the region. Figure 5.3 shows that land use change throughout most of the region will result in large one-time emissions of carbon that is currently stored in biomass and soils. While positive emissions from land use change are not explicitly accounted

174
for in any of the Climate Action Plans,i this accounting can be an important metric to help decision-makers understand the inherent emissions trade-offs involved in land use change. Additionally, Figure 5.4 shows that land use change throughout most of the region will have long-term sequestration consequences, as those lands will sequester less carbon each year after they change. This accounting can also elucidate trade-offs because the lost sequestration would need to be replaced with other NWL sequestration to maintain an equilibrium in the NCSs in NWLs. Alternatively, technological solutions could compensate for NWL sequestration loss, though this would be costly and potentially difficult to implement.16,18 The exception to this rule of thumb is if the land use change is a change from less photosynthetically productive lands to more productive lands, as would be the case in chaparral or woodland restoration on degraded, retired, or disturbed lands, for instance (See Figure 5.2 for an illustration of land use change that results in greater sequestration).
There are some caveats and drawbacks to this analysis. First, local data were unavailable for some vegetation classes and the values used may not accurately reflect local conditions or circumstances. As a result, this analysis made assumptions that generalized carbon storage and sequestration potential. Importantly, the analysis assumes that all scrub and chaparral habitat store and sequester a uniform amount of carbon, regardless of the vegetation class within scrub and chaparral. Without more accurate values based on local data collection, this assumption was used as a placeholder. Thus, local data will become more important in the future as droughts and other phenomena affect the San Diego region. Additionally, this analysis assumed that all scrub habitats were intact (i.e., not invaded), which will inflate the storage and sequestration values because of results by Luo et al. (2007),30 which shows that chaparral in one part of the San Diego region is a strong sink in normal years and a source in years of severe droughts, and Wheeler et al. (2016),33 which shows that invaded chaparral in the San Diego region stores and sequesters less carbon than an intact habitat. These studies highlight both the uncertainties in carbon accounting and the importance of localized data. Second, soil carbon estimates were not universally included in the literature, or it was not clear whether soil carbon had been included in some stated values. Excluding soil carbon would underestimate the total stored carbon, but it is unlikely to affect the carbon sequestration rates because the majority of measured soil carbon is relatively shallow, where much of the long-term soil carbon storage is in deeper soil layers.61 Third, the full extent of eelgrass and other marine, beach, and intertidal plants and algae were not included in the vegetation classification shapefiles or were not included in enough detail to make determinations. Thus, their carbon storage and sequestration potentials are underrepresented, despite the fact that they are important contributors to negative emissions in the region and store large quantities of carbon.38,41,56 Fourth, this analysis was done at a coarser scale than other regional and localized analyses that
i Personal communication Scott Anders, September 2021.
175
are forthcoming.i Those more detailed analyses should be considered more accurate because they will better reflect plant biomass and soil carbon estimates as well as carbon sequestration potential. Finally, this analysis would benefit from research done by local institutions and organizations like WildCoast, the Climate Action Alliance, San Diego State University, and the Scripps Institution of Oceanography. When local data are available, they should be incorporated into all land use analyses as quickly as possible.
5.2.5 Policy implications
This analysis illustrates that an ounce of prevention is worth a pound of cure – protecting a hectare of NWLs will prevent emissions and will continue to sequester carbon in a low to no cost manner. As such, NWLs contribute to negative emissions in the region and thus mitigate some local anthropogenic emissions. Meanwhile, losing NWLs would require expensive restoration, mitigation, or negative emissions technology investments to capture the one-time emissions of stored carbon and to continue to sequester the carbon that those lands would have sequestered naturally.
Further, this analysis illustrates that those efforts to characterize the carbon storage and sequestration capacity of NWLs in the San Diego region should be supported by local governments, jurisdictions, and agencies because current policies are generally not informed by the most localized carbon cycling data. Similarly, this analysis shows that there will be emissions trade-offs associated with land use change in the region. Thus, regional governments should include emissions from lost biomass and soils as well as the lost carbon sequestration potential when deciding land use policies and decarbonization pathways in order to better understand the carbon-related trade-offs of land use decisions. Additional effort should be applied to monetizing these emissions and lost sequestration potential in order to properly incentivize natural and working land protection and to understand the extent of regional net negative emissions.
5.2.6 Policy recommendations:
● Prioritizing retaining natural and working lands’ sequestration potential is the region’s least expensive and most effective NCS.
● Support infill development and natural growth in rural communities that minimize loss of carbon sequestration potential and co-benefits from NWLs. Disincentivize sprawl growth in NWLs and sprawl growth that cannot support efficient transit use or multi-modal transportation options.
i Personal communication Drs. Megan Jennings and Matthew Costa, 2021 and information from the Climate Action Alliance detailed here: https://www.climatesciencealliance.org/carbon-sequestration

176
● Support studies to accurately measure and report local carbon stocks and sequestration rates.
● Consider incorporating the costs of CO2 emissions from land use change and the lost CO2 sequestration potential into land use planning decisions.
5.3 Agriculture and working lands 5.3.1 Introduction
Nationally, agriculture is a net GHG emitter because agricultural activities result in net positive emissions of methane, nitrous oxide, and CO2 (Figure 5.2).14,15,24 However, agriculture is a relatively small source of regional emissions62 and it is unique because it is the only sector that is capable of switching from net positive to net negative emissions, all while producing agricultural goods. In this way, the NCSs associated with farming, ranching, and other agricultural activities can support decarbonization and continue to provide jobs, livelihoods, food, and other agricultural goods to the region and beyond.
Many NCSs focus on ways to both reduce CO2 emissions and enhance sequestration potential,21,22,24 where methane and nitrous oxide management are more nuanced and difficult.25,26 This is also true for agricultural emissions, however, manure and fertilizer management can reduce methane and nitrous oxide emissions, respectively.21,52 This report will focus on the CO2 implications of agricultural climate solutions, sometimes referred to as “carbon farming” or “climate farming,” though it will note important considerations for methane and nitrous oxide when applicable. The two primary methods for addressing CO2 sequestration and emissions in existing agriculture are 1) to amend soils, increase average annual vegetation cover, or otherwise change farming practices to increase the stored carbon in the soil and thereby increase annual sequestration, and 2) to prevent emissions from agricultural production, from soils, or from lost orchard trees. Examples of increasing sequestration include adding compost to soils, planting cover crops, planting trees in or around farms or pastures, planting perennial plants rather than annuals, preventing the premature loss of existing orchard trees, engaging in whole orchard recycling, or adding biochar. Examples of preventing emissions include cover cropping, practicing no or low-till agriculture, planting perennial plants rather than annuals, or planting trees, or utilizing on-farm compost.12,20,21,52
Agriculture and working lands are economically and socially important to the San Diego region and there are NCSs available today that may be able to turn agricultural carbon sources into carbon sinks and thus contribute to regional decarbonization goals.52,63 Additionally, agriculture is a relatively smaller emitter in the region when compared to energy generation,

177
transportation, and natural gas combustion in buildings, which are all considered in the RDF.15,64 It is therefore important to acknowledge that agriculture is the only emitting industry in the region that has the potential to shift to actively sequester and store carbon. Agriculture is thus a unique industry because it can counteract climate change and simultaneously provide food, nursery plants, and other goods for regional consumption.15,62,63 In implementing these NCSs, it will be critical to accurately assess costs and benefits and to provide low- or no-cost assistance to farmers, farm laborers, and farming communities to facilitate an equitable and mutually beneficial transition to climate farming techniques. Assistance can come in the form of financial and/or educational assistance.
It is important to state on the outset that there are significant uncertainties in GHG accounting in agricultural lands because the soil gas interchanges are complicated and highly heterogeneous (given that they depend largely on weather and inputs on any given day as well as on existing soil gas composition).12,27 The majority of agricultural climate discussions in the United States rely on the Department of Agriculture’s (USDA) COMET planner.i Discussions that focus on California tend to use a California-specific COMET planner tool,ii with additional help from CARB and the California Department of Food and Agriculture. This tool is important, though it should be used carefully because there are some caveats to the data. First, the data behind the estimates represent 10-year averages and the values should be considered invalid beyond that timeframe.12,65 Second, the models that use the field data are simple relative to the biochemical interactions in soils. Given that soils are highly dynamic systems, there are concerns that the COMET planner overestimates the amount of carbon that will be stored and may simultaneously underestimate the potential nitrous oxide emissions.12,27 Further, the report “Getting to Neutral: Options for Negative Carbon Emissions in California” notes that the models underlying the COMET planner also likely overestimate how much carbon is stored in deeper, and thus longer term, soil storage.12 Thus, the “Getting to Neutral” report, and others, emphasize the importance of longer term monitoring of local demonstration farms where climate farming practices have been implemented.12,52
5.3.2 Discussion
In lieu of localized carbon flux data, which would be ideal for calculating climate farming impacts, Dr. Puja Batra produced a report52 for the unincorporated San Diego region to recommend policies for the County of San Diego regarding climate farming and transforming agricultural lands from sources to sinks using California-specific COMET planner data. That report focused on compost applications in orchards, rangelands, and row crop fields. It also
i http://comet-planner.com/ ii http://www.comet-planner-cdfahsp.com/

178
discussed riparian restoration, and preventing the removal of orchard trees due to increasing marginal costs of watering and losses due to fire.
Compost application is estimated to yield the highest carbon sequestration benefits of any investigated carbon farming techniques, according to Batra,52 resulting in 227,170 MT of CO2e sequestered annually. However, the report notes that there are potential problems of nitrogen leaching into surface water and groundwater if the application rate is too high or if the nitrogen levels in the compost are too high.52 Repeated application of compost may result in eutrophication52 and/or net GHG emissions from the soil,12,27,43 so compost application for the sake of carbon sequestration will need to be coupled with monitoring. Regardless of carbon sequestration potential, compost application may offer co-benefits in reduced application of synthetic fertilizers, which could reduce NOx emissions;22 improved manure management, which could reduce CH4 and NOx emissions;12,22,52 and increased soil water retention.20,22,52
Batra also investigated riparian restoration as a means of sequestering carbon in the region’s agricultural and working lands. The unincorporated County has nearly 7,000 miles of freshwater and riparian systems,52 which are typically dominated by shrubs and trees and have higher carbon sequestration potential than forb and grass-dominated systems.2,6,24 Restoring riparian ecosystems typically involves planting native trees and shrubs, which is estimated to result in approximately 2 MT of CO2e sequestration per acre per year.52,65 Batra estimated restoration of about 25% of riparian habitats and 35 feet of buffer zones around them would result in approximately 7,230 MTCO2e per year.52
Finally, Batra considered the emissions from recent orchard tree removals and the lost sequestration value of those trees. The unincorporated County lost approximately one million orchard trees from 2000 to 2015. Many of the trees were removed because rising marginal costs of inputs like water forced farmers to choose between paying higher water costs or removing some of their orchard trees.52 Trees are particularly good at sequestering carbon because of their size and they are particularly good at storing carbon because they deposit carbon deep in the soil and store carbon in biomass,12,20,21,29 so removing these orchard trees has two carbon related impacts. First, it releases stored soil carbon and begins the process of releasing the biomass carbon. Second, it reduces the orchard’s annual sequestration potential because the removed tree is no longer able to sequester carbon annually.52 Batra estimated that the cumulative total lost orchard trees in this period released 243,468 MT of CO2e and lost the ability to store 131,657 MT of CO2e during that 15 year period. All told, the loss of orchard trees in the unincorporated County is estimated to be more than 375,000 MT CO2e.52 This analysis highlights the importance of retaining existing carbon pools, however it also speaks to the financial difficulties that farmers face when input prices increase.

179
Beyond Batra’s report, other carbon farming methods to consider should include cover cropping, improved species selection, and restoration of degraded, abandoned, or marginal agricultural lands.12,20–22 Importantly, each of these techniques has co-benefits for the farmers, ranchers, and land owners, including increased soil water retention, more shade for livestock, and/or increased agricultural yields. The techniques also have co-benefits for the surrounding ecosystems like improved or increased habitat and/or increased biodiversity.20–22,66 Restoration of degraded, abandoned, or marginal agricultural lands is likely to offer the greatest co-benefits for the San Diego region in large part because planting trees and shrubs in grasslands or fields leads to large belowground and aboveground carbon storage gains as well as improved biodiversity, soil health, water quality and quantity, and air quality outcomes.12,20–22,24 Additionally, given that much of the region’s agricultural output and acreage consists of livestock grazing, rangelands, and pasturelands,2,67 planting trees in or around grasslands used for grazing or pasture is likely to improve regional carbon sequestration while offering numerous co-benefits to farmers and ranchers, like shade for livestock, in addition to the restoration co-benefits listed above.52,65 Finally, restoration of degraded, abandoned, or marginal agricultural lands may offer a source of revenue for farmers if they can be paid for their restoration efforts.i
Addressing methane and nitrous oxide emissions is generally more difficult because there are generally fewer carbon farming solutions for these sources, despite the fact that they contribute more warming potential to the atmosphere than CO2.13,14,21,24,52 Methane in the San Diego region is primarily emitted from landfills, livestock manure, enteric fermentation, and wastewater, though there are also some methane emissions from natural decomposition in wetlands and wetland loss.12,17,20,24,47 Of these, only livestock manure and enteric fermentation are directly applicable to the region’s agricultural emissions. Batra did not account for the agricultural methane that is prevented from entering landfills because avoided methane emissions are covered by regional climate action plans and would constitute double counting.52,68,69 This would also be the case for the City of San Diego’s wastewater emissions.68,69 There are, however, some manure and enteric fermentation management techniques that would not be double counting for the region. These include on-site anaerobic manure digestion,70 methane capture or digestion from enteric fermentation, methane reduction from enteric fermentation.12,52,66,71,72 The opportunities to reduce methane and nitrous oxide emissions in the region’s agriculture sector require further study, but they may provide important GHG emissions reductions.
i For example, the USDA’s Natural Resource Conservation Service has provided funding in the past for numerous carbon farming, restoration, and land management projects across the country, so federal funds could be available for the region’s carbon farming projects (for more information, see: https://www.nrcs.usda.gov/wps/portal/nrcs/detail/national/newsroom/releases/?cid=NRCSEPRD1829258 ).

180
Two demonstration projects hosted by the Resource Conservation District of Greater San Diego County67,73 and several independent agricultural operations in San Diego County74 offer examples of carbon farming and monitoring and will provide further insight into the carbon sequestration benefits and the capital costs associated with the new techniques, processes, and monitoring. Projects like these will be critical for understanding the long-term costs and benefits of carbon farming and may help to create a local market for carbon offsets.74
A final caveat to this analysis is that agricultural lands can contribute to negative emissions and reduce emissions by diverting some of the waste that would have otherwise gone to landfills. For instance, SB 1383i will result in larger quantities of compost and mulch that are produced as organic materials from homes and businesses are diverted from landfills. Farms can potentially utilize some of the compost and mulch produced by SD 1383, though transporting and utilizing compost and mulch will come with challenges and costs. While these potential emissions reductions from organics being diverted from landfills are important, they should be considered within the waste and landfill sector’s emissions accounting, not in agricultural accounting. The negative emissions of off-site compost additions to working lands (or beyond) are also important considerations, but accounting will need to carefully draw its boundaries around only the additional negative emissions from the off-site compost additions to avoid double counting and overinflating the value of the climate farming technique. Further study of integrating the compost and mulch produced by SB 1383 with climate farming will be important to both proper carbon accounting and to accurately incentivize utilizing off-site compost.
5.3.3 Policy implications
First, localized data from farms, orchards, pastures, and rangelands will be crucial to understanding the carbon storage benefits of different carbon farming techniques. There are significant uncertainties associated with the USDA and CDFA’s data that underlie the COMET planner tools,12,65 largely because soil systems are complex and nuanced and because soil carbon storage is highly dependent on local conditions.12,27,29 Thus, improved data for local agricultural productions would enhance the region’s understanding of agricultural carbon fluxes and would better inform carbon farming techniques and policies.
Second, cost data should be collected and incorporated into carbon farming analyses. Many carbon farming techniques are expensive because they require additional or specialized machinery. For example, no-till agriculture prevents soil carbon losses during tilling, but requires using specialized machinery for seeding. Conversely, compost application requires a much smaller investment into a tractor attachment and is therefore cheaper for the farmer while still offering climate farming benefits.52 Further, data collection can be costly and there is little economic incentive for farmers to independently engage in regular soil testing to track
i https://leginfo.legislature.ca.gov/faces/billNavClient.xhtml?bill_id=201520160SB1383

181
carbon storage.74 Thus, the costs of new equipment investments, marginal operating and management costs of carbon farming, and soil testing should be incorporated into cost-effectiveness and/or cost-benefit analyses to inform incentivizing or otherwise reducing the costs of carbon farming.
Third, farmer engagement in climate farming should be voluntary and incentivized. Investments in climate farming are not costless and farmers facing difficult financial decisions should not be required to engage in additional practices that would incur financial costs, like purchasing new equipment or hiring additional staff, and opportunity costs, like spending time on training or searching for equipment, employees, or technical help. Instead, the region should actively assist farmers who are able and willing to engage in climate farming and reduce the financial and time burdens associated with new techniques in order to maximize engagement and minimize costs to the farmer.
Finally, stakeholder input generally agreed that the incentive structures are not set up to incentivize carbon farming in the region. As Batra notes, farmers in unincorporated San Diego County face myriad economic challenges, including tree losses from climate change as well as tree losses from the increasing prices of water.52,74 There seems to be high agreement that local farmers need financial assistance in order to address their carbon emissions and to allow them to engage in carbon farming and that not providing assistance would place an undue burden on farmers and farming communities in the region. Policies addressing carbon farming will need to focus on incorporating farmers’ experiences, concerns, and cost data as well as accurately characterizing the co-benefits, like healthier soils, higher yields, better soil water and nutrient retention that lead to fewer necessary water and fertilizer inputs, in order to maximize carbon storage potential in an equitable manner.
5.3.4 Policy recommendations:
● Support incentivized climate farming in the region to promote agriculture’s unique ability among regional sectors to produce goods and negative emissions.
● Study local carbon farming techniques to better understand carbon storage and sequestration potential, costs, associated ecosystem services, and economic benefits.
● Consider incentivizing tree planting in and around agricultural lands and additionally incentivizing farmers to retain existing trees.
● Engage farmers and other stakeholders to create carbon farming policies that are equitable, just, and beneficial to farmers and farming communities.
● Support farmers and other stakeholders who are already engaged in climate farming to foster community knowledge sharing for carbon farming.
182
5.4 Blue carbon and sea level rise 5.4.1 Introduction
Blue carbon generally refers to the carbon storage and sequestration potential in vegetated coastal ecosystems, like eelgrass beds, marshes, wetlands, and mangrove forests, but it sometimes specifically refers to restoring vegetated coastal ecosystems in order to improve carbon sequestration and storage.20,39 Coastal ecosystems are known for their many ecosystem services, including many economically valuable services such as storm surge reduction, wave action and wind buffering, commercially important fish nursery habitats, and air and water quality improvements.20,66 These have historically been important reasons to protect and restore blue carbon and coastal ecosystems, but many coastal ecosystems are now being protected because they collectively store disproportionately high levels of carbon per unit area than the majority of ecosystems and store carbon on the order of millennia.38,41,75
The San Diego region historically contained over half of the Southern Californian Bight’s blue carbon habitats (~11,000 hectares), much of which was in the Mission and San Diego Bays. Since mapping efforts began around 1850, it is estimated that the San Diego region has lost approximately 69% of its historic wetlands through conversion to non-wetland systems like urban development.76 Wetlands throughout the region are susceptible to land use change, sea level rise, and invasive species, all of which would reduce or eliminate annual carbon sequestration and emit CO2 and methane that are stored in the soils.17,20,47,48 As with terrestrial carbon storage and sequestration, the primary methods of maintaining or enhancing blue carbon are through protection of existing wetland ecosystems and restoration of degraded or lost wetland ecosystems.
The San Diego region has lost eelgrass beds, salt marshes, mudflats, coastal riparian zones, and other intertidal zones39,48,76 and is expected to continue to lose these habitats into the future.42,46,60 Of these lost ecosystems, only some will be eligible for restoration,17,48 which highlights the importance of both protecting existing ecosystems and restoring degraded or lost ecosystems wherever possible.
There are strong economic reasons to prevent further wetland loss or degradation. First, wetland restoration results in less annual sequestration than comparable non-forest restoration, all while costing similar amounts or more.12,77 Therefore, protecting existing wetlands will be less expensive and more effective than restoring or mitigating wetland loss. Second, the one-time releases of stored CO2 and methane will be significant because wetlands have a higher density of carbon storage per unit area than other regional ecosystems,38,39,41 so the positive emissions from even geographically small lost wetlands will be significant and
183
attempting to offset those emissions would be costly. Third, wetland restoration is expensive, so it is economically important for the region to prevent wetland loss.12,21,22
Nevertheless, there are strong economic reasons to restore lost or degraded wetlands. First, an estimate by The Nature Conservancy of California found that wetland restoration in California would result in over $1 billion of avoided climate-related damages due to ecosystem services provided by expanded wetlands.17 This further highlights the importance of existing wetlands, which currently provide those services at no cost, and supports the need to study and invest in wetland restoration in the region. Second, while intact, healthy wetlands contribute meaningfully to negative emissions, degraded or inundated wetlands are predicted to emit more CO2 than they sequester. This could occur through sea level rise (SLR), land use change, or other natural or anthropogenic impacts. Wetland restoration and wetland migration, which is natural or anthropogenic land use change of upland ecosystems to wetlands as sea water inundation occurs, can mitigate some wetland loss and associated carbon emissions.42,47,48 Given the inevitability of SLR and of other impacts of climate change,78 restoring wetland and other blue carbon habitats will be important to blue carbon’s ongoing contributions regional negative emissions and to critical ecosystem services that can bolster coastal climate resilience.45,78,79
This analysis focused on wetlands and the potential loss of blue carbon habitats with SLR because regional wetlands are well mapped and the loss of wetlands with sea level rise is well studied. However, it is important to note that eelgrass habitats will also be affected by sea level rise, that eelgrass beds are critical blue carbon habitats, and that further study of eelgrass beds is critical to understanding regional NCSs (See Box 5.1).
Box 5.1 – Eelgrass
Eelgrass, which is also known as seagrass, grows in populations called eelgrass beds. Eelgrass beds are areas of shallow coastal and bay habitats where the dominant vegetation is Z. marina or Z. pacifica, are important blue carbon habitats.38,41,80 As with marshes, they sequester carbon as they grow and are capable of storing carbon in their immediate surroundings as tissue and as compounds deposited into sediments.38,81 Eelgrass is slightly less efficient at sequestering and storing carbon than marshes and other wetlands, but they play an important role in sequestering carbon and offer many unique co-benefits, like creating habitat for marine life, reducing turbidity, and improving water quality.38,80
Beyond the traditional carbon sequestration that plants provide, eelgrass beds offer two additional decarbonization benefits that are unique. First, eelgrass utilizes dissolved carbon in the water for photosynthesis. This dissolved carbon acidifies the water and is the primary driver behind the phenomenon of ocean acidification that causes ecological harm, perhaps most famously in leading to coral bleaching events. As such, eelgrass beds reduce the acidity of their immediate surroundings, which may offer some ecological benefits to other species and/or may facilitate additional drawdown of atmospheric CO2.81–83 Second, eelgrass is capable of transporting some of its sequestered carbon to

184
the deep ocean.40 This means that restoring and protecting eelgrass beds will ensure that, on average, some fraction of the sequestered carbon will be locked away in the deep ocean for thousands to tens of thousands of years.40 Thus, eelgrass beds can offer some of the only NCSs that are virtually permanent.
Eelgrass beds are also unique because they may potentially benefit from more CO2 rich waters because it increases the carbon that is bioavailable to it. The excess CO2 from the atmosphere dissolves into the ocean and forms a weak acid which creates the “ocean acidification” phenomenon where global ocean pH has shifted to be more acidic.84 While most marine plants, algae, and animals are reacting negatively to ocean acidification, there is some evidence that eelgrasses are potentially limited by carbon availability and that their growth, and thus their carbon sequestration and storage potential, may increase with increasing ocean acidity because there is more carbon available for photosynthesis.82
Although eelgrass beds are submerged, they require sunlight to penetrate strongly enough through the water column to fuel photosynthesis and will thus be impacted by sea level rise. Studies by Merkel & Associates, Inc. for the Port of San Diego and U.S. Navy Region Southwest Naval Facilities Engineering Command (who jointly manage the San Diego Bay) and for the City of San Diego (who manages Mission Bay) have shown that water depth is a primary factor that limits eelgrass distribution in the region’s bays and inland water systems.55,57 This suggests that SLR may make some current eelgrass beds too deep for eelgrass, while SLR may simultaneously create new eelgrass habitat out of newly submerged marsh, wetland, or upland habitats. Overall, the impacts of sea level rise on eelgrass is less certain and monitoring efforts should be applied to understand the impacts.
The San Diego region has coastal and inland bay eelgrass beds, but the former are in state waters and are outside of the jurisdictional boundaries of San Diego governments. The Port of San Diego and the Navy have jurisdiction over the eelgrass beds in the San Diego Bay and the City of San Diego has jurisdiction over the eelgrass beds in Mission Bay.55,57
Eelgrass surveys and assessments for both the San Diego and Mission Bays have occurred for several decades. These surveys estimated changes over time to eelgrass bed distribution and found that eelgrass cover has changed significantly over time, with population blinking in and out.55,57,85 This suggests that newer data will be important for understanding the current extent of eelgrass beds and the associated NCSs. To this end, the Port of San Diego was awarded a $150,000 federal grant to study the San Diego Bay’s eelgrass beds and the associated carbon sequestration in the San Diego Bay.86 This study will be invaluable in helping regional agencies and authorities understand the negative emissions of eelgrass beds.
5.4.3 Results
The 1 foot of sea level rise that is anticipated to occur between 2030 and 2050 is projected to result in a loss or ecosystem change of nearly 800 hectares of blue carbon habitats throughout the region, an area approximately 1.4 times the size of downtown San Diego (Table 5.3, Figure 5.5).88 One foot of sea level rise will endanger approximately 180,112 MT CO2e that is currently stored in marsh and wetland plants and soils. Some of this would be emitted directly into the

185
atmosphere.42 Additionally, if all 800 hectares of susceptible blue carbon habitats are lost (i.e., if they do not change to eelgrass beds or other habitats), then the lost habitats would have been able to sequester approximately 1,715 MT CO2e per year (Table 5.3). In order to offset these one-time emissions and to sequester the CO2 that would have been sequestered, a comparable level of new wetlands, marshes, and riparian habitats would need to be restored prior to wetland inundation. However, such restoration efforts would merely allow the region to break even by sequestering as much as is being emitted from blue carbon habitats.
Figure 5.5. Some blue carbon habitats will be lost under 1 foot of sea level rise in the San Diego region. Blue areas in the map show such habitats, which are quantified by ecosystem category in Table 5.3. Insets show more detail of two regions with blue carbon losses.

186
Table 5.3. Total lost habitat (hectares), annual carbon sequestration (metric tonnes per year), and long-term storage (metric tonnes emitted upon loss) per blue carbon vegetation class.
Vegetation classification
Total area lost with 1 foot of SLR (ha)
Maximum lost annual sequestration (MT CO2e
yr-1)
Endangered carbon storage (MT CO2e)
Freshwater marsh 20 28 3,020
Mudflats/Saltpans 22 44 5,082
Riparian scrub 14 60.2 1,400
Salt marsh/estuary 726 1,582.68 170,610
Total terrestrial blue carbon ecosystems
782 1,714.88 180,112
5.4.4 Discussion
As in the case of regional land use change in forests and non-forest terrestrial ecosystems, protecting wetlands, marshes, mudflats, and riparian habitats from loss is the first-best option because doing so both protects existing stored carbon stocks and ensures annual carbon capture and sequestration. Protection of existing blue carbon habitats is especially important because they hold larger quantities of carbon per unit area and for longer periods of time than San Diego’s forest and non-forest ecosystems.38,56,60,77 Restoring lost or degraded blue carbon habitats and enhancing existing blue carbon habitats will also be important because failing to do so may result in greater carbon losses with SLR or other impacts.
Protecting, restoring, and enhancing blue carbon habitats can take many forms and will be specific to each system. For example, the Kendall-Frost marsh in the northeast corner of Mission Bay can be expanded such that it reconnects with Rose Creek, which would provide sediment and freshwater inputs, both of which would naturally protect the marsh from some of the effects of sea level rise.89 The active restoration of lost marsh habitat in Mission Bay would thus serve to both increase carbon storage and sequestration in Mission Bay while improving existing habitat quality and resilience.89–91 Jurisdictions that utilize this NCS should utilize the most recent and localized data possible for their systems in order to maximize the systems’ sequestration and storage potential.
Unlike regional land use change, which can generally be planned for and can thereby be reasonably prevented, blue carbon ecosystem loss is inevitable given current estimations of sea level rise and the dearth of options to prevent sea water inundation and flooding in low-lying areas and ecosystems.20,42,46 Restoring or enhancing NCSs in other ecosystems in order to offset the anticipated losses of blue carbon ecosystems will be expensive and likely impractical, given

187
the challenges of large-scale habitat restoration,12,17,53 expanding existing blue carbon habitats, and thus allow for so-called wetland migration, and protecting existing blue carbon habitats from land use change will be important NCSs in the region.
5.4.5 Policy implications
Wetland, marsh, and mudflat losses will significantly impact the ability of the region’s NCSs to contribute to negative emissions. Local carbon sequestration and storage data for marshes, wetlands, and eelgrass from organizations like the Scripps Institution of Oceanography (pers. comm., Dr. Matthew Costa, July 22, 2021) and from the Port of San Diego are forthcoming,86, 91 which will improve the analysis of anticipated impacts from sea level rise. Nevertheless, the unique threats of sea level rise and the eventual emissions from blue carbon and other low-lying ecosystems should be accounted for in decarbonization plans, even if data are imperfect.
5.4.6 Policy recommendations:
● Protect existing carbon storage pools and annual sequestration in blue carbon ecosystems from anthropogenic land use change.
● Collaborate with organizations and governments to study the feasibility and costs of wetland migration, wetland restoration, and carbon sequestration enhancement in existing wetlands. Collaborate regionally and inter-jurisdictionally to implement blue carbon restoration where feasible and possible.
● Collaborate with organizations and governments to study local blue carbon values to improve blue carbon accounting in the region.
5.5 Urban trees
5.5.1 Introduction
Urban trees are those trees which exist within urban boundaries and were either planted or are somehow maintained.92–94 Trees are often planted in urban settings because they provide ecosystem services like reducing air pollution, providing shade that cools buildings, reducing urban stormwater runoff, increasing aesthetic value, reducing noise, and other services.17,92,93 However, urban trees are also being recognized for their contributions to negative CO2 emissions because their growth reduces atmospheric CO2.17,95,96 Urban trees provide the only NCSs for urban areas and settlements that have replaced NWLs, so it is critical for such areas to have urban trees to produce negative emissions in lieu of natural landscapes. Further, these trees also provide co-benefits like ecosystem services that were lost to land use change and can provide these and other co-benefits to communities, including and especially those that are
188
disproportionately affected by poor air quality, high temperatures, and little shade or green space.17,92
There are, however, some important caveats to urban forestry that are worth consideration in the San Diego region and elsewhere. First, urban trees are more stressed than their wild counterparts and thus have shorter lifespans on average, though they can still sequester carbon for more than 40 years.97 The shorter lived urban trees will require more frequent replacement than naturally occurring trees in natural landscapes, which will need to be factored into planning. Second, if urban trees require large inputs, like water and fertilizers, that in turn require fossil-fuel based inputs, like energy or synthetic fertilizers, then urban forests can be net emitters because their care can require more CO2 emissions than they can sequester.97 Third, the species of tree planted has large implications for carbon sequestration, life expectancy, water and maintenance needs, and potential co-benefits, highlighting the importance of careful tree selection based on local conditions and needs.97–99 Fifth, as trees reach the end of their lives, they will need to be replaced in order for the urban forest to continue to provide services. Thus, tree planting goals may be too low as urban forests age and die.100 Finally, urban greening often focuses on trees because of their ability to provide unique services like shading and subsequent cooling, but regional greening should also include plans to plant native or non-native drought tolerant shrubs and plants. These plants can offer aesthetic value, air pollution mitigation, water quality improvements, improved habitat and biodiversity, and carbon storage all while generally requiring fewer inputs than trees.17,92,101
5.5.2 Discussion
In a 2003 San Diego regional analysis, the non-profit American Forests produced a report of the tree cover in the City of San Diego and 22 surrounding cities and communities and found that, collectively, these urban forests stored 640,846 MT of carbon and sequestered 4,864 MT of carbon annually.92 Despite the significant sequestration and storage values, the study region lost 29% of its tree cover from 1985 to 2002.92 While California as a whole has steadily gained tree cover and urban carbon sequestration since 1990,95,102 the San Diego region has not seen similar gains and thus has the potential to create substantial negative emissions through expanding urban tree cover.17,92,100
A 2021 national report by American Forests projected carbon storage and sequestration based on anticipated tree plantings and assuming a 1% die back rate of existing trees using current carbon storage and sequestration values, recognizing that there will be climate-related feedbacks to tree growth and life expectancy in response to localized climate change.100 The report found that San Diego County is expected to increase its urban tree carbon storage by approximately 6 MMT of carbon and to increase its annual sequestration rate by 0.32 MMT of carbon per year from 2010-2060 through urban tree expansion alone.100 The report also noted
189
that the San Diego region is expected to see an increase in avoided emissions as urban trees are expected to reduce electricity use for cooling, though, importantly, there will be increased emissions with urban expansion and overall avoided emissions will be reduced through the loss of natural lands.100
An analysis by The Nature Conservancy of California found that the San Diego region had 111,763 acres of urban land that was suitable for urban forestry or other greening.17,103 At an average sequestration rate of approximately 7 MT of CO2e per acre per year, the report estimates that fully foresting the San Diego region’s urban areas would result in over 2 MMT CO2e of annual sequestration.17,103 This roughly equals the estimated annual sequestration in Section 5.2, though it is important to note that the costs associated with planting such an extensive urban forest in the region would be significant. This is due to both 1) the upfront costs of purchasing saplings, trees, or seeds in addition to the labor to initially plant that many trees and 2) the ongoing marginal costs of maintaining an urban tree, which are higher than maintaining a tree in NWLs (see Fargione et al., 202153 for a discussion of some of the costs of producing and planting a large number of trees). Additionally, as the region’s climate changes, hotter, drier conditions may increase the water input costs and/or the urban tree mortality rate, which would decrease the sequestration potential.
Though these estimates are rough because they are not based on extensive field data and there are some notable points of consideration for urban forestry, the Nature Conservancy’s estimates still highlight the importance of greening the region’s urban areas as an NCS. As cities and municipalities throughout the region set and achieve tree planting goals, it will be important to account for accurate, localized carbon stock and sequestration values based on species, tree age, tree health, and growing conditions. Additionally, it will be important for urban areas to account for both the electricity savings due to trees’ cooling effects and to account for the emissions from inputs like watering, tree care, fertilizers, etc.
5.5.3 Policy Implications
Urban forestry is an important NCS for urban and developed areas because they can sequester and store carbon in an environment that is otherwise unable to provide negative emissions and can replace some of the natural sequestration and storage that was lost.92 Their numerous co-benefits and their ability to increase equity and improve social welfare through air and water quality improvements, cooling effects, aesthetic improvements, and more are also important reasons to increase urban canopy cover and urban tree distribution.101,104 However, as a NCS, urban trees pale in comparison to natural systems, so the first best choice from a decarbonization perspective is to protect and enhance natural systems, which are more efficient systems for generating negative emissions, rather than expand urban areas and create an urban forest.12,17,21,29,100
190
Nevertheless, there are ways to increase urban tree carbon sequestration and storage potential and maximize their value to negative emissions. First, governments can choose tree species and adjust tree management practices to maximize carbon benefits. Ideally, species would be low-water, long-lived, low-maintenance, and large trees that are well-suited for the local climate.97 This choice could increase the lifetime of the tree, increase the lifetime of carbon storage, and reduce lifetime, carbon-intensive inputs like water. Second, governments can plan or encourage private landowners to plan tree locations to maximize cooling effects on structures or surfaces.97 It is important to note that these locations need to be carefully balanced with providing defendable space for those areas which are prone to fires or otherwise have increased fire risks. Third, governments can empower and encourage local communities to collect data on trees in their areas to inexpensively improve overall urban tree data.92 These data can inform distribution, size, and species urban forest information that can aid decision-makers in crafting urban forestry policies that will increase carbon storage and sequestration while providing local co-benefits equitably. Fourth, there are funding opportunities from the state that the region can utilize and there are initiatives in other regions and states that the San Diego region can imitate. For example, CARB has provided funding in the past for urban tree planting and funding available for such efforts should be utilized by regional authorities when possible.105 Additionally, Washington State’s investments in urban forestry can serve as an example to local jurisdictions for structuring funding and implementation plans.106
5.5.4 Policy recommendations:
● Plant trees that maximize lifetime net negative emissions and net carbon storage. ● Plan tree planting locations in public spaces to maximize co-benefits like shade and
provide information and education to private landowners to assist in tree planting location choices on private land.
● Actively (government led) and/or passively (community led) collect data on urban forests.
● Protect existing trees from dying to extend carbon sequestration and storage.
5.6 Additional Natural Climate Solutions
There are other NCSs that are applicable to the region but that were not investigated in this report, either due to a lack of local data or due to their limited applicability for either negative emissions or for geographic extent. Nevertheless, they may be important to some areas, they may become more important in the future, or more data and research may elucidate their negative emissions value in the future.
191
5.6.1 Tree planting in public, non-urban lands
It is important to note that there are ongoing restoration efforts throughout the region that focus on planting native trees in areas that have lost trees. Data for tree planting in the region is occurring on tribal, private, state, federal, and local lands, though there are no comprehensive datasets detailing these efforts. Some data are being collected, but they may not yet be complete or publicly available. As an example, the County of San Diego’s Department of Parks and Recreation (DPR) has instituted two tree-centered NCS programs in County-owned and managed public lands. First, DPR has a program to protect old, large trees from death and disease during prolonged drought periods.107 Under the conditions associated with severe and/or prolonged droughts, trees become more susceptible to death or disease, and losing older trees has disproportionately large impacts on carbon sequestration and storage. In general, older trees are larger and larger trees have higher annual sequestration rates and store more carbon in any given year and in their lifetimes.108 By protecting these trees, DPR has an outsized impact on the negative emissions where those trees are. Second, DPR has a tree planting program that is working to plant trees in County parks and preserves in order to increase negative emissions.i This program has the goal to plant at least 3,500 trees a year and to replace every dead or dying tree with three new trees. In this way, the program will mitigate tree loss and strengthen carbon sequestration into the future. Additionally, this program provides an excellent model for NCSs in the region because of its focus on planting native species.109,110 Native species are likely to be more resilient into the future because they have evolved to live in the region and may be less susceptible to drought, more adapted to seasonal resource availability, and better able to provide co-benefits like biodiversity or habitat for native species.32,97,109
As more data on tree planting and restoration efforts on public, private, and tribal lands become available, they can be integrated into negative emissions estimates and can facilitate decision-making, which may include incentives to engage in or continue such NCSs.
5.6.2 Non-forest management
Despite the fact that the region is dominated by chaparral, coastal sage scrub, and other shrub habitats, there are few resources available for so-called non-forest management, which is management of shrub-dominated habitats, savannahs, woodlands, or other non-forest ecosystems. Conversely, forest management, which includes actions like thinning or prescribed burns to manage forest health and minimize large wildfire risk, is well studied. As such, non-
i This tree planting program is a part of the County’s 2018 CAP. Although the CAP was not formally approved, the tree planting program has continued to increase negative emissions, offer co-benefits to the unincorporated areas, and meet or exceed goals. This program was analyzed in Chapter 9’s CAP analysis and is one of the few examples of how NCSs were incorporated into CAP planning. More details on CAP contributions to regional decarbonization commitments can be found in Chapter 8 section 8.8.

192
forest management practices were not investigated in this chapter. However, there are many agencies and jurisdictions in the region that are managing non-forest ecosystems and the associated changes to carbon storage or sequestration resulting from this management should be studied and accounted for in regional NCSs.
Among the non-forest management techniques that could be researched and investigated are invasive species management, with a focus on non-native, annual grasses and forbs. Local studies have demonstrated that chaparral systems that are invaded by non-native, annual grasses have diminished sequestration and storage potential,30 so managing these grasses and other non-native plant species can enhance regional NCSs. Further, non-native, annual plant species invasions are correlated with increased fire risk and increased fire intensity because they provide fuel between shrubs and that may lead to a larger fire footprint and/or hotter fires.37,111 Frequent and/or hot wildfires can contribute to ecosystem shifts and habitat loss, both of which may reduce a landscape’s overall carbon storage capacity and/or its annual sequestration potential.34,37,44 Finally, non-forest management techniques that minimize invasive plant species cover can also help chaparral and scrub ecosystems rebound after a wildfire and resume carbon sequestration faster.34,37 A large seedbank of non-native species can hinder native seedling growth, so managing for invasive species can assist in ecological resilience.37
5.6.3 Fire management
In addition to the non-native, invasive plant species management impacts on reducing wildfire frequency and/or intensity, other fire management techniques can prevent or minimize carbon emissions from wildfires. Given that nearly every contemporary wildfire in San Diego county has been ignited by a human-related source,35 preventing anthropogenic ignitions is critical to reducing the impacts of wildfires. Some wildfire prevention and management strategies include road, infrastructure, or home hardening, which can both minimize sparks from vehicle or infrastructure ignition sources that can start wildfires and simultaneously minimize property damage and/or loss.112–114 These management techniques are ongoing in the region and there are opportunities to expand them through education campaigns and to better understand the NCSs associated with reducing wildfire intensity and/or frequency in the San Diego region.
5.7 Regional Natural Climate Solutions Policy Recommendations and Conclusions
As the County of San Diego and other governments in the San Diego region plan for decarbonization in order to meet net zero emission goals, NCSs will be an important part of the decarbonization pathway. Natural climate solutions and natural and working lands contribute

193
to decarbonization through sequestering atmospheric carbon annually and through storing atmospheric CO2 in plant tissues for the medium to long-term. However, NWLs can also contribute to regional emissions when they are lost due to development, natural disasters like wildfires, or climate change induced ecosystem changes like sea level rise. General policy recommendations for carbon sequestration and storage through NCSs follow.
5.7.1 Sequestration
The simplest, cheapest, most effective regional policy to contribute to NCSs is to prevent land use change and allow NWLs to continue to sequester carbon naturally. The San Diego region has a large quantity of conserved lands and has plans to conserve more lands,54 so continuing to protect conserved lands and expanding protections to additional lands will provide annual carbon sequestration and low to no cost negative emissions of more than 2 million tons of CO2e stored annually. Other NCSs like reforestation, forest management, or other restoration techniques, are typically highly effective at removing CO2, but they are almost universally more expensive than merely protecting existing lands.21,22 The County, as well as other governments and agencies in the region like tribal governments and federal agencies, can contribute to regional net negative emissions through preventing land use change among their NWLs. In addition to continuing conservation and preservation efforts, governments can research or partner with research groups to better characterize the carbon sequestration potential in the region’s NWLs. Doing so will allow for better carbon accounting and reduced uncertainties and will also help inform better management policies and practices to maximize NCSs.
Next, regional governments can research and incentivize carbon farming techniques like compost application, riparian restoration, and orchard tree retention. Additional research should investigate how rangeland tree planting, no-till agriculture, crop choice, manure management, and grazing/livestock feed management affect agricultural emissions. Carbon farming is widely considered to be the best way to transform the agricultural sector from a carbon source to a carbon sink and will likely be important for the San Diego region’s decarbonization efforts.12,22,43,52
Wetlands, marshes, and other blue carbon ecosystems contribute less to annual sequestration than tree and shrub-dominated ecosystems, but they nevertheless play an important role in total carbon sequestration. Protecting these systems from land use change and restoring them will contribute to continuing sequestration in the near-term. Restoration of surrounding habitats may allow blue carbon habitats to migrate as sea level rise inundates coastal areas, thereby allowing blue carbon systems to continue to sequester carbon in the medium and long-term.
Last, local governments should continue to increase urban tree canopy cover because these trees make urban and other settlement areas carbon sinks (Table 5.2). Additionally,

194
governments can study tree species and location selections to maximize carbon sequestration rates, minimize inputs like water, and maximize co-benefits. The latter will be especially important as governments pursue environmental justice policies that aim to provide public goods to disadvantaged and low-income communities.
There are additional NCSs to increase sequestration rates that were not investigated here but which are important to consider and study. For example, while forest management is not widely applicable in the region, non-forest management of chaparral and scrub ecosystems may improve regional sequestration rates and should be investigated for effectiveness and cost.
5.7.2 Storage
As with carbon sequestration, the simplest and cheapest way to maintain the naturally stored carbon is to protect NWLs from land use change. By protecting existing carbon storage, the region can prevent large one-time emissions from land use change. Beyond protecting lands from deliberate land use change, governments can research carbon storage values in the region to characterize the magnitude of stored carbon. Such efforts would elucidate the role of NWLs in helping the region understand long-term land use carbon accounting under different development strategies.
Similarly, blue carbon ecosystems are particularly adept at storing large quantities of carbon and are therefore disproportionately vulnerable to large emissions if they are lost. Wetlands, marshes, and other coastal systems should be actively protected from land use change to settlements and should be restored and enhanced when possible in order to increase coastal carbon storage and to prepare for loss due to sea level rise. Researching blue carbon ecosystems would provide similar relevant information as researching other land uses in the region and would similarly inform emissions under different development and restoration strategies.
Agricultural lands hold carbon primarily in trees, like orchard trees, and in soils. Some carbon farming techniques, like composting and riparian restoration, are likely to increase stored carbon in agricultural lands. These techniques, and other carbon farming techniques, will have variable effects by locality, and should thus be researched and characterized. Regardless of carbon farming, agricultural lands store more carbon than barren landscapes or settlements that do not have urban trees. As such, preventing land use change can also be an important measure in active, productive agricultural lands.
Urban trees and vegetation lead to the only carbon storage that occurs in settlements and urban areas. These trees, shrubs, and other green spaces are not as efficient at storing carbon as the native ecosystems that were historically present, however, they still provide medium-

195
term carbon storage and should be protected and expanded. There are important opportunities for communities to invest in maintenance of existing trees so overall mortality is reduced. Carbon storage and other ecosystem services are highest with mature trees, and it will take newly planted trees significant time to provide the carbon and ecosystem services of the older tree that it has replaced. However, some mortality is inevitable, and as urban trees die, they should be replaced with appropriate species to maximize total carbon storage as well as carbon storage longevity while also minimizing lifetime inputs, like water.97
Finally, some NCSs that can protect or enhance carbon storage were not included here but are still important to consider. For instance, wildfire prevention via educational programs and infrastructure hardening will reduce wildfire emissions and will allow natural systems to regenerate after wildfires and recover the emitted carbon as plants regrow.34
5.7.3 Uncertainty and future research
This report’s analyses have some important uncertainties. These primarily come from the fact that localized carbon storage and sequestration data are largely unavailable. This is problematic because local climate, prevailing fire regimes, ecosystem composition, and environmental stressors like drought have significant impacts on any given local NCS effectiveness. Regional governments should utilize the most recent and localized data possible when estimating NCSs’ contributions to decarbonization. Data on local chaparral and blue carbon storage and sequestration are forthcoming.i These data will be critical to understanding valuing regional land contributions to negative emissions and long-term carbon storage.
Additionally, regional governments should quantify the full breadth of co-benefits and ecosystem services provided by NWLs, carbon farming, blue carbon, and urban forestry. In particular, water savings, ground water recharging, air and water quality improvements, equity improvements, property damage reductions from storm surges and other natural phenomenon, biodiversity protection, climate and other refugia protection, and wildfire prevention should be considered, quantified, and maximized in addition to carbon sequestration and storage.
i Personal communication with Zachary Plopper, Dr. Meagan Jennings, and Dr. Matthew Costa, 2021.
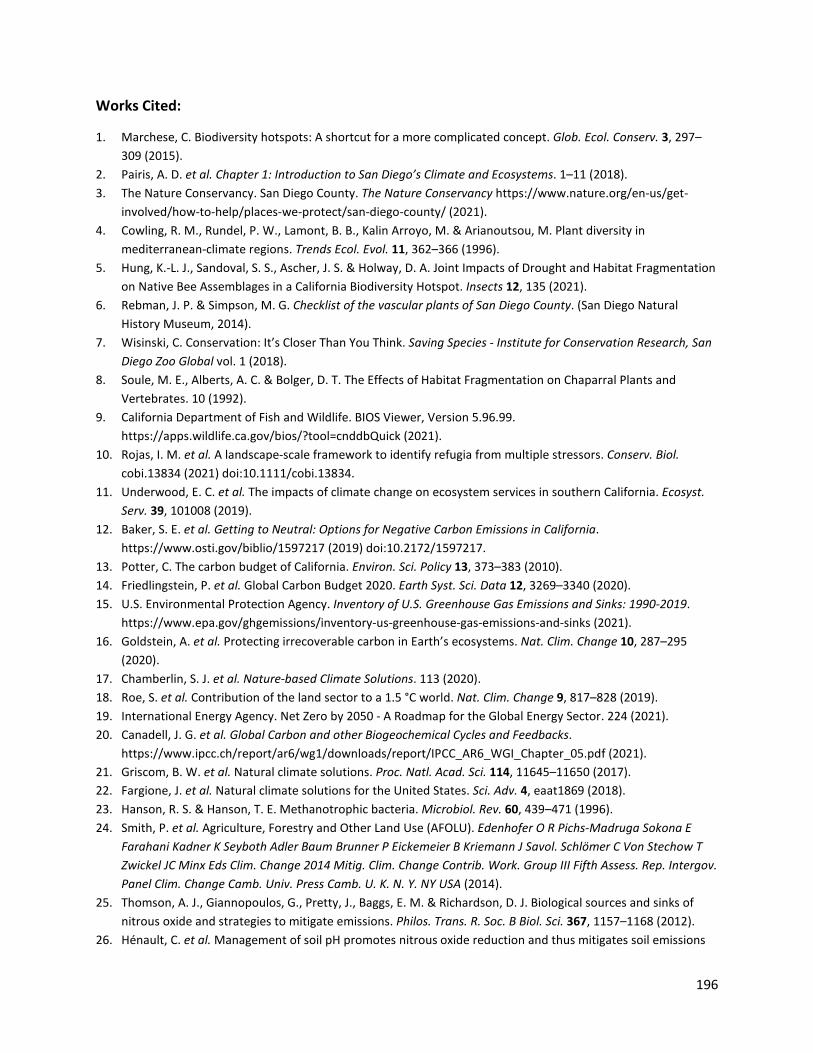
196
Works Cited:
1. Marchese, C. Biodiversity hotspots: A shortcut for a more complicated concept. Glob. Ecol. Conserv. 3, 297–309 (2015).
2. Pairis, A. D. et al. Chapter 1: Introduction to San Diego’s Climate and Ecosystems. 1–11 (2018). 3. The Nature Conservancy. San Diego County. The Nature Conservancy https://www.nature.org/en-us/get-
involved/how-to-help/places-we-protect/san-diego-county/ (2021). 4. Cowling, R. M., Rundel, P. W., Lamont, B. B., Kalin Arroyo, M. & Arianoutsou, M. Plant diversity in
mediterranean-climate regions. Trends Ecol. Evol. 11, 362–366 (1996). 5. Hung, K.-L. J., Sandoval, S. S., Ascher, J. S. & Holway, D. A. Joint Impacts of Drought and Habitat Fragmentation
on Native Bee Assemblages in a California Biodiversity Hotspot. Insects 12, 135 (2021). 6. Rebman, J. P. & Simpson, M. G. Checklist of the vascular plants of San Diego County. (San Diego Natural
History Museum, 2014). 7. Wisinski, C. Conservation: It’s Closer Than You Think. Saving Species - Institute for Conservation Research, San
Diego Zoo Global vol. 1 (2018). 8. Soule, M. E., Alberts, A. C. & Bolger, D. T. The Effects of Habitat Fragmentation on Chaparral Plants and
Vertebrates. 10 (1992). 9. California Department of Fish and Wildlife. BIOS Viewer, Version 5.96.99.
https://apps.wildlife.ca.gov/bios/?tool=cnddbQuick (2021). 10. Rojas, I. M. et al. A landscape-scale framework to identify refugia from multiple stressors. Conserv. Biol.
cobi.13834 (2021) doi:10.1111/cobi.13834. 11. Underwood, E. C. et al. The impacts of climate change on ecosystem services in southern California. Ecosyst.
Serv. 39, 101008 (2019). 12. Baker, S. E. et al. Getting to Neutral: Options for Negative Carbon Emissions in California.
https://www.osti.gov/biblio/1597217 (2019) doi:10.2172/1597217. 13. Potter, C. The carbon budget of California. Environ. Sci. Policy 13, 373–383 (2010). 14. Friedlingstein, P. et al. Global Carbon Budget 2020. Earth Syst. Sci. Data 12, 3269–3340 (2020). 15. U.S. Environmental Protection Agency. Inventory of U.S. Greenhouse Gas Emissions and Sinks: 1990-2019.
https://www.epa.gov/ghgemissions/inventory-us-greenhouse-gas-emissions-and-sinks (2021). 16. Goldstein, A. et al. Protecting irrecoverable carbon in Earth’s ecosystems. Nat. Clim. Change 10, 287–295
(2020). 17. Chamberlin, S. J. et al. Nature-based Climate Solutions. 113 (2020). 18. Roe, S. et al. Contribution of the land sector to a 1.5 °C world. Nat. Clim. Change 9, 817–828 (2019). 19. International Energy Agency. Net Zero by 2050 - A Roadmap for the Global Energy Sector. 224 (2021). 20. Canadell, J. G. et al. Global Carbon and other Biogeochemical Cycles and Feedbacks.
https://www.ipcc.ch/report/ar6/wg1/downloads/report/IPCC_AR6_WGI_Chapter_05.pdf (2021). 21. Griscom, B. W. et al. Natural climate solutions. Proc. Natl. Acad. Sci. 114, 11645–11650 (2017). 22. Fargione, J. et al. Natural climate solutions for the United States. Sci. Adv. 4, eaat1869 (2018). 23. Hanson, R. S. & Hanson, T. E. Methanotrophic bacteria. Microbiol. Rev. 60, 439–471 (1996). 24. Smith, P. et al. Agriculture, Forestry and Other Land Use (AFOLU). Edenhofer O R Pichs-Madruga Sokona E
Farahani Kadner K Seyboth Adler Baum Brunner P Eickemeier B Kriemann J Savol. Schlömer C Von Stechow T Zwickel JC Minx Eds Clim. Change 2014 Mitig. Clim. Change Contrib. Work. Group III Fifth Assess. Rep. Intergov. Panel Clim. Change Camb. Univ. Press Camb. U. K. N. Y. NY USA (2014).
25. Thomson, A. J., Giannopoulos, G., Pretty, J., Baggs, E. M. & Richardson, D. J. Biological sources and sinks of nitrous oxide and strategies to mitigate emissions. Philos. Trans. R. Soc. B Biol. Sci. 367, 1157–1168 (2012).
26. Hénault, C. et al. Management of soil pH promotes nitrous oxide reduction and thus mitigates soil emissions
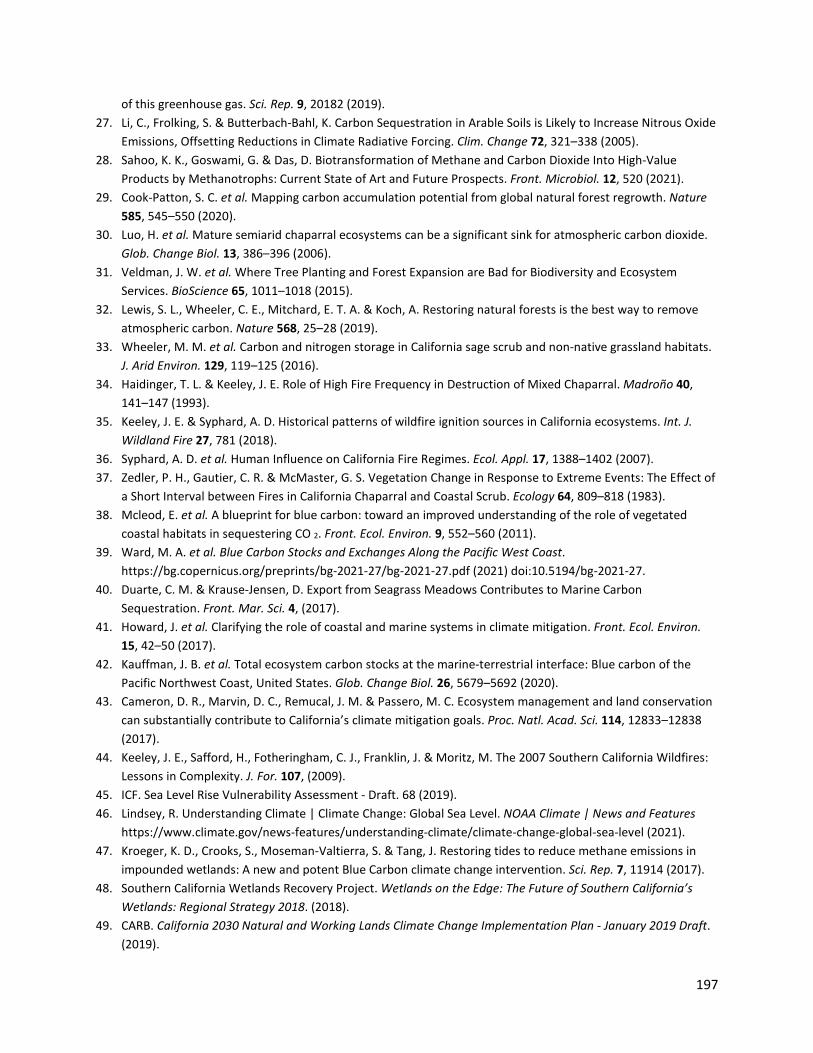
197
of this greenhouse gas. Sci. Rep. 9, 20182 (2019). 27. Li, C., Frolking, S. & Butterbach-Bahl, K. Carbon Sequestration in Arable Soils is Likely to Increase Nitrous Oxide
Emissions, Offsetting Reductions in Climate Radiative Forcing. Clim. Change 72, 321–338 (2005). 28. Sahoo, K. K., Goswami, G. & Das, D. Biotransformation of Methane and Carbon Dioxide Into High-Value
Products by Methanotrophs: Current State of Art and Future Prospects. Front. Microbiol. 12, 520 (2021). 29. Cook-Patton, S. C. et al. Mapping carbon accumulation potential from global natural forest regrowth. Nature
585, 545–550 (2020). 30. Luo, H. et al. Mature semiarid chaparral ecosystems can be a significant sink for atmospheric carbon dioxide.
Glob. Change Biol. 13, 386–396 (2006). 31. Veldman, J. W. et al. Where Tree Planting and Forest Expansion are Bad for Biodiversity and Ecosystem
Services. BioScience 65, 1011–1018 (2015). 32. Lewis, S. L., Wheeler, C. E., Mitchard, E. T. A. & Koch, A. Restoring natural forests is the best way to remove
atmospheric carbon. Nature 568, 25–28 (2019). 33. Wheeler, M. M. et al. Carbon and nitrogen storage in California sage scrub and non-native grassland habitats.
J. Arid Environ. 129, 119–125 (2016). 34. Haidinger, T. L. & Keeley, J. E. Role of High Fire Frequency in Destruction of Mixed Chaparral. Madroño 40,
141–147 (1993). 35. Keeley, J. E. & Syphard, A. D. Historical patterns of wildfire ignition sources in California ecosystems. Int. J.
Wildland Fire 27, 781 (2018). 36. Syphard, A. D. et al. Human Influence on California Fire Regimes. Ecol. Appl. 17, 1388–1402 (2007). 37. Zedler, P. H., Gautier, C. R. & McMaster, G. S. Vegetation Change in Response to Extreme Events: The Effect of
a Short Interval between Fires in California Chaparral and Coastal Scrub. Ecology 64, 809–818 (1983). 38. Mcleod, E. et al. A blueprint for blue carbon: toward an improved understanding of the role of vegetated
coastal habitats in sequestering CO 2. Front. Ecol. Environ. 9, 552–560 (2011). 39. Ward, M. A. et al. Blue Carbon Stocks and Exchanges Along the Pacific West Coast.
https://bg.copernicus.org/preprints/bg-2021-27/bg-2021-27.pdf (2021) doi:10.5194/bg-2021-27. 40. Duarte, C. M. & Krause-Jensen, D. Export from Seagrass Meadows Contributes to Marine Carbon
Sequestration. Front. Mar. Sci. 4, (2017). 41. Howard, J. et al. Clarifying the role of coastal and marine systems in climate mitigation. Front. Ecol. Environ.
15, 42–50 (2017). 42. Kauffman, J. B. et al. Total ecosystem carbon stocks at the marine-terrestrial interface: Blue carbon of the
Pacific Northwest Coast, United States. Glob. Change Biol. 26, 5679–5692 (2020). 43. Cameron, D. R., Marvin, D. C., Remucal, J. M. & Passero, M. C. Ecosystem management and land conservation
can substantially contribute to California’s climate mitigation goals. Proc. Natl. Acad. Sci. 114, 12833–12838 (2017).
44. Keeley, J. E., Safford, H., Fotheringham, C. J., Franklin, J. & Moritz, M. The 2007 Southern California Wildfires: Lessons in Complexity. J. For. 107, (2009).
45. ICF. Sea Level Rise Vulnerability Assessment - Draft. 68 (2019). 46. Lindsey, R. Understanding Climate | Climate Change: Global Sea Level. NOAA Climate | News and Features
https://www.climate.gov/news-features/understanding-climate/climate-change-global-sea-level (2021). 47. Kroeger, K. D., Crooks, S., Moseman-Valtierra, S. & Tang, J. Restoring tides to reduce methane emissions in
impounded wetlands: A new and potent Blue Carbon climate change intervention. Sci. Rep. 7, 11914 (2017). 48. Southern California Wetlands Recovery Project. Wetlands on the Edge: The Future of Southern California’s
Wetlands: Regional Strategy 2018. (2018). 49. CARB. California 2030 Natural and Working Lands Climate Change Implementation Plan - January 2019 Draft.
(2019).

198
50. IPCC. Summary for Policymakers. In: Climate Change and Land: an IPCC special report on climate change, desertification, land degradation, sustainable land management, food security, and greenhouse gas fluxes in terrestrial ecosystems s [P.R. Shukla, J. Skea, E. Calvo Buendia, V. Masson-Delmotte, H.- O. Pörtner, D. C. Roberts, P. Zhai, R. Slade, S. Connors, R. van Diemen, M. Ferrat, E. Haughey, S. Luz, S. Neogi, M. Pathak, J. Petzold, J. Portugal Pereira, P. Vyas, E. Huntley, K. Kissick, M. Belkacemi, J. Malley, (eds.)]. In press. https://www.ipcc.ch/site/assets/uploads/sites/4/2020/02/SPM_Updated-Jan20.pdf (2019).
51. Millan, B., Marsden, M. & Vasilakis, M. Solving Sprawl: Building Housing for a Sustainable and Equitable San Diego . (2021).
52. Batra, P. Linking Climate-Friendly Farming Practices to San Diego County’s Climate Action Plan: An Opportunity Analysis of Carbon Farming in the Unincorporated County. (2018).
53. Fargione, J. et al. Challenges to the Reforestation Pipeline in the United States. Front. For. Glob. Change 4, 629198 (2021).
54. SANDAG. The 2021 Regional Plan - Appendix AA: Regional Habitat Conservation Vision. https://sdforward.com/mobility-planning/2021-regional-plan-draft (2021).
55. Merkel & Associates, Inc. 2017 San Diego Bay Eelgrass Inventory. (2018). 56. Ward, M. A. et al. Blue carbon stocks and exchanges along the California coast. Biogeosciences 18, 4717–4732
(2021). 57. Merkel & Associates, Inc. Eelgrass Mitigation and Monitoring Plan in Support of the Mission Bay Park
Navigational Safety Dredging Project - Mission Bay, San Diego, California. (2016). 58. Merkel & Associates, Inc. 12-Month Post-Transplant Eelgrass Survey – Mission Bay Harbor Dredging Project.
(2012). 59. MBC Aquatic Sciences. Mission Bay Eelgrass Restoration project.
https://www.mbcaquatic.com/project/mission-bay-eelgrass-restoration (2022). 60. McTigue, N. D., Walker, Q. A. & Currin, C. A. Refining Estimates of Greenhouse Gas Emissions From Salt Marsh
“Blue Carbon” Erosion and Decomposition. Front. Mar. Sci. 8, 661442 (2021). 61. CARB. An inventory of ecosystem carbon in California’s natural and working lands. (2018). 62. SANDAG. Appendix X: 2016 Greenhouse Gas Emissions Inventory and Projections for the San Diego Region.
https://sdforward.com/docs/default-source/2021-regional-plan/appendix-x---2016-greenhouse-gas-emissions-inventory-and-projections-for-the-san-diego-region.pdf?sfvrsn=8444fd65_2 (2021).
63. County of San Diego. County of San Diego 2020 Crop Statistics and Annual Report. https://www.sandiegocounty.gov/content/dam/sdc/awm/docs/2020CropReportSanDiego.pdf (2021).
64. SANDAG. Appendix X: 2016 Greenhouse Gas Emissions Inventory and Projections for the San Diego Region. 68 https://sdforward.com/docs/default-source/2021-regional-plan/appendix-x---2016-greenhouse-gas-emissions-inventory-and-projections-for-the-san-diego-region.pdf?sfvrsn=8444fd65_2 (2021).
65. California Department of Food and Agriculture. COMET-Planner California Healthy Soils. http://www.comet-planner-cdfahsp.com/ (2021).
66. Fargione, J. et al. Supplementary Materials for: Natural climate solutions for the United States. Sci. Adv. 4, eaat1869 (2018).
67. Richards, C. & Caires, K. Carbon Farming Plan. 57 (2018). 68. City of San Diego. Climate Action Plan 2018 Annual Report Appendix. (2018). 69. City of San Diego. Sustainability Division | City of San Diego Official Website.
https://www.sandiego.gov/2020cap#ourclimate (2021). 70. Dudek. Evaluation of Greenhouse Gas Emissions Offset Availability within San Diego County.
https://www.ci.oceanside.ca.us/civicax/filebank/blobdload.aspx?BlobID=49641 (2018). 71. Hristov, A. N. et al. Special topics—Mitigation of methane and nitrous oxide emissions from animal
operations: I. A review of enteric methane mitigation options. J. Anim. Sci. 91, 5045–5069 (2013).
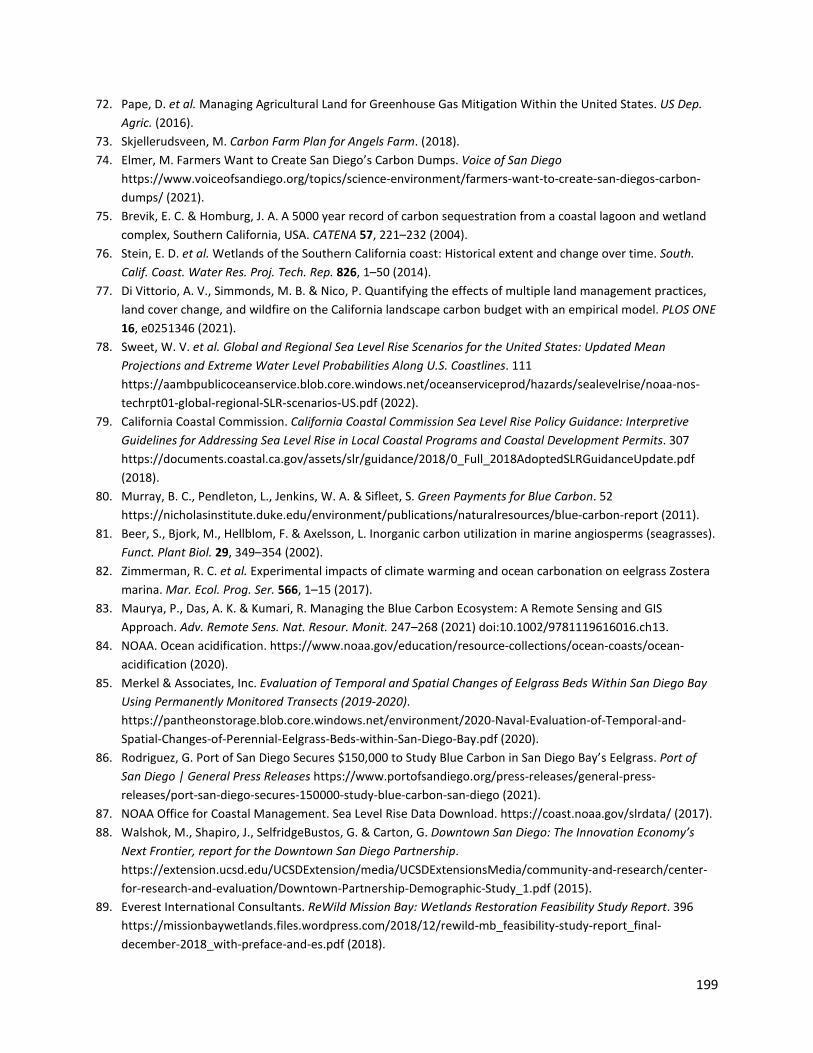
199
72. Pape, D. et al. Managing Agricultural Land for Greenhouse Gas Mitigation Within the United States. US Dep. Agric. (2016).
73. Skjellerudsveen, M. Carbon Farm Plan for Angels Farm. (2018). 74. Elmer, M. Farmers Want to Create San Diego’s Carbon Dumps. Voice of San Diego
https://www.voiceofsandiego.org/topics/science-environment/farmers-want-to-create-san-diegos-carbon-dumps/ (2021).
75. Brevik, E. C. & Homburg, J. A. A 5000 year record of carbon sequestration from a coastal lagoon and wetland complex, Southern California, USA. CATENA 57, 221–232 (2004).
76. Stein, E. D. et al. Wetlands of the Southern California coast: Historical extent and change over time. South. Calif. Coast. Water Res. Proj. Tech. Rep. 826, 1–50 (2014).
77. Di Vittorio, A. V., Simmonds, M. B. & Nico, P. Quantifying the effects of multiple land management practices, land cover change, and wildfire on the California landscape carbon budget with an empirical model. PLOS ONE 16, e0251346 (2021).
78. Sweet, W. V. et al. Global and Regional Sea Level Rise Scenarios for the United States: Updated Mean Projections and Extreme Water Level Probabilities Along U.S. Coastlines. 111 https://aambpublicoceanservice.blob.core.windows.net/oceanserviceprod/hazards/sealevelrise/noaa-nos-techrpt01-global-regional-SLR-scenarios-US.pdf (2022).
79. California Coastal Commission. California Coastal Commission Sea Level Rise Policy Guidance: Interpretive Guidelines for Addressing Sea Level Rise in Local Coastal Programs and Coastal Development Permits. 307 https://documents.coastal.ca.gov/assets/slr/guidance/2018/0_Full_2018AdoptedSLRGuidanceUpdate.pdf (2018).
80. Murray, B. C., Pendleton, L., Jenkins, W. A. & Sifleet, S. Green Payments for Blue Carbon. 52 https://nicholasinstitute.duke.edu/environment/publications/naturalresources/blue-carbon-report (2011).
81. Beer, S., Bjork, M., Hellblom, F. & Axelsson, L. Inorganic carbon utilization in marine angiosperms (seagrasses). Funct. Plant Biol. 29, 349–354 (2002).
82. Zimmerman, R. C. et al. Experimental impacts of climate warming and ocean carbonation on eelgrass Zostera marina. Mar. Ecol. Prog. Ser. 566, 1–15 (2017).
83. Maurya, P., Das, A. K. & Kumari, R. Managing the Blue Carbon Ecosystem: A Remote Sensing and GIS Approach. Adv. Remote Sens. Nat. Resour. Monit. 247–268 (2021) doi:10.1002/9781119616016.ch13.
84. NOAA. Ocean acidification. https://www.noaa.gov/education/resource-collections/ocean-coasts/ocean-acidification (2020).
85. Merkel & Associates, Inc. Evaluation of Temporal and Spatial Changes of Eelgrass Beds Within San Diego Bay Using Permanently Monitored Transects (2019-2020). https://pantheonstorage.blob.core.windows.net/environment/2020-Naval-Evaluation-of-Temporal-and-Spatial-Changes-of-Perennial-Eelgrass-Beds-within-San-Diego-Bay.pdf (2020).
86. Rodriguez, G. Port of San Diego Secures $150,000 to Study Blue Carbon in San Diego Bay’s Eelgrass. Port of San Diego | General Press Releases https://www.portofsandiego.org/press-releases/general-press-releases/port-san-diego-secures-150000-study-blue-carbon-san-diego (2021).
87. NOAA Office for Coastal Management. Sea Level Rise Data Download. https://coast.noaa.gov/slrdata/ (2017). 88. Walshok, M., Shapiro, J., SelfridgeBustos, G. & Carton, G. Downtown San Diego: The Innovation Economy’s
Next Frontier, report for the Downtown San Diego Partnership. https://extension.ucsd.edu/UCSDExtension/media/UCSDExtensionsMedia/community-and-research/center-for-research-and-evaluation/Downtown-Partnership-Demographic-Study_1.pdf (2015).
89. Everest International Consultants. ReWild Mission Bay: Wetlands Restoration Feasibility Study Report. 396 https://missionbaywetlands.files.wordpress.com/2018/12/rewild-mb_feasibility-study-report_final-december-2018_with-preface-and-es.pdf (2018).

200
90. Elmer, M. The Mission Bay Mud That Could be Worth Millions. Voice of San Diego https://www.voiceofsandiego.org/topics/science-environment/the-mission-bay-mud-that-could-be-worth-millions/ (2021).
91. Garrick, D. How much carbon is buried under Mission Bay? Scientists seek to know. San Diego Union-Tribune https://www.sandiegouniontribune.com/news/politics/story/2021-08-19/new-climate-change-study-will-analyze-how-much-carbon-marshes-could-sequester-under-mission-bay (2021).
92. American Forests. Urban Ecosystem Analysis San Diego, California: Calculating the Value of Nature. (2003). 93. McPherson, E. G. et al. The structure, function and value of urban forests in California communities. Urban
For. Urban Green. 28, 43–53 (2017). 94. U.S. Department of Agriculture, Forest Service. Urban tree canopy assessment: a community’s path to
understanding and managing the urban forest. 16 (2019). 95. Domke, G. M. et al. Greenhouse gas emissions and removals from forest land, woodlands, and urban trees in
the United States, 1990–2019. US Dep. Agric. For. Serv. North. Res. Stn. Resource Update FS-307, (2021). 96. SANDAG. Climate Action Portal. https://climatedata.sandag.org/ (2021). 97. Nowak, D. J., Stevens, J. C., Sisinni, S. M. & Luley, C. J. Effects of Urban Tree Management and Species
Selection on Atmospheric Carbon Dioxide. 10 (2002). 98. McPherson, E. G., Simpson, J. R., Peper, P. J., Scott, K. I. & Xiao, Q. Tree Guidelines for Coastal Southern
California Communities. 106 (2000). 99. Nowak, D. J., Greenfield, E. J., Hoehn, R. E. & Lapoint, E. Carbon storage and sequestration by trees in urban
and community areas of the United States. Environ. Pollut. 178, 229–236 (2013). 100. Nowak, D. J., Greenfield, E. J. & Ellis, A. Climate Change and Urban Forests. 93
https://d36s8l75ryva2.cloudfront.net/wp-content/uploads/2021/04/Nowak-Study.pdf (2021). 101. Tree Equity Score & American Forests. Tree Equity Score. https://treeequityscore.org/ (2021). 102. Domke, G. M. et al. Appendix 1.–National Scale Estimates for Individual States, 1990-2019 in Domke, Grant
M.; Walters, Brian F.; Nowak, David J.; Smith, James, E.; Nichols, Michael C.; Ogle, Stephen M.; Coulston, J.W.; Wirth, T.C. 2021. Greenhouse gas emissions and removals from forest land, woodlands, and urban trees in the United States, 1990-2019. Resource Update FS-307. Madison, WI: U.S. Department of Agriculture, Forest Service, Northern Research Station. 5 p. [plus 2 appendixes]. https://doi.org/10.2737/FS-RU-307. (2021).
103. The Nature Conservancy California. Nature-Based Climate Solutions. https://tnc.maps.arcgis.com/apps/webappviewer/index.html?id=b6386378560a4c0496d5d0edafe56ce8 (2020).
104. Riley, C. B. & Gardiner, M. M. Examining the distributional equity of urban tree canopy cover and ecosystem services across United States cities. PLOS ONE 15, e0228499 (2020).
105. California Air Resources Board. California Climate Investments provided more than $1 billion for underserved communities in 2019. https://ww2.arb.ca.gov/news/california-climate-investments-provided-more-1-billion-underserved-communities-2019 (2020).
106. WA - DNR. Urban and Community Forestry. Washington State Department of Natural Resources https://www.dnr.wa.gov/urbanforestry#grants-and-financial-assistance (2022).
107. County of San Diego Parks and Recreation. Heritage Tree Preservation Program. https://www.sdparks.org/content/sdparks/en/news-events/news-archives/HeritageTreeProgram.html (2022).
108. Stephenson, N. L. et al. Rate of tree carbon accumulation increases continuously with tree size. Nature 507, 90–93 (2014).
109. County of San Diego. Climate Action Plan - Measure A-2.2 County Tree Planting. San Diego County Data Portal https://data.sandiegocounty.gov/stories/s/A-2-2-County-Tree-Planting/q64d-hunj/ (2022).
110. County of San Diego. Expanding the number of trees in San Diego County. Climate Action Plan https://www.sandiegocounty.gov/content/sdc/sustainability/news/CountyTreePlanting.html (2020).

201
111. Mann, M. L. et al. Incorporating Anthropogenic Influences into Fire Probability Models: Effects of Human Activity and Climate Change on Fire Activity in California. PLOS ONE 11, e0153589 (2016).
112. Cal Fire. Defensible Space. Cal Fire Programs https://www.fire.ca.gov/programs/communications/defensible-space-prc-4291/ (2022).
113. San Diego County Fire. California Wildfire Mitigation Program - Home Hardening Initiative FAQs. San Diego County Fire / Fire Protection District https://www.sandiegocounty.gov/content/sdc/sdcfa/crr/ca-wildfire-mitigation-program-/faqs.html (2022).
114. Smith, J. E. California to pay for wildfire retrofits up to $40,000 per home, starting with rural San Diego. San Diego Union-Tribune (2022).

202
Appendix 5.A Methods, data, and sources for carbon stock and flow data and sources
This analysis used SanGIS’s “ECO_VEGETATION_CN” (date of data: August 2021; downloaded August 2021) and “County_Boundary” (downloaded July, 2021) shapefiles downloaded from SanGIS (SanGIS.org). The former shapefile contains the vegetation community type for the entire region. The latter shapefile contains the San Diego County boundary. The layers were reprojected into California Albers (ESPG: 6414) and invalid geometries were fixed. The ECO_VEGETATION_CN layer was clipped using the County_Boundary to remove polygons that were in state waters or in other counties. The resulting layer’s polygons show the San Diego region’s land uses (Figure 5.1). The areas were calculated for each polygon and converted to hectares.
Carbon values were assigned to the Holland vegetation classes in the ECO_VEGETATION_CN dataset and were merged into the region’s vegetation shapefile in QGIS. The polygon areas were multiplied by their corresponding carbon storage and sequestration values to return each polygon’s carbon storage and sequestration totals. These data were exported to Excel and aggregated by broad land use type based largely on IPCC land use types. The IPCC’s forest category was disaggregated to forests, woodlands, riparian, and shrublands; settlements were disaggregated to urban areas, disturbed areas, and agriculture; grasslands were consolidated to only include grasslands and meadows; and barren areas were disaggregated to water, barren (here meaning having no vegetation), and desert.
Values used to multiply polygon area by vegetation type are shown in Table 5.A.1. Eelgrass estimates included San Diego Bay estimates from 2017 surveys and were multiplied by the eelgrass values in Table 5.A.1.
Table 5.A.1 – Carbon stock and flux multipliers by Holland vegetation class type and the sources. LEGEND C stock (MT CO2eha-1) C flux (MT CO2e ha-1yr-1) Category
11000 Non-Native Vegetation 191 0.012 Disturbed
11200 Disturbed Wetland 2353 -1.074 Wetland
11300 Disturbed Habitat 191 0.012 Disturbed
12000 Urban/Developed 7.665 0.396,7 Settlement
18000 General Agriculture 378 0.3838 Agriculture
18100 Orchards and Vineyards 378 0.3838 Agriculture
18200 Intensive Agriculture - Dairies, Nurseries, Chicken Ranches 378 0.3838 Agriculture
18300 Extensive Agriculture - Field/Pasture, Row Crops 378 0.3838 Agriculture
18310 Field/Pasture 378 0.3838 Agriculture
18320 Row Crops 378 0.3838 Agriculture
21230 Southern Foredunes 0.159 0 Desert
22100 Active Desert Dunes 0.159 0 Desert
22300 Stabilized and Partially-Stabilized Desert Sand Field 0.159 0 Desert
24000 Stabilized Alkaline Dunes 0.159 0 Desert
25000 Badlands/Mudhill Forbs 0.159 0 Desert
31200 Southern Coastal Bluff Scrub 431 1.912 Scrub

203
32000 Coastal Scrub 431 1.912 Scrub
32400 Maritime Succulent Scrub 431 1.912 Scrub
32500 Diegan Coastal Sage Scrub 431 1.912 Scrub
32510 Diegan Coastal Sage Scrub: Coastal form 431 1.912 Scrub
32520 Diegan Coastal Sage Scrub: Inland form 431 1.912 Scrub
32700 Riversidian Sage Scrub 431 1.912 Scrub
32710 Riversidian Upland Sage Scrub 431 1.912 Scrub
32720 Alluvial Fan Scrub 431 1.912 Scrub
33000 Sonoran Desert Scrub 431 1.912 Scrub
33100 Sonoran Creosote Bush Scrub 431 1.912 Scrub
33200 Sonoran Desert Mixed Scrub 431 1.912 Scrub
33210 Sonoran Mixed Woody Scrub 431 1.912 Scrub
33220 Sonoran Mixed Woody and Succulent Scrub 431 1.912 Scrub
33230 Sonoran Wash Scrub 431 1.912 Scrub
33300 Colorado Desert Wash Scrub 431 1.912 Scrub
33600 Encelia Scrub 431 1.912 Scrub
33700 Acacia Scrub 431 1.912 Scrub
34000 Mojavean Desert Scrub 431 1.912 Scrub
34300 Blackbush Scrub 431 1.912 Scrub
35000 Great Basin Scrub 431 1.912 Scrub
35200 Sagebrush Scrub 431 1.912 Scrub
35210 Big Sagebrush Scrub 431 1.912 Scrub
36110 Desert Saltbush Scrub 431 1.912 Scrub
36120 Desert Sink Scrub 431 1.912 Scrub
37000 Chaparral 431 1.912 Scrub
37120 Southern Mixed Chaparral 431 1.912 Scrub
37121 Granitic Southern Mixed Chaparral 431 1.912 Scrub
37122 Mafic Southern Mixed Chaparral 431 1.912 Scrub
37130 Northern Mixed Chaparral 431 1.912 Scrub
37131 Granitic Northern Mixed Chaparral 431 1.912 Scrub
37132 Mafic Northern Mixed Chaparral 431 1.912 Scrub
37200 Chamise Chaparral 431 1.912 Scrub
37210 Granitic Chamise Chaparral 431 1.912 Scrub
37220 Mafic Chamise Chaparral 431 1.912 Scrub
37300 Red Shank Chaparral 431 1.912 Scrub
37400 Semi-Desert Chaparral 431 1.912 Scrub
37500 Montane Chaparral 431 1.912 Scrub
37510 Mixed Montane Chaparral 431 1.912 Scrub
37520 Montane Manzanita Chaparral 431 1.912 Scrub
37530 Montane Ceanothus Chaparral 431 1.912 Scrub
37540 Montane Scrub Oak Chaparral 431 1.912 Scrub
37800 Upper Sonoran Ceanothus Chaparral 431 1.912 Scrub
37830 Ceanothus crassifolius Chaparral 431 1.912 Scrub

204
37900 Scrub Oak Chaparral 431 1.912 Scrub
37A00 Interior Live Oak Chaparral 431 1.912 Scrub
37C30 Southern Maritime Chaparral 431 1.912 Scrub
37G00 Coastal Sage-Chaparral Transition 431 1.912 Scrub
37K00 Montane Buckwheat Scrub 431 1.912 Scrub
39000 Upper Sonoran Subshrub Scrub 431 1.912 Scrub
42000 Valley and Foothill Grassland 191 0.012 Grassland
42100 Native Grassland 191 0.012 Grassland
42110 Valley Needlegrass Grassland 191 0.012 Grassland
42120 Valley Sacaton Grassland 191 0.012 Grassland
42200 Nonnative Grassland 191 0.012 Grassland
42200 Non-Native Grassland 191 0.012 Grassland
42210 Non-Native Grassland: Broadleaf-Dominated 191 0.012 Grassland
42300 Wildflower Field 191 0.012 Grassland
42400 Foothill/Mountain Perennial Grassland 191 0.012 Grassland
42470 Transmontane Perennial Grassland 191 0.012 Grassland
44000 Vernal Pool 1513,10 011,12 Wetland
44320 San Diego Mesa Vernal Pool 1513,10 011,12 Wetland
44322 San Diego Mesa Claypan Vernal Pool 1513,10 011,12 Wetland
45000 Meadows and Seeps 191 0.012 Grassland
45100 Montane Meadow 191 0.012 Grassland
45110 Wet Montane Meadow 191 0.012 Grassland
45120 Dry Montane Meadows 191 0.012 Grassland
45300 Alkali Meadows and Seeps 191 0.012 Grassland
45320 Alkali Seep 191 0.012 Grassland
45400 Freshwater Seep 191 0.012 Grassland
46000 Alkali Playa Community 191 0.012 Grassland
52120 Southern Coastal Salt Marsh 2353 2.1814 Wetland
52300 Alkali Marsh 2353 2.1814 Wetland
52310 Cismontane Alkali Marsh 2353 2.1814 Wetland
52400 Freshwater Marsh 1513,10 1.410 Wetland
52410 Coastal and Valley Freshwater Marsh 1513,10 1.410 Wetland
52420 Transmontane Freshwater Marsh 1513,10 1.410 Wetland
52440 Emergent Wetland 1513,10 1.410 Wetland
60000 Riparian and Bottomland Habitat 10015 4.316 Riparian
61000 Riparian Forests 10015 4.316 Riparian
61300 Southern Riparian Forest 10015 4.316 Riparian
61310 Southern Coast Live Oak Riparian Forest 10015 4.316 Riparian
61320 Southern Arroyo Willow Riparian Forest 10015 4.316 Riparian
61330 Southern Cottonwood-Willow Riparian Forest 10015 4.316 Riparian
61510 White Alder Riparian Forest 10015 4.316 Riparian
61810 Sonoran Cottonwood-Willow Riparian Forest 10015 4.316 Riparian
61820 Mesquite Bosque 10015 4.316 Riparian
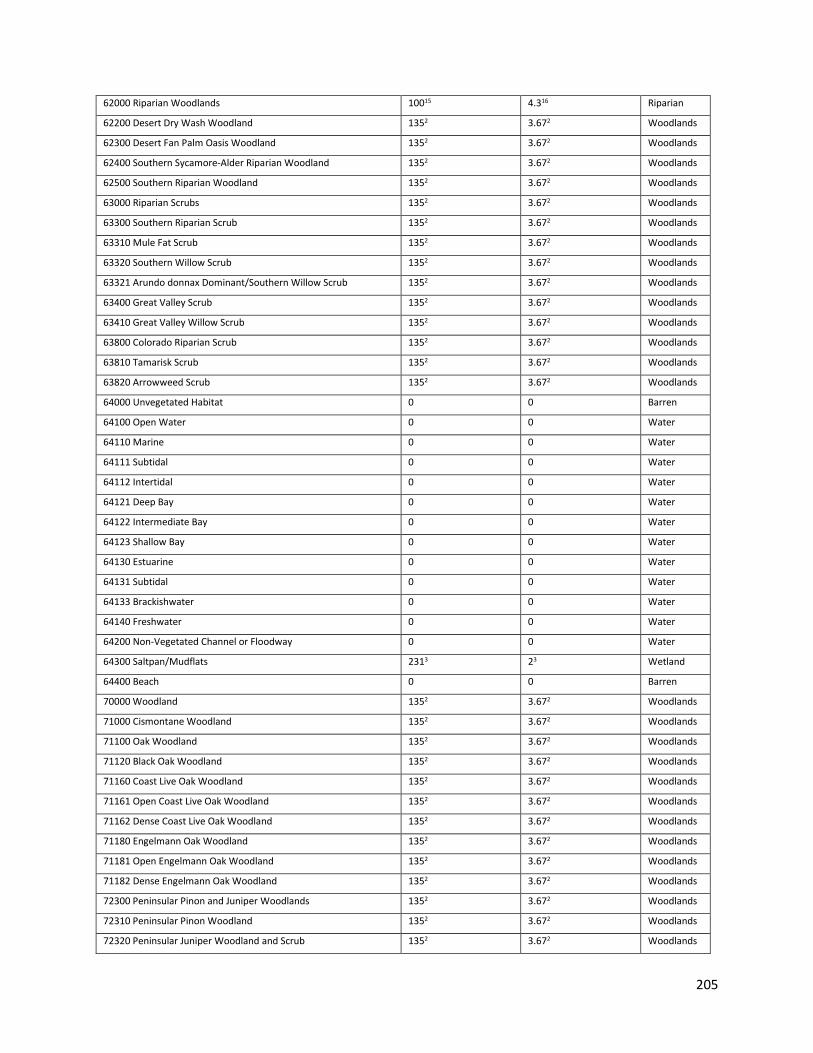
205
62000 Riparian Woodlands 10015 4.316 Riparian
62200 Desert Dry Wash Woodland 1352 3.672 Woodlands
62300 Desert Fan Palm Oasis Woodland 1352 3.672 Woodlands
62400 Southern Sycamore-Alder Riparian Woodland 1352 3.672 Woodlands
62500 Southern Riparian Woodland 1352 3.672 Woodlands
63000 Riparian Scrubs 1352 3.672 Woodlands
63300 Southern Riparian Scrub 1352 3.672 Woodlands
63310 Mule Fat Scrub 1352 3.672 Woodlands
63320 Southern Willow Scrub 1352 3.672 Woodlands
63321 Arundo donnax Dominant/Southern Willow Scrub 1352 3.672 Woodlands
63400 Great Valley Scrub 1352 3.672 Woodlands
63410 Great Valley Willow Scrub 1352 3.672 Woodlands
63800 Colorado Riparian Scrub 1352 3.672 Woodlands
63810 Tamarisk Scrub 1352 3.672 Woodlands
63820 Arrowweed Scrub 1352 3.672 Woodlands
64000 Unvegetated Habitat 0 0 Barren
64100 Open Water 0 0 Water
64110 Marine 0 0 Water
64111 Subtidal 0 0 Water
64112 Intertidal 0 0 Water
64121 Deep Bay 0 0 Water
64122 Intermediate Bay 0 0 Water
64123 Shallow Bay 0 0 Water
64130 Estuarine 0 0 Water
64131 Subtidal 0 0 Water
64133 Brackishwater 0 0 Water
64140 Freshwater 0 0 Water
64200 Non-Vegetated Channel or Floodway 0 0 Water
64300 Saltpan/Mudflats 2313 23 Wetland
64400 Beach 0 0 Barren
70000 Woodland 1352 3.672 Woodlands
71000 Cismontane Woodland 1352 3.672 Woodlands
71100 Oak Woodland 1352 3.672 Woodlands
71120 Black Oak Woodland 1352 3.672 Woodlands
71160 Coast Live Oak Woodland 1352 3.672 Woodlands
71161 Open Coast Live Oak Woodland 1352 3.672 Woodlands
71162 Dense Coast Live Oak Woodland 1352 3.672 Woodlands
71180 Engelmann Oak Woodland 1352 3.672 Woodlands
71181 Open Engelmann Oak Woodland 1352 3.672 Woodlands
71182 Dense Engelmann Oak Woodland 1352 3.672 Woodlands
72300 Peninsular Pinon and Juniper Woodlands 1352 3.672 Woodlands
72310 Peninsular Pinon Woodland 1352 3.672 Woodlands
72320 Peninsular Juniper Woodland and Scrub 1352 3.672 Woodlands
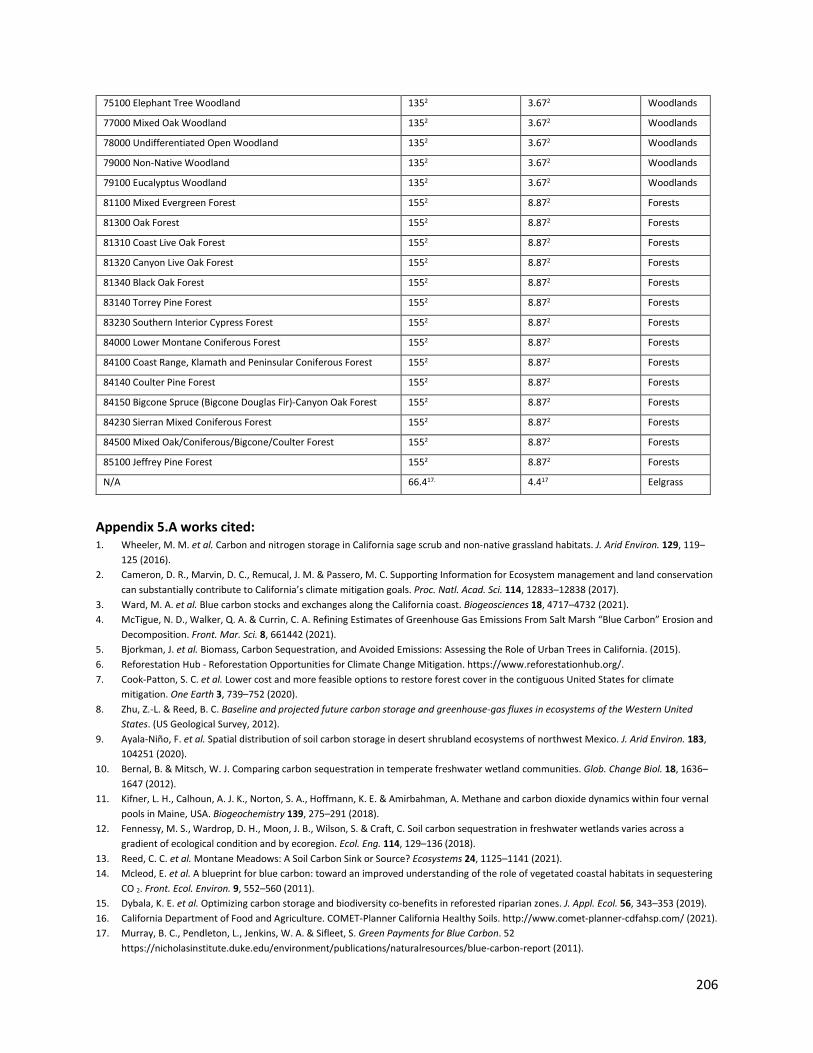
206
75100 Elephant Tree Woodland 1352 3.672 Woodlands
77000 Mixed Oak Woodland 1352 3.672 Woodlands
78000 Undifferentiated Open Woodland 1352 3.672 Woodlands
79000 Non-Native Woodland 1352 3.672 Woodlands
79100 Eucalyptus Woodland 1352 3.672 Woodlands
81100 Mixed Evergreen Forest 1552 8.872 Forests
81300 Oak Forest 1552 8.872 Forests
81310 Coast Live Oak Forest 1552 8.872 Forests
81320 Canyon Live Oak Forest 1552 8.872 Forests
81340 Black Oak Forest 1552 8.872 Forests
83140 Torrey Pine Forest 1552 8.872 Forests
83230 Southern Interior Cypress Forest 1552 8.872 Forests
84000 Lower Montane Coniferous Forest 1552 8.872 Forests
84100 Coast Range, Klamath and Peninsular Coniferous Forest 1552 8.872 Forests
84140 Coulter Pine Forest 1552 8.872 Forests
84150 Bigcone Spruce (Bigcone Douglas Fir)-Canyon Oak Forest 1552 8.872 Forests
84230 Sierran Mixed Coniferous Forest 1552 8.872 Forests
84500 Mixed Oak/Coniferous/Bigcone/Coulter Forest 1552 8.872 Forests
85100 Jeffrey Pine Forest 1552 8.872 Forests
N/A 66.417. 4.417 Eelgrass
Appendix 5.A works cited: 1. Wheeler, M. M. et al. Carbon and nitrogen storage in California sage scrub and non-native grassland habitats. J. Arid Environ. 129, 119–
125 (2016). 2. Cameron, D. R., Marvin, D. C., Remucal, J. M. & Passero, M. C. Supporting Information for Ecosystem management and land conservation
can substantially contribute to California’s climate mitigation goals. Proc. Natl. Acad. Sci. 114, 12833–12838 (2017). 3. Ward, M. A. et al. Blue carbon stocks and exchanges along the California coast. Biogeosciences 18, 4717–4732 (2021). 4. McTigue, N. D., Walker, Q. A. & Currin, C. A. Refining Estimates of Greenhouse Gas Emissions From Salt Marsh “Blue Carbon” Erosion and
Decomposition. Front. Mar. Sci. 8, 661442 (2021). 5. Bjorkman, J. et al. Biomass, Carbon Sequestration, and Avoided Emissions: Assessing the Role of Urban Trees in California. (2015). 6. Reforestation Hub - Reforestation Opportunities for Climate Change Mitigation. https://www.reforestationhub.org/. 7. Cook-Patton, S. C. et al. Lower cost and more feasible options to restore forest cover in the contiguous United States for climate
mitigation. One Earth 3, 739–752 (2020). 8. Zhu, Z.-L. & Reed, B. C. Baseline and projected future carbon storage and greenhouse-gas fluxes in ecosystems of the Western United
States. (US Geological Survey, 2012). 9. Ayala-Niño, F. et al. Spatial distribution of soil carbon storage in desert shrubland ecosystems of northwest Mexico. J. Arid Environ. 183,
104251 (2020). 10. Bernal, B. & Mitsch, W. J. Comparing carbon sequestration in temperate freshwater wetland communities. Glob. Change Biol. 18, 1636–
1647 (2012). 11. Kifner, L. H., Calhoun, A. J. K., Norton, S. A., Hoffmann, K. E. & Amirbahman, A. Methane and carbon dioxide dynamics within four vernal
pools in Maine, USA. Biogeochemistry 139, 275–291 (2018). 12. Fennessy, M. S., Wardrop, D. H., Moon, J. B., Wilson, S. & Craft, C. Soil carbon sequestration in freshwater wetlands varies across a
gradient of ecological condition and by ecoregion. Ecol. Eng. 114, 129–136 (2018). 13. Reed, C. C. et al. Montane Meadows: A Soil Carbon Sink or Source? Ecosystems 24, 1125–1141 (2021). 14. Mcleod, E. et al. A blueprint for blue carbon: toward an improved understanding of the role of vegetated coastal habitats in sequestering
CO 2. Front. Ecol. Environ. 9, 552–560 (2011). 15. Dybala, K. E. et al. Optimizing carbon storage and biodiversity co-benefits in reforested riparian zones. J. Appl. Ecol. 56, 343–353 (2019). 16. California Department of Food and Agriculture. COMET-Planner California Healthy Soils. http://www.comet-planner-cdfahsp.com/ (2021). 17. Murray, B. C., Pendleton, L., Jenkins, W. A. & Sifleet, S. Green Payments for Blue Carbon. 52
https://nicholasinstitute.duke.edu/environment/publications/naturalresources/blue-carbon-report (2011).
207
Appendix 5.B Blue carbon methodology details and blue carbon value sources
The blue carbon vegetation class was used to determine the emitted carbon from the carbon stock and the lost carbon sequestration potential. These values were taken from the literature and were preferentially from San Diego, California, the west coast of the contiguous United States, anywhere in the United States, or any blue carbon study, in that order. A table of values and sources is in Table 5.B.1. The carbon stock and sequestration values from the literature were converted to metric tons of CO2e per hectare (MT CO2e ha-1) if they were not already in those values. They were then multiplied by the appropriate vegetation class’s total area to get the one-time positive emissions and the foregone negative emissions from planned land use change in the region.
The “ECO_VEGETATION_CN” layer contains polygons for all land use types as well as water types. In order to only consider the impacts of sea level rise on blue carbon habitats, the vegetation layer was filtered to only contain those blue carbon polygons.
Two rounds of filtering occurred. First, polygons were filtered by the broad vegetation categories (column name: “CATEGORY”) of ‘Bog and Marsh' and 'Riparian and Bottomland Habitat.' In order to additionally include degraded wetlands, which still hold carbon, the Holland code and name (column name: “LEGEND”) of '11200 Disturbed Wetland.'
Next, these broader categories were filtered to only remove the following Holland code polygons, because they were not considered blue carbon habitats in this analysis: '64400 Beach,’ '64112 Intertidal,' '64000 Unvegetated Habitat,' '64110 Marine,' '64111 Subtidal,' '64121 Deep Bay,' '64122 Intermediate Bay,' '64123 Shallow Bay,' '64131 Subtidal,' '64140 Freshwater,' and '64200 Non-Vegetated Channel or Floodway.' What remained were the blue carbon habitat polygons. Eelgrass was not included in this mapping because it is not included in the vegetation layers.
The resulting layer was clipped using NOAA’s 1 foot SLR layer (fixed and reprojected to ESPG:6414) such that the resulting layer only showed those blue carbon habitats that would be inundated with seawater under a 1 foot SLR scenario. Area was calculated in QGIS and the final attribute table was exported as a CSV file for carbon emissions and lost sequestration potential calculations in Excel. Values used are shown in Table 5.A.2. The final areas of each polygon were calculated in units of hectares and final polygons with an area equal to zero hectares were dropped, as in the land use change section.

208
Table 5.B.1 – Carbon values and sources used to calculate lost carbon stock and sequestration rates. Blue Carbon Habitat Type Stock (MT CO2e ha-1) Flow (MT CO2e ha-1yr-1) Freshwater marsh 151i 1.41 Mudflats/Saltpans 2312 23 Riparian scrub/estuary 1004 4.35 Salt marsh/estuary 2352 2.186
Appendix 5.B works cited:
1. Bernal, B. & Mitsch, W. J. Comparing carbon sequestration in temperate freshwater wetland communities. Glob. Change Biol. 18, 1636–1647 (2012).
2. Ward, M. A. et al. Blue carbon stocks and exchanges along the California coast. Biogeosciences 18, 4717–4732 (2021). 3. Sasmito, S. D. et al. Organic carbon burial and sources in soils of coastal mudflat and mangrove ecosystems. CATENA 187, 104414 (2020). 4. Dybala, K. E. et al. Optimizing carbon storage and biodiversity co-benefits in reforested riparian zones. J. Appl. Ecol. 56, 343–353 (2019). 5. California Department of Food and Agriculture. COMET-Planner California Healthy Soils. http://www.comet-planner-cdfahsp.com/ (2021). 6. Mcleod, E. et al. A blueprint for blue carbon: toward an improved understanding of the role of vegetated coastal habitats in sequestering
CO 2. Front. Ecol. Environ. 9, 552–560 (2011).
i Assumes that freshwater marsh storage follows the same ratio to saltwater marsh storage (Ward et al., 2021) as freshwater marsh sequestration (from Bernal & Mitsch, 2012) does to saltwater marsh sequestration (Mcleod et al., 2011).
209
6. Employment Impacts through Regional Decarbonization Framework for the San Diego Region Robert Pollin, Department of Economics and Political Economy Research Institute (PERI) University of Massachusetts Amherst Jeannette Wicks-Lim, PERI, University of Massachusetts Amherst Shouvik Chakraborty, PERI, University of Massachusetts Amherst Gregor Semieniuk, PERI, University of Massachusetts Amherst Key Takeaways
• Between 2021 – 2030, the regional decarbonization pathway would generate an average of nearly 27,000 jobs per year in the San Diego region.
• Even taking into account the contraction of fossil fuel jobs, we estimate that no workers in the region’s fossil fuel-based industries will have to experience job displacement before 2030.
• San Diego county and local governments should begin now to develop a viable set of just transition policies for the workers in the community who will experience job displacement between 2031 – 2050.
• The costs of a just transition will be much lower if the transition is able to proceed steadily rather than through a series of episodes. Under a steady transition, the proportion of workers who will retire voluntarily in any given year will be predictable, the transition process avoids having to provide support for a much larger share of workers.
• Geothermal production of the five sites identified in Imperial County would generate 1,900 jobs per year over a 10-year period.
In this chapter, we estimate the employment impacts of advancing the clean energy decarbonization program developed for the San Diego region by Evolved Energy Research (EER), as summarized in Appendix A of this project. The model that EER describes in Appendix A includes seven different energy system transformation scenarios between 2020 – 2050. The purpose of all of these scenarios is present pathways through which CO2 emissions in the San Diego region can fall to zero by 2050. In this chapter, we focus on what the EER model terms the “central case.” They explain that this is the case through which the region can achieve net zero CO2 emission in 2050 at the lowest net cost. We focus in this chapter on the employment impacts between 2021 – 2030 through advancing the EER central case in the San Diego region.i
i In fact, the EER model from which we are generating employment estimates encompasses a broader geographic area than the San Diego region alone. The EER model is for Southern California, which they define as including 13 counties in addition to the San Diego region. In order for us to produce estimates of employment impacts within the San Diego region itself, we therefore need to work with some assumptions in defining the proportionate level of activity in the San Diego region relative to all 14 counties constituting Southern California in the EER model. We describe our estimating methodology on this issue in Appendix 1. Because we have developed a methodology of

210
We also estimate in this chapter the impacts on employment of phasing down fossil fuel-based economic activity in the county. Within the EER central case model, the phasing down of fossil fuel-based activity will be modest between 2021 – 2030, the decade of activity on which we focus here. EER assumes that natural gas consumption in the county will remain at its current level through 2030, while the consumption of oil will have fallen by 20 percent as of 2030 relative to current consumption levels. There is, at present, already close-to-zero coal consumption in the region.
This chapter will first focus on the employment creation impacts between 2021 - 2030 of the San Diego region advancing its zero emissions program. We then turn to considering the employment impacts of phasing down fossil fuels in the county over this same period. i
Our overall findings can be summarized briefly. We estimate that, between 2021 – 2030, the regional decarbonization project will generate an average of nearly 27,000 jobs per year in the San Diego region. This amounts to an expansion of employment in the county of about 1.6 percent. It means that, if all else were held equal in the regional labor market over 2021 – 2030, the regional decarbonization project would itself be capable of reducing the county’s unemployment rate from, say, 7.5 percent to 5.9 percent. The newly-created jobs will encompass a wide range of occupations, at all levels of the regional labor market. At the same time, between 2021 – 2030, we estimate that no workers in the county’s fossil fuel- based industries will have to experience job displacement.
6.1 Overview of Job Creation Estimates
According to our calculations, as an average over 2021– 2030, total expenditures within the central case includes $9.9 billion per year to purchase a wide range of products that operate through consuming energy, what we will term “energy demand expenditures.” These include electric vehicles, heating and cooling systems, and refrigeration equipment.ii It also includes $5.1 billion per year to expand the supply of both clean renewable energy sources, including solar, wind, geothermal, and hydro power, as well as other low- to zero CO2-emitting technologies, including nuclear power, biomass, and carbon sequestration. The average overall average spending total for both energy demand expenditures and energy supply investments therefore comes to an average of $15.0 billion per year between 2021 – 2030. This is equal to
converting their model for Southern California into estimates for the San Diego region specifically, we refer throughout the paper to the EER model for the San Diego region. i This paper provides a primarily quantitative analysis of the employment impacts resulting from the clean energy transition in the regional region. Dr. Carol Zabin Director of the UC Berkeley Labor Center’s Green Economy Program, and co-authors are producing a more qualitative study, focusing on a range of employment policy issues associated with the San Diego region’s clean energy transition. Another related, and already completed, study of clean energy and fossil fuel-based employment levels in the San Diego region is presented in a November 2020 spreadsheet report, Clean and Renewable Energy in San Diego-Chula Vista-Carlsbad, CA, by the San Diego Regional Economic Development Corporation. https://docs.google.com/spreadsheets/d/1mVZ4UXWzYG2zHu2XfnTFhXq2-1rwBBkr/edit?goal=0_c2357fd0a3-b9c8e8882a-84300641#gid=1212436047 ii Appendix 1 in Pollin et al. (2020)3 provides a full listing of all of the EER spending categories.

211
about 3.2 percent of San Diego’s overall economic activity at its midpoint between 2021 – 2030 assuming that the regional economy grows at an average annual rate of 2.5 percent over this 10-year period.
Working from these budgetary figures, we then estimate the amount of jobs that will be created as a result of the spending amounts that EER have allocated to all categories in the areas of both energy demand and supply. Our overall findings are that an average of about 13,300 jobs per year will be generated through $9.9 billion in average annual energy demand expenditures in the region between 2021 – 2030 and another 13,400 jobs per year will be generated through spending an average of $5.1 billion per year in low- to zero emissions technologies in the region. Overall then, we estimate that the zero carbon emissions program for the San Diego region will generate an average of about 26,700 jobs between 2021 – 2030 in the San Diego region. This is equal to about 1.6 percent of the County’s average projected labor force size between 2021 – 2030. This higher level of employment in the San Diego region will be sustained throughout this first decade of the county’s clean energy transformation program (assuming no other major changes in the district’s economy were to occur).
After estimating the number of jobs that these energy demand and supply expenditures will generate, we then present indicators of the quality of these jobs. These quality indicators include average compensation levels, health care coverage, and union membership. We also provide data on the types of workers who are employed at present in the job areas that will be created by the energy demand and supply expenditures, including evidence on both educational credentials of these workers as well as their racial, ethnic and gender composition. We then report on the prevalent types of jobs that will be generated through both the energy demand and supply expenditures.
6.2 Methodological Issues in Estimating Employment Creation
Before proceeding to present our detailed job creation and job quality estimates, we first briefly describe the methodology we used to generate our results.i
Our employment estimates are figures generated directly with data from national surveys of public and private economic enterprises within the U.S. and organized systematically within the official U.S. input-output (I-O) model. The “inputs” within this model are all the employees, materials, land, energy and other products that are utilized in public and private enterprises within the U.S. to create goods and services. The “outputs” are the goods and services themselves that result from these activities that are then made available to households, private businesses and governments as consumers within both domestic and global markets. Within the given structure of the U.S. economy broadly and the regional economy specifically, these figures from the input-output model provide the most accurate evidence available as to what happens within private and public enterprises when they produce the economy’s goods and services. In particular, these data enable researchers to observe how many workers were hired
i We provide a fuller discussion of our methodology in Pollin et al. (2020)3 Appendix 2.

212
to produce a given set of products or services, and what kinds of materials were purchased in the process.
Here is one specific example of how our methodology works. When the regional economy expands its solar energy productive capacity by $1 billion, we are able to estimate how much of the $1 billion will be spent on hiring workers, how much will be spent on non-labor inputs, including materials, energy costs, and maintaining factory buildings, and how much will be left over for business profits. Moreover, when businesses spend on non-labor inputs, we estimate what are the employment effects through giving orders to suppliers, such as glass manufacturers or trucking companies.
6.2.1 Direct, Indirect and Induced Job Creation
Spending money in any area of any economy, including the San Diego region, will create jobs, since people are needed to produce any good or service that the economy supplies. This is true regardless of whether the spending is done by private businesses, households, or government entities. At the same time, for a given amount of spending within the economy, for example, $1 billion, there are differences in the relative levels of job creation through spending that $1 billion in alternative ways. Again, this is true regardless of whether the spending is done by households, private businesses, or public sector enterprises.
There are three sources of job creation associated with any expansion of spending—direct, indirect, and induced effects. For purposes of illustration, consider these categories in terms of investments in manufacturing electric cars or building wind turbines:
1. Direct effects—the jobs created, for example, by installing solar panels or purchasing electric vehicles;
2. Indirect effects—the jobs associated with industries that supply intermediate goods for the solar panels or electric vehicles, such as silicon, steel, and transportation;
3. Induced effects—the expansion of employment that results when people who are paid in the glass, steel, or transportation industries spend the money they have earned on other products in the economy. These are the multiplier effects within a standard macroeconomic model.
In this study, we report on all three employment channels—direct, indirect, and induced job creation. But we emphasize that estimating induced effects—i.e. multiplier effects—within I-O models is much less reliable than the direct and indirect effects. In addition, induced effects derived from alternative areas of spending within a national economy are likely to be comparable to one another.
Within the categories of direct plus indirect job creation, how is it that spending a given amount of money in one set of activities in the economy could generate more employment than other activities? As a matter of simple arithmetic, there are only three possibilities. These are:
1. Labor Intensity. When proportionally more money of a given overall amount of funds is spent on hiring people, as opposed to spending on machinery, buildings,

213
energy, land, and other inputs, then spending this given amount of overall funds will create relatively more jobs.
2. Compensation per worker. If $1 billion in total is spent on employing workers in a given year on a project, and each employee earns $1 million per year working on that project, then only 1,000 jobs are created through spending this $1 billion. However, if, at another enterprise, the average pay is $50,000 per year, then the same $1 billion devoted to employing workers will generate 20,000 jobs.
3. Local content. When a given amount of money is spent in the San Diego region in either the areas of energy supply or demand, a significant share of the funds will support activities that occur outside of the county itself. Of course, job creation in the San Diego region itself will increase as the relative share of locally produced goods and services rises. Through the input/output model, we are able to observe the level of job creation at existing local content levels. But we can also estimate how much overall job creation will change through assuming either an increase or decrease in the local content share, resulting, for example, from active economic development policies in the county. In what follows, we report job creation levels resulting from current local content ratios.
6.2.2 Time Dimension in Measuring Job Creation
Jobs-per-year vs. job years. Any type of spending activity creates employment over a given amount of time. To understand the impact on jobs of a given spending activity, one must therefore incorporate a time dimension into the measurement of employment creation. For example, a program that creates 100 jobs that last for only one year needs to be distinguished from another program that creates 100 jobs that continue for 10 years each. It is important to keep this time dimension in mind in any assessment of the impact on job creation of any clean energy investment activity.
There are two straightforward ways in which one can express such distinctions. One is through measuring job years. This measures cumulative job creation over the total number of years that jobs have been created. Thus, an activity that generates 100 jobs for 1 year would create 100 job years. By contrast, the activity that produces 100 jobs for 10 years would generate 1,000 job years.
The other way to report the same figures would be in terms of jobs-per-year. Through this measure, we are able to provide detail on the year-to-year breakdown of the overall level of job creation. Thus, with the 10-year program we are using in our example, we could express its effects as creating 100 jobs per year over the course of the 2021 – 2030 time period.
This jobs-per-year measure is most appropriate for the purposes of this study. The reason that jobs-per-year is a better metric than job years is because the impact of any new investment, whether on renewable energy or anything else, will be felt within a given set of labor market conditions at a point in time. Reporting cumulative job creation figures over multiple years prevents us from scaling the impact of investments on job markets at a given point in time. For example, as noted above, we estimate that employment creation in the county from the full set of energy demand and supply expenditures in the county will average about 26,700 jobs per

214
year over 2021 – 2030. We are able to scale that employment increase in the county relative to the size of the county’s labor force. We estimate that the region’s labor force will average about 1.7 million between 2021 – 2030. Thus, the increase of 26,700 00 jobs to the county’s overall force of about 1.7 million jobs will amount to a growth of employment of 1.6 percent. We present the full derivation of these overall results below.
6.2.3 Incorporating Labor Productivity Growth over the 10-Year Investment Cycle
The figures we use for the input-output tables are based on the technologies that are prevalent at present for undertaking these clean energy investments. Yet we are estimating job creation through clean energy investments that will occur over the 10-year cycle between 2021 - 2030. The relevant production technologies will certainly change over this decade, so that a different mixture of inputs may be used to produce a given output.
For example, new technologies are likely to emerge, making other technologies obsolete. Certain inputs could also become scarcer, and, as result, firms may substitute other less expensive goods and services to save on costs. The production process overall could also become more efficient, so that fewer inputs are needed to produce a given amount of output. Energy efficiency investments do themselves produce a change in production processes—i.e. a reduction in the use of energy inputs to generate a given level of output. In short, the input-output relationships in any given economy—including its employment effects of clean energy investments—are likely to look different in 2030 relative to the present.
Pollin et al. addresses this issue in detail (e.g. 2015, pp. 133 - 44).2 For the purposes of the present discussion, we work with a simple assumption: that average labor productivity in all of the expenditure areas included in the EER model will rise by 1 percent per year through until 2030.
6.3 Job Creation Estimates
Tables 6.1 – 6.5 report on our job creation estimates generated by the EER central case scenario to enable the San Diego region to reach net zero emissions by 2050, with our focus on the 2021 – 2030 period. We report two overall sets of figures for both the energy demand and energy supply expenditures—first, job creation per $1 million in expenditure, then, job creation given the average annual level of spending incorporated into the EER model, i.e. $9.9 billion per year in energy demand expenditures and $5.1 billion in energy supply investments. We first report figures for direct and indirect jobs, along with the totals for these main job categories. We then include the figures on induced jobs and show total job creation when induced jobs are added to figures for direct and indirect jobs.
In Tables 6.1 and 6.2, we present our estimates as to the job creation effects generated by the full range of energy demand expenditures in the EER central case. We have grouped this full set of projects into 10 categories. They are: vehicles, heating/ventilation/air conditioning (HVAC), manufacturing, other commercial and residential spending, construction, appliances,

215
refrigeration, mining, agriculture and lighting.i As Table 6.1 shows, direct plus indirect job creation per $1 million in spending range between 0.7 for mining to 10.0 for agriculture.
Table 6.1. Job Creation through Energy Demand Expenditures in San Diego, by Subsectors and Technology. Job creation per $1 million in spending
Investment Area
Direct Jobs Indirect Jobs Direct Jobs+ Indirect Jobs
Induced Jobs Direct Jobs + Indirect Jobs + Induced Jobs
Vehicles 0.47 0.19 0.66 0.21 0.87 HVAC 1.57 0.82 2.39 0.89 3.28 Refrigeration 1.81 0.68 2.49 0.98 3.47 Appliances 0.79 0.43 1.22 0.43 1.65 Construction 2.43 1.38 3.81 1.35 5.16 Lighting 1.74 0.93 2.67 0.98 3.65 Manufacturing 0.91 0.72 1.63 0.63 2.26 Other commercial and residential
1.6 0.8 2.4 0.9 3.3
Agriculture 8.78 1.27 10.05 2.74 12.79 Mining 0.39 0.33 0.72 0.34 1.06
Note: These figures are based on current rates of job creation, weighted by total investment amounts over 2021-2030. Source: IMPLAN 3.1 In Table 6.2, we show the level of job creation through spending an average of $9.9 billion per year on the full set of these projects between 2021 and 2030. As we see, of the full $9.9 billion average annual spending figure, the largest areas of expenditures include (with rounding): $7.7 billion on clean energy vehicles, $897 million on high-efficiency HVAC systems and $762 million on refrigeration equipment. These three spending categories therefore account for roughly 95 percent of total demand expenditures, with spending on clean energy vehicles alone accounting for 78 percent of all demand-side expenditures.
The result of the demand expenditures at this level will be the creation of an average of about 6,914 direct jobs and 3,022 indirect jobs, for an average between 2021 and 2030 of 9,936 direct plus indirect jobs. Including induced jobs adds another 3,413 jobs per year to the total figure. This brings the total net job creation figure for the full set of energy demand expenditures, including induced jobs to about 13,400 as an annual average figure between 2021 – 2030.
i The “other” commercial and residential category of energy demand expenditures is taken directly from the EER model—or, more precisely, this category combines the “commercial other” and “residential other” categories within the EER model.
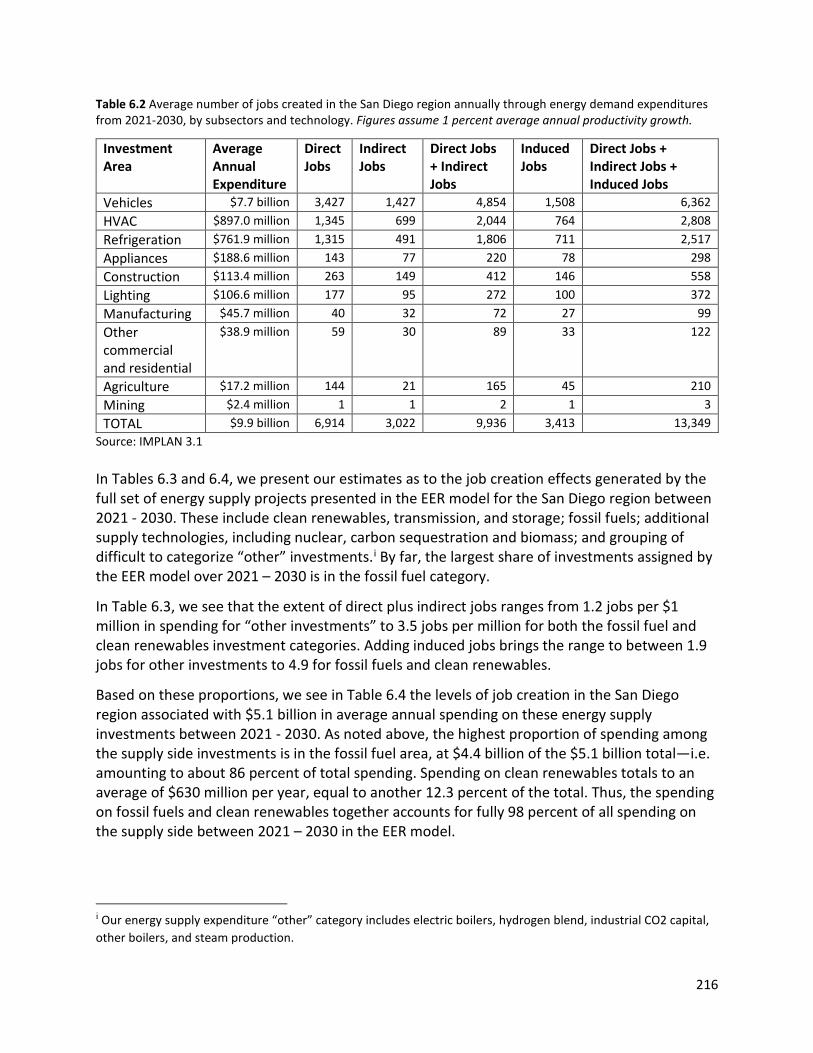
216
Table 6.2 Average number of jobs created in the San Diego region annually through energy demand expenditures from 2021-2030, by subsectors and technology. Figures assume 1 percent average annual productivity growth.
Investment Area
Average Annual Expenditure
Direct Jobs
Indirect Jobs
Direct Jobs + Indirect Jobs
Induced Jobs
Direct Jobs + Indirect Jobs + Induced Jobs
Vehicles $7.7 billion 3,427 1,427 4,854 1,508 6,362 HVAC $897.0 million 1,345 699 2,044 764 2,808 Refrigeration $761.9 million 1,315 491 1,806 711 2,517 Appliances $188.6 million 143 77 220 78 298 Construction $113.4 million 263 149 412 146 558 Lighting $106.6 million 177 95 272 100 372 Manufacturing $45.7 million 40 32 72 27 99 Other commercial and residential
$38.9 million 59 30 89 33 122
Agriculture $17.2 million 144 21 165 45 210 Mining $2.4 million 1 1 2 1 3 TOTAL $9.9 billion 6,914 3,022 9,936 3,413 13,349
Source: IMPLAN 3.1 In Tables 6.3 and 6.4, we present our estimates as to the job creation effects generated by the full set of energy supply projects presented in the EER model for the San Diego region between 2021 - 2030. These include clean renewables, transmission, and storage; fossil fuels; additional supply technologies, including nuclear, carbon sequestration and biomass; and grouping of difficult to categorize “other” investments.i By far, the largest share of investments assigned by the EER model over 2021 – 2030 is in the fossil fuel category.
In Table 6.3, we see that the extent of direct plus indirect jobs ranges from 1.2 jobs per $1 million in spending for “other investments” to 3.5 jobs per million for both the fossil fuel and clean renewables investment categories. Adding induced jobs brings the range to between 1.9 jobs for other investments to 4.9 for fossil fuels and clean renewables.
Based on these proportions, we see in Table 6.4 the levels of job creation in the San Diego region associated with $5.1 billion in average annual spending on these energy supply investments between 2021 - 2030. As noted above, the highest proportion of spending among the supply side investments is in the fossil fuel area, at $4.4 billion of the $5.1 billion total—i.e. amounting to about 86 percent of total spending. Spending on clean renewables totals to an average of $630 million per year, equal to another 12.3 percent of the total. Thus, the spending on fossil fuels and clean renewables together accounts for fully 98 percent of all spending on the supply side between 2021 – 2030 in the EER model.
i Our energy supply expenditure “other” category includes electric boilers, hydrogen blend, industrial CO2 capital, other boilers, and steam production.
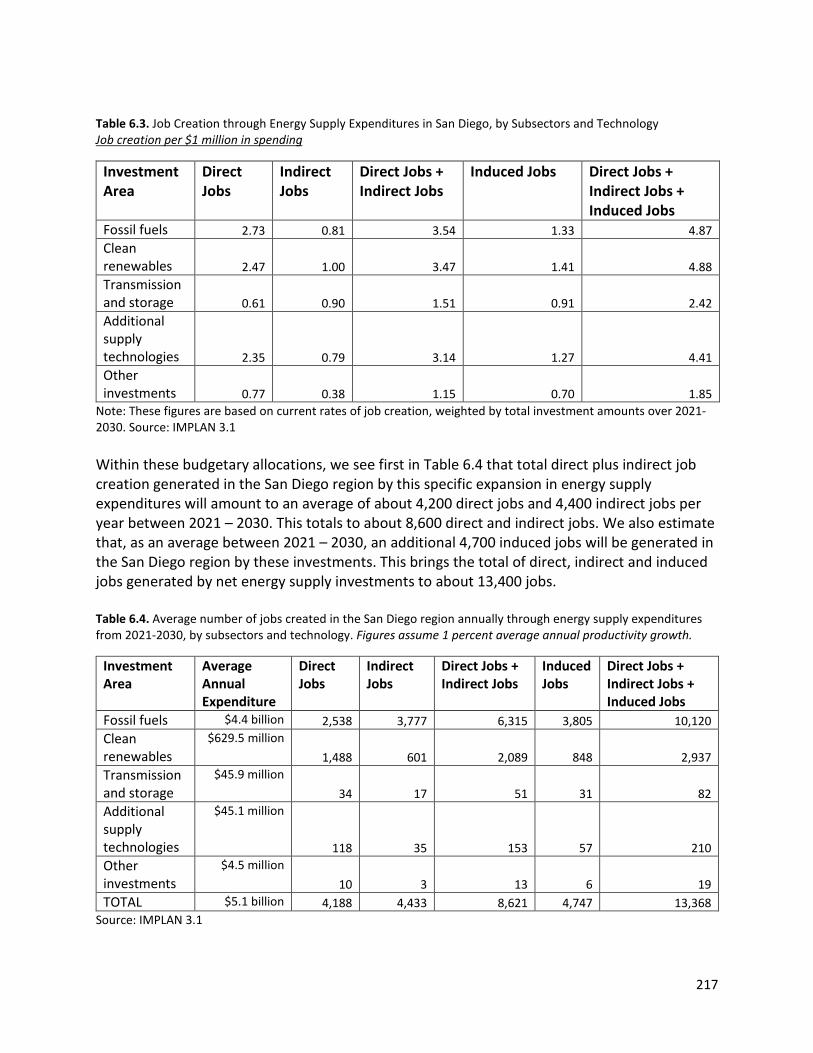
217
Table 6.3. Job Creation through Energy Supply Expenditures in San Diego, by Subsectors and Technology Job creation per $1 million in spending
Investment Area
Direct Jobs
Indirect Jobs
Direct Jobs + Indirect Jobs
Induced Jobs Direct Jobs + Indirect Jobs + Induced Jobs
Fossil fuels 2.73 0.81 3.54 1.33 4.87 Clean renewables 2.47 1.00 3.47 1.41 4.88 Transmission and storage 0.61 0.90 1.51 0.91 2.42 Additional supply technologies 2.35 0.79 3.14 1.27 4.41 Other investments 0.77 0.38 1.15 0.70 1.85
Note: These figures are based on current rates of job creation, weighted by total investment amounts over 2021-2030. Source: IMPLAN 3.1 Within these budgetary allocations, we see first in Table 6.4 that total direct plus indirect job creation generated in the San Diego region by this specific expansion in energy supply expenditures will amount to an average of about 4,200 direct jobs and 4,400 indirect jobs per year between 2021 – 2030. This totals to about 8,600 direct and indirect jobs. We also estimate that, as an average between 2021 – 2030, an additional 4,700 induced jobs will be generated in the San Diego region by these investments. This brings the total of direct, indirect and induced jobs generated by net energy supply investments to about 13,400 jobs. Table 6.4. Average number of jobs created in the San Diego region annually through energy supply expenditures from 2021-2030, by subsectors and technology. Figures assume 1 percent average annual productivity growth.
Investment Area
Average Annual Expenditure
Direct Jobs
Indirect Jobs
Direct Jobs + Indirect Jobs
Induced Jobs
Direct Jobs + Indirect Jobs + Induced Jobs
Fossil fuels $4.4 billion 2,538 3,777 6,315 3,805 10,120 Clean renewables
$629.5 million 1,488 601 2,089 848 2,937
Transmission and storage
$45.9 million 34 17 51 31 82
Additional supply technologies
$45.1 million
118 35 153 57 210 Other investments
$4.5 million 10 3 13 6 19
TOTAL $5.1 billion 4,188 4,433 8,621 4,747 13,368 Source: IMPLAN 3.1

218
Table 6.5 brings together our job creation estimates for both the energy supply investments and energy demand expenditures, resulting from spending an average of $15.0 billion per year from 2021 - 2030. We show total figures for direct plus indirect jobs only, then we also show the total when induced jobs are included. Table 6.5. Estimated Average Annual Job creation in the San Diego region through Combined Energy Supply and Energy Demand Expenditure Program, 2021-2030
Number of Direct and Indirect Jobs
Number of Direct, Indirect, and Induced Jobs
1. $9.9 billion in average annual energy demand investments
9,936 13,349
2. $5.1 billion in average annual energy supply investments
8,621 13,368
3. $15.0 in average annual energy demand investments
18,557 26,717
4. Total job creation as a share of projected 2026 labor force (projection is 1.68 million the San Diego region labor force for 2026)
1.1% 1.6%
Note: Figures assume 1 percent average annual labor productivity growth. Source: Figures derived from EER energy model for Southern California We see in row 3 of Table 6.5 that total average direct and indirect job creation between 2021 – 2030—including jobs generated on both the supply and demand-sides of the energy transformation—is, as discussed above, 18,557. Through adding induced jobs, the average annual job creation figures then rise to 26,717. As we see in row 4, this level of direct and indirect job creation would amount to between about 1.1 percent of the likely regional labor force as of 2026. When we include induced jobs in the total, we reach 1.6 percent of the likely size of the county’s 2026 labor force.
6.4 Job Quality Indicators and Worker Characteristics in Energy Demand and Supply Employment
In Tables 6.6 - 6.9, we provide some basic measures of job quality for the direct jobs in the core areas that will be generated through both the energy demand expenditures and energy supply investments within the EER central case for the San Diego region. These basic indicators include: 1) average total compensation (including wages plus benefits) for wage-earning employees; 2) the percentage of workers receiving health insurance coverage through their employer; 3) the percentage that are union members; 4) the respective levels of educational attainment for workers in the various employment sectors; and 5) the racial, ethnic and gender composition of the workforce in each sector. We first present these figures for the energy demand categories in Tables 6.6 and 6.7, then for the energy supply investments in Tables 6.8 and 6.9.

219
To provide a comparative framework for assessing the job quality features and worker characteristics in the various energy supply and demand sectors, in Appendix 2, we report figures in these areas of job quality for all employed people and worker characteristics for the total labor force in the San Diego area.i We will also refer to these figures on the overall regional workforce at various points in the discussion that follows below.
6.4.1 Energy Demand Expenditures and Job Quality
We focus here on figures for the three major energy demand expenditure areas—i.e. vehicles, HVAC, and refrigeration. These three spending categories comprise roughly 95 percent of all spending on energy demand between 2021 – 2030.
Starting with compensation figures, we see in Table 6.6 that the averages for the energy demand expenditures range between roughly $62,000 per year for workers in the vehicles category to nearly $78,000 in the refrigeration category. In general, these figures are all lower than the average compensation figures for San Diego. As we report in Appendix 2 (Table A2.1), average total compensation in the region is $80,900.
Table 6.6. Indicators of Job Quality in Energy Demand Investment Areas: Direct Jobs Only
Investment Area Average total compensation*
Health insurance coverage, percentage**
Union membership, coverage***
Vehicles $62,000 58.2% 14.9% HVAC $72,000 53.8% 12.9% Refrigeration $77,600 55.2% 14.7% Appliances $70,800 51.1% 14.3% Construction $73,200 51.9% 13.5% Lighting $73,800 50.9% 14.4% Manufacturing $71,800 64.9% 6.9% Other commercial and residential
$73,800 53.4% 13.6%
Agriculture $59,500 44.7% 5.1% Mining $61,700 76.3% --
Notes: *Compensation figures reflect only wage and salary workers, and excludes proprietors’ compensation, in the San Diego region. This is because wage and salary workers’ employment in these activities serve as their primary jobs whereas proprietors’ employment in these activities are more likely to serve only as secondary jobs. **Health insurance coverage is based on workers within the San Diego region plus the five surrounding counties that supply the San Diego region with the highest numbers of commuting workers. These counties include: Imperial County, Los Angeles County, Orange County, Riverside County, and San Bernardino County. *** Union membership is based on workers in the southern region of California. “--” indicates that the sample size was insufficient to produce a reliable estimate. Source: CPS 2015-2019, ACS 2015-2019, IMPLAN 3.1. The share of workers receiving health insurance coverage is comparable for most of these major energy demand areas, ranging between 54 percent for HVAC to 58 percent in vehicles.
i The compensation figures in Tables 6.6, 6.8, and 14 are based on employment in the San Diego region. All other job quality and workforce characteristics presented in Tables 6.6-6.11, 6.14 and 6.15 are based on workers from a wider geographical area in order to create sample sizes sufficient to generate reliable estimates. See table notes for details.
220
Similarly, the level of union membership is also comparable for most areas, ranging between about 13 - 15 percent of the workforce in the area. These figures are comparable to those for all workers in the region. For the overall regional workforce, 62.2 percent of workers have health insurance coverage and 13.3 percent are union members (see Appendix 2).
6.4.2 Educational Credentials and Racial, Ethnic and Gender Composition
In Table 6.7, we present data on both the educational credentials for workers employed in the full range of energy demand categories. We also show data on the racial, ethnic and gender composition of the existing workforce in the respective energy demand categories. We focus on the workers in the three core energy efficiency expenditure categories of vehicles, HVAC, and refrigeration, as well as the race and gender composition of these workers. We categorize all workers according to three educational credential groupings: 1) shares with high school degrees or less; 2) shares with some college or Associate degrees; and 3) shares with Bachelor’s degree or higher.
As Table 6.7 shows, the distribution of educational credentials is fairly consistent across the major energy demand spending categories. Thus, the range of workers with high school degrees or less varies from a low of 45 percent for workers employed in the vehicles category to 61 percent in refrigeration. Similarly, the share of workers with Bachelor’s degrees or higher ranges from a low of 12 percent in refrigeration to 22 percent in the vehicles category.
In terms of racial and ethnic categories, we see in Table 6.7 that the largest share of the current labor force are Latinx workers of any race. This includes about 46 precent of workers in vehicles, and about 60 percent in HVAC and refrigeration. Another 30 percent of the labor force are White non-Latinx in all three of the major energy demand categories.
For the overall regional workforce, the levels of educational attainment are spread fairly evenly between the three categories, with 33.7 percent of workers with high school degrees or less, 31.3 percent with some college or Associate’s degrees and 35.0 percent with Bachelor’s degrees or higher. The racial and ethnic distribution of the overall regional workforce is also more even than that of the energy demand categories. With the overall workforce, about 39 percent are White non-Latinx, 38 percent are Latinx of all races, 15 percent are Asian and about 5 percent are Black.
The share of female employment is between 11 – 21 percent in the major energy demand areas of vehicles, HVAC, and refrigeration, even while, as we see in Appendix 2, women make up 46 percent of the San Diego area workforce.

221
Table 6.7. Educational Credentials and Race/Gender Composition of Workers in Energy Demand Investment Areas: Direct Jobs Only
Investment Area Vehicles HVAC Refrigeration Appliances Construction Lighting Manufacturing
Other commercial
and residential Agriculture Mining Educational Credentials % with high school degree or less 45.0% 58.8% 60.5% 59.7% 61.3% 59.8% 51.0% 59.3% 65.4% 55.8%
% with some college or Associate degree 32.7% 26.9% 27.7% 26.7% 25.5% 26.6% 24.0% 27.0% 22.0% 20.2%
% with Bachelor’s degree or higher 22.3% 14.2% 11.8% 13.6% 13.1% 13.6% 25.1% 13.8% 12.5% 24.0%
Racial and Ethnic Composition % White, non-Latinx 30.0% 30.0% 29.6% 30.1% 29.8% 29.9% 25.4% 30.0% 24.6% 28.9% % Black, non-Latinx 9.0% 2.3% 2.2% 2.2% 2.3% 2.1% 2.6% 2.3% 1.1% 3.6% % Asian, non-Latinx 12.9% 6.1% 5.5% 5.4% 5.1% 5.7% 11.9% 5.9% 4.3% 11.7% % Other, non-Latinx 2.4% 1.6% 1.6% 1.6% 1.3% 1.5% 1.9% 1.6% 1.2% 4.0% % Latinx (any race) 45.8% 60.0% 61.1% 60.7% 61.5% 60.7% 58.3% 60.2% 68.8% 51.8% Gender % Women 20.8% 12.2% 10.7% 10.5% 10.9% 10.4% 32.6% 11.6% 37.2% 17.1%
Notes: Worker characteristics are based on workers within the San Diego region plus the five surrounding counties that supply the San Diego region with the highest numbers of commuting workers. These counties include: Imperial County, Los Angeles County, Orange County, Riverside County, and San Bernardino County. Source: CPS 2015-2019, ACS 2015-2019, IMPLAN 3.1.

222
6.4.3 Energy Supply Investments and Job Quality
Tables 6.8 and 6.9 present the job quality and demographic figures for all of the supply investment categories in the EER model. We focus on the two core areas of expenditures on the supply side of their model, i.e. fossil fuels and clean renewables.
As we see first in Table 6.8, compensation for workers in San Diego’s fossil fuel industry is high, with pay averaging over $180,000. This figure is clearly well above that for the three main employment categories on the demand side of the EER model, where the pay range is between $62,000 and $78,000. Average compensation in clean renewables, at roughly $100,000, is also well below that for workers in the fossil fuel industry, but still significantly higher than the averages for the energy demand categories. These compensation figures are also well above the average for the overall workforce in the San Diego region, as reported in Appendix 2.
In terms of the provision of employer-sponsored health care, the coverage rate is 83 percent for fossil fuel workers and 60 percent for those in clean renewables. The unionization rates are relatively high in these two largest energy supply areas, at 18 percent in the fossil fuel sector and 11 percent in clean renewables. These figures are close to those for the main areas of energy demand.
Table 6.8. Indicators of Job Quality in Energy Supply Investment Areas: Direct Jobs Only
Investment Area Average total compensation*
Health insurance coverage, percentage**
Union membership, coverage***
Fossil fuels $181,800 82.9% 18.0% Clean renewables $97,600 59.5% 11.5% Transmission and storage
$69,700 69.4% 15.4%
Additional supply technologies
$75,100 51.3% 14.6%
Other investments $75,900 55.8% 12.6% Notes: See notes to Table 6.6. Source: CPS 2015-2019, ACS 2015-2019, IMPLAN 3.1. 6.4.4 Educational Credentials and Racial, Ethnic and Gender Composition
In Table 6.9, we present data on both the educational credentials as well as the racial, ethnic and gender composition of the workers employed in the supply-side areas of the EER model. We again focus here only on the workers who are employed directly through these investments.
As Table 6.9 shows, in the fossil fuel sector, the educational attainment level of the industry’s workforce is evenly divided between those without high school degrees or less, those with some college, and those with Bachelor’s degrees or higher. In clean renewables, there is one major difference, in that nearly half of the workers have only high school degrees or less.

223
Table 6.9. Educational Credentials and Race/Gender Composition of Workers in Energy Supply Investment Areas: Direct Jobs Only
Investment Area Fossil fuels
Clean renewables
Transmission and storage
Additional supply technologies
Other investments
Educational Credentials % with high school degree or less 31.1% 46.5% 40.6% 58.8% 51.9% % with some college or Associate degree 35.6% 23.4% 28.7% 26.6% 25.8% % with Bachelor’s degree or higher 33.4% 30.1% 30.7% 14.6% 22.3% Racial and Ethnic Composition % White, non-Latinx 37.3% 35.2% 34.9% 28.8% 33.9% % Black, non-Latinx 5.1% 2.7% 3.4% 2.0% 2.6% % Asian, non-Latinx 11.4% 10.8% 11.6% 5.7% 7.6% % Other, non-Latinx 2.4% 2.0% 2.3% 1.5% 1.8% % Latinx (any race) 43.7% 49.4% 47.9% 62.0% 54.1% Gender % Women 23.0% 19.0% 20.4% 21.5% 16.3%
Note: See notes to Table 6.7. Sources: ACS 2015-2019, IMPLAN 3.1. In terms of the racial and ethnic composition, the largest share of the labor force are Latinx of any race, at 44 percent in the fossil fuel sector, and 49 percent in clean renewables. The Latinx shares are also in that range or higher in the smaller energy supply investment categories. White non-Latinx workers comprise another 37 percent of the workforce in the fossil fuel sector and 35 percent in clean renewables. Black non-Latinx workers represent a small share of the workforce in both fossil fuels and clean renewables, at 5.1 percent and 2.7 percent respectively.
Women remain badly underrepresented in both of these main areas of supply side expenditures, at 23 percent for fossil fuels and 19 percent in clean renewables. Again, these figures are well below the share of women in the overall regional workforce, at nearly 46 percent.
6.4.5 Prevalent Job Types with Energy Demand and Supply Employment
In addition to these average results across the various energy supply investment and energy demand expenditure areas, it is important to consider the range of the types of jobs that will be generated in each of the specified areas. To provide a picture of this range of jobs, in Tables 6.10 A-C and 6.11A-B, we present more detailed information about the jobs created by the energy demand and energy supply investments. These tables also show detailed breakdowns on the union status as well as the racial, ethnic, and gender composition of the labor force in each of the specific job categories.
Tables 6.10A-C provide representative job titles within the major occupational group that we expect will make up at least 5 percent of the direct jobs created by the three largest demand investment areas. It is difficult to summarize the detailed data on job categories presented in these tables. But the overall pattern is clear. That is, investing to build a clean energy economy will produce new employment opportunities at all levels of the regional economy. New job

224
opportunities will open for, among other occupations, carpenters, machinists, chemists, environmental scientists, secretaries, accountants, heating installers, truck drivers, pipelayers and construction laborers, as well as a full range of managerial occupations. At the same time, blue-collar jobs—such as in transportation and material moving, construction and production occupations—predominate and such jobs tend to range widely in job quality depending on such factors as unionization and subcontracting.
To see this, we also provide in Tables 6.10A-C and 6.11A-B several wage measures for each occupational group. Specifically, we show the 25th wage percentile, the 50th wage percentile (median), and the 75th wage percentile. The 25th percentile--the wage at which 25 percent of workers in the occupational group earn less and 75 percent earn more—indicates the typical pay rate at the low end of the wage distribution. Likewise, the 75th percentile—the wage at which 75 percent of workers in the occupational group earn less and 25 percent earn more—indicates the typical pay rate at the high end of the wage distribution. The median figure provides the wage rate of the worker exactly in the middle of the wage distribution.i
These wage figures in Tables 6.10A-C and 6.11A-B show that the quality of jobs can range widely, with a significant share reasonably characterized as low wage. Take for example, production jobs and transportation and material moving jobs produced by investments in vehicles. Typical pay rates for these jobs range roughly between $12.00 and $22.00, with half of workers in these jobs earning less than $16.00 per hour. Pay rates among construction and office jobs from these investments range more widely, indicating a greater mix of low- to high- wage jobs. The 25th, 50th, and 75th wage percentiles among these jobs correspond closely with those in the overall workforce. For the overall regional labor force, as we report in Appendix 2, workers in the 25th percentile earn an average of $12.90 per hour, the median worker earns $18.90 per hour, and the 75th percentile worker is paid $31.90 per hour. ii
Management jobs, on the other hand, consistently provide higher wages. However, with the managers as well, pay ranges widely, typically between $30.00 and $54.00. The types of jobs generated from investments in HVAC, refrigeration and clean renewables, and the pay rates for these jobs, largely mirror those through investments in vehicles. The one significant exception is that construction employment represents a larger share of employment in the HVAC, refrigeration and clean renewable sectors, as opposed to the transportation and material moving jobs, which are more heavily represented in the production of vehicles.
The prevalent job types from spending on fossil fuels have two qualities that distinguish them from the jobs generated by other spending areas. First, fossil-fuel jobs are composed of a greater variety of occupations with none of the representative occupations taking up more than
i Note that these wage figures are different from the compensation figures in Tables 6.6 and 6.7 which include the value of benefits, such as employer-sponsored health insurance. ii Note that these wage estimates are based on wage data pooled from 2015-2019 and are adjusted for inflation to reflect 2020 dollars. However, during these years the state minimum increased from $9.00 in 2015 to $12.00 in 2019 for employers with at least 26 employees. This minimum is $14.00 as of January 2021 (slightly lower rates applied to smaller employers). If we were able to estimate these wages based only on data from 2021 or even 2019, the 25th wage percentile would undoubtedly be higher.
225
15 percent of total employment generated by these investments. At the same time, blue collar occupations still comprise about half of the fossil fuel jobs, much higher than the one-fifth that exists in San Diego’s overall labor market.i Second, with the exception of management occupations, the fossil fuel jobs pay higher rates—even when comparing them to jobs within the same representative occupational groups. Take construction occupations, for example. Typical pay rates in the construction jobs generated by fossil fuel spending range between $21.00 and $40.00 as compared to $13.00 to $28.00 among the jobs created by the other spending areas.
In sum, Tables 6.10A-C and 6.11A-B show the wide-range in job types among demand and supply employment. At the same time, a significant share of these jobs currently pay relatively low wages. Therefore, the clean energy investments agenda for San Diego should include policies that will ensure decent wages, benefits and working conditions.
The figures in these tables on racial, ethnic and gender proportions vary by the specific job categories. For example, the share of Latinx workers in management positions in all of the energy supply and demand sectors is relatively low, ranging between 21 – 28 percent while the share in production jobs is mostly around 70 percent. Similarly, in terms of gender composition, between about 50 – 70 percent of workers employed in office and administrative support are women. By contrast, women hold only between 2 – 4 percent of the construction jobs in the various sectors. Whites hold over 50 percent of the management positions in all of the specific employment areas. Regional decarbonization should therefore also include measures to address these disparities by race, ethnicity, and gender as a central feature of its overall policy package.
i According to data from the Labor Department’s Occupational Employment and Wages Statistics program, the blue-collar occupational groups (construction and extraction; production; installation, maintenance and repair; farming, fishing, and forestry; building and grounds cleaning and maintenance; and transportation and material moving) made up about 20 percent of employment in the San Diego metropolitan area in May 2020.

226
Table 6.10A. Vehicles: Prevalent Job Types: (Job categories with 5 percent or more employment)
Job Category Transportation and material moving Construction Production Management
Office and administrative support
Percentage of Total Industry Employment 38.2% 13.7% 13.6% 9.3% 7.0%
Representative Occupations Order fillers; freight movers; bus drivers
Electricians; carpenters; construction laborers
First-line supervisors; welding workers; electrical assemblers;
General managers; marketing managers; construction managers
Dispatchers; bookkeeping clerks; administrative assistants
Wages
25th percentile $12.20 $13.70 $12.20 $29.50 $14.50
50th percentile (median) $15.60 $18.70 $15.40 $44.40 $20.90
75th percentile $21.50 $27.70 $18.30 $53.70 $26.10
Union Status
% Union Members or Covered by Union Contract 19.9% 15.3% 10.1% 5.5% 8.8%
Racial and Ethnic Composition
White 29.0% 21.0% 13.8% 56.8% 30.4%
Black 16.9% 2.2% 2.5% 4.8% 7.8%
Asian 12.1% 2.9% 10.6% 12.7% 12.7%
Other 3.1% 1.1% 1.2% 3.4% 2.7%
Latinx 39.0% 72.8% 71.8% 22.3% 46.4%
Gender
Women 21.6% 2.3% 20.9% 16.8% 55.7%
Note: This table—aside from wages and unionization rates—is based on workers within the San Diego region plus the five surrounding counties that supply the San Diego region with the highest numbers of commuting workers. These counties include: Imperial County, Los Angeles County, Orange County, Riverside County, and San Bernardino County. To achieve sufficient sample sizes, wage and union estimates from the CPS -ORG files are based on workers from the southern region of California. This region includes the counties: Fresno, Imperial, Inyo, Kern, Kings, Los Angeles, Mono, Orange, Riverside, San Bernardino, San Diego, Santa Barbara, Tulare and, Ventura. The wage data are adjusted for inflation to reflect 2020 dollars. However, during these years the state minimum increased from $9.00 in 2015 to $12.00 in 2019 for employers with at least 26 employees (slightly lower rates applied to smaller employers). This minimum is $14.00 as of January 2021. If we were able to estimate these wages based only on data from 2021 or even 2019, the 25th wage percentile would undoubtedly be higher. Sources: ACS 2015-2019, IMPLAN 3.1, and CPS-ORG 2015-2019.

227
Table 6.10B. HVAC: Prevalent Job Types: (Job categories with 5 percent or more employment)
Job Category Construction Management Production Office and administrative support
Percentage of Total Industry Employment 53.0% 13.2% 9.5% 6.3%
Representative Occupations Electricians, first-line supervisors; painters
Chief executives; operations managers; sales managers
First-line supervisors; brazing workers; assemblers
Shipping clerks; accounting clerks; general office clerks
Wages
25th percentile $14.60 $25.90 $12.90* $13.60*
50th percentile (median) $19.00 $35.70 $16.40 $19.40
75th percentile $27.70 $52.00 $22.60 $26.00
Union Status
% Union Members or Covered by Union Contract 16.4% 6.8% 9.7% 5.7%
Racial and Ethnic Composition
White 21.0% 59.0% 16.5% 40.2%
Black 1.7% 2.4% 1.4% 3.7%
Asian 2.7% 8.8% 9.2% 8.3%
Other 1.2% 2.0% 1.1% 4.1%
Latinx 73.4% 27.8% 71.8% 43.8%
Gender Composition
Women 2.0% 14.7% 17.6% 71.6%
Sources: ACS 2015-2019, IMPLAN 3.1, CPS-ORG, 2015-2019. See notes to Table 6.10A.

228
Table 6.10C. Refrigeration: Prevalent Job Types: (Job categories with 5 percent or more employment)
Job Category Construction Production Installation and maintenance Management
Office and administrative support
Percentage of Total Industry Employment 34.2% 21.4% 15.5% 8.9% 6.6%
Representative Occupations First-line supervisors; painters; construction laborers
Inspectors; machinists; soldering workers
General maintenance workers; heating installers; heavy vehicle technicians
Marketing managers; operations managers; chief executives
Inventory clerks; general office clerks; auditing clerks
Wages
25th percentile $14.70 $12.20 $14.90 $25.10 $15.60
50th percentile (median) $19.00 $16.40 $19.90 $34.60 $19.90
75th percentile $27.70 $20.70 $25.90 $54.20 $28.40
Union Status
% Union Members or Covered by Union Contract 16.5% 20.1% 15.7% 7.1% 4.6%
Racial and Ethnic Composition
White 21.0% 17.3% 33.6% 61.7% 40.9%
Black 1.7% 3.4% 0.9% 2.4% 2.7%
Asian 2.8% 4.6% 4.1% 8.5% 9.0%
Other 1.1% 1.7% 1.5% 2.0% 4.2%
Latinx 73.4% 73.0% 59.9% 25.5% 43.1%
Gender Composition
Women 2.3% 5.2% 1.7% 15.5% 73.5%
Sources: ACS 2015-2019, IMPLAN 3.1, CPS-ORG, 2015-2019. See notes to Table 6.10A.
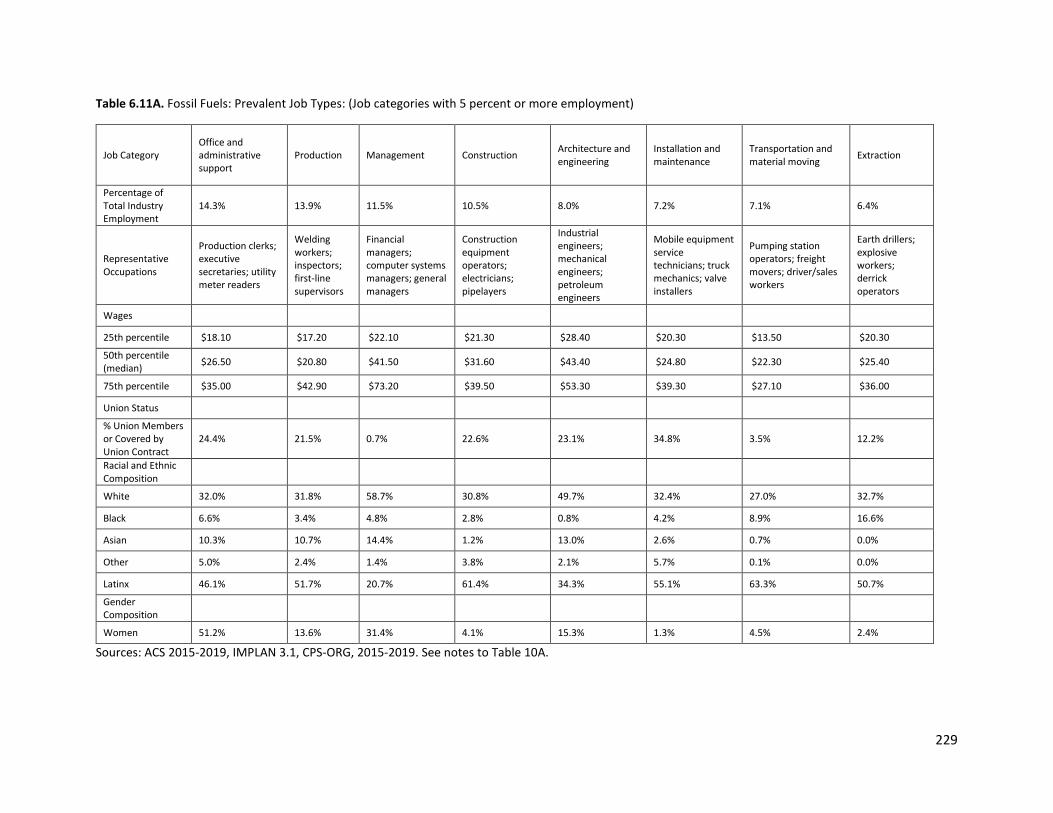
229
Table 6.11A. Fossil Fuels: Prevalent Job Types: (Job categories with 5 percent or more employment)
Job Category Office and administrative support
Production Management Construction Architecture and engineering
Installation and maintenance
Transportation and material moving Extraction
Percentage of Total Industry Employment
14.3% 13.9% 11.5% 10.5% 8.0% 7.2% 7.1% 6.4%
Representative Occupations
Production clerks; executive secretaries; utility meter readers
Welding workers; inspectors; first-line supervisors
Financial managers; computer systems managers; general managers
Construction equipment operators; electricians; pipelayers
Industrial engineers; mechanical engineers; petroleum engineers
Mobile equipment service technicians; truck mechanics; valve installers
Pumping station operators; freight movers; driver/sales workers
Earth drillers; explosive workers; derrick operators
Wages
25th percentile $18.10 $17.20 $22.10 $21.30 $28.40 $20.30 $13.50 $20.30
50th percentile (median) $26.50 $20.80 $41.50 $31.60 $43.40 $24.80 $22.30 $25.40
75th percentile $35.00 $42.90 $73.20 $39.50 $53.30 $39.30 $27.10 $36.00
Union Status
% Union Members or Covered by Union Contract
24.4% 21.5% 0.7% 22.6% 23.1% 34.8% 3.5% 12.2%
Racial and Ethnic Composition
White 32.0% 31.8% 58.7% 30.8% 49.7% 32.4% 27.0% 32.7%
Black 6.6% 3.4% 4.8% 2.8% 0.8% 4.2% 8.9% 16.6%
Asian 10.3% 10.7% 14.4% 1.2% 13.0% 2.6% 0.7% 0.0%
Other 5.0% 2.4% 1.4% 3.8% 2.1% 5.7% 0.1% 0.0%
Latinx 46.1% 51.7% 20.7% 61.4% 34.3% 55.1% 63.3% 50.7%
Gender Composition
Women 51.2% 13.6% 31.4% 4.1% 15.3% 1.3% 4.5% 2.4%
Sources: ACS 2015-2019, IMPLAN 3.1, CPS-ORG, 2015-2019. See notes to Table 10A.
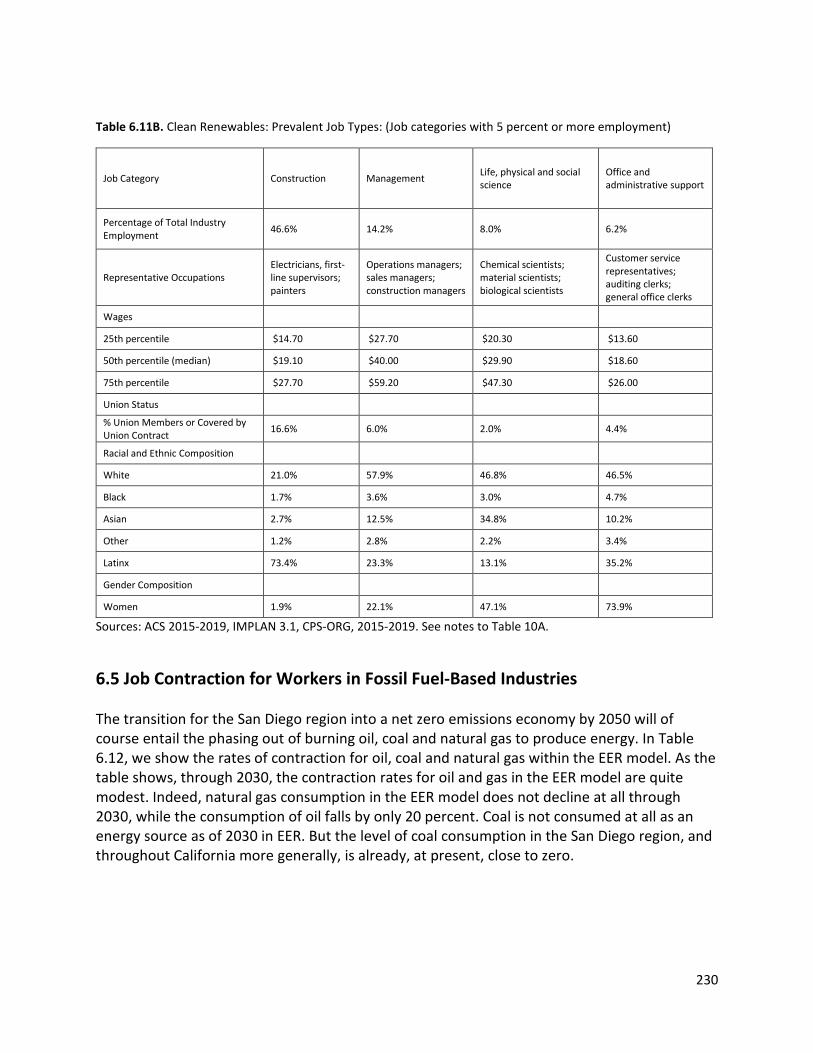
230
Table 6.11B. Clean Renewables: Prevalent Job Types: (Job categories with 5 percent or more employment)
Job Category Construction Management Life, physical and social science
Office and administrative support
Percentage of Total Industry Employment 46.6% 14.2% 8.0% 6.2%
Representative Occupations Electricians, first-line supervisors; painters
Operations managers; sales managers; construction managers
Chemical scientists; material scientists; biological scientists
Customer service representatives; auditing clerks; general office clerks
Wages
25th percentile $14.70 $27.70 $20.30 $13.60
50th percentile (median) $19.10 $40.00 $29.90 $18.60
75th percentile $27.70 $59.20 $47.30 $26.00
Union Status
% Union Members or Covered by Union Contract 16.6% 6.0% 2.0% 4.4%
Racial and Ethnic Composition
White 21.0% 57.9% 46.8% 46.5%
Black 1.7% 3.6% 3.0% 4.7%
Asian 2.7% 12.5% 34.8% 10.2%
Other 1.2% 2.8% 2.2% 3.4%
Latinx 73.4% 23.3% 13.1% 35.2%
Gender Composition
Women 1.9% 22.1% 47.1% 73.9%
Sources: ACS 2015-2019, IMPLAN 3.1, CPS-ORG, 2015-2019. See notes to Table 10A.
6.5 Job Contraction for Workers in Fossil Fuel-Based Industries The transition for the San Diego region into a net zero emissions economy by 2050 will of course entail the phasing out of burning oil, coal and natural gas to produce energy. In Table 6.12, we show the rates of contraction for oil, coal and natural gas within the EER model. As the table shows, through 2030, the contraction rates for oil and gas in the EER model are quite modest. Indeed, natural gas consumption in the EER model does not decline at all through 2030, while the consumption of oil falls by only 20 percent. Coal is not consumed at all as an energy source as of 2030 in EER. But the level of coal consumption in the San Diego region, and throughout California more generally, is already, at present, close to zero.
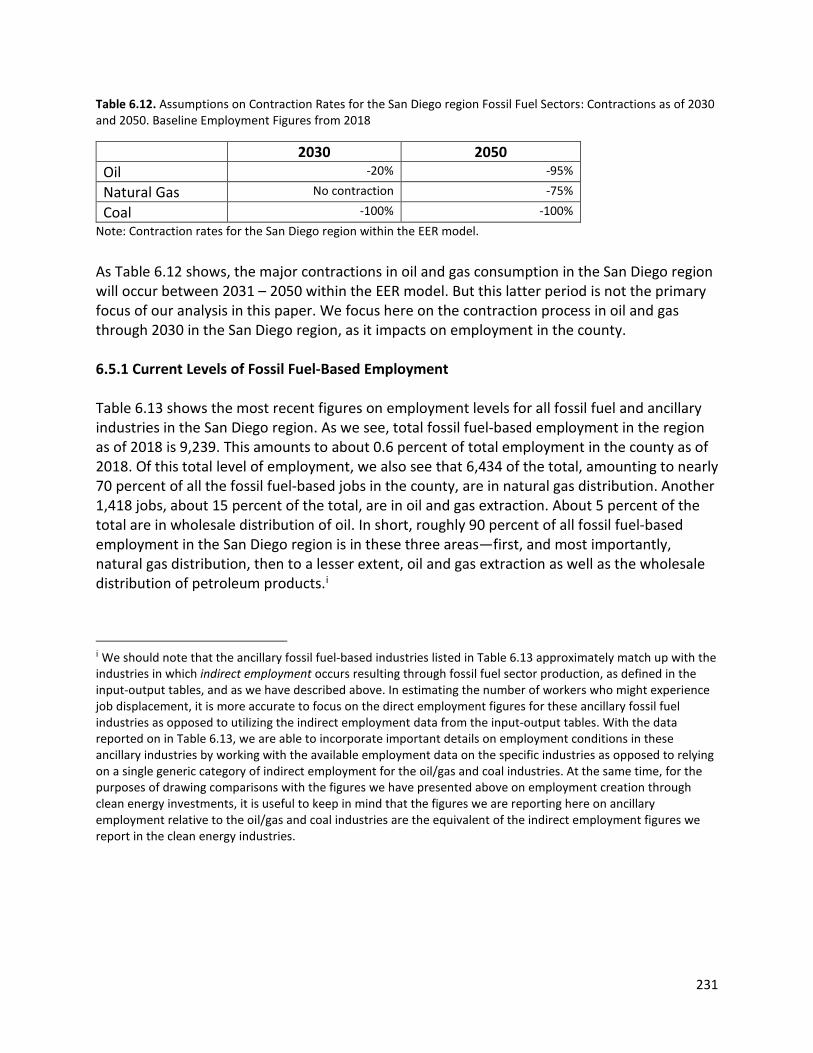
231
Table 6.12. Assumptions on Contraction Rates for the San Diego region Fossil Fuel Sectors: Contractions as of 2030 and 2050. Baseline Employment Figures from 2018
2030 2050 Oil -20% -95%
Natural Gas No contraction -75%
Coal -100% -100% Note: Contraction rates for the San Diego region within the EER model. As Table 6.12 shows, the major contractions in oil and gas consumption in the San Diego region will occur between 2031 – 2050 within the EER model. But this latter period is not the primary focus of our analysis in this paper. We focus here on the contraction process in oil and gas through 2030 in the San Diego region, as it impacts on employment in the county. 6.5.1 Current Levels of Fossil Fuel-Based Employment Table 6.13 shows the most recent figures on employment levels for all fossil fuel and ancillary industries in the San Diego region. As we see, total fossil fuel-based employment in the region as of 2018 is 9,239. This amounts to about 0.6 percent of total employment in the county as of 2018. Of this total level of employment, we also see that 6,434 of the total, amounting to nearly 70 percent of all the fossil fuel-based jobs in the county, are in natural gas distribution. Another 1,418 jobs, about 15 percent of the total, are in oil and gas extraction. About 5 percent of the total are in wholesale distribution of oil. In short, roughly 90 percent of all fossil fuel-based employment in the San Diego region is in these three areas—first, and most importantly, natural gas distribution, then to a lesser extent, oil and gas extraction as well as the wholesale distribution of petroleum products.i
i We should note that the ancillary fossil fuel-based industries listed in Table 6.13 approximately match up with the industries in which indirect employment occurs resulting through fossil fuel sector production, as defined in the input-output tables, and as we have described above. In estimating the number of workers who might experience job displacement, it is more accurate to focus on the direct employment figures for these ancillary fossil fuel industries as opposed to utilizing the indirect employment data from the input-output tables. With the data reported on in Table 6.13, we are able to incorporate important details on employment conditions in these ancillary industries by working with the available employment data on the specific industries as opposed to relying on a single generic category of indirect employment for the oil/gas and coal industries. At the same time, for the purposes of drawing comparisons with the figures we have presented above on employment creation through clean energy investments, it is useful to keep in mind that the figures we are reporting here on ancillary employment relative to the oil/gas and coal industries are the equivalent of the indirect employment figures we report in the clean energy industries.
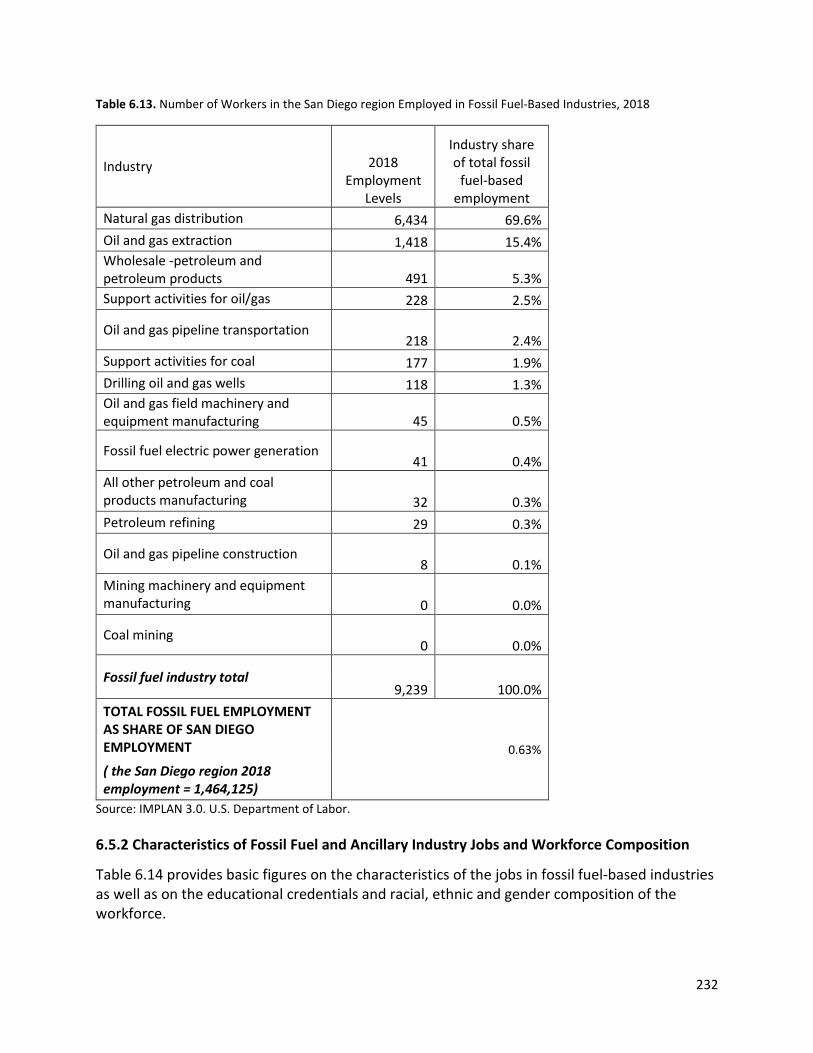
232
Table 6.13. Number of Workers in the San Diego region Employed in Fossil Fuel-Based Industries, 2018
Industry 2018 Employment
Levels
Industry share of total fossil
fuel-based employment
Natural gas distribution 6,434 69.6% Oil and gas extraction 1,418 15.4% Wholesale -petroleum and petroleum products 491 5.3% Support activities for oil/gas 228 2.5%
Oil and gas pipeline transportation 218 2.4%
Support activities for coal 177 1.9% Drilling oil and gas wells 118 1.3% Oil and gas field machinery and equipment manufacturing 45 0.5%
Fossil fuel electric power generation 41 0.4%
All other petroleum and coal products manufacturing 32 0.3% Petroleum refining 29 0.3%
Oil and gas pipeline construction 8 0.1%
Mining machinery and equipment manufacturing 0 0.0%
Coal mining 0 0.0%
Fossil fuel industry total 9,239 100.0%
TOTAL FOSSIL FUEL EMPLOYMENT AS SHARE OF SAN DIEGO EMPLOYMENT 0.63%
( the San Diego region 2018 employment = 1,464,125)
Source: IMPLAN 3.0. U.S. Department of Labor. 6.5.2 Characteristics of Fossil Fuel and Ancillary Industry Jobs and Workforce Composition
Table 6.14 provides basic figures on the characteristics of the jobs in fossil fuel-based industries as well as on the educational credentials and racial, ethnic and gender composition of the workforce.

233
Starting with the compensation figures, the table shows that, on average, these are relatively high-quality jobs. The average overall compensation level is $212,900. Of course, this figure is 2 – 3 times higher than any of the energy demand sectors, as reported in Table 6.6. It is also more than twice as high as the average compensation level in renewable energy. Table 6.14. Characteristics of Workers Employed in the San Diego region’s Fossil Fuel-Based Sectors
Fossil Fuel-Based industries
Average total compensation
$212,900
Health insurance coverage
86.8%
Union membership coverage*
21.9%
Educational credentials Share with high school degree or less
25.2%
Share with some college or Associate degree
36.3%
Share with Bachelor’s degree or higher
38.5%
Racial and ethnic composition of workforce % White, non-Latinx 37.6% % Black, non-Latinx 4.9% % Asian, non-Latinx 12.2% % Other, non-Latinx 3.1% % Latinx (any race) 42.2% Gender composition of workforce Pct. female workers 26.1%
Note: All the estimates-aside from the compensation figures and union membership coverage—in this table are based on data from the ACS. Compensation figures are from IMPLAN and are for the San Diego region. The estimates for the other characteristics are based on data from workers in the San Diego region plus the five surrounding counties that supply the San Diego region with the highest numbers of commuting workers. These counties include: Imperial County, Los Angeles County, Orange County, Riverside County, and San Bernardino County. The one exception is the union measure. The ACS does not ask about union membership. The union coverage measure is estimated from the ORG files of the CPS which have smaller sample sizes than the ACS. To construct an adequate sample size, the union density measure is based on 14 counties that make up the southern region of California. These include: Fresno, Imperial, Inyo, Kern, Kings, Los Angeles, Mono, Orange, Riverside, San Bernardino, San Diego, Santa Barbara, Tulare, and Ventura. Source: ACS 2015-2019; CPS ORG 2015-2019. The figure is even roughly $30,000 higher than the $182,000 average compensation figure we report in Table 6.8 for the supply-side investments in the fossil fuel sector itself. The reason that the Table 6.8 and 6.14 figures are not identical, even though they both are showing compensation figures in the fossil fuel sector, is that the mix of specific spending areas within the supply investment categories is not the same as the current overall profile of employment in the county’s fossil fuel sectors.

234
Workers in these industries are also relatively well off in terms of the benefits they receive from their jobs. Nearly 90 percent of them receive health insurance from their jobs. Union membership is at nearly 22 percent. This figure is more than 3 times higher than the average for the entire U.S. private sector, at only 6.2 percent, and also higher than the average 13 percent for the Southern California (see Appendix 2). Again, these figures are largely reflecting the favorable working conditions in the natural gas distribution industry in the region. All of these job quality measures are also high in comparison with the figures for the overall regional workforce—i.e. the same overall regional workforce figures we report in Appendix 2 and have summarized in the text above. With respect to workforce composition, the jobs are, first of all, distributed fairly evenly with respect to educational credentials, with 25 percent of workers having high school degrees or less, 36 percent having some college and 39 percent with Bachelor’s degrees or higher. As with the figures we saw with respect to clean energy sectors, Latinx workers of all races constitute the largest proportion of the labor force, at 42 percent. White non-Latinx workers represent another 38 percent of the labor force in the fossil fuel-based sectors. Thus, Latinx and White non-Latinx workers account between them for 80 percent of the overall labor force. Asian non-Latinx workers account for another 12 percent. Black non-Latinx workers represent slightly less than 5 percent of the labor force. Again, as with the figures on clean energy, women are significantly underrepresented, at only 26 percent of the total. We provide more specifics on the composition of the workforce in the fossil fuel-based industries in Table 6.15, in which we list all the job categories in which 5 percent or more of the workforce is employed, as well as estimates of the wages these jobs typically pay as in Tables 6.10 and 6.11. As we see, the highest percentage of jobs, at 18.6 percent, are in office and administrative support, including dispatchers, production clerks and meter readers. Various forms of management are the next largest category of employment in the fossil fuel-based industries in San Diego, at 12.4 percent. Next comes production workers, at 10.6 percent of all employment. The representative occupations in these jobs include welding workers, inspectors and first-line supervisors.
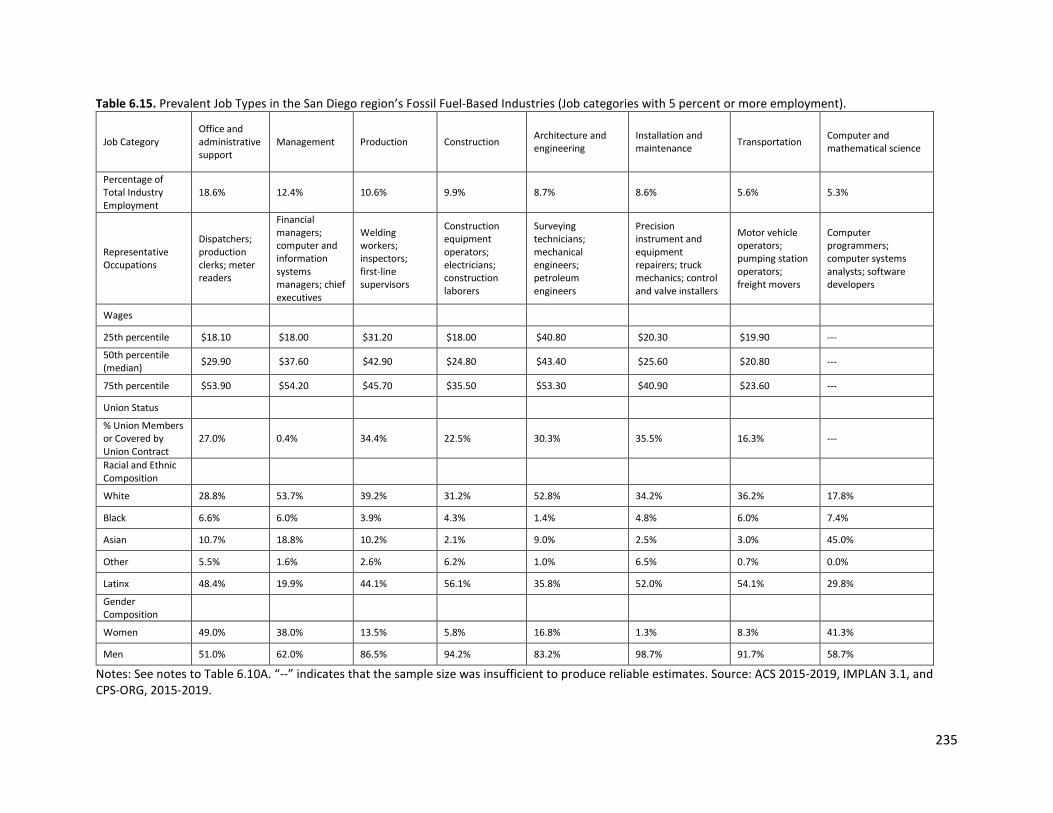
235
Table 6.15. Prevalent Job Types in the San Diego region’s Fossil Fuel-Based Industries (Job categories with 5 percent or more employment).
Job Category Office and administrative support
Management Production Construction Architecture and engineering
Installation and maintenance Transportation Computer and
mathematical science
Percentage of Total Industry Employment
18.6% 12.4% 10.6% 9.9% 8.7% 8.6% 5.6% 5.3%
Representative Occupations
Dispatchers; production clerks; meter readers
Financial managers; computer and information systems managers; chief executives
Welding workers; inspectors; first-line supervisors
Construction equipment operators; electricians; construction laborers
Surveying technicians; mechanical engineers; petroleum engineers
Precision instrument and equipment repairers; truck mechanics; control and valve installers
Motor vehicle operators; pumping station operators; freight movers
Computer programmers; computer systems analysts; software developers
Wages
25th percentile $18.10 $18.00 $31.20 $18.00 $40.80 $20.30 $19.90 ---
50th percentile (median) $29.90 $37.60 $42.90 $24.80 $43.40 $25.60 $20.80 ---
75th percentile $53.90 $54.20 $45.70 $35.50 $53.30 $40.90 $23.60 ---
Union Status
% Union Members or Covered by Union Contract
27.0% 0.4% 34.4% 22.5% 30.3% 35.5% 16.3% ---
Racial and Ethnic Composition
White 28.8% 53.7% 39.2% 31.2% 52.8% 34.2% 36.2% 17.8%
Black 6.6% 6.0% 3.9% 4.3% 1.4% 4.8% 6.0% 7.4%
Asian 10.7% 18.8% 10.2% 2.1% 9.0% 2.5% 3.0% 45.0%
Other 5.5% 1.6% 2.6% 6.2% 1.0% 6.5% 0.7% 0.0%
Latinx 48.4% 19.9% 44.1% 56.1% 35.8% 52.0% 54.1% 29.8%
Gender Composition
Women 49.0% 38.0% 13.5% 5.8% 16.8% 1.3% 8.3% 41.3%
Men 51.0% 62.0% 86.5% 94.2% 83.2% 98.7% 91.7% 58.7%
Notes: See notes to Table 6.10A. “--” indicates that the sample size was insufficient to produce reliable estimates. Source: ACS 2015-2019, IMPLAN 3.1, and CPS-ORG, 2015-2019.

236
Generally speaking, as with the areas of employment in both the demand and supply sides of the EER expenditure program, we see that the San Diego region’s fossil fuel-based industries employ a wide range of workers. Some of them will have skills specific to the industry and will therefore face difficulties moving into new employment areas. But the majority of the workers will have jobs that should be transferable to new employment opportunities, in the clean energy economy or elsewhere. Additionally, as can be expected, the pay rates of fossil fuel-based industry jobs look similar to those among jobs generated by the fossil fuel investments represented in Table 6.11A. These jobs—in Tables 6.11A as well as in Table 6.15—have typical pay rates that are higher than in the region overall. As a result, for those workers who need to move into new employment areas, an important component to a just transition will be the wage insurance policies discussed below.
As we have seen with the clean energy investment areas, there are significant differences in the racial, ethnic and gender composition of the labor forces in the respective sectors. Thus, White workers account for a majority of the workforce in management jobs as well as those in architecture and engineering. Asian workers account for the largest employment share in computers and mathematical science positions, at 45 percent of the labor force. Latinx workers represent the largest share in the all the other employment categories, i.e. office and administrative support, production, construction, installation and transportation. Women account for nearly 50 percent of the labor force in office and administrative jobs. They also represent roughly 40 percent of the labor force in management and computer and mathematical science positions. The share of women otherwise ranges between 1 – 17 percent in the areas of production, construction, architecture/engineering, installation/maintenance, and transportation.
6.5.3 Estimating Annual Job Losses through Fossil Fuel Contraction
For understanding the impact on employment of the phase-down of the fossil fuel-based industries in the San Diego region (and elsewhere), the most relevant metric will be the rate at which workers are likely to be losing their jobs through the phase-down. Within the EER Chapter 2 model, we have seen that, by 2030, the level of oil consumption will be 20 percent lower than at present, while natural gas consumption will remain stable. We have also reported in Table 6.8 that, through the supply-side investments in the EER model, over 6,000 new jobs will be generated on average between 2021 – 2030 in the county’s fossil fuel sectors. Nevertheless, the contraction of the county’s consumption of oil by 20 percent will engender some job losses.
Moreover, the assumption in EER of a stable level of natural gas consumption in the San Diego region is crucial since, as we have seen, roughly 70 percent of the 9,239 fossil fuel industry-based jobs in the county are in the natural gas distribution sector. Most of these jobs will remain at current levels through 2030. However, some employment losses will still result even in this sector through 2030. This is because, while consumption of natural gas will remain stable in the San Diego region through 2030, there will also be no need to expand the county’s natural gas distribution infrastructure. Rather, the county’s existing natural gas distribution channels should remain adequate through 2030, given the county’s stable natural gas consumption level. As such, it is reasonable to assume that the construction industry jobs associated with the San
237
Diego region’s natural gas industry—jobs that would be tied to the expansion of the sector—will be phased out by 2030. We have incorporated this factor into our estimate below of the overall fossil fuel-based industry employment losses through 2030.
We therefore estimate the total number of jobs that will be phased out in San Diego’s fossil fuel-based industries through 2030, based on the assumptions that: 1) oil consumption declines by 20 percent; 2) natural gas consumption remains constant; and 3) construction activity in the natural gas sector falls to zero. We then also need to incorporate two other considerations in generating the job contraction estimates for the county’s fossil fuel-based sectors. These are: 1) the attrition rate in the sector’s labor force due to voluntary retirements; and 2) whether the rate of contraction will be steady or episodic.
Labor force attrition through voluntary retirements. About 80 percent of workers in the U.S. fossil fuel-based industries choose to retire voluntarily once they reach age 65. As the San Diego region’s fossil fuel-based industries contract, the workers employed in the industry who are choosing to retire will, of course, not experience job losses, in contrast with those workers, of all ages, who are not choosing to retire. As such, to the extent that the rate of voluntary retirements in the industry counterbalances against the rate at which the industry is contracting, the extent of job losses and displacement experienced by workers in the industry will be correspondingly reduced. It therefore becomes an important component of our estimate of job losses in the sector to take account of the rate of voluntary retirements per year in the industry.
Steady versus Episodic Industry Contraction. The scope and cost of any set of policies to manage a just transition for impacted workers will depend heavily on whether the contraction is steady or episodic. Under a pattern of steady contraction, there will be uniform annual employment losses over both the 2020 – 2030 and 2031 – 2050 periods, with the steady rates determined by the overall level of industry contraction within the given time period. But it is not realistic to assume that the pattern of industry contraction will necessarily proceed at a steady rate. An alternative pattern would entail relatively large episodes of employment contraction, followed by periods in which no further employment losses are experienced. This type of pattern would occur if, for example, one or more relatively large firms were to undergo large-scale cutbacks at one point in time as the industry overall contracts, or even for such firms to shut down altogether.
The costs of a just transition will be much lower if the transition is able to proceed steadily rather than through a series of episodes. One reason is that, under a steady transition, the proportion of workers who will retire voluntarily in any given year will be predictable. This will enable the transition process to avoid having to provide support for a much larger share of workers. The share of workers requiring support would rise if several large businesses were to shut down abruptly and lay off their full work force at once, including both younger as well as older workers. Similarly, it will be easier to find new jobs for displaced workers if the pool of displaced workers at any given time is smaller.
For the purposes of our calculations, we proceed by assuming that the San Diego region will successfully implement a relatively smooth contraction of its fossil fuel industries. This indeed

238
would be one important feature of a well-designed and effectively implemented just transition program. As a practical matter, a relatively smooth transition should be workable as long as policymakers remain focused on that goal.
Incorporating these considerations, in Table 6.16, we show figures on annual employment reductions in the county’s fossil fuel-based industries over 2021 – 2030. We also then estimate the proportion of workers who will move into voluntary retirement at age 65 as of 2030. Once we know the share of workers who will move into voluntary retirement at age 65, we can then estimate the number of workers who will be displaced through the industry-wide contraction.
Table 6.16. Attrition by Retirement and Job Displacement for Fossil Fuel. Workers in the San Diego region, 2021-2030.
Fossil Fuel Workers 1) Total workforce as of 2018
9,239
2) Job losses over 10-year transition, 2021-2030 1,078*
3) Average annual job loss over 10-year production decline (= row 2/10)
108
4) Number of workers reaching 65 over 2021-2030 (=row 1 x % of workers 54 and over in 2019)
1,977 (21.4 % of all
workers) 5) Number of workers per year reaching 65 during 10-year transition period (=row 4/10)
198
6) Number of workers per year reaching age 65 and retiring voluntarily (=row 5 x % retiring voluntarily)
158 (80% of 65+ workers retire voluntarily**)
7) Number of workers requiring re-employment (= row 3 – row 6)
0
Source: Table 6.1. Note: *Job losses includes 605 construction jobs in the natural gas distribution industry that will phase out in phase 1 because the industry will contract by 75 percent during 2031-2050. **The 80 percent retirement rate for workers over 65 is derived from U.S. Bureau of Labor Statistics data: https://www.bls.gov/cps/cpsaat03.htm. According to these BLS data, 20 percent of 65+ year-olds remain in the workforce. We therefore assume that 80 percent of workers age 65 years and over retire voluntarily. We begin in Table 6.16 with the total fossil fuel-based industry workforce of 9,239 workers. Based on the respective contraction rates for the oil and construction activity in natural gas, we estimate that the total job contraction will amount to 1,078 workers over 2021 – 2030 Assuming a steady rate of contraction, this amounts to an average rate of job losses of 108 per year.
We then estimate that 1,977 workers employed in the industry will reach the age of 65 over 2021 – 2030, which averages to 198 workers per year. Of this total, we assume that 80 percent
239
of these workers will retire voluntarily once they reach age 65.i This amounts to 158 workers in the San Diego region’s fossil fuel-based industries retiring voluntarily per year.
Thus, according to our estimates, 108 jobs per year will be lost in the San Diego region due to the County’s contraction of fossil fuel consumption, while 158 workers per year will voluntarily retire from the industry. In total therefore, the San Diego region should not experience any job displacements through 2030 as a result of the county’s commitment to move onto a zero emissions trajectory through 2030. In other words, through until 2030, no workers in the county that are currently employed in any of its fossil fuel-based industries will require reemployment.
6.5.4 Planning a Just Transition Program
In working from the EER model for transitioning the San Diego region into a zero emissions economy by 2050, we have seen that the fossil fuel industry in the county will not experience job displacements through 2030. However, job displacements will certainly result between 2031 – 2050, as oil consumption in the county falls by 95 percent relative to the present level and natural gas consumption falls by 75 percent. As such, as one critical part of the project of advancing the transition to a zero emissions economy by 2050, the San Diego region should begin now to develop a viable set of just transition policies for the workers in the community who will experience job displacement between 2031 – 2050.
In previous work, we have outlined just transition programs both for the U.S. overall and for specific states, including California and Colorado that include five policy measures (e.g. Pollin et al. 2019,4 2020,3 and 20215). These are:
1. Pension guarantees for all workers in fossil fuel-based industries, especially those workers who will be retiring voluntarily over the transition period;
2. Reemployment guarantees for all displaced workers. 3. Wage insurance for all displaced workers. One approach is to guarantee 3 years of total
compensation at levels the workers had been receiving in their fossil fuel jobs. 4. Retraining support. This could include 2 years of retraining support for workers who
required this in their new areas of employment. 5. Relocation support. This should be sufficient to cover full moving expenses for all
workers who are forced to relocate. To date, Colorado has been most active in advancing just transition measures in the state. In particular, in 2019, it established an Office of Just Transition.1 According to website of the office, its purpose is as follows:
To assist workers and communities that will be adversely affected by the loss of jobs and revenues due to the closure of coal mines and coal-fired power plants. Its purpose is to
i Our voluntary retirement figure is based only on those who are 65 years and older. We do not assume any early retirements (i.e., no workers retire before they reach age 65 years).

240
help workers transition to new, high-quality, jobs, to help communities continue to thrive by expanding and attracting diverse businesses, and to replace lost revenues.i
Colorado Governor Polis has also been active in supporting just transition measures at the federal level.
It would be beneficial for the San Diego region to begin now to consider the most effective ways through which to implement this, or some comparable set of measures. To begin this process now will greatly increase the likelihood that the county will succeed in building a zero emissions economy while also preventing large numbers of community members from experiencing major economic losses as the transition program advances.
i https://cdle.colorado.gov/offices/the-office-of-just-transition/about-the-office-of-just-transition

241
Appendix 6.A Employment Impacts of Geothermal Energy Projects for Imperial County
In Chapter 2 of this project, “Geospatial Analysis of Renewable Energy Production,” Emily Leslie and Joseph Bettles describe a project to develop geothermal energy production sites in Imperial County. They write: Five geothermal sites are identified in Imperial County with generation of 10,680 GWh of electricity (seen as green points in Figure 2.8). This analysis assumes these plants become fully operational by 2030 and supply the remaining capacity to San Diego after satisfying Imperial’s electricity demand (see assumptions in Appendix 2.D). In this note, we estimate the employment impacts of developing this geothermal energy project. Because the project will be developed in Imperial County rather than the San Diego region, we estimate in this case the employment effects throughout Southern California. Our estimate is that this project will generate about 1,900 jobs per year throughout Southern California over the course of the 10-year period to complete the work. We derive this result as follows: 1. Leslie and Bettles state that the aim of the project will be to generate 10,680 GWh of electricity capacity. 2. This level of electricity generation is equal to 0.04 quadrillion BTUs (“Q-BTUs” or “quads” of energy). 3. In its February 2021 report on levelized costs of energy generation, the U.S. Energy Information Agency estimates the lump sum capital expenditures to develop one Q-BTU of geothermal generating capacity is $78 billion.i 4. This, to develop 0.04 Q-BTUs of geothermal electricity generating capacity will cost about $3.1 billion (i.e. $78 billion x 0.04 = $3.1 billion). 5. From these figures, we document in Table 6.A.1 our estimate of job creation throughout Southern California through from building this level of geothermal capacity in Imperial County. As Table 6.A.1 shows, we estimate that this project will produce as an average over 2021 – 2030 810 direct jobs, 465 indirect jobs and 589 induced jobs. This amounts to 1,275 direct and indirect jobs and 1,864 jobs in total.
i EIA study is here: https://www.eia.gov/outlooks/aeo/pdf/electricity_generation.pdf. See Pollin et al. (2021),5 p. 27 for conversion of EIA capital costs in overall levelized cost framework into lump sum capital expenditures.
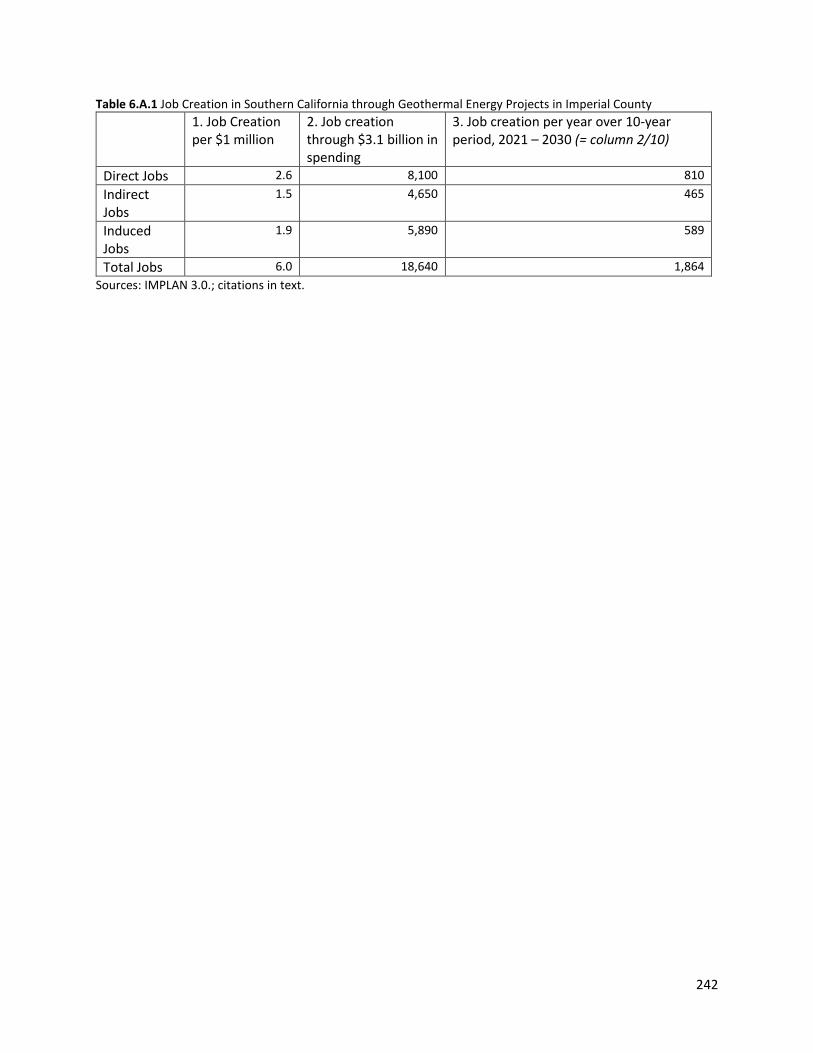
242
Table 6.A.1 Job Creation in Southern California through Geothermal Energy Projects in Imperial County 1. Job Creation
per $1 million 2. Job creation through $3.1 billion in spending
3. Job creation per year over 10-year period, 2021 – 2030 (= column 2/10)
Direct Jobs 2.6 8,100 810 Indirect Jobs
1.5 4,650 465
Induced Jobs
1.9 5,890 589
Total Jobs 6.0 18,640 1,864 Sources: IMPLAN 3.0.; citations in text.

243
Appendix 6.B Estimating San Diego Region-Specific Employment
The EER model is for Southern California, which they define as including 13 counties in addition to the San Diego region. These 13 additional counties are: Ventura, Fresno, Mono, San Bernardino, Riverside, Santa Barbara, Kings, Los Angeles, Orange, Kern, Tulare, Imperial, and Inyo. In order for us to generate estimates of employment impacts within the San Diego region itself, we therefore need to work with some assumptions in defining the proportionate level of activity in the San Diego region relative to all 14 counties constituting Southern California in the EER model.
As of 2019, the San Diego region’s total economic output is $417.9 billion. This amounts to about 14.6 percent the total level of activity throughout Southern California, which is $2.87 trillion. In reviewing the evidence from the EER model as well as the detailed input-output data for the activities in this model, we conclude that a reasonable assumption for estimating employment creation in the San Diego region is a straightforward one. That is, we estimate that the level of employment creation in the San Diego region will amount to 15 percent of the employment creation in Southern California overall through the EER model. In other words, employment creation in the region generated by the activities in the EER model will be proportional to the ratio of total output in the San Diego region relative to Southern California, i.e. with the San Diego region’s output at roughly 15 percent of that for Southern California.
One could certainly develop more detailed assumptions that would relate to various specific features of the EER model. But incorporating a more highly specified set of assumptions is not likely to generate more accurate employment estimates. by attempting to develop any set of more detailed assumptions. Here are the main considerations through which we reached this conclusion:
Demand-Side and Supply-Side Activities in EER Model
The EER model consists of two sets of activities: demand-side purchases and supply-side investments. We consider these two sets of activities separately.
Demand-side purchases. The demand-side purchases include everything that consumers in Southern California purchase that will provide energy services at reduced rates of energy consumption. These would include purchases of electric vehicles, electric heat pumps and other HVAC equipment, appliances, and refrigeration equipment.
With these demand-side purchases, it is reasonable to assume that the San Diego region’s increased purchases will not be constrained by any shortages that would be specific to the county itself. Shortages of specific products could well emerge as the level of clean energy expenditures in the region grows rapidly. But there is no reason to assume that any such shortages are likely to emerge specifically in the region, as opposed to the broader Southern California region.
Supply-side investments. The supply-side investments include everything that contributes to supplying a zero-emissions economy—e.g. architectural, engineering and related services, communication and energy wire manufacturing, turbine manufacturing, residential

244
construction, scientific research and development, as well as ongoing investments in the county’s fossil fuel-based industries.
Relative to the demand-side investments, it is less straightforward with the supply-side investments to assume that the San Diego share of total Southern California activity will remain proportionate to the Southern California figure. The major consideration that could produce disproportionately slower growth with any given investment activity within the county would if this investment activity produces significant supply constraints to growth within the county as clean energy activities scale up throughout the region. For example, the installation of solar panels in the San Diego region might be disproportionately low because of land-use issues. A disproportionately large share of solar installations might then take place in, say, Riverside County. The solar-generated electricity could then be imported from Riverside County to the San Diego region.
In fact, in examining the current profile of supply-side investments in the San Diego region within the EER model, it does not appear that there should be significant supply constraints specific to the region as clean energy investments expand in the region. At present, there are only 7 supply-side activities in the EER model in which the region’s current share is over 25 percent of all Southern California activity—i.e. significantly greater than San Diego’s current share of overall Southern California output, at 15 percent. These activities are: natural gas distribution; sugar cane mills and refining; turbine and turbine generator set units manufacturing; capacitator and other inductor manufacturing; other communication and energy wire manufacturing; all other miscellaneous electrical equipment and component manufacturing; and scientific research and development services. Of these 7 activities, there is only one in which this activity accounts for more than 2 percent of all of San Diego’s economic activity. That is scientific research and development services, which currently accounts for nearly 9 percent of all of the San Diego region’s total output.
It is not likely that the San Diego region would face supply constraints in expanding its scientific research and development services. This activity will not generate significant land-use demands. It will also not produce any significant negative environmental impacts. As such, it is reasonable to conclude that the San Diego region is well-positioned to absorb a substantial absolute increase in scientific research activity within the county. Indeed, it is almost certain that the county will welcome a major expansion of activity in this sector.
Overall, again, it therefore seems reasonable to work with a straightforward assumption that the San Diego region’s share of supply-side activities in the EER model will be maintained, as with the demand-side activities, at its current share of aggregate Southern California output. We therefore assume that the share of both the demand- and supply-side activities within the EER model for Southern California will generate employment in the San Diego region that is equal to 15 percent of employment creation in Southern California.
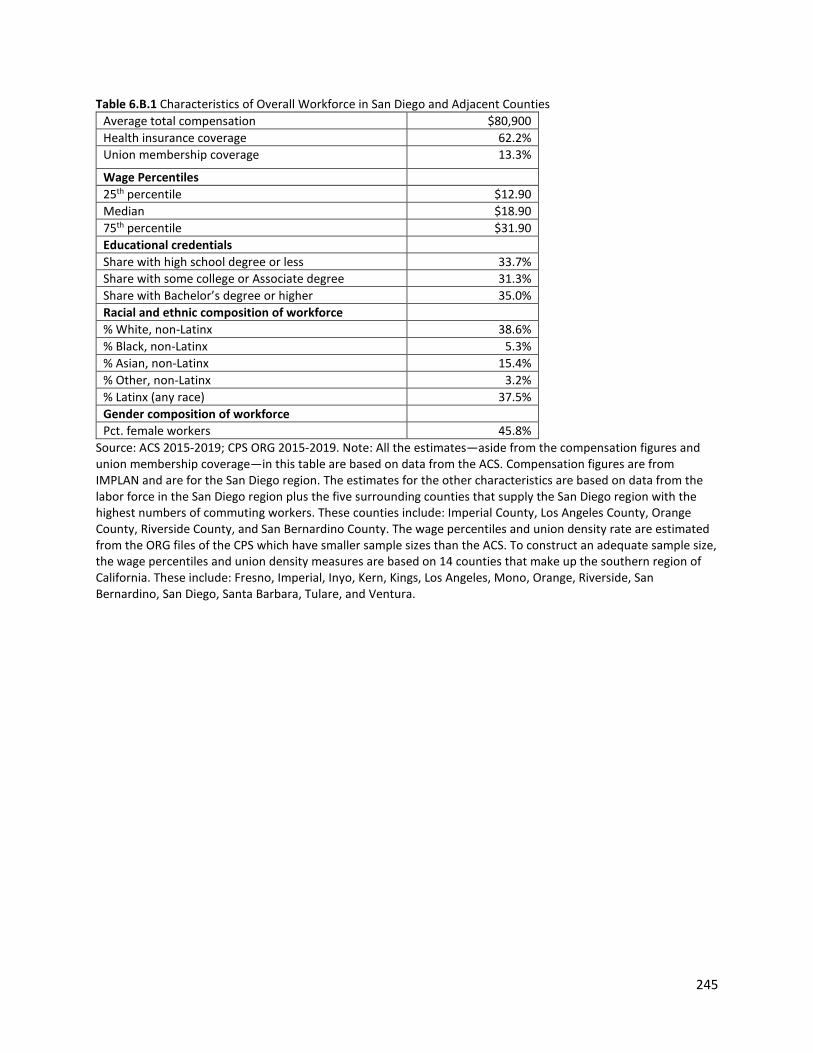
245
Table 6.B.1 Characteristics of Overall Workforce in San Diego and Adjacent Counties Average total compensation $80,900 Health insurance coverage 62.2% Union membership coverage 13.3%
Wage Percentiles 25th percentile $12.90 Median $18.90 75th percentile $31.90 Educational credentials Share with high school degree or less 33.7% Share with some college or Associate degree 31.3% Share with Bachelor’s degree or higher 35.0% Racial and ethnic composition of workforce % White, non-Latinx 38.6% % Black, non-Latinx 5.3% % Asian, non-Latinx 15.4% % Other, non-Latinx 3.2% % Latinx (any race) 37.5% Gender composition of workforce Pct. female workers 45.8%
Source: ACS 2015-2019; CPS ORG 2015-2019. Note: All the estimates—aside from the compensation figures and union membership coverage—in this table are based on data from the ACS. Compensation figures are from IMPLAN and are for the San Diego region. The estimates for the other characteristics are based on data from the labor force in the San Diego region plus the five surrounding counties that supply the San Diego region with the highest numbers of commuting workers. These counties include: Imperial County, Los Angeles County, Orange County, Riverside County, and San Bernardino County. The wage percentiles and union density rate are estimated from the ORG files of the CPS which have smaller sample sizes than the ACS. To construct an adequate sample size, the wage percentiles and union density measures are based on 14 counties that make up the southern region of California. These include: Fresno, Imperial, Inyo, Kern, Kings, Los Angeles, Mono, Orange, Riverside, San Bernardino, San Diego, Santa Barbara, Tulare, and Ventura.

246
Works Cited
1. Colorado Department of Labor and Employment. (n.d.) “The Office of Just Transition.” https://cdle.colorado.gov/the-office-of-just-transition.
2. Pollin, Robert, Heidi Garrett-Peltier, James Heintz, and Shouvik Chakraborty (2015) Global Green Growth: Clean Energy Industrial Investments and Expanding Job Opportunities, United Nations Industrial Development Organization and Global Green Growth Institute, https://www.unido.org/sites/default/files/2015-05/GLOBAL_GREEN_GROWTH_REPORT_vol1_final_0.pdf
3. Pollin, Robert, Jeannette Wicks-Lim and Shouvik Chakraborty (2020) “Industrial Policy, Employment and Just Transition,” Chapter 3 in America’s Zero Carbon Action Plan, Sustainable Development Solutions Network, https://irp-cdn.multiscreensite.com/6f2c9f57/files/uploaded/zero-carbon-action-plan-ch-03.pdf
4. Pollin, Robert, Jeannette Wicks-Lim, Shouvik Chakraborty, and Tyler Hansen (2019) A Green Growth Program for Colorado, Political Economy Research Institute, https://peri.umass.edu/publication/item/1168-a-green-growth-program-for-colorado.
5. Pollin, Robert, Jeannette Wicks-Lim, Shouvik Chakraborty, Caitlin Kline, and Gregor Semieniuk (2021) A Program for Economic Recovery and Clean Energy Transition in California, Political Economy Research Institute, https://peri.umass.edu/economists/gregor123/item/1466-a-program-for-economic-recovery-and-clean-energy-transition-in-california

247
7. Key Policy Considerations for the San Diego Region Joseph Bettles, UC San Diego Gordon C. McCord, UC San Diego David G. Victor, UC San Diego Emily Carlton, UC San Diego
Key Takeaways ● Reduction of GHG emissions across the region requires that cities and agencies
coordinate their actions more closely. Yet many of the most impactful actions are steeped in uncertainty around the best choices of policy, technology and implementation strategies. Bridging this uncertainty will require goals and policies that incentivize active learning and experiments to test diverse ideas, mechanisms to facilitate collaborative assessment of solutions across jurisdictions, and adjustment of policies in light of new information about which policies and strategies are effective.
● Each sector analyzed by the RDF has near-term actions that will be worthwhile regardless of how longer-term uncertainty resolves itself. These near-term “low-regret” policies should be prioritized as a starting point for local adoption.
● A mechanism such as a Regional Climate Action JPA could scale strategic thinking and decision-making and facilitate implementation of closer region-wide coordination around decarbonization.
● This chapter proposes region-wide institutional governance for decarbonization that incentivizes experimentation and learning. Organized into a Regional Steering Committee, Sector Working Groups, and Front-Line Advisors, this evolving structure can coordinate learning efforts across jurisdictions and adapt to changing technological and political realities.
● Given limited local leverage over many emitting activities, regional climate governance institutions must directly engage with the state and federal governments to advocate for policies and programs that support local decarbonization needs.
● For the San Diego region to have a measurable impact on global emissions it should seek to generate followership among other regions and upscale durable innovations that can be expanded and replicated. Because the County territory accounts for just 0.08% of global emissions, actions that are taken in the region but stay in region will be much less impactful than those that diffuse more widely as models.
248
7.1 Introduction
Along with the rest of the world, the governing bodies of the San Diego region – including 18 cities, public agencies, and the County of San Diego – face the unprecedented challenge of decarbonization by midcentury or earlier. This must happen in the context of great uncertainty around changing technologies, resources, climate impacts, and socio-political realities, and despite local governments’ limited direct authority over many emitting activities. Even as science and policy lead to solutions in the rest of the world, many of which the RDF proposes implementing over the near term, the region still must discover whether and how those will work in the San Diego context. Beyond the near term, even the best models are unable to perfectly identify the best course of action today.
Given these uncertainties, the RDF is not meant to be a prescriptive roadmap to complete decarbonization. Instead, it is meant to kick-off and inform an ongoing process of local experimentation to discover what does and does not work here in San Diego County. To that end, the earlier chapters of the RDF set bold goals that can help point climate-related activities in the right direction, provide a framework for organizing action (by sector), and lay out near-term, least-cost actions. Based on science and derived from what is working in other contexts, the RDF offers a starting point for local policy efforts that must adapt over time in light of new information and experience.
This chapter builds on the earlier chapters by outlining a strategy through which local governments can adapt and shape their efforts over time in response to new information. Successful deep decarbonization will require an institutional framework that systematically rewards experimentation and facilitates learning by government officials, planning bodies, and regulators as well as local industry stakeholders, civil society groups, and academics. Central to this strategy is the idea that even as many near-term actions are known and must be pursued, some of the most impactful actions to be taken are steeped in uncertainty today. The framework offered here includes incentives that encourage experimentation around those new ideas. Finally, as San Diego represents a tiny fraction of global emissions, this chapter offers strategies for San Diego’s efforts to have a broader impact on climate policy in other regions of the country and beyond. Ultimately, the measure of success for the RDF is not how exactly the pathways laid out in the sector chapters are followed, but how quickly and systematically the region's various actors can work together to implement, evaluate, and improve them in light of learning–and how quickly the ideas about what works in San Diego are emulated more widely.

249
7.2 Achieving Deep Decarbonization across San Diego: the Need for more Experimentation, Collaboration and Learning
7.2.1 The Local Region as an Agent of Change
It is widely accepted that local governments are at the front lines of both climate change adaptation and mitigation efforts.1–4 Especially when national and international action on climate change is inadequate, highly motivated local regions such as cities and counties are stepping up as the leaders of greenhouse gas (GHG) emissions reductions.5 While the motivations for action are powerful, making efforts to reduce GHG emissions across the region requires a careful strategy that will not emerge, autonomously, on its own. Collective action is needed because, often, no single local agency (or even a whole city) can solve problems by acting alone. The strategy requires incentives to break away from old investment patterns that won’t achieve deep decarbonization–and incentives to experiment with new ones. The strategy also requires engaging a broad set of actors–including government but also industry, academics, and ground level workers–to implement and assess solutions, and share learning about what works and what doesn’t.i,6
Within the San Diego region there are 18 cities, 17 tribal governments, and several agencies and government offices relevant to decarbonization. Sustained and meaningful collaboration in such a fragmented and diverse region poses challenges, which the rest of this chapter aims to address. But it is also necessary for maximizing our efforts. Working as a region can achieve economies of scale,7 as combining resources increases leverage and capacity.8 Sharing of expertise and experience among neighboring cities–often facing very similar contexts of opportunities and challenges–can allow for faster diffusion of successful innovations9 as well as more equitable distribution of resources. For example, coordination between local governments in Southern California and the State of California has led to an increasingly equitable distribution of EV charging stations across census tracts with different income levels.10 Climate action in geographically defined communities can lead to close relationships between government staff that can make joint problem solving more effective by building trust that enhances open deliberation.5
7.2.2 A Collective Shift from the Status Quo
The RDF lays out decarbonization pathways for each sector that require large investments and rapid change. Table 7.1 provides an overview of key decarbonization actions, areas of uncertainty, and County leverage points from each of the four sectors: land use, buildings, transportation, electric sector. This sector-by-sector approach to deep decarbonization is
i This logic is sometimes called “experimentalist governance”. The idea is that cities in the San Diego Region can act as laboratories for policy innovation that is standardized and entrenched over time. (Victor and Sabel 2022)
250
extremely important because the lesson learned, around the world, is that detailed planning for new technologies, business practices, and policy strategies is much more effective when the big problem of “climate change” is broken down into smaller units–sectors–because the best solutions vary so markedly across sectors.11 Leverage is defined as the direct or significant influence of the County over actions to achieve deep decarbonization.
However, the slow pace of change in most sectors and jurisdictions worldwide so far illustrates that acknowledging the need–the threat of climate change–and even laying out actions is not enough. Both governments and businesses across the region recognize the need to act on climate change, despite the fact that the best actions and the exact forms of policy are still hard to discern, especially where change could be highly disruptive. For a business owner who doesn’t know how rules will evolve, which solutions will be most cost effective, or how consumers and investors will respond to such changes, it may be difficult to justify significant capital investment in major changes. Individual local leaders facing the same uncertainties could be similarly–and understandably– hesitant to risk public backlash on major changes, .
Under these conditions, local leaders must step in to send a collective, clear, and credible signal that the real risk is in doing nothing. This can be done in a variety of ways, both formal and informal: for businesses, examples include the credible promise that government will tighten regulation as solutions become viable or the threat of being shut out of the market; for local agencies the pressure of new rules from the state and growing public demand for action. These “sticks” are most effective when paired with “carrots” that reward early movers, such as public contracts that guarantee a market for local businesses that decarbonize or individual-level incentives that increase demand for goods and services aligned with the needs of a decarbonized future (such as the adoption of heat pumps, EVs, and building shell improvements).
In San Diego, as in the rest of the world, the best types of incentives and the right pace for implementing them will be different for each sector. Where the science around the best solutions is still highly uncertain–for example, in land use, where gaps remain in the evidence around how much and how reliably natural climate solutions can sequester carbon–the best sector strategy would emphasize experimentation and rapid learning so that goals and incentives can be adjusted in line with new information. By contrast, in sectors like electricity and light-duty transportation where confidence in the solutions is higher (at least over the short term) but the feasibility of rapid adoption is uncertain, the best approaches would emphasize deployment of known technologies while still learning about the next wave of technologies that will be needed once the low-regrets options diminish.

251
Table 7.1. Key actions and areas of leverage identified per sector.
Land Use Buildings Transportation Power
Key Emission Sources
Disturbance of intact ecosystems (e.g., wildfire, sea-level rise, development)
Residential water heating. Space heating/cooling Process energy
Internal combustion engine emissions from light- and heavy-duty vehicles and freight.
Electricity is generated from natural gas power plants.
Key Decarbonization Actions
Protect existing carbon pools to avoid releasing stored sinks of CO2, prioritizing intact, native ecosystems. Manage existing ecosystems to increase carbon sequestration as well as to mitigate wildfires and storm surge damage through forest, chaparral, and wetland management/restoration. Promote “climate farming” to change agricultural lands from sources into sinks and to manage agricultural methane emissions.
Increased adoption of electrification of space and water heating. Geographically targeted electrification (e.g., in neighborhood clusters). End expansion of the gas utility system to lower the risk of stranded assets. Building shell improvements to reduce electric system peaks and manage system costs. Improved data gathering is a low-cost, foundational action for future policy development.
Reduce demand for travel. Shifting to EV for LDV, HDV, and freight Siting charging infrastructure. Multi-modal oriented development where assets are already present, as well as investments in new transit infrastructure. Accelerate replacement rates Engage with vulnerable communities.
San Diego County has sufficient solar and wind resource potential to transition electricity to 100% of the estimated demand with renewable resources inside the County, while the Central Case from the overall model retains firm power gas infrastructure to keep costs low. Neighboring Imperial County has significant solar and geothermal beyond internal population demands CAISO estimates necessary transmission network upgrades for San Diego - Imperial - Baja - Arizona to be $3.9 billion and will take decades to complete.
Areas of Uncertainty
There is a high degree of uncertainty around the benefits of reforestation and afforestation. It is uncertain the degree to which natural climate solutions are a reliable source of negative emissions Further there is uncertainty as to the degree that climate change will have an impact.
The long-term best extent of electrification is uncertain (70%? 85%? 100%?), but not relevant for near-term action. Uncertain performance/results from new policy levers (at local, state, federal levels). Future cost, availability, and demand for low-carbon gas is uncertain; this suggests it may need to be saved for hardest to decarbonize sectors.
Alternative fuels. Resilience in the face of supply disruptions. The political feasibility of mandating shifts. The degree of flexible charging and the feasibility of vehicle to grid (V2G) systems.
Ability to upgrade the capacity of the transmission system to meet demands Social acceptability of large utility-scale projects. Storage and firm power The degree to which Mexico will provide a source of renewable electricity inputs.
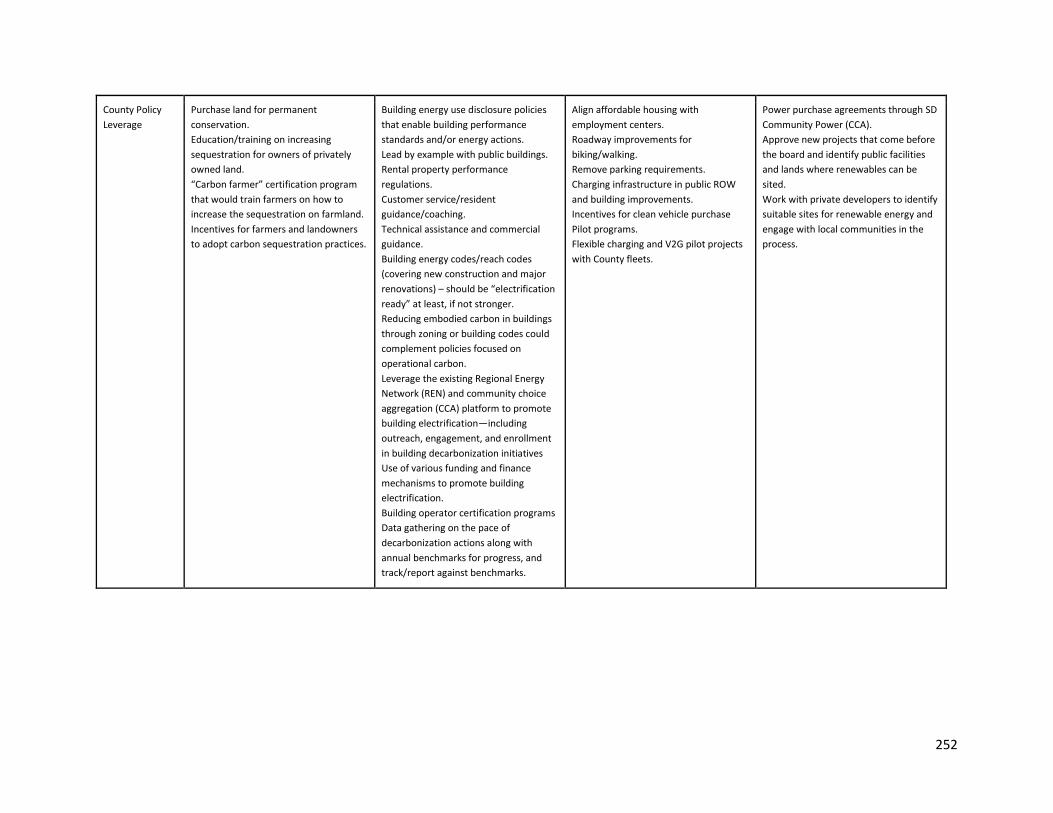
252
County Policy Leverage
Purchase land for permanent conservation. Education/training on increasing sequestration for owners of privately owned land. “Carbon farmer” certification program that would train farmers on how to increase the sequestration on farmland. Incentives for farmers and landowners to adopt carbon sequestration practices.
Building energy use disclosure policies that enable building performance standards and/or energy actions. Lead by example with public buildings. Rental property performance regulations. Customer service/resident guidance/coaching. Technical assistance and commercial guidance. Building energy codes/reach codes (covering new construction and major renovations) – should be “electrification ready” at least, if not stronger. Reducing embodied carbon in buildings through zoning or building codes could complement policies focused on operational carbon. Leverage the existing Regional Energy Network (REN) and community choice aggregation (CCA) platform to promote building electrification—including outreach, engagement, and enrollment in building decarbonization initiatives Use of various funding and finance mechanisms to promote building electrification. Building operator certification programs Data gathering on the pace of decarbonization actions along with annual benchmarks for progress, and track/report against benchmarks.
Align affordable housing with employment centers. Roadway improvements for biking/walking. Remove parking requirements. Charging infrastructure in public ROW and building improvements. Incentives for clean vehicle purchase Pilot programs. Flexible charging and V2G pilot projects with County fleets.
Power purchase agreements through SD Community Power (CCA). Approve new projects that come before the board and identify public facilities and lands where renewables can be sited. Work with private developers to identify suitable sites for renewable energy and engage with local communities in the process.
253
In many cases, local agencies may not have the direct authority to implement incentives and penalties that would mobilize action. Thus, regional leaders will need to engage continually with outside agencies, especially at the state level, to influence policy. This is important not just for getting the right policies to mobilize action in San Diego, but also for generating action beyond the region. San Diego County accounts for a relatively small fraction of global emissions and thus what it does at home must be advanced with an eye to how it affects the rest of the world. Section 7.5 later in the chapter provides greater detail on influencing policy outside the region.
Whether enacting local policies or influencing policies elsewhere, it is essential that the 18 cities and other key agencies that serve San Diego county show alignment around moving away from the status quo. The three largest sources of emissions in San Diego: light-duty vehicles (37%), electricity (23%), and natural gas in buildings (8%)12 cross municipal boundaries and therefore require geographically coherent policies. Even for emissions sources that can be ascribed to a specific geographic area (e.g. methane from solid waste), a patchwork of uneven penalties and rewards risks generating confusion, increasing administrative burdens, pushing emissions into certain geographic pockets of the region, and threatening equitable distribution of costs and benefits. Finally, where county agencies lack direct authority to implement incentives, a united regional voice is likely to have greater influence on state and federal policy than individual agencies or cities.
While the RDF as a whole is focused on mitigating climate change through decarbonization, the same logics outlined in this chapter–the need for collective action to mobilize a shift away from the status quo, drive rapid learning about the best solutions, and engage with frontier efforts in other jurisdictions –could yield a more effective regional strategy on climate change adaptation as well. For example, coastal erosion, an adaptation problem that is currently managed independently by each coastal city, could benefit from a region-wide strategy, such as for coastal management projects.13
Achieving alignment on region-wide policies to mobilize action in each sector is a challenge, especially given the large diversity of preferences and the sheer number of government entities across the region. It will require bold leadership and new institutional mechanisms, some of which are outlined in the remainder of this chapter. But despite the challenge, there is reason to be optimistic. Fragmentation within the region can create an environment where jurisdictions experiment, good ideas spread quickly, and the likelihood of policy cooperation across cities increases.14 For example, the City of Chula Vista was the first city in the County to adopt a Climate Action Plan in 2000 after working with the UN program Local Governments for the Environment.15 In the years following, nearly all other cities adopted climate actions plans.16

254
And despite many different context and interests across the region, pressure is mounting for serious responses to the challenge of deep decarbonization.
7.2.3 The Need for Collaborative Learning
The complexity and urgency of the decarbonization challenge require–in addition to incentives for action–active, collaborative learning by relevant local actors, including government, industry, academics, and ground-level workers. This learning should pursue two critical goals:
First, local actors within each sector must learn how to adapt near-term “low-regret” policies from other contexts to work here in San Diego. The RDF has already identified the least-cost, currently technically feasible actions to prioritize, given high confidence that they will be worthwhile regardless of how many uncertainties are resolved. But successful implementation still requires adapting technological solutions to suit the natural environments found in San Diego County as well as adapting policies, programs, and incentives to work in the varied political and economic contexts of the region. Some elements of policies that encourage EV adoption in Del Mar likely will not work the same in City Heights, for example.
Second, local actors must engage with each other and with the wider world in the search for solutions where the best solutions aren’t yet known. To what degree and how rapidly will electrification of industrial loads take place? What will be the role of low- and zero-carbon liquid fuels for transportation, or will all transportation need to electrify in order to decarbonize? How reliable are intact ecosystems as a method for absorbing carbon from the atmosphere–in effect, a source of negative emissions? While regional scale investments in technological innovation are not likely to have dramatic impacts on technological readiness, San Diego's technology-focused industrial culture and multiple university communities make it an ideal testbed for pilot and demonstration projects. For example, vehicle to grid (V2G) systems are an emerging technology that can reduce the need for battery storage of renewable electricity. UC San Diego is home to a California Energy Commission pilot project in partnership with local startup Nuuve to study V2G implementation. Cities within San Diego could achieve greater innovation in the implementation of V2G systems through pilot projects at the municipal scale.
Systematic learning under conditions of uncertainty requires some form of institutional structure that facilitates local adoption of solutions and then brings together experts from relevant governments, industry, and academia, to systematically assess how they work, problem-solve where necessary, and share that learning with others.6 They key is to establish ongoing processes of providing information about experiments along with review, where mutual learning and discussion with feedback from those on the front line inform changes to

255
goals, policy, and planning. An institutional framework that does this successfully must be flexible and able to respond to changing conditions and, most importantly, to lessons learned.
7.2.4 The Regional Players in San Diego
Building an institutional framework that achieves the iterative, problem-oriented collaboration described above and maintains it over the long term is not easy, especially in a region as diverse as San Diego. Fortunately, San Diego already has key government entities that are well-positioned to act as leaders and champions for the effort. The largest regional agency, and most relevant for decarbonization, is the region’s Metropolitan Planning Organization (MPO), the San Diego Association of Governments (SANDAG). The MPO is designed for regional coordination around transportation and land use planning. SANDAG already employs iterative planning based on some ground-level feedback: the 2050 Regional Transportation Plan produced by SANDAG relies on data from key local actors, extensive public input, and regular progress reports to inform ongoing GHG reducing land use and transportation planning.19 Additionally, under the Regional Planning Committee, SANDAG has established several working groups working on a variety of relevant policy areas.
The working groups may offer another starting point in the development of an institutional structure to increase coordination on GHG reduction. Further, as an established coordinating body in the region with land use and transportation authority, SANDAG will play an important role in any new governing authority on decarbonization.
The government of San Diego County is another natural coordinating body in the San Diego region. The County operates in a privileged position in climate governance with a combination of proximity to the local context and connection to state and federal resources.20 The governing body, the County Board of Supervisors, represents all areas of the region and holds land use planning authority in the unincorporated areas of the County. In addition, the County receives federal and state funds for health, infrastructure, and more recently, economic stimulus.21 The distinct advantages of proximity to constituents as well as control of state and federal resources provide the opportunity for coordinating efforts by the County to have a meaningful impact on regional GHG emissions.
The County has several areas of direct influence in decarbonization as well as indirect influence as a regional governing body with representation from all parts of the region. The recent decision to join San Diego Community Power (SDCP), provides the County with influence in the development and procurement of electricity for the region.22 In addition, the County is a voting member of several important agencies and boards with authority over transit, water, air quality, and the airport. In Figure 7.1, the County’s role in decarbonization is shown in the

256
regional context. While it lacks direct authority over cities, county-wide representation positions the County as a leader of decarbonization in the region.
The benefit of having local government entities like SANDAG or the County leading the coordination is the power to enter into formal agreements with other agencies or jurisdictions, both in and outside the region, via Memoranda of Understanding (MOU) or Joint Powers Agreements (JPA). Formalized partnerships can increase leverage, including by allowing the region to apply for state and federal funding for major projects. In San Diego, such partnerships have already begun to form around climate change: community choice aggregators throughout the region benefit from a JPA to coordinate on the development and procurement of renewable energy.23
A Regional Climate Action JPA could facilitate implementation of region-wide decarbonization and adaptation initiatives. The idea would require further study to define the authority for the JPA, which funding streams would get pooled, how different stakeholders would be represented, and how decision-making would happen. The region, however, would collectively benefit from supporting active experimentation in a framework that could be implemented elsewhere in the country. A mechanism such as a JPA would help the region go beyond jurisdictions that nominally collaborate but act in their own self-interest to regional-scale strategic thinking and decision-making on decarbonization.
Figure 7.1. Role of the County of San Diego in the regional decarbonization context.

257
Outside of government, San Diego has several private and academic networks, including the San Diego Regional Climate Collaborative, which coordinate efforts on climate-related initiatives. These existing networks will be an important resource for structures that seek to draw on local expertise.
7.3 Case Studies for Regional Coordination
Within San Diego County and outside of it, there are already many examples of regional efforts to adopt and learn from climate solutions. This section outlines seven case studies that highlight institutional structures that have achieved the kinds of functions needed to achieve rapid, deep decarbonization, outlined earlier in this chapter. Those functions include setting ambitious but adjustable goals, breaking down complex problems into smaller and more focused learning units (usually sectors), providing strong incentives to deviate from the status quo despite uncertainty, investing in experiments that test new solutions, and creating programs aimed at systematic assessment of the outcomes to review what works and what doesn’t and share the learnings within and beyond the region.
The case studies that follow illustrate some ways that communities have organized themselves to perform these functions as they grapple with what to do in their context; however, no single case study illustrates all of the functions at once. The following sections of this chapter, 7.4 and 7.5, propose an institutional framework and strategy for balancing these functions.
7.3.1 Buildings: Learning through Multiple Strategies in San Diego
In February 2019, the City of Carlsbad was the first in the region to implement building electrification by mandating electric or solar water heaters for all new construction.24 Encinitas took this a step further in 2021 when they banned natural gas connections for all new construction, including space heaters, fireplaces, and stoves.25 These are examples of policies that disrupt the status quo, creating the conditions for change. Policies such as these that create pressure to move away from gas are emerging at both the local and state level and are having the intended effect: San Diego Gas and Electric (SDG&E) is now actively moving to address carbon emissions from existing natural gas infrastructure through pilots on blending green hydrogen that could lower the carbon intensity of gas within buildings.26 While these are good examples of how policy can create incentives for technological innovation and experimentation, it is still unknown whether these specific policy and technological solutions are the right ones. For example, bans on gas hookups have local political support, but the aggregate impact may be to erode the larger value across the whole region of a gas pipeline network that could be used to supply decarbonized gas. As these experiments in policy and
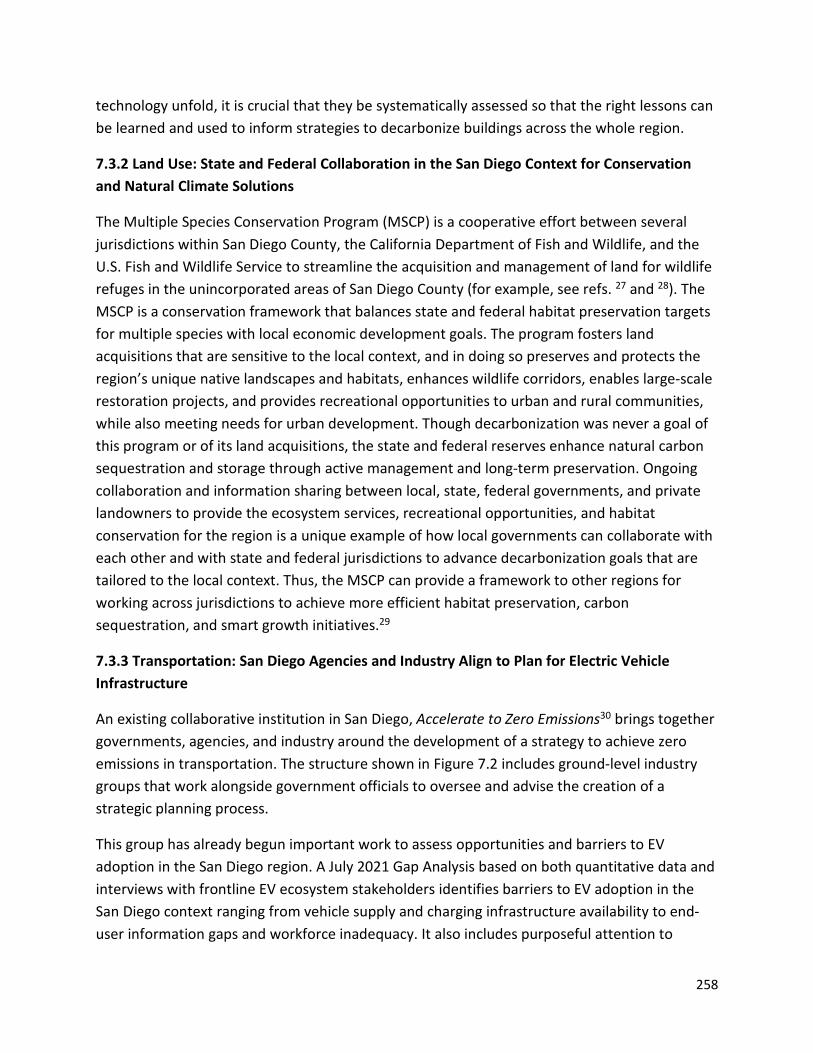
258
technology unfold, it is crucial that they be systematically assessed so that the right lessons can be learned and used to inform strategies to decarbonize buildings across the whole region.
7.3.2 Land Use: State and Federal Collaboration in the San Diego Context for Conservation and Natural Climate Solutions
The Multiple Species Conservation Program (MSCP) is a cooperative effort between several jurisdictions within San Diego County, the California Department of Fish and Wildlife, and the U.S. Fish and Wildlife Service to streamline the acquisition and management of land for wildlife refuges in the unincorporated areas of San Diego County (for example, see refs. 27 and 28). The MSCP is a conservation framework that balances state and federal habitat preservation targets for multiple species with local economic development goals. The program fosters land acquisitions that are sensitive to the local context, and in doing so preserves and protects the region’s unique native landscapes and habitats, enhances wildlife corridors, enables large-scale restoration projects, and provides recreational opportunities to urban and rural communities, while also meeting needs for urban development. Though decarbonization was never a goal of this program or of its land acquisitions, the state and federal reserves enhance natural carbon sequestration and storage through active management and long-term preservation. Ongoing collaboration and information sharing between local, state, federal governments, and private landowners to provide the ecosystem services, recreational opportunities, and habitat conservation for the region is a unique example of how local governments can collaborate with each other and with state and federal jurisdictions to advance decarbonization goals that are tailored to the local context. Thus, the MSCP can provide a framework to other regions for working across jurisdictions to achieve more efficient habitat preservation, carbon sequestration, and smart growth initiatives.29
7.3.3 Transportation: San Diego Agencies and Industry Align to Plan for Electric Vehicle Infrastructure
An existing collaborative institution in San Diego, Accelerate to Zero Emissions30 brings together governments, agencies, and industry around the development of a strategy to achieve zero emissions in transportation. The structure shown in Figure 7.2 includes ground-level industry groups that work alongside government officials to oversee and advise the creation of a strategic planning process.
This group has already begun important work to assess opportunities and barriers to EV adoption in the San Diego region. A July 2021 Gap Analysis based on both quantitative data and interviews with frontline EV ecosystem stakeholders identifies barriers to EV adoption in the San Diego context ranging from vehicle supply and charging infrastructure availability to end-user information gaps and workforce inadequacy. It also includes purposeful attention to
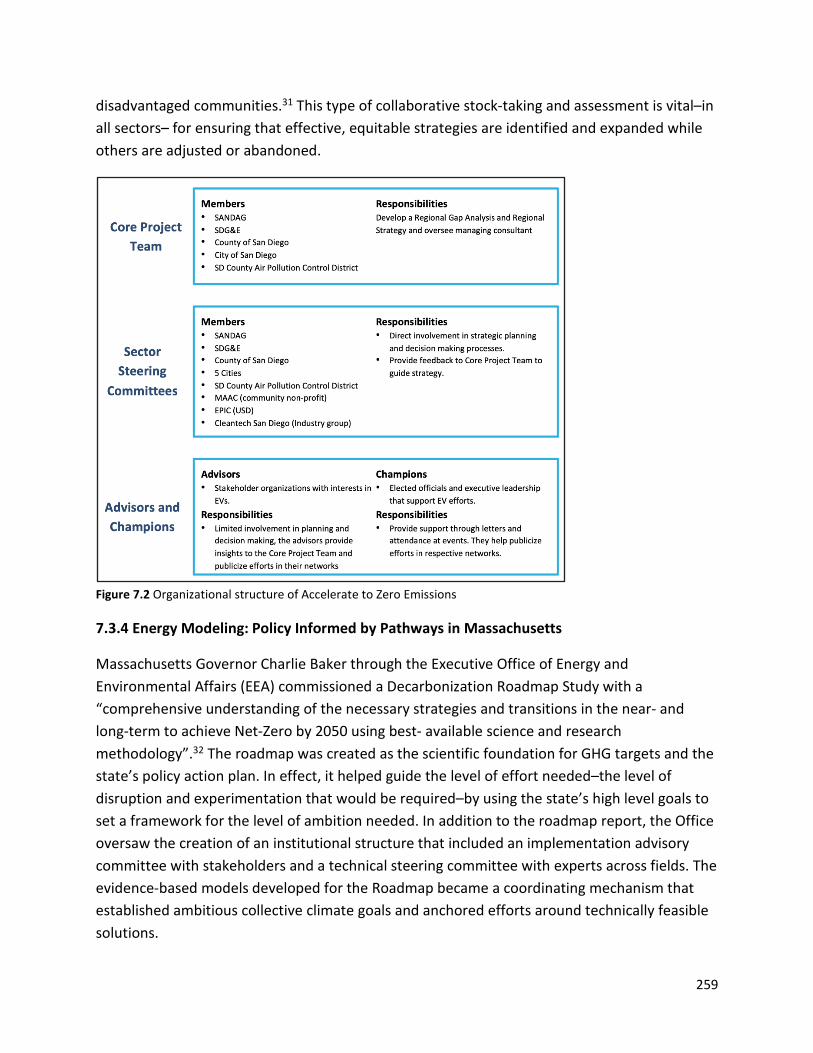
259
disadvantaged communities.31 This type of collaborative stock-taking and assessment is vital–in all sectors– for ensuring that effective, equitable strategies are identified and expanded while others are adjusted or abandoned.
Figure 7.2 Organizational structure of Accelerate to Zero Emissions
7.3.4 Energy Modeling: Policy Informed by Pathways in Massachusetts
Massachusetts Governor Charlie Baker through the Executive Office of Energy and Environmental Affairs (EEA) commissioned a Decarbonization Roadmap Study with a “comprehensive understanding of the necessary strategies and transitions in the near- and long-term to achieve Net-Zero by 2050 using best- available science and research methodology”.32 The roadmap was created as the scientific foundation for GHG targets and the state’s policy action plan. In effect, it helped guide the level of effort needed–the level of disruption and experimentation that would be required–by using the state’s high level goals to set a framework for the level of ambition needed. In addition to the roadmap report, the Office oversaw the creation of an institutional structure that included an implementation advisory committee with stakeholders and a technical steering committee with experts across fields. The evidence-based models developed for the Roadmap became a coordinating mechanism that established ambitious collective climate goals and anchored efforts around technically feasible solutions.

260
7.3.5 Climate Network: Bi-directional Governance in German Climate Change Management
In a study of cities as leaders of climate policy in the EU, Kern5 identifies several lessons that could prove useful to San Diego. Kern advocates an “embedded upscaling” approach in which decision-making takes place within cities under the guidance of a larger network. Kern highlights the case study of the German Climate Change Management (KPL) in which German states create goals for decarbonization and municipalities decide on implementation strategies that are feasible within their context. States provide funding based on adherence to the goals as well as the financial need of the municipality. Kern notes that a co-benefit of this approach is that city staff become experts on decarbonization which has led to a knowledge-sharing network across cities. This case study provides a great example of an institutional governance system that incentivizes experimentation and facilitates local learning. It also demonstrates the importance of direct engagement between local and state governments, both for supporting the differing needs of municipalities as well as upscaling the efforts of those municipalities through knowledge sharing.
7.3.6 Orlando and Central Florida: Regional Coordination and City Followership
In Central Florida, a newly created council of governments are working together to tackle sustainability and resilience through a regional decarbonization strategy: The East Central Florida Regional Resilience Collaborative (ECFR2C). This collaborative, started in 2018, is built upon three pillars 1) People (health and equity), Places (built infrastructure and natural environment), and Prosperity (economic resilience). Led by the East Central Florida Regional Planning Council, this initiative convenes 37 partners (including counties, cities, towns, and public agencies) with the goal of reducing their carbon footprint, risks, and vulnerabilities, and increasing sustainability efforts on a region-wide level.33 The steering committee has also drafted a Memorandum of Understanding which formally recognizes partner local governments and agencies within 8 counties and 78 cities, and calls on stakeholders to commit to regional cooperation, develop regional resilience action plans, align decisions with a shared legislative strategy, engage the community, and participate in an annual summit.34 This call for collaborative engagement between different governments and agencies demonstrates the formation of a united regional voice and emphasizes the importance of achieving alignment on policies which can then mobilize action.
The City of Orlando is also implementing local government initiatives that connect with global commitments to reach net zero GHG emissions by 2050. Orlando’s position as a clean energy leader shows that cities can generate followers in the transition to renewable energy transitions by enacting efficient and sustainable policies: ramping up renewables, storage, energy efficiency, and electric vehicles (EV), meeting green building standards, and phasing out coal plants. Orlando is successfully doing this by collaborating with the Orlando Utilities

261
Commission (OUC) to deploy large-scale, city-wide solar projects which shift residential and commercial users towards solar photovoltaic (PV) systems.35 Orlando as a city government has established a pathway for other cities to follow by using financial and fiscal policies that make renewable energy the cheapest option available: i.e. financing programs that support low-income residents with community-oriented energy efficiency upgrades and solar installations, and incentive initiatives that cover soft costs of installation of solar PV.
7.3.7 Washington DC: Coordination through a Regional Council
The Metropolitan Washington Council of Governments (COG)36 is another one of the nation’s leading groups in addressing climate change on a regional level. The COG is an association of 300 elected officials from local and state governments, as well as members of the U.S. Congress that collaborates to address major regional issues of climate and energy action in the District of Columbia, Maryland, and Northern Virginia. The COG set initial goals for sustainable growth–including GHG emissions reductions– in its 2012 Region Forward vision, and continues to assess progress and update those goals accordingly. With this vision as a guide, COG lays out plans and priorities for regional collective action in Climate and Energy Action Plans, which are also reviewed and adapted over time (the most recent is the 2030 Plan). The climate action section of the plan–known as the regional mitigation strategy–is broken down roughly by sector: planning, equity, clean electricity, zero energy buildings, zero emission vehicles, zero waste, mode shift and travel behavior, and sequestration.
Implementation is led by COG’s Climate, Energy and Environment Policy Committee (CEEPC), which consists of representatives from COG’s member local governments, state agencies and legislatures, the Air and Climate Public Advisory Committee, regional and federal agencies, and electric and gas utilities. This committee pools learning from a collection of subcommittees, technical working groups, and partners and uses it to advise the COG board on a variety of things, including setting annual legislative priorities for climate and energy and monitoring advances in the technical feasibility of promising solutions. At the same time, the committee supports local area governments as they collaborate to try solutions by providing capacity building, training, data and tools, research, planning, policy/program development, project feasibility assessments, advocacy, and cooperative procurement to communities. The committee and its subcommittees also facilitate upscaling through diffusion of knowledge across jurisdictions. For example, they host one regular forum for problem-solving and lesson-sharing around solid waste management and another that brings together sectoral actors across jurisdictions and institutions to create a unified approach to managing regional forest canopy.
262
Like the overarching vision and goals, this structure is flexible and routinely adapted in response to learning. New ad-hoc working groups are created to address needs and advance initiatives as they arise and then disbanded when no longer needed. One program, the Greater Washington Region Clean Cities Coalition (GWRCCC), was originally established within the COG to work with vehicle fleets, fuel providers, and community leaders and stakeholders toward the goal of reducing gasoline consumption in transportation. Over time, it has evolved into a separate private-public partnership that continues to collaborate closely with COG on zero emission vehicle adoption. Overall, the COG approach has resulted in considerable progress; the region surpassed the goal it established in 2012 of a 10% reduction in GHG emissions below business-as-usual projections, mainly through deployment of low carbon distributed generation resources, cleaner cars, and fewer vehicle miles traveled.)
7.3.8 Denver: Effective Problem-Solving through Regional Coordination
In Denver, models of effective problem-solving have also emerged on a local level – through focusing on areas that will have the most impact i.e., large buildings, transportation, and power generation. This case study provides an important lesson: when attempting to address the larger issue of reducing GHG emissions, breaking it down into smaller units, in this case prioritizing key sectors that will have the largest impact, will allow for more effective experimentation and collaborative learning by relevant actors within each sector. Denver’s 80 x 50 Climate Action Plan37 (reducing GHG emissions 80% below 2005 levels by 2050), released in 2018, engaged technical experts and community stakeholders alike to place a strong emphasis on measurable carbon reductions whilst ensuring equity (through reduced utility bills from the gains of energy efficiency to lower operational costs of electric vehicles). This plan’s stakeholder process included two key groups: the Technical Advisory committee that created systems based GHG reduction approaches within four sectors (mobile supply, mobile demand, stationary supply, and stationary demand) and the Task Force that integrated these strategies into a larger framework.
Through this Climate Action Plan, Denver aims to “increase building code to net-zero energy for new buildings, target homes in need of efficiency upgrades and pair them with strategies like EV, solar, storage and fuel switching and partner with local and national organizations to facilitate group discounts for energy improvements” Denver also commits to continuing its Energize Denver program which requires buildings greater than 25,000 square feet to report their annual energy use publicly, adopted the 2018 IECC to ensure stronger building codes for new construction, and is actively pursuing incentives like stretch codes and green lease programs which provide incentives for high-performing, LEED, and net-zero buildings. In efforts to decarbonize the electricity grid, Denver has partnered with utility Xcel Energy, exploring a Certified Grid Mix approach to add renewable energy on new construction buildings, residential
263
rooftops, and community solar gardens, allow isolated districts and microgrids, increase energy storage and expand renewable choice programs and incentives. Within the transportation sector, Denver is advocating for Colorado to adopt Clean Car Standards (including the Zero Emission Vehicle standard), partner with car share companies to provide access to EVs and subsidize memberships to allow for better access to low-income people, support EV workplace charging programs, and support electrification of delivery trucks – all with a target of making 40% vehicle registrations in the city electric vehicles by 2030.
7.3.9 Kansas City: Coordinated Partnerships of Local Leaders
Kansas City has had a long history of implementing sustainability initiatives to ensure economic, social, and environmental benefits, and has most recently employed a collaborative regional approach in its 2021 Climate Action Plan (CAP).38 This CAP, which serves 10 counties, and 123 municipalities in the states of Kansas and Missouri is made up of a team of over 130 local and state elected leaders, community members, and stakeholders, spearheaded by Climate Action KC and the Mid-America Regional Council (MARC). Climate Action KC, a nonprofit coalition that brings together local leaders from government, nonprofit, public and corporate organizations to reduce emissions and improve quality of life, and MARC, a nonprofit association of city and county governments and the metropolitan planning organization for Kansas City have come together to establish the first regional climate plan which establishes goals and strategies across nine sectors: collaboration and leadership, transportation, energy generation, finance & innovation, urban greening, healthy & resilient homes and buildings, food systems, industry & resource management, and community resilience. Since the types of incentives, the right pace for adopting new technological solutions, and the levels of uncertainty vary across sectors, breaking down GHG reduction plans into distinct components is key to ensuring successful experimentation and the creation of opportunities for local actors to take appropriate action.
For each section, the plan carefully identifies a set of co-benefits such as health & wellbeing, accessibility, cost savings, or green job development, as well as linkages with other sections of the plan, thereby illustrating the relevant connections and positive outcomes that can be achieved through information sharing and the formation of coordinated partnerships. Some of the policy recommendations made for local government across the different sectors include adopting solar-ready and energy-benchmarking ordinances, adopting building performance requirements and IECC 2021, linking economic incentives to building performance, revising zoning codes to allow for accessory dwelling units and to create transit-supportive environments, and include green infrastructure in capital improvement and asset management plans.

264
None of these case studies can be transplanted on their own, however each one holds important lessons that can be incorporated into San Diego’s decarbonization approach, and across the rest of the world. From Orlando and Washington DC’s examples of coordination efforts amongst local actors to Denver and Kansas City’s approaches of breaking down larger GHG reduction goals into more manageable components to best identify sector-specific solutions, these regional case studies act as real-world examples to point to and learn from.
7.4 Institutional Structure Built for Learning and Adaptation
The RDF has laid out a science-based course of action for decarbonizing the San Diego region by sector, starting with measures that are currently the least regrets–that is, options with lowest costs, highest technical feasibility and most familiar. However, the strategy must look beyond–to the time when the risks and potential performance of technologies and policy interventions become more uncertain, and where many local idiosyncrasies have a big impact on deployment as technologies and conditions evolve constantly.39 For example, there is a high degree of uncertainty as to the best technology, policies, and operation of EV charging to balance electricity loads for a grid with high renewable energy penetration–that EVs are the lowest cost way to achieve deep decarbonization for most light duty transportation is known robustly, but how EV charging can best help integrate renewable power on the grid is not. Beyond uncertainties identified in the RDF are the countless unknowns due to environmental, technological, social, economic, and political shocks, acutely illustrated by the COVID-19 pandemic. In this environment, it is impossible to know, today, exactly the best course of action for implementing sectoral transitions locally, especially over the mid- to long-term. (Rather than abandon forecasts altogether, we find that the common aphorism, “all models are wrong, but some are useful” is an appropriate perspective to have when thinking about modeled pathways for decarbonization in the region.)
To bridge the uncertainty and make region-wide decarbonization possible, government entities across the region must collaborate to encourage the production of new knowledge about how to decarbonize by investing in experiments. For example, rather than deciding ex ante on a single solution for managing regional EV charging, or worse, doing nothing due to uncertainty, San Diego can encourage investment in pilot projects similar to the V2G pilot at UC San Diego across various municipalities. Results from pilot programs can inform policy for the remaining cities and contribute valuable knowledge to an important global challenge for decarbonization. Making this kind of local learning systematic will require a regional governance structure that is able to respond to the needs of those on the front lines as well as evolving technological and political realities.

265
This section outlines key elements of such a structure. It is informed by the findings from each of the four RDF sectors, the broad strategies for local learning described in section 7.2 and illustrated in 7.3, and core themes from a series of focus groups held locally as part of the RDF process.
7.4.1 Local Focus Group Feedback on Regional Climate Governancei
On the week of August 23rd, 2021, focus group sessions were held on the topics of buildings, energy, transportation, and land use. The feedback sessions lasted approximately one and a half hours and included stakeholders from industry, civil society, and academia. The final question posed to all focus groups solicited feedback on an institutional framework that could support implementation. The groups were asked, “considering the range of stakeholders in this sector -- including public agencies, advocates, energy providers, and others -- what would a collaborative effort look like to create and implement the framework?” To identify key themes across focus groups, the responses are aggregated in Figure 7.3 below and summarized into three key actions: 1) establish goals, 2) organize players, and 3) engage and inform. These recommendations, which broadly align with and support the process of local adaptation and learning we describe earlier in the chapter, are integrated into the proposals for regional decarbonization governance that follow.
i More details on the focus groups are provided on the County of San Diego’s Integrated Regional Decarbonization Framework website: https://www.sandiegocounty.gov/content/sdc/sustainability/regional-decarbonization.html .

266
Figure 7.3 Aggregated Focus Groups Response used to develop recommendations for regional governance on How to Implement the RDF.
7.4.2 A Framework for Regional Decarbonization Governance
Figure 7.4 outlines recommendations for organization, incentives, and mechanisms as a starting point for regional governance, followed by further discussion of each of the components. It is important to note that in addition to regional coordination among the governments in San Diego, any new institution must also coordinate with the region’s 18 Tribal Nations. Bi-national coordination between any new institution and Tribal governments will be important for knowledge sharing and achieving shared goals. The Regional Tribal Summits between SANDAG and Tribal governments is a useful model for this coordination.40
Figure 7.4 Proposed Regional Governance of Decarbonization.
Regional Steering Committee: As the core governing body of the regional decarbonization effort, the Steering Committee is made up of members in government, industry, academia, and civil society institutions and is responsible for the overall strategic planning of the network and the establishment and adjustment of shared goals and priorities The Steering Committee would be a stock-taking body, supporting learning by periodically assessing and codifying lessons from technical committees, as well as pooling knowledge about costs and effectiveness of different actions.6 The Committee would work with Sector Working Groups to identify goals and rules that require tightening or loosening, and urge appropriate jurisdictions and agencies at the local, state, and federal levels to update accordingly. As the key oversight body, the Committee

267
would also create Sector Working Groups, organize subgroups (for example, on heavy duty vehicles or waste), and institute changes to representation in such groups or governance processes as needed, based on feedback and deliberation.
Sector Working Groups: Starting with the four key sectors, the Working Groups would be technical committees composed of sector experts from industry, academia, and government, who oversee strategic plans based on RDF modeling and support front-line advisors in ongoing problem solving and assessment as solutions are implemented and tested.6 The Groups would serve as the principal mechanism for reviewing and assessing experience–in effect, a kind of peer review through which front-line experts would compare results from experiments and codify what they learn as best practices. The Groups would also look for innovations and lessons from outside San Diego that could usefully be incorporated in this region. If funding opportunities for pilot programs and investment funds become available, the Sector Working Groups could decide on the beneficiaries and oversee implementation. Working groups in SANDAG may serve as existing bodies suitable to this role.
Front-Line Advisors: The advisors are public and private players in the region actively implementing decarbonization measures, with the support of Sector Working Groups. These could include, for example, a bureaucrat with firsthand knowledge of an emissions reduction program or an employee of a company trying a new decarbonization strategy. In the event of available funding for pilot programs, advisors could propose projectswhile also providing feedback on outcomes. Especially motivated advisors could serve as members of Sector Working Groups, using their own experiences as a key source of feedback on policy and source of peer review.
The Steering Committee, heavily guided by Sector Working Groups, would make recommendations to local, state and federal jurisdictions and agencies on creating incentives for action. These include direct incentives such as funding pilot projects and tightening rules and regulations, as well as indirect incentives for elected officials and businesses to be seen as part of collaborative efforts on climate change. Laggards will be drawn in due to incentives for participants involved in successful innovations.
The Steering Committee and Sector Working Groups will also be the main facilitators of learning and collaboration, both across and beyond regional jurisdictions. Figure 7.4 offers a few examples of mechanisms by which they might accomplish this. These mechanisms center around key actions such as funding pilot projects, hosting fora for learning and information diffusion, and other activities to measure and review progress and stimulating innovation among stakeholders and jurisdictions.
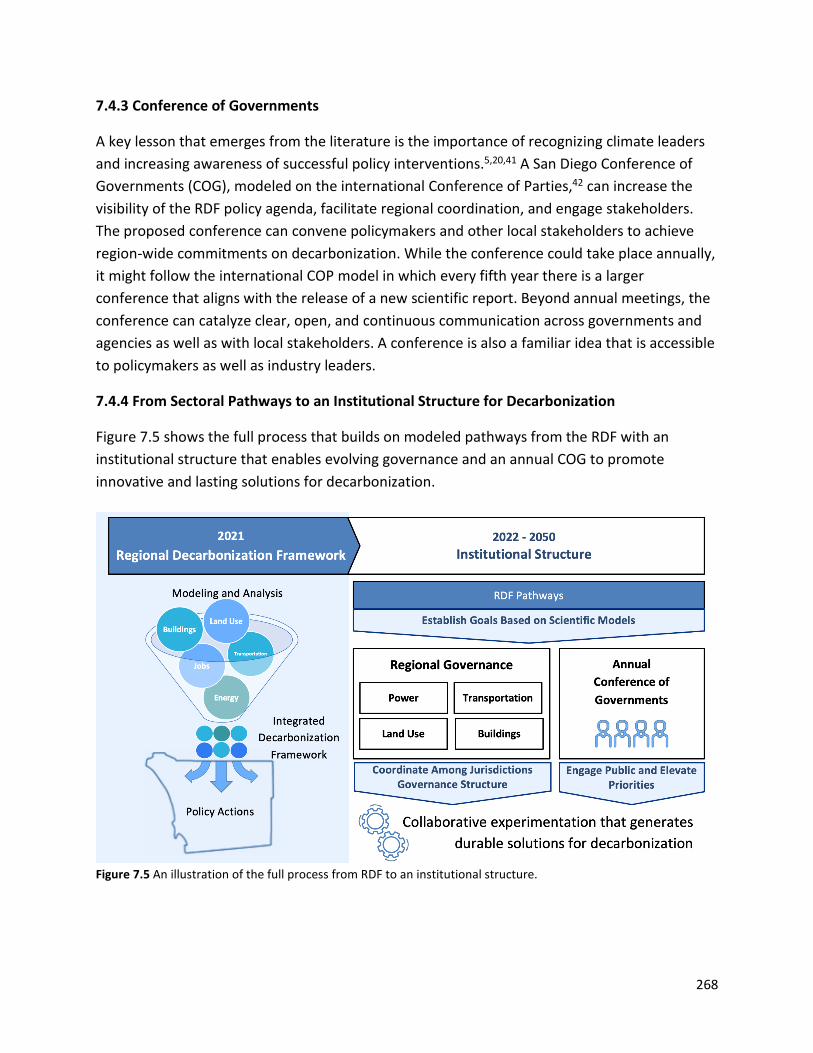
268
7.4.3 Conference of Governments
A key lesson that emerges from the literature is the importance of recognizing climate leaders and increasing awareness of successful policy interventions.5,20,41 A San Diego Conference of Governments (COG), modeled on the international Conference of Parties,42 can increase the visibility of the RDF policy agenda, facilitate regional coordination, and engage stakeholders. The proposed conference can convene policymakers and other local stakeholders to achieve region-wide commitments on decarbonization. While the conference could take place annually, it might follow the international COP model in which every fifth year there is a larger conference that aligns with the release of a new scientific report. Beyond annual meetings, the conference can catalyze clear, open, and continuous communication across governments and agencies as well as with local stakeholders. A conference is also a familiar idea that is accessible to policymakers as well as industry leaders.
7.4.4 From Sectoral Pathways to an Institutional Structure for Decarbonization
Figure 7.5 shows the full process that builds on modeled pathways from the RDF with an institutional structure that enables evolving governance and an annual COG to promote innovative and lasting solutions for decarbonization.
Figure 7.5 An illustration of the full process from RDF to an institutional structure.
269
7.5 Creating Followership: Acting at Home but Impacting Outside the Region
External engagement is necessary for successful decarbonization here in San Diego. While local governments are on the front lines of decarbonization, they are limited in statutory and budgetary authority. The governments in the San Diego region should identify and actively engage with state and federal lawmakers to advocate for key policies and programs necessary to motivate actions and build capacity for decarbonization at the local level. But the benefits of such engagement go beyond regional decarbonization.
Engagement with external efforts to push the frontier of science is an avenue for the region to generate climate impact outside the region as well as direct reductions in local emissions. There are also economic co-benefits of such engagement: opportunities to attract outside resources–such as innovation grants–and attention from state and federal policymakers, with potential spillover effects on the development of local businesses. For example, in the recent $15 billion climate packagei signed by Governor Newsom in September 2021, $20 million is dedicated for “Regional Climate Collaboratives” (RCC), which are community-driven organizations that partner with public agencies.44 SB 1072ii will add to existing funding. These are important developments to track for potential state resources to fund climate initiatives in the San Diego region.
While the RDF has mostly focused on eliminating GHG emissions within San Diego County, the region’s contribution to global carbon emissions is .08%, a proportion that will only decrease as efforts to decarbonize continue and emissions in other regions rise. The pre-pandemic carbon dioxide equivalent emissions from the San Diego region were approximately 35 million metric tons (MMTCO₂e).12 Pre-pandemic emissions were roughly 425 MMTCO₂e in California,45 6,558 MMTCO₂e in the US,46 and 43,100 MMTCO₂e globally.47 Therefore, for San Diego to have a meaningful impact on atmospheric carbon, it must not only demonstrate and adapt frontier innovations–many developed outside the region–to generate local benefits, but also share their learnings with other regions so that they may follow. If San Diego focuses from the start on the diffusion of technologies and policies to other regions, the region can be a leader that generates followership among the many other regions struggling with similar challenges in the effort to decarbonize.
Here, three mechanisms for generating followership are suggested. One is that the County can be active in state-level networks (see section 7.5.1 below). A second is that what's done in San Diego can be explicitly upscaled beyond the region--through political entrepreneurs and the
i Governor Newsom, 2021: https://www.gov.ca.gov/2021/09/23/governor-newsom-signs-climate-action-bills-outlines-historic-15-billion-package-to-tackle-the-climate-crisis-and-protect-vulnerable-communities/ ii SB 1072, 2018: https://leginfo.legislature.ca.gov/faces/billTextClient.xhtml?bill_id=201720180SB1072

270
courts (7.5.2). And a third is that models developed here can be emulated because they are successful, cost-effective, and have sustained political support.
7.5.1 A Forum for State Engagement
State leaders in California have shown a growing recognition of the need for more coordination within regions and between the state and regions on climate governance. In 2021 the California State Legislature considered Assembly Bill 897.i The proposed legislation would have created networks of local governments overseen by the Governor’s Office of Planning and Research eligible for funding for both climate change mitigation and adaptation. While the bill did not pass, a fresh proposal for such networks–AB 1640ii– would do the same thing, though with a singular focus on climate change mitigation. The lead author of this proposal, which will begin moving through committees in February 2022, is San Diego’s own Chris Ward. If and when San Diego follows through with the creation of a cross-jurisdictional climate governance institutional arrangement–such as the proposed Regional Steering Committee–this proposal would offer a ready-made avenue for seeking funding and exchanging information about what works and what doesn’t with the state and other regions.
7.5.2 Mechanisms for Upscaling
Upscaling14 can be vertical (higher levels of governance) or horizontal (across peer regions).5 In table 7.2, we provide key pillars and policies, drawn from Williams et al.48 and the US Zero Carbon Action Plan3 that can guide policymaker’s efforts to influence state and federal level policy. For a more detailed discussion of state-level policies for decarbonization, see the Local Policy Opportunity Analysis Chapter of the RDF. There are several mechanisms identified in the peer-reviewed literature and summarized in Figure 7.6. that can provide guidance for the San Diego region to achieve influence beyond its borders.
● Political Entrepreneurship: Local leaders seeking to achieve influence beyond the borders of their jurisdiction can lead to upscaling.14,20,41,49 In the San Diego context, providing a platform for local political entrepreneurs through the COG may incentivize action on climate. Leaders in the San Diego Region can also take advantage of opportunities for leadership roles in existing collaborations and structures at the state, federal, and international levels. As an example, the San Diego region’s leadership on the California Air Resources Board provides a platform for innovative programs that can have influence on the direction of state policy.
● Policy Entrenchment: According to Bernstein and Hoffman, entrenchment of climate policy can lead to catalytic impact beyond the local level.50 They identify norm changing, capacity building, and coalitions as the key mechanisms to achieve entrenchment. In a
i AB 897l, 2021: https://leginfo.legislature.ca.gov/faces/billTextClient.xhtml?bill_id=202120220AB897
ii AB 1640, 2022: https://leginfo.legislature.ca.gov/faces/billTextClient.xhtml?bill_id=202120220AB1640

271
case study of Palo Alto, California, Anderton and Setzeridentify local governance actions to achieve entrenchment: 1) legislative mandates that are enforceable in courts, 2) platforms to promote reforms, and 3) long-term visions.20 These key mechanisms ensure the stickiness of local policies and allow for broader impact that can be embedded into regional governance structures.
● Incentivize Competition: Competition among local jurisdictions can provide incentives for innovation that lead to the emergence of scalable policies and technologies that are useful in other regions.14 In San Diego, incentives for action and innovation by jurisdictions can be amplified through pilot funding.
In addition to mechanisms identified here, Chapter 9: San Diego as a Model Chapter provides further insight on how the processes created through the creation of the RDF can be used as a model in other regions.
Figure 7.6 Mechanisms for vertical and horizontal upscaling of local policies. Adapted from Kern (2019).

272
Table 7.2 Key State and Federal Policies Critical to Decarbonization at the Local Level
Decarbonization Strategy State and Federal Policies
Electricity Decarbonization. In the near term, the falling costs of wind, solar, and storage technologies make renewables an important strategy for decarbonizing the electric sector.
● Clean energy standards: Price the carbon externality ● Storage: Require sufficient storage to ensure reliability ● Offshore wind: Accelerate leasing development of offshore wind areas ● Oil and gas moratorium: Establish a moratorium on all further on and offshore oil and gas exploration ● Research, development, demonstration, and deployment: Create incentives for the innovation and adoption of
new technologies. ● Expansion of the grid: Increased coordination on transmission upgrades and expansion among grid-connected
states and federal agencies
Energy Efficiency and Conservation. Action taken to increase energy efficiency and conservation will reduce the increasing demand for electricity generation. Additionally, efficiency can lower costs for governments and ratepayers.
● Efficiency standards: Broaden and tighten standards across a wider range of end uses ● Discourage single-occupancy vehicles: Financial support for transit infrastructure and allow for greater
regulation of vehicles ● Remote work: Support remote work through broadband expansion and incentives ● Aircraft: Incentivize low carbon aircraft fuel and invest in research of new technologies ● Dietary guidelines: Expand dietary guidelines to include carbon footprint ● Food waste: Incentivize the reduction of household and post-harvest food waste
Electrification of Buildings and Transport. Electrification is an essential strategy to achieve decarbonization by mid-century while keeping costs relatively low.
● Clean Air Act: Tighten GHG emissions standards through the Clean Air Act ● EV charging: Expand EV charging stations ● Biofuels: Restrict biofuels to hard-to-decarbonize transport (e.g., heavy duty vehicles, aviation, shipping) ● Mandates: Nationwide EV mandates similar to California’s ● Hydrogen: Create incentives and support infrastructure for green hydrogen development and distribution ● Energy codes: Require states to adopt an energy code to achieve maximum possible electrification and
efficiency ● Enforcement: Funding for the enforcement of new building standards ● Equity: Subsidize the transition of low-income households to electrify buildings and transport
Carbon Capture. Removal of CO2 from combustion processes as well as from the air are necessary components of achieving decarbonization and eventually negative emissions.
● RDD&D: Invest in Carbon Capture and Storage (CCS) to achieve necessary scale ● Procurement: Direct funding through procurement by federal agencies ● 45Q: Increase the size of the 45Q tax credit for CCS ● Clean Energy Standard: Make CCS eligible for clean energy standard ● Negative Agricultural Emissions: Incentivize farmers to store carbon in soils ● Carbon Pricing: Create a price on emissions that incentivizes both CCS and reforestation efforts on private lands

273
7.6 Conclusion
One of the lessons from the pandemic is that systems need to be flexible to changing science and allow for ongoing learning from front-line experts on implementation. The same should be true for the historic task of transitioning the regional economy from fossil fuels to decarbonized sources of energy. The structures, mechanisms, and principles proposed in this chapter are meant to provide initial guidance on the design and implementation of a process to achieve climate ambitions. However, the process can, and should, evolve over time as science and technology advance. The collaboration established in the creation of the RDF itself provides a good starting point for the region. The parts of this collaboration that work well should be developed and scaled up.

274
Works Cited: 1. Castán Broto, V., & Bulkeley, H. (2013). A survey of urban climate change experiments in 100 cities. Global Environmental Change, 23(1), 92–102. https://doi.org/10.1016/j.gloenvcha.2012.07.005 2. Measham, T. G., Preston, B. L., Smith, T. F., Brooke, C., Gorddard, R., Withycombe, G., & Morrison, C. (2011). Adapting to climate change through local municipal planning: Barriers and challenges. Mitigation and Adaptation Strategies for Global Change, 16(8), 889–909. https://doi.org/10.1007/s11027-011-9301-2 3. SDSN. (2020). Zero Carbon Action Plan. Sustainable Development Solutions Network. https://irp-cdn.multiscreensite.com/6f2c9f57/files/uploaded/zero-carbon-action-plan.pdf 4. Victor, D. G., & Muro, M. (2020, October 22). Cities are pledging to confront climate change, but are their actions working? Brookings. https://www.brookings.edu/blog/the-avenue/2020/10/22/cities-are-pledging-to-confront-climate-change-but-are-their-actions-working/ 5. Kern, K. (2018). Cities as leaders in EU multilevel climate governance: Embedded upscaling of local experiments in Europe. Environmental Politics, 28(1), 125–145. https://doi.org/10.1080/09644016.2019.1521979 6. David G. Victor and Charles F. Sabel, Fixing the Climate: Strategies for an Uncertain World (Princeton University Press, 2022), https://press.princeton.edu/books/hardcover/9780691224558/fixing-the-climate. 7. Holcombe, R. G., & Williams, D. W. (2009). Are There Economies of Scale in Municipal Government Expenditures? Public Finance and Management, 9(3), 416–438.6. 8.Morrill, R. L. (1989). Regional Governance in the United States: For Whom? Environment and Planning C: Government and Policy, 7(1), 13–26. https://doi.org/10.1068/c070013 9. Jordan, A., & Huitema, D. (2014). Innovations in climate policy: The politics of invention, diffusion, and evaluation. Environmental Politics, 23(5), 715–734. https://doi.org/10.1080/09644016.2014.923614 10. Trumbull, K., & DeShazo, J. R. (2021). Southern California Regional Energy Needs Assessment (p. 85). Luskin Center for Innovation. 11. Victor, David G., Frank W. Geels, and Simon Sharpe. 2019. “Accelerating The Low Carbon Transition.” Washington, D.C.: Brookings Institution. https://www.brookings.edu/research/accelerating-the-low-carbon-transition/. 12. SANDAG. (2018). Climate Change White Paper. San Diego Association of Government. 13. Diehl, P. Oceanside will push for beach groins, sand bypass system despite likely denial by state. The San Diego Union-Tribune (2021). https://www.sandiegouniontribune.com/communities/north-county/oceanside/story/2021-08-12/oceanside-will-request-permits-for-beach-groins-sand-bypass-system 14. Kalafatis, S. E., & Lemos, M. C. (2017). The emergence of climate change policy entrepreneurs in urban regions. Regional Environmental Change, 17(6), 1791–1799. https://doi.org/10.1007/s10113-017-1154-0 15. Sampite-Montecalvo, A. Chula Vista council adopts 2017 climate action plan. The San Diego Union-Tribune (2017). https://www.sandiegouniontribune.com/communities/south-county/sd-se-climate-plan-1005-story.html 16. SANDAG. (n.d.) Climate Action. San Diego Association of Government (SANDAG). https://www.sandag.org/index.asp?classid=17&subclassid=46&projectid=565&fuseaction=projects.detail 17. Forrest, K. E., Tarroja, B., Zhang, L., Shaffer, B., & Samuelsen, S. (2016). Charging a renewable future: The impact of electric vehicle charging intelligence on energy storage requirements to meet renewable portfolio standards. Journal of Power Sources, 336, 63–74. https://doi.org/10.1016/j.jpowsour.2016.10.048 18. Margoni, L. (2017, June 14). Nuvve and UC San Diego to Demonstrate Vehicle-to-Grid Technology Through Energy Commission Grant. UC San Diego News. https://ucsdnews.ucsd.edu/pressrelease/nuvve_and_uc_san_diego_to_demonstrate_vehicle_to_grid_technology

275
19. SANDAG (2011). 2050 Regional Transportation Plan. San Diego Association of Government (SANDAG). https://www.sandag.org/index.asp?projectid=349&fuseaction=projects.detail 20. Anderton, K., & Setzer, J. (2018). Subnational climate entrepreneurship: Innovative climate action in California and São Paulo. Regional Environmental Change, 18(5), 1273–1284. https://doi.org/10.1007/s10113-017-1160-2 21. Garrick, D. San Diego and area cities getting $600M in federal COVID-19 relief to help replace lost tax revenue. The San Diego Union-Tribune (2021). 22. Nikolewski, R. County to join 5-city CCA as alternative to SDG&E. Will it bring lower electric rates? The San Diego Union-Tribune (2021). 23. CalCCA (2021.) San Diego County to Join San Diego Community Power. California Community Choice Association (CalCCA). https://cal-cca.org/san-diego-county-to-join-san-diego-community-power/#:~:text=About%20SDCP%20San%20Diego%20Community,and%20the%20economy%20in%20our 24. PG&E, SDG&E, & SCE (2019). Frontrunner: City of Carlsbad. Statewide Reach Codes Program, California Energy Codes and Standards, CA Public Utilities Commission. https://localenergycodes.com/content/reach-codes-frontrunner-city-of-carlsbad/ 25. Nikolewski, R. Encinitas just banned natural gas in new buildings, including homes - The San Diego Union-Tribune. The San Diego Union-Tribune (2021). 26. SoCalGas & SDG&E. SoCalGas and SDG&E Announce Groundbreaking Hydrogen Blending Demonstration Program to Help Reduce Carbon Emissions. PR Newswire (2020). https://www.prnewswire.com/news-releases/socalgas-and-sdge-announce-groundbreaking-hydrogen-blending-demonstration-program-to-help-reduce-carbon-emissions-301178982.html 27. California Department of Fish and Wildlife (2022). Rancho Jamul Ecological Reserve. https://wildlife.ca.gov/Lands/Places-to-Visit/Rancho-Jamul-ER#10119102-history 28. U.S. Fish and Wildlife Service (2021). San Diego National Wildlife Refuge. https://www.fws.gov/refuge/San_Diego/about.html 29. San Diego County Department of Parks and Recreation (n.d.). Multiple Species Conservation Program (MSCP). County of San Diego. https://www.sdparks.org/content/sdparks/en/AboutUs/Plans/MSCP.html 30. SANDAG, SDG&E, County of San Diego, & City of San Diego. (n.d.). Accelerate to Zero Emissions. http://a2zsandiego.com/static/zero/ 31. Black & Veatch Management Consulting. (2021, July). San Diego Regional Electric Vehicle Gap Analysis. http://a2zsandiego.com/static/zero/regional-gap-analysis.html 32. Massachuessets. (2020). Massachusetts Decarbonization Roadmap (p. 92). MA Executive Office of Energy and Environmental Affairs. 33. East Central Florida Regional Resilience Collaborative. East Central Florida Regional Planning Council . (n.d.). https://www.ecfrpc.org/resiliencecollaborative 34. The East Central Florida Regional Resilience Collaborative Memorandum of Understanding. (2019, May 15). https://www.ecfrpc.org/_files/ugd/4c4fbd_a7e3a59bf14a4bc9b29983ba6613391d.pdf 35. City of Orlando. (2021). The 100% Renewables Cities and Regions Roadmap. https://renewablesroadmap.iclei.org/wp-content/uploads/2021/11/Orlando-case-study_final.pdf 36. Climate, Energy and Environment Policy Committee. (2020, November 18). Metropolitan Washington 2030 Climate and Energy Action Plan. https://www.mwcog.org/documents/2020/11/18/metropolitan-washington-2030-climate-and-energy-action-plan/ 37. Denver Public Health & Environment. (2018, July). Denver 80x50 Climate Action Plan. https://www.denvergov.org/files/assets/public/climate-action/documents/ddphe_80x50_climateactionplan.pdf 38. Mid-America Regional Council, & Climate Action KC. (2021). KC Regional Climate Action Plan. https://kcmetroclimateplan.org/wp-content/uploads/2021/05/Climate-Action-Plan.pdf

276
39. Smith, L. A., & Stern, N. (2011). Uncertainty in science and its role in climate policy. Philosophical Transactions of the Royal Society A: Mathematical, Physical and Engineering Sciences, 369(1956), 4818–4841. https://doi.org/10.1098/rsta.2011.0149 40. SANDAG. (2018, February). Intraregional Tribal Transportation. https://www.sandag.org/uploads/publicationid/publicationid_4488_23635.pdf 41. Brouwer, S., & Huitema, D. (2018). Policy entrepreneurs and strategies for change. Regional Environmental Change, 18(5), 1259–1272. https://doi.org/10.1007/s10113-017-1139-z15. 42. UNFCCC COP https://unfccc.int/process/bodies/supreme-bodies/conference-of-the-parties-cop 43. Myers, J. (2017, August 6). Column: Political Road Map: No one spends more on lobbying in Sacramento than local governments. Los Angeles Times. https://www.latimes.com/politics/la-pol-ca-road-map-lobbying-local-governments-20170806-story.html 44. California Strategic Growth Council (2021). SGC Community and Technical Assistance Programs. https://sgc.ca.gov/programs/cace/resources/ 45. CARB. (2020). Air Quality and Emissions Data and Statistics. California Air Resources Board. https://ww3.arb.ca.gov/html/ds.htm 46. EPA. (2019). Inventory of U.S. Greenhouse Gas Emissions and Sinks [Reports and Assessments]. U.S. Environmental Protection Agency. https://www.epa.gov/ghgemissions/inventory-us-greenhouse-gas-emissions-and-sinks 47. GCP. (2021). Global Carbon Project (GCP). Global Carbon Project (GCP). https://www.globalcarbonproject.org/ 48. Williams, J. H., Jones, R. A., Haley, B., Kwok, G., Hargreaves, J., Farbes, J., & Torn, M. S. (2021). Carbon-Neutral Pathways for the United States. AGU Advances, 2(1), e2020AV000284. https://doi.org/10.1029/2020AV000284 49. Huitema, D., Boasson, E. L., & Beunen, R. (2018). Entrepreneurship in climate governance at the local and regional levels: Concepts, methods, patterns, and effects. Regional Environmental Change, 18(5), 1247–1257. https://doi.org/10.1007/s10113-018-1351-5 50. Bernstein, S., & Hoffmann, M. (2018). The politics of decarbonization and the catalytic impact of subnational climate experiments. Policy Sciences, 51(2), 189–211. https://doi.org/10.1007/s11077-018-9314-8

277
8. Local Policy Opportunity Scott Anders, Energy Policy Initiatives Center, University of San Diego Nilmini Silva-Send, Energy Policy Initiatives Center, University of San Diego Joe Kaatz, Energy Policy Initiatives Center, University of San Diego Yichao Gu, Energy Policy Initiatives Center, University of San Diego Marc Steele, Energy Policy Initiatives Center, University of San Diego
Other chapters in this report present results of technical analysis to determine levels of activity in each of four pathways that are possible and would be needed to reach deep decarbonization goals in the San Diego region. This chapter assesses current commitments in Climate Action Plans (CAP) to determine if additional activity would be needed to put the region on a trajectory to meet these goals and to identify opportunities for local jurisdictions in the region to take further action to support the decarbonization pathways.
To this end, EPIC completed an analysis of the authority of local governments and agencies to act to influence and regulate greenhouse gas (GHG) emissions, based on a summary of key federal, state, and local agencies, and key legislation and regulation at the federal and state levels to help to clarify the ability of local governments to act to reduce GHG emissions; a comparative analysis of CAPs to determine the frequency of measures, relative GHG impact of decarbonization pathways and measures, and integration of social equity considerations; and a scenario analysis to estimate the total impact of the GHG reduction commitments in all adopted and pending CAPs and the potential GHG impact of a scenario of applying the best CAP commitments to all jurisdictions. We use results of the above analysis and additional research, identify opportunities for further local action and regional collaboration in each of the four decarbonization pathways. Figure 8.1 summarizes the overall project approach.

278
Figure 8.1 Overall Approach to Identifying Local Policy Options
In general, opportunities exist for additional GHG reductions by increasing the number of jurisdictions adopting an existing measure or policy, making existing measures or policies more aggressive, and implementing policies not previously adopted in the region. Opportunities for regional collaboration can include efforts to support local policy development and implementation and those that are regional in scope that are intended to serve the entire region.
Figure 8.2 illustrates the organizational structure for the analysis and results presented here and indicates the related Regional Decarbonization Framework report chapter. These three pillars of decarbonization — focused on buildings, electricity supply, and transportation — represent both the highest emitting sectors and those with the highest potential to reduce GHG emissions. Natural climate solutions, including agriculture, are important and will be included in the analysis but to a lesser extent than the three main pathways. The broad pathways can be further organized into subcategories.
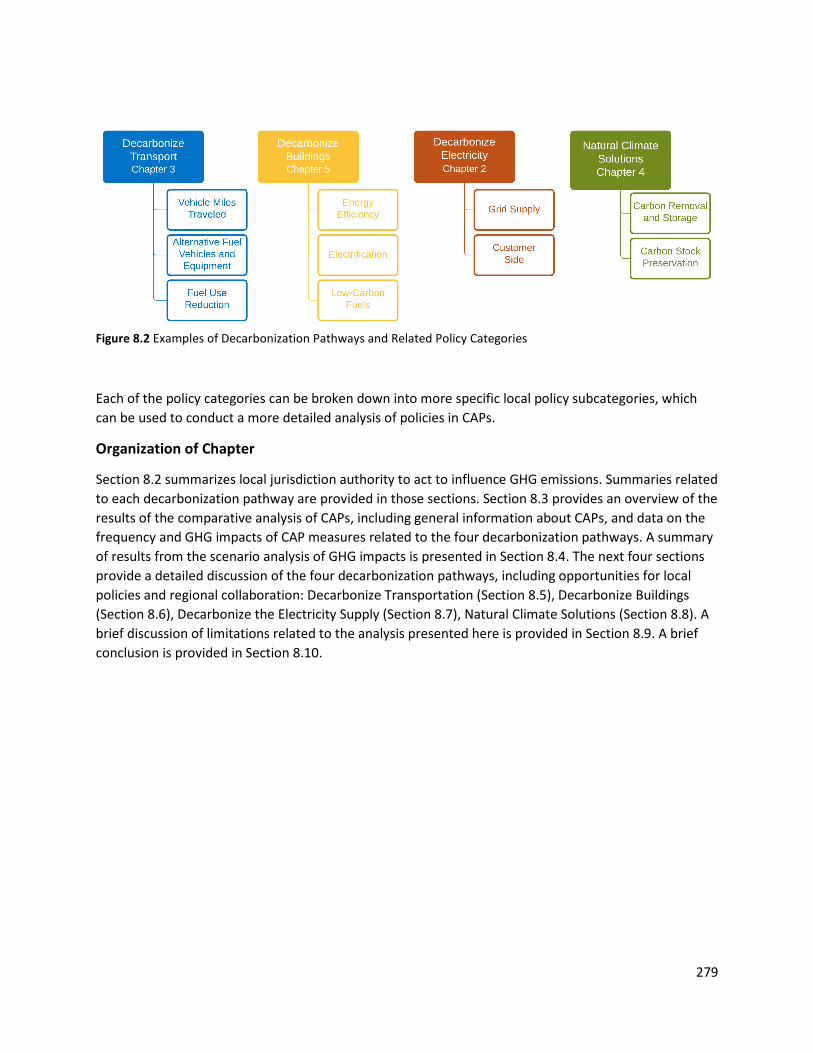
279
Figure 8.2 Examples of Decarbonization Pathways and Related Policy Categories
Each of the policy categories can be broken down into more specific local policy subcategories, which can be used to conduct a more detailed analysis of policies in CAPs.
Organization of Chapter
Section 8.2 summarizes local jurisdiction authority to act to influence GHG emissions. Summaries related to each decarbonization pathway are provided in those sections. Section 8.3 provides an overview of the results of the comparative analysis of CAPs, including general information about CAPs, and data on the frequency and GHG impacts of CAP measures related to the four decarbonization pathways. A summary of results from the scenario analysis of GHG impacts is presented in Section 8.4. The next four sections provide a detailed discussion of the four decarbonization pathways, including opportunities for local policies and regional collaboration: Decarbonize Transportation (Section 8.5), Decarbonize Buildings (Section 8.6), Decarbonize the Electricity Supply (Section 8.7), Natural Climate Solutions (Section 8.8). A brief discussion of limitations related to the analysis presented here is provided in Section 8.9. A brief conclusion is provided in Section 8.10.
280
8.1 Key Findings Based on our analysis, the following overall key findings emerge. More detailed findings are provided in the sections below, including findings from the analysis completed and opportunities for local action and regional collaboration.
● Local Jurisdictions Have Authority to Influence and Regulate GHG Emissions – Local governments can influence and regulate GHG emissions by accelerating state statutory targets and policies, adopting ordinances to go beyond state law, and using unique authority to adopt and implement policies. Local authority comes from both constitutionally derived police power and delegated authority from state statutes. Constitutionally derived police power grants a broad, elastic authority to act where such action is reasonably related to a legitimate government purpose and has a reasonable tendency to promote public health, safety, or the general welfare of the community. It is limited by general state law and state and federal constitutions. The full extent of a local jurisdiction’s police power to regulate GHG emissions is unknown. Delegated authority includes, among other things, analyzing land use environmental impacts and mitigating them, adopting more stringent building codes, building infrastructure, or creating community choice aggregators (CCA) to supply electricity. Key findings related to authority in each decarbonization pathway are presented in more detail in Section 8.2 and the sections on each decarbonization pathway (Sections 8.5 through 8.8). A full discussion of local authority is provided in Appendix B.
● Current CAP Commitments are Insufficient to Reach Decarbonization Goals – Current local CAP commitments for transportation, electricity, and natural gas GHG reductions contribute a relatively small portion of the total reductions needed to reach net zero GHG emissions in 2035 — about 2 million metric tons CO2e (MMT CO2e), which would leave about 12 MT CO2e. Even if the most aggressive CAP measures are applied to all jurisdictions in the region, regardless of whether they have a CAP in place, significant emissions would remain (approximately 7 MMT CO2e in 2035), mostly from natural gas combustion and on-road transportation. Note other remaining emissions from other emissions categories also would have to be addressed. More detail is provided in Section 8.4 and Sections 8.5 through 8.8.
● Opportunities Exist for More Jurisdiction to Adopt and Strengthen Existing CAP Measures – Based on the comparative analysis of CAPs, there is an opportunity for more jurisdictions to adopt CAP measures already adopted by some jurisdictions in the region. Similarly, based on the scenario analysis of the combined GHG impacts of CAP measures, there is an opportunity for most jurisdictions to strengthen their existing CAP measures. While many policy examples exist in our region, there also are other examples from around California and the U.S. of policies that have not been included in CAPs in the region. More detail is provided in Section 8.4 and Sections 8.5 through 8.8
● Additional Policies Would be Needed to Decarbonize Transportation and Buildings – Based on current CAP commitments, expected GHG reductions in 2035 from measures to reduce vehicle miles traveled (VMT) and increase use of zero-emissions vehicles (ZEV) are insufficient to achieve the level of GHG emissions reductions — mainly from ZEVs outlined in Chapter 3. Local uptake of ZEVs beyond what is expected from state and

281
regional incentives likely would require more local incentives. Similarly, expected GHG reductions in 2035 from building measures in CAPs are insufficient to meet the goals outlined in Chapter 5. In particular, more measures would be needed to electrify existing buildings. More detail on decarbonizing transportation is provided in Section 8.5 and on decarbonizing buildings in Section 8.6
● Opportunities Exist for Regional Collaboration in all Decarbonization Pathways – Regional collaboration could include collecting and tracking data, conducting analysis, providing support to develop and implement policies, and convening stakeholder and working groups to develop regional strategies and monitor progress. Examples exist for regional collaboration, including the Accelerate to Zero (A2Z) project to increase use of ZEVs. More detail on opportunities for regional collaboration is provided in Sections 8.5.7, 8.6.6, 8.7.6, and 8.8.6.
● Additional Work Would be Needed to Integrate Social Equity into Climate Planning – Based on a preliminary review, the integration of social equity in adopted and pending CAPs is limited, inconsistent, and lacks specificity. Additional work would be needed to develop the capacity and tools to understand and address the equity implications of all decarbonization policies in the San Diego region, including data collection and analysis; regional guidance documents; and regional working groups to coordinate, advise, track, and monitor how equity is being addressed in climate planning. Additional discussion on social equity is provided in Sections 8.3.5, 8.5.7, 8.6.6, 8.7.6, and 8.8.6.
282
8.2 Authority of Local Jurisdictions and Agencies to Influence and Regulate GHG Emissions
In general, to reduce GHG emissions, local governments can accelerate state statutory targets and policies, adopt ordinances to go beyond state law, and use unique authority to adopt and implement policies. This section provides a summary of a detailed review (provided in Appendix B). It seeks to answer the following questions related to the ability of local governments and agencies to influence or regulate GHG emissions:
● What constitutional or delegated authority exists for local action, and to what extent is local authority preempted by federal or California law or regulation?
● What state and federal players can influence or regulate GHG emissions (e.g., state regulators like the California Air Resources Board), and what are their respective roles relative to local jurisdictions and agencies?
● What key legislation or regulation applies in a given area (e.g., building electrification) that will affect GHG emissions at the local level?
8.2.1 Summary of Findings
Local jurisdiction authority to regulate GHGs is created by broad, general constitutionally derived “police power”i or delegated authority under state or federal law. Use of police authority may not conflict with “general” law (e.g., state law) under preemption principles found in California Constitutional Article XI, § 7 or federal expressed or implied preemption under the Supremacy Clause of the U.S. Constitution.ii State and federal preemption analysis, as well as the analysis on the full extent of local police power to regulate GHG emissions, are factually specific with local jurisdiction authority uncertainty dependent on the type of action.
Police power of a city or county within its own boundaries is as broad as that of the state legislature and subject only to limitations of general law.iii Police power "is not a circumscribed prerogative, but is elastic and, in keeping with the growth of knowledge and the belief in the popular mind of the need for its application, capable of expansion to meet existing conditions of modern life and thereby keep pace with the social, economic, moral, and intellectual evolution of the human race."iv Its exercise must be both:
a) Reasonably related to a legitimate government purposev; and b) Have a reasonable tendency to promote the public health, morals, safety, or general
welfare of the community.vi
i Cal. Const. art. XI, § 7. ii U.S. Const. art. VI, §2. iii Candid Enters., Inc. v. Grossmont Union High Sch. Dist., 39 Cal. 3d 878, 885 (1985); Birkenfeld v. City of Berkeley, 17 Cal. 3d 129, 140 (1976); Carlin v. City of Palm Springs, 14 Cal. App. 3d 706, 711 (1971). iv Miller v. Board of Pub. Works, 195 Cal. 477, 485 (1925). v Birkenfeld v. City of Berkeley, 17 Cal. 3d 129, 158 (1976). See Consolidated Rock Prods. Co. v. City of Los Angeles, 57 Cal. 2d 515, 522 (1962). vi Carlin v. City of Palm Springs, 14 Cal. App. 3d 706, 711 (1971).
283
Police power is especially well established in enacting and enforcing land use laws. City and county land use authority does not rely on delegated general law of the state or federal government. Instead, state and federal laws are limitations on a city’s or county’s exercise of its police power.i To this end, local jurisdictions act with both police power and delegated authority from the legislature to establish climate changes policies and regulations to reduce GHGs in general plans (GPs), climate action plans (CAPs), zoning, transit-oriented development regulations, carbon sequestration (including urban forestry), energy conservation actions through green building practices and reach codes, water conservation, and solid waste reduction. Land use authority is subject to the vested rights doctrineii and Subdivision Map Actiii that limits how a subsequent change in local law or the authority to impose conditions apply to a particular improvement to land or a vesting tentative map for subdivisions.
Local jurisdiction police power is also subject to state preemption. Examples include the California Energy Commission’s authority to site and license thermal power plants of 50 megawattsiv or more and energy storage resources of 20 MWs or more that discharge for at least two hours or more and will deliver net peak energy by October 31, 2021.v It is notable that the Governor may curtail local land use authority over siting and regional air quality regulation of these and other related energy resources, including emergency backup generation, when an emergency declaration is issued for a specified time period.vi Such declarations can suspend local and state laws by either establishing exclusive licensing authority that preempts or by expressly suspending air quality laws, the California Environmental Quality Act (CEQA), and the California Coastal Act (CAC). Emergency declarations may also have the effect of limiting judicial review of such licenses.
Local land use authority is generally concurrent to, and not preempted by, air quality authority law and regulation of air pollutants from stationary, nonvehicular sources of emissions. Concurrent authority may allow local jurisdictions to further regulate air quality under its police power.vii It should be noted that there is no power granted to local air districts to infringe on an existing local jurisdiction’s authority over land use (e.g., zoning).viii
Charter cities and counties act with more autonomy over governance decisions than common law cities and countiesix; however, all local jurisdictions are controlled and subject to general state law. Of the nineteen local governments in the San Diego region, there are eight charter citiesx, and the County of San Diego is a charter county. Notably, all cities act with a higher level of autonomy than the county
i DeVita v. County of Napa, 9 Cal. 4th 763, 782 (1995); Candid Enters., Inc. v. Grossmont Union High Sch. Dist., 39 Cal. 3d 878, 885 (1985). ii Avco Community Developers v. South Coast Reg’l Comm’n, 17 Cal. 3d 785, 791 (1976), superseded by statute as stated in Santa Margarita Area Residents Together v. San Luis Obispo County Bd. Of Supervisors, 84 Cal. App. 4th 221, 229 (2000). iii See Government Code §§ 66410–66499.38; Govt Code § 66474.2 & 66498.1(b). iv See Public Resources Code §§ 25500 et seq.; See Public Resources Code §§ 25120 & 25123. v See California Energy Commission Order No. 21-0908-1 (Adopted September 8, 2021). vi See Governor’s July 30, 2021 Proclamation of A State of Emergency to address energy supply and demand issues; See U.S. Const. Amendment X; See California Emergency Services Act: Government Code §§ 8558, 8567, 8571, 8625, & 8627. vii See Health & Safety Code §§ 39002 & 41508. viii See Health & Safety Code §§ 40716(b) & 41015. ix See Cal. Const. art. XI; See Government Code § 34871. x Cities of Carlsbad, Chula Vista, Del Mar, El Cajon, Oceanside, San Diego, San Marcos, and Vista.
284
because they are voluntarily formed and perform many essential services. Charter cities also act with more autonomy than common law cities under the “home rule” power to govern matters of “municipal affairs.”i Charter counties exercise limited home rule authority.ii This power allows local laws to expand beyond state law requirements. However, the extent of home rule authority is a legal determination that depends on the specific charter and municipal code of an individual charter jurisdiction, whether the exercised authority is for a municipal affair, and whether the matter is of statewide concern where it is the intent and purpose of the general laws to occupy the field to the exclusion of municipal regulation.iii Finally, because counties are the legal subdivision of the state, the state may delegate or rescind any delegated function of the state to a county.
Local jurisdictions also act with the authority to taxiv, issue bondsv, and impose fees, charges, and rates.vi This authority is derived from and limited by the California Constitution and statute, including requiring voter approval for taxes and bonds.vii
Summary of Findings by Decarbonization Pathway Table 8.1 summarizes local jurisdiction authority for each decarbonization pathway and policy category. Also, brief summaries of the authority related to the decarbonization pathways are presented in the sections on Decarbonize Transportation (Section 8.5), Decarbonize Buildings (Section 8.6), Decarbonize the Electricity Supply (Section 8.7), and Natural Solutions (Section 8.8). Appendix B contains a more detailed discussion of the underlying research that forms the basis of the summary below and authority summaries found in each pathway section.
i Cal. Const. art. XI, § 5. ii Charter County limited “home rule” authority includes: 1) providing for lection, compensation, terms, removal, and salary of the governing board; 2) for the election or appointment (except the sheriff, district attorney, and assessor who must be elected), compensation, terms, and removal of all county officers; 3) for the powers and duties of all officers; and for consolidation and segregation of county offices. It excludes additional authority over: 1) local regulations; 2) revenue-raising abilities; 3) budgetary decisions; or 4) intergovernmental relations. iii See Cal. Const. art. XI, § 5, subd. (a); See Jackson v. City of Los Angeles, 111 Cal. App. 4th 899 (2d Dist. 2003); See City of Santa Clara v. Von Raesfeld, 3 Cal. 3d 239 (1970); See Baron v. City of Los Angeles, 2 Cal. 3d 535 (1970); Dairy Belle Farms v. Brock, 97 Cal. App. 2d 146, 217 P.2d 704 (1st Dist. 1950); See Wilkes v. City and County of San Francisco, 44 Cal. App. 2d 393, (1st Dist. 1941); See People ex rel. Scholler v. City of Long Beach, 155 Cal. 604 (1909); See Galli v. Brown, 110 Cal. App. 2d 764 (1st Dist. 1952); See Pearson v. Los Angeles County, 49 Cal. 2d 523 (1957). iv Cal. Const. art. XIIIC, § 2(a) & (d). v See generally Municipal Bond Act of 1901 (Government Code §§ 43600–43638) & Government Code §§ 50665.1–50670. vi Cal. Const. art XI, §7; see also Revenue Bond Act of 1941 (Government Code §§ 54300 et seq., Uniform Standby Charge Procedure Act (Government Code §§ 54984 et seq.); Government Code § 66013; Government Code § 66014; Health & Safety Code § 5471 & 5473; See generally Government Code § 37112. vii See generally Cal. Const. art. XIIIA, XIIIC, & XIIID; See Bradley-Burns Uniform Local Sales and Use Tax Law (Revenue & Tax Code §§ 7200 et seq.).
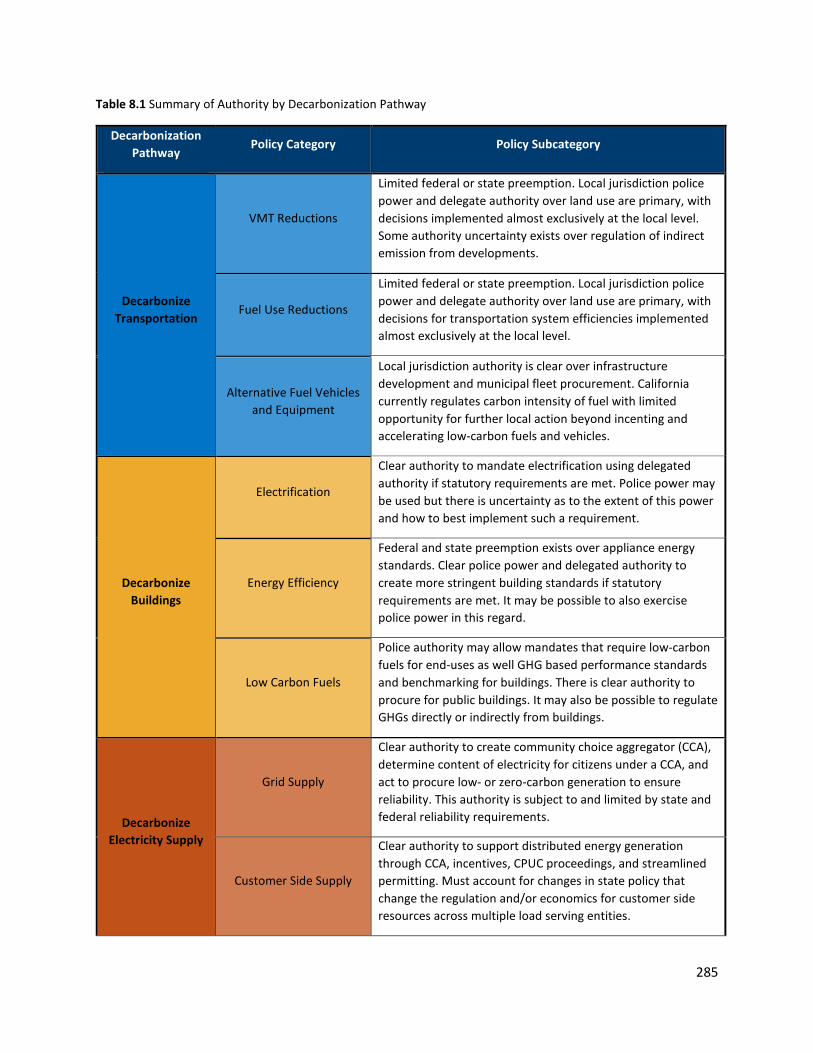
285
Table 8.1 Summary of Authority by Decarbonization Pathway
Decarbonization Pathway
Policy Category Policy Subcategory
Decarbonize Transportation
VMT Reductions
Limited federal or state preemption. Local jurisdiction police power and delegate authority over land use are primary, with decisions implemented almost exclusively at the local level. Some authority uncertainty exists over regulation of indirect emission from developments.
Fuel Use Reductions
Limited federal or state preemption. Local jurisdiction police power and delegate authority over land use are primary, with decisions for transportation system efficiencies implemented almost exclusively at the local level.
Alternative Fuel Vehicles and Equipment
Local jurisdiction authority is clear over infrastructure development and municipal fleet procurement. California currently regulates carbon intensity of fuel with limited opportunity for further local action beyond incenting and accelerating low-carbon fuels and vehicles.
Decarbonize Buildings
Electrification
Clear authority to mandate electrification using delegated authority if statutory requirements are met. Police power may be used but there is uncertainty as to the extent of this power and how to best implement such a requirement.
Energy Efficiency
Federal and state preemption exists over appliance energy standards. Clear police power and delegated authority to create more stringent building standards if statutory requirements are met. It may be possible to also exercise police power in this regard.
Low Carbon Fuels
Police authority may allow mandates that require low-carbon fuels for end-uses as well GHG based performance standards and benchmarking for buildings. There is clear authority to procure for public buildings. It may also be possible to regulate GHGs directly or indirectly from buildings.
Decarbonize Electricity Supply
Grid Supply
Clear authority to create community choice aggregator (CCA), determine content of electricity for citizens under a CCA, and act to procure low- or zero-carbon generation to ensure reliability. This authority is subject to and limited by state and federal reliability requirements.
Customer Side Supply
Clear authority to support distributed energy generation through CCA, incentives, CPUC proceedings, and streamlined permitting. Must account for changes in state policy that change the regulation and/or economics for customer side resources across multiple load serving entities.

286
Decarbonization Pathway
Policy Category Policy Subcategory
Natural
Climate Solutions
Carbon Removal
& Storage
This is an evolving area of state action and law with significant mandates on state land agencies through executive orders. It is complicated by federal, tribal, state, private, and local land ownership, land use authority, and land management agencies. Cooperative agreements amongst these stakeholders are paramount to achieving any regionwide action. Existing local jurisdiction land use authority exists, but additional research and development of what is legally feasible to develop or mandate these types of projects would be needed. Aligning with state planning and funding could be evaluated.
Carbon Stock Preservation
This is an evolving area of state action and law with significant mandates on state land agencies through executive orders. It is complicated by federal, tribal, state, private, and local land ownership, land use authority, and land management agencies. Cooperative agreements amongst these stakeholders are paramount to achieving any regionwide action. Existing local jurisdiction land use authority exists, but additional research and development of what is legally feasible beyond easements and land conservation, particularly with regard to activities on private land, would be needed. Aligning with state planning and funding could be evaluated.
Agriculture Methane Reduction
State authority exists for CARB to regulate, but legislation sets January 1, 2024, as the effective date of any regulation. It is unclear whether CARB will enact regulations in 2024, leaving potential opportunity for local jurisdiction action.
8.2.2 Limitations of Review of Authority
The review of authority analyzed federal and state preemption with regards to local jurisdiction police power and delegated authority. It evaluated opportunities for local jurisdictions to act within existing constitutional, legislative, and regulatory frameworks and to identify uncertainty with regard to authority. It was designed to be comprehensive but not exhaustive given the complexity of some of the laws involved and the lack of activities in certain areas such as natural climate solutions. It did not evaluate specific local policies — such as permit approval processes — to find barriers. Additional work would be needed in this area to understand the opportunities and challenges presented by local policies.

287
8.3 Comparative Analysis of Climate Action Plans in the San Diego Region CAPs are planning documents that demonstrate how a local jurisdiction can achieve an adopted emissions target. Cities develop plans for a variety of reasons, including as mitigation for General Plan updates or to act as general, aspirational guidance for city actions. In general, CAPs represent what local jurisdictions have determined to be a reasonable and feasible commitment to reduce GHG emissions at the time of adoption. EPIC reviewed and analyzed measures and supporting actions contained in 17 adopted and pending CAPs to identify current local policy commitments in the San Diego region that support decarbonization pathways.
For this analysis, we determined (1) the frequency and distribution of measures and supporting actions across all 17 CAPs, (2) how much CAP measures and supporting actions contributed to the local GHG reduction in CAPs, and (3) whether and how CAPs integrate of social equity considerations.
8.3.1 Summary of Findings
● Nearly half of the CAPs in the region are scheduled to be updated between 2021 and 2025.
● No adopted or pending CAP analyzed has a net zero GHG emissions target. ● Significant variability exists across CAPs in how much each decarbonization pathway and
policy category contributes to the local GHG reduction in CAPs. For example, the contribution from decarbonizing electricity ranges from 20% to nearly 70% of local GHG reductions. Similarly, decarbonizing transportation ranges from about 10%–50%, building decarbonization ranges from 0%-30%, and natural climate solutions range from 0-5%.
● All adopted and pending CAPs have measures to approach or achieve 100% carbon-free grid electricity supply before the state deadline of 2045. On average, these measures account for about 45% of local GHG reductions in CAPs; the majority is from measures to form or join a CCA program.
● Based on GHG commitments in CAPs, transportation-related measures account for the next highest contribution to local GHG emissions (28%), with increasing alternative fuel use contributing on average about 16% and VMT reduction on average about 12%.
● On average, GHG reductions in CAPs come disproportionately from decarbonizing electricity even though on-road transportation is the highest emitting GHG emissions category. This is due mostly to the statewide policy to achieve 100% carbon-free electricity in California by 2045 and suggests an opportunity for additional reductions from the Decarbonize Transportation Pathway.
● Opportunities exist across all decarbonization pathways for more local jurisdictions to adopt existing CAP measures.
● CAP measures employ a range of implementation mechanisms, including making capital expenditures and infrastructure investments, typically by local jurisdictions; education, outreach, and collaboration; financial incentives and financing; evaluations of potential programs and policies; plans or programs; and requirements. It is common for local governments to combine approaches.
288
● Social equity considerations in CAPs are limited, inconsistent, and lack specificity. CAP updates provide an opportunity to integrate social equity into the entire climate action planning cycle. For example, the SANDAG ReCAP Framework could be expanded to include guidance for integrating equity considerations into CAPs.
● Regional programs and collaboration could develop regional equity indicators, create a consistent definition of equity, and regularly report on climate-related equity topics. A Regional Climate Equity Collaborative or Working Group could educate and advise regional leaders and collect stakeholder input.
8.3.2 Comparative Analysis Approach
To analyze CAP measures and supporting actions, EPIC updated its CAP Mitigation Measure Database to reflect the most recently adopted and pending CAPs. CAP measures and supporting actions were categorized using several different characteristics to facilitate analysis in line with the structure of the report, including decarbonization pathways, policy categories and subcategories, and implementation mechanisms. The following sections provide more details on this approach.
CAPs Included in the Analysis Table 8.2 summarizes which CAPs we included or excluded from the analysis. We included fourteen adopted CAPs and two that are completed but pending adoption. We excluded the City of National City because its CAP was adopted in 2011 and had a 2020 emissions target. Further, its methods, data, and measures predate significant development in methods and state guidance. Note that the City of San Diego draft CAP update was released for public review on November 2021. Because our analysis was nearly complete at the time of release, it is not included in our analysis here; however, the current City of San Diego CAP, adopted in 2015, is included. In addition, the City of El Cajon rescinded its CAP in 2020; however, it was replaced with a Sustainability Initiative, which contains measures and actions substantially similar to the CAP and is treated as such in this analysis. Lastly, the County of San Diego’s CAP, which was adopted in 2018, has since been invalidated through litigation; however, the County is in the process of revising its CAP and is actively implementing measures included in its 2018 CAP. For this reason, the County is included in the 17 jurisdictions with adopted and pending CAPs out of the 19 jurisdictions in the region.

289
Table 8.2 CAPs Included in Local Policy Analysis
Jurisdiction CAP Status Included in Analysis
Carlsbad 2020 Y
Chula Vista 2017 Y
Coronado Pending Y
County of San Diego In Progress N
Del Mar 2016 Y
El Cajon1 2020 Y
Encinitas 2020 Y
Escondido 2021 Y
Imperial Beach 2019 Y
La Mesa 2018 Y
Lemon Grove 2020 Y
National City 2011 N
Oceanside 2019 Y
Poway N/A N/A
San Diego 2015 Y
San Marcos 2020 Y
Santee 2020 Y
Solana Beach 2017 Y
Vista Pending Y
1 The City of El Cajon has adopted a Sustainability Initiative with measures similar to a Climate Action Plan.
Focusing on more recently adopted and pending CAPs improves the analysis in several ways, including providing more up-to-date sample of measures; creating a more consistent sample of measures that are more closely aligned with current federal, state, and regional efforts, including the San Diego Association of Government’s (SANDAG) Regional Climate Action Planning (ReCAP) Framework; and provides a collection of measures that rely on more consistent methodologies for GHG reduction calculations as methods may evolve over time.
Policy Categories and Subcategories The decarbonization pathways are the main parts of an overall strategy to reduce GHG emissions. These include decarbonize electricity, decarbonize buildings, decarbonize transportation, and natural climate solutions. Policy categories represent the main methods to reduce emissions within a
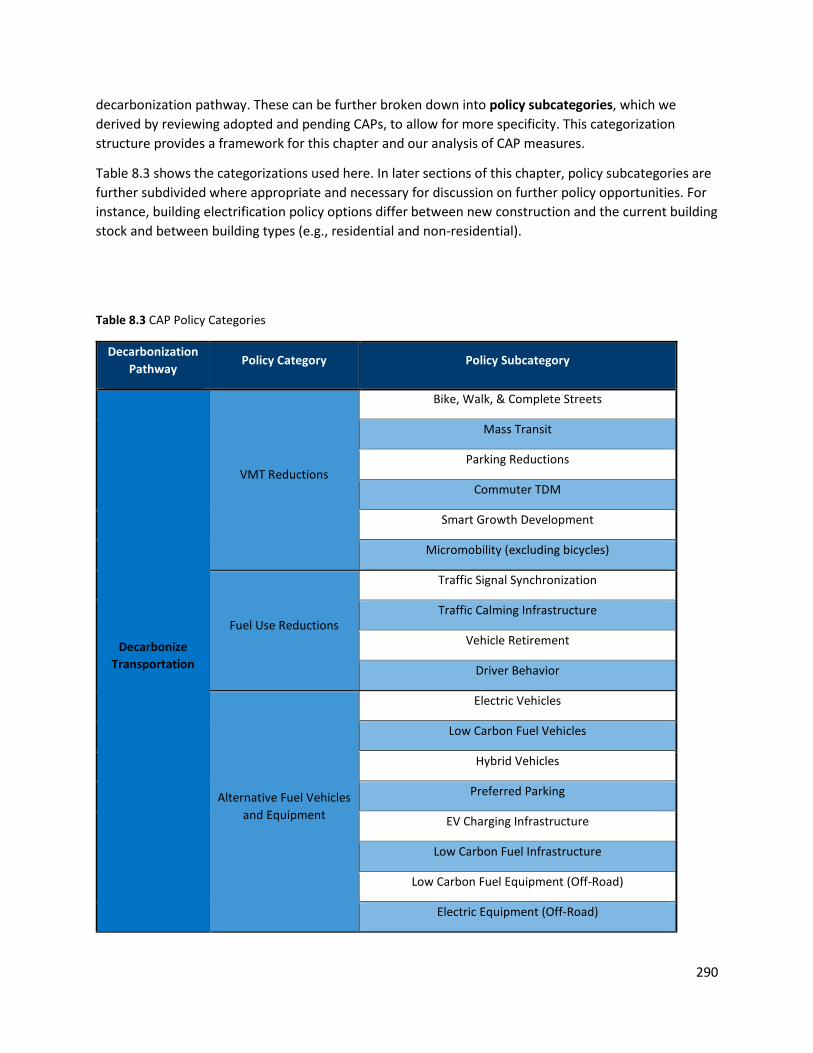
290
decarbonization pathway. These can be further broken down into policy subcategories, which we derived by reviewing adopted and pending CAPs, to allow for more specificity. This categorization structure provides a framework for this chapter and our analysis of CAP measures.
Table 8.3 shows the categorizations used here. In later sections of this chapter, policy subcategories are further subdivided where appropriate and necessary for discussion on further policy opportunities. For instance, building electrification policy options differ between new construction and the current building stock and between building types (e.g., residential and non-residential).
Table 8.3 CAP Policy Categories
Decarbonization Pathway
Policy Category Policy Subcategory
Decarbonize Transportation
VMT Reductions
Bike, Walk, & Complete Streets
Mass Transit
Parking Reductions
Commuter TDM
Smart Growth Development
Micromobility (excluding bicycles)
Fuel Use Reductions
Traffic Signal Synchronization
Traffic Calming Infrastructure
Vehicle Retirement
Driver Behavior
Alternative Fuel Vehicles and Equipment
Electric Vehicles
Low Carbon Fuel Vehicles
Hybrid Vehicles
Preferred Parking
EV Charging Infrastructure
Low Carbon Fuel Infrastructure
Low Carbon Fuel Equipment (Off-Road)
Electric Equipment (Off-Road)
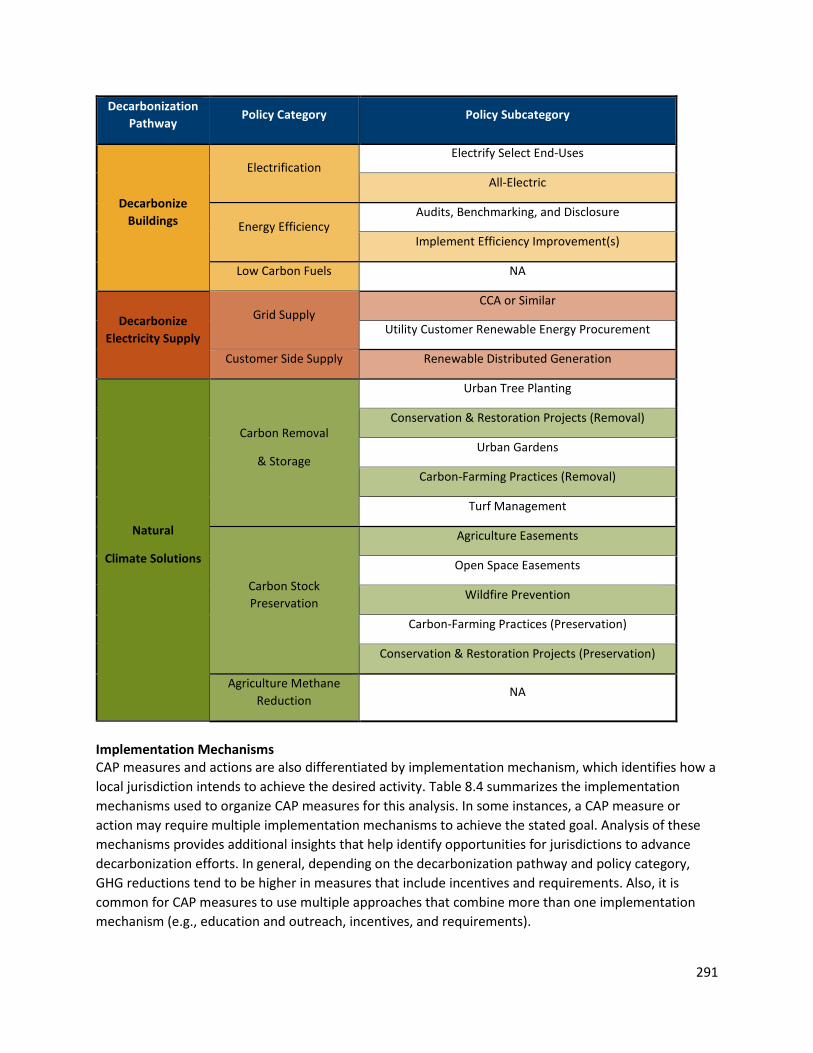
291
Decarbonization Pathway
Policy Category Policy Subcategory
Decarbonize Buildings
Electrification Electrify Select End-Uses
All-Electric
Energy Efficiency Audits, Benchmarking, and Disclosure
Implement Efficiency Improvement(s)
Low Carbon Fuels NA
Decarbonize Electricity Supply
Grid Supply CCA or Similar
Utility Customer Renewable Energy Procurement
Customer Side Supply Renewable Distributed Generation
Natural
Climate Solutions
Carbon Removal
& Storage
Urban Tree Planting
Conservation & Restoration Projects (Removal)
Urban Gardens
Carbon-Farming Practices (Removal)
Turf Management
Carbon Stock Preservation
Agriculture Easements
Open Space Easements
Wildfire Prevention
Carbon-Farming Practices (Preservation)
Conservation & Restoration Projects (Preservation)
Agriculture Methane Reduction
NA
Implementation Mechanisms CAP measures and actions are also differentiated by implementation mechanism, which identifies how a local jurisdiction intends to achieve the desired activity. Table 8.4 summarizes the implementation mechanisms used to organize CAP measures for this analysis. In some instances, a CAP measure or action may require multiple implementation mechanisms to achieve the stated goal. Analysis of these mechanisms provides additional insights that help identify opportunities for jurisdictions to advance decarbonization efforts. In general, depending on the decarbonization pathway and policy category, GHG reductions tend to be higher in measures that include incentives and requirements. Also, it is common for CAP measures to use multiple approaches that combine more than one implementation mechanism (e.g., education and outreach, incentives, and requirements).
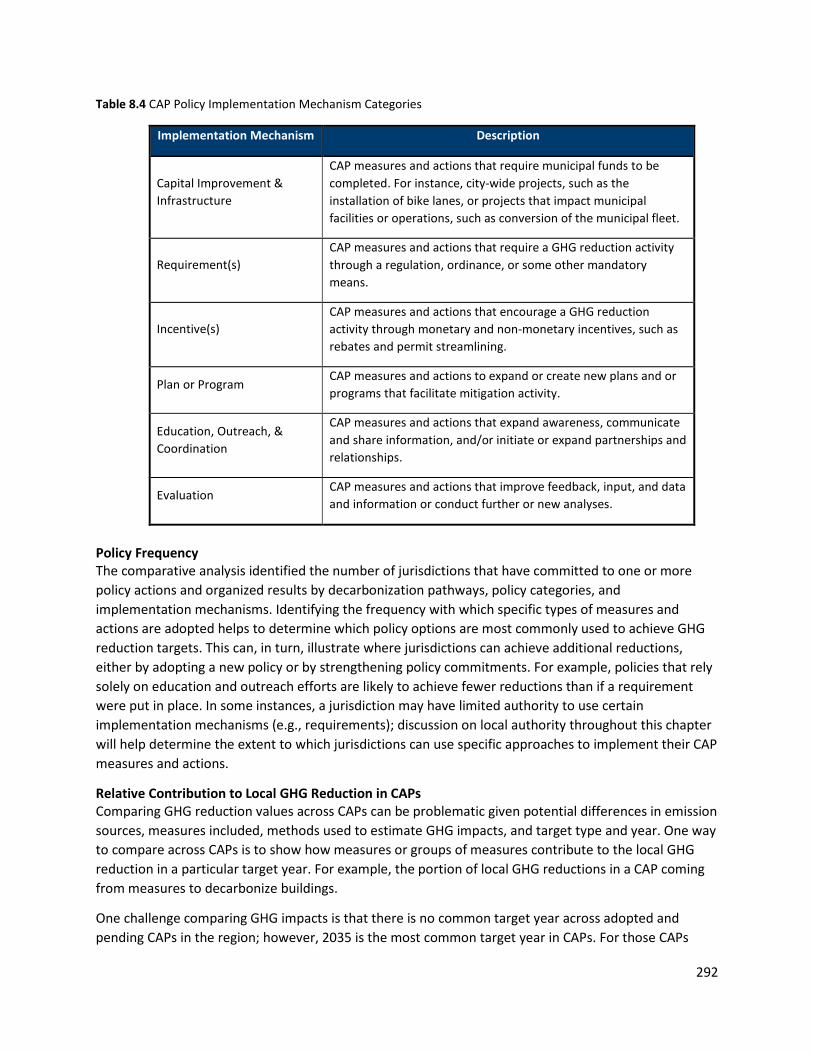
292
Table 8.4 CAP Policy Implementation Mechanism Categories
Implementation Mechanism Description
Capital Improvement & Infrastructure
CAP measures and actions that require municipal funds to be completed. For instance, city-wide projects, such as the installation of bike lanes, or projects that impact municipal facilities or operations, such as conversion of the municipal fleet.
Requirement(s) CAP measures and actions that require a GHG reduction activity through a regulation, ordinance, or some other mandatory means.
Incentive(s) CAP measures and actions that encourage a GHG reduction activity through monetary and non-monetary incentives, such as rebates and permit streamlining.
Plan or Program CAP measures and actions to expand or create new plans and or programs that facilitate mitigation activity.
Education, Outreach, & Coordination
CAP measures and actions that expand awareness, communicate and share information, and/or initiate or expand partnerships and relationships.
Evaluation CAP measures and actions that improve feedback, input, and data and information or conduct further or new analyses.
Policy Frequency The comparative analysis identified the number of jurisdictions that have committed to one or more policy actions and organized results by decarbonization pathways, policy categories, and implementation mechanisms. Identifying the frequency with which specific types of measures and actions are adopted helps to determine which policy options are most commonly used to achieve GHG reduction targets. This can, in turn, illustrate where jurisdictions can achieve additional reductions, either by adopting a new policy or by strengthening policy commitments. For example, policies that rely solely on education and outreach efforts are likely to achieve fewer reductions than if a requirement were put in place. In some instances, a jurisdiction may have limited authority to use certain implementation mechanisms (e.g., requirements); discussion on local authority throughout this chapter will help determine the extent to which jurisdictions can use specific approaches to implement their CAP measures and actions.
Relative Contribution to Local GHG Reduction in CAPs Comparing GHG reduction values across CAPs can be problematic given potential differences in emission sources, measures included, methods used to estimate GHG impacts, and target type and year. One way to compare across CAPs is to show how measures or groups of measures contribute to the local GHG reduction in a particular target year. For example, the portion of local GHG reductions in a CAP coming from measures to decarbonize buildings.
One challenge comparing GHG impacts is that there is no common target year across adopted and pending CAPs in the region; however, 2035 is the most common target year in CAPs. For those CAPs

293
where GHG reductions were not reported in 2035, reductions were extrapolated linearly if 2035 fell between two target years (e.g., 2030 and 2050), or carried forward from the previous target year (e.g., if 2030 were the last target year, emissions from 2030 were applied in 2035).
Analyzing the relative GHG reduction contribution of CAP measures at the policy subcategory or a lower level is difficult given differences in how measures are structured across CAPs. In many instances, a CAP measure may have multiple elements that cut across policy subcategories, making it difficult to separate out the GHG reductions associated with each individually. For this reason, the relative GHG contribution of CAP measures was only analyzed at the decarbonization pathway and policy category levels in target year 2035.
Local GHG Commitments in CAPs in the San Diego Region The GHG reductions in CAPs represent the GHG impacts associated with federal and State mandates and local commitments that lead to reductions at the local level. After developing a baseline GHG emissions inventory, emissions are projected to a future year. The jurisdiction establishes one or more emission targets, and identifies the local actions needed to achieve that target are developed.i
The baseline inventory estimates the GHG emissions for a given year and serves as the basis for projections and targets. Emissions target levels are most often determined as a percentage reduction from the baseline year. A business-as-usual (BAU) projection is made based on population, employment, and housing growth, with no additional future policy changes to determine the total amount of GHG reductions necessary to reach the target levels. The BAU projection is then adjusted to account for the future emissions impact of federal and State policies in place at the time of CAP development. This is known as the legislatively-adjusted BAU projection. The difference between the legislatively-adjusted BAU emissions in a target year and the target level of emissions is sometimes referred to as the “local emissions gap” or “local gap.”
In Figure 8.3, the upper black line is the BAU projection, and the blue line below is the legislatively-adjusted BAU projection. The green dashed line represents the emissions trajectory to meet target emissions levels. The gap between the blue and green dashed lines represents the local gap.ii Throughout this chapter, we refer to the measures to address this local gap as “local CAP measures” or “local measures.” This includes policies and other actions by local jurisdictions to influence GHG emissions and is the focus of the analysis presented here. Remaining emissions are those left after reaching target emission levels or whatever level can be attained.
i SANDAG Regional Climate Action Planning Framework: TECHNICAL APPENDIX I- GHG Inventories, Projections, and Target Selection, VERSION 1.1: OCTOBER 2020. ii For details on this, see SANDAG ReCAP Technical Appendix I, Id.
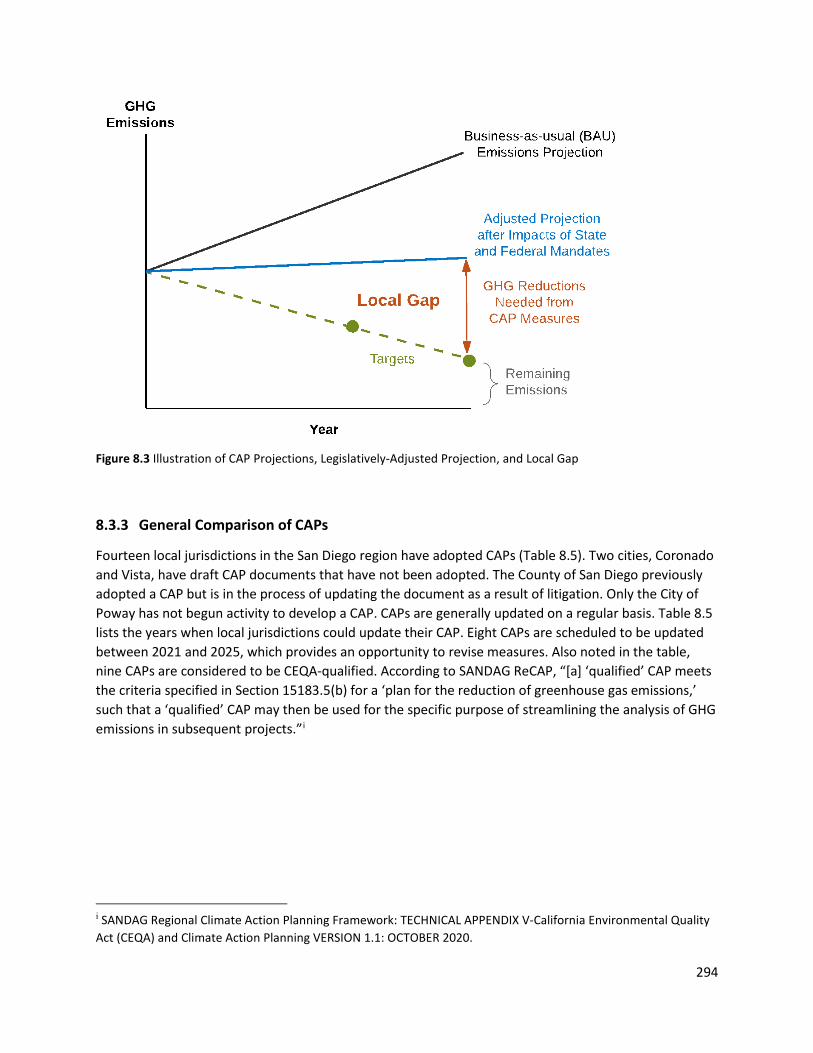
294
Figure 8.3 Illustration of CAP Projections, Legislatively-Adjusted Projection, and Local Gap
8.3.3 General Comparison of CAPs
Fourteen local jurisdictions in the San Diego region have adopted CAPs (Table 8.5). Two cities, Coronado and Vista, have draft CAP documents that have not been adopted. The County of San Diego previously adopted a CAP but is in the process of updating the document as a result of litigation. Only the City of Poway has not begun activity to develop a CAP. CAPs are generally updated on a regular basis. Table 8.5 lists the years when local jurisdictions could update their CAP. Eight CAPs are scheduled to be updated between 2021 and 2025, which provides an opportunity to revise measures. Also noted in the table, nine CAPs are considered to be CEQA-qualified. According to SANDAG ReCAP, “[a] ‘qualified’ CAP meets the criteria specified in Section 15183.5(b) for a ‘plan for the reduction of greenhouse gas emissions,’ such that a ‘qualified’ CAP may then be used for the specific purpose of streamlining the analysis of GHG emissions in subsequent projects.”i
i SANDAG Regional Climate Action Planning Framework: TECHNICAL APPENDIX V-California Environmental Quality Act (CEQA) and Climate Action Planning VERSION 1.1: OCTOBER 2020.

295
Table 8.5 CAPs Included in Local Policy Analysis
Jurisdiction CAP Status CAP Update Year2 CEQA Qualified CAP
Carlsbad 2020 2021 Y
Chula Vista 2017 2021 N
Coronado Pending 2022 N
County of San Diego In Progress NA NA
Del Mar 2016 2023 N
El Cajon1 2020 2025 N
Encinitas 2020 2025 Y
Escondido 2021 2025 Y
Imperial Beach 2019 2026 N
La Mesa 2018 2027 Y
Lemon Grove 2020 2025-2030 N
National City 2011 NA N
Oceanside 2019 NA Y
Poway NA NA NA
San Diego 2015 NA Y
San Marcos 2020 NA Y
Santee 2020 2021 Y
Solana Beach 2017 2021 N
Vista Pending 2022 Y
1 The City of El Cajon has adopted a Sustainability Initiative with measures similar to a Climate Action Plan.
2 NAs indicate no updated timeline has been specified.
Other public agencies also adopt GHG reduction plans, including the San Diego International Airport, which has a Carbon Neutrality Plan,i and the Unified Port District of San Diego.ii Emissions associated with these public agencies can be excluded from local jurisdiction GHG inventories given the lack of
i San Diego International Airport, July 2020. Carbon Neutrality Plan: A Roadmap for Airport Carbon Accreditation and Beyond. Available at https://www.san.org/Portals/0/Documents/Environmental/2020-Plans/2020_Carbon-Neutrality-Plan-min.pdf. ii Unified Port of San Diego, 2013. Climate Action Plan. Available at https://www.portofsandiego.org/environment/energy-sustainability/climate-action-plan.
https://www.san.org/Portals/0/Documents/Environmental/2020-Plans/2020_Carbon-Neutrality-Plan-min.pdf
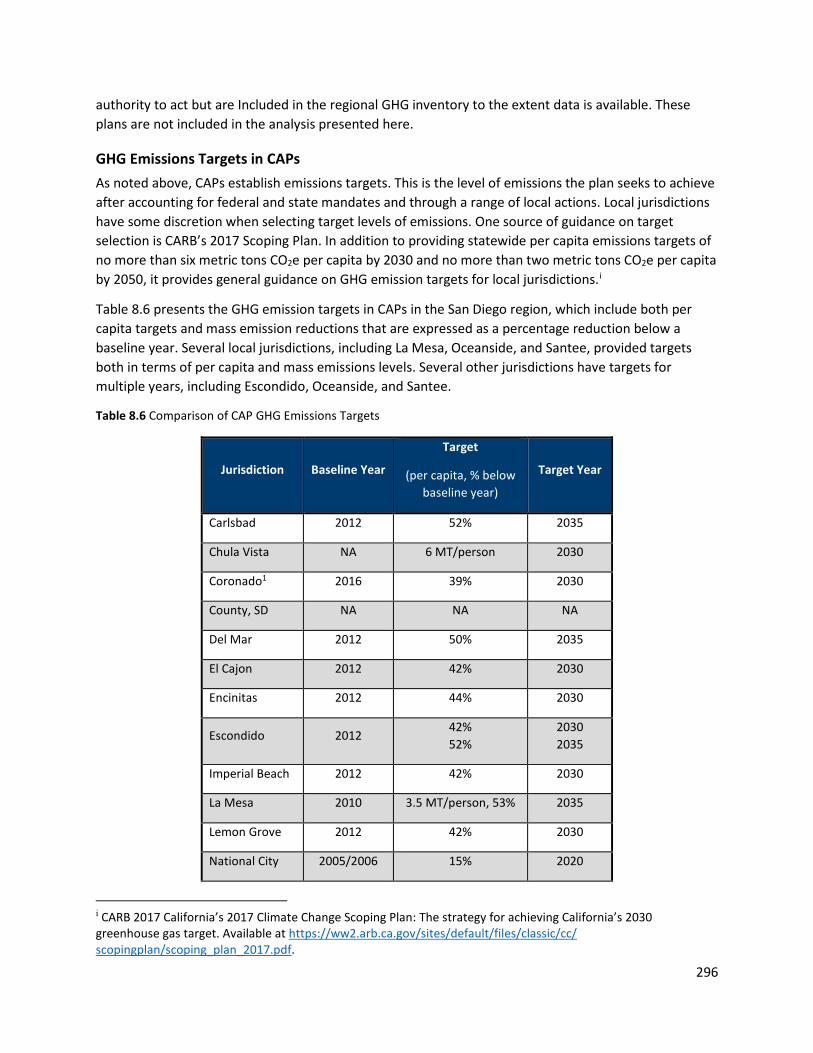
296
authority to act but are Included in the regional GHG inventory to the extent data is available. These plans are not included in the analysis presented here.
GHG Emissions Targets in CAPs As noted above, CAPs establish emissions targets. This is the level of emissions the plan seeks to achieve after accounting for federal and state mandates and through a range of local actions. Local jurisdictions have some discretion when selecting target levels of emissions. One source of guidance on target selection is CARB’s 2017 Scoping Plan. In addition to providing statewide per capita emissions targets of no more than six metric tons CO2e per capita by 2030 and no more than two metric tons CO2e per capita by 2050, it provides general guidance on GHG emission targets for local jurisdictions.i
Table 8.6 presents the GHG emission targets in CAPs in the San Diego region, which include both per capita targets and mass emission reductions that are expressed as a percentage reduction below a baseline year. Several local jurisdictions, including La Mesa, Oceanside, and Santee, provided targets both in terms of per capita and mass emissions levels. Several other jurisdictions have targets for multiple years, including Escondido, Oceanside, and Santee.
Table 8.6 Comparison of CAP GHG Emissions Targets
Jurisdiction Baseline Year
Target
(per capita, % below baseline year)
Target Year
Carlsbad 2012 52% 2035
Chula Vista NA 6 MT/person 2030
Coronado1 2016 39% 2030
County, SD NA NA NA
Del Mar 2012 50% 2035
El Cajon 2012 42% 2030
Encinitas 2012 44% 2030
Escondido 2012 42% 52%
2030 2035
Imperial Beach 2012 42% 2030
La Mesa 2010 3.5 MT/person, 53% 2035
Lemon Grove 2012 42% 2030
National City 2005/2006 15% 2020
i CARB 2017 California’s 2017 Climate Change Scoping Plan: The strategy for achieving California’s 2030 greenhouse gas target. Available at https://ww2.arb.ca.gov/sites/default/files/classic/cc/scopingplan/scoping_plan_2017.pdf.
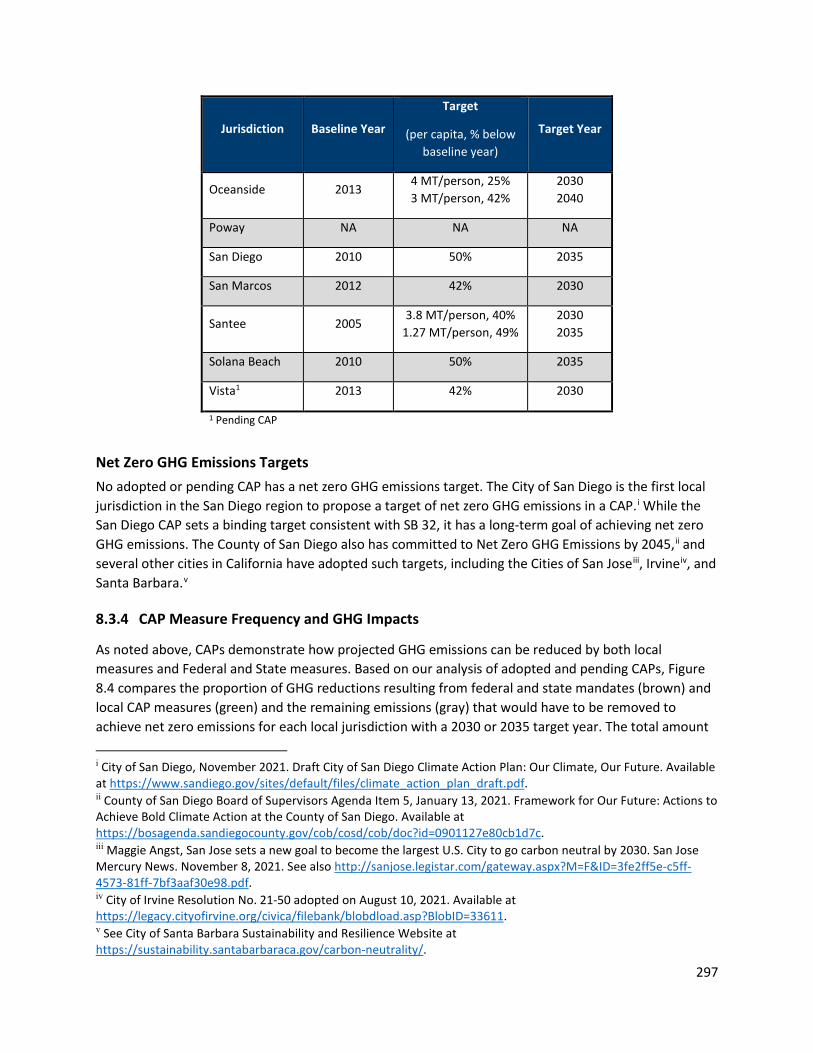
297
Jurisdiction Baseline Year
Target
(per capita, % below baseline year)
Target Year
Oceanside 2013 4 MT/person, 25% 3 MT/person, 42%
2030 2040
Poway NA NA NA
San Diego 2010 50% 2035
San Marcos 2012 42% 2030
Santee 2005 3.8 MT/person, 40%
1.27 MT/person, 49% 2030 2035
Solana Beach 2010 50% 2035
Vista1 2013 42% 2030
1 Pending CAP
Net Zero GHG Emissions Targets No adopted or pending CAP has a net zero GHG emissions target. The City of San Diego is the first local jurisdiction in the San Diego region to propose a target of net zero GHG emissions in a CAP.i While the San Diego CAP sets a binding target consistent with SB 32, it has a long-term goal of achieving net zero GHG emissions. The County of San Diego also has committed to Net Zero GHG Emissions by 2045,ii and several other cities in California have adopted such targets, including the Cities of San Joseiii, Irvineiv, and Santa Barbara.v
8.3.4 CAP Measure Frequency and GHG Impacts
As noted above, CAPs demonstrate how projected GHG emissions can be reduced by both local measures and Federal and State measures. Based on our analysis of adopted and pending CAPs, Figure 8.4 compares the proportion of GHG reductions resulting from federal and state mandates (brown) and local CAP measures (green) and the remaining emissions (gray) that would have to be removed to achieve net zero emissions for each local jurisdiction with a 2030 or 2035 target year. The total amount
i City of San Diego, November 2021. Draft City of San Diego Climate Action Plan: Our Climate, Our Future. Available at https://www.sandiego.gov/sites/default/files/climate_action_plan_draft.pdf. ii County of San Diego Board of Supervisors Agenda Item 5, January 13, 2021. Framework for Our Future: Actions to Achieve Bold Climate Action at the County of San Diego. Available at https://bosagenda.sandiegocounty.gov/cob/cosd/cob/doc?id=0901127e80cb1d7c. iii Maggie Angst, San Jose sets a new goal to become the largest U.S. City to go carbon neutral by 2030. San Jose Mercury News. November 8, 2021. See also http://sanjose.legistar.com/gateway.aspx?M=F&ID=3fe2ff5e-c5ff-4573-81ff-7bf3aaf30e98.pdf. iv City of Irvine Resolution No. 21-50 adopted on August 10, 2021. Available at https://legacy.cityofirvine.org/civica/filebank/blobdload.asp?BlobID=33611. v See City of Santa Barbara Sustainability and Resilience Website at https://sustainability.santabarbaraca.gov/carbon-neutrality/.

298
of emissions depicted here represents the BAU projection in the target year. The reductions from federal and state mandates plus those from local CAP measures presumably would achieve the CAP emissions target. Remaining emissions are those not yet addressed by local, state, or federal policies.
Reductions from local CAP measures range from about 6% to 32% of total BAU emissions in the target year, with an average of about 17%. Reductions from state and federal mandates range from about 23% to 47%, with an average of 30%. The level of remaining emissions ranges from about 33% to nearly 68% of BAU emissions, with an average of about 53%. Because BAU emission projections are based on the requirements in place at the time of the estimate, actual remaining emissions in a given year depends on many factors, including future federal and state regulation, implementation of local CAP measures, future CAP updates, etc.
Figure 8.4 Breakdown of BAU Projection to Reach Net Zero Emissionsi
GHG Contribution by Decarbonization Pathways and Other Categories Figure 8.5 shows how reductions from local policy efforts in the decarbonization pathways (e.g., decarbonize buildings) align with emission sources (e.g., transportation and electricity). For example, many CAPs rely on measures to decarbonize the electricity supply for a majority of their emissions reductions; however, the regional inventory shows that a significant majority (44%) of emissions come from the transportation sector. This signals a potential need — and opportunity — for more local policies that decarbonizes the transportation sector.
Figure 8.6 shows the breakdown of local CAP GHG reductions across decarbonization pathways for the year 2035.ii While there is significant variability across the 17 CAPs shown here, on average, reductions from decarbonizing the electricity supply (45%) and decarbonizing transportation (28%) account for
i Note City of Chula Vista has a 2020 target year and is omitted from the figure. ii Values in figure represent the estimated or extrapolated GHG reductions in the year 2035 to provide a better comparison across CAPs. Not all jurisdictions include 2035 as a target year and extrapolated values may not perfectly align with how reductions are calculated in those CAPs. Nevertheless, this figure provides a representative look at how reductions are spread across decarboniniztion pathways within each CAP.
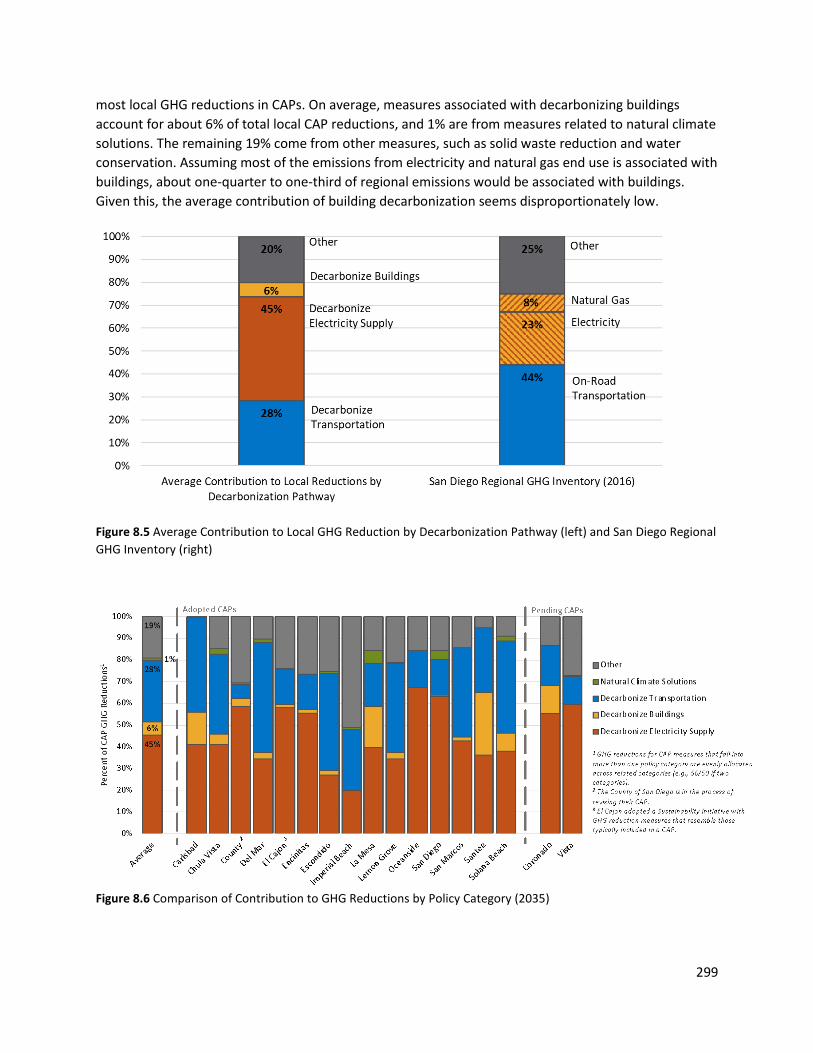
299
most local GHG reductions in CAPs. On average, measures associated with decarbonizing buildings account for about 6% of total local CAP reductions, and 1% are from measures related to natural climate solutions. The remaining 19% come from other measures, such as solid waste reduction and water conservation. Assuming most of the emissions from electricity and natural gas end use is associated with buildings, about one-quarter to one-third of regional emissions would be associated with buildings. Given this, the average contribution of building decarbonization seems disproportionately low.
Figure 8.5 Average Contribution to Local GHG Reduction by Decarbonization Pathway (left) and San Diego Regional GHG Inventory (right)
Figure 8.6 Comparison of Contribution to GHG Reductions by Policy Category (2035)
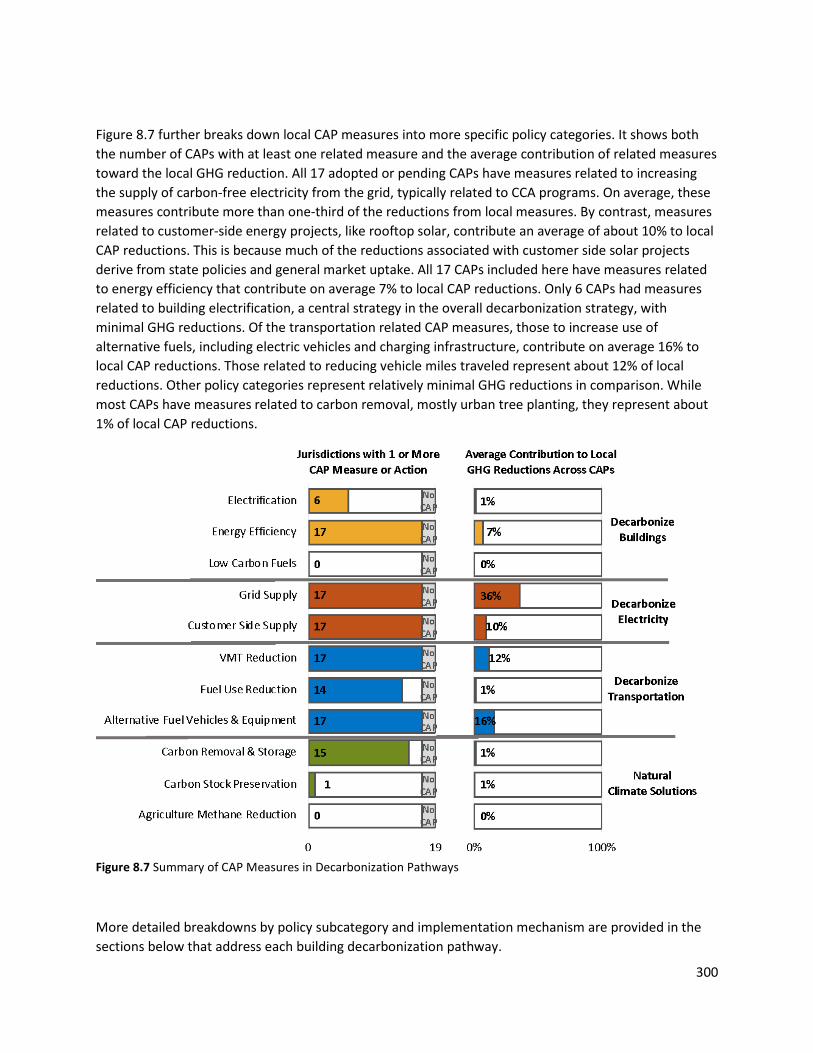
300
Figure 8.7 further breaks down local CAP measures into more specific policy categories. It shows both the number of CAPs with at least one related measure and the average contribution of related measures toward the local GHG reduction. All 17 adopted or pending CAPs have measures related to increasing the supply of carbon-free electricity from the grid, typically related to CCA programs. On average, these measures contribute more than one-third of the reductions from local measures. By contrast, measures related to customer-side energy projects, like rooftop solar, contribute an average of about 10% to local CAP reductions. This is because much of the reductions associated with customer side solar projects derive from state policies and general market uptake. All 17 CAPs included here have measures related to energy efficiency that contribute on average 7% to local CAP reductions. Only 6 CAPs had measures related to building electrification, a central strategy in the overall decarbonization strategy, with minimal GHG reductions. Of the transportation related CAP measures, those to increase use of alternative fuels, including electric vehicles and charging infrastructure, contribute on average 16% to local CAP reductions. Those related to reducing vehicle miles traveled represent about 12% of local reductions. Other policy categories represent relatively minimal GHG reductions in comparison. While most CAPs have measures related to carbon removal, mostly urban tree planting, they represent about 1% of local CAP reductions.
Figure 8.7 Summary of CAP Measures in Decarbonization Pathways
More detailed breakdowns by policy subcategory and implementation mechanism are provided in the sections below that address each building decarbonization pathway.
301
8.3.5 Social Equity in Climate Action Plans
EPIC completed a preliminary review of CAPs to determine whether and how social equity factors are considered. This section briefly summarizes findings from this review and presents opportunities for additional local action and regional collaboration.
Summary of Key Findings
● Inclusion of equity in adopted and pending CAPs is limited, inconsistent, and lacks specificity. For example, no CAP defines social equity.
● Although not reviewed in detail, it appears that the City of San Diego’s draft CAP (2021) integrates equity more than any other adopted or pending CAP in the San Diego region.
● There is an opportunity to improve integration of equity considerations when CAPs are updated.
● Equity can be integrated across the entire climate action planning cycle. SANDAG’s ReCAP Framework could be expanded to include guidance for integrating equity considerations into CAPs.
● Regional programs and collaboration could support the development of regional indicators, guidance, and regular reporting on climate-related equity topics. For example, a Regional Climate Equity Collaborative or Working Group could serve to educate regional leaders and collect stakeholder input.
Defining Social Equity No CAP in the San Diego region defined social equity. As an example, the Urban Sustainability Directors Network has defined equity in the sustainability context to include the following:i
● Procedural Equity – Inclusive, accessible, authentic engagement and representation in processes to develop or implement sustainability programs and policies;
● Distributional Equity – Sustainability programs and policies result in fair distribution of benefits and burdens across all segments of a community, prioritizing those with the highest need;
● Structural Equity – Sustainability decision makers institutionalize accountability; decisions are made with a recognition of the historical, cultural, and institutional dynamics and structures that have routinely advantaged privileged groups in society and resulted in chronic, cumulative disadvantage for subordinated groups;
● Transgenerational Equity – Sustainability decisions consider generational impacts and don’t result in unfair burdens on future generations.
A similar definition is used in a regional adaptation planning guidance document in the San Diego region.ii
i Angela Park, 2014. Equity in Sustainability: An Equity Scan of Local Government Sustainability Programs. Urban Sustainability Directors Network. Available at http://usdn.org/public/Innovation.html#EquityScan. ii San Diego Regional Climate Collaborative and San Diego Association of Governments, "Equity- First Approach to Climate Adaptation" (2021). San Diego Regional Climate Collaborative. 15. https://digital.sandiego.edu/npi-sdclimate/15.
302
Communities of Concern The State of California has created various definitions of communities related to social equity through statute. SB 535 (2012) defines disadvantaged communities (DAC) and directed the California Environmental Protection Agency (CalEPA) to define and identify DACs for investment opportunities and allocate funds to their benefit. As part of SB 535 (2012), the CalEPA identified low-income and highly polluted geographical areas, now available through CalEnviroScreen. AB 1550 (2016) created an additional income-related definition. It defines low-income households as those at or below 80% of state median income (SMI) or below a threshold identified by the California Department of Housing and Community Development (HCD). AB 1550 (2016) also identifies low-income communities; however, analysis of low-income communities would only help to identify where concentrated populations of low-income residences are within an unincorporated county, not how many households qualify.
In the context of electricity and natural gas policy, the CPUC often includes within the definition of low-income household “residential customers eligible for California Alternate Rates for Energy (CARE) and the Family Electric Rates Assistance (FERA) programs, resident-owners of single-family homes in disadvantaged communities (as defined in Decision (D.) 18-06-0127), or residential customers who live in California Indian Country (as defined in D.20-12-003)…”i
For our purposes here and throughout this chapter, we will use the term “communities of concern” as adopted by the City of San Diego in their Climate Equity Indexii, understanding that there are many other terms used.
Local Commitments to Social Equity in CAPs Although limited, CAPs in the San Diego region integrate social equity considerations in several ways, including gathering stakeholder input from communities of concern, having a separate section or chapter on equity, designating equity as a co-benefit, and integrating equity into measure language and implementation plans.
● Stakeholder Input – Given the relatively limited integration of social equity considerations in CAPs in the San Diego region, it appears that stakeholder outreach to communities of concern also was limited. Not all CAPs describe the outreach process used, so it can be difficult to understand the outreach completed. Although not reviewed in detail or included in the analysis in this chapter, the City of San Diego’s draft CAP update released in November 2021 includes a detailed explanation about the process undertaken to solicit and receive stakeholder input, particularly from communities of concern.iii
● CAP Section or Chapter on Equity – Some CAPs include a separate section or chapter to discuss how the CAP incorporates and responds to social equity concerns. The city of Del Mar has a separate chapter on social equity that briefly describes local and regional strategies to ensure benefits accrue to all residents. Examples include using CCA
i California Public Utilities Commission. Proposed Decision Revising Net Energy Metering Tariff and Subtariffs in Rulemaking 20-08-020, 12-13-21. ii City of San Diego, 2019, San Diego’s Climate Equity Index Report. Available at https://www.sandiego.gov/sites/default/files/2019_climate_equity_index_report.pdf. iii City of San Diego, November 2021. Draft City of San Diego Climate Action Plan: Our Climate, Our Future. Available at https://www.sandiego.gov/sites/default/files/climate_action_plan_draft.pdf.
303
revenues to subsidize energy improvements for low-income and senior residents and ensuring that outreach related to CAP implementation is designed to reach all residents.i Similarly, the City of San Diego CAP adopted in 2015 includes a chapter on social equity and job creation, which focuses mainly on job creation but seeks to prioritize programs and actions in communities of concern. The adopted San Diego CAP also includes regular monitoring on CAP-related job creation and social equity impacts of CAP implementation.ii
● Equity as a Co-Benefit – Several cities designate social equity impacts as a co-benefit to identify measures that would benefit communities of concern, though there is no specificity on how this would occur and the steps needed to realize positive impacts. In the context of CAPs, a co-benefit is a positive outcome that results from activity to reduce GHG emissions. For example, installing solar photovoltaics on a home will reduce emissions from electricity use but may also reduce utility bills. The energy cost savings and potential return on investment would be considered co-benefits. This is different from ensuring that CAP measures and policies are designed and implemented in ways that encourage social equity. For example, CAPs could consider how to make electric vehicle use or solar photovoltaic installation more equitable across all communities and how programs to require or encourage solar would affect communities of concern.
● Integrating Equity into CAP GHG Measures – Few CAPs integrate equity into the development and implementation of CAP measures. The City of Escondido includes equity considerations as a performance metric for certain measures and seeks to develop a Clean Energy Equity Plan and identify priority investment neighborhoods (PIN) to help prioritize implementation in communities of concern. The CAP states that “[w]here applicable, GHG reduction measures will be targeted and prioritized for funding and implementation in priority investment neighborhoods. These are measures that will improve quality of life, housing stock, health, and quality of life for residents in vulnerable neighborhoods.”iii The Escondido CAP includes recommended priority neighborhoods based on CalEnviroScreen.
● Considering Equity in Implementation Sections or Plans – Few CAPs considered equity in the implementation section of CAPs or separate plans. Cities with stand-alone implementation plans include high-level consideration of equity but do not include specifics. Some CAPs also mention social equity in the context of adaptation measures, which we did not consider here because the focus of the Regional Decarbonization Framework is reducing greenhouse gas emissions.
Opportunity for Local Jurisdictions to Integrate Social Equity into CAPs Given the limited consideration of equity in CAPs in the San Diego region, an opportunity exists to integrate social equity across the CAP planning cycle as described in SANDAG’s Regional Climate Action Planning (ReCAP) Framework.iv In general, this cycle includes developing and maintaining the CAP, implementing CAP measures, monitoring and reporting progress, and identifying equity as a cross-
i City of Del Mar, June 2016. Del Mar Climate Action Plan. ii City of San Diego, December 2015, City of San Diego Climate Action Plan. iii City of Escondido, March 2021. City of Escondido Climate Action Plan. iv SANDAG, 2020. Regional Climate Action Planning (ReCAP) Framework Summary.
304
cutting consideration that can apply across all aspects of climate planning. The following sections briefly discuss how equity could be integrated into each of the main steps in the CAP planning cycle.
Develop and Maintain CAP This step includes developing a baseline GHG inventory, projecting emissions, setting emissions targets, and developing and estimating the GHG impacts of CAP measures. Social equity considerations could be integrated into this step in the following ways.
● Conduct Stakeholder Outreach – While it is true that stakeholder engagement cuts across all aspects of the climate planning cycle, soliciting and receiving stakeholder input at this initial step, particularly from communities of concern, could help to inform subsequent steps in the process.
● Collect and Analyze Data Related to Social Equity – Historically, data related to equity has not been readily available, particularly as related to CAP development. In recent years, a focus on equity has expanded access to data and tools related to equity. Examples include the Climate Equity Index developed by the Cities of Chula Vista and San Diego. Data included in these indexes can provide context for CAP development. In addition, a specific analysis may be needed to develop CAP measures, targets for activity levels, and performance metrics related to communities of concern. Other analyses could inform aspects of CAP development, including benefit cost analysis, job impacts analysis, etc.
● Develop Specific Equity-Focused Targets – Another option is to integrate equity into each measure of the CAP and to develop specific performance indicators that can be monitored over time. For example, many CAPs include measures to increase the number or coverage of trees. Developing a specific goal for the number or percentage of trees planted in communities of concern could help to guide implementation activities. As noted above, detailed analysis may be needed to determine the best way to direct funding and activity to ensure equitable outcomes.
● Consider Equity Implications of CAP Measures – Local jurisdictions also could consider whether and how GHG reduction measures could disproportionately affect communities of concern. For example, the potential increase in utility costs due to building electrification or inequitable adoption of rooftop solar. The specific equity implications of decarbonizing transportation, buildings, and the electricity supply are discussed further in the sections below (8.5 through 8.7).
Implement CAP Measures Most CAPs include a section that provides a high-level summary of how measures will be implemented. This typically includes a timeline, responsible departments, and sometimes also cost implications. Some jurisdictions also develop a separate implementation plan. The following actions could help to integrate social equity into CAP implementation.
● Develop Equity-Focused Implementation Strategies – CAPs could include implementation strategies that seek to specifically address equity concerns and that prioritize activities in communities of concern. Several options exist to integrate equity-focused implementation strategies, including adding specific strategies to the

305
implementation section in a CAP, including a separate section within the CAP focused on the equity aspects of implementation, and/or developing a separate implementation plan – or section of plan – that focuses on equity.
● Equity Related Staff Positions in Local Jurisdictions – Several jurisdictions have full-time staff positions related to equity and environmental justice. These positions can support and monitor the equity aspects of CAPs. To the extent feasible, other local jurisdictions could create a similar position.
Monitor and Report Progress The final step in the climate planning cycle, monitoring and reporting progress, helps local jurisdictions understand whether emissions targets have been reached and the extent to which CAP measures have been implemented. This provides an opportunity to track specific equity-focused performance indicators included in the CAP or to monitor related implementation strategies. In addition to CAP-related indicators, it also is possible to monitor other equity indicators like energy poverty that might help to track the overall progress of social equity regardless of whether they are connected to CAP measures.
Opportunity for Regional Collaboration In addition to the opportunities for local jurisdictions to integrate equity, there are opportunities for regional collaboration.
Guidance for Integrating Equity into CAPs Given the relative lack of information to help local jurisdictions address equity in CAPs, there is an opportunity to develop a guidance document for integrating equity into CAP. For example, developing an additional element of the ReCAP Framework could provide customizable options to encourage consistency across jurisdictions. Figure 8.8 illustrates how equity could be integrated into all aspects of the climate action planning cycle.

306
Figure 8.8 Illustrative Example of Integrating Equity Across the Climate Action Planning Cycle
Regional Support for Smaller Jurisdictions As with climate planning generally, there may be a need for a regional program to provide equity-related support to smaller jurisdictions that may lack the resources to hire a part- or full-time position dedicated to equity. A model for this approach is SANDAG’s Energy Roadmap Program, which provided climate planning support to the smallest 16 cities in the region. SANDAG is still providing some support to these cities, including GHG inventory development and monitoring and reporting support.i
Develop Regional Equity Indicators While some local governments have collected and analyzed data related to social equity and climate, including climate equity indexes, there is no single clearinghouse of equity indicators in the San Diego region. A regional approach to collect data, develop equity indicators, and publicly display and report information could help to facilitate integration of equity into CAPs. For example, a regional database that includes indicators at the census tract level could be displayed geospatially in a public data portal, similar to SANDAG’s Climate Action Data Portal. Such a tool would allow for regional or subregional analysis but also enable analysis on a jurisdictional or community level. This could help to identify gaps and help to allocate resources. For example, while each city has goals to plan trees, a regional analysis would help to identify the areas with the lowest tree cover that coincide with other equity indicators like income. A regional program, potentially in addition to CAP efforts, could be developed to direct tree planting activities into these high-priority areas.
i See ReCAP Snapshots and Climate Data Portal available at https://climatedata.sandag.org/.
307
State of Regional Climate Equity Report Data from a regional database of equity indicators could be used to regularly report on the state of equity as it relates to climate action planning. The Equinox Project’s Quality of Life Dashboardi provides an example of regular reporting on a suite of indicators.
8.3.6 Limitations of Comparative Analysis
While our methods seek to minimize them, we acknowledge several limitations when analyzing local policy commitments across CAPs, including the following.
● CAP language may be high-level and/or vague, requiring subjective judgment when categorizing the policy into one or more groups;
● CAPs may rely on different methods and inputs (e.g., emission factors) that may change over time or may vary based on the consultant preparing the CAP;
● Jurisdictions may not have activity in all emissions sectors (e.g., agriculture) and will consequently not have associated policies included in their CAP;
● Some jurisdictions may implement decarbonization-related policies that are not included within their CAP;
● Some CAP measures have, since adoption, been superseded by federal, state, and regional requirements and/or activity (e.g., low carbon fuel standards, updated building code standards, and SB 375); and
● CAP target years do not consistently align and, for some CAPs, data on GHG reductions in interim years may be limited.
i Equinox Projects’ Quality of Life Dashboard. Non-Profit Institute, University of San Diego. Available at https://www.sandiego.edu/soles/hub-nonprofit/initiatives/dashboard/.

308
8.4 Scenario Analysis of GHG Impacts from CAPs in the San Diego Region This section presents the results of analysis to estimate the impact of the GHG commitments in adopted and pending CAPs and a scenario of more aggressive GHG reductions. This analysis focuses on a subset of GHG emissions, namely, on-road transportation, electricity, and natural gas. These emissions categories are consistent with the four decarbonization pathways included in this chapter. While the comparative analysis presented above in Section 8.3 allows for comparison of GHG reductions across CAPs, the scenario analysis presented here estimates the combined GHG impacts of CAPs.
8.4.1 Summary of Findings
● Current local CAP commitments for transportation, electricity, and natural gas GHG reductions contribute a relatively small portion of the total reductions needed to reach net zero GHG emissions in 2035, about 2 MMT CO2e, which would leave about 12 MT CO2e remaining in these categories.
● CAP measures that aim to increase renewable electricity to 80–100%, mainly through CCA programs, contribute the largest GHG emissions reduction in 2035 among current CAP commitments. Local policy actions to achieve 100% carbon-free electricity supply sooner would lead to more cumulative GHG reductions, not important for attaining annual emission targets but consequential to atmospheric warming and the resulting climate impacts.i
● Even if the most aggressive CAP measures are applied to all jurisdictions in the county (Best CAP Commitment Scenario), regardless of whether they have a CAP in place, significant emissions would remain (approximately 7 MMT CO2e in 2035), mostly from natural gas combustion and medium- and heavy-duty vehicles. This suggests that additional measures are needed to decarbonize buildings and either electrify or use low-carbon fuels in larger vehicles.
● The largest GHG emissions reduction in the Best CAP Commitment Scenario is from CAP measures to decarbonize transportation, such as reducing VMT by reducing parking supply and increasing alternative commute modes.
● Even in the Best CAP Commitment Scenario, the impact of building electrification is limited because only CAPs adopted in the last two to three years have considered and incorporated these strategies.
● Given the differences between Current CAP Commitments and the Best CAP Commitments in all decarbonization pathways, there is an opportunity for local jurisdictions to strengthen CAP measures to reduce additional GHG emissions.
● Under the Natural Climate Solutions Pathway, existing CAP measures only include urban tree planting, indicating potential to expand removal and storage or other natural climate solutions in future CAP updates.
i See Riahi, K., Bertram, C., Huppmann, D. et al. Cost and attainability of meeting stringent climate targets without overshoot. Nat. Clim. Chang. (2021). https://doi.org/10.1038/s41558-021-01215-2. See also Drouet, L., Bosetti, V., Padoan, S.A. et al. Net zero-emission pathways reduce the physical and economic risks of climate change. Nat. Clim. Chang. (2021). https://doi.org/10.1038/s41558-021-01218-z.

309
8.4.2 Scenario Analysis Approach
The analysis presented here includes the same CAPs and policy organizational structure as described above for the comparative analysis in Section 8.3. For this analysis, we developed three GHG emissions scenarios.
Regionwide Reference Scenario without CAP Commitments The first step was to develop an estimate of regionwide GHG emissions based on a projection of relevant activity (e.g., electricity use or VMT) without the impact of any CAP commitments. This scenario, which accounts for the emission impacts of state and federal policies in place in 2021 but not of local CAP measures, shows emissions from electricity, natural gas, and on-road transportation. These emissions categories represent the decarbonization pathways evaluated in the other chapters of the report. The resulting emissions represent the reference scenario for the analysis. For the on-road transportation category, we used the light-duty vehicle (LDV) and heavy-duty vehicle (HDV) miles driven and GHG emissions from the 2021 SANDAG Regional Plan.i For electricity and natural gas categories, we projected electricity and natural gas demand-based California Energy Commission’s mid-case 2020–2030 energy demand forecast for SDG&E planning area.
Current CAP Commitment Scenario As noted above, simply summing GHG reductions reported in CAPs can be problematic potential differences in emission sources, measures included, methods used to estimate GHG impacts, and target type and year. For example, recent CAPs may assume more efficient vehicles and lower vehicle emission rates in GHG calculations, so reducing one vehicle mile would result in lower GHG reductions compared to older CAPs. Another example is how GHG reductions from federal and State policies are included in CAPs. Measures to encourage or mandate residential solar PV systems were considered a local CAP measure until 2019 when it became a state mandate.
To avoid the potential shortcomings of summing CAP reductions, we developed a scenario to estimate the emissions impact of GHG reduction measures in the adopted and pending CAPs considered here. We evaluated the 17 CAPs and summed the change in activity levels from CAP measures, such as electricity avoided in kWh due to energy retrofit measures and combustion vehicle miles replaced by electric vehicle miles (e-VMT) due to electric vehicle (EV) measures. We then calculated the GHG impact of the aggregated level of activity using a common calculation method. In this way, we avoided the challenge of methodological or data differences across CAPs. Once completed for all policy subcategories listed in Table 8.3 above for which quantified CAP measures existed, the resulting GHG emissions impacts represent GHG impact of all local CAP commitments. Results can be seen as the current regionwide commitment from CAPs to reduce GHG emissions.
Best CAP Commitment Scenario To estimate the impacts of more aggressive measures to reduce emissions, we developed a Best CAP Commitment Scenario. We identified the most aggressive measures in each policy subcategory, regardless of the jurisdiction size or CAP adoption year. For example, under the Decarbonize Transportation pathway Parking Reduction policy subcategory, the most aggressive measure out of the
i San Diego Association of Governments (SANDAG). 2021. San Diego Forward the Regional Plan. Appendix X: 2016 Greenhouse Gas Emissions Inventory and Projections for the San Diego Region. For LDV emissions, the GHG reduction from SANDAG.

310
measures in the 17 CAPs is Lemon Grove’s CAP Measure T-11 to reduce residential parking requirements near light rail transit stations by 50%. The complete list of the best CAP commitment is provided in Appendix A. Since we only included quantified CAP measures, and not all policy subcategories in Table 8.3 have quantifiable measures associated with them, not all subcategories are represented in this scenario. Some subcategories are broken down further, because some CAP measures only contribute to portions of the subcategories. For example, under the Bike, Walk & Complete Streets subcategory, the most aggressive complete streets policy is from the County of San Diego CAP, while the most aggressive bicycle infrastructure improvement policy is from the Imperial Beach CAP.
Once identified, we applied the most aggressive CAP policy to all jurisdictions in the region, regardless of whether it has an adopted or pending CAP. The result is the Best CAP Commitment Scenario. Using the Parking Reduction subcategory as an example, the 50% parking reduction near light rail transit is applied to all housing units in the 2021 SANDAG Regional Plan Mobility Hubs. The parking reduction leads to household VMT reductions and associated GHG emissions.
The difference between the Current CAP Commitment Scenario and the Best CAP Commitment Scenario shows the GHG reductions that would result if all jurisdictions adopted the “best-in-class” approach. This gap helps to identify opportunities for further action by local jurisdictions. It is important to recognize that not all jurisdictions may be able to achieve the most aggressive level of activity for structural reasons, like land use and settlement patterns. Nonetheless, this approach provides an upper limit of what could be achieved with current policies in CAPs.
8.4.3 Results of Scenario Analysis
Figure 8.9 presents the estimated projected GHG emissions in each scenario. The top thick black line represents the Regionwide Reference Scenario without CAP Commitments, which includes the impacts of state and federal policies in place in 2021 but does not include the GHG impact of local CAP measures. The upper blue dashed line represents the level of regional emissions after the impacts of current CAP commitments are considered. The bottom blue dashed line represents the Best CAP Commitment Scenario. The GHG reductions from existing CAP commitments are relatively small, about 1.9 MMT CO2e in 2035. The smaller impact over time is in part because CAPs typically have a planning horizon to 2030 or 2035 and also because of the impact of California’s carbon-free electricity requirement. Even accounting for the GHG impacts of the Best CAP Commitment Scenario, approximately 7 MMT CO2e would remain in 2035.

311
Figure 8.9 Projected Total GHG Emissions in Each Scenario of the Scenario Analysis
Figure 8.10 shows the GHG impacts of CAP commitments for each decarbonization pathway in both scenarios. In the Current CAP Commitment Scenario, decarbonizing the electricity supply, mainly through committing to high (80%–100%) renewable and carbon-free electricity, provides the most GHG reduction among the four pathways. The impact of the Decarbonize Electricity Supply Pathway increases in the short run but is zero after 2045 because all electric service providers must provide 100% renewable or carbon-free electricity in 2045. Achieving 100% renewable electricity earlier than 2045 would yield higher cumulative reductions from this pathway (i.e., area of the red wedge) but would not increase the reduction in 2045 (i.e., the height of the red wedge in 2045). While higher cumulative reductions don’t necessarily help local jurisdictions attain annual CAP emissions targets, they can affect atmospheric warming. Measures related to electrifying buildings and carbon removal and storage were not often included in CAPs until recently; therefore, these Pathways have minimal impact in the Current CAP Commitment Scenario, suggesting a need for additional policies. In the Best CAP Commitment Scenario, in addition to the Decarbonize Electricity Supply Pathway, the Decarbonize Transportation Pathway provides significant GHG reductions. Building decarbonization also reduces more GHG emissions, but still less than what would be needed to meet the level of building decarbonization contemplated in Chapter 5.

312
Figure 8.10 Emissions Reductions from Each Pathway under Current and Best CAP Commitment Scenarios
The total GHG emissions shown here include only the emissions from on-road transportation, electricity and natural gas, not all GHG emitting activities in the region. Even with the best CAP Commitment Scenario and carbon removal and storage, approximately 7 MMT CO2e would remain. The remaining emissions are mainly from natural gas and HDV, as CAP measures generally focus on increasing renewable electricity and reducing miles driven LDVs. The emissions breakdown after accounting for reductions in the Current CAP Commitment and Best CAP Commitment Scenarios are shown in Figure 8.11.
Figure 8.11 Emissions Breakdown under Current and Best CAP Commitment Scenarios

313
Scenario Analysis Results by Policy Subcategory The impact of each category and subcategory under the Pathways in both scenarios are discussed in detail in Section 8.5 through Section 8.8. In summary, the impact of each scenario on GHG emitting activity level (electricity use, natural gas, and VMT) is shown in Table 8.7. For all decarbonization pathways, the Best CAP Commitment Scenario reduces significantly more GHG emissions than the Current CAP Commitment Scenario, indicating the potential for jurisdictions to expand CAP measures in the next round of CAP updates.
Table 8.7 Impact of Current and Best CAP Commitment Scenarios in Reducing GHG Emitting Activity Level
Activity Pathway: Policy
Category Policy Subcategory
Reduction in Activity Level
Current CAP Commitment
Scenario
Best CAP Commitment
Scenario
Electricity Use
Decarbonize Buildings: Energy
Efficiency
Residential Energy Retrofits 0.01% 5%
Non-residential Energy Retrofits 0.01% 5%
Residential Water Heater Retrofits
0.0003%
2%
Non-residential Solar Water Heater Retrofits
0.02%
Natural Gas Use
Decarbonize Buildings:
Electrification
Residential New-Construction Electrification
0.1% 5%
Decarbonize Buildings: Energy
Efficiency
Residential Energy Retrofits 0.5% 14%
Non-residential Energy Retrofits 0.3% 7%
Residential Water Heater Retrofits
0.5%
4%
Non-residential Solar Water Heater Retrofits
3%
VMT Decarbonize
Transportation: VMT Reductions
Increase Commute by Biking 1% 1%
Increase Commute by Walking 0.02% 0.3%
Increase Safe Routes to School 0.001% 0.03%
Complete Streets 0.01% 0.13%
Increase Commute by Mass Transit + Intra-city Shuttle
3% 4%
Reduce Parking 0.2% 13%
Commute TDM Strategies 0.4% 4%
Increase Commute by Vanpool 0.03% 19%

314
Under the Decarbonize Building Pathway, energy efficiency-related CAP measures mainly reduce natural gas use and associated GHG emissions, with residential and non-residential energy retrofit measures contributing the most. This is because the best CAP commitment under residential and non-residential energy retrofits are from the City of Carlsbad CAP Measures D through F, which aim to reduce energy use by 50% in 30% of existing homes, and by 40% in 30% of existing commercial spaces.
Water heater retrofit measures provide 7% natural gas reduction under the best CAP commitment scenario, but depending on the specific provisions, this type of measure can face federal preemption issues and could be replaced by electrification measures or other measures to reduce natural gas use in existing buildings, as discussed in Section 8.6.
Under the Decarbonize Transportation Pathway, increasing commute by vanpool and reducing parking subcategory reduce the most VMT in the current and best CAP commitment scenario, indicating the potential to expand these measures in CAPs. For reduced parking measures, the best CAP commitment is from Lemon Grove’s CAP Measure T-11, which aims to reduce residential parking requirements near trolley stations by 50%. Applying this requirement to all units in the SANDAG 2021 Regional Plan Mobility Hub would lead to an estimated 13% VMT reduction regionwide. For increasing commute by vanpool subcategory, the best CAP commitment is from Solana Beach CAP Measure T-2, which aims to have an additional 19% of the labor force vanpool to work.
The VMT reduction from increasing commute by active transportation modes (i.e., walking and bicycling) and increasing the Safe Routes to School program are limited in both existing and best CAP commitment scenarios. This could be because the miles avoided from walking or bicycling to work are low (average 1 mile per one-way trip for walking and 5 miles per one-way trip for bicycling), or existing CAPs have not captured all opportunities with the jurisdictions to improve pedestrian and bicycling infrastructure. The VMT reduction from increasing commute by mass transit and intra-city shuttle in both scenarios is similar. The opportunity for intra-city shuttles is only limited to jurisdictions without a robust public transit system.
8.4.4 Limitations of Scenario Analysis
Only GHG Emitting Activities Related to Decarbonization Pathways are Considered This analysis is limited to the GHG emissions and CAP measures related to four decarbonization pathways included in the other chapters of the report. CAP measures to reduce emissions from solid waste, which can be significant, are not included. Additional analysis would be needed to determine the GHG impacts of current CAP commitments and the application of best CAP commitments in other GHG emissions categories (e.g., solid waste).
All Jurisdictions May Not Be Able to Achieve the Best CAP Commitment It is important to recognize that not all jurisdictions may be able to achieve the most aggressive level of activity included in the Best CAP Commitment Scenario due to structural reasons, like land use and building patterns, and political acceptance. Nonetheless, this approach provides an estimate of the upper limit of GHG reductions from measures in CAPs in the region. Also, because levels of remaining emissions after accounting for the best CAP commitments are significant, this scenario helps to put into perspective the level of activity that would be needed to reach deep decarbonization targets.

315
The Best CAP Commitment Scenario is Not a Best-Case Scenario The Best CAP Commitment Scenario presented here is not a best-case scenario analysis because we limited our review to CAP commitments. For example, we did not consider other local policies with GHG reduction potential not included in CAPs. Also, we did not compare either the resulting emissions from the Current CAP Commitment or Best CAP Commitment Scenario to the results of the Evolved Energy modeling effort due to different approaches taken. Also, the level of activity that results from the Best CAP Commitment Scenario is less than what would be needed to achieve the deep decarbonization contemplated in the modeling and other chapters of the report.
Building Electrification and Carbon Removal and Storage Measures are limited in CAPs Even in the Best CAP Commitment Scenario, the impact of electrification and natural climate solutions is minimal, because only CAPs adopted in recent two to three years have considered and incorporated related strategies. For example, we included the City of San Diego’s 2015 CAP in the analysis, which has limited building decarbonization measures. The City of San Diego’s new draft CAP, released in November 2021, which is not included in this analysis, has a measure to phase-out 90% of natural gas citywide through building decarbonization. Applying this approach regionwide would have a significant impact on emissions.
Analysis Does not Estimate Impact of Future State and Federal Policies For this analysis, we created a Regionwide Reference Scenario without CAP Commitments, which is a projection of future emissions that includes the impacts of state and federal policies in place as of 2021. It also considers forecasts of activities like the expected increase in rooftop solar systems. However, this projection does not consider future changes in state or federal policies, which may lower projected emissions in the region. Additional analysis would be needed to develop a future State and federal policy scenario.
CAP Measures May Not Represent What is Implemented CAPs are plans, and the measures included may not represent what is actually implemented over time. Nonetheless, CAPs represent the reasonable and feasible commitments that local jurisdictions are willing to commit to. So the Current CAP Commitment Scenario can be seen as the level of GHG reductions that regional leaders are currently willing to commit to. The Best CAP Scenario can be seen as an idealized version of regional CAP commitments. Implementation is a key part of the climate action planning cycle, but our analysis shows that even the Best CAP Commitment Scenario for the four decarbonization pathways included here would still result in significant remaining emissions.
CAPs are typically monitored regularly, sometimes annually, and updated typically every 5 years. This process provides opportunities to evaluate implementation status. While our analysis does not include a systematic review of what has been implemented or of specific levels of activity (e.g., vehicle miles traveled or percentage renewable electricity supply), where possible we included information about policies and measures that are being implemented.

316
8.5 Decarbonize Transportation On-road transportation accounts for about 47% of regional GHG emissions, more than any other category. While the modeling completed in the Regional Decarbonization Framework technical analysis focuses on accelerated adoption of ZEVs, there are other ways to reduce transportation-related emissions. In particular, both CAPs and SANDAG’s 2021 Regional Plan (RP2021) include measures to reduce VMT.i Our analysis of CAP transportation decarbonization measures includes VMT reduction, system fuel use reduction, and increased alternative fuel use, including ZEV. Table 8.8 summarizes the key takeaways from our analyses on the Decarbonizing Transportation Pathway.
Table 8.8 Summary of Key Takeaways for the Decarbonize Transportation Pathway
Policy Category Key Takeaways
VMT Reduction
All adopted and pending CAPs have related measures; moderate GHG contribution; opportunity for more urbanized cities (e.g., higher densities, parking management) to increase access to basic services from increased transit uptake; opportunity for more aggressive walk and bike actions; opportunities across all jurisdictions to prioritize related social equity projects; significant opportunity to coordinate and cooperate as a region.
Fuel Use Reduction
Half the adopted and pending CAPs have related measures; relatively low GHG contribution because of the low activity levels; opportunity for increased fuel use reduction through system efficiencies within jurisdictions and across the region, for example, improved traffic management coordination across the region.
Alternative Fuel Vehicles & Equipment
All adopted and pending CAPs have related measures, including ZEV actions; moderate GHG contribution due to low local uptake levels; opportunity for more local action contingent on more local ZEV funding beyond state-based funding; opportunity for more municipal uptake of other low carbon fuels such as renewable diesel.
8.5.1 Summary of Findings
Key Findings of Analysis The following are key findings from the review of legal authority to act, from the comparative policy analysis, and the scenario analyses of combined GHG impacts from CAPs, which include the impacts of the SANDAG RP2021.
● Local Jurisdictions Have Broad Legal Authority to Regulate Transportation Emissions – Local authority over transportation is rooted in land use authority over planning and development and does not rely on delegated general law of the state or federal government. As shown in Section 8.2, cities and counties also have delegated and derived powers, taxation powers, and police powersii which can be limited by state and
i VMT reduction is also discussed in Chapter 3 of this report. ii Police power is generally understood to be the regulatory authority to protect public health, safety and welfare.
317
federal laws, but can provide significant broad authority. To this end, local jurisdictions act to establish climate change policies and regulations to reduce GHGs from transportation in general plans (GPs), CAPs, zoning, transit-oriented development regulations, require infrastructure for fuel switching in buildings (e.g., electric vehicle charging equipment), build supporting infrastructure in public right of ways or on public land, and support alternative fuel production and infrastructure such as hydrogen. However, regulation of fuels and tailpipe emissions is largely preempted by state and federal law. Local jurisdictions have clear procurement authority over their own fleets and with authority to regulate indirect transportation emissions to maintain attainment or to correct nonattainment of federal and state air quality standards. State statutes and regulations create an opportunity to align local action to decrease costs for implementation by bringing state funded projects, particularly in communities of concern, to the region and deploying technology developed by state or federal funding.
● On-Road Transportation Remains the Largest Source of GHG Emissions through 2035 – In 2016, on-road transportation emitted more than 12 MMT CO2e, about 47% of regional emissions. In 2035, emissions from on-road transportation are projected to account for about 7.5 MMT CO2e out of a regional total of about 19 MMT CO2e, about 41% of the total projected emissions. This includes market-based ZEV adoption, but does not include the impact of CAP measures. In 2035, on-road transportation emissions reductions from current CAP measures are projected to be about 0.5 MMT CO2e in year 2035. This would reduce on-road transportation emissions to about 7 MMT CO2e in 2035.
● VMT Reduction is the Main Source of Transportation-Related Emission Reduction in CAPs – Based on the assessment of quantified CAP measures in the scenario analysis, in 2035, 56% of the transportation-related GHG reductions are expected to be achieved through VMT reduction measures, 42% from alternative fuel vehicles avoiding fossil fuel use, including ZEVs, and 2% from measures that reduce fuel use. Public transportation plays the largest role in reducing VMT according to current CAPs. Based on language in CAP measures, local jurisdictions rely heavily on SANDAG to help achieve their transportation GHG reductions.
● CAP Measures are Insufficient to Achieve State-Aligned Regional ZEV Goals – Without significantly increased support from the state or federal governments, neither SANDAG’s RP2021 commitments for ZEV uptake, nor SANDAG RP2021 ZEV commitments in combination with current CAP ZEV measures, which are expected to add about 63,000 ZEVs, for a total of over 500,000 ZEVs, can achieve the regional share of ZEVs (771,000 ZEVs) needed to meet the state goal under Executive Order N-79-20 that calls for all new passenger vehicles sold to be zero emissions by 2035.
● Differences Exist Between Model-based Decarbonization Needs and CAP Commitments – There is a fundamental difference in the actions developed in CAPs to reduce on-road transportation emissions and Evolved Energy modeling that suggests focusing on achieving technology-based solutions and ZEV uptake. CAPs rely on VMT reduction over ZEV uptake. More study would be needed to determine how CAP VMT commitments align with SANDAG RP2021 mass transit development in specific communities, and how
318
VMT reduction measures, if implemented as adopted in current CAPs, affect regional ZEV goals.
Summary of Opportunities for Further Local Action The following summarizes key opportunities for further action to reduce GHG emissions from transportation based on the legal authority analysis, the CAP GHG analysis, MPO actions, review of CCA actions on decarbonizing transportation, and a literature review of social equity in transportation.
● Assess Local Legal Authority to Reduce Transportation GHG Emissions - Jurisdictions appear to have more legal authority through land use, transportation infrastructure siting, police powers, delegated authority, and taxation powers to reduce transportation GHGs, than represented by commitments in CAPs. Additional work by local jurisdictions would be needed to assess the limits of their authority to increase on-road transportation GHG reductions.
● Promote Mass Transit Use – CAPs identify mass transit as the single most important measure to achieve GHG reductions through VMT reduction. Even while recognizing the significant role of regional cooperation for these measures, local jurisdictions still have multiple opportunities to promote this mode to reduce VMT. As an example, the option to provide school bus service through public buses can be assessed.
● Increase Bike and Walk Infrastructure to Increase Access to Basic Needs and Avoid VMT – An opportunity exists for local jurisdictions to make active transportation plans a requirement of new developments and evaluate the locational potential for additional active transportation in their borders. Local jurisdictions also could increase cooperation and coordination with regional walk and bike implementation projects by SANDAG and prioritize walk and bike projects in communities of concern.
● Increase Connectivity through Land Use Changes to Avoid VMT – Fewer than half the CAPs have addressed smart growth, and only one has addressed parking regulations. Opportunities exist for local jurisdictions to increase density, eliminate parking minimums, and permit zoning changes to promote mixed-use developments, which reduce distances to basic needs and promote VMT reduction. Opportunities to increase density in in-fill areas have been identified in Chapter 3.i
● Manage Transportation Demand – Jurisdictions have the opportunity to implement Transportation Demand Management (TDM) policies together with employers. Demand management can be effective through a series of different approaches, such as density bonuses for reduced parking, trip reduction programs through the employer such as mandatory and incentivized or voluntary commute trip reduction, cash-out parking programs where employers pay workers to not drive, and employer and publicly supported vanpools.ii
● Assess Fuel use Reduction Potential through Improved System Efficiencies – Jurisdictions have an opportunity to identify areas for traffic calming measures, anti-idling requirements, especially around school, and provide driver behavior incentives.
i Areas in the region which meet infill definitions are provided in Chapter 3 of this report, page 70 ff. ii Carlson, D. and Howard, Z. Impacts of VMT reduction strategies on selected areas and groups, Evans School of Public Affairs, Washington State Transportation Center, prepared for the State of Washington, December 20201, available at https://www.wsdot.wa.gov/research/reports/fullreports/751.1.pdf.

319
● Accelerate Vehicle Retirement – CAPs generally do not address vehicle retirement, which is an opportunity to replace inefficient with cleaner alternatives, including ZEVs. Vehicle retirement can be prioritized in communities of concern, which can have older less fuel-efficient vehicles. Replacing inefficient vehicles would lead to significant air pollution reduction with associated health benefits for all.
● Increase Use of Alternative Fuel Vehicles in Municipal Fleets – There is an opportunity for more local governments to increase use of alternative, low-carbon fleet fuels in addition to ZEVs, particularly for medium- and heavy-duty vehicles. Jurisdictions can leverage and implement the existing fleet greening studies and plans. Cities could work with school districts to obtain funding for a regionwide school bus transition.
● Assess the Social Equity Tradeoffs between ZEVs and Mass Transit – An opportunity exists for local jurisdictions to collaborate to assess the equity impacts of ZEV use versus increasing use of mass transit in various communities, and to align regional transportation equity analysis (e.g., SANDAG) with CAP equity analyses (e.g., City of San Diego).
● Assess the Use of LCFS Funding to Promote Transition to Lower Carbon Fuels – There may be opportunities to use cap and trade funds through the Low-Carbon Fuel Standard (LCFS) to aid in fleet electrification or transition to a lower carbon fuel as clean vehicle rebates decrease.
● Multiple Opportunities for Regional Collaboration and Coordination – On road transportation is especially suited to regional action over local jurisdictional action because interconnections are needed between jurisdictions to serve basic needs. VMT reduction through improved connectivity and mass transit, ZEV uptake, and social equity integration may be more effective through a regional approach rather than through individual local actions as represented in CAPs. Regional projects such as assessing the use of LCFS for funding the transportation decarbonization or availability of biofuels are examples of such collaborative opportunities.
● Explore Acceleration of Transportation Decarbonization through Mechanisms such as Joint Powers Agreements – CCAs provide an example of a local mechanism, usually through Joint Powers Agreements (JPA), that can support transportation electrification by developing programs to locally incentivize EV uptake beyond state and federal programs. Similarly, other regional decarbonize transportation mechanisms may be identified which can promote local funds for transportation decarbonization.
8.5.2 Summary of Authority in the Decarbonize Transportation Pathway
Transportation emissions may be reduced by changing land use patterns to reduce the distances needed to be traveled (e.g., reducing VMT and/or providing alternative transportation modes to single-occupant vehicles), by designing communities to reduce system inefficiencies such as those caused by transportation congestion (e.g., synchronized traffic lights), and by regulating direct (e.g., tailpipe) emissions from vehicles, including by switching to low-carbon fuels such as clean electricity. The legal authority to regulate each type of transportation emissions is summarized below.
320
Land Use Authority Local authority over transportation is rooted in police power that creates land use authority over planning and development that determines where residents live and work. Because it is a police power, city and county land use authority does not rely on delegated general law of the state or federal government. Instead, state and federal laws act as limitations on a city’s or county’s exercise of its police power.i To this end, local jurisdictions act with both police power and delegated authority to establish climate changes policies and regulations to reduce GHGs from transportation in general plans (GPs), climate action plans (CAPs), zoning, and transit-oriented development regulations. Land use authority is subject to the vested rights doctrineii and the Subdivision Map Actiii that limit how a subsequent change in local law or the authority to impose conditions apply to a particular improvement to land or a vesting tentative map for subdivisions.
There is limited federal preemption with regard to local land use. Certain transportation land use actions that include congestion pricing and low emission zones are means to reduce VMT and must be evaluated for potential federal preemption under the Energy Policy Conservation Act (EPCA), Clean Air Act (CAA), and Federal Aviation Administration Authorization Act.iv,v State law creates planning requirements that do not preempt local land use authority. These requirements inform local land use decision makers by:
● Directing local jurisdictions to identify and mitigate GHG emissions that are found to have significant environmental impacts under CEQA for projects or general plans;
● Addressing infill to reduce vehicle miles traveled (VMT) under SB 743 (Steinberg, Chapter 386, Statutes of 2013);
● Providing CEQA streamlining benefits for implementing sustainable community strategies (SCS) to achieve regional GHG reduction targets under SB 375 (Steinberg, Chapter 728, Statues of 2008).
It is important to understand and distinguish the limited amount of federal and state preemption over local land use authority compared to the express and definitive federal and state preemption that exists over emissions from mobile sources (e.g., vehicles). These distinctions are important in understanding the extent that a local jurisdiction may act.
Indirect Regulation of Transportation Emissions The San Diego County Air Pollution Control District (SD APCD) may regulate indirect emissions from transportation to reduce emissions from transportation and areawide emission sources to achieve and maintain state ambient air quality standards.vi However, there is uncertainty over jurisdiction and how
i DeVita v. County of Napa, 9 C4al. th 763, 782 (1995); Candid Enters., Inc. v. Grossmont Union High Sch. Dist., 39 Cal. 3d 878, 885 (1985). ii Avco Community Developers v. South Coast Reg'l Comm'n, 17 Cal. 3d 785, 791 (1976), superseded by statute as stated in Santa Margarita Area Residents Together v. San Luis Obispo County Bd. Of Supervisors, 84 Cal. App. 4th 221, 229 (2000). iii See Government Code §§ 66410–66499.38; Govt Code § 66474.2 & 66498.1(b). iv 49 U.S.C.A. §§ 14501(c)(1) & (c)(2)(A). v Turner, Amy E. and Burger, Michael, "Cities Climate Law: A Legal Framework for Local Action in the U.S." (2021). Sabin Center for Climate Change Law. p. 37: https://scholarship.law.columbia.edu/sabin_climate_change/2 vi Health & Safety Code §§ 40910, 40716–40717
321
to interpret this authority for indirect emissions.i Additionally, existing authority is used by other air districts to create a voluntary GHG reduction credit generation and certification program to help address GHG emissions of this type (e.g., CO2). Examples exist of creating a voluntary program for transportation emission reductions at this time that may be applicable to SD APCD.ii
Concurrent authority may allow a local jurisdiction to further regulate air quality under its police power,iii although local jurisdictions would need to develop internal technical expertise by hiring staff and avoid state and federal preemption. It should be noted that there is no statutory power granted to SD APCD to infringe on the existing local government authority over land use with regards to air quality regulation (e.g., zoning).iv
Regulation of Direct Emissions from Vehicles Federal and state law and regulation preempt local jurisdictions from regulating GHG emissions directly from on-road and off-road mobile sources under the EPCA and CAA. It is unclear whether local jurisdiction police power or delegated permit, fees, rules, and regulations under California Public Utilities Code § 5371.4 (f)–(g) related to city and counties may allow for the acceleration of the reduction targets and goals for transportation network companies (TNCs). Local authority may exist to regulate certain small off-road engines, but further research is required. California continues to invest heavily in reducing emissions from all transportation sources through its state agencies and programs, particularly CARB and the California Energy Commission (CEC). Aligning local actions and policies with state policy and funding may accelerate local implementation and decrease costs.
Fuels and Infrastructure State preemption exists in the form of the CARB administered Low-Carbon Fuel Standard (LCFS), which regulates the carbon intensity of transportation fuels in California.v State preemption exists over types of reformed fuels that are sold in California, including the Low Emission Diesel and Standards for Diesel Fuel regulations,vi as well as the development and commercialization of alternative diesel fuels for sale in California.vii CPUC regulation does not automatically extend over compressed natural gas and hydrogen fueling stationsviii like intrastate pipelines for natural gas and hydrogen where entities meet
i Health & Safety Code §§ 42300–42339; See Health & Safety Code §§ 40716(b) & 41015 (sometimes interpreted as not prohibiting parallel permitting systems for indirect sources); See 76 Ops Call Atty Gen 11 (1993) (Attorney General opinion that authority of an APCD or AQMD does not extend to requiring permits for indirect sources; Note: Attorney General opinions are nonbinding). ii See Sacramento Metropolitan AQMD Rule 206 Mobile and Transportation Source Emission Reduction Credits (Adopted December 15, 1992; Amended December 5, 1996): http://www.airquality.org/ProgramCoordination/Documents/rule206.pdf. iii See Health & Safety Code §§ 39002, 39037, & 41508. iv See Health & Safety Code §§ 40716(b) & 41015. v See 17 C.C.R. §§ 95480–95503; See also Executive Order N-79-20, Order No. 9 (September 23, 2020): https://www.gov.ca.gov/wp-content/uploads/2020/09/9.23.20-EO-N-79-20-Climate.pdf. vi See 13 C.C.R. §§ 2281–2285, 2299–2299.5; 17 C.C.R. §§ 93114, 93117, 93118, 93118.2, 93118.3, 93118.5; 13 C.C.R. §§ 2281–2285 & 2299–2299.5. vii 13 C.C.R. §§ 2293–2293.9. viii California Public Utilities Code § 216 (f).

322
the public utility definition. There is uncertainty as to whether the Federal Energy Regulatory Commission (FERC) acts with authority over interstate hydrogen pipelines under the Natural Gas Act.i
Local jurisdictions may:
● Exercise police and land use authority to prohibit zoning for new gas stations or support alternative fuel infrastructure through zoning and expediting permitting for renewable natural gas fueling stations, hydrogen fueling stations, and electric vehicle charging equipment (EVSE);
● Require installation or pre-wiring for EVSE in the public right of way, on new residential and/or nonresidential buildings, or when additions or alterations to existing residential and/or non-residential buildings occur;ii and
● Consider state assessments of infrastructure need and funding to inform the exercise of their own authority to develop and help fund fuels and infrastructure.
New Vehicle Sales and Fleet Procurement Local jurisdictions act with clear authority to procure fleets for their operations with limited federal preemption under the “market participant exception” of the Dormant Commerce Clause.iii Local jurisdictions have been prohibited from mandating the purchase of the certain type of clean technology vehicles for private classes of vehicles, such as taxis.iv Local jurisdictions act with clear authority to procure fleets for their operations with limited preemption by the state.v
8.5.3 GHG Impacts of CAP Measures in the Decarbonize Transportation Pathway
In general, the decarbonization of transportation in CAPs is achieved by (1) reducing VMT; (2) accelerating uptake of alternative fuels, including ZEVs; and (3) reducing fuel use by increasing the efficiency of the transportation system such as through traffic calming measures. This section complements Chapter 3 by summarizing the GHG impacts from CAP measures related to decarbonizing transportation, including those from the comparative analysis (Section 8.3) and the scenario analysis of GHG Impacts (Section 8.4).
Historical and Projected Emissions from On-road Transportation
Regional 2016 GHG Inventory and Historical Emissions In 2016, on-road transportation (LDVs and HDVs) emitted more than 12 MMT CO2e, or about 47% of regional emissions. Based on SANDAG’s modeled regional GHG emissions estimates in 2006, 2012, and 2016, on-road transportation emissions have decreased 33% during this period, and the contribution of emissions from LDVs, which include passenger vehicles and SUVs, of all vehicles has decreased from 90%
i See 14 U.S.C.A §717a (5). ii See 12 C.C.R. Part 11 (2021); See Health & Safety Code §§ 17958.5, 17958.7 & 18941.5(b). iii 49 U.S.C.A § 32919(c); See Engine Mfrs. Ass'n v. South Coast Air Quality Mgmt. Dist., 498F.3d 1031, 1040 (9th Cir. 2007); Tocher v. City of Santa Ana, 219 F.3d 1040, 1049 (9th Cir. 2000); See also City of Columbus v. Ours Garage & Wrecker Serv., Inc., 536 U.S. 424, 431 (2002). iv Metro. Taxicab Bd. of Trade v. City of New York, 615 F.3d 152, 157 (2d Cir. 2010), cert. denied, 562 U.S. 1264 (2011); Ophir v. City of Boston, 647 F.Supp. 2d 86, 94 (D. Mass. 2009). v See 13 C.C.R. §§ 2023 et seq; See 13 C.C.R. §§ 1963; 1963.1,1963.2,1963.3,1963.4,1963.5,2012,2012.1, & 2012.2; See 17 CCR §§ 95690.1, 95690.2, 95690.3, 95690.4, 95690.5, 95690.6, 95690.7, and 95690.8.

323
to 85% (Figure 8.12). The contribution of HDVs to GHG emissions increased about 9% during 2012 to 2016. However, LDVs continue to comprise the largest portion of all regional emissions, about 40%, and similar to state proportions.
Figure 8.12 Historical on-road transportation emissions, San Diego County
Projected On-road Transportation Emissions In 2035, SANDAG’s 2021 Regional Plan estimates a regional total of GHG emissions from all sources to be about 19 MMT CO2e in 2035, of which nearly 8 MMT CO2e will be from on-road transportation before CAP measure reductions. On-road GHG emissions are projected to remain the largest source of GHG emissions in 2035, about 41% of the total projected emissions in 2035, including the impacts of market-based ZEV adoption. However, LDV contribution to GHGs decreases to 32% in 2035 compared with 41% in 2016, while HDV emissions contribute relatively more (9%) in 2035 than in 2016 (Figure 8.13).
The on-road transportation emissions in 2035 of nearly 8 MMT CO2e include the estimated impacts of Federal and State measures on fuel efficiency, and an assumed 8% ZEVs in the fleet. On top of those reductions, SANDAG is expected to achieve an additional 0.41 MMT CO2e reduction in 2035 from regionally-funded ZEVs and infrastructure EVCS and Transportation Demand Management (TDM) measures for an estimated 7.5 MMT CO2e emissions from on-road transportation in 2035.
SANDAG’s regional measures are able to achieve about another 5% decrease in the on-road emissions in 2035. The 38% drop in on-road emissions from 2016 to 2035 translates to per capita CO2e reduction from 3.7 MT CO2e in 2016 to 2.1 MT CO2e in 2035, despite a projected increase of 2% VMT during 2016-2035.i The remaining on-road emissions of about 7.5 MMT CO2e in 2035 is equivalent to more than 3 billion gallons of gasoline, or 63.6 million barrels of oil.ii To put this into context, if using natural climate solutions, this would require planting more than 124 million tree seedlings for 10 years, or more than 9
i SANDAG 2021 Regional Plan Appendix X. ii EPA https://www.epa.gov/energy/greenhouse-gas-equivalencies-calculator
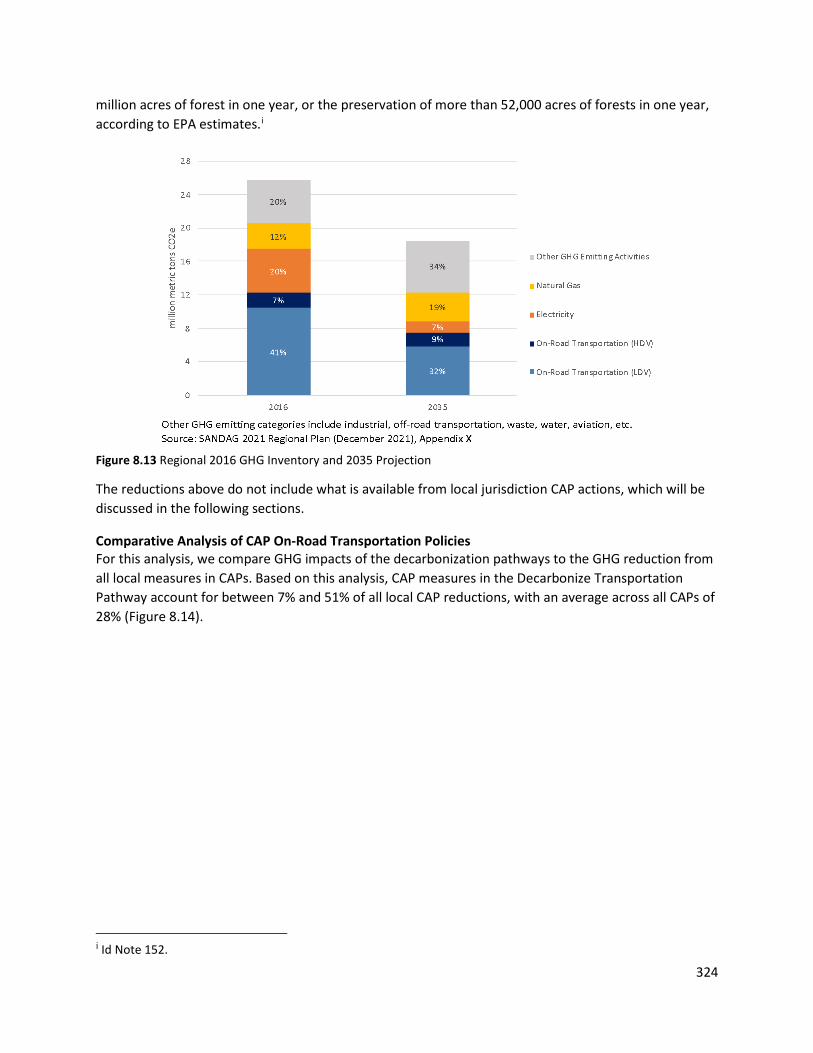
324
million acres of forest in one year, or the preservation of more than 52,000 acres of forests in one year, according to EPA estimates.i
Figure 8.13 Regional 2016 GHG Inventory and 2035 Projection
The reductions above do not include what is available from local jurisdiction CAP actions, which will be discussed in the following sections.
Comparative Analysis of CAP On-Road Transportation Policies For this analysis, we compare GHG impacts of the decarbonization pathways to the GHG reduction from all local measures in CAPs. Based on this analysis, CAP measures in the Decarbonize Transportation Pathway account for between 7% and 51% of all local CAP reductions, with an average across all CAPs of 28% (Figure 8.14).
i Id Note 152.
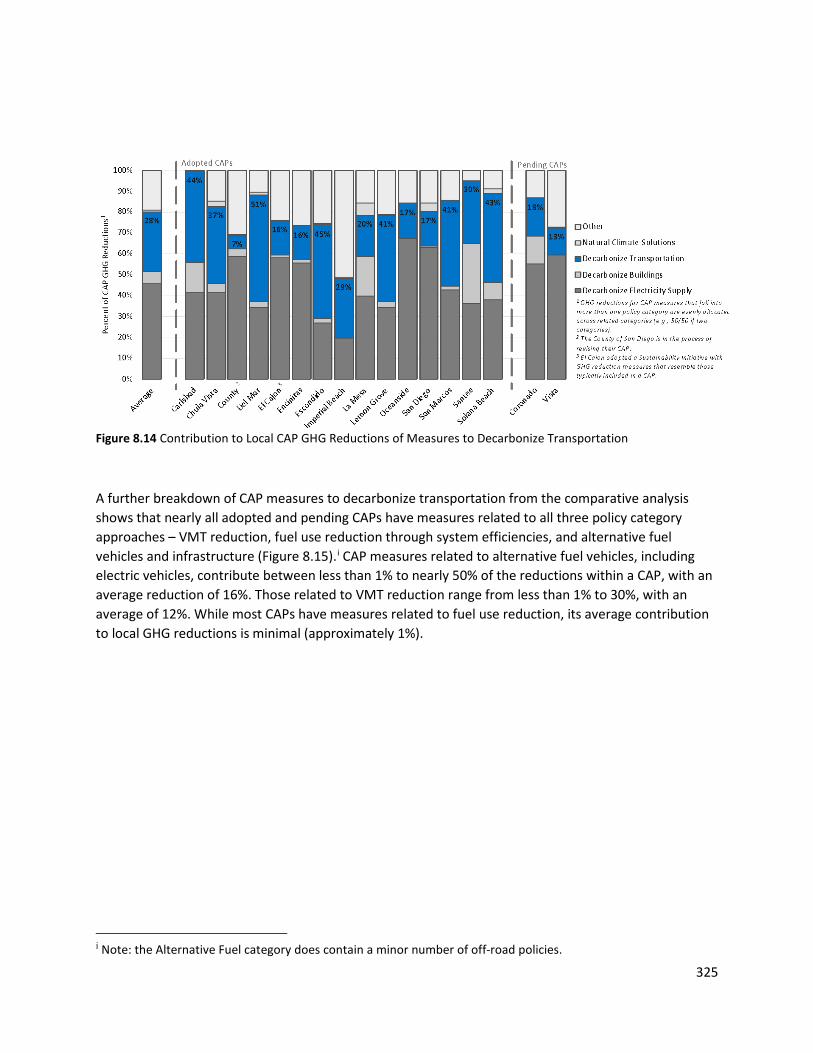
325
Figure 8.14 Contribution to Local CAP GHG Reductions of Measures to Decarbonize Transportation
A further breakdown of CAP measures to decarbonize transportation from the comparative analysis shows that nearly all adopted and pending CAPs have measures related to all three policy category approaches – VMT reduction, fuel use reduction through system efficiencies, and alternative fuel vehicles and infrastructure (Figure 8.15).i CAP measures related to alternative fuel vehicles, including electric vehicles, contribute between less than 1% to nearly 50% of the reductions within a CAP, with an average reduction of 16%. Those related to VMT reduction range from less than 1% to 30%, with an average of 12%. While most CAPs have measures related to fuel use reduction, its average contribution to local GHG reductions is minimal (approximately 1%).
i Note: the Alternative Fuel category does contain a minor number of off-road policies.

326
Figure 8.15 Number of CAPs with Main Approaches to Reduce on-Road Transportation Emissions
More details from the comparative analysis for each policy category and related subcategories, and from the existing CAP commitments will be provided in the following sections. As described above in Section 8.3.3, we did not estimate the contribution of the policy subcategories to local GHG reductions across CAPs.
Scenario Analysis of GHG Impacts from CAP Commitments In contrast to the comparative analysis, which considers measures in all emissions categories and does not consider the combined impact of measures, the scenario analysis only evaluates emissions from on-road transportation, electricity, and natural gas, and estimates the GHG impact of all related CAP measures. Results of the analysis of emissions associated with decarbonizing transportation are presented here. The emission reduction from each policy category within the Decarbonize Transportation Pathway only shows quantified policies as shown in Figure 8.16 as not all policies relating to each policy category are quantified in CAPs.
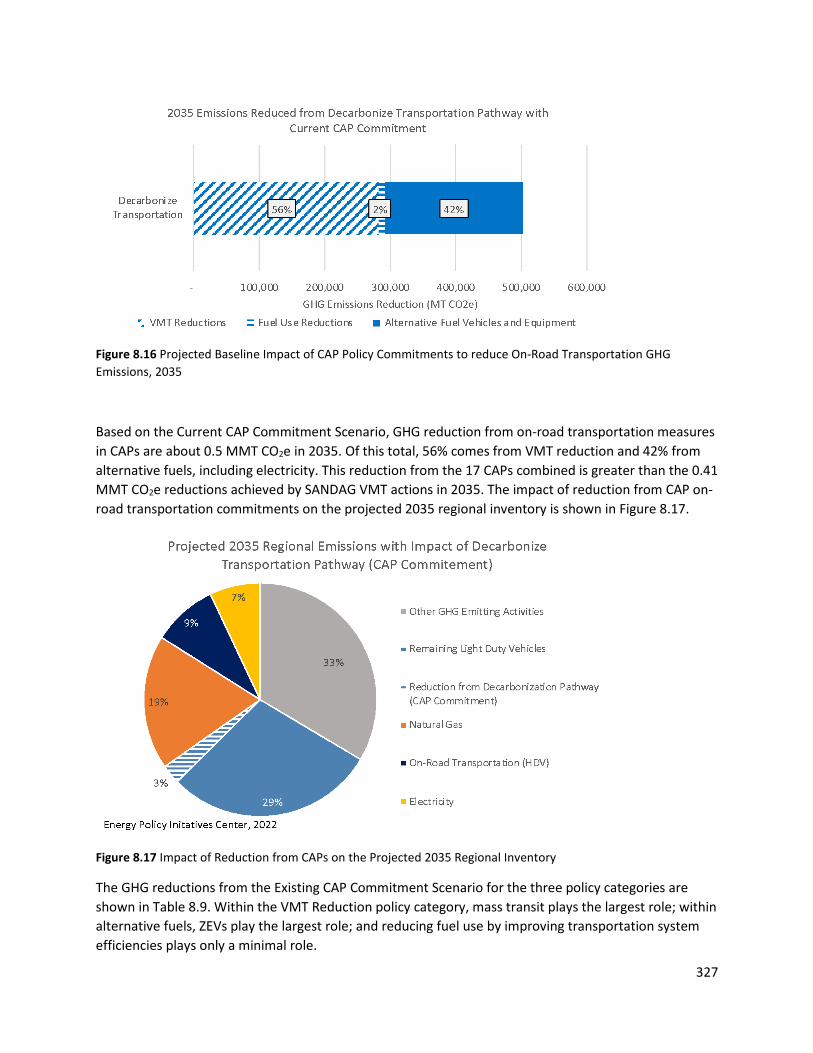
327
Figure 8.16 Projected Baseline Impact of CAP Policy Commitments to reduce On-Road Transportation GHG Emissions, 2035
Based on the Current CAP Commitment Scenario, GHG reduction from on-road transportation measures in CAPs are about 0.5 MMT CO2e in 2035. Of this total, 56% comes from VMT reduction and 42% from alternative fuels, including electricity. This reduction from the 17 CAPs combined is greater than the 0.41 MMT CO2e reductions achieved by SANDAG VMT actions in 2035. The impact of reduction from CAP on-road transportation commitments on the projected 2035 regional inventory is shown in Figure 8.17.
Figure 8.17 Impact of Reduction from CAPs on the Projected 2035 Regional Inventory
The GHG reductions from the Existing CAP Commitment Scenario for the three policy categories are shown in Table 8.9. Within the VMT Reduction policy category, mass transit plays the largest role; within alternative fuels, ZEVs play the largest role; and reducing fuel use by improving transportation system efficiencies plays only a minimal role.

328
Table 8.9 CAP Commitments and GHG Reductions, 2035
Decarbonization Pathway
Policy Category
Policy Subcategory
GHG Emissions Reduced in 2035
MT CO2e Distribution
within Pathway
Decarbonize Transportation
VMT Reductions
Increase Commute by Biking 42,896 9%
Increase Commute by Walking 1,221 0.2%
Increase Safe Routes to School 79 0.02%
Complete Street 650 0.1%
Increase Commute by Mass Transit + Intra-city Shuttle
200,963 40%
Reduce Parking 9,781 2%
Commute TDM Strategies 24,140 5%
Increase Commute by Vanpool 2,065 0.4%
Fuel Use Reductions
Traffic Signal Synchronization 3,893 1%
Install Roundabouts 5,623 1%
Vehicle Retirement 446 0.1%
Alternative Fuel
Vehicles and
Equipment
Increase City-wide electric vehicle miles
187,364 37%
Increase alternative fuel vehicles in municipal fleet
23,269 5%
Total: 502,389 100%
Best CAP Commitment scenario We estimate the GHG impacts if all jurisdictions were to implement the most ambitious commitment (Appendix A) in any CAP across the region in 2035. If all CAPs implement the most ambitious commitment in any CAP for 2035, on-road transportation measures would provide the largest reduction of the local reductions included in the analysis, about 3.5 MMT CO2e, with VMT reduction providing the largest reductions followed by ZEVs (Figure 8.18). This reflects the fact that adopted and pending CAPs expect to achieve the most on-road transportation reductions through VMT policies, especially mass transit. It does not imply that all jurisdictions should or can apply the currently most ambitious policies, but provides an upper limit of what could be achieved with current policies in CAPs.
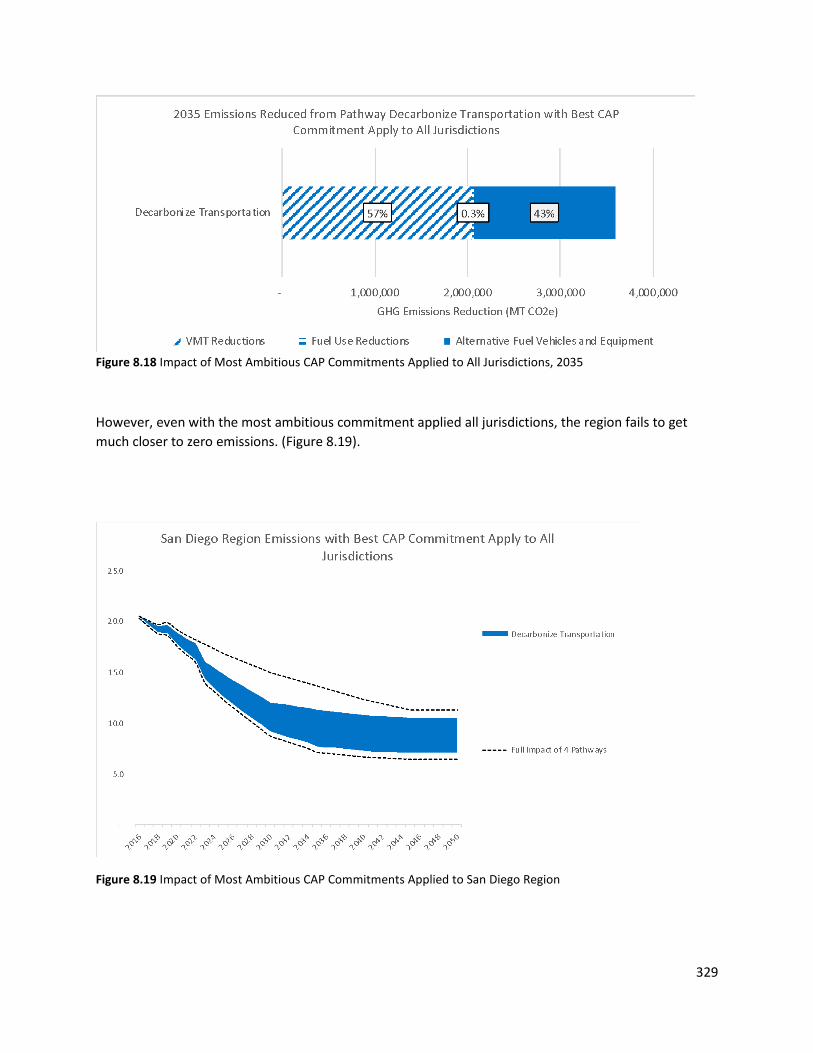
329
Figure 8.18 Impact of Most Ambitious CAP Commitments Applied to All Jurisdictions, 2035
However, even with the most ambitious commitment applied all jurisdictions, the region fails to get much closer to zero emissions. (Figure 8.19).
Figure 8.19 Impact of Most Ambitious CAP Commitments Applied to San Diego Region

330
The best CAP commitment GHG reductions and associated activity levels are shown in Table 8.10. In this scenario, within the transportation reductions, there would be a 43% reduction in VMT across the region in 2035, within which vanpools, parking strategies, transit commute and commute TDM policies play the largest roles, in that order. However, the ZEV uptake would contribute a similar amount of reductions. As mentioned, even if the most ambitious policies were implemented by all jurisdictions, significant transportation emissions remain to be removed in 2035.
Table 8.10 GHG Reduction by Policy Category and Subcategory (Best CAP Commitments Scenario)
Decarbonization Pathway
Policy Category
Policy Subcategory
GHG Emissions Reduced in 2035
(MT CO2e) Distribution
within Pathway
Decarbonize Transportation
VMT Reductions
Increase Commute by Biking
30,416 1%
Increase Commute by Walking
14,833 0.4%
Increase Safe Routes to School
1,440 0.04%
Complete Street 6,387 0.2%
Increase Commute by Mass Transit + Intra-city Shuttle
213,231 6%
Reduce Parking 647,937 18%
Commute TDM Strategies 215,248 6%
Increase Commute by Vanpool
927,567 26%
Fuel Use Reductions
Fuel Reduction from Traffic Calming
12,283 0.3%
Vehicle Retirement 2,973 0.1%
Alternative Fuel
Vehicles and
Equipment
Increase City-wide electric vehicle miles
1,502,651 42%
Increase alternative fuel vehicles in municipal fleet
24,066 1%
Total: 3,599,034 100%

331
8.5.4 VMT Reduction
In general, increasing accessibility to basic needs and mobility while reducing VMT is the aim of this policy and requires a shift from single-occupant passenger vehicle use into alternative modes that are more energy efficient than single occupant vehicles.
Currently, most trips in the region are made by single occupant vehicles (Figure 8.20). Implementation of SANDAG’s RP2021 is projected to lead to a 20% decrease in per capita VMT by 2035 as required under SB375.i There is projected to be some change in mode share across the region, but this increase in mode share 2016-2035 is overtaken by net absolute VMT growth of 2% based on SANDAG’s ABM2+ model.ii
Figure 8.20 Percentage of Passengers by Mode, 2016 and expected in 2035, from the SANDAG RP2021. Source: SANDAT RP 2021, Appendix T
VMT Reduction Measures in CAPs CAP VMT reduction measures would be additional to SANDAG RP2021 measures. Results from the comparative analysis of CAP measures to reduce VMT are summarized by policy subcategory (down) and implementation mechanism (across)(Figure 8.21).
i SANDAG RP2021, Appendix T: Network Development and Performance, Table T6.2. ii SANDAG RP2021, Appendix T: Network Development and Performance, Table T6.1.

332
Figure 8.21 Assessment of VMT Reduction Measures in CAPs by Policy Subcategories
Within VMT reduction policies, the largest impacts come from mass transit followed in a distant second by bike, walk and complete street policy subcategory. (Figure 8.22).
Figure 8.22 Emissions Reduced from Measures to Reduce VMT in CAPs in the San Diego Region
Mass Transit Mass transit accounts for the most GHG reductions from VMT reductions in CAPs (40%, Figure 8.22). Most associated measures in CAPs (Figure 8.21) relate to education and outreach; the focus on education and outreach may suggest the legal and/or capacity limitations of jurisdictional authority over mass transit. The educational policies for mass transit as written in CAPs also demonstrate a high reliance on regional collaboration with SANDAG and regional transit agencies such as MTS and NCTD. Given this dependence, it is unclear whether the GHG reduction potential of mass transit (40%) as identified in the Current CAP Commitment Scenario would be achievable without regional collaboration and funding. From the Comparative Analysis, it appears that individual jurisdictions’ capital projects

333
mechanism relates to relatively minor mass transit infrastructure projects, such as installation of bus shelters that, however, are necessary additions to a transit network.
Other general implementation mechanisms for mass transit measures in CAPs are provided in Figure 8.11. Mandating new developments to provide connections to the mass transit network is given only in one CAP.
Table 8.11 General CAP Policies – Mass Transit Policy Subcategory
Implementation Mechanism General Policy
Capital Improvement & Infrastructure
● Install mass transit infrastructure (e.g., bus shelters) ● Implement an intra-city shuttle system
Education, Outreach, & Coordination
● Partner with and encourage transit providers for improved/enhanced service
● Advocate for improved transit infrastructure ● Participate in regional transit planning programs ● Pursue partnerships and grant opportunities for funding ● Partner with neighboring jurisdictions to identify opportunities to
increase transit ridership ● Partner with school districts to increase school bus ridership
Evaluation ● Evaluate transit routes and frequency
Incentives ● Provide subsidized or discounted transit fares
Plan or Program ● Develop an intra-city shuttle program ● Develop a Safe Routes program to provide access to mass transit
network Requirement(s) ● Require new development to provide connections to mass transit
network
Bike, Walk, and Complete Streets This shows that of the VMT reduction policy subcategories, more CAPs have the bike, walk and complete streets subcategory than any other policy subcategory although these provide only 9% of the reductions. All CAPs have at least one related measure implemented through the capital improvement and infrastructure mechanism, followed by measures to develop a plan or program and conduct education and outreach. Only two CAPs have measures to mandate actions related to bike, walk, and complete streets and only one includes evaluation of the impact of bike, walk and complete street projects as part of the CAP itself. None of the CAPs commit to encourage bike, walk and complete streets through financial incentives.
Except for the County, other CAPs quantify only bike and walk policies. The County CAP quantifies the GHG reductions from a complete streets measure as a combination of incentives, improved street connectivity and bike and walk improvements which would fall under the capital improvement and infrastructure mechanism. General policies in CAPs to address the bike, walk and complete streets policy subcategory, by implementation type, are shown in Table 8.12.

334
Table 8.12 VMT Reduction in CAPs: General CAP Policies in the Bike, Walk & Complete Streets Subcategory
Implementation Mechanism General Policy
Capital Improvement & Infrastructure
● Install bike and pedestrian projects and facilities
● Improve existing bicycle and pedestrian facilities
● Complete streetscape improvements for safety and accessibility
● Implement complete streets policies
● Implement active transportation master plan
● Purchase e-bikes for municipal employee use
● Expand bicycle parking facilities
● Install sharrows on bike routes
● Improve connectivity between mass transit and active transportation networks
Education, Outreach, & Coordination
● Promote bicycle use and safety
● Facilitate bike-sharing services
● Encourage installation of bike and pedestrian facilities at nonresidential developments
● Develop partnerships to promote active transportation safety
● Coordinate efforts with SANDAG
● Pursue partnerships and grant opportunities for funding
Evaluation ● Monitor bicycle lane usage
Incentives NA
Plan or Program ● Develop a Complete Streets policy
● Develop an Active Transportation Plan or Similar (e.g., Bike or Pedestrian)
● Update existing Active Transportation Plans or Similar (e.g., Bike or Pedestrian)
● Develop a bicycle sharing program
Requirement(s) ● Require new development to provide connections to active transportation network
● Require increased bicycle parking facilities at certain nonresidential locations
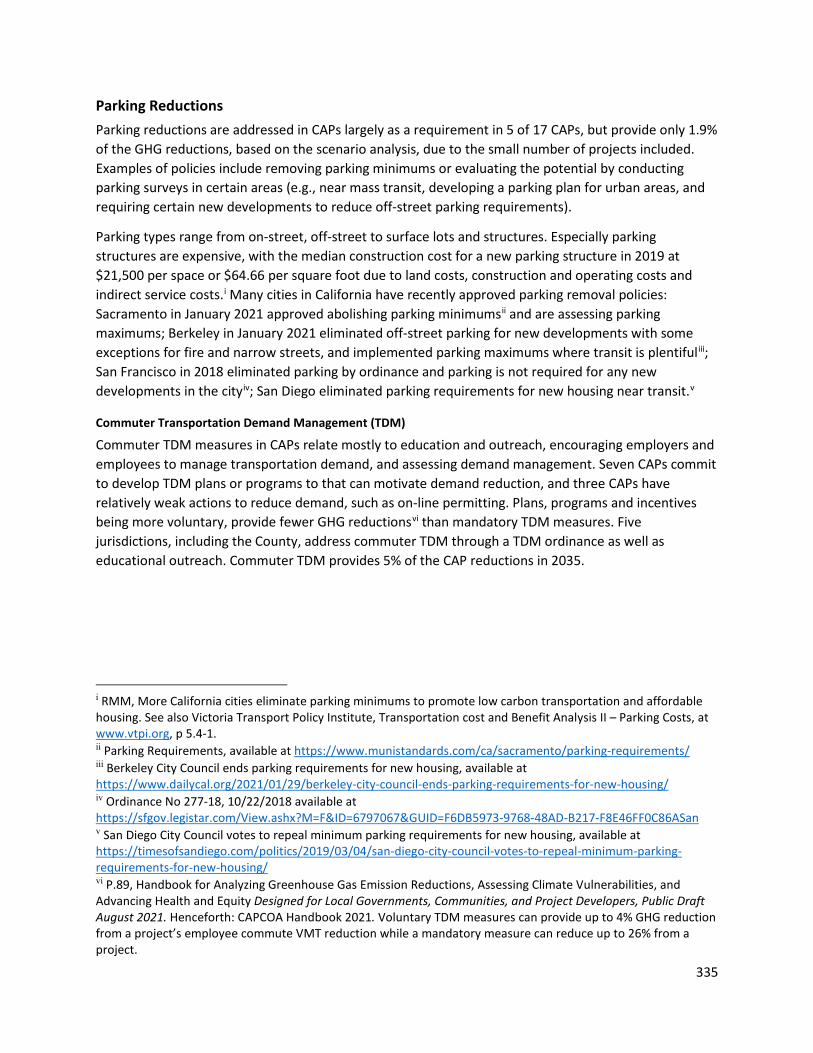
335
Parking Reductions Parking reductions are addressed in CAPs largely as a requirement in 5 of 17 CAPs, but provide only 1.9% of the GHG reductions, based on the scenario analysis, due to the small number of projects included. Examples of policies include removing parking minimums or evaluating the potential by conducting parking surveys in certain areas (e.g., near mass transit, developing a parking plan for urban areas, and requiring certain new developments to reduce off-street parking requirements).
Parking types range from on-street, off-street to surface lots and structures. Especially parking structures are expensive, with the median construction cost for a new parking structure in 2019 at $21,500 per space or $64.66 per square foot due to land costs, construction and operating costs and indirect service costs.i Many cities in California have recently approved parking removal policies: Sacramento in January 2021 approved abolishing parking minimumsii and are assessing parking maximums; Berkeley in January 2021 eliminated off-street parking for new developments with some exceptions for fire and narrow streets, and implemented parking maximums where transit is plentifuliii; San Francisco in 2018 eliminated parking by ordinance and parking is not required for any new developments in the cityiv; San Diego eliminated parking requirements for new housing near transit.v
Commuter Transportation Demand Management (TDM)
Commuter TDM measures in CAPs relate mostly to education and outreach, encouraging employers and employees to manage transportation demand, and assessing demand management. Seven CAPs commit to develop TDM plans or programs to that can motivate demand reduction, and three CAPs have relatively weak actions to reduce demand, such as on-line permitting. Plans, programs and incentives being more voluntary, provide fewer GHG reductionsvi than mandatory TDM measures. Five jurisdictions, including the County, address commuter TDM through a TDM ordinance as well as educational outreach. Commuter TDM provides 5% of the CAP reductions in 2035.
i RMM, More California cities eliminate parking minimums to promote low carbon transportation and affordable housing. See also Victoria Transport Policy Institute, Transportation cost and Benefit Analysis II – Parking Costs, at www.vtpi.org, p 5.4-1. ii Parking Requirements, available at https://www.munistandards.com/ca/sacramento/parking-requirements/ iii Berkeley City Council ends parking requirements for new housing, available at https://www.dailycal.org/2021/01/29/berkeley-city-council-ends-parking-requirements-for-new-housing/ iv Ordinance No 277-18, 10/22/2018 available at https://sfgov.legistar.com/View.ashx?M=F&ID=6797067&GUID=F6DB5973-9768-48AD-B217-F8E46FF0C86ASan v San Diego City Council votes to repeal minimum parking requirements for new housing, available at https://timesofsandiego.com/politics/2019/03/04/san-diego-city-council-votes-to-repeal-minimum-parking-requirements-for-new-housing/ vi P.89, Handbook for Analyzing Greenhouse Gas Emission Reductions, Assessing Climate Vulnerabilities, and Advancing Health and Equity Designed for Local Governments, Communities, and Project Developers, Public Draft August 2021. Henceforth: CAPCOA Handbook 2021. Voluntary TDM measures can provide up to 4% GHG reduction from a project’s employee commute VMT reduction while a mandatory measure can reduce up to 26% from a project.

336
Table 8.13 General CAP Policies – Commuter TDM Policy Subcategory
Implementation Mechanism General Policy
Capital Improvement & Infrastructure
● Launch and transition to an online municipal permitting system
Education, Outreach, & Coordination
● Facilitate first-mile/last-mile transportation options (e.g., bike- and car-sharing)
● Collaborate with SANDAG on regional TDM plans ● Promote use of alternative transportation modes (e.g., vanpool,
carpool) ● Connect employers with TDM resources ● Promote regional TDM programs ● Encourage employers to develop and participate in TDM programs ● Develop partnerships to promote TDM programs and strategies ● Encourage municipal employees to use a TDM commute method
(e.g., vanpool, carpool) Evaluation ● Conduct a transportation demand management study
● Review SANDAG’s TDM KPIs annually ● Conduct surveys to determine TDM usage rates
Incentives ● Provide incentives to municipal employees who use alternative transportation
● Provide incentives to businesses with TDM strategies in place Plan or Program ● Develop a citywide TDM plan
● Develop a TDM plan for municipal employees ● Develop an incentive program for municipal employees to use
alternative transportation Requirement(s) ● Require new nonresidential projects and certain retrofits to adopt
a TDM plan/strategies ● Require carpool and vanpool parking in new development
Smart Growth Development As mentioned previously, not all VMT reduction measures are quantified in CAPs as local actions, and are therefore not represented in Figure 21 and Figure 8.22. Measures not quantified as local actions but included as policies in CAPs are smart growth plans or programs. General implementation mechanisms for these policies are shown in Figure 8.14.
Smart growth development generally means zoning changes and density increases in new developments. The CAPCOA Handbook for Analyzing Greenhouse Gases i includes these as land use changes, such as increased residential density, increased job density, providing transit-oriented development, and improving street connectivity. These developments are considered to be part of the legislatively-adjusted BAU but if identified as specific projects in CAPs could have long-term VMT reduction potential by planning for focused new development in mobility hubs, for example. CAPs generally do not estimate reductions from plans and programs, even if they have the potential for long-term efficient development. Plans or programs (e.g., zoning changes to accommodate density increase) may be supported at a later stage by incentives (e.g., for example, density bonuses), and at an even later stage may become requirements for new development (e.g., minimum number of multifamily units), at
i p. 137, CAPCOA Handbook 2021.

337
which point they could be quantified for GHG reduction in CAPs. Therefore, where jurisdictions can identify new future developments that are not yet included in the BAU regional projection, CAPs can be used as the tool to estimate GHG reductions.
Table 8.14 General CAP Policies – Smart Growth Development Policy Subcategory
Implementation Mechanism General Policy
Capital Improvement & Infrastructure
NA
Education, Outreach, & Coordination
● Encourage higher density and mixed-use development
● Develop partnerships to identify barriers to higher-density development
● Develop partnerships to expand transit service near new development sites
● Encourage participation in easement programs for natural and working lands
Evaluation ● Identify areas that can support increased population or employment
Incentives ● Provide smart growth incentives to new development
Plan or Program ● Develop smart growth related plans, policies, or strategies (e.g., Transit District Specific Plan)
● Update General Plan
Requirement(s) ● Establish standards for new development projects
Micromobility
Micromobility measures, for example, e-bike programs, are not quantified in current CAPs. Micromobility is addressed in 3 CAPs only as an educational opportunity and not identified as a project that could assist in transit use, or otherwise shift to non-car community uses. CAPCOA estimates that up to 0.06% of GHG emissions reduction can be had from a community with this type of program.i
8.5.5 Reduce Fuel Use
Making the transportation system more efficient, thus using less fuel, includes traffic calming measures, and encouraging efficient driving behaviors. CAP commitments that have been quantified are mostly in the form of potential capital improvement projects. Half the CAPs use these actions (Figure 8.23), but because of the relatively few projects within each jurisdiction, the GHG reduction potential of these projects is only 3% of the total on-road GHG reduction amount (Figure 8.24). It is not possible to assess the potential magnitude of reduction from increasing the number of such actions across the region without significant coordination and cooperation in the region.
i Id. at 154.

338
Figure 8.23 Reduce Fuel Use Category: the bar charts show the number of CAPs with specific policies related to each subcategory.
Figure 8.24 GHG Reductions from Fuel Use Reduction as Estimated for 2035 in CAPs
General policies related to these policies are shown in Table 8.15 and Table 8.16. Driver behavior, addressed by only 3 CAPs, can also affect the efficiency of fuel use but has not been quantified for GHG reductions in CAPs. Examples of CAP measures include promoting fuel efficient driving behaviors, working with school districts to improve idling time during student pick up and drop off times, and limiting construction vehicle equipment and idling, through ordinances. These measures not only reduce fuel waste and GHG emissions, but also reduce emissions of criteria pollutants. California anti-idling regulations prohibit diesel trucks and buses, including from school buses, from idling for more than 5 minutes, with fines of $300-$1,000 per day. Local peace officers and the APCD can enforce these regulations. There are no similar regulations for LDVs; however, such actions would be within the authority of a school district or jurisdiction to adopt and enforce.
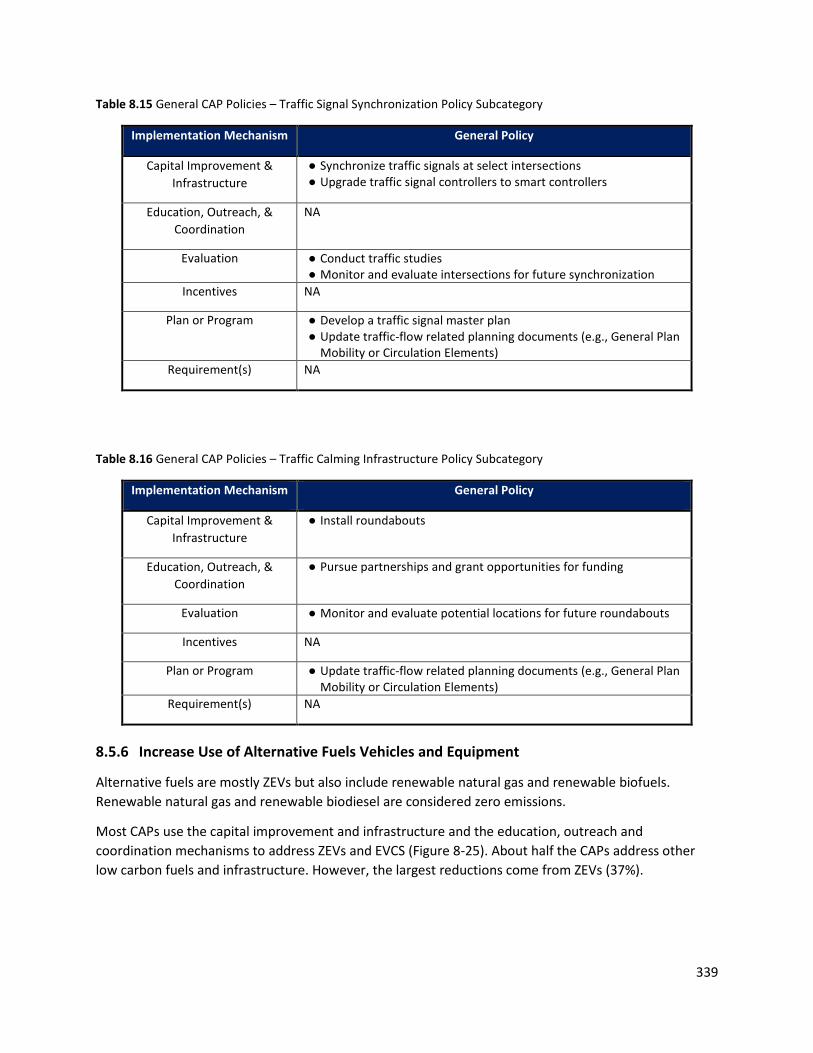
339
Table 8.15 General CAP Policies – Traffic Signal Synchronization Policy Subcategory
Implementation Mechanism General Policy
Capital Improvement & Infrastructure
● Synchronize traffic signals at select intersections ● Upgrade traffic signal controllers to smart controllers
Education, Outreach, & Coordination
NA
Evaluation ● Conduct traffic studies ● Monitor and evaluate intersections for future synchronization
Incentives NA
Plan or Program ● Develop a traffic signal master plan ● Update traffic-flow related planning documents (e.g., General Plan
Mobility or Circulation Elements) Requirement(s) NA
Table 8.16 General CAP Policies – Traffic Calming Infrastructure Policy Subcategory
Implementation Mechanism General Policy
Capital Improvement & Infrastructure
● Install roundabouts
Education, Outreach, & Coordination
● Pursue partnerships and grant opportunities for funding
Evaluation ● Monitor and evaluate potential locations for future roundabouts
Incentives NA
Plan or Program ● Update traffic-flow related planning documents (e.g., General Plan Mobility or Circulation Elements)
Requirement(s) NA
8.5.6 Increase Use of Alternative Fuels Vehicles and Equipment
Alternative fuels are mostly ZEVs but also include renewable natural gas and renewable biofuels. Renewable natural gas and renewable biodiesel are considered zero emissions.
Most CAPs use the capital improvement and infrastructure and the education, outreach and coordination mechanisms to address ZEVs and EVCS (Figure 8-25). About half the CAPs address other low carbon fuels and infrastructure. However, the largest reductions come from ZEVs (37%).
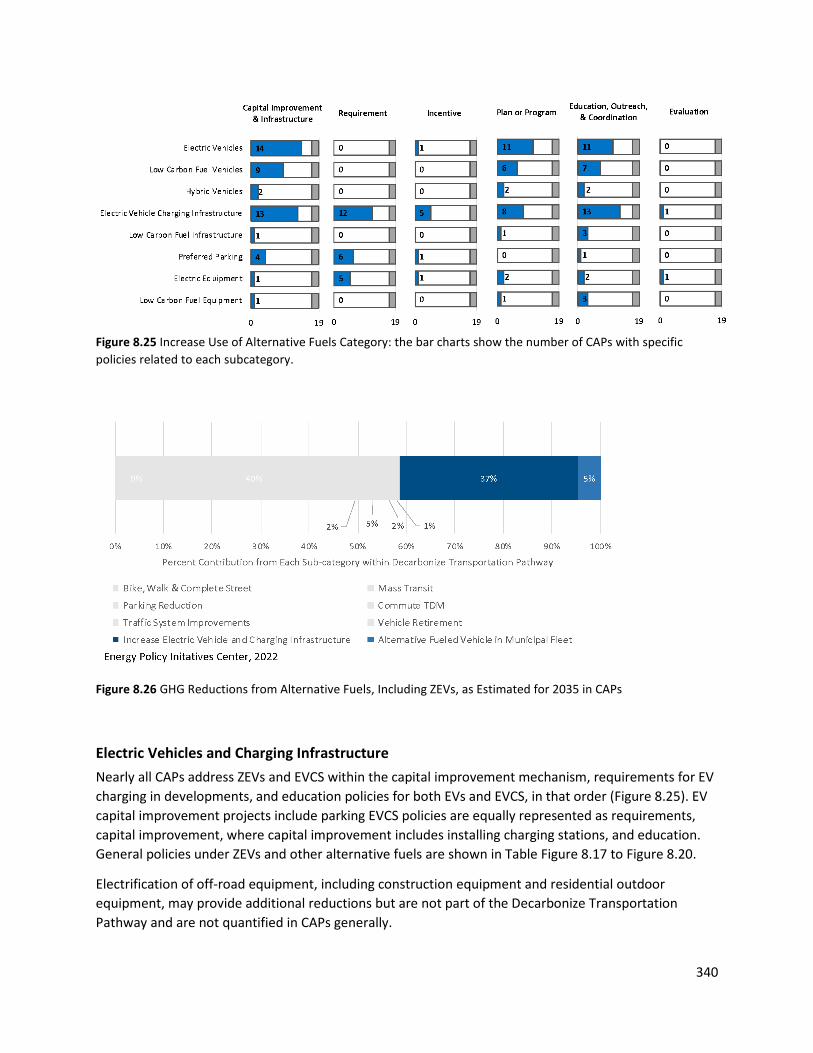
340
Figure 8.25 Increase Use of Alternative Fuels Category: the bar charts show the number of CAPs with specific policies related to each subcategory.
Figure 8.26 GHG Reductions from Alternative Fuels, Including ZEVs, as Estimated for 2035 in CAPs
Electric Vehicles and Charging Infrastructure Nearly all CAPs address ZEVs and EVCS within the capital improvement mechanism, requirements for EV charging in developments, and education policies for both EVs and EVCS, in that order (Figure 8.25). EV capital improvement projects include parking EVCS policies are equally represented as requirements, capital improvement, where capital improvement includes installing charging stations, and education. General policies under ZEVs and other alternative fuels are shown in Table Figure 8.17 to Figure 8.20.
Electrification of off-road equipment, including construction equipment and residential outdoor equipment, may provide additional reductions but are not part of the Decarbonize Transportation Pathway and are not quantified in CAPs generally.

341
Low-Carbon Fuel Vehicles, Infrastructure, and Equipment As provided in CAPs, low carbon alternative fuels are most important for municipal fleets and provide 5% of the CAP on-road transportation reductions in 2035. While the GHG reduction potential may be low (currently 5%, Figure 8.26) depending on the size of the municipal fleet, every municipality could implement a fleet conversion program based on studies initiated through SANDAG in the years 2012-2018.i Jurisdictions can leverage and implement the existing fleet greening studies and plans within their CAPs. Conversion of municipal fleet to ZEVs will fully eliminate those GHGs. According to CAPCOA, using cleaner-fuel vehicles would also increase transportation resilience by diversifying fuel sources. Alternative low carbon fuel sources can provide health and equity benefits by generally eliminating or lowering criteria air pollutants, although biodiesel may increase NOx emissions and lower PM emissions compared with regular diesel.ii
Table 8.17 General CAP Policies – Electric Vehicles Policy Subcategory
Implementation Mechanism General Policy
Capital Improvement & Infrastructure
● Transition municipal fleet from gas to alternative fuels ● Convert school bus fleet to electric
Education, Outreach, & Coordination
● Partner with waste hauler to use alternative fuel waste trucks ● Promote regional incentive and rebate programs supporting
electric vehicles ● Pursue partnerships and grant opportunities for funding ● Work with municipal departments to develop policies and
programs ● Partner with waste hauler to convert vehicles ● Partner with transit service provider to convert vehicles ● Develop partnerships to design municipal plans and policies ● Promote use of EVs ● Work with regional partners to develop a regional EV plan ● Advocate for an EV carsharing network
Evaluation NA
Incentives ● Provide incentives to city residents to increase use of EVs
Plan or Program ● Develop a municipal fleet management program or plan ● Update vehicle fleet assessment ● Develop a municipal alternative fuels policy ● Integrate low- and zero-emissions vehicles into municipal
purchasing policy ● Develop an electric vehicle carshare program
Requirement(s) NA
i The SANDAG Energy Roadmap Program provided free energy assessments and development of energy roadmaps including for municipal fleets and facilities, if and as requested by jurisdictions. Specific reduction potentials for greening the fleet were estimated, with associated fuel savings and GHG reductions. See https://www.sandag.org/index.asp?projectid=373&fuseaction=projects.detail. ii P. 187, CAPCOA Handbook 2021
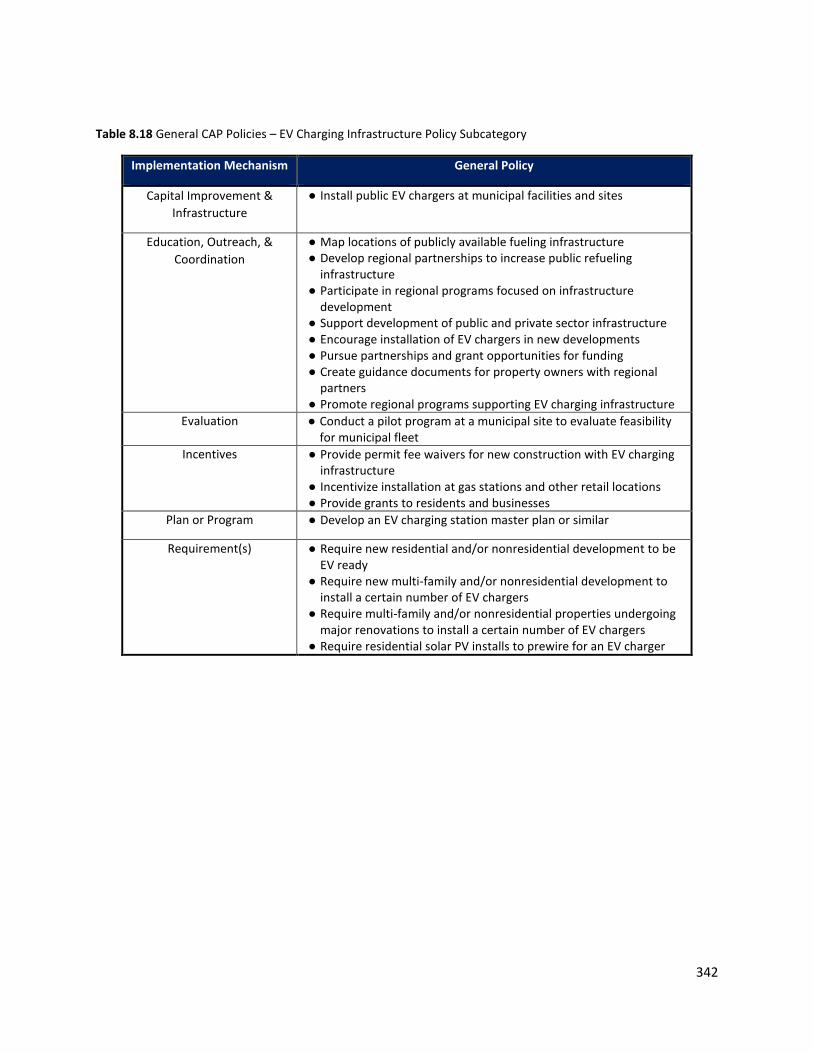
342
Table 8.18 General CAP Policies – EV Charging Infrastructure Policy Subcategory
Implementation Mechanism General Policy
Capital Improvement & Infrastructure
● Install public EV chargers at municipal facilities and sites
Education, Outreach, & Coordination
● Map locations of publicly available fueling infrastructure ● Develop regional partnerships to increase public refueling
infrastructure ● Participate in regional programs focused on infrastructure
development ● Support development of public and private sector infrastructure ● Encourage installation of EV chargers in new developments ● Pursue partnerships and grant opportunities for funding ● Create guidance documents for property owners with regional
partners ● Promote regional programs supporting EV charging infrastructure
Evaluation ● Conduct a pilot program at a municipal site to evaluate feasibility for municipal fleet
Incentives ● Provide permit fee waivers for new construction with EV charging infrastructure
● Incentivize installation at gas stations and other retail locations ● Provide grants to residents and businesses
Plan or Program ● Develop an EV charging station master plan or similar
Requirement(s) ● Require new residential and/or nonresidential development to be EV ready
● Require new multi-family and/or nonresidential development to install a certain number of EV chargers
● Require multi-family and/or nonresidential properties undergoing major renovations to install a certain number of EV chargers
● Require residential solar PV installs to prewire for an EV charger

343
Table 8.19 General CAP Policies – Low Carbon Fuel Vehicles Policy Subcategory
Implementation Mechanism General Policy
Capital Improvement & Infrastructure
● Transition municipal fleet from gas to alternative fuels ● Install a public CNG fueling station at a municipal facility
Education, Outreach, & Coordination
● Partner with waste hauler to use alternative fuel waste trucks ● Promote regional incentive and rebate programs supporting low
carbon fuel vehicles ● Pursue partnerships and grant opportunities for funding ● Work with municipal departments to develop policies and
programs ● Partner with waste hauler to convert vehicles ● Partner with transit service provide to convert vehicles
Evaluation NA
Incentives NA
Plan or Program ● Develop a municipal fleet management program or plan ● Update vehicle fleet assessment ● Develop a municipal alternative fuels policy ● Integrate low- and zero-emissions vehicles into municipal
purchasing policy Requirement(s) NA
Table 8.20 General CAP Policies – Low Carbon Fuel Infrastructure Policy Subcategory
Implementation Mechanism General Policy
Capital Improvement & Infrastructure
NA
Education, Outreach, & Coordination
● Map locations of publicly available fueling infrastructure ● Develop regional partnerships to increase public refueling
infrastructure ● Participate in regional programs focused on infrastructure
development ● Support development of public and private sector infrastructure ● Partner with waste hauler to use alternative fuel waste trucks
Evaluation NA
Incentives NA
Plan or Program ● Develop an integrated transportation strategy, including infrastructure needs
Requirement(s) NA

344
Preferred Parking CAP actions that have not been quantified are preferred parking actions for alternative fuel vehicles – that would support the acceleration of ZEVs. Even without quantification, most local jurisdictions can adopt preferred parking requirements in new developments, parking lots operated by private entities for public use, city-owned public spaces, and provide incentives for businesses to do so.
Table 8.21 General CAP Policies – Preferred Parking Policy Subcategory
Implementation Mechanism General Policy
Capital Improvement & Infrastructure
● Provide designated parking for EVs and AFVs at municipal facilities and public parking lots
● Designate a percentage of street parking spaces in certain areas for EVs and AFVs
Education, Outreach, & Coordination
● Encourage conversion of private parking spaces to EV and AFV preferred parking
Evaluation NA
Incentives ● Provide incentives to businesses that designate EV and AFV preferred parking spaces
Plan or Program NA
Requirement(s) ● Require EV and AFV preferred parking at new nonresidential developments
8.5.7 Opportunities for Additional Local Action to Decarbonize Transportation
Based on the analysis presented above on the authority of local jurisdictions to act, comparative analysis of CAPs, and scenario analysis of impact of commitments from CAPs in 2035, this section presents opportunities for local jurisdictions to take further action to decarbonize transportation. In general, opportunities exist for more jurisdictions to adopt and implement existing CAP measures and more aggressive measures like the best CAP commitment.
VMT Reduction California has two laws relating to VMT reduction – SB 375 and SB 743.i SB 375 requires per capita VMT reductions applicable to the regional transportation agency and SB 743 requires transportation environmental impacts to be assessed based on VMT rather than the previous Level of Service (LOC) criteria. Together, these indicate a shift from purely mobility-based planning to accessibility planning where a multitude of modes are available for different users. The following local policy opportunities can be viewed within this context.
Promote Mass Transit Use CAPs identify mass transit as the single most important measure to achieve GHG reductions through VMT reduction. Even while recognizing the significant role for regional cooperation for these measures,
i California is not alone in adopting this approach. The state of Washington also has targets to reduce VMT per capita by target years while exempting vehicles over 10,000 pounds, which are mostly freight and commercial vehicles. This law in Washington also aims to reduce on-road GHGs from transportation which is also there, the largest single source of GHGs.

345
jurisdictions still have significant opportunities to promote this mode to reduce VMT. Among these are requirements are for new developments and existing developments to improve connectivity, increase residential and job density. Studies have shown that for every 1% residential population density increase, there can be a 0.22% decrease in VMT. CAPCOA estimates that up to 30% of GHG emissions from new developments could be achieved through such actions.i
Within their local jurisdiction, improved transit support infrastructure such as stations, bus depots, bus shelters can promote mass transit use. A 2018 study by the Utah Transit Authority (UTA) compared ridership and paratransit demand from before and after bus shelter improvements with a control group. It found that improved bus stops are associated with a statistically significant increase in overall ridership and a decrease in paratransit demand. The study concluded that between 2013 and 2016, there was a 92% increase in ridership due to improved bus stops than at the control group stops, and a 94% decrease in ADA paratransit demand.ii
Increasing network coverage and hours, increasing the frequency of service, reducing transit fares are additional policies that may not be amenable to individual jurisdictional application. However, CAPCOA estimates that increasing service hours can provide up to 4.6% GHG reductions within a community, while increasing frequency can mitigate up to 11% GHG emissions from a community.iii Reducing transit fares also has the potential to increase uptake and reduce GHGs by about 1.7% within a community.iv However, implementing such changes may require collaboration with transit agencies and regional transportation agencies. Therefore the likelihood that the GHG reductions estimated for mass transit in CAPs becomes reality is heavily dependent on collaboration with regional agencies.
If mass transit is to be a regionally significant path forward to transportation decarbonization through VMT reduction, then electrifying all equipment and transit vehicles would lead to additional reductions.v
Mass transit also has a significant associated equity component in that it often serves those who have the least ability to own a vehicle, or even when they do, has huge cost burdens imposed. Sections below further evaluate the equity components of on-road transportation. A study by Washington statevi on the differential impacts of mass transit on different types of rural versus urban populations showed that small businesses relying on long-distance workers, low income rural and low-income urban, agricultural workers, very low density land areas would benefit less from mass transit than in urbanized areas and that other approaches such as vanpools, destination oriented alternative modes, providing digital access
i P.69, CAPCOA Handbook 2021 ii Impacts of Bus Stop Improvements, Report No. UT-18-04, KY Kim et al, University of Utah, available at http://mrc.cap.utah.edu/wp-content/uploads/sites/8/2015/12/UT-18.04-Impacts-of-Bus-Stop-Improvements.pdf. iii P. 169, CAPCOA Handbook, 2021 iv Id. at p. 183. v Electrifying the Nations’ Mass Transit Bus Fleets, available at https://info.burnsmcd.com/white-paper/electric-bus-fleets. Also see the Road to Net-Zero Is Paved By Electric Buses, by Paola Massoli, May 19, 2020, available at https://blog.greenenergyconsumers.org/blog/why-electric-buses-make-sense-now, citing a study by the Union of Concerned Scientists at https://www.ucsusa.org/sites/default/files/attach/2019/04/Electric-Utility-Investment-Truck-Bus-Charging.pdf that the average 40-foot diesel bus emits 2,680 grams of CO2 per mile (g/mi), an electric bus charged on the average U.S. energy mix emits 1,078 g/mi, nearly 50% less. vi Carlson, D. and Howard, Z. Impacts of VMT reduction strategies on selected areas and groups, Evans School of Public Affairs, Washington State Transportation Center, prepared for the State of Washington, December 20201, available at https://www.wsdot.wa.gov/research/reports/fullreports/751.1.pdf.

346
to reduce the need to travel, ride-sharing programs and increasing low income housing within transit developments all help to reduce VMT. SANDAG’s most recent RP2021 appears to represent these findings.
Increase Bike and Walk Infrastructure to Increase Access to Basic Needs and Avoid VMT An opportunity exists for local jurisdictions to require alternative mode infrastructure to serve local access and mobility needs from new developments, make active transportation plans a requirement of new developments and evaluate the potential for additional active transportation (AT) in their city, and assess the potential for ATs in parts of their jurisdiction. Local jurisdictions could increase cooperation and coordination with neighboring jurisdictions and with regional walk and bike implementation projects by SANDAG and prioritize walk and bike projects in communities of concern.
The bike, walk and complete streets policy subcategory is the single most frequent policy used in CAPs and is likely consistent with local jurisdiction legal authority over land use. The County is the only jurisdiction to quantify a complete streets policy while all other CAPs only quantify bike and walk policies. There remains opportunity for more jurisdictions to incentivize bike, walk and complete streets, develop plans and programs, and increase education and outreach. More jurisdictions could increase evaluation the impact of bike, walk and complete street impacts to assess effectiveness and understand what type of improvements can be made.
Even while the overall GHG reduction potential of this policy subcategory is relatively low, bike, walk and complete streets policies can be used to address long standing inequities, such as lack of access to basic local needs (e.g., food, recreation, potentially employment), poor infrastructure, and there are multiple health and safety benefits of active transportation to all residents and visitors.
Therefore opportunities exist for local jurisdictions to make this policy subcategory a requirement for new developments and also to assess areas where active transportation plans would lead to increased uptake of alternative modes for local access and mobility. An example of a recent active transportation plan comes from the City of Encinitas.i Local jurisdictions could increase cooperation and coordination with neighboring jurisdictions and with regional walk and bike implementation projects by SANDAG and prioritize walk and bike projects in communities of concern.
Increase Connectivity through Land Use Changes to Avoid VMT Opportunities exist for local jurisdictions to increase connectivity by increasing residential or job density, eliminate parking minimums, and permit zoning changes to promote mixed-use developments, which reduce distances to basic needs and promote VMT reduction. Opportunities to increase density in specific in-fill areas have been identified in Chapter 3.ii According to CAPCOA, GHG reductions from these actions can lead to GHG reductions of up to 30% in the project area, similar to the promotion of mass transit described above.iii
i City of Encinitas Active Transportation Plan, August 22, 2018, available at https://encinitasca.gov/Portals/0/City%20Documents/Documents/Development%20Services/Planning/Advanced%20Planning/CMLS/ATP%20Council%20PPT%20Presentation%2008222018.pdf ii Areas in the region which meet infill definitions are provided in Chapter 3 of this report, page 70 ff. iii P.123, CAPCOA Handbook 2021.
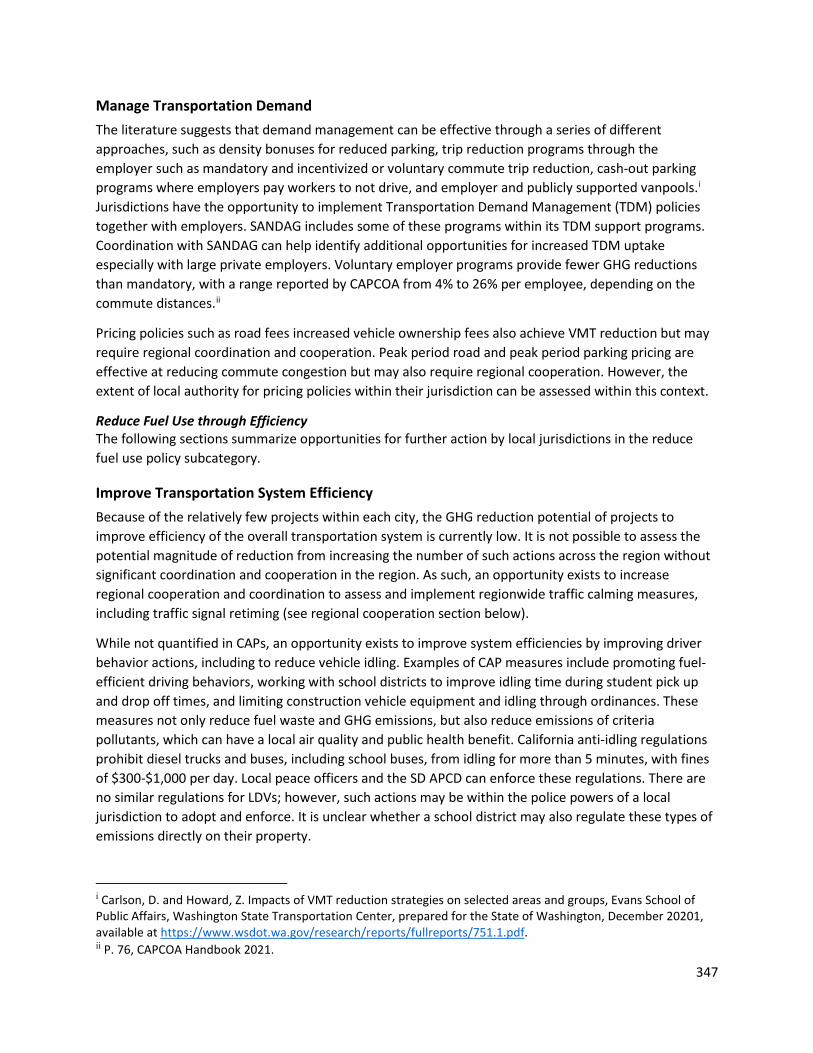
347
Manage Transportation Demand The literature suggests that demand management can be effective through a series of different approaches, such as density bonuses for reduced parking, trip reduction programs through the employer such as mandatory and incentivized or voluntary commute trip reduction, cash-out parking programs where employers pay workers to not drive, and employer and publicly supported vanpools.i Jurisdictions have the opportunity to implement Transportation Demand Management (TDM) policies together with employers. SANDAG includes some of these programs within its TDM support programs. Coordination with SANDAG can help identify additional opportunities for increased TDM uptake especially with large private employers. Voluntary employer programs provide fewer GHG reductions than mandatory, with a range reported by CAPCOA from 4% to 26% per employee, depending on the commute distances.ii
Pricing policies such as road fees increased vehicle ownership fees also achieve VMT reduction but may require regional coordination and cooperation. Peak period road and peak period parking pricing are effective at reducing commute congestion but may also require regional cooperation. However, the extent of local authority for pricing policies within their jurisdiction can be assessed within this context.
Reduce Fuel Use through Efficiency The following sections summarize opportunities for further action by local jurisdictions in the reduce fuel use policy subcategory.
Improve Transportation System Efficiency Because of the relatively few projects within each city, the GHG reduction potential of projects to improve efficiency of the overall transportation system is currently low. It is not possible to assess the potential magnitude of reduction from increasing the number of such actions across the region without significant coordination and cooperation in the region. As such, an opportunity exists to increase regional cooperation and coordination to assess and implement regionwide traffic calming measures, including traffic signal retiming (see regional cooperation section below).
While not quantified in CAPs, an opportunity exists to improve system efficiencies by improving driver behavior actions, including to reduce vehicle idling. Examples of CAP measures include promoting fuel-efficient driving behaviors, working with school districts to improve idling time during student pick up and drop off times, and limiting construction vehicle equipment and idling through ordinances. These measures not only reduce fuel waste and GHG emissions, but also reduce emissions of criteria pollutants, which can have a local air quality and public health benefit. California anti-idling regulations prohibit diesel trucks and buses, including school buses, from idling for more than 5 minutes, with fines of $300-$1,000 per day. Local peace officers and the SD APCD can enforce these regulations. There are no similar regulations for LDVs; however, such actions may be within the police powers of a local jurisdiction to adopt and enforce. It is unclear whether a school district may also regulate these types of emissions directly on their property.
i Carlson, D. and Howard, Z. Impacts of VMT reduction strategies on selected areas and groups, Evans School of Public Affairs, Washington State Transportation Center, prepared for the State of Washington, December 20201, available at https://www.wsdot.wa.gov/research/reports/fullreports/751.1.pdf. ii P. 76, CAPCOA Handbook 2021.

348
Accelerate Vehicle Retirement While the County has a program to advance vehicle retirement in their communities, CAPs generally do not address vehicle retirement. This is an opportunity to reduce inefficient vehicles and replace them with clean alternatives, including ZEVs. Vehicle retirement can be prioritized in Communities of Concern which tend to have older less fuel efficient vehicles. Replacing them would also lead to significant air pollution reduction with associated health benefits for all. California’s Voluntary Accelerated Vehicle Retirement Program provides incentives to individuals to scrap their older more polluting vehicles and replace with newer ones. This program is administered by certain air pollution control districts. Jurisdictions have an opportunity to benefit from this program.
Alternative Fuels and Infrastructure The following sections summarize opportunities for further action by local jurisdictions in the alternative fuels and infrastructure policy category.
Increase Use of Alternative Fuel Vehicles in Municipal Fleets There is an opportunity for local governments to increase use of alternative, low-carbon fleet fuels in addition to ZEVs, particularly for medium- and heavy-duty vehicles but regional study could assess the availability and funding requirements for non-electricity alternative fuels (see below, regional cooperation). More local jurisdictions could address both ZEVs, EVCS and non-electric fuels for their fleet. While the associated GHG reduction based on our scenario analysis may be low (currently 5%, Figure 8.26) depending on the size of the municipal fleet, every municipality can implement a fleet conversion program based on studies initiated through SANDAG in the years 2012-2018.i Jurisdictions could leverage and implement the existing fleet greening studies and plans within their CAPs.
The conversion of school buses to EVs is addressed in several CAPs. Cities could work with all school districts to obtain funding for a regionwide school bus transition. A larger question relating to school buses is to assess whether the school bus system can be part of the public transit system, as is common in European countries.ii College students in the San Diego region are already a large source of passengers to the public system, and including school-going passengers would increase the use of the public transit system in place of several scattered privately operated systems.
Assess the Social Equity tradeoffs between ZEVs and Mass Transit As discussed above, there is little or no integration of social equity in CAP on-road transportation measures. An opportunity exists for local jurisdictions to collaborate to assess the equity impacts of ZEV
i The SANDAG Energy Roadmap Program 2012–2018 provided free energy assessments and development of energy roadmaps including for municipal fleets and facilities. Specific reduction potentials for greening the fleet were estimated for jurisdictions, as desired, with associated fuel savings and GHG reductions. See https://www.sandag.org/index.asp?projectid=373&fuseaction=projects.detail ii See, The Existing school transportation framework in Greece — Barriers and problems comparing to other European countries, which provides the common practices among European countries. In Germany for example, certain routes are set up to serve schools at school times. The paper report that in Germany, about 40% of students aged 6 to 16 years are daily transferred either by public buses for two hours in the morning and two hours in the afternoon and where the schedule is adapted to schools’ needs and some jurisdictions offering tickets at discounted rates for school children. Safety is implemented by flashing lights similar to California and federal law sets speed limits at 50 and 80 km/hr for urban and interurban areas respectively.
349
use versus increasing use of mass transit in all communities, and to align regional transportation equity analysis (e.g., SANDAG) with CAP equity analyses (e.g., City of San Diego).
Opportunities for Regional Collaboration and Coordination On-road transportation is especially suited to regional action over local jurisdictional action because interconnections are needed between jurisdictions to serve basic needs. VMT reduction through improved connectivity and mass transit, ZEV uptake, and social equity integration could be more effective through a regional approach rather than through individual CAPs. A summary of opportunities is presented below.
Increase Regional Cooperation to Integrate Social Equity Because transportation planning has significant long-term implications for social equity, it is important to coordinate and integrate equity-specific considerations into CAPs in coordination with other regional equity assessments. Although SANDAG has considered social equity in the 2021 Regional Plan in a much more significant manner than in previous versions, the City of San Diego has developed an equity index for guiding city-funded projects and integrated social equity into its 2021 CAP update, the City of Chula Vista has also developed an equity index related to climate action, all based on significant inclusive participation, an opportunity exists for increased coordination between these equity efforts and analyses.
Similar to our review of CAPs, a literature survey shows that there is no accepted definition of equity in transportation; however, without equitable distribution of resources in the transition to a low carbon economy, the benefits of the transition will be felt disproportionately by low income communities for reasons explained in the sections below.
SANDAG’s equity analysis (App H SANDAG RP2021) considers three population groups that represent disadvantaged populations in the ABM transportation model: minorities, low-income populations, and seniors. Demographic thresholds were selected to determine the type of mobility needed for these groups and this section focuses on low income and seniors. The threshold for seniors was selected as 75 years of age, where mobility is still a concern, but would convert to transit rather than passenger vehicle. While there is significant regional variation, the low-income population was defined as having income at or below 200% of the 2016 federal poverty level, and this constituted 25% of the region’s residents. In addition, 9.8% of the civilian population is classified as disabled, and this is also a group that needs access to basic needs through transit or special programs. Households with no vehicle available was also considered, which constituted 5.7% of all households in the region.
Therefore, according to SANDAG’s analysis in its RP2021, more than 30% of the region’s households would be good candidates for transit use. Figure 8.27 shows that more than 30% of households with less than $60,000 income walk and/or use transit for all trips data.

350
Figure 8.27 Household Income by Means of Transportation to Work (SANDAG 2016 Regional Transportation Study, Volume I, Figure 8-26)
The transportation cost burden of people living in the San Diego region (based on the City of San Diego as representative) are of the order 100 times greater than their household energy cost burden. The average transportation cost burden (transportation costi as a % of median income adjusted for household income) for a San Diego resident is 21%, while the energy cost burden (energy cost as % of median income adjusted for household income) is 2%. The transportation cost burden ranges from slightly less than 10% to nearly 60% of median income (adjusted for housing cost). Those spending more than the average 21% all have a median housing-adjusted income less than about $70,000 (Figure 8.28).
i Transportation cost considers the costs associated with vehicle ownership and usage and use of public transportation.

351
Figure 8.28 Transportation Cost Burden, City of San Diego 2010 Census Data, ACS Estimate for 2016.
This very high average transportation cost burden is much higher than the 13% average across the U.S., which in turn is considerably higher than any other developed country in the world. As quoted by the Institute for Transportation and Development Policy (ITDP), “ [i]n the US, there is a narrative that if people work hard, then they can get out of poverty, but we’ve built cities that make this narrative impossible. For households making less than $20,000 per year, reliable cars are a pipe dream: a huge expense that they can’t afford. Without adequate transit, they will remain stuck in place.”i If this is still correct, for these populations, implementing the SANDAG RP2021 could provide an expanded, fast, clean and reliable transit access system designed to result in out-of-pocket transportation costs decreasing from 5.1% in 2025 to 4.4% in 2050 if implemented.ii
Yet another indicator helps visualize the relatively obvious links between income and vehicle ownership. Though yet to be developed for San Diego County, for the United States, a recent report from the International Council on Clean Transportation (ICCT) shows that U.S. households earning less than $25,000 spend about 50% of their income on vehicle ownership and maintenance not including registration, financing or parking costs. Figure 8.29 shows this relationship for the United States.
i Indicators for Sustainable Mobility, ITDP Report. ii SANDAG RP 2021, Appendix H: Social Equity: Engagement and Analysis, p. H-54
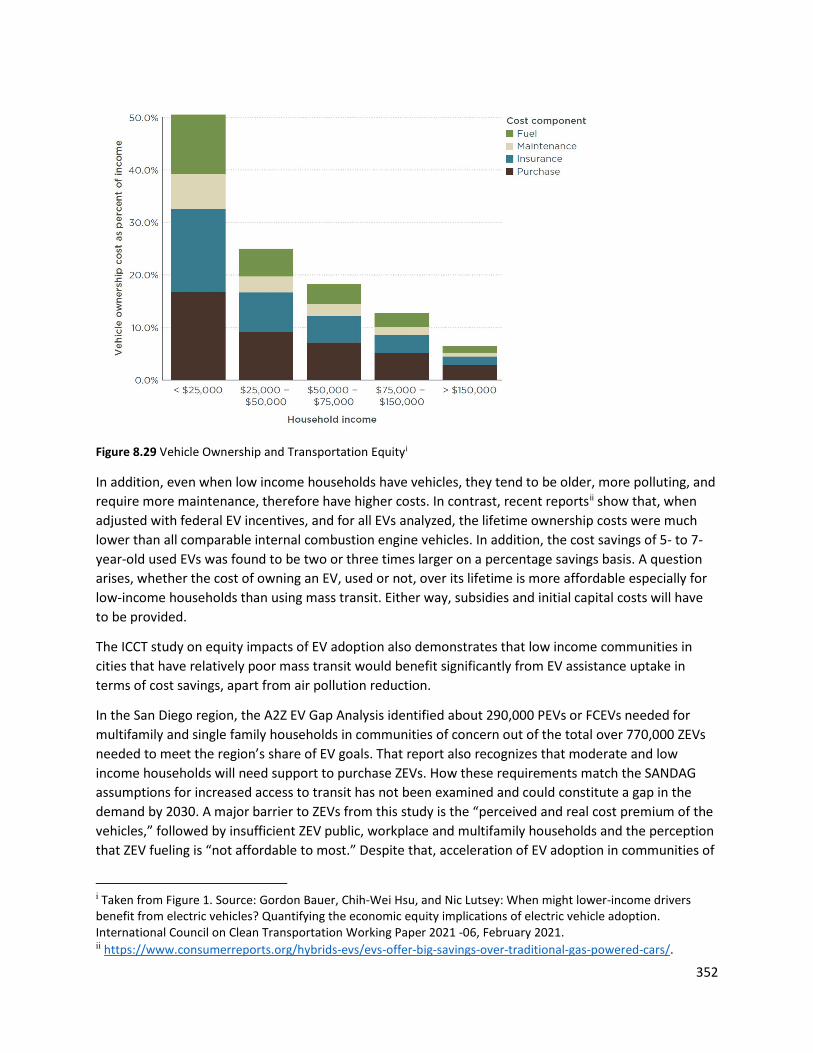
352
Figure 8.29 Vehicle Ownership and Transportation Equityi
In addition, even when low income households have vehicles, they tend to be older, more polluting, and require more maintenance, therefore have higher costs. In contrast, recent reportsii show that, when adjusted with federal EV incentives, and for all EVs analyzed, the lifetime ownership costs were much lower than all comparable internal combustion engine vehicles. In addition, the cost savings of 5- to 7-year-old used EVs was found to be two or three times larger on a percentage savings basis. A question arises, whether the cost of owning an EV, used or not, over its lifetime is more affordable especially for low-income households than using mass transit. Either way, subsidies and initial capital costs will have to be provided.
The ICCT study on equity impacts of EV adoption also demonstrates that low income communities in cities that have relatively poor mass transit would benefit significantly from EV assistance uptake in terms of cost savings, apart from air pollution reduction.
In the San Diego region, the A2Z EV Gap Analysis identified about 290,000 PEVs or FCEVs needed for multifamily and single family households in communities of concern out of the total over 770,000 ZEVs needed to meet the region’s share of EV goals. That report also recognizes that moderate and low income households will need support to purchase ZEVs. How these requirements match the SANDAG assumptions for increased access to transit has not been examined and could constitute a gap in the demand by 2030. A major barrier to ZEVs from this study is the “perceived and real cost premium of the vehicles,” followed by insufficient ZEV public, workplace and multifamily households and the perception that ZEV fueling is “not affordable to most.” Despite that, acceleration of EV adoption in communities of
i Taken from Figure 1. Source: Gordon Bauer, Chih-Wei Hsu, and Nic Lutsey: When might lower-income drivers benefit from electric vehicles? Quantifying the economic equity implications of electric vehicle adoption. International Council on Clean Transportation Working Paper 2021 -06, February 2021. ii https://www.consumerreports.org/hybrids-evs/evs-offer-big-savings-over-traditional-gas-powered-cars/.

353
concern is a major issue often raised in CAP stakeholder meetings because ZEVs are seen as a way to improve air pollution and noise.
Therefore, by identifying the communities of concern with low-income households in the region, and targeting transportation electrification in these areas provides an opportunity to mitigate GHGs for the future but also to address historical inequities. Along with this, local jurisdictions could assess the cost of increased ZEV access in communities of concern (short-term and lifetime costs per GHG avoided) compared to an electrified mass transit system (costs per unit of GHG emissions avoided over the lifetime of the system) both for the region and for low-income households.
Chapter 3 already identified areas with communities of concern which can be targeted and while prioritizing communities of concern for EVs does not provide additional GHG reductions it does help to re-distribute the benefits, including reducing criteria pollutants.
An opportunity exists to assess the reduction in air pollutants from conversion to electric transportation, including in school buses. In a follow-up to a Harvard Six Cities Study, which examined the relationship between improvements in ambient PM2.5 and city-level mortality, a comparison of the 1974–1989 period with a follow-up period, 1990–1998, showed that every 10-mg improvement in city-level average annual PM2.5 was associated with a 27% improvement in the relative risk of death.
Because transportation planning has significant long-term implications for social equity, there is an opportunity to integrate equity-specific considerations into CAP and to coordinate with regional approaches, including SANDAG’s equity assessments. Although SANDAG has considered social equity in the 2021 Regional Plan more than in previous versions, and the City of San Diego has developed an equity index for guiding city-funded projects, there is room for increased coordination between SANDAG’s equity analysis, local equity policies, and climate action planning. Another option is for cities to coordinate and cooperate through SANDAG to integrate social equity into all future transportation projects supported by funding.
Increase Regional Collaboration to Increase Transportation System Efficiency Traffic calming measures have ripple effect across boundaries, and regional cooperation could help to assess opportunities for regionwide fuel use reduction actions. Installing roundabouts in one jurisdiction could cause back-ups along the same arterial in another jurisdiction. An example of a regional roundabout study is one done for Monterey County, where 26 area intersections as proposed by cities and county were used to identify a prioritized list (Figure 8.30) to help guide roundabout investment regionally, but also by jurisdiction.

354
Figure 8.30 Example Results of a Regional Roundabout Study, Monterey County, 2016. Green symbols represent roundabouts with a positive Benefit-Cost Ratio.
Develop a Regional ZEV Implementation Plan to Meet State Targets Neither SANDAG incentives for ZEVs nor the additional CAP-based ZEV uptake appear able to reach the 2035 targets for ZEVs for the region estimated in Chapter 3. The opportunity to assess this gap and develop an implementation plan following the A2Z Gap Analysis report has just started. Coordinating with CAP measures when updating, including when adopting electric vehicle infrastructure ordinances for new and significant retrofit construction, could improve regional approaches to increasing ZEV uptake.
Regional Action Could Lead to Additional GHG Emissions from On-road Transportation VMT reduction through improved connectivity and mass transit, ZEV uptake, and social equity integration could be more effective through a regional approach rather than through individual CAPs. An opportunity exists to coordinate between the regional planning process and the local climate action

355
planning process to accelerate GHG reduction from on-road transportation. Working with private sector employers can also help achieve the state goals for GHG reduction.
Assess availability of non-electric biofuels for use in fleets The availability of biofuels for municipal fleets could be assessed especially as more cost-effective short- and medium-term solutions emerge for heavy-duty vehicle conversion. U.S. production of renewable diesel, for example, is expected to increase significantly through 2024 and it receives favorable scores under the LCFS, which incentivizes its use.i Similarly, biodiesel is in high demand for heavy-duty trucks, although its crop-based needs create a limitation.ii A regional assessment of the benefits and challenges of using these fuels and their availability and price could help municipalities decide on short-term low-carbon options for their immediate fleet turnover needs while waiting for more mass availability of electric HDTs.
Assess the use of LCFS funding to promote transition to lower carbon fuels There may be an opportunity to use cap and trade funds through the LCFS to aid in fleet electrification or transition to a lower carbon fuel. While clean vehicle rebates and incentive programs are phasing out, the LCFS requires reduction of carbon intensity of fuels over time, and there is market for buying and selling LCFS credits which can assist in the transition. For example, owners of public EVCS can generate and sell credits for EV charging. ICCT has shown how the LCFS can support transport electrification, including the potential for a small revenue stream from home charging that can reduce the cost of individual EV ownership.iii
Increase regional program development Providing program development and implementation resources for local measures, including shared, reduced, or alternative fuel vehicle preferred parking standards; transportation demand management plans; pedestrian and bicycle infrastructure; improved traffic flow projects; and smart growth development could help increase awareness and availability of current regional programs and funding opportunities to increase current participation levels.
Through its ReCAP, SANDAG has provided services to most cities in the region to support climate action planning activities, including developing and providing templates for methods and monitoring, applying them to the development of CAPs, and monitoring metrics related to GHG mitigation measures, and providing results in the form of annual ReCAP Snapshots. SANDAG has developed and hosts the CAP data through a publicly available Climate Action Data Portal. The ReCAP program has led to some level of consistency in CAPs across the region, allows the tracking of CAP measure progress over time, and the monitoring of overall GHG reduction activities in the region.
Such programs could be expanded and new programs and funding mechanisms could be identified to fill gaps where it appears goals are not being met. Improving the coordination between CAP data gathering
i U.S. renewable diesel capacity could increase due to announced and developing projects, U.S. Energy Information Administration, July 29, 2021, at https://www.eia.gov/todayinenergy/detail.php?id=48916. ii Biodiesel is booming. At https://www.npr.org/2021/10/28/1043413986/biodiesel-is-booming-it-may-help-the-climate-but-theres-a-big-environmental-risk. iii Kelly, C. Blog, How low-carbon fuel standards cab support transport electrification, August 6, 2020, at https://theicct.org/how-low-carbon-fuel-standards-can-support-transport-electrification/.

356
and metric tracking and those that SANDAG must track by regulation, especially under SB 375, can potentially identify new programs and funding mechanisms to accelerate the achievement of the State and regional climate and energy goals.
Increase Sub-regional Collaboration Apart from increased cooperation with the MPO, jurisdictions can work directly with transit agencies to identify gaps in service, prioritizing communities of concern, and identifying funding for its increased local policy adoption and implementation.
Accelerate EV Adoption through Joint Powers Agreements CCA programs in the region represent a local mechanism, usually through JPAs, which can support transportation electrification by developing programs to incentivize EV uptake beyond state and federal programs. Examples of local CCA programs that will accelerate EV adoption are summarized in Table 8.22. Once launched, a CCA is completely funded by revenues and not taxpayer dollars. As a result, surplus funds generated by the CCA can, and often are, used to fund projects to reduce GHGs. It remains to be seen whether the multiple CCAs currently being formed in San Diego county will follow the examples given below.

357
Table 8.22 CCA Programs to Accelerate Transportation Community
Choice Aggregator
Number of Customers (Accounts)
Transportation Electrification Program - On-going or Planned
Collaboration Needs Addresses
Equity?
Clean Power Alliance
1 million
Public EV Charging: incentives to non-residential customers to install electric vehicle (EV) chargers that are available for public use Pilot Program: EV Chargers: Available to commercial customers with at least three Level 2 EV chargers, this program asks participants to allow their EV chargers to operate at a reduced rate of charge during peak events
Collaborate with CALeVIP and local air resource boards to expand funding and expedite implementation of EV infrastructure incentives for CPA customers.
-
Central Coast Community Energy
350,000
Electrify Your Ride: designed to provide CCCE customers with a “one-stop-shop” process to apply for post purchase incentives for one or more of the following four (4) rebates: EVs, EV Chargers, EV Readiness and Electric Bikes making this program the single largest energy program budget to date. Funds exhausted. Electrifying our community’s school buses for a cleaner, healthier and safer Central Coast. Central Coast Community Energy is funding up to $200,000 per bus for public school districts throughout our service area. 50% matching funds requirement to complete the bus purchase after the CCCE incentive.
South Central Coast Incentive Project: with CALeVIP ($1.75 million) Central Coast Incentive Project: with CALeVIP (CEC and CCSE) and Monterey Bay Community Power ($7 million), for non-residential, multi-family, non-profits and LGs EV chargers in 3 counties $295,000 given in rebates, funds exhausted Collaborate with Monterey Bay Air Resource District: will replace 6 school buses, fund exhausted
Yes, based on Tier 1 and Tier 2 income classification CCCE contributed $1.75 million of $12 mi from CALeVIP, 50% for DACs
Marin Clean Energy
450,000
EV rebates for new, used and leased vehicles, up to $3,500; Website pointing to multiple state rebates, CVRP, BAAQMD, PG&E incentives, and federal tax incentives.
- Yes, income qualified
Peninsula Clean Energy
295,000
EV rebates for used and new plug-in hybrid and battery EVs up to $4,000; also for rentals EV Ready Program: $28 million funded by CCA for 3,500 EVCS in county in 4 years
-
Yes, increased rebates for income-qualified residents

358
Community Choice
Aggregator
Number of Customers (Accounts)
Transportation Electrification Program - On-going or Planned
Collaboration Needs Addresses
Equity?
Redwood Coast Energy Authority
62,000
RCEA customers are eligible for a rebate totaling 50% of whatever incentive amount they received from the CVRP. Applicants can only apply for RCEA’s rebate if they have already been approved by the state CVRP program, total available $50,000 Residential EV Charging Equipment Rebate $500, $24,000 available E-bike rebate $500 ($41,500, funds exhausted)
- -
San Jose Clean Energy
Park for free at all City of San Jose parking meters Website pointing to multiple state rebates, CVRP, BAAQMD, PG&E incentives, and federal tax incentives.
Partnership with CEC to offer light-duty fleet vehicles rebates on Level 2 chargers.
-
Santa Barbara Clean Energy
EV cash-back: customers are eligible for $1,500 cash back on Chevy Bolt EV and EUV and $1,000 cash back on any used BEV and PHEV
- -
Silicon Valley Clean Energy
270,000
Website pointing to the multiple state rebates – CA vehicle retirement program, CA HOV exemption, AC Clean Fuel Reward for new or lease, CVRP, Beneficial State Bank <8% interest loans, PG&E rate plans, Community Housing Dec Corp grants, BAAQMD incentives including toll discounts on bridges, and federal tax incentives.
- -
Sonoma Clean Power
224,000 EV rebates: $12,500 to non-profits which purchase or lease an EV or plug-in hybrid with range at least 25 mile
- -
Valley Clean Energy
55,000 Website pointing to multiple state rebates, CVRP, BAAQMD, PG&E incentives, and federal tax incentives.
- -

359
8.6 Decarbonize Buildings In the San Diego region, about 8 MMTCO2e of GHG emissions is associated with electricity and natural gas end use, much of which is associated with energy use in buildings. GHG emissions associated with buildings come from the electricity to serve the building and the fuel (e.g., natural gas) combusted in the building for various end uses. This section focuses on reducing energy used in buildings and switching from natural gas and other fossil fuels to electricity for building equipment. Decarbonizing the electricity supply, which is sometimes considered part of building decarbonization, is addressed in Section 8.7.
In general, there are three main methods to reduce GHG emissions from buildings: (1) reducing energy use through increased efficiency, (2) electrifying building appliances, and (3) increasing use of low-carbon fuels. Implicit in this is the decarbonization of the electricity supply. Supplying clean or zero emissions electricity to all-electric appliances not only reduces emissions at the power plant but also in the building. There are no CAP measures related to use of low-carbon fuels in buildings; therefore, we provide only limited analysis of this policy category.
The policy categories and subcategories related to decarbonize buildings will be the organizing framework for the following sections (Figure 8.31). We evaluate various aspects of each of these, including the legal authority of local jurisdictions to act; existing local commitments in CAPs, including analysis on the frequency and distribution of measures across all adopted and pending CAPs and the relative GHG contribution of measures; opportunities for additional local action; and opportunities for regional collaboration.
Policy Category Policy Subcategory
Electrification Electrify Select End-Uses
All-Electric
Energy Efficiency Audit, Benchmarking, Disclosure
Implement Efficiency Improvement(s)
Low Carbon Fuels TBD
Figure 8.31 Policy Categories within the Decarbonize Buildings Pathway
8.6.1 Summary of Findings
Table 8.23 presents a summary of key takeaways for the decarbonizing buildings pathway.

360
Table 8.23. Summary of Key Takeaways for the Decarbonize Buildings Pathway
Policy Category Key Takeaways
Energy Efficiency
All adopted and pending CAPs have related measures; relatively low GHG reductions in CAPs; least regret opportunity for more jurisdictions to exercise existing authority to adopt reach codes for new construction, alteration, and addition projects; need to reduce energy use in existing buildings; GHG impact of energy efficiency declines as the electricity supply approaches 100% carbon free and appliances are electrified; full authority to act is not exercised in the region.
Electrification
Relatively few CAPs with measures to electrify buildings; low GHG impacts in CAPs; least regret opportunity for reach codes for new construction, alteration, and addition projects; need to electrify existing buildings; existing authority provides multiple paths to electrify new and existing buildings; full authority to act is not exercised in the region.
Low Carbon Fuels
No CAP measures use low-carbon fuels in buildings; limited analysis completed; additional research needed; there is existing authority to act in this regard but uncertainty exists; the extent of authority is untested and legal risk is dependent on action taken; full authority to act is not exercised in the region.
Key Findings of Analysis This section summarizes results of the review of authority to act and the comparative and aggregated analyses of CAPs.
● Authority Exists to Regulate GHG Emissions from Building End-Uses – The police power and delegated authority to regulate energy end-uses are primary means of implementing building decarbonization. Police power may be exercised to prohibit natural gas plumbing in new buildings, require energy benchmarking outside of Title 20, and/or encourage fuel switching to low- or zero-emission fuels (e.g., renewable natural gas or green hydrogen) through GHG emission performance standards based on energy benchmarking information. Local jurisdictions also act with delegated authority over the built environment to require more stringent Title 24, Part 6 Energy Codes and Part 11 CalGreen Codes, directly regulate criteria pollutant emissions from buildings, or use their procurement authority, including sole source procurement authority for energy conservation, cogeneration, and alternative energy supply projects on public buildings. The California Environmental Quality Act (CEQA) also may allow a lead agency to set a GHG-based threshold of significance for all projects (e.g., carbon neutral or net zero) that decrease building emissions. Local governments are preempted from establishing energy efficiency appliance standards, regulating natural gas supply, transmission, and storage, and high global warming potential refrigerants (e.g., HFCs).

361
● CAPs Have Relatively Few Measures to Electrify Buildings – Only six CAPs include measures related to building electrification. By contrast, all adopted and pending CAPs have measures related to energy efficiency. All building electrification measures focus on new construction projects, with the exception of two CAPs which have measures related to electrifying existing buildings, which focus on electrifying water heating appliances. As noted above, depending on the policy approach related to water heating, federal pre-emption concerns may exist. Based on the relative lack of CAP measures to electrify buildings and the GHG implications as presented in the scenario analysis, the current commitment to electrification in CAPs is insufficient to achieve the level of building equipment electrification contemplated in Chapter 5.
● GHG Impact of Building Decarbonization Measures in CAP is Relatively Low – GHG reductions in CAPs associated with efficiency and electrification are relatively low. Based on our comparative analysis, measures related to efficiency contributed about 7% on average to the local CAP reduction, while electrification contributed about 1%. Based on our scenario analysis, applying the most aggressive CAP policy to every jurisdiction in the region would increase estimated GHG reductions in 2035 from about 40,000 MT CO2e to over 720,000 MT CO2e. The increase would be due mostly to an increase in energy efficiency retrofits. By contrast, a similar application of the best renewable electricity supply policy would reduce GHG emissions by about 1.6 MMT CO2e. It is important to note that GHG reductions from efficiency improvements in electric appliances decline over time as the electric supply approaches 100% carbon-free and more appliances are electrified. However, California is developing dynamic time-dependent electric rates and energy efficiency programs that balance supply and demand to integrate renewable energy and decrease marginal carbon emissions.
● Policies for the Existing Building Stock are Key to Decarbonize Buildings – Decarbonizing existing buildings is an important step in reaching regional emissions targets. Buildings that exist in 2021 will represent more than 80% of the buildings that will exist in 2050. State building energy codes regulate alterations and additions to certain existing buildings, but local policies could further encourage or require energy efficiency and electrification in many other existing buildings. There are many examples of policies to increase energy efficiency in existing buildings, including those to require energy assessments, benchmarking and disclosure of energy use, efficiency improvements, and retrocommissioning or building tune-ups. Many examples of these policies exist in the San Diego region and California. By contrast, there are few policies in California to electrify existing buildings. Most existing policies focus on new construction, alterations, and additions. Consequently, there are almost no policies at the local level to require existing building electrification, though efficiency policies potentially can provide the blueprint for policy development in this area. There are, however, some market barriers to electrification in the existing building stock, including consumer preferences and awareness, upfront cost hurdles, and workforce development needs that would have to be overcome to achieve widespread electrification. Key elements of an integrated strategy to decarbonize existing buildings include education and outreach, financial incentive and financing, and requirements.

362
Opportunities for Further Action The following summarizes key opportunities for further action.
● Decarbonize New Buildings – Local jurisdictions have the authority to adopt local building codes, including reach codes to encourage or require energy efficiency and electrification. Because only four CAPs include at least one measure to require energy efficiency improvements in new buildings and only four have measures related to electrifying new buildings, there is opportunity for more local jurisdictions in the San Diego region to adopt these policies. California has a history of local governments adopting local ordinances to improve energy efficiency, and numerous examples exist in the San Diego region and around California. Ordinances to require electrification are relatively new, though an increasing number of local jurisdictions have adopted local building electrification requirements that go beyond state requirements or have used their police powers to adopt a moratorium on natural gas infrastructure. Given authority to act, the numerous examples around California, and existing support to develop and implement such policies, adopting reach codes is a least regret policy; however, this opportunity may be limited in its potential to reduce GHG emissions due to regular updates to the State building energy code.
● Local Governments Can Decarbonize Municipal Facilities – Just over half of CAPs have measures to improve efficiency at municipal facilities, and none have measures to electrify these facilities. The federal government has recently adopted a commitment to achieve net zero emissions in federal facilities. This is a least regret policy as implementing cost effective measures helps reduce operating costs and can model the type of actions local governments may encourage homes and businesses to do.
● Regional Collaboration to Support Building Decarbonization – Given the clear, existing authority that local governments have to adopt local building codes (e.g., reach codes) for new buildings and the existing knowledge and experience in the region and statewide, developing a regional approach to support reach code development, adoption, and implementation is a least regret approach. A similar but more expanded program could be developed to support efforts to decarbonize the existing building stock, including analyzing existing building stock, convening an existing building decarbonization task force, developing a regional strategy to decarbonize the existing building stock, and a policy development support program similar to the reach code example.
● Assess Social Equity Considerations of Building Decarbonization Policies – In the context of building decarbonization, there are several aspects of equity to consider, including the high proportion of renters in communities of concern, the relative lack of data and analysis related to equity and building-related policies, and potential cost implications of building decarbonization policies, particularly electrification. Additional work would be needed to develop the capacity and tools to understand and address the equity implications of building and other decarbonization policies in the San Diego region.
363
8.6.2 Summary of Authority in the Decarbonize Buildings Pathway
At the local level, the police power and delegated authority to regulate energy end-uses are the primary means of implementing building decarbonization actions. Local jurisdictions may use their police power to prohibit the installation of natural gas plumbing in new buildings,i identify buildings or neighborhoods that are in need of natural gas infrastructure replacement to electrify (e.g., natural gas infrastructure pruning), require energy benchmarking for buildings not covered by Title 20 Benchmarking requirements,ii and/or encourage fuel switching to low- or zero-emission fuels (e.g., renewable natural gas or green hydrogen) through GHG emission performance standards based on energy benchmarking information and disclosure. Local jurisdictions act with delegated authority to require more stringent Title 24, Part 6 Energy Codes, Part 11 CALGreen Codes, and procurement authority, including sole source procurement authority for energy conservation, cogeneration, and alternative energy supply projects on public buildings.iii Local governments could evaluate how to align local requirements and actions with state policy and programs to decrease costs related to building decarbonization.
Energy Efficiency and Building Material Conservation and Resource Efficiency Using delegated authority, local jurisdictions may adopt more stringent building code standards that address energy efficiency, water conservation, building material conservation, or resource efficiency based on GHG requirements (e.g., material carbon intensity). Where the requirement addresses energy consumption, the adopted local code (e.g., all-electric reach codes or building performance standards) must be at least as energy efficient as the state codes, cost-effective,iv and submitted to the CEC to review for compliance with state law.v In all cases where Title 24 is amended, the standards must be submitted to the Building Standards Commission with the findings for local climatic, geological, or topical conditions that authorize the change to Title 24. In terms of police authority, the full extent of local jurisdiction police authority is unknown and largely untested. Additional research is required to vet other local actions.
Federal preemption exists over setting energy efficiency standards for covered productsvi (e.g., appliances) under EPCA with limited exception for new construction.vii Local jurisdictions are subject to state preemption in the form of Title 20 appliance standards that regulate many appliances not preempted by the EPCA and the triennially updated Title 24 building standards that the CEC adopts.
CEQA Environmental Impact Mitigation Authority CEQA offers another means to address emissions from the built environment. A lead agency acts with discretion to determine whether an adverse environmental effect identified in an environmental impact
i Note: the City of Berkeley’s prohibition is currently on appeal to the Ninth Circuit Court of Appeals (CRA v. City of Berkeley, No. 21-16278, (9th Cir.), filed August 5, 2021); See CRA v. City of Berkeley, Docket No. 4:19-cv-07668, Judgment, Document 76 (N.D. Cal. Nov. 21, 2019) which dismissed with prejudice cause of action for EPCA preemption and dismissed without prejudice California state law preemption cause of action. ii See AB 802 (Williams, Chapter 590, Statutes of 2015); 20 C.C.R. § 1680 et seq. (2021); see also City of San Diego Building Benchmarking Ordinance adopted pursuant to 20 C.C.R. § 1684 (2021). iii See Government Code § 4217.10 et seq. iv See to Public Resources Code § 25402.1(h)(2) and Health & Safety Code §§ 17958.5 & 17958.7. v See Public Resources Code § 25402.1 (h)(2); see Title 24, Part 6, Section 10-106 (2021). vi 42 U.S.C. § 6295; See also 10 CFR Parts 430, 431, & 429. vii 42 U.S.C. §§ 6297(c) & 6297(f)(3); See also 42 U.S.C. §§ 6291 et seq. (Part A-Energy Conservation Program for Consumer Products Other Than Automobiles); 42 U.S.C. §§ 6311 et seq. (Part A-1-Certain Industrial Equipment).
364
report (EIR) should be classified as "significant" or "less than significant."i A lead agency may adopt and publish a threshold of significance that sets a high threshold for GHG emissions, which could include requiring all projects to be carbon neutral or zero net carbon,ii and must be based on scientific and factual data to the extent possibleiii to meet the substantial evidence standard.iv This is limited by existing implied or expressed authority to impose mitigation measures on a project.v Mitigation measures cannot be legally infeasiblevi — meaning that they may not be beyond the power conferred on lead and responsible agencies — and are also subject to express limitations, including limits on reducing housing units.vii
Direct Regulation of Building GHG Emissions Direct regulation of GHG emissions, not currently regulated by Cap-and-Trade, may provide additional means to reduce emissions, but uncertainty exists around authority.viii It may be possible to create GHG performance standards for buildings.ix Under existing authority, it may be possible to directly regulate building and appliance oxides of nitrogen (NOx) emissions from natural gas.x Finally, it is uncertain whether existing tax or fee authority may be used to regulate GHGs.xi
Fuel Switching and Emissions related to End-Uses Police power authority may be used to require fuel switching to low or zero-carbon sources through prohibitions on the installation of certain energy infrastructure (e.g., natural gas plumbing) in buildings. Police power may take the form of adopting an ordinance that expressly prohibits natural gas plumbing without either amending Title 24, Part 6, changing minimum efficiency standards for covered products under the EPCA, or requiring the installation of specific appliances or systems as a condition of approval.xii There is currently an effort to preempt local jurisdiction police power under the EPCA. The City of Berkeley’s Ordinance No. 7,672-N.S. adopted on July 16, 2019, used police power without amending Title 24 to prohibit natural gas plumbing in new construction. This ordinance survived the preemption challenge in federal district court and is now on appeal in the Ninth Circuit.xiii
i 14 C.C.R. § 15064(b)(1) (2021). ii 14 C.C.R. § 15064.7(b) (2021); see also definition of “threshold of significance” under 14 CCR § 15064.7(a) (2021). iii 14 C.C.R. § 15064(b)(1) (2021). iv Mission Bay Alliance v. Office of Community Inv. & Infrastructure, 6 Cal. App. 5th 160, 206 (2016). v See 14 C.C.R. § 15040(d)–(d). vi See Public Resources Code § 21004; See 14 C.C.R. § 15040. vii See Public Resources Code § 21159.26; See 14 C.C.R. § 15092(c). viii 17 C.C.R. §§ 95811 (a)–(b) & 95812(c). ix See Health & Safety Code §§ 17958.5, 17958.7, and 18941.5(b); See California Public Resources Code § 25402.10 (d)(2)(F) & 20 C.C.R. § 1684; See City of Berkeley Municipal Code 19.81 – the Building Energy Savings Ordinance (BESO) (2021). x See Health & Safety Code §§ 39002, 39013, 39037, and 41508. xi See Cal. Const. art. XIII C & D. xii See City of Berkeley Ordinance No. 7,672-N.S. (Adopted July 16, 2019), City of Morgan Hill Ordinance No. 5906 (adopted October 23, 2019), City of San Jose Ordinance No. 30330 (adopted September 17, 2019), and City of Santa Cruz Ordinance No. 2020-06 (adopted April 14, 2020). xiii See California Restaurant Ass. v. City of Berkeley, Order Granting in Part and Denying in Part Motion to Dismiss, Document 75, Case No. 4:19-cv-07668-YGR (July 6, 2021); See See California Restaurant Ass. v. City of Berkeley, Case No. 21-16278 (9th Cir.), filed Aug. 5, 2021.

365
Local jurisdictions also act with authority to develop local hydrogen production and infrastructure through land use, constitutional authority to provide municipal services under California Constitution Article XI, § 9, franchise agreement authority, and police power authority. The CPUC would regulate intrastate hydrogen pipelines as a public utility if not owned by a municipal-owned utility.i End-uses that depend on ozone-depleting substances (ODS) and ODS substitutes with high-GWP gases, particularly HFC refrigerants, are subject to federal and state regulations that ban, limit or phase out the regulated substance offering an opportunity to act locally to accelerate and augment these regulations.ii Finally, there is an opportunity to engage in the legislativeiii and regulatory (CPUC) process on the future of natural gas infrastructure.iv
8.6.3 GHG Impacts of CAP Measures in the Decarbonize Buildings Pathway
This section summarizes the GHG impacts from CAP measures related to building decarbonization, including those from the comparative analysis and the scenario analysis of GHG Impacts.
Comparative Analysis for the Decarbonize Buildings Pathway For this analysis, we compare GHG impacts across CAPs. Based on the comparative analysis, CAP measures in the Decarbonize Buildings Pathway account for between 0% and 29% of local reductions, with an average across all CAPs of about 6% (Figure 8.32).
A further breakdown of CAP building decarbonization measures from the comparative analysis shows the number of jurisdictions with one or more CAP measures or supporting action related to each of the three-building decarbonization policy categories and the associated average GHG contribution to the local CAP GHG reduction (Figure 8.35). The entire pathway contributes about 6% to local reductions, with nearly all coming from energy efficiency measures. All CAPs have measures related to energy efficiency, and they account for between less than 1% to almost 30% of the GHG reductions from local measures in CAPs, with an average of about 7%. Only six CAPs have building electrification measures, with an average contribution of about 1% to local GHG reductions. No CAPs in the San Diego region have measures related to increasing use of low-carbon fuels in buildings; therefore, we do not provide a detailed assessment of this policy category.
i See Public Utilities Code § 216. ii See 40 CFR Part 82; See 17 C.C.R. §§ 95380–95398; See 17 C.C.R. §§ 95371–95377; See California Air Resources Board, Prohibitions on Use of Certain Hydrofluorocarbons in Stationary Refrigeration, Chillers, Aerosols-Propellants, and Foam End-Uses Regulation, Last Visited January 5, 2022: https://ww2.arb.ca.gov/rulemaking/2020/hfc2020. iii AB 2313 (Williams, Chapter 571, Statutes of 2016); SB 1440 (Hueso, Chapter 739, Statutes of 2018); see also AB 1900 (Gatto, Chapter 602, Statutes of 2012); See also SB 1440 (Hueso, Chapter 739, Statutes of 2018); AB 3163 (Salas, Chapter 358, Statutes of 2020); See AB 1496 (Thurmond, Chapter 604, Statutes of 2015), SB 1371 (Leno, Chapter 525, Statutes of 2014) and SB 887 (Pavley, Chapter 673, Statutes of 2016), SB 605 (Lara, Chapter 523, Statutes of 2014), SB 1383 (Lara, Chapter 395, Statutes of 2016), and AB 1496 (Thurmond, Chapter 604, Statutes of 2015); See SB 1371 (Leno, Chapter 525, Statutes of 2014). iv See CPUC Rulemaking R.18-04-019, Order Institution Rulemaking to Consider Strategies and Guidance for Climate Change Adaptation; See CPUC Rulemaking R.18-12-005, Order Instituting Rulemaking to Examine Electric Utility De-Energization of Power Lines in Dangerous Conditions; See CPUC Rulemaking R. 18-10-007, Order Instituting Rulemaking too Implement Electric Utility Wildfire Mitigation Plans Pursuant to SB 901 (2018); See CPUC Rulemaking R. 20-01-007, Order Instituting Rulemaking to Establish Policies, Processes, and Rules to Ensure Safe and Reliable Gas Systems in California and Perform Long-Term Gas System Planning.
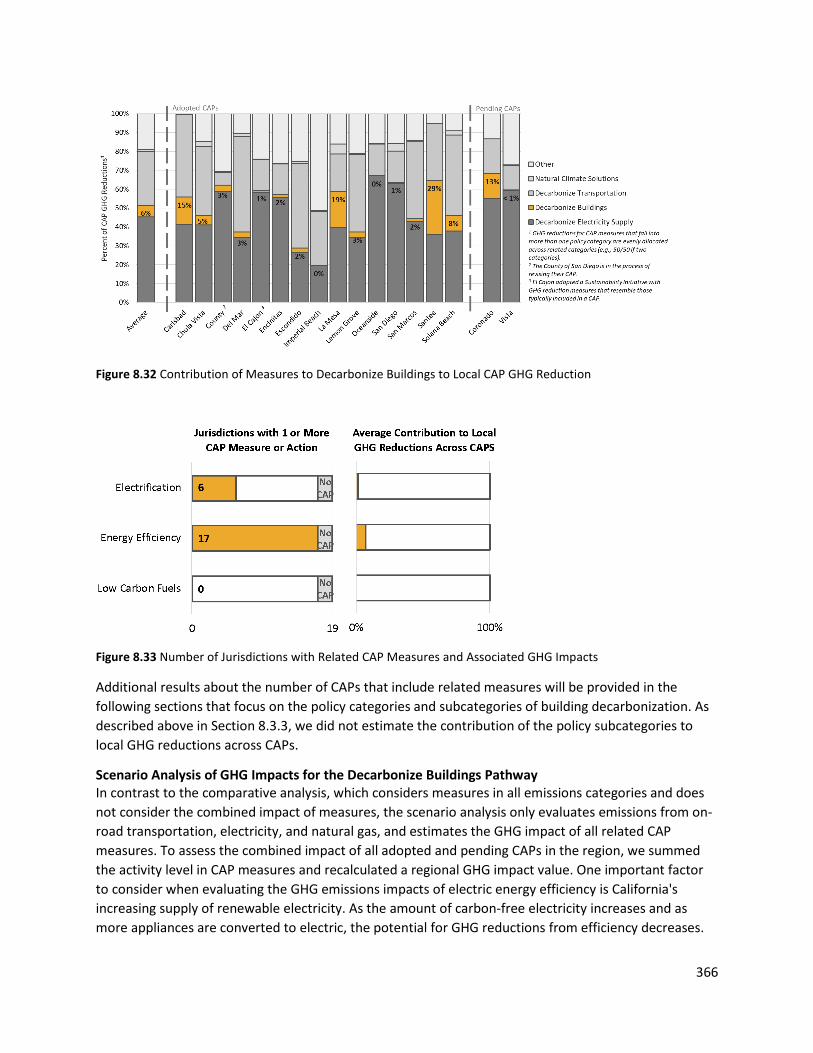
366
Figure 8.32 Contribution of Measures to Decarbonize Buildings to Local CAP GHG Reduction
Figure 8.33 Number of Jurisdictions with Related CAP Measures and Associated GHG Impacts
Additional results about the number of CAPs that include related measures will be provided in the following sections that focus on the policy categories and subcategories of building decarbonization. As described above in Section 8.3.3, we did not estimate the contribution of the policy subcategories to local GHG reductions across CAPs.
Scenario Analysis of GHG Impacts for the Decarbonize Buildings Pathway In contrast to the comparative analysis, which considers measures in all emissions categories and does not consider the combined impact of measures, the scenario analysis only evaluates emissions from on-road transportation, electricity, and natural gas, and estimates the GHG impact of all related CAP measures. To assess the combined impact of all adopted and pending CAPs in the region, we summed the activity level in CAP measures and recalculated a regional GHG impact value. One important factor to consider when evaluating the GHG emissions impacts of electric energy efficiency is California's increasing supply of renewable electricity. As the amount of carbon-free electricity increases and as more appliances are converted to electric, the potential for GHG reductions from efficiency decreases.

367
Nonetheless, as noted above, efficiency is important during the transition to electrified buildings both from GHG impact and cost perspectives.i
Figure 8.34 shows the GHG reduction from CAP measures associated with building decarbonization. The overall GHG impact is relatively small, about 0.05 MMT CO2e. Over 90% of the reductions would result from energy efficiency measures and 6% from building electrification. Note that the draft City of San Diego CAP is not included in this analysis.
Figure 8.34 Emissions Reduced from Decarbonize Buildings Pathway Policies in CAPs in the San Diego Region
Table 8.24 provides a breakdown of the GHG reductions from energy efficiency based on our scenario analysis. Energy efficiency improvements in existing nonresidential buildings represent 51% of the reductions in this pathway. Residential energy retrofits and water heater retrofits represent 16% and 25%, respectively. The relatively small impact of building electrification in Table 8.24 represents what would be expected from residential new construction measures in CAPs.
i Berg, W., E. Cooper, and M. Molina. 2021. Meeting State Climate Goals: Energy Efficiency Will Be Critical. Washington, DC: American Council for an Energy-Efficient Economy. https://www.aceee.org/research-report/u2104.

368
Table 8.24 Emissions Reduced from Decarbonize Buildings Pathway Current CAP Commitment Scenario
Decarbonization Pathway
Policy Category
Policy Subcategory
GHG Emissions Reduced in 2035
(MT CO2e) Distribution
within Pathway
Decarbonize Buildings
Electrification Residential New-Construction Electrification
3,207 8%
Energy Efficiency
Residential Energy Retrofits 6,421 16%
Non-residential Energy Retrofits 20,294 51%
Water Heater Retrofits 9,758 25%
Total: 37,954 100%
Best CAP Commitments Scenario for Building Decarbonization The Best CAP Commitment Scenario applies the CAP measure with the highest impact to activity level and emissions to all jurisdictions in the region regardless of whether they have an adopted or pending CAP. The GHG reduction from measures related to building decarbonization in this scenario (0.7 MMT CO2e) are significantly higher than what would result from the current CAP commitments (0.04 MMT CO2e), though still relatively low when compared to other decarbonization pathways. For example, increasing grid supply of carbon-free electricity would reduce GHG emissions by 1.3 MMT CO2e in the Current CAP Scenario and 1.6 MMT CO2e in the Best Cap Commitment Scenario. The proportion of GHG reductions from energy efficiency would decline to 77%, and those from electrification would increase to 23%.
Figure 8.35 Emissions Reduced from Best Building Decarbonization Policies Applied Regionwide
Table 8.25 provides a breakdown of the GHG reductions from energy efficiency by policy subcategory. Efficiency improvements in existing residential buildings represent 37% of the reductions in this pathway. Residential energy retrofits and water heater retrofits reduce emissions by 23% and 16%, respectively.

369
Table 8.25 Emissions Reduced from Best Building Decarbonization Policies Applied Regionwide
Policy Group Policy
Category Policy Subcategory
GHG Emissions Reduced in 2035
(MT CO2e) Distribution
within Pathway
Policy Group 2: Decarbonize
Buildings
Electrification Residential New-Construction Electrification
166,298 23%
Energy Efficiency
Residential Energy Retrofits 269,074 37%
Non-residential Energy Retrofits 164,672 23%
Residential Water Heater Retrofits 116,645 16%
Non-residential Solar Water Heater Retrofits
937 0.1%
Total: 717,626 100%
Table 8.26 compares the impact to regional electricity and natural gas use that commitments related to building decarbonization would have and those expected from the Best CAP Commitment Scenario. Overall, measures in adopted and pending CAPs included in this analysis would reduce regional electricity use by less than one percent and natural gas use by about one percent. The Best CAP Commitment Scenario would reduce electric use by 12% and natural gas use by 19%. By comparison, estimates in Chapter 5 under the central scenario, natural gas use associated with buildings should reduce by about 50% between 2019 and 2035. Based on this scenario, there would be a significant gap in the level of building decarbonization needed to be on track to achieve the levels contemplated in Chapter 5.

370
Table 8.26 Impact of Best CAP Commitment in Building Decarbonization on Regional Energy Use
Activity Policy
Category Policy Subcategory
Reduction in Activity Level1
Current CAP Commitment
Scenario
Best CAP Commitment
Scenario
Electricity Use
Energy Efficiency
Residential Energy Retrofits 0.01% 5%
Non-residential Energy Retrofits 0.01% 5%
Residential Water Heater Retrofits
0.0003%
2%
Non-residential Solar Water Heater Retrofits
0.02%
Natural Gas Use
Electrification Residential New-Construction Electrification
0.1% 5%
Energy Efficiency
Residential Energy Retrofits 0.5% 14%
Non-residential Energy Retrofits 0.3% 7%
Residential Water Heater Retrofits
0.5%
4%
Non-residential Solar Water Heater Retrofits
3%
1 Reduction in activity level (kWh electricity use or therms natural gas use) of electricity and natural gas demand, for year 2035
8.6.4 Increase Energy Efficiency
Energy efficiency has been the foundation of California’s energy policy since the 1970s. In the context of building decarbonization, energy efficiency can reduce total energy needed by improving building envelope performance (e.g., insulation, windows, weatherization, etc.) and appliance efficiency, particularly natural gas appliances in the short run and electric appliances in the medium and long term; GHG emissions from fossil-fueled and electric appliances in the short run while electrification transition occurs (in the short-run the emissions rate of electricity is higher, so energy efficiency can have a short run impact on emissions); and, energy costs, which is important for communities of concern for whom energy costs can represent a higher portion of income.
CAP Measures Related to Energy Efficiency in the San Diego Region In the context of CAPs, energy efficiency related measures can be broken into two categories: (1) measures to encourage or require efficiency improvements, and (2) measures to encourage or require building owners to audit, benchmark, and disclose information about building energy use. Each of these can be broken down further by construction (e.g., new) and building types (e.g., residential). We use the frequency of CAP measures and the overall GHG contribution to local reductions in CAPs to assess potential opportunities for additional local actions.

371
Much of the building decarbonization analysis in Chapter 5 focuses on electrification, though as noted above, energy efficiency can continue to play a role in cost containment, an important equity consideration. Also, building-related measures in CAPs focus mainly on efficiency and many of the same considerations for building energy efficiency policies are relevant to building electrification.
Policies to Encourage or Require Energy Efficiency Improvements Based on our comparative analysis of CAPs in the San Diego region, energy efficiency accounts for between about 1% and 30% of total local reductions in CAPs in 2035, with an average of about 7%. CAPs include a range of quantified measures and supporting efforts to increase energy efficiency in buildings. Table 8.27 summarizes the number of CAPs in the region that include at least one quantified measure related to implementing energy efficiency improvements. It shows which implementation mechanisms were used and distinguishes building (e.g., residential and nonresidential) and construction (e.g., new and existing) types. This view helps to understand how often related measures are included in CAPs across various categories, which can help assess whether there is an opportunity for further local action. Table 8.28 provides examples of the types of measures included in the implementation mechanisms.
Table 8.27 Number of CAPs with at Least One Measure to Implement Energy Efficiency
Implementation Mechanism Viewing the results in Table 8.27 vertically can help understand the distribution of CAPs across implementation mechanisms. In this case, education, outreach, and coordination appear to be the approach included in most CAPs, followed by requirements and incentives. In general, for nearly all policy categories associated with building decarbonization, the highest number of CAPs with related measures fall within these three implementation mechanisms.
Education and outreach measures include those to raise awareness about energy efficiency and to encourage a range of strategies, including water heater efficiency and cool roofs. Examples of measures related to incentives include expediting permits or waiving permit fees for increased energy efficiency, and providing financial incentives, and increasing financing opportunities. And energy efficiency measures also can require energy efficiency improvements at specified intervention points, like time of sale or major remodel.
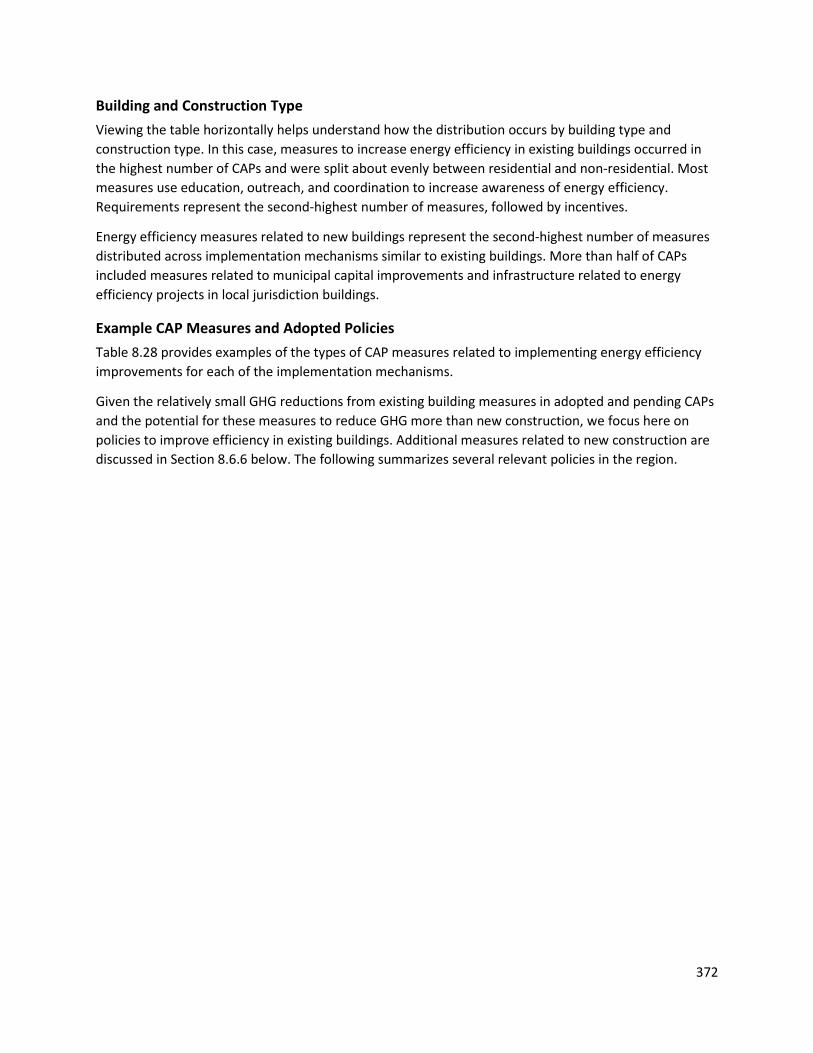
372
Building and Construction Type Viewing the table horizontally helps understand how the distribution occurs by building type and construction type. In this case, measures to increase energy efficiency in existing buildings occurred in the highest number of CAPs and were split about evenly between residential and non-residential. Most measures use education, outreach, and coordination to increase awareness of energy efficiency. Requirements represent the second-highest number of measures, followed by incentives.
Energy efficiency measures related to new buildings represent the second-highest number of measures distributed across implementation mechanisms similar to existing buildings. More than half of CAPs included measures related to municipal capital improvements and infrastructure related to energy efficiency projects in local jurisdiction buildings.
Example CAP Measures and Adopted Policies Table 8.28 provides examples of the types of CAP measures related to implementing energy efficiency improvements for each of the implementation mechanisms.
Given the relatively small GHG reductions from existing building measures in adopted and pending CAPs and the potential for these measures to reduce GHG more than new construction, we focus here on policies to improve efficiency in existing buildings. Additional measures related to new construction are discussed in Section 8.6.6 below. The following summarizes several relevant policies in the region.
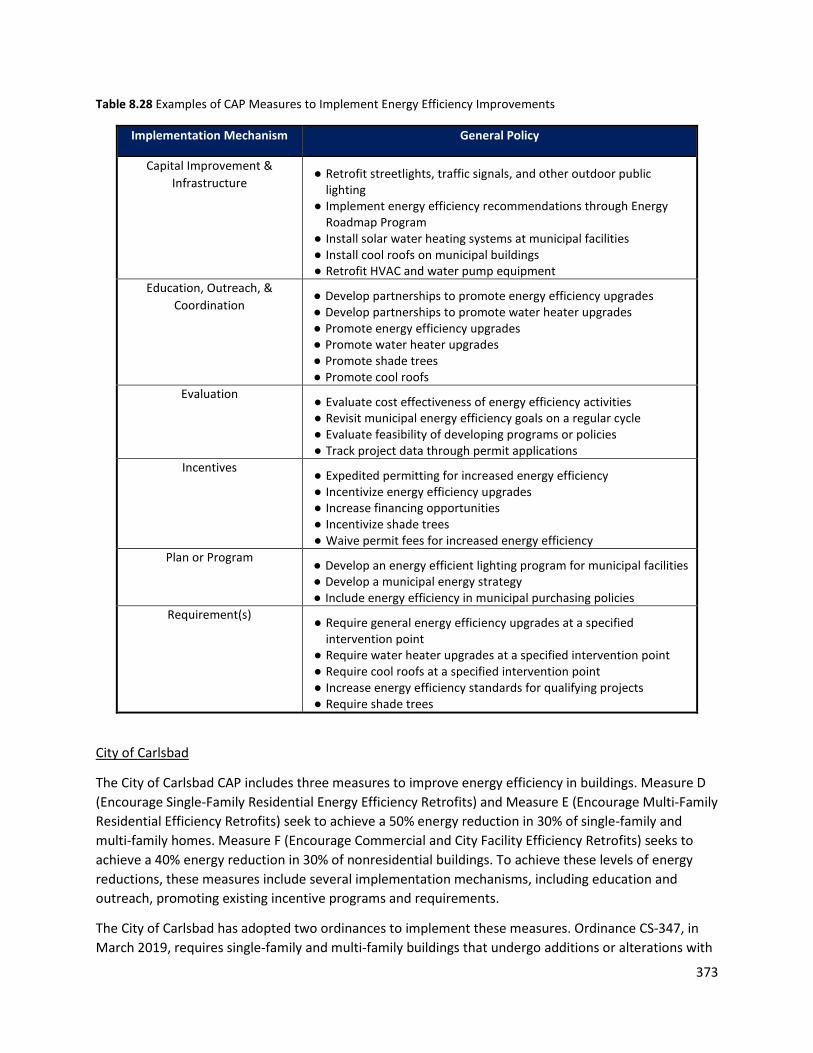
373
Table 8.28 Examples of CAP Measures to Implement Energy Efficiency Improvements
Implementation Mechanism General Policy
Capital Improvement & Infrastructure
● Retrofit streetlights, traffic signals, and other outdoor public lighting
● Implement energy efficiency recommendations through Energy Roadmap Program
● Install solar water heating systems at municipal facilities ● Install cool roofs on municipal buildings ● Retrofit HVAC and water pump equipment
Education, Outreach, & Coordination
● Develop partnerships to promote energy efficiency upgrades ● Develop partnerships to promote water heater upgrades ● Promote energy efficiency upgrades ● Promote water heater upgrades ● Promote shade trees ● Promote cool roofs
Evaluation ● Evaluate cost effectiveness of energy efficiency activities ● Revisit municipal energy efficiency goals on a regular cycle ● Evaluate feasibility of developing programs or policies ● Track project data through permit applications
Incentives ● Expedited permitting for increased energy efficiency ● Incentivize energy efficiency upgrades ● Increase financing opportunities ● Incentivize shade trees ● Waive permit fees for increased energy efficiency
Plan or Program ● Develop an energy efficient lighting program for municipal facilities ● Develop a municipal energy strategy ● Include energy efficiency in municipal purchasing policies
Requirement(s) ● Require general energy efficiency upgrades at a specified intervention point
● Require water heater upgrades at a specified intervention point ● Require cool roofs at a specified intervention point ● Increase energy efficiency standards for qualifying projects ● Require shade trees
City of Carlsbad
The City of Carlsbad CAP includes three measures to improve energy efficiency in buildings. Measure D (Encourage Single-Family Residential Energy Efficiency Retrofits) and Measure E (Encourage Multi-Family Residential Efficiency Retrofits) seek to achieve a 50% energy reduction in 30% of single-family and multi-family homes. Measure F (Encourage Commercial and City Facility Efficiency Retrofits) seeks to achieve a 40% energy reduction in 30% of nonresidential buildings. To achieve these levels of energy reductions, these measures include several implementation mechanisms, including education and outreach, promoting existing incentive programs and requirements.
The City of Carlsbad has adopted two ordinances to implement these measures. Ordinance CS-347, in March 2019, requires single-family and multi-family buildings that undergo additions or alterations with

374
a building permit valuation greater than $60,000 to complete specified energy efficiency improvements.i Compliance requirements are determined by the type (e.g., single-family) and building age and include actions related to duct sealing, attic insulation, cool roofs, and lighting. Note the ordinance also includes provisions related to water heating in nonresidential buildings, which are included in the section below on building electrification.
City of Chula Vista
Objective 3.3 (Energy Efficiency Upgrades) of the City of Chula Vista CAP, specifically Strategy 3, seeks to require energy-savings retrofits in existing buildings at a specific point in time. To implement this measure, in March 2021, the City of Chula Vista adopted Ordinance No. 3498 to require benchmarking and energy efficiency improvements in certain multi-family and non-residential buildings.ii More information on the Benchmarking and Disclosure portion of the ordinance is in the section below on this topic.
Starting 2023 for buildings with a gross floor area (GFA) of at least 50,000 SF and 2026 for buildings with GFA 20,000 – 49,999 SF, the ordinance also requires certain multi-family and nonresidential buildings to meet building performance standards every five years. Buildings that do not meet the standard must achieve performance targets based on Energy Star scores or the site’s weather normalized energy use intensity (EUI-WN) or to complete both minimum building energy improvements every 10 years based on Energy Star scores or EUI-WN and a building audit and retro-commissioning. Multi-family buildings constructed before 2006 for rental tenant spaces where the tenant bears utility costs also have to complete the minimum number of prescriptive measures.
City of Encinitas
The City of Encinitas CAP includes two measures related to building energy efficiency: BE-1 (Adopt a Residential Energy Efficiency Ordinance) and BE-3 (Adopt Higher Energy Efficiency Standards for Commercial Buildings). To implement these measures, the City of Encinitas adopted a comprehensive Green Building Ordinance 2021-13.iii Several provisions require energy efficiency improvements.
Residential buildings undergoing additions or alterations with a permit valuation of $50,000 or higher are required to complete specified energy efficiency improvements. Similar to the City of Carlsbad’s ordinance, compliance requirements depend on building type (e.g., single-family) and age of the building and include actions related to duct sealing, attic insulation, cool roofs, lighting, and water heating.
i California Energy Commission. Docket Number 16-BSTD-07, April 22, 2019. Local Ordinance Application – 2016 Standards. TN# 227821. Carlsbad Ordinance CS347 Full Text. Available at https://efiling.energy.ca.gov/GetDocument.aspx?tn=227821&DocumentContentId=59197. ii City of Chula Vista, Building Energy saving Ordinance webpage. Available at https://www.chulavistaca.gov/departments/clean/benchmarking. iii City of Encinitas. Green Building Ordinances webpage. Available at https://encinitasca.gov/Government/Departments/City-Manager/Environmental-Services/Climate-Action-Plan/Green-Building-Ordinances.

375
Existing non-residential, certain multi-family residential, and hotel/motel building additions of 1,000 square feet or alterations with a permit valuation of at least $200,000 are required to complete energy improvements related to outdoor lighting, water heating, and daylighting.
Audit, Benchmark, and Disclosure Policies Policies to encourage or require energy audits, benchmarking, and disclosure policies are intended to provide data about energy use to raise awareness and to help develop and implement energy efficiency improvements. Auditing policies encourage building owners to complete comprehensive energy assessments that identify opportunities to improve energy and water efficiency.i Benchmarking is a process of reporting energy use, typically through the ENERGY STAR Portfolio Manager site.ii Once collected, building energy usage data can be disclosed, either publicly through a governmental website or directly to prospective tenants or buyers. In general, the goal of these policies is to increase the amount and availability of information and data about building energy consumption to form the basis for further action.
Table 8.29 presents the number of CAPs that have at least one measure related to audit, benchmark, and disclosure policies. Relatively few CAPs include measures related to these policies, and nearly all of them are associated with existing buildings. While new buildings can disclose estimated energy use through energy ratings similar to fuel efficiency ratings on new cars, it is more common in existing buildings, particularly nonresidential buildings.
Based on the information presented in Table 8.29, there appears to be an opportunity to increase the number of CAP measures related to audit, benchmark, and disclosure policies in existing buildings. Also, while municipal buildings represent a small portion of energy use and emissions in a local jurisdiction, action to improve efficiency can provide an opportunity to model actions that could be needed in the private sector. There is also a potential opportunity for local jurisdictions to assess energy use at municipal facilities. As with policies to implement energy efficiency improvements, many aspects of policies to encourage or related to audit, benchmark, and disclosure can be transferred to building electrification strategies.
i Pacific Northwest National Laboratory. September 2011. A guide to Energy Audits. Available at https://www.pnnl.gov/main/publications/external/technical_reports/PNNL-20956.pdf. ii U.S. Environmental Protection Agency Energy Star Portfolio Manager webpage. Available at https://www.energystar.gov/buildings/benchmark.

376
Table 8.29 Summary of CAP Measures Related to Energy Audit, Benchmark, and Disclosure
GHG impact of CAP Measures Audit, benchmark, and disclosure policies can be considered a foundational step in the efficiency process but alone may not result in notable energy reductions. As such, associated GHG reductions are likely relatively low. Evaluation of previous policies shows general energy impacts of these policies. For example, a comprehensive review of nonresidential benchmarking and transparency policies in 2017 found “3 to 8 percent reductions in gross energy consumption or energy use intensity over a two- to four-year period of [benchmarking and transparency] policy implementation.”i For auditing policies that do not require efficiency improvements, the number of building owners that complete actions and the energy impact of those actions are important considerations in determining the impact of these policies.
The GHG impacts of these policies were not considered in the scenario analysis presented in Section 8.4. Only five CAPs quantified the GHG impacts of these policies. Many CAP measures related to auditing, benchmarking, and disclosure are supporting actions.
Example CAP Measures and Policies Table 8.30 provides examples of the types of policies related to the assessment and disclosure of energy use information for each of the implementation mechanisms. Measures related to municipal buildings generally commit to conducting audits of municipal facilities. Education and outreach efforts seek to increase awareness about the process of audits, benchmarking, and information disclosure. In this context, incentives reduce or eliminate the cost of the energy audit or benchmarking process. Required action includes audits or benchmarking for certain buildings (e.g., undergoing additions or alterations) or intervention points (e.g., time of sale).
i N. Mims, et al., 2017. Evaluation of U.S. Building Energy Benchmarking and Transparency Programs: Attributes, Impacts, and Best Practices. Energy Analysis and Environmental Impacts Division Lawrence Berkeley National Laboratory.

377
Table 8.30 Examples of CAP Measures Related to Audit, Benchmarking, and Disclosure
Implementation Mechanism General Policy
Capital Improvement & Infrastructure
● Conduct energy audits of municipal buildings
Education, Outreach, & Coordination
● Educate public on energy performance disclosure ● Target outreach to specific communities ● Develop partnerships to enroll users in benchmarking programs ● Promote information disclosure tools and resources ● Encourage regional partners to provide free energy audits
Evaluation NA
Incentives ● Offer free home evaluations ● Develop an incentive program for building benchmarking and
disclosure ● Provide free retrofit evaluations
Plan or Program NA
Requirement(s) ● Require energy audits for additions and/or alterations to existing residential and/or nonresidential units
● Require public disclosure at a specific point in time (e.g., time of sale)
There are relatively few examples of measures from adopted or pending CAPs related to encouraging or requiring energy audits, benchmarking, and disclosure. California adopted a benchmarking requirement with AB 802 (2015), which requires certain buildings to report energy use data. Local ordinances are implemented in this context and can build on existing requirements.
Chula Vista Energy Efficiency Ordinance
Objective 3.1 (Energy Education & Enforcement) of the City of Chula Vista CAP includes Strategy 1 (Expand education targeting key community segments and facilitate energy performance disclosure). Several actions are contemplated to implement this measure, including:
● Action 3.1.1 A: Offer free evaluations through Free Resource & Energy Business Energy Evaluations (FREBE) & Home Upgrade, Carbon Downgrade programs
● Action 3.1.1 F: Create local incentives or policies for building benchmarking and public disclosure
● Action 3.3.3 A: Require free energy evaluations for businesses as part of licensing process
● Action 3.3.3 B: Include free retrofit evaluations in Home Upgrade, Carbon Downgrade program

378
In March 2021, the City of Chula Vista adopted Ordinance No. 3498 to require benchmarking and energy efficiency improvements in certain multi-family and non-residential buildings.i Starting in 2022, owners of certain non-residential buildings with a gross floor area (GFA) of at least 20,000 square feet are required to conduct regular benchmarking and to submit data annually via Energy Start Portfolio Manager. The City of Chula will disclose results to the public, and building owners will directly disclose to tenants and buyers.
City of Santee CAP
The City of Santee CAP has several quantified measures related to energy audits. Measure 1.1 (Energy Audits in the Existing Residential Sector) seeks to require energy audits of existing residential units requesting permits for major and minor Modifications. Measure 3.1 (Energy Audits in the Existing Commercial Sector) would require energy audits in existing commercial units requesting permits for minor or major modifications.
8.6.5 Electrify Building End Uses
Building decarbonization requires replacing fossil fuel end uses with electric or low-carbon fuels. Chapter 5 identified the following appliances as candidates for electrification.
Table 8.31 Common Electric Appliances
End Use Electric Appliance Option
Space Heating Air Source Heat Pump
Ground Source Heat Pump
Water Heating Heat Pump Water Heater
On-Demand Electric Water Heater
Cooking Induction Cooktops and Stoves
Laundry Electric Dryers
Heat Pump Dryers
These technologies replace natural gas usage with electricity. Because every fossil-fueled appliance is an emissions source, electrifying building end uses reduces GHG but also other criteria pollutants, both indoors and in the vicinity of the building. As the GHG intensity of electricity declines, the overall amount of GHG emissions associated with these appliances also declines. This reduces direct emissions from building end uses. Electrifying certain appliances is likely to have a relatively large impact on GHG emissions, depending on the amount of natural gas required to operate the appliance. For example, Figure 8.36 illustrates the total residential natural gas end use by appliance within the SDG&E territory.
i City of Chula Vista, Building Energy saving Ordinance webpage. Available at https://www.chulavistaca.gov/departments/clean/benchmarking.
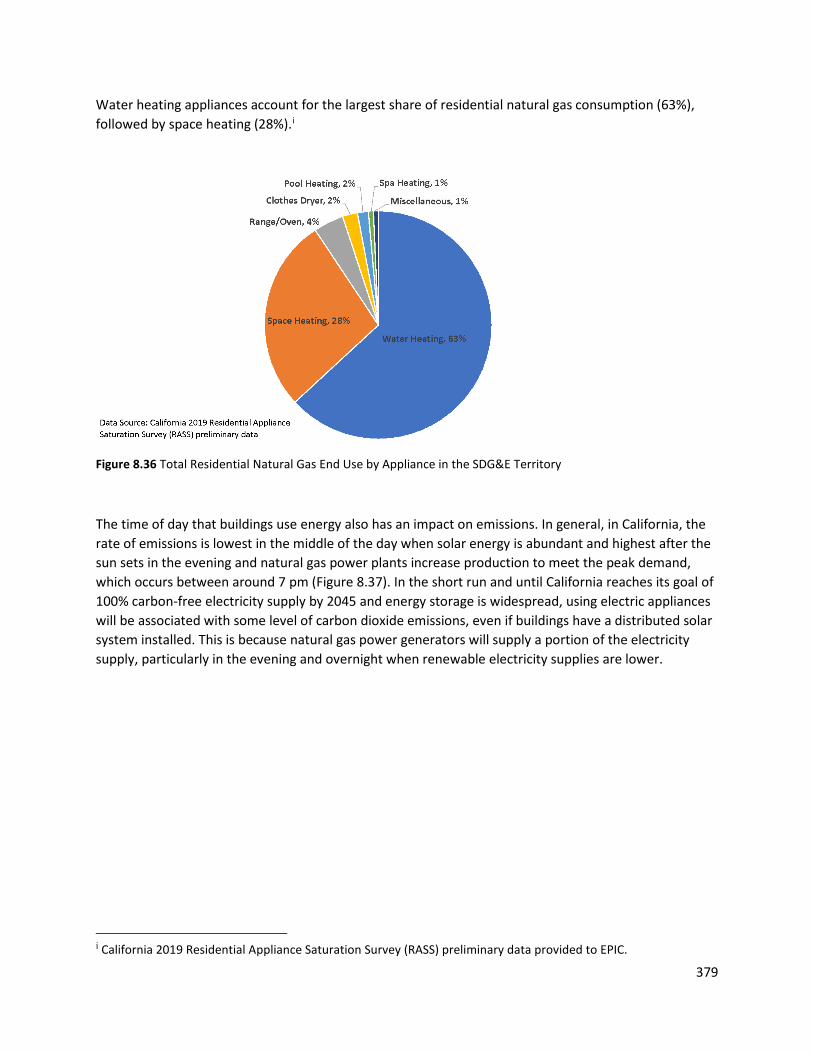
379
Water heating appliances account for the largest share of residential natural gas consumption (63%), followed by space heating (28%).i
Figure 8.36 Total Residential Natural Gas End Use by Appliance in the SDG&E Territory
The time of day that buildings use energy also has an impact on emissions. In general, in California, the rate of emissions is lowest in the middle of the day when solar energy is abundant and highest after the sun sets in the evening and natural gas power plants increase production to meet the peak demand, which occurs between around 7 pm (Figure 8.37). In the short run and until California reaches its goal of 100% carbon-free electricity supply by 2045 and energy storage is widespread, using electric appliances will be associated with some level of carbon dioxide emissions, even if buildings have a distributed solar system installed. This is because natural gas power generators will supply a portion of the electricity supply, particularly in the evening and overnight when renewable electricity supplies are lower.
i California 2019 Residential Appliance Saturation Survey (RASS) preliminary data provided to EPIC.

380
Figure 8.37 Carbon-Dioxide Emissions Rate from CAISO (10-27-21) i
Efforts to electrify buildings have grown rapidly in the past several years, both at the state and local levels. At the state level, building requirements in the Energy Code (Title 24 Part 6) are shifting towards electrification, as seen in the upcoming 2022 standards approved by the CEC in August 2021.ii In addition, beginning January 1, 2023, all new residential construction must be electric-ready and prescriptive requirements for residential water heating set heat pump water heaters as the standard for most climate zones. It is anticipated that state requirements will shift even further towards all-electric requirements for both residential and nonresidential construction in future triennial code updates.
However, there are still opportunities for jurisdictions to go beyond state requirements. Increasingly, cities are adopting ordinances that encourage or require some degree of electrification. But not all electrification ordinances are alike, and requirements across the state fall along a broad spectrum (Figure 8.38). Despite this spectrum, many local governments are willing to pursue all-electric policies. Forty-two jurisdictions have adopted all-electric requirements for residential and/or nonresidential construction since 2019. These requirements have come in two forms: a local ordinance or reach code; and a natural gas infrastructure moratorium.
i California Independent System Operator (ISO) Today’s Outlook webpage. Available at http://www.caiso.com/TodaysOutlook/Pages/emissions.html. ii California Energy Commission. 2022 Building Energy Efficiency Standards. Available at https://www.energy.ca.gov/programs-and-topics/programs/building-energy-efficiency-standards/2022-building-energy-efficiency.

381
Figure 8.38 Spectrum of Electrification Options in Current Reach Codes
Electrification within the existing building stock is more challenging to address than in new construction. Several barriers to adoption persist within the current market and will likely need to be directly addressed to encourage electrification in existing buildings and new construction where requirements are not present. These include, but are not limited to:i
● Limited experience or comfort working with electric appliances among contractors; ● Limited awareness and/or negative perceptions of electric technologies among
consumers; ● Limited access to low-cost financing for low-income consumers; ● Prioritization of least-cost commonly used technologies in new construction projects; ● Unwillingness of consumers to pay higher upfront costs; ● Perceived “hassle factor” of fuel switching appliances; and ● Inability to rapidly fuel switch when an “emergency” replacement is required (e.g.,
water heater failure).
CAP Measures Related to Building Electrification in the San Diego Region Current commitments for building electrification in CAPs in the San Diego region are few and only focus on electrification of specific appliances.ii For CAPs that contain at least one electrification measure, these measures account for one percent of local reductions on average. Figure 8.42 summarizes the number of jurisdictions with one or more CAP measures or supporting action that addresses building electrification across all building (e.g., residential and nonresidential) and construction (e.g., new and existing) types, and implementation mechanisms.
Relatively few CAP measures and supporting actions relate to building electrification. Collectively, only five of the 19 jurisdictions in the region have committed to some sort of electrification requirement for select appliances. Even fewer jurisdictions have committed to providing incentives and education on
i E3 (2019). Residential Building Electrification in California. Appendix D: Market Adoption Barriers and Potential Solutions. PDF. ii While no CAP in the region commits to all-electric requirements, some jurisdictions have moved towards all-electric requirements during implementation of their CAP. Examples are provided later in this section.
382
building electrification (one and two, respectively), and no jurisdiction committed to all-electric activity within their CAP. Based on the relative lack of CAP measures to electrify buildings and the GHG implications as presented in the scenario analysis presented in Section 8.4 and above in this section, the current commitment to electrification in CAPs is insufficient given the level of building equipment electrification contemplated in Chapter 5.
Table 8.32 Summary of CAP Measures to Electrify Buildings
Implementation Mechanisms For those jurisdictions that do include building electrification, requirements are the most frequent approach used, followed by education and then incentives. No current CAPs commit to capital improvement and infrastructure (e.g., electrification of municipal facilities), developing a building electrification plan or program, or ongoing evaluation of current or future building electrification opportunities.
Building and Construction Type Generally, CAPs have focused on electrifying select end-uses in new residential developments. In this case, measures have specified the electrification of one or more appliances, such as the water heater or cookstove/range, through the development of a local ordinance. Few CAPs, if any, look to electrify nonresidential projects and the existing building stock. The one jurisdiction that requires electrification of nonresidential buildings (new and existing) specifies electrification of water heating equipment. In addition, the electrification requirement for the existing nonresidential building stock only applies to qualifying addition and alteration projects.
Municipal facilities are covered under nonresidential requirements, but no jurisdiction has specifically committed to the electrification of municipal facilities.
Examples of Policies in Region Table 8.33 provides general policies identified in current CAP measures and actions related to building electrification by implementation mechanism.

383
Table 8.33 Examples of CAP Measures to Electrify Select End Uses
Implementation Mechanism General Policy
Capital Improvement & Infrastructure
NA
Education, Outreach, & Coordination
● Promote installation of heat pump water heaters in renovations ● Provide educational materials on alternative water heaters ● Educate homeowners and businesses on building electrification
and appliance options Evaluation NA
Incentives ● Provide electric appliance incentives to new and existing residential units
● Expedite permitting for replacement of natural gas space and/or water heaters
Plan or Program NA
Requirement(s) ● Require electrification of water heater in new residential and/or nonresidential construction (including additions and alterations)
● Develop materials to support requirements (e.g., cost effectiveness studies)
● Explore requiring non-natural gas appliances in new residential development
● Require new multi-family residential development to install electric cooking appliances
While building electrification measures are only included in recent CAPs, several local jurisdictions have adopted related policies.
City of Encinitas
The 2020 interim revision to the City of Encinitas CAP included two CAP measures that focused on building electrification. Measures BE-2 (Require Decarbonization of New Residential Buildings) and BE-4 (Require Decarbonization of New Commercial Buildings) estimated the GHG reduction potential of electrifying water heating in new residential and nonresidential developments through the adoption of a local ordinance or reach code. In October 2021, the City of Encinitas adopted its Green Building Ordinance, which included, among other things, electrification requirements for new construction.i This ordinance goes beyond what was committed to in their CAP and requires all new residential and nonresidential construction to be all-electric, with some exceptions for commercial kitchens, essential
i City of Encinitas. Green Building Ordinances webpage. Available at https://encinitasca.gov/Government/Departments/City-Manager/Environmental-Services/Climate-Action-Plan/Green-Building-Ordinances.
384
facilities, and projects that would require significant utility upgrades to accommodate the increased electric load. For buildings where an exception applies, the building must be electric-ready.
Encinitas developed a Green Building Incentive Program that provides financial incentives, priority plan checks, and City Council recognition to qualifying projects to advance efforts within the city and encourage electrification in the existing building stock.i
City of Carlsbad
The City of Carlsbad adopted a CAP in 2015, which included Measure J, specifying the adoption of a local ordinance that requires a solar water heater or heat pump water heater in new residential and nonresidential construction with exceptions made for central water heating systems that serve multiple dwelling units. In March 2019, the city adopted this ordinance.ii While not explicitly an electrification requirement, this ordinance is representative of efforts to electrify certain end-uses, especially those responsible for most residential natural gas consumption.
City of Solana Beach
The City of Solana Beach did not commit to electrification in their 2017 CAP but recognized the potential to reach its climate goals by developing an electrification ordinance. In December 2021, the City adopted Ordinance 518, which requires electrification of most end-uses in new residential and nonresidential projects.iii End-uses required to be electric include space heating, water heating (including pools and spas), and clothes drying. The ordinance also has an electric-ready requirement for buildings plumbed for natural gas or propane cooking appliances.
Worth noting on this ordinance is how it defines new construction. The ordinance applies to certain existing buildings when they are substantially changed as defined within the ordinance as:
● Any non-residential or mixed-use remodel project that has a permit valuation of $750,000 or more; or alters 50% or more of major structural components including exterior walls, interior walls, floor area, roof structure, or foundation; or has an increase of 50% or more of floor area; and
● Any residential remodel project that alters 50% or more of structural components, including exterior walls, interior walls, floor area, roof structure, or foundation; or has an addition of 700 square feet or more floor area.
This reflects the discretion local jurisdictions act with when interpreting Title 24 and adopting their own building standard amendments to Title 24.
i City of Encinitas. Green Building webpage. Available at https://encinitasca.gov/Residents/Environmental-Programs/Green-Building. ii City of Carlsbad. Ordinance No. CS-348. Available at https://localenergycodes.com/download/461/local_government_adoption_ordinance/fieldList/Carlsbad 2019 - Ordinance No CS-348.PDF. iii City of Solana Beach. Ordinance 518. See City Council Meeting November 10, 2021. Available at https://solanabeach.12milesout.com/video/meeting/c5805988-cc39-4106-a75a-30975821258b.

385
8.6.6 Opportunities for Additional Local Policy Action in the Decarbonize Buildings Pathway
Opportunities are a function of authority to act, frequency of measures in CAPs, and the GHG impact. As noted above, there is a range of policy mechanisms to implement CAP measures. For purposes of identifying policy options to decarbonize building in the San Diego region, we will focus on three key mechanisms: education, outreach, and collaboration, incentives and financing, and requirements. Recognizing that all three policy mechanisms are needed but that GHG impacts increase as we move from education to requirements, we will focus on incentives and requirements. In addition to these three, we will consider the equity implications of these policies
In general, there is an opportunity for more jurisdictions to adopt energy efficiency and electrification policies and for all jurisdictions to adopt best-in-class policies.
Integrate Equity Considerations into Building Decarbonization Policy Process As noted in Section 8.3.5 above, the integration of social equity considerations in adopted and pending CAPs is limited, inconsistent, and lacks specificity. In general, there is an opportunity to integrate these considerations into CAPs and the resulting measures and policies. In the context of electricity and natural gas policy, the CPUC often includes within the definition of low-income household “residential customers eligible for California Alternate Rates for Energy (CARE) and the Family Electric Rates Assistance (FERA) programs, resident-owners of single-family homes in disadvantaged communities (as defined in D.18-06-0127), or residential customers who live in California Indian Country (as defined in D.20-12-003)… .”i
The following provides a preliminary overview of several aspects of equity related to building electrification, but additional work would be needed to develop the capacity and tools to integrate equity into the San Diego region's building and other decarbonization policies.
High Proportion of Renters in Communities of Concern Policies and programs to address energy use in buildings that lease or rent units often face the “split incentive” dilemma. Building owners often do not pay utility bills and have no incentive to address building energy, while renters pay the utility bills and have an incentive to improve energy use but do not own the building or the main energy-consuming appliances and equipment. In communities with a high proportion of renters, considering the split incentive is particularly important.
There is a range of actions to address the unique challenges that renters face, including the following: findings from a report by ACEEE focusing on energy efficiency in rental housing.ii Granting renters the right to make efficiency improvements
● Adopting a renter right of first refusal on property sale ● Creating a rental energy disclosure policy ● Advocating to expand state and utility rental efficiency programs ● Promoting existing state and utility efficiency programs to renters and landlords
i California Public Utilities Commission. Proposed Decision Revising Net Energy Metering Tariff and Subtariffs in Rulemaking 20-08-020, 12-13-21. ii Samarripas, S., and A. Jarrah. 2021. A New Lease on Energy: Guidance for Improving Rental Housing Efficiency at the Local Level. Washington, DC: American Council for an Energy-Efficient Economy. aceee.org/research-report/u2102.
386
● Adopting a rental energy performance standard and assisting affordable housing providers with compliance
● Instituting limited-scope rental property retrofit requirements ● Designing rental efficiency loan and grant programs with affordability covenants ● Coupling public housing energy-efficient rehab projects with inclusive workforce
development ● Including energy efficiency in competitive, affordable housing funding criteria
An example from the San Diego region that addresses the split incentives is the City of Chula Vista Building Energy Savings Ordinance (Ordinance No. 3498), which requires certain multifamily building owners to benchmark and disclose energy usage and improve efficiency in rental units.
Similar issues and policy opportunities would exist for electrification. However, additional analysis would be needed to determine the applicability of these approaches in the San Diego region.
Relative Lack of Data and Analysis Related to Equity In general, there is a lack of comprehensive data and analysis at the local jurisdiction and regional level for equity aspects of building energy use. Some work has been done to collect data at the local level and to develop visualization tools. For example, the City of San Diegoi and the City of Chula Vistaii each have developed a Climate Equity Index, which includes metrics related to energy use and costs. The City of Escondido’s CAP seeks to develop a Clean Energy Equity Plan and priority investment neighborhoods (PIN) to help target the implementation of certain CAP measures.iii Examples of detailed building energy mapping tools exist in other regions of California, including UCLA’s Energy Atlas, which allows users to explore energy usage and greenhouse gas emissions at varying levels of geographic scale down to the neighborhood level.iv Researchers from UCLA also have developed equity-related metrics to understand issues of energy poverty.v Developing regional capacity to do this analysis could help to integrate equity-focused considerations into the policy development process.
Cost Implications of Building Electrification The cost to residents in communities of concern of electrifying residential units depends on many factors, including equipment cost, the equipment being installed and replaced, type of construction (i.e., new vs. retrofit), age of the building, electric and natural gas rates, expected change in natural gas and electric consumption, and climate zone. Certain equipment or combinations of equipment have capital cost, bill, and lifecycle savings, including all-electric new homes with air conditioning, mini-split retrofits,
i City of San Diego. Climate Equity Index Mapping Tool webpage. Available at https://www.sandiego.gov/sustainability/social-equity-and-job-creation. ii City of Chula Vista. Climate Equity Index Mapping Tool Available at https://usandiego.maps.arcgis.com/apps/webappviewer/index.html?id=4e6aab73778944148336d512edc032ea. iii City of Escondido Climate Action Plan, 2021. Available at https://www.escondido.org/climate-action-plan-documents.aspx. iv UCLA Energy Atlas Mapping Tool. Available at https://energyatlas.ucla.edu/map/usage_income. v Fournier, ED, et al. 2020. On energy sufficiency and the need for new policies to combat growing inequities in the residential energy sector. Elem Sci Anth, 8: 24. DOI: https://doi.org/10.1525/elementa.419.

387
ducted heat pumps in new construction air conditioning. While others result in additional upfront and operating costs, including electric induction cooktops and heat pump clothes dryers.i
CPUC analysis has shown that for certain buildings in the San Diego region, particularly those in a hot climate zone, switching from mixed-fuel to electric space and water heating can lower monthly energy utility bills, considering electricity and natural gas use and rates. On the other hand, new all-electric homes in this same climate zone would have slightly higher bills. This is, in part, due to including less cost effective equipment like induction cooktops and heat pump clothes dryers.ii This is consistent with findings in Chapter 5, which notes that “[p]olicies should support increasing adoption of efficient heat pump-based space and water heating systems in both new and existing buildings, with particular focus on assistance for low-income residents and rental buildings.”
More analysis may be needed to understand the specific cost implications of building electrification in communities of concern in the San Diego region and the potential need for financial assistance.
Adopt Reach Codes for New Buildings and Additions/Alterations to Existing Buildings Buildings have a long lifetime, and the number of buildings affected by energy codes accumulates over time; improving energy efficiency and electrifying buildings in new construction, additions, and alterations is a least regret policy. Based on the comparative analysis of adopted and pending CAPs, there is an opportunity to increase the number of reach code policies in the San Diego region. Only four CAPs include at least one measure to improve new residential and nonresidential efficiency. Similarly, only 4 CAPs include requirements for new building – all focused on residential buildings.
Several cities in the San Diego region and many across California have adopted efficiency and electrification policies. Based on this previous experience, there are many example policies and several statewide cost effectiveness studies that can facilitate policy development.
However, there are limitations to policies that target new buildings. A relatively small number of buildings are built each year compared to the existing housing stock. In the San Diego region, new buildings account for about 1% of the total buildings stock each year. Between 2020 and 2050, the region will add an estimated 250,000 housing units, a 21% increase. The City of San Diego has the largest projected increase with 165,869, an increase of about 30% and about 65% of the expected new housing units in the region. Cities of Chula Vista (about 9% of total), Escondido (5%), and San Marcos (4%) have the next highest number of expected new housing units.
i E3, “Residential Building Electrification in California” (2019). https://www.ethree.com/wp-content/uploads/2019/04/E3_Residential_Building_Electrification_in_California_April_2019.pdf. ii California Public Utilities Commission, 2021. Utility Costs and Affordability of the Grid of the Future: An Evaluation of Electric Costs, Rates, and Equity Issues Pursuant to P.U. Code Section 913.1.
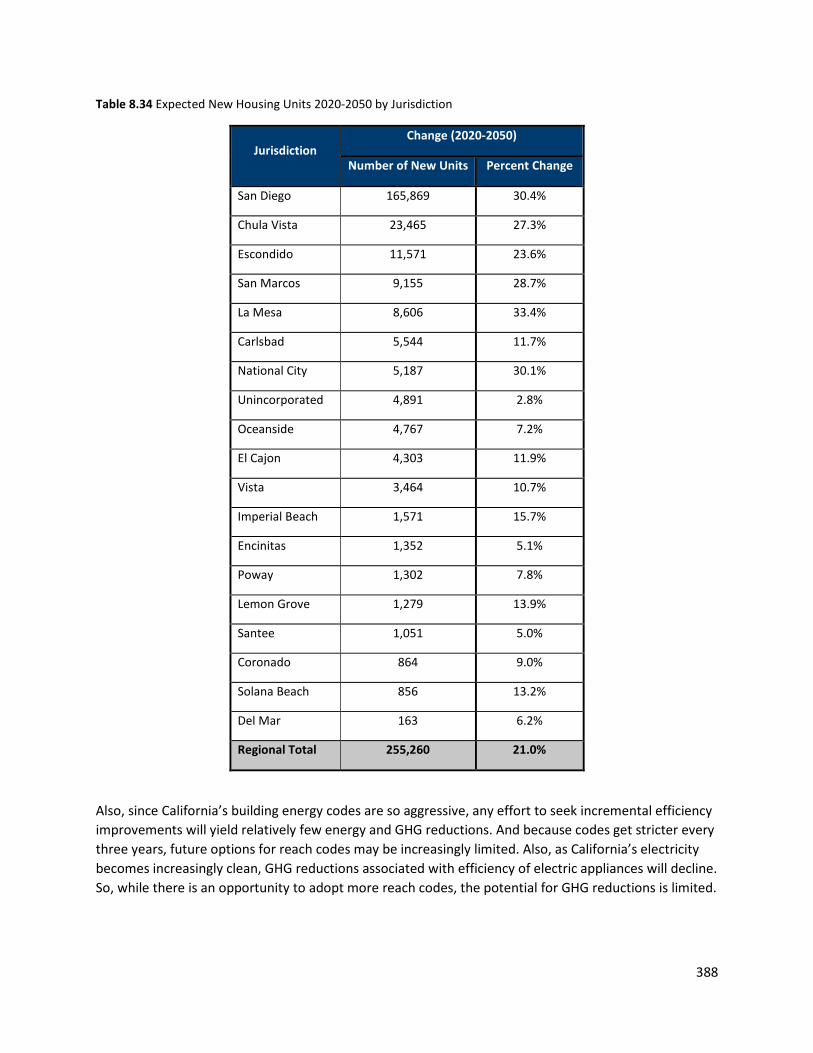
388
Table 8.34 Expected New Housing Units 2020-2050 by Jurisdiction
Jurisdiction Change (2020-2050)
Number of New Units Percent Change
San Diego 165,869 30.4%
Chula Vista 23,465 27.3%
Escondido 11,571 23.6%
San Marcos 9,155 28.7%
La Mesa 8,606 33.4%
Carlsbad 5,544 11.7%
National City 5,187 30.1%
Unincorporated 4,891 2.8%
Oceanside 4,767 7.2%
El Cajon 4,303 11.9%
Vista 3,464 10.7%
Imperial Beach 1,571 15.7%
Encinitas 1,352 5.1%
Poway 1,302 7.8%
Lemon Grove 1,279 13.9%
Santee 1,051 5.0%
Coronado 864 9.0%
Solana Beach 856 13.2%
Del Mar 163 6.2%
Regional Total 255,260 21.0%
Also, since California’s building energy codes are so aggressive, any effort to seek incremental efficiency improvements will yield relatively few energy and GHG reductions. And because codes get stricter every three years, future options for reach codes may be increasingly limited. Also, as California’s electricity becomes increasingly clean, GHG reductions associated with efficiency of electric appliances will decline. So, while there is an opportunity to adopt more reach codes, the potential for GHG reductions is limited.

389
Key Considerations for Reach Codes
● Revisit Reach Code Opportunities with Building Code Cycle – The State Energy Code updates every three years, and the opportunities for local requirements are likely to decrease with each code cycle as requirements are integrated into the building code language. This change can be seen with solar PV requirements for new construction. In the early to mid-2010s, a significant portion of reach codes required solar PV in new residential construction. Beginning in 2020, however, this requirement was mandated through the 2019 State Energy Codei, making a local requirement unnecessary. Since local jurisdictions have shifted to ordinances requiring PV on new nonresidential construction, however, this too is included in adopted language for the 2022 Energy Codeii, which is set to take effect January 1, 2023. As state standards tighten, jurisdictions can explore opportunities to achieve additional energy savings and GHG reductions from the new and existing building stock.
● Adopt Reach Codes for New Construction and Existing Buildings Sooner – Jurisdictions can achieve greater reductions early on by adopting requirements before they are included in the State Energy Code. This helps state officials identify key trends statewide that may influence future requirements included in building code updates and has a greater impact on the cumulative reduction in emissions within the region.
● Consider Cost Effectiveness and Energy Savings of Requirements – For a reach code to be approved by the CEC, a jurisdiction must demonstrate that the requirements (1) consume no more energy than state standards and (2) are cost-effective. The latter is generally the limiting factor, especially for newer technologies that may have high costs for adoption. For instance, many CAPs in the region have included measures to require solar water (SW) heating in new residential and/or nonresidential construction. However, SW heating requirements are generally not cost-effective without significant rebates and incentives. For this reason, many jurisdictions have sought to modify the requirements they are pursuing (e.g., Encinitas updated their SW heating measure to an electrification measure in their CAP update).
Opportunities for Reach Codes In addition to the above considerations, a number of resources have been developed by the Statewide Reach Codes Program, a subprogram of the California Statewide Energy Codes and Standards Program.iii These resources are specifically designed to help jurisdictions leverage their authority to adopt requirements that achieve greater building-related energy and GHG savings, highlighting many of the opportunities for reach code requirements currently available for adoption for new and existing buildings. Included in these resources are cost-effectiveness studies that document (1) energy savings
i California Energy Commission. 2019 Building Energy Efficiency Standards. Available at https://www.energy.ca.gov/programs-and-topics/programs/building-energy-efficiency-standards/2019-building-energy-efficiency. ii California Energy Commission. 2022 Building Energy Efficiency Standards. Available at https://www.energy.ca.gov/programs-and-topics/programs/building-energy-efficiency-standards/2022-building-energy-efficiency iii Statewide Reach Codes Program, California Energy Codes and Standards – A Statewide Utility Program. Available at https://localenergycodes.com/.

390
and (2) cost-effectiveness for all climate zones in the state. Current statewide studies for new construction that pertain to the current 2019 State Energy Code are included in Table 8.33.
Table 8.35 Statewide Cost-Effectiveness Studies for New Construction, 2019 Building Code
Building / Construction Type
Building Fuel Types Analyzed
Building Energy Packages Analyzed
New Low-Rise Residential Construction1
● Mixed Fuel ● All-Electric
● Energy efficiency ● Energy efficiency + increased solar PV ● Energy efficiency + increased solar PV + battery storage
New Mid-Rise Residential Construction2
● Mixed Fuel ● All-Electric
● Energy efficiency ● Energy efficiency + increased solar PV
New High-Rise Residential Construction3
● Mixed Fuel ● All-Electric
● Energy efficiency ● Energy efficiency + increased solar PV
New Detached Accessory Dwelling Units4 ● All-Electric ● Energy efficiency
● Energy efficiency + increased solar PV
New Nonresidential Construction5
● Mixed Fuel ● All-Electric
● Energy efficiency ● Energy efficiency + increased solar PV + battery storage
1 CA Energy Codes & Standards Program (2019). 2019 Cost-Effectiveness Study: Low-Rise Residential New Construction. 2 CA Energy Codes & Standards Program (2020). 2019 Mid-Rise New Construction Reach Code Cost-Effectiveness Study. 3 CA Energy Codes & Standards Program (2021). 2019 Cost-Effectiveness Study: 2020 Analysis of High-Rise Residential New Construction. 4 CA Energy Codes & Standards Program (2021). 2020 Reach Code Cost-Effectiveness Analysis: Detached Accessory Dwelling Units. 5 CA Energy Codes & Standards Program (2019). 2019 Nonresidential New Construction Reach Code Cost Effectiveness Study.
As they relate to building electrification, these studies support the adoption of a range of electrification requirements within the San Diego region, including electric-preferred and all-electric ordinances for new residential and nonresidential construction (as illustrated in Figure 8.38). Specific requirements applicable to each jurisdiction will depend on the building climate zone(s) within the jurisdiction’s boundary. Included with these analyses, jurisdictions may also consider adopting electric ready requirements (e.g., pre-wiring and panel upgrades); however, these requirements are expected to be included in the 2022 State Energy Code.
In addition, the City of Carlsbad carried out its own study to support its reach code, which examines the cost-effectiveness of electrifying water heating in new residential construction.i This study found the requirement to be cost-effective, paving the way for a similar requirement to be adopted elsewhere as well.
i California Energy Commission. Docket Number 16-BSTD-07, April 22, 2019. Local Ordinance Application – 2016 Standards. TN# 227844. Existing Building Efficiency Upgrade Cost Effectiveness Study. Available at https://efiling.energy.ca.gov/GetDocument.aspx?tn=227844&DocumentContentId=59219.

391
Currently, there are no studies to support electrification requirements (all-electric or of specific appliances) for the existing building stock in the San Diego region.
Current opportunities for energy efficiency requirements are much broader than electrification and can be adopted in coordination with electrification requirements. Again, specific requirements will vary based on the climate zone(s) within each jurisdiction. In addition, requirements for additions and alterations may vary based on the building vintage. For instance, potential requirements identified for residential retrofits depend on the year in which the home was built. Studies developed for new construction may be used to support requirements for certain additions and alterations that are considered “new” in the context of the reach code. A separate study is also available to support a handful of requirements for retrofits of existing residential units.i
Explore Other Options for New Buildings Other possible policy options exist to increase efficiency and electrifications in new buildings, including energy use rating and disclosure for new homes, improved building energy code compliance, and assessing and disclosing embedded carbon.
Implement More Policies to Increase Efficiency in Existing Buildings In addition to the addition and alteration projects covered by reach codes, policies that affect other existing buildings can reduce GHG emissions. Based on the comparative analysis of CAPs and the scenario analysis of GHG impacts, several potential opportunities emerge to increase efficiency in existing buildings.
● Existing Building Incentives and Requirements – Even though nearly half of CAPs include measures related to encouraging or requiring efficiency improvements because existing represent the largest portion of building-related GHG emissions is associated with existing buildings, additional activity related to existing buildings would be necessary.
● Municipal Energy Efficiency Improvements – More than half of the CAPs included in this analysis include measures to improve energy efficiency at municipal facilities. While related energy use is relatively small compared with city- or regionwide energy use, implementing cost effective energy efficiency in municipal buildings provides an opportunity not only to reduce energy expenditures but to demonstrate leadership by modeling the types of building improvements that CAPs may contemplate for homes and businesses.
Existing structures are key to building decarbonization since about 80% of buildings that will exist in the San Diego region in 2050 already exist in 2020. Efficiency remains a way to reduce energy use, emissions, and energy utility costs, particularly in the short- and medium-term while buildings transition toward electrification. As noted above, reach codes can address existing buildings that undergo alterations and additions, but given the number of CAPs with measures related to existing buildings and the expected GHG impacts both from existing CAP commitments and the best commitment scenario, there is an opportunity for additional local policy action.
i CA Energy Codes and Standards Program (2021). 2019 Cost-Effectiveness Study: Existing Single Family Residential Building Upgrades.

392
Local jurisdictions have the authority to encourage or require energy efficiency improvements and to audit, benchmark, and disclose. And, there are numerous examples of these policies in the San Diego region and across California.
There are relatively few CAPs with audit, benchmarking, and disclosure measures. These policies result in relatively small energy and GHG emissions reductions but help to raise awareness of energy use and can form the foundation of future policies. These policies can transition to include information about associated carbon emissions in the future, especially as we transition to electric appliances.
Non-Residential Figure 8.39 includes common elements of policies that require energy efficiency improvements or related activities in existing non-residential buildings. Policies often include one or more elements and can cover water efficiency. There are examples of local policies that focus on just one of these elements, while others include nearly all of them.
Figure 8.39 Key Element of Nonresidential Existing Building Energy Efficiency Policies
● Audits – Policies can require building owners to complete energy audits of buildings to identify cost effective opportunities to improve efficiency. Energy improvement opportunities identified during an energy audit can be pursued voluntarily by building owners or form the basis for an energy improvement requirement.
● Benchmarking – Requiring a building to benchmark its energy use typically entails collecting and reporting data through ENERGY STAR Portfolio Manager.i Once disclosed, benchmarking data allows building owners to compare energy use with similar buildings. As noted above, California has enacted AB 802 (2015), which requires certain buildings to report energy use data. More generally, benchmarking serves as a foundational policy that can provide needed information and data to develop more targeted and appropriate building energy policies.
● Disclosure – Often paired with audits and benchmarking, disclosure policies require building owners to disclose certain energy use and related data to tenants, lessees, and buyers. Disclosure provisions also often have local jurisdictions publicly post to a website certain energy data for building subject to the energy auditing or benchmarking requirement. These
i U.S. Environmental Protection Agency Energy Star Portfolio Manager webpage. Available at https://www.energystar.gov/buildings/benchmark.
393
policies allow existing and potential tenants and buyers to understand energy consumption and the potential implications, including financial.
● Efficiency Improvements – Policies can require that certain buildings complete efficiency improvements. In general, there are two pathways to demonstrate compliance: performance and prescriptive. Using performance standards, a building owner can comply by meeting a specified performance standard, typically energy use per square foot of building area. There is a trend toward using carbon dioxide as a performance metric. Boston and New York City have adopted GHG performance standards.i Using a prescriptive compliance pathway, building owners can comply by completing specified building energy improvements (e.g., installing insulation). Performance and prescriptive pathways are used in new building requirements in Title 24, part 6.
● Retrocommissioning and Building Tune-Up – These options focus on low- or no-capital improvements to energy-related building equipment. According to New York City’s Local Law 87, retro-commissioning is a “systematic process for optimizing the energy efficiency of existing base building systems through the identification and correction of deficiencies in such systems, including but not limited to repairs of defects, cleaning, adjustments of valves, sensors, controls or programmed settings, and/or changes in operational practices.”ii For example, Chula Vista requires retro-commissioning as a compliance option for conservation requirements for non-residential and certain multi-family buildings. On the other hand, according to the City of Seattle, a building tune-up includes an inspection of building systems to identify operational or maintenance issues and corrections to operational issues identified in the inspection that have relatively short paybacks.iii In general, retro-commissioning includes more robust documentation than a building tune-up.
Several cities in California have adopted policies to improve energy efficiency in existing nonresidential buildings that include some or all of these key elements. The City of San Diego has also adopted a policy requiring benchmarking and disclosure.iv The City of Berkeley’s Building Energy Savings Ordinance (BESO) requires all buildings, depending on size, to benchmark or audit, and disclose energy usage information at the time of listing for sales. Certain large buildings have to conduct benchmarking every 1-5 years.v The City of San Francisco has a similar ordinance for nonresidential and large residential buildings.vi The Cities of Chula Vista, Los Angeles, and San Jose have adopted ordinances that include benchmarking and disclosure provisions along with a building performance requirement with multiple
i See New York City Local Law 97, available at https://www1.nyc.gov/assets/buildings/local_laws/ll97of2019.pdf. See also City of Boston Building Emissions Reduction and Disclosure Ordinance, available at https://www.boston.gov/departments/environment/building-emissions-reduction-and-disclosure. ii Erin Beddingfield and Zachary Hart, “Putting Data to Work: Using Data from Action-Oriented Energy Efficiency Policies and Programs.” IMT. https://www.imt.org/wp-content/uploads/2019/11/IMT-PuttingDatatoWork-Using-Audit-Data.pdf. iii City of Seattle, Building Tune-ups Resources. iv City of San Diego Municipal Code. Article 12, Division 1, Sections 1412.0101 to 1412.0113. See https://docs.sandiego.gov/municode/MuniCodeChapter14/Ch14Art12Division01.pdf. v City of Berkeley Municipal Code Chapter 19.81 Sections 19.81.010 to 19.81.170. See https://www.cityofberkeley.info/uploadedFiles/Planning_and_Development/Level_3_-_Energy_and_Sustainable_Development/BESOordinanceUpdated_20201215.pdf. vi https://sfenvironment.org/sites/default/files/fliers/files/sfe_gb_ecb_ordinance_overview.pdf.

394
compliance options, including completing energy efficiency improvements, audits, and retrocommissioning. Table 8.36 summarizes policies for a sample of cities in California.
Table 8.36 Comparison of Energy Efficiency Policies for Existing Non-Residential Buildings in CA
Residential Buildings There are fewer adopted policies for existing residential buildings in California. Two examples include the City of Berkeley’s Building Energy Savings Ordinance and the City of San Francisco’s Residential Energy Conservation Ordinance (RECO). These policies include auditing, disclosure, and energy efficiency improvement provisions.
As described above, the City of Berkeley’s Building Energy Savings Ordinance requires all buildings, including residential buildings with 1-4 units, to conduct a building energy audit and disclose the results to potential lessees and buyers prior to executing a lease or contract for sale.
The City of San Francisco has adopted a RECO that requires owners of single- and two-family dwellings, apartment buildings, and residential hotels to conduct an audit and to complete prescriptive energy and water efficiency improvements at the time of sale and prior to the transfer of title.i In addition to time of sale, there are several other intervention points for this policy, including metering conversion, major improvements, and condominium conversions.
Examples of the prescriptive measures required for single- and two-family family buildings include: insulation, weatherstripping, water heater insulation, low-flow showerhead, caulk and seal openings in building exterior, insulate heating and cooling ducts, faucet aerators, and low flush toilets. San
i San Francisco Housing Code Chapter 12 (Residential Energy Conservation) and Chapter 12 A (Residential Water Conservation).
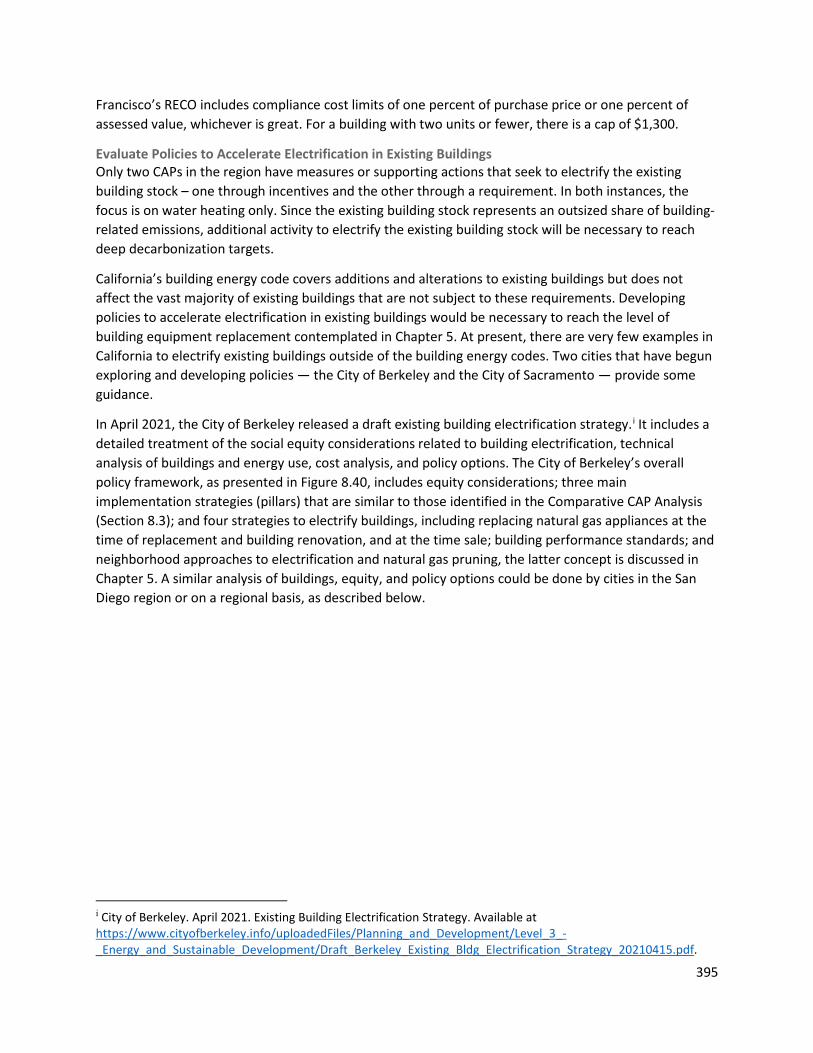
395
Francisco’s RECO includes compliance cost limits of one percent of purchase price or one percent of assessed value, whichever is great. For a building with two units or fewer, there is a cap of $1,300.
Evaluate Policies to Accelerate Electrification in Existing Buildings Only two CAPs in the region have measures or supporting actions that seek to electrify the existing building stock – one through incentives and the other through a requirement. In both instances, the focus is on water heating only. Since the existing building stock represents an outsized share of building-related emissions, additional activity to electrify the existing building stock will be necessary to reach deep decarbonization targets.
California’s building energy code covers additions and alterations to existing buildings but does not affect the vast majority of existing buildings that are not subject to these requirements. Developing policies to accelerate electrification in existing buildings would be necessary to reach the level of building equipment replacement contemplated in Chapter 5. At present, there are very few examples in California to electrify existing buildings outside of the building energy codes. Two cities that have begun exploring and developing policies — the City of Berkeley and the City of Sacramento — provide some guidance.
In April 2021, the City of Berkeley released a draft existing building electrification strategy.i It includes a detailed treatment of the social equity considerations related to building electrification, technical analysis of buildings and energy use, cost analysis, and policy options. The City of Berkeley’s overall policy framework, as presented in Figure 8.40, includes equity considerations; three main implementation strategies (pillars) that are similar to those identified in the Comparative CAP Analysis (Section 8.3); and four strategies to electrify buildings, including replacing natural gas appliances at the time of replacement and building renovation, and at the time sale; building performance standards; and neighborhood approaches to electrification and natural gas pruning, the latter concept is discussed in Chapter 5. A similar analysis of buildings, equity, and policy options could be done by cities in the San Diego region or on a regional basis, as described below.
i City of Berkeley. April 2021. Existing Building Electrification Strategy. Available at https://www.cityofberkeley.info/uploadedFiles/Planning_and_Development/Level_3_-_Energy_and_Sustainable_Development/Draft_Berkeley_Existing_Bldg_Electrification_Strategy_20210415.pdf.
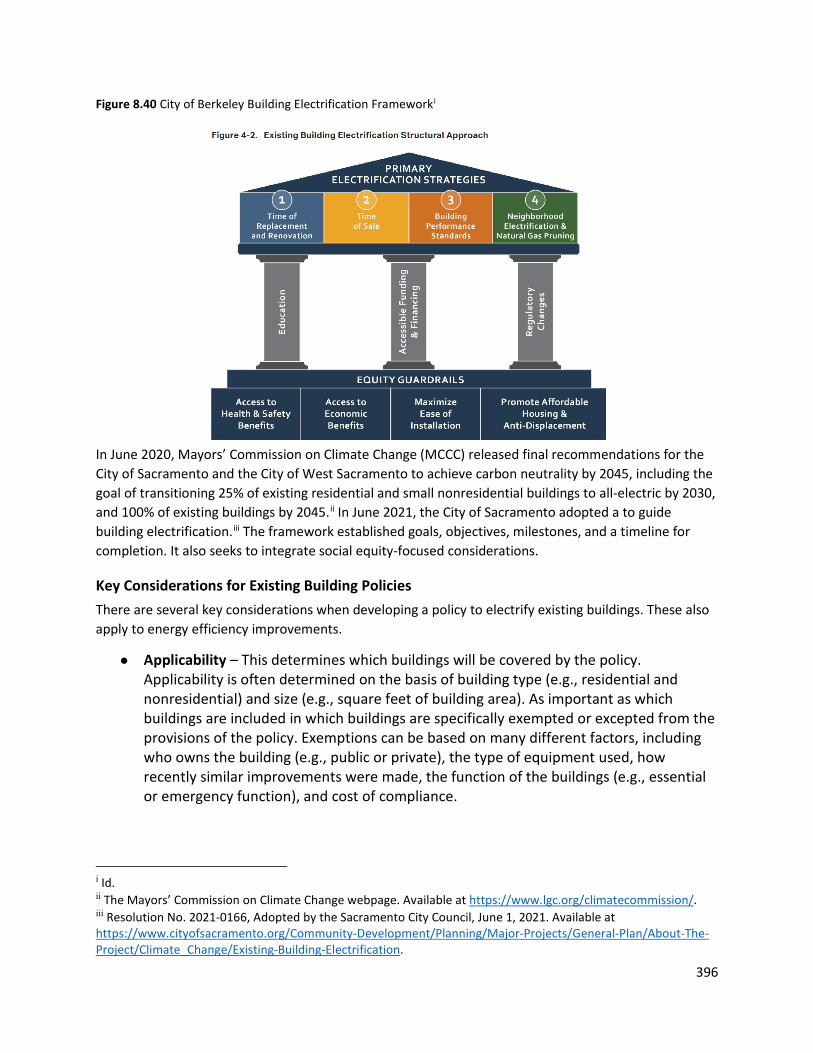
396
Figure 8.40 City of Berkeley Building Electrification Frameworki
In June 2020, Mayors’ Commission on Climate Change (MCCC) released final recommendations for the City of Sacramento and the City of West Sacramento to achieve carbon neutrality by 2045, including the goal of transitioning 25% of existing residential and small nonresidential buildings to all-electric by 2030, and 100% of existing buildings by 2045.ii In June 2021, the City of Sacramento adopted a to guide building electrification.iii The framework established goals, objectives, milestones, and a timeline for completion. It also seeks to integrate social equity-focused considerations.
Key Considerations for Existing Building Policies There are several key considerations when developing a policy to electrify existing buildings. These also apply to energy efficiency improvements.
● Applicability – This determines which buildings will be covered by the policy. Applicability is often determined on the basis of building type (e.g., residential and nonresidential) and size (e.g., square feet of building area). As important as which buildings are included in which buildings are specifically exempted or excepted from the provisions of the policy. Exemptions can be based on many different factors, including who owns the building (e.g., public or private), the type of equipment used, how recently similar improvements were made, the function of the buildings (e.g., essential or emergency function), and cost of compliance.
i Id. ii The Mayors’ Commission on Climate Change webpage. Available at https://www.lgc.org/climatecommission/. iii Resolution No. 2021-0166, Adopted by the Sacramento City Council, June 1, 2021. Available at https://www.cityofsacramento.org/Community-Development/Planning/Major-Projects/General-Plan/About-The-Project/Climate_Change/Existing-Building-Electrification.

397
● Phasing – This determines when building owners will be subject to the provisions of the policy. Provisions can be in force at the date of adoption or phased in over time to allow building owners time to adjust to the requirements.
● Intervention Points – Sometimes called “triggers,” these determine when the provisions of the policy apply. Intervention points can include: time of sale or time of listing; building size, typically based on building size (i.e., square footage); point of lease or rental; building renovation; building maintenance or major system replacement; building resilience upgrade (e.g., seismic renovation, flood prevention); building type (e.g., single-family or multi-family), and strategies that implement activities by geography (e.g., neighborhood).i
● Enforcement – Whether and how a local jurisdiction can monitor compliance and enforce a policy, particularly a requirement, is an important consideration. Enforcement can be related to the intervention point. For example, policies that use the permitting process as a trigger for a requirement may be easier to enforce given existing staff and capacity. On the other hand, new requirements attached to permitting may create a disincentive to acquire a permit.
Local Governments Continue to Demonstrate Building Efficiency and Electrification Just over half of CAPs have measures to improve efficiency at municipal facilities. This is least regret policy because implementing cost effective measures help to reduce operating costs and can model the type of actions local governments may encourage homes and businesses to do. It is possible that these are already happening but are not included in CAPs, but there appears to be an opportunity for additional energy efficiency improvements in municipal facilities. It is common for local governments to conduct audits of existing facilities to identify opportunities for energy efficiency, and some cities have developed detailed energy strategies.
Potential for Regional Collaboration While local governments have authority to act to encourage and require efficiency and electrification of buildings, a regional approach could facilitate broad adoption of policies both for new and existing buildings.
Regional Program to Support Reach Code Policy Development Given the clear, existing authority that local governments have to adopt local building codes (e.g., reach codes) for new buildings and the existing knowledge and experience in the region and around statewide, developing a regional approach to reach code development, adoption, and implementation is a least regret policy. Such a program could include the following key elements.
● Conduct a Regional Reach Code Analysis - Conduct regional reach code analysis to identify opportunities for further action by jurisdiction and climate zone. This analysis could consider the future build out of the region, analyze future building growth in each jurisdiction, identify the best approaches, and identify policy gaps and opportunities for each jurisdiction.
● Support Development and Implementation of Reach Code Policies – A regional program could support development and implementation of regional reach codes. This
i City of Berkeley Building Energy Saving Ordinance Evaluation Report February 11, 2020. Energy Solutions.
398
program could leverage existing resources, including SDG&E Codes and Standards program and Statewide Reach Code Program.i The Clean Power Alliance, the Los Angeles region CCA, completed a report on potential programs and identified a regional reach code program as one option. Based on the report, such a program could: develop model ordinances to streamline the process for local jurisdictions, provide funding to local governments for the development and adoption process of a building electrification code, and make available technical assistance to municipalities that want to adopt a building electrification reach code.ii The Bay Area Renewable Energy Network, known as BayREN, has a similar program to support development of local building energy code policies for new buildings. iii
Regional Program for Decarbonizing Existing Buildings The largest policy gap in CAPs related to building decarbonization is improving efficiency and electrifying existing buildings. In particular, there are relatively few CAP measures to accelerate the turnover of natural gas appliances in both residential and commercial buildings. Federal and state action will continue to encourage building decarbonization, but there is a role for local jurisdictions.
Historically, improving energy efficiency in existing buildings has been difficult. It is expected that electrifying existing buildings will be equally challenging. There is an opportunity to evaluate the potential for a regional program that could complete analysis, help develop policy options and support the adoption and implementation of related policies. This is similar in concept to the reach code support program contemplated above, but the prerequisite analysis, materials, and approach are comparatively less developed than for reach codes. Also, existing building policies are sufficiently different from new building policies and approaches to warrant a separate effort. The following are examples of elements of such a program.
● Conduct Data Analysis on Existing Buildings – There is a lack of publicly available data related to existing building energy use. Collecting and analyzing existing regional building data could help form evidence-based policies. This could include mapping buildings; collecting data to characterize buildings by age, type, use, etc.; determining whether they use natural gas appliances; etc. This work can form the analytical basis for develop a strategy and eventual policies. Also could provide necessary information and mechanisms to monitor progress over time, preferably using a publicly available data portal. Because privacy rules exist that govern the types and granularity of energy consumption data that can be shared publicly, methods would have to be developed to aggregate results in a way that does not violate these rules.
● Convene an Existing Building Decarbonization Task Force – Results of a regional building energy analysis could inform the work of a regional building decarbonization task force, which could comprise key stakeholders from around the region including: community-based organizations, environmental advocates, San Diego Gas & Electric,
i https://localenergycodes.com/. ii Clean Power Alliance. 2020 Local Programs for a Clean Energy Future, p. 26. iii Bay Area Regional Energy Network (BAYREN). Reach Codes and Policies webpage. Available at https://www.bayrencodes.org/reachcodes/.
399
community choice aggregation programs, building officials and related city staff, labor unions, building trades, developers, policy experts, etc. The goal of the task force could be to develop a regional strategy to decarbonize buildings.
● Develop a Regional Strategy to Decarbonize Existing Buildings – A regional existing building decarbonization strategy would help to develop a framework and implementation pathways to accelerate both energy efficiency and electrification. Chapter 5 provides a good first step, but a more detailed analysis, strategies, and policies are needed. As an example, the City of Berkeley has developed Existing Buildings Electrification Strategy.i A strategy could consider social equity factors, the potential for a regional incentive program, and stakeholder outreach.
● Develop a Program to Support Development of Existing Building Policy – A regional program could support development, adoption, and implementation of existing building policies. Such a program could include model policies and supporting materials, technical/expert support throughout the process, and implementation support.
i City of Berkeley. April 2021. Existing Building Electrification Strategy.
400
8.7 Decarbonize the Electricity Supply Decarbonizing the electric supply is a pivotal step in the overall decarbonization framework. Increasing carbon-free electricity supplies not only reduces GHGs from the electricity sector it also becomes the low- or zero-carbon energy source of choice for transportation and buildings to enable additional GHG reductions. In general, there are two main methods to reduce emissions from the electricity supply: (1) increase the amount of carbon-free electricity supplied to customers from the electric grid, typically from large-scale projects, and (2) increase installation of distributed renewable energy projects located on the customer side of the electric meter.
This section follows a similar format as the sections above and will cover authority of local governments to act; local CAP commitments, including the number of CAPs with related measures and the GHG impact of those measures; and a summary of opportunities for additional local action and regional collaboration. The geospatial analysis of renewable energy presented in Chapter 2 estimates the potential for both large-scale and distributed (e.g., rooftop and infill) in the region. We provide some findings on the GHG contribution of related CAP policies but did not include distributed solar in our scenario analysis of CAPs, mainly because associated GHG reductions are included in the reference scenario.
8.7.1 Summary of Findings
Table 8.37 summarizes key takeaways for the Decarbonize the Electricity Supply Pathway.
Table 8.37 Summary of Key Takeaways from the Decarbonize the Electricity Supply Pathway
Policy Category Key Takeaways
Grid Supply
All adopted and pending CAPs have related measures, typically related to community choice aggregation (CCA), reflective of existing authority; relatively high GHG reductions in CAPs; opportunity for more cities to join existing CCAs, and commit to 100% carbon-free service options for municipal accounts and default community accounts.
Customer Side Supply
All adopted and pending CAPs have related measures reflective of existing authority; relatively low GHG reductions in CAPs due mainly to State activity in this area; limited opportunity for more jurisdictions to adopt reach codes for new construction, but more opportunity exists for alterations and additions; opportunity to increase customer side generation in existing buildings, particularly when coupled with energy storage.
Key Findings of Analysis This is a summary of results of the review of authority to act and the comparative and aggregated analyses of CAPs.
● Authority Exists to Procure and Require Carbon-Free Electricity Supply – Local jurisdictions may supply electricity to their citizens either through the formation of community choice aggregator (CCA) or municipal utility, with the primary difference between the two being that the municipal utility owns the distribution and transmission
401
infrastructure while the CCA does not. Both options allow the procurement and supply of higher renewable energy content electricity than that required by California’s Renewable Portfolio Standard (RPS) for the incumbent investor-owned utility. Both options are subject to federal and/or state preemption over reliability, which complicates fully decarbonizing the electricity supply with renewable energy. However, authority exists to support alternatively fueled thermal power plants and related infrastructure that can provide low- or zero-emission (e.g., green hydrogen) electricity to meet reliability and air quality requirements. Local jurisdictions also play a direct role in increasing distributed generation through CCAs, reach codes, and permit streamlining. Local jurisdiction over more stringent regulation of direct emissions from conventional fossil fuel generators is uncertain because of litigation but possibly preempted by the Federal Clean Air Act. California’s Cap-and-Trade preempts local jurisdiction authority over GHG emissions from these fossil fuel facilities unless the facility falls below Cap-and-Trade’s 25,000 metric ton emissions threshold.
● Decarbonizing Electricity has the Highest GHG Reduction in CAPs – Increasing carbon-free electricity is the single largest contributor to GHG reductions in adopted and pending CAPs. All 17 CAPs evaluated have a measure to achieve a high renewable electricity supply, typically from forming or joining a CCA program. If the most aggressive CAP policy related to CCA is applied to all jurisdictions, additional reductions are possible; however, because most CAPs include a measure to achieve or approach 100% renewable or carbon-free electricity supply, expanding participation in CCA programs would increase expected GHG reductions by about 30%, which is less than other policy actions considered in our scenario analysis of GHG impacts from CAP measures.
Opportunities for Further Action
The following summarizes key opportunities for further action.
● Opportunities Exist for Local Policies to Increase Carbon-Free Electricity Supply – In the San Diego region, there is an opportunity for more local jurisdictions to join existing CCAs or to increase renewable supply otherwise and commit to 100% service options for municipal accounts and default community accounts. CCAs also have the ability to develop programs to encourage solar installations, including financial incentives for customer-scale projects and feed-in tariffs for larger scale projects.
● State Requirements for Solar on New Buildings Limit Local Opportunities – In the past, CAPs sought to require solar in new construction, but the State’s building energy code now requires solar for new low-rise residential. Also, while local jurisdictions could require solar in nonresidential new construction, it will be mandated when the next code cycle is effective in January 2023. As a result, the State requirements limit the role of local jurisdictions to reduce GHG emissions from distributed solar. An opportunity exists to evaluate mandating or incentives for energy storage systems paired with solar to decrease marginal emissions during the electric system’s peak and highest GHG emission hours, which will align both with new net energy regulations and rates that reflect these realities.

402
● Opportunities Remain to Require Solar in Alteration and Addition Projects – While upcoming changes to the State’s building energy code will require solar on new nonresidential buildings, there is an opportunity for local jurisdictions to adopt reach codes that require solar on alteration and addition projects. Examples of these policies exist in the region and around California. GHG reductions associated with these policies likely would be limited given the number of affected projects but more analysis would be needed to determine the full potential of these policies.
● Additional Work Would be Needed to Make Carbon-Free Electricity Supply More Accessible – Research shows that most distributed solar PV systems installed in California have been installed in higher-income neighborhoods with higher levels of homeownership compared to the statewide average. Numerous options exist to address the inequitable distribution of solar installations, including targeted incentives and financing. Also, in the short run before California meets its 100% carbon-free electricity requirement, enabling residents in communities of concern to participate in service options with high levels of carbon-free electricity can also address this issue. CCA programs can maximize participation in the Disadvantaged Communities Green Tariff Program and subsidize CARE and FERA customers to opt up to 100% carbon free electricity service options.
8.7.2 Summary of Authority in the Decarbonize the Electric Supply Pathway
Electricity regulation is divided between state regulation of the distribution system and procurement of supply and federal regulation of bulk-power transmission systems and bulk-power markets. In both instances, reliability requirements preempt local authority over electricity procurement where the procurement impacts either CPUC resource adequacy (RA) requirementsi or FERC authority over electric reliability in bulk-power systems.ii The following will discuss local authority in light of the state and federal regulation of conventional and renewable electricity supply resources. Additional information can be found in Appendix B.
Conventional and Fossil Fuel Generation California’s Cap-and-Trade program regulates covered entities that include cogeneration, self-generation of electricity, stationary combustion, and first deliverers of electricity that emit 25,000 metric tons or more of CO2e per data year.iii The CEC is the siting authority for thermal power plants of 50 megawatts or more with authority that preempts local jurisdiction land use authority.iv The CEC is prohibited from siting new nuclear power plants unless there is demonstrated technology or disposal site for high-level nuclear waste.v The Governor may also preempt local land use authority on a limited basis through an emergency declaration.vi Finally, all electric utilities and load-serving entities are
i See Public Utilities Code § 380; See CPUC Resource Adequacy Proceeding R.19-11-009. ii See 14 U.S.C. § 8240. iii 17 C.C.R. §§ 95811 (a)–(b) & 95812(c). iv Public Resources Code §§ 25500 et seq. v Public Resources Code § 25524.2. vi See Governor’s July 30, 2021 Proclamation of A State of Emergency to address energy supply and demand issues; See U.S. Const. Amendment X; See California Emergency Services Act: Government Code §§ 8558, 8567, 8571, 8625, & 8627.
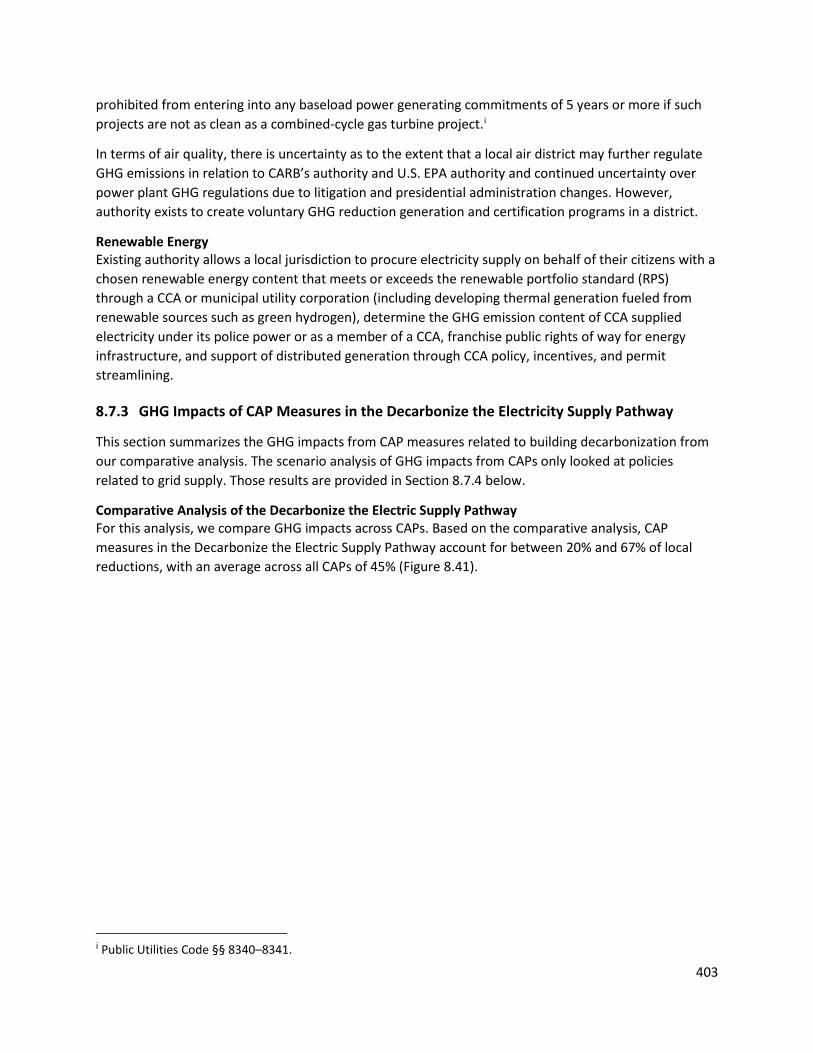
403
prohibited from entering into any baseload power generating commitments of 5 years or more if such projects are not as clean as a combined-cycle gas turbine project.i
In terms of air quality, there is uncertainty as to the extent that a local air district may further regulate GHG emissions in relation to CARB’s authority and U.S. EPA authority and continued uncertainty over power plant GHG regulations due to litigation and presidential administration changes. However, authority exists to create voluntary GHG reduction generation and certification programs in a district.
Renewable Energy Existing authority allows a local jurisdiction to procure electricity supply on behalf of their citizens with a chosen renewable energy content that meets or exceeds the renewable portfolio standard (RPS) through a CCA or municipal utility corporation (including developing thermal generation fueled from renewable sources such as green hydrogen), determine the GHG emission content of CCA supplied electricity under its police power or as a member of a CCA, franchise public rights of way for energy infrastructure, and support of distributed generation through CCA policy, incentives, and permit streamlining.
8.7.3 GHG Impacts of CAP Measures in the Decarbonize the Electricity Supply Pathway
This section summarizes the GHG impacts from CAP measures related to building decarbonization from our comparative analysis. The scenario analysis of GHG impacts from CAPs only looked at policies related to grid supply. Those results are provided in Section 8.7.4 below.
Comparative Analysis of the Decarbonize the Electric Supply Pathway For this analysis, we compare GHG impacts across CAPs. Based on the comparative analysis, CAP measures in the Decarbonize the Electric Supply Pathway account for between 20% and 67% of local reductions, with an average across all CAPs of 45% (Figure 8.41).
i Public Utilities Code §§ 8340–8341.
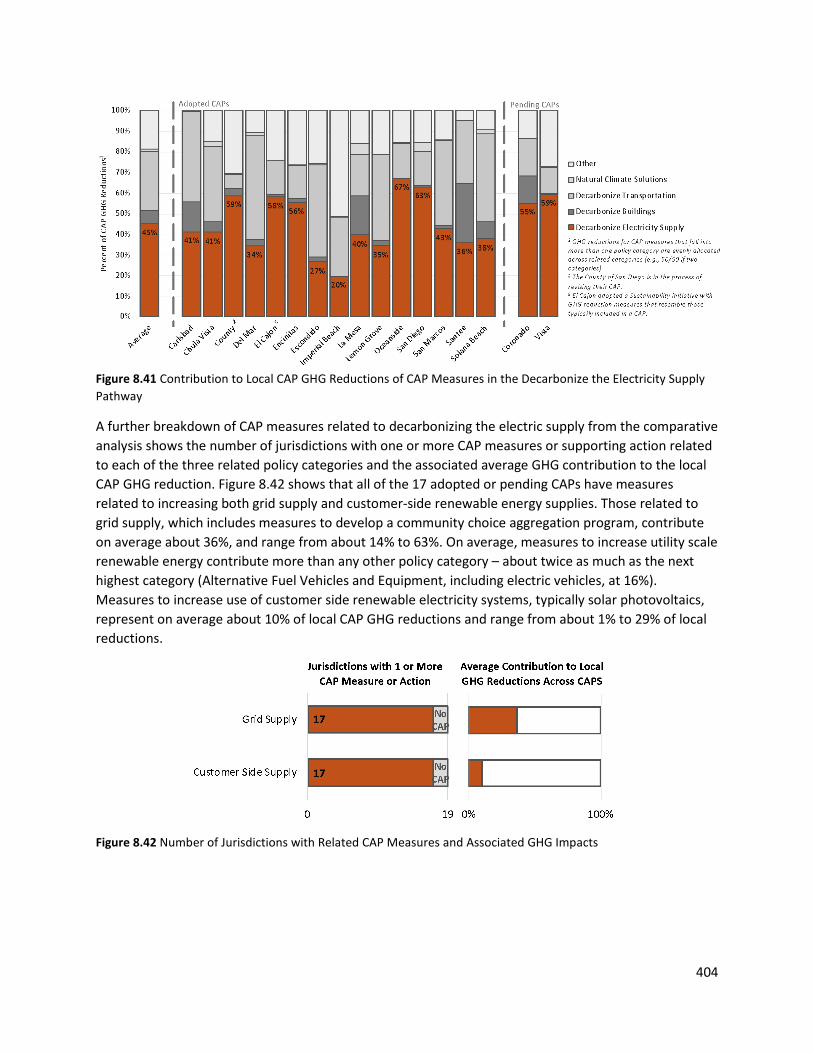
404
Figure 8.41 Contribution to Local CAP GHG Reductions of CAP Measures in the Decarbonize the Electricity Supply Pathway
A further breakdown of CAP measures related to decarbonizing the electric supply from the comparative analysis shows the number of jurisdictions with one or more CAP measures or supporting action related to each of the three related policy categories and the associated average GHG contribution to the local CAP GHG reduction. Figure 8.42 shows that all of the 17 adopted or pending CAPs have measures related to increasing both grid supply and customer-side renewable energy supplies. Those related to grid supply, which includes measures to develop a community choice aggregation program, contribute on average about 36%, and range from about 14% to 63%. On average, measures to increase utility scale renewable energy contribute more than any other policy category – about twice as much as the next highest category (Alternative Fuel Vehicles and Equipment, including electric vehicles, at 16%). Measures to increase use of customer side renewable electricity systems, typically solar photovoltaics, represent on average about 10% of local CAP GHG reductions and range from about 1% to 29% of local reductions.
Figure 8.42 Number of Jurisdictions with Related CAP Measures and Associated GHG Impacts

405
8.7.4 Grid Supply of Carbon-Free Electricity
California has a statutory target of 100% carbon-free electricity supply by 2045. So, regardless of local action, the region’s renewable supply will approach this target. Nonetheless, local governments can accelerate attainment of this goal, thus realizing more overall GHG reductions and doing so earlier than the statutory trajectory. GHG emissions impacts associated with CCAs are those above and beyond what is expected from the state requirements. Table 8.38 summarizes the requirement for renewable and carbon free content of the electric supply. For example, energy suppliers are required to supply 60% renewable content by 2030. If a CAP were to commit to increasing that amount to 75%, the difference would be attributed to CCA and is included in the local CAP GHG reduction.
Table 8.38 SB 100 (2018) Requirements for Renewable and Carbon Free Content in Electric Supply
Renewable Content Requirement
Deadline
44% 21/31/24
50% 12/31/26
52% 21/31/27
60% 12/31/30
100% carbon free 21/31/45
According to the most recent Renewable Portfolio Standards Annual Report submitted to the legislature by the CPUC, the percentage of RPS-eligible renewable supplies for each of the three large IOUs in California ranges from 34% to 39%.i SDG&E has the highest percentage at nearly 39% renewable content. On average, renewable content accounts for about 47% of electricity supplies by Community Choice Aggregation programs in California.
Values reported for IOUs include unbundled renewable energy credits (REC). These may vary from values in the CEC Power Source Disclosure process, which account differently for RECs. CCA programs in the region are not fully operational but have stated that they will not use unbundled RECs and likely will achieve at least 50% renewable content, given the default service plans described in more detail below.
Scenario Analysis of GHG Impacts for the Decarbonize Buildings Pathway In contrast to the comparative analysis, which considers measures in all emissions categories and does not consider the combined impact of measures, the scenario analysis only evaluates emissions from on-road transportation, electricity, and natural gas, and estimates the GHG impact of all related CAP measures. For purposes of showing the combined GHG impact of all CAP commitments to decarbonize
i 2021 Renewable Energy Portfolio Annual Report. November 2021. California Public Utilities Commission. Available at https://www.cpuc.ca.gov/industries-and-topics/electrical-energy/energy-reports-and-whitepapers/rps-reports-and-data.

406
the electricity supply, we only looked at those related to exploring, forming, or joining CCA programs. These represent the vast majority of GHG reductions from CAP commitments, about 1.3 MMT CO2e in 2035. Figure 8.43 shows the impact of these measures (orange wedge) on regional emissions. The upper dashed line represents the legislatively adjusted BAU emissions level. The bottom dashed line represents the impact of policies of all four decarbonization pathways in adopted and pending CAPs.
No customer side renewable electricity is included in the GHG analysis because an increase in distributed solar is embedded in the legislatively adjusted BAU, and some of the policies to increase the amount of solar on new residential construction in adopted and pending CAPs are now mandated by California building energy code Title 24, Part 6. Nonetheless, we provide a review of existing CAP measures related to customer side renewables.
Figure 8.43 San Diego Emissions in Four Decarbonization Pathways with Current CAP Commitments
GHG Impact from Best CAP Commitments Applied Regionwide If the best CAP commitment related to CCA adoption is applied to all local jurisdictions in the San Diego region, the GHG reduction would be about 1.6 MMT CO2e. As noted in Figure 8.45, while the contribution of CCA programs is larger, it represents a smaller portion of the overall reduction that would result from the best CAP commitment in all policy subcategories being applied to all jurisdictions in the region (bottom dashed line). Also, because all electricity in California must be 100% carbon free by 2045, the incremental impact from local actions decreases over time as the supply complies with state mandates. This is why the wedge in both the CAP Commitment (Figure 8.43) and Best CAP Commitment Scenario (Figure 8.44) show that accelerating renewable electricity mandates can lead to higher cumulative GHG reductions (area of the wedge). While this may not affect whether a CAP attains the required emissions level in a target year, it can affect overall atmospheric warming.

407
Figure 8.44 San Diego Emissions in Four Decarbonization Pathways with Current CAP Commitments Applied to All Jurisdictions
CAP Measures Related to Increasing Grid Supply of Carbon-Free Electricity in the San Diego Region Based on the comparative analysis, all 17 of the adopted or pending CAPs reviewed include a measure to explore, develop, or join a community choice aggregation or similar program (Table 8.39). Examples of related CAP measures are provided in Table 8.40. While SDG&E offers a 100% renewable option and a few CAPs include measures related to increasing awareness of this program, it is limited in scope by statute, and SDG&E has requested that the CPUC suspend the program due to current and expected declines in enrollment and consequent increases in costs to customers.i In practice, to leverage local government authority to influence the electricity supply in the region at a significant scale, CCA is the main policy mechanism in this policy subcategory.
Table 8.39 Number of CAP Measures to Increase Renewable Electricity via CCA or Similar Program
i Robb Nikolewski. Why SDG&E Wants to Suspend a Program that Offers Customers Extra Renewable Energy. San Diego Union Tribune, January 6, 2022. Available at https://www.sandiegouniontribune.com/business/story/2022-01-06/sdg-e-looks-to-suspend-customer-program-for-extra-renewable-energy.

408
Table 8.40 Examples of CAP Measures to Expand Grid Supplied Renewable Electricity via CCA or Similar Program
Implementation Mechanism General Policy
Capital Improvement & Infrastructure
NA
Education, Outreach, & Coordination
● Encourage SDG&E to achieve 100% renewable ● Partner with neighboring municipalities to explore CCA feasibility ● Advocate for a regional CCA
Evaluation ● Conduct a CCA feasibility study Incentives NA
Plan or Program ● Develop or join a CCA or similar program ● Adopt a renewable energy procurement policy
Requirement(s) NA
Examples of Policies in Region Because nearly all of the adopted or pending CAPs have a measure to explore, develop, or join a CCA, we focus here on the implementation of those measures. As a result of CAP measures, in part, there are two operational CCAs in the San Diego region: San Diego Community Power and Clean Energy Alliance (Table 8.41). The total number of customers that will be included in these programs is yet to be determined since local jurisdictions continue to join, and each CCA is not serving all customers. As an opt-out program, the total number of participating customers depends on the number that affirmatively opt-out to either continue receiving electricity from SDG&E or from a direct access provider. This will be unknown until all SDCP residential customers are enrolled by the middle of 2022.
Table 8.41 Community Choice Aggregation Programs in the San Diego Region
CCA Program Member Jurisdictions Status
San Diego Community Power (SDCP)
Chula Vista, Encinitas, Imperial Beach, La Mesa, San Diego
National City and County of San Diego joining in 2023
Launched service for Municipal customers in March 2021 and Commercial customers in June 2021. Residential service planned for early 2022.
Clean Energy Alliance (CEA)
Carlsbad, Solana Beach, and Del Mar
Escondido and San Marcos joining in 2023
Launched service on May 1 for Carlsbad, Del Mar and Solana Beach residents.
CCAs can, within statutory limits, determine the percentage of renewable electricity supplied to customers. SDCP has two service plans: PowerOn, which includes 50% renewable supply and serves as the default option for customers; and, Power100, which has 100% renewable supply and is available for

409
the customer to opt-up.i Similarly, CEA has multiple service plans: Clean Impact, which is 50% renewable and is available for customers to opt-down from the default; Clean Impact Plus, which is 50% renewable and 75% Carbon-Free, and serves as the default option for customers; and Green Impact, which is 100% renewable content and is available for the customer to opt-up.ii Figure 8.45 summarizes the renewable energy or carbon-free content of SDCP and CEA service plans.
Figure 8.45 Renewable or Carbon-Free Content of CCE Electricity Service Plans
In addition to the renewable electricity service options offered by CCAs, SDG&E offers EcoChoiceiii and Ecoshare.iv These are opt-in programs that provide customers with an option to purchase 100% renewable electricity. These programs are limited to 59 MW of solar capacity by statute and are currently available to customers. Given the limited customer uptake for these programs and the number of customers transitioning to CCA programs, SDG&E has asked the CPUC to suspend the programs.v
In addition to forming a CCA, there are other actions local governments can take to influence the GHG emissions impact of these programs.
● Choice of Service Plan for Municipal Operations – Because CCA programs offer service plans with differing levels of renewable content, local governments can choose to opt-up to the higher renewable content product for municipal operations. For example, all
i San Diego Community Power. Compare Service Plans webpage. Available at https://sdcommunitypower.org/your-choice/compare-service-plans/. ii Clean Energy Alliance Service Options webpage. Available at https://thecleanenergyalliance.org/your-options/. iii San Diego Gas & Electric. Ecochoice webpage. Available at https://www.sdge.com/residential/savings-center/solar-power-renewable-energy/ecochoice. iv San Diego Gas & Electric. Ecoshare webpage. Available at https://www.sdge.com/residential/savings-center/solar-power-renewable-energy/ecoshare. v Robb Nikolewski. Why SDG&E Wants to Suspend a Program that Offers Customers Extra Renewable Energy. San Diego Union Tribune, January 6, 2022.

410
local governments participating in SDCP have opted up to the Power100 for municipal operations.
● Choice of Default Service Plan for Customers – City of Encinitas opted for Power100 as the default option for customers.
Local governments also can influence is the siting and permitting of renewable electricity generation projects. Currently, no CAPs include measures related to siting electric generation projects. Chapter 2 focuses on siting of large-scale renewable projects in the San Diego region. Based on findings, most utility scale projects would be located in the unincorporated areas of San Diego County.
8.7.5 Customer Side Renewable Electricity
On average, measures to encourage or require solar on buildings account for about 8% of local reductions in CAPs in the San Diego region. CAPs include a range of quantified measures and supporting efforts to increase use of distributed renewable electricity systems, mainly solar photovoltaics.
CAP Measures Related to Distributed Renewable Generation in the San Diego Region Figure 8.46 summarizes the number of CAPs with at least one measure to increase distributed renewable electricity supplies across all implementation mechanisms. The values presented here are not mutually exclusive, and a CAP may have measures in multiple implementation mechanisms or building/construction types. Table 8.42 below provides examples of CAP measures related to distributed renewables for each of the implementation mechanisms.
Figure 8.46 Number of CAPs with Measures to Increase Renewable Electricity via Distributed Generation
Based on the number of CAPs in Figure 8.46, measures to increase renewable electricity from distributed generation systems follow a similar pattern as other policy categories, with most measures falling into three categories: education, outreach, and coordination; incentives; and requirements. In this case, the implementation mechanism with the highest number of CAPs with at least one measure related to education, outreach, and coordination, including a range of actions to raise awareness about distributed generation options and potential funding sources.
The number of remaining CAPs with related measures is roughly evenly split between incentives and requirements. Incentive measures include actions to streamline the permitting process to lower the soft

411
costs associated with solar photovoltaics and make financing available, mainly through property-assessed clean energy (PACE) programs. Focusing on requirements, the highest number of CAPs have measures related to new buildings, with a slightly higher number related to non-residential. These measures include requiring pre-wiring for solar photovoltaics and requiring solar in new construction, additions, and alterations.
More than half of all CAPs have at least one measure to install distributed renewable systems at municipal facilities. As noted above, while municipal energy use is relatively small compared with city- or regionwide energy use, implementing cost effective energy efficiency in municipal buildings provides an opportunity not only to reduce energy expenditures but to model the types of actions that CAPs may include for homes and businesses.
Measures associated with new buildings are represented in the highest number of CAPs. Those associated with new nonresidential building are represented in slightly more CAPs than new residential buildings. As noted above, CAP measures to require solar photovoltaics in new residential construction are no longer valid since California building energy codes now require this for most residential buildings. Measures for existing buildings are relatively underrepresented in CAPs and are mostly requirements associated with additions and alterations.
Table 8.42 Examples of CAP Measures to Expand Renewable Electricity via Distributed Generation
Implementation Mechanism General Policy
Capital Improvement & Infrastructure
● Install solar PV on municipal facilities and other public buildings, including parking lots
Education, Outreach, & Coordination
● Partner with local utility to provide educational materials to account holders
● Support state and regional efforts to increase solar PV installs ● Promote existing funding sources and other resources ● Train city staff to provide educational materials ● Develop regional partnerships to provide educational materials
and technical assistance ● Collaborate with local solar PV providers ● Work with local universities to install solar PV systems ● Pursue partnerships and grant opportunities for funding ● Provide technical resources and case studies
Evaluation ● Evaluate potential for microgrid at municipal facilities
Incentives ● Make permitting easier (e.g., over-the-counter, streamlined, expedited)
● Expand PACE financing options ● Provide incentives for residential and nonresidential PV installs
Plan or Program ● Develop a professional certification permitting program
Requirement(s) ● Require pre-wiring for solar in new developments ● Require solar PV in new developments ● Require qualifying nonresidential additions and alterations to
install solar PV
412
Examples of Policies in Region The 2019 California Building Energy Code (Title 24, Part 6) updates required new low-rise residential projects to include solar photovoltaics. As a result, there are no adopted ordinances in the region to require solar on residential new construction. There are two jurisdictions in the San Diego region that have adopted requirements for certain nonresidential new construction, alteration, and addition projects to install solar. In the 2022 code update, which will take effect January 2023, new nonresidential projects will be required to install solar and storage. Once this code update is effective, reach codes requiring solar on new nonresidential buildings will be obsolete, though opportunities remain for additions and alterations.
The City of Encinitas adopted Ordinance 2021–13 in October 2021. Section 120.10 requires certain nonresidential projects to install solar photovoltaics. This requirement applies to all new nonresidential, high-rise residential, and hotel/motel buildings, alterations that increase total roof area by at least 1,000 square feet, and alterations with a permit valuation of at least $1 million and that affect at least 75% of building floor area. There are two methods to calculate the required amount of solar: one based on gross floor area and the other based on time dependent valuation. Several exceptions are included in the ordinance. For example, buildings with practical challenges, like shading or limited roof space and commercial GHGs, are not required to meet the solar provisions of the ordinance.
The City of Carlsbad adopted a similar ordinance in March 2019 but has thresholds of 2,000 square feet of additional roof area for additions.
8.7.6 Opportunities for Further Local Action to Decarbonize Electricity
Integrate Equity Considerations into Policies to Decarbonize the Electric Supply Several relevant factors related to equity could be considered when considering policies to decarbonize electricity. The following presents a preliminary summary of some of these issues, but additional work would be needed to understand and address these issues in the San Diego region.
In California, most distributed solar PV systems have been installed in higher-income neighborhoods with higher levels of homeownership compared to the statewide average.i However, the proportion of systems installed in disadvantaged communities has increased in recent years.ii This increase is due in part to the falling price of PV and equity-focused programs, including SOMAH, Single-Family Affordable Solar Homes Program (SASH), Multifamily Affordable Solar Housing Program (MASH), and other programs funded by proceeds from California’s Cap and Trade Program.iii Programs like these, solar PV leasing, and property-assessed clean energy (PACE) financing have been associated with higher levels of solar PV adoption in disadvantaged communities.iv The CPUC has an ongoing rulemaking to change
i Verdant Associates LLC. Net-Energy Metering 2.0 Lookback Study. Prepared for CPUC. P. 39. See also G.Barbose, et al. (2021) Residential Solar-Adopter Income and Demographic Trends: 2021 Update. Lawrence Berkeley National Laboratory, p. 39. ii Id. at p. 39. iii Id. at p. 39. iv E. O’Shaughnessy, et al. (2021) The impact of policies and business models on income equity in rooftop solar adoption. Nature Energy, Vol 6, p 84-9.
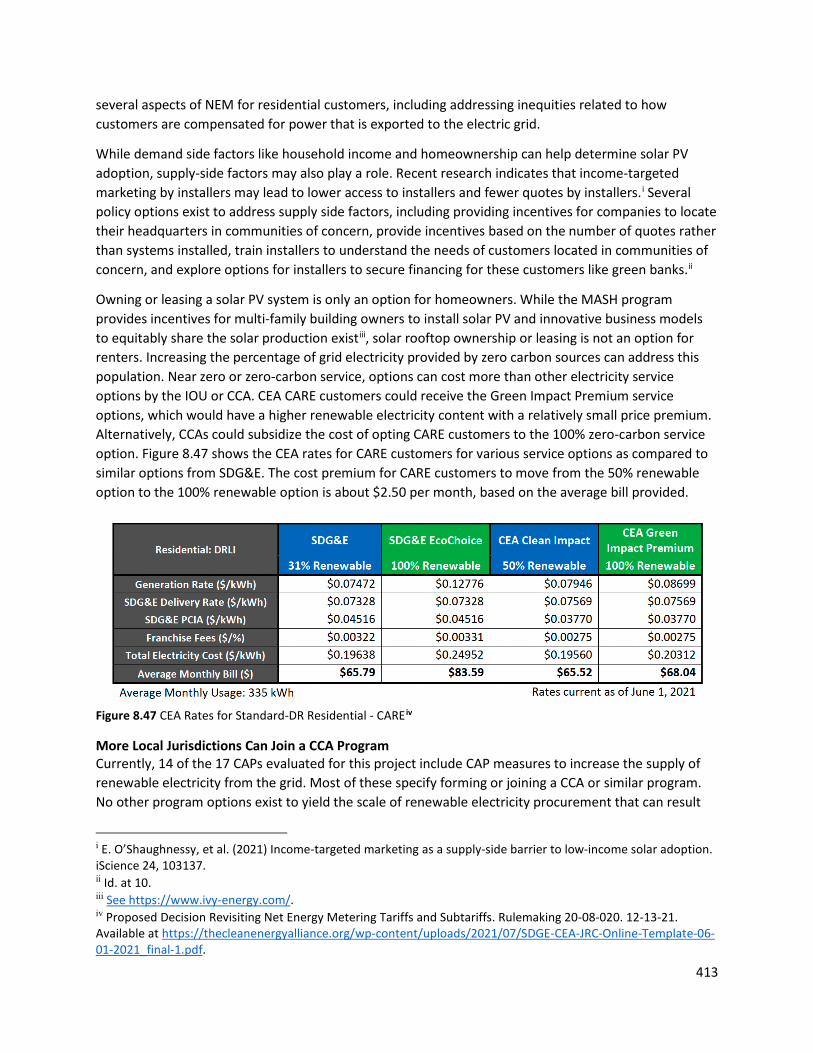
413
several aspects of NEM for residential customers, including addressing inequities related to how customers are compensated for power that is exported to the electric grid.
While demand side factors like household income and homeownership can help determine solar PV adoption, supply-side factors may also play a role. Recent research indicates that income-targeted marketing by installers may lead to lower access to installers and fewer quotes by installers.i Several policy options exist to address supply side factors, including providing incentives for companies to locate their headquarters in communities of concern, provide incentives based on the number of quotes rather than systems installed, train installers to understand the needs of customers located in communities of concern, and explore options for installers to secure financing for these customers like green banks.ii
Owning or leasing a solar PV system is only an option for homeowners. While the MASH program provides incentives for multi-family building owners to install solar PV and innovative business models to equitably share the solar production existiii, solar rooftop ownership or leasing is not an option for renters. Increasing the percentage of grid electricity provided by zero carbon sources can address this population. Near zero or zero-carbon service, options can cost more than other electricity service options by the IOU or CCA. CEA CARE customers could receive the Green Impact Premium service options, which would have a higher renewable electricity content with a relatively small price premium. Alternatively, CCAs could subsidize the cost of opting CARE customers to the 100% zero-carbon service option. Figure 8.47 shows the CEA rates for CARE customers for various service options as compared to similar options from SDG&E. The cost premium for CARE customers to move from the 50% renewable option to the 100% renewable option is about $2.50 per month, based on the average bill provided.
Figure 8.47 CEA Rates for Standard-DR Residential - CARE iv
More Local Jurisdictions Can Join a CCA Program Currently, 14 of the 17 CAPs evaluated for this project include CAP measures to increase the supply of renewable electricity from the grid. Most of these specify forming or joining a CCA or similar program. No other program options exist to yield the scale of renewable electricity procurement that can result
i E. O’Shaughnessy, et al. (2021) Income-targeted marketing as a supply-side barrier to low-income solar adoption. iScience 24, 103137. ii Id. at 10. iii See https://www.ivy-energy.com/. iv Proposed Decision Revisiting Net Energy Metering Tariffs and Subtariffs. Rulemaking 20-08-020. 12-13-21. Available at https://thecleanenergyalliance.org/wp-content/uploads/2021/07/SDGE-CEA-JRC-Online-Template-06-01-2021_final-1.pdf.

414
from CCA programs. As noted above, two CCAs have formed in the San Diego region: SDCP (6 jurisdictions) and CEA (5 jurisdictions). Eight cities in the region have not joined one of the CCA programs in the region, though it appears that there are ongoing discussions. If the additional cities joined a CCA or developed another measure to increase the amount of carbon-free electricity delivered to their jurisdiction earlier than required by state law, more GHG reductions would occur earlier than otherwise expected. Based on our Aggregated CAP Commitment analysis, current CAP commitments would reduce GHG emissions by 1.2 MMT CO2e, while a scenario in which all jurisdictions adopted the most aggressive renewable energy measures would result in 1.6 MMT CO2e. The overall GHG impact would be relatively small since most jurisdictions already have committed to a high percentage of renewable electricity. And since the law requires 100% carbon free electricity supply by 2045, the annual reduction in that year would not change; however, reducing emissions earlier than state law requires would lead to higher cumulative emission reductions.
Develop Options to Supply Higher Carbon-Free Content Electricity to Residents and Businesses Because CCAs are opt-out programs, eligible residents and businesses are automatically enrolled into default service options. Customers can opt-out of the program altogether or select another service option, which could have a higher level of renewable content. Getting more customers to participate in the 100% carbon-free service option would increase the GHG impacts of CCA programs. Participating jurisdictions can consider the following options,
● Make 100% Carbon-Free Default for All Participants – One option is to make 100% renewable option default for all customers and allow customers to opt-down to lower renewable content service options. This can be done on a jurisdiction by jurisdiction basis. For example, the City of Encinitas City Council voted to make SDCP’s 100% renewable option (Power100) the default for all participants.i East Bay Community Energy provides transparent tracking of the default service options for all participating cities. Of the 15 participating jurisdictions, five make the 100 carbon-free service option default for all customers, and another two make it the default for residential customers only. ii
● Participate in Disadvantaged Communities Green Tariff Program – Because the higher renewable content service options is often more expensive, not all participants will be able to cover the incremental costs. As directed by AB 327 (2013), the California Public Utilities Commission (CPUC) developed options for certain income qualified customers who live in disadvantaged communities (DACs) to have access to renewable electricity generated locally.iii In June 2018, the CPUC created the Disadvantage Communities Green Tariff (DAC-GT), which allows income-qualified, residential customers in DACs who may not be able to install solar to receive a 20% bill discount for higher renewable content electricity supply.iv The program is similar to the existing Green Tariff portion of
i Coast News. March 2, 2021. Encinitas commits to San Diego’s renewable electricity offering. Available at https://thecoastnews.com/encinitas-commits-to-san-diegos-renewable-electricity-offering/. ii East Bay Community Energy. Service levels transitions webpage. Avaialble at https://ebce.org/transition-to-renewable-energy/. iii Assembly Bill (AB) 327 (Perea, 2013) iv California Public Utilities Commission. Decision 18-06-027 in Rulemaking 12-07-002. Available at http://docs.cpuc.ca.gov/PublishedDocs/Published/G000/M216/K789/216789285.PDF. See also
415
the Green Tariff/Shared Renewables Programsi (i.e., EcoChoice and EcoShare in the SDG&E service territory) and is available to customers who meet the income eligibility requirements for the California Alternate Rates for Energy (CARE) and Family Electric Rate Assistance (FERA) programs and live in an investor-owned utility service territory (e.g., SDG&E).ii
● Subsidize Cost to Opt-up to 100% Carbon Free for CARE and FERA Customers – Additional options may be possible, including subsidizing the incremental cost for CARE and FERA customers to opt-up to 100% carbon-free service options. Additional research would be needed to determine the GHG impacts of opting up and the additional costs to determine whether a program to opt-up to 100% renewable content is a cost effective means to reduce GHG emissions.
Supply Municipal Operations with Carbon-Free Electricity Local jurisdictions that participate in a CCA program can opt up to the 100% carbon-free service options for municipal operations. All cities in SDCP have opted up to the 100% carbon-free service option for municipal operations.iii For jurisdictions not participating in a CCA, other options exist, including SDG&E EcoChoice, though there is a regional CAP on the amount of solar projects that can be installed to supply this program, and SDG&E has recently requested the CPUC to suspend the program due to limited uptake.
Require Solar PV on Existing Nonresidential Buildings Local jurisdictions have the authority to adopt local energy codes that exceed statewide building energy codes (Title 24, Part 6) and could require solar on new nonresidential construction, additions, and alterations. California building energy codes already require solar for low-rise residential buildings. The Cities of Carlsbad and Encinitas adopted an ordinance to require solar on non-residential buildings. While local jurisdictions have authority, statewide cost effectiveness studies are available, and examples exist in the region, a solar requirement for new nonresidential buildings would be obsolete as soon as the most recently approved codes are effective in January 2023 since solar and storage will be required for new nonresidential buildings. However, there is an opportunity for local jurisdictions to adopt reach codes that require solar on alteration and addition projects. Examples of these policies exist in the region and around California. GHG reductions associated with these policies likely would be limited given the number of affected projects, but more analysis would be needed to determine the full potential of these policies.
https://www.cpuc.ca.gov/industries-and-topics/electrical-energy/solar-in-disadvantaged-communities/the-disadvantaged-communities-green-tariff-dac-gt-program. i California Public Utilities Commission. Green Tariff/Shared Renewables program (GTSR) webpage. Available at https://www.cpuc.ca.gov/industries-and-topics/electrical-energy/electric-rates/green-tariff-shared-renewables-program. ii San Diego Gas & Electric. Bill Payment Assistance webpage. Available at https://www.sdge.com/residential/pay-bill/get-payment-bill-assistance/assistance-programs. iii Personal communication with SDCP Director of Data Analytics and Account Services, Lucas Utouh, 9-30-21.
416
Other Local Opportunities Through the supply procurement authority of existing CCAs in the region, there is an opportunity to explore options to decrease emissions from in-region and out-of-region thermal fossil fuel generation that supply electricity to the San Diego region. This may include:
● Evaluating development and procurement of low-carbon or zero-carbon fuel alternatives — such as hydrogen — to existing natural gas fired base generators and fast start generators that both achieve GHG reduction objectives, decrease local criteria pollutants, and ensure system and local reliability; and
● Evaluate carbon removal and storage options for existing in-region or contracted for out-of-region natural gas generation where these facilities will be required to operate per federal and state reliability standards.
For distributed energy resources, additional opportunities exist to expand upon state statutory mandates for streamlined approval of small wind energy systems,i residential rooftop solar PV systems,ii and advanced energy storage systems.iii There is opportunity to further streamline the application approval process for larger wind energy systems, nonresidential and large residential solar PV systems, and energy storage systems that are not covered by the current statutory language.
Potential for Regional Collaboration In addition to the measures and policies local jurisdictions can adopt on their own, there are opportunities for collaboration across jurisdictions and even regionally to increase use of carbon-free electricity.
Develop CCA Customer Programs to Encourage Use and Generation of Clean Electricity CCAs in California have developed programs to encourage participation in high renewable or carbon-free electricity service options or installation of distributed solar projects.
● Net Energy Metering (NEM) – NEM allows customers to be compensated for electricity exported to the electric grid on a monthly basis. The amount of electricity exported to and imported from the grid is summed, and if a customer is a net importer, they are charged; if the customer is a net exporter, they are paid the retail value of that amount. Because CCA programs set their own electric rates, subject to state law and regulatory requirements, they can modify the terms of certain aspects of NEM, including the crediting process and rate used to compensate net exporters. Also, customers that are net exporters on an annual basis are eligible for net surplus compensation, which uses a rate called the default load aggregation point (DLAP) price, sometimes referred to as average wholesale rates.iv This rate is much lower than the retail rate used for calculating the value of net exported electricity each month. CCAs can also modify the net surplus compensation rate. For example, Marin Clean Energy offers two times the
i See AB 45 (Blakeslee, Chapter 404, Statutes of 2009). ii Government Code §§ 65850.5 & 65850.55. iii Government Code § 65850.8. iv In D.11-06-016, the CPUC determined that the electricity portion of the net surplus compensation rate is the simple rolling average of the default load aggregation point (DLAP) price from 7 a.m. to 5 p.m. that corresponds to the customer's 12-month true-up period.

417
DLAP offered by the incumbent utility, Pacific Gas & Electric (PG&E).i Note that the CPUC has an ongoing rulemaking to change several aspects of NEM for residential customers that may affect the cost effectiveness of installing distributed solar.ii
● Financial Incentives – CCAs in California offer financial incentives to encourage installation of distributed solar and projects that include energy storage. For example, East Bay Community Energy (ECBE) has a rebate program for solar projects energy storage to improve resilience,iii and Marin Clean Energy provides MCE solar rebates for communities of concern.iv
● Feed In Tariffs – In addition to programs to encourage customers to increase supply of renewable electricity, CCAs also can develop programs to encourage development of renewable electricity projects within its service. Some CCAs have Feed-In tariffs (FiT), which purchase electricity from local projects for a fixed price over a fixed number of years. In January 2021, the SDCP adopted a Feed-In Tariff (FIT) and will be launching the program in 2022.v Other CCAs have existing programs. For example, Marin Clean Energy has two FiT programs. Projects that are up to 1 MW are eligible for the FiT Program, while projects between 1 MW and 5 MW are eligible for the Fit Plus Program.vi
Collect and Assess Data on Equity and other Indicators Related to Renewable Electricity Similar to other policy categories, there is a general need to continue to develop capacity in the region to collect, assess, and communicate data on equity and other energy-related indicators. Such data would allow additional analysis in the region to assess the current impact of renewable electricity policies in the region and to enable the process to develop policies and processes to address any inequities found.
Regional Program to Support Reach Code Policy Development Similar to the opportunity described in Section 8.6.6 above, a regional program could support development and implementation of regional reach codes to encourage installation of distributed solar. This program could leverage existing resources, including SDG&E Codes and Standards program and Statewide Reach Code Program.vii The Clean Power Alliance, the Los Angeles region’s CCA, completed a report on potential programs and identified a regional reach code program as one option. Based on the report, such a program could: develop model ordinances to streamline the process for local jurisdictions, provide funding to local governments for the development and adoption process of a building
i Marin Clean Energy. Solar Program webpage. Available at https://www.mcecleanenergy.org/solar-customers/. ii California Public Utilities Commissions. Proposed Decision in Rulemaking 20-08-020 (Dec. 13. 2021). iii East Bay Community Energy. Resilient Homes Program webpage. Available at https://ebce.org/resilient-home/. iv Marin Clean Energy. Solar Rebates and Discounts for MCE Customers webpage. Available at https://www.mcecleanenergy.org/solar-rebates/. v San Diego Community Power. Community Advisory Committee Presentation, Special Meeting Dec. 9. 2021. Available at https://sdcommunitypower.org/wp-content/uploads/2020/12/CAC-Presentation_v1.pdf. vi Marin Clean Energy. Feed In Tariffs webpage. Available at https://www.mcecleanenergy.org/feed-in-tariff/. vii Statewide Reach Codes Program, California Energy Codes and Standards – A Statewide Utility Program. Available at https://localenergycodes.com/.

418
electrification code, and make available technical assistance to municipalities that want to adopt a distributed solar reach codes.i
One notable limitation to this approach for distributed solar is that statewide building energy codes already require solar for certain low-rise residential new construction projects and will require new nonresidential buildings to install solar and storage in the next triennial code update cycle.
i Clean Power Alliance. 2020 Local Programs for a Clean Energy Future. Available at https://electricenergyonline.com/article/energy/category/ev-storage/143/849132/clean-power-alliance-approves-new-five-year-clean-energy-programs-plan.html.
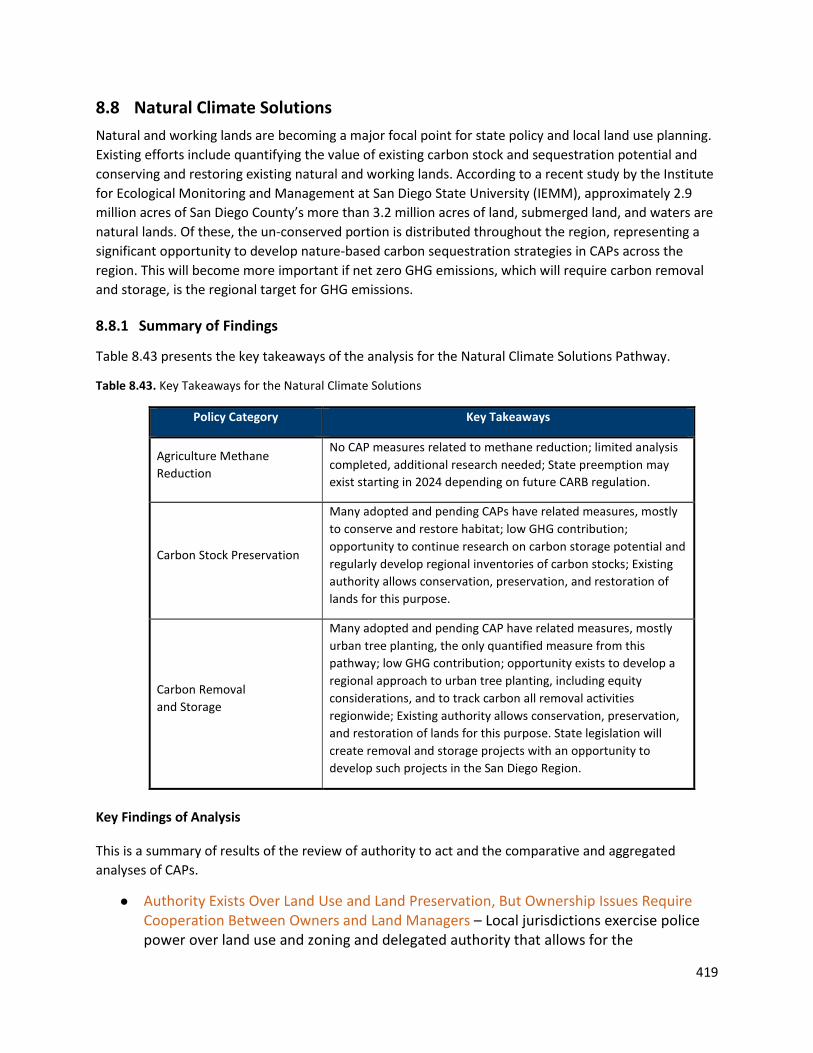
419
8.8 Natural Climate Solutions Natural and working lands are becoming a major focal point for state policy and local land use planning. Existing efforts include quantifying the value of existing carbon stock and sequestration potential and conserving and restoring existing natural and working lands. According to a recent study by the Institute for Ecological Monitoring and Management at San Diego State University (IEMM), approximately 2.9 million acres of San Diego County’s more than 3.2 million acres of land, submerged land, and waters are natural lands. Of these, the un-conserved portion is distributed throughout the region, representing a significant opportunity to develop nature-based carbon sequestration strategies in CAPs across the region. This will become more important if net zero GHG emissions, which will require carbon removal and storage, is the regional target for GHG emissions.
8.8.1 Summary of Findings
Table 8.43 presents the key takeaways of the analysis for the Natural Climate Solutions Pathway.
Table 8.43. Key Takeaways for the Natural Climate Solutions
Policy Category Key Takeaways
Agriculture Methane Reduction
No CAP measures related to methane reduction; limited analysis completed, additional research needed; State preemption may exist starting in 2024 depending on future CARB regulation.
Carbon Stock Preservation
Many adopted and pending CAPs have related measures, mostly to conserve and restore habitat; low GHG contribution; opportunity to continue research on carbon storage potential and regularly develop regional inventories of carbon stocks; Existing authority allows conservation, preservation, and restoration of lands for this purpose.
Carbon Removal and Storage
Many adopted and pending CAP have related measures, mostly urban tree planting, the only quantified measure from this pathway; low GHG contribution; opportunity exists to develop a regional approach to urban tree planting, including equity considerations, and to track carbon all removal activities regionwide; Existing authority allows conservation, preservation, and restoration of lands for this purpose. State legislation will create removal and storage projects with an opportunity to develop such projects in the San Diego Region.
Key Findings of Analysis
This is a summary of results of the review of authority to act and the comparative and aggregated analyses of CAPs.
● Authority Exists Over Land Use and Land Preservation, But Ownership Issues Require Cooperation Between Owners and Land Managers – Local jurisdictions exercise police power over land use and zoning and delegated authority that allows for the

420
preservation of land through conservation and agricultural easements with regard to natural and working lands. However, presently it is unclear to what extent local authority can be exercised over activities on private natural and working land beyond land use designation with regards to GHG regulation. The region is complicated because it is composed of federal, state, tribal, and privately held land, submerged land, and waters. Various statutes and agencies regulate the different land types, with none focused on GHG emissions or sequestration as it relates to land use. State land use and regulating agencies also operate with a wide range of statutory mandates. California statutes and executive orders require state land use agencies to account for GHG emissions from natural and working lands as well as begin to assess and regulate carbon removal and storage on these lands with significant targets in 2030. Local jurisdictions act with authority to preserve land, set goals, evaluate how to quantify and implement carbon storage requirements on existing land, and work with private owners, tribes, and state and federal land managers to achieve state, regional, and local goals related to natural and working lands. Developing local GHG targets and aligning with state goals, statutes, quantification methods informed by San Diego specific carbon valuation science, and funding may provide a path forward to achieve local natural and working land objectives.
● The Only Quantified CAP Measure Relevant to This Pathway is Urban Tree Planting – Based on our comparative CAP analysis, nearly all CAPs (15) have at least one measure related to urban tree planting, though these measures contribute on average just over 1% of local GHG reductions in CAPs. Based on our scenario analysis, the total GHG reduction expected from urban tree planting measures, which assumes 7% tree cover in developed areas, would be 0.1 MMT CO2e in 2035. If the best CAP commitment, which assumes 35% tree cover, were applied to all jurisdictions in the region, the reduction would be 0.6 MMT CO2e.
Opportunities for Further Local Action
The following summarizes key opportunities for further action.
● Opportunities at Jurisdictional Level and Regional Collaboration in Identifying Suitable Tree Planting Locations – Existing urban canopy cover varies by jurisdiction, ranging from 7% to 22%. CAP urban tree planting targets do not specify suitable tree planting locations or where trees are needed the most. Opportunities exist at the jurisdictional level to identify locations based on local needs. The most aggressive CAP measure commits to 35% urban canopy cover in developed areas. Not all developed areas in the region are suitable for tree planting. An opportunity exists for cross-jurisdictional collaboration to identify suitable locations across the region, including taking into account social equity considerations.
● Continue and Increase Land Conservation, Preservation, and Restoration Across the Region – Existing authority allows land conservation, preservation, and restoration on natural and working lands. There is an opportunity to increase existing efforts and to explore additional actions to further conserve, preserve, and restore these lands.
421
● Collaboration with Tribes, State and Federal Land Agencies and Managers, and Private Land Owners – It is necessary to evaluate the various mandates on these lands and waters to determine where collaboration is viable to achieve local, regional, and state goals for natural and working lands. Private land owners also serve as important partners to preserve land and to test and fund pilot projects for carbon removal and storage.
● Continue to Develop and Integrate both State and Local Science for the Value and Integration of Natural and Working Lands in CAPs and other Land Use Plans – CARB is currently developing methods to quantify carbon values for these lands and demonstrate sequestration values. This could be integrated with existing local science on San Diego region's natural and working land carbon values from San Diego State University’s IEMM and other San Diego specific science.
● Develop Land Use Specific Values for Land Conservation and Restoration, including Agricultural Land – There are opportunities to conserve and preserve additional land across the region. There are also some opportunities to restore land. The science behind the value of these actions is developing and needs additional support. The region could identify lands that can be conserved or preserved in support of existing and future land use planning. This process must include all tribal, federal, private, and local government stakeholders. This process could also account for the new SB 27 (2021) mandate that calls for the creation of natural and working land carbon removal and storage projects. To the extent possible, the San Diego region could develop and aid in creating these projects.
● Develop and Regularly Update a Regional Carbon Stock Inventory Based on San Diego Specific Science – Similar to the CARB Inventory of Emissions from Natural and Work Lands, the San Diego region could develop a process to regularly estimate and track over time the amount of carbon stored vegetation, wetlands, etc. This would help to understand how carbon stocks are being preserved and whether net emissions occurred due to changes in land use. These emissions are not typically included in the communitywide GHG inventory of local jurisdictions, but tracking changes over time can help understand the region’s net impact on emissions, which can imply contribution to warming. A similar process could be developed to track carbon removal projects regionwide.
8.8.2 Summary of Authority in the Natural Climate Solutions Pathway
The San Diego region is composed of federal, tribal, state, local, and privately held land. The following will discuss authority over this land, submerged land, water, and coast (land(s)). Authority over the land(s) directly determines its uses, potentially limiting whether the use can support GHG reductions, removal, and/or storage. The following will summarize opportunities to engage with federal, tribal, the State of California, and local authorities regarding natural and working lands. It concludes with an analysis of agricultural land. Additional research is required to further vet this pathway. Additional information on all topics presented here can be found in Appendix B.

422
Local Authority Over Natural and Working Lands Cities and counties often use planning and land use control authorities to protect or regulate natural and working lands. In this regard, the full extent of this authority requires further research and development to determine what is feasible at the local level to regulate, preserve, and augment natural and working lands for GHG regulations and any removal or storage activities in the region. Additionally, local jurisdictions act with authority to lobby Congress and the California Legislature, and negotiate with federal, tribal, and state agencies and lands managers to further these aims. Local jurisdictions may act with existing authority to create pilots or programs in this regard. Local jurisdictions also act with existing authority to fund local science to accurately identify and quantify local natural and working lands carbon stock and sequestration potential to inform local decisions and investment. Further research would be needed to develop and vet these and other actions on natural and working lands.
Known local government authorities and actions that can be used to regulate and protect natural and working lands include general plans, specific plans, climate action plans, local coastal plans (LCPs), zoning, special use permits, subdivision maps, and development agreements. Policies that support easements (e.g., conservationi — including California Forest Legacy Program Act easementsii — and open-spaceiii), as well as incentives largely based on easements to preserve land. Local jurisdictions can also apply for state programs — like the Urban & Community Forestry Program under the Urban Forestry Activ to support local urban forestry — efforts that are included in general plans or climate action plans.
Federal Natural and Working Lands The primary actions local jurisdictions may take related to federal lands is through lobbying Congress, engaging with federal lands management agencies to create government to government agreements (e.g., a memorandum of understanding (MOU)), and working directly with federal lands managers to achieve local objectives across the region.
One such example includes evaluation opportunities from the Energy Act of 2020 that established a research, development, and demonstration program to test, validate, or improve technologies and strategies to remove carbon dioxide from the atmosphere on a large scale through activities that include:
● Direct air capture and storage technologies; ● Bioenergy with carbon capture and storage technologies; ● Enhanced geological weathering; ● Agricultural practices; ● Forest management and afforestation; and ● Planned or managed carbon sinks, including natural and artificial.v
i Civil Code §§ 815.1, 815.3, 815.2(a)-(b). ii Public Resources Code § 12200 et seq. iii Government Code § 51070 (The Open-Space Easement Act of 1974). iv Public Utilities Code § 4799.06–4799.12. v 47 H.R. 133 — 116th Congress (2019-2020): Consolidated Appropriation Act, 2021. December 27, 2020 (Public Law No: 116-260), Division Z (Energy Act of 2020), Title V: https://www.congress.gov/bill/116th-congress/house-bill/133/text.

423
There is opportunity at the state and local level to develop and demonstrate or benefit from projects funded by this legislation. Further efforts could be made to investigate this opportunity, particularly with regard to federal land in the region.
For the four main federal land managers (excluding the Department of Defense), opportunities to coordinate with local governments or the State of California based on federal land and resources in the San Diego region:
● National Parks Service (NPS): The NPS’s discretion in achieving its mission suggests that partnering with local jurisdictions to decrease carbon emissions related to the Cabrillo Monument and increase natural land carbon removal may be feasible. Any action would need to be consistent with the purpose of creating the Cabrillo National Monument.i It may also be possible to preserve land through the creation of a national park or additional monument in the San Diego region.
● Fish and Wildlife Service (FWS): There is some level of discretion afforded to FWS officials with regards to uses that should be further analyzed. Opportunities may include increasing the size of existing refuge and working with FWS officials to exercise their discretion in a way that benefits regional decarbonization goals.
● Bureau of Land Management (BLM): BLM land managers act with broad discretion to plan and manage land and resources. Local BLM managers act with different authorities when compared to U.S. Forest Service officials, who must change already established localized plans developed in compliance with existing broad agency rules that limit discretion. This may provide an opportunity for local jurisdictions to work directly with local BLM land managers on decarbonization efforts in the San Diego region.
● The U.S. Forest Service (U.S.F.S.): Because there are localized planning requirements and less manager discretion, there is less flexibility with National Forest land than BLM land without amending or creating a new local plan under the NFMA. However, inclusion of decarbonization actions in U.S.F.S. authority to issue broad rules of applicability to manage forest land does create an opportunity for local jurisdictions to engage in the U.S.F.S. regulatory process that affects local planning in addition to advocating for changes to existing local plans, such as the Cleveland National Forest Land Management Plan.
Tribal Authority Over Natural and Working Lands States and local governments generally act with limited to no authority over tribal land use and activity. Cooperative intergovernmental policies and agreements that support tribal land preservation, land conservation, and decarbonization efforts through mechanisms that include the fee-to-trust process appear to be existing paths to work with tribes in achieving regional decarbonization goals.
State of California Authority Over Natural and Working Lands California actively manages natural and working lands through various agencies with a wide range of authority and missions. State authority and specific agency authority to preempt local police power over zoning is narrow and limitedii to specific statewide objects, that include housing requirements but not where the units should be zoned,iii and specific areas like the coastal zone or under the Subdivision Map
i See United States v. City & County of Denver, 656 P.2d 1 (Colo. 1982). ii See Government Code § 65000 et seq.; See Scrutton v. County of Sacramento, 275 Cal. App. 2d 412, 417 (1978). iii See Government Code §§ 65913.1(a), 65863.5, 65583(a)(3), 65584, & 65584.01.
424
Act.i, ii State preemption over charter city municipal affairs is expressly limited by California Constitution Article XI, §§ 3 and 5. Additionally, CEQA applies to a broad range of projects, as defined, on natural and working lands and is a major consideration when analyzing land and resource uses. The California Endangered Species Act may also affect use of habitat and would need to be specifically analyzed.iii
State policy continues to increase focus on natural and working lands that may inform and support local action or create the opportunity to align with state action. The following summarizes some of these state policies:
● SB 1386 (Wolk, Chapter 545, Statutes of 2016) established protecting and managing natural and working lands as state policy to help achieve California’s GHG reduction goals, including the intent to promote cooperation of owners of natural and working lands;
● Executive Order B-55-18’s 18’s goal to achieve carbon neutrality by 2045 incorporates working lands, including agriculture, in the CARB’s 2022 AB 32 Scoping Plan update that is currently under development and expected to be approved by the end of 2022;
● Executive Order N-82-20’s addresses biodiversity, 30% land and coastal water conservation, acceleration of natural carbon sequestration and climate resiliency on natural and working lands, and creation of the Natural and Working Lands Climate Smart Strategy, including setting a statewide target to meet the 2045 carbon neutrality goal.
● SB 27 (Skinner, Chapter 237, Statutes of 2021) established a Natural and Working Land Climate Smart Strategy that includes developing a framework to achieve California’s climate goals and mandates CARB to set CO2 removal targets for 2030 under its Scoping Plan for all emission sectors including those in this framework. It also requires the Natural Resources Agency to create a carbon removal and sequestration registry to identify, list, fund projects by state agencies and private entities, and retire projects in the state that drive climate action on the state’s natural and working lands.
● SB 859 (Committee on Budget and Fiscal Review, Chapter 368, Statutes of 2016) Natural and Working Land Inventory quantitatively estimated the existing state of ecosystem carbon stored in the State's land base and excluded GHG emissions associated with direct human activity quantified in CARB’s annual statewide GHG inventory.iv
● The Natural and Working Lands Climate Change Implementation Plan set targets out to 2030 and pathways to at least double the pace and scale of state-funded restoration and management activities, including: 1) increasing the acreage in soil conservation practices for cultivated land and rangelands by five times to change agricultural land from a net emitter to a sink by 2030; 2) doubling the pace and scale of forest managed
i Government Code §§ 66410 et seq. ii See Government Code §§ 66411, 66421, 66477, 66478, 66479, 66483, & 66484; see also Friends of Lake Arrowhead v. Board of Supervisors, 38 Cal. App. 3d 497, 505, (1974). iii Fish and Game Code § 2050 et seq. iv See CARB California Natural and Working Land Inventory (2018), p. 7 & 15: https://ww2.arb.ca.gov/nwl-inventory.
425
or restored; 3) tripling the pace of restoration of oak savannas and riparian areas; and 4) and doubling the rate of wetland seagrass restoration.i
Agriculture Local jurisdiction's authority over agricultural land stems from police power over land use and zoning. Agriculture emissions or GHG mitigation actions also may be part of a local jurisdiction's climate action plan. It is unclear how and to what extent a local jurisdiction may use its police power to regulate agriculture activities that cause GHG emissions directly. Some potential opportunities are dependent on whether and how CARB regulates certain activities.
Federal authority over agriculture land use and practices is limited with certain land use requirements for leased federal land for farming or animal production but no specific regulation of GHG emissions. As previously stated, the Energy Act of 2020 established a research, development, and demonstration program to test, validate, or improve technologies and strategies to remove carbon dioxide from the atmosphere on a large scale through activities that include Agricultural practices. ii
State policy continues to increase focus on agricultural lands that may inform and support local action or create the opportunity to align with state policy and funding. Beyond SB 1386 (2016) establishing protecting and managing natural and working lands as state policy, SB 1383 (2016) mandated that CARB achieve a 40% reduction in methane emissions below 2014 levels by 2030, including reducing emissions from livestock manure management operations and dairy manure management operations the creation and implementation of a Short-Lived Climate Pollutant Strategy. SB 1383 (2016) sets the date of on or after January 1, 2024, as the effective date to implement regulation of these emissions with ongoing investments and incentives to achieve the reductions. SB 1383 (2016) also limits regulation of enteric fermentation to incentive-based mechanisms until CARB and the Department of Food and Agriculture determine that a cost-effective and scientifically proven method of reducing enteric emissions is available, adoption of which would not damage animal health, public health, or consumer acceptance. It remains unclear whether CARB will enact regulations in 2024 to achieve these reductions. CARB regulation will likely preempt local authority action, but the current state offers an opportunity for local regulation unless, and until, CARB acts.
AB 32 (2006) and SB 32 (2016) authorized programs do not directly regulate agricultural land use, onsite agriculture GHG emission (excluding off-road emissionsiii), require carbon sequestration, or require carbon removal on working agricultural lands. However, Executive Orders B-55-18, N-82-20 require agricultural land to meet the 2045 carbon neutrality goal. SB 27’s (2021) Natural and Working Land Climate Smart, CO2 removal targets for 2030 under the Scoping Plan for all emission sectors, including agriculture, and creation of a carbon registry for carbon removal and sequestration will drive climate action on agricultural land.
i See January 2019 Draft California 2030 Natural and Working Lands Climate Change Implementation Plan (Updated January 2019), p. 13–14: https://ww2.arb.ca.gov/sites/default/files/2020-10/draft-nwl-ip-040419.pdf. ii 47 H.R. 133 — 116th Congress (2019-2020): Consolidated Appropriation Act, 2021. December 27, 2020 (Public Law No: 116-260), Division Z (Energy Act of 2020), Title V: https://www.congress.gov/bill/116th-congress/house-bill/133/text. iii See CARB Funding Agricultural Replacement Measures for Emission Reductions: https://ww2.arb.ca.gov/our-work/programs/farmer-program.

426
These efforts will further support existing agriculture preservation statutes in the coastal zone,i the long-term productivity of soil,ii and under the Williamson Act (California’s primary agricultural preservation statute).iii It will also likely affect CEQA analysis on land conversion and agricultural land preservation mitigation.
Finally, the April 2019 CARB NWL Implementation Plan, informed by SB 859’s (2016) Natural and Working Land Inventory’s quantitative estimate of the existing state of ecosystem carbon stored in the State's land base (excluding GHG emissions associated from direct human activity quantified in CARB’s annual statewide GHG inventory)iv, sets targets out to 2030 and pathways to scale needed implementation. Specific to agriculture, these include increasing the acreage in soil conservation practices for cultivated land and rangelands by five times to change agricultural land from a net emitter to a sink by 2030.v The NWL Implementation Plan also calls for increases in compost application, agroforestry, grazing land and grassland management, and cropland management to decrease emissions and increase carbon sequestration.vi
8.8.3 GHG Impacts of CAP Measures in the Natural Climate Solutions Pathway
Natural Climate Solutions is different from the other decarbonization pathways. The other pathways focus on reducing GHG emissions. This pathway focuses on carbon removal and storage. We make a distinction between carbon removal and storage – sometimes referred to as sequestration – and preserving existing stocks of carbon. For example, the GHG impacts of carbon removal and storage measures are due to physically removing carbon dioxide from the atmosphere through activities like urban tree planting and carbon farming. Such activities increase removal capacity (e.g., planting new trees) or enhance the amount of existing capacity (e.g., increasing the capacity of existing vegetation to remove carbon). On the other hand, preserving existing carbon stocks seeks to conserve the existing capacity of natural systems to store carbon. In this case, GHG impacts are associated with avoiding the conversion of existing land. For example, creating easements prevent development of existing land prevents potential emissions from disturbing natural vegetation and soil. Note that emissions associated with avoided development (e.g., reduction in VMT) are addressed in the Decarbonizing Transportation Section (Section 8.5). Table 8.44 summarizes the policy categories and subcategories used to analyze this decarbonization pathway. In the context of this decarbonization pathway, methane reduction refers to emissions related to agriculture, mainly from livestock. Because there are no related CAP measures, we do not discuss this policy category further in this chapter.
i See Public Resources Code § 30000 et seq. (Coastal Act) & § 31000 et seq. (State Coastal Conservancy); Public Resources Code §§ 31050, 31051, 30241, 30114, 30243, 30108.6, 30500(c), 30200(a), 30514, 30241.5, 30241, 30250, 30610.1, 30242, 31054, 31104.1, 31150, 31151, 31152, 31156. ii Public Resources Code § 30243. iii Government Code § 51201(c); See Government Code § 51200 et seq. iv See CARB California Natural and Working Land Inventory (2018), p. 7 & 15: https://ww2.arb.ca.gov/nwl-inventory. v See January 2019 Draft California 2030 Natural and Working Lands Climate Change Implementation Plan (Updated January 2019), p. 13: https://ww2.arb.ca.gov/sites/default/files/2020-10/draft-nwl-ip-040419.pdf. vi See January 2019 Draft California 2030 Natural and Working Lands Climate Change Implementation Plan (Updated January 2019), p. 17: https://ww2.arb.ca.gov/sites/default/files/2020-10/draft-nwl-ip-040419.pdf.

427
Table 8.44 Policy Categories Included in the Natural Climate Solutions Pathway Policy Category Policy Subcategory
Carbon Removal and Storage
Urban Tree Planting
Conservation & Restoration Projects (Removal)
Urban Gardens
Carbon-Farming Practices (Removal)
Turf Management
Preservation of Carbon Stocks
Agriculture Easements
Open Space Easements
Wildfire Prevention
Carbon-Farming Practices (Preservation)
Conservation & Restoration Projects (Preservation)
Agriculture Methane Reduction
TBD
Comparative Analysis of CAP Measures
For this analysis, we compare GHG impacts across CAPs. Based on the comparative analysis, CAP measures in the Natural Climate Solutions pathway account for between 0% and 5% of local reductions, with an average across all CAPs of about 1% (Figure 8.48).
Figure 8.48 Contribution to Local CAP GHG Reduction of Natural Climate Solutions Measures

428
Based on the comparative CAP analysis, nearly all adopted or pending CAPs include at least one measure related to carbon removal and storage, but only one has measures related to preserving carbon stocks (Figure 8.49). The estimated GHG impact of these measures in CAPs is minimal. Carbon removal and storage measures contributed on average just over 1% to local GHG reductions, while preserving carbon stocks contributes less than 1%. No CAPs had measures related to agriculture methane reductions.
Figure 8.49 Number of Jurisdictions with Related CAP Measures and Associated GHG Impacts
Scenario Analysis of GHG Impacts from CAP Measures In contrast to the comparative analysis, which considers measures in all emissions categories and does not consider the combined impact of measures, the scenario analysis only evaluates emissions from on-road transportation, electricity, and natural gas and estimates the GHG impact of all related CAP measures. To assess the combined impact of all adopted and pending CAPs in the region, we summed the activity level in CAP measures and recalculated a regional GHG impact value. For purposes of showing the GHG impact of policies related to this pathway, we only looked at those related to urban tree planting under the carbon removal and storage category because all quantified CAP measures focus on this subcategory. The carbon sequestered would be 0.1 MMT CO2e in 2035. CAP urban tree planting measures include: (1) municipal (e.g., public right-of-way, parks) tree planting targets; (2) urban canopy target for developed area in the jurisdiction; and (3) tree planting targets for new residential and commercial developments (e.g., number of new trees per dwelling unit, number of new trees per surface parking spaces).
Figure 8.50 shows the impact of these measures (green wedge) on regional emissions. The upper and bottom dashed line represents the full impact of all four decarbonization pathways discussed in this document.
A 2015/2016 LiDAR assessment shows existing tree canopy cover at approximately 13% across all jurisdictions in the region, ranging from 7% to 22%.i With the existing CAP commitment, the region would have an additional 7% urban canopy cover.
i San Diego Tree Canopy Assessment. https://perma.cc/4MNP-JGM6.

429
GHG Impact from Best CAP Commitments Applied Regionwide If the best CAP commitment related to urban tree planting is applied to all local jurisdictions in the San Diego region, the carbon sequestration would be about 0.6 MMT CO2e in 2035, as shown in Figure 8.51.
Figure 8.50 San Diego Emissions in Four Decarbonization Pathways with Current CAP Commitment
Figure 8.51 San Diego Emissions in Four Decarbonization Pathways with Current CAP Commitment

430
The best CAP commitment assumes 35% canopy cover of approximately 1 million acres of developed area in the San Diego region. With the best CAP commitment, the region would have additional 21% urban canopy cover, more than the current CAP commitment (7%). While it is not clear whether it would be possible to achieve this level of urban canopy cover across the region, this value represents an upper limit of what can be expected from current CAP measures.
8.8.4 Carbon Removal and Storage
CAP Measure Related to Carbon Removal and Storage Figure 8.52 summarizes the number of CAPs with at least one measure related to carbon removal and storage. More CAPs have measures related to urban tree planting than any other policy subcategory analyzed here. Eleven of the 17 adopted and pending CAPs assessed have a requirement to plant urban trees. Urban forestry measures are the predominant driver of carbon sequestration related GHG reductions in local CAPs, and for the few jurisdictions that do include measures and/or actions that relate to the other policy categories, they are generally not quantified.
Figure 8.52 Number of CAPs with at Least One Related Measure by Implementation Mechanism
Urban Tree Planting Table 8.45 provides examples of the types of CAP measures related to urban tree planting in each of the implementation mechanisms.

431
Table 8.45 Examples of General CAP Policies Related to Urban Tree Planting Implementation Mechanism General Policy
Capital Improvement & Infrastructure
● Plant street trees ● Include trees in capital improvement projects ● Hire an urban forest program manager ● Manage health of urban forest and other open spaces
Education, Outreach, & Coordination
● Pursue partnerships and grant funding opportunities ● Develop partnerships with neighborhood groups, CBOs, and other
stakeholders ● Develop regional partnerships to establish a regional urban forest
strategy ● Provide educational materials to residential and nonresidential
property owners ● Establish public-private partnerships for volunteer efforts
Evaluation ● Conduct a street tree inventory ● Develop a regional urban tree canopy assessment ● Track trees planted annually
Incentives ● Provide streamlined review for projects with additional trees ● Provide incentives that increase tree plantings ● Give away seedlings during special events
Plan or Program ● Develop an Urban Forestry Master Plan or similar ● Develop/expand an urban forestry program ● Hire an urban forest program manager
Requirement(s) ● Require tree planting in new and redeveloped residential and/or nonresidential properties
● Require shade trees in parking lots ● Require tree planting at new and redeveloped sites when mature
trees are removed
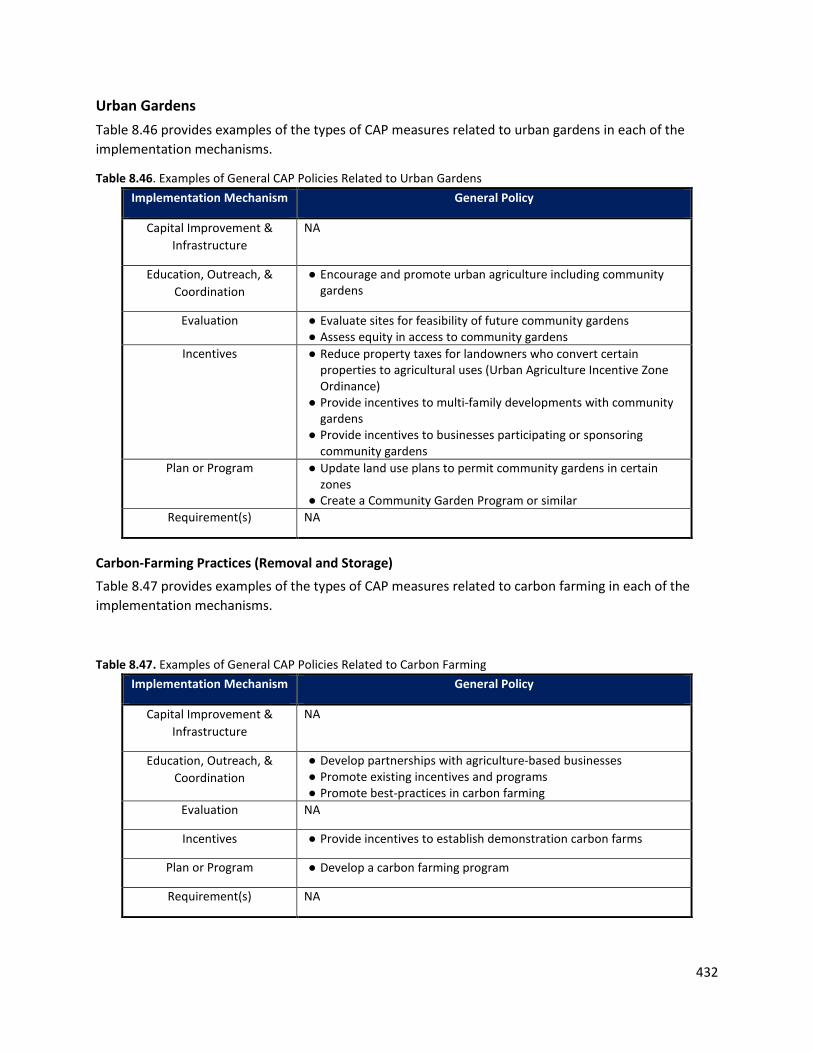
432
Urban Gardens Table 8.46 provides examples of the types of CAP measures related to urban gardens in each of the implementation mechanisms.
Table 8.46. Examples of General CAP Policies Related to Urban Gardens Implementation Mechanism General Policy
Capital Improvement & Infrastructure
NA
Education, Outreach, & Coordination
● Encourage and promote urban agriculture including community gardens
Evaluation ● Evaluate sites for feasibility of future community gardens ● Assess equity in access to community gardens
Incentives ● Reduce property taxes for landowners who convert certain properties to agricultural uses (Urban Agriculture Incentive Zone Ordinance)
● Provide incentives to multi-family developments with community gardens
● Provide incentives to businesses participating or sponsoring community gardens
Plan or Program ● Update land use plans to permit community gardens in certain zones
● Create a Community Garden Program or similar Requirement(s) NA
Carbon-Farming Practices (Removal and Storage) Table 8.47 provides examples of the types of CAP measures related to carbon farming in each of the implementation mechanisms.
Table 8.47. Examples of General CAP Policies Related to Carbon Farming Implementation Mechanism General Policy
Capital Improvement & Infrastructure
NA
Education, Outreach, & Coordination
● Develop partnerships with agriculture-based businesses ● Promote existing incentives and programs ● Promote best-practices in carbon farming
Evaluation NA
Incentives ● Provide incentives to establish demonstration carbon farms
Plan or Program ● Develop a carbon farming program
Requirement(s) NA

433
Turf Management Only three CAPs have measures related to turf management, which all use capital improvement and infrastructure as the implementation mechanism. These CAPs include measures that use top-dressing of compost at City parks.
Conservation and Restoration Projects (Removal and Storage aspects) Only two CAPs have measures related to conservation and restoration projects, which use evaluation as the implementation mechanism. These CAPs include measures to identify opportunities to enhance and conserve habitat and to research and monitor Blue Carbon opportunities.
8.8.5 Preservation of Carbon Stocks
CAP Measure Related to Preservation of Carbon Stocks Figure 8.53 summarizes the number of CAPs with at least one measure related to the preservation of carbon stocks. Only one adopted or pending CAP includes measures related to the preservation of carbon stocks. This reference is through agricultural and open space easements and consists of actions that call for the development of a plan or program and education and outreach efforts. Examples of education and outreach include working with regional partners to identify funding sources for agricultural land protection (e.g., acquisition and management). Examples of plans or programs include developing conservation. No CAPs have measures related to the other policy subcategories listed.
Figure 8.53 Number of CAPs with at Least One Related Measure by Implementation Mechanism
Agriculture and Open Space Easements Several adopted or pending CAPs have measures related to agricultural and open space easements. Those that do have use plan or program and education outreach and Coordination as implementation mechanisms. Examples of education and outreach include working with regional partners to identify funding sources for agricultural land protection (e.g., acquisition and management). Examples of plans or programs include developing conservation.
Other Policy Subcategories No relevant measures or actions are currently included in inactive and pending CAPs for the following policy subcategories: wildfire prevention; carbon-farming practices (storage).
8.8.6 Opportunities for Further Action
The following summarizes key opportunities for further action.
● Opportunities at Jurisdictional Level and Regional Collaboration in Identifying Suitable Tree Planting Locations – Existing urban canopy cover varies by jurisdiction, ranging

434
from 7% to 22%. CAP urban tree planting targets do not specify suitable tree planting locations or where trees are needed the most. Opportunities exist at the jurisdictional level to identify locations based on local needs. The most aggressive CAP measure commits to 35% urban canopy cover in the developed area. Not all developed areas in the region are suitable for tree planting. An opportunity exists for cross-jurisdictional collaboration to identify suitable locations across the region, including taking into account social equity considerations.
● Continue and Increase Land Conservation, Preservation, and Restoration Across the Region – Existing authority allows land conservation, preservation, and restoration on natural and working lands. There is an opportunity to increase existing efforts and to explore additional actions to further conserve, preserve, and restore these lands.
● Collaboration with Tribes, State and Federal Land Agencies and Managers, and Private Land Owners – It is necessary to evaluate the various mandates on these lands and waters to determine where collaboration is viable to achieve local, regional, and state goals for natural and working lands. Private land owners also serve as important partners to preserve land and to test and fund pilot projects for carbon removal and storage.
● Continue to Develop and Integrate both State and Local Science for the Value and Integration of Natural and Working Lands in CAPs and other Land Use Plans – CARB is currently developing methods to quantify carbon values for these lands and demonstrate sequestration values. This could be integrated with existing local science on San Diego region's natural and working land carbon values from San Diego State University’s IEMM and other San Diego specific science.
● Identify Land for Conservation and Restoration, including Agricultural Land – There are opportunities to conserve and preserve additional land across the region. There are also some opportunities to restore land. The science behind the value of these actions is developing and needs additional support. The region could identify lands that can be conserved or preserved in support of existing and future land use planning. This process could include all tribal, federal, private, and local government stakeholders. This process could also account for the new SB 27 (2021) mandate that calls for the creation of natural and working land carbon removal and storage projects. To the extent possible, the San Diego region could develop and aid in creating these projects.
● Develop and Regularly Update a Regional Carbon Stock Inventory Based on San Diego Specific Science – Similar to the CARB Inventory of Emissions from Natural and Work Lands, the San Diego region could develop a process to regularly estimate and track over time the amount of carbon stored vegetation, wetlands, etc. This would help to understand how carbon stocks are being preserved and whether net emissions occurred due to changes in land use. These emissions are not typically included in the communitywide GHG inventory of local jurisdictions, but tracking changes over time can help understand the region’s net impact on emissions, which can imply contribution to warming. A similar process could be developed to track carbon removal projects regionwide. Several studies related to carbon stocks have been completed in the San Diego region, including those in Chapter 4 of this report, an estimate by the SANDAG

435
using the TerraCount analysis tool, and recent research by SDSU developed regionally-relevant sequestration rates for all relevant habitats.i
i Megan Jennings, et al., 2021. Carbon Valuation for San Diego’s Natural Landscapes. Institute for Ecological Monitoring and Management, San Diego State University.

436
8.9 Other Limitations There are inherent limitations with any analysis like this that result in a degree of uncertainty. This CAP policy opportunity analysis uses the best information, data, and methods available at the time. Nonetheless, in addition to the limitations presented above in Sections 8.5 through 8.8, there are limitations to the work completed to identify opportunities for each decarbonization pathway.
No Comprehensive Review of Implementation Progress While implementation is a critical step of the climate action planning cycle, the analysis presented here focuses on measures and supporting actions included in CAPs and some of the policies that have been adopted as a result of these measures. We assume that CAPs represent what local jurisdictions and their elected officials have determined to be a reasonable and feasible commitment to reduce GHG emissions. While we reference some policies adopted by local jurisdictions related to the four decarbonization pathways throughout the report, additional research would be needed to determine whether and to what extent measures have been implemented by local jurisdictions. Such an analysis likely would require close collaboration with local jurisdictions since much of the data and knowledge about implementation activities may not be publicly available.
Also, the SANDAG RECAP Technical Appendix VI presents a framework to monitor progress.i It comprises two main parts: conducting GHG inventories to determine progress toward GHG emissions targets and evaluating progress on implementing CAP measures. While it is possible to estimate the amount of emissions associated with completed CAP activities in some cases, it can be difficult to attribute the emissions reductions to local jurisdiction's actions. For example, while it is relatively easy to track the miles of bike lanes installed, it can be difficult to attribute the amount of VMT reduced due to installing a mile of bike lanes. Similarly, it is difficult to attribute an increase in energy efficiency or rooftop solar to specific actions taken by local jurisdictions. Also, the SANDAG Climate Action Data Portal tracks the level of activity in a range of indicators related to CAP measures.ii
No Further Evaluation of Policy Opportunities Completed The goal of this analysis was to identify local policy opportunities to help achieve deep decarbonization targets. As such, we did not provide detailed analysis of or prioritize the policies we identified. Additional work would be needed to evaluate policy options based on selection criteria, including cost, potential to reduce GHG emissions, feasibility to implement, scalability, social equity implications, etc.
Limited Analysis of Certain Policy Categories and Subcategories There are several policy categories or subcategories that we did not analyze to the degree of others. For example, because there are no CAP measures related to increasing use of low-carbon fuels in building or reducing methane from agricultural operations, including dairy operations, we included only limited information. To the extent that stakeholders and decision makers want to learn more about these areas, additional work would be needed.
No Analysis of Other Public Agency GHG Reduction Plans This analysis focuses on the GHG reduction commitments in the CAPs of local jurisdictions. It does not include analysis of plans adopted by other agencies like the San Diego Unified Port District and San
i SANDAG Regional Climate Action Planning Framework: TECHNICAL APPENDIX VI-CAP Monitoring and Reporting, VERSION 1.1: December 2020. ii ReCAP Snapshots and Climate Data Portal available at https://climatedata.sandag.org/.

437
Diego International Airport. Additional analysis would be needed to determine the GHG commitments, implementation plans, and relationship to local jurisdiction CAPs.
8.10 Conclusion
This chapter assesses current commitments in Climate Action Plans (CAP) to determine if additional activity would be needed to put the region on a trajectory to meet these goals and to identify opportunities for local jurisdictions in the region to take further action to support the decarbonization pathways.
We completed analysis in three areas. First, we reviewed the authority of local governments and agencies to act to influence and regulate GHG emissions, including a summary of key federal, state, and local agencies, and key legislation and regulation at the federal and state levels to help to clarify the ability of local governments to act to reduce GHG emissions. Second, we completed a comparative analysis of CAPs to determine the frequency of measures, relative GHG impact of decarbonization pathways and measures, and integration of social equity considerations. Third, we completed a scenario analysis to estimate the total impact of the GHG reduction commitments in all adopted and pending CAPs and the potential GHG impact of a scenario of applying the best CAP commitments to all jurisdictions. Using results of the above analysis and additional research, identify opportunities for further local action and regional collaboration in each of the four decarbonization pathways.
The review of authority found that local jurisdictions have authority to influence and regulate GHG emissions using police powers and delegated authority. Some local jurisdictions are exercising delegated authority, but the full extent of a local jurisdiction’s police power to regulate GHG emissions is unknown. The comparative and scenario analyses of CAPs found that the GHG impacts of current CAP commitments are relatively small, and applying the best CAP commitments to all jurisdictions in the region would still not be enough to reach the levels of deep decarbonization contemplated in the technical analysis presented in the other chapters of this report. As a result, additional policies would be needed to decarbonize transportation and buildings, particularly VMT reductions and building electrification, respectively. Across all decarbonization pathways, there are opportunities for further local action and for regional collaboration, including collecting and tracking data, providing support to develop and implement policies, and convening stakeholder and working groups to develop regional strategies and monitor progress. Finally, based on a preliminary review of CAPs, additional work would be needed to integrate social equity considerations into climate.

438
Appendix 8.A Assumptions for Estimating GHG Impact of Best CAP Commitment
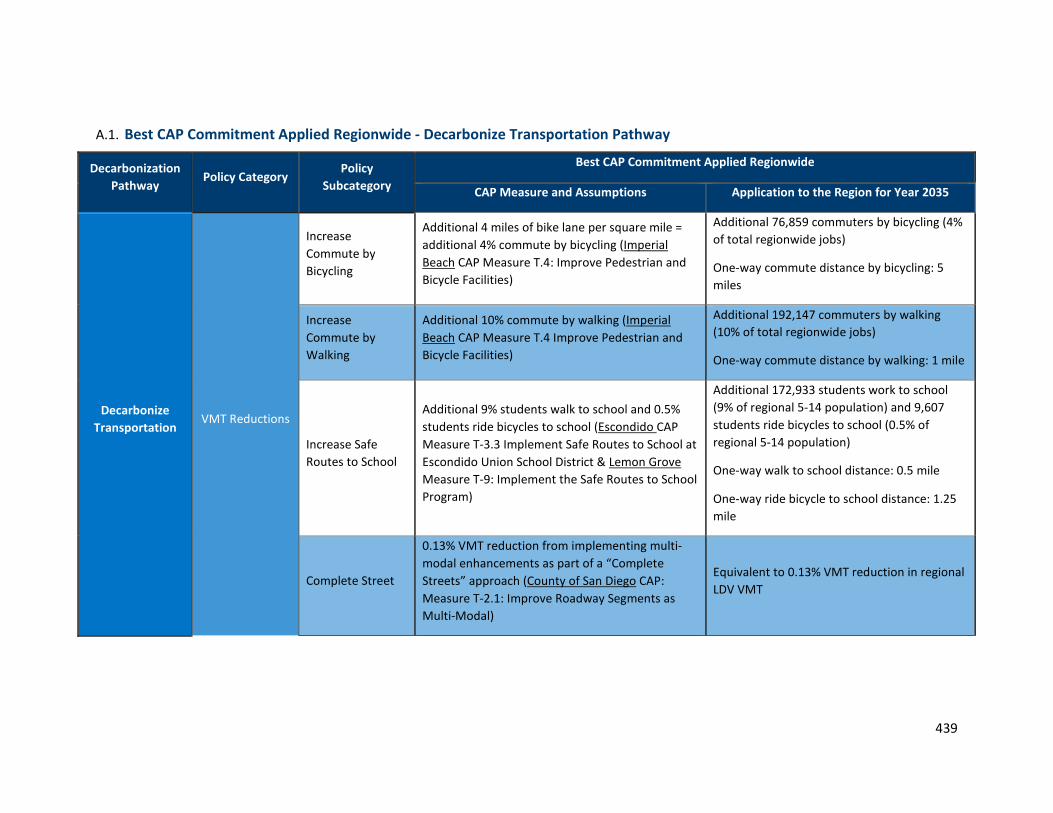
439
A.1. Best CAP Commitment Applied Regionwide - Decarbonize Transportation Pathway
Decarbonization Pathway
Policy Category Policy
Subcategory
Best CAP Commitment Applied Regionwide
CAP Measure and Assumptions Application to the Region for Year 2035
Decarbonize Transportation
VMT Reductions
Increase Commute by Bicycling
Additional 4 miles of bike lane per square mile = additional 4% commute by bicycling (Imperial Beach CAP Measure T.4: Improve Pedestrian and Bicycle Facilities)
Additional 76,859 commuters by bicycling (4% of total regionwide jobs)
One-way commute distance by bicycling: 5 miles
Increase Commute by Walking
Additional 10% commute by walking (Imperial Beach CAP Measure T.4 Improve Pedestrian and Bicycle Facilities)
Additional 192,147 commuters by walking (10% of total regionwide jobs)
One-way commute distance by walking: 1 mile
Increase Safe Routes to School
Additional 9% students walk to school and 0.5% students ride bicycles to school (Escondido CAP Measure T-3.3 Implement Safe Routes to School at Escondido Union School District & Lemon Grove Measure T-9: Implement the Safe Routes to School Program)
Additional 172,933 students work to school (9% of regional 5-14 population) and 9,607 students ride bicycles to school (0.5% of regional 5-14 population)
One-way walk to school distance: 0.5 mile
One-way ride bicycle to school distance: 1.25 mile
Complete Street
0.13% VMT reduction from implementing multi-modal enhancements as part of a “Complete Streets” approach (County of San Diego CAP: Measure T-2.1: Improve Roadway Segments as Multi-Modal)
Equivalent to 0.13% VMT reduction in regional LDV VMT

440
Decarbonization Pathway
Policy Category Policy
Subcategory
Best CAP Commitment Applied Regionwide
CAP Measure and Assumptions Application to the Region for Year 2035
Increase Commute by Mass Transit + Intra-city Shuttle
Additional 13% commute by mass transit (San Marcos CAP Measure T-11: Increase Transit Ridership)
Mass transit: additional 249,792 commuters by walking (13% of total regionwide jobs)
One-way commute distance by mass transit: 10.4 miles
Intra-city Shuttle: Current CAP commitment carry over
Parking Reduction
50% reduction in residential parking space requirements = 25% VMT reduction per household (Lemon Grove CAP Measure T-11: Reduce Residential Parking Requirements Near Trolley Station)
14 miles avoided per day (25% of household VMT) per household of the housing units in 2021 SANDAG Regional Plan Mobility Hubs (743,711 units)
Commute TDM Strategies
Additional 10% commuters using alternative modes = additional 10% commuters not driving alone (Carlsbad CAP Measure K: Promote Transportation Demand Management Strategies)
Additional 192,147 commuters not driving alone (10% of total regionwide jobs)
One-way driving distance avoided: 10.9 miles
Increase Commute By Vanpool
Additional 19% commute by vanpool (Solana Beach CAP Measure T-2: Increase Commuting by Vanpools to 20 percent of Labor Force)
Additional 365,080 commuters by bicycling (19% of total regionwide jobs)
One-way commute distance by vanpool: 25 miles
Number of people per vanpool: 6
Fuel Use Reductions
Fuel Reduction from Traffic Calming Policies
Equivalent to 0.25% reduction in VMT (Carlsbad CAP: General Plan Policies and Measures - Traffic Calming)
Equivalent to 0.25% VMT reduction in regional LDV VMT

441
Decarbonization Pathway
Policy Category Policy
Subcategory
Best CAP Commitment Applied Regionwide
CAP Measure and Assumptions Application to the Region for Year 2035
Vehicle Retirement
446 MT CO2e avoided from replacing 1,600 vehicles (County of San Diego CAP: Measure T-3.3 Develop a Local Vehicle Retirement Program)
Equivalent to 2,973 MT CO2e GHG avoided regionwide by replacing 10,667 vehicles (15% of regionwide VMT is from County of San Diego)
Alternative Fuel Vehicles and Equipment
Increase City-wide electric vehicle miles driven
Increase citywide electric vehicle miles driven to 30% total miles (Del Mar CAP Goal 16: Increase percentage of vehicle miles traveled driven by electric and alternative fuel vehicles & Solana Beach CAP Measure T-1 Increase electric vehicles and alternative fuel vehicles miles traveled to 30 percent of total vehicle miles traveled)
30% regional LDV VMT is electric
Increase alternative fuel vehicles in municipal fleet
90% reduction in municipal gasoline fleet GHG emissions (San Diego CAP Action 2.3 Present to City Council for Consideration a Municipal Alternative Fuel Policy)
90% of reduction in municipal gasoline fleet emissions. Municipal gasoline fleet emissions is 0.4% of regionwide transportation GHG emissions.

442
A.2. Best CAP Commitment Applied Regionwide – Decarbonize Buildings
Decarbonization Pathway
Policy Category Policy
Subcategory
Best CAP Commitment Applied Regionwide
CAP Measure and Assumptions Application to the Region for Year 2035
Decarbonize Buildings
Electrification Electrify New Residential Construction
All-electric new residential (single-family and multi-family) construction after 2023 (Lemon Grove CAP Measure E-6: Require New Residential Uses to be All-Electric and Generate Renewable Energy On-Site)
New housing units from 2023 to 2035 regionwide: 163,351
196 therms of natural gas avoided and 1,680 kWh of electricity added per new Energy Code-compliant unit (average of single-family and multifamily unit in Climate Zone 7 and 10)
Energy Efficiency
Residential Energy Retrofit
50% energy reduction at 30% existing homes (single-family and multifamily) (Carlsbad CAP Measure D: Encourage Single-Family Residential Efficiency Retrofits & Measure E: Encourage Multi-family Residential Efficiency Retrofits)
15% reduction in regionwide residential energy use = 106 therms of natural gas avoided and 1,989 kWh of electricity avoided per home (50% of average regionwide household energy use)
Non-residential Energy Retrofit
40% energy reduction at 30% existing commercial spaces (Carlsbad CAP Measure F: Encourage Commercial and City Facility Efficiency Retrofits)
12% reduction in regionwide commercial energy use
Residential Water Heater Retrofit
25% of existing homes retrofitted with solar water heating (Solana Beach CAP Measure E-5: Solar Hot Water Heating at 25 Percent of new homes and home retrofits)
112 therms avoided per natural gas water heater retrofit (60% of water heaters are natural gas); and 2,300 kWh avoided per electric water heater retrofit (40% water heaters are electric).
Non-residential Solar Water Heater Retrofit
20% of existing commercial spaces retrofitted with solar water heating (Solana Beach CAP Measure E-4: Solar Hot Water Heating at 20 Percent of existing commercial spaces)
6% of total commercial energy use is from water heating. 10% of reduction in water heating energy use per retrofit.

443
A.3. Best CAP Commitment Applied Regionwide – Decarbonize the Electricity Supply
Decarbonization Pathway
Policy Category Policy
Subcategory
Best CAP Commitment Applied Regionwide
CAP Measure and Assumptions Application to the Region for Year 2035
Decarbonize Electricity Supply
Grid Supply Community Choice Energy (CCE) Program
100% renewable or zero carbon electricity (Encinitas CAP City Action RE-1: Establish a Community Choice Energy Program & Escondido CAP Measure E-5.3 Increase Grid-supply Renewable and/or Zero Carbon Electricity)
95% of the SDG& bundled load in the region would switch to CCE with 100% renewable or zero carbon electricity (zero GHG emissions)

444
A.4. Best CAP Commitment Applied Regionwide – Natural Climate Solutions
Decarbonization Pathway
Policy Category Policy
Subcategory
Best CAP Commitment Applied Regionwide
CAP Measure and Assumptions Application to the Region for Year 2035
Natural Climate Solutions
Carbon Removal and Storage
Urban Tree Planting or Urban Canopy Cover
Achieve 35% urban canopy cover (Del Mar CAP Goal 22: Urban Tree Planting & San Diego CAP Measure 5.1 Urban Tree Planting Program)
35% of developed area in the region would have urban canopy cover.
445
Appendix 8.B: Supporting Material for Decarbonize Transportation Policy Assessment

446
B.1 Overlap or Gaps Between CAP Actions and Key Opportunities Identified in Chapter 3
Chapter 3 identified key actions to address two main areas of on-road transportation GHG reduction. These are listed in Table 8.48. The extent to which these actions appear as CAP policies, and whether they are quantified for GHG reduction, are also shown.
Table 8.48 Overlap Between CAPs and with Key Opportunities Identifies in Chapter 3
Key Actions Chapter 3 Equivalent CAP Policy
Category and Number of CAPs Addressing
Number of CAPs with Quantified GHG
Reduction Amount Challenges as Identified in CAPs Local Opportunity ?
VMT Reduction Actions
Expand geographic reach and service hours of bus and rail services in areas where development can support transit use
Mass transit 1 Y - Requires regional cooperation
Provide incentives and regulatory relief to facilitate higher density infill and transit-oriented development
Permit and CEQA streamlining (regulatory relief) for projects;
2 Local resistance to infill, higher density and transit-oriented development
Y
Disincentivize development in rural (or non-infill) areas that cannot support efficient transit use or multi-modal transportation options
Not addressed in CAPs 0 Not addressed in CAPs Y
In existing rural, non-infill, or underserved transit areas, invest in TNC partnerships prioritizing electric and high-occupancy vehicles to ensure sufficient access to opportunities
Not addressed in CAPs 0 Not addressed in CAPs Y

447
Key Actions Chapter 3 Equivalent CAP Policy
Category and Number of CAPs Addressing
Number of CAPs with Quantified GHG
Reduction Amount Challenges as Identified in CAPs Local Opportunity ?
Investigate opportunities to implement pricing structures (cordon pricing, HOT lanes, etc.) that incentivize high occupancy vehicles
Not addressed in CAPs 0
1. Regional cooperation/authority; 2. Pricing is used for larger roads (arterials and freeways) over which local jurisdictions have no authority; 3. Even at the regional level, road pricing faces local resistance
N
Adopt pedestrian-oriented design guidelines for all new development; reduce or remove parking minimums in walkable neighborhoods
Bike, walk, complete streets; parking reduction
16 CAPs address bike, walk complete streets, 4 address parking reduction as a requirement or CIP
Local resistance to removing parking or road diets to accommodate complete streets
Y
Update county bicycle and pedestrian planning documents; partner with SANDAG to accelerate implementation of 2010 San Diego Regional Bicycle Plan; develop Pedestrian Safety and/or Vision Zero and/or Local Road Safety Plan
Bike, walk, complete streets; specific to unincorporated County
Not addressed in CAPs Needs assessment since distances are large, may be practical only in urbanized areas
Y
Partner with SANDAG to build out a network of Mobility Hubs where shared vehicles and new mobility services can be found
Smart growth
3 CAPs address micromobility; SANDAG quantifies GHG reductions from shared mobility
Local resistance to micromobility services; regional cooperation to establish mobility hubs
Y

448
Key Actions Chapter 3 Equivalent CAP Policy
Category and Number of CAPs Addressing
Number of CAPs with Quantified GHG
Reduction Amount Challenges as Identified in CAPs Local Opportunity ?
Develop County TDM ordinance and Transportation Management Organization (TMO) to work with employers and service providers
County specific - Commuter TDM
Half the CAPs address commuter TDM
- Y
Conduct broadband gap analysis; seek funding to improve communications infrastructure in areas that lag; require enhanced communication technology in all new development through TDM ordinance
Not addressed in CAPs Not addressed in CAPs - Y
Conduct electrified freight study to understand where opportunities for distribution efficiencies exist; modify zoning code to encourage distribution centers in efficient locations
Not addressed in CAPs Not addressed in CAPs - Y for some CAPs where freight transport is an issue
Electrification Actions
Set and meet aggressive public EV charging target
Alternative Fuels, n/a “Aggressive” needs definition. Assess A2Z gap report versus CAP public charging targets.
Y – see also “Best commitment” Scenario EV numbers in 2035
Set and meet aggressive (100%) fleet adoption target
Alternative fuels in municipal fleets
8 - Y

449
Key Actions Chapter 3 Equivalent CAP Policy
Category and Number of CAPs Addressing
Number of CAPs with Quantified GHG
Reduction Amount Challenges as Identified in CAPs Local Opportunity ?
Require new development to include EV charging
Alternative Fuels, 12 - Y
Require existing development to retrofit parking with EV charging
Alternative Fuels, 12 - Y
Increase dollar value and streamline consumer vehicle purchase incentives with application to both new and used vehicles
Alternative Fuels 4 - Y
Increase dollar value of incentives, provide educational resources, and streamline permitting process for landowners to install EV charging in multi-family developments
Alternative Fuels, 4 - Y
Partner with educational institutions to assess workforce training needs; increase funding to existing programs
Alternative Fuels, 0 - Y
Continue to partner with A2Z Collaborative to share information and successful implementation strategies across jurisdictions, advocate for funding and coordination at the state level
Alternative Fuels, 0 Evaluation/cooperation Y
450
9. The San Diego Region as a Model Lessons and opportunities on aligning pathways, policies, and resources to highlight win-win scenarios in the transition to net zero
Elena Crete, UN Sustainable Development Solutions Network (SDSN) Julie Topf, UN Sustainable Development Solutions Network (SDSN) 9.1 Purpose
The San Diego Regional Decarbonization Framework (RDF) is a novel demonstration of collaborative long-term planning, which other regions and jurisdictions should adapt and replicate in order to keep global warming below 1.5 degrees Celsius. With the Intergovernmental Panel on Climate Change (IPCC) now sounding the alarm on climate change with their 2021 Global Warming of 1.5ºC Special Report,i communities around the world are beginning to reflect on what reducing and eliminating emissions means for their specific contexts. While scientists agree we now have the technologies we need to enable the transition to net zero, the exact configuration of those technologies, accompanied by supporting policy frameworks and financing, will need to be calibrated for specific conditions around the globe. Each local process must take into consideration their greenhouse gas emissions inventory, local economy and workforce, and long-term emissions reduction goals in a collaborative and transparent planning process.
The process undertaken by the County of San Diego can serve as a case study for other jurisdictions across the US and globally to learn from and replicate. In order to facilitate this dissemination, the RDF project team is working closely with the UN Sustainable Development Solutions Network (SDSN) to showcase this effort alongside various international fora. This chapter demonstrates the ways by which the findings of the RDF can be scaled vertically and horizontally through various consortiums in order to further contribute to the global climate agenda and the development of other decarbonization frameworks. Additionally, SDSN has developed an accompanying Guidebookii to serve as a toolkit for other municipalities, universities, and communities to follow in their pursuit of decarbonization. This Guidebook will serve as an addendum to the larger Regional Decarbonization Framework report. The purpose of this Guidebook is to distill the high-level process undertaken so far by the County, highlight the enabling factors for success, and provide a step-by-step instruction manual for other
i https://www.ipcc.ch/sr15/ ii http://sdgpolicyinitiative.org/guidebook/

451
communities who wish to undertake similar long-term planning processes in their efforts to combat climate change.
As articulated several times in this document, the scenarios and framework described in this exercise are just a beginning and will require flexibility and alterations along the way. In order to most effectively take this work forward, it is essential for the San Diego County project team and researchers to connect with other national and international forums where they can both garner insights from and inform similar exercises being undertaken around the globe. A few such opportunities are highlighted below for the County to follow up on.
9.2 Opportunities for Scaling Impact
With broadband access now extending to the most remote parts of the world and the COVID-19 crisis encouraging professionals around the globe to adapt to a virtual workplace, the opportunity for engaging stakeholders and sharing experiences is greater than ever. Over the last several decades, there have been new consortiums and networks established that work both vertically and horizontally across our societies to align development agendas and resources to accelerate growth in the frameworks of sustainable development and climate change mitigation. One such consortium is working globally to elevate the academic and science community to highlight the multidisciplinary approach required to understand and achieve sustainable development, the UN Sustainable Development Solutions Network (SDSN).i
SDSN was set up in 2012 under the auspices of the UN Secretary-General. SDSN mobilizes global scientific and technological expertise to promote practical solutions for sustainable development, including the implementation of the Sustainable Development Goals (SDGs) and the Paris Agreement. SDSN works closely with United Nations agencies, multilateral financing institutions, the private sector, and civil society. SDSN is guided by a Leadership Council, which brings together global sustainable development leaders from all regions and all sectors, including civil society, public, and private sectors. Much of SDSN’s work is led by National or Regional SDSNs, which mobilize knowledge institutions around the SDGs. Their research and policy work mobilizes experts from around the world on the technical challenges of implementing the SDGs and the Paris Agreement. The SDG Academy leads the education work of SDSN. As a member of the network, UC San Diego has brought on SDSN as a consulting partner in the creation of the RDF and accompanying Guidebook in order to ensure that the process and results of this project are firmly integrated into various multilateral fora, both within and alongside formal UN processes.
i https://www.unsdsn.org/

452
SDSN is working to share the RDF project within three horizontal levels across its network. First, nationally, SDSN USAi currently hosts nearly 160 institutions across all 50 states, Puerto Rico, and Washington, DC. These academic institutions have local networks of sustainability practitioners working in various aspects of the SDGs. SDSN USA builds pathways toward the achievement of the SDGs in the United States by mobilizing research, outreach, collective action, and global cooperation. To accomplish this, SDSN USA facilitates and leads coalitions to address US sustainability challenges; builds sophisticated, practical systems for assessing progress; promotes public awareness, education, and engagement; and links these efforts with policymakers and community leaders throughout the US to result in lasting change. In addition to the other universities in this network who can learn from the RDF, SDSN also has partner networks across the US with whom the final report will be shared in order to disseminate the results nationally.
The SDSN USA network is also part of a larger network of national and regional networks which make up the international framework of SDSN. With more than 1,500 members working across 44 national and regional networks worldwide as of early 2022, SDSN USA is part of a global multidisciplinary consortium of experts and has access to thought-leaders around the world. This allows the network to share the results of the RDF directly with like-minded sustainability experts across various geographies and spectrums around the world who can glean important lessons learned from the RDF process and Guidebook.
Lastly, SDSN serves as an observer organization to the United Nations Economic and Social Council (ECOSOC) and United Nations Framework Convention on Climate Change (UNFCCC) processes, and is also a partner in the Cities and Climate Change Science Conference which was co-sponsored by the IPCC in 2018. This effort continued under the auspices of the Innovate4Cities Conferenceii in October 2021, co-hosted by UN-Habitat and the Global Covenant of Mayors for Climate & Energy. The RDF project was submitted to this forum and the inputs of this event will serve to inform the 2022 IPCC Sixth Assessment Report on impact, adaptation, and vulnerability to global climate change. Opportunities for sharing the final report will be further explored through the UNFCCC Regional Climate Weeks,iii which take place annually throughout the world. Additionally, SDSN is plugged into several other forums and networks through which it will share this work. These networks include the Global Solutions Lab,iv the Open Energy Modelling Initiative,v and the Zero Emissions Solutions Conference,vi to
i https://www.unsdsn.org/united-states ii https://www.innovate4cities.org/ iii https://unfccc.int/climate-action/regional-climate-weeks#eq-1 iv https://designsciencelab.com/ v https://openmod-initiative.org/ vi https://zeroemissions.network/

453
name a few. These globally recognized consortiums provide an opportunity to showcase the results of this project and San Diego as a model to the world. With access to these fora, the RDF project can help inform global roadmaps and pathways to net zero.
It is through a concerted effort to enable this ecology of networks that this project is able to serve as a model and have a greater impact far beyond the jurisdictional boundaries of San Diego county.
9.3 Planning Across Jurisdictions––Horizontal and Vertical Alignment
Significant progress has been made over the last few decades in decarbonization efforts across California, however many of the efforts have been undertaken with a specific technology, market, policy, or sector focus. This has led to a fragmented approach which only enables parts of the system to move forward, allowing uncertainties and risk averse behavior to limit the ambitious transformative decision-making needed to enable an energy system transformation. Only with a systems approach can deep decarbonization be achieved. To apply a systems approach to decarbonization, detailed pathways analysis is needed to understand the sectors, stakeholders, and potential physical and economic trajectories that must be accounted for, so that policies can be developed in a way to compensate for displacement, buffer disruptive shifts, and ensure a just transition. The San Diego County RDF approach attempts to do exactly this, laying the groundwork for the institutional framework necessary to facilitate long-term transformational change in the energy system across jurisdictions and political boundaries.
The enabling factors in San Diego included a strong historical precedent of local climate action planning, as well as pre-established institutional linkages across several areas (for example, the San Diego Association of Governments (SANDAG) works with jurisdictions throughout the region beyond transportation planning), coupled with an ambitious and technically rigorous vision set by the County leadership. By employing state of the art energy system modeling tools and working with local experts from universities and public policy think tanks, the County has demonstrated leadership in trying to map incremental pathways forward to meet their climate action plan goals. The technological capacity of the team, plus the local political support, has created a collaborative and transparent process through which the RDF was developed. While the future remains unclear as pathways are certain to shift, technologies develop, and priorities change, the project at the very least puts forward the institutional framework necessary to take the work outlined in the RDF forward.
In order to continue to develop and build on this year-long process, San Diego County should leverage both national and global fora for resource input, process benchmarking, and access to
454
other experts. In addition to the key fora highlighted below, Appendix 9.A provides extensive lists of other national and global consortia that San Diego County and regional jurisdictions can connect with to promote this kind of exercise elsewhere.
Nationally, the campaign "America Is All In"i is the most expansive coalition of leaders ever established in support of climate action in the United States. Led by climate champions across the country and consisting of thousands of US cities, states, tribal nations, businesses, schools, and faith, health, and cultural institutions, the coalition is working alongside the federal government to develop a national climate strategy to reach net-zero emissions by 2050. Sharing the findings of the San Diego RDF can help the ~4,000 signatories of the coalition’s joint declaration of support for climate action understand how to carry out local decarbonization planning, so that they can effectively act on their pledges. Moreover, connecting with the US Department of Energy’s National Labsii across the country also provides the opportunity to receive support from national interdisciplinary experts and their vast arrays of networks and resources, as well as to elevate the impact of regional decarbonization frameworks like the RDF by engaging with top-level practitioners. The Saoradh Enterprise Partners Cleantech Innovation Hubsiii can provide a good starting point to identify opportunities for engaging with innovative private sector companies working in the clean tech space, through their deep mapping of emerging hubs and ranking of the top 40 US hubs based on the strength of their research funding and results, technology development, venture development, and other metrics.
At the state level, the US Climate Alliance,iv a bipartisan coalition of governors committed to reducing greenhouse gas emissions consistent with the Paris Agreement, offers an excellent opportunity for the findings of the RDF to inform smart, coordinated climate action. The National Governors Association,v the US bipartisan organization of the nation’s governors, is another platform where the RDF can contribute to state solutions that improve citizens’ lives through decarbonization efforts. With the state of California already being a formal member of both fora, the RDF can easily support and encourage other states to follow in San Diego and California’s footsteps. Moreover, facilitating decarbonization across US states with the RDF, and demonstrating continued US climate leadership via such groups, will further encourage other nations to do the same.
At the city level, with 1,400 mayors of large US cities as its members and sharing best practices as one of its primary roles, disseminating the findings of the RDF at the US Conference of
i https://www.americaisallin.com/ ii https://www.energy.gov/national-laboratories iii https://www.saoradh.com/research#hubs iv http://www.usclimatealliance.org/ v https://www.nga.org/
455
Mayorsi provides a great opportunity to contribute to the development of national urban policy. The benefits of engaging with the conference also extend beyond the city level because the policy positions adopted at the annual meeting, which represent the views of the nation’s mayors, are distributed to the President of the United States and Congress.
And finally, for the districts included within the San Diego RDF, the Urban Sustainability Directors Networkii offers a very practical opportunity to work alongside other municipal leaders at the county level toward implementing climate resilience work. While San Diego County is already one of the 200 communities representing nearly 90 million residents that are part of this network, other US and Canadian local governments are eligible to join.
Globally, the United Nations Framework Convention on Climate Change (UNFCCC) offers the most premier stage to share the RDF. While the Paris Agreement consists of national efforts, more and more city and regional networks have been highlighted as key innovators and solution providers to help nations implement their emissions reduction goals. The annual UNFCCC Yearbookiii is a great resource to explore to understand sectoral solutions and needs from a global perspective to ensure that the local aspects of the framework are comprehensive and aligned with global goals.
Additionally, two of the main global city networks that are actively involved with the UNFCCC Conference of the Parties include the C40 Cities Climate Leadership Group (C40)iv and the International Council for Local Environmental Initiatives (ICLEI).v C40 is a network of mayors of nearly 100 world-leading cities specifically working together on climate action based on a science-based and collaborative approach, which the San Diego RDF and pathways-based planning in general align well with and can effectively contribute to. Also, with the cities of Encinitas and Chula Vista as members, San Diego County already has established connections in the ICLEI, a global network of more than 2,500 local and regional governments committed to sustainable urban development that can significantly benefit from learning how to create regional decarbonization frameworks on the road to net zero.
Another key global forum to engage with and disseminate the learnings of the San Diego RDF and other decarbonization frameworks through is the Global Covenant of Mayors for Climate & Energy,vi the largest global alliance for city climate leadership in the world. The RDF can contribute to the covenant’s three core initiatives––Data4Cities, Innovate4Cities, and
i https://www.usmayors.org/ ii https://www.usdn.org/index.html#/ iii https://unfccc.int/sites/default/files/resource/Yearbook_GCA_2021.pdf iv https://www.c40.org/ v https://www.iclei.org/ vi https://www.globalcovenantofmayors.org/
456
Invest4Cities––which aim to facilitate local government climate action with knowledge, data, tools, and technical support. Furthermore, since 2014, the City of San Diego has participated in the Carbon Disclosure Project (CDP).i The RDF experience should be shared with them as a showcase of how carbon mitigation efforts can be scaled regionally and how other variables for land use conservation can be incorporated into comprehensive planning efforts. Given CDP’s global reach, sharing the work here could influence similar districts across the country and around the globe.
Expanding the impact of the San Diego RDF is exactly the objective of the Guidebook which accompanies this report. While this chapter and Appendix 9.A present extensive lists of fora that San Diego County – and other jurisdictions with decarbonization frameworks – should connect with, attend, and join the networks of in order to disseminate their findings across different scales, the Guidebook supplements these strategies by outlining how the San Diego RDF process can be replicated and customized to other jurisdictions in their efforts to chart their own paths toward decarbonization. Targeted toward other municipalities in the US, the Guidebook provides process and technical guidance on how to get started on regional decarbonization frameworks, examples of the tools and methodology available to design and carry out needed analyses, recommendations for future research, and provides a directory of US decarbonization policy resources. The Guidebook is intended to be used by jurisdictions at all phases of the decarbonization process, whether they are just getting started or building on already existing climate action plans. By disseminating the findings of the larger RDF report and creating the accompanying Guidebook, it is our hope that the process undertaken by San Diego County will help equip jurisdictions with the strategies and resources they need to accelerate deep decarbonization efforts during this decisive Decade of Action.
We welcome stakeholders to read and share the accompanying Regional Decarbonization Guidebook created in tandem with this report at http://sdgpolicyinitiative.org/guidebook/.
i https://www.cdp.net/en

457
Appendix 9.A Relevant US and Global Communities of Practice Lists
San Diego Level
Building Industry Association of San Diego
Relevant departments of the City of San Diego
below (full list at www.sandiego.gov/city-hall/ departments)
Fleet Operations Division Engineering & Capital Projects
Environmental Services Department Parks and Recreation
Performance & Analytics Department Planning Department
Public Utilities Department of Real Estate and Airport
Management Sustainability
Transportation Department
Clean Coalition
Clean Energy Alliance
Cleantech San Diego
Live Well San Diego
San Diego Building Electrification Coalition
San Diego Community Choice Alliance
San Diego Gas & Electric
San Diego Food System Alliance
San Diego Quality of Life Coalition
San Diego Regional Clean Cities Coalition
San Diego Urban Sustainability Coalition
From “RDF Figure 7.1: Role of the County of San Diego in the Regional Decarbonization Context”
San Diego Air Pollution Control District San Diego Airport Authority
San Diego Association of Governments (SANDAG)
Energy Working Group Environmental Mitigation Program
Working Group Military Working Group
Public Health Stakeholders Group Regional Housing Working Group
Regional Planning Technical Working Group
Shoreline Preservation Working Group San Diego Climate Advisory Committee San Diego Community Power (SDCP)
San Diego County Water Authority San Diego County’s 18 cities
San Diego Land Use and Environment Group
San Diego Office of Environmental and Climate Justice
San Diego Office of Evaluation, Performance, and Analytics
San Diego Metropolitan Transit System
San Diego North County Transit District
Port of San Diego
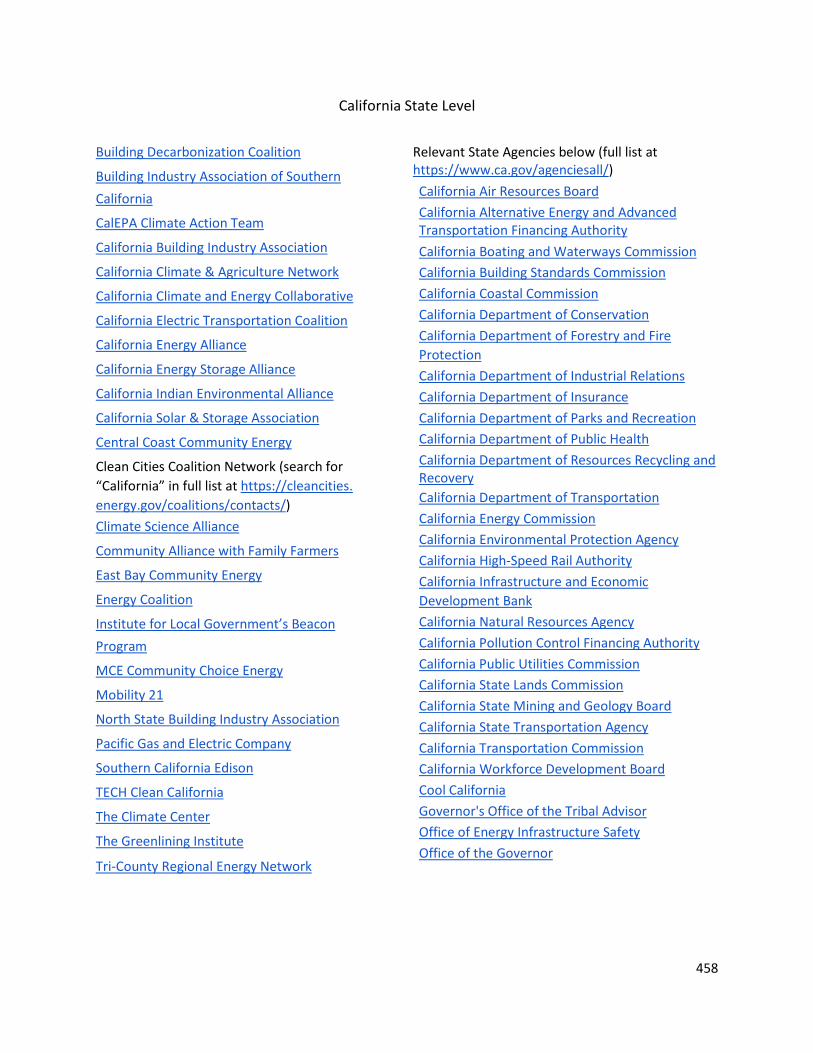
458
California State Level
Building Decarbonization Coalition
Building Industry Association of Southern California
CalEPA Climate Action Team
California Building Industry Association
California Climate & Agriculture Network
California Climate and Energy Collaborative
California Electric Transportation Coalition
California Energy Alliance
California Energy Storage Alliance
California Indian Environmental Alliance
California Solar & Storage Association
Central Coast Community Energy
Clean Cities Coalition Network (search for “California” in full list at https://cleancities. energy.gov/coalitions/contacts/)
Climate Science Alliance
Community Alliance with Family Farmers
East Bay Community Energy
Energy Coalition
Institute for Local Government’s Beacon Program
MCE Community Choice Energy
Mobility 21
North State Building Industry Association
Pacific Gas and Electric Company
Southern California Edison
TECH Clean California
The Climate Center
The Greenlining Institute
Tri-County Regional Energy Network
Relevant State Agencies below (full list at https://www.ca.gov/agenciesall/)
California Air Resources Board
California Alternative Energy and Advanced Transportation Financing Authority
California Boating and Waterways Commission
California Building Standards Commission
California Coastal Commission
California Department of Conservation
California Department of Forestry and Fire Protection
California Department of Industrial Relations
California Department of Insurance
California Department of Parks and Recreation
California Department of Public Health
California Department of Resources Recycling and Recovery
California Department of Transportation
California Energy Commission
California Environmental Protection Agency
California High-Speed Rail Authority
California Infrastructure and Economic Development Bank
California Natural Resources Agency
California Pollution Control Financing Authority
California Public Utilities Commission
California State Lands Commission
California State Mining and Geology Board
California State Transportation Agency
California Transportation Commission
California Workforce Development Board
Cool California
Governor's Office of the Tribal Advisor
Office of Energy Infrastructure Safety
Office of the Governor
459
US Regional & National Levels Alliance for Transportation Electrification
Amalgamated Transit Union
America is All In
American Federation of Labor–Congress of Industrial Organizations
American Planning Association
American Public Power Association
Better Buildings Initiative
Building Decarbonization Coalition
Buildings Performance Standards Coalition
Business Council for Sustainable Energy
Clean Cities Coalition Network
Clean Energy States Alliance
Clean Power Alliance
Climate Mayors
Coalition of Northeastern Governors
Confederation of International Contractors' Association
Construction Associations (full lists at https:// guides.emich.edu/c.php?g=188171&p=1241588 & https://jobstars.com/construction-profession al-associations-organizations/)
Consumer Energy Alliance
Cooperative Automated Transportation Coalition
DOE Office of Energy Efficiency & Renewable Energy
Electric Power Research Institute
Energy, Emissions, and Equity Initiative
Energy Foundation
Energy Information Administration
EPA Climate Change Partnerships
Equitable & Just National Climate Platform
Federal and State Recognized Tribes (full list at https://www.ncsl.org/legislators-
staff/legislators/quad-caucus/list-of-federal-and-state-recognized-tribes.aspx)
Food and Agriculture Climate Alliance
Georgetown Climate Center
Indigenous Climate Action
Indigenous Environmental Network
International Association of Machinists and Aerospace Workers
International Brotherhood of Electrical Workers
International Brotherhood of Teamsters
International Union of Operating Engineers
Interstate Renewable Energy Council
Native American Finance Officers Association
National Association of Home Builders
National Congress of American Indians
National Energy Marketers Association
National Governors Association
National League of Cities
National Operations Center of Excellence
National Renewable Energy Laboratory
North America's Building Trades Unions
Northwest Energy Efficiency Alliance
Regional Greenhouse Gas Initiative
Rural Utilities Service
Solar Energy Industries Association
Strategic Organizing Center The American Clean Power Association
The Eastern Transportation Coalition
Transport Workers Union of America
Transportation & Climate Initiative
Tribal Organizations (full list at https://www. ncai.org/tribal-directory/tribal-organizations)
United Auto Workers
United Food and Commercial Workers

460
Urban Sustainability Directors Network
US Climate Action Network
US Climate Alliance
US Conference of Mayors
US Energy Association
Relevant US Executive Government Agencies below (full list https://www.loc.gov/rr/news/ fedgov.html)
US Department of Agriculture
US Department of Commerce
US Department of Defense
US Department of Energy
US Department of Housing and Urban Development
US Department of the Interior
US Department of Labor
US Department of Transportation
US Farmers and Ranchers in Action
US Government Agencies (full list at https://www.usa.gov/federal-agencies)
Office of Climate Change and Health Equity
Office of Conservation and Water
Office of Environmental Quality
Office of Global Change
Office of the Special Presidential Envoy for Climate
Working for Advanced Transmission
Technologies Coalition

461
International/Global Level Alliance of Bioversity International and the International Center for Tropical Agriculture
Alliances for Climate Action
Allied for Climate Transformation by 2025
Center for Climate and Energy Solutions
Climate Action Network International
Climate Alliance
Climate Ambition Alliance
Climate and Clean Air Coalition
Climate Land Ambition & Rights Alliance
Coalition for Supporting Cities To Deliver Integrated Urban Energy Systems
Coalition for Urban Transitions (now run by a team at the World Resources Institute)
Council on Urban Initiatives
C40 Cities Climate Leadership Group
Energy Transitions Commission
EPA International Climate Partnerships
Glasgow Action for Climate Empowerment Work Programme
Global Alliance for Climate-Smart Agriculture
Global Alliance of Territorial Communities
Global Climate Forum
Global Covenant of Mayors for Climate & Energy
Global Energy Alliance for People and Planet
Global Network of Regional Sustainable Energy Centres
G7
G20
High-level Political Forum on Sustainable Development
Intergovernmental Panel on Climate Change
International Council for Local Environmental Initiatives
International Council on Clean Transportation
International Energy Agency
International Housing Association
International Renewable Energy Agency
International Renewable Energy Agency Coalition for Action
Least Developed Countries Renewable Energy and Energy Efficiency Initiative for Sustainable Development
NDC Partnership
Net Zero World Initiative
Organisation for Economic Co-operation and Development
Powering Past Coal Alliance
Race to Zero
Rocky Mountain Institute
Transport Decarbonisation Alliance
Under2 Coalition
United Nations Economic and Social Council
United Nations Framework Convention on Climate Change
UNFCCC partners and relevant organizations (full list at https://unfccc. int/topics/science/resources/partners-and-relevant-organizations-0)
UN-Habitat for a Better Urban Future
UN specialized agencies (full list at https:// www.un.org/en/about-us/specialized-agencies)
Urban Land Institute
World Urban Forum
World Wind Energy Association

462
10. Conclusion Gordon C. McCord, UC San Diego Elise Hanson, UC San Diego The global scientific consensus is unequivocal: the world is in the midst of a climate crisis. Human activities and influence have warmed the atmosphere, ocean, and land through rapid accumulations of greenhouse gases (GHG) in the atmosphere and the ocean, causing rapid and alarming changes. Global agreements, like the Paris Climate Agreement, and California executive orders recognize the urgency of decarbonization across all sectors of society and the economy. Regional and local plans for deep decarbonization that take into account both global commitments and local needs will be critical for finding least-cost solutions that adequately consider tradeoffs and equity considerations.
The San Diego Regional Decarbonization Framework (RDF) provides technical pathways to decarbonization in the medium-term to inform near-term policy-making in regional, county, and city governments towards collectively reducing net greenhouse gas emissions such that they align with the statewide goal of net zero by 2045. The RDF does not identify the “right” pathway and instead shows multiple ways forward to reach net zero energy system goals that fit within state- and national-level net zero pathways and also highlights tradeoffs, decision points, risks, and synergies in the pathways. The framework is flexible and should be continuously updated as science, technology and costs evolve and as uncertainties are resolved or clarified.
Collective action through regional collaboration and information sharing will be critical. The RDF proposes region-wide institutional governance for decarbonization that incentivizes experimentation and learning. Organized into a Regional Steering Committee, Sector Working Groups, and Front-Line Advisors, this evolving structure can coordinate learning efforts across jurisdictions and adapt to changing technological and political realities. A mechanism such as a Regional Climate Action JPA could scale strategic thinking and decision-making and facilitate implementation of closer region-wide coordination around decarbonization. Given limited local leverage over many emitting activities, regional climate governance institutions must directly engage with the state and federal governments to advocate for policies and programs that support local decarbonization needs.
The RDF analyzes technical pathways for electricity generation, transportation, and buildings, and in all cases finds that decarbonizing the region is technically feasible, but will require a concerted effort, political will to make decisions involving difficult tradeoffs, and active planning to ensure the transition does not exacerbate inequities in society. In addition, climate plans

463
must consider the fundamental importance of natural lands, which provide both carbon storage and annual sequestration, as well as working lands which can be either net emitters or net sinks depending on how they are managed.
The RDF also analyzes the net change in jobs in the energy sector in response to changes in the energy system, showing that the regional decarbonization pathways will generate jobs in decarbonization industries and will result in no net job losses, even with fossil fuel contractions during the period. It is important for regional governments to begin developing policies for a just transition for fossil fuel workers now so that they can transition into jobs of equivalent or better quality in the clean energy economy or elsewhere both before and after significant reductions in fossil fuel use occur. A workforce development report, titled “Putting San Diego County on the High Road: Climate Workforce Recommendations for 2030 and 2050” by Inclusive Economics,i to be released later this year, is an important step in this direction.
Since the individual jurisdictions in the San Diego region each prepare Climate Action Plans, the RDF assessed current commitments in CAPs to understand the gaps between CAPs and decarbonization goals. This was done through both a comparative CAP analysis and a scenario analysis. The chapter additionally applied the CAP measure with the largest GHG reductions to every jurisdiction, regardless of CAP status, and found that the region would still fall short of its regional decarbonization goals. Following an analysis of legal authority of local jurisdictions, the RDF finds that local governments can influence and regulate GHG emissions by accelerating state statutory targets and policies, adopting ordinances to go beyond state law, and using unique authority to adopt and implement policies. However, the full extent of a local jurisdiction’s power to regulate GHG emissions is unknown.
The process undertaken by the County of San Diego in producing the RDF can serve as a model for other jurisdictions across the United States and the world. In order to facilitate this dissemination, the RDF project team is working closely with the UN Sustainable Development Solutions Network (SDSN) to showcase this effort in various state, national, and international meetings and reports. Additionally, the project team is developing an accompanying Guidebook to serve as a toolkit for other municipalities and communities in their pursuit of regional decarbonization. The Guidebook is a separate effort that has been commissioned by the County to facilitate information sharing, highlight the enabling factors for success, and provide a step-by-step instruction manual for other communities who wish to undertake similar long-term planning processes in their efforts to combat climate change.
i Available on the County of San Diego’s Integrated Regional Decarbonization Framework website: https://www.sandiegocounty.gov/content/sdc/sustainability/regional-decarbonization.html

464
The Regional Decarbonization Framework brings together the best scientific understanding of what actions should be taken in the coming years to set the San Diego region on a pathway to decarbonization by 2045. In particular, the Framework highlights “low-regret” strategies and investments that will be worthwhile regardless of how the longer-term picture evolves. Moving forward quickly and meaningfully can generate political momentum and inspire other regions across the country and abroad to follow the science-based, inclusive process that San Diego is pioneering.

465
Appendix A. Summary of Statewide Energy System Modeling
As noted in the Study Framework chapter, the detailed sectoral analysis presented in the RDF was informed by energy system modeling at the state and national level. This work was done by Evolved Energy Research using the modeling tools EnergyPATHWAYS and RIO presented in Williams et al. (2021).1 These same modeling tools were also used in the Princeton Net-Zero America study,2 SDSN’s Zero Carbon Action Plan,3 and the Decarb America Initiative.4 Unlike in these national studies, the state-level analysis includes two zones for California (north and south), zones for each of the other ten western states, and a final “other states” zone that helped to set the boundary conditions for the west around variables such as the availability of imported biofuels. The zonal representation is shown graphically in Figure A1 and is the same used for the analysis in Wu et al. (forthcoming).
The Study Framework (Chapter 1) also notes that the energy system modeling was not prescriptive when it came to the RDF. Instead, it is meant to guide more detailed local-level analyses capturing the specific circumstances of the San Diego region. The larger energy system context presented here creates an important backdrop for the region and explicitly acknowledges the interconnectedness of our energy and land systems. This appendix focuses on summary results from the EnergyPATHWAYS and RIO modeling, along with the basic input assumptions. Readers looking for a more detailed description of both the methods and the underlying system-level dynamics outside of California should reference Williams et al. (2021).
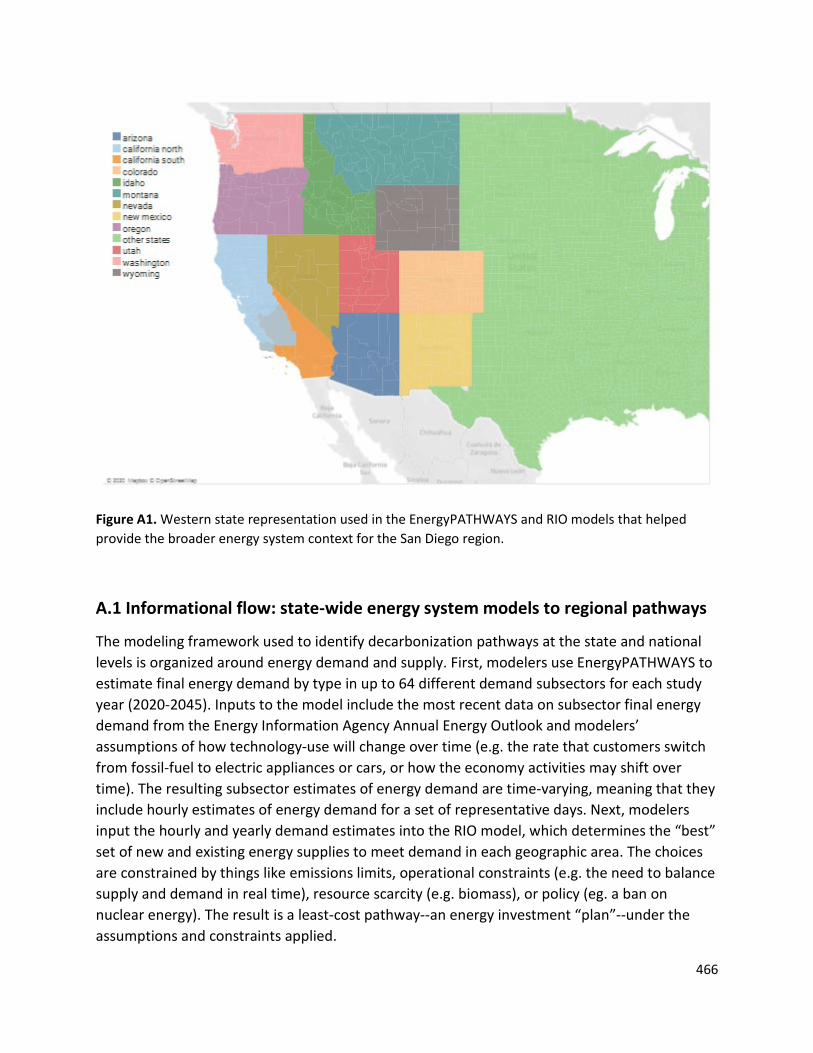
466
Figure A1. Western state representation used in the EnergyPATHWAYS and RIO models that helped provide the broader energy system context for the San Diego region.
A.1 Informational flow: state-wide energy system models to regional pathways
The modeling framework used to identify decarbonization pathways at the state and national levels is organized around energy demand and supply. First, modelers use EnergyPATHWAYS to estimate final energy demand by type in up to 64 different demand subsectors for each study year (2020-2045). Inputs to the model include the most recent data on subsector final energy demand from the Energy Information Agency Annual Energy Outlook and modelers’ assumptions of how technology-use will change over time (e.g. the rate that customers switch from fossil-fuel to electric appliances or cars, or how the economy activities may shift over time). The resulting subsector estimates of energy demand are time-varying, meaning that they include hourly estimates of energy demand for a set of representative days. Next, modelers input the hourly and yearly demand estimates into the RIO model, which determines the “best” set of new and existing energy supplies to meet demand in each geographic area. The choices are constrained by things like emissions limits, operational constraints (e.g. the need to balance supply and demand in real time), resource scarcity (e.g. biomass), or policy (eg. a ban on nuclear energy). The result is a least-cost pathway--an energy investment “plan”--under the assumptions and constraints applied.
467
Past decarbonization models have found that reaching net-zero nationwide and in California by 2045 can be done at manageable cost. In their national-level model, Williams et al. (2021)1 estimate that net costs of decarbonization would fall between 0.4% and 0.9% of GDP, depending on the scenario, compared to a historical range of total US spending on energy between 5.5%-13% of GDP from 1970 to the present. The geographic distribution of these costs are not modeled at a high resolution, and so we do not present total decarbonization costs for the San Diego region in the RDF. However, it should be noted that higher costs in a particular geographic region are not necessarily a negative, as they imply greater investment, growth in local industry and employment, and new infrastructure.
These system-level decarbonization pathways provide a useful guide for the detailed, sector-level pathways laid out in the remainder of the RDF. No individual pathway should be treated as a plan because the underlying assumptions are too uncertain. However, by applying several different sets of assumptions and constraints--scenarios--to generate several different least-cost pathways, modelers get a sense of which types of energy supply investments are most robust, or chosen as “best” in most circumstances. This gives policymakers a common general direction, at least initially, helping to alleviate policy gridlock, prevent conflicting approaches, and eliminate dead-end strategies.
A.2 Scenario Descriptions
A set of five scenarios were modeled to help inform the RDF. First, a reference, or “baseline,” scenario that does not enforce emissions constraints was run for comparison purposes. From there, the other four scenarios explore sensitivity to different uncertainties in behavior, societal preference, and technology development. These were chosen to reflect the broad debates happening around climate policy and human behavior at the state level, and reflect a wide range of plausible futures. The Central scenario meets reference energy service demand with high demand-side uptake of electric, efficient technologies and with all energy-supply technology options available. The Low Demand scenario uses assumptions from Williams et al. (2021) to examine the implication of higher energy conservation on mitigating emissions from the energy system. The Electrification Delay introduces a 20-year lag in the speed at which customers adopt electric technologies. Finally, the No Sequestration scenario disallows geologic storage of CO2 and subsequently emphasizes drop-in use of clean fuels, rather than continued use of fossil fuels with captured carbon offsetting those emissions. This scenario reflects that, while technical potential exists for geologic storage of carbon in California, political, regulatory, and economic barriers may prevent this from becoming a reality. A summary of the inputs used across each of the five scenarios is provided in Table A1.

468
Table A1. Input summary for each of the five macro-energy scenarios analyzed in the EnergyPATHWAYS and RIO models.

469
A.3 Model Implications and Supplementary Results
Some relevant results from the EER state-level energy system modeling are shown below in Figures A2-A10. Across the scenarios modeled, several broad themes emerge that inform the detailed sector-level pathways for the San Diego region.
In all scenarios consistent with net zero emissions state-wide by 2045, energy end-uses must rapidly electrify, implying dramatic reductions in the end-use of pipeline gas and gasoline fuel, relative to the reference scenario (Figure A2). This means that, even with uncertainty around the overall rate and extent of electrification, reaching net-zero emissions will require that nearly all light duty vehicles and many medium and heavy duty vehicles be electric by 2045 (Figure A7). Likewise, demand for heating and cooling in the built environment, mostly expected to increase (Figure A6) as new buildings are constructed and temperatures rise (Figure A5), must be met increasingly by electric devices.
The need for massive electrification drives the regional analyses of the transport and buildings sectors. In transport, the RDF pathways outlines a need for significant efforts across jurisdictions to rapidly increase EV adoption and the buildout of charging infrastructure. In buildings, the RDF pathway emphasizes efforts to incentivize adoption of efficient heat pump-based space and water heating systems in both new and existing buildings, with particular focus on assistance for low-income residents and rental buildings.
Simultaneously, the electric sector itself must decarbonize, which in California means massive increases in solar generation capacity and less in wind (Figure A3). This finding drives the regional energy production pathway analysis, which identifies substantial opportunity for solar development throughout the region.
Finally, the EER models show that, if allowed by policy, carbon sequestration will likely be necessary to achieve net-zero emissions. The land use and natural climate solutions regional pathway analysis broadly assumes that this will require some level of natural carbon sequestration and identifies land use and natural climate solutions which can enhance or increase net negative land emissions.
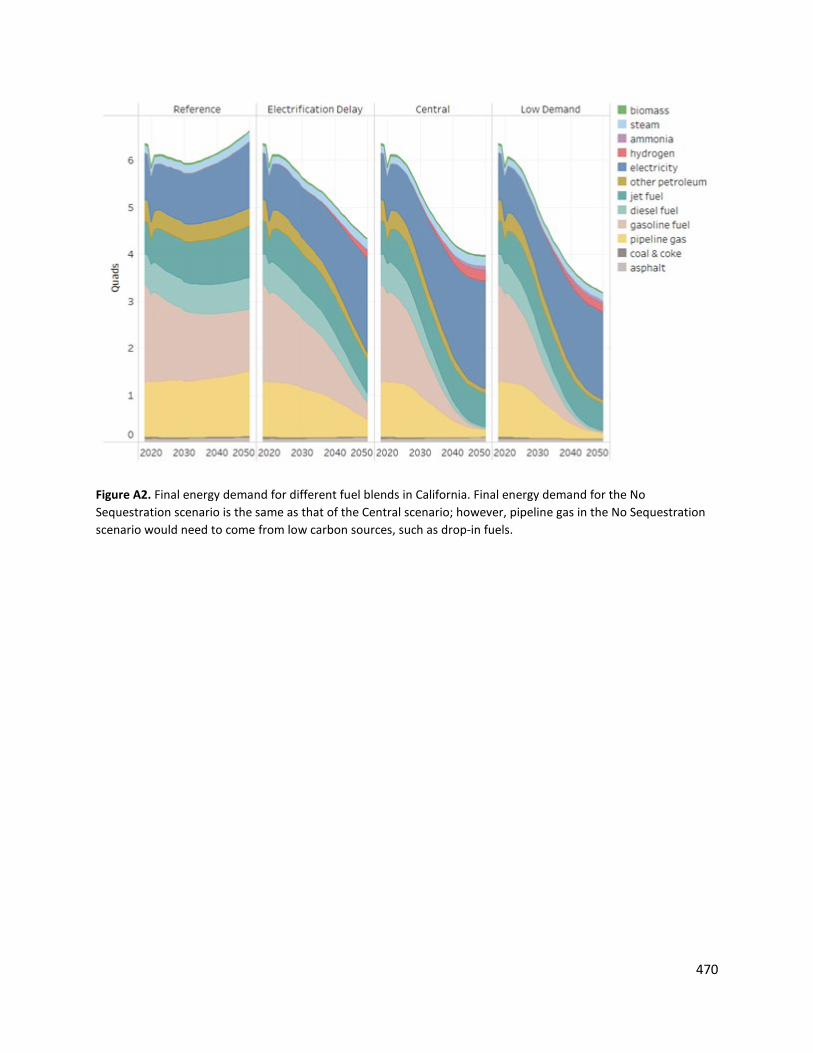
470
Figure A2. Final energy demand for different fuel blends in California. Final energy demand for the No Sequestration scenario is the same as that of the Central scenario; however, pipeline gas in the No Sequestration scenario would need to come from low carbon sources, such as drop-in fuels.

471
Figure A3. Total installed electricity capacity in California.

472
Figure A4. CO2 emissions from energy and industrial processes in California. Colors above the x-axis represent positive emissions, and colors below represent offsetting negative emissions. The black line indicates net CO2 emissions. Product and bunkered CO2 is carbon that ends up sequestered in materials (e.g., asphalt) or CO2 not counted in current inventories (e.g., interstate aviation).
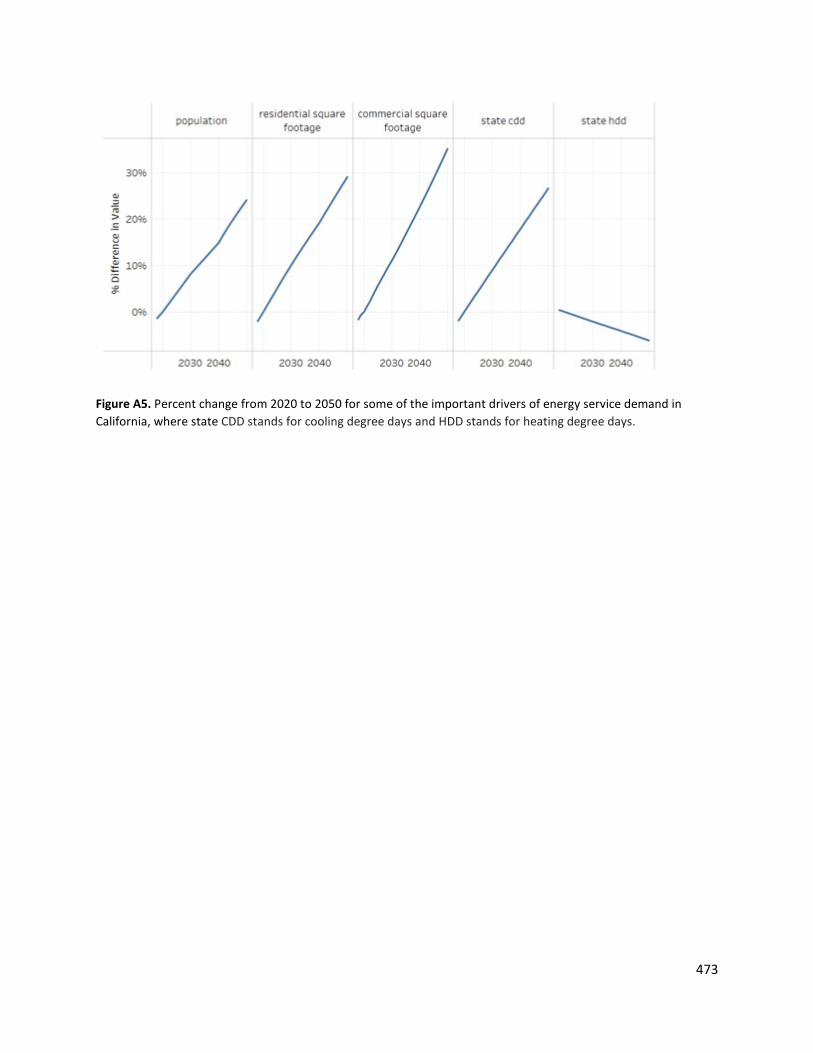
473
Figure A5. Percent change from 2020 to 2050 for some of the important drivers of energy service demand in California, where state CDD stands for cooling degree days and HDD stands for heating degree days.
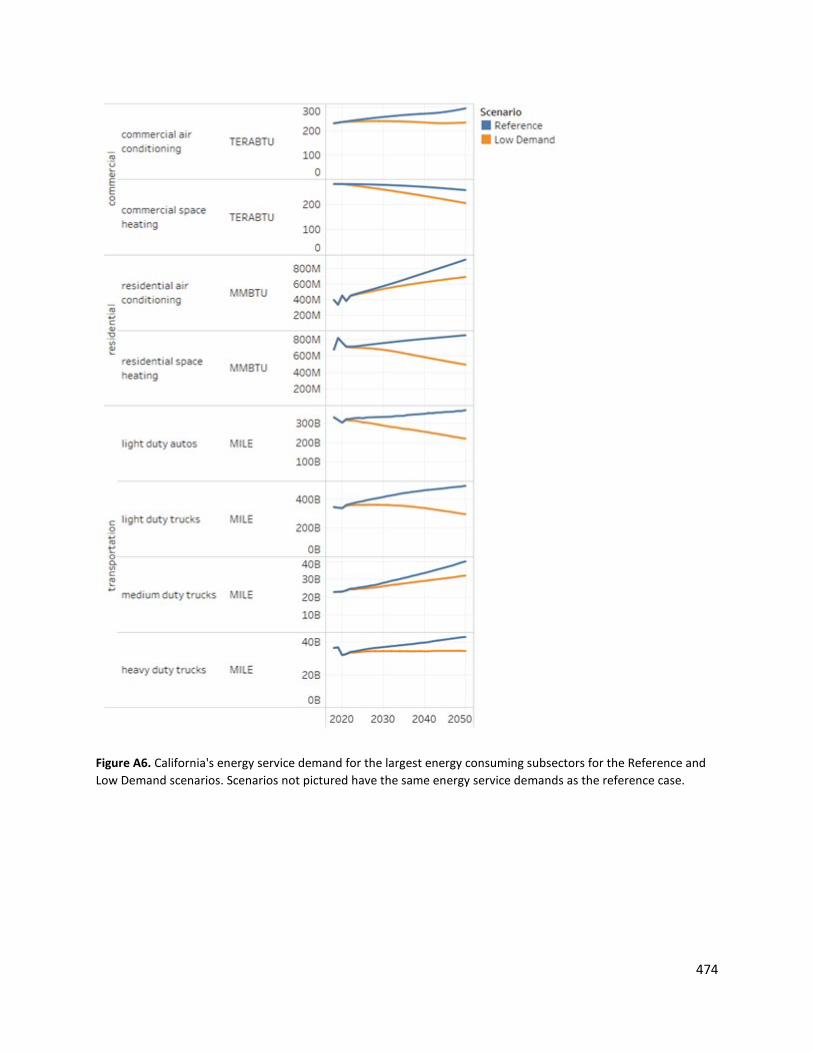
474
Figure A6. California's energy service demand for the largest energy consuming subsectors for the Reference and Low Demand scenarios. Scenarios not pictured have the same energy service demands as the reference case.

475
Figure A7. Vehicle sales shares and resulting stocks in California

476
Figure A8. California 2050 electricity consumption and supply. Fuel conversion loads include both electric boilers and electrolysis.
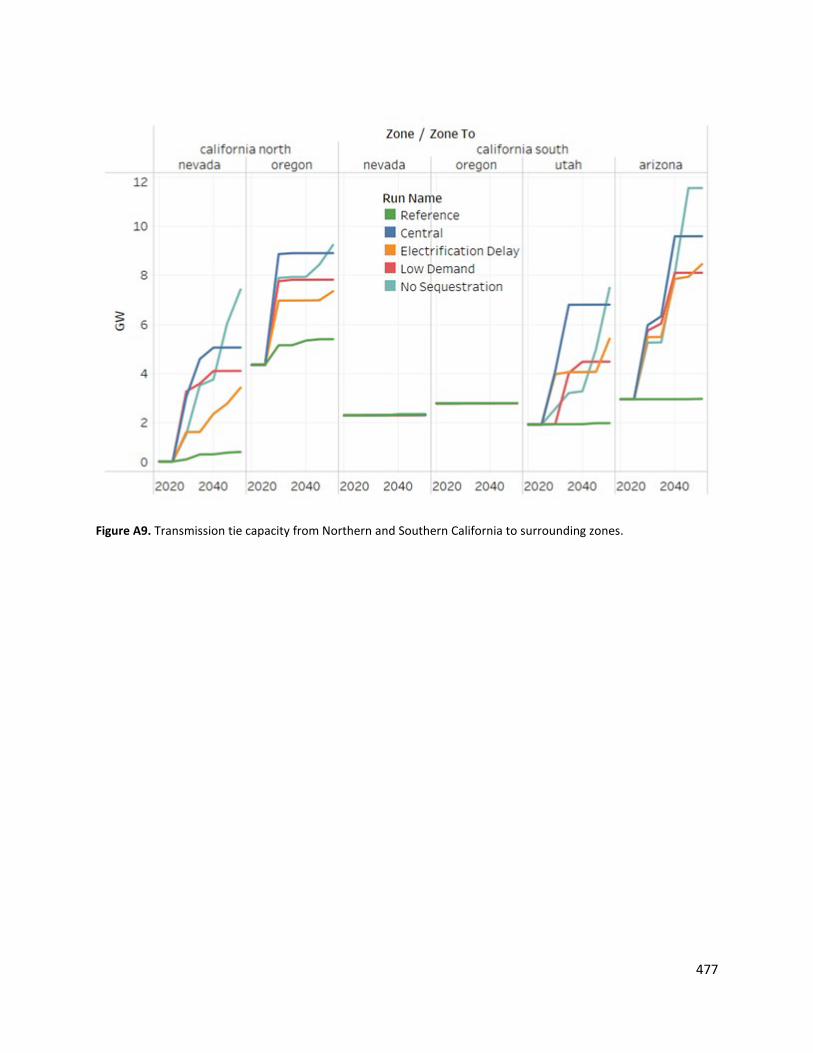
477
Figure A9. Transmission tie capacity from Northern and Southern California to surrounding zones.
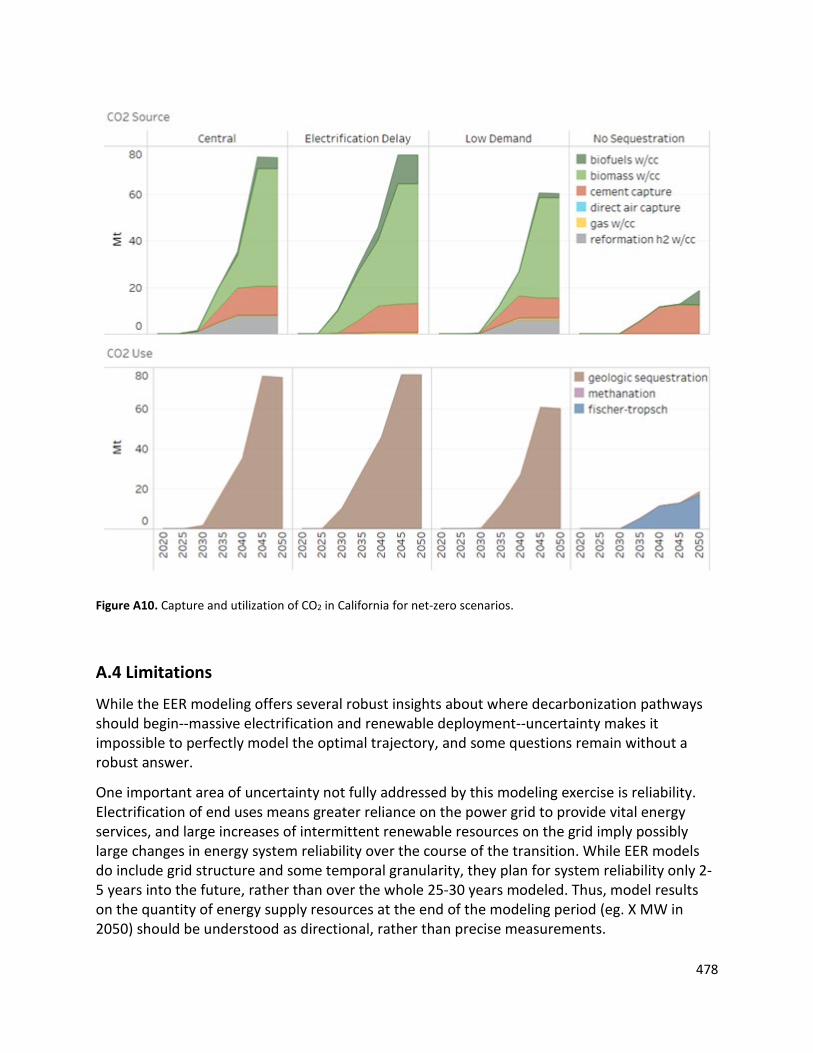
478
Figure A10. Capture and utilization of CO2 in California for net-zero scenarios.
A.4 Limitations
While the EER modeling offers several robust insights about where decarbonization pathways should begin--massive electrification and renewable deployment--uncertainty makes it impossible to perfectly model the optimal trajectory, and some questions remain without a robust answer.
One important area of uncertainty not fully addressed by this modeling exercise is reliability. Electrification of end uses means greater reliance on the power grid to provide vital energy services, and large increases of intermittent renewable resources on the grid imply possibly large changes in energy system reliability over the course of the transition. While EER models do include grid structure and some temporal granularity, they plan for system reliability only 2-5 years into the future, rather than over the whole 25-30 years modeled. Thus, model results on the quantity of energy supply resources at the end of the modeling period (eg. X MW in 2050) should be understood as directional, rather than precise measurements.

479
Also, regional level costs—both demand and supply-side—reported by the EER model are subject to significant uncertainty. These models are meant to estimate costs over broad geographic areas, and do not produce detailed outlines of the geographic distribution of these costs in sub-regions. The distribution of costs depends on many factors—including fuel availability, sequestration costs, and economic and population trends, among other—which are very difficult to estimate over time at a high spatial resolution. For this reason, regional analyses have treated EER model cost estimates for zones (like Southern California) as broad approximations and have not been precisely reported here in this Appendix.
Works Cited
1. Williams, J. H. et al. Carbon-Neutral Pathways for the United States. AGU Adv. 2, e2020AV000284 (2021).
2. Larson, E. et al. Net-Zero America: Potential Pathways, Infrastructure, and Impacts, interim report. 345 (2020).
3. SDSN. Zero Carbon Action Plan. (2020). 4. Decarb America Research Initiative. Reports. https://decarbamerica.org/report/ (2021).
480
Appendix B Review of Authority for Local Jurisdictions and Agencies to Influence and Regulate GHG Emissions Joe Kaatz, Staff Attorney, Energy Policy Initiatives Center
DRAFT FOR REVIEW
LEGAL DISCLAIMER: THE FOLLOWING IS FOR INFORMATIONAL PURPOSES ONLY. IT DOES NOT CONSTITUTE
LEGAL ADVICE NOR CREATE AN ATTORNEY-CLIENT RELATIONSHIP BETWEEN THE ENERGY POLICY INITIATIVE
CENTER (EPIC) OR UNIVERSITY OF SAN DIEGO (USD) AND ANY USER OF THE INFORMATION. USE OF THIS
INFORMATION IS AT USERS SOLE RISK AND DISCRETION. EPIC AND USD ARE NOT LIABLE FOR ERRORS OR
OMISSIONS. NO EXPRESS OR IMPLIED WARRANTEE OR GUARANTEE IS CREATED BY THIS DOCUMENT.

481
B.1 Introduction
EPIC reviewed constitutionally derived local jurisdiction police power, delegate authority from the state, and federal and state preemption that may limit local authority. EPIC used this analysis to determine if and how local jurisdictions and other agencies in the region may influence or regulate greenhouse gas (GHG) emissions. We also identified key players, regulation, and legislation that effect local authority to add context regarding a local jurisdiction’s ability to act on its own and in concert with others within the San Diego region.
In general, local authority derives from both constitutionally derived police power and delegated authority from state statutes. Constitutionally derived police power grants a broad, elastic grant of authority to act where such action is reasonably related to a legitimate government purpose and has a reasonable tendency to promote public health, safety, or the general welfare of the community. It is limited by general state law and the state and federal constitutions. The full extent of local jurisdiction police power with regards to regulating GHG emissions is unknown. Delegated authority includes, among other things, analyzing land use environmental impacts and mitigating them, adopting more stringent building codes, building infrastructure, or creating community choice aggregators to supply electricity. The following will summarize local authority by decarbonization pathway.
B.1.1 Summary of Local Authority
Local jurisdiction authority to regulate GHGs is created by broad, general constitutionally derived “police power”i or delegated authority under state or federally law. Use of police power may not conflict with “general” law (e.g., state law) under preemption principles found in California Constitutional Article XI, § 7 or federal expressed or implied preemption under the Supremacy Clause of the U.S. Constitution.ii State and federal preemption analysis, as well as the analysis on the full extent of local police power to regulate GHG emissions, are factually specific with local jurisdiction authority uncertainty dependent on the type of action.
Police power of a city or county within its own boundaries is as broad as that of the state legislature and subject only to limitations of general law.iii Police power "is not a circumscribed prerogative, but is elastic and, in keeping with the growth of knowledge and the belief in the popular mind of the need for its application, capable of expansion to meet existing conditions of modern life and thereby keep pace with the social, economic, moral, and intellectual evolution of the human race."iv Its exercise must be both:
a) Reasonably related to a legitimate government purposev; and
i Cal. Const. art. XI, § 7. ii U.S. Const. art. VI, §2. iii Candid Enters., Inc. v. Grossmont Union High Sch. Dist., 39 C3d 878, 885 (1985); Birkenfeld v. City of Berkeley, 17 Cal. 3d 129, 140 (1976); Carlin v. City of Palm Springs, 14 Cal. App. 3d 706, 711 (1971). iv Miller v. Board of Pub. Works, 195 Cal. 477, 485 (1925). v Birkenfeld v. City of Berkeley, 17 Cal. 3d 129, 158 (1976). See Consolidated Rock Prods. Co. v. City of Los Angeles, 57 Cal. 2d 515, 522 (1962).

482
b) Have a reasonable tendency to promote the public health, morals, safety, or general welfare of the community.i
Police power is especially well established in enacting and enforcing land use laws. City and county land use authority does not rely on delegated general law of the state or federal government. Instead, state and federal laws are limitations on a city’s or county’s exercise of its police power.ii To this end, local jurisdictions act with both police power and delegated authority to establish climate changes policies and regulations to reduce GHGs in general plans (GPs), climate action plans (CAPs), zoning, transit-oriented development regulations, carbon sequestration (including urban forestry), energy conservation actions through green building practices and reach codes, water conservation, and solid waste reduction. Land use authority is subject to the vested right doctrineiii and Subdivision Map Activ that limits how a subsequent change in local law or the authority to impose conditions apply to a particular improvement to land or a vesting tentative map for subdivisions.
Local jurisdiction police power is also subject to state preemption. Examples include the California Energy Commission’s (CEC) authority to site and license thermal power plants of 50 megawattsv or more and energy storage resources of 20 MWs or more that discharge for at least two hours or more and will deliver net peak energy by October 31, 2021.vi It is notable that the Governor may curtail local land use authority over siting and regional air quality regulation of these and other related energy resources, including emergency backup generation, when an emergency declaration is issued for a specified time period.vii Such declarations can suspend local and state laws by either establishing exclusive licensing authority that preempts or by expressly suspending air quality laws, the California Environmental Quality Act (CEQA), and the California Coastal Act (CAC). Emergency declarations may also have the effect of limiting judicial review of such licenses.
Local land use authority is generally concurrent to, and not preempted by, air quality authority law and regulation of air pollutants from stationary, nonvehicular source of emissions. Concurrent authority may allow local jurisdictions to further regulate air quality under its police power.viii It should be noted that there is no power granted to local air districts to infringe on an existing local jurisdiction’s authority over land use (e.g., zoning).ix
Charter cities and counties act with more autonomy over governance decisions than common law cities and countiesx; however, all local jurisdictions are controlled and subject to general state law. Of the
i Carlin v. City of Palm Springs, 14 Cal. App. 3d 706, 711 (1971). ii DeVita v. County of Napa, 9 Cal. 4th 763, 782 (1995); Candid Enters., Inc. v. Grossmont Union High Sch. Dist., 39 Cal. 3d 878, 885 (1985). iii Avco Community Developers v. South Coast Reg'l Comm'n, 17 Cal. 3d 785, 791 (1976), superseded by statute as stated in Santa Margarita Area Residents Together v. San Luis Obispo County Bd. Of Supervisors, 84 Cal. 4th 221, 229 (2000). iv See Government Code §§ 66410–66499.38; Government Code § 66474.2 & 66498.1(b). v See Public Resources Code §§ 25500 et seq.; See Public Resources Code §§ 25120 & 25123. vi See California Energy Commission Order No. 21-0908-1 (Adopted September 8, 2021). vii See Governor’s July 30, 2021 Proclamation of A State of Emergency to address energy supply and demand issues; See U.S. Const. Amendment X; See California Emergency Services Act: Government Code §§ 8558, 8567, 8571, 8625, & 8627. viii See Health & Safety Code §§ 39002 & 41508. ix See Health & Safety Code §§ 40716(b) & 41015. x See Cal. Const. art. XI; See Government Code § 34871.

483
nineteen local governments in the San Diego region, there are eight charter citiesi and the County of San Diego is a charter county. Notably, all cities act with a higher level of autonomy than the county because they are voluntarily formed and perform many essential services. Charter cities also act with more autonomy than common law cities under the “home rule” power to govern matters of “municipal affairs.”ii Charter counties exercise limited home rule authority.iii This power allows local laws to expand beyond state law requirements. However, the extent of home rule authority is a legal determination that depends on the specific charter and municipal code of individual charter jurisdiction, whether the exercised authority is for a municipal affair, and whether the matter is of statewide concern where it is the intent and purpose of the general laws to occupy the field to the exclusion of municipal regulation.iv Finally, because counties are the legal subdivision of the state, the state may delegate or rescind any delegated function of the state to a county.
Local jurisdictions also act with the authority to taxv, issue bondsvi, and impose fees, charges, and rates.vii This authority is derived from and limited by the California Constitution and statute, including requiring voter approval for taxes and bonds. viii
B.2 Local Authority to Decarbonize Transportation
Transportation emissions may be reduced by regulating direct (e.g., tailpipe) emissions from vehicles, including by switching to low carbon fuels such as clean electricity, by changing land use patterns to reduce the distances needed to be traveled (e.g., reducing VMT and/or providing alternative transportation modes to single-occupant vehicles), and by designing communities to reduce system inefficiencies such as those caused by transportation congestion (e.g., synchronized traffic lights.) The legal authority to regulate each type of transportation emissions is described below.
Local authority over transportation is rooted in land use authority over planning and development that determines where residents live and work. City and county land use authority does not rely on
i Cities of Carlsbad, Chula Vista, Del Mar, El Cajon, Oceanside, San Diego, San Marcos, and Vista. ii Cal. Const. art. XI, § 5. iii Charter County limited “home rule” authority includes: 1) providing for lection, compensation, terms, removal, and salary of the governing board; 2) for the election or appointment (except the sheriff, district attorney, and assessor who must be elected), compensation, terms, and removal of all county officers; 3) for the powers and duties of all officers; and for consolidation and segregation of county offices. It excludes additional authority over: 1) local regulations; 2) revenue-raising abilities; 3) budgetary decisions; or 4) intergovernmental relations. iv See Cal. Const. art. XI, § 5, subd. (a).; See Jackson v. City of Los Angeles, 111 Cal. App. 4th 899 (2d Dist. 2003); See City of Santa Clara v. Von Raesfeld, 3 Cal. 3d 239 (1970); See Baron v. City of Los Angeles, 2 Cal. 3d 535 (1970); Dairy Belle Farms v. Brock, 97 Cal. App. 2d 146, 217 P.2d 704 (1st Dist. 1950); See Wilkes v. City and County of San Francisco, 44 Cal. App. 2d 393, (1st Dist. 1941); See People ex rel. Scholler v. City of Long Beach, 155 Cal. 604 (1909); See Galli v. Brown, 110 Cal. App. 2d 764 (1st Dist. 1952); See Pearson v. Los Angeles County, 49 Cal. 2d 523 (1957). v Cal. Const. art. XIIIC, § 2(a) & (d). vi See generally Municipal Bond Act of 1901 (Government Code §§ 43600–43638) & Government Code §§ 50665.1–50670. vii Cal. Const. art. XI, §7.; see also Revenue Bond Act of 1941 (Government Code §§ 54300 et seq., Uniform Standby Charge Procedure Act (Government Code §§ 54984 et seq.); Government Code § 66013; Government Code § 66014; Health & Safety Code §§ 5471 & 5473; See generally Government Code § 37112. viii See generally Cal. Const. art. XIIIA, XIIIC, & XIIID; See Bradley-Burns Uniform Local Sales and Use Tax Law (Revenue & Tax Code §§ 7200 et seq.).
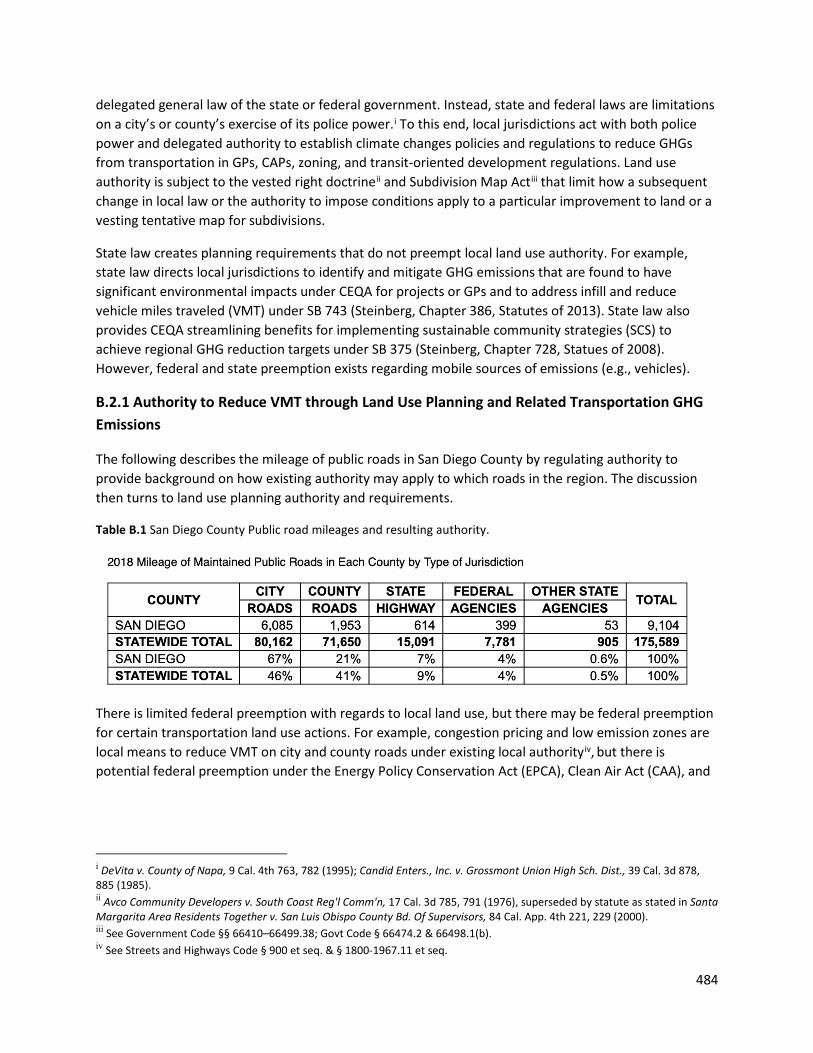
484
delegated general law of the state or federal government. Instead, state and federal laws are limitations on a city’s or county’s exercise of its police power.i To this end, local jurisdictions act with both police power and delegated authority to establish climate changes policies and regulations to reduce GHGs from transportation in GPs, CAPs, zoning, and transit-oriented development regulations. Land use authority is subject to the vested right doctrineii and Subdivision Map Actiii that limit how a subsequent change in local law or the authority to impose conditions apply to a particular improvement to land or a vesting tentative map for subdivisions.
State law creates planning requirements that do not preempt local land use authority. For example, state law directs local jurisdictions to identify and mitigate GHG emissions that are found to have significant environmental impacts under CEQA for projects or GPs and to address infill and reduce vehicle miles traveled (VMT) under SB 743 (Steinberg, Chapter 386, Statutes of 2013). State law also provides CEQA streamlining benefits for implementing sustainable community strategies (SCS) to achieve regional GHG reduction targets under SB 375 (Steinberg, Chapter 728, Statues of 2008). However, federal and state preemption exists regarding mobile sources of emissions (e.g., vehicles).
B.2.1 Authority to Reduce VMT through Land Use Planning and Related Transportation GHG Emissions
The following describes the mileage of public roads in San Diego County by regulating authority to provide background on how existing authority may apply to which roads in the region. The discussion then turns to land use planning authority and requirements.
Table B.1 San Diego County Public road mileages and resulting authority.
There is limited federal preemption with regards to local land use, but there may be federal preemption for certain transportation land use actions. For example, congestion pricing and low emission zones are local means to reduce VMT on city and county roads under existing local authorityiv, but there is potential federal preemption under the Energy Policy Conservation Act (EPCA), Clean Air Act (CAA), and
i DeVita v. County of Napa, 9 Cal. 4th 763, 782 (1995); Candid Enters., Inc. v. Grossmont Union High Sch. Dist., 39 Cal. 3d 878, 885 (1985). ii Avco Community Developers v. South Coast Reg'l Comm'n, 17 Cal. 3d 785, 791 (1976), superseded by statute as stated in Santa Margarita Area Residents Together v. San Luis Obispo County Bd. Of Supervisors, 84 Cal. App. 4th 221, 229 (2000). iii See Government Code §§ 66410–66499.38; Govt Code § 66474.2 & 66498.1(b). iv See Streets and Highways Code § 900 et seq. & § 1800-1967.11 et seq.

485
Federal Aviation Administration Authorization Act (FAAAA)i that must be evaluated and resolved.ii Additionally, tolls on “federal-aid highways” would require compliance with Federal United States Code 23 related to highways and approval from the Federal Highway Administration. SANDAG operates high-occupancy toll (HOT) lanes along I-15 under this type of federal approval.iii
State authority extends over state highways under Streets and Highway Code §§ 250 et seq., which includes acquisition of land, construction of roads, and care to preserve value and utility of the road. State law also authorizes the creation of toll bridges, roads, and ferries.iv It is unclear whether the state may create congestion pricing or low emission zones in light of EPCA, CAA, and FAAAA preemption issues. California is also exploring piloting a road user mileage-based fee under SB 339 (Wiener, Chapter 308, Statutes of 2021) that may offer additional means of addressing GHG emissions. Whether there is applicability to the local level will need to be further examined.
Local governments have been granted inherent police powers under the California constitution (California Constitution art. XI, § 7) with primary local control over local land use, including localv and county roads.vi The primacy of city and county’s control over land use, therefore, does not rely on delegated general law of the state or federal government. Instead, state and federal laws act only as minimal limitations on a city or county’s exercise of its police power.vii
To this end, local jurisdictions may establish climate change policies and regulations to reduce GHGs from transportation in GPs, CAPs, zoning, and transit-oriented development regulations. However, land use authority is subject to the vested right doctrineviii and Subdivision Map Actix that limit how a subsequent change in local law or the authority to impose conditions apply to a particular improvement to land or a vesting tentative map for subdivisions. State law directs local jurisdictions to mitigate GHG emissions that are found to have significant environmental impacts under CEQA for projects or GPs, to address infill and reduce VMT under SB 743 (Steinberg, Chapter 386, Statutes of 2013). It creates a CEQA streamlining benefit to implementing SCS to achieve regional GHG reduction targets under SB 375 (Steinberg, Chapter 728, Statues of 2008). These planning requirements do not preempt local land use authority but are instead requirements that inform land use decisions.
State and regional entity authority to preempt local land use authority is limited in terms of transportation land use planning.x At the regional level, SANDAG is responsible for, among other things: 1) regional transportation planning, resource allocation, project development (excluding airport and
i 49 U.S.C.A. §§ 14501(c)(1) & (c)(2)(A) ii Turner, Amy E. and Burger, Michael, "Cities Climate Law: A Legal Framework for Local Action in the U.S." (2021). Sabin Center for Climate Change Law. p. 37: https://scholarship.law.columbia.edu/sabin_climate_change/2 iii See 23 U.S.C.A. § 166. iv See Streets and Highways Code § 30000 et seq. v See Streets and Highways Code § 1800 et seq. vi See Streets and Highways Code § 900 et seq. vii DeVita v County of Napa, 9 Cal. 4th 763, 782 (1995); Candid Enters., Inc. v. Grossmont Union High Sch. Dist., 39 Cal. 3d 878, 885 (1985). viii Avco Community Developers v. South Coast Reg'l Comm'n, 17 C3d 785, 791 (1976), superseded by statute as stated in Santa Margarita Area Residents Together v. San Luis Obispo County Bd. of Supervisors, 84 CA4th 221, 229 (2000). ix See Government Code §§ 66410–66499.38; Govt Code § 66474.2 & 66498.1(b). x See Streets and Highways Code § 50 et seq.
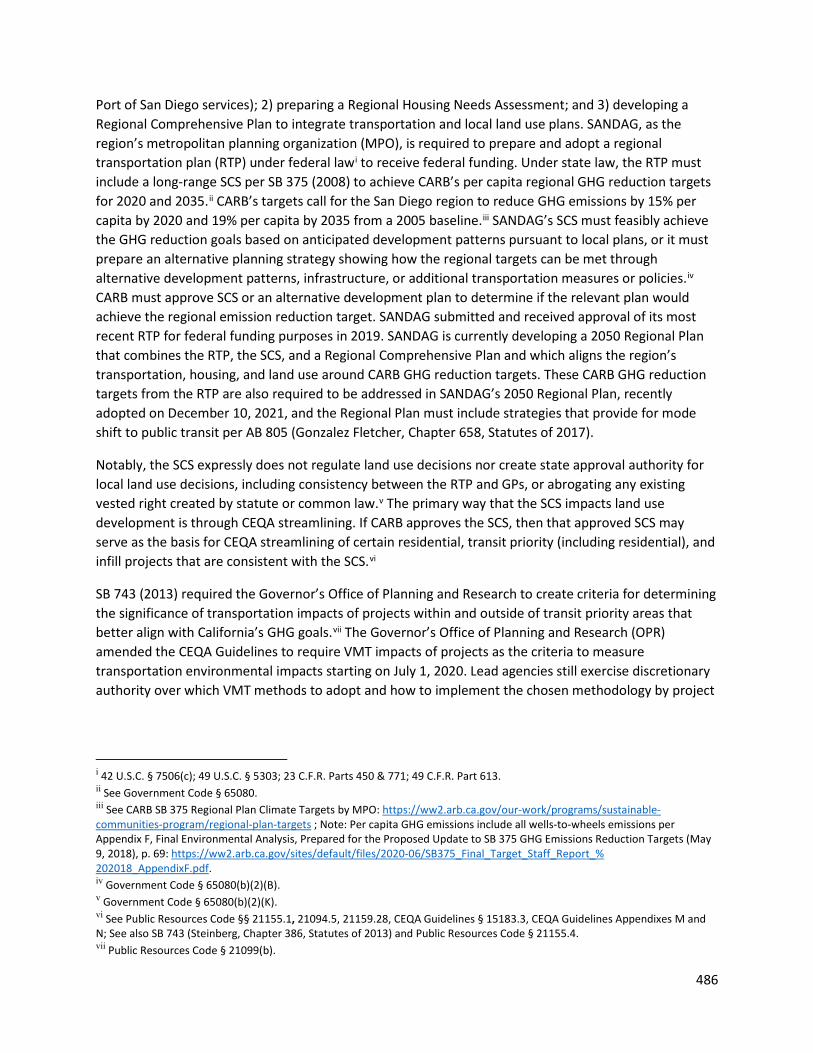
486
Port of San Diego services); 2) preparing a Regional Housing Needs Assessment; and 3) developing a Regional Comprehensive Plan to integrate transportation and local land use plans. SANDAG, as the region’s metropolitan planning organization (MPO), is required to prepare and adopt a regional transportation plan (RTP) under federal lawi to receive federal funding. Under state law, the RTP must include a long-range SCS per SB 375 (2008) to achieve CARB’s per capita regional GHG reduction targets for 2020 and 2035.ii CARB’s targets call for the San Diego region to reduce GHG emissions by 15% per capita by 2020 and 19% per capita by 2035 from a 2005 baseline.iii SANDAG’s SCS must feasibly achieve the GHG reduction goals based on anticipated development patterns pursuant to local plans, or it must prepare an alternative planning strategy showing how the regional targets can be met through alternative development patterns, infrastructure, or additional transportation measures or policies.iv CARB must approve SCS or an alternative development plan to determine if the relevant plan would achieve the regional emission reduction target. SANDAG submitted and received approval of its most recent RTP for federal funding purposes in 2019. SANDAG is currently developing a 2050 Regional Plan that combines the RTP, the SCS, and a Regional Comprehensive Plan and which aligns the region’s transportation, housing, and land use around CARB GHG reduction targets. These CARB GHG reduction targets from the RTP are also required to be addressed in SANDAG’s 2050 Regional Plan, recently adopted on December 10, 2021, and the Regional Plan must include strategies that provide for mode shift to public transit per AB 805 (Gonzalez Fletcher, Chapter 658, Statutes of 2017).
Notably, the SCS expressly does not regulate land use decisions nor create state approval authority for local land use decisions, including consistency between the RTP and GPs, or abrogating any existing vested right created by statute or common law.v The primary way that the SCS impacts land use development is through CEQA streamlining. If CARB approves the SCS, then that approved SCS may serve as the basis for CEQA streamlining of certain residential, transit priority (including residential), and infill projects that are consistent with the SCS.vi
SB 743 (2013) required the Governor’s Office of Planning and Research to create criteria for determining the significance of transportation impacts of projects within and outside of transit priority areas that better align with California’s GHG goals.vii The Governor’s Office of Planning and Research (OPR) amended the CEQA Guidelines to require VMT impacts of projects as the criteria to measure transportation environmental impacts starting on July 1, 2020. Lead agencies still exercise discretionary authority over which VMT methods to adopt and how to implement the chosen methodology by project
i 42 U.S.C. § 7506(c); 49 U.S.C. § 5303; 23 C.F.R. Parts 450 & 771; 49 C.F.R. Part 613. ii See Government Code § 65080. iii See CARB SB 375 Regional Plan Climate Targets by MPO: https://ww2.arb.ca.gov/our-work/programs/sustainable-communities-program/regional-plan-targets ; Note: Per capita GHG emissions include all wells-to-wheels emissions per Appendix F, Final Environmental Analysis, Prepared for the Proposed Update to SB 375 GHG Emissions Reduction Targets (May 9, 2018), p. 69: https://ww2.arb.ca.gov/sites/default/files/2020-06/SB375_Final_Target_Staff_Report_%202018_AppendixF.pdf. iv Government Code § 65080(b)(2)(B). v Government Code § 65080(b)(2)(K). vi See Public Resources Code §§ 21155.1, 21094.5, 21159.28, CEQA Guidelines § 15183.3, CEQA Guidelines Appendixes M and N; See also SB 743 (Steinberg, Chapter 386, Statutes of 2013) and Public Resources Code § 21155.4. vii Public Resources Code § 21099(b).

487
type (e.g., residential, commercial, industrial, etc.).i The methodology chosen affects which projects are either exempt or are found to be above or below the environmental impact threshold of significance. This determines directly which projects require transportation impact GHG mitigation and may allow a local jurisdiction to prioritize infill and transit-oriented projects.
Under CEQA, local jurisdictions as lead agencies act with discretion in determining thresholds of significance to evaluate significant environmental impacts and consequent mitigation from transportation.ii This may include adopting specific GHG thresholds of significance for the specific jurisdiction, using compliance with California climate policy such as AB 32 (Núñez, Chapter 488, Statutes of 2006) to determine a threshold of significance, or adopting an air pollution control district recommended threshold for transportation GHG emission.iii The threshold of significant controls impact analysis and mitigation and drives the use of overriding considerations where impacts cannot be mitigated below the threshold of significance or where mitigation is infeasible.
B.2.2 Air District Indirect Emissions and Local Jurisdiction Concurrent Authority
Stationary source direct air pollution is controlled by federal CAA and California air quality laws. Local land use authority is not preemptive by and is generally concurrent to air quality authority statutes and regulations that are used by the San Diego County Air Pollution Control District (SD APCD) to regulate indirect transportation air pollutants from a stationary, nonvehicular source of emissions (e.g., transportation emissions related to buildings). Concurrent authority may allow a local jurisdiction to further regulate air quality under its police poweriv, although local jurisdictions would need to develop internal technical expertise by hiring staff and avoid state and federal preemption. It should be noted that there is no statutory power granted to SD APCD to infringe on the existing local government authority over land use with regards to air quality regulation (e.g., zoning).v
The SD APCD may regulate indirect emissions from transportation to reduce emissions from transportation and areawide emission sources to achieve and maintain state ambient air quality standards.vi This allows regulation of direct and indirect emissions sources, including large office buildings and large residential and commercial developments. In certain instances, a permit may be required to carry out activities that emit air containment or pollutants. However, there is uncertainty over jurisdiction and how to interpret this authority for indirect emission.vii Additionally, existing authority is used by other air districts to create a voluntary GHG reduction credit generation and certification program to help address emissions of this type. Examples exist of creating a voluntary
i See Governor’s Office of Planning and Research: Transportation Impacts SB 743 (Last visited on October 28, 2021): https://opr.ca.gov/ceqa/sb-743/ . ii See 14 C.C.R. § 15064.4. iii See Center for Biological Diversity v. Department of Fish & Wildlife, 62 Cal. 4th 204, 230 (2015). iv See Health & Safety Code §§ 39002, 39037, & 41508. v See Health & Safety Code §§ 40716(b) & 41015. vi Health & Safety Code §§ 40910, 40716-40717 vii Health & Safety Code §§ 42300–42339; See Health & Safety Code §§ 40716(b) & 41015 (sometimes interpreted as not prohibiting parallel permitting systems for indirect sources); See 76 Ops Call Atty Gen 11 (1993) (Attorney General opinion that authority of an APCD or AQMD does not extend to requiring permits for indirect sources; Note: Attorney General opinions are nonbinding).
488
program for transportation emissions reductions at this time that may be applicable to the SD APCD (see Section 4.1 below).i
Air pollution control district authority exists to address indirect emissions subject to expressed limits. Health and Safety Code §§ 40716 & 40717 authorizes regulations to reduce VMT and allows the enforcement of transportation control measures in non-attainment areas by SD APCD and SANDAG. Health and Safety Code § 40918 allows for regulation where there is moderate air pollution. This may include transportation control measures to reduce VMT, areawide source control programs, and indirect source control programs.
In this respect, ozone (O3) is the only air pollutant with nonattainment status in the San Diego region directly regulated at the local level.ii Regional O3 is now considered severe as of July 2, 2021, under the 2015 Eight-Hour Ozone National Ambient Air Quality Standards (NAAQS) by U.S. EPA. Under the previous moderate designation, the currentiii and previousiv Regional Transportation Plan and SD APCD Plan for Attaining Air Quality Standards of Ozone in San Diego County showed implementation surpassed for transportation control measures and indirect regulation of O3 with all actions and measures implemented.v It is possible that this may be updated to address the recent severe nonattainment designation that now sets August 3, 2033, as the new attainment date.
The following is a non-exhaustive list of additional restrictions on SD APCD and local jurisdiction authority with regards to transportation emissions:
● SD APCD is prohibited from requiring an employee trip reduction program unless required by federal lawvi;
● SD APCD and regional and local jurisdictions are generally prohibited from requiring that private parties impose parking charges, restrict parking, or impose measures to reduce retail shopping tripsvii;
● SD APCD or its delegate is limited in imposing transport control measures on event centersviii;
i See Sacramento Metropolitan AQMD Rule 206 Mobile and Transportation Source Emission Reduction Credits (Adopted December 15, 1992; Amended December 5, 1996): http://www.airquality.org/ProgramCoordination/Documents/rule206.pdf. ii Note: Nonattainment exists in the region for PM2.5 and PM 10 under 17 C.C.R. §§ 60205 & 60210, but these are directly regulated by CARB with some local enforcement implemented by SD APCD; See SD APCD’s Mobile Source Program: https://www.sdapcd.org/content/sdapcd/compliance/compliance-requirements/mobile-source-program.html . iii SANDAG San Diego Forward, Federal Regional Transportation Plan, Appendix B Air Quality Planning and Transportation Conformity), p. 22 (Adopted October 25, 2019 by SANDAG: Adopted November 15, 2019 by U.S. DOT: https://sdforward.com/docs/default-source/2019federalrtp/draftfinal/app-b---air-quality-planning-and-transportation-conformity.pdf?sfvrsn=1a47ff65_2 . iv SANDAG Federal Regional Transportation Plan for 2050, Appendix B Air Quality Planning and Transportation Conformity (2011), p. B-16. v SD APCD Plan for Attaining National Air Quality Standards for Ozone in San Diego County, Attachment H (October 2020), p. H-1 (p.338): https://www.sandiegocounty.gov/content/dam/sdc/apcd/PDF/Air%20Quality%20Planning/Att%20A%20(Attainment%20Plan)_ws.pdf . vi Health & Safety Code § 40717.9 (a). vii Health & Safety Code § 40717.6. viii Health & Safety Code § 40717.8.
489
● SD APCD is prohibited from adopting new or more stringent control measures with respect to pollutants where standards have not been violated unless it prepares an analysis of the costs and benefits of achieving attainmenti; and
● SD APCD is prohibited from adopting or enforcing a regulation requiring fleet operators to purchase or lease only those vehicles that meet state motor vehicle pollutant standardsii, but under its authority to regulate indirect sources of air pollution may regulate emissions from groups of non-road construction equipment at development sites (Note: non-road construction equipment is included as “off-road” emissions in regional and local GHG inventories).iii
B.2.3 Legal Authority to Regulate Direct Emissions from Vehicles
Federal and state law and regulation preempt local jurisdictions from regulating GHG emissions directly from on-road and off-road mobile sources. The federal Energy Policy & Conservation Act (EPCA) preempts California or a local jurisdiction from setting fuel economy standards or average fuel economy standards for automobiles.iv Several federal courts have held that local jurisdictions are preempted under the EPCA from requiring clean energy technology for certain classes of vehicles (e.g., hybrid taxis).v Direct tailpipe GHG emissions are also regulated by the U.S. EPA under the CAA Section 202.vi U.S. EPA and Department of Transportation (DOT) National Highway Transportation Safety Administration (NHTSA) act with concurrent jurisdiction to regulate GHGs and fuel economy standards for light-duty and heavy-duty vehicles under the CAA.
Through this concurrent jurisdiction, the U.S. EPA and NHTSA have promulgated fuel economy standards with GHG tailpipe emissions standards for specified model years. Consequently, federal preemption exists under NHTSA's Corporate Average Fuel Economy (CAFE)vii standards for passenger cars and light-duty truck models (model years 2017–2021 and 2021–2026viii), medium-duty vehicles (model years 2014–2018), and heavy-duty vehicles (model years 2014–2018ix and 2018–2027 (currently stayed and pending proposal to withdrawx)).
i Health & Safety Code § 40930. ii See Engine Mfrs. Ass'n v. South Coast Air Quality Mgmt. Dist., 541 U.S. 246 (2004). iii See National Ass'n of Home Builders v. San Joaquin Valley Unified Air Pollution Control Dist., 627 F3d 730 (9th Cir 2010). iv 49 U.S.C.A § 32919(a). v Metro. Taxicab Bd. of Trade v. City of New York, 615 F.3d 152, 157 (2d Cir. 2010), cert. denied, 562 U.S. 1264 (2011); Ophir v. City of Boston, 647 F.Supp. 2d 86, 94 (D. Mass. 2009). vi See Revised 2023 and Later Model Year Light Duty Vehicle Greenhouse Gas Emission Standards (Model Years 2023–2024), Final Rule Docket No. EPA-HQ-OAR-2021-0208, 40 C.F.R Part 19, 86, 523, 600, 1066, & 1867: https://www.epa.gov/regulations-emissions-vehicles-and-engines/final-rule-revise-existing-national-ghg-emissions#rule-summary. vii See NHTSA: Corporate Average Fuel Economy (Last visited October 29, 2021): https://www.nhtsa.gov/laws-regulations/corporate-average-fuel-economy. viii 40 CFR Parts 531, 531.5(d) and 533; Note: NHTSA proposed new CAFE rules for model years 2024–2026 on August 10, 2021: DOT, NHTSA, 49 CFR Parts 531, 533, 536, and 537, Docket No. NHTSA-2021-0053, RIN 2127-AM34, Proposed Rulemaking: https://www.govinfo.gov/content/pkg/FR-2021-09-03/pdf/2021-17496.pdf. ix 40 CFR Parts 85, 86, 600, 1033, 1036, 1037, 1039, 1065, 1066, and 1068 (U.S. EPA) and 40 CFR Parts 523, 534, and 535 (NHTSA); partially withdrawn in 2013 under 40 CFR Part 1037, 1039, 1042, and 1068 (U.S. EPA) and 40 CFR Parts 535 (NHTSA). x See Final Rule for Phase 2 fuel efficiency and GHG emissions standards for medium-& heavy-duty vehicles, MY2018–2027 is currently stayed pursuant to an order of the United States Court of Appeals for the District of Columbia Circuit issued on September 29, 2020 in case No. 16-1430; NHTSA proposed to repeal the stayed SAFE I rule on April 22, 2021: DOT, NHTSA, 49

490
California uses delegated federal authority to enforce more stringent emission standards under its California State Implementation Plan (SIP) for new vehicles using the CAA Section 209 waiver provision. California, through CARB, regulates light-duty vehicles under the Advanced Clean Cars (ACC) program with recent action including adopting GHG standards for models years 2022–2025, requiring zero emission vehicles (ZEV) be developed and sold by manufacturers, developing regulations for model years 2026 and beyond (Advanced Clean Cars IIi and LEV IV), and enforcing particulate matter standards.ii CARB approved its funding plan for the Fiscal Year 2021–2022 on November 19, 2021, allocating $675 million to light-duty related incentives, including $150 million for equity programs (see programs below). Notably, the CAA preempts the SD APCD from adopting or enforcing any state or local standard relating to the control of emissions from new motor vehicles or motor vehicle engines.iii
It is unclear whether local jurisdiction police power or delegated permit, fees, rules, and regulations under California Public Utilities Code § 5371.4 (f)–(g) related to city and counties may allow for the acceleration of the reduction targets and goals for transportation network companies (TNCs). TNCs are regulated under SB 1014 (Skinner, Chapter 269, Statutes of 2018), with CARB mandated to establish GHG emission reduction targets, goals, and baselines that are then implemented by the California Public Utilities Commission (CPUC) to reduce GHG emission per passenger-mile starting in 2023 as part of the CPUC’s regulation of TNCs as charter-party carriers.iv Additionally, the San Diego County Regional Airport Authority (SDCRAA) is authorized by the CPUC to directly regulate TNCs at its airports, which may allow further regulation of GHG emissions from TNC related trips either through these rulesv, its Clean Vehicle Conversion Incentive Programvi, or through its local police and land use authorityvii related to environmental impacts for current and future construction, which is subject to federal preemption over airport operations and review under National Environmental Protection Act (NEPA).viii
CFR Parts 531 and 533, Docket No. NHTSA-2021-0030, RIN 21217-AM33, CAFE Preemption, Notice of Proposed Rule Making: https://www.nhtsa.gov/sites/nhtsa.gov/files/2021-04/cafe_preemption_nprm_04222021_1_0.pdf. i See CARB Public Workshop on Advanced Clean Cars II, Draft Regulatory Language for ACC II (October 13, 2021). ii See Low-Emission Vehicle (LEV) Regulation, LEV III Criteria & LEV III GHG, ZEV Regulation, and ACC II & LEV IV; see 13 California Code of Regulations (C.C.R.) § 1360 et seq. iii 42 U.S.C.A. § 7543 (a); Engine Mfrs. Ass'n v. South Coast Air Quality Mgmt. Dist., 541 US 246 (2004). iv See Cal. Const. art. XII; See California Passenger Charter-party Carriers’ Act (California Public Utilities Code §§ 5351 et seq.); See California Public Utilities Commission Rulemaking R.12-12-011 & Decision D.13-09-045, Order Instituting Rulemaking on Regulations Relating to Passenger Carriers, Ridesharing, and New Online-Enabled Transportation Services (2013); See California Public Utilities Commission General Order 157-E (Effective October 31, 2019): https://docs.cpuc.ca.gov/PublishedDocs/Published/G000/M322/K150/322150628.pdf. v California Public Utilities Commission D.13-09-045, Decision Adopting Rules and Regulation to Protect Public Safety While Allowing New Entrants To the Transportation Industry (September 23, 2013), p. 33: https://docs.cpuc.ca.gov/PublishedDocs/Published/G000/M077/K192/77192335.PDF; See San Diego County Regional Airport Authority (SDCRAA) Rules and Regulations, V7.0, § 5.4 (July 2019): https://www.san.org/DesktopModules/Bring2mind/DMX/API/Entries/Download?EntryId=7364&Command=Core_Download&language=en-US&PortalId=0&TabId=585. vi See SDCRAA Clean Transportation Plan (July 2020), p. 28 & 47: https://www.san.org/Portals/0/Documents/Environmental/2020-Plans/2020_Clean-Transportation-Plan-min.pdf. vii See SDCRAA Carbon Neutrality Plan (July 2020), p. 51. viii See U.S. Department of Transportation Federal Aviation Administration, Western-Pacific Region, Finding of No Significant Impact and Record of Decision, Proposed Airfield Improvements and Terminal 1 Replacement Project, San Diego International Airport, San Diego, San Diego County, California (October 21, 2021), p. 8: https://www.san.org/DesktopModules/Bring2mind/DMX/API/Entries/Download?Command=Core_Download&EntryId=14744&language=en-US&PortalId=0&TabId=225.

491
In terms of medium- and heavy-duty vehicles, there are a wide range of regulations for on-road vehicles that include prohibitions on diesel idling for heavy-duty long haul trucksi and school busesii, the LEV III standards as part of the ACC programiii, GHG emission control through Phase 1 and Phase 2 GHG standardsiv, the Advanced Clean Trucks regulationv, Truck and Bus Regulationvi, Tractor-Trailer Greenhouse Gas (TTGGH) regulation, the Heavy-Duty Omnibus Regulationvii, and other regulations specific to class or use case.viii These regulations will continue to change to address the executive orders and to more directly regulate GHG emissions out to 2035. CARB approved its funding plan for the Fiscal Year 2021–2022 on November 19, 2021, allocating $678.14 million to heavy-duty related incentive programs (see more detail on these programs below).
Regulation of non-road and off-road engines includes both regulations from U.S. EPA and CARB applied to specific types and uses of vehicles and engines (Note: off-road is omitted from the policy opportunity section of Chapter 8). Notably, most of these regulations do not address GHG emissions directly or regulate GHG emissions indirectly by regulating other pollutants. Zero emission technology also may not be feasible for off-road engines leaving combustion standards as the best means to reduce emissions. CARB approved its funding plan for the Fiscal Year 2021–2022 on November 19, 2021, allocating specifically $194.5 million to the Clean Off-Road Equipment Vouchers (CORE) program with additional supports of these regulations by other allocations to heavy-duty vehicle programs.
Local authority may exist to regulate certain small off-road engines, but further research is required. Existing regulations apply to small off-road engines (excluding engines under 25 horsepower (hp))ix, off-highway recreational vehicles and enginesx, off-road compression-ignition engines and equipmentxi, SIP credit for mobile agricultural equipment in the San Joaquin Valley APCDxii, off-road large spark-ignition enginesxiii, spark-ignition marine enginesxiv, in-use off-road diesel-fueled fleets (Tier 4 regulationsxv (U.S. EPA preempts emission standards for new farm and construction equipment with engines less than 175
i 13 C.C.R. § 2485. ii 13 C.C.R. § 2480. iii 13 C.C.R. § 1956.8. iv 13 C.C.R. §§ 1963 et. seq. v See Truck and Bus Regulation information: https://ww2.arb.ca.gov/our-work/programs/truck-and-bus-regulation. vi See TTGHG Regulation Information: https://ww2.arb.ca.gov/our-work/programs/ttghg. vii See Heavy-Duty OBD Regulation and Rulemaking: https://ww2.arb.ca.gov/resources/documents/heavy-duty-obd-regulations-and-rulemaking. viii See Zero-Emission Transport Refrigeration Units Regulation: 13 C.C.R §§ 2477.1–2477.6; 13 C.C.R § 2477.13; 13 C.C.R §§ 2477.17–2477.19; see Zero-Emission Powertrain Certification Regulation: 13 C.C.R § 1956.8; see Zero-Emission Drayage Truck Regulation: 13 C.C.R § 2027. ix 13 C.C.R. §§ 2400–2409. x 13 C.C.R. §§ 2410–2419.4. xi 13 C.C.R. §§ 2420–2427. xii 13 C.C.R. §§ 2428. xiii 13 C.C.R. §§ 2430–2439. xiv 13 C.C.R. §§ 2440–2448. xv 13 C.C.R. §§ 2449–2449.3 & Appendix A; See also CARB Non-Road Diesel Engine Certification Tier Chart (Last accessed on November 1, 2021): https://ww2.arb.ca.gov/resources/documents/non-road-diesel-engine-certification-tier-chart?utm_medium=email&utm_source=govdelivery
492
HP (130 kW)i)) with Tier 5 regulation stakeholder engagement proposals just introducedii), portable engine and equipmentiii (including fuel containers and spoutsiv), portable outboard marine tanks and componentsv, aftermarket off-road parts certification proceduresvi, and off-road airborne toxic control measures for in-use diesel-fueled transport refrigeration units (TRU) and TRU generator sets (including facilities where TURs operate).vii Additional off-road regulations include evaporative emission requirements for off-road equipmentviii, large spark-ignition (LSI) engine fleet requirementsix, regulation of retrofits to control emission from off-road large spark-ignition enginesx, and evaporative emission requirements for spark-ignition marine watercraft with gasoline-fueled engines.xi There are certain engine sizes and types that are not regulated, such as small off-road engines under 25 hp, that may be regulated by a local jurisdiction. It is uncertain as to whether a local jurisdiction may regulate these types of engines and vehicles for GHG purposes where emissions are regulated for criteria pollutants and airborne toxins.
California continues to invest heavily in reducing emissions from all transportation sources through its state agencies and programs, particularly CARB and the CEC. Aligning local actions and policies with state policy and funding may accelerate local implementation and decrease costs. It is unclear how much previous or future funding has been or will be received by the San Diego region, but increasing funding from these sources should be a priority. The region will compete for these funds as most if not all, funds are administered through a competitive bidding process.
CARB administered Air Quality Improvement Program (AQIP) funded $438 million in projects from Fiscal Year 2008–2009 through Fiscal Year 2019–2020 and the Low Carbon Transportation Project allocation from Fiscal Year 2013–2014 through Fiscal Year 2019–2020 totals $2.134 billion.xii The State Budget Year for Fiscal Year 2021–22, including over $1.5 billion for a ZEV Acceleration Package and Air Quality Improvement Program, received an appropriation of over $1.5 billion for CARB with an additional $3.9 billion over the next three fiscal years across all state agencies (CARB expects to receive $2.3 billion of
i See SORE – List to Determine Preempt Off-Road Applications (Last accessed November 1, 2021): https://ww2.arb.ca.gov/sore-list-determine-preempt-road-applications . ii See CARB, Potential Amendments to the Diesel Engine Off-Road Emission Standards: Tier 5 Criterial Pollutants and CO2 Standards (last access on November 1, 2021): https://ww2.arb.ca.gov/our-work/programs/tier5?utm_medium=email&utm_source=govdelivery ; See CARB November 3, 2021 Workshop to Discuss Potential Amendments to the Diesel Engine Off-Road Emission Standards: Tier 5 Criterial Pollutants and CO2 Standards (last access on November 1, 2021): https://ww2.arb.ca.gov/our-work/programs/tier-5/meetings-workshops?utm_medium=email&utm_source=govdelivery . iii 13 C.C.R. §§ 2540–2466. iv 13 C.C.R. §§ 2467–2467.9. v 13 C.C.R. §§ 2468–2468.10. vi 13 C.C.R. §§ 2470–2476. vii 13 C.C.R. §§ 2477–2479. viii 13 C.C.R. §§ 2750–2774. ix 13 C.C.R. §§ 2775–2775.2. x 13 C.C.R. §§ 2780-2789. xi See 13 C.C.R. §§ 2850–2869. xii CARB Proposed Fiscal Year 2020–21 Funding Plan for Clean Transportation Incentives (Release Date: November 6, 2020; Board Consideration: December 10-11, 2020), p.5–8: https://ww2.arb.ca.gov/sites/default/files/2020-11/proposed_fy2020-21_fundingplan.pdf .
493
this over the next three fiscal years).i CARB’s approved the following funding plan for Fiscal Year 2021–2022 on November 19, 2021, for a total of $1,548.09 million allocated in the following ways:
● $525 million for Vehicle Purchase Incentives (Light-duty Clean Vehicle Rebate Project (CVRP) and Electric Bicycles);
● $150 million for Clean Transportation Equity Investments (includes Clean Cars 4 All, Financing Assistance, Clean Mobility Options, Clean Mobility In Schools Pilot Project, Sustainable Transportation Equity Project (STEP), and others);
● $873.09 million for Heavy-Duty and Off-Road Equipment (including Clean Truck and Bus Vouchers (HVIP), Clean Off-Road Equipment Vouchers (CORE), Drayage Truck and Infrastructure Project, Truck Loan Assistance, and Demonstration and Pilot Projects).ii
The CEC currently administers the $100 million per year Clean Transportation Fund (formerly the Alternative and Renewable Fueled and Vehicle Technology Program) created by AB 118 (Núñez, Chapter 759, Statutes of 2007) and reauthorized by AB 8 (Perea, Chapter 401, Statutes of 2013). This program received additional funding this fiscal year with the CEC approving a 2021-2023 Investment Plan Update totaling $1.4 billion on November 15, 2021.iii In terms of vehicle-related investment, the plan will fund $244 million for ZEV manufacturing that complements CARB administered funding. It sunsets in January 2024.
B.2.4 Fuels and Infrastructure
State preemption exists in the form of the CARB administered Low-Carbon Fuel Standard (LCFS), which regulates the carbon intensity of transportation fuels in California by reducing the carbon intensity of fuel by at least 20% by 2030 from a 2010 baselineiv and requires continuing to reduce the carbon intensity of fuels beyond 2030 with consideration of the full life cycle of carbon.v State preemption also exists in the form of what types of reformed fuels are sold in California, including the Low Emission Diesel and Standards for Diesel Fuel regulations.vi California’s Alternative Diesel Fuel regulation governs the development and commercialization of alternative diesel fuels for sale in California.vii Notably, the CPUC does not automatically regulate compressed natural gas and hydrogen fueling stationsviii but acts
i CARB, Proposed Fiscal Year 2021–22 Funding Plan for Clean Transportation Incentives (October 8, 2021 Release) (Board Vote on November 19, 2021), p. 4: https://ww2.arb.ca.gov/sites/default/files/2021-10/fy21-22_fundingplan.pdf . ii CARB, Proposed Fiscal Year 2021–22 Funding Plan for Clean Transportation Incentives (Release Date: October 8, 2021; Board Consideration: November 19, 2021), p. 27: https://ww2.arb.ca.gov/sites/default/files/2021-10/fy21-22_fundingplan.pdf ; CARB approves $1.5 billion investment — largest to date — in clean cars, trucks, mobility options, Press Release, Release No. 21-57 (November 19, 2021): https://ww2.arb.ca.gov/news/carb-approves-15-billion-investment-largest-date-clean-cars-trucks-mobility-options. iii CEC Lead Commissioner Report, 2021-2023 Investment Plan Updated for the Clean Transportation Program, CEC-600-2021-038-LCF (November 2021): file:///Users/joseph/Downloads/TN240188_20211101T121742_2021-2023%20Lead%20Commissioner%20Report.pdf. iv See 17 C.C.R. §§ 95480–95503. v Executive Order N-79-20, Order No. 9 (September 23, 2020): https://www.gov.ca.gov/wp-content/uploads/2020/09/9.23.20-EO-N-79-20-Climate.pdf. vi See 13 C.C.R. §§ 2281–2285, 2299–2299.5; 17 C.C.R. §§ 93114, 93117, 93118, 93118.2, 93118.3, 93118.5; 13 C.C.R. §§ 2281–2285 & 2299–2299.5. vii 13 C.C.R. §§ 2293-2293.9. viii California Public Utilities Code § 216 (f).
494
with regulatory authority over intrastate pipelines for natural gas and hydrogen with authority over entities that meet the public utility definition. There is uncertainty as to whether the Federal Energy Regulatory Commission (FERC) acts with authority over interstate hydrogen pipelines under the Natural Gas Act specific to whether hydrogen is considered an “artificial gas” and whether, and at what percentage, hydrogen is mixed with natural gas.i
In terms of fuels, local jurisdictions may exercise police and land use authority to prohibit zoning for new gas stations or support alternative fuel infrastructure through zoning and expediting permitting for renewable natural gas fueling stations, hydrogen fueling stations, and electric vehicle charging equipment (EVSE). Local jurisdictions may also require installation or pre-wiring for EVSE in the public right of way, on new residential and/or nonresidential buildings, or when additions or alterations to existing residential and/or non-residential buildings occur.ii
Local authorities should also consider state assessments of infrastructure need and funding to inform the exercise of their own authority to develop and fund fuels and infrastructure. California analyzes the need for and funds infrastructure to achieve the statutory goals for transportation electrification under SB 350 (de León, Chapter 547, Statutes of 2015) and ZEVs under Executive Order N-79-20. To this end, SB 2127 (Ting, Chapter 365, Statutes of 2018) requires the CEC, CARB, and CPUC to conduct a biannual assessment for electric vehicle charging infrastructure needs to support 5 million ZEVs by 2030 and to reduce emissions of GHG to 40% below 1990 level by 2030; AB 8 (Perea, Chapter 401, Statutes of 2013) directs CARB to evaluate fuel cell electric vehicle deployment and hydrogen fuel station network development; and Executive Order N-79-20 Order 4 directs the CEC, CPUC, and CARB to accelerate affordable fueling and charging options for ZEVs, particularly in low-income and disadvantaged communities, and Order 6 c) directs the State Transportation Agency, Department of Transportation, and the California Transportation Commission to support ZEV and infrastructure as part of larger transportation projects.
CARB’s previously discussed Fiscal Year 2021–2022 funding plan provides significant funding in this regard, specific to use case and vehicle type. However, infrastructure development is the primary focus of CEC’s Clean Transportation Program funding approved on November 15, 2021, to close the infrastructure gap necessary to meet California’s ZEV goals as follows:
● $314 million for light-duty electric vehicle charging infrastructure; ● $690 million for medium- and heavy-duty ZEV infrastructure (battery-electric and
hydrogen); ● $77 million for hydrogen refueling; ● $25 million for zero and near-zero carbon fuel production and supply; and ● $15 million for workforce training and development.iii
i See 14 U.S.C.A §717a (5). ii See 12 C.C.R. Part 11 (2021); See Health & Safety Code §§ 17958.5, 17958.7 & 18941.5(b). iii CEC Approves $1.4 Billion Plan for Zero-Emission Transportation Infrastructure and Manufacturing (November 15, 2021): https://www.energy.ca.gov/news/2021-11/cec-approves-14-billion-plan-zero-emission-transportation-infrastructure-and ; CEC Lead Commissioner Report, 2021-2023 Investment Update for the Clean Transportation Program (November 2021): file:///Users/joseph/Downloads/TN240188_20211101T121742_2021-2023%20Lead%20Commissioner%20Report.pdf.
495
Specific to hydrogen, AB 8 (2013) set a target of co-funding 100 hydrogen fueling stations (currently, there are 48 hydrogen fueling stations with another $115.7 million in CEC grant solicitation to co-fund another 94 stationsi) and 200 hydrogen stations by 2025 per Executive Order B-48-18. There is currently one operational hydrogen station in San Diego County, with one more expected to open in 2021ii and three more stations expected to open in 2022.iii There is an opportunity to further develop San Diego County hydrogen fueling stations with the available state funds and matching private or local funding.
Investor Owned Utility (IOU) specific electric vehicle investment funding began in 2016 and was augmented by SB 350’s (2015) mandate to electrify transportation.iv The CPUC approved SDG&E’s first pilot in 2016v for $45 million at 350 sites corresponding to approximately 3,500 EV stations over three years, and the CPUC recently approved a renewal of its Power Your Drive Extension Program for $43.5 million to fund nearly 2,000 L2 EVSEs at workplaces and multi-family dwellings in its service territory.vi The pilot and original Power Your Drive Program installed 3,040 utility-owned and operated charging ports at 254 sites at a total cost of $70,253,053, exceeding the approved budget by $25,253,053, marking the difficulty and expense of implementing this type of program.vii Additionally, AB 1082 (Burke, Chapter 637, Statutes of 2017) and AB 1083 (Burke, Chapter 638, Statutes of 2017) authorized but did not require IOUs to support charging infrastructure at schools, state parks, and beaches. SDG&E applied and received approval for 30 school sites (184 L2 ports and 12 DC Fast Chargers (DCFCs) with either the customer or SDG&E owning the EVSE), 12 state park and beach sites (64 L2 ports & 10 DCFCs owned by SDG&E), and 10 sites at city and county parks (52 L2 ports & 10 DCFCs owned by SDG&E).viii
Finally, the Volkswagen Diesel Emission Settlement Beneficiary Mitigation Planix provides $10 million statewide for light-duty vehicle fueling infrastructure, split evenly between electric vehicles and hydrogen.
B.2.5 New Vehicle Sales and Fleet Procurement Requirements
i CARB, 2021 Annual Evaluation of Fuel Cell Electric Vehicle Deployment and Hydrogen Fuel Station Network Development (September 2021), p. ix: https://ww2.arb.ca.gov/sites/default/files/2021-09/2021_AB-8_FINAL.pdf. ii It is unknown whether this station opened as of January 7, 2022. iii CARB, 2021 Annual Evaluation of Fuel Cell Electric Vehicle Deployment and Hydrogen Fuel Station Network Development (September 2021), Appendix B. iv Public Utilities Code § 740.12(a)(1). v CPUC D.16-01-045, Decision Regarding Underlying Vehicle Integration Application and Motion to Adopt Settlement Agreement (February 4, 2016): (https://docs.cpuc.ca.gov/PublishedDocs/Published/G000/M158/K241/158241020.PDF. vi CPUC D. 19-10-012, Decision Authorizing SDG&E Company’s Power Your Drive Extension Electric Vehicle Charging Program (April , 19 2021): https://docs.cpuc.ca.gov/PublishedDocs/Published/G000/M378/K429/378429298.PDF. vii CPUC R.18-12-006, Electric Vehicle-Grid Integration Pilot Program Eight Semi-Annual Report of SDG&E Company (U902-E) (April 1, 2020), p. 3: https://www.sdge.com/sites/default/files/regulatory/R.18-12-006%20SDG%26E%20April%201%2C%202020%20Eighth%20Semi%20Annual%20PYD%20Report.pdf. viii CPUC D. 19-11-017, Decision on the Transportation Electrification Pilots for Schools and Parks Pursuant to Assembly Bills 1082 and 1083 (November 7, 2019). ix State of California Beneficiary Mitigation Plan For the Volkswagen Environmental Mitigation Trust (June 2018), p. 33-36: https://ww2.arb.ca.gov/sites/default/files/2018-07/bmp_june2018.pdf.
496
Local jurisdictions act with clear authority to procure fleets for their operations with limited federal preemption under the “market participant exception.” The market participant exception applies to the Dormant Commerce Clause and is expressly included in the EPCAi, applied by case law to the CAAii, and applied by case law to the Federal Aviation Administration Authorization Act.iii Local jurisdictions have been prohibited from mandating the purchase of the certain type of clean technology vehicles for private classes of vehicles, such as taxis.iv
Local jurisdictions act with clear authority to procure fleets for their operations with limited preemption by the state. However, California policy seeks to create a zero-emission only market for new vehicles under Executive Order No. N-79-20, establishing a 100% in-state sales of new zero-emission passenger cars and truck by 2035, and to build the electric vehicle charging infrastructure to deploy 5 million ZEVs by 2030 under Executive Order B-48-18 and to develop ZEV and related supply chains and infrastructure in California under Executive Order B-16-12.
Consequently, the Innovative Clean Transit (ICT) regulation requires all public transit agencies to gradually transition to a 100-percent zero-emission bus fleet and encourages these agencies to provide innovative first and last-mile connectivity and improved mobility for transit riders.v The Advanced Clean Trucks (ACT) regulation sets a ZEV sales requirement and a one-time reporting requirement for large entities and fleets.vi The Zero-Emission Airport Shuttle regulationvii requires private and public airport shuttle fleet owners with fixed routes serving California’s 13 largest airports (including San Diego International Airport) to fully transition their fleet to zero-emission shuttles by 2035 to reduce and eliminate GHG emissions, NOx, and other criteria pollution reductions.viii
Additionally, CARB is proposing an Advanced Clean Fleet (ACF) regulation to deploy medium- and heavy-duty ZEV where feasible. CARB describes this proposed rule as requiring the deployment of ZEVs as follows: 100% of new drayage trucks by 2035; 100% of new off-road vehicles and equipment by 2035 (where feasible), and 100% medium- and heavy-duty vehicles by 2045 (where feasible).ix It is expected that similar types of programs will be implemented for light-duty vehicles post-2026 model years.
Significant state funding exists to achieve state policy. The Volkswagen Environmental Mitigation Trust provides the following amounts per use-case:
● $130 million for zero-emission transit, school, and shuttle buses; ● $90 million for zero-emission Class 8 freight and drayage trucks;
i 49 U.S.C.A § 32919(c). ii See Engine Mfrs. Ass'n v. South Coast Air Quality Mgmt. Dist., 498F.3d 1031, 1040 (9th Cir. 2007). iii Tocher v. City of Santa Ana, 219 F.3d 1040, 1049 (9th Cir. 2000); See also City of Columbus v. Ours Garage & Wrecker Serv., Inc., 536 U.S. 424, 431 (2002). iv Metro. Taxicab Bd. of Trade v. City of New York, 615 F.3d 152, 157 (2d Cir. 2010), cert. denied, 562 U.S. 1264 (2011); Ophir v. City of Boston, 647 F.Supp. 2d 86, 94 (D. Mass. 2009). v 13 C.C.R. §§ 2023 et seq. vi See 13 C.C.R. §§ 1963; 1963.1, 1963.2, 1963.3, 1963.4, 1963.5, 2012, 2012.1, & 2012.2. vii 17 CCR §§ 95690.1, 95690.2, 95690.3, 95690.4, 95690.5, 95690.6, 95690.7, and 95690.8. viii 17 C.C.R. §§ 95690.1, 95690.3, 95690.5, and 95690.6. ix See CARB, Advanced Clean Fleets Fact Sheet (Last accessed on October 29, 2021): https://ww2.arb.ca.gov/resources/fact-sheets/advanced-clean-fleets-fact-sheet.

497
● $70 million for zero-emission freight and marine projects; and ● $60 million for freight and marine projects.i
The CEC’s funding provides the following:
● $75 million SB 110 (Committee on Budget and Fiscal Review, Chapter 55, Statutes of 2017) per Proposition 39 and $14 million Clean Transportation Program funds for school bus replacement.ii
CARB adopted the following funding allocations for Fiscal Year 2021–2022 for a total of $1,548.09 million allocated in the following ways:
● $525 million for Vehicle Purchase Incentives including: o $515 million for the Light-duty Clean Vehicle Rebate Project (CVRP); and o $10 million for the Electric Bicycle Incentive program;
● $150 million for Clean Transportation Equity Investments including: o $75 million for Clean Cars 4 All; o $23.5 million for Financing Assistance; o $10 million for Clean Mobility Options; o $10 million for Clean Mobility In Schools Pilot Project; o $25 million for the Sustainable Transportation Equity Project (STEP); o $5 million for Outreach, Community Needs Assessment, Technical Assistance,
and Access Clean California; and o $1.5 million for Workforce Training and Development;
● $873.09 for Heavy-Duty and Off-Road Equipment including: o $569.5 million for the Clean Truck and Bus Vouchers (HVIP) program; o $194.95 million for the Clean Off-Road Equipment Vouchers (CORE); o $28.64 million for the Truck Loan Assistance; and o $80 million for the Demonstration and Pilot Projects (includes $40 million for the
Drayage Truck and Infrastructure Project).iii
An example of local implementation of funding from state programs includes a local Clean Cars 4 All program approved by CARB on November 19, 2021, that will fund a $5 million program in the County of
i State of California Beneficiary Mitigation Plan For the Volkswagen Environmental Mitigation Trust (June 2018), p. 20–32: https://ww2.arb.ca.gov/sites/default/files/2018-07/bmp_june2018.pdf. ii CEC Lead Commissioner Report, 2021-2023 Investment Plan Updated for the Clean Transportation Program, CEC-600-2021-038-LCF, p 32 (November 2021): file:///Users/joseph/Downloads/TN240188_20211101T121742_2021-2023%20Lead%20Commissioner%20Report.pdf. iii CARB, Proposed Fiscal Year 2021-22 Funding Plan for Clean Transportation Incentives (Release Date: October 8, 2021; Board Approved: November 19, 2021), p. 6: https://ww2.arb.ca.gov/sites/default/files/2021-10/fy21-22_fundingplan.pdf.

498
San Diego administered by the SD APCD.i San Diego County Supervisors voted in October 2019 to bring this program to San Diego County, but the COVID-19 pandemic delayed it until 2021.
B.3 Local Authority Related to Building Decarbonization
At the local level, the police power and delegated authority to regulate energy end-uses are the primary means of implementing building decarbonization actions. Local jurisdictions may use their police power to prohibit the installation of natural gas plumbing in new buildings,ii identify buildings or neighborhoods that are in need of natural gas infrastructure replacement to electrify (e.g., natural gas infrastructure pruning), require energy benchmarking for buildings not covered by Title 20 Benchmarking requirementsiii, and/or encourage fuel switching to low- or zero-emission fuels (e.g., renewable natural gas or green hydrogen) through GHG emission performance standards based on energy benchmarking information and disclosure. Local jurisdictions act with delegated authority to require more stringent Title 24, Part 6 Energy Codes, Part 11 CALGreen Codes, and procurement authority, including sole source procurement authority for energy conservation, cogeneration, and alternative energy supply projects on public buildings.iv Local governments should evaluate how to align local requirements and actions with state policy and programs to decrease costs related to building decarbonization.
At the federal level, the Energy Act of 2020 updated and added provisions and funding for, among other things, energy and water efficiency, renewable energy and storage, carbon management and removal from buildings and industry, industry and manufacturing technologies that decrease emissions, grid modernization and building integration, and related research, development, and deployment.v President Biden recently signed Executive Order 14057 directs the federal executive branch to achieve a net-zero emissions path by 2050. Specific to building decarbonization, the Executive Order, among other things, orders:
● 100 percent carbon pollution-free electricity on a net annual basis by 2030, including 50 percent 24/7 carbon pollution-free electricity;
● A net-zero emissions building portfolio by 2045, including a 50 percent emissions reduction by 2032;
● A 65 percent reduction in scope 1 and 2 greenhouse gas emissions, as defined by the Federal Greenhouse Gas Accounting and Reporting Guidance, from Federal operations by 2030 from 2008 levels; and
i See CARB, Proposed Fiscal Year 2021–22 Funding Plan for Clean Transportation Incentives (Release Date: October 8, 2021; Board Approved: November 19, 2021), p 59–60: https://ww2.arb.ca.gov/sites/default/files/2021-10/fy21-22_fundingplan.pdf. ii Note: the City of Berkeley’s prohibition is currently on appeal to the Ninth Circuit Court of Appeals (CRA v. City of Berkeley, No. 21-16278, (9th Cir. filed August 5, 2021)); See CRA v. City of Berkeley, Docket No. 4:19-cv-07668, Judgment, Document 76 (N.D. Cal. Nov. 21, 2019) which dismissed with prejudice cause of action for EPCA preemption and dismissed without prejudice California state law preemption cause of action. iii See AB 802 (Williams, Chapter 590, Statutes of 2015); 20 C.C.R. § 1680 (2021) et seq.; see also City of San Diego Building Benchmarking Ordinance adopted pursuant to 20 C.C.R. § 1684 (2021). iv See Government Code § 4217.10 et seq. v 47 H.R. 133 – 116th Congress (2019-2020): Consolidated Appropriation Act, 2021. December 27, 2020 (Public Law No: 116-260), Division Z (Energy Act of 2020): https://www.congress.gov/bill/116th-congress/house-bill/133/text.

499
● Net-zero emissions from Federal procurement, including a Buy Clean policy to promote the use of construction materials with lower embodied emissions; and
● Climate resilient infrastructure and operations.i
This order builds upon Executive Order 13990 that directed federal agencies to review action from 2017-2022 that may be inconsistent with or conflict with improving public health, protecting the environment, accessing clean air and water, reducing GHG emissions, and bolstering resiliency to climate change. Additionally, Executive Order 14008 sets goals for a carbon-free electricity by 2035 and economy wide net-zero emissions by 2050. Whether these executive order are codified in federal law remains to be seen, and the orders are subject to rescission by future Administrations.
California policy benefits from over forty years of state regulation designed to decrease energy consumption from buildings and appliances with a focus on reducing consumer energy consumption and GHG emissions from buildings. In 2015, AB 350 (De León, Chapter 547, Statutes of 2019) set a goal of cumulative doubling energy efficiency savings and demand reduction in electricity and natural gas end-uses by January 1, 2030. AB 350 (2015) tasked the CEC with establishing an annual target to achieve these reductions with the CEC and the CPUC taking further action through buildings standards, appliance standards, and CPUC regulated energy efficiency programs administered by IOUs, CCAs, and other third-party program administrators.ii CCAs may also create their energy efficiency programs separate from CPUC regulated programs. Innovation is needed to achieve the SB 350 targets, particularly when converting energy efficiency to avoid GHG emissions, in terms of how to implement demand reduction flexibility that decreases energy use when GHG emissions are the highest (e.g., seasonal and daily peak electric load).iii
This resulted in a major policy shift towards building decarbonization in 2018 with Executive Order B-55-18 directing state agencies to achieve carbon neutrality by 2045, AB 3232 (Friedman, Chapter 373, Statutes of 2018) requiring the CEC in consultation with CARB, the CPUC, and CAISO to assess the potential to reduce GHG in buildings by 40% below 1990 levels by 2030, and SB 1477 (Stern, Chapter 378, Statutes of 2018) allocating $50 million per year through 2023 to fund the Building Initiative for Low-Emissions Development (Build) and Technology and Equipment for Clean Heating (TECH). Additionally, the CPUC adopted changes to its existing energy efficiency rolling portfolio that will set energy efficiency goals to maximize GHG reductions and grid benefits, including equity, using a Total System Benefit (TSB) test that expresses the dollar value of lifecycle energy, capacity, and GHG benefits on a utility’s energy efficiency program portfolio starting in 2024.iv The CPUC set energy efficiency portfolio goals for 2022–2032 in D.21-09-037 on September 23, 2021.
i Presidential Executive Order No. 14057, Catalyzing Clean Energy Industries and Jobs Through Federal Sustainability 86 Federal Register 70935 (2021-27114), Sec. 102 (December 8, 2021): https://www.whitehouse.gov/briefing-room/presidential-actions/2021/12/08/executive-order-on-catalyzing-clean-energy-industries-and-jobs-through-federal-sustainability/ & https://www.federalregister.gov/documents/2021/12/13/2021-27114/catalyzing-clean-energy-industries-and-jobs-through-federal-sustainability. ii See CPUC Energy Efficiency Rule Making R.13-11-005 & R.19-01-011. iii See CEC Final Staff Report, 2019 California Energy Efficiency Action Plan, November 2019, p. 4. iv See CPUC D.21-05-031, Rulemaking 12-11-005 Assessment of Energy Efficiency Potential and Goals and Modification of Portfolio Approval and Oversight Process (May 31, 2021), p. 2: https://docs.cpuc.ca.gov/PublishedDocs/Published/G000/M385/K864/385864616.PDF.

500
Pursuant to AB 3232 (2018), the CEC issued a California Building Decarbonization Assessmenti report showing that achieving reduction of GHG by 40% below 1990 level by 2030 requires residential and commercial building decarbonization through electrification, decarbonizing electricity supply, energy efficiency, refrigerant conversation and leakage reduction, distribute energy resources (DER) deployment, gas system decarbonization, and demand flexibility. The report found the most readily achievable pathway to meet the AB 3232 target was through efficient electrification of space and water heating in buildings combined with refrigerant leakage reduction.
Local governments should evaluate how to align local requirements and actions with state policy and programs to decrease costs related to building decarbonization. The CEC’s most recent ratepayer-funded Electric Program Investment Charge (EPIC) plan for 2021–2025 reflects continued investment in achieving these targets for electrification, high efficiency and low-GWP heat pump water heaters and HVAC heater pumps, building envelope upgrades, combined heat pump for hot water and heating conditioning, nanogrid HVAC module development, smart energy management systems, large building HVAC decarbonization, industrial decarbonization, low-carbon and high-temperature industrial heating, energy efficient and decarbonization of concrete manufacturing, and industrial energy efficiency separation processes.ii These investments will serve to vet viable actions to decarbonize these types of end-uses and lower costs. It will also help to determine what end-uses cannot be decarbonized and which GHG emissions by source must be removed or sequestered.
Per SB 1477 (2018), the BUILD program aims to incent near-zero-emission building technologies that reduce GHG emissions significantly beyond minimum code requirements for residential buildings. BUILD currently provides incentives to new residential housing projects that are all-electric and have no hook up to the gas distribution system. The TECH program aims to advance California’s market for low-emission space and water heating technologies that are in early-stage development. These programs, combined with existing utility energy efficiency programs, form the state policy to address building decarbonization. Local governments should evaluate how to align local requirements and actions with state policy and programs to decrease costs related to building decarbonization. There is also an opportunity to engage in the CPUC’s proceeding on building decarbonization that is implementing the BUILD and TECH programs, amongst other building decarbonization efforts.iii
B.3.1 Energy Efficiency and Building Material Conservation and Resource Efficiency
Using delegated authority, local jurisdictions may adopt more stringent building code standards that address energy efficiency, water conservation, building material conservation, or resource efficiency based on GHG requirements (e.g., material carbon intensity). Where the requirement addresses energy consumption, the adopted local code must be at least as energy efficient as the state codes, cost-effective (e.g., all-electric reach codes or building performance standards) iv, and submitted to the CEC to
i California Energy Commission: Final Commission Report California Building Decarbonization Assessment, Publication Number: CEC-400-2021-006-CMF (2021): https://www.energy.ca.gov/publications/2021/california-building-decarbonization-assessment. ii California Energy Commission: Final Commission Report The Electric Program Investment Charge Proposed 2021–2025 Investment Plan, EPIC 4 Investment Plan, (November 2021), p. 130-181: https://www.energy.ca.gov/publications/2021/electric-program-investment-charge-proposed-2021-2025-investment-plan-epic-4 . iii See CPUC R. 19-01-011: Order Instituting Rulemaking Regarding Building Decarbonization: https://apps.cpuc.ca.gov/apex/f?p=401:56:0::NO:RP,57,RIR:P5_PROCEEDING_SELECT:R1901011. iv See to Public Resources Code § 25402.1(h)(2) and Health & Safety Code §§ 17958.5 & 17958.7.
501
review for compliance with state law.i In all cases where Title 24 is amended, the standards must be submitted to the Building Standard Commission with the findings for local climatic, geological, or topical conditions that authorize the change to Title 24. In terms of police authority, the full extent of local jurisdiction police authority is unknown and largely untested. Additional research is required to vet other local actions.
Federal preemption exists over setting energy efficiency standards for covered productsii (e.g., appliances) under EPCA with limited exception for new construction.iii Local jurisdictions are subject to state preemption in the form of Title 20 appliance standards that regulate many appliances not preempted by the EPCA and the triennially updated Title 24 building standards that the CEC adopts.
In California, there is delegated authority for local jurisdictions to adopt more stringent building standards under Title 24 for energy efficiency and building materials. For example, local jurisdictions may adopt more stringent Green Building programs — including water conservationiv — by making voluntary CALGreen standards mandatory or other measures that may include building material conservation and resource efficiency based on GHG emissionsv, carbon intensity, or carbon sequestration (e.g., cement made from synthetic aggregate produced from captured compressed CO2) if it is reasonably necessary because of local climatic, geological, or topographical conditions.vi SB 596 (Becker, Chapter 246, Statutes of 2021) aids in this endeavor by requiring CARB to develop a strategy to achieve net-zero emission of GHG associated with cement used within California as soon as possible, but no later than December 31, 2045, with interim targets that include a carbon intensity reduction for cement of 40% below 2019 average levels by December 31, 2035. It may be possible for local jurisdictions to help accelerate or surpass this type of state mandate.
B.3.2 CEQA Environmental Impact Mitigation Authority
CEQA offers another means to address emissions from the built environment. A lead agency acts with discretion to determine whether an adverse environmental effect identified in an environmental impact report (EIR) should be classified as "significant" or "less than significant."vii A lead agency may adopt and publish a threshold of significance that sets a high threshold for GHG emissions, which could include requiring all projects to be carbon neutral or zero net carbonviii, and must be based on scientific and
i See Public Resources Code § 25402.1 (h)(2); see Title 24, Part 6, Section 10-106 (2021). ii 42 U.S.C. § 6295; See also 10 CFR Parts 430, 431, & 429. iii 42 U.S.C. §§ 6297(c) & 6297(f)(3); See also 42 U.S.C. §§ 6291 et seq. (Part A-Energy Conservation Program for Consumer Products Other Than Automobiles); 42 U.S.C. §§ 6311 et seq. (Part A-1-Certain Industrial Equipment). ivNote: Water conservation and enforcement programs are also authorized by Water Code §§ 375–378 & 1009, including water saving devices and rate structure design, which must also comply with Prop 218 limits (Cal. Const. art. XIIIC–XIIID); See also Water Code §§ 10680.20, 10680.24 (urban retail water suppliers must develop urban water use targets that cumulatively result in a 20 % reduction from a baseline daily per capita water use by December 31, 2020); See also Water Code §§ 10609.2, 10609.4 (requires the State Water Control Board, in coordination with the Department of Water Resources, to adopt a long-term standard for efficient use of water and establish 55 gallons per capita as the daily indoor residential standard water use). v Note: current mandatory and voluntary 2019 Title 24, Part 11 CALGreen Codes are not based on GHG life cycle analysis except for Nonresidential Voluntary Section A5.409 Life Cycle Assessment which allows GHG to be used in the impacts considered for the analysis of life cycle. vi See 12 C.C.R. Part 11 (2021); See Health & Safety Code §§ 17958.5, 17958.7 & 18941.5(b). vii 14 C.C.R. § 15064(b)(1) (2021). viii 14 C.C.R. § 15064.7(b) (2021); see also definition of “threshold of significance” under 14 CCR § 15064.7(a) (2021).
502
factual data to the extent possiblei to meet the substantial evidence standard.ii This is limited by existing implied or expressed authority to impose mitigation measures on a project.iii Mitigation measures cannot be legally infeasibleiv — meaning that they may not be beyond the power conferred on lead and responsible agencies — and are also subject to express limitations, including limits on reducing housing units.v
B.3.3 Direct Regulation of Building GHG Emissions
Direct regulation of GHG emissions, not currently regulated by Cap-and-Trade, may provide additional means to reduce emissions, but uncertainty exists around authority. It may be possible to create a GHG performance standards for buildings. It may also be possible to directly regulate building and appliance oxides of nitrogen (NOx) emissions from natural gas under existing authority. Finally, it is uncertain whether existing tax or fee authority may be used to regulate GHGs.
At the state level, California addresses GHG emissions through both direct emissions regulation as well as procurement of renewable fuel sources. California’s Cap-and-Trade program also regulates covered entities that emit 25,000 metric tons or more of CO2e per data year, including cogeneration, self-generation of electricity, cement production, glass production, hydrogen production, iron and steel production, lead production, nitric acid production, petroleum and natural gas system, petroleum refining, pulp and paper manufacturing, suppliers of natural gas, suppliers of RBOB and distillate fuel oil, suppliers of liquefied petroleum gas, suppliers of liquified natural gas and compressed natural gas, carbon dioxide suppliers, and stationary combustion.vi Regulation of sources below the 25,000 metric ton of CO2e per data year is not preempted but would require identifying authority to directly regulate, such as the police power.
For example, it may be possible to create GHG performance standards for buildings based on building type, square footage, and emission profiles. This would be an exercise of either police power or delegated authority to amend Title 24 if it is reasonably necessary because of local climatic, geological, or topographical conditions using Health and Safety Code Sections 17958.5, 17958.7, and 18941.5(b). Because such standards do not address the diminution of energy, a CEC review would not be required. The same authority can also be used to create building benchmarking requirements for energy use and GHG emission disclosures at point-of-sale or point-of-listing that are more expansive than those required under AB 802 (2015).vii The energy and GHG benchmarking would then serve as the measure to implement building GHG emission standards that utilize enforcement authority under existing municipal code for compliance.viii A potential funding source for upgrades could include creating a transfer tax
i 14 C.C.R. § 15064(b)(1) (2021). ii Mission Bay Alliance v. Office of Community Inv. & Infrastructure, 6 Cal. App. 5th 160, 206 (2016). iii See 14 C.C.R. § 15040(d)–(d). iv See Public Resources Code § 21004; See 14 C.C.R. § 15040. v See Public Resources Code § 21159.26; See 14 C.C.R. § 15092(c). vi 17 C.C.R. §§ 95811 (a)–(b) & 95812(c). vii California Public Resources Code § 25402.10 (d)(2)(F) & 20 C.C.R. § 1684; See City of Berkeley Municipal Code 19.81 – the Building Energy Savings Ordinance (BESO) (2021). viii See City of Berkeley Administrative Draft, Existing Buildings Electrification Strategy (April 2021), p. 140–141; See City of Berkeley Building Energy Savings Ordinance Evaluation Report, p. 12–21, Appendix C, & Appendix I, (February 11, 2020); See City of Berkeley Municipal Code 1.28 – Administrative Citations (2021).
503
rebate that refunds a percentage of the transfer tax to property owners who make electrification, energy efficiency, and water conservation retrofits.i Equity considerations must be addressed. Because a fund transfer rebate only benefits property owners who made a recent purchase, other funding would need to be identified to fund upgrades for recent low-income owners, renters, and long-term homeowners with limited incomes. Additional research is required to further vet this action.
It may also be possible for a city, county, or air district to directly regulate natural gas NOx emissions from buildings and appliances using Health and Safety Code Sections 39002, 39013, 39037, and 41508. For example, it may be possible for SD APCD to ban the sale of NOx emitting appliances within its district but such a ban would need to be concurrent with a ban on the installation of natural gas appliances across the district.ii These code sections also allow local authorities (e.g., city or county) to enact such regulation under Health and Safety Code Section 39002 as the entity with primary responsibility for air pollution from all sources other than vehicle sources. Standards may be set more stringent than set by law or CARB for non-vehicle sources. The extent of this authority is unknown and untested. There are no examples of its exercise by a city, county, or district in this respect. It would likely be expensive for a city or county to create and operate such a program, given the required technical expertise needed to implement and enforce it.
It is uncertain whether a local government may raise a tax or fee on GHG emissions. Local jurisdictions act with authority — subject to voter approval if a tax — to raise general taxes, special taxes, and fees for specified purposes under California Constitution Article XIII C & D. Taxes may be placed on real property and tangible personal property where the property is located. Taxes may also take the form of license taxes, sale and use taxes, documentary transfer taxes, retail transaction and use taxes, utility users’ taxes, occupancy taxes, local vehicle license fees,iii community facilities taxes, and excise taxes on developers. Under California Constitution Article XIII C § 2, general taxes must be approved by a majority vote, while special taxes must be approved by a two-thirds vote. Additionally, a charge that meets one of the requirements is not considered a tax under California Constitution Article XIII C, § 1 (e)(1)-(7) including, but not limited to:
● A charge imposed for a specific benefit conferred or privilege granted directly to the payor that is not provided to those not charged, and which does not exceed the reasonable costs to the local government of conferring the benefit or granting the privilege;
● A charge imposed for a specific government service or product provided directly to the payor that is not provided to those not charged, and which does not exceed the reasonable costs to the local government of providing the service or product;
● A charge imposed for the reasonable regulatory costs to a local government for issuing licenses and permits, performing investigations, inspections, and audits, enforcing agricultural marketing orders, and the administrative enforcement and adjudication thereof;
i See City of Berkeley Building Energy Savings Ordinance Evaluation Report (February 11, 2020), p. 5. ii See City of Berkeley, Administrative Draft Existing Building Electrification Strategy, April 2021, p. 129. iii See California Revenue Code § 11101 et seq.

504
● A charge imposed for entrance to or use of local government property, or the purchase, rental, or lease of local government property;
● A charge imposed as a condition of property development; and ● Assessments and property-related fees imposed in accordance with the provisions of
Article XIII D.
If the charge or fee is a “property-related service,” it must also meet the requirements of California Constitution Article XIII D. It is unclear if any of these charges are viable to place a fee on GHG emissions and whether California Constitution Article XIII D would apply.
B.3.4 Fuel Switching and Emissions related to End-Uses
Police power authority may be used to require fuel switching to low or zero-carbon sources through prohibitions on the installation of certain energy infrastructure (e.g., natural gas plumbing) in buildings. Police power may take the form of adopting an ordinance that expressly prohibits natural gas plumbing without either amending Title 24, Part 6, changing minimum efficiency standards for covered products under the EPCA, or requiring the installation of specific appliances or systems as a condition of approval.i There is currently an effort to preempt local jurisdiction police power under the EPCA. The City of Berkeley’s Ordinance No. 7,672-N.S. adopted on July 16, 2019, used police power without amending Title 24 to prohibit natural gas plumbing in new construction. This ordinance survived the preemption challenge in federal district court and is now on appeal in the Ninth Circuit.ii
There is an opportunity to engage in the legislature and CPUC on the future of natural gas infrastructure. California regulates natural gas supply, transmission, storage, and the development of renewable natural gas or biomethane, including procurement targets for IOUs preempting some but not all additional local action or regulation.iii Natural gas distribution and storage monitoring, leak abatement, and decreasing emissions from short-lived climate pollutants round out current state policy.iv The CPUC also mandated to decrease GHG emissions from the intrastate transmission and distribution lines.v In addition, the CPUC regulates climate impacts to and adaptation for IOU infrastructurevi and is currently
i See City of Berkeley Ordinance No. 7,672-N.S. (Adopted July 16, 2019), City of Morgan Hill Ordinance No. 5906 (adopted October 23, 2019), City of San Jose Ordinance No. 30330 (adopted September 17, 2019), and City of Santa Cruz Ordinance No. 2020-06 (adopted April 14, 2020). ii See California Restaurant Ass. v. City of Berkeley, Order Granting in Part and Denying in Part Motion to Dismiss, Document 75, Case No. 4:19-cv-07668-YGR (July 6, 2021); See See California Restaurant Ass. v. City of Berkeley, Case No. 21-16278 (9th Cir.), filed Aug. 5, 2021. iii See AB 2313 (Williams, Chapter 571, Statutes of 2016); SB 1440 (Hueso, Chapter 739, Statutes of 2018); see also AB 1900 (Gatto, Chapter 602, Statutes of 2012); See also SB 1440 (Hueso, Chapter 739, Statutes of 2018); AB 3163 (Salas, Chapter 358, Statutes of 2020). iv See AB 1496 (Thurmond, Chapter 604, Statutes of 2015), SB 1371 (Leno, Chapter 525, Statutes of 2014) and SB 887 (Pavley, Chapter 673, Statutes of 2016), SB 605 (Lara, Chapter 523, Statutes of 2014), SB 1383 (Lara, Chapter 395, Statutes of 2016), and AB 1496 (Thurmond, Chapter 604, Statutes of 2015). v See SB 1371 (Leno, Chapter 525, Statutes of 2014). vi See CPUC Rulemaking R.18-04-019, Order Institution Rulemaking to Consider Strategies and Guidance for Climate Change Adaptation; See CPUC Rulemaking R.18-12-005, Order Instituting Rulemaking to Examine Electric Utility De-Energization of Power Lines in Dangerous Conditions; See CPUC Rulemaking R. 18-10-007, Order Instituting Rulemaking to Implement Electric Utility Wildfire Mitigation Plans Pursuant to SB 901 (2018).

505
adjudicating a proceeding over the future regulation of natural gas in California.i These proceedings and the decisions that come out of them will determine how infrastructure is maintained, invested in, removed, and how stranded costs will be socialized.
Local jurisdiction act with authority to develop local hydrogen production and infrastructure through land use, constitutional authority to provide municipal services under California Constitution Article XI, § 9, franchise agreement authority, and police power authority. The CPUC would regulate intrastate hydrogen pipelines as a public utility if not owned by a municipal-owned utility.ii Development, procurement, and use of hydrogen also exist in state law through the statutory designation of E-hydrogen procurement as an eligible and carbon-neutral form of energy storage that can be used prospectively in the renewable energy grid or to fuel certain forms of transportation that can be used by IOUs to achieve state policy.iii Hydrogen development offers more opportunities to support or further fuel switching to low-emission or green hydrogen as a fuel source for buildings, industrial processes, or thermal power plants.iv However, current hydrogen production is small, and hydrogen infrastructure and end-use equipment and appliances are nonexistent or limited. There are current CEC and U.S. Department of Energy (U.S. DOE) funding efforts to decrease cost and develop end-uses.v
End-uses that depend on ozone depleting substances (ODS) and ODS substitutes with high-GWP gases, particularly HFC refrigerants, are subject to federal and state regulations that ban, limit or phase out the regulated substance. GHG emissions are caused by annual leakage during the equipment’s use and at end-of-life when the high-GWP gas is vented instead of being captured and destroyed as required by law. Local authorities may seek to strengthen or accelerate state and federal actions by providing local enforcement, incentives to install low-GWP equipment, or potentially regulating equipment that uses these substances under its police power, if not preempted.
HFC refrigerants are common in heat pumps and commercial refrigeration, and certain industrial production with heat-pump installation projected to increase significantly because of building electrification.vi The U.S. EPA regulates acceptable substitutes for existing refrigerants used in various end-use applications in the refrigeration and air conditioning (including transportation), foam blowing, and fire suppression sectors under the Significant New Alternatives Policy (SNAP).vii On May 6, 2021,
i See CPUC Rulemaking R. 20-01-007, Order Instituting Rulemaking to Establish Policies, Processes, and Rules to Ensure Safe and Reliable Gas Systems in California and Perform Long-Term Gas System Planning. ii See Public Utilities Code § 216. iii See SB 1369 (Skinner, Chapter 567, Statutes of 2018). iv See LADWP Joins HyDeal LA, Targets Green Hydrogen at $1.50/Kilogram by 2030 (May 17, 2021): https://www.ladwpnews.com/ladwp-joins-hydeal-la-targets-green-hydrogen-at-1-50-kilogram-by-2030/; See Mayor Eric Garcetti, City of Los Angeles, Announcement of Findings of Historic 100 Percent Renewable Energy Study; See Mayor Eric Garcetti’s 2021 State of City Address: https://lamayor.org/SOTC2021; See HyDeal Los Angeles: https://www.ghcoalition.org/hydeal-la. v See California Energy Commission, Introduction of EPIC Initiative – The Role of Green Hydrogen in a Decarbonized CA – A Roadmap and Strategic Plan, Docket No. 21-IEPR-05, TN# 239050, (July 27, 2021), accessed from Docket Log: https://efiling.energy.ca.gov/Lists/DocketLog.aspx?docketnumber=21-IEPR-05; see US DOE Hydrogen Shot, https://www.energy.gov/eere/fuelcells/hydrogen-shot . vi See Figure 30 in Kenney, Michael, Nicholas Janusch, Ingrid Neumann, and Mike Jaske. 2021. California Building Decarbonization Assessment. California Energy Commission. Publication Number: CEC-400-2021-006-CMF. (August 2021), p. 76; see Figure 3 in Achieving Carbon Neutrality in California: PATHWAYS Scenarios Developed for the California Air Resources Board. Energy and Environmental Economics, Inc. (October 2020), p. 25. vii 40 CFR Part 82.

506
new final SNAP regulations became effective, authorizing new refrigerant options with lower-GWP for retail food cooling as well as residential and light commercial air conditioning and heat pumps.i The American Innovation and Manufacturing (AMI) Act of 2020, part of the Consolidated Appropriations Act of 2021,ii required the U.S. EPA to phase down production and consumption of HFCs in the United States by 85 percent over the next 15 years. On April 30, 2021, the U.S. EPA proposed an HFC phase down regulation for refrigerants and other industrial purposes under an allowance allocation and trading programiii to implement the recently passed AMI Act of 2020.iv The rule will phase down the production and importation of 18 types of HFCs. This rule became effective on November 4, 2021, except for amendatory instruction 3 adding 40 CFR part 84, which became effective on October 5, 2021.
The CAA further prohibits the production and use of CFCs in the United Statesv, preventing replacing a high-GWP ODS substitute with a new lower-GWP CFC refrigerant system. CAA Title VI, Section 605 also phased out the allowed use of HCFCs, starting with specific HCFCs and then moving to a total ban subject to limited exceptions.vi Beginning January 1, 2020, there is a ban on the production and import of HCFC-22 and HCFC-142bvii, and it will be unlawful to produce any HCFCs after January 1, 2030.viii Additionally, CAA Title VI, Section 608ix sets national recycling and emission reduction standards for Class I ODS covered under Sections 604 and Class II ODS under Section 605.
California regulates high-GWP refrigerants under its Refrigerant Management Programx created by AB 32 (Núñez, Chapter 433, Statutes of 2006), set a target of a 40% reduction of HFC emission below 2014 levels by 2030 under SB 1383 (Lara, Chapter 395, Statutes of 2016), operates a California SNAP programxi per SB 1013 (Lara, Chapter 375, Statutes of 2018), and received final approval for a CARB regulation prohibiting certain HFCs in specified stationary refrigeration, chillers, aerosols-propellants, and foam end-uses and requiring refrigerant recovery, reclaim, and reuse per SB 1383 (2016).xii Additionally, SB 1013 (2018) directed the CPUC to consider including low-GWP refrigerants in energy efficiency portfolios. On April 16, 2020, CPUC D.20-04-010 adopted policies that affect all distributed
i U.S. EPA, Final Rule: Protection of Stratospheric Ozone: Listing of Substitutes Under the Significant New Alternatives Policy Program, 40 CFR Part 82 [EPA–HQ–OAR–2019–0698; FRL–10020–41– OAR], Published Federal Register: Vol 86, No. 86, May 6, 2021: https://www.govinfo.gov/content/pkg/FR-2021-05-06/pdf/2021-08968.pdf. ii 47 H.R. 133 – 116th Congress (2019-2020): Consolidated Appropriation Act, 2021. December 27, 2020 (Public Law No: 116-260), American Innovation and Manufacturing Act of 2020: https://www.congress.gov/bill/116th-congress/house-bill/133/text; 42 U.S.C.A. § 7675. iii See U.S. EPA Proposed Phasedown of Hydrofluorocarbons: Establishing the Allowance Allocation and Trading Program under the American Innovation and Manufacturing Act, 40 CFR Part 82 [EPA-HQ-OAR-2021-0044; FRL-10023-08-OAR], April 30, 2021: https://www.epa.gov/sites/production/files/2021-05/documents/hfc_allocation_nprm_043021_admin.pdf. iv See U.S. EPA: Proposed Rule - Phasedown of Hydrofluorocarbons: Establishing the Allowance Allocation and Trading Program under the AIM Act: https://www.epa.gov/climate-hfcs-reduction/proposed-rule-phasedown-hydrofluorocarbons-establishing-allowance-allocation. v Title VI of the Clean Air Act Section 604: 42 United States Code Annotated (U.S.C.A.) § 7671c. vi 42 U.S.C.A. § 7671b & d. vii Ibid. viii Ibid. ix 42 U.S.C.A. § 7671g. x 17 C.C.R. §§ 95380–95398. xi 17 C.C.R. §§ 95371–95377. xii See California Air Resources Board, Prohibitions on Use of Certain Hydrofluorocarbons in Stationary Refrigeration, Chillers, Aerosols-Propellants, and Foam End-Uses Regulation, Last Visited January 5, 2022: https://ww2.arb.ca.gov/rulemaking/2020/hfc2020.

507
energy resources, including energy efficiency, requiring program administrators to account for avoided costs of high-GWP gases in the energy efficiency portfolio, including refrigerant emissions and methane. CPUC D.20-04-010 applies avoided costs to, among other things, fuel substitution measures (e.g., the benefit is lowered methane emissions and costs are refrigerant emissions) and programs that encourage the use of lower-GWP refrigerants than current practice or regulation. CPUC D.21-05-031 , adopted May 20, 2021, required the Refrigerant Avoided Cost Calculator from D.20-04-010 to be used by rolling energy efficiency program administrators for portfolio forecasts and filings beginning in 2022. Future changes will be tied to CARB’s rulemaking, market development, and program administrator experiences.
B.4 Local Authority to Decarbonize the Electricity Supply
Electricity regulation is divided between state regulation of the distribution system and procurement of supply and federal regulation of bulk-power transmission systems and bulk-power markets. In both instances, reliability requirements preempt local authority over electricity procurement where the procurement impacts either CPUC resource adequacy (RA) requirementsi or FERC authority over electric reliability in bulk-power systems.ii The following will discuss local authority in light of the state and federal regulation of conventional and renewable electricity supply resources.
B.4.1 Conventional and Fossil Fuel Generation
The Energy Act of 2020 made several amendments to the Energy Policy Act of 2005 to address reducing GHG emissions from fossil generation through funding technological pilots to decrease emissions or fuel use from natural gas and coal turbines, improve carbon capture and storage, develop a carbon utilization programs, and study blue hydrogen, among other things.iii There were no new mandates regarding direct regulation of GHG emissions from power plants from this legislation.
In terms of state authority over GHG emissions, California’s Cap-and-Trade program regulates covered entities that include cogeneration, self-generation of electricity, stationary combustion, and first deliverers of electricity that emit 25,000 metric tons or more of CO2e per data year.iv State authority also exists over power siting. The CEC is the siting authority for thermal power plants of 50 megawatts or more with authority that preempts local jurisdiction land use authority.v The CEC is prohibited from siting new nuclear power plants unless there is demonstrated technology or disposal site for high-level nuclear waste.vi The Governor may also preempt local land use authority on a limited basis through an emergency declaration.vii Finally, all electric utilities and load-serving entities are prohibited from
i See Public Utilities Code § 380; See CPUC Resource Adequacy Proceeding R.19-11-009. ii See 14 U.S.C. § 8240. iii 47 H.R. 133 – 116th Congress (2019-2020): Consolidated Appropriation Act, 2021. December 27, 2020 (Public Law No: 116-260), Division Z (Energy Act of 2020), Title IV & V: https://www.congress.gov/bill/116th-congress/house-bill/133/text. iv 17 C.C.R. §§ 95811 (a)–(b) & 95812(c). v Public Resources Code §§ 25500 et seq. vi Public Resources Code § 25524.2. vii See Governor’s July 30, 2021 Proclamation of A State of Emergency to address energy supply and demand issues; See U.S. Const. Amendment X; See California Emergency Services Act: Government Code §§ 8558, 8567, 8571, 8625, & 8627.
508
entering into any baseload power generating commitments of 5 years or more if such projects are not as clean as a combined-cycle gas turbine project.i
In terms of air quality, there is uncertainty as to the extent that a local air district may further regulate GHG emissions in relation to CARB’s authority, U.S. EPA authority, and continued uncertainty over power plant GHG regulations due to litigation and presidential administration changes. However, authority exists to create voluntary GHG reduction generation and certification programs in a district.
The U.S. EPA acts with regulatory authority over existingii and new power plantiii criteria pollutantiv and GHG emissions standards under the CAAv with approval authority over local air district rules and regulations for the California SIP. Any state standard must satisfy the requirements of the CAA and U.S. EPA’s implementing regulation with U.S. EPA approved SIPs having the force and effect of federal law.vi SIPs or parts of SIPs that are approved by a state but not yet approved by U.S. EPA are only enforceable under state law. There is disagreement and uncertainty regarding the authority to regulate GHG emissions directly using California air quality statutes. However, the CAA preserves state authority to adopt stationary emissions standards that are as or more stringent than federal requirements.vii
To this end, California adopted its own air quality management statutes, which do not directly call for the regulation of GHGs but instead mirror the federal CAA with certain sections prohibiting the enforcement of federal regulations that are less stringent than those that existed in 2002.viii Cap-and-Trade also largely negates and may preempt additional regulation of power plant GHG emissions at the local level. Consequently, local authority to adopt more stringent GHG standards is subject to California’s Clean Air Actix, California Cap-and-Trade statute, California Air Resources Board authority and review, and U.S. EPA review. It should also be noted that a governor may issue an emergency declaration suspending air quality regulations during specific events or over a limited period of time, which may increase GHG emissions that must be quantified and mitigated or removed to meet state policy.x
The CAA regulatory framework is currently filled with uncertainty because of regulatory changes and litigation at the federal level vacating both Obama and Trump administration GHG emissions regulations under CAA Section 111(b)xi for new, modified, and reconstructed power plants and 111(d)xii for existing power plants. On January 1, 2021, U.S. EPA finalized a revised rule for new, modified, and reconstructed
i Public Utilities Code §§ 8340–8341. ii 42 U.S.C.A. § 7411 (a) & (d). iii 42 U.S.C.A. § 7411(f). iv See 40 CFR Part 60 Subpart Da (Standards of Performance for Electricity Steam Generation Units). v 42 U.S.C. § 7401 et seq. vi 42.U.S.C.A. §§ 7410 (k) & (a)(5)(A), 7413. vii See 42 U.S.C.A. §§ 7407 & 7416. viii See Health and Safety Code § 39000 et seq. ix Health and Safety Code §§ 42500 et seq. x See Governor’s July 30, 2021 Proclamation of A State of Emergency to address energy supply and demand issues; See U.S. Const. Amendment X; See California Emergency Services Act: Government Code §§ 8558, 8567, 8571, 8625, & 8627. xi 42 U.S.C.A. § 7411(f). xii 42 U.S.C.A. § 7411 (a) & (d).

509
power plants amending existing requirements that set New Performance Source Performance Standards (NSPS) to limit CO2 emissions from fossil fuel-fueled power plants.i On March 17, 2021, per President Biden’s Executive Order No. 13990, U.S. EPA asked the D.C. Circuit to vacate and remand this final rule, which occurred on April 5, 2021ii, leaving U.S. EPA’s 2015 Final Rule in place.iii In January 2021, the D.C. Circuit struck down the Affordable Clean Energy (ACE) rule for emissions from existing power plants,iv leaving no effective GHG regulation in place for existing power plants. Emission limits for existing power plants are now under development. However, a current case in front of the U.S. Supreme Court with a decision expected in summer 2022 is challenging U.S. EPA’s ability to regulate GHG emissions from new and existing facilities as well as whether the CAA delegates authority to U.S. EPA for regulation that touches other parts of the economy through electricity decarbonization.v The current state of affairs is reflected in SD APCD’s Standards of Performance for Greenhouse Gas Emissions for Electric Generating Units,vi which implements Title V thresholds for stationary sources of emissions from new or modified steam generation units, integrated coal gasification combined cycle (IGCC), or stationary combustion turbines that commence construction after January 8, 2014 or reconstruction/modification after June 18, 2014.
With U.S. EPA in the process of creating new standards, local authority to enact more stringent requirements is uncertain because enforcement depends on non-preempted state authority and delegated authority from U.S. EPA through the approval of a local air quality standard in the SIP. To date, the U.S. EPA has not approvedvii any of the following local air districts rules for enforcement under California’s SIP:
● Feather River AQMD Rule 10.11viii; ● Mojave Desert AQMD Rule 1211ix; ● North Coast Unified AQMD Rule 111x; and ● Tehama County APCD Rule 7:3.xi
i Federal Register, 86 FR 2542, 2542-2558 (2021): https://www.federalregister.gov/documents/2021/01/13/2021-00389/pollutant-specific-significant-contribution-finding-for-greenhouse-gas-emissions-from-new-modified. ii See California v. Environmental Protection Agency, No. 21-1035, order at p. 1, Document # 1893155 (D.C. Cir. Apr. 5, 2021). iii See 40 CFR Parts 60, 70, 71, and 98 (2015): https://www.govinfo.gov/content/pkg/FR-2015-10-23/pdf/2015-22837.pdf. iv See American Lung Association v. Environmental Protection Agency, 985 F.3d 914 (2021). v See West Virginia v. U.S. EPA, Docket No. 20-1530 (petitions for writs of certiorari in No. 20-1531, No. 20-1778, and No. 20-1780, granted October 29, 2021): https://www.supremecourt.gov/DocketPDF/20/20-1530/176915/20210429133443663_2021.04.29%20-%20West%20Virginia%20v.%20EPA%20Petition.pdf. vi See Title 40, Part 60, Subpart TTTT. vii See U.S. EPA Approved Air Quality Implementation Plans in California (last visited January 12, 2022): https://www.epa.gov/sips-ca. viii See FR AQMD Rule 10.11 (Adopted August 1, 2011): https://ww2.arb.ca.gov/sites/default/files/classic/technology-clearinghouse/rules/RuleID993.pdf. ix See Mojave Desert AQMD Rule 1211 (Adopted February 28, 2011): https://ww2.arb.ca.gov/sites/default/files/classic/technology-clearinghouse/rules/RuleID1972.pdf. x See North Coast Unified AQMD Rule 111 (July 9, 2015): https://ww2.arb.ca.gov/sites/default/files/classic/technology-clearinghouse/rules/RuleID2138.pdf. xi Tehama County APCD Rule 7:3 (Adopted February 1, 2011): https://ww2.arb.ca.gov/sites/default/files/classic/technology-clearinghouse/rules/RuleID3898.pdf.
510
These rules would be enforced pursuant to authority derived from existing state air quality laws.i It is unclear whether California air quality law authority by itself allows enforcement without U.S. EPA approval, specifically with regards to carbon dioxide emissions (but not other GHGs) from stationary sources subject to Cap-and-Trade.ii
Additionally, two air quality management districts have used their existing authorityiii to create voluntary programs that certify voluntary GHG reductions generated by in district activity: South Coast Air Quality Management District (SCAQMD) Rules 2700-2702iv and Sacramento Metropolitan AQMD Rule 100 et seq.v Certification of GHG reduction credits may be issued either through use of a third party verifier (e.g., a carbon registry), through a GHG reduction project developed by the district itself, or both. These programs are designed to allow generation ownership, sale, trade, or retirement of the GHG reduction credit. SCAQMD’s program is notable because it allows both third-party certification for reduction projects in its districts under Rule 2700-2701 as well as a program where a fee is paid to the district to implement a GHG reduction project in the district under Rule 2702 using approved protocols.vi It is unclear whether these voluntary programs are successful or whether there is authority to create mandatory GHG reduction rules and programs. However, authority appears to exist to create a voluntary GHG reduction program in the SD APCD.
B.4.2 Renewable Energy
Existing authority allows local jurisdictions to procure electricity supply on behalf of their citizens, to determine the carbon content of this supply, franchise public rights of way for energy infrastructure, and support distributed generation.
At the federal level, Executive Order 14057 directs the federal executive branch on a net-zero emissions path by 2050. Specific to renewable energy at the utility and distributed energy level, the Executive Order, among other things, requires:
● 100 percent carbon pollution-free electricity on a net annual basis by 2030, including 50 percent 24/7 carbon pollution-free electricity;
● A net-zero emissions building portfolio by 2045, including a 50 percent emissions reduction by 2032;
● A 65 percent reduction in scope 1 and 2 GHG emissions, as defined by the Federal Greenhouse Gas Accounting and Reporting Guidance, from Federal operations by 2030 from 2008 levels; and
● Net-zero emissions from Federal procurement, including a Buy Clean policy to promote the use of construction materials with lower embodied emissions; and
i See Health & Safety Codes §§ 40702, 40703, 40704, 40752; See also Health & Safety Code § 42400 et seq. ii Health & Safety Code § 38594 (b). iii Health & Safety Code §§ 39000 et seq. ; See also Health & Safety Code §§ 40400 et seq. & §§ 40950 et seq. iv South Coast AQMD Rule 2700-2702 (Adopted February 6, 2009; Amended June 4, 2010): https://www.aqmd.gov/home/rules-compliance/rules/scaqmd-rule-book/regulation-xxvii. v Sacramento Metropolitan Rule 100 et seq. (adopted February, 23, 2010): https://ww2.arb.ca.gov/sites/default/files/classic/technology-clearinghouse/rules/RuleID3566.pdf. vi South Coast AQMD Rule 2702 (Adopted February 6, 2009; Amended June 4, 2010), Table 1.

511
● Climate resilient infrastructure and operations.i
Implementing these orders will impact federal facilities across the San Diego region and may create opportunities to scale and benefit from federal action at the local jurisdiction level.
California’s renewable portfolio standard (RPS) requires 60% renewable energy supply by 2030 for all load-serving entities with SB 100 (De León, Chapter 312, Statutes of 2018), further mandating that load-serving entities procure 100% carbon-free electricity by 2045.ii The CEC certifies the eligibility of generating resources to patriciate in the RPS with state law changing eligibility requirements over time (e.g., renewable hydrogen-fueled generation and biomethane).iii CPUC regulated load serving entities may be required by the CPUC to exceed the RPS procurement targetiv, which suggests that local jurisdiction may petition the CPUC to require the local electric corporation to procure higher renewable energy content for their customers. CPUC regulated load serving entity may also voluntarily exceed procurement targets for any year of a three-year compliance period under the RPS for later use in a subsequent compliance period if it meets CPUC requirements.v This allows the load serving entity to supply higher renewable energy contents earlier than a target year. SB 350 (2015) also required the CPUC to create an integrated resource planning (IRP) that forms the regulated load serving entities (LSE) component of the ten-year prospective long-term procurement plan to meet state mandates and ensure reliability.vi This process sets procurement targets to achieve California GHG reductions for CPUC regulated LSEs with the current proceeding seeking to implement significant energy storage and renewable energy procurement that further decrease GHG emissions.vii
California offers limited retail competition options in the form of statutes that authorize both a direct access (DA) programviii to serve a statutorily capped number of commercial customers and the creation of community choice aggregators (CCA) to serve all customers. This further complicates decarbonizing electric supply because there may be an IOU, CCA, and/or DA supplying electricity to customers in a local jurisdiction. California Constitution Article XI, § 9 also allows local jurisdictions, as municipal corporations, to establish, purchase, and operate public works to furnish light, water, power, heat, and other services to residents. These services may be offered outside of a local government’s boundaries with the consent of the applicable jurisdiction. However, there are no publicly owned electric or natural
i Presidential Executive Order No. 14057, Catalyzing Clean Energy Industries and Jobs Through Federal Sustainability, 86 Federal Register 70935 (No. 2021-27114), Sec. 102 (December 8, 2021): https://www.whitehouse.gov/briefing-room/presidential-actions/2021/12/08/executive-order-on-catalyzing-clean-energy-industries-and-jobs-through-federal-sustainability/ & https://www.federalregister.gov/documents/2021/12/13/2021-27114/catalyzing-clean-energy-industries-and-jobs-through-federal-sustainability. ii See Public Utilities Code §§ 399.11 et seq. iii See California Energy Commission, Commission Guidebook Renewable Portfolio Standard Eligibility, Ninth Revised Edition, CEC-300-2016-006-ED9-CMF-REV (January 2017). iv Public Utilities Code § 399.15 (b)(3). v Public Utilities Code § 399.13 (A)(5)(B). vi See Public Utilities Code §§ 454.51 & 454.52. vii See CPUC Proceeding R. 16-02-007, Order Instituting Rulemaking to Develop an Electricity Integrated Resource Planning Framework and to Coordinate and Refine Long-Term Procurement Planning Requirements: https://apps.cpuc.ca.gov/apex/f?p=401:56:0::NO:RP,57,RIR:P5_PROCEEDING_SELECT:R1602007 ; See CPUC R. 20-05-003, Order Instituting Rulemaking to Continue Electric Integrated Resource Planning and Related Procurement Processes: https://apps.cpuc.ca.gov/apex/f?p=401:56:0::NO:RP,57,RIR:P5_PROCEEDING_SELECT:R2005003 . viii See Public Utilities Code § 365.1.

512
gas utilities in the San Diego region and the limited retail competition options of DA and CCAs are used in the region with the effect that local jurisdictions do not own the electric and natural gas distribution and transmission systems.
Local jurisdictions also control the public right-of-way needed to deliver electricity, natural gas, or any other molecule like hydrogen to customers. Local jurisdictions operate with long-term or perpetual franchise agreements that set terms for SDG&E to install and operate its infrastructure in the public right-of-way. Franchise agreements provide revenue to local jurisdictions and complicate the removal of infrastructure. However, it may be possible to exercise franchise rights as a way to increase renewable energy fuel, such as renewable hydrogen for power plant consumption, by either repurposing existing infrastructure or building new infrastructure.
Local governments act with the ability to procure their own supply of electricity under a CCAi — such as San Diego Community Energyii and Clean Energy Allianceiii — subject to requirements like the RPS. CCAs allow local jurisdictions to exceed the RPS targets (e.g., 100% renewable energy) through the procurement authority of the CCA to serve customers. CCAs are subject to reliability requirements under state and federal law, which may complicate achieving a 100% renewable energy supply portfolio or require carbon removal to address carbon emissions from resources that must run for reliability purposes to prevent brown or blackouts. CCAs are opt-in by default, but customers may opt-out to return to the incumbent utility or to a DA electric service provider if there is room under the DA cap. IOUs are also the provider of last resort (POLR) per SB 520 (Hertzberg, Chapter 408, Statutes of 2019), currently being instituted by CPUC decisions under R.21-03-011, further complicating decarbonization of supply portfolios to supply customers that either leave CCAs or DA providers or where a CCA or DA provider fails resulting in customers returning to the incumbent IOU.iv
Police power allows local jurisdictions to determine the supply portfolio supplied from a CCA for their citizens and businesses in their jurisdictions pursuant to either a general plan GHG mitigation plan (e.g., climate action plan)v or as part of their membership in a CCA. This allows a local government by resolution to procure a high or 100% renewable energy supply as the default offering for all of their municipal accounts and/or all of the CCA customers in that jurisdiction who do not opt-out.vi
Local jurisdictions also play an essential role in furthering distributed generation through CCAs, reach codes, and permit streamlining. CCAs can create distributed generation procurement programs in the form of net energy metering or feed-in tariffs (FIT) to increase customer installation of renewable energy generation, including energy storage. Under net energy metering, the CCA credits the customer for the net generation exported to the grid after the onsite load is served. Under a FIT, the CCA pays the customer for all generation produced by the generating resource with no onsite load served. In terms of reach codes, Title 24 now requires new low-rise residential construction (1–3 stories) to install solar.
i See AB 117 (Migden, Chapter 838, Statutes of 2002). ii Includes Cities of San Diego, Imperial Beach, Encinitas, La Mesa, Chula Vista, and the County of San Diego. iii Includes Cities of Carlsbad, Del Mar, and Solana Beach. iv See Western Community Energy Chapter 9 Bankruptcy: Western Community Energy, 6:21-bk-12821-SY (Bankr. C.D. Cal.) (Filed May 24, 2021). v See CEQA Guidelines § 15183 (2021) (14 C.C.R. § 15183). vi See City of Encinitas Regular City Council Meeting, February 24, 2021, Agenda Item 10B: Adopt Resolution 2021-17: https://encinitas.granicus.com/MetaViewer.php?view_id=7&clip_id=2347&meta_id=120211.

513
However, local jurisdiction may require additions and alterations of existing residential and nonresidential buildings to install solar if it is cost-effective pursuant to Public Resource Code § 25402.1 (h)(2) and Title 24, Part 6, Section 10-106. Finally, AB 2188 (Muratsuchi, Chapter 521, Statutes of 2014) requires permit streamlining for small residential rooftop solar systems and AB 45 (Blakeslee, Chapter 404, Statutes of 2009) encourage adoption of county ordinances to reduce permitting obstacles for small wind energy systems. Local jurisdictions act with the authority to further streamline permitting and decrease cost for these types of energy systems or to expand streamlined permit review to more extensive systems or additional types of buildings (e.g., nonresidential for rooftop solar).
B.5 Local Authority Related to Natural Climate Solutions and Other Land Use Considerations
The San Diego region is composed of federal, tribal, state, local, and privately held land. The following will discuss authority over this land, submerged land, water, and coast (land(s)). Authority over the land(s) directly determines its uses, potentially limiting whether the use can support GHG reductions, removal, and/or storage. The following will review federal, tribal, California, and local authority. It concludes with an analysis on agricultural land.
B.5.1 Federal Authority Over Natural Climate Solutions and Other Land Use Considerations
The primary actions local jurisdictions may take related to federal lands is through lobbying Congress, engaging with federal lands management agencies to create government to government agreements (e.g., a memorandum of understanding (MOU)), and working directly with federal lands managers to achieve local objectives across the region.
The U.S. Government owns fee titles in surface land, subsurface mineral rights, less-than-fee in other surface and mineral rightsi, mineral resources under the outer continental shelf, and living marine resources out to 200 miles offshore.ii Federal land in the San Diego region includes national forest, land managed by the Bureau of Land Management, a national monument, wildlife refuge, and land managed by the Department of Defense.
Federal public land law is complex, requiring specific legal and factual analysis that may involve both the Administrative Procedure Act (APA) of 1946iii and the National Environmental Policy Act (NEPA) of 1969.iv Waters of the United States also include wetlands that are regulated under Section 404 of the Clean Water Act administered by the U.S. Army Corps of Engineers.v Specific to geological carbon sequestration on public lands, the Energy Independence and Security Act of 2007 required the Secretary
i The United States owns severed surface estates, severed mineral estates, easements for access, acquired "wetlands easements" for the benefit of migratory waterfowl, and general conservation or nondevelopment easements. ii Fisheries Conservation and Management Act of 1976, 16 U.S.C.A. §§ 1801–1882. iii 5 U.S.C.A. §§ 551 -706. iv 42 U.S.C.A. §§ 4321 to 4370d. v 33. U.S.C.A § 1344; See generally 33 U.S.C.A. §§ 1251 et seq., U.S. Army Corps of Engineers implementing regulations at 33 C.F.R. §§ 320–330 and U.S. EPA § 404(b)(1) Guidelines for Specification of Disposal Sites for Dredged or Fill Material at 40 C.F.R. §§ 230–233.
514
of the Interior to submit to the House Committee on Natural Resources and Senate Committee on Energy and Natural Resources, in coordination with U.S. EPA, the Secretary of Energy, and heads of other appropriate agencies, a report:
● Recommending criteria for identifying candidate geological sequestration sites in statutorily specified types of geological settings (e.g., oil & gas fields, saline formations, etc.);
● A proposed regulatory framework for the leasing of public land or an interest in public land for the long-term geological sequestration of carbon dioxide, proposed procedures to ensure public review and comment and protection of natural and cultural resources;
● A description of the status of Federal leasehold or Federal mineral estate liability issues related to the geological subsurface trespass of or caused by carbon dioxide stored in public land, including any relevant experience from enhanced oil recovery using carbon dioxide on public land;
● Recommendations for additional legislation that may be required to ensure that public land management and leasing laws are adequate to accommodate the long-term geological sequestration of carbon dioxide;
● An identification of the legal and regulatory issues specific to carbon dioxide sequestration on land in cases in which title to mineral resources is held by the United States but title to the surface estate is not held by the United States;
● An identification of the issues specific to the issuance of pipeline rights-of-way on public land under the Mineral Leasing Act (30 U.S.C. 181 et seq.) or the Federal Land Policy and Management Act of 1976 (43 U.S.C. 1701 et seq.) for natural or anthropogenic carbon dioxide; and
● Recommendations for additional legislation that may be required to clarify the appropriate framework for issuing rights-of-way for carbon dioxide pipelines on public land.i
This report is a starting point for sequestration activity on federal lands and should be used in concert with land use authority described below.
Additionally, the Energy Act of 2020 amended the Energy Policy Act of 2005 (42 U.S.C.A § 16291 et seq.) to establish a research, development, and demonstration program to test, validate, or improve technologies and strategies to remove carbon dioxide from the atmosphere on a large scale through activities that include:
● Direct air capture and storage technologies; ● Bioenergy with carbon capture and storage technologies; ● Enhanced geological weathering; ● Agricultural practices; ● Forest management and afforestation; and ● Planned or managed carbon sinks, including natural and artificial.ii
i Public Land No. 110-140, § 714(a), 121 Stat. 1492, 1715. ii 47 H.R. 133 – 116th Congress (2019-2020): Consolidated Appropriation Act, 2021. December 27, 2020 (Public Law No: 116-260), Division Z (Energy Act of 2020), Title V: https://www.congress.gov/bill/116th-congress/house-bill/133/text.

515
There is opportunity at the state and local level to develop and demonstrate or benefit from projects funded by this legislation. Further efforts should be made to investigate this opportunity, particularly with regard to federal land in the region.
The following will provide a general explanation of the four primary federal public lands and resources agencies. An analysis of the Department of Defense is excluded but the Department of Defense should be included in any regional negotiations and planning. The analysis focuses on opportunities for local governments or the State of California to engage federal lands managers based on federal lands and resources in the San Diego region:
● National Parks Service (NPS): The National Park System Act of 1916i is the primary law governing national parks; the Act grants the NPS broad discretion in achieving its main goals of preservation and recreation. The National Parks and Recreation Act of 1978ii creates general planning obligations for the NPS. The Antiquities Act of 1906iii authorizes the presidential designation of national monuments and the protection of scientific and historical objects. It may be used to preserve additional land in the San Diego region where such land is already federally owned and the designation limited to the smallest area compatible with preservation for “historic or scientific interest”iv, with courts often granting deference to presidential discretion. The Cabrillo National Monument is the only NPS land in the San Diego region established by Presidential Proclamation 4319 (September 28, 1974).
The NPS’s discretion in achieving its mission suggests that partnering with local jurisdictions to decrease carbon emissions related to the Cabrillo Monument and increase natural land carbon removal may be feasible. Any action would need to be consistent with the purpose of creating the Cabrillo National Monument.v It may also be possible to preserve land through the creation of a national park or additional monument in the San Diego region.
● Fish and Wildlife Service (FWS): FWS mission includes land management of wildlife refuge system units created by statute and presidential executive proclamation, and national regulation for wildlife protection that applies off and on federal lands. Wildlife refuge system units are governed by the National Wildlife Refuge System Administration Act of 1966vi, the National Wildlife Refuge System Improvement Act of 1997vii, the Refuge
i 54 U.S.C.A. §§ 100101-100906. ii 54 U.S.C.A. §§ 100101, 100502, 100507, 100751, 100754, 100901, 100906, 100302, 100702-100703, 100751, 100754, 101301, 10212, 101302, 102701-102702, 104906. iii 54 U.S.C.A. §§ 320301-320303. iv 54 U.S.C.A. § 320301. v See United States v. City & County of Denver, 656 P.2d 1 (Colo. 1982). vi 16 U.S.C.A. §§ 668dd-668ee. vii Public Law No. 105-57, 111 Stat.1252.

516
Recreation Act of 1962i, and the Refuge Revenue Sharing Act of 1964.ii The National Wildlife Refuge Act of 1997 also created three tiers of use: 1) Conservation of wildlife, plants, and their habitats; 2) If human use is allowed, wildlife-dependent recreational uses are entitled to the highest priority; and 3) All other uses with the lowest priority or prohibition of use.iii, iv There is some level of discretion afforded to FWS officials with regards to uses. Funds to acquire refuge land are authorized by specific appropriation or under multiple existing statutes including: the Land and Water Conservation Fund Actv; the Migratory Bird Conservation Act of 1929vi; and the Water Bank Act of 1970.vii FWS acts with exclusive or shared enforcement authority over wildlife affecting federal, state, and private land. These include the: Endangered Species Act (ESA) of 1973viii; the Migratory Bird Treaty Act of 1918ix; the Bald Eagle Protection Act of 1940x; and the Marine Mammal Protection Act of 1972.xi FFWS administration includes the San Diego National Wildlife Refuge.
There is some level of discretion afforded to FWS officials with regards to uses that should be further analyzed. Opportunities may include increasing the size of existing refuge and working with FWS officials to exercise their discretion in a way that benefits regional decarbonization goals.
● Bureau of Land Management (BLM): BLM administers federal lands not reserved to parks or refuge under a complex statutory regime that dates back to the founding of the Republic. BLM authority comes from: the Federal Land Policy and Management Act (FLMP) of 1976xii; range management authority contained in the Taylor Grazing Act of 1934xiii and Public Rangelands Improvement Act of 1978xiv; land manager authority contained in the FLMPxv, Color of Title Actxvi, and Desert Lands Act of 1877xvii; and mineral manager authority under General Mining
i 16 U.S.C.A. §§ 460k–460k-4. ii 16 U.S.C.A. § 715s. iii 16 U.S.C.A. § 668dd(a)(2). iv See 71 Fed. Reg. 36408 (2006); Final Appropriate Refuge Uses Policy, available at http://policy.fws.gov/ser600.html. v 54 U.S.C.A. §§ 100506, 100904 to 100905, & 200301–200310. vi 16 U.S.C.A. §§ 715–715r. vii 16 U.S.C.A. §§ 1301–1311. viii 16 U.S.C.A. §§ 1531–1543. ix 16 U.S.C.A. §§ 703–711. x 16 U.S.C.A. §§ 668–668d. xi 16 U.S.C.A. §§ 1361–1407. xii 43 U.S.C.A. §§ 1701–1784. xiii 43 U.S.C.A. §§ 315–315r. xiv 43 U.S.C.A. §§ 1901–1908. xv 43 U.S.C.A. §§ 1713–1721. xvi 43 U.S.C.A. §§ 1068–1068b. xvii 43 U.S.C.A. §§ 321–323.

517
Law Act of 1872i, the Mineral Leasing Act of 1920ii, the Acquired Lands Leasing Act of 1947iii, and Geothermal Steam Act of 1970.iv
BLM land managers act with broad discretion to plan and manage land and resources. Local BLM managers act with different authorities when compared to U.S. Forest Service officials, who must change already established localized plans developed in compliance with existing broad agency rules that limit discretion. This may provide an opportunity for local jurisdictions to work directly with local BLM land managers on decarbonization efforts in the San Diego region.
● The U.S. Forest Service (U.S.F.S.): The Organic Act of 1897v grants authority over forest land, defines the purpose of national forest management, and set strict limits on timber harvest. Some management practices, like livestock grazing, administrative wilderness designation, and multi-use management actions were later codified in law. The Organic Act of 1897 originally granted a wide range of management discretion. However, the National Forests are now managed with less discretion because of the Forest and Rangelands Renewable Resources Planning Act (RPA) of 1974, as amended by and merged into the National Forest Management Act (NFMA) of 1976vi, which created an inclusive forest wide planning process for the entire national forest system, including localized planning. This authority grants discretion to U.S.F.S. to create broad, encompassing management regulations but compliance with these regulations limits local manager discretion over local plans. Forest land is also affected by the FLPMAvii, wilderness designationsviii, and the Endangered Species Act of 1973.ix
Because there are localized planning requirements and less manager discretion, there is less flexibility with National Forest land than BLM land without amending or creating a new local plan under the NFMA. However, the inclusion of decarbonization actions in U.S.F.S. authority to issue broad rules of applicability to manage forest land does create an opportunity for local jurisdictions to engage in the U.S.F.S. regulatory process that affects local planning in addition to advocating for changes to existing local plans, such as the Cleveland National Forest Land Management Plan.
B.5.2 Tribal Authority Over Natural Climate Solutions and Other Land Use Considerations
States and local governments generally act with limited to no authority over tribal land use and activity. Cooperative intergovernmental policies and agreements that support tribal land preservation, land
i 30 U.S.C.A. §§ 22–47. ii 30 U.S.C.A. §§ 181–287. iii 30 U.S.C.A. §§ 351–354. iv 30 U.S.C.A. §§ 1001–1026. v 16 U.S.C.A. §§ 473–482 (partially repealed 1976). vi 16 U.S.C.A. §§ 1600–1616. vii 43 U.S.C.A. §§ 1732(b), 1751–1753, & 1765–1771. viii 16 U.S.C.A. §§ 1131–1136. ix 16 U.S.C.A. §§ 1131–1136.

518
conservation, and decarbonization efforts through mechanisms that include the fee-to-trust process appear to be existing paths to work with tribes in achieving regional decarbonization goals.
There are eighteen federally recognized tribes and seventeen tribal governments (Note: the Barona and Viejas Bands share joint-trust and administrative responsibility for the Capitan Grande Reservation) in the San Diego region.i In terms of natural resources, tribal and individual aboriginal titles include exclusive rights to use land and resources unless abrogated by treaty or statute.ii On trust and restricted lands, the U.S. holds natural resources in trust for the tribal or individual owner, owing a fiduciary duty to the tribe or allottee. Federal executive authority over Indian Affairs, including trust land, flows from the President to the Secretary of the Interior and through delegation to the Bureau of Indian Affairs (BIA).iii BIA regulations include: the process to acquire land in trust status for a tribe or individual Indians (fee-to-trust) iv; removing restrictions on the alienation of Indian allotmentsv; approval and cancelation of leases on tribal and individual trust landvi; issuance of grazing permits on Indian landvii; governing the leasing of mineral resourcesviii; management of timber resources on tribal landix; regulation of certain fishing activitiesx; regulation of Indian tradersxi; implementation of portions of the Indian Gaming Regulatory Actxii; and regulation of certain water rights and irrigation issues.xiii
Indian tribes possess the inherent power to govern their territories. While these powers may be limited by federal laws in certain respects, the authority over tribal health and welfare remains substantial, allowing tribes to act to the full limit of their inherent governmental authority.xiv Tribes may enact environmental tribal codes that establish standards, permit requirements, and penalties for violations and provide for enforcement in tribal court and through tribal agency proceedings. Tribes may also exercise environmental law authority delegated by Congress, with tribes assumed to be the primary regulatory authority or to have primacy for administering most federal environmental law programs.xv Federal environmental law applies in a tribal territory with either the tribe or the federal agency — generally the U.S. EPA — responsible for administering the environmental statute.xvi
i Note: the San Luis Rey Band of Luiseño Indians and Mount Laguna Band of Luiseño Indians Tribal Governments do not have federally recognized land but are active in the region. ii See, e.g., United States v. Dann, 873 F.2d 1189 (9th Cir. 1989), on remand from United States v. Dann, 470 U.S. 39 (1985) (individual aboriginal use rights). iii See 25 U.S.C.A. §§ 1, 1s, & 2 ; 43 U.S.C.A. § 1457. iv 25 C.F.R. part 151. v 25 C.F.R. part 152. vi 25 C.F.R. part 162. vii 25 C.F.R. part 166. viii 25 C.F.R. parts 200, 211, 212, 225. ix 25 C.F.R. § 163. x 25 C.F.R. parts 241, 242, 247–249. xi 25 C.F.R. part 140. xii 25 C.F.R. parts 290 and 291. xiii 25 C.F.R. parts 159, 171–173. xiv See Backcountry Against Dumps v. EPA, 100 F.3d 147, 151 (D.C. Cir. 1996). xv See 1 Cohen's Handbook of Federal Indian Law § 10.01 (2021). xvi See Donovan v. Coeur d’ Alene Tribal Farm, 751 F.2d 1113, 1116 (9th Cir. 1985) (quoting United States v. Farris, 624 F.2d 890, 893–894 (9th Cir. 1980)).

519
States and local governments generally act with limited to no authority over tribal land use and activity.i State and local environmental laws do not apply to Sovereign Tribal Nations unless required by the Compact with the Stateii or through independent agreements between Tribal Governments and local agencies. Local jurisdictions may enact policies that affect tribal land expansion through the existing fee-to-trust applications process, which transfers purchased land to the BIA as trustee.iii Per SB 712 (Hueso, Chapter 291, Statutes of 2021), local jurisdictions are now encouraged to work cooperatively with tribes in a tribe’s nongaming fee-to-trust application and prohibited from adopting or enforcing a resolution or ordinance that prevents the local government from conducting a fair evolution of the application based on its merits. The County of San Diego recently acted before this law was signed by the Governor by voiding Resolution Nos. 94-115, which created a blanket policy of opposition to fee-to-trust applications in 1994, and 01-162, which set strict criteria for liquor licenses, in May of 2021. The County of San Diego will be compliant with SB 713 (2021) as it takes effect on January 1, 2022, creating a cooperative intergovernmental policy that can support tribal land preservation, land conservation, and decarbonization efforts through the fee-to-trust process.
B.5.3 State of California Authority Over Natural Climate Solutions and Other Land Use Considerations
B.5.3.1 General Authority
State ownership and authority over state and private natural and working lands are inextricably tied to federal public lands and statutes. Federal lands are often geographically contiguous with state land or surrounds state land acquired from a federal government grant or state acquisition of federal land. For example, the equal footing doctrine and Submerged Lands Act of 1953iv presumes that states own title to submerged lands beneath inland navigable waters and beneath territorial waters within three nautical miles of the state’s coast. Additionally, federal land grants are often restricted, limiting state discretion as to the use and disposition of the land.v
Beyond state land with a federal nexus, California actively manages natural and working lands through various agencies with a wide range of authority and missions. State authority and specific agency authority to preempt local police power over zoning is narrow and limitedvi to specific statewide objects. These objectives include housing requirements that determine the number of residential units to be zoned, including affordable housing, but not where the units should be zoned.vii They also include
i See Worcester v. Georgia, 31 U.S. 515 (1832). ii See Indian Gaming Regulatory Act of 1988 (Public Law 100-497; 18 U.S.C.A. §§ 1166 et seq. & 25 U.S.C.A §§ 2701 et seq.). iii See County of San Diego Resolution No. 94-115 (1994) creating policy to oppose all tribal fee-to-trust applications and Resolution No. 01-162 (2001) adopting strict criteria for tribal liquor licensing for their facilities (both resolutions voided by a 4-1 vote on May 5, 2021 of the County of San Diego Board of Supervisor- Land Use, Regular Meeting, Agenda Item No. 9: “FRAMEWORK FOR OUR FUTURE: COOPERATIVE APPROACH TO TRIBAL GOVERNMENTS AND FEE TO TRUST PROPOSALS”: https://bosagenda.sandiegocounty.gov/cob/cosd/cob/doc?id=0901127e80cfcf57; https://bosagenda.sandiegocounty.gov/cob/cosd/cob/doc?id=0901127e80cfdd81). iv Submerged Lands Act, 43 U.S.C.A. §§ 1301–1315: The 1953 Act gave coastal states title to the offshore lands three miles seaward from the coastline; See also United States v. Alaska, 521 U.S. 1 (1997) (ANWR Ownership). v George Cameron Coggins and Robert L. Glicksman, Public Natural Resources Law, Second Edition (October 2021 Update), § 1:7 (2nd ed.). vi See Government Code § 65000 et seq.; See Scrutton v. County of Sacramento, 275 Cal. App. 2d 412, 417 (1978). vii See Government Code §§ 65913.1(a), 65863.5, 65583(a)(3), 65584, & 65584.01.

520
specific areas, such as the coastal zone or under the Subdivision Map Acti, which allows specified local supplementary regulation.ii State preemption over charter city municipal affairs is expressly limited by California Constitution Article XI, §§ 3 and 5. Additionally, CEQA applies to a broad range of projects, as defined, on natural and working lands and is a major consideration when analyzing land and resource uses. The California Endangered Species Act may also affect use of habitat and would need to be specifically analyzed.iii The following discusses both state policy and relevant laws and agencies.
AB 32 (2006) and SB 32 (Pavley, Chapter 249, Statutes of 2016) authorized programs — such as Cap-and-Trade — do not directly regulate land use. However, SB 1386 (Wolk, Chapter 545, Statutes of 2016) established protecting and managing natural and working lands as state policy to be considered by all parts of the state government, that this policy is important to achieving California’s GHG reduction goals, and that state policy includes the intent to promote cooperation of owners of natural and working lands. In addition, the carbon neutrality by 2045 target required by 2018 Executive Order B-55-18’s incorporates working lands, including agriculture, in the 2022 AB 32 Scoping Plan update that is currently under development and expected to be approved by the end of 2022. CARB recently completed several technical working groups on natural and working lands as part of the Scoping Plan update, with the most recent on December 2, 2021. In addition, CARB is developing methods to model business-as-usual and several alternatives that will inform statewide goals in the 2022 Scoping Plan for five natural and working land categories: 1) forest, shrubland, and grasslands; 2) agriculture; 3) settlements (e.g., urban forests, wildland urban interface, and rural intermix and influence forests); 4) wetlands; 5) deserts and other lands.iv
Executive Order B-55-18 was furthered in 2020 by Executive Order N-82-20’s language regarding biodiversity, 30% land and coastal water conservation, acceleration of natural carbon sequestration and climate resiliency on natural and working lands, and creation of the Natural and Working Lands Climate Smart Strategy, including setting a statewide target to meet the 2045 carbon neutrality goal. The legislature codified part of Executive Order N-82-20 under SB 27 (Skinner, Chapter 237, Statutes of 2021) regarding establishing a Natural and Working Land Climate Smart Strategy that includes developing a framework to achieve California’s climate goals and mandates CARB to set CO2 removal targets for 2030 under its Scoping Plan for all emission sectors including those in this framework. Finally, SB 27 (2021) requires the Natural Resources Agency to create a carbon removal and sequestration registry to identify, list, fund projects by state agencies and private entities, and retire projects in the state that drive climate action on the state’s natural and working lands.
Previously, the 2017 AB 32 Scoping Plan, guided by SB 1386 (2016), sought to address GHG emissions from natural and working lands, including forests, rangelands, agriculture, wetlands, and soils. The 2017 Scoping Plan sought to maintain natural and working “land as carbon sinks (i.e., net zero or negative GHG emissions) and, where appropriate, minimize the net GHG and black carbon associated with
i Government Code §§ 66410 et seq. ii See Government Code §§ 66411, 66421, 66477, 66478, 66479, 66483, & 66484; see also Friends of Lake Arrowhead v. Board of Supervisors, 38 Cal. App. 3d 497, 505, (1974). iii Fish and Game Code § 2050 et seq. iv See 2022 Scoping Plan Update Modeling and Scenario Workshop, Natural and Working lands, December 2, 2021: https://ww2.arb.ca.gov/sites/default/files/2021-12/NWLPublicWorkshopSlides_Dec2_PublicDistribution.pdf.

521
management, biomass utilization, and wildfire events”i out to 2030 as it predated the 2018 executive order for carbon neutrality. It set a target of sequestering and avoiding emissions in this sector by at least 15-20 million metric tons by 2030. Actions from the 2017 AB 32 Scoping Plan specific to natural and working lands included:
● Protecting land from conversion to more intense uses by increasing conservation, and supporting local land use planning processes in urban and infrastructure development that avoid greenfield development (including SB 375 (2008) Sustainable Communities Strategies in the Regional Transportation Plan and SB 743 (2013) CEQA VMT requirements under CEQA);
● Enhance resiliency of and potential for carbon sequestration on lands through management and restoration, reduce GHG and black carbon emission from wildfire and management activities, and include expansion and management of green space in urban areas; and
● Innovate biomass utilization for harvested excess agricultural and forest biomass to advance statewide objectives in renewable energy and fuels, wood product manufacturing, agricultural markets, and soil health while also increasing the resiliency of rural communities and economies. ii
CARB and related agencies completed a Natural and Working Lands Climate Change Implementation Plan (NWL Implementation Plan) in April 2019. The NWL Implementation Plan was informed by SB 859 (Committee on Budget and Fiscal Review, Chapter 368, Statutes of 2016) Natural and Working Land Inventory that quantitatively estimated the existing state of ecosystem carbon stored in the State's land base and excluded GHG emissions associated from direct human activity quantified in CARB’s annual statewide GHG inventory.iii The NWL Implementation Plan sets targets out to 2030 and pathways to at least double the pace and scale of state-funded restoration and management activities, including: 1) increasing the acreage in soil conservation practices for cultivated land and rangelands by five times to change agricultural land from a net emitter to a sink by 2030; 2) doubling the pace and scale of forest managed or restored; 3) tripling the pace of restoration of oak savannas and riparian areas; and 4) and doubling the rate of wetland seagrass restoration.iv The NWL Implementation Plan also calls for a wide range of activities and acreage goals based across activities and land types.v
B.5.3.2 Specific Statutes and Agencies Applicable in San Diego Region
The following discusses specific statutes and agencies that regulate natural and working lands in the San Diego region. It is non-exhaustive.
i CARB California’s 2017 Climate Change Scoping Plan (November 2017), p. 81: https://ww2.arb.ca.gov/sites/default/files/classic/cc/scopingplan/scoping_plan_2017.pdf. ii CARB California’s 2017 Climate Change Scoping Plan (November 2017), p. 82: https://ww2.arb.ca.gov/sites/default/files/classic/cc/scopingplan/scoping_plan_2017.pdf iii See CARB California Natural and Working Land Inventory (2018), p. 7 & 15: https://ww2.arb.ca.gov/nwl-inventory . iv See January 2019 Draft California 2030 Natural and Working Lands Climate Change Implementation Plan (Updated January 2019), p. 13–14: https://ww2.arb.ca.gov/sites/default/files/2020-10/draft-nwl-ip-040419.pdf. v See January 2019 Draft California 2030 Natural and Working Lands Climate Change Implementation Plan (Updated January 2019), p. 14–20: https://ww2.arb.ca.gov/sites/default/files/2020-10/draft-nwl-ip-040419.pdf.

522
The California Coastal Act of 1976i created the California Coastal Commission that administers planning and permitting regulatory schemes over California's coastal land and territorial waters (including wetlands in the coastal zoneii) to balance uses with protecting coastal natural resources. The coastal zone is as defined in identified maps by the legislature. Local jurisdictions, including ports through certification of port master plans, play a primary role in implementing the Coastal Act by developing local coastal plans (LCPs) for certification by the Coastal Commission that determine use and density. LCPs are subject to CEQA and congruent with the local jurisdiction’s GPiii and become part of the GP once adopted.iv Once certified, the California Coastal Commission delegates authority to issue coastal development permits to the local jurisdiction or port. The Coastal Commission retains jurisdictions over tidelands, submerged land, public trust lands, any state university or college within the coastal zone,v where an LCP is not certified, and on appeal of certain types of developments.vi The Coastal Commission is also designated as a planning and management agency under the Federal Coastal Zone Management Act of 1972. It determines consistency with California’s federally approved coastal management program with regards to proposed federal activity or federal permitted activity within the coastal zone.vii
The Public Trust Doctrine, enshrined in California Constitution Articles I, § 25, Article X §§ 3–4, and Article XVI, § 6, creates the basis for stewardship of lands, waterways, and resources entrusted to the state. Accordingly, the State Lands Act created the California State Lands Commission to manage tide and submerged lands and the beds of naturally navigable rivers, streams, lakes, bays, estuaries, inlets, and straits.viii This includes classifying any or all state lands for their different possible uses and leasing and sale of state land (including oil and gas leases in the California Coastal Sanctuaryix).
The California Department of Fish and Wildlife acts with authority over wetland resources associated with rivers, streams, and lakes which is broader than U.S. Army Corps of Engineer authority under Clean Water Act Section 404 because it includes streamside habitats.x This authority allows the regulation of work that: substantially diverts, obstructs, or changes the natural flow of a river, stream, or lake; substantially changes the bed, channel, or bank of a river, stream, or lake; uses material from a streambed; or deposits or disposes of debris, waste, or other material containing crumbled, flaked, or ground pavement where it may pass into any river, stream, or lake, including a broad range of activities such as gravel mining and timber harvesting.xi
i See Government Code § 30000 et seq. ii See California Coastal Commission Procedural Guidance for the Review of Wetland Projects in California’s Coastal Zone, Chapter 3: https://www.coastal.ca.gov/wetrev/wettc.html. iii Public Resources Code §§ 301085 & 30108.6. iv Citizens of Goleta Valley v. Board of Supervisors, 52 Cal. 3d 553, 571 (1990). v Public Resources Code § 30519(b). vi Public Resources Code §§ 30519, 30603(a), & 30604. vii Public Resources Code § 30330; 16 U.S.C.A. § 1456(c). viii Public Resources Code § 6001 et seq. ix See Public Resource Code §§ 6240–6245. x Fish & Game Code §§ 1600-1616. xi Fish & Game § 1602.

523
The State Water Resources Control Board acts with authority over “waters of the state” under the Porter-Cologne Water Quality Act that are not under federal jurisdiction.i The State Water Resources Control Board regulates projects filling wetlands through General Orders that local Regional Water Quality Boards implement. In addition, the San Diego Regional Water Quality Control Board acts with regulatory authority over wetlands through Waste Discharge Requirements and Clean Water Act Section 401 certificates of state water quality standards compliance for fill projects in wetlands and other State waters.ii
Timber harvests on private and state-owned forest lands are regulated by the Z’berg-Nejedly Forest Practice Act of 1973iii and CEQA.iv The Board of Forestry adopts regulations under this authority, and CAL Fire administers the rules that address productivity of timberland and sustained production of timber that considers sequestration of carbon dioxidev, recreation, watershed, wildlife, range and forage, fisheries, regional economic vitality, employment, and aesthetic enjoyment. Adopted rules must protect the environmentvi, and more recently, legislation was adopted to address sequestration of carbon dioxide in forests through the Forest Practice Act of 2010,vii the Working Forest Management Planviii, and Programmatic Timberland Environmental Impact Report for Carbon Sequestration and Fuel Reduction Programix with action taken in tandem with CARB’s Scoping Plan. Executive Order B-52-18 ordered the creation of a California Forest Carbon Plan (2018), and the 2021 Wildfire and Forest Resilience Action Plan is part of its implementation. To date, there has been limited regulatory activity related to the statutory mandates at the Board of Forestry, but this will likely change with the adoption of the 2022 Scoping Plan that will directly address forest management. It is unclear how this will impact the San Diego region. Additionally, the Forest Practice Act preempts counties from regulating the activity of timber operators.x However, the County of San Diego lacks zoned timber production zones and actively regulates land uses with timber and/or designated as open space.
B.5.4 Local Authority Over Natural Climate Solutions and Other Land Use Considerations
Cities and counties often use planning and land use control authorities to protect or regulate natural and working lands. In this regard, the full extent of this authority requires further research and development to determine what is feasible at the local level to regulate, preserve, and augment natural and working lands for GHG regulations and any removal or storage activities in the region. Additionally, local jurisdictions act with authority to lobby Congress, the California Legislatures, and negotiate with federal,
i See January 25, 2001, Memorandum from SWRCB Chief Counsel to State Board Members and Regional Board Executive Officers, Effect of SWANCC v. United States on the 401 Certification Program, available at http://www.swrcb.ca.gov/water_issues/programs/cwa401/docs/stateregulation_memorandum.pdf. ii See, e.g., Memo from SWRCB Executive Director to Regional Board Executive Officers, Guidance for Regulation of Discharges to “Isolated” Waters (June 25, 2004), available at http://www.waterboards.ca.gov/water_issues/programs/cwa401/docs/isol_waters_guid.pdf; See 33 U.S.C.A. § 1342; 33 C.F.R. § 325.2(b)(1); 40 C.F.R. § 230.10(b)(1). iii Public Resources Code § 4511 et seq. iv Public Resources Code § 21000 et seq. v See Public Resources Code §§ 4512.5(a) & (e). vi See Public Resources Code § 4551. vii AB 1504 (Skinner, Chapter 534 , Statutes of 2010); See Public Resources Code § 4512(c); see also AB 1023 (Wagner, Chapter 296, Statutes of 2011); See Public Resources Code § 4512.5(a) & (d). viii AB 904 (Chesbro, Chapter 648, Statutes of 2013); See Public Resources Code § 4597 et seq. ix SB 862 (Committee of Budget and Fiscal Review, Chapter 36, Statutes of 2014); See Public Resources Code § 4598 et seq. x Public Resources Code § 4516.5(d).
524
tribal, and state agencies and lands managers to further these aims. Local jurisdictions may also act with existing authority to create pilots or programs in this regard. Local jurisdiction also act with existing authority to fund local science to accurately identify and quantify local natural and working lands carbon stock and sequestration potential to inform local decisions and investment. Further research is needed to develop and vet these and other actions on natural and working lands.
Known local government tools that can be used to regulate and protect natural and working lands include GPs, specific plans, CAPS, LCPs, zoning, special use permits, subdivision maps, and development agreements. Policies that support easements (e.g., conservationi — including California Forest Legacy Program Act easementsii — and open-spaceiii), as well as incentives largely based on easements to preserve land, are additional tools available to local jurisdictions to preserve and manage natural and working lands. This includes, but is not limited to:
● Purchase of Agricultural Conservation Easementsiv; ● Transfer development credits/transfer of development rights; ● Lease or lease-purchase; ● Fee simple acquisitions; ● Mitigation banking; ● Project specific development agreements; ● City-county agreements and revenue sharing regarding urban growth; ● Greenbelt buffers, cluster development; ● Agricultural enterprise zones; ● Agricultural Protection Planning Grant Programv; and ● Development of an agricultural land component as part of an open-space element or
agricultural land element.vi Finally, local jurisdictions can also apply for state programs like the Urban & Community Forestry Program under the Urban Forestry Actvii to support local urban forestry efforts that are included in GPs or CAPs.
B.5.5 Agriculture
Local jurisdiction's authority over agricultural land stems from police power over land use and zoning. Agriculture emissions or GHG mitigation actions also may be part of a local jurisdiction's CAP. For example, the Oceanside Carbon Farming Program is a CAP measure with a goal to establish up to 50 acres of demonstration carbon farms by 2025 utilizing alternative management practices that result in increased carbon sequestration. Such practices include, but are not limited to, synthetic nitrogen fertilization reductions, compost application, anaerobic digestion of waste, silvopasture, reduced tillage,
i Civil Code §§ 815.1, 815.3, 815.2(a)-(b). ii Public Resources Code § 12200 et seq. iii Government Code § 51070 (The Open-Space Easement Act of 1974). iv Civil Code § 815 et seq.; See County of San Diego PACE Program Guidelines (March 3, 2021). v Public Resources Code § 10280 et seq. vi See Government Code §§ 65565, 65570, 66565, 66565.1; See also Public Resources Code § 10281.5. vii Public Utilities Code § 4799.06–4799.12.

525
cover cropping, conservation crop rotation, range planting, and improved nutrient management.i It is unclear how and to what extent a local jurisdiction may use its police power to regulate agriculture activities that cause GHG emissions directly. Some potential opportunity are dependent on whether and how CARB regulates certain activities.
Federal authority over agriculture land use and practices is limited with certain land use requirements for leased federal land for farming or animal production but no specific regulation of GHG emissions.
In California, SB 1386 (Wolk, Chapter 545, Statutes of 2016) established protecting and managing natural and working lands as state policy to be considered by all parts of the state government, that this policy is important to achieving California’s GHG reduction goals, and that state policy includes the intent to promote cooperation of owners of natural and working lands. SB 1386 (2016) also defined farming land as working land under Public Resources Code § 9001.5(d)(1). SB 1383 (Lara, Chapter 395, Statutes of 2016) mandated that CARB achieve a 40% reduction in methane emissions below 2014 levels by 2030, including reducing emissions from livestock manure management operations and diary manure management operations the creation and implementation of a Short-Lived Climate Pollutant Strategy. SB 1383 (2016) sets the date of on or after January 1, 2024, as the effective date to implement regulation of these emissions with ongoing investments and incentives to achieve the reductions. SB 1383 (2016) also limits regulation of enteric fermentation to incentive-based mechanisms until CARB and the Department of Food and Agriculture determine that a cost-effective and scientifically proven method of reducing enteric emissions is available adoption of which would not damage animal health, public health, or consumer acceptance. A June 2021 Draft Analysis on the Progress Toward Achieving the 2030 Dairy and Livestock Sector Methane Emissions Target projected that current activities will achieve slightly over half of the annual methane emission reductions required by SB 1383 (2016) due to market, technical, and other barriers signifying the need for significant investment to almost double emission reduction projects by 2030.ii It remains unclear whether CARB will enact regulations in 2024 to achieve these reductions. CARB regulation will likely preempt local authority action but the current state offers an opportunity for local regulation unless, and until, CARB acts.
AB 32 (2006) and SB 32 (2016) authorized programs do not directly regulate agricultural land use, onsite agriculture GHG emission (excluding off-road emissionsiii), require carbon sequestration, or require carbon removal on working agricultural lands. However, Executive Order B-55-18’s incorporates agricultural working lands in the underdevelopment 2022 AB 32 Scoping Plan update to address the carbon neutrality by 2045 target. Executive Order N-82-20’s language regarding biodiversity, 30% land and coastal water conservation, acceleration of natural carbon sequestration and climate resiliency on natural and working lands, and creation of the Natural and Working Lands Climate Smart Strategy — including setting a statewide target to meet the 2045 carbon neutrality goal — will further focus efforts on agricultural land. SB 27 (2021), where the legislature codified part of Executive Order N-82-20, mandates a Natural and Working Land Climate Smart Strategy to achieve California’s climate goals. It
i City of Oceanside, Oceanside Climate Action Plan, 2019, p. 3-41: https://www.ci.oceanside.ca.us/civicax/filebank/blobdload.aspx?blobid=48919. ii CARB, Draft Analysis on the Progress Toward achieving the 2030 Dairy and Livestock Sector Methane Emissions Target (June 2021), p. ES-2 & 8: https://ww2.arb.ca.gov/sites/default/files/2021-06/draft-2030-dairy-livestock-ch4-analysis.pdf. iii See CARB Funding Agricultural Replacement Measures for Emission Reductions: https://ww2.arb.ca.gov/our-work/programs/farmer-program.

526
also requires CARB to set CO2 removal targets for 2030 under its Scoping Plan for all emission sectors, including agriculture. Finally, SB 27 (2021) mandates will drive climate action on agriculture land through the creation of a carbon removal and sequestration registry to identify, list, fund projects by state agencies and private entities, and retire projects.
These efforts will further support existing agriculture preservation statutes in the coastal zonei, the long-term productivity of soilii, and under the Williamson Act (California’s primary agricultural preservation statute).iii It will also likely affect CEQA analysis on land conversion and agricultural land preservation mitigation.
Previously, the 2017 AB 32 Scoping Plan sought to address GHG emissions from agriculture from energy use, methane, and N2Oiv with the objective of maintaining agriculture “land as carbon sinks (i.e., net zero or negative GHG emissions) and, where appropriate, minimize the net GHG and black carbon associated with management, biomass utilization, and wildfire events”v out to 2030 as it predated the 2018 executive order for carbon neutrality. Actions from the 2017 AB 32 Scoping Plan specific to agriculture included:
● Protecting land from conversion to more intense uses by increasing conservation and supporting local land use planning processes in urban and infrastructure development that avoid greenfield development (including SB 375 (2008) Sustainable Communities Strategies in the Regional Transportation Plan and SB 743 (2013) CEQA VMT requirements under CEQA);
● Enhance resiliency of and potential for carbon sequestration on lands through management and restoration; and
● Innovate biomass utilization for harvested excess agricultural biomass to advance statewide objectives in renewable energy and fuels, agricultural markets, and soil health.vi
The April 2019 CARB NWL Implementation Plan, informed by SB 859’s (2016) Natural and Working Land Inventory’s quantitative estimate of the existing state of ecosystem carbon stored in the State's land base (excluding GHG emissions associated from direct human activity quantified in CARB’s annual statewide GHG inventory),vii sets targets out to 2030 and pathways to scale needed implementation. Specific to agriculture, these include increasing the acreage in soil conservation practices for cultivated
i See Public Resources Code § 30000 et seq. (Coastal Act) & § 31000 et seq. (State Coastal Conservancy); Public Resources Code §§ 31050, 31051, 30241, 30114, 30243, 30108.6, 30500(c), 30200(a), 30514, 30241.5, 30241, 30250, 30610.1, 30242, 31054, 31104.1, 31150, 31151, 31152, 31156. ii Public Resources Code § 30243. iii Government Code § 51201(c); See Government Code § 51200 et seq. iv Note: the Irrigated Land Regulatory Program requires nitrogen fertilizer management to protect water quality through nitrogen management plans, which decrease N2O use on farm land and may be used to coordinate further reductions. Additional water management and water irrigation efficiency are also contributing to N2O reductions. v CARB California’s 2017 Climate Change Scoping Plan (November 2017), p. 81: https://ww2.arb.ca.gov/sites/default/files/classic/cc/scopingplan/scoping_plan_2017.pdf. vi CARB California’s 2017 Climate Change Scoping Plan (November 2017), p. 82: https://ww2.arb.ca.gov/sites/default/files/classic/cc/scopingplan/scoping_plan_2017.pdf. vii See CARB California Natural and Working Land Inventory (2018), p. 7 & 15: https://ww2.arb.ca.gov/nwl-inventory.
527
land and rangelands by five times to change agricultural land from a net emitter to a sink by 2030.i The NWL Implementation Plan also calls for increases in compost application, agroforestry, grazing land and grassland management, and cropland management to decrease emissions and increase carbon sequestration.ii
SB 859 (2016) established the Department of Food and Agriculture Healthy Soil Program (HSP) to provide incentives (including loans, grants, and research), technical assistance, and education research to farmers whose practices contribute to healthy soils, as defined, and result in net long-term on-farm GHG benefits with GHG reductions quantified using CARB methodologies. The HSP is also authorized to pilot demonstration projects to further its goals. To date, the Program received $40.1 million in California Climate Investment (CCI) (e.g., cap-and-trade proceeds) from 2016–2019, $10 million from SB 5 (De León, Chapter 852, Statutes of 2017) California Drought, Water, Parks, Climate, Coastal Protection, and Outdoor Access For All Act of 2018, and was accepting applications for 2021 with $50 million from the State General Fund and $25 million from the California Climate Investments for the Healthy Soils Program per SB 170 (Skinner, Chapter 240, Statutes of 2021) authorized by the Budget Act of 2021.iii Additional funding with impacts on GHG emissions include:
● $100 million through Fiscal Year 2022–2023 for the State Water Efficiency Enhancement Program (SWEEP);
● $160 million through Fiscal Year 2022–2023 for the Healthy Soil Program (HSP); ● $80 million through Fiscal Year 2022–2023 for the Dairy Digestor Research &
Development Program (DDRDP) & Alternative Manure Management Program (AMMP); ● $39 million through Fiscal Year 2022–2023 for the Conservation Agriculture Planning
Grant Program; and ● $5 million through Fiscal Year 2021–2022 for the Water Efficiency Technical Assistance
Grant.iv
Two other CEC operate programs fund GHG reduction activities on agricultural land. The Food Production Investment Program provides grants through the CCI to help food processors save energy and money while reducing GHG emissions through energy efficiency and renewable energy technology.v The Renewable Energy for Agriculture Program (REAP)vi offers grants that encourage the installation of renewable energy technology to reduce GHG emissions from agriculture operations, including solar PV
i See January 2019 Draft California 2030 Natural and Working Lands Climate Change Implementation Plan (Updated January 2019), p. 13: https://ww2.arb.ca.gov/sites/default/files/2020-10/draft-nwl-ip-040419.pdf. ii See January 2019 Draft California 2030 Natural and Working Lands Climate Change Implementation Plan (Updated January 2019), p. 17: https://ww2.arb.ca.gov/sites/default/files/2020-10/draft-nwl-ip-040419.pdf. iii See Department of Food and Agriculture, The Office of Environmental Farming and Innovation, Healthy Soil Program (last visited November 30, 2021): https://www.cdfa.ca.gov/oefi/healthysoils/. iv See California Department of Food and Agriculture, The Office of Environmental Farming and Innovation (last visiting on November 30, 2021): https://www.cdfa.ca.gov/oefi/. v See CEC Food Production Investment Program (last visited November 30, 2021): https://www.energy.ca.gov/programs-and-topics/programs/food-production-program. vi See CEC Renewable Energy For Agriculture Program (last visited on November 30, 2021): https://www.energy.ca.gov/programs-and-topics/programs/renewable-energy-agriculture-program.

528
systems, wind turbines, biomass-to-energy generation, or other commercially viable renewable energy technology.i It is unclear whether there is additional funding for these programs.
i The program was authorized with the passage of AB 109 (Ting, Budget Act of 2017, Chapter 249, Statutes of 2017) and SB 856 (Budget and Fiscal Review Committee, Chapter 30, Statutes of 2018). The program is receiving $10 million from the Greenhouse Gas Reduction Fund.