Appendix U16 - Riding to 2050 - San Diego Regional Bike Plan
268
Appendix U16 Active Transportation Implementation Strategy Appendix U16 Contents Background Goals and Objectives Incorporating Active Transportation into San Diego Forward: The Regional Plan Attachments: 1. Riding to 2050: The San Diego Regional Bicycle Plan 2. Bicycle Plan Project Prioritization Criteria 3. Safe Routes to Transit Methodology 4. Safe Routes to Transit Typology Prototypes 5. San Diego Regional Safe Routes to School Strategic Plan
-
Upload
khangminh22 -
Category
Documents
-
view
4 -
download
0
Transcript of Appendix U16 - Riding to 2050 - San Diego Regional Bike Plan
Appendix U16 Active Transportation Implementation Strategy
Appendix U16 Contents
Background Goals and Objectives Incorporating Active Transportation into San Diego Forward: The
Regional Plan Attachments: 1. Riding to 2050: The San Diego Regional Bicycle Plan 2. Bicycle Plan Project Prioritization Criteria 3. Safe Routes to Transit Methodology 4. Safe Routes to Transit Typology Prototypes 5. San Diego Regional Safe Routes to School Strategic Plan

Appendix U16 :: Active Transportation Implementation Strategy 1
Active Transportation Implementation Strategy The Active Transportation Implementation Strategy outlines a program for broad, regionwide implementation of
active transportation that includes walking, biking, Safe Routes to Transit, and Safe Routes to School improvements.
The Strategy is focused on incorporating active transportation into San Diego Forward: The Regional Plan (Regional
Plan), in addition to further defining SANDAG active transportation planning and implementation work in the region.
Background On October 28, 2011, the SANDAG Board of Directors approved the 2050 Regional Transportation Plan/Sustainable
Communities (2050 RTP/SCS) for the San Diego region. In response to public comment on its final action on the
2050 RTP/SCS, the SANDAG Board of Directors committed to undertaking six specific actions prior to approval of the
next RTP/SCS, including preparation of an Active Transportation Implementation Strategy, and development of a
Regional Bike Plan Early Action Program. These commitments were an integral part of the work program for the
Regional Plan.
The Active Transportation Implementation Strategy builds on Riding to 2050: The San Diego Regional Bicycle Plan
(Bike Plan), adopted by the SANDAG Board of Directors in 2010, and the Regional Bicycle Plan Early Action Program
(Bike Plan EAP), adopted by the SANDAG Board of Directors in 2013.
Riding to 2050: The San Diego Regional Bicycle Plan
In 2010, the SANDAG Board of Directors approved Riding to 2050: The San Diego Regional Bicycle Plan. The Bike Plan
was developed to support implementation of both the Regional Comprehensive Plan and the 2050 RTP/SCS, both of
which call for more transportation options and a balanced regional transportation system that supports smart growth
and a more sustainable region. In 2011, the SANDAG Board of Directors approved a set of actions for initial
implementation of the Bike Plan, including implementation of the highest priority projects identified in the plan, and
development of programs to support the plan, such as Safe Routes to Transit, data collection and modeling,
development of regional wayfinding signage guidelines, and development of an approach to address bike parking
needs. This was followed by adoption of the Regional Bike Plan Early Action Program in 2013, as described below.
The Bike Plan is included as Attachment 1.
The Regional Bike Plan Early Action Program
On September 27, 2013, the SANDAG Board of Directors approved the Regional Bike Plan Early Action Program – a
$200 million initiative to expand the Regional Bike Network regionwide and finish high-priority projects within a
decade. The adopted Bike Plan EAP comprises 38 projects, totaling roughly 77 miles of new bikeways that will make it
much easier for people to ride their bikes to school, work, transit stations, and other major destinations. The Bike Plan
EAP is funded by TransNet, the regional half-cent sales tax for transportation approved by San Diego County voters.
TransNet funding will be leveraged to bring in state and federal dollars so the region can complete more bike projects
and reap even greater economic, health, and mobility benefits. In presenting the Bike Plan EAP to the Board for
consideration, a second set of high priority projects (also with an approximate cost of $200 million) was identified.
These projects are included in the Revenue Constrained network of San Diego Forward: The Regional Plan.
Goals and Objectives The Sustainable Communities Strategy included in the Regional Plan outlines five strategies around which it is
organized. One of these strategies serves as an overarching goal for the Active Transportation Implementation
Strategy: Invest in a transportation network that gives people transportation choices and reduces greenhouse gas
emissions.

2 San Diego Forward: The Regional Plan
Four primary objectives for the Strategy were outlined in a framework set by the SANDAG Transportation Committee
on April 19, 2013, focused on incorporating active transportation into the Regional Plan:
1. Implement the Bike Plan and EAP
2. Enhance bike and pedestrian access to public transit
3. Improve bike and pedestrian safety at highway interchanges
4. Connect regional transportation investments to schools
SANDAG identified active transportation components associated with transit and freeway corridor projects for
consideration in the Regional Plan. This approach will help to maximize investments in transit and highway
infrastructure, by enhancing safety, and improving bike and pedestrian access to transit.
Accordingly, the Strategy includes the following specific approaches that have been incorporated into the Regional
Plan:
• San Diego Regional Bike Plan: Inclusion of all Regional Bike Plan projects in the regional transportation network
• Safe Routes to Transit: New transit projects include bike and pedestrian access improvements at stations and the
station area, including improved access to nearby schools and commercial and residential areas.
• Safety at Highway Interchanges: New highway interchange projects include bike and pedestrian improvements.
• Safe Routes to School: As Safe Routes to Transit, Safety at Highway Interchanges, and Regional Bike Plan projects
are implemented, Safe Routes to School improvements will also be considered in the project planning when the
project area includes schools.
• Retrofits: Identification of bike and pedestrian improvement needs at existing transit station areas and highway
interchanges.
Finally, the Strategy outlines steps toward implementation, including Regional Bike Plan EAP implementation, Safe
Routes to Transit project planning and implementation, development of a matrix that identifies implementation and
coordination opportunities, and programs that support implementation of the San Diego Regional Bike Plan:
education and outreach programs such as GoByBike, development of regional bike wayfinding signage guidelines,
and data-related activities such as project evaluation, modeling, and monitoring.
Incorporating Active Transportation into San Diego Forward: The Regional Plan Developing an Active Transportation Network and Measuring Performance
The Regional Plan represents the first time that an Active Transportation Network has been included in the Regional
Transportation Plan. The Network includes two major components: (1) The Regional Bike Network included in Riding
to 2050: The San Diego Regional Bicycle Plan; and (2) active transportation improvements that are integrated into
transit and highway projects from the Transit Network and Highway Network. The resulting Revenue Constrained
Active Transportation Network is shown in Figure U16.1, and the Revenue Unconstrained Active Transportation
Network is shown in Figure U16.2.

Pauma and YuimaReservation
RinconReservation
Sycuan Reservation
BaronaReservation
Jamul IndianVillage
Mesa GrandeReservation
PalaReservation
Santa YsabelReservation
La JollaReservation
San PasqualReservation
Capitan GrandeReservation
Oceanside
Carlsbad
Encinitas
DelMar
SolanaBeach
Poway
SanDiego
Coronado
ImperialBeach
LaMesa
Santee
El Cajon
Escondido
Vista
SanMarcos
ChulaVista
Tijuana, B.C.
UNITED STATES
MEXICO
NationalCity
County of San Diego
Camp Pendleton
San Diego
LemonGrove
905
54
805
5
282
163
94
15
15
56
78
67
8
125
75
94
52
76
11
1
2-D
21-D
5
5
5
15
805
76
78
78
6752
8
125
125
San Diego RegionMap Area
MILES
KILOMETERS
Class I - Bike Path
Cycle Track
Bike Boulevard
Enhanced Class II - Bike Lane
Enhanced Class III - Bike Route
Freeways and Highways
Regional Arterials
Safe Routes to Transit
Bicycle/Pedestrian Improvements at Freeway Interchanges
3481
Figure U16.1
2050 Revenue ConstrainedActive TransportationNetworkOctober 2015
Appendix U16 :: Active Transportation Implementation Strategy 3

San Diego RegionMap Area
3480
Figure U16.2
2050 UnconstrainedActive TransportationNetworkOctober 2015
Pauma and YuimaReservation
RinconReservation
Sycuan Reservation
BaronaReservation
Jamul IndianVillage
Mesa GrandeReservation
PalaReservation
Santa YsabelReservation
La JollaReservation
San PasqualReservation
Capitan GrandeReservation
Oceanside
Carlsbad
Encinitas
DelMar
SolanaBeach
Poway
SanDiego
Coronado
ImperialBeach
LaMesa
Santee
El Cajon
Escondido
Vista
SanMarcos
ChulaVista
Tijuana, B.C.
UNITED STATES
MEXICO
NationalCity
County of San Diego
Camp Pendleton
San Diego
LemonGrove
905
54
805
5
282
163
94
15
15
56
78
67
8
125
75
94
52
76
11
1
2-D
21-D
5
5
5
15
805
76
78
78
6752
8
125
125
MILES
KILOMETERS
Class I - Bike Path
Cycle Track
Bike Boulevard
Enhanced Class II - Bike Lane
Enhanced Class III - Bike Route
Freeways and Highways
Regional Arterials
Safe Routes to Transit
Bicycle/Pedestrian Improvements at Freeway Interchanges
Safe Routes to Transit Retrofits
Bicycle/Pedestrian Improvements/Retrofits
4 San Diego Forward: The Regional Plan

Appendix U16 :: Active Transportation Implementation Strategy 5
The Regional Bike Network
Riding to 2050: The San Diego Regional Bicycle Plan identified a connected network of bike facilities to provide access
throughout the region. This network built upon existing regional Class I facilities and was expanded to improve access
in the most urbanized transportation corridors of the region. These Bike Plan projects form the basis for the Active
Transportation Network in the Regional Plan. The Bike Plan projects included in the Regional Plan fall into three
categories and are phased accordingly in the Regional Plan:
1. Adopted Bike Plan EAP projects: phased through 2025 (included in the 2020 and 2035 Regional Plan phased
years)
These represent the 38 projects approved by the Board in 2013 for implementation over the next ten years. Cost
estimates for these projects were completed in preparation of the EAP.
2. Other Bike Plan EAP projects: phased through 2035
These represent the next 38 projects presented to the Board in 2013 for consideration as part of the EAP, but not
included as part of the original $200 million EAP adoption. Cost estimates for these projects were completed in
preparation of the Bike Plan EAP.
3. Regional Bike Plan projects not included in the Bike Plan EAP: phased to 2050
These represent the projects that were identified in Riding to 2050: The Regional Bicycle Plan as part of the
Regional Bike Network, but were not included in the EAP. Cost estimates for these projects were developed using
the EAP per-mile cost assumptions based on facility type.
Figure U16.3 and Figure U16.4 show the 2012 Regional Bike Network (Figure U16.3), compared to full build-out by
2050 (Figure U16.4).
Integration with Transit and Highway Projects
In addition to the corridors identified in the Regional Bike Plan, access to and from transit stations, and safety when
traversing highway interchange areas, represent critical areas of need for people who walk or bike. A key step in
developing the Strategy was to identify active transportation improvements for the Regional Plan. The identification of
these improvements helps to define areas of regional significance with respect to active transportation, and capitalizes
on the opportunity to build active transportation improvements into transit and highway projects.
To this end, two types of active transportation projects were identified in developing the Active Transportation
Network for the Regional Plan:
(1) New Safe Routes to Transit and Freeway Interchange Projects: Revenue Constrained
These consist of active transportation improvements in new transit and highway corridor project areas included in
the Regional Plan. These projects were identified in conjunction with the Revenue Constrained Transit and
Highway Networks – each active transportation improvement project was identified as part of the transit and
highway projects. These transit or highway projects were identified as “parent” projects to which the active
transportation improvements would be coupled. As such, phasing of the active transportation improvements
follows the phasing of the parent transit or highway project. Cost estimates for the Safe Routes to Transit projects
are described in the Safe Routes to Transit section that follows. Costs for the bike and pedestrian improvements
at freeway interchanges are assumed as part of the parent freeway project cost.1 Revenue Constrained Safe
Routes to Transit projects are shown on Figure U16.5, and Revenue Constrained Freeway Interchange projects are
shown on Figure U16.6.
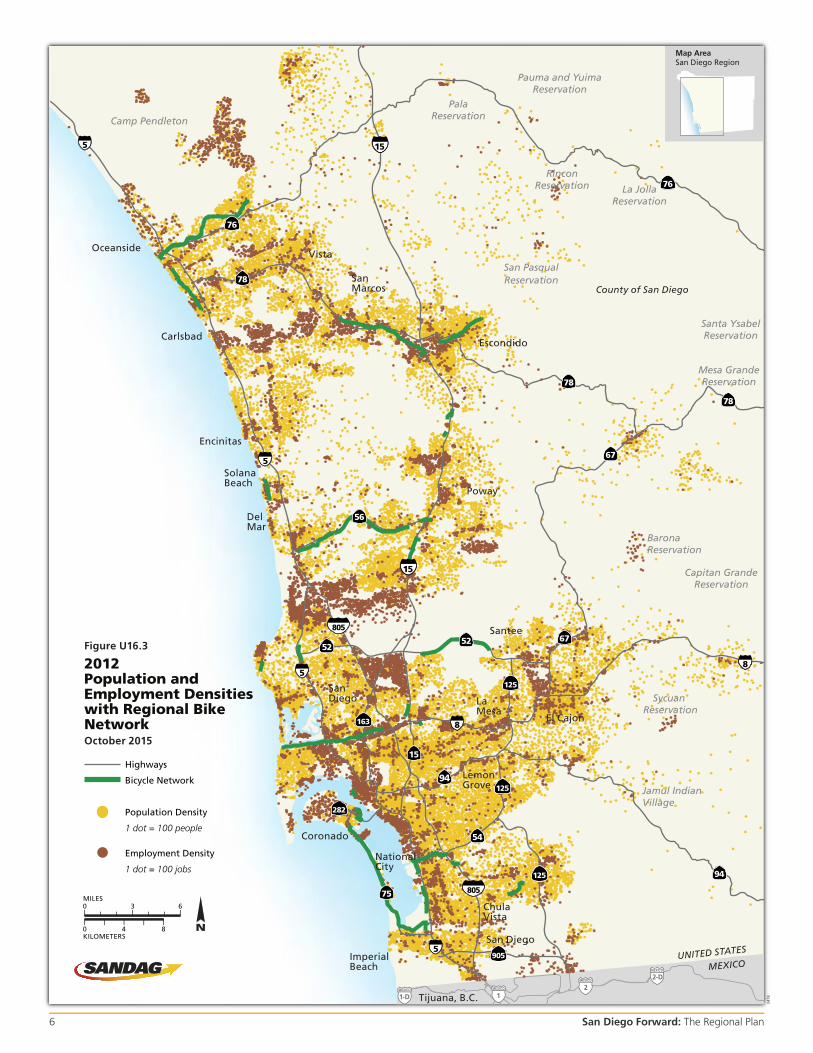
Figure U16.3
2012 Population and Employment Densities with Regional BikeNetworkOctober 2015
Highways
Bicycle Network
Population Density
1 dot = 100 people
Employment Density
1 dot = 100 jobs
3478
MILES
KILOMETERS
905
54
805
5
282
163
94
15
15
56
78
67
8
125
75
94
52
76
1
2-D
21-D
5
5
5
15
805
76
78
78
6752
8
125
125
Oceanside
Carlsbad
Encinitas
DelMar
SolanaBeach
Poway
SanDiego
Coronado
ImperialBeach
LaMesa
Santee
El Cajon
Escondido
Vista
SanMarcos
ChulaVista
Tijuana, B.C.
UNITED STATES
MEXICO
NationalCity
County of San Diego
San Diego
Camp Pendleton
Pauma and YuimaReservation
RinconReservation
Sycuan Reservation
BaronaReservation
Jamul IndianVillage
Mesa GrandeReservation
PalaReservation
Santa YsabelReservation
La JollaReservation
San PasqualReservation
Capitan GrandeReservation
LemonGrove
San Diego RegionMap Area
6 San Diego Forward: The Regional Plan

Pauma and YuimaReservation
RinconReservation
Sycuan Reservation
BaronaReservation
Jamul IndianVillage
Mesa GrandeReservation
PalaReservation
Santa YsabelReservation
La JollaReservation
San PasqualReservation
Capitan GrandeReservation
Oceanside
Carlsbad
Encinitas
DelMar
SolanaBeach
Poway
SanDiego
Coronado
ImperialBeach
LaMesa
Santee
El Cajon
Escondido
Vista
SanMarcos
ChulaVista
Tijuana, B.C.
UNITED STATES
MEXICO
NationalCity
County of San Diego
Camp Pendleton
San Diego
LemonGrove
905
54
805
5
282
163
94
15
15
56
78
67
8
125
75
94
52
76
11
1
2-D
21-D
5
5
5
15
805
76
78
78
6752
8
125
125
San Diego RegionMap Area
MILES
KILOMETERS
Bike Network
Freeways and Highways
3479
Figure U16.4
2050 Population and Employment Densitieswith Regional BikeNetworkOctober 2015
Population Density
1 dot = 100 people
Employment Density
1 dot = 100 jobs
Appendix U16 :: Active Transportation Implementation Strategy 7

Pauma and YuimaReservation
RinconReservation
Sycuan Reservation
BaronaReservation
Jamul IndianVillage
Mesa GrandeReservation
PalaReservation
Santa YsabelReservation
La JollaReservation
San PasqualReservation
Capitan GrandeReservation
Oceanside
Carlsbad
Encinitas
DelMar
SolanaBeach
Poway
SanDiego
Coronado
ImperialBeach
LaMesa
Santee
El Cajon
Escondido
Vista
SanMarcos
ChulaVista
Tijuana, B.C.
UNITED STATES
MEXICO
NationalCity
County of San Diego
Camp Pendleton
San Diego
LemonGrove
905
54
805
5
282
163
94
15
15
56
78
67
8
125
75
94
52
76
11
1
2-D
21-D
5
5
5
15
805
76
78
78
6752
8
125
125
San Diego RegionMap Area
MILES
KILOMETERS
Freeways and Highways
Regional Arterials
Safe Routes to Transit
3482
Figure U16.5
2050Revenue Constrained Safe Routes toTransit ImprovementsOctober 2015
8 San Diego Forward: The Regional Plan

Pauma and YuimaReservation
RinconReservation
Sycuan Reservation
BaronaReservation
Jamul IndianVillage
Mesa GrandeReservation
PalaReservation
Santa YsabelReservation
La JollaReservation
San PasqualReservation
Capitan GrandeReservation
Oceanside
Carlsbad
Encinitas
DelMar
SolanaBeach
Poway
SanDiego
Coronado
ImperialBeach
LaMesa
Santee
El Cajon
Escondido
Vista
SanMarcos
ChulaVista
Tijuana, B.C.
UNITED STATES
MEXICO
NationalCity
County of San Diego
Camp Pendleton
San Diego
LemonGrove
905
54
805
5
282
163
94
15
15
56
78
67
8
125
75
94
52
76
11
1
2-D
21-D
5
5
5
15
805
76
78
78
6752
8
125
125
San Diego RegionMap Area
MILES
KILOMETERS
Freeways and Highways
Regional Arterials
Bicycle/Pedestrian Improvements at Freeway Interchanges
3484
Figure U16.6
2050 RevenueConstrained Bicycle PedestrianImprovements atFreeway InterchangesOctober 2015
Appendix U16 :: Active Transportation Implementation Strategy 9
10 San Diego Forward: The Regional Plan
(2) Retrofit Safe Routes to Transit and Freeway Interchange Projects: Revenue Unconstrained
These consist of active transportation improvement projects in existing regional transit station areas and in areas
surrounding existing highway on-/off-ramps. These projects were identified by staff at the Metropolitan Transit
System and the North County Transit District in the case of the Safe Routes to Transit projects, and by Caltrans
staff in the case of the freeway interchange area projects. Safe Routes to Transit retrofit projects were estimated
to range from $186,000 to $7.5 million per stop area or station area, and are shown on Figure U16.7. Freeway
interchange retrofit projects were estimated to range from $500,000 to $3 million per interchange area, and are
shown on Figure U16.8.
Modeling Enhancements
To more accurately provide information about the Active Transportation Network projects, SANDAG developed active
transportation enhancements to the Activity-Based Model (ABM). In the absence of these enhancements, the ABM
would not be able to demonstrate any impacts resulting from the investment in bike or pedestrian infrastructure.
More information on the active transportation model enhancements can be found in Appendix T: SANDAG Travel
Demand Model Documentation.
Development of evaluation criteria and performance measures
Development of an Active Transportation Network for the first time in the Regional Plan required development of
criteria and performance measures to evaluate active transportation projects and transportation network scenarios
across all modes. SANDAG developed a set of criteria for evaluating Active Transportation Network projects. These
criteria can be found in Appendix M. However, the active transportation enhancements to the ABM could not be
developed in time for use with the criteria, so the Active Transportation Network project prioritization followed that of
Riding to 2050: The San Diego Regional Bicycle Plan. The criteria used in the Regional Bike Plan for project
prioritization can be found in Attachment 2. Additionally, in developing performance measures for evaluation of
network performance across all modes among various scenarios, SANDAG also included active transportation-related
measures, which were modeled using the ABM.
Safe Routes to Transit Planning SANDAG developed a framework for understanding potential Safe Routes to Transit needs, project types, and costs
throughout the region. The methodology (included as Attachment 3) describes how this framework was developed to
capture the land use and transportation network context surrounding transit stations. These varying contexts help to
determine the types of improvements and associated costs that could be included in Safe Routes to Transit projects
for such transit station area types. Each transit stop and station area in the region has been classified into a
Safe Routes to Transit typology, based on Smart Growth Opportunity Area place type and intersection density. The
typology prototypes can be found in Attachment 4.
Each new Safe Routes to Transit project area identified in the Regional Plan was assigned a typology according to the
framework described above. Cost estimates for each Safe Routes to Transit project were developed using the cost
estimates for the project’s respective typology.
Safe Routes to School Implementation Safe Routes to School refers to a spectrum of programs and built environment improvements used together to foster
opportunities for students to walk and bike to school safely and routinely. In 2012, the SANDAG Board of Directors
adopted the San Diego Regional Safe Routes to School Strategic Plan (Attachment 5). The Plan identifies a strategy to
support local communities in establishing new Safe Routes to School programs, as well as sustaining and enhancing
existing efforts.

Pauma and YuimaReservation
RinconReservation
Sycuan Reservation
BaronaReservation
Jamul IndianVillage
Mesa GrandeReservation
PalaReservation
Santa YsabelReservation
La JollaReservation
San PasqualReservation
Capitan GrandeReservation
Oceanside
Carlsbad
Encinitas
DelMar
SolanaBeach
Poway
SanDiego
Coronado
ImperialBeach
LaMesa
Santee
El Cajon
Escondido
Vista
SanMarcos
ChulaVista
Tijuana, B.C.
UNITED STATES
MEXICO
NationalCity
County of San Diego
Camp Pendleton
San Diego
LemonGrove
905
54
805
5
282
163
94
15
15
56
78
67
8
125
75
94
52
76
11
1
2-D
21-D
5
5
5
15
805
76
78
78
6752
8
125
125
San Diego RegionMap Area
MILES
KILOMETERS
Freeways and Highways
Regional Arterials
Safe Routes to Transit Retrofits
3483
Figure U16.7
2050 Unconstrained Safe Routes to TransitRetrofitsOctober 2015
Appendix U16 :: Active Transportation Implementation Strategy 11

Pauma and YuimaReservation
RinconReservation
Sycuan Reservation
BaronaReservation
Jamul IndianVillage
Mesa GrandeReservation
PalaReservation
Santa YsabelReservation
La JollaReservation
San PasqualReservation
Capitan GrandeReservation
Oceanside
Carlsbad
Encinitas
DelMar
SolanaBeach
Poway
SanDiego
Coronado
ImperialBeach
LaMesa
Santee
El Cajon
Escondido
Vista
SanMarcos
ChulaVista
Tijuana, B.C.
UNITED STATES
MEXICO
NationalCity
County of San Diego
Camp Pendleton
San Diego
LemonGrove
905
54
805
5
282
163
94
15
15
56
78
67
8
125
75
94
52
76
11
1
2-D
21-D
5
5
5
15
805
76
78
78
6752
8
125
125
San Diego RegionMap Area
MILES
KILOMETERS
Freeways and Highways
Regional Arterials
Bicycle/Pedestrian Improvements/Retrofits
3485
Figure U16.8
2050 Unconstrained Bicycle/PedestrianImprovements atFreeway InterchangesRetrofits October 2015
12 San Diego Forward: The Regional Plan

Appendix U16 :: Active Transportation Implementation Strategy 13
Additional opportunities for Safe Routes to School implementation can be found in the integration of Safe Routes to
School into SANDAG project planning. When Regional Bike Plan, Safe Routes to Transit, and bike/pedestrian
improvements at freeway interchange projects include schools in their project areas, plans will include improvements
to enhance school access and safety whenever possible.

14 San Diego Forward: The Regional Plan
Endnotes 1 Caltrans Deputy Directive DD-64-R1 Complete Streets – Integrating the Transportation System requires that bike, pedestrian, and transit user
needs are addressed and deficiencies identified during system and corridor planning, project initiation, scoping, and programming.

riding to 2050san diego regional bike plan
Attachment 1 :: Riding to 2050: The San Diego Regional Bicycle Plan 15
401 B Street, Suite 800 • San Diego, CA 92101-4231 • (619) 699-1900
SAN DIEGO
REGIONAL BICYCLE PLAN
Riding to 2050
Attachment 1 :: Riding to 2050: The San Diego Regional Bicycle Plan 16

BOARD OF DIRECTORS
The 18 cities and county government are SANDAG serving as the forum for regional decision-making. SANDAG builds consensus; plans, engineers, and builds public transit; makes strategic plans; obtains and allocates resources; and provides information on a
broad range of topics pertinent to the region’s quality of life.
CHAIR Hon. Lori Holt Pfeiler
FIRST VICE CHAIR Hon. Jerome Stocks
SECOND VICE CHAIR Hon. Jack Dale
EXECUTIVE DIRECTOR Gary L. Gallegos
CITY OF CARLSBAD Hon. Matt Hall, Councilmember (A) Hon. Bud Lewis, Mayor (A) Hon. Ann Kulchin, Mayor Pro Tem CITY OF CHULA VISTA Hon. Cheryl Cox, Mayor (A) Hon. Rudy Ramirez, Deputy Mayor (A) Hon. Steve Castaneda, Councilmember CITY OF CORONADO Hon. Carrie Downey, Mayor Pro Tem (A) Hon. Al Ovrom, Councilmember (A) Hon. Michael Woiwode, Councilmember CITY OF DEL MAR Hon. Crystal Crawford, Councilmember (A) Hon. Mark Filanc, Councilmember (A) Hon. Richard Earnest, Mayor CITY OF EL CAJON Hon. Mark Lewis, Mayor (A) Hon. Jillian Hanson-Cox, Councilmember CITY OF ENCINITAS Hon. Jerome Stocks, Councilmember (A) Hon. Teresa Barth, Councilmember (A) Hon. Dan Dalager, Mayor CITY OF ESCONDIDO Hon. Lori Holt Pfeiler, Mayor (A) Hon. Sam Abed, Councilmember CITY OF IMPERIAL BEACH Hon. Jim Janney, Mayor (A) Hon. Patricia McCoy, Mayor Pro Tem (A) Hon. Jim King, Councilmember CITY OF LA MESA Hon. Art Madrid, Mayor (A) Hon. Mark Arapostathis, Councilmember (A) Hon. David Allan, Vice Mayor CITY OF LEMON GROVE Hon. Mary Teresa Sessom, Mayor (A) Hon. Jerry Jones, Mayor Pro Tem (A) Hon. Jerry Selby, Councilmember CITY OF NATIONAL CITY Hon. Ron Morrison, Mayor (A) Vacant (A) Hon. Rosalie Zarate, Councilmember CITY OF OCEANSIDE Hon. Jim Wood, Mayor (A) Hon. Jerry Kern, Councilmember (A) Hon. Jack Feller, Councilmember CITY OF POWAY Hon. Don Higginson, Mayor (A) Hon. Jim Cunningham, Councilmember (A) Hon. Carl Kruse, Deputy Mayor CITY OF SAN DIEGO Hon. Jerry Sanders, Mayor (A) Hon. Anthony Young, Councilmember (A) Hon. Sherri Lightner, Councilmember Hon. Ben Hueso, Council President (A) Hon. Marti Emerald, Councilmember (A) Hon. Todd Gloria, Councilmember CITY OF SAN MARCOS Hon. Jim Desmond, Mayor (A) Hon. Hal Martin, Vice Mayor (A) Hon. Rebecca Jones, Councilmember
CITY OF SANTEE Hon. Jack Dale, Councilmember (A) Hon. Hal Ryan, Councilmember (A) Hon. John Minto, Councilmember CITY OF SOLANA BEACH Hon. Lesa Heebner, Deputy Mayor (A) Hon. Dave Roberts, Councilmember (A) Hon. Mike Nichols, Councilmember CITY OF VISTA Hon. Judy Ritter, Mayor Pro Tem (A) Hon. Bob Campbell, Councilmember (A) Hon. Steve Gronke, Councilmember COUNTY OF SAN DIEGO Hon. Pam Slater-Price, Chairwoman (A) Hon. Greg Cox, Supervisor (A) Hon. Ron Roberts, Chair Pro Tem Hon. Bill Horn, Vice Chair (A) Hon. Dianne Jacob, Supervisor IMPERIAL COUNTY (Advisory Member) Hon. Wally Leimgruber, District 5 Supervisor (A) Hon. David Ouzan, Councilmember CALIFORNIA DEPARTMENT OF TRANSPORTATION (Advisory Member) Vacant, Director (A) Laurie Berman, District 11 Director METROPOLITAN TRANSIT SYSTEM
(Advisory Member) Harry Mathis, Chairman (A) Hon. Ron Roberts (A) Hon. Jerry Selby NORTH COUNTY TRANSIT DISTRICT
(Advisory Member) Hon. Bob Campbell, Chairman (A) Hon. Carl Hilliard, Planning Committee Chair (A) Hon. Dave Roberts, Monitoring Committee Chair U.S. DEPARTMENT OF DEFENSE (Advisory Member) CAPT Keith Hamilton, USN, CEC, Southwest Division Naval Facilities Engineering Command (A) CAPT James W. Wink, USN, CEC Southwest Division Naval Facilities Engineering Command SAN DIEGO UNIFIED PORT DISTRICT (Advisory Member) Scott Peters, Commissioner (A) Stephen Padilla, Commissioner SAN DIEGO COUNTY WATER AUTHORITY
(Advisory Member) Mark Muir, Director (A) Howard Williams, Director (A) Gary Croucher, Director SOUTHERN CALIFORNIA TRIBAL
CHAIRMEN’S ASSOCIATION
(Advisory Member) Hon. Edwin 'Thorpe' Romero, Barona Band of Mission Indians Hon. Allen Lawson, San Pasqual Band of Dieguieño Indians (A) Denis Turner, SCTCA Executive Director MEXICO (Advisory Member) Hon. Remedios Gómez-Arnau Cónsul General of Mexico Hon. Martha E. Rosas, Deputy Cónsul General of Mexico
As of April 26, 2010
Attachment 1 :: Riding to 2050: The San Diego Regional Bicycle Plan 17

riding to 2050nnnnnnnnnnnnn
San Diego Regional Bicycle Plannnnnnnnnnnnnn
San Diego Regional Bicycle Plan Acknowledgments Many individuals aided in the preparation of material contained in this San
Diego Regional Bicycle Plan. In Particular, the cooperation and involvement
of members of various SANDAG committees and working groups are
acknowledged.
SANDAG COMMITTEES AND WORKING GROUPS Transportation Committee
Regional Planning Committee
Bicycle Pedestrian Working Group
Cities/County Transportation Advisory Committee
Regional Planning Technical Working Group
COMMUNITY BASED ORGANIZATIONS San Diego County Bicycle Coalition
SANDAG STAFF Gary Gallegos, Executive Director
Renée Wasmund, Chief Deputy Executive Director
Julie Wiley, General Counsel
Charles “Muggs” Stoll, Director of Land Use and Transportation Planning
Jim Linthicum, Director of Mobility Management and Project
Implementation
Colleen Windsor, Communications Director
Chris Kluth, Associate Transportation/Land Use Planner, Project Manager
Coleen Clementson, Principal Regional Planner
Stephan Vance, Senior Regional Planner
Susan Baldwin, Senior Regional Planner
Jack Boda, Director of Mobility Management and Project Implementation*
Attachment 1 :: Riding to 2050: The San Diego Regional Bicycle Plan 18

Nnnnnnnnnnnnnriding to 2050
nnnnnnnnnnnnnSan Diego Regional Bicycle Plan
Christine Eary, Associate Regional Planner
Maria Filippelli, Regional Planner
Andrew Gordon, Research Analyst
Carolina Gregor, Senior Regional Planner
Dean Hiatt, Senior Transportation Engineer
David Hicks, Senior Public Information Officer
Bob Leiter, Director of Land Use and Transportation Planning*
Andrew Martin, Associate Regional Planner
Dan Martin, Principal Regional Planner
Jose Nuncio, Manager of Financial Programming and Project Control
Rob Rundle, Principal Regional Planner
Alexia Spivey, Associate Contracts and Procurement Analyst
Lisa Starace, Associate Graphic Designer
Scott Strelecki, Regional Planner
Midori Wong, Regional Planner
*Retired
CONSULTANT TEAM Alta Planning + Design
Sam Corbett, Senior Associate
Bridget Enderle, Planner
Brett Hondorp, Principal
Sasha Jovanovic, Planner
Sherry Ryan, PhD, Senior Associate
CityWorks
Catherine Smith, JD
RBF Consulting
Mathew Capuzzi, PE
Henry Trang, PE
Attachment 1 :: Riding to 2050: The San Diego Regional Bicycle Plan 19

TABLE OF CONTENTS | i
riding to 2050 nnnnnnnnnnnnn
San Diego Regional Bicycle Plannnnnnnnnnnnnn
Table of Contents Executive Summary ................................................................................. 1
Bicycle Infrastructure Improvements ................................................ 1
Recommended Programs ................................................................... 2
1 Introduction ........................................................................................ 3
1.1 Setting ....................................................................................... 4
1.2 Benefits of Being a Bicycle Friendly Region ............................ 6
1.2.1 Environmental/Climate Change Benefits ................................ 6
1.2.2 Public Health Benefits ..................................................................... 6
1.2.3 Economic Benefits ............................................................................ 7
1.2.4 Community/Quality of Life Benefits .......................................... 8
1.2.5 Safety Benefits ................................................................................... 8
1.3 Role of the Regional Bicycle Plan ............................................. 8
1.4 Major Recommendations of the Plan ...................................... 9
1.4.1 Bicycle Infrastructure Improvements ........................................ 9
1.4.2 Recommended Programs ........................................................... 10
1.5 Overview of the Plan Contents .............................................. 11
2 Goals, Objectives, and Policy Actions ............................................. 13
2.1 Goals ........................................................................................ 13
2.2 Objectives and Policy Actions ................................................ 14
3 Recommended Regional Bicycle Network ...................................... 19
3.1 Existing Bikeways ................................................................... 19
3.2 Regional Bikeways in the 2030 RTP ....................................... 23
3.3 Network Planning Process ..................................................... 23
3.4 Regional Corridor Classifications .......................................... 27
Class I – Bike Path ......................................................................................... 28
Class II - Bike Lanes ...................................................................................... 28
Class III - Bike Routes ................................................................................... 28
Cycle Tracks .................................................................................................... 29
Bicycle Boulevards ....................................................................................... 29
3.5 The Regional Bicycle Network ............................................... 30
Attachment 1 :: Riding to 2050: The San Diego Regional Bicycle Plan 20
ii | TABLE OF CONTENTS
Nnnnnnnnnnnnnriding to 2050
nnnnnnnnnnnnn San Diego Regional Bicycle Plan
3.6 Priority Projects ...................................................................... 33
3.6.1 Project Prioritization Process ..................................................... 33
3.7 Regional Bicycle Parking ........................................................ 34
4 Recommended Programs ................................................................. 39
4.1 Education Programs ............................................................... 40
Complete Streets Education ..................................................................... 40
Driver’s Education & Diversion Courses ............................................... 41
Safe Routes to School – Phase 1 .............................................................. 42
Cycling Skills & Safety Courses (Adult & Youth) ................................. 44
4.2 Public Awareness Campaigns & Marketing ........................... 45
Bike to Work Month ..................................................................................... 46
Share the Road Campaign/Street Smarts ............................................ 46
Share the Path Campaign .......................................................................... 48
4.3 Encouragement Programs ...................................................... 49
Bike Sharing Program .................................................................................. 49
Pilot Smart Trips Program .......................................................................... 50
Employer Incentive Programs .................................................................. 52
Bicycle Friendly Community Designation ........................................... 53
San Diego Region Bike Map ...................................................................... 54
Identification & Way-finding Signage ................................................... 55
University-Based Bike Orientation .......................................................... 55
4.4 Enforcement Programs ........................................................... 56
Bike Patrol Units & Sting Operations ..................................................... 57
4.5 Monitoring & Evaluation ........................................................ 57
Annual Evaluation Program ...................................................................... 58
Bicycle Coordinators & Bicycle Advisory Committees (BACs) ...... 59
5 Air Quality Benefits of Regional Bicycle Network Implementation ................................................................. 61
5.1 Current System Usage ............................................................ 61
5.2 Potential Future Usage and Air Quality Benefits .................. 62
6 Implementation and Financing ....................................................... 67
6.1 Costing Methods and Estimates ............................................. 67
Attachment 1 :: Riding to 2050: The San Diego Regional Bicycle Plan 21
TABLE OF CONTENTS | iii
riding to 2050 nnnnnnnnnnnnn
San Diego Regional Bicycle Plannnnnnnnnnnnnn
6.3 Funding Sources ..................................................................... 72
6.3.1 Regional Funding Sources ......................................................... 72
6.3.2 Federal Funding Sources ............................................................ 73
6.3.3 State Funding Sources ................................................................. 76
6.4 Implementation ...................................................................... 77
6.4.1 Project Development ................................................................... 77
6.4.2 Environmental Review ................................................................. 78
6.4.3 Project Financing ........................................................................... 79
6.5 Program Monitoring ............................................................... 79
6.5.1 Regularly Revisit Project Prioritization ................................... 80
6.5.2 Update the Plan .............................................................................. 80
6.5.3 Establish Measures of Effectiveness ....................................... 80
7 Bicycle Design Guidelines ................................................................ 83
7.1 Design References .................................................................. 84
7.2 Design Principles .................................................................... 85
7.3 Standard Designs of Bicycle Facilities ................................... 85
7.4 Innovative Treatments and Signage ................................... 100
7.5 Bicycle Parking ...................................................................... 110
List of Tables Table 1.1 Existing Regional Land Uses ............................................... 4
Table 3.1 Bicycle Facilities in the Region .......................................... 20
Table 3.2 Existing Bicycle Facilities by Jurisdiction ......................... 22
Table 3.3 Regional Corridor Classification System .......................... 28
Table 3.4 Facility Type and Mileage for the Regional Bicycle Network .............................................................................. 30
Table 3.5 Land Use and Transit Targets for RCP Smart Growth Place Types ......................................................................... 34
Table 3.6 SANDAG iCommute Bike Lockers ..................................... 35
Table 5.1 Journey to Work Data ........................................................ 61
Table 5.2 Bicycle Commute and Air Quality Projections ................. 64
Attachment 1 :: Riding to 2050: The San Diego Regional Bicycle Plan 22

iv | TABLE OF CONTENTS
Nnnnnnnnnnnnnriding to 2050
nnnnnnnnnnnnn San Diego Regional Bicycle Plan
Table 6.1 Unit Costs Used for Estimating Costs of Regional Bicycle Network .............................................................................. 68
Table 6.2 Regional Bicycle Network Cost Estimate .......................... 69
Table 6.3 Active Transportation Program Funds ............................. 73
Table 6.4 Federal Transportation Enhancement Program Revenue Estimates* ........................................................................... 74
Table 6.5 Potential Measures of Effectiveness ................................. 81
List of Figures Figure 1-1: Existing Land Uses ............................................................... 5
Figure 3-1: Existing Local and Regional Bicycle Facilities in San Diego County ...................................................................... 21
Figure 3-2: Regional Bicycle Facilities (2030 RTP)............................... 24
Figure 3-3: Updated Preferred Regional Bicycle Network .................. 25
Figure 3-4: New and Realigned Corridors ........................................... 26
Figure 3-5: Regional Bicycle Network Corridor Alignments and Classifications ..................................................................... 31
Figure 3-6: Existing/Planned Facilities in Regional Corridors ............ 32
Attachment 1 :: Riding to 2050: The San Diego Regional Bicycle Plan 23

EXECUTIVE SUMMARY | 1
riding to 2050 nnnnnnnnnnnnn
San Diego Regional Bicycle Plannnnnnnnnnnnnn
Executive Summary The San Diego Regional Bicycle Plan (Plan) proposes a vision for a diverse
regional bicycle system of interconnected bicycle corridors, support
facilities, and programs to make bicycling more practical and desirable to a
broader range of people in our region. This vision is intended to guide the
development of the regional bicycle system through the year 2050.
Planning for a more bicycle friendly region helps to resolve multiple
complex and interrelated issues, including, traffic congestion, air quality,
climate change, public health, and livability. By guiding the region toward
the creation of a substantial regional bicycle network, this plan can affect all
of these issue areas, thereby improving existing and future quality of life in
the San Diego region.
The Plan outlines a range of recommendations to facilitate accomplishing
the regional goals of increasing the number of people who bike and
frequency of bicycle trips for all purposes, encouraging the development of
Complete Streets1, improving safety for bicyclists, and increasing public
awareness and support for bicycling in the San Diego region. The
recommendations include bicycle infrastructure improvements, bicycle-
related programs, implementation strategies, and policy and design
guidelines. Key recommendations are outlined below.
Bicycle Infrastructure Improvements The Plan presents an interconnected network of bicycle corridors that
would enable residents to bicycle with greater safety, directness, and
convenience within and between major regional destinations and activity
centers. The regional bicycle network consists of a combination of standard
bicycle facilities, including Class I bike paths, Class II bike lanes, and Class
III bike routes which are described and depicted in greater detail in Table
3.3. The Plan also proposes two facility types that are not defined as
bikeways by the California Department of Transportation (Caltrans) –
bicycle boulevards and cycle tracks. These two facility types will serve as
demonstration projects to study their potential to provide greater safety and
comfort to bicyclists.
1 Complete streets are designed and operated to enable safe access for all users. Pedestrians, bicyclists, motorists, and public transportation users of all ages and abilities are able to safely move along and across a complete street. – www.completestreets.org
Attachment 1 :: Riding to 2050: The San Diego Regional Bicycle Plan 24

2 | EXECUTIVE SUMMARY
Nnnnnnnnnnnnnriding to 2050
nnnnnnnnnnnnn San Diego Regional Bicycle Plan
The network selection and classification process included a public outreach
program, on-going consultation with the SANDAG Bicycle-Pedestrian
Working Group (BPWG), which is comprised of staff members from each
of the 19 local jurisdictions, as well as mapping and modeling to refine the
network and proposed bicycle facilities. To enhance the utility of the
regional bicycle network, this Plan also includes provisions for secure and
convenient bicycle parking and support facilities that encourage
transportation-based bicycle trips, and enhance access to transit.
Recommended Programs The Plan describes five categories of bicycle-related programs that are
essential facets of the overall bicycle system envisioned for the San Diego
region: education, marketing/public awareness programs, encouragement,
enforcement, and on-going monitoring. A spectrum of programs is
recommended for consideration that will require regional coordination to
successfully implement. Recommended programs include a Complete
Streets education program, Safe Routes to School programs, a Pilot Smart
Trips Program, expanded Bike to Work Month activities, a route
identification and way-finding signage program, and an annual bicycling
evaluation program.
Attachment 1 :: Riding to 2050: The San Diego Regional Bicycle Plan 25

INTRODUCTION | 3
riding to 2050 nnnnnnnnnnnnn
San Diego Regional Bicycle Plannnnnnnnnnnnnn
1 Introduction The San Diego Regional Bicycle Plan (Plan) supports implementation of
both the Regional Comprehensive Plan (RCP) and Regional Transportation
Plan (RTP),. The RCP calls for more transportation options and a balanced
regional transportation system to support smart growth and a more
sustainable region. A policy objective of the RCP is to “create more
walkable and bicycle-friendly communities consistent with good urban
design concepts.” The RTP calls for a multimodal regional transportation
network that includes a regional bicycle network. According to the RTP,
“steps to reduce peak-period travel or change when and how people travel
will become increasingly important in the future.” To achieve these
objectives the Plan sets forth a vision for a distinctive regional bicycle
system comprised of interconnected bicycle corridors, support facilities, and
programs to make bicycling more practical and desirable to a greater
number of the region’s residents and visitors. This vision is intended to
guide the future development of the regional bicycle system through the
year 2050, congruent with the forthcoming 2050 RTP.
The Plan was developed by evaluating the current regional corridor network
and programs to identify opportunities and constraints to bicycling in the
San Diego region. Policies to improve bicycling and to recommend a system
of safe, convenient, regionally significant bicycle facilities, including
standard bikeways, innovative facilities such as bicycle boulevards, bicycle
parking, and programs such as an annual evaluation program, are included
in the Plan. Recent local and regional bicycling questionnaires have found
that residents are willing to bicycle more frequently when better bicycle
facilities, support facilities and bicycle-related programs are provided2. In
Portland, Oregon, bicycle commuting doubled between 1990 and 2000,
coinciding with a 215 percent increase in the development of its bicycle
network.3
The Plan outlines the necessary steps for a phased implementation strategy
where the prioritization of projects and detailed financing options will be
undertaken in a subsequent effort that coincides with the development of
the 2050 RTP. Additionally, since bicycle transportation plays a role in
public health, reducing vehicle miles traveled (VMT), improving air quality,
and lessening the dependence on motor vehicle travel, the results of the Plan
will be incorporated into the 2050 RTP.
2San Diego Regional Bicycle Plan Survey Results; City of San Diego Bicycle Master Plan Update Bicycle Survey Results, 2009. 3 Birk, M. and Geller, R. Bridging the Gaps: How the Quality and Quantity of a Connected Bikeway Network Correlates with Increasing Bicycle Use. TRB Annual Meeting, 2006.
Attachment 1 :: Riding to 2050: The San Diego Regional Bicycle Plan 26

4 | INTRODUCTION
Nnnnnnnnnnnnnriding to 2050
nnnnnnnnnnnnn San Diego Regional Bicycle Plan
1.1 Setting The 19 local jurisdictions in the San Diego region encompass approximately
4,300 square miles of varied physical conditions. The region’s bays, lagoons,
rivers, hills, and mountains help make San Diego a unique and distinctive
region but also present challenges for bicycle travel.
In 2009, the San Diego region was home to approximately 3.2 million
people, representing a 12.8 percent increase in population since the 2000
Census.4 The region’s population has been characterized by a relatively
steady growth rate since the 1990s; it is also becoming more ethnically
diverse. The region’s population is expected to grow relatively older, with
an anticipated growth rate of 128 percent in the population segment over 65
years by the year 2030.
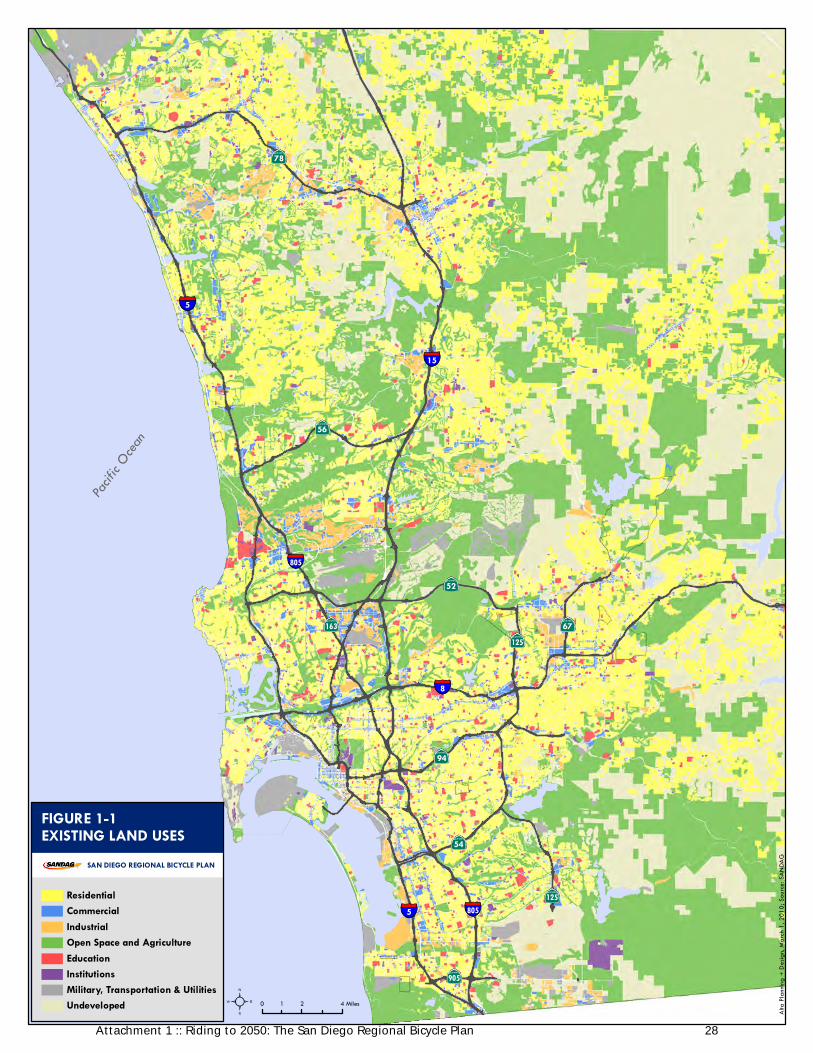
Table 1-1 shows the distribution of land use types across the region, with
roughly 12 percent residential and less than 1 percent commercial and
industrial. The largest portions of the county are parks and recreation land
and undeveloped, and which includes roadway rights-of-way and rail
rights-of-way. Figure 1-1 presents existing land uses across the region.
Table 1.1 Existing Regional Land Uses
Land Use Type Acreage Percent of TotalResidential 335,547 12.3%
Commercial & Office 17,538 0.6%
Industrial 14,977 0.5%
Public Facilities & Utilities 188,547 6.9%
Parks & Recreation 1,059,820 38.9%
Agriculture 121,793 4.5%
Undeveloped 984,180 36.1%
Other 4,897 0.2%
TOTALS 2,727,299 100%
Source: SANDAG Land Use shapefile, 2008; Alta Planning + Design,
April 2009
4 SANDAG, Current Estimates, 2009.
Attachment 1 :: Riding to 2050: The San Diego Regional Bicycle Plan 27
56
52
125
94
54
905
805
8
5
15
78
67
1258055
163
0 2 41 Miles
Pacific
Ocean
Alta P
lannin
g + D
esign
, Mar
ch 1,
2010
; Sou
rce: S
ANDA
G
FIGURE 1-1EXISTING LAND USES
ResidentialCommercialIndustrialOpen Space and AgricultureEducationInstitutionsMilitary, Transportation & UtilitiesUndeveloped
SAN DIEGO REGIONAL BICYCLE PLAN
Attachment 1 :: Riding to 2050: The San Diego Regional Bicycle Plan 28

6 | INTRODUCTION
Nnnnnnnnnnnnnriding to 2050
nnnnnnnnnnnnn San Diego Regional Bicycle Plan
1.2 Benefits of Being a Bicycle Friendly Region
Planning to create a more bicycle friendly region contributes to resolving
several complex and interrelated issues, including, traffic congestion, air
quality, climate change, public health, and livability. By guiding the region
toward bicycle friendly development, this plan can affect all of these issue
areas, which collectively can have a profound influence on the existing and
future quality of life in the San Diego region.
1.2.1 Environmental/Climate Change Benefits Replacing vehicular trips with bicycle trips has a measurable impact on
reducing human-generated greenhouse gases (GHGs) in the atmosphere
that contribute to climate change. Fewer vehicle trips and vehicle miles
traveled (VMT) translates into fewer mobile source pollutants, such as
carbon dioxide, nitrogen oxides and hydrocarbons, being released into the
air. Ground-level ozone, a byproduct of hydrocarbon emissions, has
historically been San Diego County’s greatest air pollution problem. San
Diego County exceeds the State and Federal eight-hour ozone level limits,
which also has implications for the population’s respiratory and
cardiovascular health5. While the region has made progress on reducing
ozone and other air pollutants, providing transportation options that reduce
VMT is an important component of decreasing greenhouse gas emissions
and improving the region’s air quality. Chapter five of the Plan presents a
quantitative estimate of the potential air quality benefits that will result
from increased bicycling activity associated with Plan implementation.
1.2.2 Public Health Benefits Public health professionals have become increasingly aware that the
impacts of automobiles on public health extend far beyond asthma and
other respiratory conditions caused by air pollution. There is a much deeper
understanding of the connection between the lack of physical activity
resulting from auto-oriented community designs and various health-related
problems such as obesity and other chronic diseases. Although diet and
genetic predisposition contribute to these conditions, physical inactivity is
now widely understood to play a significant role in the most common
chronic diseases in the US, including heart disease, stroke and diabetes –
each of which is a leading cause of death in San Diego County. In 2006, 25
percent of all deaths in San Diego County were caused by heart disease.
5 Air Quality in San Diego County: 2007 Annual Report. County of San Diego Air Pollution Control District, 2008.
Attachment 1 :: Riding to 2050: The San Diego Regional Bicycle Plan 29

INTRODUCTION | 7
riding to 2050 nnnnnnnnnnnnn
San Diego Regional Bicycle Plannnnnnnnnnnnnn
Stroke and diabetes were responsible for an additional nine percent of
deaths during that year.6
Physical inactivity is a primary contributor to obesity, a health concern that
can also lead to other chronic diseases such as heart disease and diabetes. In
response to these issues, the public health profession has begun to advocate
for the creation of bicycle friendly communities as one of several effective
ways to encourage active lifestyles. As the region becomes more conducive
to bicycling, the region’s population will have more opportunities to
exercise, ideally resulting in a higher proportion of the region’s residents
achieving recommended activity levels.
In addition to individual health benefits, fiscal benefits reward the entire
community through a reduction in health care costs and lost days of work.
A 2004 study found that every $1 invested in constructing multi-use paths
returns $2.94 in direct medical benefits.7
1.2.3 Economic Benefits Bicycling is economically advantageous to individuals and communities.
According to some statistics, the annual operating costs for bicycle
commuters are 1.5% to 3.5% of those for automobile commuters.8 Cost
savings associated with bicycle travel expenses are also accompanied by
potential savings in health care costs. On a community scale, bicycle
infrastructure projects are generally far less expensive than automobile-
related infrastructure. Further, shifting a greater share of daily trips to bike
trips reduces the impact on the region’s transportation system, thus
reducing the need for improvements and expansion projects. Studies have
also shown that the overall contribution of bicycling to the economy is
significant. A study conducted by the Wisconsin Department of
Transportation and Bicycle Federation of Wisconsin estimates that the
bicycle-related sector contributes $556 million to the economy annually.
This estimate does not include the economic benefits derived from bicycle
tourism, which is reported to constitute a significant portion of the state’s
$11.7 billion in the tourism sector.9 The value of the bicycle-related economy
in Portland, Oregon is estimated to be $90 million, representing a 38 percent
increase since 2006.10
6 California Department of Public Health, Center for Health Statistics, Death Statistical Master Files, 2008. 7 Wang, Guijing, et al. 2005. Cost-Benefit Analysis of Physical Activity Using Bike/Pedestrian Trails. Health Promotion Practice, Vol. 6, No. 2: 174-179. 8 Active Transportation website: http://www.activetransportation.org/costs.htm 9 The Economic Impact of Bicycling in Wisconsin. Wisconsin DOT and the Bicycle Federation of Wisconsin. 2005. 10 The Value of the Bicycle-Related Industry in Portland. Alta Planning + Design. 2008.
Attachment 1 :: Riding to 2050: The San Diego Regional Bicycle Plan 30
8 | INTRODUCTION
Nnnnnnnnnnnnnriding to 2050
nnnnnnnnnnnnn San Diego Regional Bicycle Plan
1.2.4 Community/Quality of Life Benefits Fostering conditions where bicycling is accepted and encouraged increases
a city’s livability from a number of different perspectives, that are often
difficult to measure but nevertheless important. The design, land use
patterns and transportation systems that comprise the built environment
have a profound impact on quality of life issues. Studies have found that
people living in communities with built environments that promote
bicycling and walking tend to be more socially active, civically engaged, and
are more likely to know their neighbors; whereas urban sprawl has been
correlated with social and mental health problems, including stress.11 12
Settings where walking and riding bicycles are viable also offer greater
independence to elderly people who are unable to drive automobiles. The
aesthetic quality of a community also improves when visual and noise
pollution caused by automobiles is reduced and when green space is
reserved for facilities that enable people of all ages to recreate and commute
in pleasant settings.
1.2.5 Safety Benefits Conflicts between bicyclists and motorists result from poor riding and/or
driving behavior as well as insufficient or ineffective facility design.
Encouraging development and redevelopment in which bicycle travel is
fostered improves the overall safety of the roadway environment for all
users. Well-designed bicycle facilities improve security for current cyclists
and also encourage more people to bike, which in turn, can further improve
bicycling safety. Studies have shown that the frequency of bicycle collisions
has an inverse relationship to bicycling rates – more people on bicycles
equates to fewer crashes.13 Providing information and educational
opportunities about safe and lawful interactions between bicyclists and
other roadway users likewise enhances safety.
1.3 Role of the Regional Bicycle Plan The Plan is a complementary document to the existing 2030 RTP, the
transportation component of the RCP and will be fully integrated into the
2050 RTP currently under development. The RCP establishes a vision for
transportation in the region. A part of this vision is a transportation system
that makes walking, biking and using transit more convenient and desirable
11 Frumkin, H. 2002. Urban Sprawl and Public Health. Public Health Reports 117: 201–17.
12 Leyden, K. 2003. Social Capital and the Built Environment: The Importance of Walkable Neighborhoods. American Journal of Public Health 93: 1546–51. 13 Jacobsen, P. Safety in Numbers: More Walkers and Bicyclists, Safer Walking and Bicycling. Injury Prevention, 9: 205-209. 2003.
Attachment 1 :: Riding to 2050: The San Diego Regional Bicycle Plan 31
INTRODUCTION | 9
riding to 2050 nnnnnnnnnnnnn
San Diego Regional Bicycle Plannnnnnnnnnnnnn
options. The Plan provides a long-range blueprint to advance the bicycling
component of this vision.
The Plan contains goals and recommendations that are regional in scope and
provides a planning framework to guide decision-making. As a large and
complex region where many trips are inter-jurisdictional, the San Diego
region requires a complete and integrated network of bikeways and support
facilities to increase bicycling trips. While bicycle planning and policy-
making is primarily focused on the local level, the development of the Plan
provides an opportunity to improve regional coordination and connectivity
of bicycle facilities between jurisdictions. The Plan also provides guidance
to local decision-makers on the design of bicycle facilities, development of
programs, and prioritization of improvement projects.
1.4 Major Recommendations of the Plan This plan outlines a range of recommendations to facilitate accomplishing
the regional goals of increasing the number of people who bike and
frequency of bicycle trips for all purposes, encouraging the development of
Complete Streets14, improving safety for bicyclists, and increasing public
awareness and support for bicycling in the San Diego region. The
recommendations include bicycle infrastructure improvements, bicycle-
related programs, implementation strategies, and policy and design
guidelines. Key recommendations are outlined below.
1.4.1 Bicycle Infrastructure Improvements The Plan presents an interconnected network of bicycle corridors that
would enable residents to bicycle with greater safety, directness, and
convenience within and between major regional destinations and activity
centers. The regional network consists of a combination of standard bicycle
facilities, including Class I bike paths, Class II bike lanes, and Class III bike
routes which are described and depicted in greater detail in Table 3.3. The
Plan also proposes two facility types that are not defined as bikeways by the
California Department of Transportation (Caltrans) – bicycle boulevards
and cycle tracks. These two facility types will serve as demonstration
projects to study their potential to provide greater safety and comfort to
bicyclists.
The regional bicycle network is one of two bicycle network alternatives
developed to reflect varying future funding scenarios. The preferred
regional bicycle network is based on region-wide bicycle system need
14 Complete streets are designed and operated to enable safe access for all users. Pedestrians, bicyclists, motorists, and public transportation users of all ages and abilities are able to safely move along and across a complete street. – www.completestreets.org
Attachment 1 :: Riding to 2050: The San Diego Regional Bicycle Plan 32

10 | INTRODUCTION
Nnnnnnnnnnnnnriding to 2050
nnnnnnnnnnnnn San Diego Regional Bicycle Plan
without consideration of short-term fiscal constraints. The alternative
“revenue constrained network” assumes a funding scenario in which only
currently known federal, state, and local transportation revenues are
available, supplemented with additional resources that are anticipated to
become available through 2030. The network alignments associated with
each funding scenario are identical. The difference in cost between the two
networks is dependent upon the specific proportion of facility types that
comprise a corridor. For example, a particular regional corridor may include
Class I bike paths along several segments under the regional bicycle
network, and Class II bike lanes along the same segments under the revenue
constrained scenario. In summary, the amount of Class I facilities is the
single most influential factor in determining the overall cost of each
network scenario.
The alternative network unconstrained by 2030 financial conditions was
selected as the regional bicycle network for three principal reasons: 1) the
regional bicycle network accurately reflects bicycle system needs and is
consistent with direction from policy makers and citizen input showing a
preference for facilities separate from the roadway, whereas the revenue
constrained network underestimates need; 2) the regional bicycle network
provides a blueprint for developing a comprehensive regional bikeway
system to be complete in 2050 corresponding with the 2050 RTP; and 3)
acknowledging the region’s actual bicycle system needs broadens the scope
of funding opportunities to pursue for system development. The regional
bicycle network is described in greater detail in Chapter 3.
The network selection and classification process included a public outreach
program, on-going consultation with the SANDAG Bicycle-Pedestrian
Working Group (BPWG), which is comprised of staff members from each
of the 19 local jurisdictions, as well as mapping and modeling to refine the
network and proposed bicycle facilities. To enhance the utility of the
regional bicycle network, this Plan also includes provisions for secure and
convenient bicycle parking and support facilities that encourage
transportation based bicycle trips, and access to transit.
1.4.2 Recommended Programs The Plan describes five categories of bicycle-related programs that are
essential facets of the overall bicycle system envisioned for the San Diego
region: education, marketing/public awareness programs, encouragement,
enforcement, and on-going monitoring. Chapter 4 provides an overview of
these program types as well as synopses of representative programs within
each category. These recommended programs were identified through an
assessment of the region’s program deficiencies and needs determined
through extensive public outreach, direction from the BPWG, comparisons
Attachment 1 :: Riding to 2050: The San Diego Regional Bicycle Plan 33
INTRODUCTION | 11
riding to 2050 nnnnnnnnnnnnn
San Diego Regional Bicycle Plannnnnnnnnnnnnn
with national model programs, and an analysis of the probable effectiveness
of each program within the San Diego context.
1.5 Overview of the Plan Contents After this introductory chapter, the Plan is organized into the following
chapters:
Chapter 2 describes the goals, objectives, and policy actions that
provide a vision for future bicycling in the region and serve as the
foundation for the Plan recommendations.
Chapter 3 presents a vision of a regional bicycle system, including a
classified bicycle network and support facilities.
Chapter 4 summarizes bicycle-related program types
recommended for the region.
Chapter 5 provides estimates of the benefits of the proposed
regional bicycle network in terms of reduction in GHG.
Chapter 6 addresses an implementation strategy and potential
financing options.
Chapter 7 presents bicycle facility design guidelines and a best
practices manual to serve as a guide for planners, engineers, and
designers.
Attachment 1 :: Riding to 2050: The San Diego Regional Bicycle Plan 34

12 | INTRODUCTION
Nnnnnnnnnnnnnriding to 2050
nnnnnnnnnnnnn San Diego Regional Bicycle Plan
Attachment 1 :: Riding to 2050: The San Diego Regional Bicycle Plan 35

GOALS, OBJECTIVES, AND POLICY ACTIONS | 13
riding to 2050 nnnnnnnnnnnnn
San Diego Regional Bicycle Plannnnnnnnnnnnnn
2 Goals, Objectives, and Policy Actions
This chapter outlines the goals and objectives that will serve as guidelines in
the development of the regional bicycle network and programs and that
articulate a vision of an ideal future bicycling environment in the San Diego
region. The Plan goals and objectives are derived from the RCP and 2030
RTP and were refined based on information garnered over the course of this
planning process, including public involvement, and input from the
SANDAG Bicycle-Pedestrian Working Group (BPWG) and SANDAG staff.
The RCP seeks to balance regional population, housing, and employment
growth with habitat preservation, agriculture, open space, and
infrastructure needs. A part of the vision supported by the RCP is a
transportation system that makes walking, biking, and transit desirable and
reasonable options. A related objective stated in the RCP is to create more
bicycle-friendly and walkable communities consistent with good urban
design principles. The RCP also recommends enhancing pedestrian and
bicycle connections to transit as one action that would help improve the
regional transportation system.
2.1 Goals The goals of the Regional Bicycle Plan describe the guiding principles and
long-range vision for the region’s bicycling environment.
Goal 1: Significantly Increase Levels of Bicycling throughout the San
Diego Region
Increase bicycling by all types of bicycle riders for all trip purposes through consistent support of programs and infrastructure projects that address the five Es: Education, Encouragement, Enforcement, Engineering, and Evaluation.
Goal 2: Improve Bicycling Safety
Improve bicycling safety by increasing education and training opportunities for cyclists, pedestrians, motorists, and professionals whose work impacts the roadway environment, and by promoting enforcement of traffic laws to reduce bicycle related conflicts.
Goal 3: Encourage the Development of Complete Streets
Promote the integration of Complete Streets principles into roadway planning, design, and maintenance policies so that all roadways safely accommodate all users, including bicyclists, pedestrians, transit riders, children, older people, and disabled people, as well as motorists.
Attachment 1 :: Riding to 2050: The San Diego Regional Bicycle Plan 36
14 | GOALS, OBJECTIVES, AND POLICY ACTIONS
Nnnnnnnnnnnnnriding to 2050
nnnnnnnnnnnnn San Diego Regional Bicycle Plan
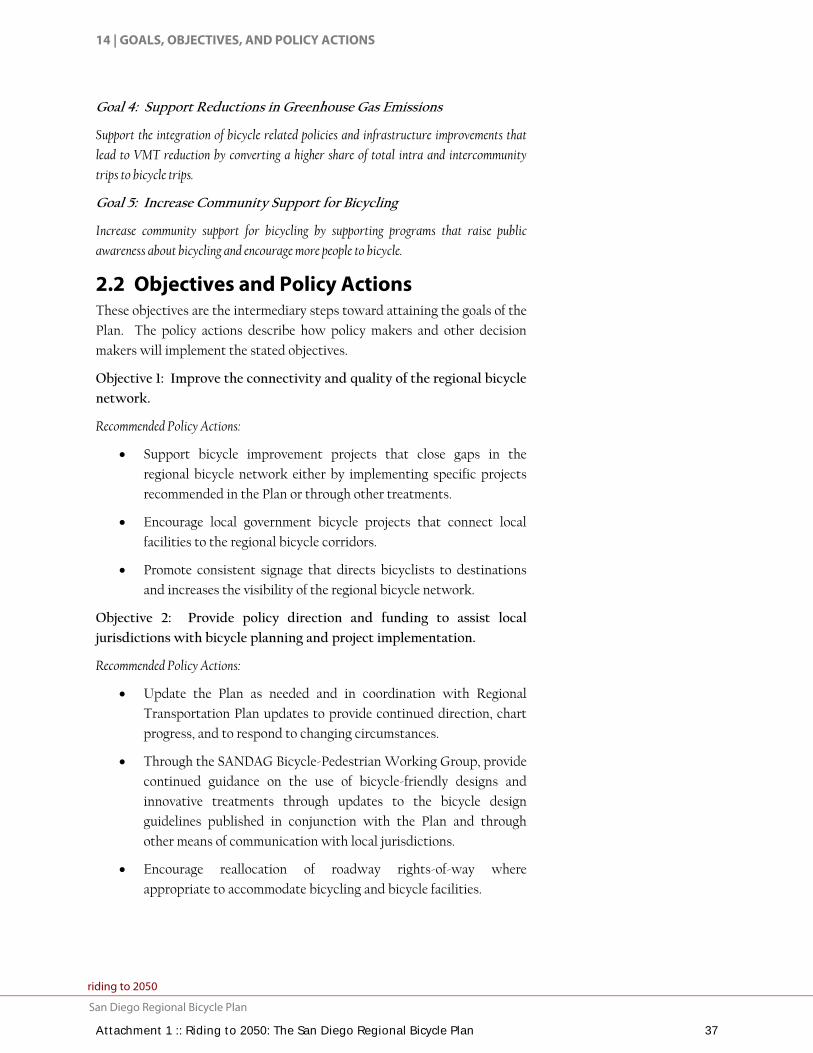
Goal 4: Support Reductions in Greenhouse Gas Emissions
Support the integration of bicycle related policies and infrastructure improvements that lead to VMT reduction by converting a higher share of total intra and intercommunity trips to bicycle trips.
Goal 5: Increase Community Support for Bicycling
Increase community support for bicycling by supporting programs that raise public awareness about bicycling and encourage more people to bicycle.
2.2 Objectives and Policy Actions These objectives are the intermediary steps toward attaining the goals of the
Plan. The policy actions describe how policy makers and other decision
makers will implement the stated objectives.
Objective 1: Improve the connectivity and quality of the regional bicycle
network.
Recommended Policy Actions:
Support bicycle improvement projects that close gaps in the
regional bicycle network either by implementing specific projects
recommended in the Plan or through other treatments.
Encourage local government bicycle projects that connect local
facilities to the regional bicycle corridors.
Promote consistent signage that directs bicyclists to destinations
and increases the visibility of the regional bicycle network.
Objective 2: Provide policy direction and funding to assist local
jurisdictions with bicycle planning and project implementation.
Recommended Policy Actions:
Update the Plan as needed and in coordination with Regional
Transportation Plan updates to provide continued direction, chart
progress, and to respond to changing circumstances.
Through the SANDAG Bicycle-Pedestrian Working Group, provide
continued guidance on the use of bicycle-friendly designs and
innovative treatments through updates to the bicycle design
guidelines published in conjunction with the Plan and through
other means of communication with local jurisdictions.
Encourage reallocation of roadway rights-of-way where
appropriate to accommodate bicycling and bicycle facilities.
Attachment 1 :: Riding to 2050: The San Diego Regional Bicycle Plan 37

GOALS, OBJECTIVES, AND POLICY ACTIONS | 15
riding to 2050 nnnnnnnnnnnnn
San Diego Regional Bicycle Plannnnnnnnnnnnnn
Promote the preservation of bicycle access within all roadway
rights-of-way, as well as the development of innovative, safety-
enhanced on-street facilities, such as bicycle boulevards.
Continue the TransNet and Transportation Development Act (TDA)
funding programs that direct funds to local governments to
improve and expand bicycle facilities and programs throughout the
San Diego region.
In support of Board Policy No. 031, TransNet Ordinance and
Expenditure Plan Rules, Rule #21: Accommodation of Bicyclists
and Pedestrians, continue to mandate bicycle travel
accommodations of all projects funded with TransNet revenue.
Establish a monitoring program to measure the effectiveness and
benefits of the Rule.
Establish a program and implementation plan for local governments
to conduct bicycle counts and assessments when any local land
development requires a traffic impact study.
Objective 3: Support bicycle-transit integration to improve access to
major employment and other activity centers and to encourage
multimodal travel for longer trip distances.
Recommended Policy Actions:
Develop regional on-demand bike lockers that are accessible using a
fare payment card that allows users to access a variety of transit
modes administered by multiple agencies.
Support the development of bicycle facilities that provide access to
regional and local public transit services wherever possible.
Coordinate with transit providers to ensure bicycles can be
accommodated on all forms of transit vehicles and that adequate
space is devoted to their storage on board whenever possible.
Coordinate with transit agencies to install and maintain convenient
and secure short-term and long-term bike parking facilities – racks,
on-demand bike lockers, in-station bike storage, and staffed bicycle
parking facilities – at transit stops, stations, and terminals.
Work with local jurisdictions to facilitate bicycle-friendly
development activity and support facilities, such as bicycle rental
and repair, around transit stations.
Provide current and relevant information to cyclists regarding bike
parking opportunities located at transit stations through a variety
of formats, such as the SANDAG website and regional bike maps.
Attachment 1 :: Riding to 2050: The San Diego Regional Bicycle Plan 38

16 | GOALS, OBJECTIVES, AND POLICY ACTIONS
Nnnnnnnnnnnnnriding to 2050
nnnnnnnnnnnnn San Diego Regional Bicycle Plan
Objective 4: Ensure the provision of convenient and secure bicycle
parking and support facilities region-wide.
Recommended Policy Actions:
Prepare recommended bicycle parking standards that provide
context sensitive solutions for the location and number of spaces
that should be provided.
Encourage local jurisdictions to install and support short-term,
long-term, and high capacity bicycle parking within the public
right-of-way and on public property.
Encourage local jurisdictions to adopt bicycle parking ordinances.
Encourage local jurisdictions to create policies or programs that
incentivize building owners and employers to provide showers and
clothing lockers along with secure bike parking in areas where
employment density warrants.
Provide current and relevant information to cyclists regarding bike
parking opportunities throughout the region through a variety of
formats.
Consider a bike sharing program with distribution stations located
in major employment and other activity centers throughout the
region.
Objective 5: Institutionalize Complete Streets principles in roadway
planning, design, and maintenance policies.
Recommended Policy Actions:
Provide Complete Streets training to transportation-related
professionals.
Consider development of a region-wide Complete Streets policy
and guidelines manual.
Encourage local jurisdictions to adopt a Complete Streets policy to
be included in their General Plans.
Objective 6: Increase education, encouragement, enforcement, and
performance monitoring and evaluation programs.
Recommended Policy Actions:
Support programs that educate the bicycling and general public
about bicycle operation, bicyclists’ rights and responsibilities, and
lawful interactions between motorists and cyclists.
Attachment 1 :: Riding to 2050: The San Diego Regional Bicycle Plan 39

GOALS, OBJECTIVES, AND POLICY ACTIONS | 17
riding to 2050 nnnnnnnnnnnnn
San Diego Regional Bicycle Plannnnnnnnnnnnnn
Support marketing and public awareness campaigns aimed at
promoting bicycling and/or improving safety.
Support enhancements to Bike to Work Month promotional
activities and events.
Monitor and evaluate the San Diego region’s bicycling efforts by
implementing a regional annual evaluation program that includes:
collecting bicycle and pedestrian count data; conducting a regional
non-motorized travel survey; and generating an annual report on
the state of non-motorized transportation in the region.
Support programs aimed at increasing bicycle trips by providing
incentives, recognition, or services that make bicycling a more
convenient transportation mode.
Encourage enforcement efforts that target unsafe bicyclist and
motorist behaviors and enforce laws that reduce bicycle/motor
vehicle collisions and conflicts.
Encourage local jurisdictions to monitor and evaluate progress
toward becoming bicycle-friendly by establishing advisory
committees, staffing bicycle coordinator positions and by
evaluating bicycle master plan implementation.
Attachment 1 :: Riding to 2050: The San Diego Regional Bicycle Plan 40

18 | GOALS, OBJECTIVES, AND POLICY ACTIONS
Nnnnnnnnnnnnnriding to 2050
nnnnnnnnnnnnn San Diego Regional Bicycle Plan
Attachment 1 :: Riding to 2050: The San Diego Regional Bicycle Plan 41

GOALS, OBJECTIVES, AND POLICY ACTIONS | 19
riding to 2050 nnnnnnnnnnnnn
San Diego Regional Bicycle Plannnnnnnnnnnnnn
3 Recommended Regional Bicycle Network
A primary objective of the Plan is to improve the connectivity and quality of
the regional bicycle network and bicycle support facilities. Defining and
improving a comprehensive regional bicycle network is essential to meeting
the 2030 RTP goals of options that help alleviate future traffic demands and
congestion. The Plan is regional in focus and provides a framework to
promote consistency between and among local jurisdictions and encourage
the development of quality facilities region wide. The current regional
system requires additional on- and off-street bicycle facilities, safety
improvements, improved connections to transit facilities and corridor
realignments to enable bicyclists to reach key destinations and encourage
more people to bicycle more frequently.
As described in the 2030 RTP,
“The goal of the [Regional Bicycle Plan] is to encourage the development of a unified bicycle system throughout the San Diego region that serves the needs of people using their bicycle for transportation and recreational bicyclists with connections to local and regional activity centers and transit facilities and other regional non-motorized systems.”
This chapter describes the infrastructure-related components of the
regional bicycle system and is organized into the following sections:
Existing Bikeways
Regional Bikeways in the 2030 RTP
Network Planning Process
Regional Corridor Classifications
Regional Bicycle Network
Regional Bicycle Parking
The regional bicycle network presented in this chapter is a vital component
of the overall regional bicycle system vision, which also includes distinctive
bicycle programs and support facilities.
3.1 Existing Bikeways SANDAG publishes a bike map showing existing bicycle facilities in the
region, as well as other recommended routes. Table 3.1 summarizes mileage
of bikeways by facility type for the entire region, including those facilities
designated as regional corridors. Figure 3-1 displays all existing local and
regional bikeways across the region.
Attachment 1 :: Riding to 2050: The San Diego Regional Bicycle Plan 42

20 | RECOMMENDED REGIONAL BICYCLE NETWORK
Nnnnnnnnnnnnnriding to 2050
nnnnnnnnnnnnn San Diego Regional Bicycle Plan
Table 3.1 Existing Bicycle Facilities in the Region
Facility Type Miles % of Total Class I – Path 159.3 11.9%
Class II – Lane 890.2 66.4%
Class III – Route 243.9 18.2%
Freeway Shoulders 47.4 3.5%
TOTALS 1,340.8 100%
Source: SANDAG Bikes shapefile, 2010; Alta Planning + Design,
April, 2010
There are approximately 1,340 miles of existing bikeway facilities in the
region. Class II facilities are the predominate type of bikeway at roughly 66
percent of the total, followed by Class III facilities at 18 percent of the
regional total. Class I facilities comprise about 12 percent of the regional
total. Although bicycles are allowed on a few select freeway shoulders, this
Plan does not propose to include those facilities in the regional bicycle
network as they are not intended to accommodate users of all types.
Attachment 1 :: Riding to 2050: The San Diego Regional Bicycle Plan 43

56
52
125
94
54
905
805
8
5
15
78
67
125
805
5
163
0 2 41 Miles
Pacific
Ocean
San Diego Santee
Poway
ChulaVista
El Cajon
LaMesa
Coronado
ImperialBeach
EscondidoCarlsbad
Vista
EncinitasUnincorporated
County
San Marcos
Oceanside
SolanaBeach
DelMar
NationalCity
San Diego
Alta P
lannin
g + De
sign,
March
1, 20
10
LemonGrove
EXISTING LOCAL ANDREGIONAL FACILITIES INSAN DIEGO COUNTY
REGIONAL BICYCLE PLANSAN DIEGO
FIGURE 3-1
CLASS I - BIKE PATH
CLASS III - BIKE ROUTECLASS II - BIKE LANE
FREEWAY SHOULDER
Attachment 1 :: Riding to 2050: The San Diego Regional Bicycle Plan 44

22 | RECOMMENDED REGIONAL BICYCLE NETWORK
Nnnnnnnnnnnnnriding to 2050
nnnnnnnnnnnnn San Diego Regional Bicycle Plan
Table 3.2 presents a summary of existing bikeways by facility type and
jurisdiction. Six local jurisdictions – Del Mar, Imperial Beach, La Mesa,
Lemon Grove, Poway, and Vista – have one mile or less of Class I facilities;
while Imperial Beach and National City are the only jurisdictions with one
mile or less of Class II facilities.
Table 3.2 Existing Bicycle Facilities by Jurisdiction
Jurisdiction
Mileage by Facility Type Total
Mileage by Jurisdiction
Percent of Regional
Total Mileage
Percent of Regional
Population Class
I
Class
II
Class
III
Freeway
Shoulder
Carlsbad 4.2 85.6 4.9 0 94.7 7.06% 3.3%
Chula Vista 6.0 67.1 42.6 5.3 121 9.02% 7.4%
Coronado 9.6 1.5 5.0 0 16.1 1.20% 0.7%
Del Mar 0.1 6.0 0.2 0 6.3 0.47% 0.1%
El Cajon 1.3 14.8 3.5 0 19.6 1.46% 3.1%
Encinitas 4.4 21.1 3.0 0 28.5 2.13% 2.0%
Escondido 10.2 33.0 0.1 1.8 45.1 3.36% 4.6%
Imperial Beach 0.6 0.2 0.3 0 1.1 0.08% 0.9%
La Mesa 0.0 13.0 10.5 0 23.5 1.75% 1.8%
Lemon Grove 0.0 7.8 1.0 0 8.8 0.66% 0.8%
National City 2.5 1.0 20.4 0 23.9 1.78% 2.0%
Oceanside 8.8 81.0 16.4 0 106.2 7.92% 5.7%
Poway 0.7 27.0 3.2 0 30.9 2.31% 1.6%
San Diego 71.6 308.4 112.9 16.1 509 37.96% 42.5%
San Marcos 11.8 45.3 0.0 0 57.1 4.26% 2.6%
Santee 7.7 13.7 8.1 0 29.5 2.20% 1.8%
Solana Beach 1.6 3.6 1.4 0 6.6 0.50% 0.4%
Vista 0.0 23.5 4.6 0 28.1 2.10% 3.1%
Unincorporated 18.2 136.6 5.8 24.2 184.8 13.78% 15.5%
TOTALS 159.3 890.2 243.9 47.4 1,340.8 100% 100%
Source: SANDAG Bikes shapefile, 2010; Alta Planning + Design, April 2010
As shown in Table 3.2, the City of San Diego has the greatest percentage of
facilities that are also part of the regional bicycle network, at roughly 38
percent of the regionwide total, while Imperial Beach, Del Mar, and Solana
Beach have the smallest percentage of the regional total, respectively. The
overall trends in bikeway facility provision follow trends in population and
land area. There are eight jurisdictions whose share of regional bicycle
facilities is less than their share of the regional population. These
jurisdictions include El Cajon, Escondido, Imperial Beach, Lemon Grove,
National City, San Diego, Vista, and the unincorporated county.
Attachment 1 :: Riding to 2050: The San Diego Regional Bicycle Plan 45

GOALS, OBJECTIVES, AND POLICY ACTIONS | 23
riding to 2050 nnnnnnnnnnnnn
San Diego Regional Bicycle Plannnnnnnnnnnnnn
3.2 Regional Bikeways in the 2030 RTP The regional bicycle network as proposed in the 2030 RTP consists of a
total of 445 miles of existing and planned facility. The 2030 RTP does not
define the classification for each of the segments in the regional corridor
system. Figure 3-2 displays an overview of the adopted regional corridors
from the 2030 RTP, which served as the starting point for the development
of the regional bicycle network.
3.3 Network Planning Process Development of the Plan required close examination of the network and
alignments in the 2030 RTP. The network planning process included public
input, consultation with the SANDAG Bicycle-Pedestrian Working Group
(BPWG) comprised of staff members from each of the 19 local jurisdictions,
and GIS mapping and modeling to refine the proposed network alignments
and facility classifications.
Criteria adopted by the SANDAG Transportation Committee were
employed in refining an updated regional bicycle network, including serving
the highest relative bicycle demands across the region, providing for the
most direct connections, and incorporating existing facilities where feasible
(A complete presentation of the existing conditions analysis documenting
this background assessment is presented in Appendix A.). Figure 3-3
presents a regionwide overview of the updated regional bicycle network
adopted by the Transportation Committee. Proposed changes to the 2030
RTP regional network include the addition of seven new corridors and the
adjustment of alignments for eight corridors. Figure 3-4 displays the
changes between the 2030 RTP regional network and the updated network
for the Plan.
Attachment 1 :: Riding to 2050: The San Diego Regional Bicycle Plan 46
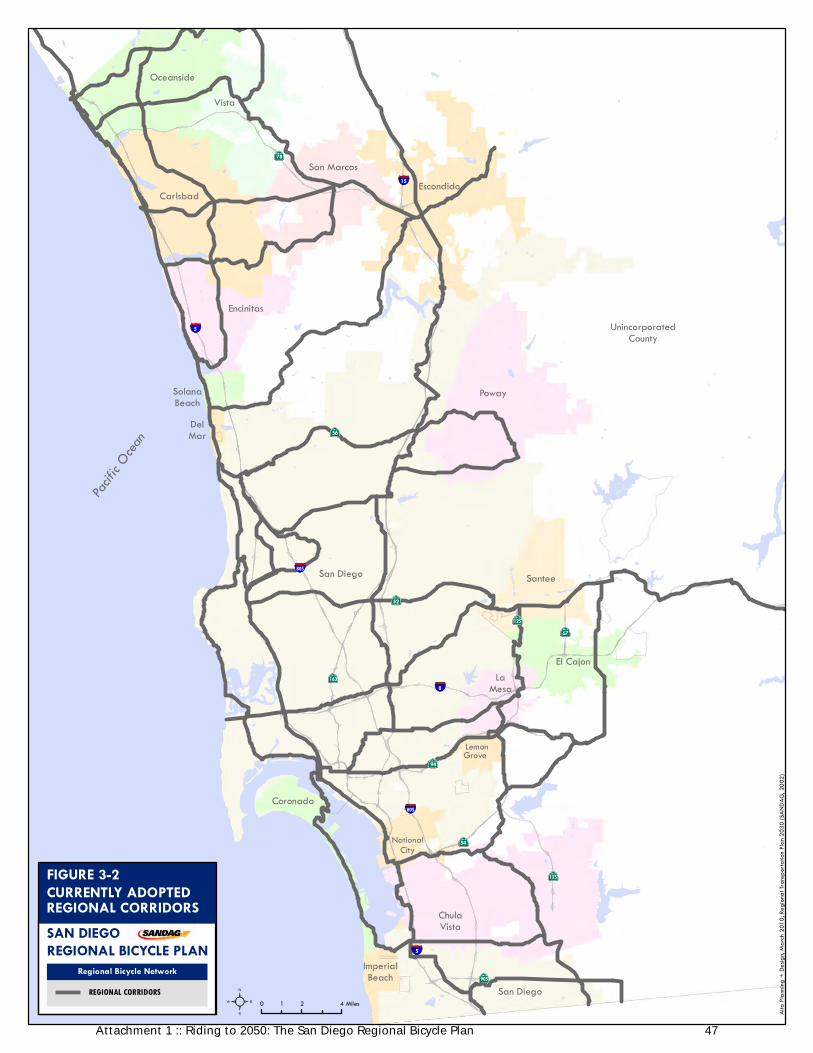
56
52
125
94
54
905
805
8
5
15
78
67
125
805
5
163
0 2 41 Miles
Pacific
Ocean
San Diego Santee
Poway
ChulaVista
El CajonLa
Mesa
Coronado
ImperialBeach
EscondidoCarlsbad
Vista
EncinitasUnincorporated
County
San Marcos
Oceanside
SolanaBeach
DelMar
Lemon
NationalCity
San Diego
Grove
Alta P
lannin
g + De
sign,
March
2010
; Reg
ional
Transp
ortati
on Pl
an 20
30 (S
ANDA
G, 20
02)
CURRENTLY ADOPTEDREGIONAL CORRIDORS
REGIONAL BICYCLE PLANSAN DIEGO
Regional Bicycle Network
FIGURE 3-2
REGIONAL CORRIDORS
Attachment 1 :: Riding to 2050: The San Diego Regional Bicycle Plan 47

0 2 41 Miles
1 2
3
4
5
6
7
8
9
10
11
12
13
14
15
16
17
18
19
20
21
22
24
25
23 26
28
29
30
31
32
3436
37
38
33
35
27
REGIONAL BICYCLE CORRIDORS
1 - Bayshore Bikeway2 - Bay to Ranch Bikeway3 - Border Access Corridor4 - Camp Pendleton Trail5 - Carlsbad-San Marcos Corridor6 - Central Coast Corridor7 - Centre City-La Mesa Corridor8 - Chula Vista Greenbelt9 - City Heights-Old Town Corridor10 - Clairemont-Centre City Corridor11 - Coastal Rail Trail12 - East County Northern Loop13 - East County Southern Loop14 - El Camino Real15 - Encinitas-San Marcos Corridor16 - Escondido Creek Bikeway17 - Gilman Connector18 - Hillcrest-El Cajon Corridor19 - Imperial Beach Connector20 - Inland Rail Trail21 - Kearny Mesa-Beaches Corridor22 - Kensington-Balboa Park Corridor23 - North Park-Centre City Corridor24 - Mid-County Bikeway25 - Mira Mesa Corridor26 - Mission Valley-Chula Vista Corridor27 - Park Boulevard Connector28 - Poway Loop29 - San Diego River Bikeway30 - San Luis Rey River Trail31 - Santee-El Cajon Corridor32 - Sweetwater River Bikeway33 - Vista Way Connector34 - I-8 Corridor35 - I-15 Bikeway36 - SR-52 Bikeway37 - SR-56 Bikeway38 - SR-125 Corridor39 - I-805 Connector40 - SR-905 Corridor
Pacific
Ocean
San DiegoSantee
Poway
ChulaVista
El Cajon
LaMesa
Coronado
ImperialBeach
EscondidoCarlsbad
Vista
Encinitas
San Marcos
Oceanside
SolanaBeach
DelMar
San Diego
Alta P
lannin
g + D
esign
, Mar
ch 20
09
FIGURE 3-3UPDATED REGIONALBICYCLE NETWORK
SAN DIEGO REGIONAL BICYCLE PLAN
NOTE:Colors do not represent facility type.The color variations are intended todifferentiate start and end of allcorridors.
40
39
Attachment 1 :: Riding to 2050: The San Diego Regional Bicycle Plan 48
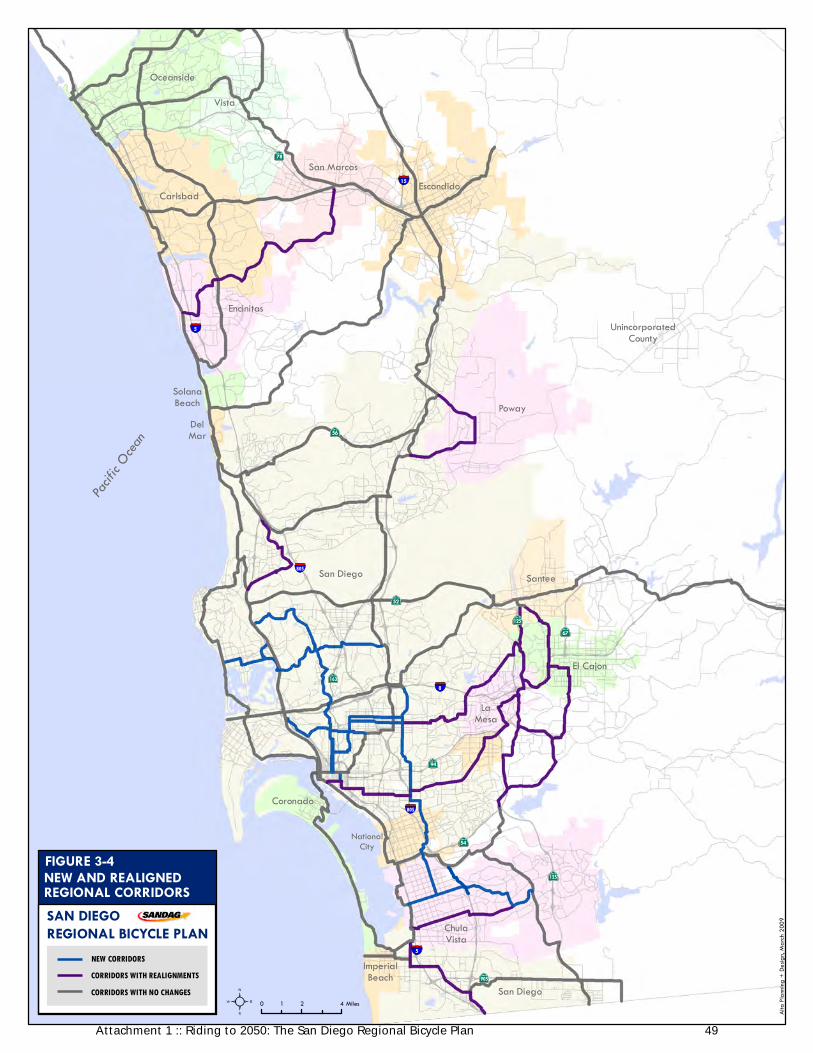
56
52
125
94
54
905
805
8
5
15
78
67
125
805
5
163
0 2 41 Miles
Pacific
Ocean
San Diego Santee
Poway
ChulaVista
El Cajon
LaMesa
Coronado
ImperialBeach
EscondidoCarlsbad
Vista
EncinitasUnincorporated
County
San Marcos
Oceanside
SolanaBeach
DelMar
NationalCity
San Diego
Alta P
lannin
g + De
sign,
March
2009
NEW AND REALIGNEDREGIONAL CORRIDORS
REGIONAL BICYCLE PLANSAN DIEGO
FIGURE 3-4
NEW CORRIDORS
CORRIDORS WITH NO CHANGESCORRIDORS WITH REALIGNMENTS
Attachment 1 :: Riding to 2050: The San Diego Regional Bicycle Plan 49

GOALS, OBJECTIVES, AND POLICY ACTIONS | 27
riding to 2050 nnnnnnnnnnnnn
San Diego Regional Bicycle Plannnnnnnnnnnnnn
3.4 Regional Corridor Classifications The same method that informed the network alignment process described
in Section 3.3 was utilized to establish a bicycle facilities classification
system that was applied to the regional corridor alignments to establish a
clear vision for future development of the regional bikeway system. The
system included five classification types. Three are from the Caltrans
Highway Design Manual (referenced in Chapter 7) bikeway classifications
enhanced with additional bicycle facility treatments, such as intersection
treatments to improve high bicycle/motorist conflict areas. The Plan also
proposes the consideration of two classifications not currently defined by
the Highway Design Manual – bicycle boulevards and cycle tracks – to
provide additional opportunities for regional bikeway connections. Because
cycle tracks include non-standard design elements, the cycle track
classification is recommended for limited segments to serve as a pilot
project. Table 3-3 displays the classification system employed in planning
for the regional bicycle system. Greater detail on the design of standard and
non-standard facilities and treatments is provided in Chapter 7. All
regional corridors should be identifiable via identification and way-finding
signage that names each corridor and allows users to easily understand the
destinations served by each respective corridor.
Attachment 1 :: Riding to 2050: The San Diego Regional Bicycle Plan 50

28 | GOALS, OBJECTIVES, AND POLICY ACTIONS
Nnnnnnnnnnnnnriding to 2050
nnnnnnnnnnnnn San Diego Regional Bicycle Plan
Table 3.3 Regional Corridor Classification System
Class I – Bike Path Bike paths are bikeways that are physically separated from
vehicular traffic. Also termed shared-use paths, bike paths
accommodate bicycle, pedestrian, and other non-motorized travel.
Paths can be constructed in roadway right-of-way or independent
right-of-way. Bike paths provide critical connections in the region
where roadways are absent or are not conducive to bicycle travel.
Class II - Bike Lanes Bike lanes are defined by pavement markings and signage used to
allocate a portion of a roadway for exclusive or preferential bicycle
travel. Within the regional corridor system, bike lanes should be
enhanced with treatments that improve safety and connectivity by
addressing site-specific issues. Such treatments include
innovative signage, intersection treatments, and bicycle loop
detectors.
Class III - Bike Routes Bike routes are located on shared roadways that accommodate
vehicles and bicycles in the same travel lane. Established by signs,
bike routes provide continuity to other bike facilities or designate
preferred routes through corridors with high demand. Within the
regional corridor system, bike routes should be enhanced with
treatments that improve safety and connectivity by addressing
site-specific issues.
Attachment 1 :: Riding to 2050: The San Diego Regional Bicycle Plan 51
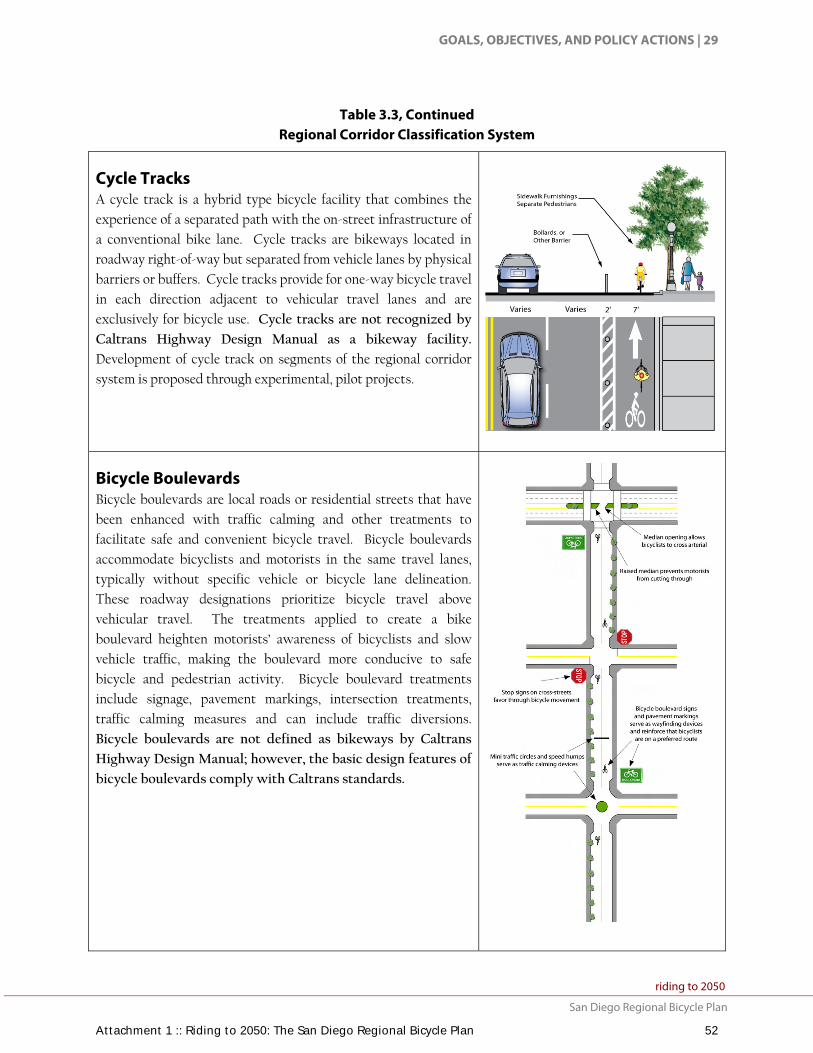
GOALS, OBJECTIVES, AND POLICY ACTIONS | 29
riding to 2050 nnnnnnnnnnnnn
San Diego Regional Bicycle Plannnnnnnnnnnnnn
Table 3.3, Continued Regional Corridor Classification System
Cycle Tracks A cycle track is a hybrid type bicycle facility that combines the
experience of a separated path with the on-street infrastructure of
a conventional bike lane. Cycle tracks are bikeways located in
roadway right-of-way but separated from vehicle lanes by physical
barriers or buffers. Cycle tracks provide for one-way bicycle travel
in each direction adjacent to vehicular travel lanes and are
exclusively for bicycle use. Cycle tracks are not recognized by
Caltrans Highway Design Manual as a bikeway facility.
Development of cycle track on segments of the regional corridor
system is proposed through experimental, pilot projects.
Bicycle Boulevards Bicycle boulevards are local roads or residential streets that have
been enhanced with traffic calming and other treatments to
facilitate safe and convenient bicycle travel. Bicycle boulevards
accommodate bicyclists and motorists in the same travel lanes,
typically without specific vehicle or bicycle lane delineation.
These roadway designations prioritize bicycle travel above
vehicular travel. The treatments applied to create a bike
boulevard heighten motorists’ awareness of bicyclists and slow
vehicle traffic, making the boulevard more conducive to safe
bicycle and pedestrian activity. Bicycle boulevard treatments
include signage, pavement markings, intersection treatments,
traffic calming measures and can include traffic diversions.
Bicycle boulevards are not defined as bikeways by Caltrans
Highway Design Manual; however, the basic design features of
bicycle boulevards comply with Caltrans standards.
Attachment 1 :: Riding to 2050: The San Diego Regional Bicycle Plan 52

30 | GOALS, OBJECTIVES, AND POLICY ACTIONS
Nnnnnnnnnnnnnriding to 2050
nnnnnnnnnnnnn San Diego Regional Bicycle Plan
3.5 The Regional Bicycle Network This section presents alignments and classifications for the updated
regional bicycle network. The regional bicycle network reflects a
comprehensive view of the region’s bikeway system needs and represents
the vision for a regional network in the year 2050. As part of the planning
effort, two bicycle network alternatives were developed, the preferred
regional bicycle network and a revenue constrained network. The revenue
constrained network is based on a scenario in which only currently known
federal, state, and local transportation revenues, supplemented with
resources anticipated to become available through 2030, are available for
network construction. Whereas, the preferred regional bicycle network
accurately reflects the region’s bikeway needs unconstrained by shorter-
term fiscal conditions. Further details on the different revenue scenarios
can be found in Chapter 6.
Section 3.3 of this chapter summarizes the process employed to develop the
regional bicycle network. Figure 3-5 shows the alignments along with the
bicycle facility classifications proposed for each corridor. Figure 3-6
displays existing facilities within the regional corridors along with portions
of the regional corridor system that have not been built.
Table 3.4 presents a summary of the regional bicycle network mileage by
classification type for each of its 40 corridors. As shown, the network
would provide for approximately 515.5 miles of facility, including roughly
227.8 miles of Class I facility, 212.5 miles of enhanced Class II, 33.7 miles of
enhanced Class III, 8.3 miles of cycle track, and 34.2 miles of bicycle
boulevard.
Table 3.4 Facility Type and Mileage for the Regional Bicycle Network
Facility Type Mileage Percent of TotalClass I – Bike Path 227.8 44.2 %
Enhanced Class II – Bike Lane 212.5 41.3 %
Enhanced Class III – Bike Route 32.7 6.3 %
Cycle Track 8.3 1.6 %
Bicycle Boulevard 34.2 6.6 %
TOTALS 515.5 100 %
Source: Alta Planning + Design, April 2009
The bicycle network map and summary tables for the constrained revenue
funding scenario is provided in Appendix B.
Attachment 1 :: Riding to 2050: The San Diego Regional Bicycle Plan 53

56
52
125
94
54
905
805
8
5
15
78
67
125
805
5
163
0 2 41 Miles
Pacific
Ocean
San Diego Santee
Poway
ChulaVista
El Cajon
LaMesa
Coronado
ImperialBeach
EscondidoCarlsbad
Vista
EncinitasUnincorporated
County
San Marcos
Oceanside
SolanaBeach
DelMar
Lemon
NationalCity
San Diego
Grove
Alta P
lannin
g + De
sign,
March
1, 20
10; S
ource
: SAN
DAG
REGIONAL BICYCLE PLANSAN DIEGO
Proposed Regional Bicycle NetworkCLASS I - BIKE PATH
BICYCLE BOULEVARDCYCLE TRACK
ENHANCED CLASS II - BIKE LANEENHANCED CLASS III - BIKE ROUTE
REGIONAL BICYCLE NETWORKCORRIDOR ALIGNMENTSAND CLASSIFICATIONS
FIGURE 3-5
Attachment 1 :: Riding to 2050: The San Diego Regional Bicycle Plan 54
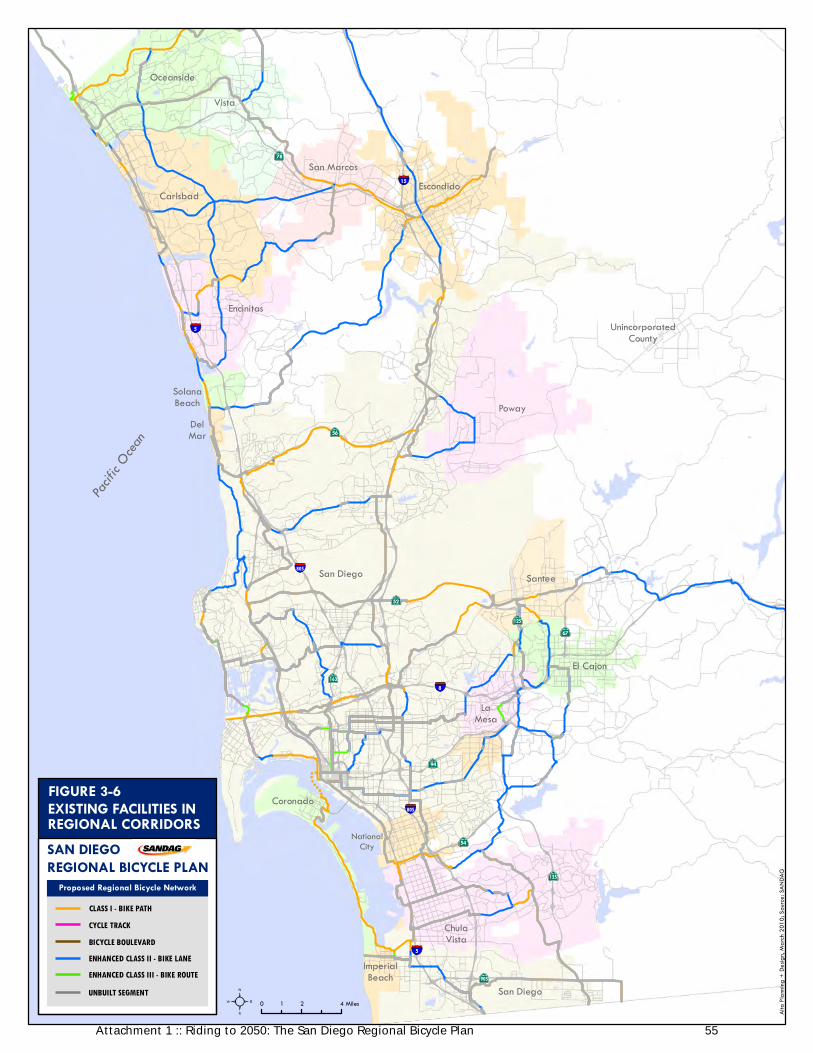
56
52
125
94
54
905
805
8
5
15
78
67
125
805
5
163
0 2 41 Miles
Pacific
Ocean
San Diego Santee
Poway
ChulaVista
El Cajon
LaMesa
Coronado
ImperialBeach
EscondidoCarlsbad
Vista
EncinitasUnincorporated
County
San Marcos
Oceanside
SolanaBeach
DelMar
NationalCity
San Diego
Alta P
lannin
g + De
sign,
March
2010
; Sou
rce: S
ANDA
G
EXISTING FACILITIES INREGIONAL CORRIDORS
REGIONAL BICYCLE PLANSAN DIEGO
Proposed Regional Bicycle Network
FIGURE 3-6
CLASS I - BIKE PATH
BICYCLE BOULEVARDCYCLE TRACK
ENHANCED CLASS II - BIKE LANEENHANCED CLASS III - BIKE ROUTEUNBUILT SEGMENT
Attachment 1 :: Riding to 2050: The San Diego Regional Bicycle Plan 55

GOALS, OBJECTIVES, AND POLICY ACTIONS | 33
riding to 2050 nnnnnnnnnnnnn
San Diego Regional Bicycle Plannnnnnnnnnnnnn
3.6 Priority Projects As part of the implementation of the Plan a project prioritization process
using criteria adopted by the SANDAG Transportation Committee will be
developed and applied to the regional network to phase implementation.
3.6.1 Project Prioritization Process The prioritization framework will assess estimated bicycling demands and
bicycle facility deficiencies across the region. The bicycle travel demand
assessment will employ a gravity model approach where the level of demand
on any given segment of the proposed network is assumed to be positively
correlated with land use intensities of locations being connected, and
inversely correlated with the distances between these locations. The Smart
Growth Opportunity Areas (SGOAs), as shown on the SANDAG Board
adopted Smart Growth Concept Map (Appendix C) will be used to define
a set of origins and destinations across the region, with linkages via the
proposed regional bicycle network assessed for relative demands. Based
upon the gravity model concept, therefore, the higher the land use intensity
of a SGOA served by the regional bicycle network, the greater the estimated
demand along that particular segment. Likewise, the shorter the distances
between any two SGOAs along the regional bicycle network, the higher the
estimated demand on that particular segment.
The RCP identifies seven categories of smart growth place types, including
the Metropolitan Center, Urban Centers, Town Centers, Community
Centers, Rural Villages, Mixed-Use Transit Corridors and Special Use
Centers. Each smart growth place type is associated with housing and
employment density targets, as well as transit service thresholds. The Smart
Growth Concept map was developed in collaboration with the 19
jurisdictions in the San Diego region and includes nearly 200 existing and
planned/potential SGOAs. Using SGOAs in the regional bicycle network
prioritization process allows the region to emphasize important synergies
between its land use, transit, and bicycle planning efforts.
Table 3.5 displays the RCP seven smart growth place types and the
respective residential, employment, and transit targets.
Attachment 1 :: Riding to 2050: The San Diego Regional Bicycle Plan 56

34 | GOALS, OBJECTIVES, AND POLICY ACTIONS
Nnnnnnnnnnnnnriding to 2050
nnnnnnnnnnnnn San Diego Regional Bicycle Plan
Table 3.5 Land Use and Transit Targets for RCP Smart Growth Place Types
Smart Growth Place Type
Minimum Residential Target
Minimum Employment Target
Minimum Transit Service Characteristics
Metropolitan
Center 75 du/ac 80 emp/ac Regional Services
Urban Center 40 du/ac 50 emp/ac Light Rail/Rapid Bus
Town Center 20 du/ac 30 emp/ac Light Rail/Rapid Bus
Community
Center 20 du/ac N/A
High Frequency Local Bus within
Transit Priority Areas based on the
Urban Service Boundary in the
2007-2011 Coordinated Plan
Rural Village 10.9 du/ac N/A N/A
Special Use
Center Optional 45 emp/ac Light Rail/Rapid Bus
Mixed-Use Transit
Corridor 25 du/ac N/A High Frequency Local Bus
Source: Smart Growth Concept Site Descriptions June 6, 2008 (SANDAG)
Notes: du/ac = dwelling units per acre emp/ac = employees per acre In addition to the demand-based criteria, the prioritization process will also
incorporate bicycle network deficiencies and levels of prior facility funding.
Specifically, the deficiency assessment will consider bicycle facility gaps,
incidence of bicycle crashes, and public comment related to problem areas.
Factors such as the presence of a facility gap, high crash locations, more
public comment, and prior funding will be given higher priority.
3.7 Regional Bicycle Parking Secure and convenient bicycle parking is essential to facilitating bicycle
transportation, including multimodal trip-chaining where the bicycle is
used for a portion of the total trip. The SANDAG iCommute bike locker
program continues to advance bicycle-transit integration in the region by
managing 872 spaces in bike lockers at 60 transit centers (Trolley,
COASTER, SPRINTER, and BRT Stations), and Park and Ride lots
throughout San Diego County. iCommute mechanical and electronic
lockers can be accessed for a $25 dollar key deposit fee and are available to
users on a first-come, first-served basis. Table 3.6 displays the quantity of
iCommute bike lockers and locker spaces by location.
Attachment 1 :: Riding to 2050: The San Diego Regional Bicycle Plan 57

GOALS, OBJECTIVES, AND POLICY ACTIONS | 35
riding to 2050 nnnnnnnnnnnnn
San Diego Regional Bicycle Plannnnnnnnnnnnnn
Table 3.6 SANDAG iCommute Bike Lockers in the San Diego Region
Site Name Total
Lockers Total
Spaces 12th and Imperial Trolley Station 2 4
24th Street Trolley Station 2 4
70th Street Trolley Station 6 12
8th Street Trolley Station 4 8
Alvarado Medical Center Trolley 6 12
Amaya Trolley Station 7 14
Bayfront Trolley Station (E Street) 9 18
Beyer Blvd Trolley Station 2 4
Buena Creek (SPRINTER) 9 18
Cal State San Marcos (SPRINTER) 10 20
Carlsbad Village 2 4
Carmel Mtn. Park & Ride #4 4 8
Coast Highway (SPRINTER) 4 8
College Blvd (SPRINTER) 10 20
Crouch St (SPRINTER) 8 16
El Cajon Transit Terminal 8 16
El Camino Real (SPRINTER) 5 10
Encanto Trolley Station 2 4
Encinitas Coaster Station 16 28
Escondido Ave (SPRINTER) 11 22
Escondido Transit Ctr 19 38
Euclid Ave Trolley Station 1 2
Fashion Valley Transit Center 16 16
Fenton Pkwy 2 4
Gillespie Field Trolley (Weld) 6 12
Grantville Trolley Station 6 12
Grossmont Trolley Station 4 8
H St. Trolley Station 11 22
Harborside Trolley Station 1 2
Hazard Center Trolley Station 6 12
Iris Ave Trolley Station 14 28
La Mesa Trolley Station 3 6
Lemon Grove Trolley (Broadway) 4 8
Massachusetts Trolley Station 3 6
Melrose Station (SPRINTER) 7 14
Mission SD Trolley Station 6 12
(Continued on next page)
Attachment 1 :: Riding to 2050: The San Diego Regional Bicycle Plan 58

36 | GOALS, OBJECTIVES, AND POLICY ACTIONS
Nnnnnnnnnnnnnriding to 2050
nnnnnnnnnnnnn San Diego Regional Bicycle Plan
Table 3.6 (continued)
SANDAG iCommute Bike Lockers in the San Diego Region
Site Name Total
Lockers Total
Spaces Mission Valley Ctr Trolley 4 8
Morena/Linda Vista Trolley 6 12
Nordahl Road Station (SPRINTER) 8 16
Oceanside Transit Center 10 20
Old Town Transit Center 24 48
Pacific Fleet Trolley Station 2 4
Palm Ave Trolley Station 7 14
Palomar College Station (SPRINTER) 16 32
Palomar Trolley Station 6 12
Poinsettia Coaster Station 6 12
Qualcomm Stadium Trolley 6 12
Rancho Bernardo BRT 8 16
Rancho Carmel Park & Ride #31 2 4
Rancho Del Oro (SPRINTER) 8 16
Sabre Springs BRT 8 16
Sabre Springs Park & Ride #16 2 4
San Marcos Civic Center (SPRINTER) 18 36
Santa Fe Depot 2 4
Santee Trolley Station 20 40
Solana Beach Coaster Station 6 12
Sorrento Valley Coaster 22 44
Spring Street Trolley Station 3 6
Vista Transit Center (SPRINTER) 14 28
Washington Trolley Station 2 4
TOTAL 446 872
Source: SANDAG, 2008
iCommute also reaches out to the community regarding bicycle locker
availability via the San Diego Region Bike Map, the iCommute website, and
biking advocacy organizations. This form of encouragement is one facet of
iCommute’s overall efforts to reduce drive-alone vehicular trips through the
promotion of alternative commutes.
Providing long-term bike parking at transit centers increases bike-transit
trip potential; however, short- and long-term parking facilities are needed
elsewhere throughout the region to encourage local bicycle trips by both
transit riders and persons traveling solely by bicycle. Many office buildings,
commercial districts, and tourist attractions lack sufficient bicycle parking
in terms of design and quantity. This discourages people from cycling
Attachment 1 :: Riding to 2050: The San Diego Regional Bicycle Plan 59
GOALS, OBJECTIVES, AND POLICY ACTIONS | 37
riding to 2050 nnnnnnnnnnnnn
San Diego Regional Bicycle Plannnnnnnnnnnnnn
because many bicyclists desire reasonable protection against theft,
vandalism, and inclement weather. According to the bicycle user
questionnaire distributed for the Regional Bicycle Plan planning process, 43
percent of respondents indicated that they would bicycle more frequently if
more bike parking was available. An even greater percentage of public
workshop participants expressed strong interest in bike parking. Bicycle
parking is most effective when it is located close to trip destinations, visible,
and easy to use. If quality bicycle parking facilities are not provided,
determined bicyclists lock their bicycles to street signs, parking meters,
lampposts, or trees, all of which are undesirable because they are often less
secure, may interfere with pedestrian movements, and can create liability
issues or damage to street furniture or trees.
In addition to maintaining the iCommute bike locker program, SANDAG
has a role in providing policy guidance to local jurisdictions to ensure
adequate bicycle parking is available throughout the region. Locally
adopted and enforced bike parking ordinances are most critical to ensuring
bike parking is provided by private developers, yet few jurisdictions in San
Diego County currently have an ordinance that mandates specific bike
parking requirements. Bike parking ordinances at a minimum should
include parameters for the quantity and type of bike parking facilities that
are required by type of development. They should also include provisions
for the design options and placement of facilities to ensure they are secure,
convenient, visible and maneuverable. Chicago, Illinois; Santa Cruz,
California; and Madison, Wisconsin have been successful in implementing
ordinances that make bike parking compulsory. Appendix D provides a
model bike parking ordinance and is intended to assist cities in developing a
local bike parking ordinance. Chapter 7 provides a brief overview of
effective bike parking design options.
Attachment 1 :: Riding to 2050: The San Diego Regional Bicycle Plan 60

38 | GOALS, OBJECTIVES, AND POLICY ACTIONS
Nnnnnnnnnnnnnriding to 2050
nnnnnnnnnnnnn San Diego Regional Bicycle Plan
Attachment 1 :: Riding to 2050: The San Diego Regional Bicycle Plan 61
RECOMMENDED PROGRAMS | 39
riding to 2050 nnnnnnnnnnnnn
San Diego Regional Bicycle Plannnnnnnnnnnnnn
4 Recommended Programs The infrastructure projects and system improvements recommended by the
Plan are intended to be complemented by programs designed to raise
awareness of bicycling; connect current and future cyclists to resources;
educate people about safe bicycle operation, bicyclists’ rights and
responsibilities, and lawful interactions between motorists and cyclists; and
encourage residents to bicycle more frequently.
The Plan describes several proposed bicycle programs whose success in the
San Diego region would be contingent on cooperation between regional
agencies, municipal governments, and non-governmental organizations
(NGOs) for funding and implementation. In many cases, these programs
can be implemented by NGOs provided they are adequately funded.
The selection of programs proposed in this plan is largely derived from a
review of strengths and weakness in the region’s existing programs as well
as a national-level review of best practices. An overview of existing
programmatic conditions can be found in Appendix A.
The proposed programs are intended to provide direction to the San Diego
region for developing programs that directly support the goals, objectives,
and policies of the Plan. This chapter presents a discussion of each of the
following program categories:
Education Programs
Public Awareness Programs/Marketing
Encouragement Programs
Enforcement Programs
Monitoring & Evaluation
Each section contains an overview of the program category and synopses of
representative programs within each category. The presentation of each
proposed program includes identification of the target audience, the
primary implementing agency, potential partners, key elements of the
program, relative cost, potential funding sources, and exemplary programs.
The proposed programs were selected based upon information garnered
over the course of this planning process, including public input, direction
from the Bicycle-Pedestrian Working Group (BPWG) and SANDAG staff,
and from an analysis of the likely effectiveness of each program in the San
Diego region.
This chapter is intended to introduce a spectrum of programs that are
successful in other locations, but are currently absent or underserved the
San Diego region. Their introduction serves as a jumping off point for
Attachment 1 :: Riding to 2050: The San Diego Regional Bicycle Plan 62

40 | RECOMMENDED PROGRAMS
Nnnnnnnnnnnnnriding to 2050
nnnnnnnnnnnnn San Diego Regional Bicycle Plan
further exploration of their application. Local governments can use this
chapter as a menu of potential programs, select certain programs for further
examination, and include this selected subset of programs in their bicycle
master plans with more detailed discussions related to implementation in
their respective city.
4.1 Education Programs Education programs ensure that bicyclists, pedestrians, and motorists
understand how to travel safely in the roadway environment and are
cognizant of the regulations that govern these modes of transportation.
Education programs are available in an array of forums from long-term
courses with detailed instruction to single session workshops focusing on a
specific topic. Curriculums should be tailored to the target audience with
specific content varying by audience group and instruction format. The
following education programs are recommended for implementation in the
region and described in more detail in the remainder of the section:
Complete Streets Education
Driver’s Education and Diversion Classes
Safe Routes to School – Phase 1
Cycling Skills and Safety Courses (Adult & Youth)
Complete Streets Education Target City planners and engineers, police officers,
construction crews and professional drivers
Primary agency Local governments
Partners SANDAG, research and education institutions
Key elements Internal or off-site educational programs for
professionals
Cost $50,000 to $100,000 annually
Potential funding sources TDA & TransNet funds; California Bicycle Coalition;
Municipal Planning Organizations (MPOs)
Sample programs UC Berkeley ITS TE-19 Course:
http://www.its.berkeley.edu/education/ Achieving Complete Streets requires shifting the paradigm of roadway
planning and design away from preference to motorists and toward an
approach that accommodates all forms of travelers, including bicyclists,
pedestrians, transit riders, children, older people, disabled people, and
motorists. In 2008 California passed the Complete Streets Act, joining
several states and local governments who have adopted a variety of policies
to achieve complete streets. Implementing Complete Streets legislation
Attachment 1 :: Riding to 2050: The San Diego Regional Bicycle Plan 63

RECOMMENDED PROGRAMS | 41
riding to 2050 nnnnnnnnnnnnn
San Diego Regional Bicycle Plannnnnnnnnnnnnn
requires educating professionals whose work directly or indirectly impacts
the roadway environment. The San Diego region would benefit from a
comprehensive Complete Streets training program that could be made
available to city planners, engineers, and decision-makers. The American
Planning Association (APA) has developed a Best Practices Manual on Complete Streets (http://www.planning.org/research/streets/) which is a product of
long-term research and collaboration with organizations such as the
National Complete Streets Coalition.
Contractors, subcontractors, and city maintenance and utility crews should
also receive instruction to ensure they are aware of bicyclists and
pedestrians movements and that they follow standard procedures when
working on or adjacent to roadways and walkways.
Driver’s Education & Diversion Courses Target Learning drivers; traffic violators
Primary agency Bicycle organizations, traffic courts (i.e. San Diego
Superior Court), city transportation departments and
police departments
Partners Driver education schools, court-approved traffic schools
Key elements Curriculum, testing materials, and training videos
Cost $50,000 to $100,000 annually
Potential funding
sources
TDA & TransNet funds; National Highway Traffic Safety
Administration
Sample programs League of American Bicyclists:
http://bikeleague.org/programs/education/courses.php
League of Illinois Bicyclists:
http://www.bikelib.org/video/
The Mobility Education Foundation (Seattle):
http://www.mobilityeducation.org
Marin County:
http://www.marinbike.org/Campaigns/ShareTheRoad/In
dex.shtml#StreetSkills
Portland:
http://www.legacyhealth.org/body.cfm?id=1928 Educating beginning drivers on rules related bicycling and how to safely
interact with bicyclists provides an opportunity to instill positive attitudes
and behaviors when new drivers are developing driving habits. Multiple
organizations have created curriculums, instructional videos, and tests to be
integrated into driver’s education courses that teach new motorists laws
and safe practices related to bicycle travel. Programs are frequently
initiated through partnerships between city police or transportation
Attachment 1 :: Riding to 2050: The San Diego Regional Bicycle Plan 64
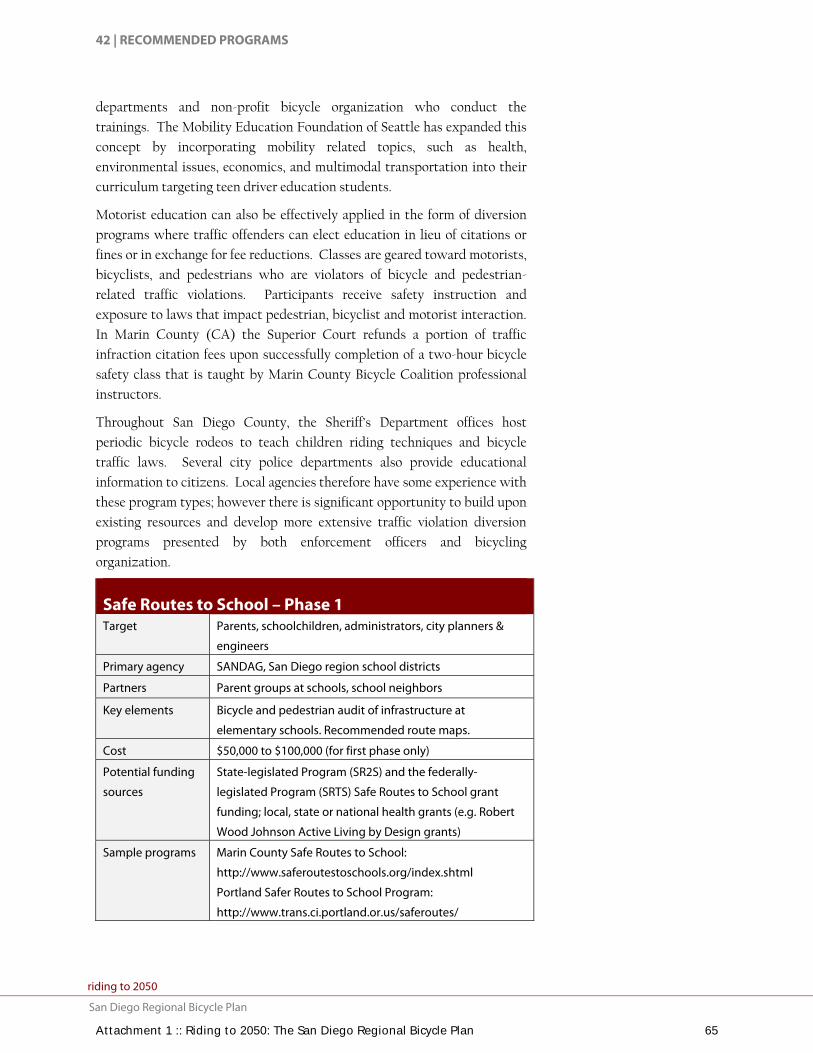
42 | RECOMMENDED PROGRAMS
Nnnnnnnnnnnnnriding to 2050
nnnnnnnnnnnnn San Diego Regional Bicycle Plan
departments and non-profit bicycle organization who conduct the
trainings. The Mobility Education Foundation of Seattle has expanded this
concept by incorporating mobility related topics, such as health,
environmental issues, economics, and multimodal transportation into their
curriculum targeting teen driver education students.
Motorist education can also be effectively applied in the form of diversion
programs where traffic offenders can elect education in lieu of citations or
fines or in exchange for fee reductions. Classes are geared toward motorists,
bicyclists, and pedestrians who are violators of bicycle and pedestrian-
related traffic violations. Participants receive safety instruction and
exposure to laws that impact pedestrian, bicyclist and motorist interaction.
In Marin County (CA) the Superior Court refunds a portion of traffic
infraction citation fees upon successfully completion of a two-hour bicycle
safety class that is taught by Marin County Bicycle Coalition professional
instructors.
Throughout San Diego County, the Sheriff’s Department offices host
periodic bicycle rodeos to teach children riding techniques and bicycle
traffic laws. Several city police departments also provide educational
information to citizens. Local agencies therefore have some experience with
these program types; however there is significant opportunity to build upon
existing resources and develop more extensive traffic violation diversion
programs presented by both enforcement officers and bicycling
organization.
Safe Routes to School – Phase 1Target Parents, schoolchildren, administrators, city planners &
engineers
Primary agency SANDAG, San Diego region school districts
Partners Parent groups at schools, school neighbors
Key elements Bicycle and pedestrian audit of infrastructure at
elementary schools. Recommended route maps.
Cost $50,000 to $100,000 (for first phase only)
Potential funding
sources
State-legislated Program (SR2S) and the federally-
legislated Program (SRTS) Safe Routes to School grant
funding; local, state or national health grants (e.g. Robert
Wood Johnson Active Living by Design grants)
Sample programs Marin County Safe Routes to School:
http://www.saferoutestoschools.org/index.shtml
Portland Safer Routes to School Program:
http://www.trans.ci.portland.or.us/saferoutes/
Attachment 1 :: Riding to 2050: The San Diego Regional Bicycle Plan 65

RECOMMENDED PROGRAMS | 43
riding to 2050 nnnnnnnnnnnnn
San Diego Regional Bicycle Plannnnnnnnnnnnnn
Safe Routes to School refers to a variety of multi-disciplinary programs
aimed at promoting walking and bicycling to school, and improving traffic
safety around school areas. Robust Safe Routes to School programs address
all of the “Five E’s” (Engineering, Education, Encouragement, Enforcement,
and Evaluation) and typically involve partnerships between municipalities,
school districts, community and parent volunteers, and law enforcement
agencies. Numerous San Diego communities have utilized Caltrans
programs to develop Safe Routes to School projects, including
neighborhoods in San Diego’s City Heights, East County neighborhoods,
and the city of Chula Vista.
For San Diego County school districts that have not implemented a Safe
Routes to School Program, an example of a first phase program uses
walkabouts (also known as a bicycle and pedestrian audits) to assess
walking and biking conditions of streets adjacent to elementary schools.
Parents, students, neighbors, city planners, and traffic engineers are invited
to join in the walkabout. Safety concerns, issues, and ideas are recorded.
After the bicycle and pedestrian audits are conducted, maps for each
elementary school showing recommended routes to reach school, along
with high-traffic intersections and routes to avoid, are produced and
distributed.
As a final step, an initial infrastructure improvement plan is produced for
each elementary school, including cost estimates and a prioritized project
list. This infrastructure improvement plan serves as a blueprint for future
investments, and can be used to apply for further grant funding.
Students participate in a walkabout to evaluate pedestrian
conditions
Attachment 1 :: Riding to 2050: The San Diego Regional Bicycle Plan 66

44 | RECOMMENDED PROGRAMS
Nnnnnnnnnnnnnriding to 2050
nnnnnnnnnnnnn San Diego Regional Bicycle Plan
Cycling Skills & Safety Courses (Adult & Youth)Target Adult cyclists, school-age children
Primary agency Bicycle organizations, school districts, cities’ public safety,
police and planning departments
Partners Parent groups at schools, community volunteers
Key elements On-bike skills and safety training
Cost $50,000 to $100,000
Potential funding
sources
State-legislated Program (SR2S) and the federally-legislated
Program (SRTS) Safe Routes to School grant funding; local,
state or national health grants (e.g. Robert Wood Johnson
Active Living by Design grants); TDA & TransNet funds
Sample programs LAB’s curriculums:
http://www.bikeleague.org/programs/education/index.php
BTA’s Bike Safety Education Program:
http://www.bta4bikes.org/resources/educational.php
Nearly every person in the United States receives in-depth training before
receiving a driver’s license. Bicycles are also vehicles used on roadways, but
most bicyclists do not receive comprehensive training about the rules of the
road related to bicyclist-motorist interactions, how bicycles operate, or how
to ride a bicycle safely and effectively on the roadway.
Volunteers assist Swiss children through a bicycle skills course
Attachment 1 :: Riding to 2050: The San Diego Regional Bicycle Plan 67
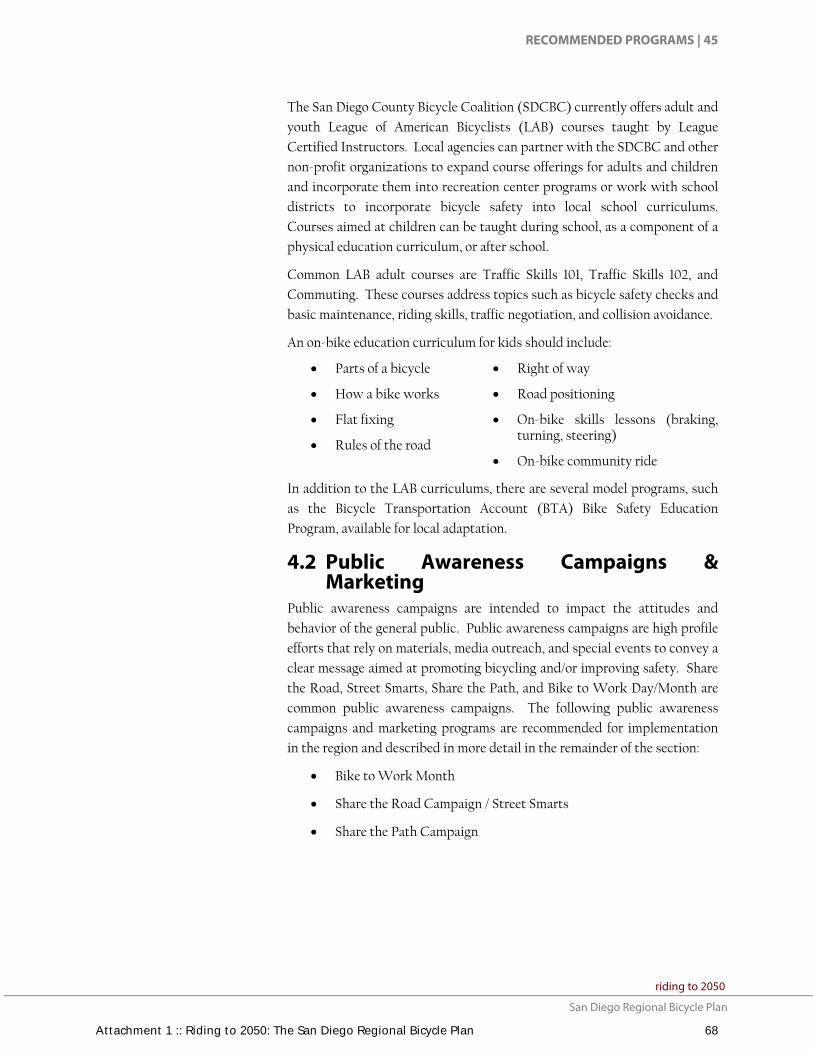
RECOMMENDED PROGRAMS | 45
riding to 2050 nnnnnnnnnnnnn
San Diego Regional Bicycle Plannnnnnnnnnnnnn
The San Diego County Bicycle Coalition (SDCBC) currently offers adult and
youth League of American Bicyclists (LAB) courses taught by League
Certified Instructors. Local agencies can partner with the SDCBC and other
non-profit organizations to expand course offerings for adults and children
and incorporate them into recreation center programs or work with school
districts to incorporate bicycle safety into local school curriculums.
Courses aimed at children can be taught during school, as a component of a
physical education curriculum, or after school.
Common LAB adult courses are Traffic Skills 101, Traffic Skills 102, and
Commuting. These courses address topics such as bicycle safety checks and
basic maintenance, riding skills, traffic negotiation, and collision avoidance.
An on-bike education curriculum for kids should include:
Parts of a bicycle
How a bike works
Flat fixing
Rules of the road
Right of way
Road positioning
On-bike skills lessons (braking, turning, steering)
On-bike community ride
In addition to the LAB curriculums, there are several model programs, such
as the Bicycle Transportation Account (BTA) Bike Safety Education
Program, available for local adaptation.
4.2 Public Awareness Campaigns & Marketing
Public awareness campaigns are intended to impact the attitudes and
behavior of the general public. Public awareness campaigns are high profile
efforts that rely on materials, media outreach, and special events to convey a
clear message aimed at promoting bicycling and/or improving safety. Share
the Road, Street Smarts, Share the Path, and Bike to Work Day/Month are
common public awareness campaigns. The following public awareness
campaigns and marketing programs are recommended for implementation
in the region and described in more detail in the remainder of the section:
Bike to Work Month
Share the Road Campaign / Street Smarts
Share the Path Campaign
Attachment 1 :: Riding to 2050: The San Diego Regional Bicycle Plan 68

46 | RECOMMENDED PROGRAMS
Nnnnnnnnnnnnnriding to 2050
nnnnnnnnnnnnn San Diego Regional Bicycle Plan
Bike to Work Month Target Current and potential cyclists
Primary agency SANDAG, San Diego County Bicycle Coalition
Partners Local businesses, other local bicycle clubs and advocacy
groups, community volunteers
Key elements Publicize National Bike Month in May. Offer classes, rides
and events.
Cost $50,000 to $100,000+ (depending on scope)
Potential funding
sources
Local businesses and bike shops (in-kind or cash
support); hospitals and insurance companies; local
government agencies
Sample program Puget Sound Region Bike to Work Month Activities:
http://www.cbcef.org/btw/
SANDAG iCommute coordinates Bike to Work Day in May with the
assistance of local bicycle organizations and businesses
(http://www.icommutesd.com/Promotions/BikeToWorkDay.aspx). The
popularity of this event has grown significantly in recent years. Supporting
activities throughout the month of May, in recognition of National Bike
Month, could expand the campaign’s impact.
Options for expanding Bike to Work activities during the month of May
include offering commute classes, weekly rides, presentations on bicycling
for employees, raffles, and commuter incentives. The League of American
Bicyclists organization’s website provides marketing, educational, and
organizational materials to help cities promote and support bike to work
week (http://www.bikeleague.org/programs/bikemonth/).
Share the Road Campaign/Street SmartsTarget All roadway users
Primary agency Local governments’ public safety and police departments,
bicycle organizations
Partners Local bike clubs and organizations
Key elements Multimedia and printed promotional materials; events
Cost $50,000 to $100,000+
Potential funding
sources
State or national health grants (e.g. Robert Wood Johnson
Active Living by Design grants); TDA & TransNet funds
Sample programs Share the Road: http://isharetheroad.com/
City of San Jose Street Smarts:
http://www.getstreetsmarts.org/pr_121702.htm
Attachment 1 :: Riding to 2050: The San Diego Regional Bicycle Plan 69

RECOMMENDED PROGRAMS | 47
riding to 2050 nnnnnnnnnnnnn
San Diego Regional Bicycle Plannnnnnnnnnnnnn
A Share the Road campaign is intended to educate motorists, bicyclists, and
pedestrians about their legal rights and responsibilities on the road, and the
need to increase safety through courteous and cooperative behavior. The
campaign targets all residents and visitors to a community. Developing a
Share the Road campaign would require collaboration between local Public
Safety Departments (or Police Divisions), San Diego bicycling advocacy
groups, and other partners. Establishing Share the Road campaigns
generally include:
Developing Share the Road flyers, one targeting bicyclists and one
targeting motorists, which outline safe and courteous behavior,
collision reporting procedures, and local bicycling resources and
hotlines.
In conjunction with the Police Department, holding periodic
traffic checkpoints during months with high bicycling rates,
where motorists, bicyclists, and pedestrians are stopped, given a
Share the Road flyer and have the opportunity to provide feedback
to officers regarding the campaign ideas. Checkpoints are typically
held along local bikeways and roadways commonly used by
bicyclists.
Producing public service announcements on radio and TV to
promote the Share the Road campaign, including publicity about
the Share the Road checkpoints. Promoting the campaign on
involved agencies’ websites.
Creating public PowerPoint presentations with the Share the
Road message for presentation to the public.
Developing adult bicycle safety classes and holding them at
regular intervals.
Similar to a comprehensive Share the Road campaign, Street Smarts, a traffic
calming program developed by the City of San Jose, combines an advertising
campaign with techniques, such as community events, school presentations,
and neighborhood initiatives. Street Smarts aims to provoke fundamental
change in the attitudes and behaviors of motorists, pedestrians, and
bicyclists.
Attachment 1 :: Riding to 2050: The San Diego Regional Bicycle Plan 70

48 | RECOMMENDED PROGRAMS
Nnnnnnnnnnnnnriding to 2050
nnnnnnnnnnnnn San Diego Regional Bicycle Plan
Share the Path Campaign Target All path users (especially cyclists)
Primary agency Local governments’ planning, police or parks and recreation
departments
Partners Local bicycling clubs and organizations
Key elements Bell giveaway; maps and information; media outreach.
Cost $50,000 to $100,000
Potential
funding sources
Local bike shops (in-kind donations); volunteer time
contributions by local cycling groups; in-kind or time
contributions; TDA & TransNet funds
Sample
programs
Portland Office of Transportation Share the Path brochure:
http://www.portlandonline.com/shared/cfm/image.cfm?id=1
61457 Many cities around the country are implementing “share the path” programs
in response to concerns about conflicts between pedestrians and cyclists on
shared-use paths. San Diego County is home to numerous popular paths. A
Share the Path program will encourage responsible path usage and create
community goodwill around bicycling.
Effective Share the Path campaigns generally require the following actions:
Developing a simple, clear Share the Path brochure for
distribution through local bike shops and wherever bike maps are
distributed.
Hosting a bicycle bell giveaway event on a popular shared-use
path. A table is set up with maps and brochures, and
knowledgeable staff are present to answer questions.
Volunteers and agency staff can partner to hand out bells to
cyclists. Signs, pavement chalk, and banners are used to explain the
event and give cyclists warning so they can stop and receive a bell.
Volunteers mount the bells on handlebars (BBB EasyFit bells are
recommended because installation requires no tools:
http://www.bbbparts.com/products/accessories/others/bbb12.htm)
Volunteers can also walk along the path and give a thank you and a
small gift to bicyclists who use their bells when passing.
Involved agencies conduct media outreach before the event. Bell
giveaways provide positive stories about bicycling and good visual
opportunities for marketing.
Attachment 1 :: Riding to 2050: The San Diego Regional Bicycle Plan 71

RECOMMENDED PROGRAMS | 49
riding to 2050 nnnnnnnnnnnnn
San Diego Regional Bicycle Plannnnnnnnnnnnnn
4.3 Encouragement Programs Encouragement programs are generally characterized by their focus on
encouraging people to bicycle more frequently, particularly for
transportation. Encouragement programs increase the propensity for
bicycle trips by providing incentives, recognition, or services that make
bicycling a more convenient transportation mode. The following
encouragement programs are recommended for implementation in the
region and described in more detail in the remainder of the section:
Bike Sharing Program
Pilot Smart Trips Program
Employer Incentive Programs
Bicycle Friendly Community Designation
San Diego Region Bike Map
Identification and Way-finding Signage
University-base Bike Orientation
Bike Sharing ProgramTarget Bicyclists and potential bicyclists
Primary agency SANDAG
Partners Local governments; MTS
Key elements Rental bikes available at key locations. Comprehensive
outreach.
Cost $100,000+
Potential funding
sources
CMAQ (Congestion Mitigation/Air Quality) funds; SAFETEA-
LU; TE, ; public transportation funds; TDA & TransNet funds
Sample programs Paris’ Velib: http://www.en.velib.paris.fr/
Germany’s Call a Bike: http://www.callabike-
interaktiv.de/kundenbuchung/process.php?proc=english&f
=500&key=d77b3782346423c9f6ea41d27f412b00...00000
City of Houston:
http://www.publicworks.houstontx.gov/bikeways/bikecam
paign.htm
Bike sharing is an innovative approach to urban mobility, combining the
convenience and flexibility of a private vehicle with the accessibility and
reliability of public mass transit. Public bicycles are available on demand,
providing fast and easy access for any trip around a community without the
hassles presented by parking a private car or waiting on a transit timetable.
When used in combination with other transportation systems, a shared
bike program can reduce the travel time between transit stop and office and
easily overcome the distance between residences and shopping centers. The
Attachment 1 :: Riding to 2050: The San Diego Regional Bicycle Plan 72

50 | RECOMMENDED PROGRAMS
Nnnnnnnnnnnnnriding to 2050
nnnnnnnnnnnnn San Diego Regional Bicycle Plan
flexibility and freedom presented by a public bicycle program are well
suited for modern urban commutes. Bike sharing programs generally
facilitate biking for shorter trip distances. Within the regional setting, bike
sharing nodes ease congestion in dense urban areas and encourage transit
use by inter-jurisdictional commuters by providing a convenient
transportation option to make local trips throughout the course of the
workday.
Public bicycle programs have gained momentum all over Europe with new
networks of rental systems rolling out in a variety of cities. Ninety-plus
cities in Europe, Australia, and Asia already take advantage of some form of
shared bike infrastructure. Italy, France, Germany, and Spain have all
enjoyed the success and popularity of a public bicycle rental system. North
America has active bike sharing programs in Washington D.C., Chicago,
University of California at Irvine, and Montreal with many other cities
planning to implement bicycle systems in the coming years. Sophisticated
tracking and transaction technology has contributed to the public appeal of
these programs by allowing users to see the availability of bicycles and
parking stations live through internet and mobile devices, a level of
accessibility on par with, and sometimes surpassing, transit and traditional
vehicle parking systems. In most cases this technology and infrastructure
can be introduced into any city.
Municipal bike fleet programs have proven successful in several U.S. cities
including Houston, San Francisco, and Portland. These programs provide
bicycles to city employees to use for free for travel between city buildings
and meetings or errands.
Pilot Smart Trips Program Target San Diego County residents who are interested in biking,
walking and transit
Primary agency Local governments
Partners SANDAG, transit agencies, community volunteers
Key elements Outreach to a target geographic area promoting biking,
walking and transit usage.
Cost $100,000+
Potential
funding sources
CMAQ (Congestion Mitigation/Air Quality) funds; federal
flexible transportation; public transportation funds; hospitals
and insurance companies; TDA & TransNet funds
Sample
programs
Portland Smart Trips program:
http://www.portlandonline.com/transportation/index.cfm?c=
ediab
Attachment 1 :: Riding to 2050: The San Diego Regional Bicycle Plan 73

RECOMMENDED PROGRAMS | 51
riding to 2050 nnnnnnnnnnnnn
San Diego Regional Bicycle Plannnnnnnnnnnnnn
Smart Trips programs (also known as social marketing programs) are
encouragement programs based on the concept of saturating a geographic
area with resources to help residents reduce drive-alone trips and increase
biking, walking, transit, and carpool trips. Smart Trips programs have
demonstrated a lasting reduction in drive-alone trips. Target areas in
Portland, Oregon for example have experienced a 10% reduction in vehicle
traffic.15
Programs offer residents maps, brochures and other printed materials,
classes, guided rides and walks, and other tools and programs that make
bicycling, walking, and transit usage a more inviting travel option compared
to drive-alone trips.
Measured against infrastructure improvements, these programs are scalable, flexible, inexpensive, and site-independent. Once the program has been established for a specific geographic target area, it can be administered with low start-up costs in other target areas.
This model, however, is unlikely to be successful in areas that have failed to make initial infrastructure investments sufficient to provide a functional bicycling, walking, and transit network. It is most effective as an approach that leverages investments in infrastructure, not one that replaces those investments.
One of the strengths of the individualized marketing model is that it reaches
every resident with an appealing invitation to participate, but then focuses
the bulk of resources on those who identify themselves as interested. The
15 Alta Planning + Design, 2009
Maps and materials are delivered to interested residents by bike in this
Smart Trips program
Attachment 1 :: Riding to 2050: The San Diego Regional Bicycle Plan 74
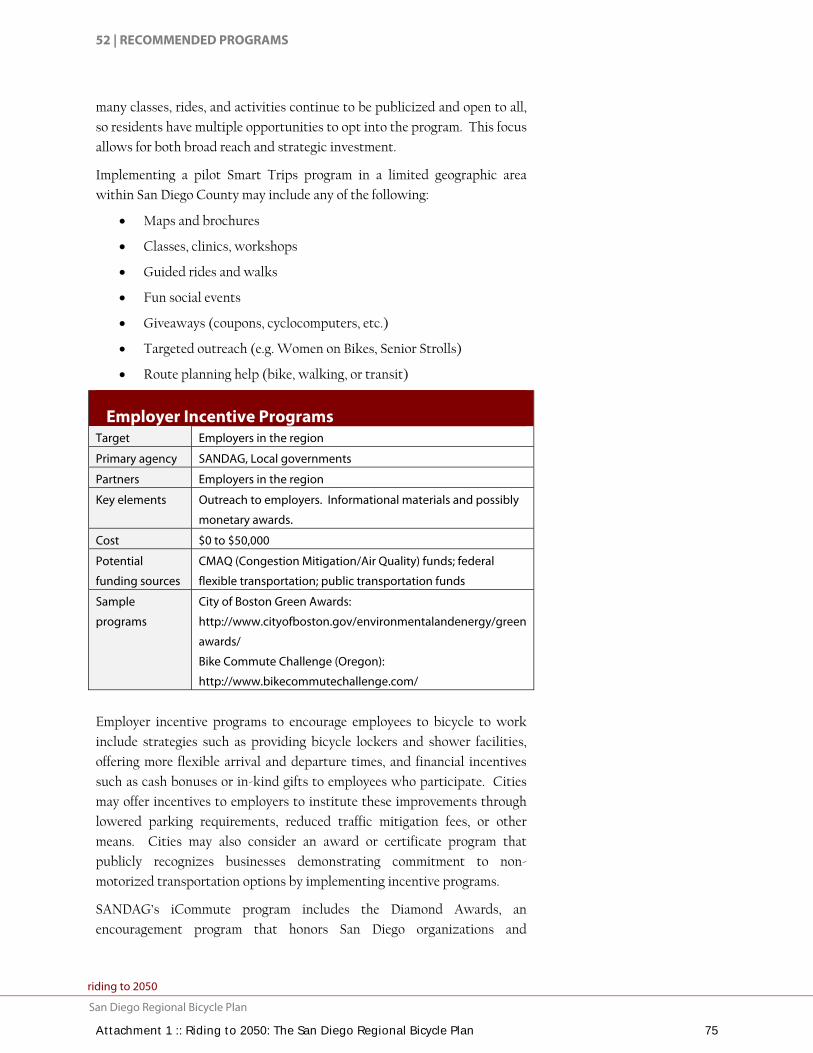
52 | RECOMMENDED PROGRAMS
Nnnnnnnnnnnnnriding to 2050
nnnnnnnnnnnnn San Diego Regional Bicycle Plan
many classes, rides, and activities continue to be publicized and open to all,
so residents have multiple opportunities to opt into the program. This focus
allows for both broad reach and strategic investment.
Implementing a pilot Smart Trips program in a limited geographic area
within San Diego County may include any of the following:
Maps and brochures
Classes, clinics, workshops
Guided rides and walks
Fun social events
Giveaways (coupons, cyclocomputers, etc.)
Targeted outreach (e.g. Women on Bikes, Senior Strolls)
Route planning help (bike, walking, or transit)
Employer Incentive ProgramsTarget Employers in the region
Primary agency SANDAG, Local governments
Partners Employers in the region
Key elements Outreach to employers. Informational materials and possibly
monetary awards.
Cost $0 to $50,000
Potential
funding sources
CMAQ (Congestion Mitigation/Air Quality) funds; federal
flexible transportation; public transportation funds
Sample
programs
City of Boston Green Awards:
http://www.cityofboston.gov/environmentalandenergy/green
awards/
Bike Commute Challenge (Oregon):
http://www.bikecommutechallenge.com/
Employer incentive programs to encourage employees to bicycle to work
include strategies such as providing bicycle lockers and shower facilities,
offering more flexible arrival and departure times, and financial incentives
such as cash bonuses or in-kind gifts to employees who participate. Cities
may offer incentives to employers to institute these improvements through
lowered parking requirements, reduced traffic mitigation fees, or other
means. Cities may also consider an award or certificate program that
publicly recognizes businesses demonstrating commitment to non-
motorized transportation options by implementing incentive programs.
SANDAG’s iCommute program includes the Diamond Awards, an
encouragement program that honors San Diego organizations and
Attachment 1 :: Riding to 2050: The San Diego Regional Bicycle Plan 75

RECOMMENDED PROGRAMS | 53
riding to 2050 nnnnnnnnnnnnn
San Diego Regional Bicycle Plannnnnnnnnnnnnn
individuals promoting alternative travel options such as vanpooling,
carpooling, use of public transit, walking, and biking
(http://www.icommutesd.com/Promotions/DiamondAwards.aspx).
Companies and organizations are eligible to receive one of the following
award categories:
Program Excellence
Innovation
Marketing
Ongoing Commitment
Best New Program
Programs that promote biking and bike-transit integration may be eligible
for an award under each category. However, iCommute may consider
revising these categories to include a bike-friendly category or non-
motorized transport category in order to elevate awareness of these program
types.
Bicycle Friendly Community Designation Target General public
Primary agency Local governments
Partners Bicycle advocacy organizations
Key elements Bicycle Friendly audit and application.
Cost $0 to $50,000 (to apply)
Potential funding sources Funding may not be required.
Sample programs Bicycle Friendly Community Information:
http://www.bikeleague.org/programs/bicyclefrien
dlyamerica/communities/ The League of American Bicyclists sponsors an awards program that
recognizes cities and counties that actively support bicycling. According to
the League, a Bicycle Friendly Community is one that “provides safe
accommodation for cycling and encourages its residents to bike for
transportation and recreation.” The league recognizes four tiers of bicycle
friendly communities: bronze, silver, gold, and platinum. In 2008 the City of
Oceanside was the recipient of a Bronze Level Bicycle Friendly Community
designation and is the first jurisdiction to receive the distinction in the San
Diego region. Other jurisdictions may choose to develop action plans that
fulfill the League of American Cyclist’s requirements to become a Bicycle
Friendly Community. Bicycle Friendly Community designation promotes
bicycling and demonstrates communities’ commitment and willingness to
be held accountable.
Attachment 1 :: Riding to 2050: The San Diego Regional Bicycle Plan 76
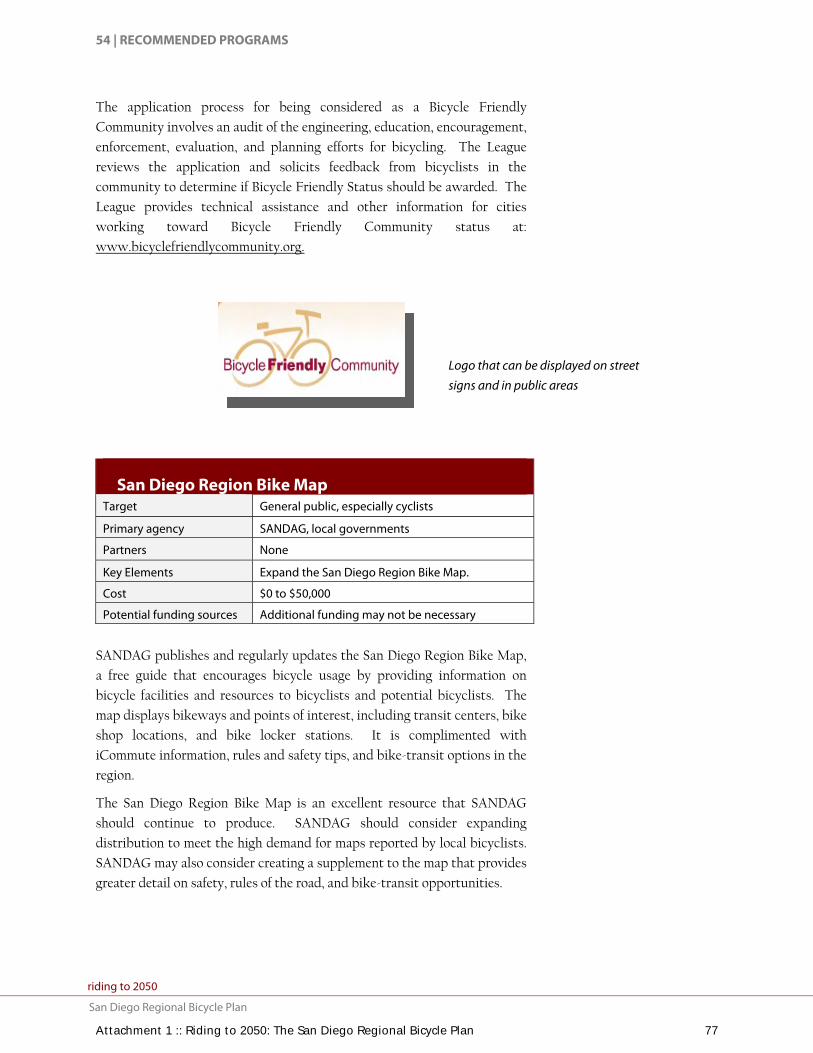
54 | RECOMMENDED PROGRAMS
Nnnnnnnnnnnnnriding to 2050
nnnnnnnnnnnnn San Diego Regional Bicycle Plan
The application process for being considered as a Bicycle Friendly
Community involves an audit of the engineering, education, encouragement,
enforcement, evaluation, and planning efforts for bicycling. The League
reviews the application and solicits feedback from bicyclists in the
community to determine if Bicycle Friendly Status should be awarded. The
League provides technical assistance and other information for cities
working toward Bicycle Friendly Community status at:
www.bicyclefriendlycommunity.org.
San Diego Region Bike MapTarget General public, especially cyclists
Primary agency SANDAG, local governments
Partners None
Key Elements Expand the San Diego Region Bike Map.
Cost $0 to $50,000
Potential funding sources Additional funding may not be necessary
SANDAG publishes and regularly updates the San Diego Region Bike Map,
a free guide that encourages bicycle usage by providing information on
bicycle facilities and resources to bicyclists and potential bicyclists. The
map displays bikeways and points of interest, including transit centers, bike
shop locations, and bike locker stations. It is complimented with
iCommute information, rules and safety tips, and bike-transit options in the
region.
The San Diego Region Bike Map is an excellent resource that SANDAG
should continue to produce. SANDAG should consider expanding
distribution to meet the high demand for maps reported by local bicyclists.
SANDAG may also consider creating a supplement to the map that provides
greater detail on safety, rules of the road, and bike-transit opportunities.
Logo that can be displayed on street signs and in public areas
Attachment 1 :: Riding to 2050: The San Diego Regional Bicycle Plan 77

RECOMMENDED PROGRAMS | 55
riding to 2050 nnnnnnnnnnnnn
San Diego Regional Bicycle Plannnnnnnnnnnnnn
Identification & Way-finding Signage Target General public, especially cyclists
Primary agency SANDAG
Partners Local Governments
Key Elements Signage
Cost To be determined with implementation
Potential funding
sources
Low cost; additional funding may not be necessary
System identification raises awareness of the bicycle network and
encourages more bicycle trips by making it easier for people to navigate to
destinations. System identification generally consists of identifying a series
of bicycle routes, designing a unique logo and facility signage, developing a
network map, and publicity. Ideally, the system also includes informational
kiosks, directional signage pointing out local and regional destinations, and
mileage indicators. The Plan recommends that all facilities within the
regional bicycle network be complimented with identification and
wayfinding signage. This will require coordination with city governments.
As system identification plans are usually implemented and maintained by
cities, local governments may choose to build upon the regional system to
develop city-based wayfinding and identification systems.
Recommendations on wayfinding signage design protocol are provided in
Chapter 7.
University-Based Bike OrientationTarget University and college students, especially incoming
freshmen
Primary agency Local governments & universities/colleges
Partners Student bicycle clubs
Key elements Bicycle safety & promotion orientation for incoming
freshmen and returning students. Classes & clinics, materials,
social events, and rides.
Cost $50,000 to $100,000
Potential
funding sources
On-campus parking fees, TDM funding sources
Sample
programs
Stanford University Bike Program:
http://transportation.stanford.edu/alt_transportation/Biking
AtStanford.shtml
University students are ideal candidates for bicycling outreach programs;
many students live near campus and may not own a car or choose not to
Attachment 1 :: Riding to 2050: The San Diego Regional Bicycle Plan 78

56 | RECOMMENDED PROGRAMS
Nnnnnnnnnnnnnriding to 2050
nnnnnnnnnnnnn San Diego Regional Bicycle Plan
drive. The San Diego region is home to several major universities and
colleges, such as San Diego State University (SDSU), University of
California–San Diego (UCSD), Cal State University San Marcos (CSUSM),
and University of San Diego (USD), however many university campuses and
college areas are unaccommodating to bicycle travel. UCSD offers
successful biking encouragement programs, including the UCSD Pedal Club
and the Triton Bikes Program, a free on-campus bike sharing program.
There is also an on-campus UCSD Bike Shop. A bike orientation program is
one option for universities to add to or initiate multimodal program
strategies. Bike orientation programs encourage bicycling, improve relations
between bicyclists and other vehicles, and increase safety for student
bicyclists.
Bike orientation programs typically include:
Bike maps and information provided to incoming and returning students at the beginning of the year through school informational packets
Flat tire clinics and guided rides, advertised through flyers, email and bulletin boards, and campus newspapers
Information table hosted at campus events and prominent locations (e.g. campus bookstores, quads) during the first few weeks of school
A Bikes at SDSU (for example) web page with links and more information
At-cost or low-cost bike lights sold at tabling events and through campus bookstores
A “bike buddy” program may also be implemented to match current cycling
students with interested students. This can be a simple program where
bicyclists wear a sticker that says “I bike to SDSU, ask me how,” or a more
elaborate program that matches bike buddies with interested students who
live in their neighborhood for mentoring. Bike buddy programs increase the
cost of university-based programs, but can be an effective tool. SANDAG’s
iCommute offers the option of setting up a university network through its
Ride Matcher program (http://www.icommutesd.com/
Commuters/RideMatcher.aspx).
4.4 Enforcement Programs Enforcement programs target unsafe bicyclist and motorist behaviors and
enforce laws that reduce bicycle/motor vehicle collisions and conflicts.
Enforcement fosters mutual respect between roadway users and improves
safety. These programs generally require coordination between law
enforcement, transportation agencies, and bicycling organizations.
Attachment 1 :: Riding to 2050: The San Diego Regional Bicycle Plan 79

RECOMMENDED PROGRAMS | 57
riding to 2050 nnnnnnnnnnnnn
San Diego Regional Bicycle Plannnnnnnnnnnnnn
Bike Patrol Units & Sting Operations Target General public
Primary agency Local police departments
Partners None
Key Elements On-bike police officers enforcing laws.
Cost $0 to $50,000
Potential funding
sources
Additional funding may not be necessary.
Local police departments enforce applicable laws on roadways, depending
on available resources and priorities. Vehicle statutes related to bicycle
operations are typically enforced on bikeways as part of a department’s
normal operations. Police departments may consider proactively enforcing
bicycle-related violations at high-crash areas. Spot enforcements are highly
visible and publicly advertised. They may take the form of crosswalk stings,
handing out informational sheets to motorists, bicyclists and pedestrians, or
enforcing speed limits and right of way at shared use path-roadway
intersections.
As part of a National Highway Traffic Safety Administration grant awarded
to Utah’s Departments of Health, Transportation, and Public Safety to
develop a Share the Road campaign, the State of Utah has developed an
enforcement plan that targets motorists who do not share the road with
bicyclists. Plainclothes officers on bicycles will stop motorists and cyclists
not following the rules of the road and will provide educational material
developed as part of the grant, as well as cite the transgressors. An officer
on a bicycle will observe the offense and radio to an officer in a chase car
who will make the stop. Multiple municipal police forces in the region
include bike patrol units, such as the City of San Diego, Escondido and
Carlsbad. Bicycle patrol units are encouraged. Bike officers are often
viewed as more approachable and undergo special training in bicycle safety
and bicycle-related traffic laws and are therefore especially equipped to
enforce laws pertaining to bicycling. Bicycle patrol officers also help
educate cyclists and motorists through enforcement.
4.5 Monitoring & Evaluation Monitoring and evaluating local jurisdictions of the region’s progress
toward becoming bicycle-friendly is critical to ensuring that programs and
facilities are effective and to understanding changing needs. Maintaining
consistent count programs, reporting on progress, and convening advisory
committees are methods for monitoring efforts and for holding agencies
accountable to the public. The following monitoring and evaluation
Attachment 1 :: Riding to 2050: The San Diego Regional Bicycle Plan 80
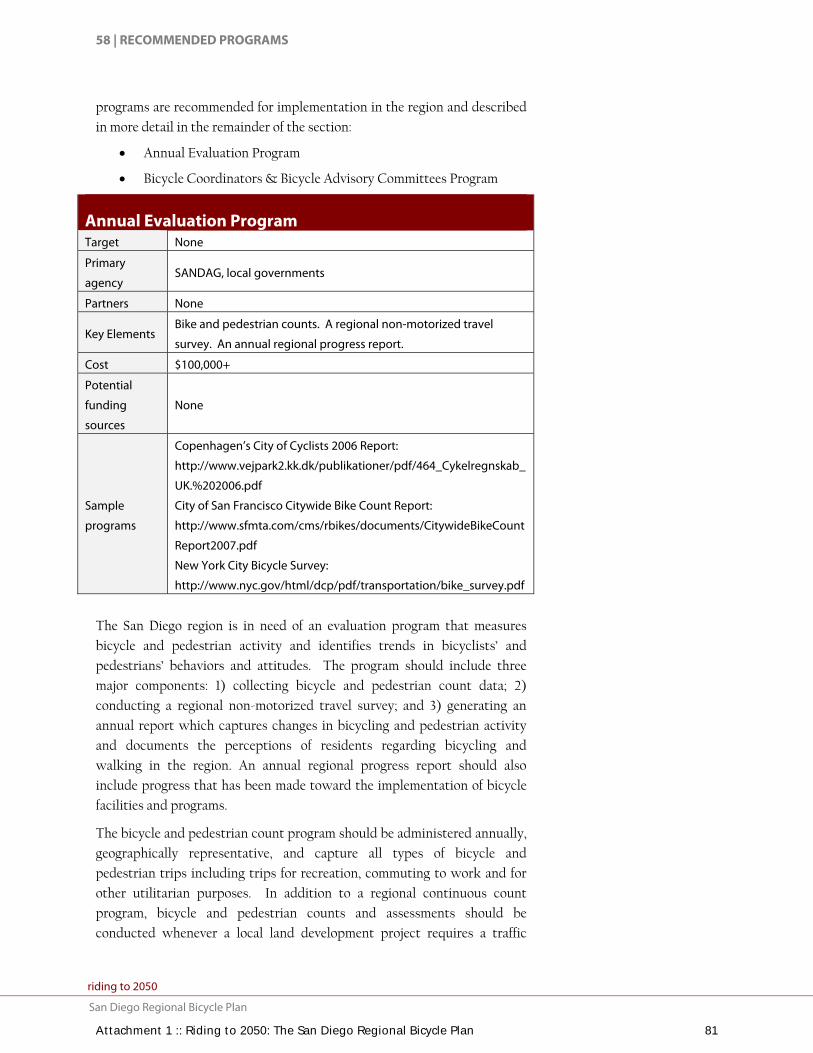
58 | RECOMMENDED PROGRAMS
Nnnnnnnnnnnnnriding to 2050
nnnnnnnnnnnnn San Diego Regional Bicycle Plan
programs are recommended for implementation in the region and described
in more detail in the remainder of the section:
Annual Evaluation Program
Bicycle Coordinators & Bicycle Advisory Committees Program
Annual Evaluation Program Target None
Primary
agency SANDAG, local governments
Partners None
Key Elements Bike and pedestrian counts. A regional non-motorized travel
survey. An annual regional progress report.
Cost $100,000+
Potential
funding
sources
None
Sample
programs
Copenhagen’s City of Cyclists 2006 Report:
http://www.vejpark2.kk.dk/publikationer/pdf/464_Cykelregnskab_
UK.%202006.pdf
City of San Francisco Citywide Bike Count Report:
http://www.sfmta.com/cms/rbikes/documents/CitywideBikeCount
Report2007.pdf
New York City Bicycle Survey:
http://www.nyc.gov/html/dcp/pdf/transportation/bike_survey.pdf
The San Diego region is in need of an evaluation program that measures
bicycle and pedestrian activity and identifies trends in bicyclists’ and
pedestrians’ behaviors and attitudes. The program should include three
major components: 1) collecting bicycle and pedestrian count data; 2)
conducting a regional non-motorized travel survey; and 3) generating an
annual report which captures changes in bicycling and pedestrian activity
and documents the perceptions of residents regarding bicycling and
walking in the region. An annual regional progress report should also
include progress that has been made toward the implementation of bicycle
facilities and programs.
The bicycle and pedestrian count program should be administered annually,
geographically representative, and capture all types of bicycle and
pedestrian trips including trips for recreation, commuting to work and for
other utilitarian purposes. In addition to a regional continuous count
program, bicycle and pedestrian counts and assessments should be
conducted whenever a local land development project requires a traffic
Attachment 1 :: Riding to 2050: The San Diego Regional Bicycle Plan 81
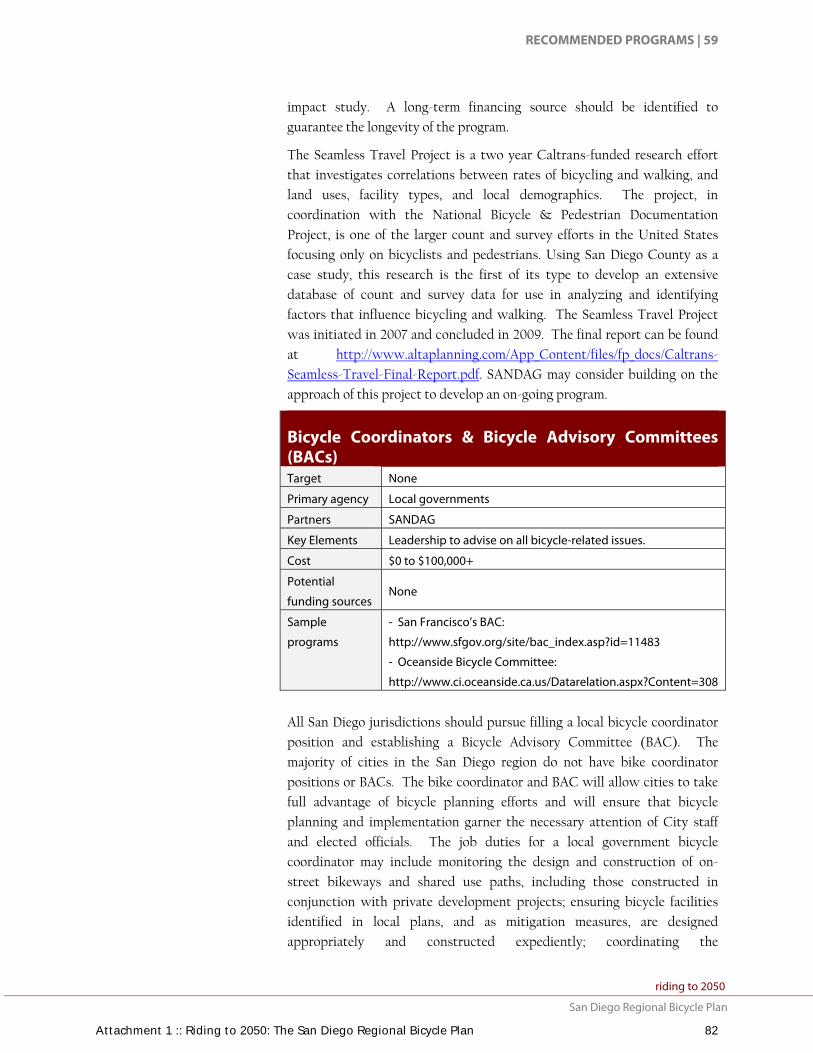
RECOMMENDED PROGRAMS | 59
riding to 2050 nnnnnnnnnnnnn
San Diego Regional Bicycle Plannnnnnnnnnnnnn
impact study. A long-term financing source should be identified to
guarantee the longevity of the program.
The Seamless Travel Project is a two year Caltrans-funded research effort
that investigates correlations between rates of bicycling and walking, and
land uses, facility types, and local demographics. The project, in
coordination with the National Bicycle & Pedestrian Documentation
Project, is one of the larger count and survey efforts in the United States
focusing only on bicyclists and pedestrians. Using San Diego County as a
case study, this research is the first of its type to develop an extensive
database of count and survey data for use in analyzing and identifying
factors that influence bicycling and walking. The Seamless Travel Project
was initiated in 2007 and concluded in 2009. The final report can be found
at http://www.altaplanning.com/App_Content/files/fp_docs/Caltrans-
Seamless-Travel-Final-Report.pdf. SANDAG may consider building on the
approach of this project to develop an on-going program.
Bicycle Coordinators & Bicycle Advisory Committees (BACs)Target None
Primary agency Local governments
Partners SANDAG
Key Elements Leadership to advise on all bicycle-related issues.
Cost $0 to $100,000+
Potential
funding sources None
Sample
programs
- San Francisco’s BAC:
http://www.sfgov.org/site/bac_index.asp?id=11483
- Oceanside Bicycle Committee:
http://www.ci.oceanside.ca.us/Datarelation.aspx?Content=308
All San Diego jurisdictions should pursue filling a local bicycle coordinator
position and establishing a Bicycle Advisory Committee (BAC). The
majority of cities in the San Diego region do not have bike coordinator
positions or BACs. The bike coordinator and BAC will allow cities to take
full advantage of bicycle planning efforts and will ensure that bicycle
planning and implementation garner the necessary attention of City staff
and elected officials. The job duties for a local government bicycle
coordinator may include monitoring the design and construction of on-
street bikeways and shared use paths, including those constructed in
conjunction with private development projects; ensuring bicycle facilities
identified in local plans, and as mitigation measures, are designed
appropriately and constructed expediently; coordinating the
Attachment 1 :: Riding to 2050: The San Diego Regional Bicycle Plan 82
60 | RECOMMENDED PROGRAMS
Nnnnnnnnnnnnnriding to 2050
nnnnnnnnnnnnn San Diego Regional Bicycle Plan
implementation of master plan projects and programs; and serving on the
regional BPWG.
BACs generally consist of 10 to 15 members appointed by city councils or
boards of supervisors to advise the city or county on issues related to
bicycling. BACs make recommendations on facility and program
improvements and oversee the implementation of long-range plans, such as
bicycle master plans. Committee members are citizens with expertise and
commitment to bicycle-related issues and typically represent a geographic
area of the city or county.
SANDAG’s Bicycle-Pedestrian Working Group (BPWG) is a committee
formed to advise SANDAG on the bicycle, pedestrian, and non-motorized
facilities component of the RTP and to make recommendations about
funding priorities for local bicycle and pedestrian projects. The BPWG is
composed of staff members from the 19 local jurisdictions, transit agencies,
and bicycle and pedestrian advocacy groups. The BPWG has also provided
input on all aspects of the Plan content. Individual advocates and non-
profit organizations are currently underrepresented on the BPWG. There
may be benefits to expanding participation by non-agency stakeholders so
that the group strengthens cooperation between public agencies and
citizens and reflects the breadth of perspectives in the region.
Attachment 1 :: Riding to 2050: The San Diego Regional Bicycle Plan 83

AIR QUALITY BENEFITS | 61
riding to 2050 nnnnnnnnnnnnn
San Diego Regional Bicycle Plannnnnnnnnnnnnn
5 Air Quality Benefits of Regional Bicycle Network Implementation This chapter discusses the potential air quality benefits associated with
increasing bicycle use. Section two of this Plan’s introduction summarizes
several issue areas that are positively impacted by the Plan’s implementation
including environmental, public health, economic, community and quality
of life, and safety benefits. Collectively these benefits can have a profound
influence on the existing and future quality of life in the San Diego region.
One of the primary reasons for developing the Plan is to maximize the
number of bicycle commuters in order to help achieve transportation goals
such as providing an alternative to driving, and reducing traffic congestion
and air pollution. Local and national statistics are used as a basis for
estimating the benefits of an improved and expanded regional bicycle
network in San Diego. The national statistics are derived from the 2000
U.S. Census and SANDAG forecasts.
5.1 Current System Usage Understanding how many people bike in the San Diego region is important
to developing a baseline against which to measure success and is also vital
information for grant applications. This section presents bicycle system
usage estimates developed through application of Census data on commuter
mode shares to San Diego County.
A primary data source for estimating biking rates is the United States
Census and the American Community Survey. Journey to work data was
obtained from the 2006 American Community Survey for San Diego County,
California, and the United States for comparison. Table 5.1 displays journey
to work data. As shown, approximately 0.6% of San Diego County journey-
to-work trips are by bicycle. This is less than the state as a whole.
Table 5.1 Journey to Work Data
Mode United States
California San Diego County
Bicycle 0.5% 0.8% 0.6%
Car, Truck or Van – Drive Alone 76.0% 73.0% 80.1%
Car, Truck or Van – Carpool 10.7% 12.4% 11.5%
Public Transit 4.8% 5.0% 3.3%
Walked 2.9% 2.7% 2.9%
Other Means 5.1% 6.1% 1.1%
Source: 2006 American Community Survey
Attachment 1 :: Riding to 2050: The San Diego Regional Bicycle Plan 84
62 | AIR QUALITY BENEFITS
Nnnnnnnnnnnnnriding to 2050
nnnnnnnnnnnnn San Diego Regional Bicycle Plan
This data is likely an underestimate of the true amount of biking in the
county. Census data does not account for the number of people who bicycle
for recreation or for utilitarian purposes, students traveling to school, or
commuters who travel from outside of the county. Census data also only
reflects a person’s predominant commute mode and does not count non-
motorized trips that are part of a multimodal trip, for example a person who
walks or bicycles to a transit station.
5.2 Potential Future Usage and Air Quality Benefits
According to the San Diego County Air Pollution Control District, the
monitoring agency of the San Diego Area Basin’s air quality, the San Diego
region does not currently meet the federal or State eight-hour average ozone
standards nor does it meet the stringent State particulate matter (PM10)
fine particle standards. In the San Diego region, passenger vehicles are the
largest source of air pollution and greenhouse gases (about 41% of the total)
that contribute to climate change. By making bicycle travel a safe and
functional option for everyday trips to work, school, and shops, the regional
bicycle network can help the region improve air quality.
The Climate Action Strategy, SANDAG’s guide for addressing climate
change, identifies measures that reduce total miles of vehicle travel as one of
three potential approaches to reducing greenhouse gas emissions from
passenger vehicles. Measures to increase bicycle trips, including
implementation of the Plan, are one of several potential policy options to
reduce vehicle miles traveled that can help SANDAG reduce greenhouse gas
emissions in the 2050 RTP and comply with Senate Bill 375 (Steinberg
2008).
According to Census 2000 trip to work data, the San Diego region’s
bicycling mode share is 0.6%. This mode share is significantly lower than
the actual mode share because it doesn’t include people bicycling to school
or to transit. By supplementing Census data with estimates of bicycle mode
share for students and transit riders, this plan estimates that the actual
current number of daily bicycle commuters in San Diego County is closer to
76,037 riders, making 152,075 daily trips and saving an estimated 46,918
VMTs per weekday. The calculations behind this estimate are described
below and outlined in Table 5.2.
Table 5.2 quantifies the estimated increase in cyclists and resulting
reduction in VMTs in the San Diego region by 2030. It is predicted that
progress on implementing the Plan could increase the total number of work
and school bicycle commuters from the current estimate of 76,037 (2.7%
mode share) to 280,031 (7.0% mode share). Table 5.2 shows the
assumptions and calculations applied to generate these estimates. The 7.0%
Attachment 1 :: Riding to 2050: The San Diego Regional Bicycle Plan 85

AIR QUALITY BENEFITS | 63
riding to 2050 nnnnnnnnnnnnn
San Diego Regional Bicycle Plannnnnnnnnnnnnn
mode share would result in an estimated decrease of 8,410 pounds/year of
particulate matter (PM10 and PM2.5), 1,132,456 pounds/year of
hydrocarbons, and 307,261,855 pounds/year of carbon dioxide (CO2).
Predicted increases in cycling are based on increases in cycling on newly
built bikeways in San Francisco, California; Portland, Oregon; and Seattle,
Washington.16
16 San Francisco saw 61% corridor increase at 20% network completion, translating to 305% adjusted increase. Portland saw 137% corridor increases at 50% system completion, translating to 274% adjusted increase. Seattle saw 90% corridor increase at 35% system completion, translating to 257% adjusted increase. This translates into an average 279% increase upon system completion. Adjusted increase reflects the projected amount of bicycling that will occur when the system is completed, based on studies of communities with completed or nearly completed bikeway systems. Corridor increases refers to the average increase in bicycling in the corridors in each city, before and after bikeways were installed. System completion refers to the percent completion of the citywide bikeway network in each city.
Attachment 1 :: Riding to 2050: The San Diego Regional Bicycle Plan 86
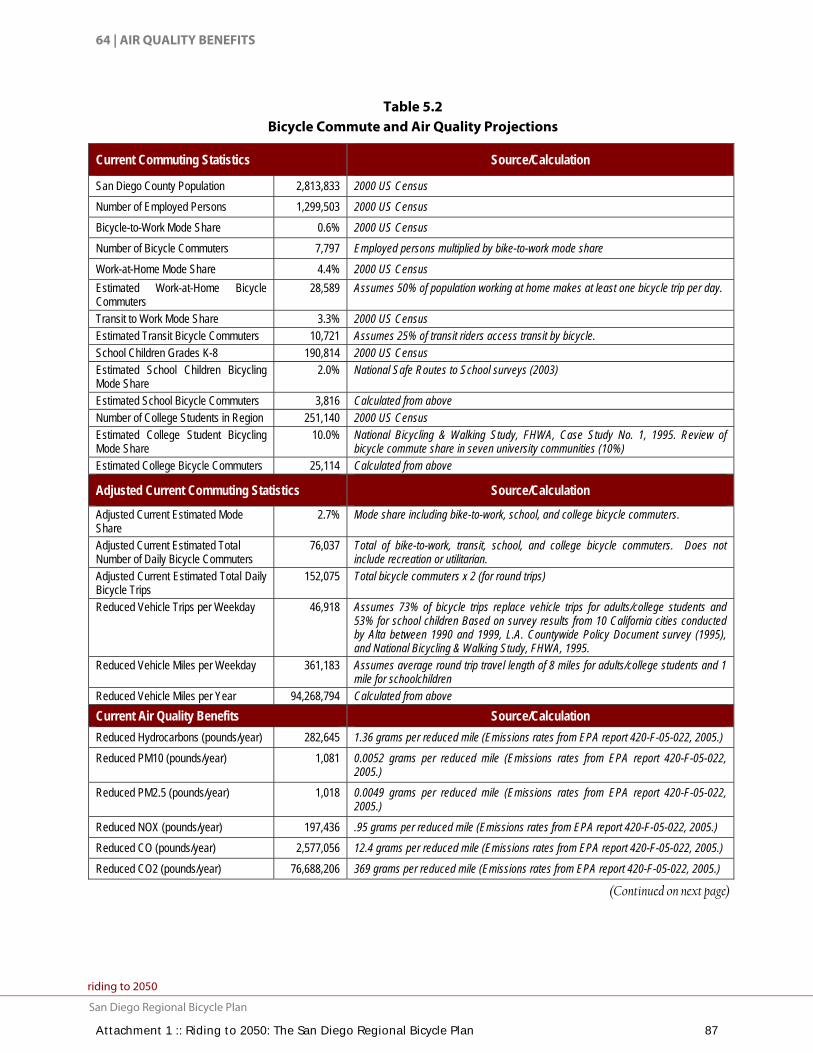
64 | AIR QUALITY BENEFITS
Nnnnnnnnnnnnnriding to 2050
nnnnnnnnnnnnn San Diego Regional Bicycle Plan
Table 5.2 Bicycle Commute and Air Quality Projections
Current Commuting Statistics Source/Calculation
San Diego County Population 2,813,833 2000 US Census
Number of Employed Persons 1,299,503 2000 US Census
Bicycle-to-Work Mode Share 0.6% 2000 US Census
Number of Bicycle Commuters 7,797 Employed persons multiplied by bike-to-work mode share
Work-at-Home Mode Share 4.4% 2000 US Census
Estimated Work-at-Home Bicycle Commuters
28,589 Assumes 50% of population working at home makes at least one bicycle trip per day.
Transit to Work Mode Share 3.3% 2000 US Census Estimated Transit Bicycle Commuters 10,721 Assumes 25% of transit riders access transit by bicycle. School Children Grades K-8 190,814 2000 US Census Estimated School Children Bicycling Mode Share
2.0% National Safe Routes to School surveys (2003)
Estimated School Bicycle Commuters 3,816 Calculated from above Number of College Students in Region 251,140 2000 US Census Estimated College Student Bicycling Mode Share
10.0% National Bicycling & Walking Study, FHWA, Case Study No. 1, 1995. Review of bicycle commute share in seven university communities (10%)
Estimated College Bicycle Commuters 25,114 Calculated from above
Adjusted Current Commuting Statistics Source/Calculation
Adjusted Current Estimated Mode Share
2.7% Mode share including bike-to-work, school, and college bicycle commuters.
Adjusted Current Estimated Total Number of Daily Bicycle Commuters
76,037 Total of bike-to-work, transit, school, and college bicycle commuters. Does not include recreation or utilitarian.
Adjusted Current Estimated Total Daily Bicycle Trips
152,075 Total bicycle commuters x 2 (for round trips)
Reduced Vehicle Trips per Weekday 46,918 Assumes 73% of bicycle trips replace vehicle trips for adults/college students and 53% for school children Based on survey results from 10 California cities conducted by Alta between 1990 and 1999, L.A. Countywide Policy Document survey (1995), and National Bicycling & Walking Study, FHWA, 1995.
Reduced Vehicle Miles per Weekday 361,183 Assumes average round trip travel length of 8 miles for adults/college students and 1 mile for schoolchildren
Reduced Vehicle Miles per Year 94,268,794 Calculated from above
Current Air Quality Benefits Source/Calculation
Reduced Hydrocarbons (pounds/year) 282,645 1.36 grams per reduced mile (Emissions rates from EPA report 420-F-05-022, 2005.)
Reduced PM10 (pounds/year) 1,081 0.0052 grams per reduced mile (Emissions rates from EPA report 420-F-05-022, 2005.)
Reduced PM2.5 (pounds/year) 1,018 0.0049 grams per reduced mile (Emissions rates from EPA report 420-F-05-022, 2005.)
Reduced NOX (pounds/year) 197,436 .95 grams per reduced mile (Emissions rates from EPA report 420-F-05-022, 2005.)
Reduced CO (pounds/year) 2,577,056 12.4 grams per reduced mile (Emissions rates from EPA report 420-F-05-022, 2005.)
Reduced CO2 (pounds/year) 76,688,206 369 grams per reduced mile (Emissions rates from EPA report 420-F-05-022, 2005.)
(Continued on next page)
Attachment 1 :: Riding to 2050: The San Diego Regional Bicycle Plan 87

AIR QUALITY BENEFITS | 65
riding to 2050 nnnnnnnnnnnnn
San Diego Regional Bicycle Plannnnnnnnnnnnnn
Table 5.2, Continued
Bicycle Commute and Air Quality Projections
Estimated Future Bicycle Commuting Statistics Source/Calculation
2030 San Diego County Population 3,984,753 SANDAG 2030 Population Forecast
Future Employed Population Estimate 1,913,822 SANDAG 2030 Employment Population Forecast
Adjusted Future Estimated Mode Share 7.0% Estimate of the potential mode share based on other jurisdictions experiences with system development.
Future Total Number of Bicycle Commuters 280,031 Total bike-to-work, school, college, and work-at-home biking trips. Does not include recreation.
Future Total Daily Bicycle Trips 560,062 Future daily bicycle commuters x 2
Future Reduced Vehicle Trips per Weekday 189,035 Assumes 73% of bicycle trips replace vehicle trips for adults/college students and 53% for school children
Future Reduced Vehicle Miles per Weekday 1,447,130 Assumes average round trip travel length of 8 miles for adults/college students and 1 mile for schoolchildren
Future Reduced Vehicle Miles per Year 377,700,902 Calculated from above
Future Air Quality Benefits Source/Calculation
Reduced Hydrocarbons (pounds/year) 1,132,456 1.36 grams per reduced mile (Emissions rates from EPA report 420-F-05-022, 2005.)
Reduced PM10 (pounds/year) 4,330 0.0052 grams per reduced mile (Emissions rates from EPA report 420-F-05-022, 2005.)
Reduced PM2.5 (pounds/year) 4,080 0.0049 grams per reduced mile (Emissions rates from EPA report 420-F-05-022, 2005.)
Reduced NOX (pounds/year) 791,054 .95 grams per reduced mile (Emissions rates from EPA report 420-F-05-022, 2005.)
Reduced CO (pounds/year) 10,325,331 12.4 grams per reduced mile (Emissions rates from EPA report 420-F-05-022, 2005.)
Reduced CO2 (pounds/year) 307,261,855 369 grams per reduced mile (Emissions rates from EPA report 420-F-05-022, 2005.)
Notes: Sources as noted in the table.
Attachment 1 :: Riding to 2050: The San Diego Regional Bicycle Plan 88

66 | AIR QUALITY BENEFITS
Nnnnnnnnnnnnnriding to 2050
nnnnnnnnnnnnn San Diego Regional Bicycle Plan
Attachment 1 :: Riding to 2050: The San Diego Regional Bicycle Plan 89

IMPLEMENTATION AND FINANCING | 67
riding to 2050 nnnnnnnnnnnnn
San Diego Regional Bicycle Plannnnnnnnnnnnnn
6 Implementation and Financing This chapter describes the assumptions used to develop the estimated costs
of implementing the regional bicycle network and supporting regional
programs. It presents alternative strategies for implementing the Plan,
identifies the funding sources available to the SANDAG bicycle program,
and financing alternatives for implementing the regional network. It
concludes with a discussion of recommended strategies for monitoring the
effectiveness of the Plan and its implementation, including updating the
Plan on a periodic basis.
6.1 Costing Methods and Estimates The cost to complete the regional corridor network were estimated using
unit costs for each facility type that were developed in conjunction with
SANDAG staff and a review of unit costs from other jurisdictions.
Table 6.1 displays the unit costs employed for this planning process.
Build out of the regional bicycle network will result in 153.9 miles of new
Class I facility, 51.6 miles of new enhanced Class II facility, 27.2 miles of new
enhanced Class III, 34.2 miles of bicycle boulevard, and 8.3 miles of cycle
track. The estimated cost for build out of the regional bicycle network is
$419 million. Table 6.2 displays these estimated costs by regional corridor
and facility type.
Costs for education and encouragement programs, which are discussed in
Chapter 4, would result in ongoing annual costs of up to $1.3 million
depending on the number and size of the programs operated each year.
Attachment 1 :: Riding to 2050: The San Diego Regional Bicycle Plan 90

68 | IMPLEMENTATION AND FINANCING
Nnnnnnnnnnnnnriding to 2050
nnnnnnnnnnnnn San Diego Regional Bicycle Plan
Table 6.1 Unit Costs Used for Estimating Costs of Regional Bicycle Network
Facility
Type Unit Base Cost
Survey /
Design
(10%)
Contingency
(10%)
Admin
(5%)
Traffic
Control and
Mobilization
(7%)
Total Cost
per Mile* Source(s)
Bike Path
(Class I) Mile $2,000,000 $200,000 $200,000
$100,00
0 $140,000 $2,640,000
San Diego Association of Governments (2008)
Bike
Boulevard
1
Mile $84,000 $8,400 $8,400 $4,200 $5,900 $110,900
Milpitas (CA) Bikeway Master Plan Update - Public Draft (2008); Lafayette Bikeways Master Plan (2006); Caltrans Approved BTA Projects FY2006/2007, FY2007/2008 and FY2008/2009
Bike
Boulevard
2
Mile $94,000 $9,400 $9,400 $4,700 $6,600 $124,100
Milpitas (CA) Bikeway Master Plan Update - Public Draft (2008); Lafayette Bikeways Master Plan (2006); Caltrans Approved BTA Projects FY2006/2007, FY2007/2008 and FY2008/2009
Cycle
Track Mile $341,800 $34,200 $34,200 $17,100 $23,900 $451,200
Milpitas (CA) Bikeway Master Plan Update - Public Draft (2008); Mammoth Lakes (CA) Trail System Master Plan - Public Draft (2008); Columbus (OH) Bicentennial Bikeways Plan (2008); La Grande (OR) Pedestrian and Bicycle Improvement Plan (2007)
Bike Lane
(Class II) Mile $22,700 $2,300 $2,300 $1,100 $1,600 $30,000
Milpitas (CA) Bikeway Master Plan Update - Public Draft (2008); Mammoth Lakes (CA) Trail System Master Plan - Public Draft (2008); Columbus (OH) Bicentennial Bikeways Plan (2008); La Grande (OR) Pedestrian and Bicycle Improvement Plan (2007)
Bike Lane
(Class II)
w/
Widening
Mile $206,800 $20,700 $20,700 $10,300 $14,500 $273,000
Milpitas (CA) Bikeway Master Plan Update - Public Draft (2008); Mammoth Lakes (CA) Trail System Master Plan - Public Draft (2008); La Grande (OR) Pedestrian and Bicycle Improvement Plan (2007)
Bike
Route
(Class III)
Mile $11,200 $1,100 $1,100 $600 $800 $14,800
Milpitas (CA) Bikeway Master Plan Update - Public Draft (2008); Mammoth Lakes (CA) Trail System Master Plan - Public Draft (2008); Carlsbad (CA) Bikeway Master Plan (2007)
Source: Alta Planning+Design, April 2009 *Note: Base cost does not include right-of-way acquisition
Attachment 1 :: Riding to 2050: The San Diego Regional Bicycle Plan 91

IMPLEMENTATION AND FINANCING | 69
riding to 2050 nnnnnnnnnnnnn
San Diego Regional Bicycle Plannnnnnnnnnnnnn
Table 6.2 Regional Bicycle Network Cost Estimate
ID Name Beginning End Total Miles
Miles of Unbuilt Facility Cost of Unbuilt
Portion Unbuilt Miles
Class I
Class II17
Class II18
Class III
Bike Blvd
Cycle Track
1 Bayshore Bikeway
Central Coast
Corridor
Central Coast
Corridor 23.8 11.2 11.2 0 0 0 0 0 $29,568,000
2 Bay to Ranch Bikeway
Bayshore Bikeway
Chula Vista Greenbelt Otay River
7.4 4.8 0 0 0.7 0 4.1 0 $502,750
3
Border Access Corridor (Preferred Alternative)
Bayshore Bikeway
San Ysidro Border
Crossing, San Diego
6.4 3.1 0 0 3.1 0 0 0 $93,000
4 Camp Pendleton Trail
Northern boundary of
County of San Diego
San Luis Rey River
Trail, Oceanside
18.9 18.1 0 0 0 18.1 0 0 $267,880
5 Carlsbad – San Marcos Corridor
Coastal Rail Trail,
Carlsbad
Inland Rail Trail, San Marcos
10.3 0.7 0 0.7 0 0 0 0 $191,100
6 Central Coast Corridor
Coastal Rail Trail, Del
Mar
Bayshore Bikeway,
San Diego 22.1 8.5 0 0 1.5 0.1 3.8 3.1 $1,891,700
7 Centre City – La Mesa Corridor
Bayshore Bikeway,
San Diego
SR-125 Corridor
13.7 7.5 0 0 6.8 0 0.7 0 $286,250
8
Chula Vista Greenbelt Otay River (Preferred Alternative)
Bayshore Bikeway,
San Diego
SR-125 Corridor,
Chula Vista 5.7 3.8 0 0 0.8 0 3.0 0 $376,500
9 City Heights – Old Town Corridor
Coastal Rail Trail
I-15 Bikeway
6.2 5.5 0 0 1.3 2.6 0.9 0.7 $499,070
10 Clairemont – Centre City Corridor
Coastal Rail Trail
North Park – Centre City
Corridor 13.9 7.7 0.9 0 4.2 1.5 1.1 0 $2,653,450
11 Coastal Rail Trail
San Luis Rey River
Trail, Oceanside
Bayshore Bikeway,
San Diego 44.3 34.0 29.5 0 0.2 0 1.2 3.1 $79,425,720
12 East County Northern Loop
SR-125 Corridor, La
Mesa
SR-125 Corridor, County of San Diego
9.2 3.7 0 2.3 0 1.4 0 0 $648,620
(Continued on next page)
17 Class II with constraints. 18 Class II without constraints.
Attachment 1 :: Riding to 2050: The San Diego Regional Bicycle Plan 92

70 | IMPLEMENTATION AND FINANCING
Nnnnnnnnnnnnnriding to 2050
nnnnnnnnnnnnn San Diego Regional Bicycle Plan
Table 6.2 (continued)
Regional Bicycle Network Cost Estimate
ID Name Beginning End Total Miles
Miles of Unbuilt Facility Cost of Unbuilt
Portion Unbuilt Miles
Class I
Class II19
Class II20
Class III
Bike Blvd
Cycle Track
13 East County Southern Loop
East County Northern Loop, El Cajon
SR-125 Corridor, County of San Diego
4.3 1.1 0 0 1.1 0 0 0 $33,000
14 El Camino Real
San Luis Rey River
Trail, Oceanside
Coastal Rail Trail,
Encinitas 20.0 3.8 0 3.2 0 0.6 0 0 $882,480
15 Encinitas – San Marcos Corridor
Coastal Rail Trail ,
Encinitas
Inland Rail Trail, San Marcos
13.3 4.2 4.1 0.1 0 0 0 0 $10,851,300
16 Escondido Creek Bikeway
I-15 Bikeway,
Escondido
Valley Centre Rd, Escondido
5.9 2.3 2.3 0 0 0 0 0 $6,072,000
17 Gilman Connector
Central Coast
Corridor, San Diego
Coastal Rail Trail 2.0 0 0 0 0 0 0 0 0
18 Hillcrest – El Cajon Corridor
Kensington – Balboa
Park Corridor
SR-125 Corridor
11.5 6.8 0 0 0.4 0 6.4 0 $764,000
19 Imperial Beach Connector
Seacoast Drive,
Imperial Beach
Border Access 2.6 2.4 0 0 0 1.5 0.9 0 $127,950
20 Inland Rail Trail
Coastal Rail Trail,
Oceanside
I-15 Bikeway,
Escondido 20.7 14.8 14.8 0 0 0 0 0 $39,072,000
21
Kearny Mesa – Beaches Corridor
(Preferred Alternative)
Central Coast
Corridor, Pacific Beach
I-15 Bikeway,
San Diego 10.4 8.4 1.6 1.0 0 0 5.8 0 $5,178,500
22 Kensington – Balboa Park Corridor
Clairemont – Centre City
Corridor
Mission Valley –
Chula Vista Corridor
5.3 4.3 0 0 1.7 0 2.6 0 $356,500
23 North Park – Centre City Corridor
City Heights – Old Town
Corridor
Coastal Rail Trail
3.7 1.5 0 0 0.5 0 0 1.0 $466,200
24 Mid-County Bikeway Corridor
Coastal Rail Trail, Del
Mar
Inland Rail Trail 17.3 4.6 0 0 4.4 0.2 0 0 $134,960
(Continued on next page)
19 Class II with constraints. 20 Class II without constraints.
Attachment 1 :: Riding to 2050: The San Diego Regional Bicycle Plan 93

IMPLEMENTATION AND FINANCING | 71
riding to 2050 nnnnnnnnnnnnn
San Diego Regional Bicycle Plannnnnnnnnnnnnn
Table 6.2 (continued)
Regional Bicycle Network Cost Estimate
ID Name Beginning End Total Miles
Miles of Unbuilt Facility Cost of Unbuilt
Portion Unbuilt Miles
Class I
Class II21
Class II22
Class III
Bike Blvd
Cycle Track
25 Mira Mesa Corridor
Coastal Rail Trail, San
Diego
I-15 Bikeway
6.5 1.8 0.7 1.1 0 0 0 0 $2,148,300
26
Mission Valley – Chula Vista Corridor
San Diego River
Bikeway, San Diego
Bay to Ranch
Bikeway, Chula Vista
12.5 10.3 0.7 2.1 4.2 1.2 2.1 0 $2,811,810
27 Park Boulevard Connector
North Park – Centre City
Corridor
Centre City – La Mesa Corridor
0.4 0.4 0 0 0 0 0 0.4 $180,480
28 Poway Loop I-15
Bikeway, San Diego
I-15 Bikeway,
San Diego 6.9 0 0 0 0 0 0 0 0
29 San Diego River Bikeway
Voltaire St, San Diego
SR-125 Corridor, Santee
17.9 10.7 10.7 0 0 0 0 0 $28,248,000
30 San Luis Rey River Trail
Coastal Rail Trail,
Oceanside
I-15 Bikeway, County of San Diego
18.4 10.7 10.7 0 0 0 0 0 $28,248,000
31 Santee – El Cajon Corridor
El Cajon Northern Loop, El Cajon
I-8 Corridor, Santee 3.9 0.2 0 0 0.2 0 0 0 $6,000
32 Sweetwater River Bikeway
Bayshore Bikeway,
National City
SR-125 Corridor,
Chula Vista 5.2 0.6 0.6 0 0 0 0 0 $1,584,000
33 Vista Way Connector
San Luis River Rey
Trail
Inland Rail Trail
4.6 2.5 0 2.5 0 0 0 0 $682,500
34 I-8 Corridor SR-125 Corridor
Japatul Valley Rd,
County of San Diego
25.0 9.9 6.0 0 3.9 0 0 0 $15,957,000
35 I-15 Bikeway
Northern boundary of
County of San Diego
City Heights – Old Town
Corridor 55.1 24.2 23.5 0.7 0 0 0 0 $62,061,000
36 SR-52 Bikeway
Coastal Rail Trail, San
Diego
San Diego River
Bikeway, San Diego
13.5 13.5 13.5 0 0 0 0 0 $35,640,000
37 SR-56 Bikeway
Coastal Rail Trail, San
Diego
I-15 Bikeway,
San Diego 10.7 1.2 1.2 0 0 0 0 0 $3,168,000
(Continued on next page)
21 Class II with constraints. 22 Class II without constraints.
Attachment 1 :: Riding to 2050: The San Diego Regional Bicycle Plan 94

72 | IMPLEMENTATION AND FINANCING
Nnnnnnnnnnnnnriding to 2050
nnnnnnnnnnnnn San Diego Regional Bicycle Plan
Table 6.2 (continued)
Regional Bicycle Network Cost Estimate
ID Name Beginning End Total Miles
Miles of Unbuilt Facility Cost of Unbuilt
Portion Unbuilt Miles
Class I
Class II23
Class II24
Class III
Bike Blvd
Cycle Track
38 SR-125 Corridor
San Diego River
Bikeway, Santee
Otay Mesa Border
Crossing, San Diego
25.1 15.6 11.1 0 2.9 0 1.6 0 $29,579,000
39 I-805 Connector
Sweetwater River
Bikeway
Telegraph Canyon
Road, Chula Vista
1.8 1.8 1.8 0 0 0 0 0 $4,752,000
40 SR-905 Corridor
Border Access
Corridor, San Diego
Future SR-11 Border Crossing,
County of San Diego
9.0 9.0 9.0 0 0 0 0 0 $23,760,000
TOTALS 515.5 275.2 153.9 13.0 38.6 27.2 34.2 8.3 $419,169,020
Source: Alta Planning+Design, March, 2010
6.2 Funding Sources Historically, the primary sources of revenue for developing bicycle programs
and projects in the region have been the TransNet Active Transportation
Program, which funds bicycle, pedestrian, and neighborhood safety (traffic
calming) projects and programs, and the Transportation Development Act
(TDA) Article 3 Non-motorized funds. Eligible support programs include
those that help to encourage walking and the use of bicycles, such as secure
bicycle parking facilities and bicycle and pedestrian promotion and safety
education programs. Regional projects have also benefited from the
availability of federal transportation funds, and to a lesser extent, state
funds. In fact, the TransNet Extension Ordinance states that the TransNet Active Transportation funds should be used to match federal, state, local,
and private funding to maximize the number of improvements to be
implemented. Each of these funding sources, and the level of funding
available, is discussed below.
6.2.1 Regional Funding Sources TransNet Active Transportation Program. The TransNet 1/2-cent transportation
sales tax program has provided approximately $31.4 million in sales tax
revenues and interest earnings for active transportation projects since it was
first began in FY 1988. For the first 20 years, $1 million was designated for
bicycle facilities and programs each year. With the passage of the TransNet
23 Class II with constraints. 24 Class II without constraints.
Attachment 1 :: Riding to 2050: The San Diego Regional Bicycle Plan 95

IMPLEMENTATION AND FINANCING | 73
riding to 2050 nnnnnnnnnnnnn
San Diego Regional Bicycle Plannnnnnnnnnnnnn
Extension Ordinance, which began in FY 2009, the funding increased to
two percent of the annual revenues, and the purposes for which the funds
could be expended were broadened to include pedestrian and neighborhood
safety (traffic calming) projects. Over the years, these TransNet funds
supported regional bikeway development primarily by serving as the local
match for federal funds. The overwhelming majority of the funds have gone
to local projects through an annual competitive grant process. The TransNet program will end in 2048. Projected revenues for the Active Transportation
Program between FY 2011 and the end of the program are estimated to be
$232 million in current dollars as shown in Table 6.3.
Transportation Development Act (TDA) Article 3. The TDA program is funded by
1/4-cent of the statewide sales tax based on sales taxes collected within San
Diego County. Of that amount, two percent is set aside for bicycle and
pedestrian programs and projects. Annual revenues currently are about $1.8
million. SANDAG administers these funds in the San Diego region as part of
its Active Transportation Program. The funds are distributed to cities and
the County through the same competitive grant process used to award
TransNet active transportation grants. Revenues for TDA funds are also
shown in Table 6.3.
Table 6.3 Active Transportation Program Funds
Fiscal Years
TransNet TDA Total
2011 $3,874,000 $1,787,000 $5,661,000
2012 3,918,000 1,840,000 $5,758,000
2013 4,028,000 1,890,000 $5,918,000
2014 4,244,000 1,994,000 $6,238,000
2015 4,418,000 2,076,000 $6,494,000
2011-
2015 $20,482,000 9,587,000 $30,069,000
2016-
2020 23,719,000 11,143,000 $34,862,000
2021-
2048 187,581,000 88,124,000 275,705,000
Total $231,782,000 $108,854,000 $340,636,000
6.2.2 Federal Funding Sources The current federal transportation funding authorization is known as Safe, Accountable, Flexible, Efficient Transportation Equity Act – A Legacy for Users (SAFETEA-LU). It is the third iteration of the transportation vision
established by Congress in 1991 with the Intermodal Surface Transportation
Efficiency Act (ISTEA) that takes a multimodal approach to transportation
Attachment 1 :: Riding to 2050: The San Diego Regional Bicycle Plan 96

74 | IMPLEMENTATION AND FINANCING
Nnnnnnnnnnnnnriding to 2050
nnnnnnnnnnnnn San Diego Regional Bicycle Plan
planning. It allows flexibility in the use of funds under the various funding
programs, which makes bicycle projects eligible in most funding categories.
SAFETEA-LU expired in October 2009, so the federal transportation
program has been continuing under a series of extensions enacted by
Congress. In light of the uncertainty about the form and funding levels of
the next federal authorization, this plan assumes a continuation of the
existing federal programs with funding levels consistent with recent
authorizations and with funding estimates provided by the California
Transportation Commission (CTC).
While bicycle projects are eligible under most federal funding programs,
current SANDAG policy dedicates 94 percent of all discretionary funding to
the TransNet Early Action Projects (EAP). These are the major corridor
projects that support highway and transit corridor project development.
Regional bikeway projects could be built with the funds dedicated to the
EAP if they are identified as mitigation for those projects, but for the most
part, the bikeway projects will need to compete for the remaining six
percent of federal funds where there already is significant demand from
other eligible project types. There are, however, several federal programs
that restrict funds to specific categories of projects, and some of these could
be used to support development of regional bikeway projects.
Transportation Enhancement Funds. The most common source of federal funds
for bicycle projects is the Transportation Enhancements (TE) Program.
Based on the assumption that the TE program will be included in the next
federal transportation authorization, the state has estimated funding levels
for the program through FY 2015 as shown in Table 6.4.
Table 6.4 Federal Transportation Enhancement Program Revenue Estimates*
FY 2011 FY 2012 FY 2013 FY 2014 FY 2015 Total
$1,356,000 $3,624,000 $4,311,000 $5,326,000 $5,327,000 $19,944,000
*Based on revenue estimates provided by the California Transportation Commission
TE funds may be used to fund 12 specified types of projects, including
bicycle and pedestrian facilities. Using the discretion over these funds
granted to regional agencies by state law, SANDAG has in the past chosen
to focus the use of TE funds on projects that support specific regional
priorities. Most recently, the funds were used for a pilot program to
demonstrate how transportation funding can be used to develop projects
that support and provide incentives for smart growth. That discretion could
be used to dedicate future TE funds to regional bikeway implementation.
While local agencies may want the opportunity to compete for these funds
Attachment 1 :: Riding to 2050: The San Diego Regional Bicycle Plan 97

IMPLEMENTATION AND FINANCING | 75
riding to 2050 nnnnnnnnnnnnn
San Diego Regional Bicycle Plannnnnnnnnnnnnn
as they have in the past, focusing TE funds on regional bikeways would
reduce the amount of local TransNet and TDA funds necessary for the
regional network, leaving more of those funds for local projects. In addition,
it would consolidate the administrative burden that comes with federal
funds on a few larger projects.
Safe Routes to School. SAFTEA-LU established a federal Safe Routes to School
program to support projects that encourage more children to walk or ride a
bike to school. Metropolitan planning organizations (MPOs) like SANDAG
are eligible to receive grants under this program, which is administered in
California through Caltrans. The last cycle of projects provided $46 million
for 106 projects. Eligible projects must be within two miles of a school.
Projects on the regional network that directly serve schools could
potentially benefit from this funding source.
Congestion Mitigation and Air Quality Funds (CMAQ). Projects that help meet
national goals for improved air quality and congestion relief, including
bicycle projects, are eligible for CMAQ funds. Several regional bikeway
projects, including the Coastal Rail Trail, Inland Rail Trail and the Bayshore
Bikeway have been developed in part with CMAQ funds. However, because
these funds are subject to SANDAG policy to dedicate 94 percent of
discretionary funds to the EAP, this cannot be considered a viable source of
funding for regional bikeway implementation in the near term.
Land and Water Conservation Fund. This program, administered by the National
Parks Service, allocates money to state and local governments to acquire
new land for recreational purposes, including bicycle paths and support
facilities such as bike racks. Funding allocated to California is administered
by the State Department of Parks and Recreation. Eligible applicants
include cities, counties and districts authorized to acquire, develop, operate
and maintain park and recreation areas. For local agencies, funds are
provided through a competitive selection process. There is a 50% local
match requirement. The Land and Water Conservation Fund has not been
used to date in the San Diego region to develop the regional bikeway
network.
Recreational Trails Program. This program provides funds for developing and
maintaining recreational trails and trail-related facilities for both non-
motorized and motorized recreational trail uses. Examples of trail uses
include hiking, bicycling, in-line skating, equestrian use, and other non-
motorized as well as motorized uses. While bikeway projects have been
developed through this program, the urban location and transportation
emphasis of the regional bike network suggests this will not be a major
source of revenue for project implementation. There are, however,
recreational trails in the region that do serve a transportation function. Even
Attachment 1 :: Riding to 2050: The San Diego Regional Bicycle Plan 98

76 | IMPLEMENTATION AND FINANCING
Nnnnnnnnnnnnnriding to 2050
nnnnnnnnnnnnn San Diego Regional Bicycle Plan
if this program did not fund the regional network, it is available as a
potential source of funds for local bikeway projects that qualify and would
compete well under the program. The Recreational Trails Program is
administered in California by California State Parks. Approximately $6
million was available statewide for this program in the last funding cycle.
6.2.3 State Funding Sources Bicycle Transportation Account (BTA). The BTA is an annual statewide
discretionary program that is available through Caltrans for funding bicycle
projects. The grants to cities and counties provide $7.2 million each year
with an emphasis on funding projects that benefit bicycling for commuting
purposes. The local match must be a minimum of ten percent of the total
project cost. BTA funds have been used to develop regional bikeways like
the Inland Rail Trail, but should SANDAG be responsible for regional
project development, it would only be available through a cooperative
agreement with a local agency that agreed to apply for the funds on
SANDAG’s behalf.
Safe Routes to School. The state of California was a pioneer in establishing a
state Safe Routes to School program ten years ago using funds from the
Hazard Elimination Safety program. Like the federal program, its purpose is
to encourage walking and bicycling to school by eliminating barriers to
bicycle and pedestrian travel, and by implementing education and
encouragement campaigns. The most recent funding cycle provided $24
million statewide. Like the BTA, only cities and counties are eligible under
the state program, and a ten percent local match is required. Projects on the
regional network that directly serve schools could potentially benefit from
this funding source.
Other Potential Funding Sources. There are a variety of other sources of funds
that have or could be used to support bikeway development in the region.
These sources include:
Federal demonstration grants been awarded through the San Diego
congressional delegation
Federal economic stimulus funds
State bond funds such as Proposition 84 park bonds
Local gas tax or TransNet Local Systems funds
Development impact fees or other developer assessments
Finally, federal, state and local complete streets policies establish the
responsibility to provide for all modes of travel when developing
transportation projects. Following complete streets guidelines, wherever a
regional network project coincides with other highway, local streets and
Attachment 1 :: Riding to 2050: The San Diego Regional Bicycle Plan 99

IMPLEMENTATION AND FINANCING | 77
riding to 2050 nnnnnnnnnnnnn
San Diego Regional Bicycle Plannnnnnnnnnnnnn
roads or transit projects, the projects should be developed concurrently to
take advantage of the costs and time savings that could be realized through
economies of scale and coordinated implementation.
6.3 Implementation The key implementation steps that will follow adoption of the Plan and will
include employing the Plan’s project prioritization criteria to develop a list
of priority regional corridor projects, developing an implementation strategy
for how the regional network will be completed and programmatic
components of the Plan implemented, and developing a financial plan for
implementing the projects and programs. These follow-up steps will be
completed through the summer of 2010 so the Plan recommendations can be
incorporated into the 2050 RTP.
The Plan represents a significant step forward in bicycle planning for the
region. It includes more comprehensive and detailed recommendations for
the regional bicycle network and supporting programs that were previously
developed through the regional transportation plan process, and it
establishes ambitious goals to make bicycling a significant contributor to
the region’s transportation system. With this new and ambitious plan
comes the opportunity to re-evaluate the region’s approach to project
development and financing.
6.3.1 Project Development SANDAG’s current role in developing the regional bicycle network has been
to identify and administer funding sources, encourage local agencies to take
on regional projects, and provide guidance and oversight as projects are
developed. This approach is a reflection of SANDAG’s role as the
administrator of transportation funding in the region, but it has its
limitations. Implementation of corridor projects that have a high priority at
the regional level have had to compete against local priorities for resources.
At times this has led to long project development timelines. Different
priorities for regional projects between jurisdictions have resulted in the
development of discontinuous segments for multi-jurisdictional bicycle
facilities. In addition, educational and promotional programs that could
have been deployed regionwide have been restricted to the single
jurisdiction that is awarded funding for the project, reducing the program’s
impact. Two alternative approaches to implementation are suggested for
further consideration: 1) provide increased incentives in the Active
Transportation funding program to encourage local agencies to implement
regional projects; and 2) establish agreements between SANDAG and local
agencies that enables SANDAG to be the lead agency for project
implementation.
Attachment 1 :: Riding to 2050: The San Diego Regional Bicycle Plan 100

78 | IMPLEMENTATION AND FINANCING
Nnnnnnnnnnnnnriding to 2050
nnnnnnnnnnnnn San Diego Regional Bicycle Plan
SANDAG awards funds to local jurisdictions under its Active
Transportation program through a competitive grant process. Projects are
selected based on established criteria that are designed to select projects
with high potential demand that increase safety, and that are cost effective
and ready for development. These criteria could be revised to place a
premium on funding regional projects. With this approach, SANDAG also
may want to increase its oversight role to help ensure timely project
development and a consistent approach to design and operation for regional
bikeways. This approach would be consistent with the implementation
framework established in the RCP adopted in 2004 that focuses on
collaborative planning and incentives to achieve regional goals.
The current approach to developing regional bikeways was developed
before the consolidation of regional transportation implementation
responsibilities at SANDAG. Taking advantage of this new capacity, a
second approach would be to implement the regional bicycle program in a
manner more akin to how regional transit projects are developed with
SANDAG taking lead in planning, design and construction, and the local
agency assuming responsibility for on-going operation and maintenance.
Investing SANDAG with the responsibility to implement regional projects
would require cooperative agreements between SANDAG and local agencies
that addressed how construction, operation, and maintenance would occur.
It also would require changes in the way regional funds are allocated since
current active transportation funding decisions are made through a process
designed to dispense funds to local agencies.
Maintenance. Maintenance and funding for maintenance is a significant issue
for all public rights of way whether it is for general roadways or separate
bicycle and pedestrian facilities. Historically, the funding that has been
administered by SANDAG for bicycle and pedestrian projects has not been
available for maintenance, and the Plan does not include specific provisions
for maintenance of the facilities proposed in the Plan. This issue will be
addressed as part of the first phase of the Plan implementation where it can
be evaluated in conjunction with the project prioritization and financing
discussion.
6.3.2 Environmental Review Proposed projects are required to comply with the California Environmental
Quality Act (CEQA). It is not the intent of this Plan to make
recommendations for regional network improvements that would result in
significant impacts to traffic, biological resources, or other environmental
factors. During design and environmental review of individual planned
segments, project proponents may elect to modify alignment of corridor
Attachment 1 :: Riding to 2050: The San Diego Regional Bicycle Plan 101

IMPLEMENTATION AND FINANCING | 79
riding to 2050 nnnnnnnnnnnnn
San Diego Regional Bicycle Plannnnnnnnnnnnnn
segments to avoid and minimize impacts. Any changes to the regional
network will be documented during the Plan update, which is proposed at
intervals of every four years.
6.3.3 Project Financing The Plan identifies a cost of $419 million to implement the regional bicycle
network, and $246 million for the constrained revenue network. The
revenue estimate for the TransNet and TDA Active Transportation Program
through the end of the TransNet program in FY 2048 is $340.6 million, which
means a significant portion of the regional network could be funded with
the TransNet and TDA funds dedicated for active transportation provided
completing the regional network were made the first priority for the use of
these funds. However, considerable additional funding sources will be
required to augment TransNet and TDA funds.
A simple comparison of projected annual TransNet and TDA Active
Transportation Program revenues to total estimated network project costs
suggests that the regional bicycle network could be completed in
approximately 40 years if all these revenues were dedicated to constructing
the network and if all available Transportation Enhancement (TE) funds are
added to the funding plan as a revenue source for regional network
development, with a three percent growth in TE funds assumed for each
new federal authorization. How to prioritize funding the regional network
and programs in comparison to local bicycle, pedestrian and neighborhood
safety projects will be a policy decision to be addressed in the initial
implementation phase of the Plan.
An alternative funding scenario that would enable an accelerated schedule
for project development would be to utilize the TransNet program’s
financing capacity to borrow against future Active Transportation Program
revenues. The regional projects could be financed as part of SANDAG’s
periodic bond sales or other financing mechanisms. This approach could
reduce the impact of developing the regional network on the Active
Transportation Program funds to the debt service obligations spread out
over the remaining years of the TransNet program, leaving more funds for
local projects in the early years. A debt financing strategy will be evaluated
as an early implementation item once a priority list of projects and
associated project costs has been established.
6.4 Program Monitoring The Plan provides a long-term vision for the development of a regionwide
bicycle network that can be used by all residents for all types of trips.
Implementation of the Plan will take place incrementally over many years.
Attachment 1 :: Riding to 2050: The San Diego Regional Bicycle Plan 102

80 | IMPLEMENTATION AND FINANCING
Nnnnnnnnnnnnnriding to 2050
nnnnnnnnnnnnn San Diego Regional Bicycle Plan
The following actions and measures of effectiveness are provided to guide
SANDAG toward the vision identified in the Plan.
6.4.1 Regularly Revisit Project Prioritization Projects will be prioritized based on bicycling demand, facility deficiencies,
public comment, and a host of other criteria. This list should be reviewed
every fiscal year, with new projects added, completed projects removed, and
the priorities revised as conditions change.
6.4.2 Update the Plan While the Plan is intended to guide the SANDAG’s bicycle planning for the
next 40 years, it should be reviewed and updated on a regular basis. The
Plan should be updated on a four year cycle consistent with the requirement
for updating the RTP.
6.4.3 Establish Measures of Effectiveness Measures of effectiveness are used as a quantitative way to measure the
region’s progress toward implementing the Plan. Well-crafted measures of
effectiveness will allow the region to determine the degree of progress
toward meeting the Plan’s goals, and include time-sensitive targets for
SANDAG to meet. Chapter 4 includes a discussion of a monitoring and
evaluation program.
Table 6.5 describes several measures that SANDAG may consider. These
measures were developed based on known baseline conditions. Goal targets,
when given, are developed based on reasonable expectations within the
time frame. As new baseline information is made available, and SANDAG
implements more of the Plan, the measures of effectiveness should be
reevaluated, revised, and updated. SANDAG should regularly review the
progress made toward these goals, preferably on an annual or biennial basis.
Attachment 1 :: Riding to 2050: The San Diego Regional Bicycle Plan 103
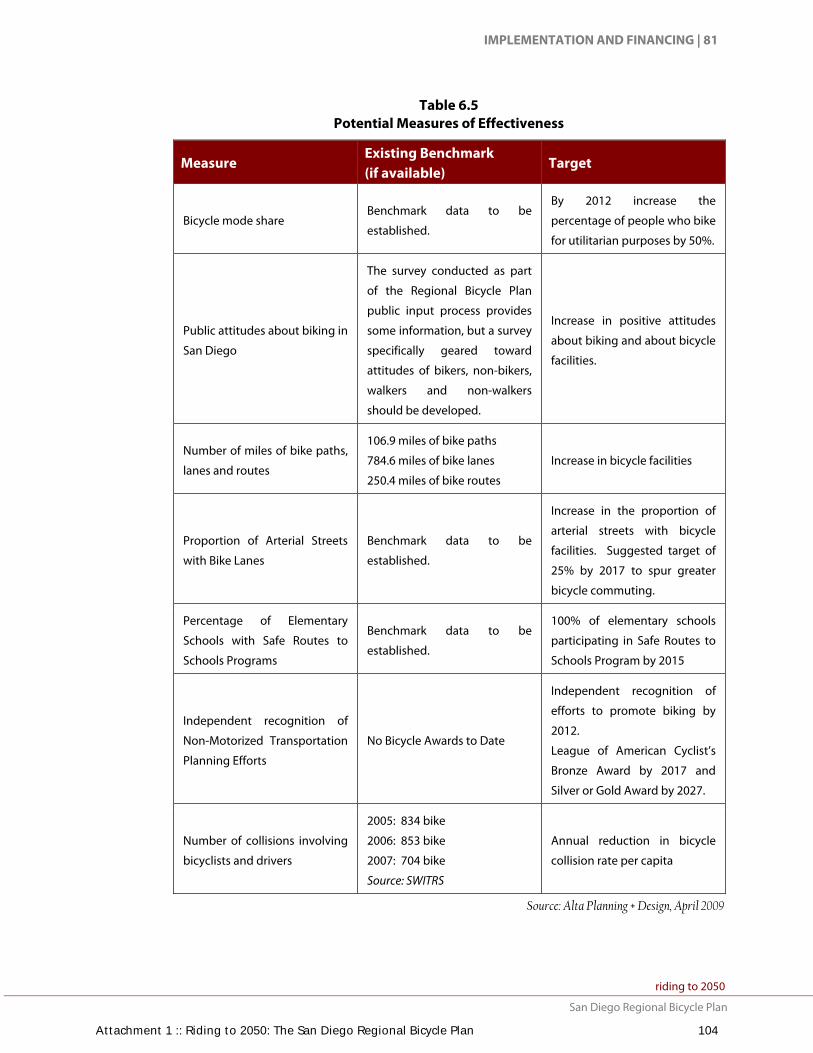
IMPLEMENTATION AND FINANCING | 81
riding to 2050 nnnnnnnnnnnnn
San Diego Regional Bicycle Plannnnnnnnnnnnnn
Table 6.5 Potential Measures of Effectiveness
Measure Existing Benchmark (if available)
Target
Bicycle mode share Benchmark data to be
established.
By 2012 increase the
percentage of people who bike
for utilitarian purposes by 50%.
Public attitudes about biking in
San Diego
The survey conducted as part
of the Regional Bicycle Plan
public input process provides
some information, but a survey
specifically geared toward
attitudes of bikers, non-bikers,
walkers and non-walkers
should be developed.
Increase in positive attitudes
about biking and about bicycle
facilities.
Number of miles of bike paths,
lanes and routes
106.9 miles of bike paths
784.6 miles of bike lanes
250.4 miles of bike routes
Increase in bicycle facilities
Proportion of Arterial Streets
with Bike Lanes
Benchmark data to be
established.
Increase in the proportion of
arterial streets with bicycle
facilities. Suggested target of
25% by 2017 to spur greater
bicycle commuting.
Percentage of Elementary
Schools with Safe Routes to
Schools Programs
Benchmark data to be
established.
100% of elementary schools
participating in Safe Routes to
Schools Program by 2015
Independent recognition of
Non-Motorized Transportation
Planning Efforts
No Bicycle Awards to Date
Independent recognition of
efforts to promote biking by
2012.
League of American Cyclist’s
Bronze Award by 2017 and
Silver or Gold Award by 2027.
Number of collisions involving
bicyclists and drivers
2005: 834 bike
2006: 853 bike
2007: 704 bike
Source: SWITRS
Annual reduction in bicycle
collision rate per capita
Source: Alta Planning + Design, April 2009
Attachment 1 :: Riding to 2050: The San Diego Regional Bicycle Plan 104

82 | IMPLEMENTATION AND FINANCING
Nnnnnnnnnnnnnriding to 2050
nnnnnnnnnnnnn San Diego Regional Bicycle Plan
Attachment 1 :: Riding to 2050: The San Diego Regional Bicycle Plan 105

BICYCLE DESIGN GUIDELINES | 83
riding to 2050 nnnnnnnnnnnnn
San Diego Regional Bicycle Plannnnnnnnnnnnnn
7 Bicycle Design Guidelines This chapter provides design guidelines gathered from local, state and
national best practices. It is intended to serve as a guide for city planners,
engineers, and designers when designing and constructing bicycle facilities
in the San Diego region. The design guidelines presented in this chapter are
a combination of minimum standards outlined by the California Highway Design Manual’s Chapter 1000, recommended standards prescribed by the
American Association of State Highway and Transportation Officials
(AASHTO) Guide for the Development of Bicycle Facilities and the California Manual of Uniform Traffic Control Devices (California MUTCD). The minimum
standards and guidelines presented by Chapter 1000 and AASHTO provide
basic information about the design of bicycle facilities, such as bicycle lane
dimensions, striping requirements and recommended signage and pavement
markings. These guidelines also include recommendations for optional
design treatments that are not intended to represent a minimum or
maximum accommodation or to replace any existing adopted roadway
design guidelines. Also included in these guidelines are experimental or
nonstandard best practices with information about optional innovative
bikeways and support facilities that have not been adopted by the California MUTCD or by the State of California for use in California and do not
currently meet Highway Design Manual, Chapter 1000 design requirements.
Final design of any bikeway should be conducted by a licensed engineer
using sound engineering judgment and applicable standards and
guidelines.
7.1 Design References lists the documents used to develop the San
Diego region bicycle facility guidelines.
7.2 Design Principles describes the principles that should be used in
implementing the San Diego region design guidelines.
7.3 Standard Designs of Bicycle Facilities provides general
descriptions of California bikeway classifications, standard
treatments, and standard signage.
7.4 Innovative Treatments and Signage presents treatments and
signage that are intended to enhance safety but are not standard in
California according to the California MUTCD or Caltrans Highway Design Manual, Chapter 1000.
7.5 Bicycle Parking describes guidelines for placing bicycle parking,
and design guidelines for bicycle racks, bicycle lockers, and high-
volume bicycle parking options such as bicycle corrals and bike
stations.
Attachment 1 :: Riding to 2050: The San Diego Regional Bicycle Plan 106

84 | BICYCLE DESIGN GUIDELINES
Nnnnnnnnnnnnnriding to 2050
nnnnnnnnnnnnn San Diego Regional Bicycle Plan
7.1 Design References The bikeway design principals outlined in this chapter are derived from the
regional, state, and national documents listed below. Many of these
documents are available online and provide a wealth of information and
resources to the public.
Highway Design Manual, Chapter 1000: Bikeway Planning and
Design (California Department of Transportation, 2006).
http://www.dot.ca.gov/hq/oppd/hdm/pdf/chp1000.pdf
California Manual of Uniform Traffic Control Devices for Streets
and Highways, Part 9: Traffic Controls for Bicycle Facilities
(California Department of Transportation, 2006).
http://www.dot.ca.gov/hq/traffops/signtech/mutcdsupp/pdf/camut
cd/CAMUTCD-Part9.pdf
Guidelines for the Development of Bicycle Facilities (American
Association of State Highway and Transportation Officials, 1999).
http://www.transportation.org/
Federal Highway Administration Best Practices Design Guide Part
2, Designing Sidewalks and Trails for Access (FHWA Pub#
FHWA-EP-01-027, 1001)
AASHTO Green Book: Policy on Geometric Design of Streets and
Highways (American Association of State Highway and
Transportation Officials, 2001). www.transportation.org
Bike Lane Design Guide (City of Chicago and Pedestrian and
Bicycle Information Center, 2002).
http://www.bicyclinginfo.org/pdf/bike_lane.pdf
Bicycle Parking Design Guidelines (Association of Pedestrian and
Bicycle Professionals, 2002).
http://www.bicyclinginfo.org/pdf/bikepark.pdf
Pedestrian and Bicycle Facilities in California: A Technical
Reference and Technology Transfer Synthesis for Caltrans Planners
and Engineers (California Department of Transportation, 2005)
Innovative Bicycle Treatments (Institute of Transportation
Engineers, 2003)
Bicycle Boulevard Design Tools and Guidelines (City of Berkeley,
2000)
Bicycle Boulevards Technical Memorandum (Alta Planning +
Design, 2007)
Attachment 1 :: Riding to 2050: The San Diego Regional Bicycle Plan 107

BICYCLE DESIGN GUIDELINES | 85
riding to 2050 nnnnnnnnnnnnn
San Diego Regional Bicycle Plannnnnnnnnnnnnn
Cycle Tracks: Lessons Learned (Alta Planning + Design; Burchfield,
Robert, 2008)
All bikeway facilities are required at a minimum to meet the design
guidelines outlined in the Highway Design Manual, Chapter 1000 and in
the California MUTCD. Jurisdictions in the San Diego region are
encouraged to consider application of the innovative design treatments
where appropriate. When using design treatments not approved by the
California MUTCD and the Highway Design Manual, Chapter 1000,
agencies in the San Diego region must follow the protocol for testing
innovative treatments specified by the State.
7.2 Design Principles The following key principles were followed in developing the San Diego
regional bicycle network as proposed in this plan:
The San Diego region will have a complete and interconnected
network of on-street bicycling facilities and shared-use paths that
will provide bicycle access across the region to a broad range of
bicycle users.
All roads in the San Diego region are legal for the use of bicyclists,
(except those roads designated as limited access facilities which
prohibit bicyclists). This means that most streets are bicycle
facilities, and will be designed and maintained accordingly.
The San Diego region should strive for ‘complete streets’ as called
for by the California Complete Streets Act of 2008. Complete
streets are designed to safely accommodate all users, including
bicyclists, pedestrians, transit riders, children, older people, and
disabled people, as well as motorists.
Design guidelines are intended to be flexible and should be applied with
professional judgment by licensed engineers. In this manual, design
guidelines approved by the California MUTCD and the Highway Design Manual, Chapter 1000 are differentiated from innovative design treatments that are not
yet approved. When using design treatments not approved by the standard
regulatory documents, agencies in the San Diego region must follow the
protocol for testing innovative treatments specified by the State.
7.3 Standard Designs of Bicycle Facilities According to Caltrans, the term “bikeway” encompasses all facilities that
provide primarily for bicycle travel. Caltrans has defined three types of
bikeways in the Highway Design Manual, Chapter 1000: Class I, Class II, and
Class III. For each type of bikeway facility both “Design Requirements” and
“Additional Design Recommendations” are provided. “Design
Attachment 1 :: Riding to 2050: The San Diego Regional Bicycle Plan 108
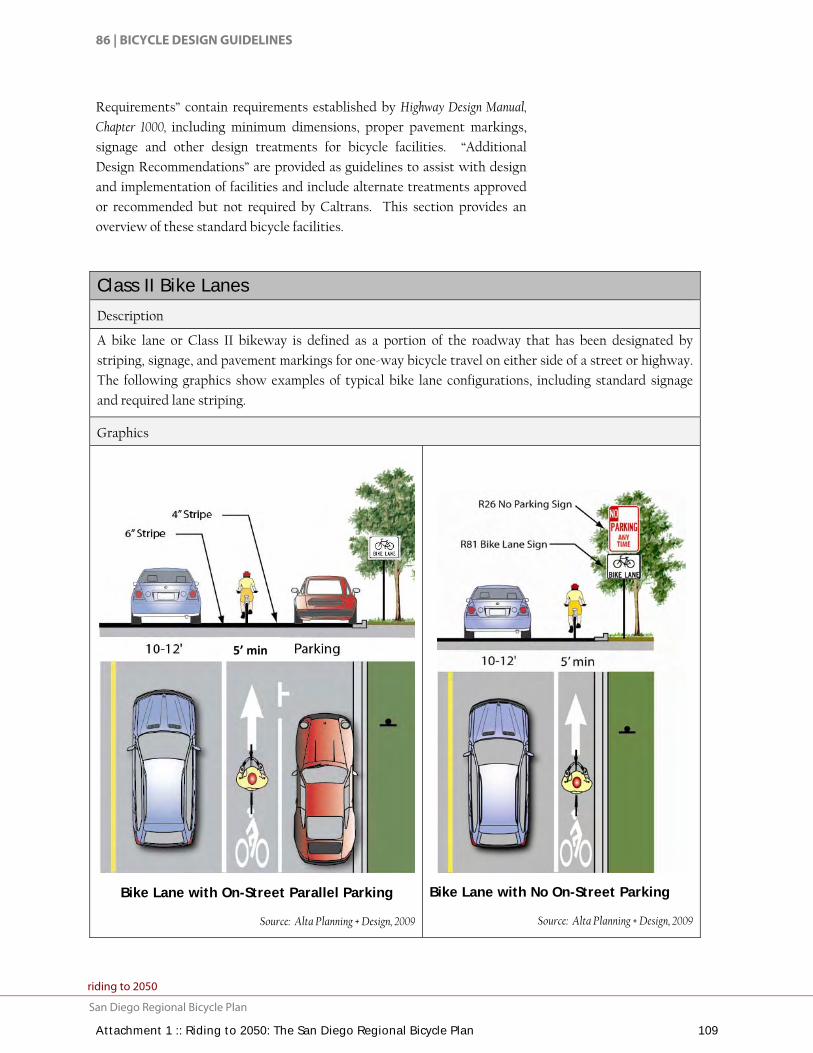
86 | BICYCLE DESIGN GUIDELINES
Nnnnnnnnnnnnnriding to 2050
nnnnnnnnnnnnn San Diego Regional Bicycle Plan
Requirements” contain requirements established by Highway Design Manual, Chapter 1000, including minimum dimensions, proper pavement markings,
signage and other design treatments for bicycle facilities. “Additional
Design Recommendations” are provided as guidelines to assist with design
and implementation of facilities and include alternate treatments approved
or recommended but not required by Caltrans. This section provides an
overview of these standard bicycle facilities.
Class II Bike Lanes
Description
A bike lane or Class II bikeway is defined as a portion of the roadway that has been designated by
striping, signage, and pavement markings for one-way bicycle travel on either side of a street or highway.
The following graphics show examples of typical bike lane configurations, including standard signage
and required lane striping.
Graphics
Bike Lane with On-Street Parallel Parking
Source: Alta Planning + Design, 2009
Bike Lane with No On-Street Parking
Source: Alta Planning + Design, 2009
5’ min
Attachment 1 :: Riding to 2050: The San Diego Regional Bicycle Plan 109

BICYCLE DESIGN GUIDELINES | 87
riding to 2050 nnnnnnnnnnnnn
San Diego Regional Bicycle Plannnnnnnnnnnnnn
Bike Lane with Buffer and On-Street Parallel Parking
Source: Alta Planning + Design, 2009
Bike Lane with Back-in Diagonal Parking
Source: Alta Planning + Design, 2009
General Guidelines
The width of the bike lanes vary according to parking and street conditions. Note that these dimensions are
for reference only, and are subject to engineering design review.
4 feet (1.2 m) minimum width if no gutter exists, measured from edge of pavement;
5 feet (1.5 m) minimum width with normal gutter, measured from curb face; or 3' (0.9 m) measured from the gutter pan seam;
5 feet (1.5 m) minimum width when parking stalls are marked; and
11 feet (3.4 m) minimum width for a shared bike/parking lane where parking is permitted but not marked on streets without curbs; or 12 feet (3.7 m) for a shared lane adjacent to a curb face.
Bicycle lanes shall be comprised of a 6 inch solid white stripe on the outside of the lane, and a 4 inch solid white stripe on the inside of the lane.
Where on-street parking is allowed, bicycle lanes must be striped between the parking area and the travel lanes.
In cases where there is insufficient space for a bike lane, cities may recommend removing a traffic lane, narrowing traffic lanes, or prohibiting parking.
The R81 (CA) bicycle lane sign shall be placed at the beginning of all bicycle lanes, on the far side of arterial street intersections, at all changes in direction and at a maximum of 0.6 mile intervals. All standard signage is shown in Chapter 9 of the 2006 California MUTCD.
Attachment 1 :: Riding to 2050: The San Diego Regional Bicycle Plan 110

88 | BICYCLE DESIGN GUIDELINES
Nnnnnnnnnnnnnriding to 2050
nnnnnnnnnnnnn San Diego Regional Bicycle Plan
Additional Discussion
Intersections represent a primary collision point for bicyclists. Small intersections with few lanes are relatively
easy to manage. Large, multi-lane intersections are more difficult for bicyclists to travel through than smaller,
two-lane intersections. Road striping and signage can be used to accommodate bicyclists at critical locations.
Figures 9C1 and 9C3 of the California MUTCD provide standard treatment options for intersections with
right-turn only and left-turn only lanes. Design solutions for bicyclists at large signalized intersections
include:
Signals should be timed to allow slower-moving bicyclists to travel across the intersection per the recommendations in the California Manual for Uniform Traffic Control Devices;
Loop detectors or video detection that is used to actuate the signal should be calibrated to detect bicyclists;
Loop detector stencils should be used to show bicyclists where to position themselves to actuate signals using properly calibrated loop detectors;
Bike boxes and/or warning signage may be used to assist bicyclists who wish to turn left and are required to travel across several motor vehicle lanes to reach the left hand turn lane;
Warning signage may be used to assist bicyclists who are traveling straight and have to merge across motor vehicle traffic that is turning right from a right-turn lane;
Design treatments can help bicyclists travel through intersections and alert motorists of bicyclists’ presence. Good intersection design alerts motorist to bicyclists, indicates to motorists and bicyclists where bicyclists may ride, and guides bicyclists through intersections.
Attachment 1 :: Riding to 2050: The San Diego Regional Bicycle Plan 111

BICYCLE DESIGN GUIDELINES | 89
riding to 2050 nnnnnnnnnnnnn
San Diego Regional Bicycle Plannnnnnnnnnnnnn
Typical Class III Bike Routes
Description
A bike route or Class III bikeway provides routes through areas not served by Class I or II facilities or to connect
discontinuous segments of a bikeway. Class III facilities can be shared with either motorists on roadways or
pedestrians on a sidewalk (strongly discouraged) and is identified only by signing. There are no recommended
minimum widths for Class III facilities, but when encouraging bicyclists to travel along selected routes, traffic
speed and volume, parking, traffic control devices, and surface quality should be acceptable for bicycle travel.
Although it is not a requirement, a wide outside traffic lane (14 feet) is typically preferable to enable cars to
safely pass bicyclists without crossing the centerline. Highway Design Manual, Chapter 1000 provides details
regarding the design requirements for placement and spacing of bicycle route signage.
Graphics
Bike Route with Wide Outside Lane
Source: Alta Planning + Design, 2009
Bike Route on Minor Roadway
Source: Alta Planning + Design, 2009
Attachment 1 :: Riding to 2050: The San Diego Regional Bicycle Plan 112
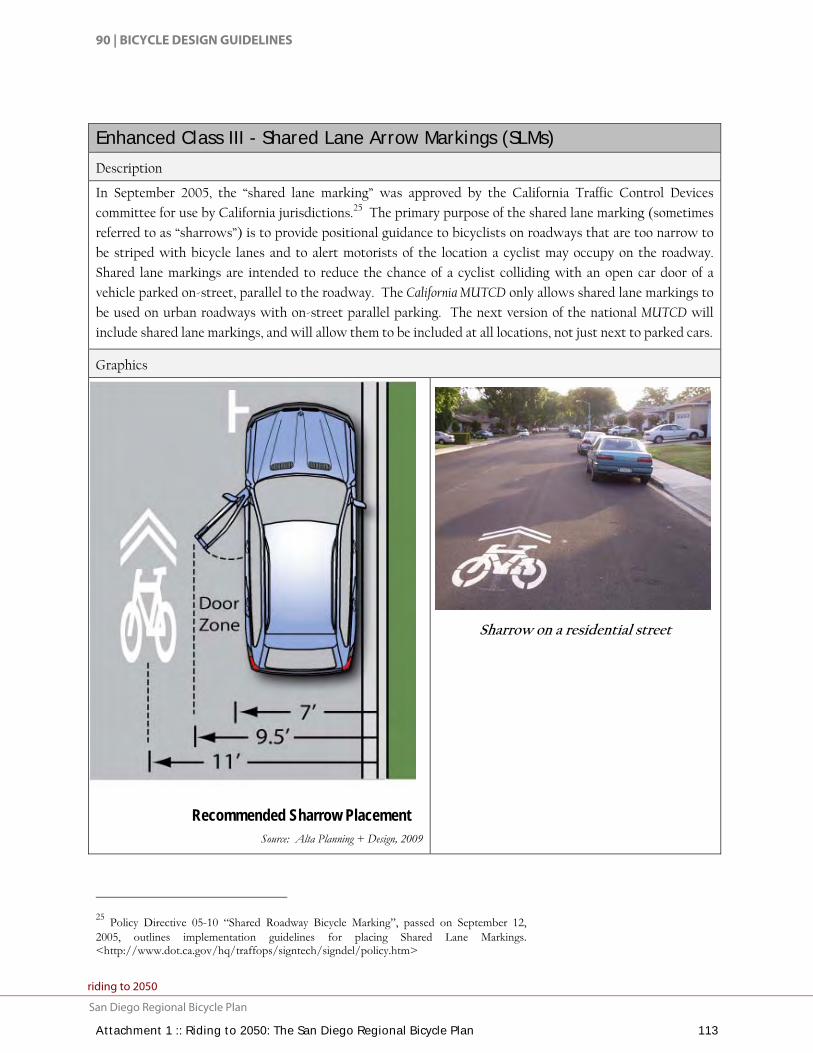
90 | BICYCLE DESIGN GUIDELINES
Nnnnnnnnnnnnnriding to 2050
nnnnnnnnnnnnn San Diego Regional Bicycle Plan
Enhanced Class III - Shared Lane Arrow Markings (SLMs)
Description
In September 2005, the “shared lane marking” was approved by the California Traffic Control Devices
committee for use by California jurisdictions.25 The primary purpose of the shared lane marking (sometimes
referred to as “sharrows”) is to provide positional guidance to bicyclists on roadways that are too narrow to
be striped with bicycle lanes and to alert motorists of the location a cyclist may occupy on the roadway.
Shared lane markings are intended to reduce the chance of a cyclist colliding with an open car door of a
vehicle parked on-street, parallel to the roadway. The California MUTCD only allows shared lane markings to
be used on urban roadways with on-street parallel parking. The next version of the national MUTCD will
include shared lane markings, and will allow them to be included at all locations, not just next to parked cars.
Graphics
Recommended Sharrow Placement
Source: Alta Planning + Design, 2009
Sharrow on a residential street
25 Policy Directive 05-10 “Shared Roadway Bicycle Marking”, passed on September 12, 2005, outlines implementation guidelines for placing Shared Lane Markings. <http://www.dot.ca.gov/hq/traffops/signtech/signdel/policy.htm>
Attachment 1 :: Riding to 2050: The San Diego Regional Bicycle Plan 113

BICYCLE DESIGN GUIDELINES | 91
riding to 2050 nnnnnnnnnnnnn
San Diego Regional Bicycle Plannnnnnnnnnnnnn
General Guidelines
Shared lane markings are appropriate on bicycle network streets that are:
Too narrow for standard striped bicycle lanes;
Areas that experience a high level of "wrong-way" riding; or
Streets that have moderate to high parking turnover, typically in commercial areas.
There is increasing interest in applying sharrows in conjunction with bike lanes on steeper slope roadways. Bike lanes are placed on the uphill side of the roadway and sharrows are placed on the downhill side of the roadway to encourage fast moving bicyclists to position themselves away from parked cars.
Shared lane arrow markings should be installed in conjunction with “share the road” signs
Arrows should be spaced approximately 200’ center to center, with the first arrow on each block or roadway segment placed no further than 100’ from the nearest intersection.
Attachment 1 :: Riding to 2050: The San Diego Regional Bicycle Plan 114
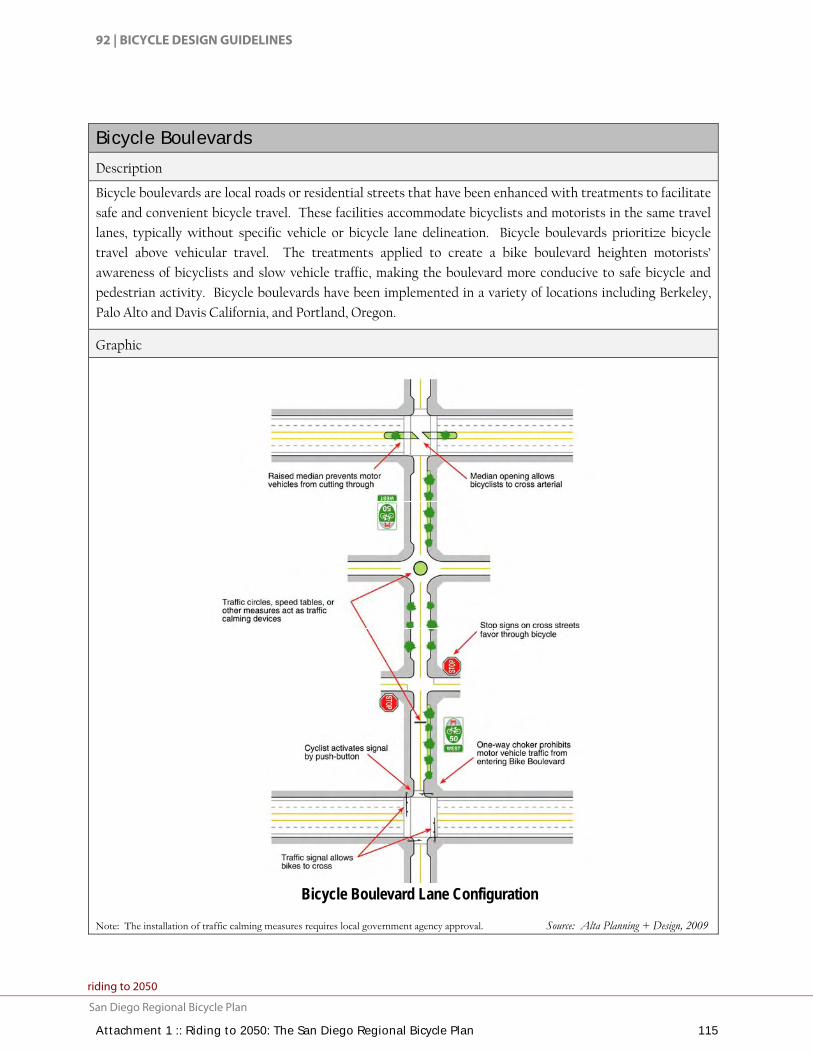
92 | BICYCLE DESIGN GUIDELINES
Nnnnnnnnnnnnnriding to 2050
nnnnnnnnnnnnn San Diego Regional Bicycle Plan
Bicycle Boulevards
Description
Bicycle boulevards are local roads or residential streets that have been enhanced with treatments to facilitate
safe and convenient bicycle travel. These facilities accommodate bicyclists and motorists in the same travel
lanes, typically without specific vehicle or bicycle lane delineation. Bicycle boulevards prioritize bicycle
travel above vehicular travel. The treatments applied to create a bike boulevard heighten motorists’
awareness of bicyclists and slow vehicle traffic, making the boulevard more conducive to safe bicycle and
pedestrian activity. Bicycle boulevards have been implemented in a variety of locations including Berkeley,
Palo Alto and Davis California, and Portland, Oregon.
Graphic
Bicycle Boulevard Lane Configuration
Note: The installation of traffic calming measures requires local government agency approval. Source: Alta Planning + Design, 2009
Attachment 1 :: Riding to 2050: The San Diego Regional Bicycle Plan 115

BICYCLE DESIGN GUIDELINES | 93
riding to 2050 nnnnnnnnnnnnn
San Diego Regional Bicycle Plannnnnnnnnnnnnn
General Guidelines
Bicycle boulevards typically include the following design features:
Traffic calming devices such as traffic circles and curb bulbouts;
Bicycle destination signage;
Pavement stencils indicating status as a bicycle boulevard;
Crossing improvements at major arterials such as traffic signals with bicycle-detection, four-way stops and high-visibility crosswalks;
Bicycle-friendly signal preemption at high-volume signalized intersections;
Stop signs on streets crossing the bicycle boulevard; and
Some jurisdictions have implemented bicycle boulevards by removing on-street parking in select locations.
Bicycle boulevards can be designed to accommodate the particular needs of the residents and businesses
along the routes, and may be as simple as pavement markings with wayfinding signs or as complex as a street
with traffic diverters and bicycle signals. Bike boulevards with signage only typically require extensive
public education to be effective.
To further identify a street as a preferred bicycle route, lower volume roadways may be modified to function as a
through street for bicycles, while maintaining only local access for automobiles. Traffic calming devices can
lower traffic speeds and through trips, limiting conflicts between motorists and bicyclists and providing priority
to through bicycle movement.
For more information, see:
City of Berkeley Bicycle Boulevard Design Tools and Guidelines: http://www.ci.berkeley.ca.us/transportation/Bicycling/BB/Guidelines/linkpag.htm;
Bicycle Transportation Alliance Bicycle Boulevards Campaign: http://www.bta4bikes.org/at_work/bikeboulevards.php
Draft 2009 AASHTO Guide for the Development of Bicycle Facilities
Bicycle Boulevard Design Guidebook (forthcoming publication of the Portland State University Initiative for Bicycle and Pedestrian Innovation (IBPI) and Alta Planning + Design.
Traffic calming on bicycle boulevards
Attachment 1 :: Riding to 2050: The San Diego Regional Bicycle Plan 116

94 | BICYCLE DESIGN GUIDELINES
Nnnnnnnnnnnnnriding to 2050
nnnnnnnnnnnnn San Diego Regional Bicycle Plan
Class I Bike Path (Shared-Use Path)
Description
Typically called a “bike path” or “shared-use path,” a Class I bikeway provides bicycle travel on a paved right-
of-way completely separated from any street or highway. In locations with high use, or on curves with limited
sight distance, a yellow centerline should be used to separate travel in opposite directions. High use areas of
the trail should also provide additional width of up to 12 feet. Lighting should be provided in locations where
evening use is anticipated or where paths cross below structures.
Graphics
Shared-Use Path Example
Source: Alta Planning + Design, 2009
Shared-Use Path Undercrossing
Source: Alta Planning + Design, 2009
Attachment 1 :: Riding to 2050: The San Diego Regional Bicycle Plan 117

BICYCLE DESIGN GUIDELINES | 95
riding to 2050 nnnnnnnnnnnnn
San Diego Regional Bicycle Plannnnnnnnnnnnnn
General Guidelines
The recommended width of a shared-use path is dependent upon anticipated usage:
8 feet (2.4 m) is the minimum width for Class I facilities.
8 feet (2.4 m) may be used for short neighborhood connector paths (generally less than one mile in length) due to low anticipated volumes of use.
10 feet (3.0 m) is the recommended minimum width for a typical two-way shared-use path.
12 feet (3.7 m) is the preferred minimum width if more than 300 users per peak hour are anticipated, and/or if there is heavy mixed bicycle and pedestrian use.
A minimum 2’ (0.6 m) wide graded area must be provided adjacent to the path to provide clearance from trees, poles, walls, guardrails, etc.
Paths should be constructed with adequate sub grade compaction to minimize cracking and sinking, and should be designed to accommodate appropriate loadings, including emergency vehicles.
A 2% cross slope shall be provided to ensure proper drainage.
8 feet (2.4 m) is the required minimum clearance from overhead obstructions, with 10 feet (3.0 m) recommended.
GRADE INTERSECTION: When shared-use paths cross streets, proper design should be developed on the pathway as well as on the
roadway to alert bicyclists and motorists of the crossing. Sometimes on larger streets, at mid-block pathway
crossing locations, an actuated signal is necessary. A signal allows bicyclists a clear crossing of a multi-lane
roadway. If a signal is or is not needed, appropriate signage and pavement markings should be installed,
including stop signs and bike crossing pavement markings.
OVERCROSSINGS: Overcrossings are also an important component of bikeway design. Barriers to bicycling often include
freeways, complex interchanges, and rivers. When a route is not available to cross these barriers a bicycle
overcrossing is necessary.
Some design considerations for overcrossings include:
Pathways must be a minimum 6 feet (1.8 m) wide, with a preferred width of 8 feet (2.4 m) or 10 feet (3.0 m) wide;
Slope of any ramps must comply with ADA Guidelines; and
Screens are often a necessary buffer between vehicle traffic and the bicycle overcrossing.
UNDERCROSSINGS: Undercrossings are an important component of Class I bikeway design. Some considerations for
undercrossings include:
Must have adequate lighting and sight distance for safety;
Must have adequate over-head clearance of at least 10 feet (3.0 m);
Tunnels should be a minimum width of 14 feet (4.3 m) for several users to pass one another safely; a 10 feet x 20 feet (3.0 m x 6.1 m) arch is the recommended standard;
“Channeling” with fences and walls into the tunnel should be avoided for safety reasons; and
May require drainage if the sag point is lower than the surrounding terrain.
Attachment 1 :: Riding to 2050: The San Diego Regional Bicycle Plan 118

96 | BICYCLE DESIGN GUIDELINES
Nnnnnnnnnnnnnriding to 2050
nnnnnnnnnnnnn San Diego Regional Bicycle Plan
Bicycle Signals & Adaptive Signal Timing
Description
Making intersections more “friendly” to bicyclists, involves modifying how they operate. Improved signal
timing, calibrating loop detectors to detect bicyclists, and camera detection makes intersections easier for
bicyclists to cross intersections.
Bicycle loop detectors activate traffic signals at intersections, similar to standard loop detectors used for auto traffic.
Where bicycle loop detectors are not present, bicyclists are forced to wait for a motor vehicle to trigger a signal;
where motor vehicle traffic is infrequent, they may cross against a red signal. Bicycle loop detectors should be
identified with pavement markings that show cyclists where to position themselves to trigger the traffic signal.
A bicycle signal provides an exclusive signal phase for bicyclists traveling through an intersection. This takes the
form of a new signal head installed with red, amber, and green bicycle indications. Bicycle signals can be actuated
with bicycle sensitive loop detectors, video detection, or push buttons. Bicycle signals became an approved traffic
control device in the state of California after the technology was studied after years of service in the City of Davis.
Part 4 of the California MUTCD covers bicycle signals.
Graphics
Bicycle signal
Bicycle loop detector stencil
Attachment 1 :: Riding to 2050: The San Diego Regional Bicycle Plan 119

BICYCLE DESIGN GUIDELINES | 97
riding to 2050 nnnnnnnnnnnnn
San Diego Regional Bicycle Plannnnnnnnnnnnnn
General Guidelines
Bicycle signals are typically considered in locations with heavy bicycle traffic combined with significant
conflicts with motor vehicles, at intersections with unique geometry or at the interface between busy roads
and off-street bicycle facilities. Specific situations where bicycle signals have had a demonstrated positive
effect include:
Locations with high volume of bicyclists at peak hours;
Locations with high numbers of bicycle/motor vehicle crashes, especially those caused by crossing
paths;
At T-intersections with major bicycle movement along the top of the T;
At the confluence of an off-street bike path and a roadway intersection; and
Where separated bike paths run parallel to arterial streets.
While bicycle signals are approved for use in California, local municipal code should be checked or modified to
clarify that at intersections with bicycle signals, bicycles should only obey the bicycle signal heads.
Attachment 1 :: Riding to 2050: The San Diego Regional Bicycle Plan 120

98 | BICYCLE DESIGN GUIDELINES
Nnnnnnnnnnnnnriding to 2050
nnnnnnnnnnnnn San Diego Regional Bicycle Plan
On-Street Bikeway Signage
Description
Standard signage for on-street bikeways includes standard BIKE LANE and BIKE ROUTE signage, as well as
supplemental signage such as SHARE THE ROAD and warning signage for constrained bike lane conditions.
Engineers should consult the California MUTCD for the full spectrum and applicability of signage options.
Graphics
Potential Signage Options for Bike Routes/Bicycle Boulevards
(not comprehensive)
Source: California MUTCD
Berkeley, CA bike boulevard signage
San Francisco, CA route identification signage
Attachment 1 :: Riding to 2050: The San Diego Regional Bicycle Plan 121

BICYCLE DESIGN GUIDELINES | 99
riding to 2050 nnnnnnnnnnnnn
San Diego Regional Bicycle Plannnnnnnnnnnnnn
Additional Discussion
Wayfinding signage is an important part of the bicycle network. Implementing a well-planned and attractive
system of signage can greatly enhance bikeway facilities, making their presence aware to motorists, as well as
existing and potential bicyclists. By leading people to city bikeways that offer safe and efficient
transportation, effective signage can encourage residents and visitors to bicycle. Way-finding can include mile-
markers, route identification, and informational kiosks.
Destination signage helps bicyclists use the bikeway network as an effective transportation system. These
signs typically display distance, direction and in some cases, estimated travel time information to various
destinations and activity centers. In the San Diego region, destination signage would be helpful for
destinations such as downtown, Balboa Park, UCSD, and beaches. Signage can also assist users to navigate
towards major bikeways, transit hubs, or greenway trails. Finally, way-finding can help bicyclists avoid
difficult and potentially hazardous road scenarios, like steep terrain, dangerous intersections, highway and
river crossings, or deteriorating road conditions.
Wayfinding and bike route network signage is recommended for the San Diego region. California MUTCD
defines standards for these route network signs. Most commonly, they show the route number and the
corresponding direction. Route naming and numbering should be coordinated between neighboring
jurisdictions where bikeways cross cities’ boundaries so that the regional signage system is seamless.
For bike route signs, California MUTCD requires a green background and white lettering. The top third portion
of the sign is customizable for the city or region where it is located. For example, the City of San Francisco
shows the Golden Gate Bridge on its bike route signs.
The multi-use path network should be integrated with on-street bike facility signage to encourage use of paths
for recreational as well as utilitarian bicycling; helping bicyclists of all ages and abilities reach destinations
more easily.
Informational kiosks, complete with maps of the surrounding area, can help provide initial orientation and
bearings for bicyclists beginning their journeys at major transit hubs, or transitioning from off-street to on-
street facilities.
Attachment 1 :: Riding to 2050: The San Diego Regional Bicycle Plan 122

100 | BICYCLE DESIGN GUIDELINES
Nnnnnnnnnnnnnriding to 2050
nnnnnnnnnnnnn San Diego Regional Bicycle Plan
7.4 Innovative Treatments and Signage The following section describes facilities and treatments that are intended
to enhance safety but are not adopted as standard treatments by the
California MUTCD or Caltrans Highway Design Manual.
Bike Boxes
Description
A bike box is a relatively simple innovation to improve turning movements for bicyclists without requiring
cyclists to merge into traffic to reach the turn lane or use crosswalks as a pedestrian. The bike box is formed
by pulling the stop line for vehicles back from the intersection, and adding a stop line for bicyclists
immediately behind the crosswalk. When a traffic signal is red, bicyclists can move into this “box” ahead of
the cars to make themselves more visible, or to move into a more comfortable position to make a turn. Bike
Boxes are not included in the California MUTCD.
Graphic
Possible Bike Box Configuration Source: Alta Planning + Design, 2009
Examples of bike boxes
Attachment 1 :: Riding to 2050: The San Diego Regional Bicycle Plan 123

BICYCLE DESIGN GUIDELINES | 101
riding to 2050 nnnnnnnnnnnnn
San Diego Regional Bicycle Plannnnnnnnnnnnnn
General Guidelines
Apply at intersections with a high volume of bicycles and motor vehicles.
Apply where there are frequent turning conflicts and/or intersections with a high percentage of
turning movements by both bicyclists and motorists.
California MUTCD signage should be present to prevent ‘right turn on red’ and to indicate where
the motorist must stop.
In the US, bicycle boxes have been used in Cambridge, MA, Portland, OR and Eugene, OR. They
have been used in a variety of locations throughout Europe.
Attachment 1 :: Riding to 2050: The San Diego Regional Bicycle Plan 124

102 | BICYCLE DESIGN GUIDELINES
Nnnnnnnnnnnnnriding to 2050
nnnnnnnnnnnnn San Diego Regional Bicycle Plan
Colored Bike Lanes in Conflict Areas
Description
European countries have used colored pavement – red, blue, yellow, and green—for bike lanes where this is a
higher probability of vehicle conflicts. Examples of such locations are freeway on- and off-ramps where
motorists move into a right turn pocket. In the United States cities such as Portland and Seattle have
experimented with colored bike lanes and supportive signage with favorable results. Studies conducted in
Portland showed that more motorists were using their turn signals and slowing or stopping at the blue lanes.
Colored Bike Lanes are not included in the California MUTCD.
Graphics
Colored Bike Lane Configuration
Source: Alta Planning + Design, 2009
Examples of colored bike lanes in U.S. cities
Attachment 1 :: Riding to 2050: The San Diego Regional Bicycle Plan 125

BICYCLE DESIGN GUIDELINES | 103
riding to 2050 nnnnnnnnnnnnn
San Diego Regional Bicycle Plannnnnnnnnnnnnn
General Guidelines
This treatment is not currently present in any State or Federal design standards.
Colored bike lanes are used to guide bicyclists through major vehicle/bicycle conflict points,
especially at locations where the volume of conflicting vehicle traffic is high, and where the
vehicle/bicycle conflict area is long.
Colored bike lanes typically extend through the entire bicycle/vehicle conflict zone (e.g., through
the entire intersection, or through the transition zone where motorists cross a bike lane to enter a
dedicated right-turn lane.
Portland’s Blue Bike Lanes: http://www.portlandonline.com/shared/cfm/image.cfm?id=58842
Attachment 1 :: Riding to 2050: The San Diego Regional Bicycle Plan 126

104 | BICYCLE DESIGN GUIDELINES
Nnnnnnnnnnnnnriding to 2050
nnnnnnnnnnnnn San Diego Regional Bicycle Plan
Cycle Tracks
Description
Cycle tracks are receiving increasing levels of interest and attention from planners and engineers in the
United States, although they are not currently considered a standard facility type. The Highway Design
Manual, Chapter 1000 does not define cycle tracks as a bikeway or include provisions for cycle track
designs. Cycle tracks are physically separated one-way (or two-way) bike lanes in the roadway right-of-
way. These bikeways are located between sidewalks and vehicle travel lanes or parking lanes and are a
delineated area specifically for through bicycle traffic. Cycle tracks can be at the same plane as sidewalks
but are usually separated by a low curb or barrier. There should be sidewalks adjacent to cycle tracks to
prevent pedestrians from confusing cycle tracks with multi-use paths. When crossing cycle tracks,
pedestrians should have the right-of-way. On the motor vehicle side of cycle tracks, if there is an on-street
vehicle parking lane then there is normally a two to three foot buffer preventing car doors from entering the
bikeway. If there is no on-street parking, a larger barrier is put in place to separate bicycles and automobile
traffic.
Graphics
Cycle Track with No On-Street Parking Source: Alta Planning + Design, 2008
Cycle track in New York City, NY
Attachment 1 :: Riding to 2050: The San Diego Regional Bicycle Plan 127

BICYCLE DESIGN GUIDELINES | 105
riding to 2050 nnnnnnnnnnnnn
San Diego Regional Bicycle Plannnnnnnnnnnnnn
General Guidelines
Cycle tracks are useful along streets with minimal crossings.
Intersections should be designed to include signage that alerts motorists of bicyclists crossing from
the cycle track, and vegetation and parking should be limited near intersections so that bicyclists
and motorists can see each other.
If cycle tracks are two-way, motorists should be alerted to the fact that bicyclists will be
approaching from both directions.
To help decrease the number of wrong-way riding bicyclists on one-way cycle tracks,
complimentary facilities should be provided on the opposite side of the street.
While cycle tracks increase bicyclists’ comfort on urban and suburban streets, intersection
treatments are needed to mitigate turn movement conflicts. Protective measures include retrofitting
signalized intersections to provide separate left and right turn movements, adding bicycle-only
signals, requiring no right-turn-on-red, and warning signage and special markings at unsignalized
intersections. Other innovative treatments, such as colored pavement, can complement these
facilities and improve warnings to motorists.
For additional discussion of cycle track designs, see the white paper on cycle tracks provided in
Appendix I.
Attachment 1 :: Riding to 2050: The San Diego Regional Bicycle Plan 128

106 | BICYCLE DESIGN GUIDELINES
Nnnnnnnnnnnnnriding to 2050
nnnnnnnnnnnnn San Diego Regional Bicycle Plan
Shared Bike-Bus Lane
Description
Travel time for bikes and buses can be improved with a dedicated shared bicycle/bus lane, so that neither is
hindered or endangered by congestion from other auto traffic. Shared bicycle/bus lanes are commonly used
in central business districts where room for dedicated bicycle lanes is limited, and where motor vehicle
congestion warrants a separate facility for buses.
Graphic
Shared Bike-Bus Configuration Source: Alta Planning + Design, 2009
Shared Bike-Bus Signage
General Guidelines
Potential locations for bicycle/bus lane implementation include congested streets with moderate or long bus headways, streets with moderate bus headways during peak hours, or places that provide no reasonable alternative routing alignment.
Shared bicycle/bus lanes should be paved with colored asphalt and stenciled as a diamond lane with supporting signage and pavement legends to emphasize their designation.
Lanes should be wide enough to allow bicyclists to comfortably pass stopped buses on the left. Twelve feet is the recommended minimum width of shared bicycle/bus lanes.
Potential disadvantages of shared lanes include a leapfrogging between buses and bikes (when buses and bikes are continually passing one another in the lane). Leapfrogging creates a greater potential for conflicts. The second disadvantage is when vehicles are allowed to use the lane at intersections as a right turn lane. This slows and creates potential conflict points between bicycles and vehicles and slows buses and bicycles significantly.
Attachment 1 :: Riding to 2050: The San Diego Regional Bicycle Plan 129

BICYCLE DESIGN GUIDELINES | 107
riding to 2050 nnnnnnnnnnnnn
San Diego Regional Bicycle Plannnnnnnnnnnnnn
Contra-Flow Bicycle Lanes
Description
Contra-flow bicycle lanes entail a striped lane for bicycles going against the flow of automobile travel. The
lanes should be separated by a double-yellow line. Contra-flow bike lanes are not included in the
Highway Design Manual, Chapter 1000.
Contra-flow bike lanes are designated lanes that allow bicycles to move in the opposite direction of traffic on
a one-way street. Functionally, streets with contra-flow bicycle lanes are set up so that motor vehicles can
only move one way on the road, while bikes can move in both directions – with traffic or opposite traffic in
the contra-flow lane.
Graphic
Attachment 1 :: Riding to 2050: The San Diego Regional Bicycle Plan 130

108 | BICYCLE DESIGN GUIDELINES
Nnnnnnnnnnnnnriding to 2050
nnnnnnnnnnnnn San Diego Regional Bicycle Plan
General Guidelines
Their implementation is controversial primarily because, contrary to standard road rules, they encourage
cyclists to ride against motor-vehicle right of way, which can lead to increased bicycle/motor-vehicle crashes.
However, in some circumstances, they may offer substantial savings in out-of-direction travel, by providing
more direct routes. For popular destinations and high-use bikeways, a contra-flow lane can increase safety
by reducing the number of bicyclists, and the number of conflicts, along the longer indirect route.
Potential Applications:
Provides direct access to key destination;
Improves safety;
Infrequent driveways on bike lane side;
Bicyclists can safely and conveniently re-enter traffic at either end;
Sufficient width to provide bike lane;
No parking on side of street with bike lane;
Existing high bicycle usage of street;
Less than three blocks in length; or
No other reasonable route for bicyclist.
Contra-flow lanes are most successful on streets with few intersecting driveways, alleys or streets on the
side of the lane; on streets where bicyclists can safely and conveniently re-enter the traffic stream at either
end of the lane; on streets where a substantial number of bicyclists are already using the street; and on streets
with sufficient width to accommodate a bike lane.
Special features to incorporate into contra-flow bike lane design include the following.
The contra-flow bike lane must be placed on the right side of the street (to motorists' left) and must be separated from oncoming traffic by at least a double yellow line; vertical separation or grade separation is encouraged. This indicates that the bicyclists are riding on the street legally, in a dedicated travel lane.
Any intersecting alleys, major driveways, and streets must have signs indicating to motorists that they should expect two-way bicycle traffic.
Existing traffic signals should be fitted with actuators for bicyclists (i.e. loop detectors, video cameras, infrared or push buttons).
Existing traffic signals should be modified (if necessary) so that bicyclists traveling in the contra-flow direction can see the signal head, and any conflicting turn phasing shall be eliminated.
Attachment 1 :: Riding to 2050: The San Diego Regional Bicycle Plan 131
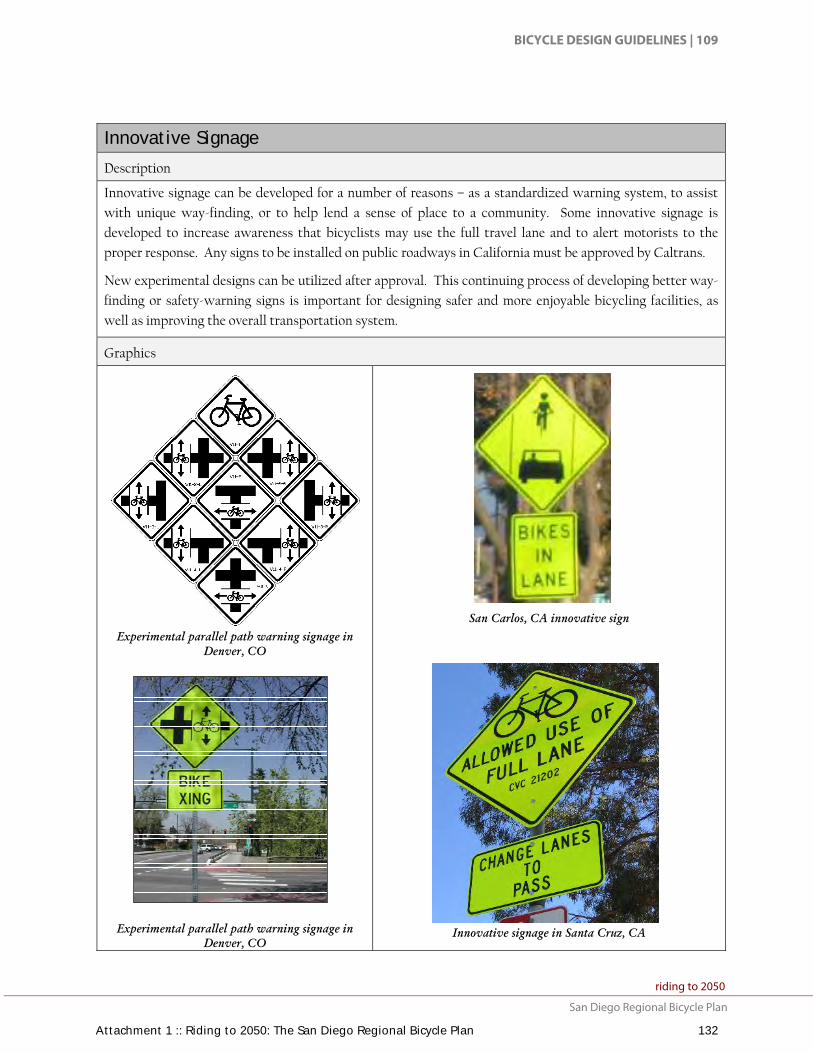
BICYCLE DESIGN GUIDELINES | 109
riding to 2050 nnnnnnnnnnnnn
San Diego Regional Bicycle Plannnnnnnnnnnnnn
Innovative Signage
Description
Innovative signage can be developed for a number of reasons – as a standardized warning system, to assist
with unique way-finding, or to help lend a sense of place to a community. Some innovative signage is
developed to increase awareness that bicyclists may use the full travel lane and to alert motorists to the
proper response. Any signs to be installed on public roadways in California must be approved by Caltrans.
New experimental designs can be utilized after approval. This continuing process of developing better way-
finding or safety-warning signs is important for designing safer and more enjoyable bicycling facilities, as
well as improving the overall transportation system.
Graphics
Experimental parallel path warning signage in Denver, CO
Experimental parallel path warning signage in
Denver, CO
San Carlos, CA innovative sign
Innovative signage in Santa Cruz, CA
Attachment 1 :: Riding to 2050: The San Diego Regional Bicycle Plan 132
110 | BICYCLE DESIGN GUIDELINES
Nnnnnnnnnnnnnriding to 2050
nnnnnnnnnnnnn San Diego Regional Bicycle Plan
7.5 Bicycle Parking As more bikeways are constructed and bicycle usage grows, the need for
bike parking will increase. Short-term parking at shopping centers and
similar land uses can support bicycling as well as long-term bicycle parking
at transit stations, work sites and schools.
Bicycle parking should be installed on public property, or available to
private entities on an at-cost basis. Bicycle parking facilities should be
provided at other public destinations, including government buildings,
community centers, parks, schools and shopping centers.
All bicycle parking should be in a safe, secure area visible to passersby.
Commuter locations should provide secure indoor parking, covered bicycle
corrals, or bicycle lockers. Bicycle parking on sidewalks in commercial
areas should be provided according to specific design criteria, reviewed by
merchants and the public, and installed as demand warrants.
Attachment 1 :: Riding to 2050: The San Diego Regional Bicycle Plan 133

BICYCLE DESIGN GUIDELINES | 111
riding to 2050 nnnnnnnnnnnnn
San Diego Regional Bicycle Plannnnnnnnnnnnnn
Short Term Bicycle Parking
Description
Short term bicycle parking facilities are best used to accommodate visitors, customers, messengers and
others expected to depart within two hours. Bicycle racks provide support for the bicycle but do not
have locking mechanisms. Racks are relatively low-cost devices that typically hold between two and
eight bicycles, allow bicyclists to securely lock their frames and wheels, are secured to the ground, and
are located in highly visible areas. They are usually located at schools, commercial locations, and
activity centers such as parks, libraries, retail locations, and civic centers.
Graphics
Bike Rack Recommendations
Source: Association of Pedestrian and Bicycle Professionals, 2002
Custom artistic racks
Inverted U rack
Attachment 1 :: Riding to 2050: The San Diego Regional Bicycle Plan 134
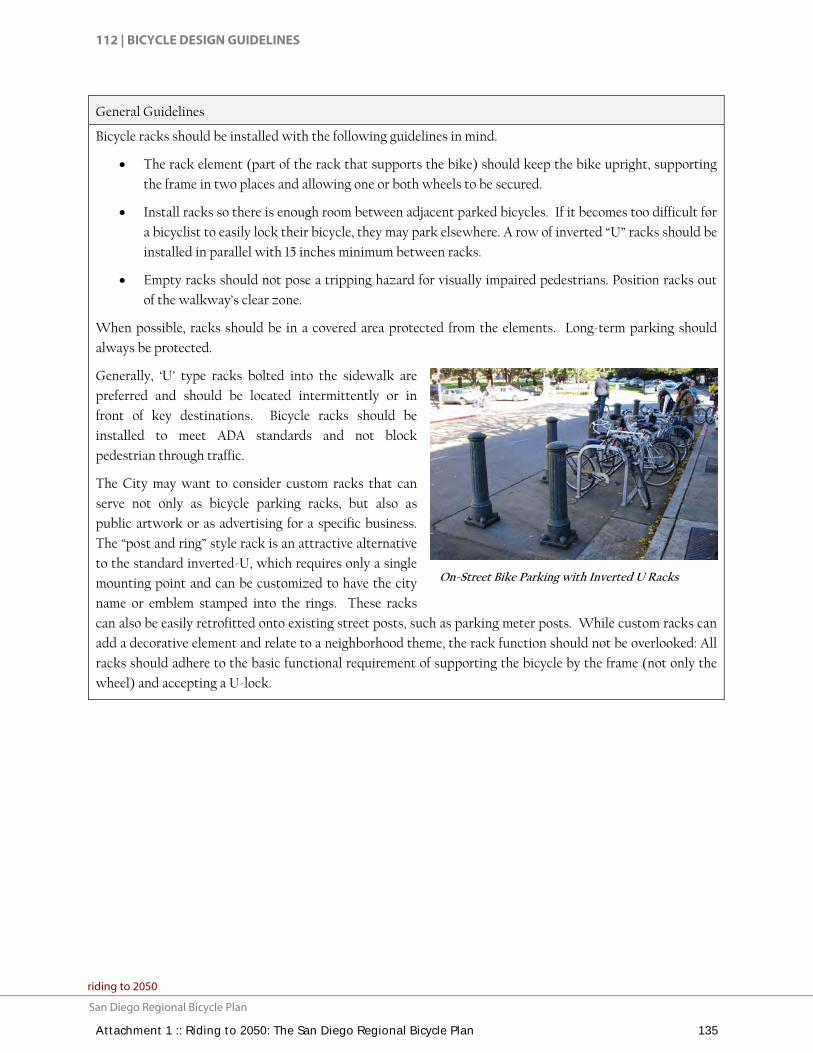
112 | BICYCLE DESIGN GUIDELINES
Nnnnnnnnnnnnnriding to 2050
nnnnnnnnnnnnn San Diego Regional Bicycle Plan
On-Street Bike Parking with Inverted U Racks
General Guidelines
Bicycle racks should be installed with the following guidelines in mind.
The rack element (part of the rack that supports the bike) should keep the bike upright, supporting
the frame in two places and allowing one or both wheels to be secured.
Install racks so there is enough room between adjacent parked bicycles. If it becomes too difficult for
a bicyclist to easily lock their bicycle, they may park elsewhere. A row of inverted “U” racks should be
installed in parallel with 15 inches minimum between racks.
Empty racks should not pose a tripping hazard for visually impaired pedestrians. Position racks out
of the walkway’s clear zone.
When possible, racks should be in a covered area protected from the elements. Long-term parking should
always be protected.
Generally, ‘U’ type racks bolted into the sidewalk are
preferred and should be located intermittently or in
front of key destinations. Bicycle racks should be
installed to meet ADA standards and not block
pedestrian through traffic.
The City may want to consider custom racks that can
serve not only as bicycle parking racks, but also as
public artwork or as advertising for a specific business.
The “post and ring” style rack is an attractive alternative
to the standard inverted-U, which requires only a single
mounting point and can be customized to have the city
name or emblem stamped into the rings. These racks
can also be easily retrofitted onto existing street posts, such as parking meter posts. While custom racks can
add a decorative element and relate to a neighborhood theme, the rack function should not be overlooked: All
racks should adhere to the basic functional requirement of supporting the bicycle by the frame (not only the
wheel) and accepting a U-lock.
Attachment 1 :: Riding to 2050: The San Diego Regional Bicycle Plan 135

BICYCLE DESIGN GUIDELINES | 113
riding to 2050 nnnnnnnnnnnnn
San Diego Regional Bicycle Plannnnnnnnnnnnnn
Long Term Bicycle Parking
Description
For long-term parking, the cities may want to consider bicycle lockers. Bicyclists are usually more
comfortable storing their bicycles in lockers for long periods because they offer increased security and
protection from natural elements. Although they may be more expensive to install, they can make the
difference for commuters deciding whether or not to bicycle.
Lockers can be controlled with traditional key systems or through more elaborate subscription systems.
Subscription locker programs, like e-lockers, or park-by-phone systems allow even more flexibility within
locker use. Instead of restricting access for each patron to a single locker, subscribers can gain access to all
lockers within a system, controlled by magnetic access cards, or caller ID. These programs typically have
fewer administrative costs because they simplify or eliminate key management and locker assignment.
Long-term bicycle parking facilities accommodate employees, students, residents, commuters, and others
expected to park more than two hours. This parking should be provided in a secure, weather-protected manner
and location. Long-term bicycle parking will either be a bicycle locker, or a secure area like a ‘bike corral’ that
may be accessed only by bicyclists.
Graphic
Bike Locker Configuration
Source: Alta Planning + Design, 2000
Attachment 1 :: Riding to 2050: The San Diego Regional Bicycle Plan 136

114 | BICYCLE DESIGN GUIDELINES
Nnnnnnnnnnnnnriding to 2050
nnnnnnnnnnnnn San Diego Regional Bicycle Plan
Innovative High Volume Bicycle Parking
Description
In many locations, individual U-racks located on the sidewalk can be sufficient to meet bicycle parking
demand. Where bicycle parking demand is higher, more formal structures and larger facilities need to be
provided. Several options for high-volume bicycle parking are outlined below.
Graphic
Bike Oasis
Bike Corral in Portland, OR
Bike Station in Chicago, IL
Attachment 1 :: Riding to 2050: The San Diego Regional Bicycle Plan 137

BICYCLE DESIGN GUIDELINES | 115
riding to 2050 nnnnnnnnnnnnn
San Diego Regional Bicycle Plannnnnnnnnnnnnn
General Guidelines
On‐Street Bike Parking Corral:
A relatively inexpensive solution to providing high-volume bicycle parking is to convert one or two on-street
motor vehicle parking spaces into on-street bicycle parking. Bike racks are installed in the street and
protected from motor vehicles with removable curbs and bollards. These Bike Parking Corrals move
bicycles off the sidewalks, and leave space for sidewalk café tables or pedestrians. Bicycle parking does not
block sightlines like motor vehicles do, so it may be possible to locate bicycle parking in no-parking zones
near intersections and crosswalks.
Bike Oasis:
In 2008, the City of Portland, Oregon began installation of several “Bike Oases” in commercial districts.
These signature bicycle parking facilities are installed on curb extensions and consist of attractive covered
bike parking and an information panel. Portland’s Bike Oases provide parking space for ten bikes. Bike and
walking maps are installed on the information panel.
Bike Stations:
Bike stations serve as one-stop bicycle service centers for bicycle commuters. They include 24-hour secure
bicycle parking and may provide additional amenities such as a store to purchase items (helmets, raingear,
tubes, patch kits, bike lights, and locks), bicycle repair facilities, showers and changing facilities, bicycle
rentals, and information about biking. Some bike stations provide free bike parking, while others charge a
fee or require membership.
Bike stations have been installed in several cities in California, including Long Beach, San Francisco, Los
Angeles and Berkeley, as well as Chicago, and Seattle.
Valet Bike Parking:
The San Diego Padres currently provides bike parking in a pavilion at Sunday afternoon Padres games as
does the San Diego County Bicycle Coalition (SDCBC) during other community events. To expand bike
parking options, indoor locations for storing bicycles should be designed into future venues that host
sporting events, festivals, and other events where large numbers of people gather.
In San Francisco, attended bicycle parking is provided at the AT&T Stadium, home of the San Francisco
Giants. The bicycle valet sees between 100 and 180 bicycles per game on average (The stadium’s capacity is
41,503). In addition to providing bicycle valet parking, the City and stadium heavily promote using
alternative modes to get to the stadium, emphasizing that “if you drive you will get stuck in traffic.”
Their valet parking system works much like a coat check: the bicyclist gives their bicycle to the attendant,
who tags the bicycle with a number and gives the bicyclist a claim stub. The valet also will take non-
motorized devices such as rollerblades, baby strollers and push scooters. When the bicyclist returns to get
the bicycle, they present the claim stub and the attendant retrieves the bicycle for them. Locks are not
needed. The valet is open from two hours before the game to thirty minutes after.
Attachment 1 :: Riding to 2050: The San Diego Regional Bicycle Plan 138
Riding To 2050: The San Diego Regional Bicycle Plan Evaluation Criteria Summary The following is a summary of the evaluation criteria used to prioritize projects for inclusion in the Regional
Bicycle Network identified in Riding to 2050. The criteria include three components:
1. Demand-based Criteria
2. Facilities-based Criteria
3. Cost-to-Nee d Ratio
Demand-based Criteria
Location in Metropolitan Center/Urban Center/Town Center Smart Growth Opportunity Areas
Facilities-based Criteria
1. Fills in facility gaps
2. Existence of funding for unbuilt segment
3. Crash density in project area
4. Number of public comments received regarding segment
Cost-to-Need Ratio
Cost-to-Need Ratio = (Demand-based score + Facilities-based score)/Cost weighted by facility type
Attachment 2 :: Bicycle Plan Project Prioritization Criteria 139

MEMORANDUM Date: 20 September 2013 To: Christine Eary, SANDAG From: Matt Benjamin, Jeremy Klop & Michael Kennedy, Fehr & Peers
Subject: SR2T Station Typologies Ref: SD13-0086
This memorandum summarizes our recommended station context typological categories to be used to inform the development of contextually appropriate safe routes to transit (SR2T) enhancements.
SANDAG PLACE TYPOLOGIES
The SANDAG Regional Comprehensive Plan (RCP) identifies seven smart growth place types, and identifies existing and potential/planned locations of these place types in the region. These place types are identified both by minimum land use thresholds in terms of residential and employment densities (dwelling units per acre, employees per acre), as well as minimum levels of transit service in terms of transit type (commuter rail, bus rapid transit, local bus, etc.). The following table details the minimum residential and employment targets, and the minimum transit service characteristics of the seven smart growth place types:
Regional Comprehensive Plan Smart Growth Place Type Targets
Source: SANDAG Smart Growth Concept Map Site Descriptions, January 27, 2013
Attachment 3 :: Safe Routes to Transit Methodology 140
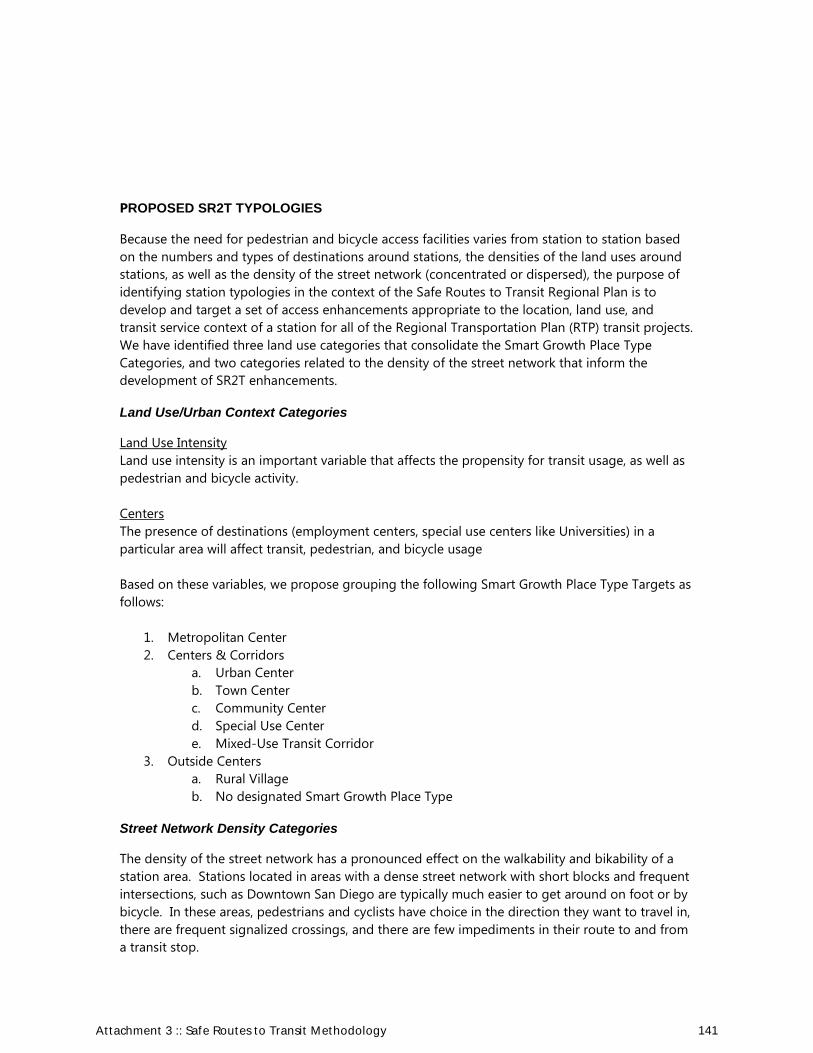
PROPOSED SR2T TYPOLOGIES
Because the need for pedestrian and bicycle access facilities varies from station to station based on the numbers and types of destinations around stations, the densities of the land uses around stations, as well as the density of the street network (concentrated or dispersed), the purpose of identifying station typologies in the context of the Safe Routes to Transit Regional Plan is to develop and target a set of access enhancements appropriate to the location, land use, and transit service context of a station for all of the Regional Transportation Plan (RTP) transit projects. We have identified three land use categories that consolidate the Smart Growth Place Type Categories, and two categories related to the density of the street network that inform the development of SR2T enhancements.
Land Use/Urban Context Categories
Land Use Intensity Land use intensity is an important variable that affects the propensity for transit usage, as well as pedestrian and bicycle activity. Centers The presence of destinations (employment centers, special use centers like Universities) in a particular area will affect transit, pedestrian, and bicycle usage Based on these variables, we propose grouping the following Smart Growth Place Type Targets as follows:
1. Metropolitan Center 2. Centers & Corridors
a. Urban Center b. Town Center c. Community Center d. Special Use Center e. Mixed-Use Transit Corridor
3. Outside Centers a. Rural Village b. No designated Smart Growth Place Type
Street Network Density Categories
The density of the street network has a pronounced effect on the walkability and bikability of a station area. Stations located in areas with a dense street network with short blocks and frequent intersections, such as Downtown San Diego are typically much easier to get around on foot or by bicycle. In these areas, pedestrians and cyclists have choice in the direction they want to travel in, there are frequent signalized crossings, and there are few impediments in their route to and from a transit stop.
Attachment 3 :: Safe Routes to Transit Methodology 141
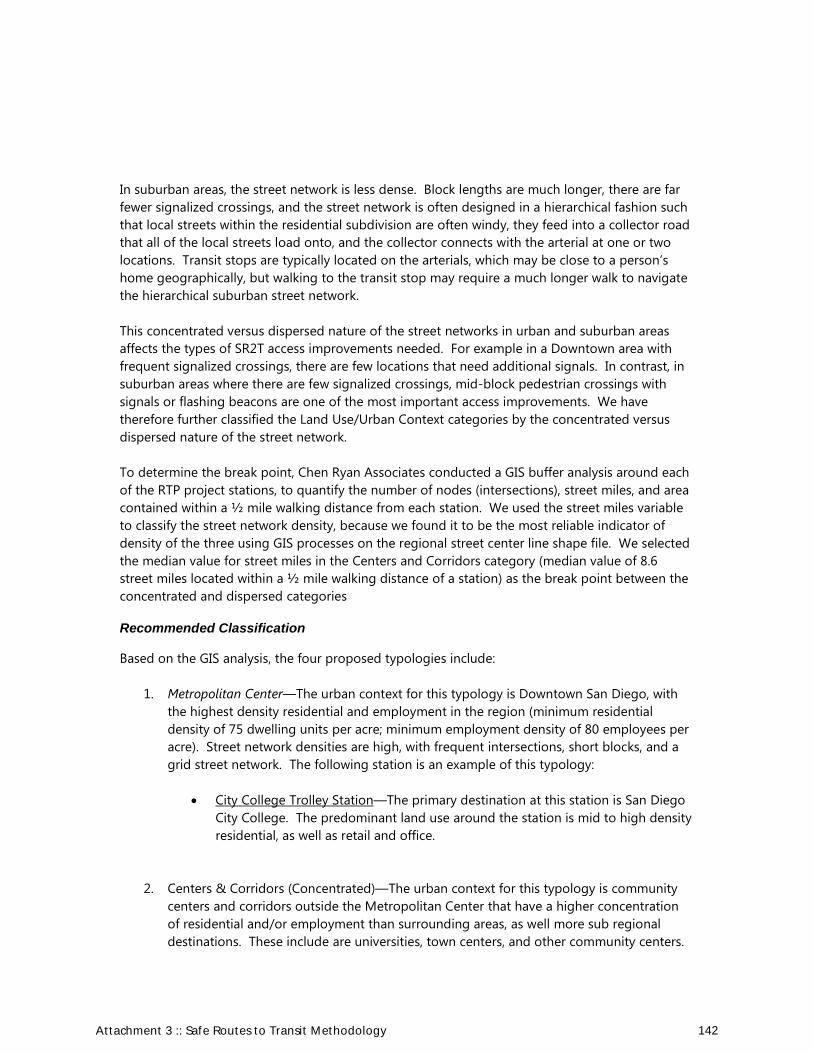
In suburban areas, the street network is less dense. Block lengths are much longer, there are far fewer signalized crossings, and the street network is often designed in a hierarchical fashion such that local streets within the residential subdivision are often windy, they feed into a collector road that all of the local streets load onto, and the collector connects with the arterial at one or two locations. Transit stops are typically located on the arterials, which may be close to a person’s home geographically, but walking to the transit stop may require a much longer walk to navigate the hierarchical suburban street network. This concentrated versus dispersed nature of the street networks in urban and suburban areas affects the types of SR2T access improvements needed. For example in a Downtown area with frequent signalized crossings, there are few locations that need additional signals. In contrast, in suburban areas where there are few signalized crossings, mid-block pedestrian crossings with signals or flashing beacons are one of the most important access improvements. We have therefore further classified the Land Use/Urban Context categories by the concentrated versus dispersed nature of the street network. To determine the break point, Chen Ryan Associates conducted a GIS buffer analysis around each of the RTP project stations, to quantify the number of nodes (intersections), street miles, and area contained within a ½ mile walking distance from each station. We used the street miles variable to classify the street network density, because we found it to be the most reliable indicator of density of the three using GIS processes on the regional street center line shape file. We selected the median value for street miles in the Centers and Corridors category (median value of 8.6 street miles located within a ½ mile walking distance of a station) as the break point between the concentrated and dispersed categories
Recommended Classification
Based on the GIS analysis, the four proposed typologies include:
1. Metropolitan Center—The urban context for this typology is Downtown San Diego, with the highest density residential and employment in the region (minimum residential density of 75 dwelling units per acre; minimum employment density of 80 employees per acre). Street network densities are high, with frequent intersections, short blocks, and a grid street network. The following station is an example of this typology:
• City College Trolley Station—The primary destination at this station is San Diego City College. The predominant land use around the station is mid to high density residential, as well as retail and office.
2. Centers & Corridors (Concentrated)—The urban context for this typology is community centers and corridors outside the Metropolitan Center that have a higher concentration of residential and/or employment than surrounding areas, as well more sub regional destinations. These include are universities, town centers, and other community centers.
Attachment 3 :: Safe Routes to Transit Methodology 142

Minimum residential densities range from 20 to 40 dwelling units per acre, and minimum employment densities range from 30 to 50 employees per acre, for centers that are employment focused. The street network density is still relatively high. Examples of this typology include existing and proposed station areas in North Park, Uptown, and La Jolla. The following station is an example of this typology:
• Encinitas Coaster Station—The context of this station is Downtown Encinitas with
low to mid density retail and residential. The high density street network is characterized by short blocks in a grid-pattern with frequent intersections.
3. Centers & Corridors (Dispersed)—The urban context for this typology is described above,
but the street network density is below 8.6 street miles within the ½ mile station area. The following station is an example of this typology:
• Planned Mid-Coast Trolley Executive Drive Station at Genesee Avenue &
Executive Drive—The context of this station located in the University Town Center area is mid and high density office and residential, as well as the UTC regional shopping center. Most of the developments are located on long blocks with limited pedestrian crossings.
1. Outside Centers—The urban context for this typology includes much of the San Diego
region. These are areas with lower density (well less than 20 dwelling units per acre) with limited or no employment. Most of these areas have not been categorized as a Smart Growth Opportunity Area, though select locations have been classified as the Rural Village place type. The street network is predominantly low density in these areas. The following station is an example of this typology:
• Planned Bus Rapid Transit Route 688 Stop at Lusk Boulevard & Barnes Canyon Road—The context of this station located in the University Town Center area is low to mid density office park development, with limited retail services and extensive surface parking. There are few signalized crossings, and very long arterial blocks.
Table 1 summarizes the distribution of the SANDAG region station and stops by land use center and regional versus local transit service. Of the 528 stations in the RTP transit projects network, 10% of them are the Metropolitan Center typology, 28% are Centers & Corridors Concentrated, 26% are Centers & Corridors Dispersed, and 36% are Outside Centers.
Attachment 3 :: Safe Routes to Transit Methodology 143
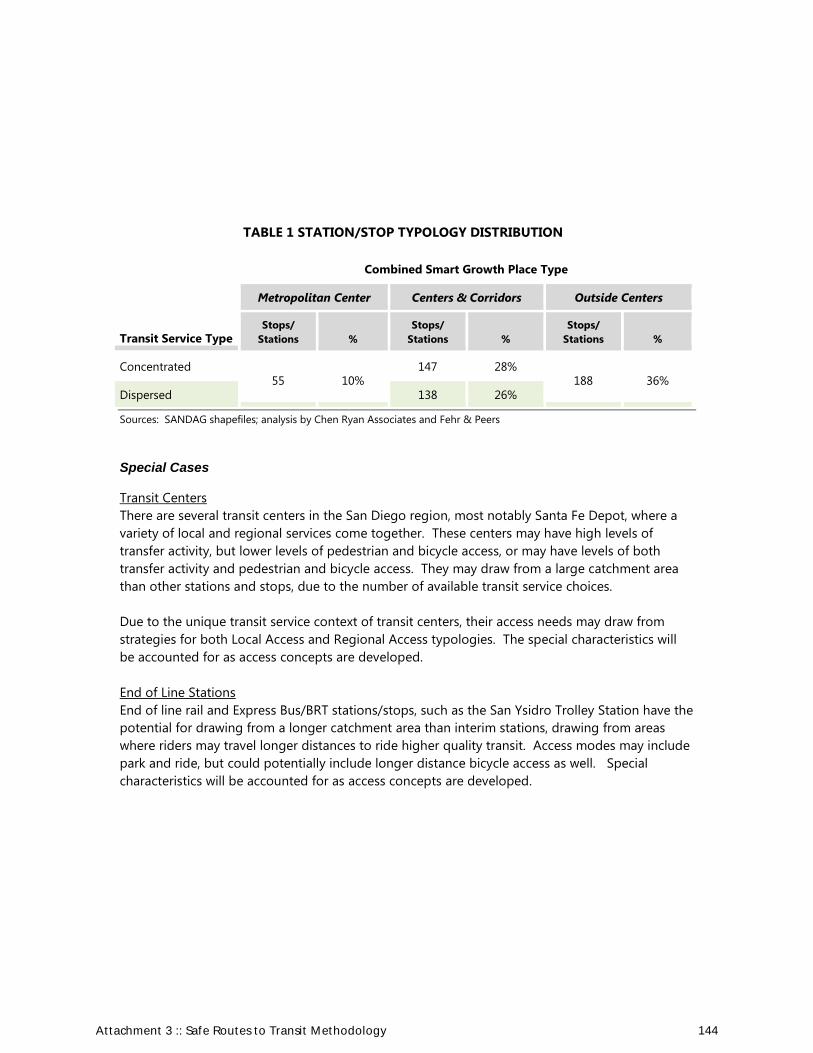
TABLE 1 STATION/STOP TYPOLOGY DISTRIBUTION
Transit Service Type
Combined Smart Growth Place Type
Metropolitan Center Centers & Corridors Outside Centers
Stops/ Stations %
Stops/ Stations %
Stops/ Stations %
Concentrated 55 10%
147 28% 188 36%
Dispersed 138 26%
Sources: SANDAG shapefiles; analysis by Chen Ryan Associates and Fehr & Peers
Special Cases
Transit Centers There are several transit centers in the San Diego region, most notably Santa Fe Depot, where a variety of local and regional services come together. These centers may have high levels of transfer activity, but lower levels of pedestrian and bicycle access, or may have levels of both transfer activity and pedestrian and bicycle access. They may draw from a large catchment area than other stations and stops, due to the number of available transit service choices. Due to the unique transit service context of transit centers, their access needs may draw from strategies for both Local Access and Regional Access typologies. The special characteristics will be accounted for as access concepts are developed. End of Line Stations End of line rail and Express Bus/BRT stations/stops, such as the San Ysidro Trolley Station have the potential for drawing from a longer catchment area than interim stations, drawing from areas where riders may travel longer distances to ride higher quality transit. Access modes may include park and ride, but could potentially include longer distance bicycle access as well. Special characteristics will be accounted for as access concepts are developed.
Attachment 3 :: Safe Routes to Transit Methodology 144

STATION AREA TYPOLOGYMETROPOLITAN CENTER // CONCENTRATED ACCESS
Image via Flickr.com
/THE Holy Hand Grenade!
Attachment 4 :: Safe Routes to Transit Typology Prototypes 145

2
Station Area Typologies
CITY COLLEGE TROLLEY STATION
DESCRIPTIONAs a regional center, downtown San Diego contains the administrative, legal, government, business, entertainment, and cultural center, with the largest centralized, high-density housing in the region. The Downtown Community Plan contains designated land uses that will allow people to live and work near transit in pedestrian-friendly neighborhoods and will support up to 165,000 jobs and a residential population of 90,000 people. Many destinations are located within downtown San Diego, including San Diego City College, adjacent to the City College Trolley Station. The predominant land use around the station, aside from City College, is mid- to high-density residential, as well as retail and office. Street network densities are high, with frequent intersections, short blocks, and a grid street network.
Transit service at the station is provided by the Orange and Blue Trolley lines, which connect the station as far as El Cajon and San Ysidro, as well as Santa Fe Depot in downtown San Diego. Peak period service frequency on the Orange Line is generally 15 minutes, and it is eight minutes on the Blue Line. City College Station is also an important bus transfer station, with local and express bus service that connects the station to close destinations like North Park, and farther destinations like Mira Mesa.
Because of the proximity of most destinations to the stations, the short, walkable nature of the City College Station vicinity, most station access is likely to be on foot, so most of the proposed access improvements focus on enhancing
PROJECT ID: #### // PARK BLVD AND BROADWAY*
pedestrian safety, amenity, and wayfinding. However, many of downtown’s key destinations, such as Petco Park or the Gaslamp Quarter, are a long walk, but convenient bike ride, so select bicycle access enhancements are also proposed.
Schools in thie station vicinity include San Diego High School and San Diego Early Middle College. The recommendations that follow could serve as SRTS improvements for these schools.
AROUND THE STATION The area immediately surrounding the City College Trolley Station contains a variety of pedestrian and bicycle amenities that connect the urban fabric of the neighborhood with San Diego Blue/Orange Line Trolley.
The majority of intersections within a quarter-mile distance of the station platform are signalized (85%), providing pedestrians with protected crossing opportunities. Some stop-controlled intersections exist, and no uncontrolled intersections are within the station area. Many intersections—both signalized and stop-controlled—do not provide marked pedestrian crosswalks.
OBSERVED PEDESTRIAN & BICYCLIST NEEDS & OPPORTUNITIES
SRTT Typology: Metropolitan Center - Concentrated Access
Jurisdiction: City of San Diego (Civic San Diego)
2050 RTP/SCS Transit Project: SDSU to Downtown Trolley via El Cajon Boulevard/Park Avenue, Downtown Tunnel
Smart Growth Opportunity Areas: Metropolitan Center, SD-CC-1; San Diego Downtown (Centre City)
SRTS: San Diego High School, San Diego Early Middle College
Crosswalks are unmarked or striped with white parallel crosswalks; opportunity to provide high visibility crosswalk markings.1
Visible signage for nearby bus stops would help trolley passengers find connections more easily. Pedestrian and biyccle wayfinding signage for area destinations could be enhanced.2
Attachment 4 :: Safe Routes to Transit Typology Prototypes 146

3
SANDAG Safe Routes to Transit Plan
Visual differentiation of locations where Trolley routes intersect pedestrian crossings would enhance pedestrian safety.
3 Covered, secure bicycle parking at the station would help encourage bike access to transit.4
Placement of street furnishings, street lights, and bus stops could be reconsidered to maximize sidewalk space for pedestrians, particularly those with disabilities.
6
Directional curb ramps would enhance safety for pedestrians by keeping them further from the path of vehicles in the intersection.
7
Wide intersection crossings at Park Boulevard & B Street could be reconsidered to include traffic calming and higher visibility for pedestrians.8
Pedestrian crossings could be reduced to single stage crossings, to optimize convenience for pedestrians.5
Attachment 4 :: Safe Routes to Transit Typology Prototypes 147

4
Station Area Typologies
Existing Trolley Riders Existing Bus Riders (1/4 mi) Population (1/4 mi) Employment (1/4 mi)
14,790 6,946 34,233 15,489
Sidewalks are generally accommodating of pedestrians, although occasionally “pinch points” exist where the usable pedestrian throughway becomes cluttered with street furniture, street trees, utility poles, and other items. A few notable areas lack street trees and the shaded canopy they provide walkers.
Some bicycle infrastructure exists in the form of a bike route along B Street, and other bikeways are planned as part of the City of San Diego’s July 2013 Final Draft Bicycle Master Plan, which includes future bike lanes on 8th Avenue, B Street, C Street, and Park Street North of B Street, as well as bike routes on parts of 14th St and Park Street.
Nearby desinations (the Gaslamp Quarter, Petco Park, Westfield Horton Plaza, and the San Diego Convention Center) are accessible to the south and west. Interstate 5, which abuts the north and eastern sides of the station area, inhibits through pedestrian and bicycle travel in these directions, although Balboa Park to the north is accessible via Park Boulevard, where a bike lane is planned and sidewalks exist.
Transit Service and Demographics
Places to Walk to
Existing Pedestrian Facilities
Places to Bike to
Regional Transit Connections
• San Diego City College
• San Diego High School
• San Diego Early Middle College
• 46 Total Intersections
• 39 Signalized Intersections (85%)
• 7 Stop-Controlled Intersections (15%)
• 0 Uncontrolled Intersections (0%)
• Petco Park
• Gaslamp Quarter
• Balboa Park
• Westfield Horton Plaza
• Orange & Blue Line Trolley
• Routes 2, 5, 7, 15, 20, 210, 510, 520, 929, and 992
Bicycle Facilities
• Existing Bicycle Lanes: None
• Planned Bicycle Lanes: 8th Ave, B St, C St, and Park St North of B St
• Existing Bike Paths: None
• Planned Bike Paths: None
• Existing Bicycle Parking: Two circular racks on the east side of Park Boulevard across from the station. Two triangular racks on Broadway along the southern end of the station
Attachment 4 :: Safe Routes to Transit Typology Prototypes 148
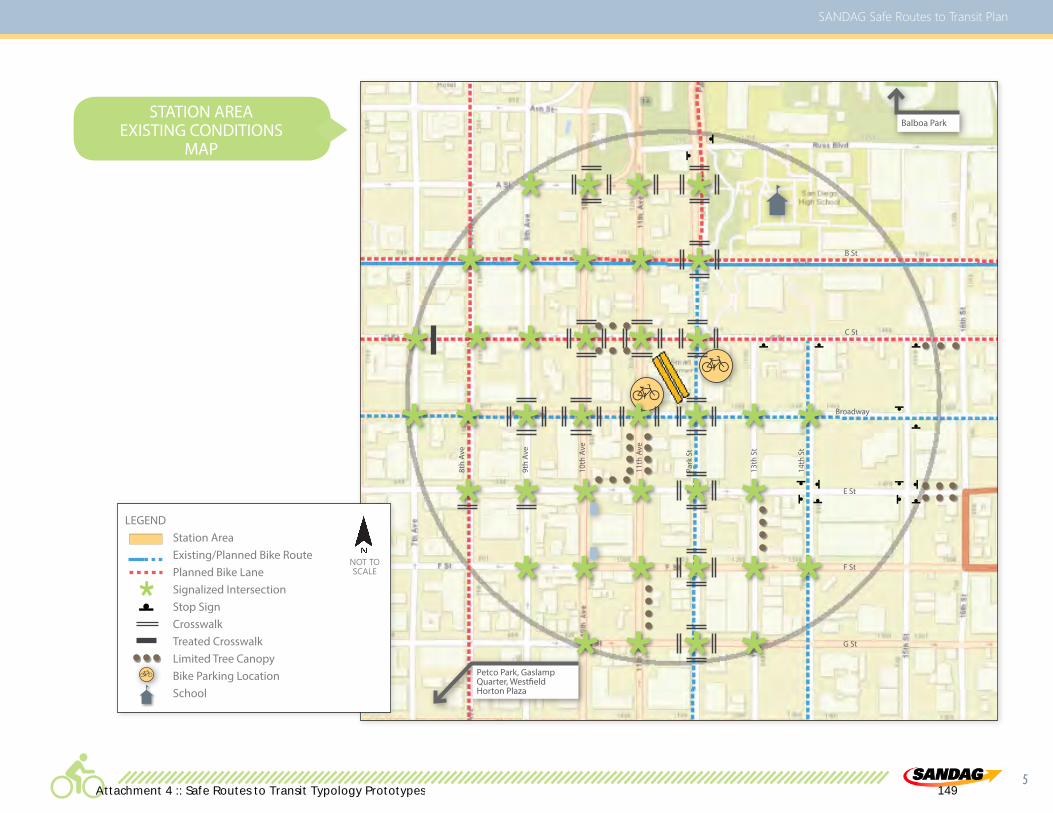
5
SANDAG Safe Routes to Transit Plan
LEGEND Station Area Existing/Planned Bike Route Planned Bike Lane Signalized Intersection Stop Sign Crosswalk Treated Crosswalk Limited Tree Canopy Bike Parking Location School
NOT TO SCALE
STATION AREAEXISTING CONDITIONS
MAP
Petco Park, Gaslamp Quarter, Westfield Horton Plaza
Balboa Park
B St
C St
Broadway
E St
F St
G St
14th
St
13th
St
Park
St
11th
Ave
10th
Ave
9th
Ave
8th
Ave
Attachment 4 :: Safe Routes to Transit Typology Prototypes 149

6
Station Area Typologies
RECOMMENDED IMPROVEMENTS• Add crosswalks for all intersections within the quarter-mile
station area
• Add curb extensions to the corners of eight intersections immediately adjacent to the station, within the designated focus area (see map)
• Introduce north/south and east/west bikeways for increased connection to destinations in these directions.
• Locate additional bike parking at the City College station
• Install wayfinding signage at the City College station, and continue appropriate signage along pathways to key destinations
• Consider cycle tracks on Park Boulevard, Broadway, B Street, C Street, or 8th Street
OTHER OPPORTUNITIES • Downtown San Diego Complete Streets Mobility Plan
• City of San Diego Bikeshare program
Measure Quantity Low Medium HighPedestrian Signal Modification (Protected Lefts) 4 Locations $168,000 $168,000 $168,000 Ped Scramble Phase 4 Locations $20,000 $20,000 $20,000 Countdown Pedestrian Signalhead 10 Intersections $64,000 $72,000 $88,000 High-Visibility Crosswalk 40 Intersections $96,000 $128,000 $160,000 Directional Curb Ramps (including truncated domes) 8 Intersections $256,000 $288,000 $320,000 Sidewalk Reconstruction 20,000 SF $180,000 $240,000 $300,000 Curb/Gutter Reconstruction 2,000 LF $70,000 $80,000 $90,000 Street Trees 8 Blocks $192,000 $320,000 $512,000 Pedestrian Street Lighting 8 Blocks $320,000 $480,000 $544,000 Pedestrian Wayfinding Signs 16 Signs $12,000 $14,400 $16,000 Subtotal Pedestrian $1,378,000 $1,810,400 $2,218,000
Bicycle Bike Parking 32 Spaces $8,000 $16,000 $32,000 Bike Destination Wayfinding Signs 16 Signs $12,000 $14,400 $16,000 One-Way Cycle Track (Striped Buffer) 1.5 Miles $1,243,440 $1,702,800 $2,316,600 One-Way Cycle Track (Raised Median) 0.5 Miles $447,163 $817,740 $1,111,440 Class II Bike Lanes (including signing & striping) 2 Miles $26,667 $37,594 $49,421 Class III Sharrows (including signing & striping) 2 Miles $11,827 $18,586 $24,077 Bike Signal (added to existing signalized intersection) 4 Bike Signals $200,000 $300,000 $400,000Subtotal Bicycle $1,950,098 $2,907,119 $3,949,538
Traffic Calming Curb Extensions (w/ directional curb ramps) 8 Intersections $240,000 $300,000 $360,000 Neighborhood Traffic Circles 2 Traffic Circles $14,200 $26,000 $36,470 Diverters (Use similar assumption to Median Refuge) 1 Diverter $3,600 $5,000 $6,000Subtotal Traffic Calming $257,800 $331,000 $402,470
Construction Cost Subtotal $3,585,898 $5,048,519 $6,570,008Contingencies Construction Contingency $717,180 $1,009,704 $1,314,002 Planning/Design/Environmental $537,885 $757,278 $985,501 Construction Engineering $358,590 $504,852 $657,001Total Including Contingencies (Rounded to Nearest $1,000) $5,200,000 $7,320,000 $9,527,000
Improvement Cost Breakdown
Total Cost
Attachment 4 :: Safe Routes to Transit Typology Prototypes 150

7
SANDAG Safe Routes to Transit Plan
RECOMMENDATION MAP*
Broadway
E St
14th
St
13th
St
C St
B St
F St
G St
Park
Blv
d
15th
St
11th
St
10th
St
9th
St8th
St
7th
St
LEGEND Station Area Existing/Planned Bike Route Planned Bike Lane Key Station Bicycle Connection Candidate Location for High-Visibility Crosswalk Candidate Location for Curb Extensions, Pedestrian Scramble Phases, or Other Enhanced Pedestrian Measures Additional Bicycle Parking
NOT TO SCALE
*Wide-ranging recommendations or those that are not location-specific are not shown
Attachment 4 :: Safe Routes to Transit Typology Prototypes 151

[This page intentionally left blank]
Image via Flickr.com
/THE Holy Hand Grenade!
Attachment 4 :: Safe Routes to Transit Typology Prototypes 152

STATION AREA TYPOLOGYCENTERS & CORRIDORS // CONCENTRATED ACCESS
Image via Flickr.com
/THE Holy Hand Grenade!
Attachment 4 :: Safe Routes to Transit Typology Prototypes 153
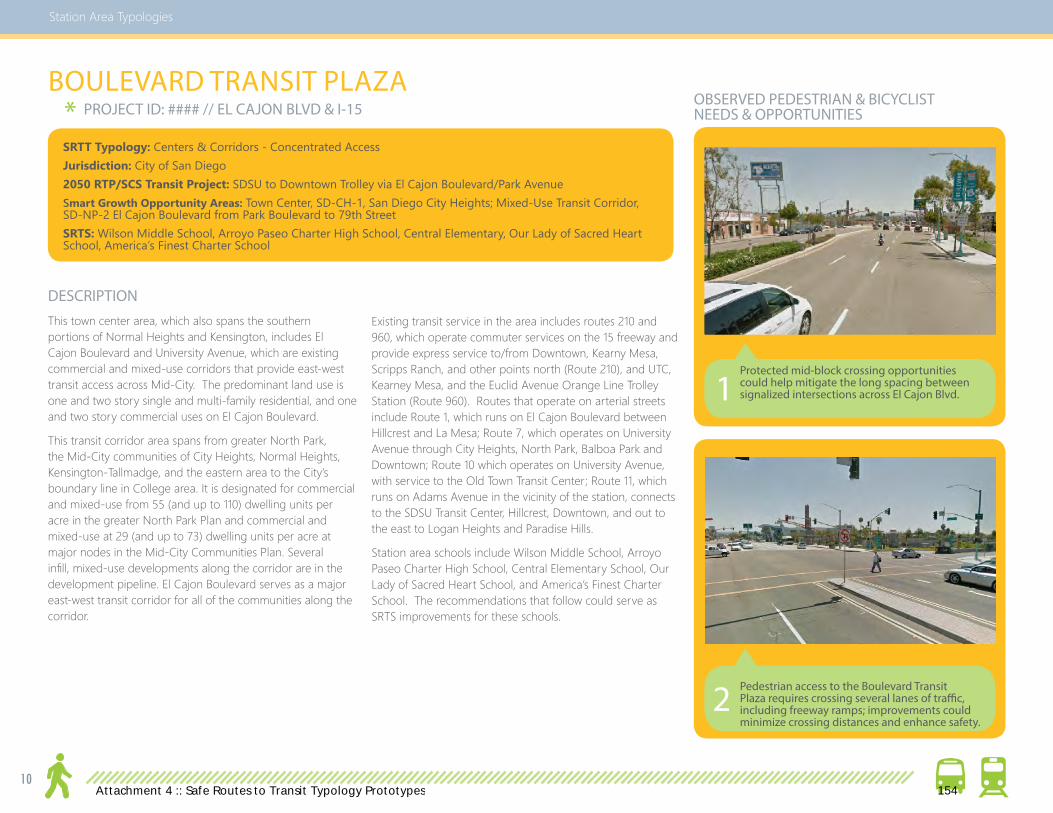
10
Station Area Typologies
BOULEVARD TRANSIT PLAZA
DESCRIPTIONThis town center area, which also spans the southern portions of Normal Heights and Kensington, includes El Cajon Boulevard and University Avenue, which are existing commercial and mixed-use corridors that provide east-west transit access across Mid-City. The predominant land use is one and two story single and multi-family residential, and one and two story commercial uses on El Cajon Boulevard.
This transit corridor area spans from greater North Park, the Mid-City communities of City Heights, Normal Heights, Kensington-Tallmadge, and the eastern area to the City’s boundary line in College area. It is designated for commercial and mixed-use from 55 (and up to 110) dwelling units per acre in the greater North Park Plan and commercial and mixed-use at 29 (and up to 73) dwelling units per acre at major nodes in the Mid-City Communities Plan. Several infill, mixed-use developments along the corridor are in the development pipeline. El Cajon Boulevard serves as a major east-west transit corridor for all of the communities along the corridor.
PROJECT ID: #### // EL CAJON BLVD & I-15*
Existing transit service in the area includes routes 210 and 960, which operate commuter services on the 15 freeway and provide express service to/from Downtown, Kearny Mesa, Scripps Ranch, and other points north (Route 210), and UTC, Kearney Mesa, and the Euclid Avenue Orange Line Trolley Station (Route 960). Routes that operate on arterial streets include Route 1, which runs on El Cajon Boulevard between Hillcrest and La Mesa; Route 7, which operates on University Avenue through City Heights, North Park, Balboa Park and Downtown; Route 10 which operates on University Avenue, with service to the Old Town Transit Center; Route 11, which runs on Adams Avenue in the vicinity of the station, connects to the SDSU Transit Center, Hillcrest, Downtown, and out to the east to Logan Heights and Paradise Hills.
Station area schools include Wilson Middle School, Arroyo Paseo Charter High School, Central Elementary School, Our Lady of Sacred Heart School, and America’s Finest Charter School. The recommendations that follow could serve as SRTS improvements for these schools.
OBSERVED PEDESTRIAN & BICYCLIST NEEDS & OPPORTUNITIES
SRTT Typology: Centers & Corridors - Concentrated AccessJurisdiction: City of San Diego2050 RTP/SCS Transit Project: SDSU to Downtown Trolley via El Cajon Boulevard/Park AvenueSmart Growth Opportunity Areas: Town Center, SD-CH-1, San Diego City Heights; Mixed-Use Transit Corridor, SD-NP-2 El Cajon Boulevard from Park Boulevard to 79th StreetSRTS: Wilson Middle School, Arroyo Paseo Charter High School, Central Elementary, Our Lady of Sacred Heart School, America’s Finest Charter School
Protected mid-block crossing opportunities could help mitigate the long spacing between signalized intersections across El Cajon Blvd.1
Pedestrian access to the Boulevard Transit Plaza requires crossing several lanes of traffic, including freeway ramps; improvements could minimize crossing distances and enhance safety.
2
Attachment 4 :: Safe Routes to Transit Typology Prototypes 154

11
SANDAG Safe Routes to Transit Plan
Medians on El Cajon Blvd. provide opportunities to add mid-block pedestrian refuge if new crossings are added.3
Sidewalks could be widened to eliminate pinch points at several locations, including at bus stops. Bus stops could be enhanced with amenities at most locations.
4
Crosswalks could be provided at stop-controlled intersections, which make up the majority the intersections in the station area.6
Orange Ave is a designated bike route, and could benefit from facilities (such as sharrows, enhanced signage, etc.) to indicate that it is an active bike route.
7A limited number of inverted U-racks are provided for bike parking at the Transit Plaza. Visibility of the bike parking from the street is limited.
8
Uncontrolled pedestrian crossings near schools could be upgraded with more visible striping, better signage, and other pedestrian enhancements like RRFBs. Opportunity to leverage access improvements that will serve both the station and area schools.
5
Attachment 4 :: Safe Routes to Transit Typology Prototypes 155
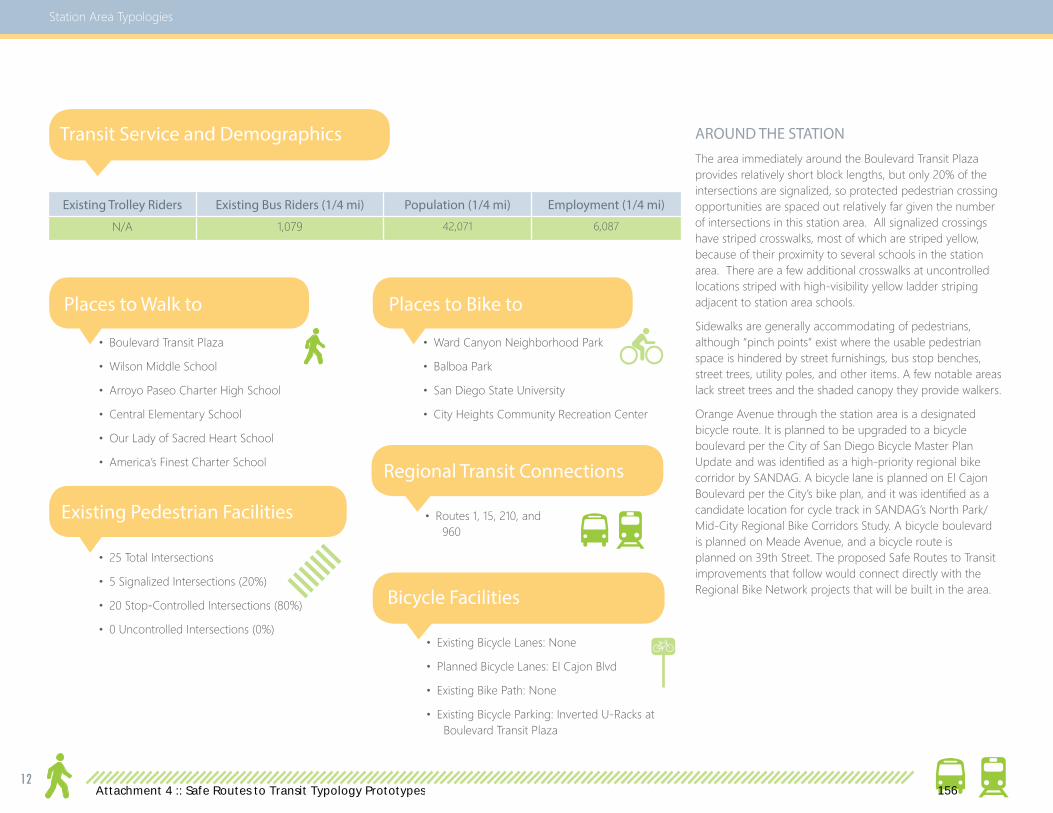
12
Station Area Typologies
Existing Trolley Riders Existing Bus Riders (1/4 mi) Population (1/4 mi) Employment (1/4 mi)
N/A 1,079 42,071 6,087
AROUND THE STATION The area immediately around the Boulevard Transit Plaza provides relatively short block lengths, but only 20% of the intersections are signalized, so protected pedestrian crossing opportunities are spaced out relatively far given the number of intersections in this station area. All signalized crossings have striped crosswalks, most of which are striped yellow, because of their proximity to several schools in the station area. There are a few additional crosswalks at uncontrolled locations striped with high-visibility yellow ladder striping adjacent to station area schools.
Sidewalks are generally accommodating of pedestrians, although “pinch points” exist where the usable pedestrian space is hindered by street furnishings, bus stop benches, street trees, utility poles, and other items. A few notable areas lack street trees and the shaded canopy they provide walkers.
Orange Avenue through the station area is a designated bicycle route. It is planned to be upgraded to a bicycle boulevard per the City of San Diego Bicycle Master Plan Update and was identified as a high-priority regional bike corridor by SANDAG. A bicycle lane is planned on El Cajon Boulevard per the City’s bike plan, and it was identified as a candidate location for cycle track in SANDAG’s North Park/Mid-City Regional Bike Corridors Study. A bicycle boulevard is planned on Meade Avenue, and a bicycle route is planned on 39th Street. The proposed Safe Routes to Transit improvements that follow would connect directly with the Regional Bike Network projects that will be built in the area.
Transit Service and Demographics
Places to Walk to
Existing Pedestrian Facilities
• Boulevard Transit Plaza
• Wilson Middle School
• Arroyo Paseo Charter High School
• Central Elementary School
• Our Lady of Sacred Heart School
• America’s Finest Charter School
• 25 Total Intersections
• 5 Signalized Intersections (20%)
• 20 Stop-Controlled Intersections (80%)
• 0 Uncontrolled Intersections (0%)
Places to Bike to
• Ward Canyon Neighborhood Park
• Balboa Park
• San Diego State University
• City Heights Community Recreation Center
Regional Transit Connections
Bicycle Facilities
• Existing Bicycle Lanes: None
• Planned Bicycle Lanes: El Cajon Blvd
• Existing Bike Path: None
• Existing Bicycle Parking: Inverted U-Racks at Boulevard Transit Plaza
• Routes 1, 15, 210, and 960
Attachment 4 :: Safe Routes to Transit Typology Prototypes 156

13
SANDAG Safe Routes to Transit Plan
Ward Canyon Neighborhood ParkSTATION AREA
EXISTING CONDITIONSMAP
Monroe Ave
39th
St
40th
St
41st
St
Mar
lbor
ough
Ave
42nd
St
Cope
land
Ave
38th
St
37th
St
Meade Ave
El Cajon Blvd
Orange Ave
Polk AveCity Heights Community Recreation CenterBalboa Park
SDSU
LEGEND Station Area Existing/Planned Bike Route Planned Bike Lane Planned Bike Boulevard Signalized Intersection Stop Sign Crosswalk Yellow Crosswalk (Parallel) Yellow Crosswalk (Ladder) Raised Median Bike Parking School
NOT TO SCALE
*Limited tree canopy throughout site
Attachment 4 :: Safe Routes to Transit Typology Prototypes 157
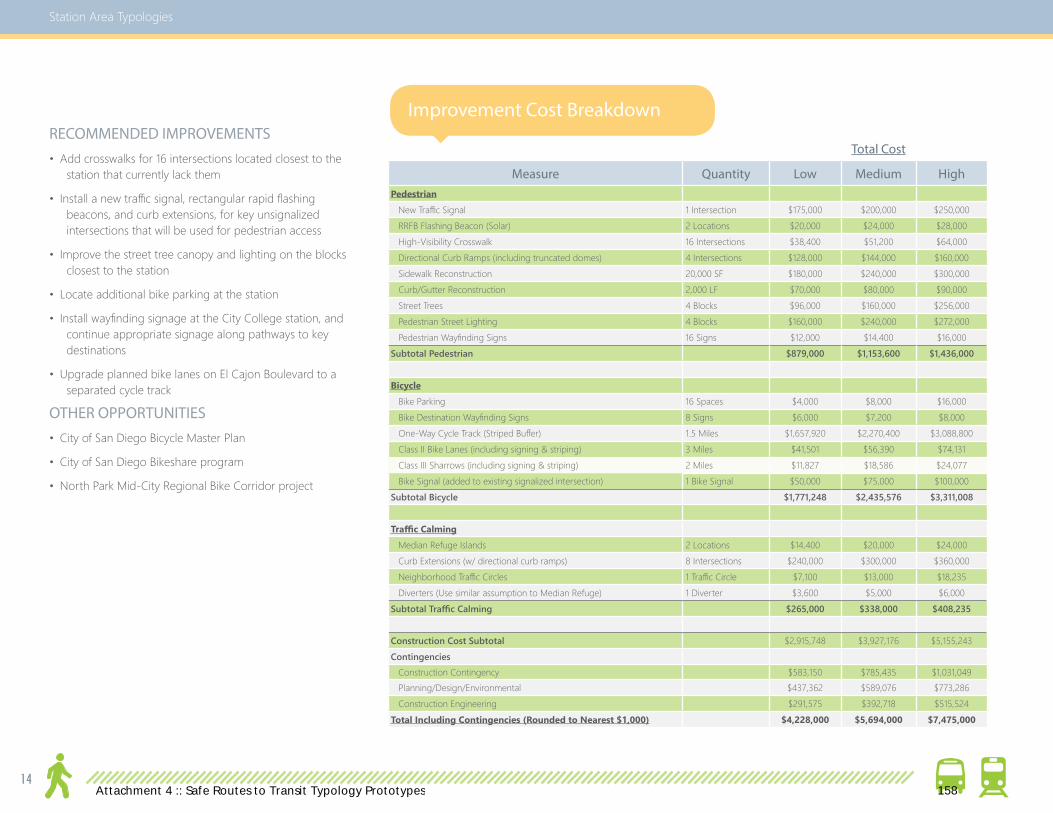
14
Station Area Typologies
RECOMMENDED IMPROVEMENTS• Add crosswalks for 16 intersections located closest to the
station that currently lack them
• Install a new traffic signal, rectangular rapid flashing beacons, and curb extensions, for key unsignalized intersections that will be used for pedestrian access
• Improve the street tree canopy and lighting on the blocks closest to the station
• Locate additional bike parking at the station
• Install wayfinding signage at the City College station, and continue appropriate signage along pathways to key destinations
• Upgrade planned bike lanes on El Cajon Boulevard to a separated cycle track
OTHER OPPORTUNITIES • City of San Diego Bicycle Master Plan
• City of San Diego Bikeshare program
• North Park Mid-City Regional Bike Corridor project
Improvement Cost Breakdown
Total Cost
Measure Quantity Low Medium HighPedestrian New Traffic Signal 1 Intersection $175,000 $200,000 $250,000 RRFB Flashing Beacon (Solar) 2 Locations $20,000 $24,000 $28,000 High-Visibility Crosswalk 16 Intersections $38,400 $51,200 $64,000 Directional Curb Ramps (including truncated domes) 4 Intersections $128,000 $144,000 $160,000 Sidewalk Reconstruction 20,000 SF $180,000 $240,000 $300,000 Curb/Gutter Reconstruction 2,000 LF $70,000 $80,000 $90,000 Street Trees 4 Blocks $96,000 $160,000 $256,000 Pedestrian Street Lighting 4 Blocks $160,000 $240,000 $272,000 Pedestrian Wayfinding Signs 16 Signs $12,000 $14,400 $16,000 Subtotal Pedestrian $879,000 $1,153,600 $1,436,000
Bicycle Bike Parking 16 Spaces $4,000 $8,000 $16,000 Bike Destination Wayfinding Signs 8 Signs $6,000 $7,200 $8,000 One-Way Cycle Track (Striped Buffer) 1.5 Miles $1,657,920 $2,270,400 $3,088,800 Class II Bike Lanes (including signing & striping) 3 Miles $41,501 $56,390 $74,131 Class III Sharrows (including signing & striping) 2 Miles $11,827 $18,586 $24,077 Bike Signal (added to existing signalized intersection) 1 Bike Signal $50,000 $75,000 $100,000Subtotal Bicycle $1,771,248 $2,435,576 $3,311,008
Traffic Calming Median Refuge Islands 2 Locations $14,400 $20,000 $24,000 Curb Extensions (w/ directional curb ramps) 8 Intersections $240,000 $300,000 $360,000 Neighborhood Traffic Circles 1 Traffic Circle $7,100 $13,000 $18,235 Diverters (Use similar assumption to Median Refuge) 1 Diverter $3,600 $5,000 $6,000Subtotal Traffic Calming $265,000 $338,000 $408,235
Construction Cost Subtotal $2,915,748 $3,927,176 $5,155,243Contingencies Construction Contingency $583,150 $785,435 $1,031,049 Planning/Design/Environmental $437,362 $589,076 $773,286 Construction Engineering $291,575 $392,718 $515,524Total Including Contingencies (Rounded to Nearest $1,000) $4,228,000 $5,694,000 $7,475,000
Attachment 4 :: Safe Routes to Transit Typology Prototypes 158

15
SANDAG Safe Routes to Transit Plan
Monroe Ave
39th
St
40th
St
41st
St
Mar
lbor
ough
Ave
42nd
St
Cope
land
Ave
38th
St
37th
St
Meade Ave
El Cajon Blvd
Orange Ave
Polk Ave
RECOMMENDATION MAP*
LEGEND Station Area Existing/Planned Bike Route Planned Bike Lane Planned Bike Boulevard Upgrade Bike Lanes to Cycle Track Candidate Location for High-Visibility Crosswalk Candidate Location for Protected Crossing (Signals or Beacons, Curb Extensions or Median Refuge) Add Bicycle Parking Candidate Block for Improved Lighting & Trees
NOT TO SCALE
*Wide-ranging recommendations or those that are not location-specific are not shown
Attachment 4 :: Safe Routes to Transit Typology Prototypes 159

[This page intentionally left blank]
Image via Flickr.com
/THE Holy Hand Grenade!
Attachment 4 :: Safe Routes to Transit Typology Prototypes 160
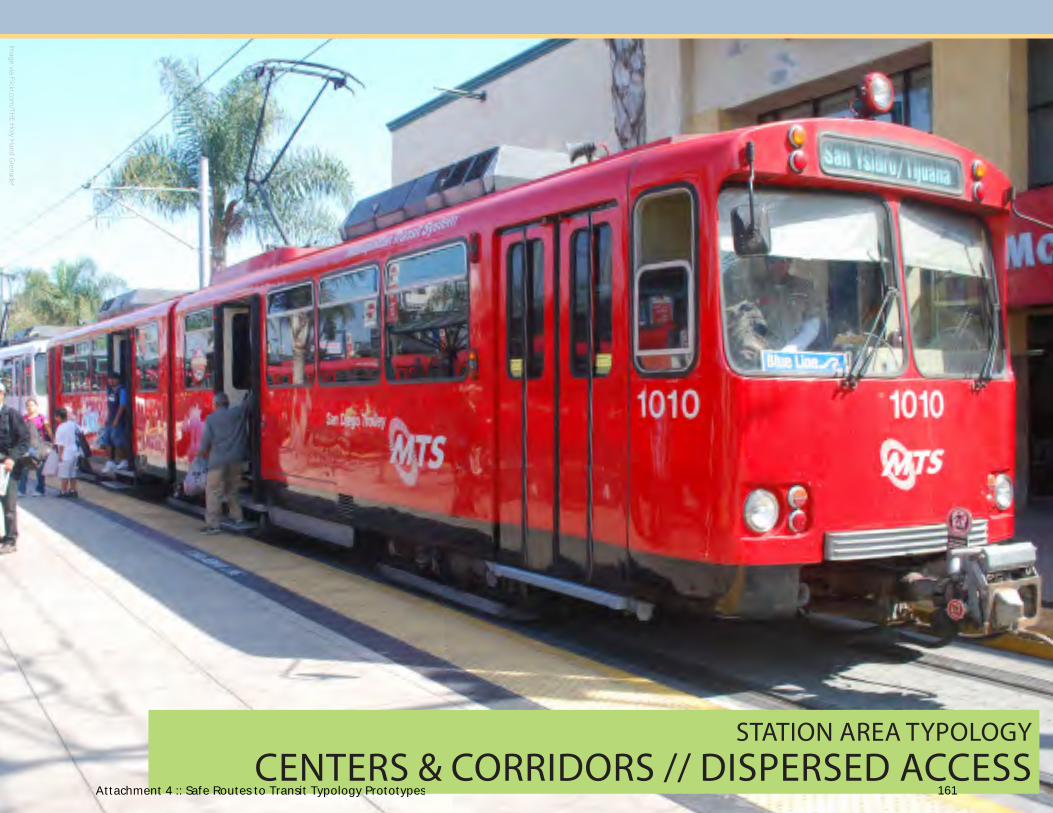
STATION AREA TYPOLOGYCENTERS & CORRIDORS // DISPERSED ACCESS
Image via Flickr.com
/THE Holy Hand Grenade!
Attachment 4 :: Safe Routes to Transit Typology Prototypes 161

18
Station Area Typologies
GENESSEE / EXECUTIVE STATION
DESCRIPTIONAdjacent to the University of California at San Diego and its related facilities and associated institutions, San Diego University City is home to the highest density and intensity of office, commercial, and residential uses and medium-high and mid- to high-rise office towers. As of 2012, numerous development projects have been approved for the area, including 750,000 square feet of neighborhood and community-serving commercial and 800 residential units in high- and mid-rise towers. Street network densities are lower than in some other urban areas, with long blocks, somewhat infrequent intersections, and a meandering street network. Nearby destinations include University of California-affiliated centers and institutions, the university itself, and the popular Westfield University Towne Center shopping mall.
Current transit operations in the area include bus routes 31, 960, and 979, as well as a number of local shuttles operated by UCSD and nearby private businesses. Some of these shuttles connect to the Sorrento Valley Coaster Station to the north of the station area. Commuter rail trains leaving this station reach as far north as Oceanside, where a connection to Metrolink trains is available, and as far south as Santa Fe Depot in Downtown San Diego.
The Mid-Coast LRT Extension, an extension of SDMTS’s San Diego Trolley, is planned to serve the area in the future, with service slated to start in 2018. The SANDAG Board approved the Locally Preferred Alternative (LPA) for the route in July 2010, which calls for a median-running section on Genesee
PROJECT ID: #### // EXECUTIVE DR & GENESEE AVE*
Avenue terminating at the Westfield University Towne Center transit center.
Schools in the station vicinity include La Jolla Country Day School and Nierman Preschool. The recommendations that follow could serve as SRTS improvements for these schools.
AROUND THE STATION Currently, the area immediately around the intersection of Genessee Avenue and Executive Drive displays some pedestrian and bicycle amenities. Genessee Drive contains both northbound and southbound bike lanes that connect to other nearby bicycle facilities, including existing lanes on Eastgate Mall and Regents Road. Other connecting bikeways are planned, including a bike path originating on the north side of Eastgate Mall.
The majority of intersections within a quarter-mile distance of the station are signalized (73%), providing pedestrians with protected crossing opportunities at the limited number of intersections in the station area.
OBSERVED PEDESTRIAN & BICYCLIST NEEDS & OPPORTUNITIES
SRTT Typology: Centers & Corridors - Dispersed Access
Jurisdiction: City of San Diego
2050 RTP/SCS Transit Project: Mid-Coast LRT Extension
Smart Growth Opportunity Areas: Urban Center, SD-UN-2, San Diego University City
SRTS: La Jolla Country Day School, Nierman Preschool
Improvements could include shortening long crossing distances for pedestrians crossing Genessee Avenue and La Jolla Village Drive.1
Protected mid-block crossings could mitigate long blocks to present more street crossing opportunities.2
Attachment 4 :: Safe Routes to Transit Typology Prototypes 162

19
SANDAG Safe Routes to Transit Plan
Crosswalk striping paint is thinly worn and difficult to see in places, and could be refreshed to provide better visibility for pedestrians crossing.
3Elevated pedestrian bridges provide pedestrian crossing opportunities, but convenience could be improved by at-grade crosswalks at intersections and mid-block locations.
4
Pedestrian access is limited to driveways, presenting a conflict area.6
Transit stops need amenities such as shade and bicycle parking, and the bus bench could be placed so as not to intrude into pedestrian travel space.
7 A buffer between pedestrians and moving traffic could help mitigate the lack of on-street parking and attached sidewalks. 8
Protection could be provided for bike lanes on Genessee Ave, Eastgate Mall, and Regents Road, since high traffic volumes create conflicts.
5
Attachment 4 :: Safe Routes to Transit Typology Prototypes 163
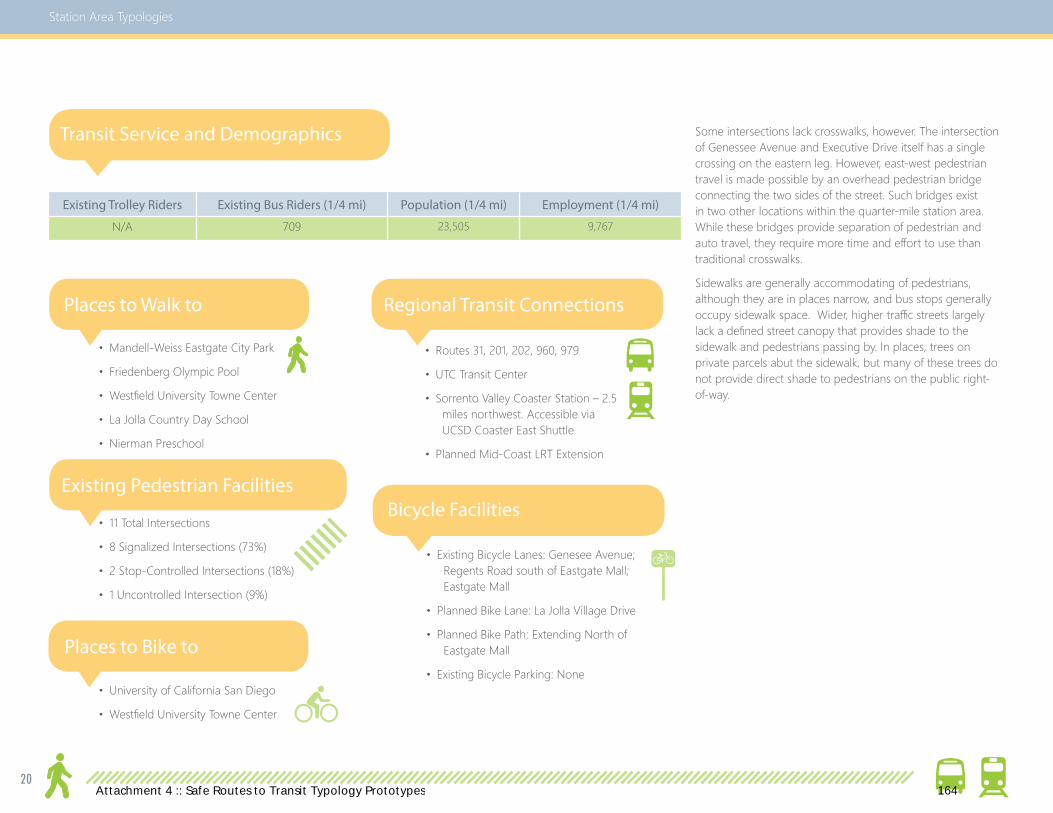
20
Station Area Typologies
Existing Trolley Riders Existing Bus Riders (1/4 mi) Population (1/4 mi) Employment (1/4 mi)
N/A 709 23,505 9,767
Some intersections lack crosswalks, however. The intersection of Genessee Avenue and Executive Drive itself has a single crossing on the eastern leg. However, east-west pedestrian travel is made possible by an overhead pedestrian bridge connecting the two sides of the street. Such bridges exist in two other locations within the quarter-mile station area. While these bridges provide separation of pedestrian and auto travel, they require more time and effort to use than traditional crosswalks.
Sidewalks are generally accommodating of pedestrians, although they are in places narrow, and bus stops generally occupy sidewalk space. Wider, higher traffic streets largely lack a defined street canopy that provides shade to the sidewalk and pedestrians passing by. In places, trees on private parcels abut the sidewalk, but many of these trees do not provide direct shade to pedestrians on the public right-of-way.
Transit Service and Demographics
Places to Walk to
Existing Pedestrian Facilities
Places to Bike to
Regional Transit Connections
• Mandell-Weiss Eastgate City Park
• Friedenberg Olympic Pool
• Westfield University Towne Center
• La Jolla Country Day School
• Nierman Preschool
• 11 Total Intersections
• 8 Signalized Intersections (73%)
• 2 Stop-Controlled Intersections (18%)
• 1 Uncontrolled Intersection (9%)
• University of California San Diego
• Westfield University Towne Center
• Routes 31, 201, 202, 960, 979
• UTC Transit Center
• Sorrento Valley Coaster Station – 2.5 miles northwest. Accessible via UCSD Coaster East Shuttle
• Planned Mid-Coast LRT Extension
Bicycle Facilities
• Existing Bicycle Lanes: Genesee Avenue; Regents Road south of Eastgate Mall; Eastgate Mall
• Planned Bike Lane: La Jolla Village Drive
• Planned Bike Path: Extending North of Eastgate Mall
• Existing Bicycle Parking: None
Attachment 4 :: Safe Routes to Transit Typology Prototypes 164
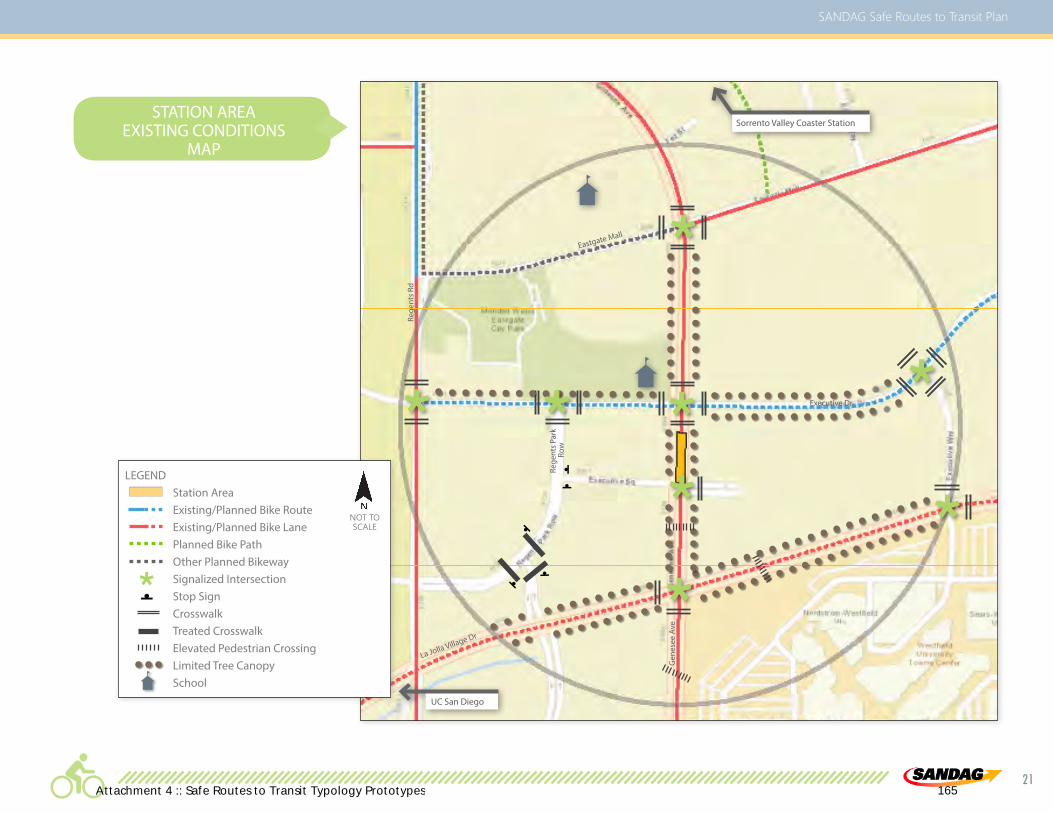
21
SANDAG Safe Routes to Transit Plan
LEGEND Station Area Existing/Planned Bike Route Existing/Planned Bike Lane Planned Bike Path Other Planned Bikeway Signalized Intersection Stop Sign Crosswalk Treated Crosswalk Elevated Pedestrian Crossing Limited Tree Canopy School
NOT TO SCALE
UC San Diego
Sorrento Valley Coaster StationSTATION AREA
EXISTING CONDITIONSMAP
Executive Dr
Gen
esee
Ave
Eastgate Mall
Rege
nts
Park
Row
Rege
nts
Rd
La Jolla Village Dr
Attachment 4 :: Safe Routes to Transit Typology Prototypes 165
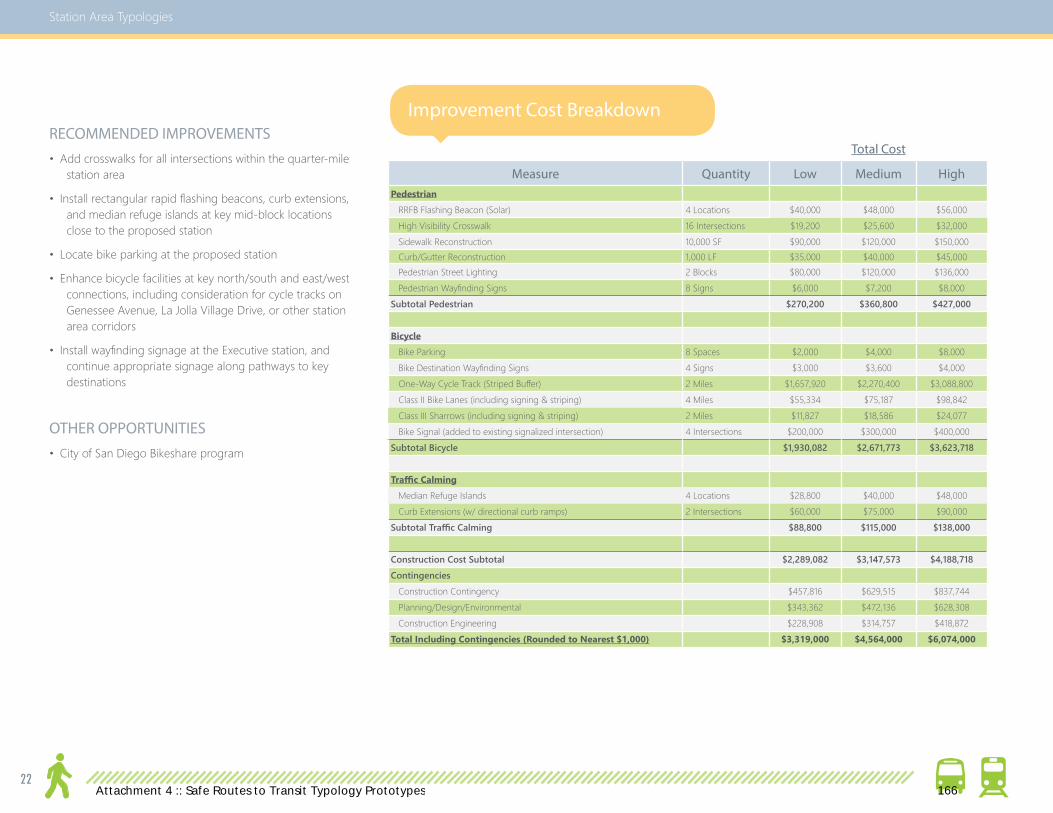
22
Station Area Typologies
RECOMMENDED IMPROVEMENTS• Add crosswalks for all intersections within the quarter-mile
station area
• Install rectangular rapid flashing beacons, curb extensions, and median refuge islands at key mid-block locations close to the proposed station
• Locate bike parking at the proposed station
• Enhance bicycle facilities at key north/south and east/west connections, including consideration for cycle tracks on Genessee Avenue, La Jolla Village Drive, or other station area corridors
• Install wayfinding signage at the Executive station, and continue appropriate signage along pathways to key destinations
OTHER OPPORTUNITIES • City of San Diego Bikeshare program
Measure Quantity Low Medium HighPedestrian RRFB Flashing Beacon (Solar) 4 Locations $40,000 $48,000 $56,000 High Visibility Crosswalk 16 Intersections $19,200 $25,600 $32,000 Sidewalk Reconstruction 10,000 SF $90,000 $120,000 $150,000 Curb/Gutter Reconstruction 1,000 LF $35,000 $40,000 $45,000 Pedestrian Street Lighting 2 Blocks $80,000 $120,000 $136,000 Pedestrian Wayfinding Signs 8 Signs $6,000 $7,200 $8,000 Subtotal Pedestrian $270,200 $360,800 $427,000
Bicycle Bike Parking 8 Spaces $2,000 $4,000 $8,000 Bike Destination Wayfinding Signs 4 Signs $3,000 $3,600 $4,000 One-Way Cycle Track (Striped Buffer) 2 Miles $1,657,920 $2,270,400 $3,088,800 Class II Bike Lanes (including signing & striping) 4 Miles $55,334 $75,187 $98,842 Class III Sharrows (including signing & striping) 2 Miles $11,827 $18,586 $24,077 Bike Signal (added to existing signalized intersection) 4 Intersections $200,000 $300,000 $400,000Subtotal Bicycle $1,930,082 $2,671,773 $3,623,718
Traffic Calming Median Refuge Islands 4 Locations $28,800 $40,000 $48,000 Curb Extensions (w/ directional curb ramps) 2 Intersections $60,000 $75,000 $90,000Subtotal Traffic Calming $88,800 $115,000 $138,000
Construction Cost Subtotal $2,289,082 $3,147,573 $4,188,718Contingencies Construction Contingency $457,816 $629,515 $837,744 Planning/Design/Environmental $343,362 $472,136 $628,308 Construction Engineering $228,908 $314,757 $418,872Total Including Contingencies (Rounded to Nearest $1,000) $3,319,000 $4,564,000 $6,074,000
Improvement Cost Breakdown
Total Cost
Attachment 4 :: Safe Routes to Transit Typology Prototypes 166

23
SANDAG Safe Routes to Transit Plan
RECOMMENDATION MAP*
LEGEND Station Area Existing/Planned Bike Route Existing/Planned Bike Lane Planned Bike Path Other Planned Bikeway Key Station Bicycle Connection Candidate Location for High-Visibility Crosswalk Candidate Location for Protected Crossing (Signals or Beacons, Curb Extensions or Median Refuge) Add Bicycle Parking
NOT TO SCALE
*Wide-ranging recommendations or those that are not location-specific are not shown
Executive Dr
Gen
esee
Ave
Eastgate Mall
Rege
nts
Rd
La Jolla Village Dr
Attachment 4 :: Safe Routes to Transit Typology Prototypes 167

[This page intentionally left blank]
Image via Flickr.com
/THE Holy Hand Grenade!
Attachment 4 :: Safe Routes to Transit Typology Prototypes 168

STATION AREA TYPOLOGYOUTSIDE CENTERS // DISPERSED ACCESS
Image via Flickr.com
/THE Holy Hand Grenade!
Attachment 4 :: Safe Routes to Transit Typology Prototypes 169

26
Station Area Typologies
LUSK BOULEVARD AT BARNES CANYON ROAD
DESCRIPTIONThe Sorrento Mesa Area is a primary suburban employment center characterized by low to moderate density office parks surrounded by surface parking, limited strip commercial retail and restaurant, and a low density street network with long intersection spacing, few signalized pedestrian crossings, and relatively wide arterial streets. Existing transit service is primarily commuter-serving, with infrequent service, and limited service hours that are focused on peak weekday commute periods. Route 880 provides connections to the UTC Transit Center, Mira Mesa, and the 4S Ranch. Route 921 connects to University City, Miramar, and Mira Mesa. Route 972 is a Sorrento Mesa circulator, which provides connections from the Sorrento Valley Coaster Station through the employment areas.
The Qualcomm campus represents the major employment destination in this area. Qualcomm provides a shuttle, but many employees walk between Qualcomm buildings.
PROJECT ID: #### // LUSK BLVD & BARNES CANYON RD*
AROUND THE STOP Pedestrian and bicycle facilities surrounding Lusk Boulevard at Barnes Canyon Road are limited. The only existing bicycle facilities are bike lanes on Mira Mesa Boulevard a short distance away (outside the quarter-mile station area). Other connecting bikeways are planned for the area, including a bike route on Pacific Heights Boulevard between Barnes Canyon Road and Mira Mesa Boulevard and on Barnes Canyon Road between Pacific Heights Boulevard and Lusk Boulevard. Another, as-yet-undetermined Class II or Class III bikeway is planned for this stretch of Lusk Boulevard.
All intersections within a quarter-mile distance of the stop are signalized, providing pedestrians with designated crossing opportunities at the limited city intersections in the station area. Some intersections lack crosswalks: the convergences of Pacific Center Boulevard and Lusk Boulevard, Barnes Canyon Road and Pacific Heights Boulevard, and Pacific Mesa Boulevard and Pacific Heights Boulevard are all missing one leg.
Sidewalks are generally accommodating of pedestrians, although they are in places narrow, and bus stops generally lack pedestrian amenities such as shade and benches. In places, trees on private parcels abut the sidewalk, but many of these trees do not provide direct shade to pedestrians on the public right-of-way. This is particularly evident on Lusk Boulevard just north and south of Barnes Canyon Road.
OBSERVED PEDESTRIAN & BICYCLIST NEEDS & OPPORTUNITIES
SRTT Typology: Outside Centers - Dispersed Access
Jurisdiction: City of San Diego
2050 RTP/SCS Transit Project: Otay Mesa to Sorrento Mesa via I-805 BRT
Smart Growth Opportunity Areas: N/A
SRTS: None
The number of signalized intersections are limited, and spaced far apart, so there are few controlled locations for pedestrians to cross. There are regular unprotected mid-block crossings as a result.
1
Intersection improvements could shorten crossing distances for pedestrians.2
Attachment 4 :: Safe Routes to Transit Typology Prototypes 170

27
SANDAG Safe Routes to Transit Plan
Crosswalk striping exists at most intersections, although paint is thinly worn and difficult to see in places.3 Sidewalks are generally provided on all public
roadways, but sidewalks are narrow.4
Transit stops could include amenities such as shade, benches, bicycle parking, etc. 6 Lack of on-street parking and attached
sidewalks means there is no buffer between pedestrians and moving traffic. 7 Limited bicycle infrastructure8
Pedestrian access to office parks are primarily at vehicle driveways, presenting a conflict area.5
Attachment 4 :: Safe Routes to Transit Typology Prototypes 171

28
Station Area Typologies
Existing Trolley Riders Existing Bus Riders (1/4 mi) Population (1/4 mi) Employment (1/4 mi)
N/A 545 21 8,246
Transit Service and Demographics
Places to Walk to
Existing Pedestrian Facilities
Places to Bike to
Regional Transit Connections
• Qualcomm Offices
• Commercial strip retail
• 5 Total Intersections
• 5 Signalized Intersections (100%)
• 0 Stop-Controlled Intersections (0%)
• 0 Uncontrolled Intersections (0%)
• Qualcomm Offices
• Commercial strip retail
• Sorrento Valley Coaster Station
• Routes 880, 921, 972
• Sorrento Valley Coaster Station – 2.5 miles west. Accessible via Route 972
• UTC Transit Center—3.5 miles to the south. Accessible via Route 880.
Bicycle Facilities
• Existing Bicycle Lanes: Mira Mesa Boulevard
• Planned Bikeways: Lusk Boulevard, Pacific Heights Boulevard between Barnes Canyon Road and Mira Mesa Boulevard, Barnes Canyon Road between Pacific Heights Boulevard and Lusk Boulevard
Attachment 4 :: Safe Routes to Transit Typology Prototypes 172

29
SANDAG Safe Routes to Transit Plan
LEGEND Station Area Planned Bike Route Existing Bike Lane Other Planned Bikeway Signalized Intersection Crosswalk Limited Tree Canopy
NOT TO SCALE
Qualcomm OfficesSorrento Valley Coaster StationSTATION AREAEXISTING CONDITIONS
MAP
Lusk Blvd
Lusk Blvd
Attachment 4 :: Safe Routes to Transit Typology Prototypes 173

30
Station Area Typologies
RECOMMENDED IMPROVEMENTS• Add high-visibility crosswalks for all legs of key intersections
within the quarter-mile stop area
• Install rectangular rapid flashing beacons at midblock locations far from existing crossing locations
• Locate bike parking at stop
• Implement planned bikeways
• Install wayfinding signage
OTHER OPPORTUNITIES • City of San Diego Bikeshare program
Measure Quantity Low Medium HighPedestrian RRFB Flashing Beacon (Solar) 4 Locations $40,000 $48,000 $56,000 High Visibility Crosswalk 4 Intersections $9,600 $12,800 $16,000 Sidewalk Reconstruction 5,000 SF $45,000 $60,000 $75,000 Curb/Gutter Reconstruction 500 LF $17,500 $20,000 $22,500 Pedestrian Wayfinding Signs 4 Signs $3,000 $3,600 $4,000 Subtotal Pedestrian $115,100 $144,400 $173,500
Bicycle Bike Parking 4 Spaces $1,000 $2,000 $4,000 Bike Destination Wayfinding Signs 2 Signs $1,500 $1,800 $2,000 Class II Bike Lanes (including signing & striping) 2 Miles $27,667 $37,594 $49,421Subtotal Bicycle $30,167 $41,394 $55,421
Construction Cost Subtotal $125,267 $161,794 $200,921Contingencies Construction Contingency $29,053 $37,159 $45,784 Planning/Design/Environmental $21,790 $27,869 $34,338 Construction Engineering $14,527 $18,579 $22,592Total Including Contingencies (Rounded to Nearest $1,000) $211,000 $269,000 $332,000
Improvement Cost Breakdown
Total Cost
Attachment 4 :: Safe Routes to Transit Typology Prototypes 174

31
SANDAG Safe Routes to Transit Plan
RECOMMENDATION MAP*
LEGEND Station Area Existing/Planned Bike Route Existing Bike Lane Other Planned Bikeway Key Bicycle Connection Candidate Location for High-Visibility Crosswalk Candidate Location for Protected Crossing (Signals or Beacons, Curb Extensions or Median Refuge) Add Bicycle Parking
NOT TO SCALE
*Wide-ranging recommendations or those that are not location-specific are not shown
Lusk Blvd
Lusk Blvd
Attachment 4 :: Safe Routes to Transit Typology Prototypes 175

[This page intentionally left blank]
Image via Flickr.com
/THE Holy Hand Grenade!
Attachment 4 :: Safe Routes to Transit Typology Prototypes 176
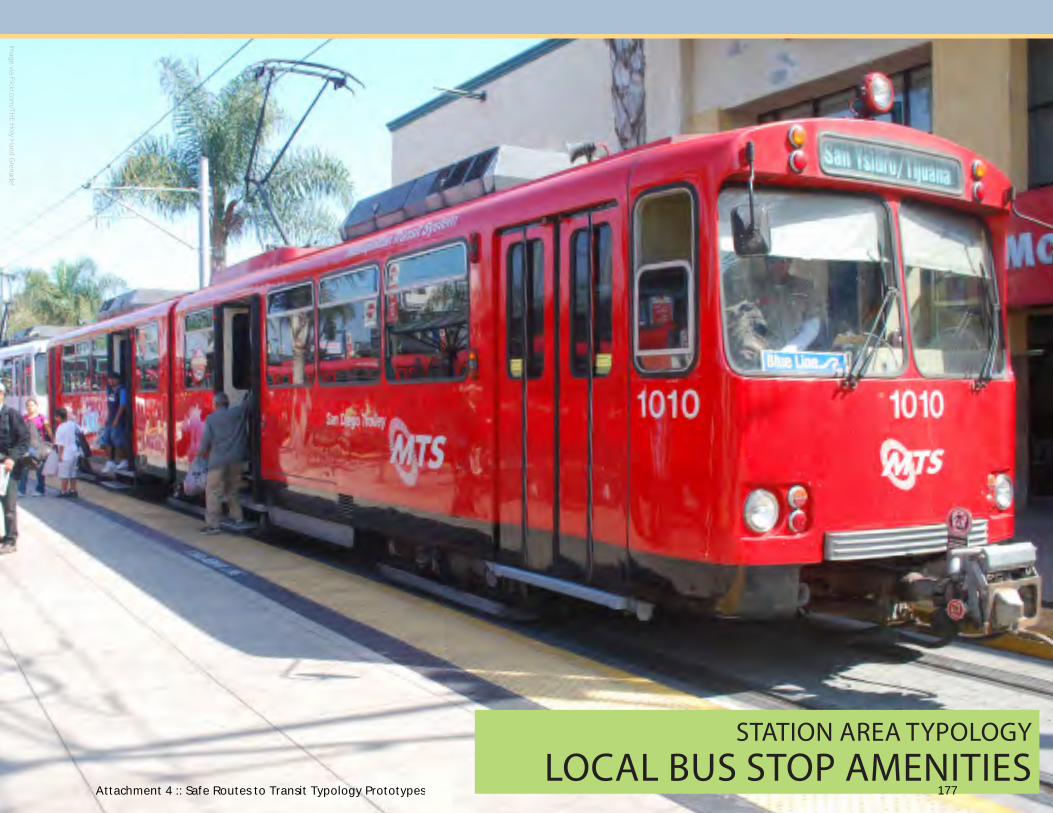
STATION AREA TYPOLOGYLOCAL BUS STOP AMENITIES
Image via Flickr.com
/THE Holy Hand Grenade!
Attachment 4 :: Safe Routes to Transit Typology Prototypes 177

34
Station Area Typologies
PROTOTYPICAL LOCAL BUS STOP
DESCRIPTIONLocal bus stops are the predominant stop typology in the San Diego region. Most are located along arterials and collectors in residential and neighborhood commercial areas. This type of transit service, operated primarily by San Diego Metropolitan Transit System in the southern and central areas of the county, and the North Coast Transit District in the northern part of the county provides service to local destinations, and in some cases to regional transit services like the Coaster commuter rail. Bus service frequencies vary by line and location. On some lines, service can be quite limited, and on other local lines that serve some larger residential areas, service can be more frequent.
The level of bus stop amenity varies by location, line, and service provider, but is generally limited to a bus stop sign, and in some locations a bus stop bench, and trash receptacle.
Pedestrian and bicycle access opportunities can be quite limited in areas with few signalized pedestrian crossing opportunities. Bicycle infrastructure varies by location and jurisdiction, but is often quite limited. However, because local bus stop spacing is generally close together (typically less than a mile), the emphasis on these recommendations is addressing pedestrian access constraints at bus stops.
PROJECT ID: ####*SRTT Typology: Local Bus Stops
Jurisdiction: Varies
2050 RTP/SCS Transit Project: N/A
Smart Growth Opportunity Areas: : Varies. Some may fall within a SGOA, but most fall outside.
SRTS: Varies. Some may be located near schools.
RECOMMENDATION
IMPLEMENTATION EXAMPLE
LEGEND
High-Visibility Crosswalk
Attachment 4 :: Safe Routes to Transit Typology Prototypes 178

35
SANDAG Safe Routes to Transit Plan
RECOMMENDED IMPROVEMENTSThe primary impediment at many local bus stops is the lack of protected pedestrian crossings. Generally, signalized intersections are spaced far apart, so pedestrians walking to access a bus will often need to cross at an uncontrolled intersection, or will cross mid-block. Local bus stops in suburban areas may also lack continuous sidewalk coverage. To address these impediments, the following enhancements are proposed:
• Install a mid-block high visibility crosswalk with a median refuge island and a rectangular rapid flashing beacon.
• Relocate bus stops so that they are adjacent to the protected crossing.
• Improve sidewalk coverage to ensure that sidewalks are provided on the block where the local bus stop is located.
• Add bicycle parking for up to two spaces in locations where bike parking may be desirable.
Measure Quantity Low Medium HighPedestrian RRFB Flashing Beacon (Solar) 1 Location $10,000 $12,000 $14,000 High Visibility Crosswalk 1 Location $600 $800 $1,000 Sidewalk Reconstruction 4,000 SF $36,000 $48,000 $60,000 Subtotal Pedestrian $46.600 $60,800 $75,000
Bicycle Bike Parking 2 Spaces $500 $1,000 $2,000Subtotal Bicycle $500 $1,000 $2,000
Traffic Calming Median Refuge Island 200 SF $3,600 $5,000 $6,000Subtotal Traffic Calming $3,600 $5,000 $6,000
Construction Cost Subtotal $50,700 $66,800 $83,000Contingencies Construction Contingency $29,053 $37,159 $45,784 Planning/Design/Environmental $21,790 $27,869 $34,338 Construction Engineering $14,527 $18,579 $22,592Total Including Contingencies (Rounded to Nearest $1,000) $116,000 $150,000 $186,000
Improvement Cost Breakdown
Total Cost
Attachment 4 :: Safe Routes to Transit Typology Prototypes 179

36
Station Area Typologies
Prohibit parking along any curb or platform where the transit vehicle will stop so that passengers have a clear path to the vehicle. The area where parking needs to be prohibited needs to be clearly designated to avoid any confusion as to where parking is legal or not. Never assume that a driver knows where not to park. Designating the no-parking zone should be by a means separate from the transit stop sign. The preferred method is painting the curb in the appropriate no-parking color. An alternate is separate no parking signs clearly delineating the length of the zone.
Construct a landing pad for passengers to board or alight the vehicle, based on the vehicle design and location of doors. A typical bus stop pad to allow the operation of a wheelchair lift or ramp requires:
• a firm, stable surface (concrete, asphalt or pavers, depending on surrounding materials);
• a minimum clear length of 96 in. (measured from the curb or vehicle roadway edge);
• a minimum clear width of 60 in. (measured parallel to the vehicle roadway) to the maximum extent allowed by legal or site constraints; and
• a cross slope not to exceed 2 percent.
These guidelines should be verified with local and national accessibility requirements and with vehicle specifications.
Connect pad to streets, sidewalks or pedestrian paths by an accessible route.
The slope of the pad must meet accessibility requirements but should be the same as the parallel roadway to the extent practicable.
For water drainage, a maximum slope of 1:50 (2 percent) perpendicular to the roadway is allowed.
Provide benches for passenger to wait.
Locate the benches so that passengers seated on them can see approaching vehicles. Ensure that benches do not intrude into the landing pad or the pedestrian clear zone.
Provide shelters to protect waiting passengers from the elements.
Do not place shelters in the pedestrian clear zone. Locate shelters so that they do not impair operation of wheelchair lifts.
A minimum distance of 2 ft should be maintained between the back-face of the curb and the roof or panels of the shelter. Greater distances are preferred to separate waiting passengers from nearby vehicular traffic.
Shelters should be located at the end of the transit stop zone so they are highly visible to approaching buses and passing traffic and to reduce walking distance from the shelter to the bus. Locate shelters so that passengers in the shelter can see approaching vehicles.
Shelters should not be located directly in front of store windows. When shelters are directly adjacent to a building, a 12 in. clear space should be preserved to permit trash removal or cleaning of the shelter.
A minimum clear entrance (doorway) of 32 in. is recommended. The entrance may be constructed as part of the “path of travel,” but then it must be 36 in. wide minimum
A minimum clear floor area measuring 30 in. wide by 48 in. long, completely within the perimeter of the shelter, must be provided. A rider using a wheelchair or other mobility aid must be able to enter the shelter from the public way and reach the 30 in. by 48 in. clear floor area.
Good: Parking clearly prohibited at bus stop. (Las Vegas, NV). Photo: Christof Spieler
EXAMPLES
Good: Wheelchair user being let off on landing pad. (Dallas, TX). Photo: DART
Bad: No landing pad, no ramp, no connecting sidewalk. (Houston, TX). Photo: Christof Spieler
Good: Passenger using bench. (Houston, TX). Photo: Christof Spieler
11
2
2
3
34
4
5
BUS STOP AMENITY GUIDELINESIn addition to access enhancements, the American Public Transportation Association (APTA) has developed a recommended practice that provides stop amenity guidelines for local bus stops, The following is an excerpt from APTA Recommended Practice:a
a Design of On-street Transit Stops and Access from Surrounding Areas, APTA, March 2012.
Attachment 4 :: Safe Routes to Transit Typology Prototypes 180
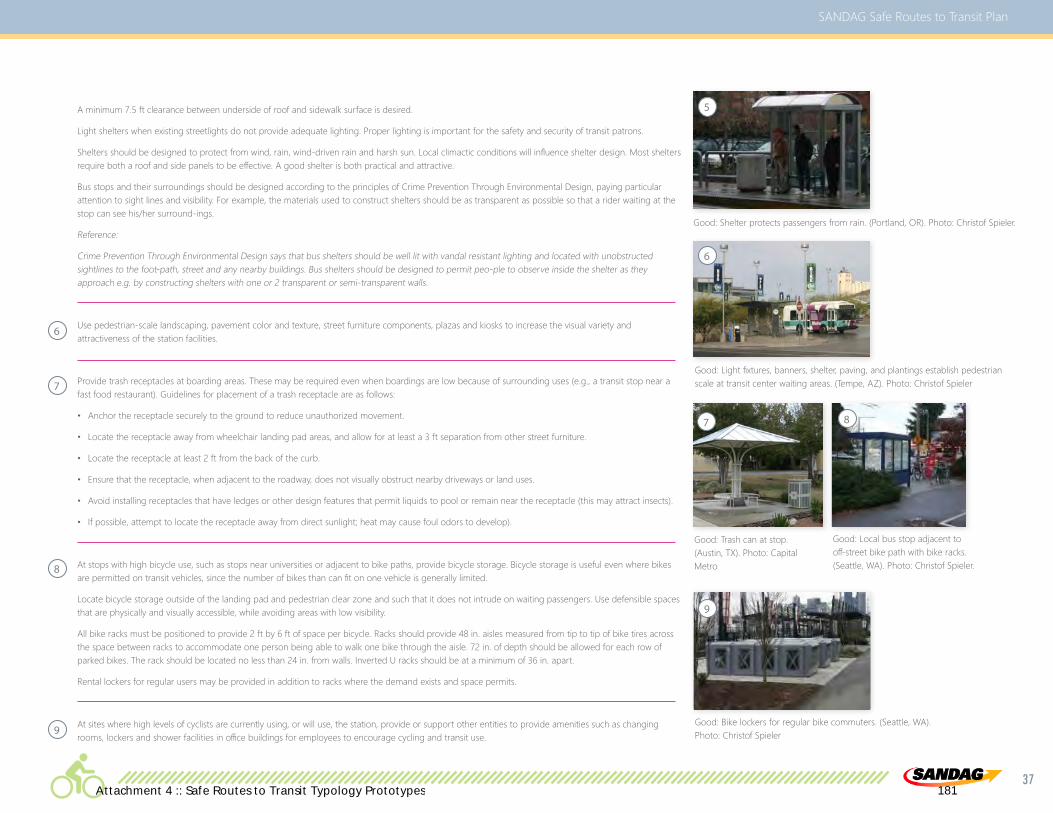
37
SANDAG Safe Routes to Transit Plan
A minimum 7.5 ft clearance between underside of roof and sidewalk surface is desired.
Light shelters when existing streetlights do not provide adequate lighting. Proper lighting is important for the safety and security of transit patrons.
Shelters should be designed to protect from wind, rain, wind-driven rain and harsh sun. Local climactic conditions will influence shelter design. Most shelters require both a roof and side panels to be effective. A good shelter is both practical and attractive.
Bus stops and their surroundings should be designed according to the principles of Crime Prevention Through Environmental Design, paying particular attention to sight lines and visibility. For example, the materials used to construct shelters should be as transparent as possible so that a rider waiting at the stop can see his/her surround-ings.
Reference:
Crime Prevention Through Environmental Design says that bus shelters should be well lit with vandal resistant lighting and located with unobstructed sightlines to the foot-path, street and any nearby buildings. Bus shelters should be designed to permit peo-ple to observe inside the shelter as they approach e.g. by constructing shelters with one or 2 transparent or semi-transparent walls.
Use pedestrian-scale landscaping, pavement color and texture, street furniture components, plazas and kiosks to increase the visual variety and attractiveness of the station facilities.
Provide trash receptacles at boarding areas. These may be required even when boardings are low because of surrounding uses (e.g., a transit stop near a fast food restaurant). Guidelines for placement of a trash receptacle are as follows:
• Anchor the receptacle securely to the ground to reduce unauthorized movement.
• Locate the receptacle away from wheelchair landing pad areas, and allow for at least a 3 ft separation from other street furniture.
• Locate the receptacle at least 2 ft from the back of the curb.
• Ensure that the receptacle, when adjacent to the roadway, does not visually obstruct nearby driveways or land uses.
• Avoid installing receptacles that have ledges or other design features that permit liquids to pool or remain near the receptacle (this may attract insects).
• If possible, attempt to locate the receptacle away from direct sunlight; heat may cause foul odors to develop).
At stops with high bicycle use, such as stops near universities or adjacent to bike paths, provide bicycle storage. Bicycle storage is useful even where bikes are permitted on transit vehicles, since the number of bikes than can fit on one vehicle is generally limited.
Locate bicycle storage outside of the landing pad and pedestrian clear zone and such that it does not intrude on waiting passengers. Use defensible spaces that are physically and visually accessible, while avoiding areas with low visibility.
All bike racks must be positioned to provide 2 ft by 6 ft of space per bicycle. Racks should provide 48 in. aisles measured from tip to tip of bike tires across the space between racks to accommodate one person being able to walk one bike through the aisle. 72 in. of depth should be allowed for each row of parked bikes. The rack should be located no less than 24 in. from walls. Inverted U racks should be at a minimum of 36 in. apart.
Rental lockers for regular users may be provided in addition to racks where the demand exists and space permits.
At sites where high levels of cyclists are currently using, or will use, the station, provide or support other entities to provide amenities such as changing rooms, lockers and shower facilities in office buildings for employees to encourage cycling and transit use.
Good: Shelter protects passengers from rain. (Portland, OR). Photo: Christof Spieler.
Good: Light fixtures, banners, shelter, paving, and plantings establish pedestrian scale at transit center waiting areas. (Tempe, AZ). Photo: Christof Spieler
Good: Trash can at stop. (Austin, TX). Photo: Capital Metro
Good: Local bus stop adjacent to off-street bike path with bike racks. (Seattle, WA). Photo: Christof Spieler.
Good: Bike lockers for regular bike commuters. (Seattle, WA). Photo: Christof Spieler
5
6
6
7
7
8
8
9
9
Attachment 4 :: Safe Routes to Transit Typology Prototypes 181
[This page intentionally left blank]
Attachment 4 :: Safe Routes to Transit Typology Prototypes 182

San Diego Regional
Safe Routes to SchoolStrategic Plan
March 2012
Attachment 5 :: San Diego Regional Safe Routes to School Strategic Plan 183

ii
For additional information please contact: Bridget Enderle (619) 595-5612
[email protected] www.sandag.org/srts
Attachment 5 :: San Diego Regional Safe Routes to School Strategic Plan 184

iii
Table of Contents
Executive Summary ................................................................................................. 3
The Charge for a Regional Strategy .......................................................................... 4 A Regional Safe Routes to School Strategy ............................................................... 4
Chapter 1: Introduction .......................................................................................... 7
The “Five E’s” of Safe Routes to School ................................................................... 8 Engineering .......................................................................................................... 8 Education ............................................................................................................. 9 Encouragement .................................................................................................... 9 Enforcement ...................................................................................................... 10 Evaluation .......................................................................................................... 10
The Safe Routes to School Movement .................................................................... 11 California’s Safe Routes to School Grant Program ............................................... 12 Federal Safe Routes to School Grant Program ..................................................... 13 Local and Regional Implementation .................................................................... 14
Purpose and Relationship to Other Plans and Policies ............................................. 15 Strategy Planning Process ...................................................................................... 17 Contents of the Strategic Plan ............................................................................... 18
Chapter 2: Existing Issues and Opportunities ..................................................... 19
Snapshot of the Region’s School System and Walking and Bike Trends ................... 19 Physical Activity and Health Among Youths ............................................................ 23 Traffic Safety and Personal Security ........................................................................ 25 Transportation Costs .............................................................................................. 32 Complete Streets and Smart Growth ...................................................................... 33 Transportation Demand Management, Air Quality, and Greenhouse Gas
Emissions ............................................................................................................... 35
Chapter 3: Existing Safe Routes to School Efforts .............................................. 37
Federal and State Grant Funded Programs ............................................................. 37 Supportive Local and School District Policies ........................................................... 42 Public Health Partnerships ...................................................................................... 42
California Department of Public Health ............................................................... 42 County of San Diego Healthy Works ................................................................... 43
SANDAG’s Active Transportation Program ............................................................. 47 SANDAG iCommute’s SchoolPool .......................................................................... 48 Advocacy and Community-Based Organizations ..................................................... 51
Attachment 5 :: San Diego Regional Safe Routes to School Strategic Plan 185

iv
Chapter 4: Moving Forward – A Regional Strategy ............................................ 53
Regional Planning and Evaluation .......................................................................... 53 Data Collection and Evaluation ........................................................................... 53 Smart Growth and Complete Streets Integration ................................................ 55
Collaboration and Coordination ............................................................................. 57 Safe Routes to School Coordination ................................................................... 57 Safe Routes to School Coalition .......................................................................... 59
Technical Assistance .............................................................................................. 60 Seminars and Trainings ....................................................................................... 60 Safe Routes to School Planning Workshops ........................................................ 61 Safe Routes to School Planning Services .............................................................. 63
Education and Encouragement Strategies .............................................................. 64 Safe Routes to School Web Enhancements ......................................................... 64 Outreach and Promotional Campaigns ............................................................... 66 Education Courses ............................................................................................. 68
Implementation Process ......................................................................................... 69
Appendix A: Resource List ................................................................................... 71
San Diego Region .................................................................................................. 71 California .............................................................................................................. 73 National ................................................................................................................ 73
References ............................................................................................................ 75
Attachment 5 :: San Diego Regional Safe Routes to School Strategic Plan 186

v
List of Tables
Table 3.1 State-Legislated Safe Routes to School Program Funded Projects in the San Diego Region (All Program Cycles) ...................................................... 38
Table 3.2 Federal Safe Routes to School Program Funded Projects in the San Diego Region (Program Cycles 1 & 2) ................................................. 39
Table 3.3 SANDAG Healthy Works Grant Projects .................................................... 46
Attachment 5 :: San Diego Regional Safe Routes to School Strategic Plan 187

vi
THIS PAGE INTENTIONALLY LEFT BLANK
Attachment 5 :: San Diego Regional Safe Routes to School Strategic Plan 188
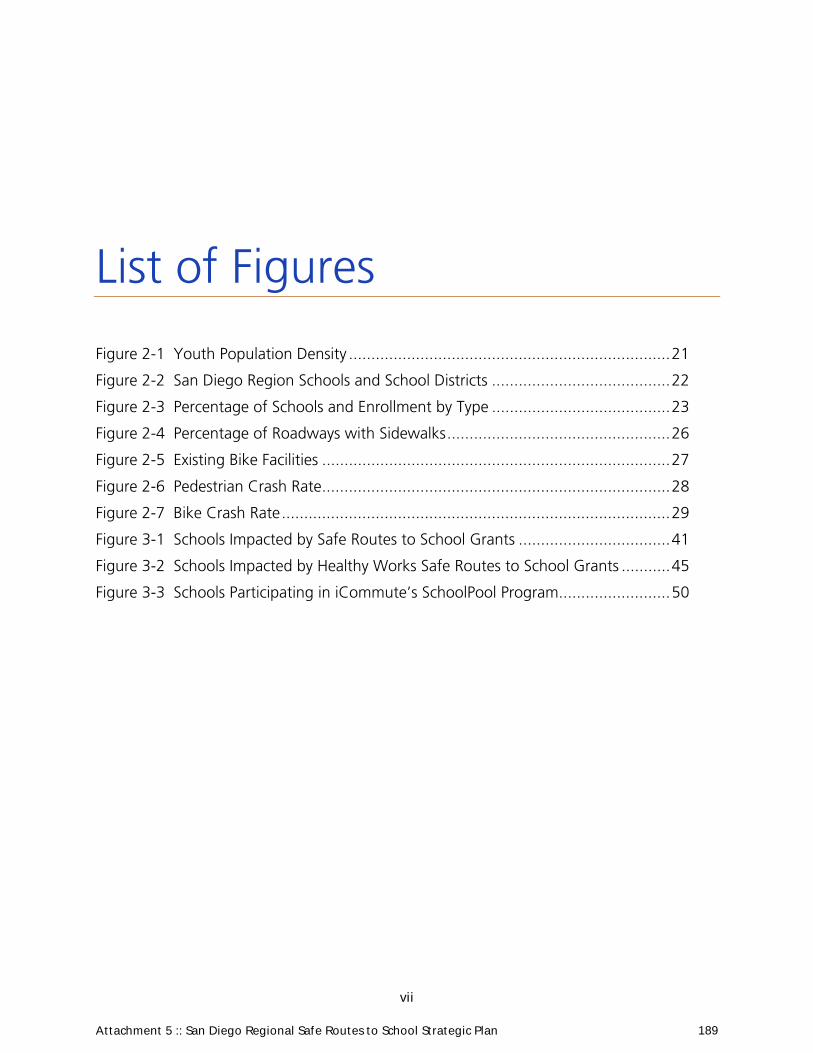
vii
List of Figures
Figure 2-1 Youth Population Density ........................................................................ 21
Figure 2-2 San Diego Region Schools and School Districts ........................................ 22
Figure 2-3 Percentage of Schools and Enrollment by Type ........................................ 23
Figure 2-4 Percentage of Roadways with Sidewalks .................................................. 26
Figure 2-5 Existing Bike Facilities .............................................................................. 27
Figure 2-6 Pedestrian Crash Rate .............................................................................. 28
Figure 2-7 Bike Crash Rate ....................................................................................... 29
Figure 3-1 Schools Impacted by Safe Routes to School Grants .................................. 41
Figure 3-2 Schools Impacted by Healthy Works Safe Routes to School Grants ........... 45
Figure 3-3 Schools Participating in iCommute’s SchoolPool Program ......................... 50
Attachment 5 :: San Diego Regional Safe Routes to School Strategic Plan 189

viii
THIS PAGE INTENTIONALLY LEFT BLANK
Attachment 5 :: San Diego Regional Safe Routes to School Strategic Plan 190

San Diego Regional Safe Routes to School Strategic Plan
Made possible by funding from the Centers for Disease Control and Prevention, through the County of San Diego and the San Diego Association of Governments
401 B Street, Suite 800
San Diego, CA 92101 (619) 699-1900
sandag.org
facebook.com/SANDAGregion
Attachment 5 :: San Diego Regional Safe Routes to School Strategic Plan 191

2
THIS PAGE INTENTIONALLY LEFT BLANK
Attachment 5 :: San Diego Regional Safe Routes to School Strategic Plan 192

3
Executive Summary
“Safe Routes to School” efforts create streets that safely accommodate bicyclists and pedestrians, coupling infrastructure improvements with education, encouragement, and other programs designed to make walking and biking safer and more desirable.
With the overarching goals of improving safety and encouraging active transportation, Safe Routes to School efforts improve health, reduce transportation costs, and decrease school-related vehicle trips, thus improving air quality and reducing traffic congestion near schools. Safe Routes to School efforts also teach children healthy lifestyle skills and heighten public awareness about the benefits of active transportation.
To further realize these benefits, the Regional Safe Routes to School Strategic Plan (Strategic Plan) proposes a blueprint for a regional strategy to make walking and bicycling to and from school safer and facilitate the development of more attractive travel choices for families throughout the region.
Safe Routes to School initiatives support the regional objectives of the Regional Comprehensive Plan (RCP) and 2050 Regional Transportation Plan and Sustainable Communities Strategy (2050 RTP and SCS) by creating walkable and bicycle-friendly communities, encouraging active transportation to reduce vehicle trips and improve public health.
Attachment 5 :: San Diego Regional Safe Routes to School Strategic Plan 193

4
THE CHARGE FOR A REGIONAL STRATEGY
Safe Routes to School efforts support the regional objectives of the Regional Comprehensive Plan (RCP) and 2050 Regional Transportation Plan and Sustainable Communities Strategy (2050 RTP and SCS) by creating walkable and bicycle-friendly communities, encouraging active transportation to reduce vehicle trips and improve public health.
To enhance the region’s existing efforts, the Strategic Plan identifies a strategy to support local communities in establishing new Safe Routes to School programs as well as sustaining and enhancing existing efforts. A regional strategy will ensure that the tools provided are germane and that resources are focused in areas across the region with the greatest need for assistance.
A REGIONAL SAFE ROUTES TO SCHOOL STRATEGY
SANDAG began developing the Strategic Plan in September 2010 with funding through the County of San Diego Health and Human Services Agency (HHSA) Healthy Works program, a multi-faceted initiative addressing rising obesity rates in the region by increasing access to healthy foods and promoting physical activity.
The planning process has engaged key stakeholders and the region’s residents in the development of the Strategic Plan through a variety of venues. The strategy proposed in the plan reflects input received as well as reviews of best practices and existing conditions.
The recommended strategy consists of the following elements:
Photo Source: SANDAG
Attachment 5 :: San Diego Regional Safe Routes to School Strategic Plan 194
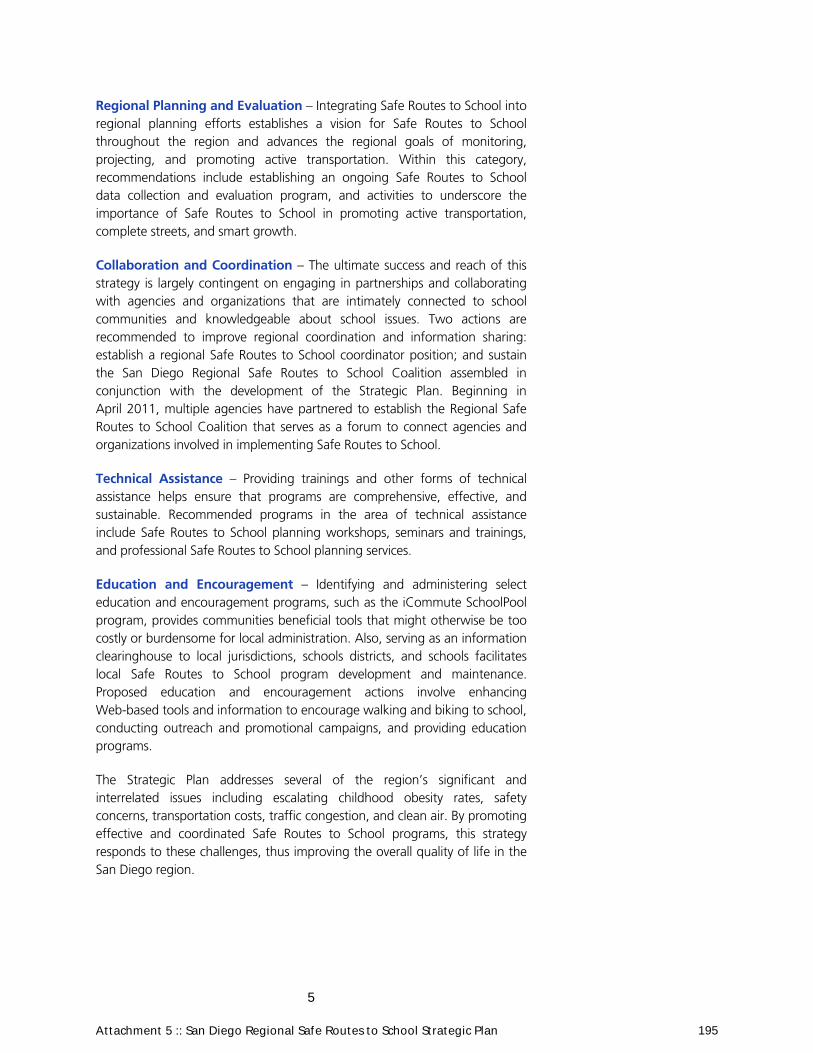
5
Regional Planning and Evaluation – Integrating Safe Routes to School into regional planning efforts establishes a vision for Safe Routes to School throughout the region and advances the regional goals of monitoring, projecting, and promoting active transportation. Within this category, recommendations include establishing an ongoing Safe Routes to School data collection and evaluation program, and activities to underscore the importance of Safe Routes to School in promoting active transportation, complete streets, and smart growth.
Collaboration and Coordination – The ultimate success and reach of this strategy is largely contingent on engaging in partnerships and collaborating with agencies and organizations that are intimately connected to school communities and knowledgeable about school issues. Two actions are recommended to improve regional coordination and information sharing: establish a regional Safe Routes to School coordinator position; and sustain the San Diego Regional Safe Routes to School Coalition assembled in conjunction with the development of the Strategic Plan. Beginning in April 2011, multiple agencies have partnered to establish the Regional Safe Routes to School Coalition that serves as a forum to connect agencies and organizations involved in implementing Safe Routes to School.
Technical Assistance – Providing trainings and other forms of technical assistance helps ensure that programs are comprehensive, effective, and sustainable. Recommended programs in the area of technical assistance include Safe Routes to School planning workshops, seminars and trainings, and professional Safe Routes to School planning services.
Education and Encouragement – Identifying and administering select education and encouragement programs, such as the iCommute SchoolPool program, provides communities beneficial tools that might otherwise be too costly or burdensome for local administration. Also, serving as an information clearinghouse to local jurisdictions, schools districts, and schools facilitates local Safe Routes to School program development and maintenance. Proposed education and encouragement actions involve enhancing Web-based tools and information to encourage walking and biking to school, conducting outreach and promotional campaigns, and providing education programs.
The Strategic Plan addresses several of the region’s significant and interrelated issues including escalating childhood obesity rates, safety concerns, transportation costs, traffic congestion, and clean air. By promoting effective and coordinated Safe Routes to School programs, this strategy responds to these challenges, thus improving the overall quality of life in the San Diego region.
Attachment 5 :: San Diego Regional Safe Routes to School Strategic Plan 195

6
THIS PAGE INTENTIONALLY LEFT BLANK
Attachment 5 :: San Diego Regional Safe Routes to School Strategic Plan 196

7
CHAPTER 1:
INTRODUCTION
“Safe Routes to School” refers to a spectrum of programs and built environment improvements used together to foster opportunities for students to walk and bike to school safely and routinely.
In addition to the overarching goals of improving safety and increasing physical activity, Safe Routes to School efforts improve health, reduce transportation costs, and decrease school-related vehicle trips thus improving air quality and reducing traffic congestion near our schools. Safe Routes to School efforts also teach children healthy lifestyle skills and heighten public awareness about the built environment, air quality, health, and quality of life benefits associated with these programs.
Safe Routes to School efforts improve health, reduce transportation costs, and decrease school-related vehicle trips thus improving air quality and reducing traffic congestion near our schools.
Photo Source: Walk San Diego
Attachment 5 :: San Diego Regional Safe Routes to School Strategic Plan 197

8
This chapter of the Strategic Plan introduces the concept of Safe Routes to School, how the concept has evolved over time, and it describes how the plan was developed and highlights the specific goals of the strategy.
THE “FIVE E’S” OF SAFE ROUTES TO SCHOOL
Safe Routes to School programs utilize five strategies: planning and evaluation, infrastructure improvements, enforcement of safe motorist, pedestrian, and bicyclist behaviors, education, and activities that encourage children to walk and bicycle to school. Comprehensive Safe Routes to School programs encompass all of these components commonly referred to as the 5 E’s (engineering, education, enforcement, encouragement, and evaluation).
Engineering
The engineering element of Safe Routes to School refers to the design, construction, and maintenance of traffic control devices, pedestrian and bicycle facilities, traffic calming measures, and other modifications to the built environment aimed at enhancing safety around school areas. Common improvements include installing school area signage, high visibility crosswalks, flashing yellow beacons, and traffic calming measures such as landscaped roundabouts, curb extensions, and chicanes. Use of school area infrastructure improvements is guided by engineering analysis and several design guidelines and manuals including Planning and Designing for Pedestrians, Model Guidelines for the San Diego Region and the California Manual on Uniform Traffic Control Devices, particularly Part 7, Traffic Controls for School Areas.
Attachment 5 :: San Diego Regional Safe Routes to School Strategic Plan 198

9
Education
Education is a cornerstone of Safe Routes to School. It involves teaching students traffic safety skills and laws, personal security measures, as well as health and environmental lessons. Material is presented in a variety of formats including skills practice in a simulated streetscape setting, school assemblies, and ongoing classroom coursework. Integrating Safe Routes to School education into physical education, health, and science curriculums exposes students to the health and environmental benefits of active transportation. Public awareness campaigns can also educate the general public about the benefits associated with Safe Routes to School and the critical importance of operating motor vehicles more safely, especially in school zones. Providing the educational information in alternative languages for those with limited English skills can help ensure all members of the community have the opportunity to learn about Safe Routes to School. Educating neighbors and parents on the goals and benefits of Safe Routes to School is essential to program success.
Encouragement
Closely related to education, encouragement efforts are designed to increase walking and biking to school by generating enthusiasm, highlighting the benefits of active transportation, and increasing the convenience of using alternatives to driving students to school. Encouragement activities include special events, such as “Walk and Bike to School Day”, coordinated walking and biking groups, promotional campaigns, student competitions and incentives. Many of these initiatives incorporate an educational component. For example, “Walk Across America” can integrate geography, math, and science lessons into this classroom-based competition by calculating and
Integrating Safe Routes to School education into physical education, health, and science curriculums exposes students to the health and environmental benefits of active transportation.
Photo Source: SANDAG
Attachment 5 :: San Diego Regional Safe Routes to School Strategic Plan 199

10
tracking classes’ weekly walking miles across a map, studying destinations they travel through, and learning about the air quality benefits derived from their walk trips.
Enforcement
Enforcing compliance with traffic and parking laws is another aspect of Safe Routes to School. Enforcement activities target unsafe driving behavior, such as speeding, failing to yield to pedestrians and bicyclists, as well as illegal parking and turns in school areas. In addition to motorists’ behaviors, enforcement includes ensuring that pedestrians and bicyclists comply with traffic laws. While authority to enforce traffic laws resides with local police departments, crossing guards, school officials, parents, and volunteers can play a vital role in reinforcing safe behaviors surrounding schools.
Evaluation
Evaluation is crucial to gauging the efficacy of a Safe Routes to School program and identifying needed improvements. Factors to measure include program participation levels and awareness of the program, school travel mode shift, changes in attitudes toward active transportation to school, infrastructure completed, and dollars leveraged to support the longevity of the program. Evaluation efforts begin with collecting baseline data and establishing performance measures and obtainable benchmarks.
Ideally, identifying each community’s respective infrastructure and programmatic strategies begins with a planning process that includes a
Photo Source: City of National City
Evaluation is crucial to gauging the efficacy of a Safe Routes to School program and identifying needed improvements.
Attachment 5 :: San Diego Regional Safe Routes to School Strategic Plan 200
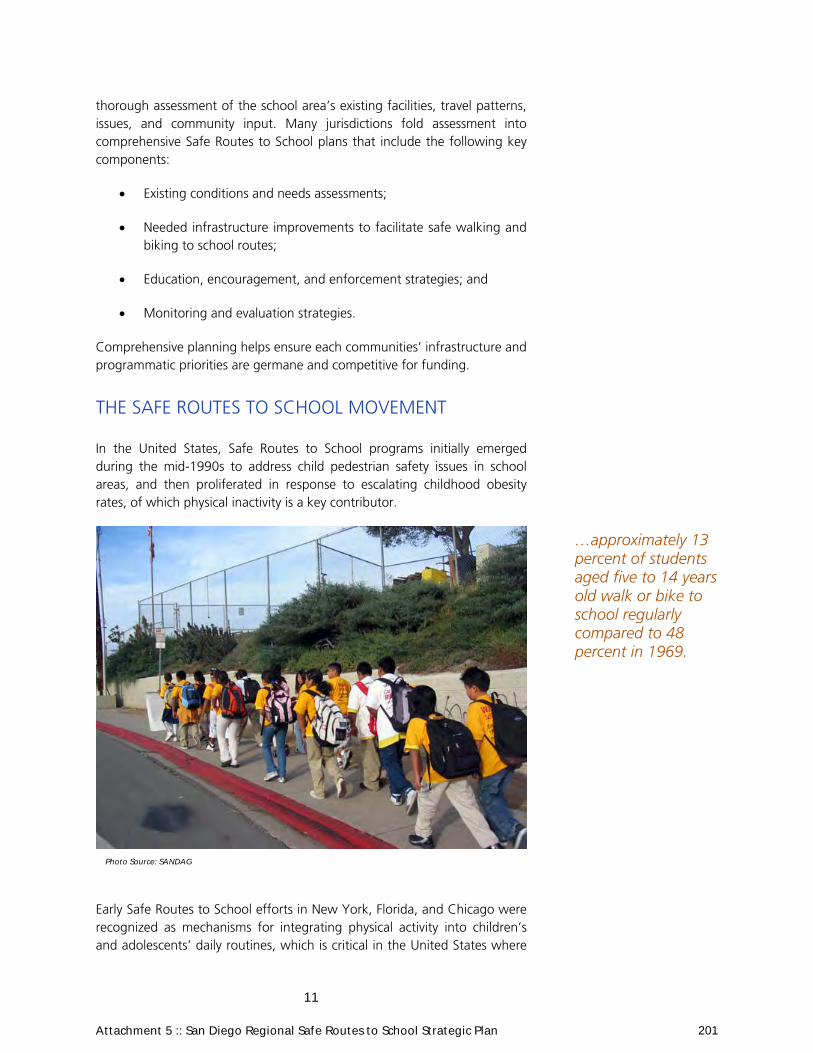
11
thorough assessment of the school area’s existing facilities, travel patterns, issues, and community input. Many jurisdictions fold assessment into comprehensive Safe Routes to School plans that include the following key components:
Existing conditions and needs assessments;
Needed infrastructure improvements to facilitate safe walking and biking to school routes;
Education, encouragement, and enforcement strategies; and
Monitoring and evaluation strategies.
Comprehensive planning helps ensure each communities’ infrastructure and programmatic priorities are germane and competitive for funding.
THE SAFE ROUTES TO SCHOOL MOVEMENT
In the United States, Safe Routes to School programs initially emerged during the mid-1990s to address child pedestrian safety issues in school areas, and then proliferated in response to escalating childhood obesity rates, of which physical inactivity is a key contributor.
Early Safe Routes to School efforts in New York, Florida, and Chicago were recognized as mechanisms for integrating physical activity into children’s and adolescents’ daily routines, which is critical in the United States where
…approximately 13 percent of students aged five to 14 years old walk or bike to school regularly compared to 48 percent in 1969.
Photo Source: SANDAG
Attachment 5 :: San Diego Regional Safe Routes to School Strategic Plan 201

12
an estimated 32 percent of children and adolescents are considered overweight or obese and only one-third meet the Surgeon General’s daily physical activity recommendations (Center for Disease Control and Prevention [CDC], 2005). Correspondingly, approximately 13 percent of students aged five to 14 years old walk or bike to school regularly compared to 48 percent in 1969 (National Center for Safe Routes to School [NCSRTS], 2010).
Recognition of the safety and health implications of this trend ultimately led to state and federal Safe Routes to School grant programs established through legislation in 1999 and 2005, respectively.
California’s Safe Routes to School Grant Program
California’s pioneering Safe Routes to School program was established in October 1999 with the passage of California Assembly Bill 1475 (AB 1475). AB 1475 allocated one-third of California’s federal Surface Transportation Program (STP) safety funds toward Safe Routes to School, thus creating the first statewide Safe Routes to School construction program in the United States. A coalition of urban planning, engineering, public health, education, law enforcement, active transportation advocacy groups, and other professional organizations were instrumental in advancing the bill.
The initial two-year program administered by the California Department of Transportation (Caltrans) restricted funding to infrastructure projects. However, succeeding program cycles have authorized funds to be used for education and encouragement programs at the schools that the infrastructure projects serve. Under the current grant program guidelines (Cycle 9), incorporated cities and counties are eligible to apply for up to $450,000 toward construction projects that target grades K–12 schools and
Photo Source: SANDAG
Attachment 5 :: San Diego Regional Safe Routes to School Strategic Plan 202

13
may apply ten percent of project funding toward education, enforcement, and encouragement activities and/or school grounds improvements. A ten percent match of funds is required for the California state program. The non-infrastructure program allowance is sometimes underutilized; however, in many communities this component of the program is a pivotal part of the strategy to support travel behavior change.
In September 2011 California Assembly Bill 516 was adopted, requiring state and federal Safe Routes to School grant program applicants to identify community priorities, a public participation process, and potential benefits of the project to low income communities.
Federal Safe Routes to School Grant Program
At the federal level, Safe Routes to School commenced in 2000 when the National Highway Traffic Safety Administration (NHTSA) awarded $50,000 each to launch pilot programs in Marin County, California and Arlington, Massachusetts geared toward increasing rates of walking and biking to school. The successes of these and other programs, particularly in Marin County, ultimately led to federal Safe Routes to School legislation. In 2005, the federal surface transportation bill, Safe, Accountable, Flexible, Efficient Transportation Equity Act: A Legacy for Users (SAFETEA-LU), authorized $612 million in funding under Section 1404 to state departments of transportation for Safe Routes to School programs through September 2009. The funding is allotted to states based on their relative proportions of total enrollment in primary and middle schools. The federal surface transportation bill has been operating under a series of short-term extensions until a new transportation authorization is passed.
Under the federal Safe Routes to School grant program guidelines released on April 15, 2011, tribal governments and regional and local planning
Photo Source: SANDAG
Attachment 5 :: San Diego Regional Safe Routes to School Strategic Plan 203

14
agencies are eligible to apply for funding toward infrastructure and non-infrastructure projects aimed at influencing behavior and improving safety for children in Kindergarten through 8th grade. Although local or regional planning agencies must serve as the lead agency, they may partner with a ‘Project Sponsor’ such as a public health agency, school district, or non-profit organization.
One million dollars is the maximum amount that may be requested for capital projects and $500,000 for programmatic projects. In addition to applying for projects that are exclusively programmatic, agencies seeking capital project funding may allocate up to 10 percent of their budget toward complementary education, encouragement, and enforcement activities. California’s approximate allocation of funds for the current (2011 – 2012) cycle is $42 million, with a target of 70 percent of those funds devoted to infrastructure projects and 30 percent toward education, encouragement and enforcement activities.
Local and Regional Implementation
While funding for Safe Routes to School programs primarily derives from the state and federal programs, the planning and implementation of Safe Routes to School programs is inherently local, relying on collaboration between local jurisdictions, school districts, schools, and community-based and nonprofit organizations. Although state and federal grants are vital funding sources, many Safe Routes to School activities occur outside of grant funded projects. Several of these effective local programs exist throughout the San Diego region and are described in greater detail in Chapter 3 of this plan.
Photo Source: SANDAG
Attachment 5 :: San Diego Regional Safe Routes to School Strategic Plan 204
15
Within the regional planning context, Safe Routes to School is gaining prominence as an effective Transportation Demand Management (TDM), air quality, and greenhouse gas reduction strategy in addition to an essential component to regional active transportation planning. It also plays a developing role in addressing transportation equity by targeting public health impacts and serving low-income communities.
PURPOSE AND RELATIONSHIP TO OTHER PLANS AND POLICIES
The emerging role of Safe Routes to School in regional planning has significant implications for the San Diego region. Safe Routes to School efforts support the regional objectives of creating walkable and bicycle-friendly communities, encouraging complete streets and smart growth place-making, and helping to reduce vehicle trips during peak periods of demand. Chapter two of this plan summarizes these and several related benefits derived from implementing Safe Routes to School programs.
To achieve these benefits, this Strategic Plan identifies a strategy to support the region’s local communities in establishing new programs as well as sustaining and expanding upon the many existing Safe Routes to School initiatives. Planning a regional strategy ensures that tools and resources are strategically distributed to realize the greatest benefit.
The specific goals of the regional strategy are to:
Increase physical activity rates of children and adolescents by increasing the number who walk and bike to school.
Improve safety conditions for pedestrians and bicyclists, thereby reducing child and adolescent injuries and fatalities.
Continue to expand current Safe Routes to School programs by encouraging comprehensive planning, fostering collaboration and partnerships, boosting public support, and initiating institutional change.
Reduce barriers to participation in Safe Routes to School, whether founded on race, ethnicity, national origin, disability, income level, or some other basis.
Promote and document the health, vehicle miles traveled (VMT) and greenhouse gas emission reduction, traffic management, and community benefits derived from Safe Routes to School through systematic monitoring, evaluation, and planning.
Planning a regional strategy ensures that tools and resources are strategically distributed to realize the greatest benefit.
Attachment 5 :: San Diego Regional Safe Routes to School Strategic Plan 205

16
Promote standardization of data collection where possible throughout the region.
Promote land use planning and design decisions that support active transportation, complete streets, and smart growth place-making.
The regional strategy consists of methods for integrating Safe Routes to School into regional planning activities; strengthening collaboration; providing technical assistance; and education and encouragement programs offered region-wide.
Several of the region’s transportation plans underpin the development of the Strategic Plan to support active transportation to school. The 2050 Regional Transportation Plan (2050 RTP) outlines the regional Safe Routes to School strategy and provides a framework to guide the development of this Strategic Plan. The 2050 RTP proposes completion of the Strategic Plan as one action toward expanding the region’s travel choices by helping to make walking and biking to school a viable transportation option.
The Safe Routes to School strategy also contributes to a new element of the RTP, the Sustainable Communities Strategy (SCS). The SCS proposes coordinating land use, housing, and transportation planning to foster more sustainable, compact, walkable, and transit-oriented communities. The SCS accounts for this strategy’s potential to increase school walk and bike trips and thus contribute to meeting the regional greenhouse gas reduction targets.
Consistent with Safe Routes to School objectives, the Regional Comprehensive Plan (RCP), adopted in 2004, seeks to advance more walkable and bicycle-friendly communities based on sound urban design and planning principles. The RCP also acknowledges the significant role of school siting and
Photo Source: SANDAG
Attachment 5 :: San Diego Regional Safe Routes to School Strategic Plan 206

17
design in using land more efficiently and supporting smart growth development.
Safe Routes to School is also identified as a priority in Riding to 2050: San Diego Regional Bicycle Plan (Regional Bicycle Plan) adopted in April 2010. The Regional Bicycle Plan provides a blueprint for making bicycling more practical and desirable to a broad spectrum of people in the San Diego region. It includes Safe Routes to School as a priority program to encourage children and adolescents to bicycle safely and more frequently to school.
STRATEGY PLANNING PROCESS
SANDAG began developing the Strategic Plan in September 2010 with funding through the County of San Diego Health and Human Services Agency (HHSA) Healthy Works program, a multi-faceted initiative intended to address rising obesity rates in the region by increasing access to healthy foods and promoting physical activity.
The planning process has engaged key stakeholders and the general public in the development of the Strategic Plan through a variety of formats.
Beginning in October 2010, SANDAG has convened a Safe Routes to School Strategy Coordination Team comprised of school district officials, planners, engineers, and public health professionals. The specific purpose of the team was to provide guidance on the contents of the Strategic Plan including existing conditions, issues to address, and actions identified in the plan.
Early in the planning process, SANDAG staff also drafted a white paper entitled “Overview of Safe Routes to School and the 2050 Regional Transportation Plan” that introduced the concept of a regional Safe Routes to School strategy and proposed preliminary strategic actions for potential inclusion in the 2050 RTP and as a possible framework for developing the Strategic Plan.
In November 2010 through January 2011, this 2050 RTP white paper was presented to the following eight SANDAG working groups and policy committees to solicit input on the strategy: Bicycle-Pedestrian Working Group, Public Health Stakeholder Group, Regional Planning Technical Working Group, San Diego Regional Traffic Engineers Council, Regional Planning Committee, Transportation Committee, and Cities/County Transportation Advisory Committee. The same eight working groups and committees were presented the draft of this plan and provided valuable input to shape the final Strategic Plan.
Developing and administering a Healthy Works pass-through grant program was also instrumental in shaping this strategy. The Healthy Works Safe
Attachment 5 :: San Diego Regional Safe Routes to School Strategic Plan 207

18
Routes to School grant programs are funding twelve comprehensive Safe Routes to School planning projects and education, encouragement, and enforcement related projects.
SANDAG staff also garnered feedback on the strategy through public presentations and forums, such as to the Regional Safe Routes to School Coalition (discussed in Chapter 4 of this plan) and various school-based meetings. School stakeholders and the general public also had the opportunity to review and provide comment on the draft version of the Strategic Plan available online on the SANDAG website (www.sandag.org/healthyworks) and distributed via email to key stakeholders and agencies.
CONTENTS OF THE STRATEGIC PLAN
After this introduction, the Strategic Plan is organized into the following chapters:
Chapter 2: Existing Issues and Opportunities discusses the role of Safe Routes to School in addressing certain transportation, built environment, air quality, and public health issues currently impacting the region.
Chapter 3: Existing Safe Routes to School Efforts describes the region’s existing Safe Routes to School resources and programs implemented at the local as well as regional level.
Chapter 4: Moving Forward – a Regional Safe Routes to School Strategy presents the draft regional strategy to support the creation and maintenance of Safe Routes to School efforts. It also proposes a process for implementing the strategy and updating the strategy to address future needs.
Attachment 5 :: San Diego Regional Safe Routes to School Strategic Plan 208

19
CHAPTER 2:
EXISTING ISSUES AND OPPORTUNITIES
This chapter of the Strategic Plan highlights opportunities for Safe Routes to School programs to impact several of the region’s significant and interrelated challenges including escalating childhood obesity rates, safety concerns, transportation costs, traffic congestion, and cleaner air. By promoting effective Safe Routes to School programs, this strategy can substantially affect all of these challenges, thus improving the overall quality of life in the San Diego region.
The chapter opens with walking and bicycling to school trends and an overview of the region’s school system.
SNAPSHOT OF THE REGION’S SCHOOL SYSTEM AND WALKING AND BIKING TRENDS
As of 2011, an estimated 21 percent of students walk to and/or from school, and 1 percent bike to and/or from school. In comparison, 2.7 percent of all daily trips are taken by walking, and 0.5 percent by bike. Single occupancy vehicle trips constitute 52.7 percent of all trips, 42.8 percent are high-occupancy vehicle trips, and the remaining 1.3 percent of trips are taken via transit. While the percentage of students taking active modes to school is
Photo Source: SANDAG
Attachment 5 :: San Diego Regional Safe Routes to School Strategic Plan 209
20
relatively significant, there is opportunity to grow these numbers through Safe Routes to School, particularly as the average distance between home and school in the region is 3.25 miles. Figure 2-1 shows the distribution of youths across the region.
The San Diego region’s public school system currently consists of 42 school districts and 761 schools serving 498,243 students. An additional 38,431 students attend the region’s 251 private elementary and secondary schools (California Department of Education, 2011). Figure 2-2 displays the schools and school district boundaries within the region. Of the 42 districts, 24 are elementary, six are high school, and 12 are unified districts, which consolidate primary and high school administration into a single district.
Attachment 5 :: San Diego Regional Safe Routes to School Strategic Plan 210

San Diego
Poway
Chula Vista
Carlsbad
Oceanside
Vista
Escondido
Santee
San Marcos
Encinitas
El Cajon
Coronado
LaMesa
National City
Imperial Beach
Lemon Grove
Solana Beach
Del Mar
2/13/2012 M e x i c oM e x i c o0 2 4 6 8Miles
Unincorporated County
Youths (5-17) per Acreby Census Block
0 - 1
2 - 3
4 - 6
7 - 10
20 - 30
Figure 2-1: Youth Population Density
Attachment 5 :: San Diego Regional Safe Routes to School Strategic Plan 211
fde
Text Box
21
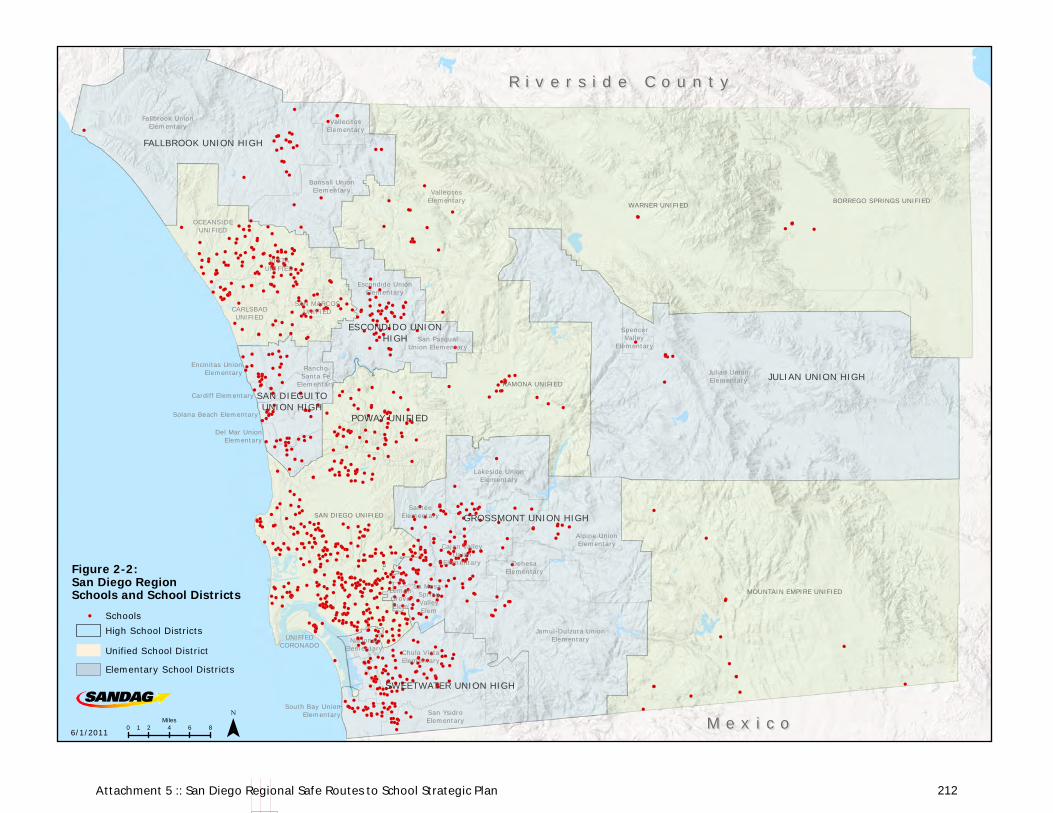
!( !(!( !(
!(
!( !( !( !(!(
!(
!(!( !(!(
!(
!(!(
!(!(
!(
!(
!(
!(!(!(!(
!(
!(
!(!(!( !(!( !( !(!(!( !( !(
!(
!(
!( !(!(
!(!( !(!( !(!(!(!(
!(
!(
!(
!(!( !( !(
!(
!(!(!(!(
!(!(!( !(
!(!(!( !(!( !(!( !(!( !( !(
!(!(
!(!(!(!(!( !(!(
!( !(!(!(
!(
!(
!( !( !(!( !( !( !(!( !(
!(!(
!(!(!( !(!( !(!( !(!( !( !(!(
!(
!( !(!(!(
!(
!(!(!(
!(
!(!( !(!(!( !( !(!(
!(
!(
!(
!(
!(
!(
!(!(!(
!(
!(!(!(!( !(
!(!(!(
!(
!(
!(
!(
!(
!(
!(
!(!(
!(!(
!( !( !( !( !( !(!(
!(!(!(!(
!(!( !(!(!(!( !(
!(!( !(!( !(!(!(
!(!( !(
!(!(!(!(!(!( !(!( !(!(
!(
!(!( !( !(!(
!(!(!(!(
!(!(!(
!(!(!( !(
!(
!(!( !( !(!(!(!( !(!(!( !(!(!( !( !(
!(!(!( !( !(!(
!(!( !(!(!(!( !(!(
!(!( !(!( !(!( !(
!(!( !(
!(
!( !(
!( !( !(
!(!( !(!( !(!( !(!( !( !(
!(!(
!(
!(
!(
!(!(
!(
!(
!(
!(
!(
!( !(!(!(!( !(!( !(!(!( !(
!( !( !(!(
!( !(!(!( !(!( !(
!(!(!( !(!(!(
!(
!(
!(!(!(!(
!(!( !(
!(!(
!(
!(
!(
!(
!(
!(!(!( !(!(
!( !(!(
!( !(!( !(!(!(
!(!(
!(!(!(
!(
!( !(!(!(!( !(!( !(!(!( !(!(!(!(
!(!( !(!( !(!(!( !(!(!( !(!( !(!(
!(!(!( !(!(!(
!( !(!(
!( !( !(!( !(!(!(!( !(!(!(!(!( !( !( !( !(!(
!(
!( !(!(!(!( !( !(!( !(!(!(
!(
!(
!(
!( !(!( !(!( !(!(
!(
!(
!(
!(
!(!( !(
!(!( !( !(!(
!( !(
!(
!(
!( !(!(!(!(!(
!(
!(
!(!( !(!( !( !(!(!(!(!(!(!(
!(!(!( !(
!(!(!( !(!( !(
!(
!( !(!(
!(!(
!(
!(!(!(!(!(!( !(
!(!( !(!(!( !( !(!( !(
!(!(
!(!(!(!(
!(!(!(!( !( !(!(!(!( !(!( !(!( !(!(!( !(!(!(!( !(!( !(!( !(
!(
!(
!(!(
!(
!(!(
!(!(
!(!( !(!( !(!( !( !(!(
!(
!( !(!(!(!( !(!(
!(!( !(!(
!(
!(!( !(!(!( !( !(!( !(!(!(
!(!(!(!(!(
!(!(!( !(
!(!( !(!(!(!( !(!(!(
!(!( !(!(!(!( !(
!(!( !(
!(
!(!(!(!( !(
!(
!( !(!(
!( !(
!(!( !(
!(!(
!(!(!(
!(
!(
!(
!(
!(
!(
!(
!(
!(!(
!(
!(
!( !( !(!( !( !( !(
!(
!(
!(
!(
!(
!(
!(
!(
!(
!(
!(!(
!(
!(
!(
!(!(!(
!(
!(
!(
!(
!(
!(
!(
!(
!(
!(
!(
!(
!(
!(
!(
!(
!(
!(
!(
!(!(
!(
!(
!(
!(
!(
!(
!(
!(
!(
!(
!(
!(
!(
!(
!(
!(
!(
!(
!(!(!(
!(!(!(
!(!(!(!(!(!(
!(!(
!(
!(
!(
!(
!(!(
!(
!(
!(
!(
!(
!(
!(
!(!(
!(
!(
!(
!(
!(
!(
!(!(
!(
!(
!(
!(
!(
!(
!(
!(!(!(
!(
!( !(
!(!(
!(
!(
!(!(!(!(
!(!(
!(
!(
!(!(!(
!(!(
!(!(
!(
!(!(
!(!(
!(
!(
!(
!(!(
!(
!(
!(
!(
!(
!(!(
!(!(!(!(
!(
!(
!(
!(
!(!( !( !(!(!(!(
!(!(
!(!(
!(!(
!(
!(
!(!(
!(!( !(
!(!(!(
!(!(!(!(!(
!(!(
!(!(
!(
!(!(
!( !(
!(!(
!(!(
!(!(
!(!(!(
!(
!(!(
!(
!(
!(!(!(
!(!(
!( !(!(
!( !(
!(
!(
!(
!(
!(
!(
!(
!(
!( !(
!(
!(
!(
!(
!(!(
!(!(
!(
!(!(
!( !(!(
!(
!(!(
!(
!(
!(
!(
!(!(
!(!(
!(
!(!(
!(
!(
!(!(
!(
!(
!(
!(
!(!(
!(
!(
!(
!(
!(
!(
!(
!(!(
!(
!(
!(
!(!(
!(
!(
!(
!(
!(
!(
!(
!(
!(
!(
!(
!(
!(
!(
!(
!(
!(
!(
!(
!(
!(
!(
!(
!(
!(
!(
!(
!(
!(
!(
!(
!(
!(
!(
!(
!(
!(
!(!(
!(
!(
!(
!(
!(
!(
!(
!(
!(
!(
!(
!(
!(
!(
!(
!(
!(
!(!(
!(
!(
!(
!(
!(
!(
!(
!(
!(!(!(
!(
!(
!(
!(!(
!(
!(!(!(
!(
!(
!(
!(
!(
!(!(
!(
!(
!(
!(
!(
!(
!(
!(
!(
!(
!(
!(
!(
!(
!(
!(
!(
!(
!(
!(
!(
!(
!(
!(
!(
!(
!(
!(
!(
!(
!(
!(
!(
!(
!(
M e x i c oM e x i c o
R i v e r s i d e C o u n t yR i v e r s i d e C o u n t y
Fallbrook UnionElementary
VallecitosElementary
Bonsall UnionElementary
FALLBROOK UNION HIGH
OCEANSIDEUNIFIED
VISTAUNIFIED
CARLSBADUNIFIED
SAN MARCOSUNIFIED
Encinitas UnionElementary
Cardiff Elementary
Del Mar UnionElementary
Solana Beach Elementary
RanchoSanta Fe
Elementary
SAN DIEGUITOUNION HIGH
VallecitosElementary
WARNER UNIFIEDBORREGO SPRINGS UNIFIED
ESCONDIDO UNIONHIGH
Escondido UnionElementary
San PasqualUnion Elementary
RAMONA UNIFIED
SpencerValley
Elementary
Julian UnionElementary JULIAN UNION HIGH
Lakeside UnionElementary
Alpine UnionElementary
DehesaElementary
Cajon ValleyUnion
Elementary
GROSSMONT UNION HIGH
Jamul-Dulzura UnionElementary
Chula VistaElementary
SWEETWATER UNION HIGH
San YsidroElementary
South Bay UnionElementary
NationalElementary
LemonGroveElem
SAN DIEGO UNIFIEDSantee
Elementary
POWAY UNIFIED
La Mesa-SpringValleyElem
Low Income
MOUNTAIN EMPIRE UNIFIED
¯0 2 4 6 81Miles
6/1/2011
UNIFIEDCORONADO
Figure 2-2:San Diego RegionSchools and School Districts
!( Schools
High School Districts
Unified School District
Elementary School Districts
Attachment 5 :: San Diego Regional Safe Routes to School Strategic Plan 212
fde
Text Box
22

23
Correspondingly, elementary school students comprise the greatest share of school enrollment. Figure 2-3 displays the portion of schools and student enrollment figures by school type within the region. As shown, elementary schools account for approximately 59 percent of the region’s schools and 47 percent of total student enrollment.
Figure 2-3: Percentage of Schools and Enrollment by Type
Source: Education Data Partnership, May 2011
The proportions of middle and high school students are both greater than their relative share of schools in the region. Specifically, 14 percent of the region’s schools are middle schools constituting 18 percent of enrollment and 13 percent of schools are high schools contributing 30 percent of total student enrollment in the region (Education Data Partnership, 2011).
PHYSICAL ACTIVITY AND HEALTH AMONG YOUTHS
Childhood and adolescent obesity rates have risen exponentially over the last few decades and currently persist at critical levels, with approximately 32 percent of United States youths ages two to 19 classified as overweight and 17 percent considered obese (Ogden et al., 2010). This trend is equally severe in the San Diego region, where more than one in four children are categorized as obese (California Department of Education, 2010). As with adults, lack of physical activity is a principal contributor to the childhood obesity epidemic and the associated health risks, including diabetes, high blood pressure, and heart disease.
Safe Routes to School programs provide opportunities to incorporate physical activity into children and adolescents daily lives; thus counteracting
Attachment 5 :: San Diego Regional Safe Routes to School Strategic Plan 213
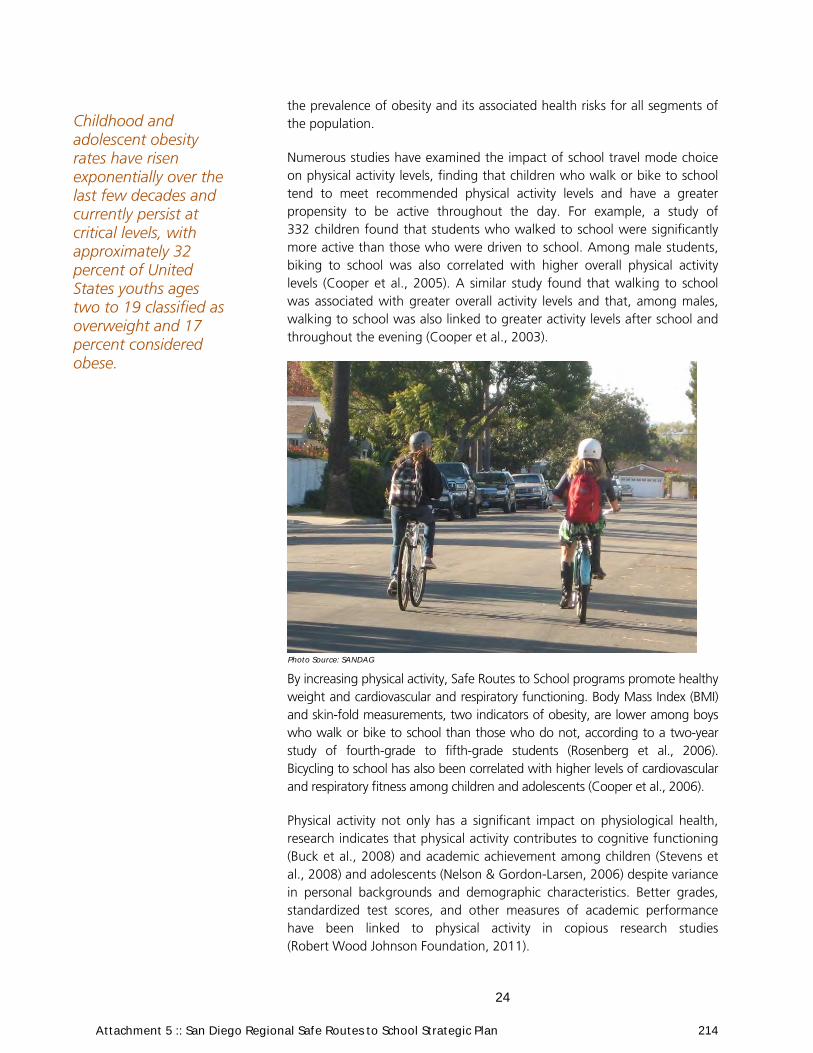
24
the prevalence of obesity and its associated health risks for all segments of the population.
Numerous studies have examined the impact of school travel mode choice on physical activity levels, finding that children who walk or bike to school tend to meet recommended physical activity levels and have a greater propensity to be active throughout the day. For example, a study of 332 children found that students who walked to school were significantly more active than those who were driven to school. Among male students, biking to school was also correlated with higher overall physical activity levels (Cooper et al., 2005). A similar study found that walking to school was associated with greater overall activity levels and that, among males, walking to school was also linked to greater activity levels after school and throughout the evening (Cooper et al., 2003).
By increasing physical activity, Safe Routes to School programs promote healthy weight and cardiovascular and respiratory functioning. Body Mass Index (BMI) and skin-fold measurements, two indicators of obesity, are lower among boys who walk or bike to school than those who do not, according to a two-year study of fourth-grade to fifth-grade students (Rosenberg et al., 2006). Bicycling to school has also been correlated with higher levels of cardiovascular and respiratory fitness among children and adolescents (Cooper et al., 2006).
Physical activity not only has a significant impact on physiological health, research indicates that physical activity contributes to cognitive functioning (Buck et al., 2008) and academic achievement among children (Stevens et al., 2008) and adolescents (Nelson & Gordon-Larsen, 2006) despite variance in personal backgrounds and demographic characteristics. Better grades, standardized test scores, and other measures of academic performance have been linked to physical activity in copious research studies (Robert Wood Johnson Foundation, 2011).
Childhood and adolescent obesity rates have risen exponentially over the last few decades and currently persist at critical levels, with approximately 32 percent of United States youths ages two to 19 classified as overweight and 17 percent considered obese.
Photo Source: SANDAG
Attachment 5 :: San Diego Regional Safe Routes to School Strategic Plan 214

25
In addition to these immediate health benefits, walking and biking to school can engender lasting behavior change – children who are consistently physically active as youths are more likely to become physically active adults (Telama et al., 2005).
The role of Safe Routes to School in increasing physical activity makes it a key school-based public health strategy that, in conjunction with physical education, nutrition, and wellness programs, can have a monumental impact on child and adolescent health.
TRAFFIC SAFETY AND PERSONAL SECURITY
Concerns for child safety are among the strongest impediments to children walking or biking to school, but for some, walking or bicycling to school is a necessity due to financial or other circumstances. In fact, walking or biking to school is more than twice as common among students from low-income households than students from higher-income households. Studies also show that low-income communities tend to report more infrastructure deficiencies within their communities compared to higher-income communities (McDonald, 2008). For these reasons, creating safe routes is one key mechanism to achieve social equity goals by providing safe opportunities to walk and bike regardless of a community’s socio-economic composition.
Traffic safety conditions vary substantially across the region, based on characteristics such as traffic volumes and speeds, roadway widths, intersection density, and presence of pedestrian and bicycle facilities. Figure 2-4 displays the percentage of roadways with sidewalks by census block group across the region. Figure 2-5 shows existing bicycle facilities in the region. Although facilities exist across the region, gaps are also present in some areas.
Frequent vehicle collisions involving pedestrians or bicyclists indicate that there are opportunities to improve safe walking or biking. Figures 2-6 and 2-7 show average pedestrian crash rates and bicycle crash rates by census block group over a ten-year period normalized by day time population.
Improving safety conditions is a central goal of Safe Routes to School programs, which can be accomplished through improvements to the built environment, educating students, engaging community members, enforcing traffic laws, and instituting programs designed to address personal security concerns.
…creating safe routes is one key mechanism to achieve social equity goals by providing safe opportunities to walk and bike regardless of a community’s socio-economic composition.
Attachment 5 :: San Diego Regional Safe Routes to School Strategic Plan 215
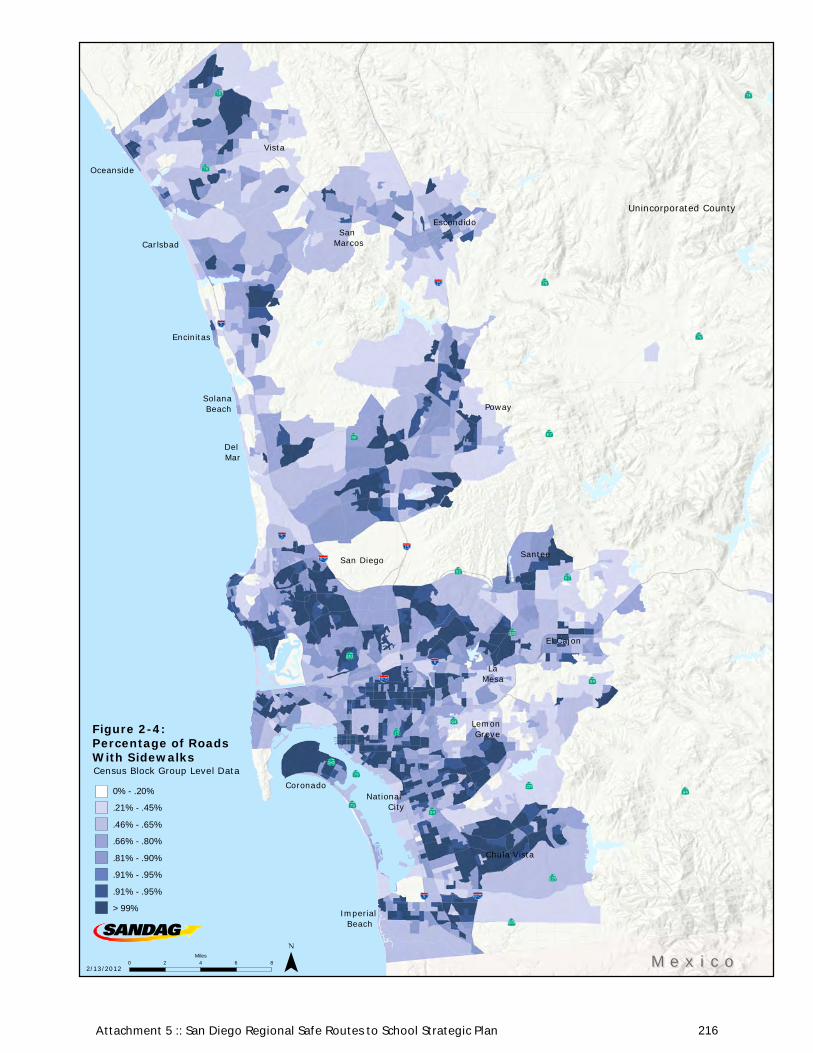
San Diego
Poway
Chula Vista
Carlsbad
Oceanside
Vista
Escondido
Santee
San Marcos
Encinitas
El Cajon
Coronado
LaMesa
National City
Imperial Beach
Lemon Grove
Solana Beach
Del Mar
2/13/2012 M e x i c oM e x i c o0 2 4 6 8Miles
Unincorporated County
Census Block Group Level Data
0% - .20%
.21% - .45%
.46% - .65%
.66% - .80%
.81% - .90%
.91% - .95%
.91% - .95%
> 99%
Figure 2-4: Percentage of RoadsWith Sidewalks
Attachment 5 :: San Diego Regional Safe Routes to School Strategic Plan 216
fde
Text Box
26

San Diego
Poway
Chula Vista
Carlsbad
Oceanside
Vista
Escondido
Santee
San Marcos
Encinitas
El Cajon
Coronado
LaMesa
National City
Imperial Beach
Lemon Grove
Solana Beach
Del Mar
2/13/2012 M e x i c oM e x i c o0 2 4 6 8Miles
Unincorporated County
Bikeways of the San Diego Region.
Bike Path
Bike Lane
Bike Route
Figure 2-5: Existing Bike Facilities
Attachment 5 :: San Diego Regional Safe Routes to School Strategic Plan 217
fde
Text Box
27
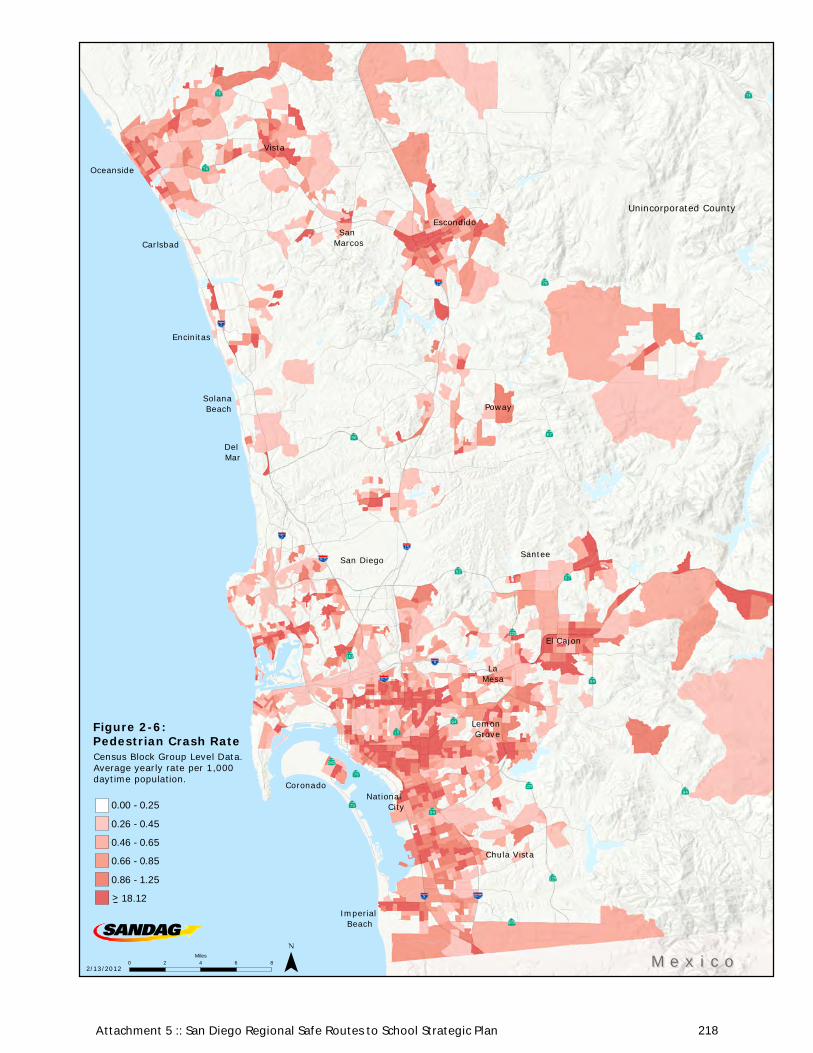
San Diego
Poway
Chula Vista
Carlsbad
Oceanside
Vista
Escondido
Santee
San Marcos
Encinitas
El Cajon
Coronado
LaMesa
National City
Imperial Beach
Lemon Grove
Solana Beach
Del Mar
2/13/2012 M e x i c oM e x i c o0 2 4 6 8Miles
Unincorporated County
Census Block Group Level Data. Average yearly rate per 1,000daytime population.
0.00 - 0.25
0.26 - 0.45
0.46 - 0.65
0.66 - 0.85
0.86 - 1.25
18.12>
Figure 2-6: Pedestrian Crash Rate
Attachment 5 :: San Diego Regional Safe Routes to School Strategic Plan 218
fde
Text Box
28

San Diego
Poway
Chula Vista
Carlsbad
Oceanside
Vista
Escondido
Santee
San Marcos
Encinitas
El Cajon
Coronado
LaMesa
National City
Imperial Beach
Lemon Grove
Solana Beach
Del Mar
2/13/2012 M e x i c oM e x i c o0 2 4 6 8Miles
Unincorporated County
Census Block Group Level Data. Average yearly rate per 1,000daytime population.
0.00 - 0.25
0.26 - 0.45
0.46 - 0.65
0.66 - 0.85
0.86 - 1.25
10.07>
Figure 2-7: Bike Crash Rate
Attachment 5 :: San Diego Regional Safe Routes to School Strategic Plan 219
fde
Text Box
29

30
Studies focused on assessing the impacts of the California-legislated program demonstrate that Safe Routes to School infrastructure improvements can be effective tools for improving safety and increasing the proportion of students walking and biking to school. Traffic signal enhancements and sidewalk gap closures, especially, have been shown to influence safety and mode choice. (Boarnet et al., 2005a; Boarnet et al., 2005b). In addition to addressing school travel issues, investing in safety improvements and traffic calming measures benefits the broader community particularly in urban areas where school and population density is higher (Watson & Dannenberg, 2008).
Photo Source: SANDAG
Attachment 5 :: San Diego Regional Safe Routes to School Strategic Plan 220

31
Schools in the San Diego region that have participated in the National Center for Safe Routes to School evaluation program show that, combined, traffic safety and infrastructure deficiencies are by far the most significant barriers to parents allowing their children to walk and bike to school. In addition to physical barriers, forty percent of parents surveyed also indicate that fear of violence or crime influences their decisions regarding active transportation to school. This was the strongest individual factor among the approximately forty schools from five jurisdictions that participated in the program by January 2011 (NCSRTS, December 2010). Although this only reflects parents’ attitudes from a small subset of the population, it illustrates that in many communities personal security is a significant determinant of school travel behavior.
Several Safe Routes to School strategies are designed to address personal security concerns by engaging parents, school officials, and community members in supervising students as they walk or bike to school and by training children how to respond to potentially dangerous encounters on the trip to school. Walking schools buses, for example, have proven effective in urban, socio-economically disadvantaged neighborhoods where concern with criminal activity can be paramount (Mendoza, et al., 2009).
Photo Source: City of National City
Attachment 5 :: San Diego Regional Safe Routes to School Strategic Plan 221

32
TRANSPORTATION COSTS
Congestion in school zones degrades air quality and can be a significant community-level transportation issue that is further exacerbated by changes in San Diego school districts’ transportation policies. Over the last several years, the cost of busing, coupled with budgetary constraints, have caused several districts to reduce, eliminate, or institute a fee-based system for school-busing services.
By 2009, at least three of the region’s school districts had eliminated regular school-to-home transportation and 12 charged a fee for student busing although fee policies typically exclude students enrolled in special education programs or whose household income qualifies them as low-income or certified to receive free or reduced lunch. In June 2011 the San Diego Unified School District Board of Education, overseeing the largest district in the region, approved a plan to eliminate all non-mandatory bus services. This action will eliminate bus service for approximately 6,000 students and is projected to produce substantial overcapacity at 11 schools resulting in a need of $56 million in capital improvements to accommodate a surge of students returning to their neighborhood schools (San Diego Unified School District, June 7, 2011).
Photo Source: SANDAG
Attachment 5 :: San Diego Regional Safe Routes to School Strategic Plan 222

33
The cost to schools and individual families due to busing reductions can be mitigated, in part, by expanding transportation options including carpooling, walking, biking, and taking other active modes to school.
COMPLETE STREETS AND SMART GROWTH
Safe Routes to School programs support the vision established in the Regional Comprehensive Plan and Draft 2050 Regional Transportation Plan of more sustainable, compact, well-designed communities interconnected by a transportation system that expands travel choices and reduces greenhouse gas emissions. Safe Routes to School programs help achieve this vision by reducing peak period vehicle trips and making active transportation to school more viable and attractive options. Addressing school safety and accessibility improves the overall walkability of affected neighborhoods.
Some of the region’s most exemplary ‘complete streets’ are a result of Safe Routes to School infrastructure projects, exhibiting a mix of traffic calming measures, road diet, pedestrian and bicycle facilities, and amenities. The County of San Diego and cities of National City, Chula Vista, Lemon Grove, San Diego, and Encinitas have all completed Safe Routes to School projects featuring traffic calming elements. For example, the City of Encinitas used a federal Safe Routes to School grant to fund first phase implementation of a neighborhood traffic calming project surrounding Cardiff Elementary School, and the City of National City received a state grant to improve access to Central Elementary School with a road diet, traffic calming, and amenities along East 8th Street. In San Diego, the City Heights neighborhood Urban Village is a mixed-use public space that provides recreational and educational opportunities to adults and youths including enhanced pedestrian access to Rosa Parks Elementary School.
Some of the region’s most exemplary ‘complete streets’ are a result of Safe Routes to School infrastructure projects, exhibiting a mix of traffic calming measures, road diet, pedestrian and bicycle facilities, and amenities.
Photo Source: SANDAG
Attachment 5 :: San Diego Regional Safe Routes to School Strategic Plan 223
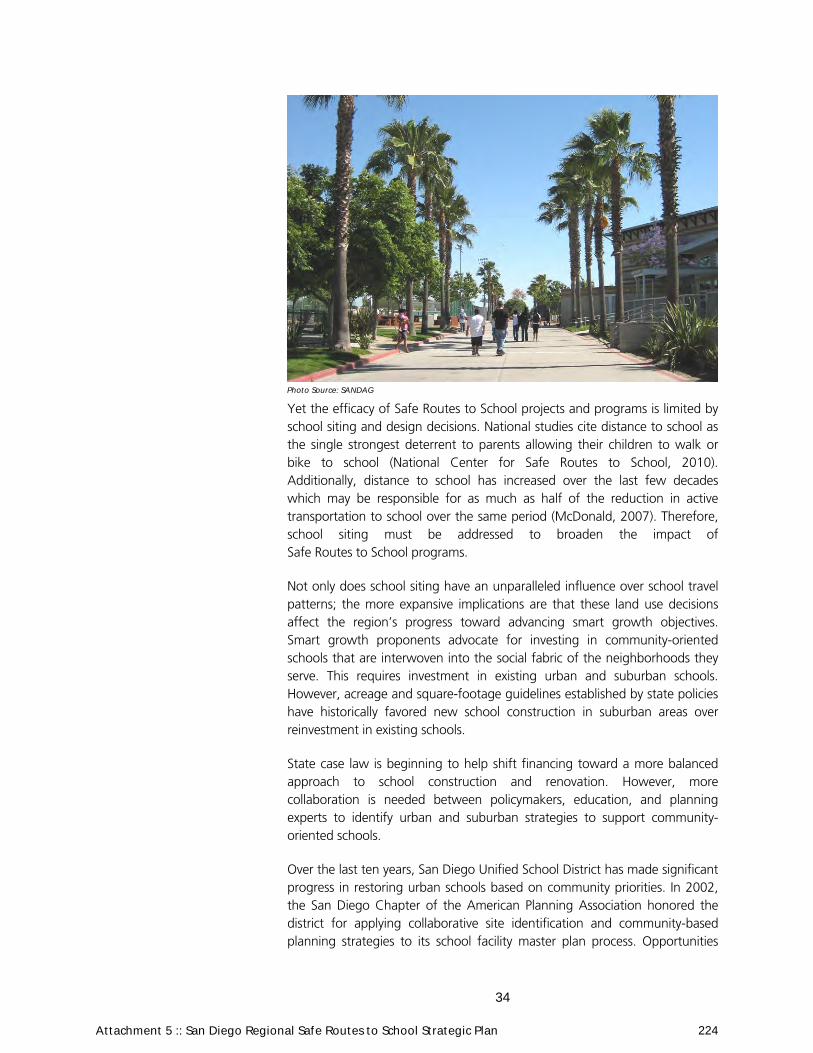
34
Yet the efficacy of Safe Routes to School projects and programs is limited by school siting and design decisions. National studies cite distance to school as the single strongest deterrent to parents allowing their children to walk or bike to school (National Center for Safe Routes to School, 2010). Additionally, distance to school has increased over the last few decades which may be responsible for as much as half of the reduction in active transportation to school over the same period (McDonald, 2007). Therefore, school siting must be addressed to broaden the impact of Safe Routes to School programs.
Not only does school siting have an unparalleled influence over school travel patterns; the more expansive implications are that these land use decisions affect the region’s progress toward advancing smart growth objectives. Smart growth proponents advocate for investing in community-oriented schools that are interwoven into the social fabric of the neighborhoods they serve. This requires investment in existing urban and suburban schools. However, acreage and square-footage guidelines established by state policies have historically favored new school construction in suburban areas over reinvestment in existing schools.
State case law is beginning to help shift financing toward a more balanced approach to school construction and renovation. However, more collaboration is needed between policymakers, education, and planning experts to identify urban and suburban strategies to support community-oriented schools.
Over the last ten years, San Diego Unified School District has made significant progress in restoring urban schools based on community priorities. In 2002, the San Diego Chapter of the American Planning Association honored the district for applying collaborative site identification and community-based planning strategies to its school facility master plan process. Opportunities
Photo Source: SANDAG
Attachment 5 :: San Diego Regional Safe Routes to School Strategic Plan 224

35
exist to strengthen the relationship between Safe Routes to School, school siting, and the advancement of smart growth goals.
TRANSPORTATION DEMAND MANAGEMENT, AIR QUALITY, AND GREENHOUSE GAS EMISSIONS
Safe Routes to School programs are mechanisms for reducing private vehicle trips and traffic congestion which improves traffic safety and air quality in school zones, and has a measurable impact on human-generated greenhouse gas (GHG) emissions. These programs can also help counteract the adverse effect on air quality experienced in communities that are already overburdened by pollution.
For this reason, planning and transportation agencies across the U.S. utilize Safe Routes to School as TDM measures. In 2009, the San Francisco Bay Area Metropolitan Transportation Commission (MTC) invested $80 million over three years toward its Climate Initiatives Program, which includes $17 million allocated toward emission-reducing Safe Routes to School programs.
Marin County’s nationally-recognized Safe Routes to School initiative has proven effective at shifting school travel modes from single-student vehicle trips to alternative modes. During the 2007/2008 school year, 90 percent of students living within a half-mile of school walked or bicycled to school. The Transportation Authority of Marin (TAM) attributes the program with more than 15 percent mode shift since its inception (TAM, 2009). This is significant in Marin County where school-related trips constitute 21 percent of morning peak period trips compared to 11 percent in most U.S. geographic areas (U.S. Department of Transportation, 2007).
In the San Diego region, 41 percent of the region’s GHG emissions derive from light-duty truck and passenger car trips. Much of these emissions occur during the morning and afternoon commute hours – approximately 50 percent of daily travel occurs during the morning and afternoon peak-periods. School trips contribute over eight percent of peak-period traffic congestion. These figures are likely underestimations because the data does not distinguish between work commute trips and combined work and school commute trips. Combination trips are generally captured as work commute whereas school-only trips are reflected as school commutes. Thus, there is also no measure of additional miles traveled resulting from these extended trips.
Shifting a greater percentage of these school-related trips to walking and biking trips would contribute to meeting our region’s GHG reduction goals. The SCS developed in conjunction with the 2050 RTP includes implementation of this Safe Routes to School Strategy as one measure to help reduce future GHG emissions from private vehicles and light trucks. Specifically, implementing this Safe Routes to School strategy is anticipated to increase school walk and bike trips by 10 percent in 2020 and 20 percent by 2035, resulting in tens-of-thousands fewer pounds of GHG.
Attachment 5 :: San Diego Regional Safe Routes to School Strategic Plan 225

36
THIS PAGE INTENTIONALLY LEFT BLANK
Attachment 5 :: San Diego Regional Safe Routes to School Strategic Plan 226

37
CHAPTER 3:
EXISTING SAFE ROUTES TO SCHOOL EFFORTS
The potential benefits described in Chapter 2 are already evident in many communities throughout the region who participate in Safe Routes to School activities. This chapter of the Strategic Plan provides an overview of the region’s existing Safe Routes to School efforts underway, including individual programs as well as regionally-available resources.
FEDERAL AND STATE GRANT FUNDED PROGRAMS
Through the collaborative efforts of city officials, schools, school districts, community-based organizations, parent organizations, and parents, at least a quarter of the region’s schools engage in Safe Routes to School activities or benefit from Safe Routes to School infrastructure improvements funded by the federal or state-legislated grant programs.
Although not inclusive of all of the region’s existing Safe Routes to School efforts, as primary sources of funding for Safe Routes to School programs,
Photo Source: SANDAG
Attachment 5 :: San Diego Regional Safe Routes to School Strategic Plan 227
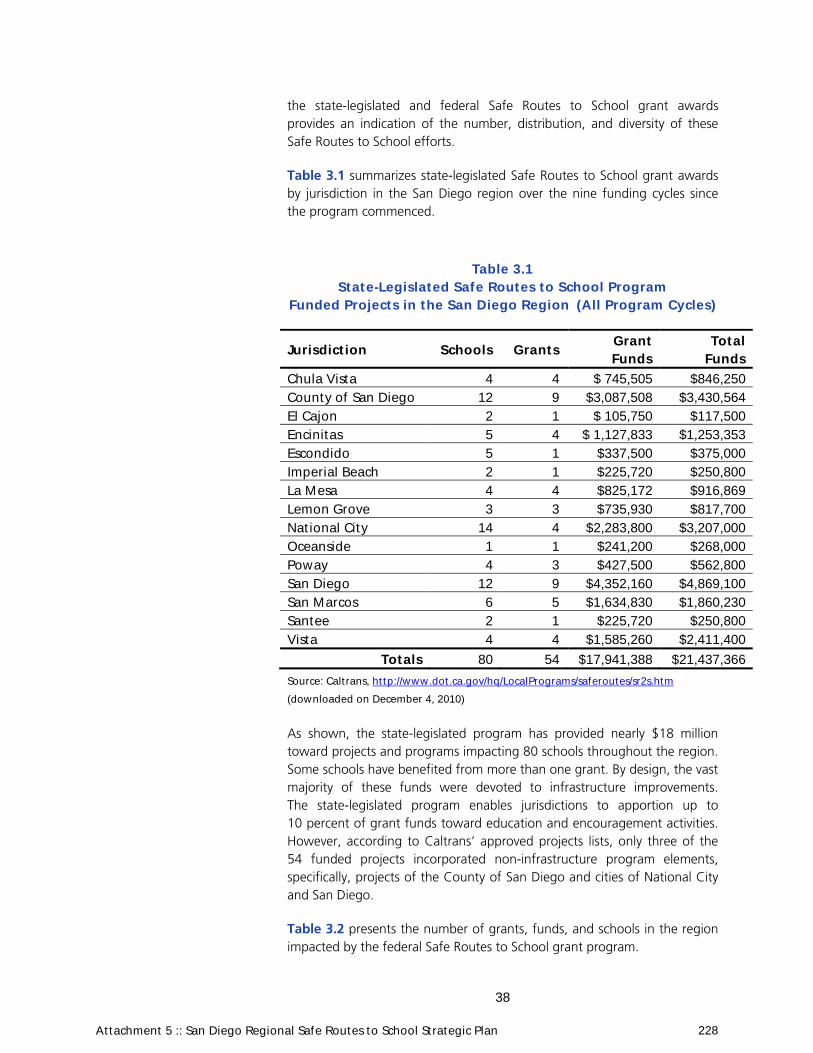
38
the state-legislated and federal Safe Routes to School grant awards provides an indication of the number, distribution, and diversity of these Safe Routes to School efforts.
Table 3.1 summarizes state-legislated Safe Routes to School grant awards by jurisdiction in the San Diego region over the nine funding cycles since the program commenced.
Table 3.1 State-Legislated Safe Routes to School Program
Funded Projects in the San Diego Region (All Program Cycles)
Jurisdiction Schools GrantsGrant Funds
Total Funds
Chula Vista 4 4 $ 745,505 $846,250County of San Diego 12 9 $3,087,508 $3,430,564El Cajon 2 1 $ 105,750 $117,500Encinitas 5 4 $ 1,127,833 $1,253,353Escondido 5 1 $337,500 $375,000Imperial Beach 2 1 $225,720 $250,800La Mesa 4 4 $825,172 $916,869Lemon Grove 3 3 $735,930 $817,700National City 14 4 $2,283,800 $3,207,000Oceanside 1 1 $241,200 $268,000Poway 4 3 $427,500 $562,800San Diego 12 9 $4,352,160 $4,869,100San Marcos 6 5 $1,634,830 $1,860,230Santee 2 1 $225,720 $250,800Vista 4 4 $1,585,260 $2,411,400
Totals 80 54 $17,941,388 $21,437,366
Source: Caltrans, http://www.dot.ca.gov/hq/LocalPrograms/saferoutes/sr2s.htm
(downloaded on December 4, 2010)
As shown, the state-legislated program has provided nearly $18 million toward projects and programs impacting 80 schools throughout the region. Some schools have benefited from more than one grant. By design, the vast majority of these funds were devoted to infrastructure improvements. The state-legislated program enables jurisdictions to apportion up to 10 percent of grant funds toward education and encouragement activities. However, according to Caltrans’ approved projects lists, only three of the 54 funded projects incorporated non-infrastructure program elements, specifically, projects of the County of San Diego and cities of National City and San Diego.
Table 3.2 presents the number of grants, funds, and schools in the region impacted by the federal Safe Routes to School grant program.
Attachment 5 :: San Diego Regional Safe Routes to School Strategic Plan 228

39
Table 3.2 Federal Safe Routes to School Program
Funded Projects in the San Diego Region (Program Cycles 1 & 2)
Agency Schools Grants Grant FundsChula Vista 2 1 $621,115Chula Vista Elementary School District
17 1 $499,025
Encinitas 1 1 $651,390La Mesa 9 2 $975,390Lemon Grove 2 1 $743,510National City 1 1 $730,000Oceanside 2 1 $63,320Rady Children’s Hospital Center for Healthier Communities
27 1 $499,816
San Diego County 1 1 $517,000San Marcos 14 2 $1,034,000Santee 1 1 $228,800
Totals 77 13 $6,563,366
Source: Caltrans, http://www.dot.ca.gov/hq/LocalPrograms/saferoutes/sr2s.htm
(downloaded on December 4, 2010)
Over the first two federal program cycles, 13 grants with a combined total of about $6.6 million have been awarded to cities, school districts, and non-profit organizations. Ten of the 13 grants were infrastructure based and three were provided to support non-infrastructure programs conducted by the Chula Vista Elementary School District, Rady Children’s Hospital Center for Healthier Communities, and City of La Mesa.
Some of the non-infrastructure funded programs include coordinating Walk to School Day events, parent safety patrols, taskforces, incentive programs, outreach campaigns, and traffic safety courses.
To help reduce the disparity between the numbers of infrastructure and non-infrastructure funded projects (an imbalance that is not exclusive to the San Diego region), Caltrans sets funding distribution goals. The federal Call for Projects released on April 15, 2011 aimed to allocate 70 percent of available funds to infrastructure projects and 30 percent to support education, encouragement and enforcement activities.
The majority of federal and state Safe Routes to School infrastructure projects involve sidewalk and curb ramp installation. Traffic controls and crossing improvements such as enhanced crosswalks, in-pavement lighted crosswalks, flashing beacons, pavement markings, and signage, are also common construction types. Additionally, several jurisdictions have used
Attachment 5 :: San Diego Regional Safe Routes to School Strategic Plan 229

40
funds for traffic calming measures including curb extensions, bulb-outs, raised pedestrian refuges, and speed humps. Fewer projects involve bicycle facilities.
Figure 3-1 displays the geographic distribution of schools impacted by the federal and state-legislated Safe Routes to School grant awards in the San Diego region. As shown, several jurisdictions have implemented Safe Routes to School projects. While the majority of funds have been used to support capital projects, the three non-infrastructure grants have benefited about 50 schools because programmatic activities are relatively inexpensive compared to infrastructure improvements. Federally-funded non-infrastructure programs are concentrated in the southwestern portion of the region, in southeastern San Diego, La Mesa, and Chula Vista.
In addition to those already impacting the region, eleven new Safe Routes to School grants are anticipated through the federal 2011/2012 program cycle. On October 17, 2011, Caltrans announced the list of projects approved for Cycle 3 grants, which will contribute an additional $5.4 million in federal Safe Routes to School funds to the San Diego region, including $1.9 million to support non-infrastructure projects. Cycle 3 grant recipients include the cities of San Diego, Santee, El Cajon, Encinitas, La Mesa, Lemon Grove, National City, San Marcos, and County of San Diego.
Photo Source: City of National City
Attachment 5 :: San Diego Regional Safe Routes to School Strategic Plan 230

!(!(!(!(
!(
!(!(!(
!(
!(!(
!(
!(
!(!( !(
!(!(
!(!(
!(!( !(!(
!(!( !(!(!(
!(
!(
!(
!(
!(!(!(!(
!(
!(!(!(!( !(
!(!( !(
!(
!(
!(!(
!(
!(
!(!(!(
!(!(!(
!(!(
!(!(!(!(!( !(!(
!(
!(
!(!(!(
!(
!(
!(
!(
!(
!(
!(
!(!(!(!(
!(!(
!(
!(
!( !(!(
!(!H
!(
!(
!(
!(!(!(
!( !(!(
!(!(!(
!(!(!(
!(
!(
!(!(!( !(
!(!(!(!(!(
!(
!(
!(
!(
!(!(
!(
!(!(!(!(!( !( !(
!(
!(
!( !(
!(
!(!(
!(
!(
!H!(
!(!(!H
!(
!(
!(
WXZ5
ÃÅ54
ÃÅ94
WXZ8ÃÅ163
WXZ5
WXZ5
WXZ15
[\̂805
ÃÅ15
ÃÅ67
WXZ5
[\̂805
ÃÅ52
ÃÅ78
[\̂805
WXZ15
ÃÅ905
ÃÅ125
ÃÅ125
ÃÅ56
ÃÅ54
ÃÅ75
ÃÅ94
ÃÅ76ÃÅ76
ÃÅ78
ÃÅ78
ÃÅ67
ÃÅ125
ÃÅ282
San Diego
Poway
Chula Vista
Carlsbad
Oceanside
Vista
Escondido
Santee
San Marcos
Encinitas
El Cajon
Coronado
LaMesa
National City
Imperial Beach
Lemon Grove
Solana Beach
Del Mar
8/10/2011 ¯ M e x i c oM e x i c o0 2 4 6 8
Miles
Unincorporated County
State Grant Target Schools
1 Grant!(
2 Grants
3 Grants
4 Grants!(!(
!(
Federal Grant Target Schools
Infrastructure and Non-Infrastructure Grant
Infrastructure Grant
!H
!(
Non-Infrastructure Grant!(
Figure 3-1: Schools Impacted bySafe Routes to School Grants
Attachment 5 :: San Diego Regional Safe Routes to School Strategic Plan 231
fde
Text Box
41

42
SUPPORTIVE LOCAL AND SCHOOL DISTRICT POLICIES
Most local jurisdictions in the region have a current bicycle master plan and several have a pedestrian master plan, or similar document, that includes a discussion of Safe Routes to School as a key element to improving pedestrian and bicycle mobility. Fewer school districts have adopted complementary policies. Of the region’s 42 school districts, the following eight have adopted Safe Routes to School-supportive policies:
Alpine Union School District
Encinitas Union School District
Escondido Union School District
Escondido Union High School District
Grossmont Union High School District
La Mesa – Spring Valley School District
San Pasqual Union School District
Solana Beach School District
School boards can play a vital role in encouraging active transportation to school by establishing policies that promote programs and encourage coordination with local city departments to implement Safe Routes to School projects. Policy development can also be key to assessing and minimizing liability risks. Concern over liability is a common barrier to instituting Safe Routes to School programs. Some local jurisdictions are addressing these issues by developing Safe Routes to School plans that identify need and establish policies, programs, and procedures to implement Safe Routes to School.
PUBLIC HEALTH PARTNERSHIPS
The public health field plays an integral role in advancing Safe Routes to School programs both state-wide and within the region.
California Department of Public Health
To complement the support provided by the state grant program, the California Safe Routes to School Technical Assistance Resource Center (TARC) assists local communities in coordinating non-infrastructure Safe Routes to School programs. TARC is a project of California Active Communities, which is a joint program of the University of California, San Francisco, Institute for Health and Aging and the California Department of Public Health. TARC is funded by Caltrans to support non-infrastructure
School boards can play a vital role in encouraging active transportation to school by establishing policies that promote programs and encourage coordination with local city departments to implement Safe Routes to School projects.
Attachment 5 :: San Diego Regional Safe Routes to School Strategic Plan 232
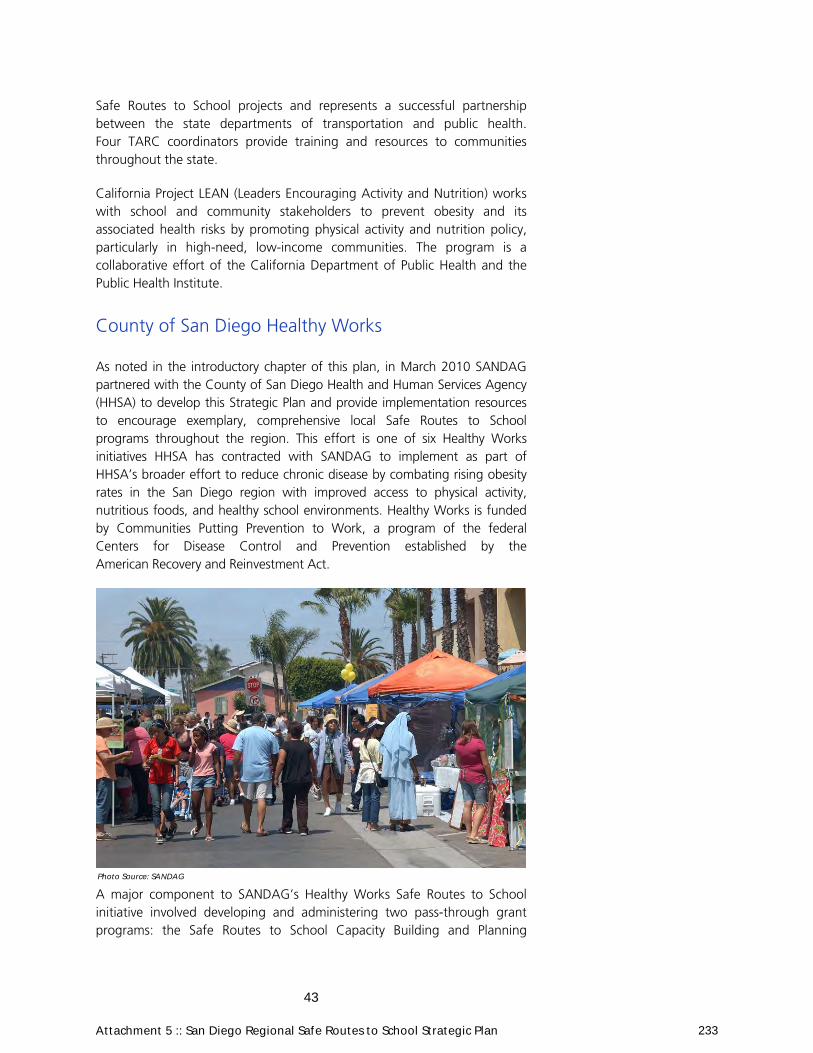
43
Safe Routes to School projects and represents a successful partnership between the state departments of transportation and public health. Four TARC coordinators provide training and resources to communities throughout the state.
California Project LEAN (Leaders Encouraging Activity and Nutrition) works with school and community stakeholders to prevent obesity and its associated health risks by promoting physical activity and nutrition policy, particularly in high-need, low-income communities. The program is a collaborative effort of the California Department of Public Health and the Public Health Institute.
County of San Diego Healthy Works
As noted in the introductory chapter of this plan, in March 2010 SANDAG partnered with the County of San Diego Health and Human Services Agency (HHSA) to develop this Strategic Plan and provide implementation resources to encourage exemplary, comprehensive local Safe Routes to School programs throughout the region. This effort is one of six Healthy Works initiatives HHSA has contracted with SANDAG to implement as part of HHSA’s broader effort to reduce chronic disease by combating rising obesity rates in the San Diego region with improved access to physical activity, nutritious foods, and healthy school environments. Healthy Works is funded by Communities Putting Prevention to Work, a program of the federal Centers for Disease Control and Prevention established by the American Recovery and Reinvestment Act.
A major component to SANDAG’s Healthy Works Safe Routes to School initiative involved developing and administering two pass-through grant programs: the Safe Routes to School Capacity Building and Planning
Photo Source: SANDAG
Attachment 5 :: San Diego Regional Safe Routes to School Strategic Plan 233

44
Photo Source: SANDAG
Grant Program, and Safe Routes to School Education, Encouragement, and Enforcement Grant Program.
Twelve cities, non-profit organizations, and school districts were awarded grants totaling about $340,000. Approximately $280,000 was provided to develop comprehensive Safe Routes to School plans that include existing conditions analysis; identification of infrastructure needs and non-infrastructure program strategies; and define an ongoing monitoring and evaluation strategy. These plans are intended to serve as a blueprint for future Safe Routes to School investments and make jurisdictions more competitive for state and federal funding. In addition to planning grants, about $60,000 was awarded to advance education, encouragement, and enforcement activities, such as bicycle rodeos, a speed reduction campaign, pedestrian safety courses, and student encouragement competitions.
Figure 3-2 displays schools impacted by the Healthy Works grant programs. As demonstrated, the Healthy Works program was most commonly utilized in jurisdictions where Safe Routes to School initiatives already exist. In some cases, the Healthy Works funds are contributing to expanding Safe Routes to School into schools not currently participating, such as in Chula Vista. In other jurisdictions, funds are being used to incorporate other program components, such as the City of National City pursuing education and encouragement activities to support their existing capital investments.
Attachment 5 :: San Diego Regional Safe Routes to School Strategic Plan 234
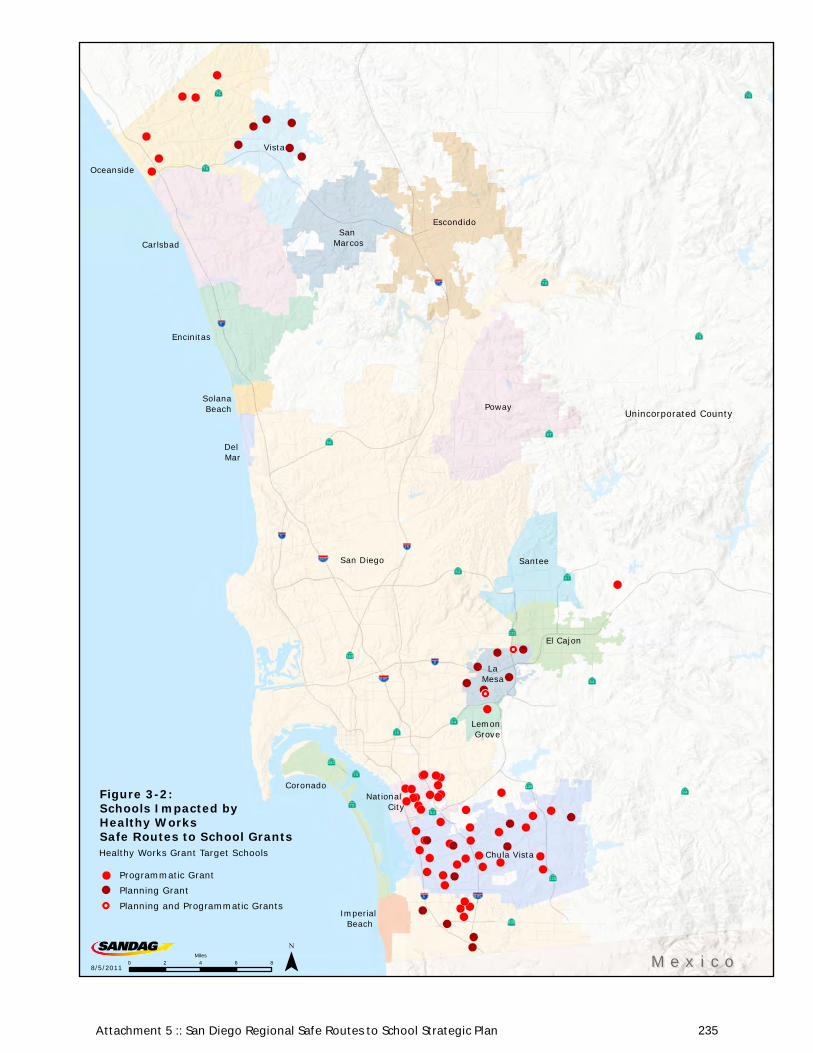
!(!( !(!( !(
!(
!(!(!(
!(!( !(
!H!(!(
!(!(
!(
!(
!(!(
!( !(
!(
!(!( !(!(
!(!(
!(
!(!(
!(
!(!(!(
!(
!(
!(
!(!( !(
!(!(!(
!(!H
!(!(!(!(!( !( !(!( !(!(!(
!(
!( !(!( !(
!(!(!(
!(
!(
!(
!(
!(
!(
!(
!(
WXZ5
ÃÅ54
ÃÅ94
WXZ8ÃÅ163
WXZ5
WXZ5
WXZ15
[\̂805
ÃÅ15
ÃÅ75
ÃÅ67
WXZ5
[\̂805
ÃÅ52
ÃÅ78
[\̂805
WXZ15
ÃÅ905
ÃÅ125
ÃÅ125
ÃÅ56
ÃÅ54
ÃÅ75
ÃÅ94
ÃÅ76ÃÅ76
ÃÅ78
ÃÅ78
ÃÅ67
ÃÅ125
ÃÅ282
San Diego
Poway
Chula Vista
Carlsbad
Oceanside
Vista
Escondido
Santee
San Marcos
Encinitas
El Cajon
Coronado
LaMesa
National City
Imperial Beach
Lemon Grove
Solana Beach
Del Mar
8/5/2011 ¯ M e x i c oM e x i c o0 2 4 6 8Miles
Unincorporated County
Healthy Works Grant Target Schools
Programmatic Grant
Planning Grant
Planning and Programmatic Grants!H
!(
!(
Figure 3-2: Schools Impacted byHealthy Works Safe Routes to School Grants
Attachment 5 :: San Diego Regional Safe Routes to School Strategic Plan 235
fde
Text Box
45

46
Table 3.3 lists the Healthy Works project titles, lead agency, and project partners.
Table 3.3 SANDAG Healthy Works Grant Projects
Project Title Lead Agency Project Partners
La Mesa Kids Walk & Roll to School Safe Routes Program Planning Project
City of La Mesa La Mesa-Spring Valley School District, Boys and Girls Club of East County,
WalkSanDiego
San Ysidro Walks and Wheels to School WalkSanDiego San Ysidro School District
South San Diego: Let's Move Together WalkSanDiego South Bay Union School District
Students Taking Active Routes to School (STARTS) Program
City of Chula Vista
Sweetwater Union High School District, San Diego County Bicycle Coalition, Chula Vista Community
Collaborative
Vista Safe Routes to School Strategic Plan City of Vista Vista Unified School District
Golden Avenue Elementary Safe Routes to School (GAE-SRTS)
Lemon Grove Elementary School
District
San Diego County Sheriff’s Department, District Health and
Wellness Council, WalkSanDiego, Parent Teacher Association of Golden
Avenue Elementary
La Mesa and Parkway Middle School Student Engagement Initiative
City of La Mesa WalkSanDiego
Lakeside Gets Moving WalkSanDiego Lakeview Elementary School, Lakeside
Union School District
National City Safe Routes to School Education and Encouragement Initiative
City of National City
National School District, Sweetwater Union High School District, South Bay
Community Services, National City Collaborative Family Resource Center
Neighborhood Pace Car Program- Safe Routes to School
Chula Vista Elementary School
District
Chula Vista Community Collaborative, WalkSanDiego
Oceanside Bicycle Rodeo Program City of Oceanside Oceanside Unified School District, Oceanside Bicycle Committee, San
Diego County Bicycle Coalition
Walk This Way: Pedestrian Training for Elementary School Students
WalkSanDiego
Attachment 5 :: San Diego Regional Safe Routes to School Strategic Plan 236
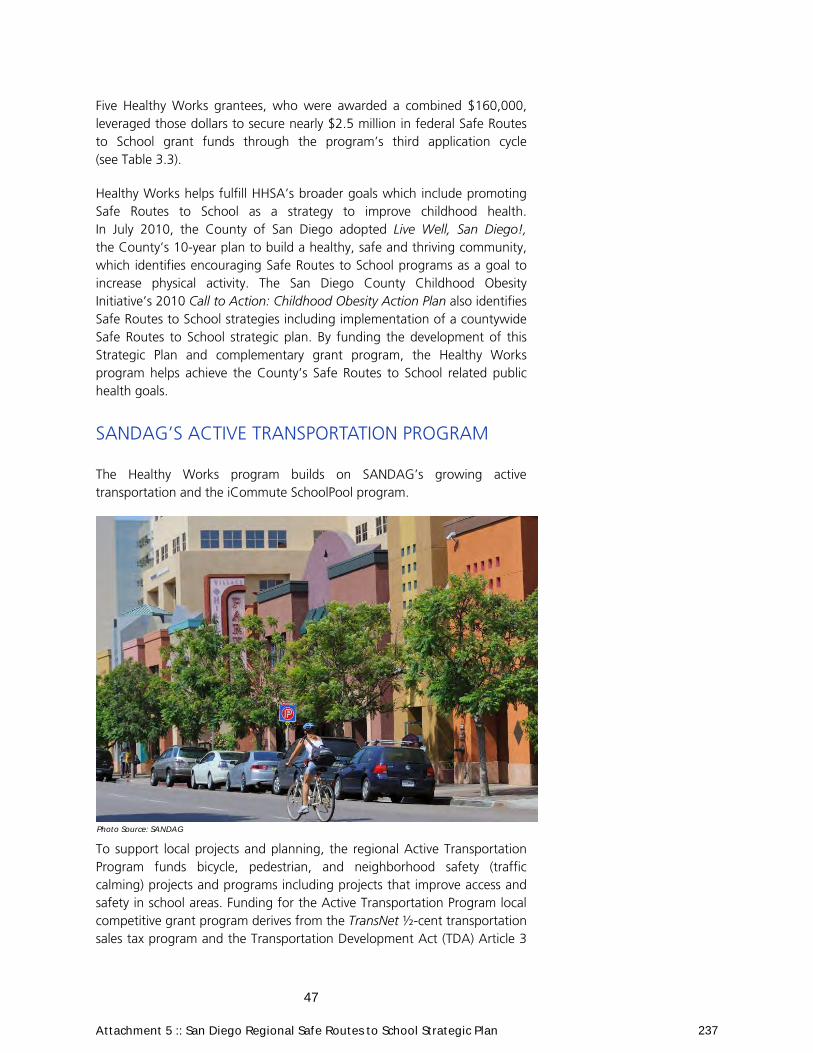
47
Five Healthy Works grantees, who were awarded a combined $160,000, leveraged those dollars to secure nearly $2.5 million in federal Safe Routes to School grant funds through the program’s third application cycle (see Table 3.3).
Healthy Works helps fulfill HHSA’s broader goals which include promoting Safe Routes to School as a strategy to improve childhood health. In July 2010, the County of San Diego adopted Live Well, San Diego!, the County’s 10-year plan to build a healthy, safe and thriving community, which identifies encouraging Safe Routes to School programs as a goal to increase physical activity. The San Diego County Childhood Obesity Initiative’s 2010 Call to Action: Childhood Obesity Action Plan also identifies Safe Routes to School strategies including implementation of a countywide Safe Routes to School strategic plan. By funding the development of this Strategic Plan and complementary grant program, the Healthy Works program helps achieve the County’s Safe Routes to School related public health goals.
SANDAG’S ACTIVE TRANSPORTATION PROGRAM
The Healthy Works program builds on SANDAG’s growing active transportation and the iCommute SchoolPool program.
To support local projects and planning, the regional Active Transportation Program funds bicycle, pedestrian, and neighborhood safety (traffic calming) projects and programs including projects that improve access and safety in school areas. Funding for the Active Transportation Program local competitive grant program derives from the TransNet ½-cent transportation sales tax program and the Transportation Development Act (TDA) Article 3
Photo Source: SANDAG
Attachment 5 :: San Diego Regional Safe Routes to School Strategic Plan 237

48
Non-motorized funds. Since the TransNet program’s inception in FY 1988, SANDAG has provided approximately $28 million in TransNet revenues and $37 million TDA funds to active transportation projects throughout the region.
The competitive grant program’s current guidelines and criteria give preference to planning and infrastructure projects that comprehensively address active transportation and complete streets considerations, including bicycle, pedestrian, and transit access and Safe Routes to School. Approximately $8.8 million is available for the FY 2011 local call for projects.
Implementation of the Regional Bicycle Plan is also central to the development of a robust active transportation system and is now a key component to the regional Active Transportation Program. In April 2011 SANDAG assumed responsibility as the lead agency in implementing regional bicycle projects and programs identified in the Regional Bicycle Plan. These projects and programs are funded by TransNet and Transportation Enhancement (TE) funds. Initial implementation will begin in 2012 and is supported by $8.3 million in TransNet and TE funds.
As noted in Chapter 1, the Regional Bicycle Plan identifies Safe Routes to School as a priority regional program. This Strategic Plan strengthens the region’s Active Transportation Program by contributing a strategy to support Safe Routes to School planning and programming.
SANDAG iCOMMUTE SCHOOLPOOL
SANDAG’s SchoolPool program is managed by iCommute, the regional TDM program. SchoolPool is designed to reduce peak-period trips and traffic congestion in and around school zones. The program is a free, convenient, and secure online system used to help parents of children who attend the same school to find partners to walk, bike, or carpool for school commute trips. As of January 2012, 68 schools from 14 school districts participate in the SchoolPool program.
Carpooling is a vital element to many Safe Routes to School programs, particularly for schools where a significant portion of the student population live further from school than is a reasonable distance to walk or bike. Carpooling reduces vehicle congestion in school zones, which promotes cleaner air and safety around the school.
With Healthy Works funding, iCommute launched the “Walk, Ride and Roll to School” campaign in 2011 to expand school and parent participation in SchoolPool. The campaign introduced the “Walking School Bus” and “Bike Buddies” elements to the program. These program elements encourage students to walk or bike to school as a group, supported by adult-
To support local projects and planning, the regional Active Transportation Program funds bicycle, pedestrian, and neighborhood safety (traffic calming) projects and programs including projects that improve access and safety in school areas.
Attachment 5 :: San Diego Regional Safe Routes to School Strategic Plan 238

49
Photo Source: Walk San Diego
supervision and safety education. Bike Buddies and Walking School Buses can also be used in combination with carpooling.
Walk, Ride, and Roll to School 2011 provided free marketing materials, student incentives, and safety equipment, such as bike helmets and reflective vests, for Walking School Bus and Bike Buddies formed through SchoolPool. These Bike Buddies and Walking School Bus starter kits were available while supplies lasted to all SchoolPool registrants, regardless of participation in Walk, Ride, and Roll. The campaign featured a competition where schools could win up to $1,000 toward school supplies for logging the most walking or biking trips throughout the month of October 2011. Registered schools also received pedestrian or bicycle safety training courses and safety trading cards.
Twenty-two schools, representing approximately 15,000 students, registered to participate in Walk, Ride, and Roll to School in 2011. As shown in Figure 3-3, schools across the region participate in SchoolPool as well as Walk, Ride, and Roll. Also beginning in 2011, iCommute is holding annual Walk and Bike to School Day events in conjunction with International Walk to School Day.
Walk, Ride, and Roll to School 2011 provided free marketing materials, student incentives, and safety equipment, such as bike helmets and reflective vests, for Walking School Bus and Bike Buddies formed through SchoolPool… Twenty-two schools, representing approximately 15,000 students, registered to participate in Walk, Ride, and Roll to School.
Attachment 5 :: San Diego Regional Safe Routes to School Strategic Plan 239
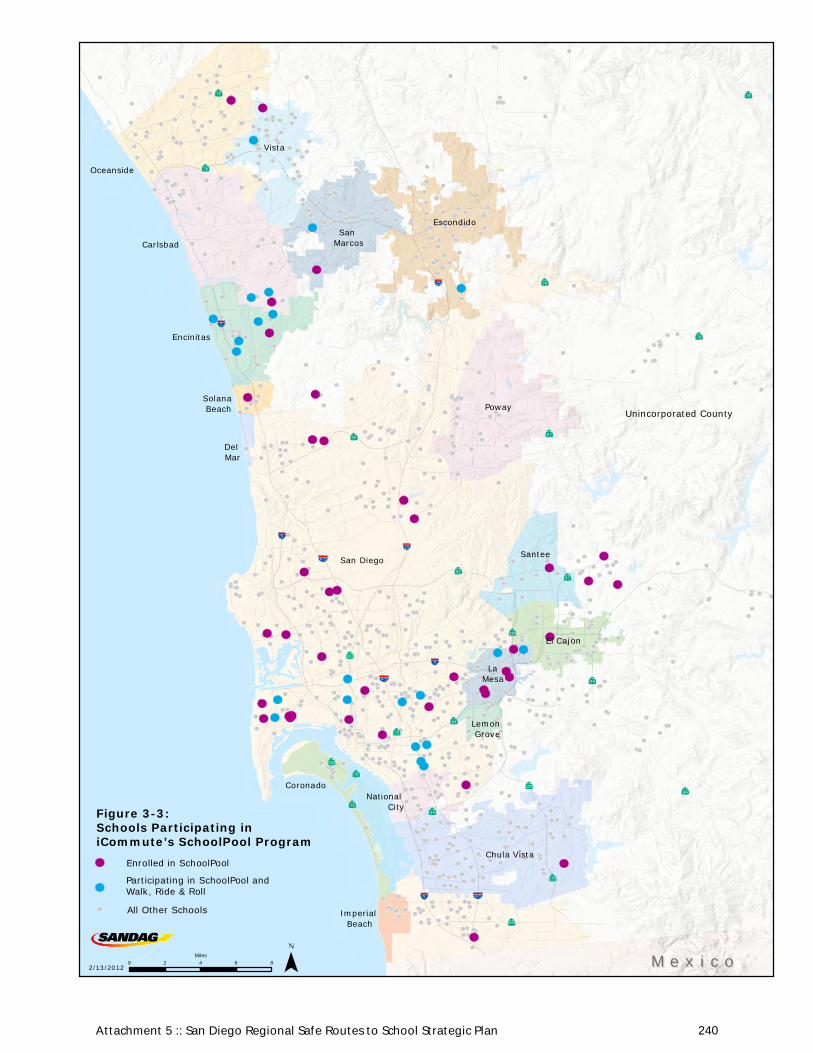
San Diego
Poway
Chula Vista
Carlsbad
Oceanside
Vista
Escondido
Santee
San Marcos
Encinitas
El Cajon
Coronado
LaMesa
National City
Imperial Beach
Lemon Grove
Solana Beach
Del Mar
2/13/2012 M e x i c oM e x i c o0 2 4 6 8Miles
Unincorporated County
Participating in SchoolPool and Walk, Ride & Roll
All Other Schools
Enrolled in SchoolPool
Figure 3-3: Schools Participating in iCommute’s SchoolPool Program
Attachment 5 :: San Diego Regional Safe Routes to School Strategic Plan 240
fde
Text Box
50

51
ADVOCACY AND COMMUNITY-BASED ORGANIZATIONS
As illustrated in the previous sections, non-profit and community-based organizations in the San Diego region play a vital role in Safe Routes to School implementation within the region. The San Diego County Bicycle Coalition, for example, provides bicycle skills and safety training to children in communities throughout the region. This includes conducting bicycle and pedestrian safety trainings as a facet of the iCommute “Walk, Ride, and Roll” campaign.
WalkSanDiego is another non-profit organization in the region focused on education, outreach, and advocacy to promote walkable communities. Their work includes contracting with several communities within the region to assess school travel needs and deliver Safe Routes to School education and encouragement programs. Additionally, the City Heights Community Development Corporation, Oceanside Bicycle Committee, Bayside Community Center and Linda Vista Collaborative, and Chula Vista Community Collaborative are among the numerous community-based organizations that collaborate with schools, school districts, and city agencies to advance Safe Routes to School.
State and national organizations also serve as essential resources to Safe Routes to School programs. The National Center for Safe Routes to School, administered by the University of North Carolina Highway Safety Research Center with funding from the U.S. Department of Transportation Federal Highway Administration, maintains a website containing the largest U.S. based collection of Safe Routes to School related information, including a guide to developing and sustaining programs, case studies, news,
Photo Source: SANDAG
Attachment 5 :: San Diego Regional Safe Routes to School Strategic Plan 241

52
publications, information on funding sources, and instructions on collecting and submitting data to the National Center’s database.
The National Center’s data collection program is a tool for local communities to evaluate the effectiveness of their programs and also contributes to national research and evaluation conducted by the institute. Currently, the National Center also provides mini-grants of $1,000 to communities throughout the country on a bi-annual basis to support mainly community-driven education and encouragement activities.
Other online resources include California Walk to School Day Headquarters and iWalk International Walk to School in the USA, which enables schools to register their Walk to School events and provides access to materials and tools for organizing successful events. Appendix A of this plan lists Web links to resources provided at the regional, state, and national level.
The programs summarized in this chapter reflect only a large subset of Safe Routes to School activities within the region. Many activities are maintained with volunteer support, such as bicycle rodeos conducted in Oceanside and Lakeside. School and parent involvement can be key to the success of these programs due to limited staff resources. Private businesses, organizations, and other governmental agencies also regularly fund Safe Routes to School related efforts. For example, in 2005, Imperial Beach launched a pedestrian and bicycle safety campaign involving bicycle and pedestrian rodeos and school assemblies with funding from the California Office of Traffic Safety. Imperial Beach is now expanding their Safe Routes to School program activities with a Caltrans Environmental Justice grant award.
Photo Source: SANDAG
Attachment 5 :: San Diego Regional Safe Routes to School Strategic Plan 242

53
CHAPTER 4:
MOVING FORWARD A REGIONAL STRATEGY
Based on a review of best practices, existing efforts, and extensive input from stakeholders, the following strategy is proposed as a means to support local communities and schools in developing effective Safe Routes to School programs and to better integrate Safe Routes to School with regional objectives.
The strategy consists of the following major components: regional planning and evaluation; technical assistance; collaboration and coordination; and education and encouragement. Within each of these categories, actions are recommended as well as the agencies responsible for implementing the action.
REGIONAL PLANNING AND EVALUATION
Integrating Safe Routes to School into regional planning efforts establishes a vision for Safe Routes to School throughout the region and advances the regional goals of monitoring, projecting, and promoting active transportation.
The following actions are recommended to strengthen the role of Safe Routes to School in local and regional transportation and land use planning.
Data Collection and Evaluation
Key Elements Data collection and analysis focused on school travel Lead Agency SANDAG Partners School districts, schools, parent volunteers, and local
governments Data collection and analysis of school travel behavior is essential to measuring progress, identifying and prioritizing needs, and generating evidence to support future investment in Safe Routes to School efforts. Accordingly, the Strategic Plan recommends establishing a process to evaluate Safe Routes to School program participation levels, changes in
Integrating Safe Routes to School into regional planning efforts establishes a vision for Safe Routes to School throughout the region and advances the regional goals of monitoring, projecting, and promoting active transportation.
Attachment 5 :: San Diego Regional Safe Routes to School Strategic Plan 243

54
perceptions and attitudes toward active transportation to school, future needs, and Safe Routes to School impacts on mode share, health, and safety.
This Safe Routes to School monitoring program should complement the Active Transportation Program data collection, evaluation, and modeling effort planned for initial implementation in 2012. This broader Active Transportation Program effort will capture active transportation trip data to incorporate into future activity-based transportation models and to inform future regional planning efforts with more robust data on active transportation activity levels and behaviors.
To measure journey to school trends, the Safe Routes to School data collection effort may consist of three major components:
Conducting biannual school traffic counts throughout the region that capture a diverse sample of school sites in terms of Safe Routes to School program elements and land use, transportation, and population characteristics, as well as encouraging schools to routinely collect in-classroom student arrival and departure tallies, consistent with the National Center for Safe Routes to School evaluation program.
Surveying parents or guardians and students to identify behavioral and attitudinal trends as well as input on the effectiveness of Safe Routes to School infrastructure and non-infrastructure programs. Survey instruments should be based upon and compatible with the National Center for Safe Routes to School evaluation program but enhanced with input from local practitioners.
Photo Source: SANDAG
Attachment 5 :: San Diego Regional Safe Routes to School Strategic Plan 244
55
Surveying government agencies and school administrators to gain an accurate picture of the types and distribution of the Safe Routes to School activities in existence, programs they are interested in learning more about, and existing institutional barriers to participating in Safe Routes to School activities.
The data compiled through this effort should be incorporated into a Regional Safe Routes to School Evaluation and Action Plan that includes: 1) performance measures and benchmarks; 2) a mode shift and GHG reduction analysis; 3) an assessment of Safe Routes to School program participation levels, including utilization of SANDAG resources such as SchoolPool; 4) a health and safety benefits analysis; and 5) actions and programs recommended to implement the Strategic Plan over the subsequent years.
The Evaluation and Action Plan should be published bi-annually and incorporated into regional Active Transportation Program monitoring reports. It should help inform future regional transportation and comprehensive planning, and also serve as a strong public awareness tool to communicate the health and environmental benefits of active transportation.
Smart Growth and Complete Streets Integration
Key Elements Engaging planners, school district officials, and policymakers to improve synthesis between school facility and community planning goals.
Lead Agency SANDAG Partners Local jurisdictions, school district officials, and school
facility planners Community-oriented schools located in close proximity to the neighborhoods they serve encourage walking and biking to school and provide social and recreational opportunities for students and community residents. If well-designed, they reflect community character, can hold historical significance, and enhance the aesthetic quality of a neighborhood. For these reasons, community schools support smart growth development, and in many communities, school access has become the focal point of complete streets initiatives.
However, a spectrum of factors discourages investment in community-oriented schools. These include regulatory barriers, such as historical funding biases that favor new construction over renovation and minimum acreage regulations for new facilities, as well as social factors that must be balanced, such as the need for large athletic fields and cultural diversity goals. Lack of coordination between comprehensive planning and school facility planning is also a challenge to designing schools that are interwoven into the community fabric.
Community-oriented schools located in close proximity to the neighborhoods they serve encourage walking and biking to school and provide social and recreational opportunities for students and community residents.
Attachment 5 :: San Diego Regional Safe Routes to School Strategic Plan 245

56
Despite these challenges, communities are moving toward collaboration and innovative design solutions to retain community-centered schools.
To underscore the connection between school planning, smart growth, and complete streets, the Strategic Plan recommends the following actions:
Discuss the role of schools in place-making in relevant, future regional plans such as the Regional Comprehensive Plan and Regional Transportation Plan.
Address school design and access issues in any of the region’s future smart growth, complete streets, or healthy and active design guidelines.
In SANDAG’s existing Smart Growth and Active Transportation grant programs, consider incorporating criteria that encourages jurisdictions to consider school access and collaborative school facility planning approaches.
Provide workshops, presentations, or other forums on topics such as joint-use policies, green school building renovation, complete streets, and model inter-agency review agreements between school facility planning and city planning agencies.
Photo Source: SANDAG
Attachment 5 :: San Diego Regional Safe Routes to School Strategic Plan 246

57
COLLABORATION AND COORDINATION
The success and reach of this strategy is largely contingent on engaging with partners and collaborating with agencies and organizations that are intimately connected to school communities and knowledgeable about school issues.
There is growing interest among Safe Routes to School implementers in coordinating regionally and collaborating on Safe Routes to School efforts. The following actions are intended to strengthen relationships and the exchange of information amongst schools, organizations, SANDAG, and other agencies involved in advancing Safe Routes to School. Another key objective is to engage related, non-participating organizations in Safe Routes to School efforts through collaboration and disseminating information.
Safe Routes to School Coordination
Key Elements Regional coordination of Safe Routes to School efforts
Lead Agency Regional public health or planning organization Partners Local jurisdictions, school districts, County of
San Diego HHSA, and other regional organizations and agencies involved in Safe Routes to School
The Strategic Plan recommends creating a structure to manage on-going implementation of the regional strategy, coordinate local Safe Routes to School program activities, and ensure that local jurisdictions and school communities have access to technical assistance that supports effective program implementation. A key component to this process is bringing school districts and local jurisdictions together to promote collaboration and jointly address barriers to Safe Routes to School implementation.
The success and reach of this strategy is largely contingent on engaging in partners and collaborating with agencies and organizations that are intimately connected to school communities and knowledgeable about school issues.
Photo Source: SANDAG
Attachment 5 :: San Diego Regional Safe Routes to School Strategic Plan 247

58
Safe Routes to School funding apportioned for non-infrastructure projects is often underutilized because applicants lack the staff resources to implement these types of projects. Although city traffic engineers and planners may not have the time or expertise to devote toward programmatic activities, most recognize the high rate of return provided by these efforts. As shown in Chapter 2, non-infrastructure projects can reach a considerable number of schools at relatively low cost.
Coordinating access to resources and information could help address this gap and expand program activities in the San Diego region. Throughout the U.S., county- or region-wide Safe Routes to School coordination supports programmatic activities by providing individualized support to jurisdictions, schools, and community volunteers. This includes connecting schools with available resources and providing information on model programs and strategies for establishing programs tailored to their communities’ needs, sustaining activities, and overcoming program challenges. One way to accomplish this is by maintaining a clearinghouse of case studies to illustrate best practices.
Regional coordination could also result in tools to address common barriers to walking and biking to school, such as liability concerns, prohibitive school policies and other institutional barriers, as well as tools to support instituting curriculums, school transportation policies, and school wellness policies that facilitate walking and biking to school. Regional coordination could also help to ensure resources are available, in appropriate formats and languages, to underserved communities.
Participating in existing regional, state, and national Safe Routes to School networks, in addition to seeking new opportunities to collaborate among
Photo Source: SANDAG
Attachment 5 :: San Diego Regional Safe Routes to School Strategic Plan 248

59
agencies and institutions, is key to coordinating Safe Routes to School regionally.
Safe Routes to School Coalition
Key Elements On-going forum to exchange information and promote collaboration
Lead Agencies California Department of Public Health, Safe Routes to School Technical Assistance Resource Center
County of San Diego HHSA Rady Children’s Hospital, Center for Healthier
Communities SANDAG
Partners School district officials, parent organizations, non-profit organizations, local government staff including engineers and planners.
Beginning in April 2011, the County of San Diego HHSA, SANDAG, the California Department of Public Health’s Safe Routes to School Technical Assistance Resource Center (TARC), and Rady Children’s Hospital, Center for Healthier Communities, have partnered to establish a Regional Safe Routes to School Coalition that serves as a forum to connect agencies and organizations involved in implementing Safe Routes to School. The Coalition, currently chaired by TARC, meets on a bi-monthly basis to coordinate efforts and to share relevant information about local program activities as well as available resources and technical expertise.
The Strategic Plan recommends regional and local partners, including SANDAG, continue to participate and work to expand participation and the scope of the Coalition.
Photo Source: SANDAG
Attachment 5 :: San Diego Regional Safe Routes to School Strategic Plan 249
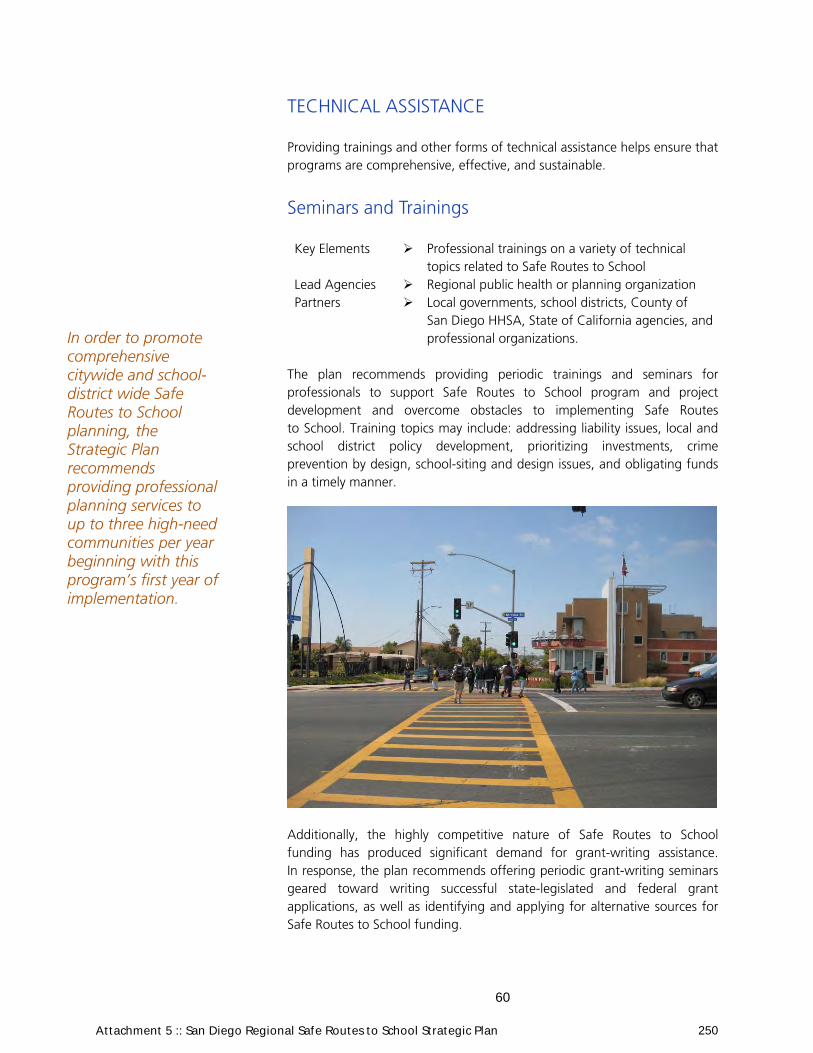
60
TECHNICAL ASSISTANCE
Providing trainings and other forms of technical assistance helps ensure that programs are comprehensive, effective, and sustainable.
Seminars and Trainings
Key Elements Professional trainings on a variety of technical topics related to Safe Routes to School
Lead Agencies Regional public health or planning organization Partners Local governments, school districts, County of
San Diego HHSA, State of California agencies, and professional organizations.
The plan recommends providing periodic trainings and seminars for professionals to support Safe Routes to School program and project development and overcome obstacles to implementing Safe Routes to School. Training topics may include: addressing liability issues, local and school district policy development, prioritizing investments, crime prevention by design, school-siting and design issues, and obligating funds in a timely manner.
Additionally, the highly competitive nature of Safe Routes to School funding has produced significant demand for grant-writing assistance. In response, the plan recommends offering periodic grant-writing seminars geared toward writing successful state-legislated and federal grant applications, as well as identifying and applying for alternative sources for Safe Routes to School funding.
In order to promote comprehensive citywide and school-district wide Safe Routes to School planning, the Strategic Plan recommends providing professional planning services to up to three high-need communities per year beginning with this program’s first year of implementation.
Attachment 5 :: San Diego Regional Safe Routes to School Strategic Plan 250

61
Photo Source: Walk San Diego
One to three trainings or seminars could be offered within the first five years of strategy implementation, contingent on local demand.
Safe Routes to School Planning Workshops
Key Elements Safe Routes to School planning workshops Lead Agency SANDAG Partners Local jurisdictions, school districts, schools, parent
volunteers, and professional trainers The San Diego region is home to 251 private and 747 public primary and secondary schools as distinct as the 19 jurisdictions they reside within. With schools located in varied rural, suburban, and urban settings and with diverse built environment and population characteristics, each school’s combination of transportation issues and solutions are unique.
The plan recommends offering Safe Routes to School planning workshops to engage school communities and jurisdictions in launching comprehensive Safe Routes to School programs that address each school’s distinctive mix of issues and opportunities.
The workshops should be modeled after the National Center for Safe Routes to School National Course, designed to engage local planners, engineers, policy-makers, law enforcement, school district and school administrators, teachers, parent organizations, and other community members in a highly interactive process to identify school travel issues and potential solutions.
Attachment 5 :: San Diego Regional Safe Routes to School Strategic Plan 251

62
The workshops should be approximately three-hour sessions, taught by a team of at least two instructors, and conducted at a school or nearby facility. The format includes an introduction to the five elements of Safe Routes to School, observation of school travel behaviors, and charettes resulting in potential design solutions, as well as non-infrastructure programs to pursue, for the target schools.
Prior to the workshop, the instructors should conduct field work to observe travel behaviors and identify deficiencies and issues in the vicinity of each target school. They should also review traffic count and collision data and interview enforcement, engineering, and school officials prior to the workshop. All of this information should be integrated into the workshop content.
Workshops could either focus on an individual school or a small group of schools located within the same area or similar settings. Scheduling workshops would require collaborating with school districts and local jurisdictions to prioritize implementation and coordinate with schools.
The results of the workshop, along with the data collected prior to the workshop, should be summarized into a report for the host agencies. The results can be used to initiate broader planning efforts, such as those described in the subsequent section (Safe Routes to School Planning Services), and to help launch the development of a comprehensive Safe Routes to School program. The workshop facilitators should also offer post-workshop de-briefs to the lead implementing agencies to provide technical assistance in moving forward with the development of the program.
Photo Source: SANDAG
Attachment 5 :: San Diego Regional Safe Routes to School Strategic Plan 252
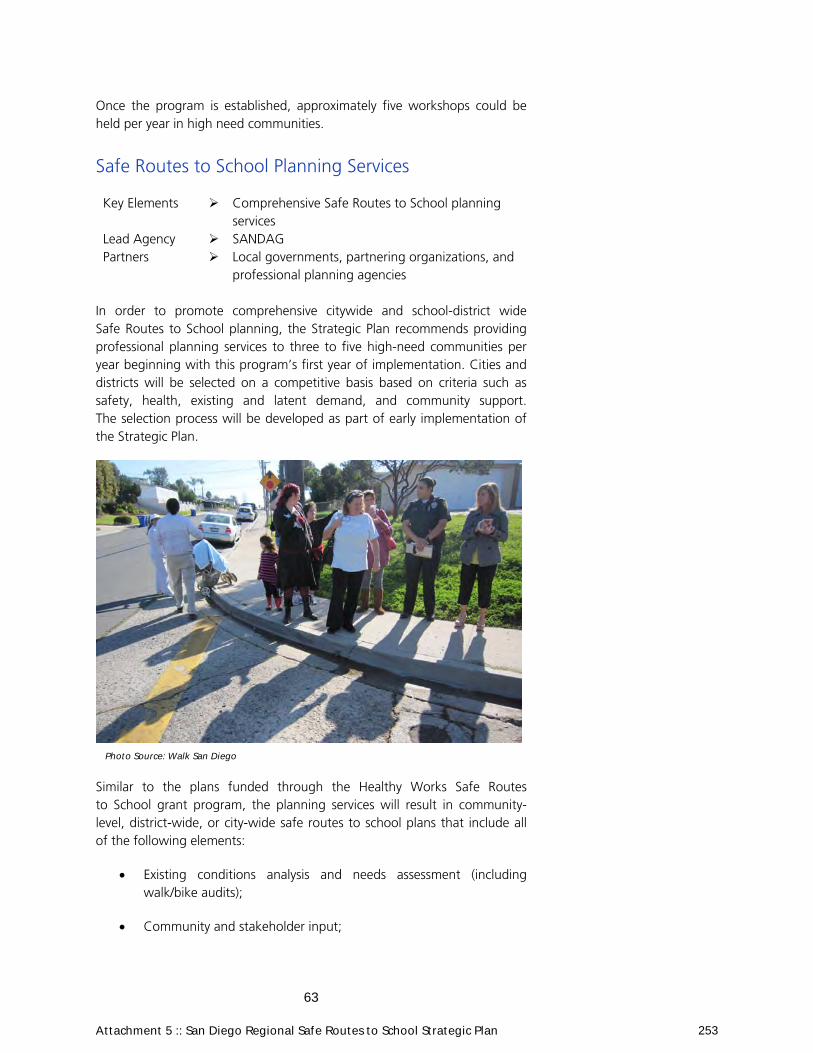
63
Photo Source: Walk San Diego
Once the program is established, approximately five workshops could be held per year in high need communities.
Safe Routes to School Planning Services
Key Elements Comprehensive Safe Routes to School planning services
Lead Agency SANDAG Partners Local governments, partnering organizations, and
professional planning agencies In order to promote comprehensive citywide and school-district wide Safe Routes to School planning, the Strategic Plan recommends providing professional planning services to three to five high-need communities per year beginning with this program’s first year of implementation. Cities and districts will be selected on a competitive basis based on criteria such as safety, health, existing and latent demand, and community support. The selection process will be developed as part of early implementation of the Strategic Plan.
Similar to the plans funded through the Healthy Works Safe Routes to School grant program, the planning services will result in community-level, district-wide, or city-wide safe routes to school plans that include all of the following elements:
Existing conditions analysis and needs assessment (including walk/bike audits);
Community and stakeholder input;
Attachment 5 :: San Diego Regional Safe Routes to School Strategic Plan 253
64
Suggested routes and/or deficiency maps;
Infrastructure improvement plans and concepts;
Education, encouragement, and enforcement program strategies;
Summary of funding sources; and
Evaluation and monitoring plan.
In addition, planning services to provide guidance on school-siting, new school design, or renovations may be available through this program.
EDUCATION AND ENCOURAGEMENT STRATEGIES
Identifying and administering select education and encouragement programs provides communities beneficial tools, such as SchoolPool, that might otherwise be too costly or burdensome for local administration. Also, serving as an information clearinghouse to local jurisdictions, schools districts, and schools facilitates local Safe Routes to School program development and maintenance.
Safe Routes to School Web Enhancements
Key Elements A Safe Routes to School page and upgrades to iCommute Trip-Tracker
Lead Agency SANDAG Partners Local governments, school districts, schools,
non-profit organizations, and other Safe Routes to School implementers
Knowledge about and access to existing resources is an initial hurdle to initiating Safe Routes to School efforts. One recommended approach to raising awareness about Safe Routes to School resources is by creating a Safe Routes to School Web page that incorporates the following possible elements:
A summary or listing of Safe Routes to School programs and resources offered throughout the San Diego region;
Announcements of Safe Routes to School events or related activities in the region; and
Links to Safe Routes to School resources and publications available throughout the United States including the National Center for Safe Routes to School, iWalk International Walk to School Day, and California Active Communities Safe Routes to School Technical Assistance Resource Center Web sites.
Attachment 5 :: San Diego Regional Safe Routes to School Strategic Plan 254
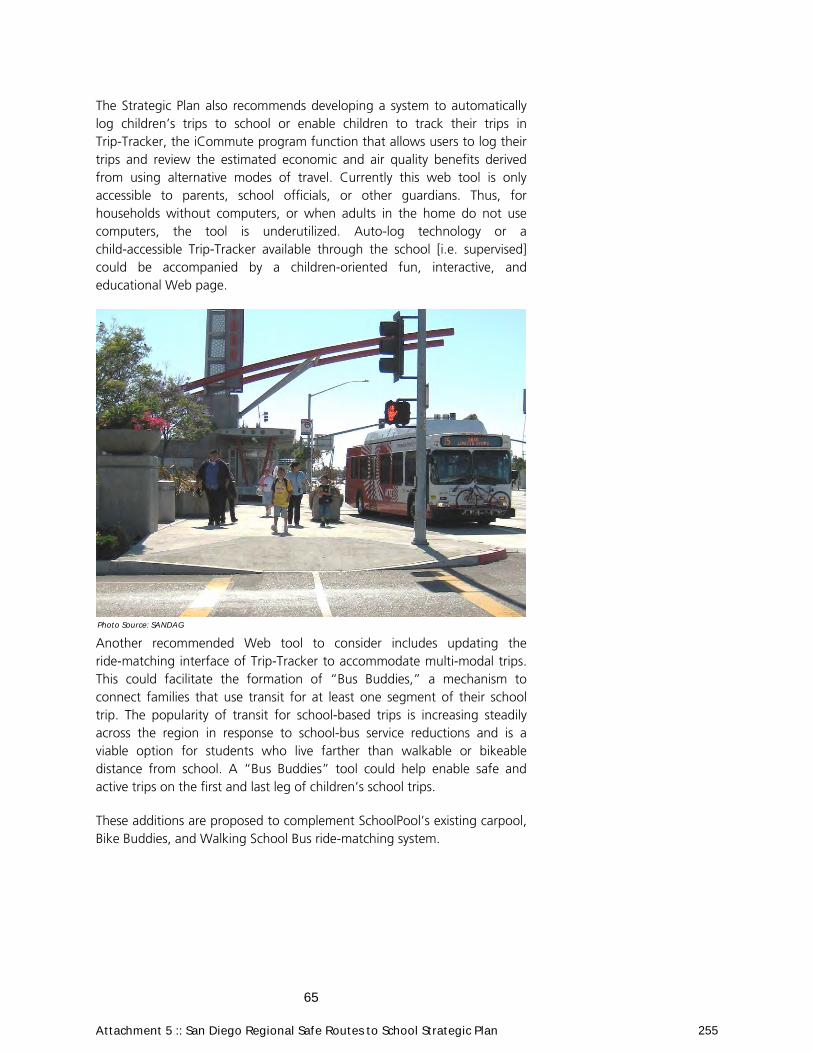
65
The Strategic Plan also recommends developing a system to automatically log children’s trips to school or enable children to track their trips in Trip-Tracker, the iCommute program function that allows users to log their trips and review the estimated economic and air quality benefits derived from using alternative modes of travel. Currently this web tool is only accessible to parents, school officials, or other guardians. Thus, for households without computers, or when adults in the home do not use computers, the tool is underutilized. Auto-log technology or a child-accessible Trip-Tracker available through the school [i.e. supervised] could be accompanied by a children-oriented fun, interactive, and educational Web page.
Another recommended Web tool to consider includes updating the ride-matching interface of Trip-Tracker to accommodate multi-modal trips. This could facilitate the formation of “Bus Buddies,” a mechanism to connect families that use transit for at least one segment of their school trip. The popularity of transit for school-based trips is increasing steadily across the region in response to school-bus service reductions and is a viable option for students who live farther than walkable or bikeable distance from school. A “Bus Buddies” tool could help enable safe and active trips on the first and last leg of children’s school trips.
These additions are proposed to complement SchoolPool’s existing carpool, Bike Buddies, and Walking School Bus ride-matching system.
Photo Source: SANDAG
Attachment 5 :: San Diego Regional Safe Routes to School Strategic Plan 255

66
Outreach and Promotional Campaigns
Key Elements Coordinate campaigns, activities, and events that promote walking and biking to school.
Lead Agency SANDAG Partners Local governments, non-profit organizations, and
school communities
Raising awareness through public outreach efforts and regional campaigns can increase school and parent participation in Safe Routes to School initiatives.
As described in Chapter 3, iCommute launched a Walk, Ride and Roll to School campaign in 2011 to expand school and parent participation in SchoolPool and to introduce “Walking School Bus” and “Bike Buddies” elements to the program. These program elements encourage students to walk or bike to school as a group, supported by adult-supervision and safety education.
With adult-supervision as an essential element, Walking School Bus and Bike Buddies programs address personal security concerns, which is a significant barrier to walking and biking to school. Older adults within the community can be trained to supervise groups, which would benefit the older community as well as students and their families. Evaluations of Walking School Bus initiatives have shown them to be effective in low-income, urban neighborhoods where concern with criminal activity can
Photo Source: SANDAG
Attachment 5 :: San Diego Regional Safe Routes to School Strategic Plan 256

67
be paramount (Mendoza, et al., 2009). Adding and promoting a “Bus Buddies” component also holds potential to increase personal safety.
Building on the momentum of Healthy Works, the plan recommends SANDAG continue to coordinate with school officials and parent organizations to promote and administer the iCommute SchoolPool program through regular communication and through robust incentive-based campaigns similar to Walk, Ride, and Roll to School.
In addition, SANDAG should continue to conduct outreach, provide incentives, and coordinate campaigns, activities, and events that promote walking and biking to school. This includes annual coordination of a regional Walk and Bike to School Day in conjunction with International Walk to School Day.
Attachment 5 :: San Diego Regional Safe Routes to School Strategic Plan 257

68
Education Courses
Key Elements Education courses for students Lead Agencies SANDAG
Non-profit organizations Partners Schools, parent volunteers, school districts and local
public safety personnel Education is a vital element to any Safe Routes to School program. The content and format of educational activities should be designed to address known barriers to walking and biking to school, and therefore, can vary substantially between communities. Programs commonly involve teaching students traffic safety skills and can also incorporate lessons about personal security measures and health, science, and math topics. Material can be presented in a variety of formats including skills practice in a simulated streetscape setting, school assemblies, and ongoing classroom coursework.
Because there is a spectrum of possible programs, the Strategic Plan recommends conducting a ‘best practices’ and needs analysis to identify education programs that will have the broadest benefit to the region. The study should include a strategy for offering education programs so that they reach communities with the greatest need for assistance. The results of this assessment can be both shared with and informed by the Regional Safe Routes to School Coalition and planning efforts described in this chapter. After initial implementation, the effectiveness of the courses offered should be regularly assessed as a part of the evaluation program described on pages 53 and 54 of this Strategic Plan.
Photo Source: SANDAG
Attachment 5 :: San Diego Regional Safe Routes to School Strategic Plan 258
69
IMPLEMENTATION PROCESS
Following adoption of the Strategic Plan, the recommendations will be prioritized. A phasing and financing strategy will be developed and incorporated into an Active Transportation Early Action Program. The 2050 RTP calls for an Active Transportation Early Action Program by 2014 to accelerate implementation of the regional Active Transportation Program.
Implementing the Strategic Plan also requires a needs analysis to define areas that will receive priority for some of the resources recommended in the strategy. This analysis will consider demographic and land use patterns with emphasis on safety, health impacts and social equity considerations. Using the results of the analysis to prioritize implementation will help meet a major social equity objective identified in the 2050 RTP, “to create equitable transportation opportunities for all populations regardless of age, ability, race, ethnicity, or income.”
In future years, this assessment will be addressed within Evaluation and Action Plans (p. 53) that will provide recommendations based on analysis of data and public input collected through the ongoing Safe Routes to School Data Collection and Evaluation program (p. 53 - 55). This approach allows the strategy to evolve and respond to the changing needs of the regions’ local communities and schools.
Following adoption of the Strategic Plan, the recommendations will be prioritized. A phasing and financing strategy will be developed and incorporated into an Active Transportation Early Action Program.
Attachment 5 :: San Diego Regional Safe Routes to School Strategic Plan 259

70
THIS PAGE INTENTIONALLY LEFT BLANK
Attachment 5 :: San Diego Regional Safe Routes to School Strategic Plan 260

71
Appendix A:
RESOURCE LIST
Schools and community members interested in Safe Routes to School are encouraged to contact their local government to learn about opportunities within their jurisdiction. There is also a multitude of resources available to assist communities in developing individualized Safe Routes to School programs. This reference list can be used as a starting point for collecting more information on active transportation and how to initiate and sustain Safe Routes to School programs.
SAN DIEGO REGION
Caltrans District 11 – San Diego & Imperial Counties Division of Local Assistance Luis Z. Medina, Safe Routes to School District Coordinator (619) 278-3735 [email protected] http://www.dot.ca.gov/hq/LocalPrograms/saferoutes/saferoutes.htm Division of Transportation Planning Seth Cutter, District 11 Bicycle and Pedestrian Coordinator (619) 688-2597 [email protected] (619) 688-6699 (general number for District 11) http://www.dot.ca.gov/dist11/ County of San Diego Health and Human Services Agency Katherine Judd, Health Promotion Specialist (619) 668-3758 [email protected] http://www.healthyworks.org/ Rady Children’s Hospital Center for Healthier Communities Dane Lotspeich, Safe Routes to School Project Coordinator (858) 573-1700, ext. 3656 [email protected] http://www.rchsd.org/ourcare/programsservices/c-d/centerforhealthiercommunities/injuryprevention/saferoutestoschool/index.htm
Attachment 5 :: San Diego Regional Safe Routes to School Strategic Plan 261

72
Safe Routes to School Technical Assistance Resource Center California Active Communities, CA Department of Public Health Kristin Haukom, Safe Routes to School Project Coordinator, San Diego Region (916) 208-1885 [email protected] http://www.casaferoutestoschool.org/ SANDAG Regional Active Transportation Program Chris Kluth, Program Manager (619) 699-1952 [email protected] Bridget Enderle, Active Transportation Planner (Safe Routes to School contact) (619) 595-5612 [email protected] http://www.sandag.org/index.asp?subclassid=98&fuseaction=home.subclasshome iCommute SchoolPool Kim Weinstein, Senior Transportation Planner (619) 699-0725 [email protected] Call 511 (say “SchoolPool” when prompted) [email protected] http://www.icommutesd.com/Schoolpool.aspx San Diego County Bicycle Coalition Maria Olivas, Education Program Coordinator (858) 472-6025 [email protected] http://www.sdcbc.org/ San Diego Regional Safe Routes to School Coalition Kristin Haukom, Chair (916) 208-1885 [email protected] Bridget Enderle, Advisory Member (619) 595-5612 [email protected] WalkSanDiego Leah Stender, Program Manager (619) 544-9255 lstender@walksandiego,org http://www.walksandiego.org/
Attachment 5 :: San Diego Regional Safe Routes to School Strategic Plan 262

73
CALIFORNIA
California Project LEAN (916) 552-9907 http://www.californiaprojectlean.org/ California Safe Routes to School (Caltrans) Caltrans Division of Local Assistance Dawn Foster, California Safe Routes to School Coordinator (916) 653-6920 [email protected] http://www.dot.ca.gov/hq/LocalPrograms/saferoutes/saferoutes.htm California Safe Routes to School Technical Assistance Resource Center California Active Communities, CA Department of Public Health (916) 552‐9874 CAactivecommunities.org http://www.casaferoutestoschool.org/ California Walks Wendy Alfsen, Director (510) 684-5705 [email protected] https://californiawalks.org/ California Walk to School Day Headquarters California Active Communities (916) 552-9874 [email protected] http://www.cawalktoschool.com Safe Routes to School California: A Project of the Safe Routes to School National Partnership http://saferoutescalifornia.wordpress.com/
NATIONAL
America Walks (703) 738-4889 http://americawalks.org/ iWalk International Walk to School in the USA (866) 610-SRTS http://www.walktoschool-usa.org
Attachment 5 :: San Diego Regional Safe Routes to School Strategic Plan 263
74
Center for Disease Control and Prevention of the Department of Health and Human Services Kids Walk-to-School http://www.cdc.gov/nccdphp/dnpa/kidswalk/resources.htm League of American Bicyclists (202) 822-1333 [email protected] http://www.bikeleague.org/ National Center for Safe Routes to School University of North Carolina Highway Safety Research Center (866) 610-SRTS http://www.saferoutesinfo.org National Complete Streets Coalition http://www.completestreets.org/ National Policy & Legal Analysis Network to Prevent Childhood Obesity Public Health Law & Policy http://www.nplanonline.org/ Pedestrian and Bicycle Information Center University of North Carolina Highway Safety Research Center http://www.pedbikeinfo.org/ Safe Routes to School National Partnership Jessica Meaney, California Policy Manager (213) 221-7179 [email protected] http://www.saferoutespartnership.org/home United States Federal Highway Administration Safe Routes to School Program http://safety.fhwa.dot.gov/saferoutes/ The National Center for Bicycling and Walking http://www.bikewalk.org/
Attachment 5 :: San Diego Regional Safe Routes to School Strategic Plan 264

75
REFERENCES
Boarnet, M.G., Day, K., Anderson, C. McMillan, T., & Alfonzo, M. (2005). California’s safe routes to school program: Impacts on walking, bicycling, and pedestrian safety. Journal of the American Planning Association, 71(3), 301-317. Boarnet, M.G., Anderson, C.L., Day, K., McMillan, T. & Alfonzon, M.(2005). Evaluation of the California safe routes to school legislation: Urban form changes and children’s active transportation to school. American Journal of Preventive Medicine, 28(2S2), 134-140. Buck, S.M., Hillman, C.H., & Castelli, D.M. (2008). The relation of aerobic fitness to stroop task performance in performance in preadolescent children. Medicine and Science in Sports Exercise, 40 (1), 166-172. California Department of Education, Physical Fitness Testing Statewide Research Files. Accessed online at http://www.cde.ca.gov/ta/tg/pf/pftresearch.asp (December 29, 2010). California Department of Education, DataQuest. Accessed online at http://dq.cde.ca.gov/dataquest/ (October 15, 2011). Centers for Disease Control and Prevention. Youth Risk Behavior Surveillance – United States, 2005. Surveillance Summaries, June 9. MMWR 2006; 55(SS-5):1-108. Cooper, A.R., Page, A.S., Foster, L.J. & Qahwaji, D. (2003). Commuting to School: Are children who walk more physically active? American Journal of Preventive Medicine, 25(4), 273-276. Cooper, A.R., Andersen, L.B. Wedderkopp, N., Page, A.S., Froberg, K. (2005). Physical activity levels of children who walk, cycle, or are driven to school. American Journal of Preventive Medicine, 29(3), 179-184. Cooper, A.R., Wedderkopp, N., Wang, H., Andersen, L.B., Froberg, K. & Page, A.S. (2006). Active travel to school and cardiovascular fitness in Danish children and adolescents. Medicine & Science in Sports & Exercise, 38(10), 1724-1731. Education Data Partnership: http://www.ed-data.k12.ca.us/. Accessed on February 24, 2011 McDonald, N. (2008). Critical factors for active transportation to school among low-income and minority students: Evidence from the 2001 National
Attachment 5 :: San Diego Regional Safe Routes to School Strategic Plan 265

76
Household Travel Survey. American Journal of Preventive Medicine, 34(4), 341-344. McKenzie, T., & Kahan, D. (2008). Physical activity, public health, and elementary schools. The Elementary School Journal, 108(3), 171-180. Mendoza, J.A., Levinger, D.D., & Johnston, B.D. (2009). Pilot evaluation of a walking school bus program in a low-income, urban community. BMC Public Health, 9(122). NCSRTS, 2010 Nelson, M.C. & Gordon-Larsen, P. (2006). Physical activity and sedentary behavior patterns are associated with selected adolescent health risk behaviors. Pediatrics, 117, 1281-1290. Ogden, C.L., Carroll, M.D., Curtin, L.R., Lamb, M.M., & Flegal, K.M. (2010). Prevalence of high body mass index in US children and adolescents, 2007-2008. Journal of the American Medical Association, 303(3), 242-249. Rosenberg, D.E., Sallis, J.F., Conway, T.L., Cain, K.L., & McKenzie, T.L. (2006). Active transportation to school over 2 years in relation to weight status and physical activity. Obesity, 14(10), 1771-1776. San Diego County Office of Education (January 2011). Annual Report to the Community (Downloaded from: http://www.sdcoe.net/pdf/anrept.pdf) on January 31, 2011). San Diego Unified School District (June 2011). Board of Education June 7, 2011 Meeting Agenda. (Accessed from: http://www.sandi.net/ on June 10, 2011). Staunton, C.E., Hubsmith, D. & Kallins, W. (2003). Promoting safe walking and biking to school: The Marin County success story. American Journal of Public Health, 93(9), 1431-1434. Stevens, T.A., To, Y., Stevenson, S.J., & Lochbaum, M.R. (2008). The importance of physical activity and physical education in the prediction of academic achievement. Journal of Sport Behavior, 31 (4), 368-388. Watson, M. & Dannenberg, A.L. (2008). Investment in Safe Routes to School projects: Public health benefits for the larger community. Preventing Chronic Disease: Public Health Research, Practice, and Policy, 5(3). Transportation Authority of Marin County (June 2008). Safe Routes to School Evaluation and Recommendations for the School Years 2006-2007.
Transportation Authority of Marin County (2009). Measure A Transportation Sales Tax Measure Strategic Plan.
Attachment 5 :: San Diego Regional Safe Routes to School Strategic Plan 266

77
Telama, R., Yang, X., Viikari, J., Valimaki, I. Wanne, O., & Raitakari, O. (2005). Physical activity from childhood to adulthood: a 21-year tracking study. American Journal of Preventive Medicine, 28(3), 267-273. U.S. Department of Transportation Federal Highway Administration (August 2007). National Household Travel Survey Brief.
Attachment 5 :: San Diego Regional Safe Routes to School Strategic Plan 267