UNIVERSITE OF CALIFORNIA, SAN DIEGO - eScholarship.org
307
UNIVERSITY OF CALIFORNIA, SAN DIEGO Investigations into the Impact of Transported Particles on Air Pollution and Climate Using Aerosol Time-of-Flight Mass Spectrometry A dissertation submitted in partial satisfaction of the requirements for the degree Doctor of Philosophy in Chemistry by Andrew Phillip Ault Committee in charge: Professor Kimberly A. Prather, Chair Professor Katja Lindenberg Professor David R. Miller Professor Amitabha Sinha Professor William C. Trogler 2010
-
Upload
khangminh22 -
Category
Documents
-
view
3 -
download
0
Transcript of UNIVERSITE OF CALIFORNIA, SAN DIEGO - eScholarship.org

UNIVERSITY OF CALIFORNIA, SAN DIEGO
Investigations into the Impact of Transported Particles on Air Pollution
and Climate Using Aerosol Time-of-Flight Mass Spectrometry
A dissertation submitted in partial satisfaction of the requirements for the degree
Doctor of Philosophy
in
Chemistry
by
Andrew Phillip Ault
Committee in charge:
Professor Kimberly A. Prather, Chair Professor Katja Lindenberg Professor David R. Miller
Professor Amitabha Sinha Professor William C. Trogler
2010

Copyright
Andrew Phillip Ault, 2010
All rights reserved

This dissertation of Andrew Phillip Ault is approved, and it is
acceptable in quality and form for publication on microfilm and
electronically:
__________________________________________________
__________________________________________________
__________________________________________________
__________________________________________________
__________________________________________________
Chair
University of California, San Diego
2010
iii

DEDICATION
Dedicated to my parents Bruce and Helene Ault and sister Julie Ault for all of their love
and support.
iv

EPIGRAPH
Life is what happens while you are busy making other plans.
John Lennon
v

TABLE OF CONTENTS
Signature Page iii
Dedication iv
Epigraph v
Table of contents vi
List of figures xiii
List of tables xvii
Acknowledgements xviii
Vita xxv
Abstract of the Dissertation xxvii
1 Introduction 1
1.1 The Importance of Aerosols 1
1.2 Aerosol Transport and Processing – Local Scale 1
1.3 Aerosol Transport and Processing – Regional Scale 2
1.4 Aerosol Transport and Processing – Intercontinental Scale 3
1.5 Aerosol Time-of-Flight Mass Spectrometry (ATOFMS) 4
1.5.1 ATOFMS Background 4
1.5.2 The ATOFMS Instrument 5
1.5.3 ATOFMS Aerosol Inlet 7
1.5.4 ATOFMS Light Scattering and Particle Sizing Region 8
1.5.5 Laser Desorption/Ionization Time-of-Flight Mass
Spectrometry 13
vi

1.6 Research Objectives and Scope of the Thesis 13
1.7 References 18
2 Impact of Emissions from the Los Angeles Port Region on San
Diego Air Quality During Regional Transport Events 25
2.1 Synopsis 25
2.2 Introduction 26
2.3 Experimental 27
2.3.1 Scripps Institution of Oceanography Pier 2006 Study 27
2.3.2 Real-Time Single-Particle Mass Spectrometry 28
2.3.3 Data Analysis 29
2.3.4 Scaling ATOFMS to Mass Concentrations 29
2.4 Results and Discussion 30
2.4.1 Mass Concentrations Across San Diego County 34
2.4.2 Identification of Regional Events 34
2.4.3 Air Mass History during Regional Events 35
2.4.4 Particle Chemistry during Regional Transport Events 38
2.4.5 General submicron particle types 40
2.4.6 Sulfate Formation and Aging Processes During Transport 42
2.4.7 Temporal Variations by Particle Type 43
2.4.8 Correlation between Major Particle Types 45
2.4.9 Size-Resolved Chemistry of Regional Events 46
2.4.10 Correlation between Ships at Sea and Selected
Particle Types 49
vii

2.4.11 Impact of Regional Events 51
2.5 Acknowledgements 52
2.6 References 53
3 Characterization of the Single Particle Mixing State of Individual
Ship Plume Events Measured at the Port of Los Angeles 58
3.1 Synopsis 58
3.2 Introduction 59
3.3 Experimental 60
3.3.1 Sampling Information 60
3.3.2 Gas and Particle Peripheral Instrumentation 61
3.3.3 Aerosol Time-of-Flight Mass Spectrometry (ATOFMS) 61
3.3.4 Single Particle Analysis 62
3.4 Results and Discussion 62
3.4.1 Ship Identification 62
3.4.2 Plume Characterization 66
3.4.3 In Plume Gas Phase Chemistry and Concentrations 68
3.4.4 Unique Plume Chemistry 70
3.4.5 Details on the OC-V-sulfate and Fresh Soot
Particle Types 74
3.4.6 Description of the Ca-ECOC Particle Type 77
3.4.7 Background Particle Types During Plumes 79
3.4.8 Temporal Trends 82
3.4.9 Size-resolved Chemistry 84
viii

3.4.10 Correlation between sulfate and vanadium particles 87
3.4.11 Sulfate and Sulfuric Acid in Additional Plumes 90
3.4.12 Conclusions 93
3.5 Acknowledgements 94
3.6 References 95
4 Mobile Laboratory Observations of Temporal and Spatial
Variability within the Coastal Urban Aerosol 100
4.1 Synopsis 100
4.2 Introduction 101
4.3 Experimental 104
4.3.1 Mobile ATOFMS Laboratory 104
4.3.2 2009 San Diego Bay Measurements 105
4.3.3 Instrumentation 105
4.3.4 Aerosol Time-of-Flight Mass Spectrometry 108
4.3.5 Single Particle Data Analysis 108
4.3.5 Scaling Single Particle Measurements to Mass
Concentrations 109
4.4 Results and Discussion 110
4.4.1 Temporal Patterns of Meteorological and Gas
Phase Concentrations 110
4.4.2 Variability of Particle Mass and Number Concentrations 113
4.4.3 Variation in Aerosol Size Distributions 115
4.4.4 Differeing Aerosol Sources Determined by Particle
ix

Chemistry 119
4.4.5 Differences in Particle Aging and Mixing State 122
4.4.6 Variations in Chemistry and Implications for Models
and Regulations 124
4.5 Acknowledgements 125
4.6 References 127
5 Observations of Transported Asian Dust in California Precipitation
during CalWater 131
5.1 Synopsis 131
5.2 Introduction 132
5.3 Experimental 134
5.3.1 Meteorological Methods 134
5.3.2 Precipitaation Sampling 135
5.3.3 FLEXPART Model 135
5.4 Results and discussion 136
5.4.1 Atmospheric Rivers Impacting California 136
5.4.2 Meteorology and Precipitation Properties for Storms 1
and 2 144
5.4.3 Transported Asian Dust in Precipitation Samples 146
5.4.4 Back Trajectory Analysis 152
5.4.5 Conclusions 156
5.5 Acknowledgements 157
5.5 References 158
x

6 Characterization of Asian Outflow at Gosan, Korea by
Single Particle Mass Spectrometry 162
6.1 Synopsis 162
6.2 Introduction 163
6.3 Experimental 166
6.3.1 Location and Instrumentation 166
6.3.2 Single particle mass spectrometry 167
6.4 Results and discussion 168
6.4.1 Air Mass Characteristics and Meteorology 168
6.4.2 Aerosol Size Distributions and Bulk Mass Concentrations 175
6.4.3 Aerosol Chemistry 181
6.4.4 Aerosol Chemical Mixing States 186
6.5 Conclusion 192
6.6 Acknowledgements 194
6.7 References 196
7 An Intercontinental Overview of Size-Resolved Chemical Mixing
State by Single Particle Mass Spectrometry 202
7.1 Synopsis 202
7.2 Introduction 203
7.3 Experimental 207
7.3.1 Aerosol Time-of-Flight Mass Spectrometry (ATOFMS) 207
7.3.2 Particle Classification 211
7.4 Results and discussion 217
xi

7.4.1 Size-Resolved Chemical Composition 218
7.4.1.1 Urban Areas 218
7.4.1.1.1 Aged Urban Areas 218
7.4.1.1.2 Fresh Urban Areas 221
7.4.1.2 Remote Continental Sites 223
7.4.1.3 Marine Studies 225
7.4.2 Internal Mixing with Secondary Speces 229
7.4.2.1 Urban Areas 230
7.4.2.1.1 Aged Urban Areas 230
7.4.2.1.2 Fresh Urban Areas 233
7.4.2.2 Remote Continental Sites 234
7.4.2.3 Marine Studies 236
7.5 Conclusion 241
7.6 Acknowledgements 244
7.7 References 246
8 Conclusion and Future Directions 258
8.1 Conclusion 258
8.2 Los Angeles Basin Mobile Study (LABMS) Result 262
8.3 Characterization of Aerosol Optical Properties at Gosan, Korea 267
8.4 Future Directions 272
8.5 Final Thought 277
8.6 References 278
xii

LIST OF FIGURES
Figure 1.1 Schematic of the transportable ATOFMS 6
Figure 1.2 Schematic of the ATOFMS light scattering region 9
Figure 1.3 Different refractive indices calculated from Mie Theory 12
Figure 2.1 Time series of mass and number concentrations at the SIO Pier 31
Figure 2.2 Fraction of Scaled PM2.5 corresponding to PM1 hourly 33
Figure 2.3 HYSPLIT back trajectories during transport and non-transport time 37
Figure 2.4 Mass spectra of ECOC and V-Ni-Fe particle type and time series
of both types 39
Figure 2.5 Positive and negative ion mass spectra for the six most
abundant particle types (excluding ECOC and V-Ni-Fe already shown) 41
Figure 2.6 Relative fractions and scaled mass concentrations at the SIO Pier 44
Figure 2.7 Comparison of the average size-resolved mass distributions
during regional and non-event time periods 48
Figure 2.8 Time series of ECOC and V-Ni-Fe and ship radio contacts an event 50
Figure 3.1 Map showing the Port of LA 65
Figure 3.2 Gas and particle measurements of the ship Container1b 67
Figure 3.3 Average mass spectra for OC-V-sulfate and fresh soot 71
Figure 3.4 Digital color stack for the OC-V-sulfate particle type 75
Figure 3.5 Digital color stack for the fresh soot particle type 76
Figure 3.6 Average mass spectrum of the Ca-ECOC particle type 78
Figure 3.7 Average mass spectra for background particle types before
xiii

and after the plume from Container 1a 80
Figure 3.8 Average mass spectra of background particle types from before
and after the plume from Container4 81
Figure 3.9 Time series of the OC-V-sulfate and fresh soot particle types 83
Figure 3.10 Size-resolved number fractions of the different particle types
before and after Container4 and Container1a 86
Figure 3.11 Sulfate and sulfuric acid absolute peak areas by particle type 88
Figure 3.12 Sulfate and sulfuric acid absolute peak areas for additional plumes 92
Figure 4.1 Map of sampling sites and HYSPLIT back trajectories 106
Figure 4.2 Comparison of meteorological conditions between Feb. 12th and
Mar. 13th for San Diego Bay 111
Figure 4.3 Mass and number concentration comparison across sites 114
Figure 4.4 Size distribution measurements for Feb. 12th and Mar. 13th 116
Figure 4.5 Chemically resolved mass fractions across the eight sites 121
Figure 4.6 Secondary marker information across eight sites 123
Figure 5.1 Sampling sites used during CalWater Early Start 133
Figure 5.2 Integrated water vapor and precipitation rates during Calwater
Early Start 138
Figure 5.3 Wind profiles and surface observations from Colfax, California 142
Figure 5.4 Chemical and meteorological measurements during Storms 1 and 2 145
Figure 5.5 ATOFMS mass spectra from precipitation samples 150
Figure 5.6 FLEXPART back trajectory analysis during each precipitation sample 153
Figure 5.7 Schematic summary of Storm 2 case study 155
xiv

Figure 6.1 HYSPLIT back trajectory analysis during different air mass types 171
Figure 6.2 Meteorological data from the Gosan site 172
Figure 6.3 HYSPLIT forward trajectory analysis during different air mass types 174
Figure 6.4 Time series of bulk and size distribution mesaurements 177
Figure 6.5 Size distributions and mass concentrations from each air mass type 178
Figure 6.6 Size and chemically-resolved mass distributions by air mass type 179
Figure 6.7 Number fraction of particle types and secondary marker fractions
by size 180
Figure 6.8 Average mass spectra for the seven main particle types 184
Figure 6.9 Matrix of the number fraction of particles mixed with secondary
markers 185
Figure 6.10 Matrices of the number fraction of particles mixed with secondary
markers for each particle type versus air mass type 188
Figure 6.11 Ternary plots of ammonium, sulfate, and nitrate for each particle
type and air mass type 189
Figure 6.12 Ternary plot of ammonium, sulfate, and nitrate as a function of size 192
Figure 7.1 Global and US maps of ATOFMS study sites 210
Figure 7.2 ATOFMS particle classes 214
Figure 7.3 Size-resolved particle type number fractions for aged urban areas 219
Figure 7.4 Size-resolved particle type number fractions for fresh urban areas 222
Figure 7.5 Size-resolved particle type number fractions for remote continental
sites 224
Figure 7.6 Size-resolved particle type number fractions for marine studies 226
xv

Figure 7.7 Size-resolved particle type number fractions for clean and marine
polluted time periods during marine studies 228
Figure 7.8 Secondary matrices from aged urban areas 231
Figure 7.9 Secondary matrices from fresh urban areas 232
Figure 7.10 Secondary matrices from remote continental 235
Figure 7.11 Secondary matrices from marine studies 237
Figure 7.12 Secondary matrices from aged and polluted marine studies 239
Figure 8.1 PM2.5 concentrations at sampling sites across the Los Angeles Basin 263
Figure 8.2 Back trajectory analysis from each sampling site 264
Figure 8.3 Size-resolved chemical mixing state from each site 265
Figure 8.4 Single particle scattering data from each particle type at Gosan, Korea 269
Figure 8.5 Single particle scattering response as a function of relative humidity 270
Figure 8.6 Top fit of scattering response as a function of size for aged sea salt
at different relative humidities 271
xvi
LIST OF TABLES
Table 2.1 Table of regional events observed at the SIO Pier 32
Table 3.1 Characteristics of ship plumes 64
Table 3.2 Gas phase concentrations during different plume events 69
Table 4.1 Mobile laboratory sampling locations 107
Table 5.1 Atmospheric river conditions for both storms 139
Table 5.2 Precipitation sampling period information 149
Table 6.1 The fraction of time observed for each air mass type 173
Table 7.1 ATOFMS studies used for comparison 209
Table 7.2 Table of characteristic particle types 215
xvii

ACKNOWLEDGMENTS
It is a bit overwhelming to think back over the last 5 years at the number of
people that have supported me during my time in graduate school. Be it with a kind word,
a helpful piece of advice, or lending a hand, these acts of generosity and friendship have
made an intense endeavor a fulfilling and enjoyable experience.
The most important source of support and guidance during my time at UCSD has
been from my advisor Prof. Kim Prather. Looking back it is remarkable the amount of
trust and faith she has placed in me and the rest of the group as we have taken million
dollar instruments around the country and the world. Kim has given me incredible
freedom to explore different aspects of aerosol chemistry ranging from ship plumes to
intercontinentally transported dust. This independence has always been balanced by a
keen scientific insight and an encouraging word when things have gotten tough and
discouraging. This support has taken many different forms, including my personal
favorite - slipping away for a mid-afternoon drink at the pub. Her passion has served as
an inspiration as I pursue my career objective of becoming a university professor. I look
forward to bouncing scientific ideas off of one another, reminiscing about the old days,
and discussing the latest exploits of the Giants and Reds at a corner seat in a local
watering hole during conferences for years to come.
One of the greatest pleasures I have had during graduate school has been the
chance to work with members of the Prather group both past and present. I feel fortunate
to have learned something from all of the members of the Prather group that I have had
the pleasure of working with over the last 5 years including: Dr. Hiroshi Furutani, Dr.
xviii

Steve Toner, Dr. Matt Spencer, Dr. Ryan Moffet, Dr. Laura Shields, Dr. Sharon Qin,
John Holecek, Dr. Thomas Rebotier (and Leah), Dr. Ryan Sullivan, Dr. Kerri Pratt, Dr.
Robert Moision, Dr. Ying Wang, Dr. Yongxuan Su, Meagan Moore, Liz Fitzgerald,
Lindsay Hatch, Cassandra Gaston, Melanie Zauscher, Jessie Creamean, Kaitlyn Suski,
Jack Cahill, Doug Collins, Jessie Charrier, Rene Sanchez, Maggie Yandell, Danny
Phung, and Brandon Heilman. First and foremost I have to thank Joe Mayer for
encouragement and support over the last 5 years. Joe has been a constant source of calm
and logic no matter how harried a field study situation has become. His ability to digest a
situation and devise a solution, often a beautifully simplistic solution, has been an
invaluable asset to all Prather group members over the past nearly two decades. Dr.
Hiroshi Furutani was a constant source of support and guidance during my first two years
in the Prather Lab; he taught me when to push through something, when to reassess and
change tactics, and when to take a deep breath and have a laugh. Dr. Matt Spencer and
Dr. Steve Toner showed me the ropes early on in grad school emphasizing how
imperative it was to make sure you were collecting the best data possible and that you
have to be willing to tear things apart to really learn how they work. The other older
group members when I joined, Dr. Thomas Rebotier, Dr. Ryan Moffet, Dr. Laura Shields,
Dr. Sharon Qin, and John Holecek, always had a kind and encouraging word and were
always willing to share their vast knowledge with me. Though Dr. Yongxuan Su has
moved on from the Prather group, he has remained close by with a watchful eye over all
of us and has always been a source of support and advice over the years. Dr. Kerri Pratt
was always willing to provide her honest opinion and help with a study or a paper. She
also encouraged me to chase fellowships I didn’t think I had a chance to receive. Cassie
xix
Gaston, Liz Fitzgerald, and Lindsay Hatch have all been there to provide an opinion or
listen to a gripe over the years and have been great fellow travelers on the journey that is
graduate school. I feel fortunate to have had the chance to mentor Jessie Creamean during
the last 2 years; through field studies and writing, I have learned as much from her
through this process as she has learned from me. Maggie Yandell was a good
undergraduate to work with and has remained a good friend.
Beyond the Prather Group, many people have lent a helping hand during my years
at UCSD. First and foremost among them has been Myra Kosak who has always been
able to handle the complicated monetary and travel related situations we have produced
over the years. I learned an incredible amount during my time teaching with Dr. Sergio
Guazzotti and Prof. Skip Pomeroy, who through very different styles taught me an
incredible amount about instrumentation over a very small amount of time. Prof.
Pomeroy has always been willing to take a break and talk through whatever is happening
in my grad career or in the world at large. I would also like to thank my thesis committee
for their guidance and ideas over the years: Prof. Amit Sinha, Prof. Katja Lindenberg,
Prof. Bill Trogler, and Prof. Ralph Keeling.
I have been fortunate to work with a fantastic group of fellow scientists and
collaborators during my time in the Prather Group. Our CalWater collaborators at NOAA
Drs. Marty Ralph, Allen White, Christopher Williams, and Paul Neiman have been
fantastic to work with, and I have learned an incredible amount about meteorology and
clouds through working with them. We have also worked during field studies in
California over the years with Prof. Mark Thiemans and Dr. Gerardo Dominguez at
UCSD, Dr. Richard Peiper and Carrie Wold at the Southern California Marine League,
xx

Dr. Robert Loeschen at CSU-LB, Prof. Paul Ziemann at UCR, and many more. During
the Pacific Dust Experiment in Gosan, Korea, I was fortunate to work with Prof. Sang-
Woo Kim, Kyeongsik Kim, Ji Hyoung Kim, Man Hae Kim, Jong Hwan Kim, Prof. Seong
Soo Yum, Aihua Zhu, and Prof. V. Ramanathan. The travel and science involved in these
field studies were incredibly exciting, and I appreciate the incredible amount of
assistance and patience that our scientific collaborators have shown through these studies.
Before arriving at UCSD many people helped influence me during my prior
academic endeavors. During high school chemistry, Ms. Chow and Mr. Lazar both
helped me discover an interest in chemistry that continues to grow. During the summer of
2003, Dr. Paul Fleitz, Dr. Joy Rogers, Dr. Ben Hall, and the rest of the research group at
Wright Patterson Air Force Base provided me with my first research experience. At
Carleton College, my research advisor Prof. Deborah Gross helped nurture my interest in
the atmosphere and mass spectrometry. She has continued to serve as a mentor,
collaborator, and friend over the years since I’ve left Northfield. Prof. Will Hollingsworth
inspired an awe at the quirky and complicated world of quantum mechanics. Working
with my comps (senior thesis) advisor Prof. Daniela Kohen and comps partner Dr. Janel
Uejio to study the world of surface adsorption was an incredible experience that helped
me appreciate research at an in-depth level and prepared me for graduate school. I have
valued Janel’s continued friendship and support as we have wound our way through our
respective graduate programs.
Many people from my personal life have provided an incredible amount of
support to me through my graduate school journey. My parents Prof. Bruce Ault and
Helene Ault have been an incredible source of support and encouragement throughout my
xxi

life. My mom’s relentless positivity and my dad’s calm, reasoned analysis have been
fantastic complementary resources during graduate school. My sister Julie Ault is
probably my most loyal advocate and is always looking out for her older brother. Visits
with Ju have provided needed breaks during graduate school and talks with her have been
a great way to escape the bubble of scientific research. My extended family, especially
those in San Diego (the Blankenships: Kathy, Jay, Carrie, Richard, Corey, Nate, and
Cammie and the Aults: Frank, Evie, Jenny (and Mark), Heather (and Dave)) have been
great sources of support as well. In particular, Uncle Frank and Aunt Evie, have
supported me during my time in SD from the moment I got here all the way through my
defense. My good friend Dave Kayser helped me to develop an interest in math and
science in high school and has remained a good friend. My two running partners from
Carleton, Micah and Becky Johnson, who’ve run a marathon or half marathon together
with me each year for the last 6 years, have provided an excellent outlet and motivation
to keep in shape physically, as well as mentally, and are true friends. In San Diego, Chris
Johnson and Diana Schlamadinger have been constant sources of friendship and a good
laugh. The last two years have been much more fun after three friends from Carleton
moved to San Diego (Andy Ryan, Lexi Gelperin Ryan, and Yui Takeshita). I’ll miss our
trips to Pt. Loma Seafood and other adventures. My roommate of four years Andrew
Markley has been a great source of friendship and patience. Lastly, I must thank Dr. Kerri
Pratt who has inspired me with her quest for knowledge, passion for life, and devotion to
those she truly cares for. You have motivated me and believed in me when I didn’t
believe in myself; I can’t thank you enough for your faith in me, in us, and in our future. I
look forward to continuing our adventure together in the years to come more than you
xxii

can possibly imagine. All of the people listed above have supported and encouraged me
through the years in a variety of ways, and I feel truly blessed to have had their support.
The work in this dissertation was supported by the California Air Resources
Board (CARB), Department of Energy (DOE), Unified Port of San Diego, California
Energy Comission (CEC), and the Atmospheric Brown Cloud project funded under the
United Nations Environmental Programme and the National Oceanic and Atmospheric
Administation (NOAA). I am very grateful for the DOE Global Change Education
Program (GCEP) Graduate Research Environmental Fellowship (GREF) that has
supported me at the end of my graduate school career. Specifically, Prof. Jeff Gaffney,
Milton Constantin, and Rose Etta Cox have been fantastic to work. My involvement in
the GCEP fellowship program has been a tremendously positive experience.
Chapter 2 is reproduced with permission from the American Chemical Society:
Ault, A.P., Moore, M.J., Furutani, H., and K.A. Prather, Impacts of emissions from the
Los Angeles port region on San Diego air quality during Regional Transport Events.
Environmental Science and Technology, 43 (10), 3500-3506, 2009.
Chapter 3 is reproduced with permission from the American Chemical Society:
Ault, A.P., Gaston, C.J., Wang, Y., Dominguez, G.l Thiemens, M.H., and K.A. Prather,
Characterization of the single particle mixing state of individual ship plume events
measured at the Ports of Los Angeles and Long Beach, Environmental Science &
Technology, 44 (6), 1954-1961, 2010.
Chapter 4 is in preparation for submission to Atmospheric Environment: Ault,
A.P., Creamean, J.M., and Prather, K.A., Mobile laboratory observations of temporal and
spatial variability within the coast urban aerosol.
xxiii

Chapter 5 has been submitted to Nature Geoscience: Ault, A.P., Williams, C.R.,
White, A.B., Neiman, P.J., Creamean, J.M., Gaston, C.J., Ralph, F.M., and K.A. Prather.
Potential Changes to California Orographic Precipitation Due to Transported Asian Dust.
Chapter 6 is in preparation for submission to the Atmosperhic Environment: Ault,
A.P., Zhu, A., Ramanathan, V., and K.A. Prather. Analysis of regionally transported
particles in Gosan, Korea by single particle mass spectrometry.
Chapter 7 is in preparation for submission to the Journal of Geophysical
Research: Ault, A.P., Pratt, K.A., Gross, D.S., Dall’Osto, M., Gaelli, M., Harrison, R.M.,
and K.A. Prather. An intercontinental overview of size-resolved chemical mixing state by
single particle mass spectrometry.
xxiv

VITA
2005 B.A. Chemistry, Carleton College
2005-2008 Teaching Assistant, Dept. of Chemistry & Biochemistry, University of
California San Diego
2005-2010 Graduate Research Assistant, Dept. of Chemistry & Biochemistry,
University of California, San Diego
2010 Ph.D. in Chemistry, University of California, San Diego
PUBLICATIONS
Rogers, J. E.; Hall, B. C.; Hufnagle, D. C.; Slagle, J. E.; Ault, A. P.; McLean, D. G.; Fleitz, Paul A.; Cooper, T. M. Effect of platinum on the photophysical properties of a series of phenyl-ethynyl oligomers. Journal of Chemical Physics (2005), 122(21). Ault, A.P.; Moore, M.J.; Furutani, H.; Prather, K.A. Impact of emissions from the Los Angeles port region on San Diego air quality during regional transport events. Environmental Science and Technology. 2009, 43(10), 3500-3506. Ault, A.P.; Gaston, C.J.; Wang, Y.; Dominguez, G.; Thiemens, M.H.; Prather, K.A. Characterization of the single particle mixing state of individual ship plume events measured at the Port of Los Angeles. Environmental Science Technology. 2010, 44(6), 1954-1961. Ault, A.P.; Creamean, J.M.; Prather, K.A. Mobile laboratory observations of temporal and spatial variability within the coastal urban aerosol, Atmospheric Environment, 2010, in preparation Ault, A.P.; Williams, C.R.; White, A.B.; Neiman, P.J.; Creamean, J.M.; Gaston, C.J.; Ralph, F.M.; Prather, K.A. Potential Changes to California Orographic Precipitation Due to Transported Asian Dust Nature Geoscience, 2010, submitted Creamean, J.M.; Ault, A.P.; Gaston, C.J.; Roberts, G.; Prather, K.A. Measurements of aerosol chemistry during new particle formation events at a remote rural site. Environmental Science and Technology, 2010, in preparation Ault, A.P.; Pratt, K.A.; Gross, D.S.; Dall’Osto, M.; Gaelli, M.; Harrison, R.M.; Prather, K.A. An intercontinental overview of size-resolved chemical mixing state by single particle mass spectrometry. Journal of Geophysical Research, 2010, in preparation
xxv

Creamean, J.M.; Hatch, L.E.; Ault, A.P.; Prather, K.A. Signature marine aerosol chemistry observed in an inland urban location during tropical cyclones. Geophysical Research Letters, 2010, in preparation Ault, A.P.; Zhu, A.; Ramanathan, V.; Prather, K.A. Analysis of regionally transported particles in Gosan, Korea by single particle mass spectrometry. Atmospheric Environment, 2010, in preparation Ault, A.P.; Moffet, R.C.; Prather, K.A. Chemical and optical properties of transported carbonaceous and crustal species by single particle mass spectrometry. Geophysical Research Letters, 2010 in preparation
FIELDS OF STUDY
Major Field: Chemistry
Studies in Mass Spectrometry: Professor Kimberly A. Prather
Studies in Atmospheric Chemistry:
Professor Kimberly A. Prather
xxvi

ABSTRACT OF THE DISSERTATION
Investigations into the Impact of Transported Particles on Air Pollution and Climate
Using Aerosol Time-of-Flight Mass Spectrometry
by
Andrew Phillip Ault
Doctor of Philosophy in Chemistry
University of California, San Diego, 2010
Professor Kimberly A. Prather, Chair
Atmospheric aerosols have a significant impact on human health and climate, yet
the full scope of these influences are only beginning to be discovered and characterized.
To understand these impacts, detailed in-situ measurements of the physical, chemical,
and optical properties of aerosols are necessary. Aerosol time-of-flight mass spectrometry
(ATOFMS) provides the ability to measure chemical, physical, and optical properties of
single particles in real-time. This dissertation uses ATOFMS to explore both the
properties and evolution of particles as they are transported over local to global distances.
The results of numerous field studies are utilized to explore the changes to these particles
as they travel through the atmosphere from their source to eventual deposition.
xxvii

xxviii
Local to regional scale transport of particles was observed from a number of
perspectives in this dissertation. Particles regionally transported from the Ports of Los
Angeles and Long Beach to San Diego were identified chemically as ship and truck
emissions and shown to overwhelm local sources during peak transport conditions. Ship
emissions were studied in detail at the Port of Los Angeles by characterizing individual
ship plumes at a site adjacent to the main channel. Mobile laboratory measurements
demonstrated the variation in particle concentrations and composition on a local-to-
regional level.
On the intercontinental-to-global scale, Asian dust was observed in precipitation
samples collected in the Sierra Nevada Mountains during orographic precipitation. The
incorporation of the long range-transported dust might enhance precipitation, which may
alter California’s precipitation patterns and water supply. The outflow of particles from
Asia to North America were measured on a remote island off Korea, and the sources and
aging of particles in Chinese urban, Chinese dust, and Korean air masses were compared
to marine air masses. Lastly, ATOFMS studies from sites across North America, Asia,
Europe, and Africa were compared to determine similarities and differences in size-
resolved chemical mixing state of particles across numerous types of sampling sites, with
the objective being to provide information for global climate models to more accurately
represent particles. Taken together these results provide an increased understanding of
particle chemistry and transport on the scale of meters-to-continents.

1 Introduction
1.1 The Importance of Aerosols
Aerosols have an enormous impact on our world through human inhalation,
scattered solar radiation, and cloud droplet and ice crystal nucleation [Poschl, 2005].
From a human health perspective, high mass concentrations have been linked to
increased mortality [Pope, 2007] and certain types of aerosols have been linked to
specific deleterious health effects [Campen, et al., 2001;Pinkerton, et al., 2004]. Aerosols
have also been shown to have significant influences on climate, but our scientific level of
understanding of these processes is still low [Solomon, et al., 2007]. A small scale
example of these issues is understanding the role of aerosols on buffered systems such as
clouds [Stevens and Feingold, 2009]. While our understanding of aerosols has
dramatically increased in the last decade, a great deal remains to be learned as to their
effect on the whole earth system.
1.2 Aerosol Transport and Processing – Local Scale
One of the challenges in determining the effects of aerosols on climate and human
health is that they are constantly changing from the point of emission to the point of
deposition or inhalation. This occurs through processes such as condensation,
coagulation, heterogeneous reactions, and aqueous phase processing [Finlayson-Pitts and
Pitts, 2000]. Emissions from light duty vehicles (cars) and heavy duty vehicles (trucks)
have been studied extensively to determine changes as emissions age from the tailpipe
[Shields, et al., 2007;Sodeman, et al., 2005;Toner, et al., 2005]. Plumes from ships have
been studied to determine the size, concentrations, and lifetime of plumes in the boundary
1

2
layer [Petzold, et al., 2008]. Studies of power plant and refinery plumes at a coastal site
have observed marine, industrial, and crustal particles coagulating with one another
[Choel, et al., 2010]. Biomass emissions have been studied to look at changes in
chemistry [Yan, et al., 2008] and hygroscopicity [Petters, et al., 2009]. Aircraft emissions
have been investigated to look at changes due to heterogeneous chemistry during plume
evolution [Meilinger, et al., 2005]. Other local scale investigations of aerosol properties
include grass mowing [Drewnick, et al., 2008] and indoor air pollution [Dall'Osto, et al.,
2007].
1.3 Aerosol Transport and Processing – Regional Scale
The transport of aerosols on the time scale of hours to days after emission is
currently a topic of considerable interest in atmospheric chemistry. Recent studies have
investigated the changes occurring to particles as they are transported downwind from
urban areas [Moffet, et al., 2010], volcanic eruptions [Karagulian, et al., 2010], dust
storms [Sullivan, et al., 2007a], and other large sources like biomass burning [Paris, et
al., 2010]. Downwind of urban areas, the mass of organic carbon per particle increases
and the number of double bonds associated with elemental carbon decreases [Moffet, et
al., 2010]. Volcanic eruptions are found to initially have high concentrations of ash
particles, but after 1-2 days, large concentrations of sulfuric acid droplets are found in
these plumes [Karagulian, et al., 2010]. Asian dust and pollution outflow have also been
observed downwind of Asia within days to hours over both land [Chang, et al., 2010] and
the ocean [Bates, et al., 2004]. During dust storms, Asian outflow particles continue to
evolve after leaving the continent by taking up different secondary species as a function

3
of size [Sullivan, et al., 2007a] and serving as sinks for species that form in the plumes
[Sullivan, et al., 2007b].
1.4 Aerosol Transport and Processing – Intercontinental Scale
The fact that particles from one continent contribute significantly to the particle
concentrations of downwind continents has been established through multiple
measurements and models in the last decade [Uno, et al., 2009;VanCuren and Cahill,
2002;Yu, et al., 2008]. Particles transported from Asia have been shown to significantly
contribute to North American aerosol loadings through ground based measurements
[VanCuren and Cahill, 2002] and satellite measurements [Yu, et al., 2008]. In fact, dust
storms from Asia have been shown recently to circumnavigate the earth under certain
conditions [Uno, et al., 2009]. Recent advances in satellite data allow for the detailed
monitoring of Asian dust outbreaks during intercontinental transport [Yumimoto, et al.,
2009]. Outflow from Asia can also take a multilayered form with dust and pollution
mixed near the surface and a “clean” dust layer further aloft [Hara, et al., 2009]. The
chemical composition of aerosols transported intercontinentally has also recently
received considerable attention and multiple papers on this phenomenon have emerged
from the INTEX-B field campaign [Dunlea, et al., 2009;Fairlie, et al., 2010;Leaitch, et
al., 2009].
Although there have been recent advancements within the last 10-15 years about
the chemistry of transported particles, both locally and over vast distances, a great deal
remains to be learned, especially with respect to mixing state, which describes on a single
particle level which species are mixed. Aerosol uncertainties are still considerable from a
climate perspective [Solomon, et al., 2007] and also for more specific problems like

4
modeling intercontinental dust transport [Rastigejev, et al., 2010]. The research presented
in this thesis uses state-of-the-art instrumentation, specifically aerosol time-of-flight mass
spectrometry (ATOFMS), to provide detailed mixing state information of single particles
in real-time. These results provide a clearer picture of particle transport and evolution in
the atmosphere and assist modelers by providing experimental results for constraining
and improving aerosol representation in models.
1.5 Aerosol Time-of-Flight Mass Spectrometry (ATOFMS)
1.5.1 ATOFMS Background
ATOFMS was originally developed as a way to study the variable and complex
chemistry of atmospheric particles. The initial version of the instrument had two
significant limitations: it was not field portable, limiting its atmospheric range to
Riverside, California, and it was single polarity, allowing only positive or negative ions
to be studied at one time [Prather, et al., 1994]. A great deal of information about aerosol
chemistry was obtained from these initial experiments including: automobile emissions
[Silva and Prather, 1997], pyrotechnic emissions (a.k.a. fireworks) [Liu, et al., 1997],
biomass burning particles [Silva, et al., 1999], organic carbon particles [Silva and
Prather, 2000], and size-resolved chemical properties [Noble and Prather, 1996].
The desire to measure the diversity of aerosols in the world led to the
development of the transportable field instrument [Gard, et al., 1997] (Figure 1.1). Since
the development of the portable instrument, ATOFMS studies have been carried out on 3
continents (North America [Moffet, et al., 2008a], Europe [Dall'Osto and Harrison,
2006], and Asia [Spencer, et al., 2008]), on multiple research cruises [Furutani, et al.,
2008;Guazzotti, et al., 2003;Sullivan, et al., 2007a], and at numerous field sites across the

5
United States [Guazzotti, et al., 2001;Liu, et al., 2003;Pastor, et al., 2003;Shields, et al.,
2008;Su, et al., 2006]. A recently-developed version of the ATOFMS, the aircraft (A)-
ATOFMS permits sampling throughout the troposphere [Pratt, et al., 2009b] and has
yielded important findings through the first flights of a dual polarity, single-particle mass
spectrometer [Pratt, et al., 2009a]. ATOFMS has been utilized in over 100 peer reviewed
publications to date and continues to have a significant impact on our understanding of
aerosols.
1.5.2 The ATOFMS instrument
The converging nozzle inlet ATOFMS shown in Figure 1.1a [Gard, et al., 1997]
and the ultrafine (UF)-ATOFMS shown in Figure 1.1b [Su, et al., 2004] are the principle
instruments utilized in this thesis. These two instruments as well as the A-ATOFMS
[Pratt, et al., 2009b] draw particles into a differentially pumped vacuum chamber,
stepping down from atmospheric pressure to 10-7 torr or lower. Particles pass through an
inlet region, a light scattering and particle sizing region, and finally the mass
spectrometer region. Each of these regions is described below.

6
Figure 1.1 Schematic of the transportable ATOFMS with the nozzle inlet a) and aerodynamic lens inlet b). (Figure 1.1a Reprinted with permission from Gard, E., J.E. Mayer, B.D. Morrical, T. Dienes, D.P. Fergenson, and K.A. Prather, Real-time analysis of individual atmospheric aerosol particles: Design and performance of a portable ATOFMS, Analytical Chemistry, 69 (20), 4083-4091, Copyright 1997 American Chemical Society. Figure 1.1b Reprinted with permission from Su, Y.X., M.F. Sipin, H. Furutani, and K.A. Prather, Development and characterization of an aerosol time-of-flight mass spectrometer with increased detection efficiency, Analytical Chemistry, 76 (3), 712-719. Copyright 2004 American Chemical Society)

7
1.5.3 ATOFMS Aerosol Inlet
Initial versions of the ATOFMS utilized a converging nozzle inlet. The
converging nozzle inlet has its highest transmission in the 0.2 – 3.0 μm size range and
was utilized for the measurements reported in Chapters 2, 4, 5, 6, 7, and 8. After the
nozzle, particles pass through 2 skimmers (1.5 mm apart) that are used to collimate the
particle beam. As particles are initially accelerated in the instrument, they undergo a
supersonic expansion and are accelerated to a size-dependent terminal velocity. While
passing through the skimmer region, most gases are pumped away. After passing through
both skimmer stages, particles enter the light scattering region described below.
An aerodynamic lens inlet [Liu, et al., 1995a;Liu, et al., 1995b] was mated with
the ATOFMS to increase transmission at lower sizes than was possible with the
converging nozzle inlet and is referred to as the UF-ATOFMS [Su, et al., 2004]. The
peak transmission in the UF-ATOFMS is between 0.2-0.3 μm, with a range from 0.07-
1.00 μm. With the UF-ATOFMS, observations have been made of single particles in the
ultrafine size range (0.07 – 0.10 μm) during ambient studies [Shields, et al., 2008]. As
particles enter the instrument, they pass through a critical orifice (~ 100 μm inner
diameter) followed by a series of expansions and contractions through larger orifices that
serve to focus the particle beam along the central axis of the lens. The particles then pass
through a skimmer at which point most gases are pumped away and enter the particle
sizing region of the instrument. The UF-ATOFMS was utilized for measurements shown
in Chapter 3 and portions of Chapter 8.

8
1.5.4 ATOFMS Light Scattering and Particle Sizing Region
Particles that enter the light scattering region after passing through the particle
inlet and skimmer regions pass through two continuous wave Nd:YAG lasers placed 6
cm apart and operating at 532 nm. Scattering signal for single particles is collected with
photomultiplier tubes (PMTs) orthogonal to the incident laser beam (Figure 1.2). The
scattered light is focused by an ellipsoidal mirror for each scattering laser with the focal
point being the PMT. The electrical signal produced by the first PMT is used to initiate a
timing circuit. After receiving a signal from the second scattering laser, the time between
scatters is calculated and the particle speed is determined based off the calculated time
and set distance between the two lasers. The speed is then used to calculate the time when
the particle will arrive in the mass spectrometer source region 12 cm below the second
scattering laser. Not only is the particle speed used to calculate the timing for the mass
spectrometer region, but by running polystyrene latex spheres (PSLs) of known size and
density into the instrument, a calibration curve can be determined to convert particle
speed into aerodynamic diameter (Da). The calibration curve is frequently fit with a third-
order polynomial, although this does not work across the full range of ATOFMS and UF-
ATOFMS. Since the calibration curve is empirical, different fits (i.e. power law or fifth
order polynomial) are also used at times.

9
Figure 1.2 Schematic of ATOFMS light scattering region. (Figure 1.2 Reprinted with permission from Moffet, R.C., Qin, X., Rebotier, R., Furutani, H., and Prather, K.A., Chemically segregated optical and microphysical properties of ambient aerosols measured in a single-particle mass spectrometer, Journal of Geophysical Research, 113, D12213, Copyright 2008 American Geophysical Union.

10
A second feature of the light scattering region is that the light scattering signal can
be used to determine the optical properties (i.e. refractive index) of a subset of particles.
This method has been shown previously [Moffet and Prather, 2005;Moffet, et al., 2008b],
but is described briefly below. The area of the particle scattering response is converted to
a partial scattering cross section using Mie theory. This partial scattering cross section is
then plotted as a function of size, frequently revealing Mie “ripples” related to the
scattering pattern off of spherical particles. The upper limit of this distribution is then fit
and compared using a least squares model with a Mie model. As shown in Figure 1.3, as
the real part of the refractive index increases from that of water (1.33) the curves are seen
to “fall over” at lower scattering cross sections. The model fits to geometric diameter,
which is related to aerodynamic diameter by the Equation 1.1:
where Da is aerodynamic diameter, Dp is geometric diameter, χd is the dynamic shape
factor, C(Dp) is the Cunningham slip coefficient for the geometric diameter, C(Da) is the
Cunningham slip coefficient for the aerodynamic diameter, ρp is the particle density, and
ρ0 is the standard density. Thus, the density of a particle group can be determined by
using different density values to minimize the difference between the geometric
theoretical fit and the aerodynamic data. It is important to note that particles below 0.6
μm can have very similar refractive indices and it is useful to have a population of
particles above 0.6 μm to make the most accurate fit. This technique has been used in

11
multiple publications to explore the optical properties of atmospheric particles [Moffet
and Prather, 2009;Moffet, et al., 2008b].

12
Figure 1.3 Diagram demonstrating that many different combinations of refractive index (n) and size (or density) can give the same value for scattered intensity at sizes below 0.6 μm. Figure 1.3 from Moffet, R.C., Qin, X., Rebotier, R., Furutani, H., and Prather, K.A., Chemically segregated optical and microphysical properties of ambient aerosols measured in a single-particle mass spectrometer, Journal of Geophysical Research, 113, D12213, Copyright 2008 American Geophysical Union.

13
1.5.5 Laser Desorption/Ionization Time-of-Flight Mass Spectrometry
The timing calculated in the particle sizing region is used to determine when the
particle will be in the source region of the mass spectrometer. The timing signal is used to
fire a Q-switched Nd:YAG laser (266 nm) that desorbs and ionizes the particles in one
step. The ions created in the source region are then accelerated by sources plates in
opposite directions based on polarity. Each set of ions then passes through a field free
region before reaching reflectrons at the end of each flight tube. The reflectron serves to
increase mass resolution by decreasing differences in the initial kinetic energy
distribution. Ions then pass back through the field free region before striking a set of
multichannel plates (MCP) that transmit the signal to data acquisition boards in the data
collection computer. Ion optics and other improvements to the A-ATOFMS referenced
above have led to higher mass resolution, greater sensitivity, higher mass range, and
fewer mass spectral artifacts [Pratt, et al., 2009b]. All of the data in this instrument was
collected on the transportable dual polarity reflectron time-of-flight mass spectrometers
(ATOFMS and UF-ATOFMS).
1.6 Research Objectives and Scope of this Thesis
Ships represent one of the least regulated sources of anthropogenic aerosols and
efforts to regulate them have been limited by the difficulty of enforcing national laws on
international waters (i.e. > 20 km offshore) and the international scope of the businesses
involved in international shipping. Ships are well known to emit large quantities of
SO2(g), estimated at 2.4 tons annually on a global [Eyring, et al., 2005]. Large amounts of
this SO2 are converted to particulate sulfate, which represents up to 10% of sulfate mass

14
globally. While SO2 and NOx emissions have received considerably attention with
respect to ships [Capaldo, et al., 1999;Corbett and Fischbeck, 1997], metals that are
present in the low grade fuel that ocean-going ships often burn have not been studied in
nearly as much detail [Agrawal, et al., 2008a;Agrawal, et al., 2008b]. Those that have
studied it have focused on bulk techniques that cannot determine the particle mixing state
[Agrawal, et al., 2008a;Agrawal, et al., 2008b]. Chapter 2 of this thesis demonstrates the
impact that ship emissions can have regionally when transported. Also, a particle type
with a strong vanadium signature is identified and suggested to represent a marker for
ship emission transport from the Los Angeles port region. Chapter 3 follows up on
Chapter 2 by measuring individual ship plumes with ATOFMS at the Ports of Los
Angeles and Long Beach. Vanadium is shown to correlate highly with ships burning
bunker fuel and is hypothesized to facilitate the oxidation of SO2 to sulfate. This
potentially catalytic reaction helps to explain the order of magnitude greater
concentrations of sulfate and sulfuric acid on vanadium-containing particles in the
plumes. This work has the potential to improve global models predicting sulfate
concentrations by giving a more detailed description of the processes present in a typical
ship plume. Combined, these chapters strengthen our understanding of the nature of ship
emissions near the source and their long range impacts on coastal communities.
The detailed information measured by ATOFMS provides a snapshot of the
complex processes occurring in the atmosphere in real-time. One of the limitations of
these instruments is that there are only a limited number of them in the world and thus
only a few attempts have been made to measure the variation in particle chemistry over
short spatial distances with high time resolution. One such effort involved ATOFMS

15
instruments operating at Long Beach, Fullerton, and Riverside, California [Hughes, et al.,
2000]. Data were compared during trajectories that crossed all 3 sites, providing insight
into particle aging processes [Hughes, et al., 2000]. Chapter 4 in this thesis takes a
different approach by utilizing the ATOFMS mobile laboratory, which is powered by
generators to gain maximal flexibility in where and when sampling can take place. This
mobile laboratory developed as a key element of this thesis project provides the ability to
sample in multiple locations over the course of one day, thereby gaining multiple snap
shots that can be compared to study temporal and spatial variability of aerosols. The
mobile laboratory sampled at 5 sites in 1 day while sampling around San Diego Bay, a
record unlikely to be broken. The results of this study give us insight into how particle
physical and chemical properties vary around San Diego Bay on clean and polluted days.
In addition, the mobile laboratory is now a staple of ATOFMS field studies in California.
The influence of aerosols on clouds and precipitation is a relatively new focus of
study due to the difficulty in teasing apart the influence of dynamics versus aerosols in a
buffered system [Stevens and Feingold, 2009]. One challenge has been that the new and
complex tools necessary to measure each of these components with the resolution
necessary for comparison have not been combined until recently. Chapter 5 describes a
collaborative effort with the National Oceanic and Atmospheric Administration (NOAA)
to combine state-of-the-art meteorological measurements with detailed chemical analysis
from the ATOFMS. This chapter compares two storms with atmospheric rivers, a feature
responsible for the majority of California’s wintertime precipitation [Neiman, et al.,
2008]. While their integrated water vapor contents were similar, one storm was impacted
by transported Asian dust and one was not. This was observed experimentally by

16
ATOFMS analysis of precipitation samples, matching predictions based on the
Lagrangian transport model, FLEXPART [Stohl, et al., 2005]. The results described in
this chapter demonstrate the potential influence of aerosols on precipitation patterns and
intensity and establish a framework for exploring this field further on future field
campaigns.
Given the potential importance of Asian dust on North American climate as
described in Chapter 5, it is important to understand the properties of these transported
aerosols en route on their transcontinental journey. Chapter 6 describes measurements
made at Gosan on Jeju Island off the southern coast of South Korea. This sampling
location provides an optimal observational location since it is on the west coast of the
island and there is nothing but ocean between the site and China. With transport times of
roughly one day from China, the measurements at Gosan provide a detailed look at
particle composition and aging early in the process of long range transport. These
properties are compared with time periods when particles at the site came from sources
other than China.
Chapter 7 details an effort to describe similarities and differences across different
types of sampling locations by combining results from numerous ATOFMS field
campaigns from multiple groups. Field campaigns from 3 continents (Europe, North
America, and Asia) are compared and details on the size-resolved chemistry and
secondary mixing state are presented. It is hoped that by presenting both the strengths and
limitations of ATOFMS data that this paper can correct numerous persistent
misconceptions in the atmospheric community at large about single particle mass
spectrometry. This collaborative effort is aimed at providing a reference to modelers and

17
other aerosol and atmospheric scientists attempting to understand single particle mass
spectrometry measurements.

18
1.7 References
H. Agrawal, Q. G. J. Malloy, W. A. Welch, J. Wayne Miller and D. R. Cocker III, In-use gaseous and particulate matter emissions from a modern ocean going container vessel, Atmospheric Environment, 42 (21), 5504, 2008a.
H. Agrawal, W. A. Welch, J. W. Miller and D. R. Cocker, Emission Measurements from
a Crude Oil Tanker at Sea, Environ. Sci. Technol., 2008b. T. S. Bates, P. K. Quinn, D. J. Coffman, D. S. Covert, T. L. Miller, J. E. Johnson, G. R.
Carmichael, I. Uno, S. A. Guazzotti, D. A. Sodeman, K. A. Prather, M. Rivera, L. M. Russell and J. T. Merrill, Marine boundary layer dust and pollutant transport associated with the passage of a frontal system over eastern Asia, Journal Of Geophysical Research-Atmospheres, 109 (D19), 2004.
M. J. Campen, J. P. Nolan, M. C. J. Schladweiler, U. P. Kodavanti, P. A. Evansky, D. L.
Costa and W. P. Watkinson, Cardiovascular and thermoregulatory effects of inhaled PM-associated transition metals: A potential interaction between nickel and vanadium sulfate, Toxicological Sciences, 64 (2), 243-252, 2001.
K. Capaldo, J. J. Corbett, P. Kasibhatla, P. Fischbeck and S. N. Pandis, Effects of ship
emissions on sulphur cycling and radiative climate forcing over the ocean, Nature, 400 (6746), 743-746, 1999.
S. C. Chang, C. C. K. Chou, W. N. Chen and C. T. Lee, Asian dust and pollution
transport-A comprehensive observation in the downwind Taiwan in 2006, Atmospheric Research, 95 (1), 19-31, 2010.
M. Choel, K. Deboudt and P. Flament, Development of Time-Resolved Description of
Aerosol Properties at the Particle Scale During an Episode of Industrial Pollution Plume, Water Air And Soil Pollution, 209 (1-4), 93-107, 2010.
J. J. Corbett and P. Fischbeck, Emissions from ships, Science, 278 (5339), 823-824, 1997. M. Dall'Osto and R. M. Harrison, Chemical characterisation of single airborne particles
in Athens (Greece) by ATOFMS, Atmospheric Environment, 40 (39), 7614-7631, 2006.
M. Dall'Osto, R. M. Harrison, E. Charpantidou, G. Loupa and S. Rapsomanikis,
Characterisation of indoor airborne particles by using real-time aerosol mass spectrometry, Science Of The Total Environment, 384 (1-3), 120-133, 2007.
F. Drewnick, M. Dall'Osto and R. Harrison, Characterization of aerosol particles from
grass mowing by joint deployment of ToF-AMS and ATOFMS instruments, Atmospheric Environment, 42 (13), 3006-3017, 2008.

19
E. J. Dunlea, P. F. DeCarlo, A. C. Aiken, J. R. Kimmel, R. E. Peltier, R. J. Weber, J.
Tomlinson, D. R. Collins, Y. Shinozuka, C. S. McNaughton, S. G. Howell, A. D. Clarke, L. K. Emmons, E. C. Apel, G. G. Pfister, A. van Donkelaar, R. V. Martin, D. B. Millet, C. L. Heald and J. L. Jimenez, Evolution of Asian aerosols during transpacific transport in INTEX-B, Atmospheric Chemistry Physics, 9 (19), 7257-7287, 2009.
V. Eyring, H. W. Kohler, J. van Aardenne and A. Lauer, Emissions from international
shipping: 1. The last 50 years, Journal Of Geophysical Research-Atmospheres, 110 (D17), 2005.
T. D. Fairlie, D. J. Jacob, J. E. Dibb, B. Alexander, M. A. Avery, A. van Donkelaar and
L. Zhang, Impact of mineral dust on nitrate, sulfate, and ozone in transpacific Asian pollution plumes, Atmospheric Chemistry And Physics, 10 (8), 3999-4012, 2010.
B. J. Finlayson-Pitts and J. N. Pitts, Chemistry of the Upper and Lower Atmosphere:
Theory, Experiments, and Applications, Academic Press, San Diego, 2000. H. Furutani, M. Dall'osto, G. C. Roberts and K. A. Prather, Assessment of the relative
importance of atmospheric aging on CCN activity derived from field observations, Atmos. Environ., 42 (13), 3130-3142, 2008.
E. Gard, J. E. Mayer, B. D. Morrical, T. Dienes, D. P. Fergenson and K. A. Prather, Real-
time analysis of individual atmospheric aerosol particles: Design and performance of a portable ATOFMS, Analytical Chemistry, 69 (20), 4083-4091, 1997.
S. A. Guazzotti, D. T. Suess, K. R. Coffee, P. K. Quinn, T. S. Bates, A. Wisthaler, A.
Hansel, W. P. Ball, R. R. Dickerson, C. Neususs, P. J. Crutzen and K. A. Prather, Characterization of carbonaceous aerosols outflow from India and Arabia: Biomass/biofuel burning and fossil fuel combustion, Journal Of Geophysical Research-Atmospheres, 108 (D15), 2003.
S. A. Guazzotti, J. R. Whiteaker, D. Suess, K. R. Coffee and K. A. Prather, Real-time
measurements of the chemical composition of size-resolved particles during a Santa Ana wind episode, California USA, Atmospheric Environment, 35 (19), 3229-3240, 2001.
Y. Hara, K. Yumimoto, I. Uno, A. Shimizu, N. Sugimoto, Z. Liu and D. M. Winker,
Asian dust outflow in the PBL and free atmosphere retrieved by NASA CALIPSO and an assimilated dust transport model, Atmospheric Chemistry And Physics, 9 (4), 1227-1239, 2009.

20
L. S. Hughes, J. O. Allen, P. Bhave, M. J. Kleeman, G. R. Cass, D. Y. Liu, D. F. Fergenson, B. D. Morrical and K. A. Prather, Evolution of atmospheric particles along trajectories crossing the Los Angeles basin, Environmental Science & Technology, 34 (15), 3058-3068, 2000.
F. Karagulian, L. Clarisse, C. Clerbaux, A. J. Prata, D. Hurtmans and P. F. Coheur,
Detection of volcanic SO2, ash, and H2SO4 using the Infrared Atmospheric Sounding Interferometer (IASI), Journal Of Geophysical Research-Atmospheres, 115, 2010.
W. R. Leaitch, A. M. Macdonald, K. G. Anlauf, P. S. K. Liu, D. Toom-Sauntry, S. M. Li,
J. Liggio, K. Hayden, M. A. Wasey, L. M. Russell, S. Takahama, S. Liu, A. van Donkelaar, T. Duck, R. V. Martin, Q. Zhang, Y. Sun, I. McKendry, N. C. Shantz and M. Cubison, Evidence for Asian dust effects from aerosol plume measurements during INTEX-B 2006 near Whistler, BC, 9 (11), 3523-3546, 2009.
D. Y. Liu, D. Rutherford, M. Kinsey and K. A. Prather, Real-time monitoring of
pyrotechnically derived aerosol particles in the troposphere, Analytical Chemistry, 69 (10), 1808-1814, 1997.
D. Y. Liu, R. J. Wenzel and K. A. Prather, Aerosol time-of-flight mass spectrometry
during the Atlanta Supersite Experiment: 1. Measurements, Journal Of Geophysical Research-Atmospheres, 108 (D7), 2003.
P. Liu, P. J. Ziemann, D. B. Kittelson and P. H. McMurry, Generating Particle Beams Of
Controlled Dimensions And Divergence .1. Theory Of Particle Motion In Aerodynamic Lenses And Nozzle Expansions, Aerosol Science And Technology, 22 (3), 293-313, 1995a.
P. Liu, P. J. Ziemann, D. B. Kittelson and P. H. McMurry, Generating Particle Beams Of
Controlled Dimensions And Divergence .2. Experimental Evaluation Of Particle Motion In Aerodynamic Lenses And Nozzle Expansions, Aerosol Science And Technology, 22 (3), 314-324, 1995b.
S. K. Meilinger, B. Karcher and T. Peter, Microphysics and heterogeneous chemistry in
aircraft plumes - high sensitivity on local meteorology and atmospheric composition, Atmospheric Chemistry And Physics, 5, 533-545, 2005.
R. C. Moffet, B. de Foy, L. T. Molina, M. J. Molina and K. A. Prather, Measurement of
ambient aerosols in northern Mexico City by single particle mass spectrometry, Atmospheric Chemistry And Physics, 8 (16), 4499-4516, 2008a.
R. C. Moffet, T. R. Henn, A. V. Tivanski, R. J. Hopkins, Y. Desyaterik, A. L. D.
Kilcoyne, T. Tyliszczak, J. Fast, J. Barnard, V. Shutthanandan, S. S. Cliff, K. D.
21
Perry, A. Laskin and M. K. Gilles, Microscopic characterization of carbonaceous aerosol particle aging in the outflow from Mexico City, Atmospheric Chemistry And Physics, 10 (3), 961-976, 2010.
R. C. Moffet and K. A. Prather, Extending ATOFMS measurements to include refractive
index and density, Analytical Chemistry, 77 (20), 6535-6541, 2005. R. C. Moffet and K. A. Prather, In-situ measurements of the mixing state and optical
properties of soot with implications for radiative forcing estimates, Proceedings Of The National Academy Of Sciences Of The United States Of America, 106 (29), 11872-11877, 2009.
R. C. Moffet, X. Y. Qin, T. Rebotier, H. Furutani and K. A. Prather, Chemically
segregated optical and microphysical properties of ambient aerosols measured in a single-particle mass spectrometer, Journal Of Geophysical Research-Atmospheres, 113 (D12), 2008b.
P. J. Neiman, F. M. Ralph, G. A. Wick, J. D. Lundquist and M. D. Dettinger,
Meteorological characteristics and overland precipitation impacts of atmospheric rivers affecting the West Coast of North America based on eight years of SSM/I satellite observations, Journal of Hydrometeorology, 9 (1), 22-47, 2008.
C. A. Noble and K. A. Prather, Real-time measurement of correlated size and
composition profiles of individual atmospheric aerosol particles, Environmental Science & Technology, 30 (9), 2667-2680, 1996.
J. D. Paris, A. Stohl, P. Ciais, P. Nedelec, B. D. Belan, M. Y. Arshinov and M. Ramonet,
Source-receptor relationships for airborne measurements of CO2, CO and O-3 above Siberia: a cluster-based approach, Atmospheric Chemistry And Physics, 10 (4), 1671-1687, 2010.
S. H. Pastor, J. O. Allen, L. S. Hughes, P. Bhave, G. R. Cass and K. A. Prather, Ambient
single particle analysis in Riverside, California by aerosol time-of-flight mass spectrometry during the SCOS97-NARSTO, Atmospheric Environment, 37, S239-S258, 2003.
M. D. Petters, C. M. Carrico, S. M. Kreidenweis, A. J. Prenni, P. J. DeMott, J. L. Collett
and H. Moosmuller, Cloud condensation nucleation activity of biomass burning aerosol, J. Geophys. Res.-Atmos., 114, 2009.
A. Petzold, J. Hasselbach, P. Lauer, R. Baumann, K. Franke, C. Gurk, H. Schlager and E.
Weingartner, Experimental studies on particle emissions from cruising ship, their characteristic properties, transformation and atmospheric lifetime in the marine boundary layer, Atmos. Chem. Phys., 8 (9), 2387-2403, 2008.

22
K. E. Pinkerton, Y. M. Zhou, S. V. Teague, J. L. Peake, R. C. Walther, I. M. Kennedy, V. J. Leppert and A. E. Aust, Reduced lung cell proliferation following short-term exposure to ultrafine soot and iron particles in neonatal rats: Key to impaired lung growth?, Inhalation Toxicology, 16, 73-81, 2004.
C. A. Pope, Mortality effects of longer term exposures to fine particulate air pollution:
Review of recent epidemiological evidence, Inhalation Toxicology, 19, 33-38, 2007.
U. Poschl, Atmospheric aerosols: Composition, transformation, climate and health
effects, Angewandte Chemie-International Edition, 44 (46), 7520-7540, 2005. K. A. Prather, T. Nordmeyer and K. Salt, Real-Time Characterization Of Individual
Aerosol-Particles Using Time-Of-Flight Mass-Spectrometry, Analytical Chemistry, 66 (9), 1403-1407, 1994.
K. A. Pratt, P. J. DeMott, J. R. French, Z. Wang, D. L. Westphal, A. J. Heymsfield, C. H.
Twohy, A. J. Prenni and K. A. Prather, In situ detection of biological particles in cloud ice-crystals, Nature Geoscience, 2 (6), 397-400, 2009a.
K. A. Pratt, J. E. Mayer, J. C. Holecek, R. C. Moffet, R. O. Sanchez, T. P. Rebotier, H.
Furutani, M. Gonin, K. Fuhrer, Y. X. Su, S. Guazzotti and K. A. Prather, Development and Characterization of an Aircraft Aerosol Time-of-Flight Mass Spectrometer, Analytical Chemistry, 81 (5), 1792-1800, 2009b.
Y. Rastigejev, R. Park, M. P. Brenner and D. J. Jacob, Resolving intercontinental
pollution plumes in global models of atmospheric transport, Journal Of Geophysical Research-Atmospheres, 115, 2010.
L. G. Shields, X. Y. Qin, S. M. Toner and K. A. Prather, Detection of ambient ultrafine
aerosols by single particle techniques during the SOAR 2005 campaign, Aerosol Science And Technology, 42 (8), 674-684, 2008.
L. G. Shields, D. T. Suess and K. A. Prather, Determination of single particle mass
spectral signatures from heavy-duty diesel vehicle emissions for PM2.5 source apportionment, Atmospheric Environment, 41 (18), 3841-3852, 2007.
P. J. Silva, D. Y. Liu, C. A. Noble and K. A. Prather, Size and chemical characterization
of individual particles resulting from biomass burning of local Southern California species, Environmental Science & Technology, 33 (18), 3068-3076, 1999.
P. J. Silva and K. A. Prather, On-line characterization of individual particles from
automobile emissions, Environmental Science & Technology, 31 (11), 3074-3080, 1997.

23
P. J. Silva and K. A. Prather, Interpretation of mass spectra from organic compounds in
aerosol time-of-flight mass spectrometry, Analytical Chemistry, 72 (15), 3553-3562, 2000.
D. A. Sodeman, S. M. Toner and K. A. Prather, Determination of single particle mass
spectral signatures from light-duty vehicle emissions, Environmental Science & Technology, 39 (12), 4569-4580, 2005.
S. Solomon, D. Qin, M. Manning, Z. Chen, M. Marquis, K. B. Averyt, M. Tignor and H.
L. Miller, Climate Change 2007: The Physical Science Basis. Contribution of Working Group 1 to the Fourth Assessment Report of the Intergovernmental Panel on Climate Change,Cambridge University Press, Cambridge, United Kingdom and New York, NY, USA, 2007.
M. T. Spencer, J. C. Holecek, C. E. Corrigan, V. Ramanathan and K. A. Prather, Size-
resolved chemical composition of aerosol particles during a monsoonal transition period over the Indian Ocean, 113 (D16), 2008.
B. Stevens and G. Feingold, Untangling aerosol effects on clouds and precipitation in a
buffered system, Nature, 461 (7264), 607-613, 2009. A. Stohl, C. Forster, A. Frank, P. Seibert and G. Wotawa, Technical note: The
Lagrangian particle dispersion model FLEXPART version 6.2, Atmos. Chem. Phys., 5, 2461-2474, 2005.
Y. X. Su, M. F. Sipin, H. Furutani and K. A. Prather, Development and characterization
of an aerosol time-of-flight mass spectrometer with increased detection efficiency, Analytical Chemistry, 76 (3), 712-719, 2004.
Y. X. Su, M. F. Sipin, M. T. Spencer, X. Y. Qin, R. C. Moffet, L. G. Shields, K. A.
Prather, P. Venkatachari, C. H. Jeong, E. Kim, P. K. Hopke, R. M. Gelein, M. J. Utell, G. Oberdorster, J. Berntsen, R. B. Devlin and L. C. Chen, Real-time characterization of the composition of individual particles emitted from ultrafine particle concentrators, Aerosol Science And Technology, 40 (6), 437-455, 2006.
R. C. Sullivan, S. A. Guazzotti, D. A. Sodeman and K. A. Prather, Direct observations of
the atmospheric processing of Asian mineral dust, Atmospheric Chemistry And Physics, 7, 1213-1236, 2007a.
R. C. Sullivan, S. A. Guazzotti, D. A. Sodeman, Y. H. Tang, G. R. Carmichael and K. A.
Prather, Mineral dust is a sink for chlorine in the marine boundary layer, Atmospheric Environment, 41 (34), 7166-7179, 2007b.

24
S. M. Toner, L. G. Shields, D. A. Sodeman and K. A. Prather, Using mass spectral source signatures to apportion exhaust particles from gasoline and diesel powered vehicles in a freeway study, Abstracts Of Papers Of The American Chemical Society, 229, U127-U127, 2005.
I. Uno, K. Eguchi, K. Yumimoto, T. Takemura, A. Shimizu, M. Uematsu, Z. Y. Liu, Z. F.
Wang, Y. Hara and N. Sugimoto, Asian dust transported one full circuit around the globe, Nature Geoscience, 2 (8), 557-560, 2009.
R. A. VanCuren and T. A. Cahill, Asian aerosols in North America: Frequency and
concentration of fine dust, J. Geophys. Res.-Atmos., 107 (D24), 2002. B. Yan, M. Zheng, Y. T. Hu, S. Lee, H. K. Kim and A. G. Russell, Organic composition
of carbonaceous aerosols in an aged prescribed fire plume, Atmospheric Chemistry And Physics, 8 (21), 6381-6394, 2008.
H. B. Yu, L. A. Remer, M. Chin, H. S. Bian, R. G. Kleidman and T. Diehl, A satellite-
based assessment of transpacific transport of pollution aerosol, Journal Of Geophysical Research-Atmospheres, 113 (D14), 2008.
K. Yumimoto, K. Eguchi, I. Uno, T. Takemura, Z. Liu, A. Shimizu and N. Sugimoto, An
elevated large-scale dust veil from the Taklimakan Desert: Intercontinental transport and three-dimensional structure as captured by CALIPSO and regional and global models, Atmos. Chem. Phys., 9 (21), 8545-8558, 2009.

2 Impact of Emissions from the Los Angeles Port Region on
San Diego Air Quality during Regional Transport Events
2.1 Synopsis
Oceangoing ships emit an estimated 1.2–1.6 million metric tons (Tg) of PM10 per
year and represent a significant source of air pollution to coastal communities. As shown
herein, ship and other emissions near the Los Angeles and Long Beach Port region
strongly influence air pollution levels in the San Diego area. During time periods with
regional transport, atmospheric aerosol measurements in La Jolla, California show an
increase in 0.5-1 m sized single particles with unique signatures including soot, metals
(i.e. vanadium, iron, and nickel), sulfate, and nitrate. These particles are attributed to
primary emissions from residual oil sources such as ships and refineries, as well as traffic
in the port region, and secondary processing during transport. During regional transport
events, particulate matter concentrations were 2-4 times higher than typical average
concentrations from local sources, indicating the health, environmental, and climate
impacts from these emission sources must be taken into consideration in the San Diego
region. Unless significant regulations are imposed on shipping-related activities, these
emission sources will become even more important to California air quality as cars and
truck emissions undergo further regulations and residual oil sources such as shipping
continue to expand.
25

26
2.2 Introduction
Atmospheric aerosols regionally and globally impact climate and health.
Regionally transported particles contribute significantly to PM2.5 as observed in multiple
studies [Allen and Turner, 2008;Lall and Thurston, 2006]. Oceangoing ships emit an
estimated 1.2–1.6 million metric tons (Tg) of PM10 per year [Corbett and Koehler, 2003]
and the 2006 California Air Resources Board emissions inventory estimates that ships
emit more PM2.5 (4.94 tons/day) than refineries and power plants combined (3.45
tons/day), representing the second highest PM mobile source in Los Angeles County
behind diesel trucks (5.87 tons/day) [C.A.R.B., 2006]. In coastal regions, models show a
significant impact from the emissions of ships and residual fuel combustion on air
pollution levels. Strong implications exist for human health [Capaldo, et al.,
1999;Corbett, et al., 2007;Vutukuru and Dabdub, 2008], but major uncertainties exist
regarding the spatial and seasonal variability of particulate pollution that need further
investigation [Martien, et al., 2003]. Field observations have confirmed that ships
produce significant amounts of soot, vanadium, nickel, and sulfate [Lu, et al., 2006;Xie,
et al., 2006]. Ships typically burn residual fuel oil, which produces higher concentrations
of heavy metals and soot than distillate fuels such as gasoline and diesel [International
Standards Organization, 2005;Pattanaik, et al., 2007;Vallius, et al., 2003]. Additional
residual fuel oil sources, such as refineries, are often located near large ports and emit
metal-containing particles that are particularly harmful to human health [Eatough, et al.,
1984;Fang, et al., 2008;Jang, et al., 2007]. These deleterious effects can be explained by
the chemistry of the emissions as well as proposed synergistic relationships between
coemitted chemical species such as soot and iron or vanadium and nickel [Campen, et al.,

27
2001;Pinkerton, et al., 2004;Zhou, et al., 2003]. Recent studies in the Los Angeles and
Long Beach (LA-LB) port region have shown vanadium as having the strongest
correlation to reactive oxygen species using a macrophage assay [Hu, et al., 2008]. These
negative health effects combined with the transport of particles from residual fuel
combustion make it imperative to determine their contributions to the air pollution in
coastal locations along the California coast.
Regionally transported air pollution has been shown to influence the San Diego
region in previous studies. Aircraft measurements have shown O3 transport from the Los
Angeles (LA) basin and SO2 transport from offshore to San Diego [Kauper and
Niemann, 1977]. Particles transported from LA have also been observed in San Diego at
an urban freeway location by aerosol time-of-flight mass spectrometry (ATOFMS)
[Toner, 2007]. This paper discusses distinct episodes quantifying the impact of regional
transport when the air masses originated near the vicinity of the Port of LA observed by
real-time single particle mass spectrometry at the Scripps Institution of Oceanography
(SIO) Pier in La Jolla, California. During these transport periods, the highest
concentrations of submicron carbonaceous and transition metal particles (V, Ni, and Fe)
were measured. This study examines the impact of these transported aerosols on PM
concentrations in the San Diego region.
2.3 Experimental
2.3.1 Scripps Institution of Oceanography Pier 2006 Study
From August 17 to October 3, 2006, sampling was conducted at the end of the
SIO Pier, three hundred meters from shore. Ambient particles were sampled through a
four meter mast, seven meters above the pier, and fifteen meters above the ocean.

28
Different instruments sampled in parallel through insulated sampling lines. A five hour
period of sampling on September 28, 2006 was dominated by submicron particles from a
local wildfire, as determined by the ATOFMS mass spectral signatures, and because the
focus of this paper is on regional transport impacts, this period is not discussed. Particle
size distributions were optically measured using an aerodynamic particle sizer
spectrometer (APS 3321, TSI Inc.), which measures size distributions between 0.5-3 m.
Air mass back trajectory calculations were made using HYSPLIT 4.8 [Draxler and
Rolph, 2003].
2.3.2 Real-Time Single-Particle Mass Spectrometry
The aerodynamic size and chemical composition of individual particles between
0.2 and 3.0 μm were measured in real-time using an aerosol time-of-flight mass
spectrometer (ATOFMS); the design and details have been described in detail elsewhere
[Gard, et al., 1997]. Briefly, particles are introduced into the ATOFMS through a
converging nozzle into a differentially pumped vacuum chamber where they are
accelerated to a terminal velocity. The particles then pass through two continuous wave
lasers (diode pumped Nd:YAG lasers operating at 532 nm) located 6 cm apart. The
velocity of each particle is used to determine the aerodynamic size using speeds from
calibration with polystyrene latex spheres of known aerodynamic size, shape, and
density. The sized particles are then desorbed and ionized by irradiation from a Q-
switched Nd:YAG laser (266nm, 1.2-1.4 mJ/pulse) that is triggered when the particle
enters the center of the mass spectrometer ion source. Positive and negative ions from
each particle are detected using a dual-polarity, reflectron time-of-flight mass
spectrometer. During this study, ambient particles were dried using a silica gel diffusion

29
drier prior to analysis with the ATOFMS to decrease particle water content and,
therefore, increase negative ion signal intensities [Neubauer, et al., 1997]. The ATOFMS
sized and chemically analyzed 3,502,907 particles during the study.
2.3.3 Data Analysis
Single particle size and mass spectral information were analyzed with YAADA
1.2 (www.yaada.org) a data analysis toolkit for MATLAB 6.5.1 (The MathWorks, Inc.).
Particles were analyzed via two approaches: (1) searching mass spectral, aerodynamic
size, and temporal features and (2) clustering mass spectra using an adaptive resonance
theory based neural network algorithm (ART-2a) at a vigilance factor of 0.8 [Song, et al.,
1999]. ART-2a combines particles into clusters based on the intensity of ion peaks in
individual mass spectra. General particle types are defined by the characteristic chemical
species or possible source to simplify the naming scheme; these labels do not reflect all
of the species present within a specific particle type, but reflect the most intense ion
peaks. Peak identifications within this paper correspond to the most probable ions for a
given m/z ratio.
2.3.4 Scaling ATOFMS to Mass Concentrations
ATOFMS counts were scaled to number and mass concentrations using APS size-
resolved number concentrations, a method shown previously to yield quantitative mass
concentrations [Qin, et al., 2006]. Briefly, ATOFMS counts are binned into sizes that
correspond to the APS size bins (0.5-2.5 m) and scaling factors for each hour and size
bin are determined to account for ATOFMS transmission biases and busy time. After
scaling the number concentrations, density is used to convert from number to mass
concentrations. The bins were summed to give the mass of particulate matter less than 1

30
m (PM1) or less than 2.5 m (PM2.5). Scaled ATOFMS PM2.5 mass concentrations have
been shown previously to be well correlated with standard mass measurements, including
the beta attenuation monitor (BAM) and micro-orifice uniform deposit impactor
(MOUDI) [Qin, et al., 2006]. ATOFMS scaled PM1 concentrations have been shown to
track mass concentrations [Liu, et al., 2000;Qin, 2007]. Previous work has shown that
with high relative humidity [Moffet, et al., 2008] or liquid water content conditions
[Spencer, et al., 2007] particle density is low; thus, a density of 1.2 μg/m3 has been used
for the scaling herein due to an average relative humidity of 93% during sampling.
2.4 Results and Discussion
Figure 2.1 shows the PM concentrations measured over the full study,
highlighting the three high concentration regional transport periods. During many of the
regional events, daily PM concentration maxima were observed over several days due to
diurnal changes in wind speed and direction. Details on the impacts of the regional
events on PM concentrations are described below. Table 2.1 lists each identified regional
event with accompanying properties, discussed in detail in the following sections. The
fraction of PM1 contributing to PM2.5 is shown per hour in Figure 2.2. During submicron
events, PM1 mass accounted for 60% of the PM2.5 mass compared to 36% on average
during non-event periods.

31
Figure 2.1 A) The lower portion of the graph shows time series of scaled PM2.5 mass concentrations at the SIO Pier (red line) and PM2.5 data from downtown San Diego (black line). B) Hourly size distributions measured by an aerodynamic particle sizer (APS) from 0.5-1 m from August 17, 2006 – October 2, 2006. The overlaid blue line is the sum of ATOFMS counts in the 0.5-1 m size range per hour. C) Scaled PM1 (green line) and PM2.5 (red line) mass concentrations are shown over the sampling period. The gray dashed line represents the average PM1 mass concentration during the study, and the black dashed line represents the PM1 threshold set for regional events.

32
Table 2.1 Properties of different regional events are listed including: peak PM1 and PM2.5 mass concentrations, fraction of PM1 contributing to PM2.5 mass, and the mass percentage of V-Ni-Fe and ECOC particles contributing to the PM mass. 1
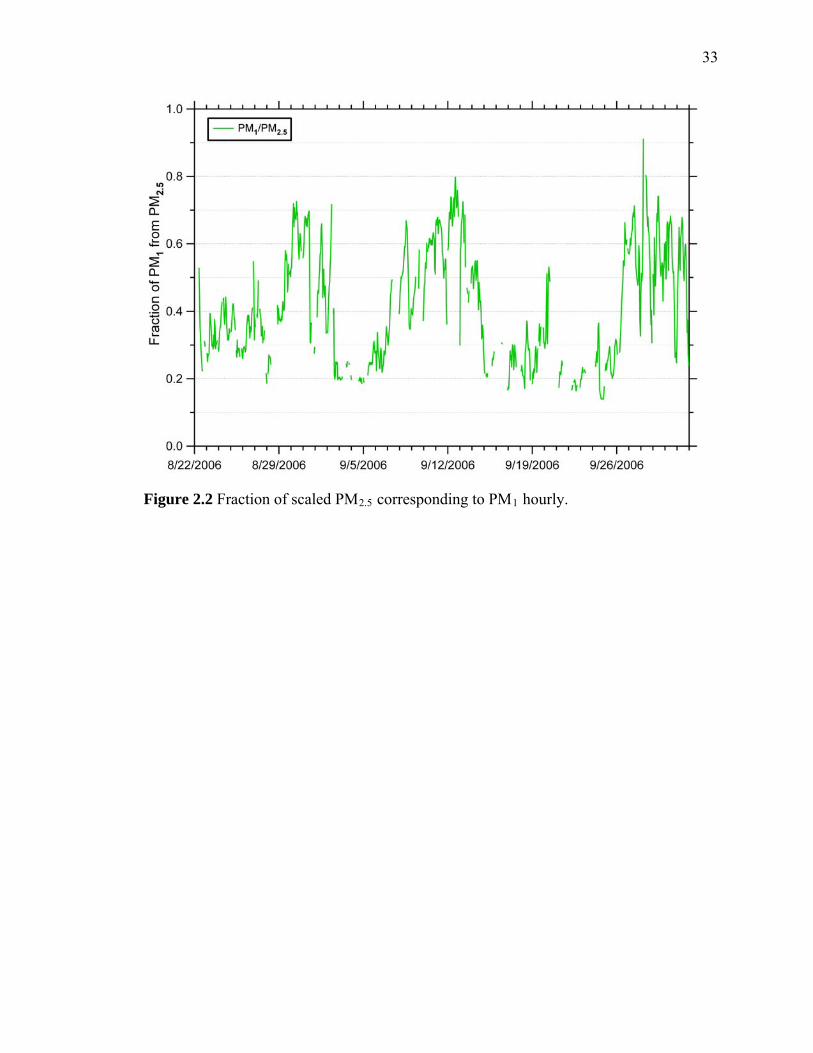
33
Figure 2.2 Fraction of scaled PM2.5 corresponding to PM1 hourly.

34
2.4.1 Mass Concentrations across San Diego County
To verify that the scaled PM values at the SIO Pier were reasonable, the PM2.5
measurements were compared to 3 other sites in San Diego County operated by the San
Diego Air Pollution Control District (SDAPCD). The average PM2.5 measured at the SIO
pier during the study (16 μg/m3) was similar to the other sites (downtown 10 μg/m3,
Escondido 18 μg/m3, and Alpine 16 μg/m3). The downtown San Diego site is the most
comparable site to the SIO Pier due to its close proximity and air mass back trajectory
patterns. Despite 12 miles separating the SIO Pier and downtown sites, similar trends in
PM2.5 mass were observed at both sites during the study (Figure 2.1a). This suggests that
these transport events described herein likely influence even larger portions of San Diego
County.
2.4.2 Identification of Regional Events
During sampling at the SIO pier, time periods with high submicron particle
concentrations were observed using average hourly submicron (0.5-1 m) size-resolved
particle concentrations from an APS. Trends in submicron ATOFMS particle counts are
correlated with submicron APS particle concentrations as shown in Figure 2.1b. The
relationship between the APS and ATOFMS submicron counts shows that, despite
transmission biases from the ATOFMS inlet, temporal variations in submicron ATOFMS
counts directly correspond to changes in atmospheric concentrations [Qin, et al.,
2006;Spencer, et al., 2008]. Multiple time periods showed elevated PM1 mass
concentrations. Figure 2.1c shows PM1 (blue line) versus PM2.5 (red line) mass
concentrations calculated using the APS, as described above. The average PM1
concentration during the study was 7 μg/m3 (dashed gray line); this represents an upper
35
limit because certain time periods with low particle concentrations were excluded from
the analysis as they did not have the requisite statistics for scaling the ATOFMS counts to
mass. Regional events are defined as any period when the peak PM1 mass was at least
twice the average PM1 concentration (14 g/m3). During regional events, PM1 accounted
for 52% of PM2.5 mass and 70% of PM2.5 number concentrations.
2.4.3 Air Mass History during Regional Events
To determine the source(s) of the submicron particles at the SIO pier, HYSPLIT
air mass back trajectories (48 hours) were calculated at 500 meters and patterns were
verified by comparing to back trajectories at 200, 400, 600, 800, and 1000 meters
[Draxler and Rolph, 2003]. Back trajectories calculated for the peak hour of each
submicron concentration spike are shown in Figure 2.3a. Many events had back
trajectories coming from the vicinity of the LA-LB Port region, while a small number of
additional events were more local and passed near the SD Port. These more local events
most likely still had contributions from LA-LB transport that stagnated over the region
for several days. Figure 2.3b shows air mass back trajectories during nonevent periods.
These air masses either came from the west over the ocean or from inland locations but
did not pass near the SD or LA-LB Ports.
Figure 2.3c groups the main air mass back trajectories by type (Port of LA-LB,
San Diego, inland, and oceanic) and includes how frequently each type was observed.
Back trajectories came from the vicinity of the Ports of LA-LB (32% of the sampling
period), the Port of SD (17%), inland (5%), and the ocean (46%). During periods when
the air masses came from the LA-LB Port region, regional events were observed 40% of
the time. Not all air mass back trajectories coming from the LA-LB port region produced

36
high concentration regional events. In order to create these conditions, high levels of
emissions at the port, consistent boundary layer height, relatively short air mass transport
times, and meteorological conditions all have to occur simultaneously. It is important to
note that the amount of ship traffic in the LA-LB Port region remained relatively constant
(25-40 major ships per day) and thus the major factor contributing to the regional events
appears to be proper meteorological conditions [Exchange, 2006]. Based on the
HYSPLIT trajectories, emissions from the Port of SD most likely contributed to two of
the events. When oceanic back trajectories occurred, no regional events were observed;
this indicates that ship traffic in the open ocean west of San Diego, which is much lower
than traffic near the ports, did not contribute significantly to San Diego air quality.
During regional transport periods when trajectories came from the LA-LB Port region, it
is likely additional sources and processes contributed along the way. Also, the very
limited recreational boating in close proximity to the pier and lower ship traffic at the
Port of San Diego (1% of LA-LB) leads to lower emissions compared to the Ports of LA-
LB and helps explain the lack of events during inland or oceanic time periods
[Authorities, 2006].

37
Figure 2.3 HYSPLIT (24 hour) back trajectory analysis at 500 meters for the peak hour of each regional event. Large diamonds represent 24 hours back from the source and small diamonds present 12 hours. A) Trajectories in red pass near the LA Port while trajectories in blue pass over the SD Port. B) Trajectories in purple are representative of non-transport time periods. C) The table included displays the frequency of different air mass types and source regions, as well as the number of regional events observed during each back trajectory type.

38
2.4.4 Particle Chemistry during Regional Transport Events
The most prevalent submicron particle types observed during these regional
events were external mixtures of soot, organic carbon, biomass burning, metals, and sea
salt. Figure 2.4 shows the average mass spectra of the two most common particle types
observed during the regional events. These included an elemental carbon (or soot)
particle type mixed with organic carbon, sulfate, nitrate and water, labeled as
ECOC(sulfate-nitrate). The second type included vanadium-nickel-iron particles mixed
with sulfate, nitrate, carbonaceous species, and water, labeled as V-Ni-Fe(sulfate-nitrate).
The particle labeling scheme used herein first indicates the most dominant peaks in the
positive ion particle spectra, followed by secondary species detected in the negative ion
spectra in parentheses. The positive ion peaks indicate the primary source of the
particles, whereas the negative ions provide insight into the atmospheric aging the
particles have undergone during transport. Notably, the primary source makes up a high
number fraction of particles, but the secondary species make up the bulk of the mass of
the particles. The mass spectra of the ECOC(sulfate-nitrate) or soot particles were
characterized by elemental carbon cluster ions (12C1+, 24C2
+,…, Cn+) with less intense
organic carbon markers (27C2H3+, 29C2H5
+, 37C3H+, and 43C2H3O+) [Spencer and
Prather, 2006]. The V-Ni-Fe(sulfate-nitrate) particle type is characterized by intense
peaks at 51V+ and 67VO+ with less intense iron (56Fe+) and nickel (58,60Ni+) ion peaks. It
should be noted that a small percentage of spectra in the other submicron particle types
showed minor vanadium and vanadium oxide peaks during these events. These mixtures
were most likely formed by coagulation processes, but only represented 2-5% of the total
particle spectra.

39
Figure 2.4 Average negative and positive ion mass spectra for a) ECOC(sulfate-nitrate) and b) V-Ni-Fe(sulfate-nitrate) particles. c) Time series of hourly ECOC(sulfate-nitrate) and V-Ni-Fe(sulfate-nitrate) particle type counts.

40
2.4.5 General submicron particle types
Average mass spectra of each particle type (beyond ECOC(sulfate-nitrate) and V-
Ni-Fe(sulfate-nitrate)) are shown in Figure 2.5 and described below. Elemental carbon
particles were identified by carbon cluster ions (12C1, 24C2,…, Cn) as the dominant peaks
in the positive and negative ion mass spectra, as well as sulfate and nitrate ions (97HSO4-,
62NO3-, and 46NO2
-), markers that are associated with aging [Spencer and Prather, 2006].
Organic carbon particles have intense ion markers at 27C2H3+, 29C2H5
+, 37C3H+, and
43C2H3O+ [Spencer and Prather, 2006]. Biomass burning particles have a dominant
potassium peak (39K+), as well as elemental and organic carbon marker ions. This
particle type also has a significant sulfate ion peak (97HSO4-) and a minor 213K3SO4
+
peak (not shown) which has been linked previously with biomass burning [Qin and
Prather, 2006;Silva, et al., 1999]. Sea salt particles were identified by 23Na+, 62Na2O+,
63Na2OH+, and 81,83Na2Cl+ [Spencer, et al., 2008]. Sea salt with soot particles were
characterized by an intense 23Na+ peak, elemental carbon cluster ions, organic markers,
and other sea salt ion peaks (m/z 62, 63, 81, and 83). This particle type is formed from
coagulation of SS and ECOC particles during transport [Holecek, et al., 2007;Spencer, et
al., 2008].

41
Figure 2.5 Average negative and positive ion mass spectra for the top six particle types (excluding ECOC and V-Ni-Fe which are discussed previously: a) Elemental carbon, b) Organic carbon, c) Biomass Burning, d) Sea salt, e) Sea salt with soot.
42
2.4.6 Sulfate Formation and Aging Processes during Transport
It is important to note that a high percentage (30-80%) of particles did not
produce negative ion mass spectra. Based on optical measurements of single particles
with similar chemical signatures [Moffet, et al., 2008], water has been shown to remain
on the particles which can suppress negative ion formation [Neubauer, et al.,
1997;Neubauer, et al., 1998]. The larger (0.5-1 m) size of these particles also suggests
they have undergone a significant amount of chemical aging during transport. The aging
processes include condensation of secondary species, aqueous phase processing of SO2,
as well as coagulation with pre-existing sulfate marine background particles [Hughes, et
al., 2000].
Due to high SO2 concentrations in the port region coupled with high average
ambient relative humidity (~93%), it is likely that the particles acquired sulfate due to
SO2 oxidative processing when initially formed. In addition, the particles most likely
picked up additional secondary species (sulfate and nitrate), water soluble organic
carbon, and water during transport. This is supported by the fact that for both particle
types, the limited particles with negative ion mass spectra showed a major bisulfate ion
peak (97HSO4), as well as nitrate ion peaks (46NO2 and 62NO3). The observations from
this study, along with a previous study in the southern California coastal region showing
marine background particles with high levels of sulfate, suggest that the ECOC and V-Ni-
Fe particles are likely composed of relatively small primary particle cores mixed with
sulfate, nitrate, and water [Hughes, et al., 2000]. Similar observations in previous studies
of single soot particles, where core sizes of less than 0.2 m were observed [Moffet and
Prather, 2008], show that sulfate and nitrate species contribute the majority of the mass

43
to these aged particles. Previous work has also shown that sulfate is associated with ship
emissions at the source [Agrawal, et al., 2008b;Agrawal, et al., 2008c]. Concurrent filter-
based triple oxygen isotope measurements of sulfate at the SIO Pier estimate that ships
represent 10-44% of non-sea salt sulfate mass concentrations below 1.5 m [Dominguez,
et al., 2008]. These co-located isotope measurements also suggest the ECOC(sulfate-
nitrate) and V-Ni-Fe(sulfate-nitrate) particles acquired significant quantities of sulfate
and water at the point of emission as well as through secondary aging processing during
transport.
2.4.7 Temporal Variations by Particle Type
Figure 2.6 shows the scaled a) relative fractions and b) contributions to PM1 mass
of the different submicron particle types by hour throughout the study. The black line
shows the hourly PM1 mass concentrations (μg/m3). The particle type representing the
majority of submicron mass varies strongly with the concentration of submicron mass.
When PM1 levels were high (>14 μg/m3), soot and V-Ni-Fe particles accounted for 24-
86% (52% average) of submicron mass. Sea salt, the primary background submicron
particle type, represented a significant fraction of submicron particles (75-80%) during
periods when the lowest PM1 mass concentrations were observed and PM1 was the
smallest fraction of PM2.5. These represent marine background periods with high wind
speeds. Biomass burning and organic carbon showed low correlations with PM1 (R2 =
0.09 and R2 = 0.11), suggesting these particle types did not come from the same sources
as most of the submicron particles detected at the pier.
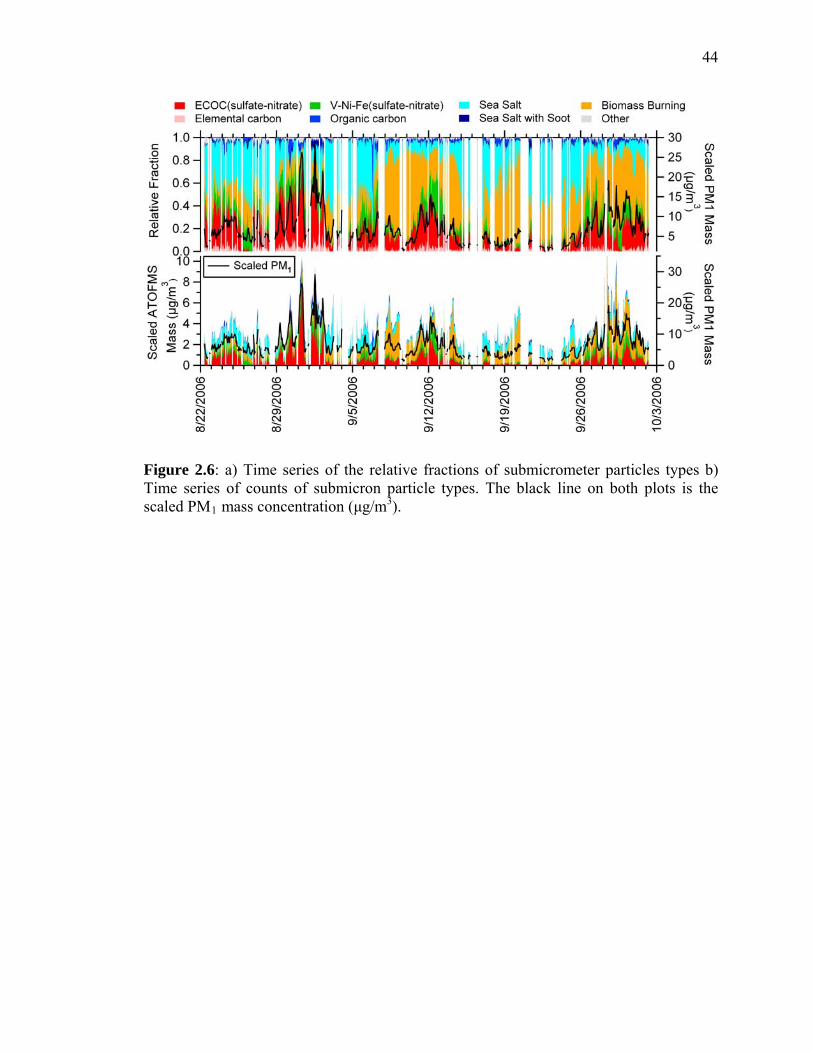
44
Figure 2.6: a) Time series of the relative fractions of submicrometer particles types b) Time series of counts of submicron particle types. The black line on both plots is the scaled PM1 mass concentration (μg/m3).

45
2.4.8 Correlation between Major Particle Types
Metal-containing particles composed of trace amounts of V, Fe, and Ni mixed
with carbonaceous species are primarily emitted from residual fuel combustion processes
and as such have limited sources, including ships and refineries [Agrawal, et al.,
2008a;Reinard, et al., 2007]. Since no refineries exist in San Diego or Orange County
and residual fuel is burned only on large ocean-going vessels, this limits likely sources to
ships from the Ports of LA-LB and Port of SD, as well as refineries near the Ports of LA-
LB. ECOC particles represent a general type produced by most combustion sources,
including diesel truck and automobile emissions [Sodeman, et al., 2005;Toner, et al.,
2008]; however the larger sizes observed (> 0.5 m) and low percentage of particles with
negative ion mass spectra, indicate that the particles were highly aged and not from local
vehicle sources. Figure 2.4c shows the high correlation (R2 = 0.64) observed between the
number concentrations of V-Ni-Fe(sulfate-nitrate) particles and ECOC(sulfate-nitrate)
particles with one hour resolution. Ships burn a variety of fuels (i.e. distillate and
residual) that produce the soot and V-Ni-Fe(sulfate-nitrate) particle types in different
proportions [Agrawal, et al., 2008c;Ault, et al., 2008], that depend on the type of engine,
fuel, and operating conditions. The temporal correlation of the V-Ni-Fe(sulfate-nitrate)
and ECOC(sulfate-nitrate) particle types (Figure 2.4c) and the significant contributions to
PM1 mass (Figure 2.7) during regional events suggests that these two particle types
originate from the same source and/or source region. Figure 2.8 below shows one specific
event where a strong correlation between the mass concentrations of ECOC(sulfate-
nitrate) and V-Ni-Fe(sulfate-nitrate) for a regional event and the number of ship radio
contacts for that period. This occurred during the period with the most rapid (6 hours)

46
transport from the LA-LB Port to the pier. In general, the number of ship counts in the
LA-LB Port region was relatively constant. As described, meteorology, rather than a
change in source emissions, appeared to control the high concentrations and regional
events observed at the SIO Pier during this study.
2.4.9 Size-Resolved Chemistry of Regional Events
The size-resolved chemical mass distributions, calculated using the APS method
discussed above, are shown for the average of regional events (Figure 2.7a) as well as the
average of non-event time periods for comparison (Figure 2.7b). Regional events showed
higher mass concentrations across all submicron sizes (4.7-6.5 µg/m3) when compared to
non-event time periods (2.9-3.8 µg/m3). During regional events, the ECOC(sulfate-
nitrate) particles represent the most significant fraction of submicron mass in each bin
(35-44%), while V-Ni-Fe(sulfate-nitrate) particles contribute 10-19% of particle
submicron mass. Note that this is a unique single particle perspective of the mass
fractions, and it focuses on the mass fraction of the entire particle type. As previously
noted, the majority of the mass of these particles was most likely sulfate, nitrate, and
water, as well as a smaller amount of carbonaceous species from residual oil and
secondary organic carbon. Soot mixed with sea salt, which has been observed in previous
studies during long range transport episodes, showed higher mass concentrations during
the event periods [Holecek, et al., 2007]. These particles were most likely formed by
coagulation processes occurring during the longer transport periods. Non-event time
periods had much lower ECOC(sulfate-nitrate) (4-22%) and V-Ni-Fe(sulfate-nitrate) (2-
10%) mass fractions, showing significantly higher fractions of background particle types.
These background types included more sea salt (16-81%) and biomass burning (9-43%)

47
than sea salt (4-28%) and biomass burning during (11-28%) regional events. During these
periods, PM1 mass represents only 36% of PM2.5 compared with 60% during regional
events. The increase in the overall PM mass and contributions from ECOC(sulfate-
nitrate) and V-Ni-Fe(sulfate-nitrate) during regional events shows the major influence of
transported emissions on San Diego air quality. Notably, these transported aerosols
(ships, refineries, and port vehicle traffic) make much higher contributions to PM
concentrations than local San Diego sources during these events.
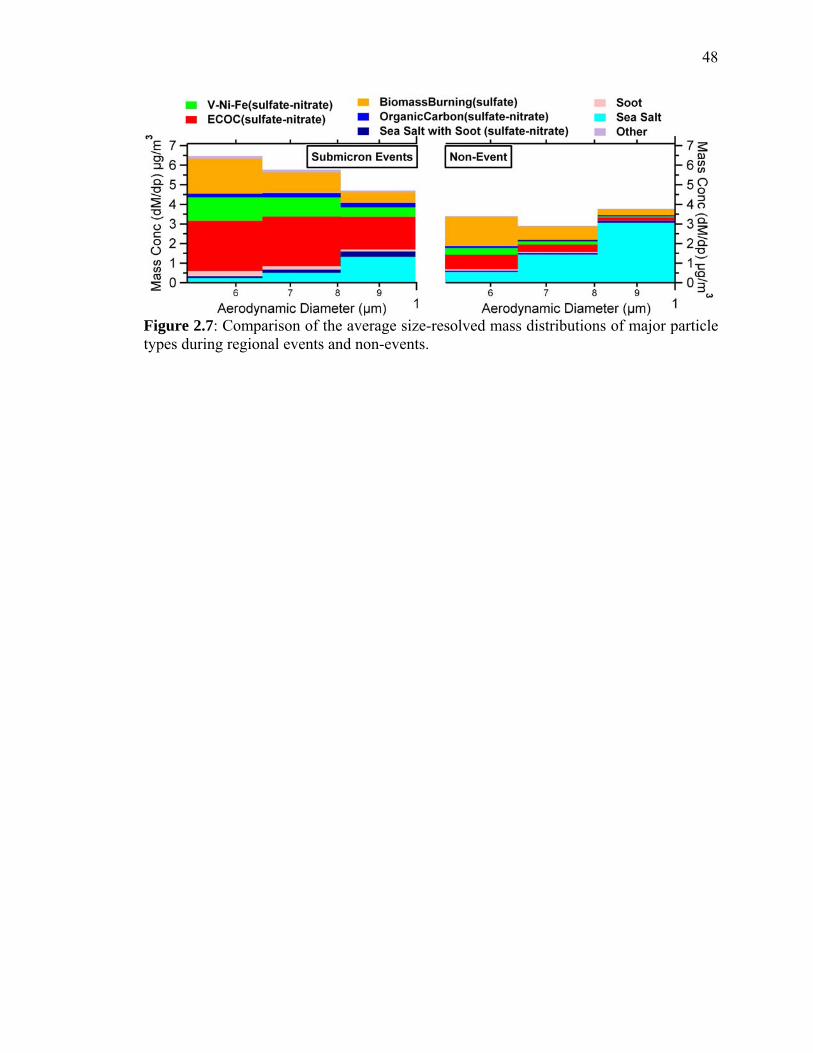
48
Figure 2.7: Comparison of the average size-resolved mass distributions of major particle types during regional events and non-events.

49
2.4.10 Correlation between Ships at Sea and Selected Particle Types
Radio transmissions of the location, speed, and heading were recorded in real time
for ships in Southern California waters with an automated identification system (AIS)
antenna in La Jolla, CA and binned as the number of transmissions per hour
[Organization, 2000]. These transmissions are required for ships at sea over 299 gross
tons every minute by the International Maritime Organization (IMO). Figure 2.8 shows
one major regional transport event, based on HYSPLIT back trajectories, from September
12-13 with the black line representing the number of recorded ship positions per hour.
The transport time from the LA-LB port region during this particular event was ~6 hours
and the peak in radioed positions occurred roughly 5-7 hours before the peaks in V-Fe-Ni
and ECOC particles, suggesting ships were a contributor to the increase in particle
concentrations. To observe this strong correlation required many conditions including
favorable meteorology, air mass direction and speed, meteorology favorable to radio
transmissions, and a sharp spike in the number of ships at sea. This correlation occurred
only one time during sampling, but provides further evidence that the LA-LB port region
is a significant source of PM in San Diego.

50
Figure 2.8 Time series of hourly counts of the ECOC and V-Ni-Fe particle types during 6 day period with ship positions recorded per hour.
51
2.4.11 Impact of Regional Events
Regional transport periods resulted in PM1 mass concentrations that were
increased by a factor of 2-4, showing how strongly ships, refineries, vehicles, and other
port combustion sources from the Ports of Los Angeles and Long Beach impact air
quality in the San Diego area. Emissions transported 12 miles north from the Port of San
Diego, while less frequent, most likely mixed with regionally transported emissions and
play a role in lowering the overall air quality of the San Diego region. Particles between
0.5-1 m contribute the most mass to PM1 and PM2.5 for the regional events. The
majority of the mass for these particles is likely a mixture of sulfate, nitrate, and water,
but identifying the core (ECOC or V-Ni-Fe) is critical to identifying the original particle
source and allowing the proper regulations to be established. The adverse health effects
of residual fuel combustion particles, which contain a complex mixture of carbonaceous
and metals, on residents of San Diego county as well as other coastal cities could be quite
significant [Corbett, et al., 2007].
Long-term sampling at a coastal site with speciated aerosol number and mass
concentration measurements will shed further light on the frequency and intensity of
these transport periods and how they vary seasonally. The impact of regionally
transported pollution on receptor site locations beyond San Diego needs to be considered
when evaluating the health impacts of particles in urban and rural areas. These emissions
will become even more important as vehicle emissions become further regulated and
residual oil sources such as shipping continue to grow. The strong influence of regional
transport on San Diego air quality in comparison to the impact of local emissions
52
demonstrates the importance of monitoring and further regulating these sources in the
future.
2.5 Acknowledgements
The authors gratefully acknowledge Dr. Gerardo Dominguez and Prof. Mark
Thiemens for providing the ship tracking data. The authors acknowledge and thank Dr.
Ryan Sullivan, Lindsay Hatch, Margaret Yandell, Elizabeth Fitzgerald, and John Holecek
for their support and assistance with measurements at the SIO Pier. William Brick at the
San Diego Air Pollution Control District is thanked for sharing San Diego County PM2.5
mass concentrations. Funding was provided by the California Air Resources Board under
contracts 04-336 and 05-346. The authors gratefully acknowledge the NOAA Air
Resources Laboratory for the provision of the HYSPLIT transport model and READY
website (http://www.arl.noaa.gov/ready.html) used in this publication.
Chapter 2 is reproduced with permission from A. P. Ault, M. J. Moore, H.
Furutani, and K.A. Prather, Impact of Emissions from the Los Angeles Port Region on
San Diego Air Quality During Regional Transport Events, Environmental Science &
Technology, 43 (10), 3500-3506, 2009. Copyright 2009, American Chemical Society.

53
2.6 References
H. Agrawal, Q. G. J. Malloy, W. A. Welch, J. W. Miller and D. R. Cocker, In-use gaseous and particulate matter emissions from a modern ocean going container vessel, Atmospheric Environment, 2008a.
H. Agrawal, Q. G. J. Malloy, W. A. Welch, J. Wayne Miller and D. R. Cocker III, In-use
gaseous and particulate matter emissions from a modern ocean going container vessel, Atmospheric Environment, 42 (21), 5504, 2008b.
H. Agrawal, W. A. Welch, J. W. Miller and D. R. Cocker, Emission Measurements from
a Crude Oil Tanker at Sea, Environ. Sci. Technol., 2008c. D. T. Allen and J. R. Turner, Transport of atmospheric fine particulate matter: Part 1 -
Findings from recent field programs on the extent of regional transport within North America, Journal Of The Air & Waste Management Association, 58 (2), 254-264, 2008.
A. Ault, C. Gaston, Y. Wang, G. Dominguez, M. H. Thiemens and K. Prather, Single
Particle Mixing State of Individual Ship Plumes at the Port of Los Angeles, Environmental Science & Technology, in prep, 2008.
A. A. o. P. Authorities, 2006 U.S. Port Cargo Tonnage Rankings, American Association
of Port Authorities, 2006. C.A.R.B., Estimated Annual Average Emissions California Air Resources Board, 2006. M. J. Campen, J. P. Nolan, M. C. J. Schladweiler, U. P. Kodavanti, P. A. Evansky, D. L.
Costa and W. P. Watkinson, Cardiovascular and thermoregulatory effects of inhaled PM-associated transition metals: A potential interaction between nickel and vanadium sulfate, Toxicological Sciences, 64 (2), 243-252, 2001.
K. Capaldo, J. J. Corbett, P. Kasibhatla, P. Fischbeck and S. N. Pandis, Effects of ship
emissions on sulphur cycling and radiative climate forcing over the ocean, Nature, 400 (6746), 743-746, 1999.
J. J. Corbett and H. W. Koehler, Updated emissions from ocean shipping, Journal Of
Geophysical Research-Atmospheres, 108 (D20), 2003. J. J. Corbett, J. J. Winebrake, E. H. Green, P. Kasibhatla, V. Eyring and A. Lauer,
Mortality from ship emissions: A global assessment, Environmental Science & Technology, 41 (24), 8512-8518, 2007.
G. Dominguez, T. Jackson, L. Brothers, B. Barnett, B. Nguyen and M. H. Thiemens,
Discovery and measurement of an isotopically distinct source of sulfate in Earth's

54
atmosphere, Proceedings Of The National Academy Of Sciences Of The United States Of America, 105 (35), 12769-12773, 2008.
R. R. Draxler and G. D. Rolph, HYSPLIT (HYbrid Single Particle Lagrangian Integrated
Trajectory) v. 4.8 Model access via NOAA ARL READY Website NOAA Air Resources Laboratory, pp. (http://www.arl.noaa.gov/ready/hysplit4.html). Silver Spring, MD. , 2003.
D. J. Eatough, N. L. Eatough, M. W. Hill, N. F. Mangelson and L. D. Hansen,
Identification Of Vo2+ In Particles From The Flue Lines Of Oil-Fired Power-Plants, Environmental Science & Technology, 18 (2), 124-126, 1984.
T. M. Exchange, Ship Arrivals-Departures-Transfers Ports of Los Angeles/Long Beach,
The Marine Exchange, San Pedro, CA, 2006. S. C. Fang, E. A. Eisen, J. M. Cavallari, M. A. Mittleman and D. C. Christiani, Acute
changes in vascular function among welders exposed to metal-rich particulate matter, Epidemiology, 19 (2), 217-225, 2008.
E. Gard, J. E. Mayer, B. D. Morrical, T. Dienes, D. P. Fergenson and K. A. Prather, Real-
time analysis of individual atmospheric aerosol particles: Design and performance of a portable ATOFMS, Analytical Chemistry, 69 (20), 4083-4091, 1997.
J. C. Holecek, M. T. Spencer and K. A. Prather, Analysis of rainwater samples:
Comparison of single particle residues with ambient particle chemistry from the northeast Pacific and Indian oceans, Journal Of Geophysical Research-Atmospheres, 112 (D22), 2007.
S. Hu, A. Polidori, M. Arhami, M. M. Shafer, J. J. Schauer, A. Cho and C. Sioutas,
Redox activity and chemical speciation of size fractioned PM in the communities of the Los Angeles-Long Beach harbor, Atmos. Chem. Phys., 8 (21), 6439, 2008.
L. S. Hughes, J. O. Allen, P. Bhave, M. J. Kleeman, G. R. Cass, D. Y. Liu, D. F.
Fergenson, B. D. Morrical and K. A. Prather, Evolution of atmospheric particles along trajectories crossing the Los Angeles basin, Environmental Science & Technology, 34 (15), 3058-3068, 2000.
International Standards Organization, Petroleum products -- Fuels (class F) --
Specifications of marine fuels, 22 pp., 2005. H. N. Jang, Y. C. Seo, J. H. Lee, K. W. Hwang, J. I. Yoo, C. H. Sok and S. H. Kim,
Formation of fine particles enriched by V and Ni from heavy oil combustion: Anthropogenic sources and drop-tube furnace experiments, Atmospheric Environment, 41 (5), 1053-1063, 2007.

55
E. K. Kauper and P. L. Niemann, Los Angeles to San Diego three dimensional ozone study, ARB Contract Number A-6-090-30, 1977.
R. Lall and G. D. Thurston, Identifying and quantifying transported vs. local sources of
New York City PM2.5 fine particulate matter air pollution, Atmospheric Environment, 40, S333-S346, 2006.
D. Y. Liu, K. A. Prather and S. V. Hering, Variations in the size and chemical
composition of nitrate-containing particles in Riverside, CA, Aerosol Science And Technology, 33 (1-2), 71-86, 2000.
G. Lu, J. R. Brook, M. R. Alfarra, K. Anlauf, W. R. Leaitch, S. Sharma, D. Wang, D. R.
Worsnop and L. Phinney, Identification and characterization of inland ship plumes over Vancouver, BC, Atmospheric Environment, 40 (15), 2767-2782, 2006.
P. T. Martien, R. A. Harley, J. B. Milford and A. G. Russell, Evaluation of incremental
reactivity and its uncertainty in Southern California, Environmental Science & Technology, 37 (8), 1598-1608, 2003.
R. C. Moffet and K. Prather, Aging of soot captured with in situ measurements:
Implications for aerosol climate forcing, Proceedings Of The National Academy Of Sciences Of The United States Of America, Submitted, 2008.
R. C. Moffet, X. Y. Qin, T. Rebotier, H. Furutani and K. A. Prather, Chemically
segregated optical and microphysical properties of ambient aerosols measured in a single-particle mass spectrometer, Journal Of Geophysical Research-Atmospheres, 113 (D12), 2008.
K. R. Neubauer, M. V. Johnston and A. S. Wexler, On-line analysis of aqueous aerosols
by laser desorption ionization, International Journal Of Mass Spectrometry And Ion Processes, 163 (1-2), 29-37, 1997.
K. R. Neubauer, M. V. Johnston and A. S. Wexler, Humidity effects on the mass spectra
of single aerosol particles, Atmospheric Environment, 32 (14-15), 2521-2529, 1998.
I. M. Organization, International Convention on Safety of Life at Sea (SOLAS) Chapter
V, 2000. S. Pattanaik, F. E. Huggins, G. P. Huffman, W. P. Linak and C. A. Miller, XAFS studies
of nickel and sulfur speciation in residual oil fly-ash particulate matters (ROFA PM), Environmental Science & Technology, 41 (4), 1104-1110, 2007.
56
K. E. Pinkerton, Y. M. Zhou, S. V. Teague, J. L. Peake, R. C. Walther, I. M. Kennedy, V. J. Leppert and A. E. Aust, Reduced lung cell proliferation following short-term exposure to ultrafine soot and iron particles in neonatal rats: Key to impaired lung growth?, Inhalation Toxicology, 16, 73-81, 2004.
X. Y. Qin, Characterization of Ambient Aerosol Composition and Formation
Mechanisms and Development of Quantification Methodologies Utilizing ATOFMS, Doctoral Thesis thesis, University of California San Diego, La Jolla, 2007.
X. Y. Qin, P. V. Bhave and K. A. Prather, Comparison of two methods for obtaining
quantitative mass concentrations from aerosol time-of-flight mass spectrometry measurements, Analytical Chemistry, 78 (17), 6169-6178, 2006.
X. Y. Qin and K. A. Prather, Impact of biomass emissions on particle chemistry during
the California Regional Particulate Air Quality Study, International Journal Of Mass Spectrometry, 258 (1-3), 142-150, 2006.
M. S. Reinard, K. Adoua, J. M. Martini and M. V. Johnston, Source characterization and
identification by real-time single particle mass spectrometry, Atmospheric Environment, 41 (40), 9397-9409, 2007.
P. J. Silva, D. Y. Liu, C. A. Noble and K. A. Prather, Size and chemical characterization
of individual particles resulting from biomass burning of local Southern California species, Environmental Science & Technology, 33 (18), 3068-3076, 1999.
D. A. Sodeman, S. M. Toner and K. A. Prather, Determination of single particle mass
spectral signatures from light-duty vehicle emissions, Environmental Science & Technology, 39 (12), 4569-4580, 2005.
X. H. Song, P. K. Hopke, D. P. Fergenson and K. A. Prather, Classification of single
particles analyzed by ATOFMS using an artificial neural network, ART-2A, Analytical Chemistry, 71 (4), 860-865, 1999.
M. T. Spencer, J. C. Holecek, C. E. Corrigan, V. Ramanathan and K. A. Prather, Size-
Resolved Chemical Composition of Aerosol Particles During a Monsoonal Transition Period over the Indian Ocean, Journal Of Geophysical Research-Atmospheres, 2008.
M. T. Spencer and K. A. Prather, Using ATOFMS to determine OC/EC mass fractions in
particles, Aerosol Science And Technology, 40 (8), 585-594, 2006.

57
M. T. Spencer, L. G. Shields and K. A. Prather, Simultaneous measurement of the effective density and chemical composition of ambient aerosol particles, Environmental Science & Technology, 41 (4), 1303-1309, 2007.
S. M. Toner, Anthropogenic Particulate Source Characterization and Source
Apportionment Using Aerosol Time-of-Flight Mass Spectrometry, Doctoral Thesis thesis, University of California San Diego, La Jolla, 2007.
S. M. Toner, L. G. Shields, D. A. Sodeman and K. A. Prather, Using mass spectral source
signatures to apportion exhaust particles from gasoline and diesel powered vehicles in a freeway study using UF-ATOFMS, Atmospheric Environment, 42 (3), 568-581, 2008.
M. Vallius, T. Lanki, P. Tiittanen, K. Koistinen, J. Ruuskanen and J. Pekkanen, Source
apportionment of urban ambient PM2.5 in two successive measurement campaigns in Helsinki, Finland, Atmospheric Environment, 37 (5), 615-623, 2003.
S. Vutukuru and D. Dabdub, Modeling the effects of ship emissions on coastal air
quality: A case study of southern California, Atmospheric Environment, 42 (16), 3751-3764, 2008.
Z. Q. Xie, L. G. Sun, J. D. Blum, Y. Y. Huang and W. He, Summertime aerosol chemical
components in the marine boundary layer of the Arctic Ocean, Journal Of Geophysical Research-Atmospheres, 111 (D10), 2006.
Y. M. Zhou, C. Y. Zhong, I. M. Kennedy, V. J. Leppert and K. E. Pinkerton, Oxidative
stress and NF kappa B activation in the lungs of rats: a synergistic interaction between soot and iron particles, Toxicology And Applied Pharmacology, 190 (2), 157-169, 2003.
3 Characterization of the Single Particle Mixing State of
Individual Ship Plume Events Measured at the Port of Los
Angeles
3.1 Synopsis
Ship emissions contribute significantly to gaseous and particulate pollution
worldwide. To better understand the impact of ship emissions on air quality,
measurements of the size-resolved chemistry of individual particles in ship emissions
were made at the Port of Los Angeles using real-time, single-particle mass spectrometry.
Ship plumes were identified through a combination of ship position information and
measurements of gases and aerosol particles at a site 500 meters from the center of the
main shipping channel of the Port of Los Angeles. Single particles containing mixtures of
organic carbon, vanadium, and sulfate (OC-V-sulfate) resulted from residual fuel
combustion (i.e. bunker fuel), whereas high quantities of fresh soot particles (when OC-
V-sulfate particles were not present) represented distinct markers for plumes from
distillate fuel combustion (i.e. diesel fuel) from ships as well as trucks in the port area.
OC-V-sulfate particles from residual fuel combustion contained significantly higher
levels of sulfate and sulfuric acid than plume particles containing no vanadium. These
associations may be due to vanadium (or other metals such as iron) in the fuel catalyzing
the oxidation of SO2 to produce sulfate and sulfuric acid on these particles. Enhanced
sulfate production on OC-V-sulfate ship emission particles would help explain some of
the higher than expected sulfate levels measured in California compared to models based
on emissions inventories and typical sulfate production pathways. Understanding the
58

59
overall impact of ship emissions is critical for controlling regional air quality in the many
populated coastal regions of the world.
3.2 Introduction
Ship emissions represent one of the least regulated forms of anthropogenic
pollution due, in large part, to the challenges involved in establishing international
policies. Ship emissions impact climate by initiating cloud formation and altering the
Earth’s radiation budget [De Bock, et al., 2000;Kim, et al., 2008]. Ships emit high
concentrations of soot and heavy metals (i.e. vanadium and nickel) [Agrawal, et al.,
2008a;Isakson, et al., 2001], in addition to an estimated 2.4 tons of SO2 globally,
producing up to 10% of sulfate mass globally through atmospheric reactions [Eyring, et
al., 2005]. Over the next century, SO2 levels are predicted to rise significantly as global
commerce expands [Eyring, et al., 2005]. Ship emissions have been shown to have
negative effects on human health through exposure studies and epidemiological models
[Campen, et al., 2001;Corbett, et al., 2007;South Coast Air Quality Management District,
2008]. For example, inhaled vanadium particles are toxic and synergistic effects with
nickel and sulfate have been shown to enhance toxicity [Campen, et al., 2001]. To
develop effective strategies for reducing the impact of shipping on climate and health,
recent studies have focused on improving ship emission inventories, which are used to
estimate future scenarios for gas phase concentrations [Eyring, et al., 2009]. Efforts to
regulate shipping emissions have been difficult due to fuel and upgrade costs and
international dependence on foreign trade [Silverman, 2008;Wang, et al., 2007].
Particulate emissions from ships have been characterized by multiple analytical
methods including energy dispersive x-ray fluorescence measurements of particulate

60
matter on filters [Isakson, et al., 2001], ion chromatography (IC) of particulate matter
extracted from filters [Agrawal, et al., 2008a], real-time mass-based measurements [Lack,
et al., 2009;Murphy, et al., 2009], particle counters [Sinha, et al., 2003], cloud
condensation nuclei measurements [Murphy, et al., 2009], and size distribution
measurements [Isakson, et al., 2001]. These measurements have led to updated emission
inventories and emission factors for particle mass and particle number for ship emissions
[Lack, et al., 2009;Murphy, et al., 2009]. Real-time, single-particle mass spectrometry
has also been used to identify ship emissions at locations both near source regions and
after transport [Ault, et al., 2009;Healy, et al., 2009;Reinard, et al., 2007]. Herein, we
report in situ measurements of the size-resolved chemical mixing state of particles in
individual fresh ship plumes measured at the Port of Los Angeles.
3.3 Experimental
3.3.1 Sampling Information
Ambient air sampling was conducted from November 16–26, 2007 at the Port of
Los Angeles (LA) on Terminal Island in San Pedro, California. Particles were sampled
through a four meter sampling mast, seven meters above the ground, at a sampling site
500 meters east of the center of the main channel. Wind direction and speed were
measured using a R.M. Young wind monitor. Winds exhibited a consistent diurnal
pattern with southerly sea breezes during the day and light nocturnal land breezes from
the north. Radio transmissions of the location, speed, and heading of ships entering and
exiting the port were recorded in real-time with an automated identification system (AIS)
antenna in La Jolla, CA [Organization, 2000]. These transmission signals are required to

61
be sent every minute for ships at sea over 299 gross tons by the International Maritime
Organization.
3.3.2 Gas and Particle Peripheral Instrumentation
Gas phase measurements were made of NOx (Thermo Environmental Instruments
(TEI) Model 42C), O3 (TEI Model 49), and SO2 (TEI Model 43). Particle size
distributions were measured with a scanning mobility particle sizer (SMPS, TSI Model
3936L) operating from 10 – 600 nm at a time resolution of 5 minutes; black carbon (BC)
concentrations (ng/m3) were measured using an aethalometer (Magee Scientific AE31).
3.3.3 Aerosol Time-of-Flight Mass Spectrometry (ATOFMS)
The design and details of the ultrafine (UF)-ATOFMS used in this study are
described in detail elsewhere [Su, et al., 2004]. This instrument measured the size and
chemical composition of individual particles between 100-1000 nm during this study.
Briefly, particles are introduced into the UF-ATOFMS through an aerodynamic lens into
a differentially pumped vacuum chamber where the particles are accelerated to a size-
dependent velocity. Particles pass through two 532 nm continuous wave lasers located 6
cm apart. Particle speed is used to determine vacuum aerodynamic diameter by
calibration with polystyrene latex spheres of known size. Sized particles are individually
desorbed and ionized in the mass spectrometer source region by a 266 nm Q-switched
Nd:YAG laser (1.2-1.4 mJ). Positive and negative ions produced from individual
particles are detected using a dual-reflectron time-of-flight mass spectrometer.

62
3.3.4 Single Particle Analysis
During sampling at the Port of LA, the aerodynamic size and chemical
composition of 1,245,041 particles were analyzed using an UF-ATOFMS. Size and mass
spectral information were imported into MatLab 6.5.1 (The Mathworks Inc.) and
analyzed utilizing YAADA 1.2 (www.yaada.org). Individual particles were analyzed via
two methods: 1) mass spectral ion intensities, aerodynamic size, and temporal
information and 2) clustering via an adaptive resonance theory based neural network
algorithm (ART-2a) at a vigilance factor of 0.8 [Song, et al., 1999]. ART-2a classifies
individual particles into separate clusters based on the presence and intensity of ion peaks
in individual single-particle mass spectra. Peak identifications within this paper
correspond to the most probable ions for a given mass/charge (m/z) ratio. General particle
types are defined by their characteristic chemical species in an attempt to simplify the
naming scheme; these labels do not reflect all of the species present within a specific
particle class.
3.4 Results and Discussion
3.4.1 Ship Identification
Characteristics of each positively identified ship plume over a 10 day period are
listed in Table 3.1 which includes: the peak time of the observed plume, length of time
the plume was observed, calculated transport time from the point of emission to the peak
of the plume at the sampling location using wind speed, peak particle number
concentration, characteristic particle type, number of particles chemically characterized
by the UF-ATOFMS, and number fractions of OC-V-sulfate and fresh soot particles
present during the plume detection period. The times when different ships passed the

63
sampling location were determined through a combination of arrival and departure logs
[Exchange, 2007], AIS ship position recordings, and pictorial documentation. As an
example, Figure 3.1 shows the departure of the vessel Container1b on November 19,
2007 at 03:30 (PST). Red markers (1 minute resolution) represent the ship’s position as
recorded by the AIS, and the green diamond represents the sampling location. The blue
line shows the path of the plume (550 meters) to the sampling location based on
measured wind direction (292°) and speed (0.6 m/s). Ships that could be positively
identified by time, position, and wind speed/direction are analyzed in detail; however,
numerous ships and plumes passed the site during the sampling period that could not be
confidently assigned using the criteria listed above. Due to changing wind direction and
wind speed, calculated plume travel times to the sampling location varied from 5-20
minutes.

64
Table 3.1 Characteristics of ship plumes sampled including: Ship plume, plume peak time, plume duration, plume age, peak number concentration, identifying ATOFMS particle type, number of ATOFMS particles, number fraction of OC-V-sulfate particles, and number fraction of fresh soot particles.

65
Figure 3.1 Map showing the Port of LA. The green diamond represents the sampling location and the red markers and line represent the minute-resolved positions and course of a container ship as it departed from the Port of LA at 03:30 on November 19, 2007. The blue line represents the average wind direction during transport of the plume to the sampling location.

66
3.4.2 Plume Characterization
Characteristics of a representative plume observed on November 19, 2007 at
03:30 from the vessel Container1b are shown in Figure 3.2. The top portion shows SO2,
NO, NO2, and BC concentrations increasing sharply from background conditions at the
onset of the plume and O3 decreasing due to its reaction with NO forming NO2 [Isakson,
et al., 2001;Sinha, et al., 2003]. Gas phase data were used to qualitatively identify the
presence of ship plumes. The duration of this plume at the sampling site was ~15
minutes, which is similar to previously observed timescales (13.6 min) [Isakson, et al.,
2001]. Similar trends for gas phase species were observed in most plumes; Table 3.2 lists
SO2 and NOx concentrations during different plume events and provides a detailed
discussion of these events. The bottom portion of Figure 3.2 shows the temporal
evolution of the size-resolved particle number concentrations with 5 minute resolution
during the plume sampling period. A rapid increase in the total number concentrations of
10-600 nm particles (white line) occurred as the plume passed the sampling location,
doubling background levels from 5000/cm3 to 11,000/cm3. The mode and shape of the
size distribution did not shift significantly while sampling this plume. In other plumes,
changes in the size distribution were also observed.

67
Figure 3.2 Identification of the plume of Container1b. Gas phase measurements included SO2 (orange), NO (green), NO2 (red), and O3 (blue). Particle phase measurements were of black carbon (black), particle number concentration (white), and size-resolved number concentrations over time (color matrix).

68
3.4.3 In Plume Gas Phase Chemistry and Concentrations
The expected loss of O3 shown in Figure 3.2 theoretically should have a 1:1 ratio
to the gain in NOx (assuming NOx is primarily NO in a fresh plume), but this was not
observed. A number of factors may have contributed to this including: additional species
reacting with NO and O3 and the presence of aqueous particles and droplets that could
have scavenged gas phase species. The maximum concentrations of SO2, NOx, and O3
during the different ship plumes are given in Table 3.2, along with background
concentrations and the net concentration increase. The ratio of NOx/SO2 is also given
which can be an indicator of fuel type. Residual fuels have higher concentrations of
sulfur and thus produce higher concentrations of SO2, while distillate fuels have less
sulfur and produce less SO2 [International Standards Organization, 2005]. Changes in
the gas phase data to lower NOx/SO2 (ppbv/ppbv) ratios presented here correspond to
changes in particle chemistry in the plumes with higher levels of OC-V-sulfate particle
levels. In contrast, fresh soot plumes have higher NOx/SO2 ratios.

69
Table 3.2 Gas phase concentrations (max, baseline, and net change) of SO2, NOx, and Ozone during different plume events are shown along with the NOx/SO2 ratio.
NOx/SO2
Max Baseline Peak Max Baseline Peak Min Baseline Peak Ratio
Container1a 7.2 3.5 3.7 26.2 7.3 18.9 30.0 55.1 25.1 5.1
Container2 7.7 3.4 4.3 16.7 7.9 8.8 19.7 54.9 35.2 2.0
Container3 11.2 5.0 6.2 19.1 10.7 8.4 45.0 68.0 23.0 1.4
Container1b 12.5 7.4 5.1 18.9 7.7 11.2 14.0 45.8 31.8 2.2
Tanker1a* 47.7 18.5 29.2 160.0 58.0 102.0 No Min No Min N/A 3.5
Container4 10.7 4.1 6.6 39.5 14.9 24.6 27.8 57.1 29.3 3.7
Tanker1b 6.3 3.2 3.1 No Peak No Peak N/A No Min No Min N/A N/A
Container5 4.1 3.1 1.0 38.0 7.1 30.9 37.4 45.4 8.0 30.9
Tanker2 12.0 6.7 5.3 32.4 10.1 22.3 8.7 38.6 29.9 4.2
Container6 12.0 8.6 3.4 41.6 15.8 25.8 23.7 44.8 21.1 7.6
CruiseShip1 10.8 6.6 4.2 52.3 11.7 40.6 26.0 46.4 20.4 9.7
Container7 9.0 4.7 4.3 13.2 10.5 2.7 23.0 35.1 12.1 0.6
* night-time chemistry altered by land breeze in Long Beach leading to high NOx & SO2 levels, but low O3
SO2 (ppbv) NOx (ppbv) O3 (ppbv)

70
3.4.4 Unique Plume Chemistry
Two types of ship plumes were observed in this study based on unique chemical
characteristics: one with a large number fraction of internally mixed organic carbon,
vanadium, and sulfate (OC-V-sulfate) particles and a second with a large number fraction
of elemental carbon (EC) or soot particles with mass spectral signatures characteristic of
fresh EC emissions [Moffet and Prather, 2009]. The average mass spectrum of the OC-
V-sulfate particle type is shown in Figure 3.3a, showing intense vanadium peaks at 51V+
and 67VO+ and organic carbon markers including 27C2H3+, 29C H2 5
+, 37C H3+, and
43C H O2 3+, as well as a strong bisulfate ion signal (97HSO4
-). Notably, a sulfuric acid
cluster peak (195H SO •HSO2 4 4-) was observed on ~80% of these OC-V-sulfate particles.
In these plumes, the OC-V-sulfate type represented 10-34% of particles sampled in the
100-500 nm size range.

71
Figure 3.3 Average negative and positive ion mass spectra for the OC-V-sulfate (a) and fresh soot (b) particle types.

72
The average mass spectrum of the soot (or elemental carbon) particle type is
shown in Figure 3.3b, characterized by both positive and negative carbon cluster ions
(e.g., 12C1+, 24C2
+,…, Cn+). These particles did not contain significant sulfate or nitrate
ion markers, likely due to limited time for atmospheric aging between the point of
emission and sampling (~68% of fresh soot particles had no sulfate or nitrate marker).
This signature is typical of fresh emissions and has been detected during source tests of
cars burning gasoline and trucks burning distillate (i.e. diesel) fuel [Sodeman, et al.,
2005;Toner, et al., 2006]. The characteristic mass spectrum contrasts most background
particle types observed at the Port of LA, including other elemental carbon particles,
which contained significant amounts of nitrate and/or sulfate, as discussed below.
Detailed information on mass spectral variability within the OC-V-sulfate and fresh soot
types is included below. While other particle types were present within these plumes, the
OC-V-sulfate and fresh soot particle types were observed as characteristic source markers
for the two different plume types. Plumes were labeled as OC-V-sulfate and/or fresh soot
when each particle type represented greater than 5% of particles sampled during the
plume event.
Residual fuels used in shipping contain much higher concentrations of vanadium
and other metals than distillate fuels [International Standards Organization, 2005].
Previous ATOFMS source studies of cars and trucks show <1% of particles mixed with
vanadium [Sodeman, et al., 2005] and have noted the correlation of vanadium and sulfur
in ambient single particles and attributed these particles to fuel oil combustion [Lake, et
al., 2004]. The distinct OC-V-sulfate and fresh soot plumes likely result from the
73
combustion of different fuels, with residual fuel oil producing the OC-V-sulfate plumes
and distillate fuel forming the fresh soot plumes. The soot plumes also had elevated
levels of Ca-ECOC particles. The Ca-ECOC particle type has been linked to distillate
(i.e. diesel) fuel in previous ATOFMS source characterization studies [Toner, et al.,
2006]; the mass spectrum is shown in Figure 3.6 The presence of Ca-ECOC particles
agrees with filter measurements in a marine distillate exhaust study, which found calcium
to be ~25% of the relative weighted emission factor for trace elements compared to <5%
in residual fuel combustion exhaust [Agrawal, et al., 2008b]. While the average ratio of
NOx to SO2 (ppbv/ppbv) during the study was 3.7, it was lower in the OC-V-sulfate
plumes (average 2.6, range: 1.4-4.2) and higher in the soot plumes (average 11.6, range:
0.6-30.9). This suggests a relative enrichment of SO2 in the V-plumes as would be
expected when burning residual fuels with high sulfur content (max 3.5 % (m/m))
[International Standards Organization, 2005]. A study comparing an auxiliary engine
burning distillate fuel and a main engine burning residual fuel found significantly higher
vanadium levels associated with the residual fuel combustion and higher levels of
calcium with the distillate fuel combustion, which agrees with this study as well as
previous diesel source testing studies using the UF-ATOFMS [Agrawal, et al.,
2008b;Toner, et al., 2006]. In addition, the amount of sulfate measured by ion
chromatography (IC) during the study by Cocker et al. 2008 does not change significantly
with ship engine load for residual or distillate fuels [Agrawal, et al., 2008b]. This
supports the assignment of OC-V-sulfate particles to residual fuel combustion plumes
and the lack of OC-V-sulfate to distillate fuel combustion plumes [Agrawal, et al.,
2008a].

74
3.4.5 Details on the OC-V-sulfate and Fresh Soot Particle Types
The digital color stack (DCS) for the OC-V-sulfate particle type is shown in
Figure 3.4. The x-axis is mass-to-charge and the y-axis shows the fraction of particles
within this type containing a specific peak. The color represents the fraction of particles
with different peak areas; a peak area > 500 (arbitrary units) was used to exclude noise in
the spectra. The ion peaks with the largest fraction and highest intensity in the positive
spectrum are the mass to charges corresponding to vanadium (51V+ and 67VO+) and
organic carbon (27C2H3+, 36C3
+, 37C3H+, 41C3H5+, 43C3H3O+, etc.). These peaks are on
nearly 100% of the particles in this type. In the negative spectrum the most intense peak
is sulfate (97HSO4-) and over 95% of these particles have a peak area above 20,000.
These particles also have sulfuric acid (195H2SO4HSO4-) on ~80% of the particles, which
is even more striking when the transmission efficiency of ~49% at m/z 200 for the co-
axial ATOFMS is considered [Pratt, et al., 2009b]. It should be noted that the intensity of
the sulfate peak led to considerable ringing, which is seen by the continuum of lower
intensity peaks between m/z -98 to -110.

75
Figure 3.4 A digital color stack for the OC-V-sulfate particle type showing the fraction of particles containing a specific peak on the y-axis versus mass-to-charge on the x-axis. The color represents the fraction containing a specific range of peak areas, with 500 being the lower peak area cutoff. The top portion of the figure represents the positive mass spectrum and the bottom portion represents the negative mass spectrum.

76
Figure 3.5 A digital color stack for the fresh soot particle type showing the fraction of particles containing a specific peak on the y-axis versus mass-to-charge on the x-axis. The color represents the fraction containing a specific range of peak areas, with 500 being the lower peak area cutoff. The top portion of the figure represents the positive mass spectrum and the bottom portion represents the negative mass spectrum.

77
The digital color stack for the fresh soot particle type is shown in Figure 3.5, with
the same thresholds and range used in Figure 3.4. For Figure 3.5, intense peaks are
observed at mass-to-charges corresponding to carbon clusters (12C+, 36C3+, 48C4
+, …,
144C12+) in the positive plot (top). The negative (bottom) plot also shows a similar pattern
with respect to the carbon clusters (24C2-, 36C3
-, 48C4-, …, 120C10
-). What is notable about
the fresh soot type is that < 10% of the particles have a sulfate peak and 0% have a
sulfuric acid peak, demonstrating the difference between the two particle types produced
in different plumes.
3.4.6 Description of the Ca-ECOC Particle Type
Figure 3.6 shows the average mass spectrum of the Ca-ECOC particle type, which
is characterized by an intense calcium ion peak (40Ca+) and elemental carbon clusters in
both the positive (12C1+, 24C2
+,…, Cn+) and negative spectra (12C1
-, 24C2-,…, Cn
-). The
significance of this particle type is that it is enhanced by number along with the fresh soot
particle type in distillate fuel plumes. Previous studies have shown higher calcium mass
fractions in filter measurements from the stacks of ships burning distillate fuel compared
to residual fuel [Agrawal, et al., 2008a;Agrawal, et al., 2008b].

78
Figure 3.6 Average mass spectrum of the Ca-ECOC particle type from a fresh soot plume.

79
3.4.7 Background Particle Types During Plumes
Figures 3.7 and 3.8 show average mass spectra for the background particle types
measured before and after the plumes from Container1b and Container4. The mass
spectra of aged soot particles (Figures 3.7a and 3.8a) were characterized by elemental
carbon cluster ions (12C1+, 24C2
+,…, Cn+) with less intense organic carbon markers
(27C2H3+, 29C2H5
+, 37C3H+, and 43C2H3O+) [Spencer and Prather, 2006] and secondary
markers for sulfate (97HSO4-) and nitrate (62NO3
-). The biomass burning particle type is
shown in Figures 3.7b and 3.7b and is characterized by a dominant potassium ion peak
(39K+) with less intense elemental carbon markers (12C1+, 24C2
+,…, Cn+) and organic
carbon markers 27C2H3+, 29C2H5
+, 37C3H+, and 43C2H3O+ [Spencer and Prather, 2006].
The mass spectra of the V-background particle type (Figures 3.7c and 3.7c) are
characterized by intense peaks at 51V+ and 67VO+ with less intense iron (56Fe+) and nickel
(58,60Ni+) ion peaks. Note the lack of peaks (other than detector crosstalk) in the negative
spectrum which is commonly observed after particles undergo aging and take up
significant amounts of water, leading to negative ion suppression [Neubauer, et al.,
1997]. These particles have been shown in other marine environments and are likely
highly aged [Ault, et al., 2009]. Although they share a strong vanadium signal, the
temporal trend of the V-background particles did not correlate with those of the freshly
emitted OC-V-sulfate particles.
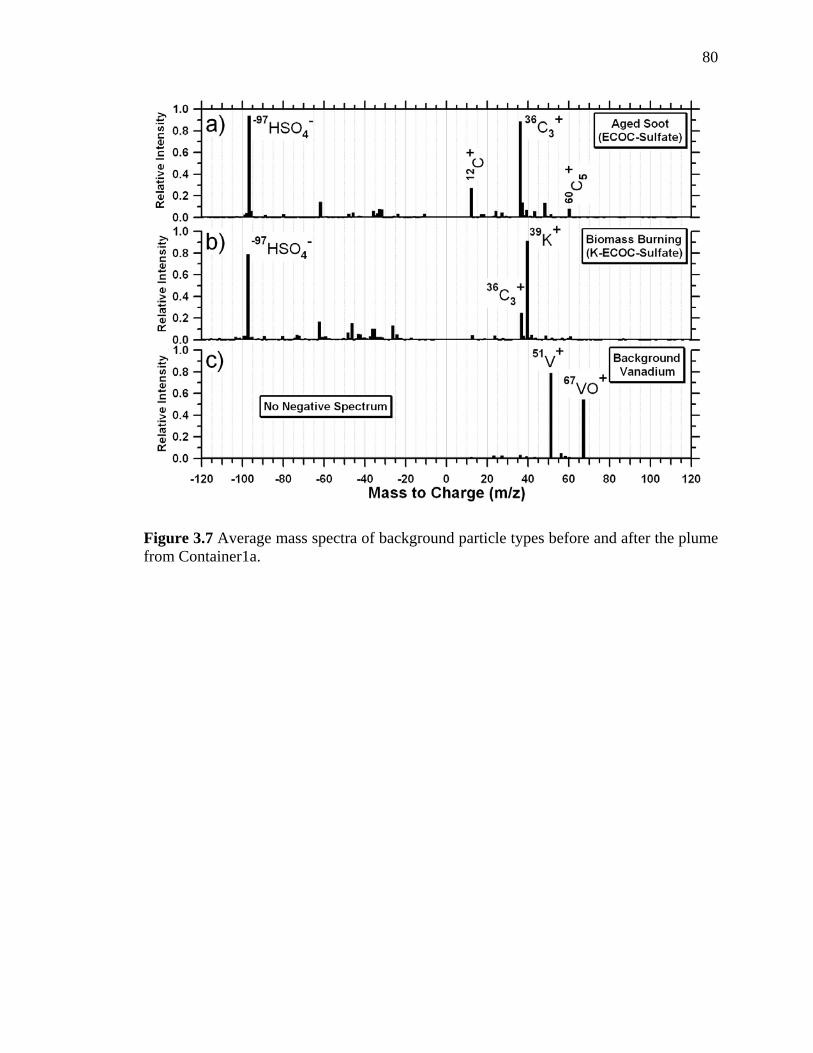
80
Figure 3.7 Average mass spectra of background particle types before and after the plume from Container1a.

81
Figure 3.8 Average mass spectra of background particle types from before and after the plume from Container4. CT represents crosstalk on the detector.

82
3.4.8 Temporal Trends
Figure 3.9 shows the time series of the number of OC-V-sulfate (Figure 3.9a) and
fresh soot particles (Figure 3.9b) analyzed by the UF-ATOFMS for the first 5 days of the
study. After this period, Santa Ana winds disrupted normal wind patterns, making the
presence of clear ship plume impacts less apparent. Both time series are characterized by
spikes lasting 5-20 minutes; however, as shown in Figure 3.9c, OC-V-sulfate and fresh
soot spikes frequently occur at different times. Over 65% of the spikes in OC-V-sulfate
particles could be correlated to specific ships. Only 15% of the fresh soot spikes
corresponded to specific ships, which is expected given that fresh soot is a more
ubiquitous particle type associated with many distillate fuel combustion sources including
trucks and tug boats [Lack, et al., 2008]. Some OC-V-sulfate plumes contained
significant fresh soot, while others did not, suggesting that the varying amount of fresh
soot in residual fuel combustion plumes may be due to different plume dynamics, engine
type and condition, operating conditions, as well as background levels and other emission
sources.

83
Figure 3.9 Time series of the differential counting rate (number of ATOFMS counts per 2 minutes) for the OC-V-sulfate and fresh soot particle types. Peaks that could be correlated with ships are labeled; plumes with asterisks were only tentatively identified.

84
3.4.9 Size-resolved Chemistry
The chemical composition as a function of aerodynamic diameter for the urban
background is shown before and after a residual combustion plume (Figure 3.10a) and a
distillate combustion plume (Figure 3.10b). This background is defined as 10 minutes
before the plume was detected until 10 minutes after the plume disappeared with the
plume itself subtracted out. The particle types associated with the background urban
aerosol included aged soot, potassium mixed with elemental carbon, and a background
vanadium type, as described in detail above. The background-specific particle types did
not exhibit a temporal pattern similar to the OC-V-sulfate or fresh soot types, suggesting
that they were not associated with the freshly emitted ship plumes.
Figures 3.10c & 3.10d show the size-resolved chemical composition for specific
ship plumes representing an OC-V-sulfate plume (Container4) and a fresh soot plume
(Container1a), respectively. The OC-V-sulfate particles in the residual fuel combustion
plume increased 10-25 times in less than 2 minutes from a nearly negligible background
level before the plume arrived (Figure 3.10a) to accounting for 28% of 150-500 nm
particles (Figure 3.10c). While the UF-ATOFMS was unable to chemically characterize
<100 nm particles, measurements of residual fuel combustion exhaust particles using
transmission electron microscopy with energy dispersive x-ray spectroscopy have
detected distinct peaks of sulfur and vanadium within particles between 30-100 nm in
diameter [Murphy, et al., 2009]. Thus, it is likely that the OC-V-sulfate particle type also
represents a significant fraction of the ultrafine particles emitted in residual fuel
combustion exhaust, especially as ultrafine particle concentrations measured by the
SMPS increased during plumes.
85
For the soot plume (Container1a), a unique mode was observed between 100 –
200 nm composed of fresh soot and Ca-ECOC particles. This differs from the majority of
the study when the center of the particle size mode was ~ 270 nm due to the combination
of inlet transmission efficiencies and ambient concentrations [Pratt, et al., 2009b], also
shown in Figure 3.10a, 3.10b, and 3.10c. However, during the fresh soot plume, particles
with small aerodynamic diameters (100-200 nm) and large geometric diameters (resulting
in increased scattering signals), were observed. Previous ATOFMS studies measuring
particle optical properties have shown that these 100-200 nm particles were non-
spherical, fractal agglomerates, typical of fresh soot [Moffet and Prather, 2008]. Also,
previous tandem measurements using a differential mobility analyzer in line with an
ATOFMS showed fresh soot particles having small aerodynamic diameters relative to
their geometric diameters for fractal particles with a low effective density [Spencer, et al.,
2007].

86
Figure 3.10 Size-resolved number fractions of the different particle types for the background before and after a) OC-V-sulfate (Container4) and b) fresh soot (Container1a) plumes. (c,d) Size-resolved chemical fractions of these plumes.

87
3.4.10 Correlation Between Sulfate and Vanadium Particles
Increasing sulfate levels represent a major concern globally [Kim, et al., 2008]
and have been shown to influence ship tracks [De Bock, et al., 2000]. For each of the
residual fuel combustion plumes with high fractions of OC-V-sulfate particles, the
number fraction of each particle type containing sulfate or sulfuric acid peaks were
determined, as well as the average intensity of each peak, which is related to the mass of
the species present [Bhave, et al., 2002;Pratt, et al., 2009a]. The OC-V-sulfate particles
within the residual fuel combustion plumes were observed to contain high concentrations
of sulfate and sulfuric acid, particularly when compared to other particle types both in
plumes and during background conditions. A representative OC-V-sulfate plume from
the ship labeled Container4 is described; four other plumes are described later in the text.
Within the Container4 plume, high number fractions of OC-V-sulfate particles contained
sulfate (100%) and sulfuric acid (56%) (Figure 3.11). In comparison, only 14-40% by
number of the remaining particle types within the plume contained sulfate, and almost
none (0-1%) contained sulfuric acid. In addition, average absolute peak areas
corresponding to sulfate and sulfuric acid were up to ~760 times greater and 7,000 times
greater, respectively, for the OC-V-sulfate particle type compared to the other particle
types within the plume (Figure 3.11). The measured sulfate and sulfuric acid peak areas
are also larger than previously measured in ATOFMS source combustion studies,
including cars burning gasoline [Sodeman, et al., 2005], trucks burning diesel [Toner, et
al., 2006], and biomass burning [Silva, et al., 1999].

88
Figure 3.11 Average sulfate (red circles) and sulfuric acid (blue circles) absolute peak areas for major particle types during the plume of the vessel Container4; errors are shown by 95% confidence intervals. Number fractions of particles containing sulfate (red diamond) and sulfuric acid (blue diamond) are shown. The inset shows a zoomed-in version of particle types with lower peak areas than the OC-V-sulfate type.

89
Several mechanisms could lead to the high measured levels of sulfate in the OC-
V-sulfate particles in the plume: 1) homogeneous formation of sulfuric acid in the gas
phase followed by condensation onto particles upon reaction with gas phase ammonia, 2)
heterogeneous production of sulfate and sulfuric acid on the surface of particles, and 3)
aqueous phase production within water-containing particles. It should be noted that other
possibilities exist that could contribute to the enhanced sulfate/sulfuric acid concentration
on OC-V-sulfate particles. Further laboratory and source testing is needed to confirm
whether the proposed hypothesis is actually occurring and quantify the concentrations of
sulfate and sulfuric acid that might be produced by these pathways. Of these mechanisms,
the gas phase process is too slow to explain the high levels of sulfate and sulfuric acid
formed on the particles within minutes of emission [Finlayson-Pitts and Pitts, 2000].
This is supported by a study showing that at high relative humidity, aqueous processing is
the main oxidation pathway [McMurry and Wilson, 1983]. Also, if sulfuric acid was
produced in the gas phase, it would likely react with ammonia and condense on all
particle surfaces present, thus forming sulfate on all particle types, not selectively on one
particle type (OC-V-sulfate) as observed in this study. Ammonium was observed on 31%
of all particles over the course of the study, however only 13% of OC-V-sulfate particles
during residual fuel combustion plumes had ammonium present and the ammonium ion
signal was quite small compared to the sulfuric acid signal. This indicates that sulfate is
being introduced into these particles via a different pathway, and we hypothesize that
given the rapid formation of sulfate on a selective subset of particles the most likely
routes are aqueous phase oxidation of SO2 to sulfate and sulfuric acid or heterogeneous
reactions. The strong association between sulfate and sulfuric acid on OC-V-sulfate

90
particles further suggests the metal(s) present in the residual fuel could catalyze this
process [Barbaray, et al., 1978]. Vanadium, one of the most abundant trace metals in
bunker fuel [International Standards Organization, 2005], could be catalyzing the
oxidation process of SO2 in the presence of H2O and NO2 [Barbaray, et al., 1978].
Alternatively, vanadium could be acting as a proxy for iron or other catalytically active
metals to which the UF-ATOFMS is less sensitive, due to differences in ionization
energy (i.e. Fe - 7.90 eV vs. V - 6.75 eV) [Lide, 2009]. This possibility could be
important since Fe is one of the most effective catalysts of sulfur (IV) in aqueous solution
[Brandt and Vaneldik, 1995]. V2O5 was originally considered to be ineffective as an
atmospheric catalyst below 150 °C [Barbaray, et al., 1977], but subsequent work has
shown that in the presence of NO2 and adsorbed H2O, catalysis of SO2 by V2O5 can
occur down to ambient temperatures (25 °C) [Barbaray, et al., 1978]. More recent
research involving vanadium catalysis through laboratory and field measurements has
also shown the potential for vanadium catalysis in the sulfate production process [Gaston,
et al., 2010;Sahle-Demessie and Devulapelli, 2008]. The fact that plumes quickly cool to
ambient temperatures [Chosson, et al., 2008], combined with the high relative humidity
in the marine sampling location and the presence of NO2 (from the fast reaction between
O3 and NO) in the plumes, these atmospheric measurements show that catalytic sulfate
production could indeed be an important atmospheric process.
3.4.11 Sulfate and Sulfuric Acid in Additional Plumes
To provide greater detail on the relationship between sulfate and sulfuric acid
with different particle types during plumes, 4 additional plumes are shown in Figure 3.12.
Similarly to Figure 3.12, the average sulfate peak area and sulfuric acid peak areas are

91
shown on the left axes by particle type and the number fraction of particles within a type
for sulfate and sulfuric acid are shown on the right axis. For each of these 4 ship plumes
sulfate and sulfuric acid peak area are shown to be roughly an order of magnitude greater
on OC-V-sulfate particles in comparison to all other particle types observed. The fraction
of particles containing sulfate and sulfuric acid peaks are also considerably higher for the
OC-V-sulfate particle type. This consistency plume-to-plume supports our hypothesis
that sulfate formation may be catalyzed by OC-V-sulfate particles.

92
Figure 3.12 Plots of sulfate peak area (red circles), sulfuric acid peak area (blue circles), sulfate number fraction (red diamonds), and sulfuric acid number fraction (blue diamonds). The plumes shown are a) container2, b) container1b, c) container3, d) tanker1a.

93
3.4.12 Conclusions
Particulate emissions from ships are expected to increase ~5% globally by 2030.
The production of large amounts of sulfate will impact climate through both cloud and
radiative transfer processes [Eyring, et al., 2005]. Increasing ship emissions will increase
concentrations of submicron OC-V-sulfate particles [Agrawal, et al., 2008a], posing
deleterious consequences for human health [Campen, et al., 2001;Corbett, et al., 2007].
Herein, direct single-particle measurements of ship plume particle mixing-states provide
key insights into the chemistry of freshly emitted ship plumes. The ability to use
vanadium as a tracer for ship plumes through single-particle mass spectrometry in the
polluted environment of the Port of LA will strengthen efforts to accurately apportion
particulate matter to sources in other coastal environments. In addition, current emissions
inventories do not account for fuel type and potential conversion of SO2 by vanadium
and/or other metals (i.e. Fe and Mn) in the presence of H2O and NO2 (both observed in
the plumes). The elevated concentrations of vanadium (maximum allowable: 600 mg/kg)
present in the fuel and thus ship plumes could be leading to higher than estimated
atmospheric sulfate concentrations [International Standards Organization, 2005].
Incorporating fuel type could help explain the enhanced sulfate levels being measured in
places such as California that current emissions inventories cannot explain [2009]. Thus,
the enrichment of sulfate and sulfuric acid on OC-V-sulfate particles due to possible
catalytic aqueous phase reactions occurring in particles enriched with vanadium has
important implications for regulating anthropogenic sulfate levels in coastal

94
environments. The vanadium and sulfur content of fuels and potential impacts on sulfate
production should be taken into account in future inventories and air quality models.
3.5 Acknowledgements
The authors acknowledge Dr. Robert Moision and Melanie Zauscher for
assistance during the study. Prof. V. Ramanathan and Dr. Craig Corrigan are
acknowledged for providing an aethalometer. The Southern California Marine Institute,
specifically Dr. Richard Peiper and Carrie Wolfe, hosted the sampling. Funding was
provided by the California Air Resources Board (#04-336).
Chapter 3 is reproduced with permission from A. P. Ault, C. J. Gaston, Y. Wang,
G. Dominguez, M.H. Thiemens, and K.A. Prather, Characterization of the Single Particle
Mixing State of Individual Ship Plume Events Measured at the Port of Los Angeles,
Environmental Science & Technology, 44 (6), 1954-1961, 2010. Copyright 2010,
American Chemical Society.

95
3.6 References
California Air Resources Board Personal Communication, 2009. H. Agrawal, Q. G. J. Malloy, W. A. Welch, J. Wayne Miller and D. R. Cocker III, In-use
gaseous and particulate matter emissions from a modern ocean going container vessel, Atmospheric Environment, 42 (21), 5504, 2008a.
H. Agrawal, W. A. Welch, J. W. Miller and D. R. Cocker, Emission Measurements from
a Crude Oil Tanker at Sea, Environ. Sci. Technol., 2008b. A. P. Ault, M. J. Moore, H. Furutani and K. A. Prather, Impact of emissions from the Los
Angeles port region on San Diego air quality, Environmental Science & Technology, 43 (10), 3500-3506, 2009.
B. Barbaray, J. P. Contour and G. Mouvier, Sulfur-Dioxide Oxidation Over Atmospheric
Aerosol - X-Ray Photoelectron-Spectra Of Sulfur-Dioxide Adsorbed On V2O5 And Carbon, Environmental Science & Technology, 11 (4), 351-356, 1977.
B. Barbaray, J. P. Contour and G. Mouvier, Effects Of Nitrogen-Dioxide And Water-
Vapor On Oxidation Of Sulfur-Dioxide Over V2O5 Particles, Environmental Science & Technology, 12 (12), 1294-1297, 1978.
P. V. Bhave, J. O. Allen, B. D. Morrical, D. P. Fergenson, G. R. Cass and K. A. Prather,
A field-based approach for determining ATOFMS instrument sensitivities to ammonium and nitrate, Environmental Science & Technology, 36 (22), 4868-4879, 2002.
C. Brandt and R. Vaneldik, Transition-Metal-Catalyzed Oxidation Of Sulfur(Iv) Oxides -
Atmospheric-Relevant Processes And Mechanisms, Chem. Rev., 95 (1), 119-190, 1995.
M. J. Campen, J. P. Nolan, M. C. J. Schladweiler, U. P. Kodavanti, P. A. Evansky, D. L.
Costa and W. P. Watkinson, Cardiovascular and thermoregulatory effects of inhaled PM-associated transition metals: A potential interaction between nickel and vanadium sulfate, Toxicological Sciences, 64 (2), 243-252, 2001.
F. Chosson, R. Paoli and B. Cuenot, Ship plume dispersion rates in convective boundary
layers for chemistry models, Atmos. Chem. Phys., 8 (16), 4841, 2008. J. J. Corbett, J. J. Winebrake, E. H. Green, P. Kasibhatla, V. Eyring and A. Lauer,
Mortality from ship emissions: A global assessment, Environmental Science & Technology, 41 (24), 8512-8518, 2007.

96
L. A. De Bock, P. E. Joos, K. J. Noone, R. A. Pockalny and R. E. Van Grieken, Single particle analysis of aerosols, observed in the marine boundary layer during the Monterey Area Ship Tracks Experiment (MAST), with respect to cloud droplet formation, Journal Of Atmospheric Chemistry, 37 (3), 299-329, 2000.
T. M. Exchange, The Marine Exchange, Ship Traffic Logs for the Ports of Los
Angeles/Long Beach, San Pedro, CA, 2007. V. Eyring, I. S. A. Isaksen, T. Berntsen, W. J. Collins, J. J. Corbett, O. Endresen, R. G.
Grainger, J. Moldanova, H. Schlager and D. S. Stevenson, Transport Impacts on Atmosphere and Climate: Shipping, Atmospheric Environment, In Press, Accepted Manuscript, 2009.
V. Eyring, H. W. Kohler, A. Lauer and B. Lemper, Emissions from international
shipping: 2. Impact of future technologies on scenarios until 2050, Journal Of Geophysical Research-Atmospheres, 110 (D17), 2005.
B. J. Finlayson-Pitts and J. N. Pitts, Chemistry of the Upper and Lower Atmosphere,
Academic Press, San Diego, CA, 2000. C. J. Gaston, K. A. Pratt, X. Y. Qin and K. A. Prather, Real-Time Detection and Mixing
State of Methanesulfonate in Single Particles at an Inland Urban Location during a Phytoplankton Bloom, Environmental Science & Technology, 44 (5), 1566-1572, 2010.
R. M. Healy, I. P. O'Connor, S. Hellebust, A. Arnaud, J. R. Sodeau and J. C. Wenger,
Characterisation of single particles from in-port ship emissions, Atmospheric Environment, 43 (40), 6408-6414, 2009.
International Standards Organization, Petroleum products -- Fuels (class F) --
Specifications of marine fuels, 22 pp., 2005. J. Isakson, T. A. Persson and E. S. Lindgren, Identification and assessment of ship
emissions and their effects in the harbour of Goeteborg, Sweden, Atmospheric Environment, 35 (21), 3659-3666, 2001.
D. Kim, C. Wang, A. M. L. Ekman, M. C. Barth and P. J. Rasch, Distribution and direct
radiative forcing of carbonaceous and sulfate aerosols in an interactive size-resolving aerosol-climate model, Journal Of Geophysical Research-Atmospheres, 113 (D16), 2008.
D. Lack, B. Lerner, C. Granier, T. Baynard, E. Lovejoy, P. Massoli, A. R. Ravishankara
and E. Williams, Light absorbing carbon emissions from commercial shipping, Geophysical Research Letters, 35 (13), 2008.
97
D. A. Lack, J. J. Corbett, T. Onasch, B. Lerner, P. Massoli, P. K. Quinn, T. S. Bates, D. S. Covert, D. Coffman, B. Sierau, S. Herndon, J. Allan, T. Baynard, E. Lovejoy, A. R. Ravishankara and E. Williams, Particulate emissions from commercial shipping: Chemical, physical, and optical properties, Journal of Geophysical Research, 114, 2009.
D. A. Lake, M. P. Tolocka, M. V. Johnston and A. S. Wexler, The character of single
particle sulfate in Baltimore, Atmos. Environ., 38 (31), 5311-5320, 2004. D. R. Lide, (ed.), CRC Handbook of Chemistry and Physics, CRC Press/Taylor and
Francis, Boca Raton, FL, 2009. P. H. McMurry and J. C. Wilson, Droplet Phase (Heterogeneous) And Gas-Phase
(Homogeneous) Contributions To Secondary Ambient Aerosol Formation As Functions Of Relative-Humidity, Journal Of Geophysical Research-Oceans And Atmospheres, 88 (NC9), 5101-5108, 1983.
R. C. Moffet and K. Prather, Aging of soot captured with in situ measurements:
Implications for aerosol climate forcing, Proceedings Of The National Academy Of Sciences Of The United States Of America, Submitted, 2008.
R. C. Moffet and K. A. Prather, In-situ measurements of the mixing state and optical
properties of soot with implications for radiative forcing estimates, 106 (29), 11872-11877, 2009.
S. M. Murphy, H. Agrawal, A. Sorooshian, L. T. Padro, H. Gates, S. Hersey, W. A.
Welch, H. Jung, J. W. Miller, D. R. Cocker, A. Nenes, H. H. Jonsson, R. C. Flagan and J. H. Seinfeld, Comprehensive Simultaneous Shipboard and Airborne Characterization of Exhaust from a Modern Container Ship at Sea, Environmental Science & Technology, 43 (13), 4626-4640, 2009.
K. R. Neubauer, M. V. Johnston and A. S. Wexler, On-line analysis of aqueous aerosols
by laser desorption ionization, International Journal Of Mass Spectrometry And Ion Processes, 163 (1-2), 29-37, 1997.
I. M. Organization, International Convention on Safety of Life at Sea (SOLAS) Chapter
V, 2000. K. A. Pratt, L. E. Hatch and K. A. Prather, Seasonal volatility dependence of ambient
particle phase amines, Environmental Science & Technology, 43 (14), 5276-5281, 2009a.
K. A. Pratt, J. E. Mayer, J. C. Holecek, R. C. Moffet, R. O. Sanchez, T. P. Rebotier, H.
Furutani, M. Gonin, K. Fuhrer, Y. X. Su, S. Guazzotti and K. A. Prather,

98
Development and Characterization of an Aircraft Aerosol Time-of-Flight Mass Spectrometer, Analytical Chemistry, 81 (5), 1792-1800, 2009b.
M. S. Reinard, K. Adoua, J. M. Martini and M. V. Johnston, Source characterization and
identification by real-time single particle mass spectrometry, Atmospheric Environment, 41 (40), 9397-9409, 2007.
E. Sahle-Demessie and V. G. Devulapelli, Vapor phase oxidation of dimethyl sulfide
with ozone over V2O5/TiO2 catalyst, Appl. Catal. B-Environ., 84 (3-4), 408-419, 2008.
P. J. Silva, D. Y. Liu, C. A. Noble and K. A. Prather, Size and chemical characterization
of individual particles resulting from biomass burning of local Southern California species, Environmental Science & Technology, 33 (18), 3068-3076, 1999.
B. Silverman, Pacific Merchant Shipping Association v. James Goldstene, United States
Court of Appeals for the Ninth Circuit, No. 07-16695, 2008. P. Sinha, P. V. Hobbs, R. J. Yokelson, T. J. Christian, T. W. Kirchstetter and R.
Bruintjes, Emissions of trace gases and particles from two ships in the southern Atlantic Ocean, Atmospheric Environment, 37 (15), 2139-2148, 2003.
D. A. Sodeman, S. M. Toner and K. A. Prather, Determination of single particle mass
spectral signatures from light-duty vehicle emissions, Environmental Science & Technology, 39 (12), 4569-4580, 2005.
X. H. Song, P. K. Hopke, D. P. Fergenson and K. A. Prather, Classification of single
particles analyzed by ATOFMS using an artificial neural network, ART-2A, Analytical Chemistry, 71 (4), 860-865, 1999.
S. South Coast Air Quality Management District, Multiple Air Toxics Exposure Study
III,South Coast Air Quality Management District, 2008. M. T. Spencer and K. A. Prather, Using ATOFMS to determine OC/EC mass fractions in
particles, Aerosol Science And Technology, 40 (8), 585-594, 2006. M. T. Spencer, L. G. Shields and K. A. Prather, Simultaneous measurement of the
effective density and chemical composition of ambient aerosol particles, Environmental Science & Technology, 41 (4), 1303-1309, 2007.
Y. X. Su, M. F. Sipin, H. Furutani and K. A. Prather, Development and characterization
of an aerosol time-of-flight mass spectrometer with increased detection efficiency, Analytical Chemistry, 76 (3), 712-719, 2004.

99
S. M. Toner, D. A. Sodeman and K. A. Prather, Single particle characterization of ultrafine and accumulation mode particles from heavy duty diesel vehicles using aerosol time-of-flight mass spectrometry, Environmental Science & Technology, 40 (12), 3912-3921, 2006.
C. F. Wang, J. J. Corbett and J. J. Winebrake, Cost-effectiveness of reducing sulfur
emissions from ships, Environmental Science & Technology, 41 (24), 8233-8239, 2007.

4 Mobile Laboratory Observations of Temporal and Spatial
Variability within the Coastal Urban Aerosol
4.1 Synopsis
Understanding the spatial and temporal variation of particle mass and number
concentrations, size distributions, and chemical composition within urban areas is critical
to quantifying particle exposure levels and impacts on human health. However, it is
difficult to measure these variations with neighborhood level spatial resolution and high
time resolution (< 1 hr). This often leads to simplifications and assumptions when models
simulate the urban aerosol and an unrealistic representation. A mobile laboratory
equipped with an aerosol time-of-flight mass spectrometer (ATOFMS) and instruments to
measure PM2.5 mass concentrations, particle size distributions, and gas phase
concentrations was used to sample ambient air two different days around San Diego Bay
in California with similar meteorological and gas phase conditions, but low particle mass
and number concentrations on one day (Feb. 12th) and high concentrations on another
(Mar. 13th). Feb. 12th was identified as representing urban background conditions through
mass concentrations, number concentrations, and particle chemistry that were similar
throughout the San Diego Bay region. On Mar. 13th the urban aerosol transitioned as the
aged anthropogenic/secondary organic particles were transported inland and replaced by
fresh combustion and sea salt particles. The shift away from an aged aerosol was
observed consistently across the San Diego Bay region and was not observed to vary
spatially. Conversely, particle concentrations were observed to vary spatially identifying
downtown as the most concentrated source region observed around the bay with the
100

101
highest concentrations of fresh combustion particles; this spatial variation did not follow
discernible temporal trends. These results demonstrate that the high resolution temporal
and spatial patterns in particle mass and number concentrations around the San Diego
Bay are driven by the chemical composition of the urban aerosol. Further studies are
needed with high temporal and spatial resolution to determine how these changes affect
exposure levels and ultimately public health.
4.2 Introduction
Particulate matter (PM) has been shown to negatively impact human health over
short and long term periods of exposure [Pope, 2007;Poschl, 2005;Valavanidis, et al.,
2008]. Short term effects from exposure to elevated levels of particulate matter include
increased hospital admissions for asthma, cardiovascular disease, and chronic obstruction
pulmonary disease when PM with diameters ≤ 10 μm (PM10) increases by 10 μg/m3
[Valavanidis, et al., 2008]. At a series of hospitals in Utah, a recent study showed that a
10 μg/m3 increase in PM2.5 (particles with diameters < 2.5 μm) increased the risk of
ischemic heart disease events (e.g. heart attacks) by 4.5% in patients [Pope, et al., 2006].
Long term studies have shown connections between particulate matter and lung cancer,
cardiopulmonary mortality, and cardiovascular disease [Pope, 2007;Valavanidis, et al.,
2008].
In addition to mass concentrations, particle-health effects have been linked to
particle number concentration, size, hygroscopicity, and chemical composition [Nel,
2005;Pope, 2007;Valavanidis, et al., 2008]. Elevated number concentrations and ultrafine
(< 0.1 μm) number concentrations can cause oxidative stress in lung cells [Xia, et al.,
2006]. Particle size plays a key role in determining the location that inhaled particles

102
deposit in the tracheobronchial and pulmonary systems [Asgharian, 2004;Park and Wex,
2008;Yeh, et al., 1996]. Particle growth, when exposed to high relative humidity after
inhalation, impacts particle size and chemical composition and determines where
particles deposit in the body [Asgharian, 2004]. The chemical composition of particles
also determines particle solubility, which plays a role in the negative health effects from
atmospheric particles [Jalava, et al., 2008]. In addition, submicron particles are more
likely than supermicron particles to be inhaled and deposited into the tracheobronchial
and pulmonary regions of the body than the naso-oro-pharyngo-laryngeal regions
[Rostami, 2009]. Negative synergistic effects have been shown when specific chemical
species are present together such as oxidative stress and NFκB activation (iron and soot),
as well as cardiovascular and thermoregulatory effects (vanadium and nickel) [Campen,
et al., 2001;Zhou, et al., 2003]. While health effects have been linked to particle mass
concentrations, number concentrations, size, and chemical composition; studying the link
between particles and health is a relatively new and rapidly developing field. Due to the
considerable amount of uncertainty regarding particles-health impacts more detailed
measurements are necessary to develop effective regulations to mitigate the detrimental
impacts of particle on public health.
Understanding particle-health impacts is complicated by the fact that while
negative health effects have been linked to the different metrics, such mass and number
concentrations as discussed above, these metrics frequently do not track one another. To
determine the metric that correlates most strongly with decreases in human health, a
thorough understanding of how particle concentrations and chemistry vary temporally
and spatially is needed. This is supported by a recent study which found neighborhood to

103
neighborhood changes in PM2.5 exposure levels and subsequently life expectancy across
an urban area [Orru, et al., 2009]. Number concentrations often have even more
heterogeneous spatial and temporal patterns than mass concentrations; further
complicating attempts to understand particle-health relationships [Harrison and Jones,
2005;Moore, et al., 2009]. Recent studies have started to investigate changes in particle
number concentrations and sizes with high spatial and temporal resolution by operating
multiple sampling sites simultaneously and deploying mobile/portable laboratories. Mejia
et al. (2008) compared measurements at 8 sites in Brisbane, Australia and found
considerable variability in number concentrations and size distributions depending on
whether the vehicle fleet was primarily cars or trucks [Mejia, et al., 2008]. Krudysz et al.
(2009) and Moore et al. (2009) monitored 13 sites around the Ports of Los Angeles and
Long Beach and also found spatial variability in particle concentrations and size
distributions, especially among ultrafine particles [Krudysz, et al., 2009;Moore, et al.,
2009]. High spatial variation in particle number concentration was also observed by
Cyrys et al. (2008) in Augsburg, Germany [Cyrys, et al., 2008].
While recent studies have improved our understanding of changes in size
distributions and number concentrations, high time resolution measurements of the
spatial variation in chemical measurements has been lacking. This is because studies
monitoring multiple sites continuously have primarily monitored particle chemistry with
low time resolution filter techniques. Recently, many portable and/or mobile laboratories
have been developed which can monitor and move quickly between sampling locations or
sample while moving giving both high temporal and spatial resolution [Bukowiecki, et
al., 2002;Kolb, et al., 2004]. Many of these mobile laboratories have focused on fresh

104
vehicle emissions [Bukowiecki, et al., 2003;Canagaratna, et al., 2004;Zavala, et al.,
2009] or spatial patterns of specific species (i.e. hexavalent chromium) [Isakov, et al.,
2007]. Herein, this paper discusses measurements involving the development and
deployment of a mobile aerosol time-of-flight mass spectrometry (ATOFMS) laboratory.
These measurements of spatial and temporal variability with real-time particle size and
chemistry mark the first single particle mass spectrometry measurements at multiple sites
in a single day, providing standard bulk measurements (particle mass and number
concentrations), as well as the chemical composition and mixing state with secondary
species to explain changes to these bulk concentrations.
4.3 Experimental
4.3.1 Mobile ATOFMS Laboratory
A Pace American Class IV trailer (length 5.5 m; width 3.5 m; height 3 m;
maximum gross trailer weight 4,500 kg) was modified to house an array of gas phase and
particle instrumentation. The mobile ATOFMS laboratory was transported between sites
by a pickup truck holding two Honda EB11000 gasoline generators (9.5 kVA) supported
by a steel frame anchored to the truck bed. The generator exhaust passed through an
exhaust manifold and 20 m of 6 cm diameter steel tubing to transport the emissions
downwind of the sampling inlet. One generator was capable of powering the trailer at full
load for 3-4 hours under normal operating conditions on a single tank of gas. This study
focused on stationary sampling. At each site a 2.5 meter sampling line was attached to a
sampling manifold on the mobile ATOFMS laboratory roof (5.5 meters above the
ground). The manifold provided laminar sampling flow for 5-6 instruments in parallel
with similar residence times.

105
4.3.2 2009 San Diego Bay Measurements
The mobile ATOFMS laboratory sampled the urban aerosol at multiple locations
around San Diego Bay on both Feb. 12 and Mar. 13, 2009. Sampling times and locations
are provided in Figure 4.1 and Table 4.1. Table 4.1 also includes major sources within 1
km upwind of each site and the distance to the source. On Feb. 12th, sampling was
conducted at three locations: Silver Strand State Beach (SS), Cesar Chavez Park (CC) in
downtown San Diego, and Coronado Tidelands Park (Cor). These same three sites were
sampled on Mar. 13th, as well as Chula Vista Bayfront Park (CV) and Pepper Park (Pep)
in National City. Throughout this paper SS1, CC1, and Cor1 refer to the measurements at
the three sites on Feb. 12th and SS2, Cor2, CC2, CV2, and Pep2 reference the
measurements made on Mar. 13th.
4.3.3 Instrumentation
Standard aerosol instrumentation in the mobile ATOFMS laboratory included
PM2.5 mass concentrations from a beta attenuation monitor (BAM) (MetOne Model
BAM-1020) and black carbon mass concentrations from a seven wavelength
aethalometer (Model AE31, Magee Scientific). Aerosol size distributions were measured
between 0.011 - 0.604 μm using a scanning mobility particle sizer (SMPS) (Model
3936L, TSI Inc.) and 0.523 -10 μm using an aerodynamic particle sizer (APS) (Model
3321, TSI Inc.). Measurements of meteorology, gas phase concentrations, and mass
concentrations (PM2.5) were also incorporated from San Diego Air Pollution Control
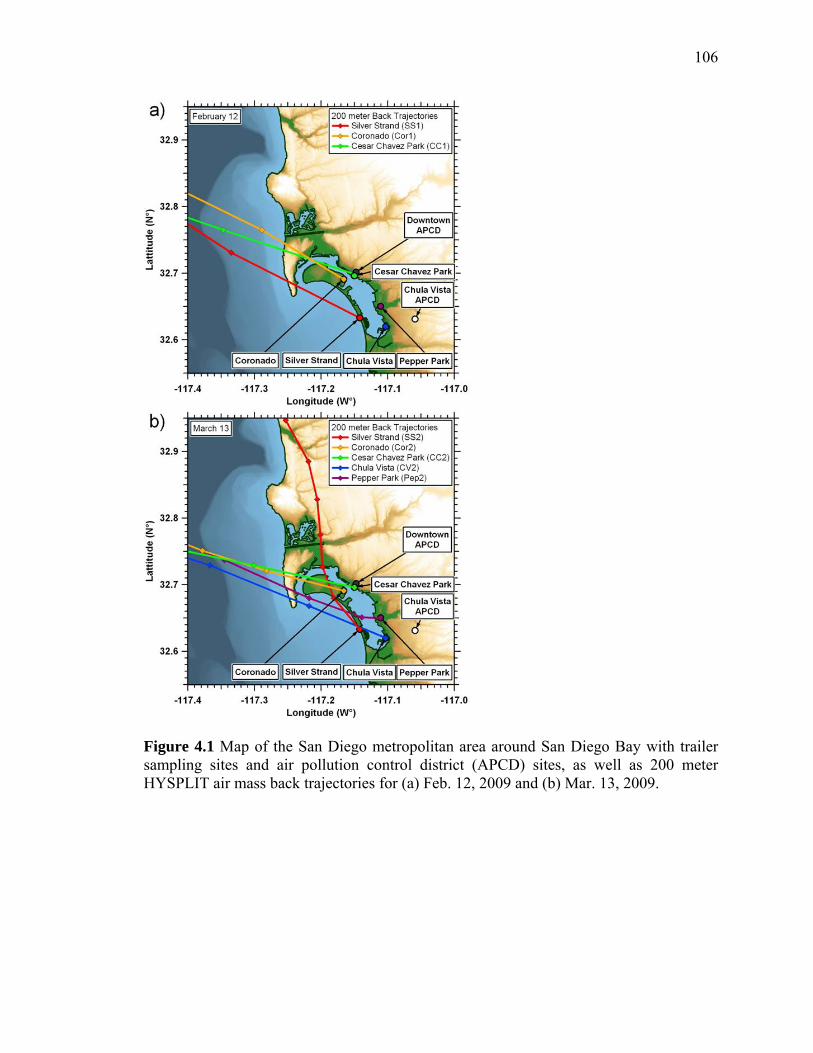
106
Figure 4.1 Map of the San Diego metropolitan area around San Diego Bay with trailer sampling sites and air pollution control district (APCD) sites, as well as 200 meter HYSPLIT air mass back trajectories for (a) Feb. 12, 2009 and (b) Mar. 13, 2009.

107
Table 4.1 Sampling times, locations, and wind direction (WD) at sites around San Diego Bay are described. Sources within 1,000 meters of the sampling site and distances are listed.
Site Abbrev Date Start Stop Latitude Longitude WD Anth. Sources DistTime Time (°N) (°W) From WD (m)
Silver Strand SS1 2/12/2009 9:48 12:18 32° 37' 58" 117° 08' 29" 280 None N/ACesar Chavez Park CC1 2/12/2009 14:21 16:10 32° 41' 46" 117° 09' 01" 287 Industry and Port 300
Coronado Cor1 2/12/2009 17:26 19:09 32° 41' 28" 117° 09' 58" 360 Minor Road 250Silver Strand SS2 3/13/2009 8:29 10:20 32° 37' 58" 117° 08' 29" 259 None N/A
Coronado Cor2 3/13/2009 11:41 13:03 32° 41' 28" 117° 09' 58" 272 Major Road 75Cesar Chavez Park CC2 3/13/2009 13:57 15:02 32° 41' 46" 117° 09' 01" 274 Industry and Port 400Chula Vista Park CV2 3/13/2009 16:10 17:03 32° 37' 11" 117° 06' 11" 274 None N/A
Pepper Park Pep2 3/13/2009 18:35 20:02 32° 39' 02" 117° 06' 38" 222 None N/A

108
District (SD-APCD) sites in downtown San Diego (DT-APCD), Chula Vista (CV-
APCD), and at the San Diego International Airport (SDAP).
4.3.4 Aerosol Time-of-Flight Mass Spectrometry
An ATOFMS was operated inside the mobile laboratory measuring the size and
chemical composition of individual particles between 0.2-3.0 μm in real-time at each site.
The design and details of the ATOFMS have been described in detail previously [Gard,
et al., 1997]. Briefly, particles are introduced into the ATOFMS through a converging
nozzle into a differentially pumped vacuum chamber where the particles are accelerated
to a size-dependent velocity. The particles pass through two continuous wave lasers
(diode pumped Nd:YAG lasers operating at 532 nm) located 6 cm apart. Particle speed is
used to determine vacuum aerodynamic diameter by calibration with polystyrene latex
spheres of known size. The sized particles are desorbed and ionized in the mass
spectrometer source region by a 266 nm Q-switched Nd:YAG laser (1.2-1.4 mJ). Positive
and negative ions from the same single particle are detected using a dual-reflectron time-
of-flight mass spectrometer.
4.3.5 Single Particle Data Analysis
Single particle size and mass spectral information were analyzed with YAADA
1.2 (www.yaada.org), a data analysis toolkit for MATLAB 6.5.1 (The MathWorks, Inc.).
Particles were analyzed via two approaches: 1) searching mass spectral, aerodynamic
size, and temporal features and 2) clustering mass spectra using an Adaptive Resonance
Theory based neural network algorithm (ART-2a) at a vigilance factor of 0.8 [Song, et
al., 1999]. ART-2a combines particles into clusters based on the intensity of ion peaks in

109
individual mass spectra. General particle types are defined by the characteristic chemical
species or possible source to simplify the naming scheme; these labels do not reflect all
of the species present within a specific particle type, but reflect the most intense ion
peaks. Peak identifications within this paper correspond to the most probable ions for a
given m/z ratio.
4.3.6 Scaling Single Particle Measurements to Mass Concentrations
Number and mass concentrations were calculated for different particle types using
APS size-resolved number concentrations, a method which has been shown previously to
yield quantitative mass concentrations [Qin, et al., 2006]. Briefly, ATOFMS counts are
divided into APS size bins (0.523 – 2.5 μm) and scaling factors were calculated for each
site to account for ATOFMS transmission biases. Bins with less than 10 particles at a site
were excluded due to low statistics, which might lead to slight undercounting of PM1 and
PM2.5. After scaling to number concentration, mass was calculated using a representative
density for particles in an urban atmosphere that have taken up water and secondary
species, 1.5 g/cm3 [Moffet, et al., 2008]. Scaled ATOFMS mass concentrations have been
shown previously to correlate well with standard mass measurements and comparisons to
the BAM PM2.5 mass concentrations are included below [Qin, et al., 2006]. Previous
ATOFMS measurements in San Diego used scaled mass concentrations to determine the
impact of transported particles from the Los Angeles port region, demonstrating the
utility of the method locally [Ault, et al., 2009].

110
4.4 Results and Discussion
4.4.1 Temporal Patterns of Meteorological and Gas Phase Concentrations
To characterize the ambient conditions on Feb. 12th and Mar. 13th, the
meteorological and gas phase concentrations for each day are compared at downtown
APCD sites (Figure 4.2). The meteorological conditions on both Feb. 12th and Mar. 13th
had diurnal trends in temperature and relative humidity (RH). The wind direction (WD)
and wind speed (WS) on Feb. 12th were also diurnal, shifting from a light easterly land
breeze (~ 1 m/s) before sunrise to a stronger westerly sea breeze (~ 3 m/s) during the day
and shifting back to a light easterly land breeze after sunset. The wind data patterns on
Mar. 13th were similar during sampling (although at night there was not a shift to a land
breeze) and meteorological data from the Chula Vista APCD site was similar to the
downtown APCD sites on both days.
The gas phase concentrations observed on Feb. 12th and Mar. 13th were also
similar (Figure 4.2). An increase in NOx concentrations was observed before dawn from
vehicle traffic, followed by a decrease after sunrise as O3 concentrations increased. On
Feb. 12th, the O3 decreased after sunset and the wind shifted to a land breeze with NOx
increasing. The lack of a shift in wind direction on Mar. 13th was accompanied by high
O3 concentrations well after dark and sustained low NOx concentrations. On both days,
SO2 concentrations were low, and no obvious temporal trends were observed. Despite
similar trends in meteorological and gas phase data significant differences in particle
mass concentrations, number concentrations, and chemistry were observed around San
Diego Bay providing insight into sources and aging for two meteorologically similar
days.

111
Figure 4.2 Comparison of meteorological conditions (temperature-red, relative humidity-light blue, wind speed-grey, wind direction-black markers) and gas phase concentrations (O3-blue, NOx-green, SO2-gold) on Feb. 12th and Mar. 13th. PM2.5 from the BAM is shown as a black line.

112
Air mass back trajectories were calculated using HYSPLIT 4.9 for each site
during the sampling periods (38). Figure 4.1a shows the 200 meter air mass back
trajectory for the three sites sampled on Feb. 12th. All three back trajectories show a
strong oceanic influence with each air mass overland for less than an hour, which
corresponds with the wind direction in Figure 4.2a. The trajectory calculated for the
initial site on Mar. 13th was moved slowly over the San Diego area for 6 hours taking up
gases and particles from many local sources leading to a polluted air mass. A strong sea
breeze during the 4 remaining sites on Mar. 13th resulted in cleaner conditions than earlier
in the day. An interesting contrast can be drawn between the relatively clean day on Feb.
12th and the transition from polluted to clean conditions on Mar. 13th Taking an in-depth
view of Mar. 13th provides information about how quickly the particles in San Diego Bay
region can change in terms of chemistry and sources.
Particulate mass concentration is the metric used to evaluate particle pollution by
state and federal regulatory agencies. The BAM is a federally certified method and
APCD BAM measurements (Figure 4.2) exhibit different patterns on the two sampling
days. On Feb. 12th, which was preceded by 5 days of rain, a diurnal trend with low
concentrations during the day (1-3 μg/m3) was observed. The more polluted case of Mar.
13th (6-13 μg/m3) had a diurnal trend except for a peak in mass concentration between
08:00-10:00 PST. From the meteorology, gas phase, and BAM measurements, Feb. 12th
can be classified as urban background conditions for this coastal urban environment, and
Mar. 13th can be classified as a shift from regional pollution buildup to marine/fresh
emission conditions.

113
4.4.2 Variability of Particle Mass and Number Concentrations
To determine whether mass concentrations observed at the downtown site were
representative of the entire San Diego Bay region, two PM2.5 mass concentrations
measured at the sample sites (scaled ATOFMS and BAM) were compared with BAM
measurements at the downtown site (Figure 4.3a). On the urban background day (Feb.
12th) mass concentrations for the downtown BAM and the mobile site BAM are in
agreement, with values within 1 μg/m3 of one another. The ATOFMS mass
concentrations compare well to the mobile site and downtown BAM at two of the three
sites (CC1 and Cor1), while SS1 was an outlier due to an instrumental artifact. Number
concentrations (Figure 4.3b – orange bars) were also consistent (1865-4169 #/cm3), but
low for an urban environment (typically ~105 #/cm3) [Finlayson-Pitts and Pitts, 2000].
This shows homogeneous values throughout the day around the San Diego Bay region
during urban background conditions.
In contrast, on Mar. 13th (with regional buildup shifting to marine/fresh emission
conditions) the mass measurements downtown versus the mobile sites do not agree
throughout the day (Figure 4.3a), though the two independent mass measurements
(ATOFMS and BAM) at the mobile sites are within error of one another at two of the
three sites with reliable measurements of both (SS2 and CV2). At mobile sites further
from downtown a significant difference in mass concentration between downtown and
the mobile sites is observed, while at mobile sites close to downtown the mass
concentrations are similar. This indicates that concentrations are not homogeneous
around the bay, as they were during background conditions. The higher concentrations
observed downtown demonstrate spatial variation in mass concentrations and show that

114
Figure 4.3 (a) PM2.5 mass concentration data at each site for the: Scaled ATOFMS mass (blue bars), mobile site BAM (red bars), and DT-APCD BAM (green bars). (b) Number concentration by site from summed SMPS scans (gold bars).

115
downtown is likely a source region. When viewed by instruments that give greater detail
on aerosol properties these relatively small differences in BAM concentrations result in
very different in particle number concentrations, size, and chemistry to which residents
are exposed.
The number concentrations on Mar. 13th show both temporal and spatial variation
around the San Diego Bay. Temporally, a steady decrease from the high concentrations
during local stagnant conditions to lower concentrations as the sea breeze strengthens is
overlaid with a spatial pattern of higher number concentrations with increasing proximity
to downtown. Taken together the mass and number concentrations suggest that
downtown San Diego is the largest source region influencing San Diego Bay and,
although point sources do exist at other points around the bay, these did not disrupt the
trends observed at the mobile sites during sampling. The relative importance of the
temporal trend versus spatial trend with respect to what is being inhaled will be
investigated both from a bulk perspective by size distribution measurements and from a
single particle perspective by analyzing particle size, sources, and secondary chemistry.
4.4.3 Variation in Aerosol Size Distributions
Size distributions were analyzed at the mobile lab sites for both Feb. 12th (Figure
4.4a) and Mar. 13th (Figure 4.4b). At SS1, a coastal site that had a strong sea breeze
during sampling, a higher concentration of larger particles (i.e. sea salt) was observed.
CC1, an urban site close to many sources, had more Aitken mode particles (0.010-0.030
μm) and fewer particles > 0.030 μm than the coastal site. The APS size distributions for
CC1 and Cor1 are nearly identical as would be expected for two sites ~1.5 km apart on a
day when mass concentrations are similar around the bay. Overall, the SMPS and APS

116
Figure 4.4 Size distribution measurements (SMPS and APS) for Feb. 12th and Mar. 13th as measured at the mobile sampling sites. The red traces correspond to Silver Strand (SS), green traces to Cesar Chavez Park (CC), yellow to Coronado (Cor), blue to Chula Vista (CV), and purple to Pepper Park (Pep).

117
scans from Feb. 12th agree with the mass and number concentrations observed and are as
expected for a day with urban background conditions.
The modes and shapes of the size distributions on Mar. 13th support the finding of
a temporal trend of decreasing aerosol concentrations as a sea breeze built in and a spatial
trend of higher concentration near downtown. The larger number of ultrafine particles
earlier in the day (SS2, Cor2, and CC2) and low concentrations of ultrafine particles later
in the day support the temporal trend discussed above. Additional evidence supporting
Feb. 12th as a background time period and of local pollution buildup on Mar. 13th is that
the downtown site (CC) on Feb. 12th has a smaller mode (0.018 μm) than Mar. 13th
(0.055 μm), which indicates a small number of fresh particles at the source region on Feb.
12th and a larger number of particles that have undergone some atmospheric processing
on Mar. 13th. The spatial trend of downtown as a source of aerosols is supported by
higher numbers of the smallest (< 0.015 μm) particles at the downtown site (CC2) and a
nearby site (Cor2) then at the site sampled earlier in the day (SS2) and later in the day
(CV2 and Pep2). Additionally, CC2 has a greater variation in number concentrations than
any of the other sites suggesting that downtown is a fresh and dynamic source of
aerosols.
An important aspect of Figure 4.4 is that the size distributions on Feb. 12th in the
overlap region between the SMPS and APS (0.523-0.604 μm) are within instrumental
variation at those sizes, but there is a larger disconnect in the overlap region between the
SMPS and APS measurements on Mar. 13th that instrumental variation cannot explain.
This is likely due to the fact that the SMPS measures electrical mobility diameter (dm)
and the APS measures aerodynamic diameter (da). These two parameters are related to

118
one another by the following equation [DeCarlo, et al., 2004] where ρ0 is the unit density
(1 g/cm3), ρp is the particle density, and χ is the dynamic shape factor:
0
pa
m
d
d
(0.1)
As can be seen from the equation, as shape factor approaches 1 (spherical) and
density approaches the unit density, aerodynamic and electrical mobility diameter
converge. This indicates that since the distributions align on Feb. 12th, particles were on
average spherical and had taken up water decreasing density. It has been shown
previously by Spencer et al. that when atmospheric liquid water content increases,
effective density approaches unity [Spencer, et al., 2007]. By comparison, on Mar. 13th
there is a multiple order of magnitude difference in number concentration in the overlap
region indicating different types of particles that have non-unity density or shape factor,
as mobility and aerodynamic diameter give different distributions. These differences
show that particles are likely more dense by the direction of the shift between SMPS and
APS distribution. This indicates that particles on Mar. 13th have not taken up as much
water as on Feb. 12th, but likely taken up higher density secondary species. The higher
particle density on a polluted than on a day with urban background conditions can be
used to infer information about the particles, such as particle solubility or hygroscopicity,
which are related to human health. To directly gain detailed information on particle
composition measurements of single particle size and chemistry were made and are
discussed below.

119
4.4.4 Differing Aerosol Sources Determined by Particle Chemistry
Single particle measurements at each site using ATOFMS were used to determine
the extent of diurnal and spatial patterns influenced by the types of particles observed
based on sources and the degree to which they had been atmospherically processed (i.e.
aged). The main particle types observed at the different sampling sites included: sea salt,
dust, elemental carbon mixed with organic carbon (ECOC), organic carbon (OC), and
potassium-combustion (K-Combustion) particles. These particle types have been
described for the San Diego area previously [Ault, et al., 2009;Guazzotti, et al., 2001].
Briefly, sea salt particles were identified by 23Na+, 62Na2O+, 63Na2OH+, and 81,83Na2Cl+
and dust particles were identified by peaks corresponding to 23Na+, 27Al+, 39K+, 56Fe+, -
76SiO3-, and -77HSiO3
-. Organic carbon (OC) particles had high intensity peaks at
27C2H3+, 29C2H5
+, 37C3H+, and 43C2H3O+, as well as other carbon fragments, and is
indicative of anthropogenic secondary organic aerosol. The average mass spectra of the
most abundant OC cluster during Mar. 13th compared with the average mass spectra from
the most abundant cluster during the Study of Organic Aerosols in Riverside (SOAR) had
a dot product of 0.9409 [Qin, et al., in prep]. The organic carbon aerosol in Riverside, CA
during SOAR has been identified as an aged secondary organic carbon by thermodenuder
studies and the similarity between the spectra suggests that the OC particles on Mar. 13th
were secondary anthropogenic organic aerosol as well [Pratt and Prather, 2009b].
Elemental carbon particles mixed organic carbon (ECOC) were characterized by peaks at
(12C1+, 24C2
+,…, Cn+) with less intense organic carbon markers (27C2H3
+, 29C2H5+,
37C3H+, and 43C2H3O+); and K-Combustion particles identified by a strong potassium
peak (39K+) and minor organic carbon ion markers. Many K-Combustion particles are

120
from biomass burning, but other sources exist in the San Diego Bay region with a similar
signature, which is why we use the broader label. The mixing state of different particle
types with markers for clean (chloride) and aged (nitrate and sulfate) particles will be
discussed below.
The relative mass fractions for submicron and supermicron particle types from
difference sources are shown Figures 4.5a and 4.5b respectively, with the black markers
representing the total ATOFMS mass concentration at each site for that size range. The
very low concentrations of submicron non-sea salt particle types (less than 10% at each
site) support the earlier finding of very clean urban background conditions. On the more
polluted Mar. 13th between 25-50% of the submicron particle mass is carbonaceous
particles (OC, ECOC, and K-combustion) from anthropogenic sources. The OC mass
decreases over the course of the day from 10% of submicron mass to negligible levels as
the sea breeze pushes the secondary OC particles that formed overnight across the San
Diego region inland replacing them with fresh emissions sea salt particles. The combined
fraction of mass from ECOC and K-Combustion particles is substantial throughout the
day (14-32%), indicating that these particle types that are the result of consistent local
sources and not the diurnal process that formed the OC particles. The supermicron mass
concentrations and mass fractions (Figure 4.5b) are remarkably consistent during the 8
time periods over 2 different days. This confirms that most variation in particle number
and chemistry spatially and temporally were driven by changes in the submicron size
range [Finlayson-Pitts and Pitts, 2000].

121
Figure 4.5 Chemically-resolved relative mass fractions of particle types for (a) submicron (0.523 – 1 μm) and (b) supermicron (1-2.5 μm) particles at each site. The black diamonds represent the average ATOFMS mass concentration by site.

122
4.4.5 Differences in Particle Aging and Mixing State
The degree of aging of the different particle types provides another means of
determining the relative importance of temporal and spatial trends on the properties of the
aerosol and specifically the variation observed on the polluted Mar. 13th in comparison to
the background conditions observed on Feb. 12th. Mass spectral markers for chloride (-
35Cl-), nitrate (62NO3-), and sulfate (97HSO4
-) were used to provide information as to the
degree and form of particle aging. Chloride has been shown as a good marker for
unreacted sea salt particles, while nitrate has been shown as a marker for aging on many
particle types [Noble and Prather, 1997;Pratt and Prather, 2009a;Sullivan, et al., 2007].
Sulfate is identified by the 97HSO4- peak [Whiteaker and Prather, 2003], except for sea
salt particles where there is interference from the 23Na37Cl2- at m/z -97. Figure 4.6a shows
the average nitrate and chloride peak areas at each site for sea salt particles, while Figure
4.6b and 4.6c show nitrate and sulfate for K-Combustion and ECOC particles, the most
abundant submicron particle types, respectively. The clean Feb. 12th has higher chloride
peak area for sea salt at all 3 sites, while more polluted conditions on Mar. 13th have a
nitrate peak area that starts larger and decreases to roughly even with chloride during the
day (Figure 4.6a). This decrease in the amount of nitrate on sea salt particles follows a
temporal trend with aged particles being transported inland by the sea breeze and
replaced by fresh particles that become more abundant. There were not enough K-
Combustion and ECOC particles with negative mass spectra to analyze peak areas during
the clean Feb. 12th. On the more polluted Mar. 13th, nitrate area decreases during the day
as it did on sea salt, indicating that the combustion particles are fresher (Figure 4.6b and

123
Figure 4.6 Peak areas related to aging for (a) Sea salt particles, (b) K-Combustion particles, and (c) ECOC particles. For sea salt particles, chloride (blue – 35Cl-) and nitrate (green – 62NO3
-) are plotted. For K-Combustion and ECOC particles, nitrate and sulfate (purple – m/z 97HSO4
-) are plotted. The ratio of the peak areas for nitrate and sulfate (d) are given for K-Combustion and ECOC particle types.

124
6c). For K-Combustion, sulfate peak area becomes larger throughout the day on Mar.
13th. This is likely because the particles are fresher and had less time to react
heterogeneously and/or have ammonium nitrate and water condense (which can suppress
sulfate signal)[Neubauer, et al., 1998]. Figure 4.6d shows the ratio of the sulfate peak
area and nitrate peak area at each site during the day. The ratio increases throughout the
day for both particle types showing relatively less secondary nitrate as the aged aerosol is
transported inland and replaced by more fresh particles. The observations from the sea
salt and combustion particles (ECOC and K-Combustion) demonstrate that the secondary
marker nitrate follows a temporal pattern and occurs across the region without much
spatial variation.
4.4.6 Variations in Chemistry and Implications for Models and Regulations
The measurements described above show that even on days with relatively similar
meteorological conditions there can be considerable differences in particle mass and
number concentrations and subsequently differences in human exposure levels to
particles. These differences are driven by changes in particle sources and aging
determined by chemical mixing state within a marine-influenced urban atmosphere. On
Feb. 12th, similar low mass concentrations, low number concentrations, and particle
chemistry were observed around the San Diego Bay, providing a baseline of the urban
background for comparison to more polluted time periods. During polluted time periods,
transport of aged particles inland and replacement by fresher emissions was observed
homogeneously across the region driven sea breeze cleanout during the day of particles
that had been chemically processed overnight. Changes in the fraction of aerosols
spatially were used to identify downtown San Diego as the most concentrated source

125
region for the fresh submicron particles (mostly combustion) observed. Thus, by
understanding the changes to sources and aging from a chemical composition perspective
we can describe why variations in mass and number concentrations were observed.
The initial deployment of the mobile ATOFMS laboratory and single particle
measurements from this platform demonstrate the importance of understanding spatial
and temporal changes driven by particle chemistry as they relate to sources and aging
processes. Describing the urban aerosol from a single particle mixing state perspective
will be a key to improving future models that will analyze the links between aerosol
composition/sources, human exposure to these aerosols, and their broader impact on
public health. When crafting future regulations, the vast variation possible within similar
PM2.5 mass concentrations and the chemistry causing these changes needs to be
considered. Future high time resolution methods and measurements of spatial variation
across urban environments will need to be incorporated into more advanced models to
help bridge the causal gap between air pollution and human health.
4.5 Acknowledgements
Andrew Ault acknowledges the Unified Port of San Diego Environmental
Services Department for funding sampling with a graduate research grant and the is
grateful for a Department of Energy Global Change Education Program graduate research
environmental fellowship.. Joseph Mayer is thanked for his efforts with adapting the
trailer and installing the generators. Additional funding was provided by the California
Air Resources Board under contract 04-336. The authors gratefully acknowledge the
NOAA Air Resources Laboratory for the provision of the HYSPLIT transport model and
READY website used in this publication.

126
Chapter 4 is in preparation for submission to the Atmospheric Environment: A. P.
Ault, J. M. Creamean, and K.A. Prather, Mobile Laboratory Observations of Temporal
and Spatial Variability within the Coastal Urban Aerosol.
127
4.6 References
B. Asgharian, A model of deposition of hygroscopic particles in the human lung, Aerosol Science And Technology, 38 (9), 938-947, 2004.
A. P. Ault, M. J. Moore, H. Furutani and K. A. Prather, Impact of emissions from the Los
Angeles port region on San Diego air quality, Environmental Science & Technology, 43 (10), 3500-3506, 2009.
N. Bukowiecki, J. Dommen, A. S. H. Prevot, R. Richter, E. Weingartner and U.
Baltensperger, A mobile pollutant measurement laboratory-measuring gas phase and aerosol ambient concentrations with high spatial and temporal resolution, Atmospheric Environment, 36 (36-37), 5569-5579, 2002.
N. Bukowiecki, J. Dommen, A. S. H. Prevot, E. Weingartner and U. Baltensperger, Fine
and ultrafine particles in the Zurich (Switzerland) area measured with a mobile laboratory: an assessment of the seasonal and regional variation throughout a year, Atmospheric Chemistry And Physics, 3, 1477-1494, 2003.
M. J. Campen, J. P. Nolan, M. C. J. Schladweiler, U. P. Kodavanti, P. A. Evansky, D. L.
Costa and W. P. Watkinson, Cardiovascular and thermoregulatory effects of inhaled PM-associated transition metals: A potential interaction between nickel and vanadium sulfate, Toxicological Sciences, 64 (2), 243-252, 2001.
M. R. Canagaratna, J. T. Jayne, D. A. Ghertner, S. Herndon, Q. Shi, J. L. Jimenez, P. J.
Silva, P. Williams, T. Lanni, F. Drewnick, K. L. Demerjian, C. E. Kolb and D. R. Worsnop, Chase studies of particulate emissions from in-use New York City vehicles, Aerosol Sci. Technol., 38 (6), 555-573, 2004.
J. Cyrys, M. Pitz, J. Heinrich, H. E. Wichmann and A. Peters, Spatial and temporal
variation of particle number concentration in Augsburg, Germany, Sci. Total Environ., 401 (1-3), 168-175, 2008.
P. F. DeCarlo, J. G. Slowik, D. R. Worsnop, P. Davidovits and J. L. Jimenez, Particle
morphology and density characterization by combined mobility and aerodynamic diameter measurements. Part 1: Theory, Aerosol Science And Technology, 38 (12), 1185-1205, 2004.
B. J. Finlayson-Pitts and J. N. Pitts, Chemistry of the Upper and Lower Atmosphere,
Academic Press, San Diego, CA, 2000. E. Gard, J. E. Mayer, B. D. Morrical, T. Dienes, D. P. Fergenson and K. A. Prather, Real-
time analysis of individual atmospheric aerosol particles: Design and performance of a portable ATOFMS, Analytical Chemistry, 69 (20), 4083-4091, 1997.

128
S. A. Guazzotti, J. R. Whiteaker, D. Suess, K. R. Coffee and K. A. Prather, Real-time
measurements of the chemical composition of size-resolved particles during a Santa Ana wind episode, California USA, Atmospheric Environment, 35 (19), 3229-3240, 2001.
R. N. Harrison and A. M. Jones, Multisite study of particle number concentrations in
urban air, Environ. Sci. Technol., 39 (16), 6063-6070, 2005. V. Isakov, J. S. Touma and A. Khlystov, A method of assessing air toxics concentrations
in urban areas using mobile platform measurements, Journal Of The Air & Waste Management Association, 57 (11), 1286-1295, 2007.
P. I. Jalava, R. O. Salonen, A. S. Pennanen, M. S. Happo, P. Penttinen, A. I. Halinen, M.
Sillanpaa, R. Hillamo and M. R. Hirvonen, Effects of solubility of urban air fine and coarse particles on cytotoxic and inflammatory responses in RAW 264.7 macrophage cell line, 229 (2), 146-160, 2008.
C. E. Kolb, S. C. Herndon, B. McManus, J. H. Shorter, M. S. Zahniser, D. D. Nelson, J.
T. Jayne, M. R. Canagaratna and D. R. Worsnop, Mobile laboratory with rapid response instruments for real-time measurements of urban and regional trace gas and particulate distributions and emission source characteristics, Environmental Science & Technology, 38 (21), 5694-5703, 2004.
M. Krudysz, K. Moore, M. Geller, C. Sioutas and J. Froines, Intra-community spatial
variability of particulate matter size distributions in Southern California/Los Angeles, Atmos. Chem. Phys., 9 (3), 1061-1075, 2009.
J. F. Mejia, L. Morawska and K. Mengersen, Spatial variation in particle number size
distributions in a large metropolitan area, Atmos. Chem. Phys., 8 (5), 1127-1138, 2008.
R. C. Moffet, X. Y. Qin, T. Rebotier, H. Furutani and K. A. Prather, Chemically
segregated optical and microphysical properties of ambient aerosols measured in a single-particle mass spectrometer, Journal Of Geophysical Research-Atmospheres, 113 (D12), 2008.
K. Moore, M. Krudysz, P. Pakbin, N. Hudda and C. Sioutas, Intra-Community
Variability in Total Particle Number Concentrations in the San Pedro Harbor Area (Los Angeles, California), Aerosol Sci. Technol., 43 (6), 587-603, 2009.
A. Nel, Air pollution-related illness: Effects of particles, Science, 308 (5723), 804-806,
2005.

129
K. R. Neubauer, M. V. Johnston and A. S. Wexler, Humidity effects on the mass spectra of single aerosol particles, Atmospheric Environment, 32 (14-15), 2521-2529, 1998.
C. A. Noble and K. A. Prather, Real-time single particle monitoring of a relative increase
in marine aerosol concentration during winter rainstorms, Geophysical Research Letters, 24 (22), 2753-2756, 1997.
H. Orru, E. Teinemaa, T. Lai, T. Tamm, M. Kaasik, V. Kimmel, K. Kangur, E. Merisalu
and B. Forsberg, Health impact assessment of particulate pollution in Tallinn using fine spatial resolution and modeling techniques, Environmental Health, 8, 2009.
S. S. Park and A. S. Wex, Size-dependent deposition of particles in the human lung at
steady-state breathing, Journal Of Aerosol Science, 39 (3), 266-276, 2008. C. A. Pope, Mortality effects of longer term exposures to fine particulate air pollution:
Review of recent epidemiological evidence, Inhalation Toxicology, 19, 33-38, 2007.
C. A. Pope, J. B. Muhlestein, H. T. May, D. G. Renlund, J. L. Anderson and B. D. Horne,
Ischemic heart disease events triggered by short-term exposure to fine particulate air pollution, Circulation, 114 (23), 2443-2448, 2006.
U. Poschl, Atmospheric aerosols: Composition, transformation, climate and health
effects, Angewandte Chemie-International Edition, 44 (46), 7520-7540, 2005. K. A. Pratt and K. A. Prather, Real-Time, Single-Particle Volatility, Size, and Chemical
Composition Measurements of Aged Urban Aerosols, Environmental Science & Technology, 43 (21), 8276-8282, 2009a.
K. A. Pratt and K. A. Prather, Real-time, single-particle volatility, size, and chemical
composition measurements of aged urban aerosols., Environmental Science & Technology, In Preparation, 2009b.
X. Qin, K. A. Pratt, L. G. Shields, S. M. Toner and K. A. Prather, Seasonal Comparisons
of the Single Particle Mixing State in Riverside, CA duing the SOAR 2005 Campaign Aerosol Science & Technology, in prep.
X. Y. Qin, P. V. Bhave and K. A. Prather, Comparison of two methods for obtaining
quantitative mass concentrations from aerosol time-of-flight mass spectrometry measurements, Analytical Chemistry, 78 (17), 6169-6178, 2006.
A. A. Rostami, Computational Modeling of Aerosol Deposition in Respiratory Tract: A
Review, Inhal. Toxicol., 21 (4), 262-290, 2009.

130
X. H. Song, P. K. Hopke, D. P. Fergenson and K. A. Prather, Classification of single
particles analyzed by ATOFMS using an artificial neural network, ART-2A, Analytical Chemistry, 71 (4), 860-865, 1999.
M. T. Spencer, L. G. Shields and K. A. Prather, Simultaneous measurement of the
effective density and chemical composition of ambient aerosol particles, Environmental Science & Technology, 41 (4), 1303-1309, 2007.
R. C. Sullivan, S. A. Guazzotti, D. A. Sodeman and K. A. Prather, Direct observations of
the atmospheric processing of Asian mineral dust, Atmospheric Chemistry And Physics, 7, 1213-1236, 2007.
A. Valavanidis, K. Fiotakis and T. Vlachogianni, Airborne Particulate Matter and Human
Health: Toxicological Assessment and Importance of Size and Composition of Particles for Oxidative Damage and Carcinogenic Mechanisms, Journal of Environmental Science and Health Part C-Environmental Carcinogenesis & Ecotoxicology Reviews, 26 (4), 339-362, 2008.
J. R. Whiteaker and K. A. Prather, Hydroxymethanesulfonate as a tracer for fog
processing of individual aerosol particles, Atmospheric Environment, 37 (8), 1033-1043, 2003.
T. Xia, M. Kovochich, J. Brant, M. Hotze, J. Sempf, T. Oberley, C. Sioutas, J. I. Yeh, M.
R. Wiesner and A. E. Nel, Comparison of the abilities of ambient and manufactured nanoparticles to induce cellular toxicity according to an oxidative stress paradigm, 6 (8), 1794-1807, 2006.
H. C. Yeh, R. G. Cuddihy, R. F. Phalen and I. Y. Chang, Comparisons of calculated
respiratory tract deposition of particles based on the proposed NCRP model and the new ICRP66 model, Aerosol Science and Technology, 25 (2), 134-140, 1996.
M. Zavala, S. C. Herndon, E. C. Wood, J. T. Jayne, D. D. Nelson, A. M. Trimborn, E.
Dunlea, W. B. Knighton, A. Mendoza, D. T. Allen, C. E. Kolb, M. J. Molina and L. T. Molina, Comparison of emissions from on-road sources using a mobile laboratory under various driving and operational sampling modes, Atmos. Chem. Phys., 9 (1), 1-14, 2009.
Y. M. Zhou, C. Y. Zhong, I. M. Kennedy, V. J. Leppert and K. E. Pinkerton, Oxidative
stress and NF kappa B activation in the lungs of rats: a synergistic interaction between soot and iron particles, Toxicology And Applied Pharmacology, 190 (2), 157-169, 2003.

5 Potential Changes to California Orographic Precipitation
Due to Transported Asian Dust
5.1 Synopsis
Aerosols impact the microphysical properties of clouds by serving as cloud
condensation nuclei (CCN) and ice nuclei (IN). By modifying cloud properties, aerosols
have the potential to alter the location and intensity of precipitation [Rosenfeld, et al.,
2008], but determining the magnitude and reproducibility of aerosol-induced changes
remains a significant challenge to experimentalists and modelers [Stevens and Feingold,
2009]. Efforts to characterize these changes are of vital importance as policymakers enact
regulations that will impact water management in regions where water is a limited
resource. Models and measurements suggest dust aerosols, which can be transported
around the globe on timescales of days [Uno, et al., 2009], can serve as effective
IN[DeMott, et al., 2003;VanCuren and Cahill, 2002] and impact mixed phase
clouds[Uno, et al., 2009;Yumimoto, et al., 2009]. Herein, results from the CalWater Early
Start field campaign combine detailed chemistry of the insoluble particle residues in
precipitation samples and back trajectory analysis with highly spatio-temporally resolved
precipitation and related meteorological observations at the surface and aloft. Two large
storms are compared with similar meteorology (e.g. 72 hour integrated horizontal water
vapor transport) that together produced 23% of the annual precipitation and 38% of the
maximum snowpack at California’s Central Sierra Snow Lab (CSSL). One storm with
high levels of Asian dust in the precipitation produced 1.4 times as much precipitation
and 1.6 times the increase in snow pack at CSSL. These uniquely comprehensive
131

132
measurements suggest that Asian dust, transported across the Pacific, became
incorporated into the upper altitudes of the precipitation-producing clouds over the Sierra
Nevada, and ultimately may have impacted precipitation amounts.
5.2 Introduction
Recent advances in observational and diagnostic methods for both aerosols and
orographic precipitation processes have created the opportunity to make further advances
on the challenging problem of quantifying aerosol-cloud-precipitation interactions. The
Sierra Nevada has seen a reduction of the snowpack in recent years, which has been
attributed to impacts of anthropogenic pollution on clouds and orographic precipitation
[Rosenfeld, et al., 2008]. In an effort to better understand the impacts of aerosols on
orographic precipitation in the Sierra Nevada [Rosenfeld, et al., 2008], the CalWater
campaign was designed to study of aerosols-meteorology-precipitation. The primary
measurement site at Sugar Pine Dam (SPD-1066 meters MSL) is ideally situated to
observe orographic precipitation associated with synoptic scale weather systems affecting
the west coast of the United States (Figure 5.1). Before investigating the potential role of
aerosols, it is critical to compare the two storms meteorologically.

133
Figure 5.1 The primary sampling site (Sugar Pine Dam – SPD, 39.129°N, 120.801°W, 1066 m ASL) and sites where supporting data were collected (Colfax, Bodega Bay – BBY, Sloughhouse – SHS, and Central Sierra Snow Lab - CSSL) are marked on a terrain base map of California and map inset. The different instruments used at the SPD site are shown in the accompanying photograph.

134
5.3 Experimental
5.3.1 Meteorological Methods
The meteorological features described above were detected by a unique network
of experimental meteorological observations aloft and at the surface, with at least hourly
time resolution. Composites of Special Sensor Microwave Imager(SSM/I) data from
polar orbiting satellites were used to measure integrated water vapor [Schluessel and
Emery, 1990] over the ocean. Atmospheric rivers were identified by IWV >2 cm IWV,
length >2000 km, and width <1000 km, criteria that have been previously established at
sea level [Neiman, et al., 2008]. A modified IWV threshold of >1.58 cm was used at
Colfax due to the elevation at the site (~ 644 meters). A 915-MHz wind profiler and
surface meteorological instrumentation at the Colfax, Sloughouse, and Bodega Bay sites
were analyzed to deduce mesoscale meteorological conditions in the vicinity of Sugar
Pine and are discussed in detail below. Over land, continuous 30-minute-resolution
measurements of IWV in the full atmospheric column above a dual-frequency, global
positioning system (GPS) receiver at Colfax, California were retrieved with high
accuracy (~1 mm) using the apparent delays in the arrival of radio signals transmitted by
a constellation of GPS satellites, as well as collocated surface temperature and pressure
measurements (Mattioli et al. 2007 and references therein[Mattioli, et al., 2007]). At
midlatitudes, the observing domain above a GPS receiver corresponds to an inverted cone
with a radius of ~11 km at 500 hPa.
At SPD the S-band profiling radar (S-PROF), a fixed dish antenna, was operated
at 2875 MHz and directed vertically to study the backscatter of energy from

135
hydrometeors and cloud droplets via Rayleigh scattering and to monitor the radar
brightband melting level (which approximates the freezing level) [White, et al., 2003]. A
Particle Size and Velocity (PARSIVEL) disdrometer measured the duration and
amplitude of the decrease in voltage of a continuous laser on a photodiode as a drop
passes through the beam to determine the drop’s fall speed and size, respectively.
Disdrometer data was used to determine drop size distributions at the surface of the
sampling site.
5.3.2 Precipitation Sampling
Precipitation was collected for Periods 1-8, snowfall was collected and melted for
Period 9, and mixed phase precipitation was collected and melted during Period 10.
Precipitation samples were analyzed chemically using a previously described method
[Holecek, et al., 2007]; the insoluble residues in the precipitation samples were
resuspended using a Collison nebulizer, dried using two silica gel diffusion driers, and
sampled by an aerosol time-of-flight mass spectrometer (ATOFMS) [Gard, et al., 1997].
The ATOFMS provides size and dual polarity mass spectra for individual particles
between 0.2-3.0 micrometers. Particles were classified into different types based on
characteristic peaks in the positive and negative mass spectra. Representative mass
spectra, as well as further details on the classification and labeling scheme are provided
below.
5.3.3 FLEXPART Model
The Lagrangian particle dispersion model FLEXPART [Stohl, et al., 2005]
version 8.1 was run with NOAA Global Forecast System 0.5° x 0.5° global data at 26
levels using SPD as the point source for 7-day backward air mass trajectory calculations

136
using the cluster analysis feature. Analyses at 0000, 0600, 1200, and 1800 UTC and
forecasts at 0300, 0900, 1500, and 2100 UTC were used. Calculations with releases of
400-500 particles were conducted every 3 hours during each storm from 500 m from 500
– 10000 meters, as well as at the mid-point in time for each precipitation sample.
Releases were also conducted at the bright band height and cloud echo top height as
determined from the S-PROF radar. Walker et al. (2009) have developed a high-
resolution (1-km) dust source database for Southwest Asia and East Asia [Walker, et al.,
2009]. The dust source database is based on topography, land use, atlases and ten years
of Dust Enhancement Product (DEP) imagery derived from MODIS. The MODIS DEP
imagery allows Walker et al. 2009 to identify the location of the small erodible area at the
head of each plume[Walker, et al., 2009]. This dataset is unique as it retains the 1-km
resolution of the satellite radiance data used to derive the dust source database. However,
for this paper, the data have been averaged to 81 km horizontal resolution.
5.4 Results and Discussion
5.4.1 Atmospheric Rivers Impacting California
The large contribution of the two extratropical cyclones described in this paper to
the annual rainfall in the Sierra Nevada was related to atmospheric river (AR) conditions
observed during both storms [Neiman, et al., 2008]. ARs transport water vapor into
California and modulate orographic precipitation. ARs lead to twice the daily average
precipitation of other storms in California during winter [Neiman, et al., 2008] and in
extreme cases lead to severe flooding [Ralph, et al., 2006], however they also increase
snowpack and fill reservoirs critical to the region’s water supply [Neiman, et al., 2008].
AR conditions for Storm 1 (February 22-24, 2009) and Storm 2 (March 1-4, 2009) are

137
evident from well-defined plumes of integrated water vapor (IWV) in special sensor
microwave imager (SSM/I) satellite imagery offshore (Figs. 5.2a and 5.2b) and in AR
observatory data at Bodega Bay on the coast, at Sloughhouse in the central valley, and at
Colfax in the Sierra foothills (Fig. 5.2). Though SPD is 250 km inland, AR conditions
(IWV >1.58 cm at 1066 meters) at the sampling site were confirmed using data from
nearby Colfax with wind profiling and global positioning system meteorology data (Figs.
5.2c and 5.3). AR conditions accounted for >90% of precipitation during both storms at
SPD. Overall, not only did both storms have similar orographic forcing by upslope winds
and similar synoptic-scale and local-scale IWV, but also remarkably similar horizontal
water vapor “bulk” fluxes. Nonetheless, the storms had significantly different
precipitation amounts due to other factors, possibly aerosol-cloud interactions.

138
Figure 5.2 SSM/I satellite images of IWV for a) Storm 1 on the afternoon of 22 February 2009, and b) Storm 2 on the afternoon of 1 March 2009. Both are composites of two SSM/I satellite overpasses during the descending phase of the orbits (North to South) between 1200 and 2359 UTC. The atmospheric rivers are best represented by the associated regions of IWV> 2 cm (green-to-yellow-to-orange), the threshold for atmospheric rivers at sea level. Gaps of satellite coverage are shown as grey areas. c) Time series of IWV (from Colfax; 13 km west of SPD) and precipitation (from SPD) spanning both storms.

139
Table 5.1 Atmospheric river characteristics for Storms 1 & 2 during the CalWater Early Start field campaign.

140
The term atmospheric river refers to a corridor of water vapor transported in the
lower level jet of an extratropical cyclone [Ralph, et al., 2004;Zhu and Newell, 1998].
These conditions account for > 90% of poleward water vapor transport in 10% of zonal
circumferences at midlatitudes [Neiman, et al., 2008;Zhu and Newell, 1998]. The
determination of atmospheric river conditions during the two extratropical cyclones was
based on a previously described methodology [Neiman, et al., 2008;Neiman, et al.,
2009;Ralph, et al., 2004]. Atmospheric rivers are typically long (>2000 km), narrow
(<1000 km) corridors of strong water vapor transport. A distinguishing characteristic of
atmospheric river conditions is the presence of large water vapor contents, as indicated
using a threshold for integrated water vapor (IWV), which is normally 2 cm, for
elevations near sea level [Ralph, et al., 2004]. The IWV threshold used in this paper for
data nearest the Sugar Pine Dam (SPD) field site (located at 1066 m MSL) was adjusted
to 1.58 cm based on analysis of atmospheric profile data from a rawinsonde launched
near sea level at Oakland, California, during Storm 2. The Oakland data indicated that
20% of the total IWV was contained in the lower atmosphere below the 644 m MSL
elevation of the Global Positioning System (GPS) receiver used to measure IWV at
Colfax, California. This correlates with previously measured IWV values during
dropsonde measurements over the Pacific Ocean [Ralph, et al., 2005], where roughly
23% was contained below 644 m MSL. The atmospheric rivers observed during
CalWater Early Start were of modest amplitude offshore and at the coast, with similar
IWV maxima (2.7 cm vs. 3.0 cm). Maximum vertically integrated water vapor transports
(IVT) were calculated from North American Regional Reanalysis (NARR) data and
found to be similar (625 kg/(s*m) vs. 675 kg/(s*m)) [Neiman, et al., 2008;Ralph, et al.,

141
2004]. Storm-total bulk water vapor flux was calculated from BBY ARO data over 72
hours for Storm 1 (starting at 0000 UTC 22 Feb 2009) and again for Storm 2 (starting at
0000 UTC 1 Mat 2009). These time windows were chosen since they encompass the
entirety of the precipitation observed in each Storm, and are of the same duration. The
72-h integrated bulk water vapor flux was nearly identical for the two storms (Table 5.1),
and yet the coastal mountain site (Cazadero) near BBY observed much more rain in the
72 h containing Storm 2 (22.9 cm) than in Storm 1 (10.2 cm).
Key tropospheric observational data were collected at Colfax, California (CFC),
which is located only ~13 km southwest of the chemistry sampling site at Sugar Pine.
Instrumentation at Colfax included a 915-MHz wind profiler for measuring hourly wind
profiles between ~0.1 and 4.0 km above ground with 100-m vertical resolution (see
Carter et al. 1995 for instrumentation details), a GPS receiver for recording IWV at 30-
min intervals, and a meteorological tower and tipping bucket for measuring standard
surface parameters every 2 min. Unless noted otherwise, the discussion here refers to the
analysis shown in Fig. 5.3 for the period 1 – 4 March 2009. This analysis combines
along-front isotachs (directed from 215°) and thermal-wind derived axes of warm and
cold advection below 4.5 km mean sea level (MSL), radar brightband melting levels,
hourly precipitation rates, and surface equivalent potential temperatures. More than 116
mm of precipitation fell at CFC during the three-day period.

142
Figure 5.3 Wind profiler and surface observations from Colfax, California (CFC) on 1-4 March 2009. (a) Time-height section of hourly wind profiles (wind flags = 25 m s-1, barbs = 5 m s-1, half-barbs = 2.5 m s-1), along-front isotachs (m s-1; black contours; directed from 215°), brightband melting level heights (black dots), and axes of thermal-wind derived (i.e., geostrophic) warm and cold advection (red and blue dashed lines, respectively; derivation technique described previously [Neiman and Shapiro, 1989]). Every other range gate is plotted, as is the passage of fronts near the surface (thin vertical dashed lines). (b) Time series of surface equivalent potential temperature (K) and hourly precipitation rate (mm h-1; 10-min averages). The total accumulation for the plotted time series is provided. Thin vertical dashed lines are as in panel (a).

143
The flow at CFC generally contained a southerly component in response to the
offshore position of an extratropical cyclone, although the surface flow was often
decoupled from that observed aloft. A warm front and two cold fronts migrated across
CFC. Geostrophic warm advection associated with the warm front descended from 4 km
MSL at 1000 UTC 1 March 2009 to 1 km MSL at 0230 UTC 2 March. The melting level
jumped by 300 m in response to the descending warm advection at 2200 UTC 1 March
and ~2 km MSL. The flow veered with time across the front, from southerly to
southwesterly above ~2 km MSL and from southeasterly to southerly below that altitude.
Steady precipitation accompanied the warm frontal descent between 1600 UTC 1 March
and 0200 UTC 2 March, after which the surface equivalent potential temperature
increased steadily. Strong southerly flow and descending bands of geostrophic warm
advection in the cyclone warm sector persisted from 0230 UTC 2 March until the first
cold frontal passage at 2100 UTC 2 March. During the warm-frontal descent and within
most of the warm sector, values of IWV exceeded the 1.58-cm threshold for atmospheric-
river conditions at the altitude of Colfax. The first cold front was characterized by an
abrupt wind shift from southerly to southwesterly below 2 km MSL, a decrease in
altitude of the melting level, a deep layer of geostrophic cold advection, and a pair of
rapid 4-K decreases in equivalent potential temperature at the surface. In addition,
significant precipitation rates flanked this cold-frontal passage, including an
instantaneous spike of 30 mm h-1 that marked a narrow cold-frontal rainband, which
forced strong upward air motion – creating the heavy precipitation. A second cold front
passed CFC at ~1830 UTC 3 March, during which the wind shifted from strong southerly
to weaker southwesterly below ~1.5 km MSL, the melting level dropped in altitude to ~ 1

144
km MSL, geostrophic cold advection was observed between 1.5 and 2.5 km MSL, and
the equivalent potential temperature decreased sharply by 5 K. Enhanced precipitation
straddled this cold-frontal passage.
5.4.2 Meteorology and Precipitation Properties for Storms 1 and 2
The meteorology and precipitation properties for both storms are shown in Fig.
5.4a-e (Storm 1) and 5.4f-j (Storm 2) including: a/f) precipitation residue chemistry, b/g)
rain rate and frontal passages, c/h) reflectivity vertical profiles and transport heights, d/i)
precipitation type, and e/j) drop size distributions at the surface. During both storms
precipitation was initially characterized by mid-to-upper-tropospheric upward motion and
associated "seeder" clouds leading to bright band (BB) rain [Martner, et al., 2008], which
shifted to a higher fraction of non-bright band (NBB) rain [Martner, et al., 2008] from
shallow clouds after warm frontal passage. Storm 1 ends with a high fraction of NBB rain
and decreased rain rates. Storm 2 has three notable differences from Storm 1: rain rate
increases after both cold fronts, precipitation type late in the storm shifts away from NBB
rain to BB, convective rain, and snow, and drop size distribution shifts to larger drops.
Many factors may have played a role in the differences between the storms, including
cold frontal forcing, freezing level changes, atmospheric instability, as well as a change
in aerosols incorporated in the clouds. Most non-aerosol-related precipitation processes
were driven by mesoscale meteorological processes that create upward air motion (and
condensation) that vary over time scales of hours and distances of tens of km and were
resolved by CalWater data. Below, we explore a third factor that may have played a role,
the entrainment of Asian dust at cloud top above the freezing level.

145
Figure 5.4 Time series of chemical and meteorological measurements during Storms 1 and 2. The fractions of particle types with different chemical compositions are shown for each period in Storm 1 (Fig. 5.4a) and Storm 2 (Fig. 5.4f). Period numbers with white text font denote periods with dust transport. The average precipitation rate during each sample period and the warm and cold frontal passages are shown for Storm 1 (Fig. 5.4b) and Storm 2 (Fig. 5.4g). A time-height cross section of radar reflectivity from the S-PROF radar is shown for Storm 1 (Fig. 5.4c) and Storm 2 (Fig. 5.4h), with the orange line circling altitudes with back trajectories from Asian dust source regions and the underlying yellow-green line circling back trajectories from Asia west of longitude 120E. The fraction of each type of precipitation (bright band (BB), non-bright band (NBB), convective (Conv.), Snow, and Insufficient (Insuf.) for each sample period (where snow indicates that the bright band is below the lowest radar range gate) is shown for Storm 1 (Fig. 5.4d) and Storm 2 (Fig. 5.4i). The surface drop size distribution (DSD) with size on the y-axis, number density (N(D) - pseudo-color background) and mean diameter (black line) are shown for Storm 1 (Fig. 5.4e) and Storm 2 (Fig. 5.4j).

146
5.4.3 Transported Asian Dust in Precipitation Samples
Aerosols that act as IN (i.e. unprocessed mineral dust) can be lofted by
extratropical cyclones into the upper troposphere [Stohl, et al., 2002] and transported
intercontinentally [Eguchi, et al., 2009]. This dust-enriched air can descend and become
entrained at cloud top heights, where even dust-free ambient air entrainment can increase
ice concentrations [Hobbs and Rangno, 1985]. The added presence of dust in entrained
ambient air has been modeled to induce an early initiation of the ice phase, increasing
riming rates, and precipitation efficiency for orographic clouds [Muhlbauer and
Lohmann, 2009]. The possibility that entrained dust may affect precipitation is supported
by earlier findings from cloud seeding experiments which show that descending dry air
over a shallow moist zone increases potential instability providing a mechanism for
strong evaporative cooling, ice nucleation [Hobbs and Rangno, 1985], and precipitation
enhancement [Rauber, et al., 1988].
To investigate the chemistry of aerosols incorporated into clouds and
precipitation, multiple precipitation samples were collected. Aerosol time-of-flight mass
spectrometry (ATOFMS) was used to determine the size and chemical composition of
individual resuspended insoluble residues [Gard, et al., 1997]. During Storm 1 and the
beginning of Storm 2 (Figs. 5.4a/5.4f), the most abundant residue observed in the
precipitation samples was an oxidized organic carbon particle type comprised of aromatic
organic species. These species most likely came from CCN active biomass burning
particles [Holecek, et al., 2007;Petters, et al., 2009] and are likely composed of water
soluble humic-like substances that can represent large fractions of organic carbon in
precipitation [Graber and Rudich, 2006]. During Storm 2, a dramatic shift occurred in

147
residue chemistry from a high number fraction of organic carbon residues to a high
fraction of mineral dust residues. Along with fractional increases, by the end of Storm 2
the precipitation had roughly an order of magnitude higher dust residue counts per
sampling hour than was observed for either Storm 1 or the beginning of Storm 2. These
mineral dust residues are characterized by aluminosilicate ions (59AlO2-, 60SiO2
-, 76SiO3-)
and inorganic metal ions (27Al+, 39K+, 48Ti+), likely phyllosilicates [Gallavardin, et al.,
2008] (OC/dust spectra in Fig. 5.5), and differences were observed in the dust mass
spectra between Storms 1 and 2. Storm 2 dust has tracer combinations that have been
observed in Asian soil samples [Jeong, 2008] and spectra are similar to Asian dust ice
residues measured by ATOFMS during aircraft-observations of mixed phase clouds
[Pratt, et al., 2009]. Ion patterns for Storm 1 particles were more representative of local
dust. Simultaneous ground-based measurements show very low concentrations of dust
particles were present at the end of Storm 2 (Table 5.2), suggesting scavenging was not
the source of residues, but instead that the dust residues were serving as IN.
Information on the different precipitation samples collected during Storms 1 & 2
is given in Table 5.2. Sample length varied based on site conditions and the fact that
collection was not an automated process. Future studies will incorporate standardized and
automated sample collection techniques to allow greater information on the precipitation
sample properties to be determined. During Storm 2 the number of precipitation residues
is observed to decrease considerably over the course of the storm, even if sample length
is normalized. This is due to the incorporation of anthropogenic aerosols both in-cloud
and during scavenging as drops fall towards the site and is typical of precipitation at the
beginning of storms [Pruppacher and Klett, 1997]. Precipitation type was classified into

148
4 primary types with half hour time resolution using methods developed that use S-Prof
data: bright band (BB), non-bright band (NBB), convective (Conv), and snow. During
some periods not enough data was collected to determine the type of precipitation and are
labeled as insufficient. Fractions of precipitation type for each sample are included as a
numerical reference due to the difficulty in determining these values from the visual
display in Figure 5.4. In addition the average and range of bright band heights and echo
top heights determined from the S-Prof radar are included.
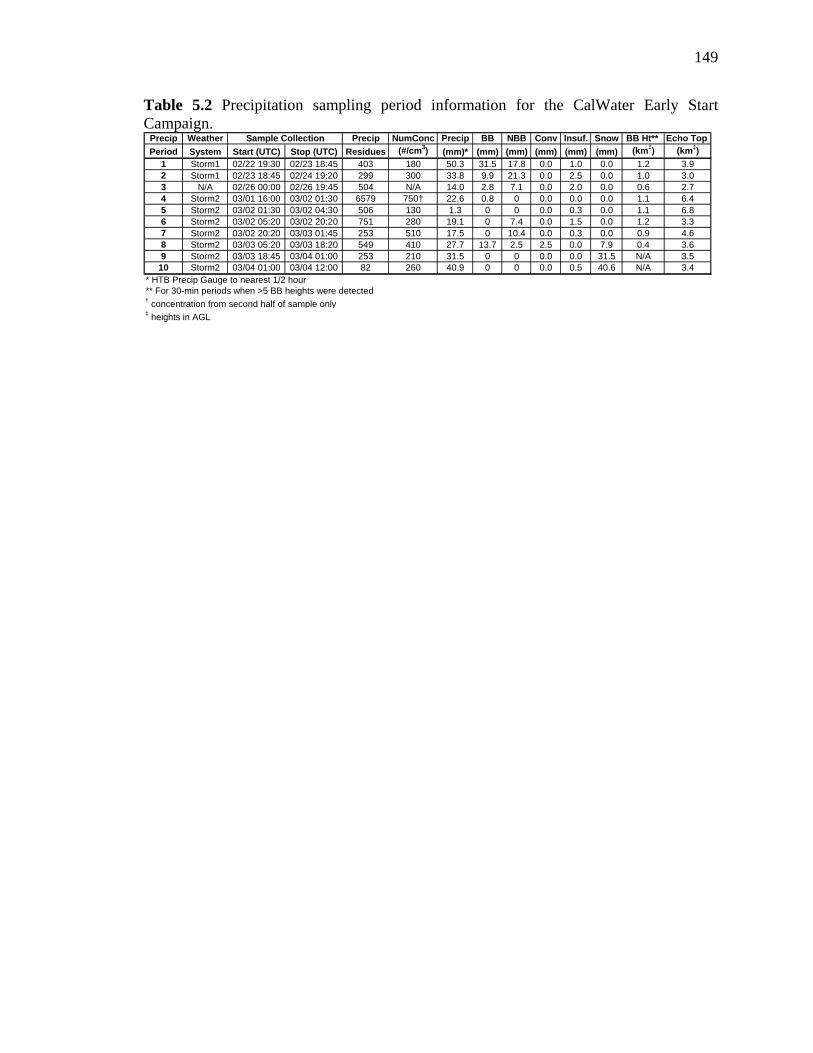
149
Table 5.2 Precipitation sampling period information for the CalWater Early Start Campaign.
Precip Weather Precip NumConc Precip BB NBB Conv Insuf. Snow BB Ht** Echo Top
Period System Start (UTC) Stop (UTC) Residues (#/cm3) (mm)* (mm) (mm) (mm) (mm) (mm) (km‡) (km‡)
1 Storm1 02/22 19:30 02/23 18:45 403 180 50.3 31.5 17.8 0.0 1.0 0.0 1.2 3.92 Storm1 02/23 18:45 02/24 19:20 299 300 33.8 9.9 21.3 0.0 2.5 0.0 1.0 3.03 N/A 02/26 00:00 02/26 19:45 504 N/A 14.0 2.8 7.1 0.0 2.0 0.0 0.6 2.74 Storm2 03/01 16:00 03/02 01:30 6579 750† 22.6 0.8 0 0.0 0.0 0.0 1.1 6.45 Storm2 03/02 01:30 03/02 04:30 506 130 1.3 0 0 0.0 0.3 0.0 1.1 6.86 Storm2 03/02 05:20 03/02 20:20 751 280 19.1 0 7.4 0.0 1.5 0.0 1.2 3.37 Storm2 03/02 20:20 03/03 01:45 253 510 17.5 0 10.4 0.0 0.3 0.0 0.9 4.68 Storm2 03/03 05:20 03/03 18:20 549 410 27.7 13.7 2.5 2.5 0.0 7.9 0.4 3.69 Storm2 03/03 18:45 03/04 01:00 253 210 31.5 0 0 0.0 0.0 31.5 N/A 3.5
10 Storm2 03/04 01:00 03/04 12:00 82 260 40.9 0 0 0.0 0.5 40.6 N/A 3.4* HTB Precip Gauge to nearest 1/2 hour** For 30-min periods when >5 BB heights were detected† concentration from second half of sample only‡ heights in AGL
Sample Collection

150
Figure 5.5 ATOFMS mass spectra of a) organic carbon and b) mineral dust from precipitation samples.
151
Average mass spectra from Period 6 for the two most abundant residues observed
in the precipitation samples are shown in Figure 5.5. One was an organic carbon particle
type characterized by oxidized organic markers (43C2H3O+/43CHNO+ and 45COOH+) and
aromatics (77C6H5+ and 91C7H7
+) and the other a mineral dust particle type characterized
by aluminosilicate peaks (76SiO3-,
77HSiO3-,
59AlO2-, 60SiO2
-) in the negative ions and
inorganic metal peaks in the positive ions (27Al+, 39K+, 56Fe+, 48Ti+, 64TiO+, 23Na+, and
24Mg+). Period 6 was chosen as it represents a period with roughly equal numbers of
organic carbon and dust particles. Given the prevalence of the organic carbon particle
type and a relative lack of spectra corresponding to the standard ATOFMS biomass
burning signature, it is likely that these spectra are of the water soluble organic species
from biomass burning particles that have dissolved in the precipitation solution and are
resuspended independent of the potassium cores often found in biomass burning particles.
The water soluble oxidized organic carbon particle type has been shown previously in
ATOFMS analysis of precipitation samples [Holecek, et al., 2007] and has been
supported by recent single particle x-ray microscopy showing organic carbon mixed with
inorganic cores in urban outflow [Moffet, et al., 2010]. The dust spectrum shown in
Figure 5.5b has many characteristic markers of dust observed in previous ATOFMS
measurements [Sullivan, et al., 2007]. The combination of these markers indicates that
these dust particles are likely phyllosilicates, such as ilite or kaolinite [Gallavardin, et al.,
2008].
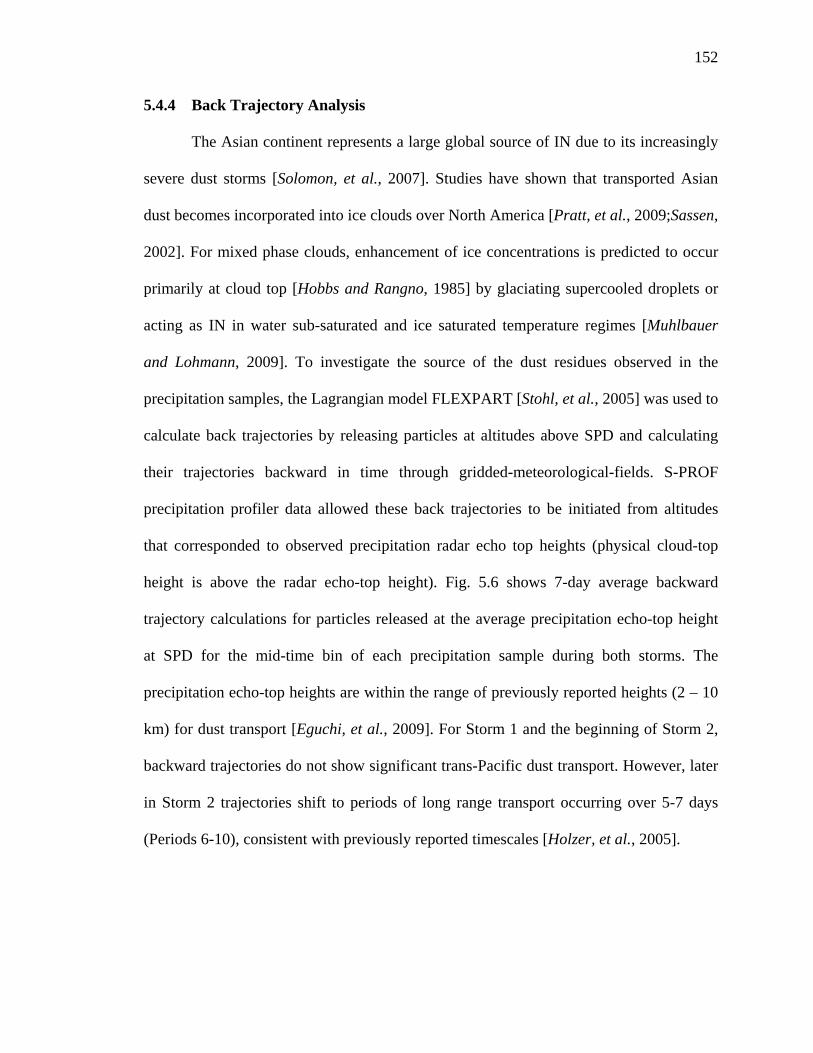
152
5.4.4 Back Trajectory Analysis
The Asian continent represents a large global source of IN due to its increasingly
severe dust storms [Solomon, et al., 2007]. Studies have shown that transported Asian
dust becomes incorporated into ice clouds over North America [Pratt, et al., 2009;Sassen,
2002]. For mixed phase clouds, enhancement of ice concentrations is predicted to occur
primarily at cloud top [Hobbs and Rangno, 1985] by glaciating supercooled droplets or
acting as IN in water sub-saturated and ice saturated temperature regimes [Muhlbauer
and Lohmann, 2009]. To investigate the source of the dust residues observed in the
precipitation samples, the Lagrangian model FLEXPART [Stohl, et al., 2005] was used to
calculate back trajectories by releasing particles at altitudes above SPD and calculating
their trajectories backward in time through gridded-meteorological-fields. S-PROF
precipitation profiler data allowed these back trajectories to be initiated from altitudes
that corresponded to observed precipitation radar echo top heights (physical cloud-top
height is above the radar echo-top height). Fig. 5.6 shows 7-day average backward
trajectory calculations for particles released at the average precipitation echo-top height
at SPD for the mid-time bin of each precipitation sample during both storms. The
precipitation echo-top heights are within the range of previously reported heights (2 – 10
km) for dust transport [Eguchi, et al., 2009]. For Storm 1 and the beginning of Storm 2,
backward trajectories do not show significant trans-Pacific dust transport. However, later
in Storm 2 trajectories shift to periods of long range transport occurring over 5-7 days
(Periods 6-10), consistent with previously reported timescales [Holzer, et al., 2005].

153
Figure 5.6 FLEXPART average backward trajectories calculated from the midpoint in time of each precipitation sampling period with particles released at the average cloud echo top height of that period. a) The above ground level (AGL) altitude for each trajectory starting at the site (0 hours) and markers representing each day backward in time from right to left. b) The back trajectories on a latitude (y-axis) and longitude (x-axis) grid with markers each day. Dust source regions are marked in brown as determined from the Navy Aerosol Analysis Prediction System (NAAPS). The observing periods in both panels have the same color coding.

154
To obtain a greater understanding of the transport conditions, a series of back
trajectories were calculated every 3 hours during each storm in 500 meter increments.
Each back trajectory was checked to see whether it passed over Asia or the climatological
source region for Asian dust below 6 km AGL within the previous 7 days. Back
trajectories originating in Asia are superimposed on S-PROF radar images in Figs.
5.4c/5.4h. Backward trajectories specifically crossing dust source regions in Asia below
6 km AGL are also shown. Minimal overlap occurs between trajectories and clouds
during Storm 1 and the beginning of Storm 2. However, during the latter half of Storm 2,
the overlap between the precipitating clouds and the trajectories indicative of dust
transport implies that mineral dust was most likely incorporated well above the melting
level in the ice phase portion of precipitating mixed phase clouds, which is confirmed by
the residue chemistry (Fig. 5.4f). Additionally, transport conditions did not occur below
cloud, which is consistent with the absence of dust in ambient sampling at the surface,
and eliminates scavenging as a source of dust in the precipitation samples. While
uncertainties exist in the back trajectories, the concurrence of three sources of
information (trajectories, S-PROF radar observations, and measurements of insoluble
residues within the precipitation) provides strong evidence of the incorporation of Asian
dust in the clouds and precipitation.

155
Figure 5.7 Schematic summary of Storm 2 case study. a) Transport path from the Asian climatological dust source region (brown), across the Pacific, to the Sierra Nevada Mountains of western North America. The path is derived from back trajectories calculated using FLEXPART ending near cloud top over the SPD observing site. Transport occurred between 2- 8 km MSL, over a roughly 7 day period between 26 February and 4 March 2009. b) Time-height cross-section of observed and derived conditions at the SPD observing site over roughly 72 hours, showing the overlap of observed clouds and precipitation with the times and altitudes for which back trajectories indicate Asian dust is likely present aloft. ATOFMS diagnostics documented Asian dust in the surface precipitation during this same time period. Precipitating clouds (green shaded) and the radar brightband melting level (black dotted line) are derived from S-Prof radar observations. Fronts and atmospheric river conditions are diagnosed from wind profiler and GPS-met observations at the nearby Colfax site. The overall pattern summarized in (b) is similar to the conditions that Rauber et al. (1988) identified as having the greatest potential for aerosol cloud seeding [Rauber, et al., 1988].

156
5.4.5 Conclusions
Herein, the first results are shown detailing the incorporation of transported Asian
dust into orographic precipitation during a synoptic scale weather system impacting
North America. A proposed mechanism of how dust might impact precipitation (Fig. 5.7)
shows a) long range dust transport and b) incorporation of dust at cloud top over regions
identified by earlier cloud seeding experiments as susceptible to precipitation
enhancement by aerosol entrainment [Rauber, et al., 1988]. This figure reflects the
intertwined nature of dynamics, transport conditions, cloud properties, and aerosols in the
atmosphere, leading to simultaneous changes in cloud and precipitation processes.
Previously, when a change occurred in the rate of precipitation, one had to hypothesize
which factors caused the change. Herein, a unique combination of aerosol-precipitation
measurements with highly spatio-temporally resolved meteorology methods allowed for
measurement of each aspect of the complex aerosol-cloud-precipitation interplay.
Different cloud properties and precipitation amounts were observed between two major
storms, one of which had a dramatic shift in aerosol sources and chemistry, impacting the
precipitating clouds due to the transport of Asian dust to cloud-top height over the Sierra
Nevada. We hypothesize that the observed shift to Asian dust affected the formation and
rate of precipitation within these rapidly changing meteorological conditions, however
much work remains to document these potential impacts definitively. This study provides
an initial glimpse into the role of different aerosol sources in precipitation processes and
sets the stage for future long term studies focused on aerosol, cloud, and meteorological
measurements. These will be explored in detail during subsequent CalWater field seasons
which will capture many more precipitation events. The susceptibility of California’s

157
water budget to any shifts in precipitation demonstrates the need to verify and quantify
the relationship between aerosols, clouds, and precipitation.
5.5 Acknowledgements
Funding was provided by the California Energy Commission under contract
UCOP/CIEE C-09-07. A.P. Ault has been funded in part by a U.S. Department of
Energy Global Change Education Program Graduate Research Environmental
Fellowship. J. Mayer, M. Zauscher, and M. Moore provided assistance with UCSD/SIO
equipment set-up. The deployment of the NOAA and UCSD/SIO equipment at the Sugar
Pine site involved many field staff, particularly C. King (NOAA/ESRL/PSD). C. Johnson
(UCSD) assisted with FLEXPART model calculations. Ms. Annette Walker and Dr.
Ming Liu of Naval Research Laboratories provided the dust source region information
from the Navy Aerosol Analysis and Prediction System (NAAPS).
Chapter 5 is preparation for submission to Nature Geoscoence. A. P. Ault, C. R.
Williams, A. B. White, P. J. Neiman, J. M. Creamean, C. J. Gaston, F. M. Ralph, and
K.A. Prather, Observations of Transported Asian Dust in California Precipitation during
CalWater.

158
5.6 References
P. J. DeMott, K. Sassen, M. R. Poellot, D. Baumgardner, D. C. Rogers, S. D. Brooks, A. J. Prenni and S. M. Kreidenweis, African dust aerosols as atmospheric ice nuclei, Geophys. Res. Lett., 30 (14), 2003.
K. Eguchi, I. Uno, K. Yumimoto, T. Takemura, A. Shimizu, N. Sugimoto and Z. Liu,
Trans-pacific dust transport: integrated analysis of NASA/CALIPSO and a global aerosol transport model, Atmospheric Chemistry And Physics, 9 (9), 3137-3145, 2009.
S. Gallavardin, U. Lohmann and D. Cziczo, Analysis and differentiation of mineral dust
by single particle laser mass spectrometry, International Journal Of Mass Spectrometry, 274 (1-3), 56-63, 2008.
E. Gard, J. E. Mayer, B. D. Morrical, T. Dienes, D. P. Fergenson and K. A. Prather, Real-
time analysis of individual atmospheric aerosol particles: Design and performance of a portable ATOFMS, Analytical Chemistry, 69 (20), 4083-4091, 1997.
E. R. Graber and Y. Rudich, Atmospheric HULIS: How humic-like are they? A
comprehensive and critical review, Atmospheric Chemistry And Physics, 6, 729-753, 2006.
P. V. Hobbs and A. L. Rangno, Ice Particle Concentrations in Clouds, Journal Of The
Atmospheric Sciences, 42 (23), 2523-2549, 1985. J. C. Holecek, M. T. Spencer and K. A. Prather, Analysis of rainwater samples:
Comparison of single particle residues with ambient particle chemistry from the northeast Pacific and Indian oceans, Journal Of Geophysical Research-Atmospheres, 112 (D22), 2007.
M. Holzer, T. M. Hall and R. B. Stull, Seasonality and weather-driven variability of
transpacific transport, J. Geophys. Res.-Atmos., 110 (D23), 2005. G. Y. Jeong, Bulk and single-particle mineralogy of Asian dust and a comparison with its
source soils, J. Geophys. Res.-Atmos., 113 (D2), 2008. B. E. Martner, S. E. Yuter, A. B. White, S. Y. Matrosov, D. E. Kingsmill and F. M.
Ralph, Raindrop size distributions and rain characteristics in California coastal rainfall for periods with and without a radar bright band, J. Hydrometeorol., 9 (3), 408-425, 2008.
V. Mattioli, E. R. Westwater, D. Cimini, J. C. Liljegren, B. M. Lesht, S. I. Gutman and F.
J. Schmidlin, Analysis of radiosonde and ground-based remotely sensed PWV

159
data from the 2004 North Slope of Alaska Arctic Winter Radiometric Experiment, Journal Of Atmospheric And Oceanic Technology, 24 (3), 415-431, 2007.
R. C. Moffet, T. R. Henn, A. V. Tivanski, R. J. Hopkins, Y. Desyaterik, A. L. D.
Kilcoyne, T. Tyliszczak, J. Fast, J. Barnard, V. Shutthanandan, S. S. Cliff, K. D. Perry, A. Laskin and M. K. Gilles, Microscopic characterization of carbonaceous aerosol particle aging in the outflow from Mexico City, Atmospheric Chemistry And Physics, 10 (3), 961-976, 2010.
A. Muhlbauer and U. Lohmann, Sensitivity Studies of Aerosol-Cloud Interactions in
Mixed-Phase Orographic Precipitation, Journal Of The Atmospheric Sciences, 66 (9), 2517-2538, 2009.
P. J. Neiman, F. M. Ralph, G. A. Wick, J. D. Lundquist and M. D. Dettinger,
Meteorological characteristics and overland precipitation impacts of atmospheric rivers affecting the West Coast of North America based on eight years of SSM/I satellite observations, Journal of Hydrometeorology, 9 (1), 22-47, 2008.
P. J. Neiman and M. A. Shapiro, Retrieving Horizontal Temperature Gradients and
Advections from Single-Station Wind Profiler Observations, Weather And Forecasting, 4 (2), 222-233, 1989.
P. J. Neiman, A. B. White, F. M. Ralph, D. J. Gottas and S. I. Gutman, A water vapour
flux tool for precipitation forecasting, Proc. Institution of Civil Engineers – Water Management, 162 (2), 83-94, 2009.
M. D. Petters, C. M. Carrico, S. M. Kreidenweis, A. J. Prenni, P. J. DeMott, J. L. Collett
and H. Moosmuller, Cloud condensation nucleation activity of biomass burning aerosol, J. Geophys. Res.-Atmos., 114, 2009.
K. A. Pratt, P. J. DeMott, J. R. French, Z. Wang, D. L. Westphal, A. J. Heymsfield, C. H.
Twohy, A. J. Prenni and K. A. Prather, In situ detection of biological particles in cloud ice-crystals, Nature Geoscience, 2 (6), 397-400, 2009.
H. R. Pruppacher and J. D. Klett, Microphysics of Clouds and Precipitation, 954 pp.,
Kluwer Academic Publishers, Norwell, Massachusetts, U.S.A, 1997. F. M. Ralph, P. J. Neiman and R. Rotunno, Dropsonde observations in low-level jets over
the northeastern Pacific Ocean from CALJET-1998 and PACJET-2001: Mean vertical-profile and atmospheric-river characteristics, Mon. Weather Rev., 133 (4), 889-910, 2005.
F. M. Ralph, P. J. Neiman and G. A. Wick, Satellite and CALJET aircraft observations of
atmospheric rivers over the eastern north pacific ocean during the winter of 1997/98, Monthly Weather Review, 132 (7), 1721-1745, 2004.

160
F. M. Ralph, P. J. Neiman, G. A. Wick, S. I. Gutman, M. D. Dettinger, D. R. Cayan and
A. B. White, Flooding on California's Russian River: Role of atmospheric rivers, Geophysical Research Letters, 33 (13), 2006.
R. M. Rauber, R. D. Elliott, J. O. Rhea, A. W. Huggins and D. W. Reynolds, A
Diagnostic Technique For Targeting During Airborne Seeding Experiments In Wintertime Storms Over the Sierra Nevada, Journal Of Applied Meteorology, 27 (7), 811-828, 1988.
D. Rosenfeld, W. L. Woodley, D. Axisa, E. Freud, J. G. Hudson and A. Givati, Aircraft
measurements of the impacts of pollution aerosols on clouds and precipitation over the Sierra Nevada, J. Geophys. Res.-Atmos., 113 (D15), 2008.
K. Sassen, Indirect climate forcing over the western US from Asian dust storms,
Geophys. Res. Lett., 29 (10), 2002. P. Schluessel and W. J. Emery, Atmospheric Water-Vapor Over Oceans From SSM/I
Measurements, International Journal of Remote Sensing, 11 (5), 753-766, 1990. S. Solomon, D. Qin, M. Manning, Z. Chen, M. Marquis, K. B. Averyt, M. Tignor and H.
L. Miller, Climate Change 2007: The Physical Science Basis. Contribution of Working Group 1 to the Fourth Assessment Report of the Intergovernmental Panel on Climate Change,Cambridge University Press, Cambridge, United Kingdom and New York, NY, USA, 2007.
B. Stevens and G. Feingold, Untangling aerosol effects on clouds and precipitation in a
buffered system, Nature, 461 (7264), 607-613, 2009. A. Stohl, S. Eckhardt, C. Forster, P. James and N. Spichtinger, On the pathways and
timescales of intercontinental air pollution transport, J. Geophys. Res.-Atmos., 107 (D23), 2002.
A. Stohl, C. Forster, A. Frank, P. Seibert and G. Wotawa, Technical note: The
Lagrangian particle dispersion model FLEXPART version 6.2, Atmos. Chem. Phys., 5, 2461-2474, 2005.
R. C. Sullivan, S. A. Guazzotti, D. A. Sodeman and K. A. Prather, Direct observations of
the atmospheric processing of Asian mineral dust, Atmospheric Chemistry And Physics, 7, 1213-1236, 2007.
I. Uno, K. Eguchi, K. Yumimoto, T. Takemura, A. Shimizu, M. Uematsu, Z. Y. Liu, Z. F.
Wang, Y. Hara and N. Sugimoto, Asian dust transported one full circuit around the globe, Nature Geoscience, 2 (8), 557-560, 2009.

161
R. A. VanCuren and T. A. Cahill, Asian aerosols in North America: Frequency and concentration of fine dust, J. Geophys. Res.-Atmos., 107 (D24), 2002.
A. L. Walker, M. Liu, S. D. Miller, K. A. Richardson and D. L. Westphal, Development
of a dust source database for mesoscale forecasting in southwest Asia, J. Geophys. Res.-Atmos., 114, 2009.
A. B. White, P. J. Neiman, F. M. Ralph, D. E. Kingsmill and P. O. G. Persson, Coastal
orographic rainfall processes observed by radar during the California land-falling jets experiment, J. Hydrometeorol., 4 (2), 264-282, 2003.
K. Yumimoto, K. Eguchi, I. Uno, T. Takemura, Z. Liu, A. Shimizu and N. Sugimoto, An
elevated large-scale dust veil from the Taklimakan Desert: Intercontinental transport and three-dimensional structure as captured by CALIPSO and regional and global models, Atmos. Chem. Phys., 9 (21), 8545-8558, 2009.
Y. Zhu and R. E. Newell, A proposed algorithm for moisture fluxes from atmospheric
rivers, Monthly Weather Review, 126 (3), 725-735, 1998.

6 Characterization of Asian Outflow at Gosan, Korea by
Single Particle Mass Spectrometry
6.1 Synopsis
Frequent intercontinental transport of mineral dust and anthropogenic pollution
from Asia impact the transfer of solar radiation through the atmosphere, alter cloud
properties, and affect aerosol concentrations and composition in North America and
beyond. Models currently use simplified schemes to account for the aging of these
outflow aerosols as they are transported globally, but the current parameterizations do not
account for the complex processes associated with particle aging. To improve our
understanding of these processes, real-time single-particle measurements of the size and
chemistry of atmospheric particles were made at the Gosan supersite on Jeju Island,
Korea. This study provided insight into the chemical mixing state of outflow particles
after ~1 day of transport over the ocean from China and Korea. The main contributors to
high concentrations of submicron particles were carbonaceous combustion particles,
while supermicron particles were dominated by sea salt and dust during transport periods.
Internal mixing with secondary species was dependent on primary particle chemistry and
size, wherein nitrate was primarily mixed with supermicron dust and sea salt and
ammonium sulfate was primarily found internally mixed with submicron carbonaceous
combustion particles. While considerable complexity exists in the aging of these outflow
particles, incorporating even simple empirically-based parameterizations of the impact of
aging on particle mixing states may improve model results significantly beyond those
obtained with the current time-based methods.
162

163
6.2 Introduction
Significant air pollution outflow from Asia has been observed for several decades
[Duce, et al., 1980;Hobbs, et al., 1971]. Aerosols transported from Asia have been shown
to play a major role in impacting climate directly by scattering and absorbing solar
radiation [Ramanathan and Carmichael, 2008] and indirectly by altering cloud properties
[Feng and Ramanathan, 2010;Sassen, 2002]. Downwind of Asia, the outflow can
significantly contribute to PM2.5 (particulate matter <2.5 μm) mass concentrations on the
west coast of North America [VanCuren and Cahill, 2002;Yu, et al., 2008]. Atmospheric
particles from Asia have even been shown to circumnavigate the globe under the proper
conditions [Uno, et al., 2009]. This transport is most prevalent during intense spring dust
storms [Holzer, et al., 2005] and can occur both in the boundary layer as well as the free
troposphere [Hara, et al., 2009] after particles have been injected at high altitudes by
warm conveyor belts [Eckhardt, et al., 2004] or frontal and postfrontal convection [Yu, et
al., 2008]. These Asian outflow plumes can range from primarily dust [Eguchi, et al.,
2009] to primarily anthropogenic sources [Yu, et al., 2008], including mixtures,
depending on meteorology and air mass history [Eguchi, et al., 2009;Hara, et al., 2009].
Simultaneous plumes have also been observed at different altitudes with one plume
containing primarily dust at one altitude and a mixture of dust and pollution in another
plume at a different altitude [Eguchi, et al., 2009]. The impacts of the Asian outflow on
climate are predicted increase in the future [Carmichael, et al., 2009] as the intensity of
dust storms likely increase [Solomon, et al., 2007] and population growth leads to
expanded anthropogenic emissions in the region [Carmichael, et al., 2009].

164
The rural super-site at Gosan on Jeju Island in Korea provides an ideal location to
observe the properties of particles following 1-2 days of transport from the east coast of
the Asian continent [Sahu, et al., 2009]. At Gosan, changes in radiative forcing have been
measured due to increased scattering and absorption during dust storms [Kim, et al.,
2006b;Kim, et al., 2005;Nakajima, et al., 2007]. In addition to aerosol loading, relative
humidity has been also shown to alter radiative forcing [Yoon and Kim, 2006], motivating
studies measuring the hygroscopicity and cloud condensation nucleating properties of
aerosols at Gosan [Kim, et al., 2006a;Kuwata, et al., 2008;Yum, et al., 2007]. Most
aerosol chemistry studies at Gosan have used bulk techniques, including photoacoustic
measurements of black carbon [Kim, et al., 2006b;Sahu, et al., 2009], ion
chromatography [Kim, et al., 2006b;Sahu, et al., 2009;Topping, et al., 2004], and aerosol
mass spectrometry [Topping, et al., 2004]. The many particle types with different
chemical composition observed at the Gosan site have been studied in small numbers of
particles through offline X-ray microscopy single particle analysis techniques [Ro, et al.,
2001]. Elevated concentrations of secondary species (eg. sulfate, nitrate) indicative of
atmospheric aging have been measured at Gosan and other island sites off the east coast
of Asia [Carmichael, et al., 1996;Chen, et al., 1997;Nishikawa, et al., 1991] with lower
concentrations of secondary species measured during time periods of marine influence, as
expected [Kim, et al., 2002]. Due to the large climate impact of Asian outflow aerosol
numerous campaigns have examined Asian outflow [Ramanathan, et al., 2001] [Russo, et
al., 2003] [Bates, et al., 2004] [Ramana and Ramanathan, 2006] [Nakajima, et al., 2007]
[Dunlea, et al., 2009] [Stith, et al., 2009], including many studies at the Gosan super-site.

165
However, for all that has been learned about the Asian outflow one significant
challenge that remains is accurately modeling how outflow particles evolve during
transport. In fact, on a broader level effects accurately incorporating particle mixing state
into climate models has been identified as one of the main steps needed to improve global
climate models [Ghan and Schwartz, 2007]. This is because significant uncertainties
remain in our understanding of particle aging processes and timescales [Riemer, et al.,
2010]. For example, with black carbon understanding aging processes has important
implications for the timescales on which hydrophobic particles will have taken up enough
hydrophillic secondary species to act as cloud condensation nuclei (CCN). In global
climate models this aging is frequently incorporated as a single aging timescale (τ) used
to move particles from the fresh/hydrophobic classification to the aged/hydrophillic
classificant where they can act as CCN [Croft, et al., 2005]. How this aging
parameterization is formulated is critical to the final model results [Croft, et al.,
2005;Koch, 2001] and using a single aging parameter has been shown to oversimplify
aging processes leading to incorrect assessments of the global black carbon burden
[Riemer, et al., 2003]. More thorough treatments of aging processes from a single particle
perspective are being developed [Riemer, et al., 2010;Riemer, et al., 2009], which have
shown urban plume aging timescales to vary from less than an hour to multiple days
depending on conditions. Considerable work remains to provide measurements that can
constrain and improve the treatment of aging in these models, with the ultimate goal of
providing a more complex yet computationally feasible method for use in global climate
models. The PACDEX ground sampling discussed below described measurements of the
single particle size and chemical composition of Asian outflow particles in spring at the

166
Gosan supersite. Particles at the site have been transported over the ocean in air masses
from different source regions for 1-2 days providing an ideal setup to directly investigate
single particle mixing and aging processes in Asian outflow.
6.3 Experimental
6.3.1 Location and Instrumentation
This study was conducted as part of the Pacific Dust Experiment (PACDEX) at
the Gosan super-site (33.29° N 126.16° E) in Korea from April 12-May 15, 2007. The
sampling site was on the western coast of Jeju Island 20 meters from the ocean at an
elevation of 35 meters with few major local sources and primarily onshore winds. The
external sampling line was ~0.3 meters in diameter and extended 40 meters above the
research station. Instruments connected to a sampling manifold with 10 parallel ports
included a condensation particle counter (CPC, 1 L/min), aerodynamic particle sizer
(APS, 5 L/min), aethalometer (4 L/min), nephelometer (17 L/min), aerosol time-of-flight
mass spectrometer (ATOFMS, 1 L/min), and a pump to pull the remaining flow, which
was adjusted as needed to maintain a consistent flow of 28.3 L/min through the PM10
cyclone (URG). The CPC (TSI Inc., Model 3010) measured particle number
concentration for particles >0.010 μm, and the APS (TSI Inc., Model 3321) provided
aerosol size distributions from 0.523-10 μm. The aethalometer (Magee Scientific, Model
AE31) measured black carbon (BC) mass concentrations. The scanning mobility particle
sizer measurements (SMPS, TSI Inc., Model 3034) were made for 0.010-0.487 μm
diameter particles on a separate sampling line. PM10 mass concentrations were obtained
from the co-located Korean Meteorological Association (KMA) site.

167
6.3.2 Single Particle Mass Spectrometry
An ATOFMS, described in detail previously [Gard, et al., 1997], measured the
size and chemical composition of individual particles in real-time. Briefly, particles are
introduced into the ATOFMS through a converging nozzle inlet into a differentially
pumped vacuum chamber, during which particles are accelerated to a terminal velocity.
The particles pass through two continuous wave lasers (diode pumped Nd:YAG lasers
operating at 532 nm) located 6 cm apart. Particle velocity is used to determine vacuum
aerodynamic diameter by calibration with polystyrene latex spheres of known size. The
sized particles are desorbed and ionized by a 266 nm Q-switched Nd:YAG laser (1.2-1.4
mJ). Positive and negative ions from the each individual particle are detected using a
dual-reflectron time-of-flight mass spectrometer.
Particle size and mass spectral data were imported into MatLab 6.5.1 (The
Mathworks Inc.) and analyzed utilizing YAADA 1.2 (www.yaada.org), a toolkit
developed for ATOFMS data analysis. Particles were grouped via two methods: 1)
searches of mass spectral, aerodynamic size, and temporal information and 2) clustering
via an adaptive resonance theory based neural network algorithm (ART-2a) at a vigilance
factor of 0.8 [Song, et al., 1999]. General particle types are defined by characteristic
chemical species; these labels do not reflect all of the species present within a specific
particle type. Peak identifications correspond to the most probable ions for a given m/z
ratio.
ATOFMS counts were scaled to number and mass concentrations using APS size-
resolved number concentrations, a method shown previously to yield quantitative mass
concentrations [Ault, et al., 2009;Qin, et al., 2006]. Briefly, ATOFMS counts were

168
binned by diameter for the APS size bins (0.5-2.5 m), and scaling factors were
determined for each hour and size bin to account for ATOFMS transmission biases [Qin,
et al., 2006]. After scaling the number concentrations, previous ATOFMS measurements
of particle density were used to convert from number to mass concentrations [Moffet and
Prather, 2009;Moffet, et al., 2008]. Bins of scaled concentrations were summed to
provide PM1 (PM <1 m), PM2.5 (PM<2.5 m), and PM1-2.5 (PM 1.0-2.5 m in
diameter). Scaled ATOFMS PM2.5 mass concentrations have been shown previously to
be well correlated with standard mass measurements, including the beta attenuation
monitor (BAM) and micro-orifice uniform deposit impactor (MOUDI) [Qin, et al., 2006].
ATOFMS scaled PM1 concentrations have been shown to track mass concentrations [Liu,
et al., 2000;Qin, 2007].
6.4 Results and Discussion
6.4.1 Air Mass Characteristics and Meteorology
Air mass back trajectories, calculated using HYSPLIT (Figure 6.1), for the Gosan
sampling site over the 5 week study agree with measured meteorological data (Figure
6.2). The most commonly observed air masses back trajectories were grouped into five
categories (China, Korea, Sea of Japan, Marine, and Local/Transition) (Figure 6.1). The
amount of time each air mass type was observed at the sampling site and the time the air
masses were over the ocean before reaching the site is shown in Table 6.1. The
trajectories start at 500 meters above the sample site and go 72 hours backward (each
marker represents 24 hours) and are representative of other heights in the boundary layer
based on comparisons at 200 and 1000 meters. Back trajectories were defined as those
that passed over the East China Sea and eastern China; these “China” trajectories had an

169
average transport time over the ocean of 20 hours from China to the sampling site, similar
to previously calculated transport times [Sahu, et al., 2009]. Air masses passing over
Northeastern China, the Yellow Sea and/or Korean peninsula before arriving at Gosan
(labeled Yellow Sea/Korea) traveled an average of 28 hours over the ocean before
reaching the sampling site. Marine air masses were defined as those that did not pass over
land during the 72 hour back trajectories. “Sea of Japan” air masses traveled east over
Manchuria in northeastern China before looping southwest over the Sea of Japan to the
sampling site (avoiding the Korean peninsula); these air masses traveled an average of 44
hours over the ocean. The most prevalent air mass type was from the Yellow Sea/Korea
region (32% of sampling time), followed by China (25%), Marine (11%), and the Sea of
Japan air mass (5%). Local/transition periods, defined as those affected by local sources
or air masses transitioning between two source regions, account for the remaining 27% of
sampling time. Air mass back trajectories previously observed at the Gosan site have
matched the 4 primary air mass types described above [Carmichael, et al., 1997;Kim, et
al., 2007;Kim, et al., 2006a;Kim, et al., 2005;Ro, et al., 2001;Wong, et al., 2007].
To determine which of these air mass types contribute to long range transport, 5
day forward trajectories were calculated at 500 meters for each of time periods defined
above (Figure 6.3).Of the four air mass types, China and Marine were indicative of long
range transport and Yellow Sea/Korea and Sea of Japan did not represent long range
transport conditions. The China and Marine air masses were lofted (1000-9000 meters) 1-
2 days east of the sampling site and reach the west coast of North America in less than
five days. In contrast, forward trajectories for the Korea and Sea of Japan air masses do
not travel beyond eastern Asia. Thus, understanding the differences in particle

170
concentrations and chemical mixing state between China and the Marine air masses is
critical to understanding the Asian outflow that reaches North American and beyond.

171
Figure 6.1 500 m, 72 hr HYSPLIT air mass back trajectories every 2 hrs (with 24 hour markers) are shown for representative time periods during the five main air mass categories. Air masses passing over eastern China and the East China Sea (April 25, 2007 15:00 – April 27, 2007 12:00) are marked in red, air masses passing over the Yellow Sea/Korea (April 17, 2007 12:00 – April 19, 2007 04:00), marine based air masses (April 20, 2007 19:00 – April 22, 2007 01:00), air masses passing over the Yellow Sea and NE China (April 17, 2007 12:00 – April 18, 2007 10:00), air masses passing over the Sea of Japan and Manchuria in NE China (April 23, 2007 8:00 – April 24, 2007 20:00), and local and/or transitioning back trajectories (April 16, 2007 6:00 – 18:00).
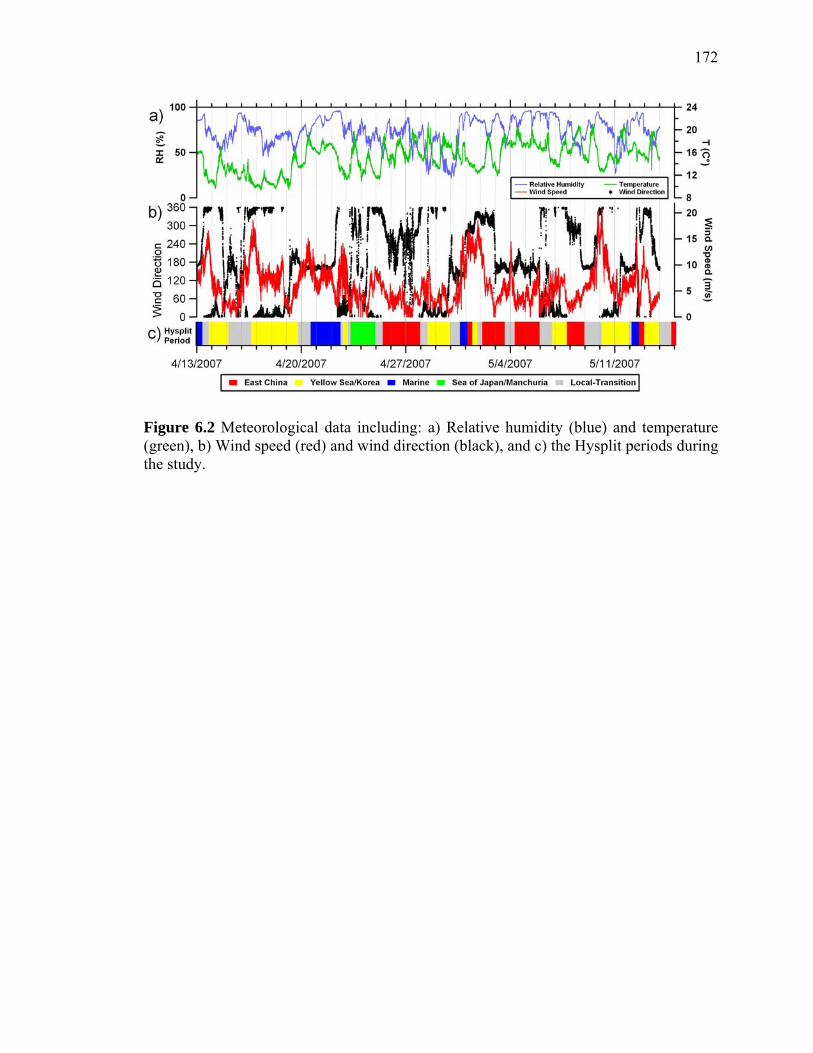
172
Figure 6.2 Meteorological data including: a) Relative humidity (blue) and temperature (green), b) Wind speed (red) and wind direction (black), and c) the Hysplit periods during the study.

173
Table 6.1 The fraction of sampling time represented by each air mass type and the average time (standard deviation) of the trajectory over ocean for the representative air mass categories shown in Figure 6.1.
Hysplit Air Mass Sampling Fraction of Time Over Back Trajectory Hours Sampling Time Ocean (Hrs)
Eastern China 196 0.25 20 ± 5YellowSea/Korea 252 0.32 28 ± 9
Marine 83 0.11 > 72Sea of Japan/Manchuria 40 0.05 44 ± 9
Transition/Local 210 0.27 N/A

174
Figure 6.3 5 day (120 hour) 500 meter forward trajectories from the sampling site color coded by the back trajectories observed at the start of each forward trajectory.
175
6.4.2 Aerosol Size Distributions and Bulk Mass Concentrations
Temporal profiles of PM10 (particulate matter <10 μm) mass, BC mass, and size-
resolved particle number concentrations are shown in Figure 6.4 with the time periods of
the different air mass categories highlighted. Elevated particle number and mass
concentrations corresponded to time periods with transport from China. Average PM10
mass concentrations for each different air mass are shown in Figure 6.5a. The China time
period was characterized by the highest average PM10 mass concentration (77 μg/m3),
followed by the Sea of Japan (52 μg/m3), Korea (43 μg/m3), and Marine (24 μg/m3) air
mass periods. As expected, the Marine air masses possessed the lowest average PM10
mass concentrations due to the lower influences of anthropogenic and dust sources.
During the China air mass periods, PM10 mass concentrations were nearly twice those of
the Korea time period, despite having only spent on average of only 8 fewer hours over
the ocean. This suggests that the China source region is characterized by significantly
higher PM10 concentrations than the Korea source region. This is supported by emissions
inventories that show Eastern China has higher anthropogenic emissions than Korea or
Manchuria [Bond, et al., 2004]. A specific source region that the China back trajectories
pass directly over Shanghai, the 10th largest city in the world. Wet and dry deposition
may explain part of the difference between Eastern China and Korea, but this is likely not
a major process since Sea of Japan air masses have higher mass concentrations than the
Korea time period and having been transported for 16 hours longer over the ocean. .
Overall, time over the ocean was not a strong predictor of mass concentration.

176
Average particle size distributions for each air mass category are shown in Figure
6.5b. The China time period possessed the largest mode (0.111 μm) in the accumulation
size range with higher 0.083-1.04 μm number concentrations compared to other air mass
periods. Suggestive of less atmospheric processing, the accumulation mode was shifted to
smaller diameters for the Sea of Japan time periods. In addition, the Sea of Japan air
masses were characterized distinct supermicron (>1 μm) mode. In comparison, the Korea
time periods were characterized by an average accumulation mode shifted to larger
diameters (more aged) than the Sea of Japan time periods, but yet shifted to smaller
diameters (less aged) compared to the China time periods. The Marine air masses had the
lowest concentrations in the accumulation mode, but somewhat high supermicron
concentrations, due to sea salt. To examine the different particle sources and atmospheric
processes influencing each air mass, the chemical composition of the particles was
examined, as detailed below.

177
Figure 6.4 Time series of bulk mass measurements and size distributions. a) PM10 and BC mass concentrations, b) APS and SMPS size distributions plotted as size vs. time with color indicating concentration, c) air mass categories versus time (China – red, Korea - yellow, Marine – blue, Sea of Japan – green).
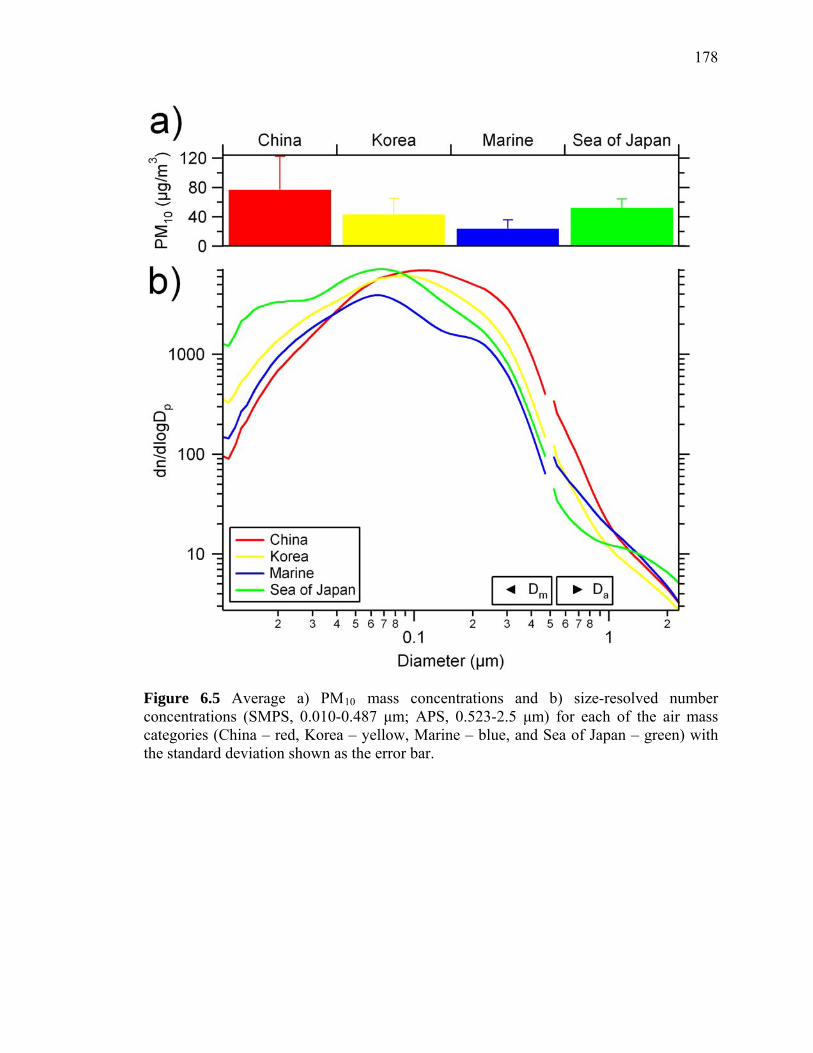
178
Figure 6.5 Average a) PM10 mass concentrations and b) size-resolved number concentrations (SMPS, 0.010-0.487 μm; APS, 0.523-2.5 μm) for each of the air mass categories (China – red, Korea – yellow, Marine – blue, and Sea of Japan – green) with the standard deviation shown as the error bar.

179
Figure 6.6 Size- and chemically-resolved mass distributions (dM/dlogDa, 0.523 – 2.5 μm) for the different air mass categories: a) China, b) Korea, c) Marine, d) Sea of Japan.

180
Figure 6.7 Number fraction vs. size (0.200-3.000 μm) for the observed ATOFMS particle types for each of the air mass categories: a) China, b) Korea, c) Marine, d) Sea of Japan. Overlaid are fractions of nitrate (62NO3
-) – blue , sulfate (HSO4-) - black, and
ammonium (18NH4+) – green, as a function of size.

181
6.4.3 Aerosol Chemistry
Chemically resolved mass and relative number size distributions are shown in Figures 6.6
and 6.7, respectively, for the different air mass categories. The characteristic mass
spectral signatures of the particle types (fresh elemental carbon (Fresh EC), elemental
carbon mixed with organic carbon (ECOC), organic carbon (OC), biomass burning, fresh
sea salt, aged sea salt, and dust) are similar to those observed during previous single
particle studies in the region [Ro, et al., 2005;Ro, et al., 2001] and are described in Figure
6.8. As an example the a large fraction of the dust observed in this study consisted of
aluminosilicates, which was also observed by previous single particle studies of Asian
outflow [Ro, et al., 2005]. While dust and sea salt were observed in the submicron size
range, they were primarily observed in the supermicron size range. Conversely, the
carbonaceous particle types were primarily observed in the submicron. Both of these are
consistent with their respective formation mechanisms [Seinfeld and Pandis, 2006]. The
large submicron (<1 μm) mass concentration mode during the China air masses is
consistent with the aged submicron number concentration mode discussed above and is
primarily composed of ECOC, biomass burning, and dust particles. The supermicron
particles were primarily dust with a small fraction of aged sea salt and other minor
particle types. Despite possessing lower average submicron mass concentrations than the
China period, the Yellow Sea/Korea air masses were characterized by similar particle
chemical composition. Separating the air masses that passed over Korea, the Yellow Sea,
northeastern China from those passing over only northeastern China and the Yellow Sea
do not significantly change the shape or chemical composition of the size distributions.
As expected, the Marine air masses are characterized by primarily fresh (non-aged) sea

182
salt particles in the supermicron mode, while the submicron mode has high mass
concentrations of ECOC and biomass burning particles, likely due to a local fire during
one marine time period. Aside from that local fire, the Marine time period observations
the bulk ion concentration trends from previous Gosan observations when winds are from
the south or southeast [Kim, et al., 2002], as observed during the Marine time periods in
this study. The highest average mass concentration of supermicron The size-resolved
number fraction of individual particles internally mixed with nitrate (62NO3-), sulfate
(97HSO4-), or ammonium (18NH4
+), secondary markers indicative of atmospheric aging,
are also shown in Figure 6.7. For all air masses, the majority of the supermicron particles
(59-74%) were mixed with nitrate, with the number fraction decreasing in the submicron
size range. In contrast, ammonium was internally mixed with few supermicron particles
with the most extreme cases being 2% by number for the Marine air masses and 12% for
the China air masses. This suggests that the majority of the observed nitrate was not in
the form of ammonium nitrate. Rather, it was likely sodium nitrate on sea salt particles
that have reacted with nitric acid or similar heterogeneous processing on dust particles.
For each of the land based air masses, nitrate was mixed with >50% of the submicron
particles; whereas during the Marine time periods, <25% were mixed with nitrate,
showing the lower degree of atmospheric aging. For all air masses, >90% of the
submicron particles were internally mixed with sulfate. This fraction decreases
precipitously in the supermicron size range for all air masses. The most extreme decrease
occurs for the Marine air masses, for which sulfate was internally mixed with 8% of all
supermicron particles; whereas, sulfate was mixed with 27% of all supermicron particles
during the China time periods. This was largely related having more carbonaceous
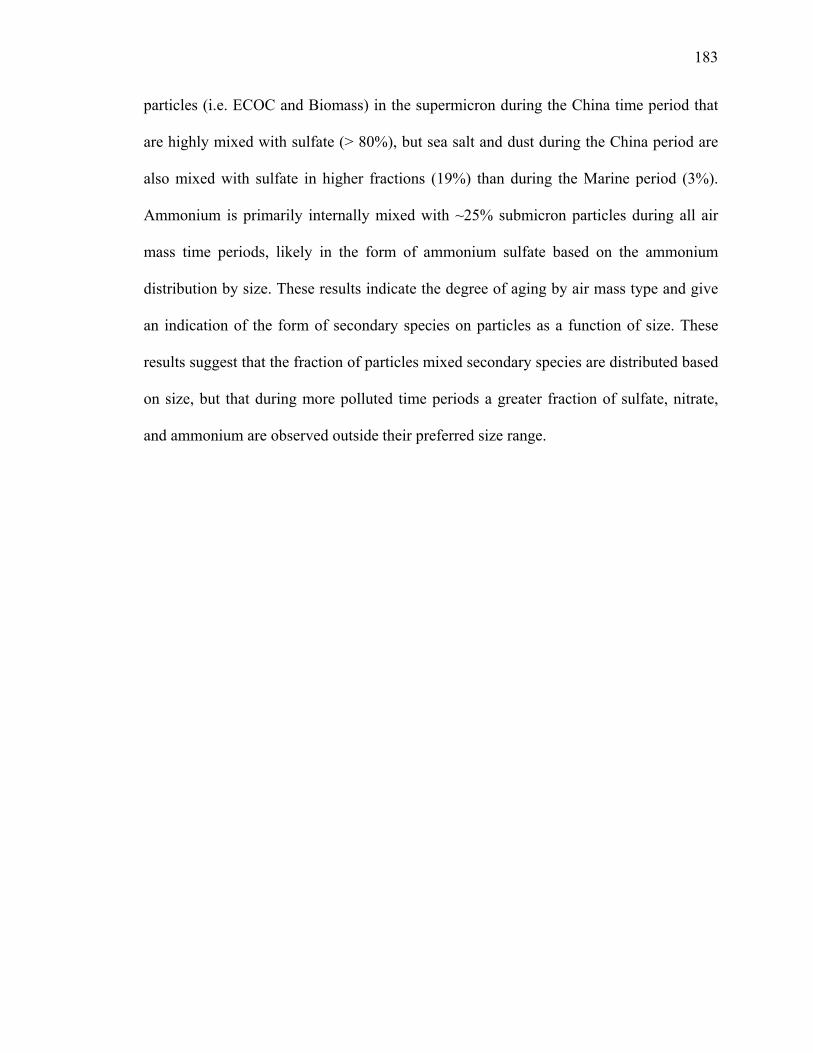
183
particles (i.e. ECOC and Biomass) in the supermicron during the China time period that
are highly mixed with sulfate (> 80%), but sea salt and dust during the China period are
also mixed with sulfate in higher fractions (19%) than during the Marine period (3%).
Ammonium is primarily internally mixed with ~25% submicron particles during all air
mass time periods, likely in the form of ammonium sulfate based on the ammonium
distribution by size. These results indicate the degree of aging by air mass type and give
an indication of the form of secondary species on particles as a function of size. These
results suggest that the fraction of particles mixed secondary species are distributed based
on size, but that during more polluted time periods a greater fraction of sulfate, nitrate,
and ammonium are observed outside their preferred size range.
184
Figure 6.8 Positive and negative mass spectra for the main particle types: a) Fresh EC, b) ECOC, c) OC, d) Biomass Burning, e) Fresh SS, f) Aged SS, g) Dust

185
Figure 6.9 Matrix showing the fraction of different particle types (Fresh EC, ECOC, OC, biomass burning, sea salt, and dust) containing peaks indicative of secondary aging (35Cl-, 46NO2
-, 62NO3-, 125HNO3NO3
-, 80SO3-, 97HSO4
-, 195H2SO4HSO4-, 18NH4
+, 43C2H3O+).

186
6.4.4 Aerosol Chemical Mixing States
To investigate the internal mixing of secondary species with different particle
types, the number fractions of each particle type mixed with various ion markers are
shown in a matrix in Figure 6.9. Only particles with both positive and negative mass
spectra were considered in the calculations of these fractions. The secondary ion markers
examined included: chloride (35Cl-), nitrate (46NO2-, 62NO3
-), nitric acid (125HNO3NO3-),
sulfate (80SO3- and 97SO4
-), sulfuric acid (195H2SO4HSO4-), ammonium (18NH4
+), and
oxidized organic carbon (43C2H3O+). For particle types that were observed primarily in
the submicron size range (Fresh EC, ECOC, OC, and biomass), the most frequently
observed secondary species is sulfate, while for particle types primarily in the
supermicron (sea salt and dust) the most abundant secondary species are nitrate markers.
Though the fraction of nitrate is highest in the supermicron particle type it is also
observed on roughly half of submicron particle types. Sulfate is observed on a low
fraction of supermicron particle types (dust and sea salt), though more so during polluted
time periods as discussed above. Ammonium is observed most frequently on submicron
particle types, specifically ECOC, OC, and biomass burning. Oxidized organic carbon is
observed primarily on submicron carbonaceous particle types and in very low fractions
on the dust and sea salt particle types (< 10%). These trends were consistent across all air
mass categories, as shown in Figure 6.10. A second important piece of information from
this figure involves which secondary markers are observed on the same particle types.
For the primary submicron particle types (ECOC and biomass burning) ~15% of particles
are mixed with sulfuric acid, indicating that the sulfate on that fraction of particle likely
from sulfuric acid. Similarly, ~10% of submicron particle types are mixed with nitric

187
acid. A large fraction of the remainder of the sulfate and nitrate on submicron particles is
likely in the form of ammonium sulfate and ammonium nitrate based on the ~50% of
ECOC and biomass burning particles are mixed with ammonium. In the supermicron the
low fraction of ammonium and nitric acid indicates that most of the nitrate is in the form
of sodium nitrate or nitrate formed from other heterogeneous processes.

188
Figure 6.10 Matrices showing the fraction of particles from each particle type mixed with selected secondary species during 4 time periods.

189
Figure 6.11 Ternary plots showing the relative intensities of ammonium, nitrate, and sulfate ion signals for individual particles for the a) ECOC, b) biomass burning, c) sea salt, and d) dust particle types. The color of each marker indicates its air mass time period (China – red, Korea – yellow, Sea of Japan – green, Marine – blue). ~1000 representative particles are shown on each plot for each time period.

190
As ion signals are related to the mass of a species with the individual particles [Gross, et
al., 2000;Pratt, et al., 2009], the relative amounts of sulfate, nitrate, and ammonium on
the different particle types may be examined. For the ternary plots shown in Figure 6.11
each point represents one particle and the closer to a corner the particle is, the closer that
peak is to 100% of the sum of the three peaks plotted. The two submicron particle types
(Figure 6.11a – ECOC and Figure 6.11b – Biomass) are centered on the sulfate corner of
the plot extending slightly more towards the ammonium corner than the nitrate corner.
For both of these particle types the marine time period has the strongest sulfate signal,
with the China the most mixed with ammonium and nitrate. The Korea and Sea of Japan
time periods are similar to the China time period, but with slightly less nitrate and
ammonium. The two supermicron particle types (Figure 6.11c – Sea Salt and Figure
6.11d – dust) are centered around the nitrate corner. Dust during the Sea of Japan and
Marine time periods is mixed mostly between ammonium and nitrate, while a greater
fraction is mixed with sulfate during the China (and to a lesser extent Korea) time
periods. This is consistent with Figure 6.7 showing higher fractions of supermicron
particles mixed with sulfate during the most polluted (China) time period. Sea salt is
mixed most strongly with nitrate, especially since there is an interfering sodium chloride
peak at m/z -97 that shifts some marine points towards the sulfate corner during the
marine period. This analysis by particle type shows that the sulfate and nitrate trends are
consistent across the sub and supermicron size ranges, with China the slightly more aged
than the Korea and Sea of Japan air masses and the marine air masses the least aged.
The relative contributions of nitrate, sulfate, and ammonium by both particle type
and size are shown in Figure 6.12. A clear trend was observed, wherein the larger

191
particles were predominantly internally mixed with nitrate with the smaller particles
internally mixed with sulfate, similar to that observed in Figure 6.7. The larger particles
also have a subset mixed with ammonium, but these particles have very low levels of
sulfate, suggesting that ammonium sulfate is not present on these particles. In contrast, as
the smaller particles age, ammonium nitrate condenses on the individual particles. These
trends are consistent across each air mass category (not shown). The prevalence of nitrate
on supermicron particles and sulfate on submicron particles processes reinforces the
importance of particle size on secondary processing across all particle types as has been
shown for dust previously [Sullivan, et al., 2007].

192
Figure 6.12 Ternary plot showing the relative intensities of ammonium, nitrate, and sulfate for individual particles for ECOC (circle), biomass (triangle), sea salt (cross), and dust (x) particles during all time periods. The color of the marker indicates the size of the particle from red (smallest) to purple (largest). ~16,000 representative particles are shown.

193
6.5 Conclusions
The results presented herein demonstrate amount and form of secondary aging
that occurs to Asian outflow particles during different air masses sampled at the Gosan
supersite. For the two air masses that are most likely to be involved in long range
transport (China and Marine), distinct differences between the particles in these time
periods were observed. The air masses originating over China were characterized by the
highest observed particle mass and number concentrations, particularly for the submicron
size range. Despite the shortest transport time to the site (and hence shortest amount of
time for atmospheric processing), the China air masses were the most aged with respect
to the number fraction mixed with nitrate, sulfate, and ammonium, as well as the amount
of ammonium nitrate on the submicron particles. In fact, all of the land-based air masses
(China, Korea, and Sea of Japan) were substantially mixed with secondary species,
reflecting the exposure of most aerosols in the region to high concentrations of gaseous
pollutants. Also, the high fractions and intensities of nitrate and sulfate in comparison to
ammonium show that there is likely not enough base to neutralize acidic gases including
nitric and sulfuric acid involved in the aging process, suggesting that the Asian outflow
sampled is likely quite acidic. This is all in contrast to the Marine period which, while
somewhat aged, was far less so than the land based time periods.
The differences in the chemistry and mixing state of sub and supermicron particles
indicate the limitations of using a single time based aging parameter to represent aging in
global models. This is related both the sources of the particles, i.e. aging reactions on
biomass burning particles are quite different than on sea salt particles. Also the
194
prominence of sulfate on submicron particles and nitrate on supermicron particles
indicates different aging processes are taking place that proceed on different time scales.
These differences impact how well particles take up water and subsequently influence
whether they can act as cloud nuclei and how they scatter solar radiation. To improve
models parameterizations both the differences in sub and supermicron particle mixing
state need to be incorporated in a more complex manner, while dealing with
computational constraints. Efforts to explore parameterizations between single particle
measurements and single particle modeling efforts will be an important first step to
addressing these current model limitations.
6.6 Acknowledgements
Andrew Ault is grateful for a Department of Energy Global Change Education
Program graduate research environmental fellowship. This work was supported by the
Atmospheric Brown Cloud project funded by the United Nations Environmental
Programme and the National Oceanic and Atmospheric Administation (NOAA). We
thank Prof. Yoon at Seoul National University and his group for their hospitality and
assistance during the campaign. Prof. Yoon and Dr. Sang Woo-Kim provided the SMPS
data. We appreciate Craig Corrigan for technical support prior to and during the
campaign. The Korean Meteorological Administration is acknowledged for
meteorological and PM10 data at the Gosan site. The authors gratefully acknowledge the
NOAA Air Resources Laboratory for the provision of the HYSPLIT transport model and
READY website (http://www.arl.noaa.gov/ready.html) used in this publication.

195
Chapter 6 is in preparation for submission to Atmospheric Environment: A. P.
Ault, A. Zhu, V. Ramanathan, and K.A. Prather, Characterization of Asian Outflow at
Gosan, Korea by Single Particle Mass Spectrometry.

196
6.7 References
A. P. Ault, M. J. Moore, H. Furutani and K. A. Prather, Impact of emissions from the Los Angeles port region on San Diego air quality, Environmental Science & Technology, 43 (10), 3500-3506, 2009.
T. S. Bates, P. K. Quinn, D. J. Coffman, D. S. Covert, T. L. Miller, J. E. Johnson, G. R.
Carmichael, I. Uno, S. A. Guazzotti, D. A. Sodeman, K. A. Prather, M. Rivera, L. M. Russell and J. T. Merrill, Marine boundary layer dust and pollutant transport associated with the passage of a frontal system over eastern Asia, Journal Of Geophysical Research-Atmospheres, 109 (D19), 2004.
T. C. Bond, D. G. Streets, K. F. Yarber, S. M. Nelson, J. H. Woo and Z. Klimont, A
technology-based global inventory of black and organic carbon emissions from combustion, Journal Of Geophysical Research-Atmospheres, 109 (D14), 2004.
G. R. Carmichael, B. Adhikary, S. Kulkarni, A. D'Allura, Y. H. Tang, D. Streets, Q.
Zhang, T. C. Bond, V. Ramanathan, A. Jamroensan and P. Marrapu, Asian Aerosols: Current and Year 2030 Distributions and Implications to Human Health and Regional Climate Change, Environmental Science & Technology, 43 (15), 5811-5817, 2009.
G. R. Carmichael, M. S. Hong, H. Ueda, L. L. Chen, K. Murano, J. K. Park, H. G. Lee,
Y. Kim, C. Kang and S. Shim, Aerosol composition at Cheju Island, Korea, Journal Of Geophysical Research-Atmospheres, 102 (D5), 6047-6061, 1997.
G. R. Carmichael, Y. Zhang, L. L. Chen, M. S. Hong and H. Ueda, Seasonal variation of
aerosol composition at Cheju Island, Korea, Atmospheric Environment, 30 (13), 2407-2416, 1996.
L. L. Chen, G. R. Carmichael, M. S. Hong, H. Ueda, S. Shim, C. H. Song, Y. P. Kim, R.
Arimoto, J. Prospero, D. Savoie, K. Murano, J. K. Park, H. G. Lee and C. Kang, Influence of continental outflow events on the aerosol composition at Cheju Island, South Korea, Journal Of Geophysical Research-Atmospheres, 102 (D23), 28551-28574, 1997.
B. Croft, U. Lohmann and K. von Salzen, Black carbon ageing in the Canadian Centre for
Climate modelling and analysis atmospheric general circulation model, Atmospheric Chemistry And Physics, 5, 1931-1949, 2005.
R. A. Duce, C. K. Unni, B. J. Ray, J. M. Prospero and J. T. Merrill, Long-Range
Atmospheric Transport Of Soil Dust From Asia To The Tropical North Pacific - Temporal Variability, Science, 209 (4464), 1522-1524, 1980.

197
E. J. Dunlea, P. F. DeCarlo, A. C. Aiken, J. R. Kimmel, R. E. Peltier, R. J. Weber, J. Tomlinson, D. R. Collins, Y. Shinozuka, C. S. McNaughton, S. G. Howell, A. D. Clarke, L. K. Emmons, E. C. Apel, G. G. Pfister, A. van Donkelaar, R. V. Martin, D. B. Millet, C. L. Heald and J. L. Jimenez, Evolution of Asian aerosols during transpacific transport in INTEX-B, Atmospheric Chemistry Physics, 9 (19), 7257-7287, 2009.
S. Eckhardt, A. Stohl, H. Wernli, P. James, C. Forster and N. Spichtinger, A 15-year
climatology of warm conveyor belts, J. Clim., 17 (1), 218-237, 2004. K. Eguchi, I. Uno, K. Yumimoto, T. Takemura, A. Shimizu, N. Sugimoto and Z. Liu,
Trans-pacific dust transport: integrated analysis of NASA/CALIPSO and a global aerosol transport model, Atmospheric Chemistry And Physics, 9 (9), 3137-3145, 2009.
Y. Feng and V. Ramanathan, Investigation of aerosol-cloud interactions using a chemical
transport model constrained by satellite observations, Tellus Series B-Chemical And Physical Meteorology, 62 (1), 69-86, 2010.
E. Gard, J. E. Mayer, B. D. Morrical, T. Dienes, D. P. Fergenson and K. A. Prather, Real-
time analysis of individual atmospheric aerosol particles: Design and performance of a portable ATOFMS, Analytical Chemistry, 69 (20), 4083-4091, 1997.
S. J. Ghan and S. E. Schwartz, Aerosol properties and processes - A path from field and
laboratory measurements to global climate models, Bulletin Of The American Meteorological Society, 88 (7), 1059-+, 2007.
D. S. Gross, M. E. Galli, P. J. Silva and K. A. Prather, Relative sensitivity factors for
alkali metal and ammonium cations in single particle aerosol time-of-flight mass spectra, Analytical Chemistry, 72 (2), 416-422, 2000.
Y. Hara, K. Yumimoto, I. Uno, A. Shimizu, N. Sugimoto, Z. Liu and D. M. Winker,
Asian dust outflow in the PBL and free atmosphere retrieved by NASA CALIPSO and an assimilated dust transport model, Atmospheric Chemistry And Physics, 9 (4), 1227-1239, 2009.
P. V. Hobbs, G. C. Bluhm and T. Ohtake, Transport Of Ice Nuclei Over North Pacific
Ocean, Transactions - American Geophysical Union, 52 (5), 429-&, 1971. M. Holzer, T. M. Hall and R. B. Stull, Seasonality and weather-driven variability of
transpacific transport, J. Geophys. Res.-Atmos., 110 (D23), 2005. J. Kim, C. H. Jung, B. C. Choi, S. N. Oh, F. J. Brechtel, S. C. Yoon and S. W. Kim,
Number size distribution of atmospheric aerosols during ACE-Asia dust and precipitation events, Atmospheric Environment, 41 (23), 4841-4855, 2007.

198
J. Kim, S. C. Yoon, A. Jefferson and S. W. Kim, Aerosol hygroscopic properties during
Asian dust, pollution, and biomass burning episodes at Gosan, Korea in April 2001, Atmospheric Environment, 40 (8), 1550-1560, 2006a.
J. Kim, S. C. Yoon, S. W. Kim, F. Brechtel, A. Jefferson, E. G. Dutton, K. N. Bower, S.
Cliff and J. J. Schauer, Chemical apportionment of shortwave direct aerosol radiative forcing at the Gosan super-site, Korea during ACE-Asia, Atmos. Environ., 40 (35), 6718-6729, 2006b.
K. H. Kim, M. H. Lee, G. W. Lee, Y. P. Kim, Y. H. Youn and J. M. Oh, Observations of
aerosol-bound ionic compositions at Cheju Island, Korea, Chemosphere, 48 (3), 317-327, 2002.
S. W. Kim, S. C. Yoon, A. Jefferson, J. A. Ogren, E. G. Dutton, J. G. Won, Y. S. Ghim,
I. B. Lee and J. S. Han, Aerosol optical, chemical and physical properties at Gosan, Korea during Asian dust and pollution episodes in 2001, Atmospheric Environment, 39 (1), 39-50, 2005.
D. Koch, Transport and direct radiative forcing of carbonaceous and sulfate aerosols in
the GISS GCM, Journal Of Geophysical Research-Atmospheres, 106 (D17), 20311-20332, 2001.
M. Kuwata, Y. Kondo, Y. Miyazaki, Y. Komazaki, J. H. Kim, S. S. Yum, H. Tanimoto
and H. Matsueda, Cloud condensation nuclei activity at Jeju Island, Korea in spring 2005, Atmospheric Chemistry And Physics, 8 (11), 2933-2948, 2008.
D. Y. Liu, K. A. Prather and S. V. Hering, Variations in the size and chemical
composition of nitrate-containing particles in Riverside, CA, Aerosol Science And Technology, 33 (1-2), 71-86, 2000.
R. C. Moffet and K. A. Prather, In-situ measurements of the mixing state and optical
properties of soot with implications for radiative forcing estimates, 106 (29), 11872-11877, 2009.
R. C. Moffet, X. Y. Qin, T. Rebotier, H. Furutani and K. A. Prather, Chemically
segregated optical and microphysical properties of ambient aerosols measured in a single-particle mass spectrometer, Journal Of Geophysical Research-Atmospheres, 113 (D12), 2008.
T. Nakajima, S. C. Yoon, V. Ramanathan, G. Y. Shi, T. Takemura, A. Higurashi, T.
Takamura, K. Aoki, B. J. Sohn, S. W. Kim, H. Tsuruta, N. Sugimoto, A. Shimizu, H. Tanimoto, Y. Sawa, N. H. Lin, C. T. Lee, D. Goto and N. Schutgens, Overview of the Atmospheric Brown Cloud East Asian Regional Experiment

199
2005 and a study of the aerosol direct radiative forcing in east Asia, Journal Of Geophysical Research-Atmospheres, 112 (D24), 2007.
M. Nishikawa, S. Kanamori, N. Kanamori and T. Mizoguchi, Kosa Aerosol As Eolian
Carrier Of Anthropogenic Material, Science Of The Total Environment, 107, 13-27, 1991.
K. A. Pratt, L. E. Hatch and K. A. Prather, Seasonal volatility dependence of ambient
particle phase amines, Environmental Science & Technology, 43 (14), 5276-5281, 2009.
X. Y. Qin, Characterization of Ambient Aerosol Composition and Formation
Mechanisms and Development of Quantification Methodologies Utilizing ATOFMS, Doctoral Thesis thesis, University of California San Diego, La Jolla, 2007.
X. Y. Qin, P. V. Bhave and K. A. Prather, Comparison of two methods for obtaining
quantitative mass concentrations from aerosol time-of-flight mass spectrometry measurements, Analytical Chemistry, 78 (17), 6169-6178, 2006.
M. V. Ramana and V. Ramanathan, Abrupt transition from natural to anthropogenic
aerosol radiative forcing: Observations at the ABC-Maldives Climate Observatory, Journal Of Geophysical Research-Atmospheres, 111 (D20), 2006.
V. Ramanathan and G. Carmichael, Global and regional climate changes due to black
carbon, Nature Geoscience, 1 (4), 221-227, 2008. V. Ramanathan, P. J. Crutzen, J. Lelieveld, A. P. Mitra, D. Althausen, J. Anderson, M. O.
Andreae, W. Cantrell, G. R. Cass, C. E. Chung, A. D. Clarke, J. A. Coakley, W. D. Collins, W. C. Conant, F. Dulac, J. Heintzenberg, A. J. Heymsfield, B. Holben, S. Howell, J. Hudson, A. Jayaraman, J. T. Kiehl, T. N. Krishnamurti, D. Lubin, G. McFarquhar, T. Novakov, J. A. Ogren, I. A. Podgorny, K. Prather, K. Priestley, J. M. Prospero, P. K. Quinn, K. Rajeev, P. Rasch, S. Rupert, R. Sadourny, S. K. Satheesh, G. E. Shaw, P. Sheridan and F. P. J. Valero, Indian Ocean Experiment: An integrated analysis of the climate forcing and effects of the great Indo-Asian haze, Journal Of Geophysical Research-Atmospheres, 106 (D22), 28371-28398, 2001.
N. Riemer, H. Vogel, B. Vogel and F. Fiedler, Modeling aerosols on the mesoscale-
gamma: Treatment of soot aerosol and its radiative effects, Journal Of Geophysical Research-Atmospheres, 108 (D19), 2003.
N. Riemer, M. West, R. Zaveri and R. Easter, Estimating black carbon aging time-scales
with a particle-resolved aerosol model, Journal Of Aerosol Science, 41 (1), 143-158, 2010.

200
N. Riemer, M. West, R. A. Zaveri and R. C. Easter, Simulating the evolution of soot
mixing state with a particle resolved aerosol model, Journal Of Geophysical Research-Atmospheres, in press, 2009.
C. U. Ro, H. Hwang, Y. Chun and R. Van Grieken, Single-particle characterization of
four "Asian Dust" samples collected in Korea, using low-Z particle electron probe X-ray microanalysis, Environmental Science & Technology, 39 (6), 1409-1419, 2005.
C. U. Ro, K. Y. Oh, H. Kim, Y. P. Kim, C. B. Lee, K. H. Kim, C. H. Kang, J. Osan, J. De
Hoog, A. Worobiec and R. Van Grieken, Single-particle analysis of aerosols at Cheju Island, Korea, using low-Z electron probe X-ray microanalysis: A direct proof of nitrate formation from sea salts, Environmental Science & Technology, 35 (22), 4487-4494, 2001.
R. S. Russo, R. W. Talbot, J. E. Dibb, E. Scheuer, G. Seid, C. E. Jordan, H. E. Fuelberg,
G. W. Sachse, M. A. Avery, S. A. Vay, D. R. Blake, N. J. Blake, E. Atlas, A. Fried, S. T. Sandholm, D. Tan, H. B. Singh, J. Snow and B. G. Heikes, Chemical composition of Asian continental outflow over the western Pacific: Results from Transport and Chemical Evolution over the Pacific (TRACE-P), Journal Of Geophysical Research-Atmospheres, 108 (D20), 2003.
L. K. Sahu, Y. Kondo, Y. Miyazaki, M. Kuwata, M. Koike, N. Takegawa, H. Tanimoto,
H. Matsueda, S. C. Yoon and Y. J. Kim, Anthropogenic aerosols observed in Asian continental outflow at Jeju Island, Korea, in spring 2005, Journal Of Geophysical Research-Atmospheres, 114, 2009.
K. Sassen, Indirect climate forcing over the western US from Asian dust storms,
Geophys. Res. Lett., 29 (10), 2002. J. H. Seinfeld and S. N. Pandis, Atmospheric Chemistry and Physics, Wiley Interscience,
Hoboken, NJ, 2006. S. Solomon, D. Qin, M. Manning, Z. Chen, M. Marquis, K. B. Averyt, M. Tignor and H.
L. Miller, Climate Change 2007: The Physical Science Basis. Contribution of Working Group 1 to the Fourth Assessment Report of the Intergovernmental Panel on Climate Change,Cambridge University Press, Cambridge, United Kingdom and New York, NY, USA, 2007.
X. H. Song, P. K. Hopke, D. P. Fergenson and K. A. Prather, Classification of single
particles analyzed by ATOFMS using an artificial neural network, ART-2A, Analytical Chemistry, 71 (4), 860-865, 1999.
201
J. L. Stith, V. Ramanathan, W. A. Cooper, G. C. Roberts, P. J. DeMott, G. Carmichael, C. D. Hatch, B. Adhikary, C. H. Twohy, D. C. Rogers, D. Baumgardner, A. J. Prenni, T. Campos, R. Gao, J. Anderson and Y. Feng, An overview of aircraft observations from the Pacific Dust Experiment campaign, Journal Of Geophysical Research-Atmospheres, 114, 2009.
R. C. Sullivan, S. A. Guazzotti, D. A. Sodeman and K. A. Prather, Direct observations of
the atmospheric processing of Asian mineral dust, Atmospheric Chemistry And Physics, 7, 1213-1236, 2007.
D. Topping, H. Coe, G. McFiggans, R. Burgess, J. Allan, M. R. Alfarra, K. Bower, T. W.
Choularton, S. Decesari and M. C. Facchini, Aerosol chemical characteristics from sampling conducted on the Island of Jeju, Korea during ACE Asia, Atmospheric Environment, 38 (14), 2111-2123, 2004.
I. Uno, K. Eguchi, K. Yumimoto, T. Takemura, A. Shimizu, M. Uematsu, Z. Y. Liu, Z. F.
Wang, Y. Hara and N. Sugimoto, Asian dust transported one full circuit around the globe, Nature Geoscience, 2 (8), 557-560, 2009.
R. A. VanCuren and T. A. Cahill, Asian aerosols in North America: Frequency and
concentration of fine dust, J. Geophys. Res.-Atmos., 107 (D24), 2002. H. L. A. Wong, T. Wang, A. Ding, D. R. Blake and J. C. Nam, Impact of Asian
continental outflow on the concentrations of O-3, CO, NMHCs and halocarbons on Jeju Island, South Korea during March 2005, Atmospheric Environment, 41 (14), 2933-2944, 2007.
S. C. Yoon and J. Kim, Influences of relative humidity on aerosol optical properties and
aerosol radiative forcing during ACE-Asia, Atmospheric Environment, 40 (23), 4328-4338, 2006.
H. B. Yu, L. A. Remer, M. Chin, H. S. Bian, R. G. Kleidman and T. Diehl, A satellite-
based assessment of transpacific transport of pollution aerosol, Journal Of Geophysical Research-Atmospheres, 113 (D14), 2008.
S. S. Yum, G. Roberts, J. H. Kim, K. Y. Song and D. Y. Kim, Submicron aerosol size
distributions and cloud condensation nuclei concentrations measured at Gosan, Korea, during the Atmospheric brown clouds - East Asian Regional Experiment 2005, J. Geophys. Res.-Atmos., 112 (D22), 2007.

7 An Intercontinental Overview of Size-Resolved Chemical
Mixing State by Single Particle Mass Spectrometry
7.1 Synopsis
The radiative forcings associated direct and indirect effects of atmospheric
aerosols represent the one of the greatest sources of uncertainty in predicting future
climate change. Of particular important is the representation of aerosol mixing state with
global climate models, as estimates of radiative forcings vary dramatically with different
mixing state assumptions. We present an intercontinental overview of aerosol time-of-
flight mass spectrometry measurements, providing single-particle size, chemistry, and
mixing state. We focus on the six main observed classes of particles (fresh elemental
carbon, aged elemental carbon mixed with organic carbon, organic carbon, biomass
burning, sea salt, and dust) that represent 94% of particles in the accumulation and coarse
modes (0.1 – 3.0 μm). Differences in chemical mixing state for these particles across
aged urban, fresh urban, marine, and remote continental locations are described with
emphasis on the mixing of secondary species (nitrate, sulfate, ammonium, and secondary
organic carbon). In particular, sulfate was primarily found to be internally mixed with
carbonaceous particle types, even in clean marine environments, and nitrate was often
mixed with sea salt and dust. The observed particle mixing states are not in agreement
with recent depictions by the Intergovernmental Panel on Climate Change reports and
have important ramifications on the estimates of aerosol radiative forcings.
202

203
7.2 Introduction
Atmospheric aerosols have the ability to alter climate on a global scale by
scattering and absorbing solar radiation (direct effect) and altering the properties of
clouds by serving as cloud condensation and ice nuclei (indirect effect) [Forster, et al.,
2007]. On average, aerosols are predicted to have a net cooling effect globally [Forster,
et al., 2007] with direct aerosol radiative forcing estimated at -0.3 ± 0.2 W/m2 [Myhre,
2009]. Despite these significant impacts, the overall scientific understanding of the
impact of aerosol effects on climate is still low [Forster, et al., 2007]. This is related in
part to the complexity of aerosols and the variability in their properties. Primary aerosol
particles originate from a variety of both natural and anthropogenic sources, including
biomass burning, incomplete fossil fuel combustion, and the wind-driven suspension of
soil and sea spray [Poschl, 2005]. Depending on particle size, chemical composition, and
local meteorology, lifetimes of atmospheric particles range from seconds to
approximately 1 month, allowing transportation on a hemispheric scale [Raes, et al.,
2000;Williams, et al., 2002]. During transport, atmospheric particles undergo physical
and chemical transformations (atmospheric aging), due to coagulation, heterogeneous
reactions of particles with trace gases, gas-particle partitioning of semi-volatile species,
and aqueous-phase processing, leading to changes in particle size, structure, and chemical
composition [Poschl, 2005]. Due to the evolving physical and chemical properties of the
distribution of aerosols, quantifying aerosol impacts on radiative forcing and clouds
represents a challenging task [Forster, et al., 2007].
Particle mixing state is defined as the distribution of different chemical species
within single particles, resulting in differing chemistry between individual particles.

204
Generally, this is considered in the context of secondary species that have become mixed
with a primary emission particle (e.g. dust internally mixed with nitrate or soot internally
mixed with sulfate). The mixing state of a particle determines its morphology, reactivity,
hygroscopicity, and optical and toxicological properties [Fuzzi, et al., 2006;Prather, et
al., 2008;Schlesinger, et al., 2006]. As an important example, as externally mixed soot
particles age, they can convert to internally mixed particles with a soot core surrounded
by sulfate, ammonium, organics, nitrate, and water [Moffet and Prather, 2009]. The
radiative forcing of soot particles is significantly altered by mixing with sulfuric acid and
sulfate species, resulting in increased absorption of solar radiation [Jacobson,
2001;Moffet and Prather, 2009], as well as increased particle hygroscopicity [Zuberi, et
al., 2005]. However, global climate models (GCMs), frequently represent black carbon
and sulfate as externally mixed, with black carbon as absorbing particles and sulfate as
purely scattering particles [Forster, et al., 2007]. This leads to lower estimates of
radiative forcing from black carbon (0.2-0.4 W/m2) [Highwood and Kinnersley,
2006;Koch, et al., 2007] than predictions from models that account for particle
processing in the atmosphere (0.6-1.2 W/m2) [Chung and Seinfeld, 2002;Jacobson,
2001;Ramanathan and Carmichael, 2008]. The representation of black carbon particles,
in particular, is important as they are estimated to have the second largest global warming
potential of any atmospheric constituent besides CO2 [Jacobson, 2001;Moffet and
Prather, 2009].
The mixing of particles with secondary species (e.g. oxidized organic, sulfate,
nitrate, ammonium) impacts the ability of individual particles to act as cloud
condensation nuclei (CCN) and ice nuclei (IN) [Cantrell and Heymsfield,
205
2005;McFiggans, et al., 2006]. For example, when reacted with nitric acid, calcium dust
becomes more hygroscopic and a more effective CCN; in contrast, when reacted with
oxalic acid, calcium dust becomes less soluble and a less effective CCN [Sullivan, et al.,
2009a]. CCN closure studies have shown that size-resolved mixing state is often needed
for accurate predictions of CCN concentrations [Cubison, et al., 2008]. Further, in
laboratory studies, coatings of sulfuric acid and ammonium sulfate on mineral dust were
observed to decrease the potential for heterogeneous ice nucleation [Cziczo, et al.,
2009a]. Changes in aerosols due to sulfate coatings impacting mixed-phase clouds are
predicted to significantly impact indirect aerosol radiative forcing estimates [Lohmann
and Hoose, 2009]. Thus, understanding the size-resolved chemical mixing state of
particles, including both the primary sources of particles in the atmosphere and the
impacts of atmospheric aging, is critical to accurately representing particles in global
models that predict future climate impacts.
One of the greatest challenges for modeling atmospheric aerosols is representing
particle mixing state accurately, particularly due to changes in mixing state over the
particle lifetime [Ghan and Schwartz, 2007]. As such GCMs frequently parameterize
aerosols in a simplistic fashion that is not representative of their state in the atmosphere.
In the 2007 Intergovernmental Panel on Climate Change (IPCC) report [Solomon, et al.,
2007], the major aerosol types were considered to be sulfate, fossil fuel organic carbon,
fossil fuel black carbon, biomass burning, nitrate, and mineral dust. Most of the aerosol
classes are defined as external mixtures, with the exception being the biomass burning
aerosols, defined as an internal mixture of organic carbon, black carbon, and inorganics,
including nitrate and sulfate [Solomon, et al., 2007]. There are currently many efforts to

206
improve the incorporation and treatment of aerosol properties into climate models [Ghan
and Schwartz, 2007]. However, many assumptions and parameterizations in large scale
climate models are still lacking, such as the frequent use of a single aging timescale to
convert fresh hydrophobic soot particles to aged hydrophilic particles internally mixed
with secondary species, for example [Croft, et al., 2005;Koch, 2001]. This can lead to
incorrect assessments of the black carbon burdens [Riemer, et al., 2003]. Efforts are
being made to improve particle mixing state in aerosol models by incorporating more
detailed mixing state[Bauer, et al., 2008] and treating particles individual [Riemer, et al.,
2010;Riemer, et al., 2009]. Ambient measurements of size-resolved chemical mixing
state are necessary to provide empirical evidence to properly constrain, improve, and
evaluate the representation of particles in these models [Ghan and Schwartz, 2007].
Single-particle mass spectrometry provides the ability to measure the size and
chemistry of individual particles in real-time, as reviewed recently [Pratt and Prather,
2010b]. Laser desorption/ionization allows for analysis of both the non-refractory (e.g.
organics, ammonium nitrate) and refractory (e.g. mineral dust, soot) components of
atmospheric aerosols. The aerosol time-of-flight mass spectrometer (ATOFMS) [Prather,
et al., 1994] utilizes a dual-polarity mass spectrometer [Gard, et al., 1997], which is used
to simultaneously detect both the positive and negative ions resulting from a single
particle. This provides the ability to identify the primary particle types/source, such as
biomass burning, organic carbon, or elemental carbon, and examine its mixing with
secondary species, such as ammonium, nitrate, and/or sulfate. In the years since the
development of the ATOFMS, it has been deployed in numerous field campaigns across
the globe [Noble and Prather, 2000;Pratt and Prather, 2010b;Sullivan and Prather,

207
2005]. Recent aircraft-based ATOFMS measurements showed significant variations in
single particle mixing state with altitude [Pratt and Prather, 2010a].
Herein, we provide an overview of ground-based ATOFMS measurements of
single particle mixing state from a nearly global perspective. The size-resolved chemical
composition of particles determined from studies in North America, Europe, Asia, and
Africa are described and grouped according to similarities in location and particle
chemistry. The mixing of general particle classes (fresh elemental carbon, organic
carbon, elemental carbon mixed with organic carbon, biomass burning, sea salt, dust, and
other) with specific secondary species (oxidized organic carbon, ammonium, nitrate, and
sulfate) from each site is then discussed. This overview incorporates ATOFMS data from
22 measurement campaigns, wherein large numbers of individual 0.1-3.0 μm particles
(~25,000 – 3,400,000 per study) were chemically analyzed in real-time with high size
resolution. While additional single-particle chemical information (e.g. mixing with
dicarboxylic acids [Sullivan and Prather, 2007], oligomers [Denkenberger, et al., 2007],
or metals [Ault, et al., 2010b;Moffet, et al., 2008b] is obtained, we present a simplified
view of the major components and secondary species contributing to particle mixing state
in an effort to provide a reference for modelers incorporating single particle processes
into small scale aerosol modules and GCMs.
7.3 Experimental
7.3.1 Aerosol Time-of-Flight Mass Spectrometry (ATOFMS)
The design and details of the ATOFMS have been described in detail elsewhere
[Gard, et al., 1997]. Briefly, particles are introduced into the ATOFMS through a
converging nozzle or aerodynamic lens system into a differentially pumped vacuum

208
chamber where they are collimated into a beam and accelerated to terminal velocities.
The particles then pass through two continuous wave lasers (diode pumped Nd:YAG
lasers operating at 532 nm) located 6 cm apart. The velocity of each particle is used to
determine the vacuum aerodynamic diameter (dva) from calibration with polystyrene
latex spheres of known diameter, shape, and density. The sized particles are then
desorbed and ionized using a Nd:YAG laser (266nm, ~1.0-1.5 mJ/pulse) that is fired
when the particle is calculated to enter the center of the mass spectrometer ion source
region. Positive and negative ions from each individual particle are detected using a dual-
polarity, reflectron time-of-flight mass spectrometer. As detailed in Table 7.1, ATOFMS
instruments during 18 of the 22 the studies possessed a converging nozzle inlet with a
size range from ~0.1 – 3.0 μm [Gard, et al., 1997]. The other 4 studies used an
aerodynamic lens inlet with a size range of 0.1 – 1.7 μm [Dall'Osto, et al., 2008].
Ultrafine ATOFMS [Su, et al., 2004] and aircraft ATOFMS [Pratt, et al., 2009c]
easur
n;
although for small communities in large urban areas the urban area is referenced. Also
m ements are not discussed.
Information on the 22 studies examined herein is listed in Table 1 including:
study location, study abbreviation, study name, dates, ATOFMS inlet type, number of
particles chemically analyzed, and previous publications. The 22 study locations are
illustrated on a nearly global map (Figure 7.1a), as well as zoomed in on the United
States of America (Figure 7.1b), colored according to their empirically determined
categories. All studies included multiple weeks of surface-based ATOFMS
measurements, resulting in ~25,000 – 3,400,000 individual particles chemically analyzed
per study. Within this manuscript, each study is referred to by its geographic locatio

209
Table 7.1 List of the ATOFMS studies included in this comparison with information on the study location, dates, instrument type (nozzle or lens), number of chemically-analyzed particles, and literature associated with the different studies.
Study Location Abbreviation Study Name Lat Lon Dates Inlet Particles Papers PublishedGrand Canyon, AZ, USA Grand Grand Canyon Aerosol 36.05 -112.10 Jun.-Jul. '98 Nozzle 25777
Canyon and Visibility StudyAldine (Houston), TX, USA TexAQS Texas Air Quality Study 29.90 -95.33 Aug.-Sept. '00 Nozzle 371537
New York, NY, USA PMTACS PM 2.5 Technology Assessment 40.74 -73.82 Jul.-Aug. '01 Nozzle 98266and Characterization Study
Fresno, CA, USA CRPAQS California Regional Particulate 36.75 -119.75 Nov. '00-Feb '01 Nozzle 673558 [Qin and Prather, 2006]Air Quality Study [Qin et al., 2006]
Mace Head, Ireland NAMBLEX North American Marine 53.32 -9.9 Jul.-Sept. '02 Nozzle 143524 [Dall'Osto et al., 2004]Boundary Layer Experiment
Yellowstone, WY, USA Yellowstone Mercury Roadshow-Yellowstone 44.74 -110.49 Sept. '03 Nozzle 60421 [Hall et al., 2006]Mt. Horeb, WI, USA Mt. Horeb Mercury Roadshow-Mt. Horeb 43.00 -89.65 Aug. '04 Nozzle 92453
E. St. Louis (St. Louis), IL, USA St. Louis Mercury Roadshow-East St. Louis 38.61 -90.16 Dec. '03-Feb. '04 Nozzle 1722813 [Snyder et al., 2009]Trinidad Head, CA, USA CIFEX Cloud Indirect Forcing Experiment 41.05 -124.15 Apr. '04 Nozzle 315324 [Holecek et al., 2007]Hanimaadhoo, Maldives APMEX Atmospheric Brown Cloud 6.78 73.18 Oct.-Nov. '04 Nozzle 326245 [Spencer et al., 2008]
Post Monsoonal ExperimentRiverside, CA, USA SOAR Study of Organic Aerosols 33.97 -117.32 Jul.-Aug. '05 Nozzle 1080675 [Moffet et al., 2008]
in Riverside [Gaston et al., 2010]Cape Verde Islands, Africa DODO Dust Outflow and Deposition Cruise Cruise Jan.-Feb. '06 Lens 167771
to the OceanMexico City, Mexico MILAGRO Megacity Initiative: Local And 19.49 -99.15 Mar. '06 Nozzle 901552 [Moffet et al., 2008a,b,c]
Global Research Observations [Moffet et al., 2009]North Atlantic MAP Marine Aerosol Production Cruise Cruise Jun.-Jul. '06 Lens 65336
La Jolla (San Diego), CA, USA SIO Pier Scripps Oeaonography 32.87 -117.26 Aug.-Sept. '06 Nozzle 3346035 [Ault et al., 2009]Pier Study - 2006
London, UK REPARTEE Regents Park and Tower 51.5 -0.12 Oct. '04 Lens 127832 [Dall'Osto et al., 2009]Environmental Experiment
Gosan, Jeju, Korea PACDEX Pacific Dust Experiment 33.29 126.18 Apr.-May. '07 Nozzle 2967725 Dearborn (Detroit), MI, USA Detroit Detroit, MI 42.25 83.20 Aug. '07 Nozzle 345665
Los Angeles, CA, USA LABMS Los Angeles Mobile Study 33.74 -118.27 Nov. '07 Nozzle 1014946 [Ault et al., 2010]Bologna, Italy SPC San Pietro Capofiume 44.53 11.3 Jul. '08 Lens 47559
Atlanta, GA, USA AMIGAS August Mini-Intensive Gas 33.78 -84.42 Aug.-Sept. '08 Nozzle 245791 and Aerosol Sampling
Sugar Pine Dam, CA, USA Calwater Calwater Early Start 39.13 -120.80 Feb.-Mar. '09 Nozzle 76806
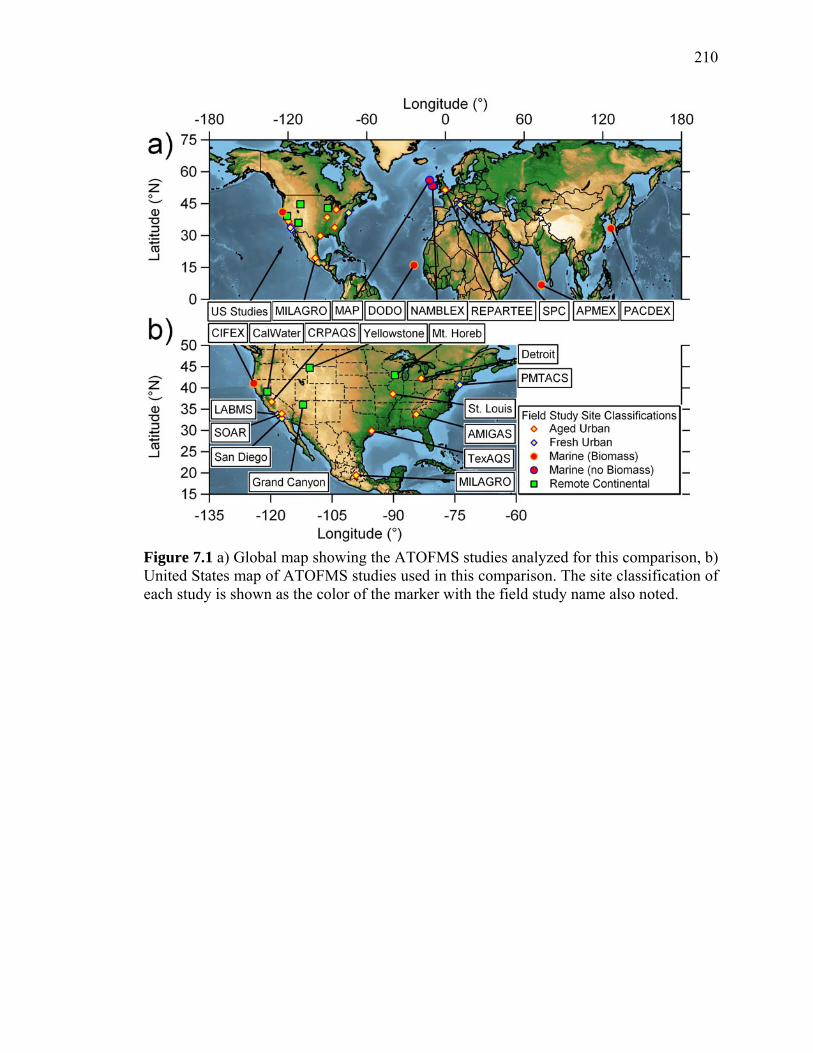
210
Figure 7.1 a) Global map showing the ATOFMS studies analyzed for this comparison, b) United States map of ATOFMS studies used in this comparison. The site classification of each study is shown as the color of the marker with the field study name also noted.

211
the two ship-based data sets are referred to by their sampling region (Cape Verde for the
Dust DODO and North Atlantic for MAP).
7.3.2 Particle Classification
Data analysis of the single particle mass spectra was completed on each study
data set. 18 of the studies were analyzed using YAADA, a data analysis toolkit for
MATLAB (The MathWorks, Inc.). Dual-polarity mass spectra were clustered using an
Adaptive Resonance Theory based neural network algorithm (ART-2a) at a vigilance
factor of 0.8 [Song, et al., 1999]. To classify a higher fraction of particles, submicron (<1
μm) and supermicron (1-3 μm) diameter particles were analyzed separately for 7 of the
studies. For the 4 studies not analyzed using YAADA (Yellowstone, St. Louis, Mt.
Horeb, and Detroit), the graphical user interface based program ENCHILADA was used,
and clustering was carried out using the K-means clustering algorithm [Gross, et al.,
2010]. Both ART-2a and the K-means algorithm combine particles into clusters based on
the intensity of ion peaks in individual mass spectra and have similar accuracy in
clustering [Rebotier and Prather, 2007]. On average > 85% of all particles from each
field study were classified and used for this analysis. After the initial clustering analysis,
clusters were combined into six general particle classes (fresh elemental carbon (Fresh
EC), aged elemental carbon mixed with organic carbon (ECOC), organic carbon (OC),
biomass burning (Biomass), sea salt (Sea Salt), and dust (Dust)) based on previous field
and source apportionment studies and using the criteria discussed below. Particles that
did not fit into the defined classes were placed in the “other” category. These particle
type classifications do not account for all of the mass spectral information obtained from
each particle, and many prior publications go into great depth regarding the presence of

212
other chemical species, such as hydroxymethanesulfonate [Whiteaker and Prather,
2003a], methanesulfonate [Gaston, et al., 2010], alkylamines [Angelino, et al.,
2001;Pratt, et al., 2009b], and specific metals [Ault, et al., 2010b;Moffet, et al., 2008b],
for example. Ammonium sulfate has been observed on a limited number of studies and
methods have been developed to identify its presence [Spencer, et al., 2008;Wenzel, et
al., 2003]. However, for the stated goal of providing information in an accessible manner
to modelers, general particle types and associated secondary species were chosen as the
focus of this comparison.
The single particle mass spectral signatures serve as fingerprints of particle
sources [Bhave, et al., 2001;Pratt and Prather, 2009;Toner, et al., 2008]. Previous
aerosol source studies have investigated the ATOFMS signatures of car emissions
[Gross, et al., 2000;Silva and Prather, 1997;Sodeman, et al., 2005], truck emissions
[Ferge, et al., 2006;Shields, et al., 2007;Toner, et al., 2006], ship emissions [Ault, et al.,
2010b;Healy, et al., 2009], biomass burning [Silva, et al., 1999], fireworks [Liu, et al.,
1997], grass mowing [Drewnick, et al., 2008], soil dust [Beddows and Telle, 2005;Silva,
et al., 2000], coal dust [Liu, et al., 2003], pesticides [Whiteaker and Prather, 2003a],
bacteria [Pratt, et al., 2009a], welding [Su, et al., 2005], brake dust [Beddows and Telle,
2005], and steel factories [Dall'Osto, et al., 2008]. Several laboratory studies have also
examined single particle mass spectral properties [Angelino, et al., 2001;Ferge, et al.,
2006;Gross, et al., 2006;Silva, et al., 2000;Silva and Prather, 2000;Spencer and Prather,
2006;Spencer, et al., 2006;Sullivan, et al., 2009b;Whiteaker and Prather,
2003a;Zimmermann, et al., 2003] and changes due to aging [Sullivan, et al., 2009b].
Numerous field studies in marine regions [Furutani, et al., 2008;Guazzotti, et al.,
213
2001a;Guazzotti, et al., 2001b;Spencer, et al., 2008] and regions impacted by dust
[Guazzotti, et al., 2001b;Sullivan, et al., 2007] have also provided source information.
Additionally, field studies have identified different source characteristics and how aging
changes them [Hughes, et al., 1999;Liu, et al., 2003;Moffet, et al., 2008a;Pratt and
Prather, 2009;Qin and Prather, 2006;Toner, 2007;Whiteaker and Prather,
2003b;Whiteaker, et al., 2002]. Together these ATOFMS mass spectral signatures
represent a robust framework that can be used to identify particle sources globally.
Chemical species desorbed and ionized by a laser have different affinities for
producing positive and negative ions [Murphy, 2007]. In general, positive ion mass
spectra can be linked to the primary source signature, and negative ion mass spectra can
provide information on mixing with secondary species [Pratt and Prather, 2009;Pratt
and Prather, 2010a]. As noted above, the six most prevalent general particle classes
globally are discussed in this paper: Fresh EC, ECOC, OC, Biomass, Sea Salt, and Dust.
These classifications refer to either the main chemical component by mass that was
present or the general source. Figure 7.2 shows representative spectra for each of these
particle classes; defining ion markers are noted in Table 7.2. Elemental carbon particles
(Fresh EC) are characterized by dominant carbon clusters in both the positive and
negative ion mass spectra (e.g., 12C1+/-,
24C2+/-, …, Cn
±) (Figure 7.2a) [Moffet and
Prather, 2009;Spencer and Prather, 2006]. Elemental carbon particles mixed with
organic carbon (ECOC) have large carbon cluster peaks in the positive ion mass spectrum
(Figure 7.2b), but mostly at low carbon numbers (i.e. n < 6), and a number of organic
carbon marker peaks, including 27C2H3+, C29
2H5+, C37
3H , and C+ 432H3O [Moffet and +

214
Prather, 2009;Spencer and Prather, 2006]. The ECOC negative ion mass spectra do not
contain
Figure 7.2 Representative average positive and negative ion mass spectra are shown for each of the particle classes: a) Fresh EC, b) ECOC, c) OC, d) Biomass, e) Sea Salt, and f) Dust.

215
Table 7.2 Defining characteristics of the six main particle types, including representative ion mass-to-charge (m/z) values and literature that the classification is based on.

216
significant carbon cluster ions and frequently have intense secondary markers of sulfate
and nitrate, as discussed below. Organic carbon (OC) particles are characterized by peaks
for 37C3H+ and 43C2H3O+, which are more intense than 12C+ and 36C3+ (the markers for
elemental carbon), as well as many other OC peaks including 27C2H3+ and 29C2H5
+
(Figure 7.2c) [Silva and Prather, 2000]. It should be noted that OC-dominant particles
can be formed through nucleation or accumulate significant OC through gas-particle
partitioning. ECOC is produced through the aging of fresh elemental carbon/soot through
the addition of OC [Moffet and Prather, 2009;Spencer and Prather, 2006]. For these OC
particles, OC, in addition to inorganic secondary species, is the primary source of
particulate mass [Spencer and Prather, 2006]. Often EC, ECOC, and OC particles are
from vehicular combustion sources [Pratt and Prather, 2009]; however, other sources
exist, detailed in the above-mentioned studies. Biomass burning particles are
characterized by a intense potassium peak (39K+), as well as many less intense peaks for
elemental carbon (12C+ and 36C3+) and organic carbon (27C2H3
+, 29C2H5+, 37C3H+, and
43C2H3O+) in the positive ions (Figure 7.2d) [Silva, et al., 1999]. Sea salt (SS) particles
are characterized by an intense sodium peak (23Na+) and markers for sodium chloride
(81,83Na2Cl+) (Figure 7.2e). Dust particles are characterized by positive ion inorganic
peaks (23Na+, 27Al+, 39K+, 40Ca+, 48Ti+, and/or 56Fe+) and their inorganic oxides (55KO+,
56CaO+, 64TiO+,70Al2O+, and/or 72FeO+) (Figure 7.2f). The presence of these inorganic
ions as well as often aluminum and silicon oxides (59AlO2-, 60SiO2
-, 76AlO2(OH)-, 76SiO3-
, and 77HSiO3-) in the negative ion mass spectra was the one method for identifying dust
particles as the dust mass spectra vary considerably particle to particle due to their

217
complex chemistry, morphology, and high absorption of 266 nm radiation [Sullivan, et
al., 2007].
To examine mixing with secondary species, searches were conducted on
representative ion markers (m/z) with the criterion that the peak area had to be at least 1%
relative area; in this way, the fraction of particles within each general particle class
containing each secondary species were identified. Secondary species investigated
include: oxidized organic carbon (43C2H3O+), ammonium (18NH4+), nitrate (46NO2
- and
62NO3-), and sulfate (80SO3
- and 97HSO4-).
7.4 Results and Discussion
ATOFMS studies were grouped into three location types: urban (Riverside, CA,
USA; St. Louis, MO, USA; Houston, TX, USA, Atlanta, GA, USA; Fresno, CA, USA;
Mexico City, Mexico; Detroit, MI, USA; London, United Kingdom; San Diego, CA,
USA; Los Angeles, CA, USA; Bologna, Italy; New York, NY, USA), marine (Maldives,
Maldives; Gosan, Korea; Cape Verde, Africa; Trinidad Head, CA, USA; North Atlantic,
Ireland; Mace Head, Ireland), and remote continental (Mt. Horeb, WI, USA; Sugar Pine
Dam, CA, USA; Grand Canyon, AZ, USA; Yellowstone, WY, USA). Urban sites are
referred to by the metropolitan area for simplicity, even if the sampling site was in an
adjacent community. The exact sampling site is listed in Table 1, with the metropolitan
area in parentheses. Given the large volume of urban sites (12 total), they were
subdivided into two groups: urban sites influenced by significant photochemistry,
oxidation, and aging (abbreviated Aged Urban) (Riverside, St. Louis, Houston, Atlanta,
Fresno, Mexico City, Detroit, and London) and urban sites without significant
photochemistry, oxidation, and aging (abbreviated Fresh Urban) (San Diego, Los

218
Angeles, Bologna, and New York). Studies have often been conducted at the same
location on multiple occasions, such as for San Diego [Guazzotti, et al., 2001b;Toner, et
al., 2008], Riverside [Hughes, et al., 1999;Liu, et al., 2000;Pastor, et al., 2003], and
Atlanta [Liu, et al., 2003;Middlebrook, et al., 2003;Wenzel, et al., 2003]; for this
comparison the most recent study was used at each of these sites.
7.4.1 Size-Resolved Chemical Composition
The size-resolved number fractions of the main particle types for each field site
are shown in Figures 7.3-7.6 and discussed below in terms of location type. By reporting
number fractions versus particle diameter, transmission biases are negated, and these
plots are comparable across different instruments with different inlets and transmission
efficiencies [Pratt, 2009]. Bins with fewer than 100 particles are not shown due to high
uncertainties based on statistics.
7.4.1.1 Urban Areas
7.4.1.1.1 Aged Urban Areas
A striking feature of size-resolved depictions of the general particle classes for
aged urban areas (Figure 7.3) was the significant number fraction (average 44%, range
26-68%) of OC particles across the submicron size range (~0.1-1.0 μm) for all 8 sites
(Riverside, London, Houston, Atlanta, Fresno, Mexico City, Detroit, St. Louis). Above 1
μm the number fraction of OC particles decreases substantially, and by 2 μm OC particles
were less than 13% by number at all sites. The primary source of OC particles in urban
areas is generally light duty vehicle emissions [Pratt and Prather, 2009]. Significant
aging of these small combustion particles via gas-particle partitioning results in

219
Figure 7.3 Size-resolved particle type number fractions for aged urban areas (Riverside, London, Houston, Atlanta, Fresno, Mexico City, Detroit, and St. Louis).

220
supermicron (>1 μm) particles [Pratt and Prather, 2009]. In aged urban areas, the
contribution of secondary organics to the total submicron organic aerosol mass can range
from ~45-90% [Docherty, et al., 2008]. The other major submicron particle types were
ECOC and Biomass particles, contributing ~20% (range 0-45%) and ~19% (range 1-
41%) by number, respectively. Fresh EC was generally confined to the smallest measured
particles (0.1-0.3 μm), as expected for fresh fossil fuel emissions [Moffet and Prather,
2009;Putaud, et al., 2004]. The major source of Fresh EC particles in many urban areas
is generally heavy duty diesel vehicles [Pratt and Prather, 2009]. As noted in the above
description, ECOC particles are aged Fresh EC particles [Moffet and Prather, 2009;Pratt
and Prather, 2009;Spencer and Prather, 2006]; further aging of Fresh EC and ECOC
particles can result in reclassification as OC particles due to the significant accumulation
of OC mass [Spencer and Prather, 2006]. Biomass burning is a significant global source
[Bowman, et al., 2009;Langmann, et al., 2009;Reid, et al., 2009], residing mostly in the
submicron size range[Qin and Prather, 2006], and is often part of the regional
background in both urban and rural areas[Qin and Prather, 2006]. Overall, little
contribution from sea salt or dust was observed in the submicron size range, although
significant contributions were observed between 0.5-1.0 μm for sea salt in London.
In the supermicron size range (1.0-3.0 μm), sea salt was the most abundant
particle class (47%) at sites within ~200 km of an ocean (Riverside, Houston, Fresno, and
London). Atlanta is 400 km, but included as having high sea salt due to hurricane
transport from the coast. Dust was a fraction (average – 16%, range - 1-32%) of
supermicron particles at most sites. While most supermicron carbonaceous particles are
aged combustion particles [Pratt and Prather, 2009], ATOFMS source studies have

221
shown supermicron Fresh EC particles from heavy duty diesel vehicle emissions [Shields,
et al., 2007] and supermicron biomass burning particles were observed in Mexico City
[Moffet, et al., 2008a]. In Detroit, St. Louis, and Mexico City, large number fractions
(~40-60%) of supermicron particles are metal-rich particles from nearby industry [Moffet,
et al., 2008a;Snyder, et al., 2009].
7.4.1.1.2 Fresh Urban Areas
33% of the urban field sites (San Diego, Los Angeles, Bologna, and New York
City) showed low number fractions (average - 12%, range - 3-26%) of submicron OC
particles that result from significant atmospheric processing (Figure 7.4). The most
abundant submicron particle class at each of these four sites was ECOC (average – 48%,
range 32-56%). This suggests that these sites are not significantly influenced by the
condensation of secondary organics and/or heterogeneous oxidation processes, as large
amounts of OC on particles can mask the primary source signature [Pratt and Prather,
2009;Spencer and Prather, 2006]. All four of these sites are within a few miles of oceans
and the diurnal land/sea breeze cycle may serve to limit the stagnant conditions that lead
to increased secondary organic carbon formation [Hughes, et al., 1999;Qin, et al., in
prep]. The aged urban sites with sea salt, discussed in the above section, were all located
further inland with a greater likelihood of having greater secondary organic carbon
formation for a variety of reasons, including local topography (Riverside and Fresno) and
high local emissions (London, Atlanta, and Houston). There was also a great deal of
variability in the number fractions of Fresh EC and Biomass particles, likely dependent
on local emission amounts. However, Fresh EC was still among the smallest measured

222
Figure 7.4 Size-resolved particle type number fractions for fresh urban areas (San Diego, Los Angeles, Bologna, and New York).

223
particles [Putaud, et al., 2004], and Biomass particles were distributed across the
submicron size range, as previously observed for fossil fuel combustion and biomass
burning emissions [Clarke, et al., 2007]. In the supermicron size range, sea salt was the
dominant particle type across all four sites, as these sites were not located near strong
dust source regions.
7.4.1.2 Remote Continental Sites
The size-resolved chemistry of the rural/remote continental locations is shown in
Figure 7.5. Of the field studies in remote continental locations, three sites (Mt. Horeb,
Sugar Pine Dam, and Grand Canyon) were sampled during representative time periods,
while the fourth site (Yellowstone) was sampled during intense wildfire conditions,
common to many portions of the western United States (Figure 7.6). Wildfire conditions
are prevalent in western United states during the fall [Reid, et al., 2009], encompassing
large swaths of land [Urbanski, et al., 2009], and altering local air quality [Viswanathan,
et al., 2006]. The Mt. Horeb, Sugar Pine Dam, and the Grand Canyon studies were
characterized high number fractions of Biomass particles in the submicron and a high
fraction of Dust in the supermicron size range. All four sites also had lower OC particle
number fractions (average 22%, range 8-36%) compared to the Aged Urban sites.
Previous filter-based measurements have shown lower PM2.5 mass fractions at locations >
50 km away from urban sources [Putaud, et al., 2004]. The Sugar Pine Dam site was
influenced by sea salt particles, even though it is ~250 km inland, which was likely
attributable to intense storms with strong winds transporting sea salt to the site [Ault, et
al., 2010a]. The high number fraction of submicron Fresh EC at Mt. Horeb was likely

224
Figure 7.5 Size-resolved particle type number fractions for remote continental sites (Mt. Horeb, Sugar Pine, Grand Canyon, and Yellowstone).

225
due to local sources, such as tractors, in the farm setting of the study. The extremely high
fraction of dust in the supermicron size range at the Grand Canyon is likely due to the
fact that it is an arid dust-producing environment [Brewer and Moore, 2009;Park, et al.,
2009].
As noted above, the Yellowstone study was completed during intense wildfires
within the National Park [Hall, et al., 2006]. While, these conditions are not
representative of normal conditions in Yellowstone, the size-resolved chemistry during
this study is discussed herein given the frequency and broad impact of wildfires in the
western United States [Brewer and Moore, 2009;Urbanski, et al., 2009] and many other
regions globally these results are discussed [Bowman, et al., 2009;Langmann, et al.,
2009;Reid, et al., 2009]. The close proximity of the wildfires to the sampling site led to
biomass, OC, and ECOC particles constituting greater than 80% of the particles by
number across both the submicron and supermicron size ranges. The remote continental
studies demonstrate the importance of biomass burning and dust in non-urban settings, as
well as the sensitivity of particle chemistry to local sources that would likely not be
observed in urban settings due elevated particle concentrations from numerous
anthropogenic sources.
7.4.1.3 Marine Studies
For the six marine studies, the dominate particle type in the supermicron size
range was sea salt, as expected (Figure 7.6). Significant number fractions of sea salt
(average – 49%, range – 1-91%), were also observed from 0.5-1.0 μm. For the two sites
that were influenced by outflow from Asia (Maldives and Gosan), a significant fraction

226
Figure 7.6 Size-resolved particle type number fractions for marine studies (Gosan, Cape Verde, Maldives, Trinidad Head, Mace Head, and North Atlantic).

227
of supermicron dust was observed, due to long range transport from the major Saharan
and Asian dust source regions [Ault, et al., 2010c;Satheesh and Moorthy, 2005;Spencer,
et al., 2008]. During periods heavily influenced by dust source regions, marine locations
can even be characterized by higher number and mass concentrations of dust than sea salt
[Ault, et al., 2010c]. In the submicron size range, the six marine sites can be split into
four sites with high number fractions of Biomass particles (Maldives, Gosan, Cape
Verde, and Trinidad Head) and 2 sites not influenced by biomass burning (North Atlantic
and Mace Head). This difference is striking as the sites in Asia, North America, and
Africa all have similar fractions of carbonaceous particle types, but the sites in Europe do
not. This is not merely an instrumental issue as the same instrument was used for Cape
Verde, North Atlantic, and Mace Head. One possible explanation is that far greater
numbers of large fires occur in Africa, Asia, and North America in comparison to Europe
[Bowman, et al., 2009;Langmann, et al., 2009;Reid, et al., 2009], leading to much lower
Biomass particle number concentrations near Mace Head and the North Atlantic. Overall,
the marine studies divided neatly into 2 subclassifications based on the presence or
absence of Biomass particles, due related to the global distribution of biomass burning
emissions [Bowman, et al., 2009;Langmann, et al., 2009;Reid, et al., 2009].
The size-resolved chemistry for each marine study was separated into clean and
polluted time periods, based on whether aged Sea Salt or fresh Sea Salt was more
prevalent (Figure 7.7). The aged sea salt type has larger nitrate peaks than chloride, while
fresh sea salt is the converse, as has been shown previously [Gard, et al., 1998]. For
particle types other than Sea Salt, the size-resolved chemical class fractions were very
similar for the clean and polluted periods, with the submicron size range dominated by

228
Figure 7.7 Size-resolved particle type number fractions for clean and polluted time periods during three marine studies (Gosan, Maldives, and Trinidad Head).

229
ECOC and Biomass. This interesting finding demonstrates that, while the number
concentration of submicron particles decreases during clean time periods [Ault, et al.,
2010c], that the number fraction of particles are still mostly from combustion classes
(ECOC and Biomass).
7.4.2 Internal Mixing with Secondary Species
In the following sections, the internal mixing of each of the six general particle
classes is described for the following secondary species markers: oxidized organic carbon
(43C2H3O+, 43C2H3O-), ammonium (18NH4+), nitrate (46NO2
- and 62NO3-), and sulfate
(80SO3- and 97HSO4
-). The mixing state discussed below is for consideration of particles
across all size ranges (0.1-3.0 μm). Mixing with respect to submicron versus supermicron
diameter particles was investigated separately, to minimize any size bias, but the mixing
state by number fraction for each particle type was similar for both its submicron and
supermicron components at most sites and is presented together. This section looks only
at the fraction of particles mixed with each secondary marker. As particles aged in the
atmosphere and they become larger and the mass of the secondary species present
increases [Spencer and Prather, 2006]. Often particles take up water during atmospheric
aging [Seinfeld and Pandis, 2006]. In real-time laser desorption/ionization mass
spectrometry , the presence of water can cause the suppression of negative ion formation,
causing many aged particles sampled in ambient environments to lack negative ions
[Ault, et al., 2009;Neubauer, et al., 1998]. For this analysis only particles producing both
positive and negative ions were considered, while leading to a small under representation
of secondary species, the qualitative trends observed as a function of particle type are still
valuable for explaining the overall characteristics of particle mixing state. In general,

230
across all location types (Figures 7.8-7.12), there is large variability in the number
fractions of the general particle types mixed with each secondary species; the following
sections describe these mixing states for each location type.
7.4.2.1 Urban Areas
7.4.2.1.1 Aged Urban Areas
The complexity of particle mixing state is evident from the lack of straight
forward trends across the urban areas for similar particle classes (Figures 7.8 and 7.9);
this suggests that atmospheric processing is not consistent across all urban locations,
particularly for all particle types. The urban areas with significant OC particle
concentrations, discussed in this section, are expected to represent the sites most
impacted by secondary species, given the large number of particles that have taken up
secondary organic material. For the OC particle type, 78-95% of the particles by number
contain oxidized OC (43C2H3O+). In particular, Riverside, Fresno, and Mexico City were
characterized by particularly high fractions (91-95%) of OC particles internally mixed
with oxidized OC. This is consistent with high submicron mass fractions of oxidized
organics and high O:C ratios in atmospheric aerosols sampled in urban locations and
those downwind of urban areas [Zhang, et al., 2007]. The increased oxidation of the
organic aerosol is due to gas-particle partitioning of semi-volatile species and
heterogeneous oxidation processes during particle aging [Heald, et al., 2010]. These
results are further supported by the observation that higher number fractions of Fresh EC
and ECOC particles were internally mixed with oxidized organic carbon (46% and 58%,

231
Figure 7.8 Particle mixing state matrices for aged urban areas, depicting the number fractions of each particle type (Fresh EC, ECOC, OC, Biomass, Sea Salt, and Dust) during each study that were internally mixed with each secondary species (oxidized organic carbon (43C2H3O+), ammonium (NH4
+), nitrate (46NO2- and 62NO3
-), and sulfate (80SO3
- and 97HSO4-)).

232
Figure 7.9 Particles mixing state matrices for fresh urban areas, depicting the number fractions of each particle type (Fresh EC, ECOC, OC, Biomass, Sea Salt, and Dust) during each study that were internally mixed with each secondary species (oxidized organic carbon (43C2H3O+), ammonium (NH4
+), nitrate (46NO2- and 62NO3
-), and sulfate (80SO3
- and 97HSO4-)).

233
respectively) than for the same particle types at fresh urban (16% and 49%), remote
continental (12% and 54%), and marine (49% and 17%) locations.
However, despite the strong presence of secondary organic carbon, very few Sea
Salt or Dust particles are internally mixed with oxidized organic carbon, with less than
25% of those particle mass spectra containing 43C2H3O+ for all 6 studies with sea salt and
dust present. However, sea salt and dust particles were mixed strongly with nitrate (81%
and 89% by number, respectively); combined with a lack of ammonium present, it is
likely that species such as NaNO3 are present due to heterogeneous reactions between
nitric acid and the marine (Sea Salt) and crustal (Dust) species [Gard, et al., 1998]. The
form and degree of aging may also be related to the chemistry of the dust, as shown
previously [Sullivan, et al., 2007].The mixing of the submicron carbonaceous types
(Fresh EC, ECOC, OC, and Biomass) with nitrate is far less consistent, suggesting that
gas phase concentrations and species that these particles are exposed to vary considerably
site-to-site. Sulfate tends to be concentrated on the carbonaceous particle types and is
observed on few sea salt or dust particles, while ammonium does not hold a consistent
trend across these sites.
7.4.2.1.2 Fresh Urban Areas
The fresh urban areas tend to have fewer Fresh EC (17%) and ECOC (50%)
particle by number internally mixed with oxidized organic carbon (Fig. 7.9) than the aged
urban areas (46% and 58%, respectively). The decreased number fractions of Fresh EC
and ECOC particles mixed with oxidized organic carbon supports the discussion in
section 7.3.1.1.2 showing that these sites are less aged both in terms of the particle

234
classes present and the mixing of secondary species with those classes, likely due to local
meteorology preventing stagnation at the sites. Also, 11% of the dust particles by number
at all four of these sites were mixed with oxidized OC, which is slightly less than that
observed for dust particles in aged urban environments (16%). Similar to the aged urban
locations, the most common secondary species internally mixed with sea salt and dust
particles was nitrate, while sulfate and ammonium are observed on very few of these
particles. When present, ammonium is mixed with ECOC, OC, and Biomass particles, as
is sulfate, suggesting the presence of ammonium sulfate. The fraction of carbonaceous
particles mixed with nitrate is also inconsistent across the four sites. Higher number
fractions of carbonaceous particle classes are mixed with nitrate than sulfate at Los
Angeles and Bologna, while the reverse is true in San Diego, and the fractions are very
similar in New York. Thus, while the mixing state of the sea salt and dust, primarily in
the supermicron size range, is predictable across all four sites, the mixing state of the
carbonaceous particle types, primarily observed in the submicron size range, is not
consistent across all four sites.
7.4.2.2 Remote Continental Sites
For the remote continental sites, Dust (and Sea Salt when present) were most
likely to be mixed with nitrate and were not mixed with sulfate (Figure 7.10). The mixing
of sulfate with carbonaceous particle classes varies considerably between sites, with
ECOC, OC, and Biomass particles highly mixed at Sugar Pine Dam (99%, 100%, and
78%, by number, respectively) and much less mixed at the Grand Canyon (14%, 6%,
21%). A similar trend is observed for nitrate with ECOC, OC, and Biomass particles,

235
Figure 7.10 Particle mixing state matrices for remote continental sites, depicting the number fractions of each particle type (Fresh EC, ECOC, OC, Biomass, Sea Salt, and Dust) during each study that were internally mixed with each secondary species (oxidized organic carbon (43C2H3O+), ammonium (NH4
+), nitrate (46NO2- and 62NO3
-), and sulfate (80SO3
- and 97HSO4-)).

236
wherein they were highly mixed at Sugar Pine Dam (58%, 79%, and 70% by number,
respectively), but barely mixed at the Grand Canyon (4%, 2%, 17%). Sugar Pine Dam is
the only remote continental site with a high fraction of ammonium, which combined with
the high sulfate and nitrate fractions, suggests the presence of ammonium sulfate and
ammonium nitrate. It was the most polluted of the remote sites, likely due to transport
from California’s polluted Central Valley [Bao, et al., 2008]. The mixing of oxidized
organic carbon with OC particles (average - 86%) is consistent with the observed high
oxidized organic fractions of the total submicron organic aerosol mass in rural/remote
locations [Zhang, et al., 2007]. Both Mt. Horeb (71% and 58% for ECOC and Biomass)
and Yellowstone (81% and 76%) have ECOC and Biomass types highly mixed with
sulfate and to a lesser extent nitrate, but the OC particle type is not mixed with sulfate
and nitrate at either Mt. Horeb (5% and 4%) or Yellowstone (15% and 10%), as it was in
the urban areas. The remote continental sites are quite different in terms of how the
particle classes are mixed with secondary species. This reinforces the conclusion above
that in an environment with fewer sources, particles class fractions, as well as how they
are mixed, vary considerably.
7.4.2.3 Marine Studies
At the marine sites, many of the same mixing state trends observed in urban areas
continued, while a couple of notable differences emerged (Figure 7.11). Once again, sea
salt and, especially, dust were mixed with nitrate across all of the sites and were not
significantly internally mixed with oxidized organic carbon or ammonium. Oxidized
organic carbon, when present, was mixed with carbonaceous species. A notable

237
Figure 7.11 Particle mixing state matrices for marine studies, depicting the number fractions of each particle type (Fresh EC, ECOC, OC, Biomass, Sea Salt, and Dust) during each study that were internally mixed with each secondary species (oxidized organic carbon (43C2H3O+), ammonium (NH4
+), nitrate (46NO2- and 62NO3
-), and sulfate (80SO3
- and 97HSO4-)).

238
difference from the urban areas is that both dust and sea salt were mixed with significant
fractions of sulfate at many sites, which may result from the oxidation of ocean-derived
SO2 [Gaston, et al., 2010], although the fractions containing sulfate (up to 66 %) were
consistently lower than the fractions containing nitrate. Sulfate was also consistently
internally mixed with the carbonaceous particle types (Fresh EC, ECOC, OC, and
Biomass). The mixing of Fresh EC, ECOC, and Biomass classes with nitrate was quite
variable, ranging from moderate number fractions at Trinidad Head (64%, 49%, and
57%, respectively) and Gosan (37%, 42%, and 44%), compared to very low fractions in
the Maldives (<1%, <1%, and 4%) and North Atlantic (4% and < 1%, Fresh EC and
ECOC), likely due to influences from different upwind sources. The particle class most
likely to be mixed with nitrate and sulfate was consistently the OC particle type (55% and
69%, respectively). Overall, the trends were in particle mixing state were far more
consistent at the marine sites compared to the urban sites, which is logical as most
particles observed at these sites have had long atmospheric lifetimes and their exposure to
different gases becomes homogenized.
The differences in marine particle mixing state between clean and polluted time
periods are shown in Figure 7.12 for the Gosan, Maldives, and Trinidad Head studies.
During polluted marine time periods at Gosan, Sea Salt and Dust particles were highly
internally mixed with nitrate (92% and 89%, by number) with little mixing with sulfate
(~10%, Sea Salt has interference at 93NaCl2-). During the clean period, the carbonaceous
particle types (Fresh EC, ECOC, OC, and Biomass) were highly mixed with sulfate
(80%, 99%, 92%, and 97% by number, respectively) and barely mixed with nitrate (15%,
21%, 8%, and 16%). The high number fractions of Sea Salt and Dust particles mixed with
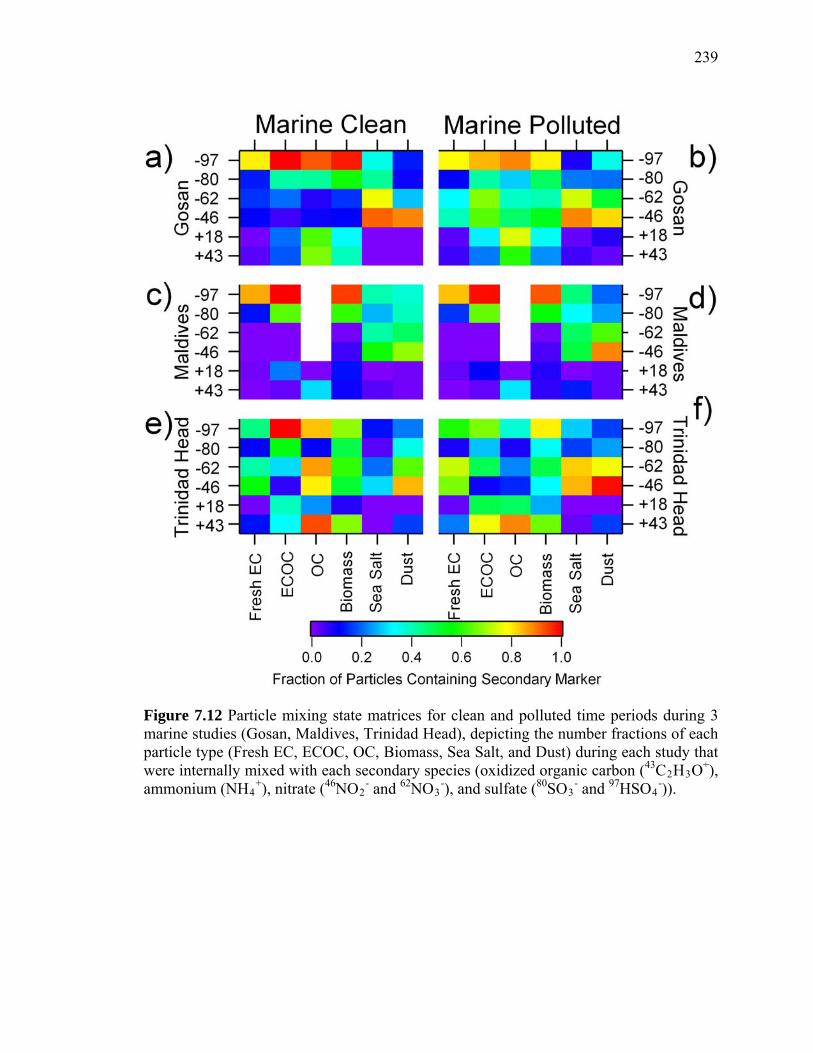
239
Figure 7.12 Particle mixing state matrices for clean and polluted time periods during 3 marine studies (Gosan, Maldives, Trinidad Head), depicting the number fractions of each particle type (Fresh EC, ECOC, OC, Biomass, Sea Salt, and Dust) during each study that were internally mixed with each secondary species (oxidized organic carbon (43C2H3O+), ammonium (NH4
+), nitrate (46NO2- and 62NO3
-), and sulfate (80SO3- and 97HSO4
-)).

240
nitrate and carbonaceous particles mixed with sulfate continued during the polluted time
periods, but the number fraction of carbonaceous particles (Fresh EC, ECOC, OC,
Biomass) mixed with nitrate increases dramatically from the clean to polluted time
period, from 8-21% to 33-68%, by number, for these four particle types. This indicates
that nitrate is taken up during the aging process on to the carbonaceous particle types.
The Maldives field campaign had similarities in that the number fractions of the Fresh
EC, ECOC, and Biomass particle types internally mixed with sulfate were high for both
clean (86%, 100%,and 95% by number, respectively) and polluted time periods (83%,
98%, 93% by number, respectively), and the Sea Salt and Dust particles are highly mixed
with nitrate during both clean (57% and 69% by number, respectively) and polluted (51%
and 89% by number, respectively) time periods, as well. The key difference between the
Gosan and Maldives studies is that there is no increase in nitrate number fraction (< 2%
mixed) for either clean or polluted conditions during the Maldives study for carbonaceous
particles. This indicates that carbonaceous particles sampled in the Maldives were likely
not exposed to as much nitric acid or other nitrate precursors during transport. For
Trinidad Head there is greater variation in the internally mixed number fractions for each
particle type during the clean and polluted periods, but this location has similar overall
trends to the Maldives study, in that nitrate is not enhanced during polluted periods after
being absent for the clean periods particles. Overall this comparison shows that the
degree of aging is likely not related to the time in transit to the site, but what gas phase
concentrations the particles are exposed to en route.

241
7.5 Conclusions
The current scientific understanding of aerosols with respect to radiative forcing
is low [Solomon, et al., 2007]. In addition to research needs in understanding the
fundamental physical and chemical properties of aerosols, there is currently a disconnect
between empirical findings and the representation of aerosols in most models. Given the
large uncertainties associated with radiative forcing due to aerosol direct and indirect
effects [Solomon, et al., 2007], it is essential that improvements be made to the
representation of aerosols in models, particularly global climate models (GCMs), In the
2007 IPCC report, the general aerosol categories were reported as: black carbon, organic
carbon, biomass burning, sea salt, mineral dust (for some models), sulfate, and nitrate (for
some models) [Solomon, et al., 2007]. With the exception of biomass burning, particles in
these GCMs were considered to be externally mixed [Solomon, et al., 2007], which is not
indicative of aerosols in the atmosphere. Further, internal versus external mixing has been
shown to drastically alter the radiative impact of black carbon and sulfate [Jacobson,
2001]. Fifth and sixth generation GCMs are currently improving their representation of
aerosols and are moving away from exclusively using external mixtures to using both
internal and external mixtures [Ghan and Schwartz, 2007]. However, a great deal about
the mixing of chemical species within different atmospheric aerosols remains to be
incorporated into climate modeling. A lack of mixing state measurements has been also
identified as one of the limiting factors in fully characterizing the ability of cloud
condensation nuclei to activate and form cloud droplets [McFiggans, et al., 2006]. Single
particle mass spectrometry measurements can provide information on the chemical
mixing state, including both refractory and non-refractory species, of single atmospheric

242
particles. Herein, we begin to address this gap in knowledge by reviewing size-resolved,
single-particle mixing state data from 22 ATOFMS studies, primarily in the Northern
Hemisphere.
Six main particle classes (Fresh EC, ECOC, OC, Biomass, Sea Salt, and Dust
particles) were observed to represent on average 94% of particles by number (95% and
92% in the submicron (0.1-1.0 μm) and supermicron (1.0-3.0 μm) size ranges,
respectively). A significant fraction of the particles within the “other” category were
metal-containing particles in the supermicron size range that were produced from
industrial processes (i.e. Pb-Zn-Cl particles in Mexico City [Moffet, et al., 2008b]) and
metals mixed with carbonaceous species from combustion (i.e. vanadium mixed with
organic carbon [Ault, et al., 2010b]) in the submicron size range. While not characterized
in this overview, metal-containing particles have important implications for human health
[Chen, et al., 2007;Liu, et al., 2005] and as potential ice nuclei [Cziczo, et al., 2009b]. In
contrast to the 2007 IPCC report, which treated sulfate and nitrate as externally mixed,
these 22 ATOFMS studies observed sulfate and nitrate nearly exclusively as internal
mixtures with the six particle types listed above and not as external mixtures. The
assumptions of mixing state have particularly important ramifications for black carbon
and sulfate [Jacobson, 2001], necessitating improved representation of sulfate (and
nitrate) mixing state in future models.
The 22 ATOFMS studies were grouped into urban, remote continental, and
marine locations. Analysis of size-resolved, single-particle chemistry data from the 12
urban studies revealed two subgroups: 1) aged urban environments with high number
fractions of OC particles in the submicron size range and 2) fresh urban environments

243
with high number fractions of ECOC and biomass particles. The photochemical
oxidation/aging processes in the aged urban environments led to high number fractions of
OC particles, many of which were likely characterized by soot particle cores coated with
secondary species, particularly oxidized OC. These sites also had the highest number
fractions of secondary species (oxidized organic carbon, nitrate, sulfate, and ammonium)
mixed with all of the particle classes. Overall, particles in the fresh urban environments
were less internally mixed with secondary species. With the exception of a biomass
burning influenced site, the remote continental sites showed the greatest variability in
aerosol size and composition with Fresh EC (Mt. Horeb), Biomass/Sea Salt (Sugar Pine
Dam), and Dust (Grand Canyon) as the largest fraction of particles by number over the
accumulation and start of the coarse mode, due to intense sources locally. The marine
studies had two particular findings of note: 1) very low number fractions of OC particles
were observed at the 6 marine sites, and 2) carbonaceous particles (Fresh EC, EOC, OC,
Biomass) comprised the majority of particles below 0.5 μm (typically 80-95% by
number) during all marine studies. The number fraction of carbonaceous particles below
0.5 μm was not significantly lower during isolated “clean” periods with sulfate internally
mixed with carbonaceous particles and nitrate mixed with sea salt and dust. The
prevalence of submicron carbonaceous particles has important implications for the
treatment of CCN in “pristine” maritime atmospheres.
Across all studies, sea salt and dust particles were preferentially internally mixed
with nitrate, while low number fractions of these particles were internally mixed with
sulfate, ammonium, or oxidized organic carbon. The carbonaceous particle types (Fresh
EC, ECOC, and Biomass), observed primarily in the submicron size range were most
244
likely to be mixed with sulfate, although nitrate was also prevalent in aged/processed
environments. Significantly variability of in the mixing of secondary species with each
particle type was observed between studies, likely due to influences from different
atmospheric aging mechanisms. This demonstrates the need to incorporate sophisticated
methods for representing aerosol aging processes, rather than simply assuming mixing
based on aging timescales.
Many steps are currently being taken to more accurately represent aerosol mixing
state in climate models to reduce uncertainties associated with aerosol radiative forcings
[Ghan and Schwartz, 2007]. The findings of this overview are intended to provide more
comprehensive information on particle mixing state to provide inputs/assumptions for
climate models. It is clear that the particle categories discussed in the 2007 IPCC report
do not accurately depict aerosol mixing state. Future work is needed to measure the size-
resolved, single-particle mixing state of particles globally, particularly in remote
locations, where the greatest variability in chemistry was observed. Reduced
uncertainties in the estimated radiative forcings by the aerosol direct and indirect effects
are expected as modules are developed to more accurately depict aerosol processes as
they are observed in the atmosphere and as models are compared with ambient
observations.
7.6 Acknowledgements
The following present and former Prather group members are thanked for
assisting with data collection: Keith Coffee, Jessie Creamean, Hiroshi Furutani,
Cassandra Gaston, John Holecek, George Khairallah, Don-Yuan Liu, Joseph Mayer,
Ryan Moffet, Silva Pastor, Xueying Qin, Michelle Sipin, Matthew Spencer, and David

245
Suess. Data collection by the Gross group was assisted by James Schauer, Alexandra
Schmidt, and Melanie Yuen. Funding for the ATOFMS field studies was provided by:
Atmospheric Brown Cloud project under the United Nations Environmental Programme,
California Air Resources Board (CARB), UK Natural Environment Research Council,
California Energy Commission (CEC), Electric Power Research Institute (EPRI),
Environmental Protection Agency (including the EPA-STAR program), LADCO,
Michigan Department of Natural Resources (MDNR), National Oceanic & Atmospheric
Administration (NOAA), and National Science Foundation (NSF). Andrew Ault is
grateful for a Department of Energy Global Change Education Program graduate research
environmental fellowship. Kerri Pratt is grateful for a NSF graduate research fellowship
and a NOAA climate & global change postdoctoral fellowship. Jerome Fast and
Xiaohong Liu (Pacific Northwest National Laboratory) are thanked for discussions of the
motivation of this manuscript.
Chapter 7 is in preparation for submission to Atmospheric Environment: A. P.
Ault, A. Zhu, K. A. Pratt, D. S. Gross, M. Dall’Osto, M. Gaelli, C. O’Dowd, and K.A.
Prather, Characterization of Asian Outflow at Gosan, Korea by Single Particle Mass
Spectrometry.

246
7.7 References
S. Angelino, D. T. Suess and K. A. Prather, Formation of aerosol particles from reactions of secondary and tertiary alkylamines: Characterization by aerosol time-of-flight mass spectrometry, Environmental Science & Technology, 35 (15), 3130-3138, 2001.
A. P. Ault, J. M. Creamean, C. J. Gaston, C. R. Williams, F. M. Ralph and K. A. Prather,
Observations of Transported Asian Dust in California Precipitation during CalWater, Nat. Geosci., submitted, 2010a.
A. P. Ault, C. J. Gaston, Y. Wang, G. Dominguez, M. H. Thiemens and K. A. Prather,
Characterization of the Single Particle Mixing State of Individual Ship Plume Events Measured at the Port of Los Angeles, Environmental Science & Technology, 44 (6), 1954-1961, 2010b.
A. P. Ault, M. J. Moore, H. Furutani and K. A. Prather, Impact of emissions from the Los
Angeles port region on San Diego air quality, Environmental Science & Technology, 43 (10), 3500-3506, 2009.
A. P. Ault, A. Zhu, V. Ramanathan and K. A. Prather, Characterization of Asian Outflow
at Gosan, Korea by Single Particle Mass Spectrometry, Journal Of Geophysical Research-Atmospheres, in prep, 2010c.
J. W. Bao, S. A. Michelson, P. O. G. Persson, I. V. Djalalova and J. M. Wilczak,
Observed and WRF-simulated low-level winds in a high-ozone episode during the Central California Ozone Study, Journal of Applied Meteorology and Climatology, 47 (9), 2372-2394, 2008.
S. E. Bauer, D. L. Wright, D. Koch, E. R. Lewis, R. McGraw, L. S. Chang, S. E.
Schwartz and R. Ruedy, MATRIX (Multiconfiguration Aerosol TRacker of mIXing state): an aerosol microphysical module for global atmospheric models, 8 (20), 6003-6035, 2008.
D. C. S. Beddows and H. H. Telle, Prospects of real-time single-particle biological
aerosol analysis: A comparison between laser-induced breakdown spectroscopy and aerosol time-of-flight mass spectrometry, Spectrochimica Acta Part B-Atomic Spectroscopy, 60 (7-8), 1040-1059, 2005.
P. V. Bhave, D. P. Fergenson, K. A. Prather and G. R. Cass, Source apportionment of
fine particulate matter by clustering single-particle data: Tests of receptor model accuracy, Environmental Science & Technology, 35 (10), 2060-2072, 2001.

247
D. Bowman, J. K. Balch, P. Artaxo, W. J. Bond, J. M. Carlson, M. A. Cochrane, C. M. D'Antonio, R. S. DeFries, J. C. Doyle, S. P. Harrison, F. H. Johnston, J. E. Keeley, M. A. Krawchuk, C. A. Kull, J. B. Marston, M. A. Moritz, I. C. Prentice, C. I. Roos, A. C. Scott, T. W. Swetnam, G. R. van der Werf and S. J. Pyne, Fire in the Earth System, Science, 324 (5926), 481-484, 2009.
P. Brewer and T. Moore, Source Contributions to Visibility Impairment in the
Southeastern and Western United States, Journal Of The Air & Waste Management Association, 59 (9), 1070-1081, 2009.
W. Cantrell and A. Heymsfield, Production of ice in tropospheric clouds - A review,
Bulletin Of The American Meteorological Society, 86 (6), 795-+, 2005. J. C. Chen, J. M. Cavallari, P. H. Stone and D. C. Christiani, Obesity is a modifier of
autonomic cardiac responses to fine metal particulates, Environmental Health Perspectives, 115 (7), 1002-1006, 2007.
S. H. Chung and J. H. Seinfeld, Global distribution and climate forcing of carbonaceous
aerosols, Journal Of Geophysical Research-Atmospheres, 107 (D19), 2002. A. Clarke, C. McNaughton, V. Kapustin, Y. Shinozuka, S. Howell, J. Dibb, J. Zhou, B.
Anderson, V. Brekhovskikh, H. Turner and M. Pinkerton, Biomass burning and pollution aerosol over North America: Organic components and their influence on spectral optical properties and humidification response, Journal Of Geophysical Research-Atmospheres, 112 (D12), 2007.
B. Croft, U. Lohmann and K. von Salzen, Black carbon ageing in the Canadian Centre for
Climate modelling and analysis atmospheric general circulation model, Atmospheric Chemistry And Physics, 5, 1931-1949, 2005.
M. J. Cubison, B. Ervens, G. Feingold, K. S. Docherty, I. M. Ulbrich, L. Shields, K.
Prather, S. Hering and J. L. Jimenez, The influence of chemical composition and mixing state of Los Angeles urban aerosol on CCN number and cloud properties, Atmospheric Chemistry And Physics, 8 (18), 5649-5667, 2008.
D. J. Cziczo, K. D. Froyd, S. J. Gallavardin, O. Moehler, S. Benz, H. Saathoff and D. M.
Murphy, Deactivation of ice nuclei due to atmospherically relevant surface coatings, Environmental Research Letters, 4 (4), 2009a.
D. J. Cziczo, O. Stetzer, A. Worringen, M. Ebert, S. Weinbruch, M. Kamphus, S. J.
Gallavardin, J. Curtius, S. Borrmann, K. D. Froyd, S. Mertes, O. Mohler and U. Lohmann, Inadvertent climate modification due to anthropogenic lead, Nature Geoscience, 2 (5), 333-336, 2009b.

248
M. Dall'Osto, M. J. Booth, W. Smith, R. Fisher and R. M. Harrison, A study of the size distributions and the chemical characterization of airborne particles in the vicinity of a large integrated steelworks, Aerosol Science And Technology, 42 (12), 981-991, 2008.
K. A. Denkenberger, R. C. Moffet, J. C. Holecek, T. P. Rebotier and K. A. Prather, Real-
time, single-particle measurements of oligomers in aged ambient aerosol particles, Environmental Science & Technology, 41 (15), 5439-5446, 2007.
K. S. Docherty, E. A. Stone, I. M. Ulbrich, P. F. DeCarlo, D. C. Snyder, J. J. Schauer, R.
E. Peltier, R. J. Weber, S. M. Murphy, J. H. Seinfeld, B. D. Grover, D. J. Eatough and J. L. Jimenez, Apportionment of Primary and Secondary Organic Aerosols in Southern California during the 2005 Study of Organic Aerosols in Riverside (SOAR-1), Environmental Science & Technology, 42 (20), 7655-7662, 2008.
F. Drewnick, M. Dall'Osto and R. Harrison, Characterization of aerosol particles from
grass mowing by joint deployment of ToF-AMS and ATOFMS instruments, Atmospheric Environment, 42 (13), 3006-3017, 2008.
T. Ferge, E. Karg, A. Schroppel, K. R. Coffee, H. J. Tobias, M. Frank, E. E. Gard and R.
Zimmermann, Fast determination of the relative elemental and organic carbon content of aerosol samples by on-line single-particle aerosol time-of-flight mass spectrometry, Environmental Science & Technology, 40 (10), 3327-3335, 2006.
P. Forster, V. Ramaswamy, P. Artaxo, T. Berntsen, R. Betts, D. W. Fahey, J. Haywood,
J. Lean, D. C. Lowe, G. Myhre, J. Nganga, R. Prinn, G. Raga, M. Schulz and R. Van Dorland, Changes in Atmospheric Constituents and in Radiative Forcing 2007.
H. Furutani, M. Dall'osto, G. C. Roberts and K. A. Prather, Assessment of the relative
importance of atmospheric aging on CCN activity derived from field observations, Atmos. Environ., 42 (13), 3130-3142, 2008.
S. Fuzzi, M. O. Andreae, B. J. Huebert, M. Kulmala, T. C. Bond, M. Boy, S. J. Doherty,
A. Guenther, M. Kanakidou, K. Kawamura, V. M. Kerminen, U. Lohmann, L. M. Russell and U. Poschl, Critical assessment of the current state of scientific knowledge, terminology, and research needs concerning the role of organic aerosols in the atmosphere, climate, and global change, Atmospheric Chemistry And Physics, 6, 2017-2038, 2006.
E. Gard, J. E. Mayer, B. D. Morrical, T. Dienes, D. P. Fergenson and K. A. Prather, Real-
time analysis of individual atmospheric aerosol particles: Design and performance of a portable ATOFMS, Analytical Chemistry, 69 (20), 4083-4091, 1997.

249
E. E. Gard, M. J. Kleeman, D. S. Gross, L. S. Hughes, J. O. Allen, B. D. Morrical, D. P. Fergenson, T. Dienes, M. E. Galli, R. J. Johnson, G. R. Cass and K. A. Prather, Direct observation of heterogeneous chemistry in the atmosphere, Science, 279 (5354), 1184-1187, 1998.
C. J. Gaston, K. A. Pratt, X. Y. Qin and K. A. Prather, Real-Time Detection and Mixing
State of Methanesulfonate in Single Particles at an Inland Urban Location during a Phytoplankton Bloom, Environmental Science & Technology, 44 (5), 1566-1572, 2010.
S. J. Ghan and S. E. Schwartz, Aerosol properties and processes - A path from field and
laboratory measurements to global climate models, Bulletin Of The American Meteorological Society, 88 (7), 1059-+, 2007.
D. S. Gross, R. Atlas, J. Rzeszotarski, E. Turetsky, J. Christensen, S. Benzaid, J. Olson,
T. Smith, L. Steinberg, J. Sulman, A. Ritz, B. Anderson, C. Nelson, D. R. Musicant, L. Chen, D. C. Snyder and J. J. Schauer, Environmental chemistry through intelligent atmospheric data analysis, Environmental Modelling & Software, 25 (6), 760-769, 2010.
D. S. Gross, M. E. Galli, M. Kalberer, A. S. H. Prevot, J. Dommen, M. R. Alfarra, J.
Duplissy, K. Gaeggeler, A. Gascho, A. Metzger and U. Baltensperger, Real-time measurement of oligomeric species in secondary organic aerosol with the aerosol time-of-flight mass spectrometer, Analytical Chemistry, 78 (7), 2130-2137, 2006.
D. S. Gross, M. E. Galli, P. J. Silva, S. H. Wood, D. Y. Liu and K. A. Prather, Single
particle characterization of automobile and diesel truck emissions in the Caldecott Tunnel, Aerosol Science And Technology, 32 (2), 152-163, 2000.
S. A. Guazzotti, K. R. Coffee and K. A. Prather, Continuous measurements of size-
resolved particle chemistry during INDOEX-Intensive Field Phase 99, Journal Of Geophysical Research-Atmospheres, 106 (D22), 28607-28627, 2001a.
S. A. Guazzotti, J. R. Whiteaker, D. Suess, K. R. Coffee and K. A. Prather, Real-time
measurements of the chemical composition of size-resolved particles during a Santa Ana wind episode, California USA, Atmospheric Environment, 35 (19), 3229-3240, 2001b.
B. D. Hall, M. L. Olson, A. P. Rutter, R. R. Frontiera, D. P. Krabbenhoft, D. S. Gross, M.
Yuen, T. M. Rudolph and J. J. Schauer, Atmospheric mercury speciation in Yellowstone National Park, Science Of The Total Environment, 367 (1), 354-366, 2006.
C. L. Heald, J. H. Kroll, J. L. Jimenez, K. S. Docherty, P. F. DeCarlo, A. C. Aiken, Q.
Chen, S. T. Martin, D. K. Farmer and P. Artaxo, A simplified description of the

250
evolution of organic aerosol composition in the atmosphere, Geophysical Research Letters, 37, 2010.
R. M. Healy, I. P. O'Connor, S. Hellebust, A. Arnaud, J. R. Sodeau and J. C. Wenger,
Characterisation of single particles from in-port ship emissions, Atmospheric Environment, 43 (40), 6408-6414, 2009.
E. J. Highwood and R. P. Kinnersley, When smoke gets in our eyes: The multiple
impacts of atmospheric black carbon on climate, air quality and health, Environment International, 32 (4), 560-566, 2006.
L. S. Hughes, J. O. Allen, M. J. Kleeman, R. J. Johnson, G. R. Cass, D. S. Gross, E. E.
Gard, M. E. Galli, B. D. Morrical, D. P. Fergenson, T. Dienes, C. A. Noble, P. J. Silva and K. A. Prather, Size and composition distribution of atmospheric particles in southern California, Environmental Science & Technology, 33 (20), 3506-3515, 1999.
M. Z. Jacobson, Strong radiative heating due to the mixing state of black carbon in
atmospheric aerosols, 409 (6821), 695-697, 2001. D. Koch, Transport and direct radiative forcing of carbonaceous and sulfate aerosols in
the GISS GCM, Journal Of Geophysical Research-Atmospheres, 106 (D17), 20311-20332, 2001.
D. Koch, T. C. Bond, D. Streets, N. Unger and G. R. van der Werf, Global impacts of
aerosols from particular source regions and sectors, Journal Of Geophysical Research-Atmospheres, 112 (D2), 2007.
B. Langmann, B. Duncan, C. Textor, J. Trentmann and G. R. van der Werf, Vegetation
fire emissions and their impact on air pollution and climate, Atmospheric Environment, 43 (1), 107-116, 2009.
D. Y. Liu, K. A. Prather and S. V. Hering, Variations in the size and chemical
composition of nitrate-containing particles in Riverside, CA, Aerosol Science And Technology, 33 (1-2), 71-86, 2000.
D. Y. Liu, D. Rutherford, M. Kinsey and K. A. Prather, Real-time monitoring of
pyrotechnically derived aerosol particles in the troposphere, Analytical Chemistry, 69 (10), 1808-1814, 1997.
D. Y. Liu, R. J. Wenzel and K. A. Prather, Aerosol time-of-flight mass spectrometry
during the Atlanta Supersite Experiment: 1. Measurements, Journal Of Geophysical Research-Atmospheres, 108 (D7), 2003.

251
Y. C. Liu, M. A. Woodin, T. J. Smith, R. F. Herrick, P. L. Williams, R. Hauser and D. C. Christiani, Exposure to fuel-oil ash and welding emissions during the overhaul of an oil-fired boiler, Journal Of Occupational And Environmental Hygiene, 2 (9), 435-443, 2005.
U. Lohmann and C. Hoose, Sensitivity studies of different aerosol indirect effects in
mixed-phase clouds, Atmospheric Chemistry And Physics, 9 (22), 8917-8934, 2009.
G. McFiggans, P. Artaxo, U. Baltensperger, H. Coe, M. C. Facchini, G. Feingold, S.
Fuzzi, M. Gysel, A. Laaksonen, U. Lohmann, T. F. Mentel, D. M. Murphy, C. D. O'Dowd, J. R. Snider and E. Weingartner, The effect of physical and chemical aerosol properties on warm cloud droplet activation, Atmospheric Chemistry And Physics, 6, 2593-2649, 2006.
A. M. Middlebrook, D. M. Murphy, S. H. Lee, D. S. Thomson, K. A. Prather, R. J.
Wenzel, D. Y. Liu, D. J. Phares, K. P. Rhoads, A. S. Wexler, M. V. Johnston, J. L. Jimenez, J. T. Jayne, D. R. Worsnop, I. Yourshaw, J. H. Seinfeld and R. C. Flagan, A comparison of particle mass spectrometers during the 1999 Atlanta Supersite Project, Journal Of Geophysical Research-Atmospheres, 108 (D7), 2003.
R. C. Moffet, B. de Foy, L. T. Molina, M. J. Molina and K. A. Prather, Measurement of
ambient aerosols in northern Mexico City by single particle mass spectrometry, Atmospheric Chemistry And Physics, 8 (16), 4499-4516, 2008a.
R. C. Moffet, Y. Desyaterik, R. J. Hopkins, A. V. Tivanski, M. K. Gilles, Y. Wang, V.
Shutthanandan, L. T. Molina, R. G. Abraham, K. S. Johnson, V. Mugica, M. J. Molina, A. Laskin and K. A. Prather, Characterization of aerosols containing Zn, Pb, and Cl from an industrial region of Mexico City, Environmental Science & Technology, 42 (19), 7091-7097, 2008b.
R. C. Moffet and K. A. Prather, In-situ measurements of the mixing state and optical
properties of soot with implications for radiative forcing estimates, Proceedings Of The National Academy Of Sciences Of The United States Of America, 106 (29), 11872-11877, 2009.
D. M. Murphy, The design of single particle laser mass spectrometers, Mass
Spectrometry Reviews, 26 (2), 150-165, 2007. G. Myhre, Consistency Between Satellite-Derived and Modeled Estimates of the Direct
Aerosol Effect, Science, 325 (5937), 187-190, 2009.

252
K. R. Neubauer, M. V. Johnston and A. S. Wexler, Humidity effects on the mass spectra of single aerosol particles, Atmospheric Environment, 32 (14-15), 2521-2529, 1998.
C. A. Noble and K. A. Prather, Real-time single particle mass spectrometry: A historical
review of a quarter century of the chemical analysis of aerosols, Mass Spectrometry Reviews, 19 (4), 248-274, 2000.
S. H. Park, S. L. Gong, W. Gong, P. A. Makar, M. D. Moran, C. A. Stroud and J. Zhang,
Sensitivity of surface characteristics on the simulation of wind-blown-dust source in North America, Atmospheric Environment, 43 (19), 3122-3129, 2009.
S. H. Pastor, J. O. Allen, L. S. Hughes, P. Bhave, G. R. Cass and K. A. Prather, Ambient
single particle analysis in Riverside, California by aerosol time-of-flight mass spectrometry during the SCOS97-NARSTO, Atmospheric Environment, 37, S239-S258, 2003.
U. Poschl, Atmospheric aerosols: Composition, transformation, climate and health
effects, Angewandte Chemie-International Edition, 44 (46), 7520-7540, 2005. K. A. Prather, C. D. Hatch and V. H. Grassian, Analysis of Atmospheric Aerosols,
Annual Review of Analytical Chemistry, 1, 485-514, 2008. K. A. Prather, T. Nordmeyer and K. Salt, Real-Time Characterization Of Individual
Aerosol-Particles Using Time-Of-Flight Mass-Spectrometry, Analytical Chemistry, 66 (9), 1403-1407, 1994.
K. A. Pratt, New Insights into Single-Particle Mixing State using Aircraft Aerosol Time-
of-Flight Mass Spectrometry, University of California, San Diego, La Jolla, CA, 2009.
K. A. Pratt, P. J. DeMott, J. R. French, Z. Wang, D. L. Westphal, A. J. Heymsfield, C. H.
Twohy, A. J. Prenni and K. A. Prather, In situ detection of biological particles in cloud ice-crystals, Nature Geoscience, 2 (6), 397-400, 2009a.
K. A. Pratt, L. E. Hatch and K. A. Prather, Seasonal volatility dependence of ambient
particle phase amines, Environmental Science & Technology, 43 (14), 5276-5281, 2009b.
K. A. Pratt, J. E. Mayer, J. C. Holecek, R. C. Moffet, R. O. Sanchez, T. P. Rebotier, H.
Furutani, M. Gonin, K. Fuhrer, Y. X. Su, S. Guazzotti and K. A. Prather, Development and Characterization of an Aircraft Aerosol Time-of-Flight Mass Spectrometer, Analytical Chemistry, 81 (5), 1792-1800, 2009c.

253
K. A. Pratt and K. A. Prather, Real-Time, Single-Particle Volatility, Size, and Chemical Composition Measurements of Aged Urban Aerosols, Environmental Science & Technology, 43 (21), 8276-8282, 2009.
K. A. Pratt and K. A. Prather, Aircraft measurements of vertical profiles of aerosol
mixing states, Journal Of Geophysical Research-Atmospheres, 115 (D11305), 2010a.
K. A. Pratt and K. A. Prather, Mass spectrometry of atmospheric aerosols – Recent
developments & applications. Part II: On-line mass spectrometry techniques., Mass Spectrometry Reviews, Submitted, 2010b.
J. P. Putaud, F. Raes, R. Van Dingenen, E. Bruggemann, M. C. Facchini, S. Decesari, S.
Fuzzi, R. Gehrig, C. Huglin, P. Laj, G. Lorbeer, W. Maenhaut, N. Mihalopoulos, K. Mulller, X. Querol, S. Rodriguez, J. Schneider, G. Spindler, H. ten Brink, K. Torseth and A. Wiedensohler, European aerosol phenomenology-2: chemical characteristics of particulate matter at kerbside, urban, rural and background sites in Europe, Atmospheric Environment, 38 (16), 2579-2595, 2004.
X. Qin, K. A. Pratt, L. G. Shields, S. M. Toner and K. A. Prather, Seasonal Comparisons
of the Single Particle Mixing State in Riverside, CA duing the SOAR 2005 Campaign Aerosol Science & Technology, in prep.
X. Y. Qin and K. A. Prather, Impact of biomass emissions on particle chemistry during
the California Regional Particulate Air Quality Study, International Journal Of Mass Spectrometry, 258 (1-3), 142-150, 2006.
F. Raes, R. Van Dingenen, E. Vignati, J. Wilson, J. P. Putaud, J. H. Seinfeld and P.
Adams, Formation and cycling of aerosols in the global troposphere, Atmospheric Environment, 34 (25), 4215-4240, 2000.
V. Ramanathan and G. Carmichael, Global and regional climate changes due to black
carbon, Nature Geoscience, 1 (4), 221-227, 2008. T. P. Rebotier and K. A. Prather, Aerosol time-of-flight mass spectrometry data analysis:
A benchmark of clustering algorithms, Analytica Chimica Acta, 585 (1), 38-54, 2007.
J. S. Reid, E. J. Hyer, E. M. Prins, D. L. Westphal, J. L. Zhang, J. Wang, S. A.
Christopher, C. A. Curtis, C. C. Schmidt, D. P. Eleuterio, K. A. Richardson and J. P. Hoffman, Global Monitoring and Forecasting of Biomass-Burning Smoke: Description of and Lessons From the Fire Locating and Modeling of Burning Emissions (FLAMBE) Program, Ieee Journal of Selected Topics in Applied Earth Observations and Remote Sensing, 2 (3), 144-162, 2009.

254
N. Riemer, H. Vogel, B. Vogel and F. Fiedler, Modeling aerosols on the mesoscale-gamma: Treatment of soot aerosol and its radiative effects, Journal Of Geophysical Research-Atmospheres, 108 (D19), 2003.
N. Riemer, M. West, R. Zaveri and R. Easter, Estimating black carbon aging time-scales
with a particle-resolved aerosol model, Journal Of Aerosol Science, 41 (1), 143-158, 2010.
N. Riemer, M. West, R. A. Zaveri and R. C. Easter, Simulating the evolution of soot
mixing state with a particle resolved aerosol model, Journal Of Geophysical Research-Atmospheres, in press, 2009.
S. K. Satheesh and K. K. Moorthy, Radiative effects of natural aerosols: A review,
Atmospheric Environment, 39 (11), 2089-2110, 2005. R. B. Schlesinger, N. Kunzli, G. M. Hidy, T. Gotschi and M. Jerrett, The health relevance
of ambient particulate matter characteristics: Coherence of toxicological and epidemiological inferences, Inhalation Toxicology, 18 (2), 95-125, 2006.
J. H. Seinfeld and S. N. Pandis, Atmospheric Chemistry and Physics, Wiley Interscience,
Hoboken, NJ, 2006. L. G. Shields, D. T. Suess and K. A. Prather, Determination of single particle mass
spectral signatures from heavy-duty diesel vehicle emissions for PM2.5 source apportionment, Atmospheric Environment, 41 (18), 3841-3852, 2007.
P. J. Silva, R. A. Carlin and K. A. Prather, Single particle analysis of suspended soil dust
from Southern California, Atmospheric Environment, 34 (11), 1811-1820, 2000. P. J. Silva, D. Y. Liu, C. A. Noble and K. A. Prather, Size and chemical characterization
of individual particles resulting from biomass burning of local Southern California species, Environmental Science & Technology, 33 (18), 3068-3076, 1999.
P. J. Silva and K. A. Prather, On-line characterization of individual particles from
automobile emissions, Environmental Science & Technology, 31 (11), 3074-3080, 1997.
P. J. Silva and K. A. Prather, Interpretation of mass spectra from organic compounds in
aerosol time-of-flight mass spectrometry, Analytical Chemistry, 72 (15), 3553-3562, 2000.
D. C. Snyder, J. J. Schauer, D. S. Gross and J. R. Turner, Estimating the contribution of
point sources to atmospheric metals using single-particle mass spectrometry, Atmospheric Environment, 43 (26), 4033-4042, 2009.

255
D. A. Sodeman, S. M. Toner and K. A. Prather, Determination of single particle mass
spectral signatures from light-duty vehicle emissions, Environmental Science & Technology, 39 (12), 4569-4580, 2005.
S. Solomon, D. Qin, M. Manning, Z. Chen, M. Marquis, K. B. Averyt, M. Tignor and H.
L. Miller, Climate Change 2007: The Physical Science Basis. Contribution of Working Group 1 to the Fourth Assessment Report of the Intergovernmental Panel on Climate Change,Cambridge University Press, Cambridge, United Kingdom and New York, NY, USA, 2007.
X. H. Song, P. K. Hopke, D. P. Fergenson and K. A. Prather, Classification of single
particles analyzed by ATOFMS using an artificial neural network, ART-2A, Analytical Chemistry, 71 (4), 860-865, 1999.
M. T. Spencer, J. C. Holecek, C. E. Corrigan, V. Ramanathan and K. A. Prather, Size-
resolved chemical composition of aerosol particles during a monsoonal transition period over the Indian Ocean, 113 (D16), 2008.
M. T. Spencer and K. A. Prather, Using ATOFMS to determine OC/EC mass fractions in
particles, Aerosol Science And Technology, 40 (8), 585-594, 2006. M. T. Spencer, L. G. Shields, D. A. Sodeman, S. M. Toner and K. A. Prather,
Comparison of oil and fuel particle chemical signatures with particle emissions from heavy and light duty vehicles, Atmospheric Environment, 40 (27), 5224-5235, 2006.
Y. X. Su, M. F. Sipin, H. Furutani and K. A. Prather, Development and characterization
of an aerosol time-of-flight mass spectrometer with increased detection efficiency, Analytical Chemistry, 76 (3), 712-719, 2004.
Y. X. Su, M. F. Sipin, K. A. Prather, R. M. Gelein, A. Lunts and G. Oberdorster,
ATOFMS characterization of individual model aerosol particles used for exposure studies, Aerosol Science And Technology, 39 (5), 400-407, 2005.
R. C. Sullivan, S. A. Guazzotti, D. A. Sodeman and K. A. Prather, Direct observations of
the atmospheric processing of Asian mineral dust, Atmospheric Chemistry And Physics, 7, 1213-1236, 2007.
R. C. Sullivan, M. J. K. Moore, M. D. Petters, S. M. Kreidenweis, G. C. Roberts and K.
A. Prather, Effect of chemical mixing state on the hygroscopicity and cloud nucleation properties of calcium mineral dust particles, Atmospheric Chemistry And Physics, 9 (10), 3303-3316, 2009a.

256
R. C. Sullivan, M. J. K. Moore, M. D. Petters, S. M. Kreidenweis, G. C. Roberts and K. A. Prather, Timescale for hygroscopic conversion of calcite mineral particles through heterogeneous reaction with nitric acid, Physical Chemistry Chemical Physics, 11 (36), 7826-7837, 2009b.
R. C. Sullivan and K. A. Prather, Recent advances in our understanding of atmospheric
chemistry and climate made possible by on-line aerosol analysis instrumentation, Analytical Chemistry, 77 (12), 3861-3885, 2005.
R. C. Sullivan and K. A. Prather, Investigations of the diurnal cycle and mixing state of
oxalic acid in individual particles in Asian aerosol outflow, Environmental Science & Technology, 41 (23), 8062-8069, 2007.
S. M. Toner, Anthropogenic Particulate Source Characterization and Source
Apportionment Using Aerosol Time-of-Flight Mass Spectrometry, Doctoral Thesis thesis, University of California San Diego, La Jolla, 2007.
S. M. Toner, L. G. Shields, D. A. Sodeman and K. A. Prather, Using mass spectral source
signatures to apportion exhaust particles from gasoline and diesel powered vehicles in a freeway study using UF-ATOFMS, Atmospheric Environment, 42 (3), 568-581, 2008.
S. M. Toner, D. A. Sodeman and K. A. Prather, Single particle characterization of
ultrafine and accumulation mode particles from heavy duty diesel vehicles using aerosol time-of-flight mass spectrometry, Environmental Science & Technology, 40 (12), 3912-3921, 2006.
S. P. Urbanski, J. M. Salmon, B. L. Nordgren and W. M. Hao, A MODIS direct broadcast
algorithm for mapping wildfire burned area in the western United States, Remote Sensing of Environment, 113 (11), 2511-2526, 2009.
S. Viswanathan, L. Eria, N. Diunugala, J. Johnson and C. McClean, An analysis of
effects of San Diego wildfire on ambient air quality, Journal Of The Air & Waste Management Association, 56 (1), 56-67, 2006.
R. J. Wenzel, D. Y. Liu, E. S. Edgerton and K. A. Prather, Aerosol time-of-flight mass
spectrometry during the Atlanta Supersite Experiment: 2. Scaling procedures, Journal Of Geophysical Research-Atmospheres, 108 (D7), 2003.
J. R. Whiteaker and K. A. Prather, Detection of pesticide residues on individual particles,
Analytical Chemistry, 75 (1), 49-56, 2003a. J. R. Whiteaker and K. A. Prather, Hydroxymethanesulfonate as a tracer for fog
processing of individual aerosol particles, Atmospheric Environment, 37 (8), 1033-1043, 2003b.

257
J. R. Whiteaker, D. T. Suess and K. A. Prather, Effects of meteorological conditions on
aerosol composition and mixing state in Bakersfield, CA, Environmental Science & Technology, 36 (11), 2345-2353, 2002.
J. Williams, M. de Reus, R. Krejci, H. Fischer and J. Strom, Application of the
variability-size relationship to atmospheric aerosol studies: estimating aerosol lifetimes and ages, Atmospheric Chemistry And Physics, 2, 133-145, 2002.
Q. Zhang, J. L. Jimenez, M. R. Canagaratna, J. D. Allan, H. Coe, I. Ulbrich, M. R.
Alfarra, A. Takami, A. M. Middlebrook, Y. L. Sun, K. Dzepina, E. Dunlea, K. Docherty, P. F. DeCarlo, D. Salcedo, T. Onasch, J. T. Jayne, T. Miyoshi, A. Shimono, S. Hatakeyama, N. Takegawa, Y. Kondo, J. Schneider, F. Drewnick, S. Borrmann, S. Weimer, K. Demerjian, P. Williams, K. Bower, R. Bahreini, L. Cottrell, R. J. Griffin, J. Rautiainen, J. Y. Sun, Y. M. Zhang and D. R. Worsnop, Ubiquity and dominance of oxygenated species in organic aerosols in anthropogenically-influenced Northern Hemisphere midlatitudes, Geophysical Research Letters, 34 (13), 2007.
R. Zimmermann, T. Ferge, M. Galli and R. Karlsson, Application of single-particle laser
desorption/ionization time-of-flight mass spectrometry for detection of polycyclic aromatic hydrocarbons from soot particles originating from an industrial combustion process, Rapid Communications In Mass Spectrometry, 17 (8), 851-859, 2003.
B. Zuberi, K. S. Johnson, G. K. Aleks, L. T. Molina and A. Laskin, Hydrophilic
properties of aged soot, Geophysical Research Letters, 32 (1), 2005.

258
8 Conclusions and Future Directions
8.1 Conclusions
Understanding the influence of transported particles on receptor sites is critical for
fully describing the atmospheric processes that impact climate and human health. This
dissertation has focused on observing the chemical and physical changes particles
undergo during transport on local (ship plumes), regional (port emissions and Asian
outflow), and intercontinental scales (Asian dust in North American precipitation). These
studies have shed new light on changes to transported particles over the timescales of
minutes to weeks. ATOFMS has been shown to be an effective tool for investigating
these research objectives. These findings have strengthened our understanding of the
processes that particles undergo during transport and provided motivation for more
detailed studies in the future.
Chapter 2 discussed results from analysis of particles observed at the Scripps
Institution of Oceanography (SIO) Pier in La Jolla, CA. Elemental carbon mixed with
organic carbon and vanadium-nickel-iron particle types were observed and linked with
regional transport from the region around the Ports of Los Angeles and Long Beach.
These two particle types were heavily aged and lacked negative spectra, likely due to
uptake of water, sulfate, and nitrate. The mass concentration of particles from the port
region was observed to dwarf that of local emissions at times of peak transport; size
resolved chemical analysis further pointed to a large mass contribution from the
submicron mode during these time periods. Mass concentration comparisons with a site
259
in downtown San Diego show that this transport affects the entirety of San Diego not just
the area surrounding the SIO Pier.
To verify that vanadium was coming from ships as hypothesized in Chapter 2,
sampling was conducted at a site adjacent to the main channel of the Port of Los Angeles.
Here plumes from specific ships were identified and analyzed with a suite of gas and
particle phase instrumentation. Plumes were grouped into two categories by their levels
of SORRRRRR2RRRRRR and NORRRRRRxRRRRRR, and ORRRRRR3RRRRRR: those with a high concentration of OC-V-sulfate particles,
which we believe originate from residual fuel burning ships, and those with high
concentrations of fresh soot, likely from distillate fuel burning ships. Both types were
observed to be highly correlated in time with specific plumes identified through ship logs,
radio signals, and visual documentation. A key finding was that sulfate and sulfuric acid
were enhanced preferentially on organic carbon particles mixed with vanadium. We
hypothesized that this is likely due to catalytic oxidation of the SORRRRRR2RRRRRR in the plume by
vanadium in the particle phase, either through aqueous or heterogeneous reactions.
The development of the mobile laboratory described in Chapter 4 is a significant
step forward in our ability to conduct field studies at diverse locations and transport
equipment between sites. Previous field deployment required that instruments be
transported in crates or box trucks and required housing and power upon arrival at a
sampling location. Using the mobile laboratory in combination with generators allows for
instruments to be towed to a site and be up and running in less than 15 minutes. This
allowed for measurements to be obtained at 5 sites in one day at different points around
San Diego Bay. The diffusion of particles from the source region in downtown versus the
cleaning effect of the sea breeze during the afternoon of March 13, 2009 provided an

260
interesting contrast between sources. This stood in stark contrast to the pristine conditions
observed during the earlier sampling on February 12, 2009 after a week of rain. These
results show the variation in particle chemistry and concentration as particles are
transported are transported away from and into a region that is often considered to have a
homogenous aerosol population.
The potential for Asian dust to influence precipitation in the United States,
specifically California, has not been fully elucidated, only gaining attention within the
past decade. Considering Asia accounts for roughly one third of global dust emissions,
these processes need to be explored in detail. The results in Chapter 5 detail initial
investigations into the links between Asian dust, clouds, and precipitation over
California. Monitoring the particle residues in precipitation revealed a stark shift from
organic carbon residues, likely from biomass burning, to dust residues over the course of
an extratropical cyclone with an atmospheric river. This contrasted with a separate
extratropical cyclone with an atmospheric river that did not observe this shift. Back
trajectory analysis revealed that during the influenced storm Asian dust was transported
at the altitudes of precipitating clouds. This was followed by a shift in the cloud drop size
distribution and an increase in precipitation intensity. While this is only one data point, it
is an intriguing observation that needs additional verification. These results demonstrate
the necessity of understanding the role of aerosol transport in altering aerosol-cloud-
precipitation interactions.
Since the outflow of particles from the Asian continent has the potential to
influence climate a continent away it is critical to understand the atmospheric processing
that these particles undergo during transport. Chapter 6 discusses results from the ground

261
measurements associated with the Pacific Dust Experiment (PACDEX) at the Gosan
Supersite on Jeju Island off the south coast of South Korea. The highest concentrations
observed at the site corresponded to air masses transported from China. These time
periods were compared with back trajectories coming from Korea, the Sea of Japan, and
over the ocean. Size resolved mass distributions indicate that even after one day of
transport, submicron particles comprise the majority of the mass in Asian outflow.
Additionally, these particle mixing state was heavily influenced by particle source and
size. The mixing state information in this paper should provide a useful data set for the
validation of single particle models investigating particle mixing state and aging.
Chapter 7 describes observations of single particle mixing state from studies across
the northern hemisphere. Based on comparisons of the size resolved chemical mixing
state four different site classifications emerged: aged urban, fresh urban, remote
continental, and marine. The size-resolved particle chemistry varied considerably
between the four types of sampling sites. A size dependence was observed for particle
chemistry, with most sites displaying a shift from a mostly carbonaceous submicron
aerosol to predominantly crustal and sea salt aerosol in the supermicron size range.
Comparisons of the secondary species associated with each of the primary particle types
demonstrated considerable differences across the diverse sampling locations.
Consistently observed trends included nitrate mixed with particles in the supermicron
size range and sulfate concentrated in the submicron mode. The similarities and
differences observed across these studies provide inputs for modelers attempting to
accurately represent single particle mixing state in climate models.

262
8.2 Los Angeles Basin Mobile Study (LABMS) Results
Prior to the mobile study around the San Diego Bay in 2009, a mobile laboratory
study was conducted in the eastern half of the Los Angeles (LA) Basin in 2007. These
results were not included in the manuscript described in Chapter 4 and are discussed
below.
The LABMS measurements were made over a 5 day period; the sampling periods
are shown as green bars in Figure 8.1. These measurements involved the mobile
laboratory equipped with an ATOFMS, a UF-ATOFMS, gas phase instrumentation (ORRRRRR3RRRRRR,
NORRRRRRxRRRRRR, and SORRRRRR2RRRRRR), and particle phase instrumentation (SMPS and APS). As described in
Chapter 4 power at each of the sites was obtained from two Honda generators inside the
bed of a pickup truck. Sites were chosen to obtain measurements on neighborhood scale
temporally and were distributed throughout the eastern half of the LA Basin. Sampling
sites included the University of California, Riverside on November 11PPPPPP
thPPPPPP and 12 PPPPPP
thPPPPPP (UCR1
and UCR2), the Chino dairy farms (Chino Farms), a park near downtown Riverside
(Riverside Park), a church parking lot in Chino Hills (Chino Hills Church), a park in
Rubidoux (Rutland Park), and a baseball field in Norco (Norco). The sampling conditions
during this 5 day period were characterized by low mass concentrations of particles less
than 2.5 microns (PMRRRRRR2.5RRRRRR), reaching their lowest levels for November 2007. The PMRRRRRR2.5RRRRRR
mass concentrations for two sites in the eastern Los Angeles Basin are also shown in
Figure 8.1.
During the fall, Riverside meteorology frequently leads to significant build up
periods followed by periods where winds come from the east bringing air masses with
few anthropogenic particles. These easterly winds, known as Santa Ana’s, are caused by

263
Figure 8.1 PMRRRRRR2.5RRRRRR mass concentrations during LABMS for Rubidoux (black line) and
Mira Loma (blue line). Sampling time periods are marked by green bars.

264
Figure 8.2 500 meter back trajectories from each of the sites sampled by the mobile laboratory during the LABMS: UCR1 (red), Chino Farms (orange), UCR2 (yellow), Riverside Park (green), Chino Hills (aqua), Rutland Park (blue), and Norco (dark blue). Diamond markers on the back trajectories represent each hour.

265
Figure 8.3 Size resolved chemical mixing state from both ATOFMS and UF-ATOFMS measurements at each of the mobile laboratory sites. a) UCR1, b) Chino Farms, c) UCR2), d) Riverside Park, e) Chino Hills, f) Rutland Park, g) Norco.

266
the clockwise flow around a high pressure system over the American northwest leading
to flow from the Great Basin of Nevada, Utah, and Eastern California towards Southern
California. The low concentrations discussed above were due to Santa Ana conditions
observed in the LA Basin which disrupted the typical diurnal shift between sea and land
breezes that often leads to pollution build up in the eastern half of the LA Basin. The
presence of Santa Ana winds was verified by back trajectory analysis at 500 meters for
each site during the study, which is shown in Figure 8.2; each of the sample sites can be
seen at the origin the back trajectory. These back trajectories indicate that air masses
approached the basin from the east, where as air masses typically approach from the west
during the mid-afternoon of days exhibiting typical diurnal patterns [Qin, et al., in prep].
The size resolved chemical mixing state (i.e. the fraction of each particle type in
each 50 nm bin) at each of the seven sites above is shown in Figure 8.3. The size range of
100-500 nm represents data from the UF-ATOFMS while the 500-2500 nm size range
was obtained from the ATOFMS. The main particle types observed are typical of
ATOFMS measurements in Riverside as reported by previous studies [Qin, et al., in
prep;Shields, et al., 2008]. These types include fresh elemental carbon, elemental carbon
mixed with organic carbon (ECOC), organic carbon (OC), biomass burning (Biomass),
vanadium-containing particles (vanadium), sea salt, and dust. For the purposes of these
comparisons, minor particle types were combined into the other category. The
measurements at the first sampling site UCR1 occurred as the Santa Ana winds were
cleaning out the built up pollution in the eastern LA basin. This can be identified
chemically by the highest fraction of organic carbon occurring during this time period

267
between 150 – 1000 nm. This time period also had the highest fractional contribution of
sea salt particles in the supermicron size range, which was likely due to diurnal transport
from the coast prior to the Santa Ana conditions. The size resolved chemical composition
for Chino Farms, UCR2, Riverside Park, Chino Hills are all reasonably similar and
characterized by ECOC, OC, and biomass in the submicron size range and dust in the
supermicron size range. Sampling at the Norco site occurred as the Santa Ana conditions
were lessening and the back trajectory after ~ 1 day loops from its initial easterly
direction towards the western LA basin and ocean. The influence of coastal emissions is
confirmed by a large fraction of vanadium containing particles in the submicron size
range that are likely from residual fuel burning ships in the Long Beach region [Ault, et
al., 2010;Ault, et al., 2009].
The results from the LABMS showed the impact of Santa Ana conditions across
the basin and the ubiquity of these conditions across the eastern LA basin. This study has
provided motivation for more detailed measurements with the mobile laboratory during
polluted conditions to determine the degree of spatial variability with respect to particle
chemistry over this region. Additional experiments with one stationary instrument and
one instrument (with the same inlet) in the mobile laboratory could provide insight into
the variation of aerosols over neighborhood to city-wide scales.
8.3 Characterization of Aerosol Optical Properties at Gosan, Korea
Additional studies beyond those described in Chapter 6 were conducted at the
Gosan supersite aiming to measure the optical properties of the sampled particles.
Particle optical properties were determined using the method previously developed in the
Prather laboratory [Moffet and Prather, 2005;Moffet, et al., 2008]. Briefly, the light

268
scattered by individual particles as they pass through the sizing lasers is focused by an
ellipsoidal mirror onto a photomultiplier tube (PMT). When particle size and chemical
composition are saved, the peak height and area from both lasers are also saved for the
particle. Once particles are grouped by chemical composition the raw scattering response
of each particle is plotted versus its size. Particles that travel through the center of the
Gaussian laser beam profile form an upper limit of scattered light intensity that can be
traced and fit to Mie Theory to determine particle refractive index (n) and density for the
class of particles. As the particle beam is broader than the laser beam a significant
fraction of particles will only clip the beam and scatter less light. To determine the upper
limit a monotonic regression of scattered intensities that accounts for the distribution of
full and clipped scattering responses was utilized. Preliminary results described here
indicate distinct optical differences between different particles types, as well as key
differences based on relative humidity. Examples of the scattering from several of the
most prevalent particle types (ECOC, biomass, dust, fresh sea salt, and aged sea salt) are
included in Figure 8.4. For spherical particle types, such as sea salt in a humid marine
environment, ripples are observed in the scattering data above roughly 1.5 microns.
These ripples are predicted from Mie theory as shown in the introduction (Chapter 1) and
confirm that the particles are spherical. The lack of a clear upper scattering limit for the
dust particle type is indicative of a non-spherical particle type, as is expected for dust.
Changes in relative humidity can have a significant impact on the scattering
properties of aerosols. As particles take up greater amounts of water their refractive index
approaches that of water (n = 1.33), which leads to a greater scattering response. The size

269
Figure 8.4 Single particle scattering data (response vs. size) from the most abundant particle types observed at Gosan, Korea: ECOC (red), biomass burning (yellow), fresh sea salt (aqua), aged sea salt (teal), dust (brown).

270
Figure 8.5 The scattering response as a function of size for biomass burning (top) and aged sea salt (bottom) with particles sampled during different relative humidities marked by color.
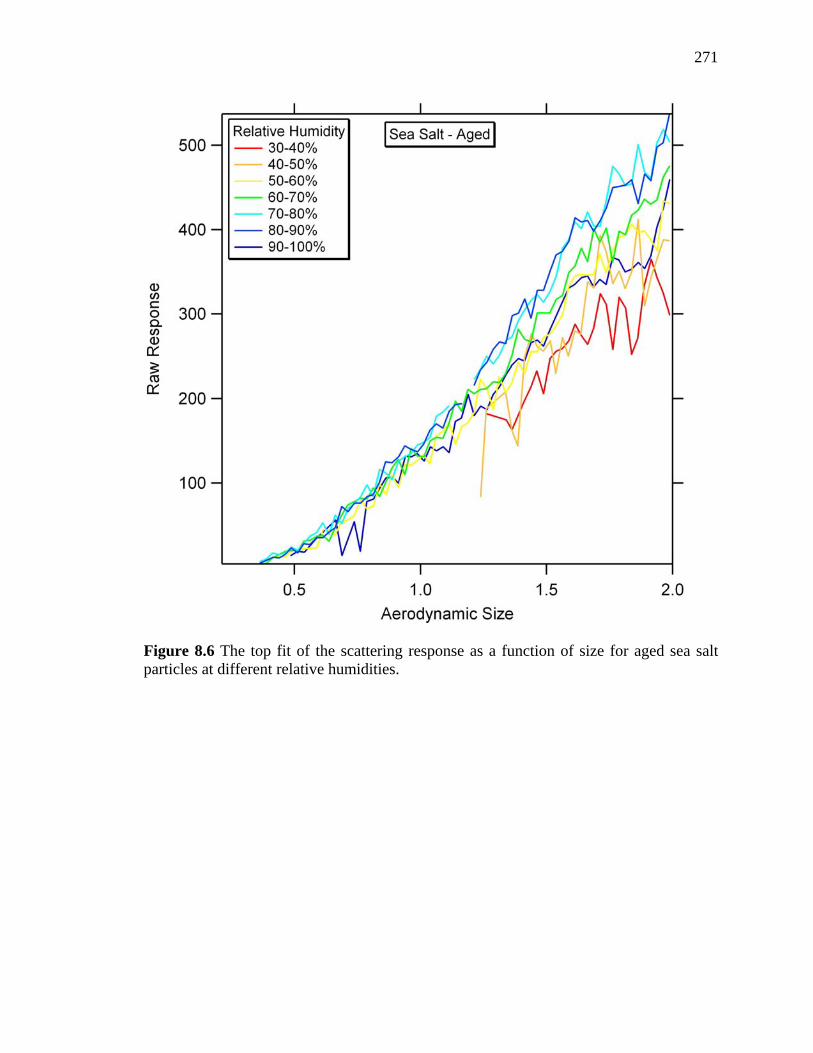
271
Figure 8.6 The top fit of the scattering response as a function of size for aged sea salt particles at different relative humidities.

272
resolved scattering data are shown in Figure 8.5 for biomass burning (top) and aged sea
salt (bottom) particles. For both particle types the upper limit of the scattering response
can be seen to increase as the relative humidity increases, indicating that the particles are
in fact taking up water. The differences in particle scattering response as a function of
relative humidity are more explicitly displayed for the aged sea salt particle type in
Figure 8.6. Here the upper limit fits can be seen to increase as relative humidity increases
(except for the 90-100% bin, which does not have sufficient counts for an accurate fit).
These results will provide a set of refractive indices and densities for aged air
masses as they begin the process of intercontinental transport and provide a more
fundamental understanding of the optical properties of aged aerosols. Taken together
these chemically resolved optical properties have the potential to greatly improve the
representation of aerosol properties in climate models by providing empirically derived
input values and benchmarks for comparison of current model results.
8.4 Future Directions
The research experiences described in this dissertation provide significant
motivation for follow up research by future group members. With respect to the analysis
of ship emissions, two directions of research could bring further advances beyond the
initial findings presented here. It is of particular interest to analyze fuel samples used in
ocean going vessels, specifically comparing the spectra associated with the combustion of
residual (a.k.a. bunker) fuels and distillated (a.k.a. diesel) fuels. Controlled sampling
from one or more ships by combining ATOFMS measurements with bulk sampling
methods [Agrawal, et al., 2008a;Agrawal, et al., 2008b], as has been previously achieved
for monitoring car and truck emissions [Shields, et al., 2007;Sodeman, et al., 2005;Toner,

273
et al., 2006] could provide verification of our hypothesis outlined in Chapter 3 that the
amount of fresh soot may be related to engine conditions. A second set of experiments
exploring the oxidation process of SORRRRRR2RRRRRR to sulfate could provide additional
understanding of the observations made in this work. These studies could be done in the
laboratory using a flow tube reactor, wherein fresh combustion particles would be
exposed to varying levels of SORRRRRR2RRRRRR to explore reaction kinetics and products. This study
could utilize techniques such as ion chromatography and microscopy, in addition to
ATOFMS, to gain further insight as to how the reaction progresses. Further, using the
ATOFMS to track an evolving ship plume in the ambient atmosphere (e.g. [Murphy, et
al., 2009]) would be interesting on two levels: (1) the sulfate and sulfuric acid peak areas
could be monitored during aging to obtain time scales of aging on the particles and (2)
the OC-V-sulfate particles in Chapter 2 near ship stacks likely aged and become the V-
Ni-Fe(sulfate-nitrate) particles observed both at the Port of Los Angeles and San Diego.
Monitoring the evolution of the mass spectra as these particles age could give insight as
to how the aging proceeds chemically. These laboratory and the field studies should also
characterize the cloud condensation nuclei (CCN) activity as a function of particle age.
Combining the chemistry and cloud nucleating potential of these particles could be key to
unraveling many of the lingering issues related to ship track clouds over the world’s
oceans.
The mobile laboratory represents a fantastic opportunity to explore both climate
and health related aerosol issues by taking advantage of its mobility. The addition of
universal power supplies (UPS) represents a minor modification to the mobile laboratory
that would increase its flexibility by decreasing down time between sites and potentially

274
allow for truly mobile sampling. At stationary sites additional UPS’s will serve to filter
incoming power, protecting against surges, dirty power, and short term power outages. In
time, developing a method for remote data collection and instrument monitoring, possibly
via a small satellite dish, would allow for greater real-time access to the instruments,
decrease instrument downtime by quickly alerting scientists to instrument malfunctions,
and provide the ability to backup data on the fly without relying on local internet (similar
to how NOAA’s sampling sites are operated). Additional studies that would be of
considerable interest involving the mobile laboratory include investigation of aging
processes placing a stationary ATOFMS at the source and positioning the mobile
laboratory at various distances downwind. This would build on initial attempts to
measure with one ATOFMS at a stationary location (UC-Riverside) and mobile
laboratory measurements made in the eastern Los Angeles Basin in fall 2007 that did not
yield usable results. An additional experiment that would be difficult, but potentially very
interesting would involve mobile sampling linked with aircraft sampling. For example,
measurements could be made each day on the ground at a different point along the flight
path of a research aircraft. The research aircraft would then transect the location at
various elevations to explore the link between the aerosol populations on the ground and
in vertical profile. This could provide a great deal of information regarding the exchange
of aerosols between the surface and aloft.
The initial measurements from CalWater Early Start described in Chapter 5 provide
the foundation for numerous research projects that could link precipitation sampling,
trajectory analysis, and meteorological measurements to explore aerosol-cloud-
precipitation interactions. In designing a future study utilizing this suite of measurements,

275
it would be extremely interesting to have an ATOFMS at one of the atmospheric river
observatories (AROs) on the west coast of California and a second ATOFMS at the Sugar
Pine site. Since the ARO sites are fairly remote it would be very interesting to compare
precipitation samples between these two sites to look at what typical residue chemistries
are and to observe the extent of dust incorporation at both sites under transport
conditions. A second, more focused approach, could involve sampling at a valley site
(perhaps Sloughhouse), at Sugar Pine, and at Norden simultaneously to explore changes
in the precipitation chemistry as the clouds are orographically lifted up the windward side
of the Sierra Nevada mountain range. The ultimate experiment might involve sampling at
all three of those sites while having a plane transect across the three at different altitudes
over the course of the day. This could provide unprecedented understanding of the
evolution of precipitation and cloud properties from a chemical and meteorological
perspective.
While the Gosan data set described in Chapters 6 provided a number of novel
results, there are many different directions that research of this type could be directed in
the future. A key starting place would be standardizing and better characterizing the
optical scattering measurements. At present there is not a good method for assessing data
quality at the time of collection. One way to improve the chances of success would
involve running a size calibration using more than the standard 8-10 sizes currently used.
A calibration of 25 sizes including 5 below a micron and PSLs every 0.1 microns from
1.0 microns to 3.0 microns would allow for a detailed understanding of the state of the
instrument as it compares to Mie theory. Currently the size calibration does not include
enough points above 1 micron to allow for a correction between Mie theory predictions

276
and actual data with a thorough calibration curve. Thus any differences in observed
scattering vs. theoretically predicted scattering could be corrected for ahead of time or
accounted for after the fact. A simple and interesting experiment with the optical
measurements could involve changing one of the scattering lasers to a blue or red
wavelength. Since Mie theory is wavelength dependent, variation in refractive index as a
function of wavelength could be observed for different particle types. The scattering
properties could then be integrated into an optical property model to constrain forcings
for specific particle types. Regarding sampling using tandem DMA-ATOFMS, a
complete characterization of the transmission efficiency for each aerosol inlet (nozzle or
aerodynamic lens) in high size resolution would be extremely useful for future
measurements, to allow for scaling to atmospheric concentrations after sampling. A
simple study with an ATOFMS run next to a DMA-ATOFMS setup would be extremely
interesting as it would allow for effective density and shape factor information to be
applied directly to measurements across the entire size range of the instrument.
The discussion of multiple ATOFMS datasets in Chapter 7 leaves open many
different possibilities for comparing datasets across instruments and research groups. An
obvious starting place would be to go into greater detail comparing the studies discussed
already, as well as including additional studies that were not included due to time and
space limitations. As new studies are collected I hope that efforts will be made to
compare with older data sets in order to provide interesting insights and greater
understanding of the temporal and spatial variability of atmospheric aerosols. An
additional step would involve comparing ATOFMS results with results from other single
particle mass spectrometers such as the PALMS [Murphy and Thomson, 1995], the

277
SPLAT instruments [Zelenyuk and Imre, 2005;Zelenyuk, et al., 2009], and the RSMS
[Carson, et al., 1995]. This will involve challenges such as different laser wavelengths,
single vs. dual polarity spectra, and differing inlets. The fact that these instruments have
operational differences that can give a broader set of results means that taken together
they have the potential to provide a more clear understanding of what we have learned in
nearly two decades of on-line single particle mass spectrometry analysis.
0B0B0B0B0B0B8.5 Final Thought
I hope the passion that I have had for this work over the course of my graduate
career is reflected in this dissertation. I have enjoyed the breadth of experiences from the
intensity and excitement of field studies to the integration of multiple techniques and data
sets after the fact to answer a pressing question. I hope that the scientific questions
explored in this thesis motivate others to ask the tough questions and not be afraid to
tackle new projects as a means of advancing our understanding of this gigantic reaction
vessel we call the atmosphere.

278
8.6 References
H. Agrawal, Q. G. J. Malloy, W. A. Welch, J. Wayne Miller and D. R. Cocker III, In-use
gaseous and particulate matter emissions from a modern ocean going container vessel, Atmospheric Environment, 42 (21), 5504, 2008a.
H. Agrawal, W. A. Welch, J. W. Miller and D. R. Cocker, Emission Measurements from
a Crude Oil Tanker at Sea, Environ. Sci. Technol., 2008b. A. P. Ault, C. J. Gaston, Y. Wang, G. Dominguez, M. H. Thiemens and K. A. Prather,
Characterization of the Single Particle Mixing State of Individual Ship Plume Events Measured at the Port of Los Angeles, Environmental Science & Technology, 44 (6), 1954-1961, 2010.
A. P. Ault, M. J. Moore, H. Furutani and K. A. Prather, Impact of emissions from the Los
Angeles port region on San Diego air quality, Environmental Science & Technology, 43 (10), 3500-3506, 2009.
P. G. Carson, K. R. Neubauer, M. V. Johnston and A. S. Wexler, Online Chemical-
Analysis Of Aerosols By Rapid Single-Particle Mass-Spectrometry, Journal Of Aerosol Science, 26 (4), 535-545, 1995.
R. C. Moffet and K. A. Prather, Extending ATOFMS measurements to include refractive
index and density, Analytical Chemistry, 77 (20), 6535-6541, 2005. R. C. Moffet, X. Y. Qin, T. Rebotier, H. Furutani and K. A. Prather, Chemically
segregated optical and microphysical properties of ambient aerosols measured in a single-particle mass spectrometer, Journal Of Geophysical Research-Atmospheres, 113 (D12), 2008.
D. M. Murphy and D. S. Thomson, Laser Ionization Mass-Spectroscopy Of Single
Aerosol-Particles, Aerosol Science And Technology, 22 (3), 237-249, 1995. S. M. Murphy, H. Agrawal, A. Sorooshian, L. T. Padro, H. Gates, S. Hersey, W. A.
Welch, H. Jung, J. W. Miller, D. R. Cocker, A. Nenes, H. H. Jonsson, R. C. Flagan and J. H. Seinfeld, Comprehensive Simultaneous Shipboard and Airborne Characterization of Exhaust from a Modern Container Ship at Sea, Environmental Science & Technology, 43 (13), 4626-4640, 2009.
X. Qin, K. A. Pratt, L. G. Shields, S. M. Toner and K. A. Prather, Seasonal Comparisons
of the Single Particle Mixing State in Riverside, CA duing the SOAR 2005 Campaign Aerosol Science & Technology, in prep.

279
L. G. Shields, X. Y. Qin, S. M. Toner and K. A. Prather, Detection of ambient ultrafine
aerosols by single particle techniques during the SOAR 2005 campaign, Aerosol Science And Technology, 42 (8), 674-684, 2008.
L. G. Shields, D. T. Suess and K. A. Prather, Determination of single particle mass
spectral signatures from heavy-duty diesel vehicle emissions for PM2.5 source apportionment, Atmospheric Environment, 41 (18), 3841-3852, 2007.
D. A. Sodeman, S. M. Toner and K. A. Prather, Determination of single particle mass
spectral signatures from light-duty vehicle emissions, Environmental Science & Technology, 39 (12), 4569-4580, 2005.
S. M. Toner, D. A. Sodeman and K. A. Prather, Single particle characterization of
ultrafine and accumulation mode particles from heavy duty diesel vehicles using aerosol time-of-flight mass spectrometry, Environmental Science & Technology, 40 (12), 3912-3921, 2006.
A. Zelenyuk and D. Imre, Single particle laser ablation time-of-flight mass spectrometer:
An introduction to SPLAT, Aerosol Science And Technology, 39 (6), 554-568, 2005.
A. Zelenyuk, J. Yang, E. Choi and D. Imre, SPLAT II: An Aircraft Compatible, Ultra-
Sensitive, High Precision Instrument for In-Situ Characterization of the Size and Composition of Fine and Ultrafine Particles, Aerosol Science And Technology, 43 (5), 411-424, 2009.