universite de perpignan via domitia - Thèses
279
Délivré par UNIVERSITE DE PERPIGNAN VIA DOMITIA Préparée au sein de l’école doctorale Energie et Environnement Et de l’unité de recherche CEntre de Formation et de Recherche sur les Environnements Méditerranéens (CEFREM) UMR 5110 CNRS UPVD Spécialité : Océanologie Présentée par Stefano LELLI Soutenue le 22 Décembre 2017 devant le jury composé de Rachid AMARA, Professeur, HDR, Universités du Littoral Côte d’Opale Rapporteur Adib SAAD, Professeur, Université de Tishreen, Syrie Rapporteur Matteo MURENU, Maître de conférences, Université de Cagliari, Italie Examinateur Philippe LENFANT, Professeur, HDR, UPVD Examinateur Gaby KHALAF, Professeur, CNRS Libanais Directeur Marion VERDOIT-JARRAYA, Maître de conférences, UPVD Co-directrice Contribution to a better knowledge of biology, distribution and diversity of demersal species along the Lebanese coast, eastern Mediterranean: a focus on Lessepsian fish species.
-
Upload
khangminh22 -
Category
Documents
-
view
0 -
download
0
Transcript of universite de perpignan via domitia - Thèses

Délivré par
UNIVERSITE DE PERPIGNAN VIA DOMITIA
Préparée au sein de l’école doctorale
Energie et Environnement
Et de l’unité de recherche
CEntre de Formation et de Recherche sur les
Environnements Méditerranéens (CEFREM)
UMR 5110 CNRS UPVD
Spécialité : Océanologie
Présentée par Stefano LELLI
Soutenue le 22 Décembre 2017 devant le jury composé de
Rachid AMARA, Professeur, HDR, Universités du
Littoral Côte d’Opale
Rapporteur
Adib SAAD, Professeur, Université de Tishreen,
Syrie
Rapporteur
Matteo MURENU, Maître de conférences, Université de Cagliari, Italie
Examinateur
Philippe LENFANT, Professeur, HDR, UPVD Examinateur
Gaby KHALAF, Professeur, CNRS Libanais Directeur
Marion VERDOIT-JARRAYA, Maître de
conférences, UPVD Co-directrice
Contribution to a better knowledge of biology, distribution and diversity of demersal species along the Lebanese coast, eastern Mediterranean: a focus
on Lessepsian fish species.

1

2
Acknowledgements
I would like to express my deep gratitude to the people who were part of this extensive endeavour
and to all the Institutions that made it possible. To the CIHEAM-Agronomic Institute of Bari that
always placed absolute trust in me and granted me excellent support. To the staff of the CIHEAM-
Pesca Libano project that dedicated its efforts towards the successful achievements of our
objectives.
For the coordination and support and in specific for upholding the smooth implementation of field
activities, I wish to thank the National Council for Scientific Research, Lebanon (CNRS) and in
particular the Secretary General Mouïn Hamzé, all the staff of the CANA project and the crew of the
R/V CANA-CNRS. My gratitude also goes to the Department of Fisheries and Wildlife of Ministry of
Agriculture of the Republic of Lebanon (DFW-MoA) for indicating strategic areas of interventions and
simplifying formal procedures for field work.
Furthermore, I never forget that all this could not have been possible without the financial support
and the confidence granted by the Italian Cooperation.
For its higher support in the constant effort to share durable strategies for the fisheries sector in
Lebanon, I express my gratitude and appreciation to the General Fisheries Commission for the
Mediterranean (GFCM). Also, I am grateful to the FAO regional project EastMed and to the Institute
for Coastal Marine Environment of the CNR (IAMC-CNR) for their vital technical support and to the
ENVIMED Mistral CNRS France for its financial support for the LESSEPS project.
All these institutions are made up of human beings that encouraged, suggested, brainstormed,
discussed or simply lent me a hand before, during and after the implementation of the field
activities. I wish to acknowledge a debt of gratitude to Biagio Di Terlizzi, Samir Majdalani and
Francesco Colloca for their continuous guidance, their help and the friendship they honor me with.
My gratitude also goes to Myriam Lteif, Sharif Jemaa and all the colleagues of the NCMS of Batroun
and to Dahej el Mokdad, Imad Lahoud and the rangers of the MoA assigned to the DFW-MoA.
This study could not have been completed without the support of the Lebanese fishermen, their
bravery and tough job in the sea. In particular, I wish to acknowledge the fishermen Toufic Assal from
Batroun and Nicholas Rahmé from Tyre for their vital technical advice.
Lastly, I wish to acknowledge the privilege to have worked with extremely knowledgeable
supervisors. I offer them my deep gratitude, to my supervisor Professor Gaby Khalaf and my co-
supervisor Dr. Marion Verdoit-Jarraya.
I would like to offer my deepest gratitude to the members of the jury who all gave me the honor and pleasure of being present during my thesis defense and their remarks were very beneficial to me. I am indebted to Université de Perpignan Via Domitia (UPVD), especially the director of the Centre de Formation et de Recherche sur les Environnements Méditerranéens (CEFREM), Wolfgang Ludwig for welcoming me during my thesis.

3

4
Table of contents
Table of contents .............................................................................................................. 4
Chapter 1 General Introduction ...................................................................................... 12
Overview ................................................................................................................................ 12
The Mediterranean Sea: Biodiversity, threats and fisheries ...................................................... 13
Geographical overview ..................................................................................................... 13
Biodiversity........................................................................................................................ 13
Threats .............................................................................................................................. 14
Fisheries ............................................................................................................................ 14
Demersal species: Status, fisheries and threats ........................................................................ 16
Worldwide overview ......................................................................................................... 16
Demersal species life history traits ................................................................................... 18
Mediterranean Demersal species ..................................................................................... 19
Mediterranean Demersal species fisheries and threats ................................................... 20
Various management tools for coastal ecosystems ......................................................... 20
Eastern Mediterranean Demersal species ........................................................................ 21
Lessepsian species and invasions............................................................................................. 23
Definition of non-indigenous species (NIS) ....................................................................... 23
Brief history of the ‘Erythrean’ invasion ........................................................................... 23
Description of the main arrivals of NIS in eastern Mediterranean .................................. 25
Ecological and economic impacts of invasions in general. ............................................... 28
Objectives of the study ........................................................................................................... 30
Chapter 2 Materials and Methods .................................................................................. 34
Characteristics of the study area ............................................................................................. 34
Data collection ....................................................................................................................... 36
Background ....................................................................................................................... 36
Sampling design ................................................................................................................ 36
Sampling gears .................................................................................................................. 39
Protocols for sampling activities ....................................................................................... 41
Biological indices and sexual maturity ..................................................................................... 43
Weight-length relationship ............................................................................................... 43
Condition factor ................................................................................................................ 43
Sexual maturity ................................................................................................................. 43

5
Stomach contents analysis ...................................................................................................... 47
Diet composition ............................................................................................................... 47
Feeding strategy ................................................................................................................ 48
Ageing fish and growth curves ................................................................................................ 49
Growth curves and growth parameters ........................................................................... 49
Data analysis .......................................................................................................................... 50
Catch per unit effort (CPUE) ............................................................................................. 50
Biodiversity indices ........................................................................................................... 50
Taxonomic diversity .......................................................................................................... 51
Statistical analyses and regressions ......................................................................................... 52
Statistics ............................................................................................................................ 52
Linear regressions ............................................................................................................. 53
Nonlinear regressions ....................................................................................................... 54
Logistic regressions ........................................................................................................... 54
Maps .................................................................................................................................. 54
Chapter 3 Fisheries sector in Lebanon: a context analysis ............................................... 58
Country profile ....................................................................................................................... 58
Socioeconomic Context ........................................................................................................... 59
Infrastructures: Transports ............................................................................................... 59
Infrastructures: Energy ..................................................................................................... 59
Population ......................................................................................................................... 60
Employment ...................................................................................................................... 61
Credit system .................................................................................................................... 61
Environmental Context ........................................................................................................... 62
Physical environment ........................................................................................................ 62
Biodiversity........................................................................................................................ 64
Protected areas ................................................................................................................. 66
Fisheries Sector ...................................................................................................................... 66
Lebanese Fisheries Overview ............................................................................................ 66
Fishing fleet, gears and grounds ....................................................................................... 67
Halieutic resources ............................................................................................................ 69
Marine Fish Catch Profile .................................................................................................. 69
Economic traits ................................................................................................................. 70
Fisheries management ...................................................................................................... 72
Threats .............................................................................................................................. 82

6
Chapter 4 ........................................................................................................................ 87
Part I: Analysis of structure and distribution of demersal species exploited by Lebanon’s
artisanal fisheries ........................................................................................................... 87
ABSTRACT .............................................................................................................................. 89
INTRODUCTION ...................................................................................................................... 90
MATERIALS AND METHODS .................................................................................................... 93
Study area ......................................................................................................................... 93
Sampling Design ................................................................................................................ 94
Protocols Set for Sampling Activities and Data Collection ............................................... 95
Sampling gears .................................................................................................................. 95
Sampling period ................................................................................................................ 97
Measures and biological parameters recorded after collection. ..................................... 97
Statistical analyses ............................................................................................................ 98
RESULTS ................................................................................................................................ 100
2012 survey ..................................................................................................................... 100
2013 survey ..................................................................................................................... 101
2014 survey ..................................................................................................................... 103
Deeper waters survey, i.e. beyond 150 meters depth ................................................... 105
Aggregated dataset ......................................................................................................... 106
Depth distribution ........................................................................................................... 112
DISCUSSION........................................................................................................................... 115
Sampling protocol ........................................................................................................... 115
Variation of abundance index ......................................................................................... 115
Spatial and depth variation ............................................................................................. 116
Biodiversity and Lessepsian species. .............................................................................. 116
ACKNOWLEDGEMENT ............................................................................................................ 117
Part II. Short Communication ......................................................................................... 118
Pattern of distribution and diversity of demersal assemblages in the eastern
Mediterranean Sea ........................................................................................................ 118
ABSTRACT ............................................................................................................................. 120
INTRODUCTION ..................................................................................................................... 121
MATERIALS AND METHODS ................................................................................................... 122
Statistical analyses .......................................................................................................... 122
RESULTS ................................................................................................................................ 124
DISCUSSION........................................................................................................................... 125
7
ACKNOWLEDGEMENT ............................................................................................................ 125
Chapter 5 Weight-length relationships .......................................................................... 128
Part I. Weight-length relationships of 3 demersal fish species from Lebanese marine
waters, eastern Mediterranean ...................................................................................... 128
ABSTRACT ............................................................................................................................. 130
INTRODUCTION ..................................................................................................................... 130
MATERIALS AND METHODS ................................................................................................... 131
RESULTS ................................................................................................................................ 132
DISCUSSION........................................................................................................................... 134
ACKNOWLEDGEMENTS .......................................................................................................... 134
Part II. Weight-length relationships of 27 demersal species from Lebanese marine waters,
eastern Mediterranean .................................................................................................... 136
ABSTRACT ............................................................................................................................. 137
INTRODUCTION ..................................................................................................................... 137
MATERIALS AND METHODS ................................................................................................... 138
RESULTS ................................................................................................................................ 139
DISCUSSION........................................................................................................................... 144
ACKNOWLEDGEMENTS .......................................................................................................... 145
Chapter 6 ..................................................................................................................... 148
Population biology of the Lessepsian migrant Sargocentron rubrum (Forsskål, 1775) along
Lebanon’s coast, eastern Mediterranean ....................................................................... 148
ABSTRACT ............................................................................................................................. 150
INTRODUCTION ..................................................................................................................... 151
MATERIALS AND METHODS ................................................................................................... 153
Sex determination ........................................................................................................... 154
Condition fish index ........................................................................................................ 154
Weight-Length Relationship ........................................................................................... 154
Ageing fish and growth curves ........................................................................................ 155
Stomach content analysis ............................................................................................... 156
Statistical analyses .......................................................................................................... 156
RESULTS ................................................................................................................................ 157
Morphometric measurements and depth distribution .................................................. 157
Weight-Length relationship (WLR) ................................................................................. 158
Sexual maturity and biological indices............................................................................ 159
Stomach content analysis ............................................................................................... 162

8
Age and growth ............................................................................................................... 167
DISCUSSION........................................................................................................................... 168
ACKNOWLEDGEMENTS .......................................................................................................... 172
Chapter 7 General discussion, conclusion and perspectives ........................................... 175
Adopting appropriate methodologies ............................................................................ 175
DEMERSAL SPECIES ................................................................................................................ 176
Presence and diversity .................................................................................................... 176
Lessepsian species .......................................................................................................... 178
Weight Length Relationships .......................................................................................... 180
Abundance index and spatio-temporal variations ......................................................... 181
Strategic management planning ..................................................................................... 182
Life history aspects and overexploitation ....................................................................... 183
BACKGROUND AND RECOMMENDATIONS.............................................................................. 185
CONCLUSION AND PERSPECTIVES ........................................................................................... 187
Sampling hard structures for the estimation of age data............................................... 187
Genetic analysis .............................................................................................................. 188
Stable isotopes ................................................................................................................ 188
Assess migratory species and Lessepsian species .......................................................... 188
Other issues .................................................................................................................... 189
List of figures ................................................................................................................. 190
List of tables .................................................................................................................. 195
References ..................................................................................................................... 199
ANNEXES ....................................................................................................................... 225
ANNEX 1. Communication to the 45th congress of the Italian Society of Marine Biology, May 9-23,
2014. ..................................................................................................................................... 226
ANNEX 2. First page of a 2014’s publication in the Journal of earth Science and Enginnering. ..... 229
ANNEX 3. Two communications to the ‘Watch Letter’ (CIHEAM), N°31, december 2014. ............ 230
ANNEX 4. First pages of the CANA book of 2014 and 2016. ....................................................... 243
ANNEX 5. First page of a 2014’s communication in the 20th International Scientific Conference New
Frontiers in Sciences ............................................................................................................... 247
ANNEX 6. First page of a 2017’s publication in the New Medit revue. ........................................ 248
ANNEX 7. First page of a 2017’s publication in the Journal of applied Ichtyology. ....................... 249
Résumé substantiel de la thèse en français .................................................................... 250
Abstract/Résumé ................................................................................................................... 277

9

10
Chapter 1
General Introduction


12
Chapter 1
General Introduction
Overview
The Mediterranean Sea is the crossroads of three continents, the waterway that enables an active exchange among different cultures and populations; and, not surprisingly, it is the area where philosophy, literature, and sciences have flourished for thousands of years. Today the Mediterranean is a sea under siege suffering on the one hand mismanagement and abuses putting coastal ecosystems at risk of ecological collapse and on the other social and political crises such as war, poverty, migration and political strife that are further negatively affecting the status of its natural resources.
The Mediterranean basin is the largest and deepest enclosed sea on Earth, surrounded by 22 countries and home to around 480 million people (European Environment Agency, 2015). Approximately one-third of the Mediterranean population is concentrated along its coastal stretch where also Countries’ main economic and social activities are established. Environmental risks associated with such activities are having a negative impact on the marine ecosystem (UNEP/MAP-Plan Bleu, 2009), also affecting people’s quality of life. In addition, the introduction of non-indigenous species (NIS) and different human practices leading to the rapid and uncontrolled modification of the Earth’s climate as well as the unsustainable exploitation of natural resources (such as the overfishing) are deeply altering the Mediterranean marine biodiversity.
However, the Mediterranean Sea is one of the major reservoirs of marine biodiversity, which is estimated at 17,000 species (Coll, et al., 2010). Among these, some of the world’s most endangered and “emblematic” species as well as sensitive habitats can be found (Zenetos, et al., 2002).
Bearing all this in mind, marine research is increasingly becoming key to strengthening the capabilities of countries for socio-economic progress while contributing to the wellbeing and sustainable development of human communities. The outstanding expansion of knowledge of the marine environment as a whole should not lead us to overlook the cost, scale, and complexity of marine studies. They demand clear goals, domestic support, international cooperation, and integrated plans. In this regard, the Mediterranean region has been a pioneer in the advancement of collaboration towards common management of fisheries resources (GFCM & FAO, 2016).
The present thesis originates from the activities implemented in the framework of two projects financed by the Italian Cooperation and steered by the CIHEAM-Bari and the Lebanese National Council for Scientific Research (CNRS-L). These projects foresaw the collaboration of Italian, Lebanese and international organizations and involved scientists and students from Italy, Lebanon and France. Aiming at establishing monitoring programmes while promoting sustainable development of the Lebanese coastal areas, aforementioned projects produced a relevant amount of raw data that needed to be elaborated for future effective marine spatial planning, identifying spawning grounds, establishing fishing restricted areas, discovering new fishing grounds, and identifying the feasibility of alternative fishing gears.
It is our hope that this work will elevate knowledge and understanding of Lebanese fisheries, contributing to ensure future sustainable exploitation of fisheries resources.

13
The Mediterranean Sea: Biodiversity, threats and fisheries
Geographical overview The Mediterranean (from Latin, in the midst of lands, known in Modern Arabic as المتوسط األبيض البحر [al-
Baḥr al-Abyaḍ al-Mutawassiṭ] "the White Middle Sea") is a semi-closed sea situated at the crossroads of
Africa, Europe, and Asia. It occupies an area of approximately 2,510,000 km2 and its greatest depth is about
4,400 m, off Cape Matapan, Greece. It connects with the Atlantic Ocean through the Strait of Gibraltar;
with the Black Sea through the Dardanelles, the Sea of Marmara, and the Bosporus; and with the Red Sea
through the man-made Suez Canal. In the Strait of Sicily, a 400 meters depth ridge separates Sicily and
Tunisia, dividing the Mediterranean Sea into the western and eastern sub-regions.
It is a concentration basin, with higher evaporation in its eastern half. Water loss through evaporation is
greater than the inputs from rain and river runoff. Hence, a resulting gradient pushes about 1 700 km3
/year cooler and low-salinity Atlantic waters inside the Mediterranean basin (Bas Peired, 2005). Moving
eastward, waters become warm and saltier since they sink down in the Levantine Sea. Heavy water masses
run back westward exiting through the Strait of Gibraltar. The Mediterranean Sea water masses are
stratified in summer, but the temperature of the water masses below 400 m is very stable at 13 ± 0.3 °C
throughout the year. The Mediterranean is globally considered as an oligotrophic sea (Margalef, 1985), and
the gradual decline in nutrient content as the water moves from west to east leads to an overall reduction
in productivity.
Mediterranean climate is characterized by hot, dry summers and cool, humid winters. Sea surface water
temperatures show high seasonality and significant gradients along the axes west-east and north-south
(Hopkins, 1985). The continental shelves are generally narrow. The geological history, biogeography,
ecology, and human history have contributed to the Mediterranean's high cultural and biological diversity
(Danovaro & Pusceddu, 2007; Sundseth, 2009).
Biodiversity The Mediterranean Sea is considered as a hot spot of biodiversity (Myers, et al., 2000). In 2000, Bianchi &
Morri estimated 4 to 18 percent of world’s marine species occurring in it (more than 8500 macroscopic
marine species) whereas Coll et al. (2010) in 2010 listed approximately 17,000 living species. The recent
Mediterranean marine biota is primarily of Atlantic origin but the wide range of historic climate and
hydrology have contributed to the co-occurrence and survival of both temperate and subtropical organisms
(Sarà, 1985). A relatively high number of endemism occur in the Mediterranean (Boudouresque, 2004;
Cuttelod, et al., 2008); this is even more evident in islands where species have evolved to survive in very
specific habitats (Blondel & Aronson, 1999). For the past two centuries, the biodiversity has been altering at
an alarmingly high rate due to human-mediated arrival of new species, with an apparent acceleration in the
rate of recorded invasions in the last decades (Rilov & Galil, 2009).
There are several unique and endangered habitats, including the seagrass meadows of the endemic
Posidonia oceanica, vermetid reefs built by the endemic gastropod and deep-sea and pelagic habitats that
support unique species and ecosystems. Only four elasmobranchs species (all batoids) are Mediterranean
endemics and nine species of marine mammals are encountered regularly in the Mediterranean (Coll, et al.,
2010). Three species of sea turtles dwell in the Mediterranean: the green turtle and the loggerhead turtle
(Chelonia mydas and Caretta caretta) and the leatherback turtle Dermochelys coriacea. However, there is
no evidence of nesting of the last one in the basin. Mediterranean is also home to the Mediterranean Monk

14
Seal Monachus monachus. The Mediterranean’s importance is not limited to the sea: richness or
uniqueness of its resident terrestrial fauna and flora goes hand in hand with millions of migratory birds
using Mediterranean wetlands and other habitats as stopover or breeding sites (Cuttelod, et al., 2008). A
total of 89 species of Chondrichthyes were recorded in the Mediterranean Sea (49 sharks, 38 rays and 2
Holocephali species) (Meléndez, et al., 2017), 57 of which were assessed in the IUCN Red List of Threatened
Species (IUCN, 2017).
Threats The Mediterranean region has been inhabited for millennia by humans that shaped – along with the effects
of natural events – ecosystems and biodiversity (Bas, 2009; Hsü, et al., 1977). It is currently home to some
480 million human inhabitants from 22 countries and a wide variety of cultures. The Mediterranean region
has been identified as one of the main climate change hotspots (Giorgi, 2006) due to water scarcity,
concentration of economic activities in coastal areas, earthquakes and coastal erosion. As Mediterranean
countries are already facing important issues of water stress and extreme climate events such as floods and
droughts, climate change will most probably exacerbate these problems, resulting in significant human and
economic losses (EEA - UNEP/MAP, 2104). In addition to that, the region is affected by relevant economic
disparities, rapid demographic changes and associated urban sprawl resulting in an increased pressure on
the environment and reduced security of populations (in terms of food, health, etc.). A global mean of sea-
level rise of around 3 mm per year over the last two decades is also of concern especially in the Southern
shores of the Mediterranean (IPCC, 2013).
The coast is under the influence of competing interests which have caused a marked deterioration in the
coastal water quality, ecological sites and natural resources. Land-based activities are modifying natural
habitats due to runoff of sediments, nutrients, toxins and pollutants, and sometime even altering the flow
of currents and tides. Changes in offshore ecosystems include the extraction of mineral resources, pollution
from vessel traffic, and the construction of infrastructure for oil development or offshore wind farms
(Halpern, et al., 2008). Not differently from other human activities, aquaculture and capture fisheries have
a relevant impact on coastal ecosystems. Intensive fish farms can release enormous quantities of organic
waste and contaminated water into the natural environment and spread parasites and diseases.
In the Mediterranean, many commercially exploited stocks are still not properly assessed. Among those
assessed, 91 percent of the stocks were being overfished in 2014 (European Commission, 2014). More in
specific, the overexploitation of large predators, with change in biomass and composition, is possibly having
a great impact on the stability of the marine ecosystem than removing species farther down the food chain
(Larkin, 1979; Watson & Pauly, 2001). Bycatch along with the unreported discard of marine resources aernd
incidental catch of vulnerable species can lead to the loss of biological resources along resulting in relevant
biological and ecological impacts (Hall, et al., 2000; FAO, 2016).
Fisheries Communities of fishers have existed throughout the Mediterranean basin since time immemorial. There is
abundant mention of this phenomenon of civilization in historic, geographic and ethnographic literature
(Féral, 2004; Voultsiadou & Vafidis, 2007). Nowadays, industrial, semi-industrial and small-scale fisheries
coexist in the region, using a large variety of fishing gear. Mediterranean fisheries generally exploit a large
array of benthic and pelagic stocks of fish, as well as molluscs and crustaceans. Due to the semi-enclosed
configuration of the Mediterranean basin, many stocks are commonly shared among fleets from different
countries (Figure 1).

15
According to the most recent data submitted to the GFCM, the fishing fleet in operation in the
Mediterranean consists of about 81 600 vessels (GFCM & FAO, 2016). This number should be considered an
underestimate of the real size of the fleet, given the lack of data on some parts of the fleet (especially
small-scale fleets) from some Mediterranean and Black Sea riparian States or non-State actors (FAO, 2015).
Mediterranean fish catches represent a small part of total catches worldwide (a bit more than 1 percent of
total catches). Fishing in the Mediterranean tends to be concentrated in inshore areas, with some boats
fishing on the continental slope for prized species such as the red shrimp, the deep-water rose shrimp, and
hake (UNEP/MAP-Plan Bleu, 2009). Production currently ranges between 1,500,000 t to 1,700,000 t per
year, more than 85 percent are attributable to six countries, i.e. Italy, Turkey, Greece, Spain, Tunisia and
Algeria (GFCM & FAO, 2016).
The artisanal fishing sector provides direct employment to tens of millions of people, and indirect
employment to tens of millions more (UNEP, 2005). Artisanal fishing comprises 90 percent of all fishing jobs
worldwide, approximately 45 percent of the world’s fisheries, and nearly a quarter of the world catch
(UNEP, 2004). They provide critical income and edible protein to hundreds of millions across the globe. In
the Mediterranean Sea, artisanal fisheries represent roughly 86 percent of the approximately 42 000 fishing
boats exploiting coastal ad offshore stocks (Maynou, et al., 2013) and 60 percent of the 250 000 people
employed in the fishing industry (GFCM & FAO, 2016). Foremost characteristics of the sector are the high
diversification of gears and techniques, the multitude of species exploited, the changing patterns of gears
use in time and space and the varying degree of fishermen’s dependence on fishing (Tzanatos, et al., 2006).
Figure 1. The Mediterranean Sea and Black Sea make up together FAO Fishing Area 37. The GFCM, that has the responsibility and authority to oversee the full process of fisheries management, undertake scientific evaluations and take decisions to ensure sustainability of fisheries resources in its area of application, identified five subregions (Western Mediterranean Sea, Ionian Sea, Adriatic Sea, Eastern Mediterranean Sea and Black Sea). On basis of the new GFCM agreement (www.fao.org/gfcm/background/legal-framework) that refers to the “subregional approach to fisheries management and aquaculture development in order to better address the specificities of the Mediterranean and the Black Sea”, the concept of subregions has been introduced during the revision process of the fishery data collection framework of GFCM and then reflected into the DCRF document. Subregions are furtherly divided in Geographical Subareas (GSAs) for a total of 30 GSAs in the Mediterranean and Black Sea region. Modified from (GFCM, 2016).

16
Demersal species: Status, fisheries and threats
Worldwide overview Fisheries and aquaculture remain important sources of food, nutrition, income and livelihoods for hundreds
of millions of people around the world. World per capita fish supply reached a new record high of 20 kg in
2014, thanks to vigorous growth in aquaculture, which now provides half of all fish for human
consumption, and to a slight improvement in the state of certain fish stocks due to improved fisheries
management (FAO, 2016). Moreover, fish continues to be one of the most-traded food commodities
worldwide with more than half of fish exports by value originating in developing countries.
With capture fishery production relatively static since the late 1980s, aquaculture has been responsible for
the impressive growth in the supply of fish for human consumption (Figure 2). Whereas aquaculture
provided only 7 percent of fish for human consumption in 1974, this share had increased to 26 percent in
1994 and 39 percent in 2004. China has played a major role in this growth as it represents more than 60
percent of world aquaculture production (FAO, 2016).
Figure 2. World capture fisheries and aquaculture production between 1950 and 2014. From (FAO, 2016).
Demersal species are defined as those species living at or near the bottom of the water column, such as
cod, haddock, hakes, Norway lobster and shrimps (i.e. Merrett & Haedrich, 1997; European Commission,
Directorate-General for Maritime Affairs and Fisheries, 2016). This means that they live and feed on or near
the bottom occupying the sea floors consisting of mud, sand, gravel or rocks. The split into demersal and
pelagic taxa is obviously simplistic, however, in marine waters, demersal species are those usually found on
or near the continental shelf, and on or near the continental slope or along the continental rise. The word
demersal comes from the Latin demergere, which means “to sink”.
Globally, pelagic species comprise the largest proportion of the global marine catches. In 1950, they
contributed for the 41 percent of total marine fisheries production while demersal species (i.e. flounders,
halibuts, soles, cods, hakes, haddocks and other miscellaneous demersals) for 35 percent. The remaining 24
percent of the total catch came from other species - which also includes demersal species – such as
shrimps, prawns, crabs, clams, mussels, and marine fishes not identified. While the total marine fish
landings increased with the development of the fishing industry, landings of demersal species reached - and

17
in some cases exceeded - the limit of potential production in the early 1970s. Subsequently, catches of
demersal species levelled off below 20 million tonnes (Figure 3) (FAO, 2011).
Figure 3. Catch over time by three groups, i.e. pelagic, demersal and other species between 1950 and 2009. From (FAO, 2011).
Most abundant demersal species ordered in terms of average annual landings from 1950 to 2009 were
Alaska pollock, Atlantic cod, largehead hairtail, blue whiting, sandeels, haddock, saithe, Cape hakes, Atlantic
redfishes, and flatfishes. These ten species produced 37 percent of the total demersal landings in 2009 with
a common pattern of decreasing trend in catch. Most of these species had a peak catch in the 1960s or
1970s. Stocks condition vary with country or region. While the Western and Eastern Central Atlantic (FAO
Areas 31 and 34) had the highest proportion of overfished stocks (about 54 percent in 2009), the lowest
proportion of overfished stocks was about 10 percent, seen in the Eastern Central Pacific (Area 77),
Northeast Pacific (Area 67) and Southwest Pacific (Area 81). The Southeast (Area47), Southwest Atlantic
(Area41), and Mediterranean and Black Sea (Area 37) had 50percent of fish stock overfished (FAO, 2011).
In terms of distribution, the variation of demersal species by depth appears to be dominant followed by a
secondary latitudinal variation and a clustering of sites related to both depth and latitude (McClatchie, et
al., 1997; Bergstad, et al., 2008; Mahon & Smith, 1989; Magnussen, 2002). There are similar bathymetric
and latitudinal trends in overall fish biomass and abundance. ECO expedition showed also a relationship
among surface chlorophyll concentration, zooplankton abundance, and meso- and bathypelagic nekton
density (Sutton, et al., 2008; Gaard, et al., 2008; Opdal, et al., 2008). Spatial patterns of demersal fish
species diversity and the associated causal factors are less clear and vary greatly from one study to the
other (Gaertner, et al., 2005).
Annual per capita consumption of demersal species has stabilized at about 2.9 kg. Demersal fish remain
among the main species favoured by consumers in Northern Europe and in North America (annual per
capita consumption of 9.2 and 4.3 kg, respectively, in 2013). Cephalopods are mainly preferred by
Mediterranean and East Asian countries (FAO, 2016).
In European non-Mediterranean waters, such as the North Sea and adjacent areas a wide range of different
fish and shellfish species (including round fish, flat fish, shellfish, crabs, shrimps, lobsters, and skates and

18
rays) are exploited, among them many demersal species. To catch demersal species, vessels use a variety of
techniques and fishing gear, the most important being demersal trawls and seines, as well as beam trawls.
Many of these fisheries do not only catch specimens of one single targeted species, but simultaneously
catch several species present in the fished area, in varying proportions. Hence, such fisheries are called
'mixed fisheries'. North Sea demersal fishing represents over 70 percent of the sector in this area, involving
several thousand of vessels. Demersal catches were worth more than €850 million in 2012, with the highest
total value of landings by species for sole, followed by plaice, Norway lobster, cod, saithe, haddock, turbot,
anglerfish, whiting and lemon sole (Weissenberger, 2016).
Demersal species life history traits Living species exhibit a great diversity of patterns of life-history features that correspond to a determined
set of population consequences which would ultimately result from adherence to the specified life history.
The birth rate, the death rate, the age composition of the population and its ability to grow may be related
innumerous ways to the ability of the species to survive in a changed physical environment or in
competition with other species. Therefore, the energy available for distribution through trophic levels and
driven by natural selection will be influential in shaping life-history patterns to correspond to efficient
populations (Cole, 1954).
Studies on life history parameters such as age and growth, along with basic information on distribution,
abundance, movements, feeding, reproduction and genetics, are essential for scientists to understand and
predict how populations will evolve and how they will respond to different stimuli.
Due to the broad definition of the term “demersal”, different life history traits are shown in this group.
Generally, demersal species show relatively restricted adult movements. Their pelagic juvenile stages
represent their most important dispersal mechanism (Cowen, et al., 2006) although genetic evidences show
that pelagic stages often fail to fully achieve their dispersal potential (Jin-Xian, et al., 2007).
Early-life-histories vary greatly among demersal species. Some species may spawn benthic eggs from which
pelagic larvae hatch while others may display life cycles where both the eggs and the larvae are pelagic. In
other cases, peculiar forms of parental care evolved (Riginos & Victor, 2001). Pelagic larval duration as well
as the spatial distribution of pelagic stages also shows great variability among marine species. In the
Mediterraenan, the Common two-banded bream (Diplodus vulgaris), the Striped red mullet (Mullus
surmuletus), and the Comber (Serranus cabrilla) have an extended pelagic larval duration. An intermediate
condition is shown by the Saddled bream (Oblada melanura), which spawns pelagic eggs and has offshore
larvae but with a shorter pelagic duration. The Blackfaced blenny (Tripterygion delaisi) and the Cardinal fish
(Apogon imberbis) are species with low potential for dispersal, producing benthic or mouth-brooded eggs,
inshore larvae, and having shorter pelagic larval duration. The Peacock wrasse (Symphodus tinca) releases
benthic eggs (Galarzaa, et al., 2009).
Understandably, direct withdrawal of fish individuals due to fishing activities may induce changes in the
demographic characteristics of populations, including genetic variations (Rochet, 1998). Several Authors,
such as Pauly (1979), Gulland & Garcia (1984), Sharp & Csirke (1984), Greenstreet & Hall (1996), Sainsbury,
et al (1997), Haedrich & Barnes (1997), Bianchi, et al. (2000) documented changes in the structure of
demersal fish communities. However, the understanding of how fishing activities affect demersal fish
communities is still unclear. There is the evidence that the size structure of demersal fish communities is
affected by fishing with an overall trend of reduction in large fish and relative increase in small fish (Bianchi,

19
et al., 2000). Data from more than 230 populations reveal a median reduction of 83 percent in breeding
population size from known historic levels. Few populations recover rapidly; most exhibit little or no change
in abundance up to 15 years after a collapse (Hutchings & Reynolds, 2004). Reductions in fishing pressure,
although clearly necessary for population recovery, are often insufficient. Unprecedented reductions in
abundance and surprisingly low rates of recovery draw attention to scientists' limited understanding of how
fish behavior, habitat, ecology, and evolution affect population growth at low abundance.
Mediterranean Demersal species In terms of economic relevance, the most important demersal species are European hake (Merluccius
merluccius), red mullets (Mullus spp.), blue whiting (Micromesistius poutassou), whiting (Merlangius
merlangus), anglerfishes (Lophius spp.), pandoras (Pagellus spp.), bogue (Boops boops), picarels (Spicara
spp.) striped venus (Chamelea gallina), octopus (Octopus spp.), cuttlefish (Sepia officinalis), red shrimps
(Aristeus antennatus and Aristaeomorpha foliacea), Norway lobster (Nephrops norvegicus) and deep-water
rose shrimp (Parapenaeus longirostris). These species represent about 30 percent of total reported catches
in the Mediterranean and Black Sea. In this area, total catches showed a steady increase from about 0.7
million tonnes in 1950 to about 2 million tonnes in the period 1982–88. They then suddenly declined to
about 1.3 million tonnes following the collapse of the Black Sea fishery for sprat and anchovy, and have
since recovered slightly to about 1.5 million tonnes. Meanwhile, declared catches of most demersal and
semi-pelagic fish and crustaceans increased steadily until the period between the 1980s and the end of the
1990s. This has been followed by declines in several species in the last few years (FAO, 2011).
Cephalopods are important catches from trawl fisheries and there are also directed fisheries in some
regions especially with smaller vessels (Bas Peired, 2005). The onset of deep-water trawling off the slope
areas of the Mediterranean in the mid- 1980s appears to explain the sharp rise in catches of deep-water
rose shrimp and aristaeidae shrimp (FAO, 2011). The decrease in catches of rose shrimp observed in the
mid-1990s is most probably the result of overexploitation of the main fishing grounds (GFCM, 2011). Its
recovery in the last three years is probably associated with a period of good recruitment. The declared
catches of Norway lobster follow a similar – still less sharp - pattern.
Also in the Mediterranean, depth plays the main role in the group differentiation, indicating the existence
of two quite distinct bathyal faunal assemblages, which are separated by the 400−500 m
bathymetric zone, e.g. Pérès & Picard (1964); Biagi, et al. (1989); Mura & Cau (1994); Stefanescu, et al.
(1994); Abella & Serena (1995); D'Onghia, et al. (1998); D'Onghia, et al. (2003). Common demersal shelf
species (Mullus barbatus, Pagellus acarne, Loligo vulgaris, etc.) and slope species (Merluccius merluccius,
Phycis blennoides, Parapenaeus longirostris, etc.) perform ontogenetic migration along the depth gradient
(Colloca, et al., 2003). They have their nursery grounds (Morfin, 2013), respectively, on the coastal shelf and
shallow slope (Ardizzone & Corsi, 1997), contributing this way to their increased dominance in these
regions. Morfin et al. (2016) found that adults were generally more densely concentrated than juveniles
and occupied areas included in the distribution of juveniles.
According to Bradai, et al. (2012), the Mediterranean is house to a total of 86 species of elasmobranchs, 49
shark species from 17 families and 37 batoids species from 9 families. Only 4 batoid species (Leucoraja
melitensis, Raja polystigma, R. radula and Mobula mobular) could be considered endemic (Serena, 2005)
with Leucoraja melitensis considered endemic threatened (Dulvy, et al., 2014). Chondrichthyes, by nature
of their K-selected life-history strategies and high position in trophic food webs, are more likely to be

20
affected by intense fishing activity than most teleosts. There is sufficient evidence from the history of
fisheries around the world, both targeting these fishes and taking them as by-catch, of major declines in
population size (Stevens, et al., 2000).
Mediterranean Demersal species fisheries and threats Mediterranean fisheries are dominated by small-scale vessels, dispersed across a large number of landing
places in most countries (FAO, 2011). A characteristic of the Mediterranean fisheries is the capability to
exploit a variety of demersal species while generally lacking large monospecific stocks. As a result,
Mediterranean fisheries have developed a multitude of métiers and scales of investments. Production is
essentially concentrated on the continental shelf and capture fishing on the coasts. Yearly volumes are
limited (1.5 to 1.7 million tons/year), representing less than 1 percent of global catches (UNEP/MAP-Plan
Bleu, 2009). There is serious cause for concern as regards the status of economically and commercially
important species (hake, red mullet, common prawn, sole, sardine and tuna), victims of unsustainable
overexploitation.
The sustainability of Mediterranean fisheries is also dramatically affected by the effects of increased
pollution from human coastal activities, habitat degradation, the introduction of non-indigenous species
(NIS), and the impacts of climate-driven changes. Aquaculture has also undergone significant growth
(seawater fish farming for sea bass, sea bream, and « fattening up » of tuna) with a two-folded result: on
the one hand an increase of production with a reduced impact in terms of fishing effort, on the other this
produced a degradation of the quality of the marine environment and habitats.
Up to 85 percent of stocks for which a validated assessment exist are fished outside biologically sustainable
limits. European hake stocks show the highest fishing pressure, with a fishing mortality rate that is an
average of 5 times higher than the target while only a few stocks of demersal species, such as whiting,
some shrimp species, picarel and red mullet, are estimated to be fished at or below the reference point for
fishing mortality (FAO, 2016).
Introductions of non-indigenous species (NIS) have caused major changes, particularly in the eastern
Mediterranean where a growing number of Indo-pacific species are settling breeding populations. Some of
these species have a commercial relevance, however others are negatively affecting fishing economy as
well as marine environment. The silver-cheeked toadfish (also known as puffer fish) Lagocephalus
sceleratus is wide spreading over eastern Mediterranean waters without natural competitors, creating
major problems to the fisheries in the region. It is regarded to be among the most destructive NIS in the
Mediterranean Sea with a significant impact on the surrounding ecosystem and on the fisheries sector
(Zenetos, et al., 2005; Streftaris & Zenetos, 2006; Ozturk, 2011). It is capable of ripping and damaging
fishing nets lines and long lines. L. sceleratus is considered to be also a serious hazard to consumers since it
contains a strong paralytic marine toxin called TTX (tetrodotoxin), which can be lethal to humans (Sabrah,
et al., 2006; Ashkar, et al., 2008; Nader, et al., 2012).
Various management tools for coastal ecosystems Mediterranean fisheries policies have been developed in order to adjust the fishing effort in relation to the
availability of fishery resources and to evaluate the fishing capacity of national fleets. Because of the wide
variety of species characterizing Mediterranean fisheries, fishery management in the Mediterranean is not
based on catch control via TACs and quotas. With few exceptions (such as the bluefin tuna which is
currently subject to a quota system throughout the Mediterranean), regulation of total fishing effort

21
through limited licenses and technical measures such as time and area closures, gear limitations and limited
landed sizes are the pillars of fisheries regulation (Cacaud, 2005). Most countries have also introduced
within certain fleet segments a limitation on the number of licenses issued.
In the Mediterranean, the overall management of all fisheries is done within the mandate of the General
Fisheries Commission for the Mediterranean (GFCM). European Member States’ fishing activities are
regulated by the Common Fisheries Policy of the European Union (EU-CFP) while non-EU countries define
their own fisheries management measures, generally ensuring consistency with GFCM regulations (GFCM &
FAO, 2016). Principal management challenges for Mediterranean fisheries are considered the fight against
illegal, unreported and unregulated (IUU) fishing, the implementation of management plans for the
sustainable exploitation of all fish stocks, and measures to reduce bycatch, discards and incidental catch of
vulnerable species.
To date, a total of 16 management and conservation measures have been adopted by the GFCM to ensure
the conservation and sustainable exploitation of living marine resources, while safeguarding habitats and
vulnerable species from the impact of fishing activities. In general, these binding decisions include: 1)
spatial management measures; 2) mitigation measures for the incidental catch of vulnerable species; and 3)
other technical conservation measures. Four areas restricted to fisheries activities have been established
covering a total area of 17 678 km2, which represents approximately 0.7 percent of the Mediterranean
Sea’s surface. 58 percent of Mediterranean and Black Sea (1 731 097 km2) deep waters and seafloors, i.e.
below 1000 m depth, are also protected. Moreover, recommendations have been adopted to mitigate the
incidental catch of marine mammals, seabirds, sea turtles and sharks and to improve monitoring and data
collection (GFCM & FAO, 2016).
An ecosystem-based approach to fisheries management (Pikitch, et al., 2004) seems particularly useful for
the Mediterranean and can be cost-effective by addressing environmental and economic considerations,
and tackling cross-sectoral problems. A mix of instruments and integrated approaches have been
encouraged to foster societal changes as well as promoting technical progress and economic development.
The need for cooperation and coordination amongst all the countries bordering the Mediterranean has
long been recognised. This has resulted in almost 40 years of international efforts to protect this fragile and
vulnerable ecosystem: the United Nation Environment Protection - Mediterranean Action Plan (UNEP-
MAP), the Barcelona Convention for the Protection of the Marine Environment and the Coastal Region of
the Mediterranean and its Protocols; and the Euro-Mediterranean Partnership (EUROMED). EUROMED is
also referred to as the Barcelona Process and was re-launched in 2008 as the Union for the Mediterranean
(UfM). In 2005, the Euro-Mediterranean partners committed themselves to substantially reduce pollution
in the Mediterranean region by 2020. This became known as the 'Horizon 2020 Initiative' endorsed in Cairo
in 2006 (European Environment Agency, 2015).
Key priorities for the sector include the need for strong political commitment, intergovernmental
cooperation and the provision of technical assistance to riparian States. Essential prerequisites are a
consolidated knowledge base, improved data collection and analysis and the development of management
and co-management mechanisms that are integrated with environmental objectives, including marine
protected areas (MPAs).
Eastern Mediterranean Demersal species In the Mediterranean, species richness displays a gradient from west to east, with the Western
Mediterranean having the highest values of species richness, likely owing to the influx of Atlantic species
and the wide range of physicochemical conditions (Coll, et al., 2010). The Levantine Basin and southeastern

22
side have in general the lowest species richness, which is due to the unfavorable conditions prevailing in
the area, such as high salinity (Por & Dimentman, 2006) and a condition of ultraoligotrophy (eastern
Mediterranean is considered as one of the most oligotrophic basins all over the world) (Azov, 1991).
However, a lack of data in several eastern and southern regions of the Mediterranean basin may have
strongly influenced results and considerations on spatial patterns.
The Levantine basin has been affected by two major human endeavours that influenced its ecosystem: first,
the construction of the Aswan High Dam resulted in the cessation of fluvial sedimentation and nutrients to
the Mediterranean, leading to a sharp decrease in small pelagics’ populations and subsequent fall-off of 90
percent of the Egyptian purse seine fishing industry (Azov, 1991; Golani, 1998). Secondly, the cut of the
Suez Canal, completed in 1869, that connected two water bodies with different abiotic characteristics and
distinct peculiar biotas. The number of fish species migrating to the Mediterranean, known as Lessepsian
migrants (Por, 1971), increased steadily in the decades following the 1920s but accelerated dramatically
after the year 2000, reaching 101 species in 2014 (Arndt & Schembri, 2015). Hundreds of other taxa (Galil,
2009; Zenetos, et al., 2012) stepped in the Mediterranean at the same time, giving rise to one of the
greatest biogeographic convolutions ever witnessed by the contemporary globe (Por, 2010).
Currently, Lessepsian fish species constitute a large proportion of commercial captures (Goren & Galil,
2005; Carpentieri, et al., 2009; Edelist, et al., 2011), leading many native fishes to be displaced by their
exotic counterparts (Galil, 2007). However, according to Golani (2010), no Mediterranean species is known
to have disappeared since the opening of the Suez Canal. It is emblematic the case of of Sarpa salpa,
indigenous Mediterranean fish, replaced by the NIS Siganus rivulatus along the Lebanese coastal waters
(Bariche, et al., 2004). Similar behaviours have been plausibly observed in the competition between Saurida
lessepsianus and Synodus saurus; Upeneus moluccensis and Mullus barbatus; Callionymus filamentosus and
C. pusillus (Fanelli, et al., 2015).
Summing up, demersal resources of the eastern Mediterranean are a mixture of indigenous and non-
indigenous species mainly of Lessepsian origins. Assemblages composition is mainly driven by depth and
easternmost sectors are witnessing deadly competitions whereby NIS are competing with native species by
occupying similar ecological niches (Edelist, et al., 2013). The overall trophic space is widening out under
the increasing redundancy of the novel community in a nutrient-deprived ecosystem. Consequently,
eastern Mediterranean demersal communities are far from being in a steady state (Fanelli, et al., 2015).

23
Lessepsian species and invasions
Definition of non-indigenous species (NIS) According to Zenetos et al. (2012) alien, non-indigenous, exotic, non-native or allochthones species are
defined by their presence in the wild, through introduction outside their natural range and beyond their
natural dispersal potential. The creation of canals bridges natural barriers to the distribution of previously
separated biomes. The diffusion of aquatic organisms in different geographical areas results in significant
changes to the newly colonized ecosystems and their species assemblages (Gollasch, et al., 2006; Nentwig,
2007). The body of water that is now the Mediterranean Sea went through dramatic changes in its biota. It
is a vestige of the Tethys Ocean, meaning that in prehistoric times it was inhabited by tropical biota.
Approximately 10 million years ago, after being cut off from the rest of the Indo-Pacific, it had slowly lost its
tropical characteristics. It eventually became a warm-temperate to subtropical body of water. Changes in
its environmental conditions as well as those to its biota, occurred over timescales of thousands to millions
of years (Rilov & Galil, 2009).
For the past two centuries, due to human-mediated arrival of new species, the Mediterranean biodiversity
has altered at an alarmingly high rate, with an apparent acceleration in the rate of recorded invasions over
the last fifty years (Galil, et al, 2017). This alteration of the biodiversity is due to the manmade connection
of two semi-closed seas with a high degree of endemism, the Mediterranean and the Red Sea (Quignard &
Tomasini, 2000). Invasions interact with factors altering the integrity of marine ecosystems as well as socio-
economic value chains. According to Mooney, et al. (2005) and Rilov & Galil (2009), they can cause loss of
native biodiversity, habitat destruction, pollution and economic damages.
In marine systems, the dominant invasion pathway is commercial shipping. Species can be transported on
the hulls of vessels, in cargo, or in ballast tanks. Some are also found associated with commercially
important species, such as oysters and abalone, whose shells serve as habitats for invertebrates and algae
(Culver & Kuris, 2000; Wasson, et al., 2001). When two points are connected by a given transport pathway,
propagules can provide the initial conditions required for the population diffusion and, eventually,
establishment in new areas.
Direct transport of species from the Red Sea through the Suez Canal is the main vector/corridor for
introductions into the Mediterranean Sea while shipping is of second in importance (Galil & Zenetos, 2002;
Galil, 2000). This process was named by Por (1978) “Lessepsian migration” while Galil & Zenetos (2002)
reintroduced the original term, ‘Erythrean’ invasion.
Brief history of the ‘Erythrean’ invasion In the second half of XIX century, Egypt hosted two remarkable works of civil engineering, which were full
of consequences for the Mediterranean in the coming decades:
The construction of the Aswan Low Dam (initiated in 1899) to control the flooding of the Nile and
provide water for irrigation. At that time, nothing of its scale had ever been attempted and, on
completion, it was the largest masonry dam in the world. In 1970, Egypt completed the
construction of the High Dam just a few kilometers downstream from the old one; and
The construction of the Suez Canal started in 1859. This artificial canal connecting the
Mediterranean and the Red Sea was opened ten years later and rapidly became an essential
shortcut to navigate from Europe to Asia without circumnavigating the African continent.

24
The history of navigating through the Suez Isthmus starts roughly 2,500 years earlier, in the time of the
Pharaoh Necho II who, according to the Greek historian Herodotus (Herodotus, 5th Cent. BC), tried to
connect the Red Sea to the Nile River and from there to the Mediterranean Sea. The pharaoh reportedly
never completed the project of the “Pharaoh Canal,” whereas his successor Darius the Great, did. Later,
ancient scribes claimed that Darius also failed in completing the work, as he feared submerging the Nile
Valley with saline Red Sea waters.
The difference in level between the Mediterranean and the Red Sea had been debated, studied, and
measured for 25 centuries. Still Napoleon’s cartographers and engineers erroneously concluded that the
Red Sea level should have been higher than the Mediterranean one, misleading — as also happened in
earlier epochs — planners and designers. Napoleon was the last to surrender to this misconception at the
end of the eighteenth century. By the 1840s, a consensus was reached that there existed no significant
difference in altitude between the two seas. This revelation would have significantly reduced construction
costs for a north-south canal, cutting the Suez Isthmus.
In 1854 and 1856, Ferdinand de Lesseps, a French diplomat who also investigated geological and
hydrological features of the Suez Isthmus, obtained concessions from Said Pasha1, authorizing him to form
a company for excavating a canal open to ships of all nations. After ten years of excavations, and the
involvement of 1.5 million laborers, the first steam made it through the whole length of the canal in the
month of September 1869, carrying on-board De Lesseps.
The vast scientific importance of the eventual faunal interchange between the two seas was soon realized
and few baseline studies were executed. We have to wait until 1917 when Jordan and Hubbs report the
first pelagic fish species, Atherinomorus lacunosus (as Atherina forskali) (Gollasch, et al., 2006), in the
Mediterranean Sea, in the waters off Port Said, and seven years later when Fox (1924) identifies the pelagic
crab Portunus pelagicus in Haifa (Gore, 1986). These two tropical species were common in the Indo-Pacific
oceans with no prior occurrence whatsoever in the Mediterranean Sea. The biota of the two seas were now
given the opportunity to venture out of their respective seas to discover and eventually to invade new
territories.
New sightings came after these and new alien species were proved to have settled and established
Mediterranean populations. In 1969, it was clear that a unique phenomenon of unidirectional migration of
species from the Red Sea to the Mediterranean via the Suez Canal was underway. The Romanian zoologist
Dov Por named it “Lessepsian migration” (Por, 1978), specifying that this is a successful biotic advance from
the Red Sea to the Eastern Mediterranean. Here, climatic conditions along with impoverished local biota
facilitate this displacement making Indo-Pacific species “welcome guests” in the Mediterranean (Golani,
1998; Rilov & Galil, 2009).
Few years before, in 1964 Carl J. George and Victoria A. Athanassiou from the American University of Beirut
(AUB) and Ismat Boulos of the Lebanese Ministry of Agriculture published a booklet titled, “The Fishes of
the Coastal Waters of Lebanon” (George, et al., 1964), the first systematic experience of data collection on
the Lebanese halieutic resources. Through this study, relying almost entirely on commercial fishermen as
supplier of the specimens, they were able to describe and report 177 fish species inhabiting Lebanese
coastal waters, 19 of Indo-Pacific origins. Two Lessepsian species, the spinefoot fish Siganus rivulatus and
the goaldband goatfish Upeneus moluccensis were by that time already considered as “very common,”
clearly affirming how Lebanese waters are a conquered realm for invasive subtropical species, at least since
the early 1960s.
1 Said Pasha had been the governor of Egypt and Sudan from 1854 until 1863, officially owing fealty to the Ottoman
Sultan but in practice exercising virtual independence.

25
By the mid-1960s and then in late 1970s, the canal was deepened to handle laden tankers of 150,000 tons.
Those enlargements may be associated with the sharp increase in the number of invaders appearing since
the mid-1960s (Rilov & Galil, 2009)(Figure 4). Therefore, the “New Suez Canal” inaugurated on August 6,
2015, adding a new 72-kilometer long second shipping lane in the existing 164-kilometer long canal can
facilitate the invasion of more species that were confined as larvae or adults in the Red Sea. Along with
other large scale ongoing phenomena, this expansion will affect the Levantine Basin, unfolding a varied
range of effects at local and regional scales (Galil, et al., 2017).
Figure 4. The enlargement of the Suez Canal (cross section, m²) and the numbers of species probably introduced through the Suez Canal. ENIS: Erythrean non-indigenous species. From Galil, et al. (2017).
Description of the main arrivals of NIS in eastern Mediterranean 751 multicellular NIS introduced into the Mediterranean Sea. About two thirds of these species are
considered Lessepsian or Erythraean NIS, i.e. introduced through the Suez Canal. Erythraean NIS numbers
more than doubled between 1980 and 2016 and are substantially greater in the Levant than in the western
Mediterranean (Galil, et al., 2017)(Figure 5). This confirms that the Mediterranean Sea – and more in
specific its easternmost shores - is one of the hottest hotspots of marine bioinvasions on earth (Rilov &
Crooks, 2009). Due to its proximity to the Suez Canal, its favorable conditions (warmer, saltier waters),
dominant currents and the faunal impoverishment, the Eastern Mediterranean shows the greatest
occurrence of NIS.

26
Figure 5. Number of non-indigenous species (NIS) the Mediterranean. In red, the fraction of species probably introduced via the Suez Canal. The circle sizes are proportionate to the total number of NIS recorded in the country. Modified from (Galil, et al., 2017).
Macrophytes, invertebrates and fish of Indo-Pacific origins are prominent in many coastal habitats and have
profoundly altered the composition of the biota of the southeastern Mediterranean Sea (Steinitz, 1970;
Por, 1978; Galil, 2007). This phenomenon encompasses all major taxa. The dominant groups of alien
species in the Mediterranean are Mollusca (215 species, 90 percent of which reported in the Eastern
Mediterranean), Crustacea (159, 79 percent in the Eastern Mediterranean), Polychaeta (132, 77 percent in
the Eastern Mediterranean), Macrophytae (128, 55 percent in the Eastern Mediterranean) and fish (126,
with only two elasmobranchs, i.e. Himantura uarnak and Torpedo sinuspersici, 83 percent in the Eastern
Mediterranean) (Zenetos, et al., 2012) (Figure 6).
Figure 6. Number of marine alien species per major groups in the MSFD subregions of the Mediterranean Sea. Modified from (Zenetos, et al., 2012).
It is worth noting the dominance of macrophytes among NIS in the Adriatic and the Western
Mediterranean due to the introduction of macrophytes in coastal lagoons, whereas in the eastern
Mediterranean they hardly add up to 10 percent (Boudouresque, et al., 2011). 84 percent of fish has been
reported from the Eastern Mediterranean. In 2012, 70 of those species had not been reported from any
other subregion of the basin (Zenetos, et al., 2012). Non-indigenous fish species succeeded in colonizing

27
almost every available niche, however the majority of fish invaders in the Mediterranean are spawning,
shallow water, benthic carnivores (Rilov & Galil, 2009) (Figure 7).
Figure 7. Ecological classifications of non-indigenous fish in the Mediterranean Sea. From (Rilov & Galil, 2009).
In 2003, a survey conducted along the Syrian coastline – whose overall objective was the promotion and
improvement of the management of marine and coastal protected areas) – reported rocky banks covered
with the NIS Stypopodium schimperi and the fauna comprised many NIS introduced via the Suez Canal, such
as Strombus decorus, Malleus regula, Chama pacifica, Pinctada imbricata radiata, Synaptula reciprocans,
Fistularia commersonii, Pempheris vanicolensis, Sargocentron rubrum and Siganus rivulatus. Sandy bottoms
were covered with a meadow of the Erythraean seagrass Halophila stipulacea (Bitar, et al., 2003) (Figure 8).
Figure 8. Meadow with Halophila stipulacea (Cove of the military station of Ras El Bassit – photo: R. D. Grandrive). From: (Bitar, et al., 2003).
In the area of Latakia, the NIS rhodophyte Galaxaura rugosa covered almost entirely the rocky substrate,
accompanied by many NIS of fish and invertebrates (Bitar, et al., 2003).
In Lebanon, few studies have dealt with the marine flora of Lebanon. (Basson, et al., 1976) listed 190 taxa
of macrophytes (including Cyanobacteria), while Bitar (1999) listed 208 taxa including 4 introduced Indo-
Pacific NIS. In 2012, 2013 and 2016, several Lebanese localities spread over the Lebanese shores were
surveyed within the framework of the international MedMPAnet Program for the establishment of an
effective Mediterranean network of marine protected areas (RAC/SPA - UNEP/MAP, 2014). At least 19

28
Indo-Pacific NIS of macrophytes were identified (Bitar, et al., 2017), while 31 percent and 21 percent
respectively of the recorded mollusc and fish species were of Indo-Pacific origin (RAC/SPA - UNEP/MAP,
2014). Influence of some Lessepsians species (as Siganidae, Chama/Spondylus bioconstructions) is
considered relevant on the habitat; and the seasonal changes are very pronounced in the flora composition
(RAC/SPA - UNEP/MAP, 2014). Furthermore, other Lessepsian NIS have established large populations such
as: the mytilid Brachidontes pharaonis, the stinging feathery hydroid Macrorynchia philippina, the bivalve
Malleus regula and the echinoderm Synaptula reciprocans (RAC/SPA - UNEP/MAP 2014). Carpentieri, et al.
(2009) evidenced the importance of Lessepsian species in terms of diversity and abundance in the catch
composition of Tyre fishing fleet, characterizing the fish community of south Lebanon coasts as a mixed
Mediterranean–Red Sea composition. The weight percentage of Lessepsian species observed in the study
area was approximately 37 percent. Most common Lessepsian fish species were Siganus rivulatus, S.
luridus, Etrumeus teres, Sargocentron rubrum, Scomberomorus commerson, Pempheris vanicolensis and
Lagocephalus spp.
Ramos Esplá & Pérez (2004) documented the overwhelming presence of NIS from the littoral to the depth
of 40 m along the Israeli coast. The mytilid B. pharaonis formed a marked belt in the lower part of the mid-
littoral. Shallow rocky reefs (1–22 m) were covered by S. spinosus and C. pacifica formations, overgrown
with the stinging Erythraean hydrozoan M. philippina. Other common nonindigenous molluscs were P.
imbricata radiata, M. regula, Strombus persicus, Trochus erythraeus. Stipopodium schimperi was pervasive.
The abundance of non-indigenous fish such as F. commersonii, P. vanicolensis, S. rubrum, S. luridus, S.
rivulatus, and Stephanolepis diaspros was relevant, comprising 37.3 percent of the total number of fish
observed (Ramos Esplá & Pérez, 2004).
Ecological and economic impacts of invasions in general. The opening of the Suez Canal in 1869 allowed entry of Indo-Pacific and Erythrean biota. Some NIS have
outcompeted or replaced native species locally, some are considered pests or cause nuisance, whereas
other invaders became of commercial value. The rate of marine biotic invasions has increased in recent
decades; collectively they have significant ecological and economic impacts in the Mediterranean
(UNEP/MAP, 2007). Introduced demersal species have the potential to drastically affect sensitive
Mediterranean coastal ecosystems (Sala, et al., 2011) and, if not deeply understood and mitigate, the
ecological risks associated with the expansion of the Suez Canal may jeopardize the integrity of a large part
of the Mediterranean ecosystem (Samaha, et al., 2016).
Crossing the Suez Canal does not guarantee successful settlement and dispersal of populations.
Hydrological conditions are important in understanding the successful spreading of many NIS (Mavruk &
Avsar, 2008). Additionally, species ecology is a key determinant for settlement and dispersal success (Galil,
et al., 2017; Rilov & Galil, 2009): according to Ben Rais Lasram, et al. (2008), only 30 percent of the
Lessepsian species have succeeded in establishing colonizing populations in the Mediterranean Sea. These
species have affected the structure and functioning of the sea and the consequent provision of goods and
services (Micheli, et al., 2013; European Environment Agency, 2015; Galil, et al., 2016). And complex and
fundamental alterations to the Mediterranean Sea are underway (Galil, et al., 2017; Samaha, et al., 2016).
In the last decades, due to their impact on human activities including significant economic impacts and
drastic changes in the fishing landing composition, some species took the role of emblematic species.
Starting mid 1980s showing an increasing presence in the last decade, swarms of the invasive Indo-pacific
jellyfish, Rhopilema nomadica, have appeared along the Levantine coast (Galil, et al., 1990; Lakkis &

29
Zeidane, 1991) (Figure 9). They frequently draw nearer to the shore negatively affecting tourism, fisheries
and coastal installations. Coastal trawling and purse-seine fishing were disrupted.
Figure 9. A specimen of Rhopilema nomadica observed in Lebanese waters, during routine sampling activities implemented by the CNRS-Lebanon along the Lebanese coastal waters. Photo: Ghazi Bitar.
Jellyfish-blocked water intake pipes pose a threat to engine cooling systems of ships and coastal power
plants: in the summer of 2001 (Rilov & Galil, 2009) and 2015 (http://www.bbc.com/news/av/world-middle-
east-14038729/jellyfish-threaten-israeli-power-plant), Israel Electric removed tons of jellyfish from its
seawater intake pipes at largest power plants. It has recently spread to Pantelleria Island (Crocetta, et al.,
2015) and to Tunisia (Galil, et al., 2017). Between April 2013 and April 2017, the interactive web-tool on
jelly blooms (http://www.ciesm.org/gis/JW/build/JellyBlooms.php) reports 22 swarms (more than 1,000
individuals) all concentrated in the South of Lebanon.
The swimming crab Portunus pelagicus, was firstly recorded in the Mediterranean in Port Said in 1898,
where it soon became abundant and sold in Egyptian and Palestinian ports (Fox, 1924; Calman, 1927). In
the whole Levant basin, it is considered commercially valuable since the early 1920s (Galil, et al., 2002),
constituting nearly half of the trawl catches along the Israeli coast in mid 1990s (Golani & Ben-Tuvia, 1995).
The silver-cheeked toadfish Lagocephalus sceleratus is a widely distributed species inhabiting the tropical
Indian and Pacific Oceans, from which it originated. Through the Suez Canal, it made its way to the
Mediterranean where was firstly recorded in February 2003 in the southern Aegean coast of Turkey (Akyol,
et al., 2005). L. sceleratus has shown a rapid expansion: it reached the North Aegean Sea in 2006
(Bilecenoglu, et al., 2006), the southern end of the Gulf of Gabès in Tunisia (central Mediterranean) in 2010
(Jribi & Bradai, 2012) and for the first time the Italian waters in October 2013, off Lampedusa island
(Azzurro, et al., 2014). Today, it is regarded to be among the most destructive NIS in the Mediterranean Sea
with a significant impact on the surrounding ecosystem and on the fisheries sector (Streftaris & Zenetos,
2006; Ozturk, 2011). In the Mediterranean, this fish was found to be voracious and carnivorous, feeding
mainly on shrimps, crabs, fish—including individuals of its own species—and cephalopods (EastMed, 2010;
Aydin, 2011). L. sceleratus is considered a serious hazard to consumers since it contains a strong paralytic
marine toxin called TTX (tetrodotoxin), which can be lethal to humans (Sabrah, et al., 2006; Nader, et al.,
2012). In the eastern Mediterranean, many cases of TTX poisoning have been reported (Ashkar, et al.,
2008). In 2005, two cases of human intoxication due to the consumption of pufferfish were recorded in
Lebanon (Khalaf, et al., 2014).

30
At present, the relatively low winter water temperatures (14–15 °C) in the eastern Mediterranean are
probably the main obstacle for the establishment of many tropical species in the Levant basin, also
considering the recent expansion of the Suez Canal. An increase of a few degrees in winter water
temperatures may lift this barrier as well unveiling a probable scenario for the not so distant future when
global warming may facilitate even further Lessepsian migration (Rilov & Galil, 2009).
Objectives of the study
The aim of this study was to contribute to a better knowledge of demersal species in the Lebanese coastal
waters, Eastern Mediterranean. Various aspects related to the distribution, diversity and biology of these
species were studied. More in specific, this gave us the chance to:
1. Investigate the biodiversity of Lebanese demersal species
2. Collect information on biological traits, relative abundance and distribution of demersal species
3. Widen the knowledge on demersal communities exploited by Lebanese artisanal fisheries
4. Investigate the ecological traits of the redcoat, a key demersal Lessepsian fish species
Some chapters of the thesis are presented under the form of articles. Following the present general
introduction, constituting Chapter I, the thesis is divided as follows:
Chapter II describes “Materials and Methods”, which includes a description of the studied area, sampling
design, sampling gears, protocols set for sampling activities and data collection and statistical tests and
analyses employed throughout the present thesis. The present thesis also comprises a description of the
Lebanon’s fisheries sector that includes socioeconomic characteristics, environmental context and
governance-related aspects (Chapter III), and a short essay on main traits, history, causes and effect of the
so called Lessepsian migration (in Chapter I) both based on original contents and bibliographic review.
Chapter IV is dedicated to the study of the pattern of distribution and structure of demersal species
exploited by artisanal fisheries in the eastern Mediterranean Sea. The second part describes and analyzes
the biological assemblages of demersal species along the Lebanese continental shelf and upper slope.
Chapter V reports the estimation of Weight-Length relationships (WLRs) of 30 coastal species captured in
Lebanese waters using data collected in the framework of a multiannual fisheries-independent data
collection for the assessment of demersal coastal species. Chapter VI presents the biology and ecology of
the Lessepsian species Sargocentron rubrum in Lebanese waters. Aiming at providing information for sound
population dynamic based models and the general discussion, conclusion, and perspectives of this work are
presented in the last chapter (Chapter VII).

31
Following annexes are included at the end of the thesis to complement and improve its contents:
- Annex 1 is dedicated to the presentation of a communication in the 45th congress of Italian Society
of Marine Biology, May 9-23, 2014 (La porta et al., 20142) and Annex 2 to a 2014’s communication
in the 20th LAAS International Science Conference - Advanced Research for Better Tomorrow,
March 27-29 (Lelli et al., 2014)3;
- Annex 3 presents two 2014’s written communications to the ‘Watch Letter’ (CIHEAM) (Hamzé et al,
20144; Zuccaro et al., 20145) ;
- Annex 4 presents the first pages of the CANA book of 2014 and 2015 (Khalaf et al, 20146; Lelli
20167);
- Annex 5 presents the first page of a 2014’s publication in the Journal of earth Science and
Enginnering (Khalaf et al. 2014)8 and Annex 6 to the first page of a 2017’s publication in the New
Medit revue (Mulazzani et al., 2017)9 ;
- Finaly, Annex 7 is dedicated to the presentation of the first page of a 2017’s publication in the
Journal of applied Ichtyology (Lelli et al., 2017)10.
2 LA PORTA B., NICOLETTI L., MOUAWAD R., TARGUSI M., LA VALLE P., LATTANZI L., LELLI S. (2014). Benthic
assemblages along the highly urbanised coasts of Lebanon (eastern Mediterranean Sea). 45° Congresso della Società
Italiana di Biologia Marina Venezia, 19-23 maggio 2014. 166-167.
3 LELLI S., LTEIF M., JEMAA S. and KHALAF G. (2014) - First information on abundance, biology and distribution of the
red giant shrimp (Aristaeomorpha foliacea) in Lebanese waters. 20th LAAS International Science Conference -
Advanced Research for Better Tomorrow. March 27-29, 2014.
4 HAMZÉ M., KHALAF G., FAKHRI M., SURSOCK A., LELLI S. (2014). Research Vessel CANA-CNRS. Five years of research activities in the Eastern Mediterranean Sea. The Mediterranean Sea. Fisheries and Beyond Paris: CIHEAM, December 2014 - Watch Letter n°31.
5 ZUCCARO M., TREVISI R., GALLI D., LELLI S., UGOLINI R., DI TERLIZZI B., MALORGIO G. (2014). Fishery and aquaculture
cooperation for the development of Mediterranean coastal communities. The Mediterranean Sea. Fisheries and
Beyond Paris: CIHEAM, December 2014 - Watch Letter n°31.
6 KHALAF G., FAKHRI M., LELLI S. (2014). Marine Hydrobiology: Hydrology, Coastal Pollution, Fishery and Cetacean. In:
CANA-CNRS. A SCIENTIFIC VESSEL FOR LEBANON 2013-2014. 66-95.
7 LELLI S. (2016). An Unlikely Mediterranean Sea: Invasive Fish Species in Lebanese Waters. In: CANA-CNRS. A
SCIENTIFIC VESSEL FOR LEBANON 2009-2015. 55-58.
8 KHALAF G., SAAD A., JEMAA S., SABOUR W., LTEIF M. AND LELLI S. (2014) - Population Structure and Sexual Maturity
of the Pufferfish Lagocephalus sceleratus (Osteichthyes, Tetraodontidae) in the Lebanese and Syrian Marine Waters
(Eastern Mediterranean). Journal of Earth Science and Engineering (4).
9 MULAZZANI L., ZANASI C., ERRICO A., PUGLIESE P., ZUCCARO M., ZERROUKI R., MEDANI M., OUAZZANI TNACHERI M., MOHANNA C., HAMZA H., LELLI S. (2017) - The comparative analysis of Mediterranean coastal communities: six case studies. NEW MEDIT N. 2/2017. 27-37.
10 LELLI S., LTEIF M., JEMAA S. and KHALAF G, VERDOIT-JARRAYA M. (2017). Weight-length relationships of 3 demersal
fish species from Lebanese marine waters, eastern Mediterranean. J Appl Ichthyol. 2017; 1–4 (early version).

32
Chapter 2
Material and Methods

33

34
Chapter 2
Materials and Methods
Characteristics of the study area
Situated in the central part of the Levantine Basin (Eastern Mediterranean), Lebanon is geographically
limited by latitude 33°- 35°N and longitude 35° 30’-36° 20’ E (Figure 10). Its coastal stretch is about 225 km
long (Central Intelligence Agency, 2013) from Aarida (north) to Ras el Naqoura (south) on the Levantine
Basin of the Mediterranean Sea. Mount Lebanon (3083 m high) is located on a 160-km-long transpressional
bend of the left-lateral Levant (Dead Sea) Fault System (LFS). Seaward from Mount Lebanon, the Levantine
margin of the Mediterranean basin is particularly steep, reaching water depths of approximately 1500 m
only 8 km from shore (Carton, et al., 2009).
The continental shelf is relatively wide in the
north, offshore of the Akkar plain (about 20
km), and in the south, offshore of Saida and
Tyre (Nabatiyeh plateau), whereas between
Beirut and Batroun, the shelf is extremely
narrow. Here the margin exhibits its steepest
slope, with the water depth abruptly
increasing from 100 to 1500 m in less than 5
km (Carton, et al., 2009). Along the entire
margin the continental slope is incised by
canyons, most of them connected to rivers
flowing from the mountains (Sursock, et al.,
2014).
Sea cliffs made out of limestone border most
of the shores and sometimes descend directly
into the sea. They are separated by gravel or
sand beaches, composed partly of shell
fragments and mostly of detrital sand (Emery
& George, 1963). There is a minimal variation
in tides (JRC – Institute for the Protection and
Figure 10. Map of study area in Lebanon.
Security of the Citizen (IPSC), 2017). The general circulation along the coast of Lebanon is dominant
northwards during most of the year along with the general counter clockwise current gyre of the Eastern
Mediterranean. This current is locally modified by the configuration of the coastline and the topography of
the narrow continental shelf. This results in a series of clockwise directed eddies and small gyres associated
with bays and headlands as well as with numerous submarine canyons incised in the continental shelf
(Goedicke, 1972). Water movements along the coast are also strongly related to surface currents and
seasonal meteorological factors. Offshore areas of Lebanon are characterized by peculiar oceanographic
conditions that may enhance the accumulations of larvae and juveniles and create favourable habitats for

35
their growth and survival. The Modified Atlantic Water (MAW) enters the Levant Basin through the Cretan
Passage and the core of the jet branches southwest of Cyprus. Part of it bypasses Cyprus to the south and
reaches the eastern boundary of the basin. In some years, the mainstream flow is blocked off at the Latakia
basin, between Cyprus and Syria. In these years, the drift of eggs and larvae eastward could be blocked in
the SE Levantin. Moreover, increased retention of eggs and larvae could be associated with the Shikmona
mesoscale anticyclonic eddy, generated offshore Lebanese-Israeli coasts. It should feature a predominately
convergent flow pattern in the surface layer of the interior of the eddy, with attendant biological
implications somewhat similar to those described for ocean surface fronts (Bakun, 2006).
Lebanon has a typical Mediterranean climate, with an average annual temperature of 20°C and about 300
sunny days each year. It is also characterised by a relatively high average rainfall, ranging from 700 to 1000
mm along the coast to 1,400 mm on Mount Lebanon. Surface water temperatures show high seasonal
variation and range from 15°C in winter to 30°C in summer. The water in the upper 50 m is well mixed in
winter and becomes stratified during the rest of the year (Greenpeace, 2010).
The Lebanese coastal waters are characterized by thermophilic biota of Mediterranean and Indo-Pacific
origin (Abboud-Abi Saab et al, 2013; Bitar et al, 2007). The local biodiversity is undergoing rapid alteration
under the combined pressures of climate change and anthropogenic impacts. Protection measures, for
either species or ecosystems, are still rare. Native marine flora and fauna are competing with invading
species originating from the Indo-Pacific and Atlantic oceans. More in specific, for the past two centuries,
the biodiversity has been altering at an alarmingly high rate due to human-mediated arrival of new species,
with an apparent acceleration in the rate of recorded invasions in the last decades (Rilov & Galil, 2009). The
features of the Lebanese coastline with no closed bays or gulf consent to coastal waters to continuously
mix thus preventing conditions of eutrophication and to disperse nutrients and pollutants (Abboud – Abi
Saab, 2012).

36
Data collection
Background International organizations and donors have granted funds and capacity building to develop adequate
research programmes to support the capability of the Lebanese Government to define new measures
towards an appropriate and sustainable management of fishing resources. The idea of an overall Country
data collection to gain information on abundance and distribution of Lebanese fisheries resources stemmed
from a series of meetings that took place in 2012 aiming at coordinating the efforts of international
organizations (i.e. FAO, CIHEAM, Italian Cooperation) and Lebanese stakeholders such as public institutions
and academia.
Financed by the Italian Cooperation in Lebanon, in 2012 the project CIHEAM-PESCA LIBANO “Technical
Assistance to the Ministry of Agriculture in the field of fishery development” aimed at providing the
Lebanese Ministry of Agriculture (MoA) with advanced tools designed for a proper management of marine
and fisheries resources. This was achieved by strengthening capabilities of the MoA staff and assessing the
potentialities of marine coastal resources. The project gathered scattered data fisheries related from
different concerned institutions, on the one hand. On the other, it actively collected data that emerged to
be important for a correct management of the sector and still missing. The project had been working on the
land to map infrastructures and activities linked to fisheries, and at sea to assess the distribution and
abundance of demersal species exploited by the Lebanese artisanal fleet. The National Council for Scientific
Research, Lebanon (CNRS-L), in charge of the implementation of the fishing surveys through its Marine
Centre, gave follow up executing seasonal data collection at sea in the North Lebanon.
With the aim of assessing the distribution and abundance of fisheries resources along the Lebanese coasts
in order to deliver scientific advice to MoA for an enhanced fisheries management, the CNRS-L organized
surveys in 2012, 2013 and 2014. Experimental fishing gears were lowered in 62 sites along the coast of
Lebanon, at depths ranging from 10 to 600 m. The following sampling stations by year were considered and
analyzed for the purpose of this thesis:
in 2012, a total of 47 hauls carried out in the period June 9 to September 4, 2012 for a total of 35.25
Km of nets deployed.
In 2013, 49 hauls executed between January 3 and August 29, 2013. A total of 36.75 Km of nets had
been lowered up to 150 meters depth.
Between September 24 and October 13, 2014, 13 sampling stations located in the Akkar Shelf and
Tripoli-Beirut regions surveyed by means of 13 Km of nets. 12 sampling stations located in deeper
waters (165-300 m depth) surveyed between April 2013 and October 2014.
Sampling design We deemed fishery-independent survey as the most appropriate tool to provide valuable measures of
relative abundance, rates of population change and size and sex composition for a wide range of species. In
fact, fishery-independent surveys form the cornerstone of many stock assessments for bony fishes and
shellfish species, they are less subject to the unknown and often confounding factors that complicate the
interpretation of fishery-dependent indices of stock status. Thus fishery-independent surveys strike a
balance between the ability to make inferences about one or more populations versus the usage of a
specific area by one or more species (Rago, 2005).

37
The predominantly used approach for the definition of a fishery-independent survey sampling design is
stratification where the total survey area is broken down into strata possessing common features regarding
the species composition and their densities and length structures. If the strata are well selected, i.e.
characterised by a low variability within the strata and clear differences between strata, the stratification is
a convenient way of increasing the precision of the abundance estimates (Cochran, 1977). Survey effort
may be allocated between strata according to their size or may be optimised if a priori knowledge on the
variability of interest is known (Sparre & Venema, 1992). Within each stratum, the fishing stations are
chosen randomly.
It is therefore clear that the stratification scheme depends on the objective established for the survey.
Since, the ultimate aim of the abundance survey in Lebanese waters was to obtain an estimate of the
relative abundance and spatial distribution of main commercial stocks, it was necessary to adopt a
stratification that could allow sampling a relative large array of species with different depth ranges. At the
same time, it was required to cover the entire Lebanese coast in order to gather enough data to map the
spatial distribution of the stocks. Table 1 and figure 11 summarise the stratification approach adopted for
the surveys based on the definition of four coastal regions from North to South (Akkar shelf, Tripoli-Beirut;
Beirut-Saida; Saida-Naqoura) and 2 depth strata (0-100 m; 101-150 m). The total number of sampling
stations was 48, spatially allocated randomly but proportionally to the extension of each area.
Table 1. Survey areas according to regions and bathymetric strata over the Lebanese continental shelf.
REGION Area in the bathymetry
0-100m (km2) n. hauls
Area in the bathymetry
100-150m (km2) n. hauls
1. AKKAR SHELF 473.6 12 124.4 3
2. TRIPOLI-BEIRUT 183.3 5 92.05 3
3. BEIRUT-SAIDA 189.8 5 99.6 3
4. SAIDA-NAQOURA 386.4 11 221.7 6
total 1233.1 33 539.7 15
Figure 11. Maps of investigated area showing the randomised distribution of sampling stations along the Lebanese continental shelf. Left: northern sectors (Akkar shelf and Tripoli-Beirut). Right: southern sectors (Beirut-Saida and Saida-Naqoura).

38
Repercussions of the Syrian conflict and related safety measures forced us to shift southward or to delete
sampling stations closer to the Syrian border. Other sampling points were slightly shifted due to technical
impediments arisen during sampling activities at sea. Table 2 shows final locations of identification codes of
the sampling points.
Table 2. Location of the sampling stations and their identification code.
REGION Haul n. Haul name Depth (-m) Coord N Coord E
AK
KA
R S
HEL
F
2 North Aabde 40 34°33.116' 35°57.196'
3 Nabi Kzaiber 80 34°32.050' 35°53.155'
4 Aabde 10 34°30.993' 35°55.562'
5 Nahr el Bared 50 34°29.430' 35°52.435'
6 El Minie 30 34°28.812' 35°53.151'
7 Deir Aamar 30 34°29.416' 35°52.517'
8 Nahr Abu Ali 70 34°30.431' 35°53.705'
9 Tripoli 30 34°30.030' 35°48.836'
10 Palm Islands 30 34°29.876' 35°47.086'
12 Qalamoun 60 34°23.305' 35°45.789'
14 Beddawi 110 34°31.020' 35°50.165'
15 Dedde 140 34°23.502' 35°45.130'
TRIP
OLI
- B
EIR
UT
16 Enfeh 20 34°21.131' 35°42.733'
17 Madfoun 40 34°13.186' 35°37.100'
18 Jounieh 70 33°59.839' 35°36.997'
19 Antelias 10 33°55.133' 35°34.680'
20 B.Hammoud 90 33°55.266' 35°34.309'
20-ter Beirut-Biel 150 33°55.170' 35°32.000'
21 Chekka 110 34°20.883' 35°42.169'
22 Fidar 120 34°06.240' 35°37.923'
22-bis Jbeil 30 34°06.831' 35°38.254'
23 Jounieh 2 140 34°00.431' 35°37.085'
TRIP
OLI
- B
EIR
UT
24 Ramlet Al Baida 30 33°51.861' 35°28.229'
25 Khaldeh 90 33°50.319' 35°27.137'
26 Aramoun 50 33°44.450' 35°24.300'
27 Nahr Damour 50 33°40.400' 35°23.300'
28 Jiyeh 10 33°40.030' 35°24.610'
29 Airport 140 33°48.444' 35°25.240'
29-bis Ouzai 10 33°50.334' 35°28.584'
30 Naameh 100 33°44.750' 35°23.935'
31 Borj Barajne 130 33°51.891' 35°26.871'
SAID
A -
NA
QO
UR
A 32 Nahr el Awali 70 33°35.465' 35°22.300'
33 Nahr Sainiq 30 33°33.736' 35°21.075'
35 Sarafand 15 33°31.385' 35°19.807'
36 Khaizarane 80 33°32.380' 35°20.033'
37 Aadloun 30 33°24.264' 35°11.918'
38 Mazraat Bsaile 22 33°19.974' 35°11.345'
39 Bourghliye 50 33°19.991' 35°11.284'

39
40 Sour 50 33°14.056' 35°07.899'
40-bis Sour2 100 33°14.804' 35°07.001'
41 Rachidiye 30 33°15.019' 35°09.399'
42 Naqoura 10 33°07.216' 35°07.519'
43 Saida 120 33°35.700' 35°22.685'
44 El Aaddoussiye 140 33°32.540' 35°20.190'
45 Sari 140 33°24.993' 35°11.912'
46 Qasmiye 150 33°20.603' 35°10.691'
47 El Bass 130 33°18.996' 35°08.954'
48 Chabriha 100 33°19.521' 35°08.799'
Sampling gears In Lebanon, the most important commercial species are typically coastal and distributed over areas where
standard trawling cannot be carried out. In this situation, other fishing gears (e.g. longlines, gillnets and
traps) had to be used to survey untrawable areas and species. Moreover, trawling activities are interdicted
in the Lebanese territorial waters (University of Balamand, 2016). Following the good results obtained in
the exploratory fishing survey implemented in March-May 2012 (Colloca & Lelli, 2012), gillnets were
selected as sampling gear for data collection. Moreover, taking into consideration the relatively high CPUEs
observed in Lebanese waters when compared with other Mediterranean areas, the dimension of each
patch of net was limited to about 250 m length, for a total of 750-1000m of nets employed during each
sampling haul. Gillnets with mesh sizes of 26, 30 and 40 mm were lowered at depths less than 100 m;
trammel nets with mesh sizes of 22, 24, 26, 28 and 30 mm were lowered at depths greater than 100 m.
Longlines of size 5 hooks were lowered at randomly specified depths (results obtained using longlines are
not reported in this study). Specifications of technical characteristics of the gillnets used during the fishing
surveys are summarised in Table 3.

40
Table 3. Technical characteristics of gillnets and trammel nets used for the implementation of the fishing surveys.
Gillnets Trammel Nets
Net yarn Material PA mono-filament PA multi-filament Diameter 0.26/0.30/0.30 mm 0.28/0.28/0.30/0.30 mm
Stretched mesh size 52/60/80 mm 22/24/26/30 (internal wall) 44/48/52/60 (external wall)
Panel height 4.4/3.9/3.9 m 3.0 m
Panel length 500/472/500 m 180/240/240/300 m
Colour light green light green/ light green/ light yellow/ light yellow
Bolsh twin
Material Twisted PE Twisted PE
Diameter 1.2 mm 6 mm
Float rope
Material Twisted PE Twisted PE
Diameter 12/14/16 mm 6 mm
Length 250 m 180/240/240/300 m
N. bolshes 1920/1560/1250
Bolsh size 0.13/0.16/0.20 m
N. meshes per bolsh 5
Hanging ratio 0.50/0.53/0.5 0.50/0.53/0.50/0.50
Floats
Material PVC PVC
Size 6.7x4.0 cm 8.0x5.0 cm
N. floats 390
Lead rope
Material Twisted PE Twisted PE
Diameter 12/14/16 mm 4/5/5/6 mm
Length 250 m 180/240/240/300 m
N. bolshes 192/156/125
Bolsh size 0.13/0.16/0.20 m
N. meshes per bolsh 5 2
Lead weight 140 g/m 260/666/666/666 g/m
Hanging ratio 0.5/0.53/0.50 0.50/0.53/0.50/0.50

41
After the conclusion of the first survey (2012), it appeared clear the need of a fine tuning of the
sampling gear in order to reduce the still-too-high selectivity of the gillnets and their fragility
especially in deeper waters where the materials undergo serious stresses due to the high pressure
and the tractions in the phase of retrieving. During the second survey (2013), after the completion of
the activities in the region of Akkar Shelf, gillnets suffered a major rupture and the loss of part of the
nets. Damaged patches of nets were re-assembled and raw materials were used to manufacture a
new set of multi-mesh trammel nets compatible with the use in deeper waters (specifications
summarised in table 3). The mesh sizes included in net series used for stocks surveying were selected
to enable full coverage of the potential size distribution of fish that may be encountered. Due to the
incompleteness of the information on the size composition of demersal resources in Lebanon,
different mesh sizes covering a wide range and rigged with a hanging ratio around 0.5 had been
used.
Protocols for sampling activities Nine artisanal fishermen from eight different ports in Lebanon distributed in the north, south and
central regions of the country were hired to lower the gear at the hauls with the specified
coordinates in order to benefit from knowledge and familiarity of the fishermen with their usual
fishing grounds (Table 4). Vessels with minimum requirements were selected to carry out fishing
operations without endangering crew and staff. The length of the vessels ranged from 8.75 to 11 m
and their gross tonnage ranged from 3.10 to 5.01 tons (Table 4). A global positioning system (GPS)
was used to reach the right haul and depth was confirmed using a sonar. Species collected from hauls
were identified and date, type of gear, net meshes, coordinates and depth in each catch were noted.
Table 4. Characteristics of the fishing vessels used in the surveys.
Port Vessel Nr. Vessel Name Vessel Owner Length
LOA (m)
Gross
Tonnage
Engine power
(hp)
Tripoli 1957 Mouhammed
Nouri Issam Sidawi 10.21 5.01 27.6
Batroun 1945 Bou Nassif Toufic Assal 8.83 4.57 20.88
Jbeil 1399 Roberto George Abi
Saad 11.00 3.10 85.00
Jounieh 2228 Aida Joseph Attieh 8.75 3.85 36.00
Beirut/Dora 531 J Fadel Attieh 8.75 3.75 24.00
Beirut/Ouzaii 9495 Princess Leila Yehya Yassine 9.00 5.00 60.00
Saida 1960 Rabih Rabih Sombol 8.80 3.50 24.00
Tyre 1494 Abou Elie Nicholas Rahmé 9.75 4.76 48.49
Tyre 1212 Jeannette Nicholas Rahmé 8.80 2.67 24.61
Fishermen lowered the nets in the afternoon and retrieved them 12 hours later at the sunrise. The
catch was collected and stored in boxes or bins divided according the mesh size of the net that
captured the specimen. Operations of extraction of the catch from the nets were usually completed
at the port (except for days with poor catch) where researchers collected and reported on ad hoc

42
sheets. Species collected from the survey were identified using the identification guides of Fischer et
al. (1987) and the three CIESM Atlases on Fishes (Golani et al, 2002), Crustaceans (Galil et al, 2002)
and Molluscs (Zenetos et al, 2003). All specimens collected regardless the species were measured
and weighed. Sex and maturity stage were determined for all the individuals. When the catch of a
given species was too abundant to be wholly measured, representative sub-samples of the catch
were taken. For fish (bony fishes and Elasmobranches), the total length with the tail fully extended
was recorded. The measurement unit was the lower half centimetre. For crustaceans, the
cephalothoracic length at the lower millimetre was measured, whereas for cephalopods, the dorsal
mantle length at the lower half centimetre was noted down. For octopods, the measure was taken
along the line passing through the eyes. Standardised protocols and minimum requirements adopted
during the surveys were based on the MEDITS programme protocols (MEDITS Working Group, 2013)
and are summarised in table 5.
Table 5. Protocols and minimum requirements adopted.
Nets management
Soak time Approximate 12 hours, overnight
Lowering time Afternoon
Retrieving time Dawn
Operators Professional fishermen
Vessels' minimum requirements
LOA > 7m
Engine Power > 16 hp
Winch Hydraulic or Motorised
Available equipments GPS, Fishfinder, Safety equipments
Biological data collection MEDITS programme protocols
Biometric: length Lower half centimetre (fish)
Biometric: weight Nearest 1 gram
Biological: sex & maturity
stages
MEDITS programme protocols (CODES OF SEXUAL
MATURITY FOR FISH, CRUSTACEANS AND CEPHALOPODS)
Biometric & Biological
Parameters
Collected on all the specimens

43
Biological indices and sexual maturity
Biological indices were used for the in-depth study of the collected species and in particular of the
redcoat, the fish species Sargocentron rubrum. Length and weight measurements were taken as part
of the standard data collection performed in the framework of the surveys. Dissection of the
specimens was performed and additional measurements were taken, including the weight of the
stomach and its content (see the paragraph on stomach contents analysis), collection of the otoliths
(see dedicated paragraph) and the macro-examination of the gonads.
Weight-length relationship Length and weight data are useful in fisheries management and standard results of fish sampling
programs. Weight–length relationships (WLRs) are used for estimating the weight corresponding to a
given length, and condition factors are used for comparing the condition, fatness, or well-being
(Tesch, 1968) of fish, based on the assumption that heavier fish of a given length are in better
condition. The equation to relate weight and total length following (Le Cren, 1951) is as follows:
The coefficient of determination (r2) was also used to evaluate the quality of the model.
The type of growth of the fish studied is determined by parameter ‘b’. This parameter is the
exponent of the arithmetic form of the weight–length relationship. If b = 3, growth is isometric and
the weight increases at the same rate as the length of the fish, indicating that smaller specimens are
in the same condition and form as larger ones. If b > 3, growth is positively allometric and the weight
increases at a faster rate than the length of the fish, indicating that larger specimens have grown in
height or width more than in length. If b < 3, growth is negatively allometric and the length increases
at a faster rate than the weight of the fish, indicating that large specimens became more elongated
or small specimens were in better nutritional condition at the time of sampling (Froese, 2006).
Condition factor
The condition factor () was calculated for Sargocentron rubrum as it reflects fish ‘condition’,
‘fatness’, and ‘well-being’ (Tesch, 1968). It can indicate periods of physiological stress or phenomena,
such as, spawning, mating, population density alterations, feeding conditions, and temperature
variations (Le Cren, 1951; Braga, 1986; Loefer & Sedberry, 2003). It was defined by (Fulton, 1904) as:
Sexual maturity Sex and sexual maturity stages of fish, crustaceans and cephalopods were identified according to
MEDITS programme protocols (MEDITS Working Group, 2013). For bony fish species, a scale from 1

44
to 4 was adopted. Additionally, the class zero was added to identify undetermined specimens, the
class 2 and 4 were divided into 3 and 2 subclasses respectively. Maturity stages for males and
females were as follows: 1) Immature=Virgin; 2a) Virgin Developing; 2b) Recovering; 2c) Maturing; 3:
Mature/Spawner; 4a) Spent; 4b) Resting. In table 6, it is detailed different gonad aspects, sexual
maturation states and maturity stages for bony fishes, cephalopods, crustaceans and
elasmobranches oviparous.
Table 6. Gonad aspects, sexual maturation states and maturity stages for bony fishes (a), cephalopods (b), crustaceans(c) and elasmobranches oviparous (d) as used in this study.
a)

45
b)

46
c)
d)

47
Stomach contents analysis
The total weight of the stomach (WS) was measured. Stomachs with food contents were preserved in
70% alcohol until identification. The stomach contents were then rinsed under tap water. Their
weight was measured if possible to the nearest gram, counted and identified to the lowest possible
taxon. The total weight of each prey group was measured if possible to the nearest gram. Several
indices were then calculated to analyse the diet of the target species studied, reflecting its diet
composition and feeding strategy.
Diet composition According to Hyslop (1980), two indices were calculated. The coefficient of vacuity (CV) was
calculated to reflect the richness or lack of food in the environment:
CV = EV × N-1 × 100
where EV is the number of empty stomachs and N is the total number of stomachs examined.
The percentage of fullness (FI) was also calculated for each stomach:
FI = WP× WS-1 × 100
where WP is the weight of the prey items in each stomach. Stomach fullness was classed based on a
five-point scale estimated by the percentage of fullness:
empty, partially empty (1-25%), slightly full (26-50%), partially full (51-75%), and full (76-100%).
Moreover, three indices were used to show the significance of different prey items. The frequency of
occurrence (O%), the coefficient of prey numerical abundance (N%), and the percentage of weight
(W%) (Hynes, 1950 ; Hyslop, 1980 ; Bowen, 1983):
O% = NP × M-1 × 100
N% = n × nP-1 × 100
W% = m × mP-1 × 100
where NP is the number of stomachs containing a specific prey group, M is the number of stomachs
with prey remains, n is the number of prey of each taxonomic group, nP is the total number of prey
items, m is the mass of prey of each taxonomic group, and mP is the total mass of prey items. Out of
these indices, the importance of each food item in the diet was obtained by the Index of Relative
Importance (IRI) (Pinkas et al., 1971) modified by (Hacunda, 1981):
IRI = O% × (N% + W%)

48
Feeding strategy The feeding strategy of the target species was analysed according to the graphical method proposed
by (Costello, 1990). This graph displays the relationship between the frequency of occurrence (O%)
(abscissa) and the coefficient of prey numerical abundance (N%) (ordinate). It particularly illustrates
the dominance and the rarity of each group of prey in both seasons and the specialized or
generalized feeding strategy as shown in Figure 12.
Figure 12. The graph of Costello (1990) and its interpretation concerning feeding strategy and prey importance (with O% as the frequency of occurrence and N% as the coefficient of prey numerical abundance).
The most dominant prey items in the diet of the target species are situated to the upper right of the
graph (high N% and O%), whereas the rare prey items are situated to the bottom left (low N% and
O%).

49
Ageing fish and growth curves
A large number of fish species living in subpolar and temperate regions show a periodicity in the
deposition of layers composing calcified structures. This periodicity can appear quite clear in the
otoliths where the opaque zone corresponded to a rapid growth and the translucent zone to a slow
growth of the fish (Beckman & Wilson, 1995).
In this study, otoliths of Sargocentron rubrum were collecting by entering the brain cavity from the
ventral side of the fish to expose the otoliths. The sagittae were extracted and stored in small plastic
bags after before reading. For interpretation, the otoliths were immersed in water and read with a
binocular microscope under reflected light (Williams & Bedford, 1974). Slow growth rings (hyaline)
appeared dark through the dark transparent background, whereas fast or opaque growth rings
(opaque) appeared lighter under reflected light. The technique of otolith sectioning as described by
Bedford (1983) was not followed because whole otoliths were considered better for measuring the
marginal increments and because of the fragility of the sections.
Once the rings were considered to be annual, each specimen was assigned to a year class, taking into
account the data of capture, the annuli counts, their formation period, and the reproductive biology
of the species in the area. In the centre of each otolith a hyaline nucleus could be clearly
distinguished, surrounded by an opaque area. A narrow hyaline ring borders the area, representing
the first annual ring. It is assumed that the margin of the nucleus was formed at the end of the
pelagic stage at the beginning of the first winter. The first hyaline ring represents the second winter
in the fish’s life (age approximately 16 months); each consecutive winter an additional ring is formed.
(Golani & Ben-Tuvia, 1985) place the spawning season in July-August.
Growth curves and growth parameters Analysis of length-at-age data was performed in the statistical software ‘R’ (R Development Core
Team, 2014) to estimate growth parameters K and L. This allows non-linear estimation of growth
parameters from length at-age data. The Von Bertalanffy’s plot is used to estimate to from the known
age/length data and estimated L∞ and K. The method is based on the regression analysis of the
following formula:
-ln (1-Lt / L∞) = -K × to + K × t
Where: the age t is the independent variable (x) and (-ln (1-L (t)/ L)) is the dependent variable (y) of
the linear regression. L∞ is the asymptotic LT, Lt the LT at age t, K the growth curvature parameter,
and t0 is the theoretical age when fish would have been at zero LT .

50
Data analysis
Catch per unit effort (CPUE) The catch per unit effort (CPUE) is an indirect measure of the abundance of a target species.
Standardized CPUE analysis is widely used to evaluate trends in population density. However, while
analyzing data, it has to be taken in mind that mechanism modifying the catchability coefficient or
overdispersion of some pelagic species (Fonteneau et al., 1999), can bias our results and lead to
relevant mistakes in their interpretation. To reduce the incidence of the catchability factor, we used
different types of experimental gears whereas we focused our study on demersal species
underexposing our results to bias due to big schools highly dispersed pelagic species. The CPUE was
calculated per each species. Each year was calculated separately to standardize the effort (as Km2 of
nets used) using the statistical software ‘R’ (R Development Core Team, 2014) in kilogram and in
number according to the following:
1. CPUE in kilograms considered by year:
CPUE Kg, Y =
where is the weight in Kg per species considered by year, is the effort reported as Km2
of nets deployed by year.
2. CPUE in number considered by year:
CPUE Kg, Y =
Where is the number of individual per species considered by year, is the effort reported
as Km2 of nets deployed by year.
Biodiversity indices Seasonal and spatial biodiversity were assessed by calculating several diversity indices considering S
as the total number of species recorded in the sample and N as the total number of individuals in the
same sample (Magurran, 2004). All these indices were calculated using the ‘vegan’ package on the
statistical software ‘R’ (R Development Core Team, 2014).
The Shannon Index One of the most used of all diversity measures is the Shannon Index. This index assumes that
individuals are randomly sampled from an infinitely large community (Pielou, 1975) and that all
species are represented in the sample. It accounts for both abundance and evenness of the species
present where a higher index value represents higher diversity with a maximum value equivalent to
lnS. The Shannon Index was calculated using the diversity function and choosing “Shannon” for index
as:

51
H′ = -
where pi is the proportion of individuals found in the ith species and calculated as (Pielou, 1969):
=
where ni is the total number of individuals in the ith species.
The Shannon Index takes into account the degree evenness of species abundances; however, no
separate value is given. It is thus possible to calculate the Shannon evenness measure separately as
(Pielou, 1969; Pielou, 1975):
J′ =
where Hmax = lnS represents the maximum diversity where all species had equal abundances.
Simpson’s Index The Simpson index is one of the most meaningful and robust diversity measures indicating the
variance of a species abundance distribution and emphasizing the species richness component of
diversity (Magurran, 2004). In fact, the probability of any two individuals picked randomly from an
infinitely large community belonging to the same species was defined by (Simpson, 1949) as:
where pi is the proportion of individuals found in the ith species.
However, the appropriate form for a finite measure was defined as:
where ni is the total number of individuals in the ith species. This form gives an index D which is
inversely proportional to the diversity. As D increases, the diversity decreases. Therefore, a better
expression for Simpson’s Index, as recommended by (Lande, 1996) is:
1 - D
where the value of this index ranges between 0 and 1, which represents the maximum diversity. It
was also calculated using the diversity function and choosing the index “Simpson”. Simpson’s
diversity measures emphasize dominance, as opposed to the richness component of diversity, and
does not purely measure evenness (Magurran, 2004).
Taxonomic diversity Two or more assemblages can have the same number of species and an equivalence in species
abundance, but vary in the diversity of the taxa to which the species belong (Magurran, 2004).

52
Therefore, measures of taxonomic diversity should be used. One development was Clarke and
Warwick’s taxonomic distinctness measure (Clarke and Warwick, 1998; Warwick and Clarke, 1998).
This measure describes the taxonomic distance between two randomly chosen organisms using the
phylogeny of all species in an assemblage. It is in two forms: ∆ or ‘taxonomic diversity’ and ∆* or
‘taxonomic distinctness’. ∆ considers species abundances as well as taxonomic relatedness and
measures the path between two randomly chosen individuals that might belong to the same species.
∆* purely measures taxonomic relatedness considering each individual coming from different
species. When such data is used, these measures are reduced to a single measure, ∆+, indicating the
average taxonomic distance between two randomly selected species and can be calculated as:
where s is the number of species in the study and ωij is the length between species i and j. The
taxonomic distances were first calculated using the function taxa2dist from a table containing all the
species classified up to their class. The taxonomic diversity was then calculated using the function
taxondive.
Statistical analyses and regressions
Statistics The need for comparison and interpretation of data urges the use of several statistical tests and
analyses and has long been used in biology. In this context, several statistical analyses were
performed in this study using the statistical software ‘R project' (R Development Core Team, 2014)
aiming to aid the analysis of results. The main analyses performed and application purposes are
presented in table 7. It includes inferential statistical tests mainly non-parametric tests (Kruskal-
Wallis rank’s tests, etc.), descriptive statistical analyses such as Principle Component Analysis and
modelisation (regression) as the various approaches are complementary. Descriptive statistics is
distinguished from inferential statistics (or inductive statistics), in that descriptive statistics aims to
summarize a sample, rather than use the data to learn about the population that the sample of data
is thought to represent.

53
Table 7. The main statistical tests performed in this study as well as their application purposes (LT, WT, FI, IG, IH, and K are total length, total weight, fullness index, and condition factor, respectively. M, F, Imm, and Mat are males, females, immature and mature individuals, respectively.
Statistical analysis R function
Description Application (Chapter)
Inferential statistic
Shapiro-Wilk test Function: shapiro.test
Tests that the population is
normally distributed.
Tested the normality of the
samples in this study. (Chapter VI)
Kruskal-Wallis rank sum test Function: kruskal.test
A nonparametric test efficient for
non-normal distributions and/or
when variances are not equal. It
compares means of two or more
independent samples that may
have different sizes.
Tested the difference in LT and
WT of a species according to the
sexual maturity stages. (Chapter
VI)
Tested the difference in IG, IH,
and K of a certain species
according to season. (Chapters VI)
Pairwise Test for Multiple Comparisons of Mean Rank Sums (Post Hoc; Nemenyi-Tests) Package: PMCMR Function: posthoc.kruskal.nemenyi.test
Calculates pairwise multiple
comparisons between group
levels. It is performed after A
nonparametric ANOVA.
Used after significant differences
in the Kruskal-Wallis rank sum
tests for pairwise multiple
comparisons of the ranked data.
(Chapter VI)
Pearson’s chi-square test (goodness-of-fit or chi-square test for independence) Function: chisq.test
Tests if there is a significant
difference between expected and
obtained results in one or more
categories.
Tests any association between
two categorical variables from a
single population.
Tested the correlation between depth and different taxa’s distribution. (Chapters IV)
Analysis of covariance (ANCOVA) Function: anova
Compares two or more regression
lines by testing the effect of a
categorical factor on a dependent
variable while controlling for the
effect of a continuous covariable.
Performed a statistical
comparison of length-weight
relationships between sexes of
the same species. (Chapters IV &
VI)
Linear regressions
The analysis of reproductive organs growth can determine the size or age at maturity. The presence
of a relationship between the development of secondary sexual characteristics and reproductive
organs and maturity urged the use of clasper length measurements to estimate the size at maturity
(Conrath, 2005). Therefore, a linear regression model was used to evaluate the relationship between
total length and clasper length. A steeper slope corresponds to the range of lengths at which the
elasmobranch is becoming mature. A linear model function in the statistical software ‘R project’ (R
Development Core Team, 2014), lm, was used to fit the linear model and estimate the parameters ‘a’
and ‘b’ of the equation relating clasper length to total length:
The coefficient of determination (r2) was used to evaluate the quality of the model.

54
Nonlinear regressions
Length-weight relationship Length-weight relationships for fish populations help to a better knowledge of the growth rate, age,
and other constituents of population dynamics (Kolher et al., 1995). A nonlinear least squares
function, nls, on the statistical software ‘R project’ (R Development Core Team, 2014) was used to
estimate of the parameters ‘a’ and ‘b’ of the nonlinear power equation between gonad weight and
total length following Le Cren (1951):
The start values of these parameters were also derived from the log transformation of the two
variables using the linear model function (lm) into:
The coefficient of determination (r2) was also used to evaluate the quality of the model.
Logistic regressions Size at maturity is also determined by the length at which 50% of the fish sample is mature (L50). The
proportion of mature elasmobranch specimens in each length group is determined. This data is then
fitted in a logistic regression and the length at the point of the curve corresponding to 50% mature
(P=0.5) indicates the size at which these fish mature. The logistic equation takes the following form:
where P is the proportion of mature elasmobranch specimens in each determined length class, and
‘a’ and ‘b’ are parameters estimated by fitting the data to the logistic curve. The length at which 50%
of the individuals of specific elasmobranch species are mature was estimated for both sexes using a
logistic curve from a generalized linear model (GLM) with logit link using the function glm in the
statistical software ‘R’ (R Development Core Team, 2014)
Maps All maps were created on the Quantum Geographic Information System (qGIS) software (Quantum
GIS Development Team, 2012).

55

56
Chapter 3
Fisheries sector in Lebanon: a context
analysis

57

58
Chapter 3
Fisheries sector in Lebanon: a context analysis
Country profile
Lebanon is a small (10,452 km2) upper-middle income country, with a GDP per capita of USD 9,928
(World Bank, 2013). In July 2016, its population was estimated at 6,237,738 (Central Investigation
Agency, 2017), of which 88 percent is urban. More than one third of the population is concentrated
in its capital, Beirut. It ranks 12 out of 21 in the Mediterranean in terms of GDP and Human
Development Index (HDI). Lebanon is characterized by a service-oriented economy with a weak
agriculture sector. Major sub-sectors are commerce, tourism and financial services (Pinello &
Dimech, 2013).
Coastal zone is considered the richest but at the same time the most endangered area of Lebanon.
The majority of industrial, commercial and financial activities of the country as well as the largest
cities are concentrated in this area. In a corridor of 500 meters wide along the coastline, 40 % of the
surface is absorbed by urbanization and 41 % by agricultural uses, while 19 % remain natural areas
(beaches, dunes, etc.) (DAR-IAURIF, 2010).
Creeping political paralysis has rendered the three branches of government either vacant or
ineffective. Moreover, the collapse of public services, such as electricity, water supply and a visually
powerful garbage crisis that has left piles of it uncollected on the streets, led to sizable popular
demonstrations. Lebanon continues to face momentous challenges emanating from the war in Syria,
including hosting the largest assembly of Syrian refugees, in proportion to the population
(Government of Lebanon & United Nations, 2017).
Notwithstanding the political dysfunctionality, improved security conditions have provided a boost
for economic activity in 2015. Growth has been driven by a resurgent tourism sector and continued
expansion in private lending as Banque du Liban (BdL) renewed its stimulus package in the amount of
$1 billion this year; tourist arrivals increased by 16.6 percent, year-on-year, in the first eight months
of 2015, compared to a mere increase of 0.7 percent during the corresponding period in 2014. On
the other hand, the real estate sector has acted as a drag on growth, with construction permits and
cement deliveries contracting by about 18.8 percent and 16.7 percent, respectively, during the first
seven months of 2015 (World Bank, 2015).
The agriculture and fisheries production sector play a minor role in the economy. It contributes to
about 5 percent of GDP and 8 percent of the effective labour force, meeting an estimated 30 % of the
domestic food demand and it has been constant in the past ten years (FAO, 2017).

59
Socioeconomic Context
Infrastructures: Transports Lebanon had about 22,000km of roads in 2001 of which 30 percent are classified and fall under the
authority of the MOPWT, while the remaining 70 percent (about 15,400km) are non-classified roads
governed by municipalities. International roads make up less than 10 percent of the “Classified road
network,” which has increased in length by about 5 percent from 1995 to 2001. “Rural roads”
account for over 70 percent of the Non-classified road network, which totals about 15,269 km
(Darwish & Timberlake, 1999). Internal roads, town roads, and village roads are the other categories
of non-classified roads. The main cities of Lebanon are notorious for persistent traffic delays and high
noise levels. Currently, Lebanon has one of the highest car/people ratios in the world with one car for
every three people (WFP Logistics, 2008).
Beirut and Tripoli host Lebanon’s two largest commercial ports. The total number of cargo vessels
and tankers docking at these two ports has steadily declined from 3,887 ships in 1996 to 3,054 ships
in 2000. At the same time, the Tripoli port has been receiving a larger proportion of the total number
of ship arrivals (ECODIT/MoE/LEDO, 2001).
Land, sea, and air transport cause significant and diverse impacts on the environment. Most
transport infrastructure (in particular roads and harbours) was built without any regard for the
protection of landscape and natural resources. Over time, people build residential and commercial
facilities with direct access to the roads, causing increased traffic congestion, travel delays, accident
fatalities, noise and additional air pollution. The maintenance and renewal of the transport fleet
generate each year thousands of tonnes of used oils, old tires, and ballast waters that are often
dumped indiscriminately into the environment (ECODIT/MoE/LEDO, 2001).
Infrastructures: Energy Lebanon currently faces a serious energy challenge associated with fulfilling its social and economic
development goals because of a lack of domestic energy resources, reduced generation capacities
and the growing demand for energy. The demand for electricity in the country for 2008 was around
2,300 MW and Electricité du Liban (EDL), the public establishment generating, transmitting and
distributing electricity to all Lebanese territories, is incessantly struggling to ensure the continuous
delivery of power with its maximum in the range of 1,500 MW (World Bank, 2009). The energy sector
suffers from years of overall poor governance, weak management of the sector's agencies and high
inefficiencies in its infrastructures including power plants and transmission and distribution
networks. Despite the efforts, the electricity network does not represent a reliable source for the
industrial and commercial sectors, where most end users have been compelled to install and use
their own generation systems to overcome the electricity shortages and ensure the continuity of
their operations.
The electrification rate in Lebanon is about 99.9%, but this high rate is not reflected in the continuity
of power supply and the services provided. The low quality of the country's electricity services as well
as supply shortages and hazards have forced many consumers to meet their needs through other
generation sources especially in the industrial sector where for each 1 MW supplied by EDL a 2 MW
backup generator has been installed (ALI/LCEC, 2006). Energy sector constitutes a heavy burden on

60
the country’s economy and, because this situation persists, many consumers have considerably
invested in backup generators, which have significantly affected the country's efficiency in terms of
power generation (World Bank, 2009).
Lebanon does not produce oil or coal and most of its energy needs, i.e. mainly petroleum products,
are imported. Renewable energy options are available including tides and waves, geothermal energy,
solar energy, wind energy, hydropower, biomass and energy from non-separated waste; however,
these resources are not widely used. Altogether, hydro, combustion/renewable/waste (CRW) and
geothermal/solar/wind power only represented 4% of the country's energy balance in 2006 (World
Bank, 2009).
EDL supplied electricity to 23 ports/landing sites. Four ports had standby electrical generators, which
were enough for the whole port in Jbeil and Beirut-Dalieh Ports, for the fish auction at Ouzai Port,
and for the Syndicate building at Dora Port (CANA-CNRS, 2011).
Population The cultural and linguistic heritage of the Lebanese people is a blend of both indigenous elements
and the foreign cultures that have come to rule the land and its people over the course of thousands
of years. About 93% of the population of Lebanon includes numerous Muslim sects and Christian
denominations. Because the matter of religious balance is a sensitive political issue, a national census
has not been conducted since 1932, before the founding of the modern Lebanese state.
Consequently, there is an absence of accurate data on the relative percentages of the population of
the major religions and groups (Department of State. U.S. Government, 2005). The only recent (post-
war) statistics available are estimates based on studies made by private organizations. There are
from 8.6 to 14 million Lebanese and descendants of Lebanese worldwide (Rolland, 2003).
The biggest study made after the independence on the Lebanese Population was made by the
Central Administration of Statistics under the direction of Robert Kasparian and Mgr. Grégoire
Haddad's Social Movement: "L'enquête par sondage sur la population active au Liban en 1970" ("The
survey on the active population in Lebanon in 1970"). It was conducted on a sample of 130,000
individuals. Lebanon demographic profile according to the CIA World Factbook (Central Investigation
Agency, 2017) are shown in table 8.
Lebanon, already struggling under complex political and socioeconomic fragility, is currently hosting
1.5 million Syrians who have fled the conflict in Syria (including 1.017 million registered as refugees
with the United Nations High Commissioner for Refugees (UNHCR), along with 31,502 Palestine
Refugees from Syria, 35,000 Lebanese returnees, and a pre-existing population of more than 277,985
Palestine Refugees in Lebanon (Government of Lebanon & United Nations, 2017).

61
Table 8. Lebanon demographic profile (Central Investigation Agency, 2017).
Population 6,237,738 (July 2016 est.)
Age structure 0-14 years: 24.65% (male 786,842/female 750,449) 15-24 years: 16.73% (male 534,040/female 509,663) 25-54 years: 44.44% (male 1,401,857/female 1,370,462) 55-64 years: 7.54% (male 220,020/female 250,288) 65 years and over: 6.64% (male 181,627/female 232,490) (2016 est.)
Dependency ratios
total dependency ratio: 47.3 youth dependency ratio: 35.4 elderly dependency ratio: 12 potential support ratio: 8.3 (2015 est.)
Urbanization urban population: 87.8% of total population (2015) rate of urbanization: 3.18% annual rate of change (2010-15 est.)
Literacy definition: age 15 and over can read and write total population: 89.6% male: 93.4% female: 86% (2007 est.)
Employment In Lebanon, social protection interventions include social insurance and labour market interventions
(including contributory schemes such as pensions), social services (access to services such as health
and education), and narrowly targeted social assistance programs (Le Borgne & Jacobs, 2016).
However, these programs reach only a small share of the population, which typically does not include
fishers’ communities. There is neither a contract of employment in Lebanon nor any social security
cover, which could protect fishers in case of disability, loss of employment and retirement
(PescaMed, 2011). Thus, fishers remain heavily reliant on their earnings, possibly on private safety
nets (such as remittances) or the credit system (see the paragraph Credit system).
In recent years, the supply of low-skilled workers has grown rapidly also due to the Syrian crisis
(resulted in a large influx of refugees into Lebanon), lowering incomes for low-income and poor
Lebanese. The jobs that have been created have typically been of low quality (for example, low skills,
often informal) and gone predominantly to foreign workers (e.g. labourers in the construction sector)
(Le Borgne & Jacobs, 2016). In 2012, the marine fisheries sector employed 3,200 people (Pinello &
Dimech, 2013) with the bulk of the sector operators being Lebanese (Majdalani, 2005).
Credit system Although Lebanon performs well regionally in lending to small and medium enterprises (SMEs), the
country’s conservative lending culture limits access to credit, although this is partially mitigated by
incentive programs of the government and the Banque du Liban (BdL). Lebanese firms depend
significantly on the banking sector for their financing, as 53 percent of all firms, 50 percent of small
firms, and 63 percent of medium-size firms report having received a bank loan. Overall, domestic
commercial banks provide 24 percent of firms’ working capital finance and 39 percent of their
investment finance. Notwithstanding, access to credit remains among the top constraints to business
and growth as identified by Lebanese SMEs (World Bank, 2016). In addition, accessing credit remains
a challenge because the value of required collateral is significantly high. In Smaller firms are facing

62
major difficulties obtaining business loans from banks, resulting in a reduced amount of bank lines of
credit and loans, less bank financing of investment and working capital, and more internal sources of
financing (World Bank, 2016). Some bank credit facilities are virtually available also for
microenterprises and fishers. Few banks offer small credit and none does it without any collateral.
Therefore, only those fishers who own a boat or some other valuable good, can afford to ask for a
loan. The interest rates vary between 25% and 30% according to the length of the repayment period
(normally 16/18 months) and the amount of the instalments (PescaMed, 2011).
The most common credit facility serving fishing communities is the one provided by the fish sellers.
Besides the yearly grant that some of them usually give to fishermen, they are often available to lend
them extra money during the year. In 2010, the amount was generally limited to 300-400 USD and
normally with no interest charged (PescaMed, 2011). Repayment schemes are very flexible, but the
only obligation fishermen have is to sell their fish to their moneylenders (Ricerca e Cooperazione
NGO, 2005). Several micro credit programmes have been started in some fishing ports by local NGO
and International Cooperation Agencies, with alternate results. Other credit facilities available for the
fishing communities are Micro-Credit in such as Al Hasan and Al Majmoua. They usually rely in strong
commitments and high rate of repayment (Ricerca e Cooperazione NGO, 2005).
Environmental Context
Physical environment Lebanon is one of the smallest countries in the world having area of 10452 km2 (United Nations
Statistics Division, 2016). It is a predominantly mountainous country located in the Levantine basin of
the Mediterranean Sea, bordered by Syria from the north and east. Lebanon has also a large
hydrological network of 2000 rivers including a dozen running through the Lebanese coast and which
consequently play an important role in the quality of marine coastal waters. The Lebanese coastline
is relatively short - about 225 km (Central Intelligence Agency, 2013) - with the coastal zone showing
high population density. 55 percent of the total population lives there, across a territory that hosts
33% of all built-up areas (GFCM, 2014). The Lebanese continental shelf is relatively narrow rarely
extending beyond an 8 kilometers strip from the coast, with the exception of the wider shelf in North
Lebanon (GFCM, 2014)(Figure 13). Along the entire margin the continental slope is incised by an
intricated system of canyons, most of which being associated to rivers flowing from the mountains
(Sursock, et al., 2014).

63
Figure 13. Bathymetric mapping of the Lebanese coast at depths greater than 200 meters. Sea Floor Relief Map Scale 1:200.000 The Shalimar Cruise IFREMER-IPGP-CNRS (2003). Modified from (CANA-CNRS, 2012).
In general, Lebanon enjoys a typical Mediterranean climate with two very contrasting seasons: a
winter that is cold and heavily wet and a summer that is long, hot and dry and two intermediate
seasons (spring and autumn). Along the coast, winters are relatively mild and rainy where the annual
temperature is relatively low, around 13 to 15°C (Abboud Abi Saab, et al., 2012). In some cases, this
temperature can decrease up to 30°C or 4°C especially in December and January. During summer,
temperatures are relatively high and can reach 30 to 35°C and even a 38°C temperature was
observed in July and August (Administration Centrale de la Statistique, 2006; Abboud Abi Saab, et al.,
2012). Moreover, according to (Abboud Abi Saab, et al., 2013) the mean monthly variation of sea
surface temperature between 2000 and 2012 varied between a minimum of 17.82°C in March and a
maximum of 29.71° C in August, and the mean monthly variation of air temperature varied between
a minimum of 12.4°C in January and a maximum of 27.59°C in August (Figure 14). The diurnal range
remains close to 7°C throughout the year (Abboud Abi Saab, 1985).

64
Figure 14. Mean monthly variations for 2000-2012 period of Sea Surface Temperature (SST) and Air Temperature (AT) in Lebanese marine waters (eastern Mediterranean) (Abboud Abi Saab, et al., 2013).
Biodiversity The Lebanese coastal waters are characterized by thermophilic biota of Mediterranean and Indo-
Pacific origin (Abboud-Abi Saab, et al., 2013; Bitar, et al., 2007). The local biodiversity is undergoing
rapid alterations under the combined pressures of climate change and human impact. Native marine
flora and fauna are competing with invading organisms originating from the Indo-Pacific and Atlantic
oceans (Abboud – Abi Saab, 2012). The features of the Lebanese coastline with no closed bays or gulf
consent to coastal waters to continuously mix thus preventing conditions of eutrophication and to
disperse nutrients and pollutants.
The status of marine biodiversity in Lebanon was assessed in 1996 within the Biological Diversity of
Lebanon - Country Study Report (BDL-CSR) (Hamadeh, et al., 1996) and then reviewed through
several published and unpublished papers. According to the (Hamadeh, et al., 1996), the country's
coastal sea comprising 1685 species, including 367 fish species, 50 of which are of commercial
interest. Phytoplankton encompasses 580 species whilst the zooplankton accounts for the largest
share of marine faunal diversity with more than 747 species recorded (Hamadeh, et al., 1996). The
microzoobenthos is represented with 12 known species whereas the macrozoobenthos is diversified
and encompass 662 species (Bitar & Kouli-Bitar, 2001).
Other families of marine organisms include seven species of cephalopods (octopuses, cuttlefish and
squids), at least three species of reptiles (loggerhead, green and leather-back marine turtles) and five
species of mammals (dolphins and porpoises and, less common in local waters, whales and seals).
The information on the conservation status is mainly available for selected species (turtles and
cetaceans). The Biodiversity Country Study identified submerged rocky, sandy and grassy habitats as
well as sciaphile, photophile, endofauna and epifauna communities, including 68 threatened species
(MoE/ECODIT, 2010).
In 2012 and 2013, within the context of the MedMPAnet research project, commissioned by UNEP
and carried out by the Regional Activity Centre for Specially Protected Areas (RAC-SPA),
approximately 436 six low taxa (at the level of species, genus or family) of megabenthic organisms

65
and nekton, belonging to 21 high taxa (phyla, classes) were observed and reported (RAC/SPA -
UNEP/MAP, 2014) (Figure 15).
Figure 15. Number of species/taxon observed in the two Lebanon missions (06/2012, 08-09/2013) (RAC/SPA - UNEP/MAP, 2014).
77 non-indigenous species were reported (17.6 percent), 75 of Indo-Pacific origin and 2 of Atlantic
origin (Oculina patagonica and Percnon gibbesi); 24 species (31 percent) were molluscs, 16 species
(21 percent) bony fishes and 7 species (9 percent) Rhodophyta (RAC/SPA - UNEP/MAP, 2014). The
number of newly reported species continues to increase also due to the contribution of newcomers
of Mediterranean origins (Mamish, et al., 2012). In fact, the fine jellyfish Aequorea forskalea was
reported in 2016 in the waters facing Beirut (CANA-CNRS, 2016)(Figure 16).
Figure 16. A new arrival in Lebanese waters, the jellyfish Aequorea forskalea, observed in the coastal area of Beirut on April 2016. First record in Lebanese coastal waters. (Photo Ali Baddreddine). Source (CANA-CNRS, 2016).

66
Protected areas Two marine natural reserves have been established in Lebanon: the Palm Islands Nature Reserve
(Decree 121, 09/03/1992) in the north and the Tyre Coast Nature Reserve (Decree 708, 05/11/1998)
in the south (Lebanese Ministry of Environment / IUCN, 2012).
Palm Islands Nature Reserve (PINR) is located in the proximity of the city of Tripoli. It is made up of 3
islands: Sanani, Ramkine and Palm. PINR covers an area of nearly 4.2 km² (Lebanese Ministry of
Environment / IUCN, 2012) and it is a resting place for sea-crossing migratory birds and the only site
in Lebanon for sea bird breeding. It has been designated a Mediterranean Specially Protected Area
under the Barcelona Convention, an Important Bird Area by Birdlife Convention as well as Wetland of
Special International Importance (MOE Ministry of Environment, 2017).
Tyre Coast Nature Reserve (TCNR) is a Nature reserve and a Ramsar acknowledged site. Expanding
over 380 ha, the reserve includes the largest sandy beach in Lebanon. Tyre Coast Nature Reserve
hosts many species of plants, animals and insects. It is a nesting site for the endangered Loggerhead
and green sea Turtle and the shelter of the Arabian spiny mouse and many other important
creatures. The TCNR is also located on major migratory routes where internationally important bird
species have been identified. It is a Ramsar site (No. 980) since 16/04/1999 (Lebanese Ministry of
Environment / IUCN, 2012). Management plans aiming at the protection and the conservation of the
reserve were prepared by the MoE (Peillen, et al., 2012).
A “national maritime protected zone at the Oceanographic & Fishing Institute in Batroun” was
established by Minister of Agriculture by Decision 129/1 of 1991.
Fisheries Sector
Lebanese Fisheries Overview Lebanon’s fisheries sector is composed of a little artisanal fishing fleet, namely 2,005 licensed vessels
(in 2015 according to the DFW) predominantly operated by rather aged fishers using old boats with
dated equipment (Pinello & Dimech, 2013). Most of the boats are motorized and below 12 m in
length using fishing techniques mostly based on passive gears such as gillnets, trammel nets,
longlines, and purse seines. Fishing operations are mostly carried out at depths of up to 50 m (Sacchi
& Dimech, 2011; Brême, 2004; Lelli, et al., 2007). Few vessels are equipped with GPS, while the rest
have very limited navigational or safety equipment (Majdalani, 2004; Sacchi & Dimech, 2011).
Lebanese coastal waters contain a significant richness of marine organisms with more than 80 fish
species being of commercial importance (Nader, et al., 2012). Illegal fishing behaviours and harmful
or unsustainable practices such as the use of small mesh nets and explosives thrive as a result of an
outdated legislation and the lack of its enforcement (Sacchi & Dimech, 2011). Lack of urban and
industrial waste management along with the absence of an effective sanitation network are
contaminating marine and fresh waters. Coastal areas are subject to uncontrolled urban sprawl and
increasing processes of artificialisation. It is widely agreed that human activities are affecting in a
worrying manner the narrow coastal area environment leading to a critical increase in its exposure to
geological hazards. Human pressure on the coastal area, along with the low public investment in the
sector during the past decades have narrowed the economic value of the sector and therefore
negatively affected fishers’ lives (DAR-IAURIF, 2010; UNDP, 2012; World Bank, 2011;
MoE/UNDP/ECODIT, 2011).

67
Despite its chaotic management, the Lebanese fishing sector represents a unique case in the
Mediterranean, being the only one solely composed by small-scale artisanal vessels. Due to its
geographical location, Lebanon represents also an outpost for a comprehensive understanding of the
dynamics driving the colonization of the Mediterranean by Indo-Pacific and Red Sea species. The
knowledge on the impact of Lebanon’s fleet on fisheries coastal resources – both non-indigenous and
endemic - is still very limited though, being available only scattered information on distribution,
abundance and biological characteristics of few fish and shellfish stocks (Colloca & Lelli, 2012; Lelli,
2007; Carpentieri, et al., 2009; Bariche, et al., 2006; Bariche, 2003; Nader, et al., 2014; Nader, et al.,
2012; George, et al., 1964).
Lebanon is moving its first steps in the fulfilment of international requirements in terms of data
collection on its halieutic resources through stocks, catch and effort assessments (FAO EastMed,
2014). International organizations and donors have granted funds and capacity building to develop
adequate research programmes to support the capability of the Lebanese Government to define new
measures towards an appropriate and sustainable management of fishing resources.
Fishing fleet, gears and grounds
The bulk of the fishing fleet is made up by multipurpose artisanal vessels known locally as flouka, a
small 3 - 15 m fishing craft, customarily made of wood, generally undecked; and with/without
inboard or outboard engines (Majdalani, 2005). In 2015, the DFW reports the average fishing vessel
length of licensed fishing vessels as 7.2 m with 546 vessels smaller than 6 m LOA, 1,420 vessels 6 to
12 m LOA and 39 vessels bigger than 12 m LOA.
Fishing grounds are bounded by law between 500 m to 6 nm from the shoreline and outings are
limited to 24 hours per fishing trip. 78 percent of fishermen fish within 3 nm of the coast with less
than 10 vessels operating beyond the 6 nm (Majdalani, 2004; Sacchi & Dimech, 2011). Fishing
techniques in Lebanon consist mainly of passive gears such as gillnets, trammel nets, longlines, purse
seine nets, lampara nets and beach seines. Table 9 summarizes major characteristics of the gears in
use in Lebanese fisheries.

68
Table 9. Fishing gears in Lebanon. Modified from (University of Balamand, 2016).
GEAR DESCRIPTION SPECIES TARGETED
Small mesh size gillnet
Has a 32 mm stretched mesh size and is made of a 0.33 mm
diameter PA monofilament. The length of each net is about
50 m and the stretched height is 3 m. Gillnets are set
between 10 and 50 m depth for a short soaking time (less
than 12 hrs)
Demersal species and
small pelagic
Medium mesh size gillnets
These gears have a stretched mesh size ranging between 48
and 120 mm built with a single wall of monofilament net.
Their length ranges between a few hundred meters to more
than 1,000 m
Demersal species and
small pelagic
Large mesh size gillnet
The nets are made of a mesh size ranging between 140 and
180 mm with 1.5 mm diameter built from a single wall of
monofilament or multifilament net. Their length is from 300
to 1,000 m and height up to 13 m
Large pelagic species
Encircling gear
Trammel nets are used with an inner panel mesh size of 28 to
40 mm and of 150 to 1,000 m in length and 1.2 to 2 m in
height, at depth between 5 to 50 m, are used for bottom
species. The nets are generally made of PA multifilament or
monofilament of 210/1 to 210/2 (approx. 40.000 m/Kg)
Demersal species and
small pelagic
Longlines Bottom longlines consist of blue PA monofilament mainline
to monofilament snoods with hooks of about 1 m long,
attached at regular intervals (around 5-6 m)
Demersal species
Traps Have triangular meshes and have 30 mm bar mesh size Demersal species
Lampara net Is a part of surrounding nets not having a purse line system in
order to close the bottom part of the bag. The net is made up
of PA multifilament panel of 10 to 14 mm stretched meshes
and it is composed of two lateral wings framing a central
“bunt”, made of the smallest meshes and thickest twine. The
total length can reach up to 200 m and the height not more
than 25 m
Small pelagic species
Purse seines “shincholas”
Used at a maximum depth of 50 m. The nets are made up of
PA multifilament of 210/2 to 210/6 and of 10 to 14 mm mesh
sizes
Small pelagic species
Handline“Boulis” Line with several hooks at its end, rolled on a small wooden
piece
Demersal species
Drifting Longlines “Jarjaras”
Uses large hooks 83 mm in length and 30 mm in width. Not
commonly used between fishermen
Large pelagic species
Source: Sacchi & Dimech ( 2011)
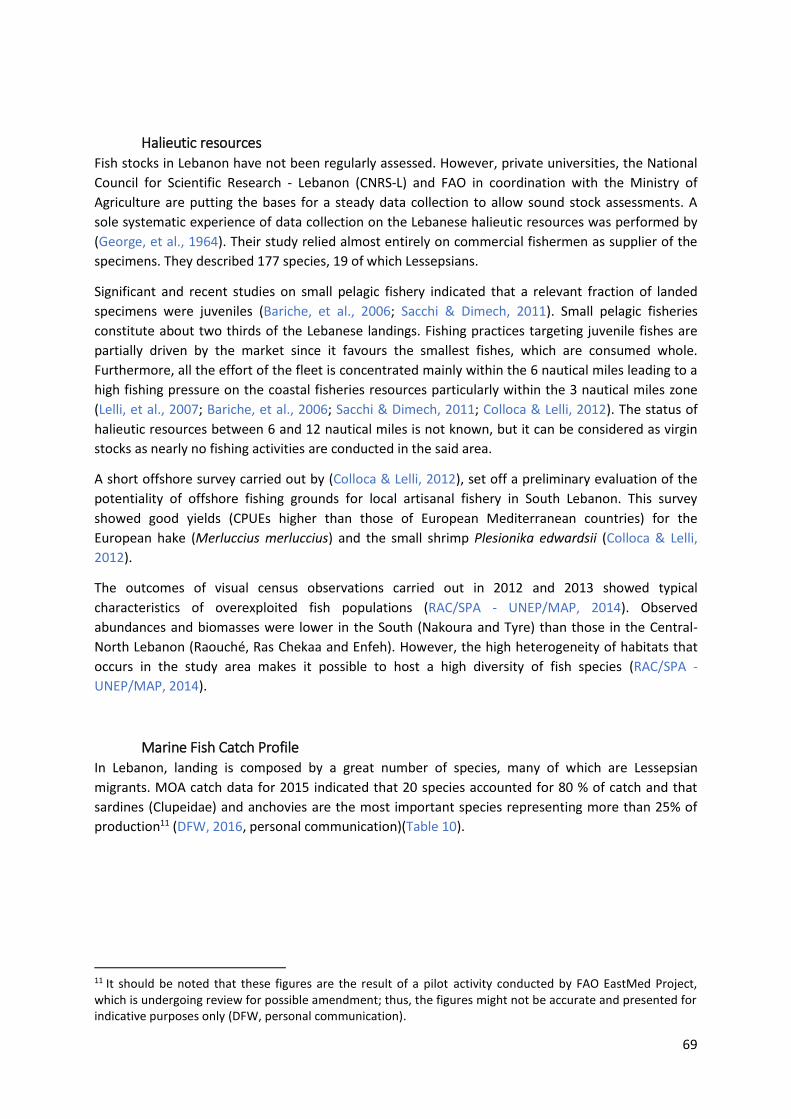
69
Halieutic resources Fish stocks in Lebanon have not been regularly assessed. However, private universities, the National
Council for Scientific Research - Lebanon (CNRS-L) and FAO in coordination with the Ministry of
Agriculture are putting the bases for a steady data collection to allow sound stock assessments. A
sole systematic experience of data collection on the Lebanese halieutic resources was performed by
(George, et al., 1964). Their study relied almost entirely on commercial fishermen as supplier of the
specimens. They described 177 species, 19 of which Lessepsians.
Significant and recent studies on small pelagic fishery indicated that a relevant fraction of landed
specimens were juveniles (Bariche, et al., 2006; Sacchi & Dimech, 2011). Small pelagic fisheries
constitute about two thirds of the Lebanese landings. Fishing practices targeting juvenile fishes are
partially driven by the market since it favours the smallest fishes, which are consumed whole.
Furthermore, all the effort of the fleet is concentrated mainly within the 6 nautical miles leading to a
high fishing pressure on the coastal fisheries resources particularly within the 3 nautical miles zone
(Lelli, et al., 2007; Bariche, et al., 2006; Sacchi & Dimech, 2011; Colloca & Lelli, 2012). The status of
halieutic resources between 6 and 12 nautical miles is not known, but it can be considered as virgin
stocks as nearly no fishing activities are conducted in the said area.
A short offshore survey carried out by (Colloca & Lelli, 2012), set off a preliminary evaluation of the
potentiality of offshore fishing grounds for local artisanal fishery in South Lebanon. This survey
showed good yields (CPUEs higher than those of European Mediterranean countries) for the
European hake (Merluccius merluccius) and the small shrimp Plesionika edwardsii (Colloca & Lelli,
2012).
The outcomes of visual census observations carried out in 2012 and 2013 showed typical
characteristics of overexploited fish populations (RAC/SPA - UNEP/MAP, 2014). Observed
abundances and biomasses were lower in the South (Nakoura and Tyre) than those in the Central-
North Lebanon (Raouché, Ras Chekaa and Enfeh). However, the high heterogeneity of habitats that
occurs in the study area makes it possible to host a high diversity of fish species (RAC/SPA -
UNEP/MAP, 2014).
Marine Fish Catch Profile In Lebanon, landing is composed by a great number of species, many of which are Lessepsian
migrants. MOA catch data for 2015 indicated that 20 species accounted for 80 % of catch and that
sardines (Clupeidae) and anchovies are the most important species representing more than 25% of
production11 (DFW, 2016, personal communication)(Table 10).
11 It should be noted that these figures are the result of a pilot activity conducted by FAO EastMed Project, which is undergoing review for possible amendment; thus, the figures might not be accurate and presented for indicative purposes only (DFW, personal communication).

70
Table 10. Lebanon estimated catch data for 2015 (DFW 2016, personal communication).
Species / Taxa Annual
Catch (tons) Percent of catch
Clupeidae [Herrings, Sardines nei] 1,033.20 14.1
Euthynnus alletteratus [Little tunny] 687.4 9.4
Pagellus acarne [Axillary seabream] 607.9 8.3
Diplodus sargus [White seabream] 514.1 7.0
Siganus rivulatus [Marbled spinefoot] 463 6.3
Pagellus erythrinus [Common pandora] 302 4.1
Liza aurata [Golden grey mullet] 256.1 3.5
Pagrus caeruleostictus [Blue spotted seabream] 242.3 3.3
Lithognathus mormyrus [Sand steenbras] 213.1 2.9
Sardinella aurita [Round sardinella] 210.1 2.9
Oblada melanura [Saddled seabream] 201.3 2.8
Seriola dumerili [Greater amberjack] 191.5 2.6
Sphyraena sphyraena [European barracuda] 191.2 2.6
Sphyraena chrysotaenia [Yellowstripe barracuda] 147.3 2.0
Siganus luridus [Dusky spinefoot] 139.4 1.9
Boops boops [Bogue] 130.7 1.8
Caranx crysos [Blue runner] 119.6 1.6
Trachinotus ovatus [Pompano] 110.7 1.5
Portunus pelagicus [Blue swimming crab] 105.5 1.4
In 1978, purse seine catches were estimated at 67 percent (4,000 tonnes) of the total fish landings in
Lebanon (Mouneimné, 1978). In the experimental survey carried out by (Bariche, et al., 2006),
Sardina pilchardus and Sardinella aurita composed 28% each of the total biomass while Engraulis
encrasicolus and Scomber japonicus represented 22 and 10%, respectively. The remaining 12% was
made up of twenty-eight other fish species. Between 2006 and 2011 the total fish catch in North
Lebanon was estimated between a maximum of 3,457 tons in 2006) and a minimum of 1,704 tons in
2009. It has to be taken into account that the fishing effort in North Lebanon is directly dependent on
weather conditions, market status and the political situation of the country (Nader, et al., 2012).
As far as demersal species are concerned, Lelli (2007) in the short survey implemented in South
Lebanon in 2006, reported the relatively high abundance of Sargocentron rubrum, Siganus rivulatus
and Fistularia commersoni over the continental shelf and the dominance of Merluccius merluccius,
Phycis blennoides and Centrophorus granulosus in the upper slope. (Carpentieri, et al., 2009)
reported in South Lebanon relatively high catches for Siganus spp., Pagellus spp., Dentex spp. and S.
rubrum. It has been also substantiated the presence of deeper waters assemblages particularly
abundant in red giant shrimps (Lelli, 2014).
Economic traits The Lebanese fishing sector compromise about 0.06 % of GDP (Pinello & Dimech, 2013). The fishing
industry generated a net profit of USD 4.6 million. The revenue of the fleet provided an average
annual salary of about USD 4,300 (on a full-time equivalent basis) which is below the Lebanon’s
minimum wage for the manufacturing sector (FAO EastMed, 2016). In 2011 the annual salary was

71
approximately USD 3,000/fisher to about 3,229 fishers and a gross income of USD 7,400/fisher-
owner (Pinello & Dimech, 2013). The sector employs in Lebanon a minimum of 4,475 fishermen
operating in the fishing fleet, while the average number is 6,480 and increases to 9,575 fishermen
during the peak season (Majdalani, 2005). 2012 data indicated that the marine fisheries sector
employed 3,200 people (Pinello & Dimech, 2013). In 2011, the Lebanese fleet landed an estimated
4,850 t with a value of 26.98 Million USD (Pinello & Dimech, 2013). According to DFW, in 2014,
Lebanon started reporting to FAO, fisheries catch data (2,998 tons in 2014 and 3,483 tons in 2015)
based on the system developed by FAO EastMed Project.
Considering the local consumption of about 35.000 tons, more than 75% of the consumed fish is
imported from abroad. Marine capture fisheries compromise about 0.06 % of the Lebanese GDP
(Pinello & Dimech, 2013). The fishing industry is reliant on the exploitation of small pelagic species.
Fisheries in Lebanon are small-scale fisheries and are based on bottom stationary gear (trammel nets
and longlines), purse seine nets (lampara) and beach seines. Fishing operations, with the exception of
longlines, are mostly carried out at depths of up to 50 m (University of Balamand, 2016). Most of the
fishing nets have small mesh sizes i.e. less than 2x2 cm (Majdalani, 2005).
The fish production is marketed, besides auctions, on port stalls, by licensed and/or unlicensed shops
and fish stalls, directly by fishermen, as well as by street vendors. Local production is sold fresh for
human consumption. A shrimp farm is the only business that freezes its products (Majdalani, 2013).
In 2005 there were fish halls for sorting, packing, selling and icing fish at 16 port/landing sites along
the Lebanese coast. The only canning plant in Lebanon was decommissioned due to lack of supply of
sardines and tuna (Majdalani, 2005). The Central Fish Market (Quarantina-Beirut) attracts fish from
all over Lebanon and most imported fishes.
67% of the first-sales occur through indirect sales (mainly the auction markets), while 23% through a
direct transaction (about two third through fishmongers and the rest sold directly to the final
consumer). Ten percent of the production was sold using so-called ‘other’ channels, and in most
cases, they were related to self-consumption (Pinello & Dimech, 2013). Purse seiners, which are the
biggest and most productive vessels, sold most part of their production through indirect sales
whereas the fleet segment minor gear < 6 m LOA sold one third of its production through direct
transactions, which include also the sale to restaurants (FAO EastMed, 2016).
In 2005, there were fish auctions at the ports of Dora, Ouzaii, Saida, Tripoli and Sour. With respect to
cold storage facilities, seven fish halls were equipped with chill rooms/refrigerators and twelve with
ice (PescaMed, 2011). The ice was mainly present as crushed, being ready made from commercial
suppliers. No fish hall had iceboxes for sale to fishermen, processors, and households, thus,
fishermen had to resort to buy such items from local vendors. Only the ports of Qalamoun, Saida,
and Naqoura Ports were equipped with ice crusher machines (Majdalani, 2004; PescaMed, 2011).
Within fishers, planning and forecasting capabilities are limited, as the immediate needs are a matter
of mere survival. Let aside the minimum spent for food and few other necessary items, the priority is
given to the expenditures related to the income generating activities (in this case nets, baits, etc).
Schooling can be an arduous issue and health a burden that only few families can afford without any
external support. Therefore, many fishermen integrate their incomes through different occupations
that are usually not related to the fishing sector. Indeed, for some of them, fishing activities become
secondary income generating occupations (Pinello & Dimech, 2013).
According to figures published by the Lebanese customs administration combined with the figures
produced by (Pinello & Dimech, 2013), Lebanon imports 78% of the consumed seafood products. The

72
export versus import is negligible, which means that the domestic production accounts for about
22% of the seafood products consumed in the country, makes the country highly dependent on the
import. In 2011, the average value of the seafood import was 4.2 $/Kg, while the average value of
the animal products in general was 3.0 $/Kg. The annual production from marine capture fisheries is
evaluated at 4,632 tonnes and 803 from aquaculture. For the same year, the apparent per capita
seafood consumption was 6.03 Kg, which is about one third of the average figure for the
Mediterranean in 2005 (Pinello & Dimech, 2013).
Fisheries management The management of the Lebanese fisheries and aquaculture sectors is the responsibility of MoA,
which includes a Department of Fisheries & Wildlife. At local and professional level, the fisheries
sector in Lebanon is represented by 34 fishermen cooperatives under the General Cooperatives
Union grouping around 43% of vessel owners/operators (University of Balamand, 2016). In general,
they do not function as a collective according to a defined plan but mainly based on the initiatives of
individuals. This makes such cooperatives unable of making proper decisions for the benefit of
fishermen (CANA-CNRS, 2011). As for fishermen syndicates, five are active in the country (North,
Beirut, Ouzaii, Saida and South) (University of Balamand, 2016). The role of syndicates is to lobby for
the improvement and development of the sector within Government.
There is no national collective labor agreement in force for the operators of the sector.
Fisheries management measures and institutional arrangements applied to main fisheries (Majdalani, 2013) at first glance:
Technical measures
Closed season:
o Purse seines: January 1 - April 15
o Fyke nets: May 15-September 15
Closed areas:
o Ban of fishing within 500m from coastline.
Fishing gear
o Beach seines: banned
o Air compressors: banned
o Mesh size control: minimum mesh size 2 x 2 cm except for purse seine nets that can be of lower mesh size.
Nature reserves:
Palm Islands (North Lebanon)
Tyre Coast:
Establishing fisheries restricted area at Oceanographic & Fishing Institute in North Lebanon
Economic incentives:

73
Taxes: no taxes levied on fisheries products
Other measures:
Establishing "minimum landing size" for many commercial species.
Regulation of Fyke Nets
Ban on fishing, sale and consumption of Lagocephalus species
The main ministries dealing with the fishery sector are the following:
Ministry of Agriculture (MOA): it was created in 1943, is mandated to regulate and supervise duties
related to agricultural wealth and soil preservation, control of hunting (in collaboration with Ministry
of Environment), fishing, use of pesticides, conservation of protected forests, reforestation of state
and private lands and the implementation of laws and regulations such as the Forests and Fisheries
laws. Within it, the Department of Fisheries & Wildlife (DFW) is responsible for the management of
the fisheries sector. Decree No. 5246 “Organization of Ministry of Agriculture” issued on 30/6/1994
defined the role of DFW (University of Balamand, 2016) as:
Marine and freshwater fisheries and game hunting affairs.
Applied research on aquaculture and establishment of training centres in different locations
and at its Institute of Oceanography and Fisheries at Batroun.
Fishing licenses.
Establishing and modernizing fishing ports and fish handling facilities in coordination with the
Ministry of Transportation.
Regulating the fishing sector by assigning fishing seasons and protected areas.
Organizing and regulating diving clubs and protected areas.
Improving the livelihood of fishermen by organizing cooperatives and syndicates.
Carrying applied research on aquaculture.
Developing and modernizing fishing techniques.
Providing training on fishing boats.
Preparing extension programs.
Hatching and distributing adaptable fish species.
Running trials on local and introduced fish species.
Surveying game species.
Preparing general guidelines to preserve game species and regulate its hunting in
coordination with the Ministry of Environment (MOE).
Growing of game species and running trials on them.
Enforcing fishing and game hunting laws and regulations.

74
The first law the fisheries sector is Law No. 1104 (issued by Decision) promulgated on 14/11/1921:
Prevents fishing inside harbors and docks except fishing with rods and lines with a maximum
of two-hook.
Bans dumping all materials that would spoil the water or agitate, intoxicate and/or poison
the fish in the coast or in the harbors designated for fishing.
This ban applies also to the industrial plants on the coast regarding disposing their wastes
into the sea except in accordance with the terms of the permission that they request.
Forbids the use of explosives in fishing.
Bans the use of firearms for fishing without special permission and every firearm found in
fishing vessels will be impounded.
Forbids pushing the fish into the nets by muddying the waters by any means.
Since 1921, several laws, decrees and decisions related directly to fisheries were promulgated with
the most relevant being Law No. 2775 “Monitoring of coastal marine fishing” passed in 1929. This
law manages the fishing sector by:
Identifying fishing – Delimiting Coastal Fisheries – Monitoring Coastal Fisheries – Designated
staff.
Various Prohibitions – Prohibited places- Prohibited times - Types of overfishing.
Fishing gears – prohibited gears.
Measures related to the organization and monitoring of fisheries and fishing by several
vessels.
Special provisions related to safeguarding juvenile fish and conservation of fish and shellfish -
Minimum sizes of fish and shellfish to be fished, transported and sold.
Prohibited baits – various prohibitions.
Arrangements and precautions related to fishing operations.
Measures for practicing fishing by rod and line.
Fees for fishing licenses and fishing gears.
Aquaculture Institute.
Penalties.
It is noteworthy to mention that, since 1921, a number of laws were passed by parliament e.g. Law of
19/11/1947 “Subjecting river fishing to licensing”, decrees e.g. Decree 9924 of 20/2/2013
“Organization of Technical Troupe to monitor and control Forests, hunting and fisheries” and
minister decisions e.g. Decision 346/1 of 15/7/2010 “Regulating and defining some fishing types and
gears” in response to technological changes and binding international agreements e.g. GFCM
recommendations. Currently there is a national policy for fisheries management aiming at the
enforcement of laws, decrees and ministerial decisions, notwithstanding the overlapping in related
public authorities. A new Lebanon Draft Fisheries Law was formulated by FAO, GFCM and MOA to
replace Law No. 2775 of 1929. This draft law is a framework law aiming to cover most developments

75
in fisheries and aquaculture sectors and respond to present international legal instruments. This
draft law is still to be passed by Lebanese parliament.
Ministry of Public Works and Transport (MOPWT): MOPWT was given the authority to protect maritime public domains and territorial sea, and to fight all forms of pollution caused by shipping operations, air and noise pollution produced by vehicular traffic. The lack of instrumental and financial resources is considered as a burden towards enabling the Ministry to undertake its duties. MOPWT is responsible for giving permits for the construction and rehabilitation of fishing ports or harbours. It is also responsible for authorizing building of local fishing and recreational vessels. It is also mandated with vessel registration, annual seaworthiness check-ups and sailing licensing for fishing vessels. MOPWT practises its mandate through a number of legal instruments like:
Maritime Trade Law issued on 02/18/1947
Decree number 16225 issued on 13/6/1957: Definition of marine navigation
Decision of 31/1 26/1/1966 “Ratification of Lebanese Ports System”
Decision 77/N/96 issued on 10/7/1996: Organization of sailing of fishing and recreational vessels within the Lebanese territorial waters
Decree 12841 of 7/8/1998 “Organization of fishing and leisure ports, and regulation of their use and safeguarding”
Law 163 of 18/8/2011 “Determination and announcement the maritime areas of the Lebanese Republic”
Decree 6433 of 1/10/2011 “Delimitation of the Lebanese Exclusive Economic Zone”
Ministry of Environment (MOE): MOE is mandated to formulate policies and strategies, fight
pollution from various sources, establish protected areas, and issue conditions for permitting the
establishment of industrial plants. Law 444 of 29/7/2002 “Protection of the Environment” specifies
the mandate of MOE. Moreover, Decree No 5591, issued on 30 August 1994, organises the Ministry
of Environment and it specifies its responsibilities and duties. In specific, Article 11 pointed out to the
presence of the Department for the protection of the Natural Reserves, including the fishery sector
and states the following: “To protect all that is natural and to monitor the environment through the
protection of all the natural resources such as water, soil, air, forests, the seashore, the river and all
its aquatic and terrestrial organisms”. Lebanese legislators has also ratified several legal instruments
like the Law of the Seas.
Ministry of Labour (MOL): Labour Law of 23/9/1946 and its associated legal laws and decrees
prohibits child labour i.e. people under the age of 15 years old are not allowed to practice fishing or
other careers or professions.
The Lebanese legislation concerned with the organization of the fishery sector relates mainly to
monitoring coastal fishing, providing license for fishing in rivers, banning the fishing activity for
certain types of marine species and the use of specific types of fishing nets. Table 11 provides a
summary of the existing laws and regulations related to fisheries and fishing.
Table 11. Laws and regulations related to the fisheries sector in Lebanon. Modified from (University of Balamand, 2016).
REGULATION No YEAR TITLE
Law 1104 14/11/1921 The determination of the coastal zone scope and penalties related to the infringement of fishing rules
Law 144/S 10/6/1925 Definition of Public Domain

76
Law 372 25/6/1926 Regulations relating to navigation, fishermen and fishing boats Law 2775 28/9/1929 Monitoring of coastal marine fishing Law 3178 18/6/1930 The wandering of foreign fishing vessels not covered by the French
Mandate Law 70/L.R 5/5/1937 Regulation of Coastal Fishing Law 86/L.R. 3/5/1939 Safety of maritime navigation and conditions in ships Law 95/L 9/5/1939 Regulating sponge fishing Law 153/L.R. 14/7/1939 Prevention of docking, trawling, use of fixed or dredge nets in the
area where the marine cable wire between Tunisia and Beirut reach land
Law 23/9/1946 Labor Law Law 02/18/1947 Maritime Trade Law Law 19/11/1947 Subjecting river fishing to licensing Decree 11882 3/6/1948 Regulation of fishing in rivers Decree 7993 3/4/1952 Syndicates Regulations Decree 16225 13/6/1957 Definition of maritime navigation Decree 6349 16/3/1961 Organization of Technical Troupe to monitor and control forests,
hunting and fisheries (Repealed by Decree No. 9924 of 20/2/2013)
Decree 8371 30/12/1961 The organization of the Ministry of Agriculture and identifying its Cadre
Law 25/5/1962 Amendment of Article 2 of Law of 5/5/1954 related to marine fishing Decree 10121 20/7/1962 Zoning and licensing requirements for extracting gravel and sand
from the Maritime Public Domain. Decree 17199 18/8/1964 Putting in effect the draft law for cooperative associations. Decree 17614 18/9/1964 Exploitation of Maritime Public Domain not presently exploited. Decree 3401 11/12/1965 Cooperatives
(Repealed by Decree 2989 of 17/3/1972) Decision 31/1 26/1/1966 Ratification of Lebanese Ports System. Decree 4809 24/6/1966 Regulating the occupation of the public maritime domain Decree 4810 24/6/1966 System of occupation of maritime public domain Decree 9791 4/5/1968 Putting into practice the draft law aimed at monitoring the beaches Decree 11541 23/12/1968 Organization of the special service responsible for monitoring the
coast within the Internal Security Forces Decree 11618 4/1/1969 Establishment of Cooperation Division within the Ministry of
Agriculture Decree 15649 21/9/1970 Regulation for extraction of sand and other materials from Maritime
Public Domain and from seabed Decision 93/1 16/6/1971 The conditions imposed on the use of buoys in the field of marine
fishing, swimming and docking Decree 2989 17/3/1972 Repealing Decree 3401 of 11/12/1965 regarding Cooperatives and
replacing it with new provisions Decision 347/1 11/12/1972 Regulation of free diving fishing Legislative Decree
138 16/9/1983 Determining the breadth of the territorial sea areas and the Forbidden Maritime Zones
Law 64 12/8/1988 Conservation of the environment against pollution from harmful wastes and dangerous materials .
Law 89 7/9/1991 Determination of Marine Fishing Licenses fees – 1991 Government Fiscal Budget Law (Annex 9)
Decision 108/1 11/9/1991 Creating a protected fishing and hunting area within the premises of Anjar Centre
Decision 129/1 23/10/1991 Establish a national maritime protected zone at the Oceanographic & Fishing Institute in Batroun
Decision 281/1 19/11/1991 Ban on fishing of sponge for 5 years Decision 209/1 21/11/1991 Organization of maritime navigation, functioning of the ports, the
equivalence of vocation certificates and services required by the Ministry of Public Works and Transport for Maritime Navigation.

77
Law 121 9/3/1992 Establishment of two nature reserves (in some of the islands in front of Tripoli Beach(
Decision 62/1 16/3/1993 Ban of Sardines nets within specific conditions Decision 63/1 16/3/1993 Ban on fishing of sponge for 5 years Decision 229/1 13/10/1993 Regulating the use, under certain conditions, of the newly
introduced Kerkari nets to Lebanon Decision 32/N 24/3/1994 Organization of sailing of fishing and recreational vessels within the
territorial waters and beyond. Decree 5246 20/6/1994 The organization of the Ministry of Agriculture and identifying its
Cadre and conditions of employment in some of the functions for this Cadre and the ranks and salaries of its professional staff (Article 100 – Department of Fisheries & Wildlife)
Decision 183/1 27/10/1994 Ban of fishing in Lake Qaraoun Decision 226/1 14/12/1994 Distribution of fishing nets and gear among fishermen cooperatives
along the Lebanese coast Decision 47/1 13/3/1995 Distributing fishing nets and gear among fishermen co-operatives
along the Lebanese coast . Decision 98/1 19/5/1995 Distribution of nets and fishing gear to development committees in
the places that could not set up cooperatives to date . Decision 60/1 31/7/1995 Defining the specific conditions for the use of Kirkai (Cianciolo) nets Decision 61/1 31/7/1995 Defining the specific conditions for the use of Sardine nets (Lux) Decision 254/1 8/12/1995 Regulating fishing-diving sport Decision 255/1 8/12/1995 Regulating fishing-diving sport institutes Decision 261/1 20/12/1995 Distribution of fishing nets and gear donated by FAO among
fishermen cooperatives Decision 131/1 15/3/1996 Organizing work at Oceanographic and Fishing Institute at Batroun
in collaboration with the National Council for Scientific Research (CNRS)
Decision 156/1 20/3/1996 Forming the Examination Committee to settle the situations of amateur scuba divers
Decision 234/1 20/5/1996 Defining medical form needed to practice scuba diving Decision 71/N/96 3/7/1996 Establishment of marine fishing port in the region of Halat Decision 77/N/96 10/7/1996 Organization of sailing of fishing and recreational vessels within the
Lebanese territorial waters. Decision 324/1 22/7/1996 Amending Decision No. 156/1 of 1996 & Decision 254/1 of
8/12/1995 Decision 119/N/96 8/10/1996 Considering the area of maritime beach a fishing and recreational
port Decision 202/1 14/4/1997 Amending Decision 254/1 of 8/12/1995 regarding regulating fishing-
diving sport Decision 381/1 25/11/1997 The activities Programme of the Oceanographic and Fisheries
Institute in Batroun . Decision 385/1 26/11/1997 Prohibition of fishing in river estuaries along the Lebanese coast Decision 397/1 28/11/1997 Creation of a Fishing and Hunting Guidance Centre at the Institute of
Oceanography and Fisheries in Batroun- Governorate of North Lebanon
Decision 398/1 28/11/1997 Creation of a Fishing and Fisheries Centre at the Institute of Oceanography and Fisheries in Batroun- Governorate of North Lebanon
Decision 1/18 2/2/1998 Establishment of Fisheries & Wildlife Extension Services Centers Decision 50/1 6/3/1998 Settlement of situations for scuba divers holding diving certificates Decision 115/1 23/6/1998 Organization of work at the Institute of Oceanography and Fisheries
and defining the basis for cooperation with the National Centre for Scientific Research (CNRS)
Decree 12841 7/8/1998 Organization of fishing and leisure ports, and regulation of their use and safeguarding
Law 708 5/11/1998 Creation of Tyr Coast Nature Reserve in Jaftlak Ras Al Ain – Tyr Real

78
Estate Zone Decision 279/1 19/11/1998 Ban on catching sea turtles Decision 280/1 19/11/1998 Prohibiting to fish with beach seines along the Lebanese coast . Decision 281/1 19/11/1998 Ban on fishing of sponge for 5 years Decision 290/1 23/11/1998 Defining the use of the sardine nets within specific conditions Decision 291/1 23/11/1998 Restricting the use of Kirkari nets (purse seine) to specific conditions Decision 42/1 24/3/1999 Organization of the hobby of underwater fishing Decision 43/1 24/3/1999 Restricting the use of Sardine and "Cianciolo" nets to specific
conditions Decision 78/1 29/6/1999 Amending article 4 of Decision No. 43/1 of 24/3/1999 regarding
restricting the use of the sardine and Cianciolo nets to specific conditions .
Decision 122/1 21/9/1999 Stop-work for Decision No. 280/1 of 19/11/1998 Prohibiting to fish with beach seines along the Lebanese coast
Decision 125/1* 23/9/1999 Prohibiting fishing of whales, seals and marine turtles Decision 179/1 1/12/1999 Assigning classrooms at the disposal of official vocational
agricultural school at the Oceanographic Institute Decision 19/1 11/1/2000 Creation of a center for fishing, nursery and forestation in Abdeh in
the Governorate of North Lebanon Decision 267/1 27/11/2000 Stop-work for Decision No. 280/1 of 10/11/1998 - Prohibiting to fish
with beach seines along the Lebanese coast until 15/5/2001 Decision 126/1 23/5/2001 Regulating scuba diving sport Decision 147/1 18/6/2001 Delegation of signing of the amateur scuba diving licenses Law 444 29/7/2002 Protection of the Environment Decision 88/1 14/3/2003 Prohibition of fishing by beach seines along the Lebanese coast Decision 127/1 9/5/2003 Stop work for Decision 88/1 of 14/3/2003 that prohibits fishing by
beach seines along the Lebanese coast, until 15/5/2005 Decision 165/2T 23/7/2003 Establishing a Cooperative for coast protection and fishing &
shellfish fishing in the province of Mount Lebanon. Decision 199/2T 19/8/2003 Establishing a cooperative for fishermen in the Governorate of
Mount Lebanon . Decision 321/1 31/10/2003 Stop work for Decision 88/1 of 14/3/2003 that prohibits fishing by
beach seines along the Lebanese coast Decision 15/1 21/1/2004 Legal sizes relating to fishing, transporting, buying and importing
fish, shellfish and crustaceans in Lebanon Law 571 11/2/2004 Permitting the Government to join the Agreement to preserve
cetaceans in the Black Sea, Mediterranean and the Contiguous Atlantic Area
Law 613 20/11/2004 Permitting the Government to ratify the amendments to the Agreement establishing the General Fisheries Commission for the Mediterranean
Decision 54/1 24/2/2005 Permission for Department of Fisheries & Wildlife to catch marine organisms to conduct research
Decision 352/1 3/10/2005 Stop work for Decision 88/1 of 14/3/2003 that prohibits fishing by beach seines along the Lebanese coast for three years
Decision 104/FO 17/11/2005 Repeal of decisions regarding occupying riverine public domain Decision 130/2T 13/6/2007 Establishing a cooperative for fishermen in the Governorate of
Mount Lebanon . Decision 408/1 2/11/2007 Defining types of marine fishing gears Decision 1/1 1/1/2008 Stop-work for Decision No. 408/1 of 2/11/2007 concerned with
defining types of marine fishing gears Decision 93/1 14/3/2008 Regulating scuba diving Decision 459/1 14/8/2008 Establishing a port for marine fishing and excursion in the zone of
Jall Al Bahr-Ain Almrayseh Law 34 16/10/2008 Permission to the government to join the Convention on the
Protection of the Marine Environment and the Coastal Region of the Mediterranean; which are the amendments made to the Protection

79
of the Mediterranean Sea against Pollution. Decision 20/1 15/1/2009 Defining types of marine fishing gears Decision 35/2T 5/3/2009 Establishment of a cooperative for the development of fishing in the
Governorate of the North Lebanon Decision 229/1 12/5/2009 Prohibiting the use of remains of slaughterhouses as feed for fish Decision 346/1 15/7/2010 Regulating and defining some fishing types and gears Decision 676/1 27/7/2011 Prohibiting fishing, transporting, selling and consuming of some fish
species Law 163 18/8/2011 Determination and announcement the maritime areas of the
Lebanese Republic Decree 6433 1/10/2011 Delimitation of the Lebanese Exclusive Economic Zone Decision 952/1 26/10/2011 Hygienic regulations for fresh, chilled and frozen fish transport
vehicles Decision 8/1 4/1/2012 Regulating and defining some fishing types and gears (Fyke nets) Decree 8633 7/8/2012 Fundamentals of Environmental Impact Assessment Decree 9924 20/2/2013 Organization of Technical Troupe to monitor and control Forests,
hunting and fisheries Decision 792/1 16/8/2013 Amending Decision No. 108/1 of 1991 (Creating a protected fishing
and hunting area within the premises of Anjar Centre)
Decision 1154/1 9/12/2013 General conditions to protect cetaceans (repealed by Decision 215/1 of 16/3/2015)
Decision 1160/1 10/12/2013 General conditions for fishing sharks (repealed by Decision 215/1 of 16/3/2015)
Decision 1163/1 12/12/2013 Ban on catching seabirds Decision 396/1* 12/5/2014 Ban on catching seabirds Decision 482/1 9/6/2014 Correction of Article 2 of Decision 396/1 of 15/5/2014 (Ban on
catching seabirds) Decree 639 18/9/2014 Joining the Integrated Coastal Zone Management Protocol in the
Mediterranean emanating from the amendments to the Convention for the Protection Of The Mediterranean Sea Against Pollution which was approved in Barcelona on 06/10/1995 and ratified by Law No. 34 Date 16/10/2008
Decision 1044/1* 25/11/2014 General conditions to protect cetaceans Decision 1045/1* 25/11/2014 General conditions to catch sharks Decision 215/1 16/3/2015 Repeal of Decision 1154/1 of 9/12/2013 and Decision 1160/1 of
10/12/2013 Decision 1234/1 31/12/2015 Amending Decision 952/1 of 26/10/2011 regarding hygienic
regulations for fresh, chilled and frozen fish transport vehicles * In accordance with GFCM recommendations
The main Fisheries Law (Law No. 2775-Monitoring of Coastal Fishing. 28/9/1929) is outdated and
goes back to 1929 during the French mandate for Lebanon. FAO, GFCM and MOA drafted a new law
that was finalised in December 2014 and sent to the Cabinet of Ministers for approval and
forwarding to the Parliament for discussion, amendments and eventual ratification. This Draft
Fisheries & Aquaculture Law contains the following sections:
Section 1 - Terminology
Section 2 - General Provisions on Management of Living Aquatic Resources
Section 3 - Common Provisions for Marine and Inland Fishing
Section 4 - Marine Fishing
Section 5 - Inland Fishing

80
Section 6 - Biodiversity Conservation & Preservation of the Aquatic
Environment
Section 7 - Aquaculture Establishments
Section 8 - Handling and Marketing of Living Aquatic Resources
Section 9 - Fees
Section 10 - Law Enforcement and Penalties
Section 11 - Establishment and Competence of the Division of Fisheries
Section 12 - Final and Transitional Provisions
Annexes 1 & 2: Minimum landing size of marine and freshwater species
With respect to the fishing gears and their technical characteristics there are currently very limited
number of gear regulations and restrictions in the Lebanese fisheries legislation. The legislation
concerns the size of the gear and the mesh and the practices of bottom trawling, static and surface
nets and surrounding gears for small pelagic fishes. The current legislation specifies the following:
- Trawling is banned in Lebanese territorial waters and currently there are no trawlers
registered in the Lebanese fishing fleet register.
- Surrounding gears (purse seine and lampara): Decision 43/1 of 1999 limited the mesh
size to a minimum of 6x6 mm for sardine (lux) nets. Moreover, Decision 20/1 of 2009 defined
net height to be 35 fathoms for Cianciolo/Kerkari nets and 20 fathoms for Sardine nets. The
regulation currently in effect, Decision 346/1 of 2010 that describes the gear (height, light,
depth) and defines the legal season for fishing with purse seine sardine (lux) nets, is
summarized in Table 12.

81
Table 12. Management measures for purse seines fishery. Modified from (University of Balamand, 2016).
MANAGEMENT MEASURES DESCRIPTION EFFECTIVENESS
Needed documents Boat registration deed
Navigation license
Fishing license
Fishermen ID
The major fishing ports are under the
control of the Lebanese Army where
fixed points are positioned
Spatial restrictions (e.g. closed areas,
MPAs, etc.)
Forbidden in depth above 25 fathoms
Fishing activities are allowed beyond 500 m from coastline
Fishing is allowed beyond 500 m from
shoreline. Deep water is a major
challenge as continental shelf is
narrow
Temporal restrictions (e.g. closed
seasons)
Forbidden from January 1st till April 15th
Forbidden during the day
Fishermen requested to reconsider
the closure period
Gear restrictions (e.g. forbidden
gears, limits to mesh size, etc.)
Net cannot be higher than 25 fathoms
Mesh: > 20x20mm (for non-migratory species)
Maximum four lights holders can be used (500 Watt each)
Forbidden to use generators
Purse seines with large mesh size do
not catch targeted species
Minimum fish size 15 cm (Decision 15/1 of 2004) Sardine in Lebanon is commercialized
and appreciated in small sizes. Large
Sardines are not attractive for
consumers
Minimum mesh size There is no minimum limit for migratory species including Sardines according to Law 2775 of 1929
Sardine nets minimum mesh size of 6x6 mm is specified in Decision 43/1 of 1999
Participatory restrictions (e.g.
licensing, TURFs, etc.)
No limits for fishing license number
Limits to fishing capacity (e.g. max.
number of vessels; fleet reduction
etc.)
No limits for boat size and engine power
Others Capture of protected and vulnerable species (Whales, dolphins, marine turtles, sharks and rays, monk seals…)
By catch is accidental in most of the
cases for purse seiners
- For the static gears several regulations exist, which forbid the use of bottom nets for
catching pelagic species and give precise definition of these gears. The minimum legal mesh
size in Lebanon is larger (20 mm bar mesh) than the legal mesh size in several Mediterranean
legislations e.g. the EC regulation n° 1967/2006 for the Mediterranean Sea limits the
stretched mesh size of gillnet to a minimum of 16 mm). There is no limitation on net length
and height in Lebanese legislation.

82
- For longlining hook size is not regulated in the Lebanese legislation.
- For traps the Lebanese legislation establishes the mesh size to 20 mm bar mesh size for
square mesh and 30 mm for triangle mesh trap. There is no limitation of number of traps and
soaking time.
- For other fishing techniques, the Lebanese legislation forbids the use of beach seines
and of air compressors; licenses are issued for spear fishing for recreational activities and its
use is prohibited with scuba diving breathing apparatus. There is no specific regulation for
commercial underwater spear fishing in Lebanon.
- Recreational fisheries: according to existing regulations it is limited to:
Rod and line: with a maximum of two hooks per rod
Underwater fishing for amateurs with spear-guns
Riverine fishing
Scarcity of financial resources and clear and effective policy management have led to neglecting the
potential of the fishery and aquaculture sectors and induced a gradual decline in their productivity as
well that of the standard of living for fishermen and fish workers involved in ancillary activities. On
the other hand, the limited knowledge of market and fish consumption patterns or potentialities in
new harvested or cultivated products, together with the lack of a strategic vision to define priorities,
hamper the creation of job opportunities.
In the last years, the FAO-EastMed-Project in collaboration with the MoA is supporting the
development of regionally consistent fisheries management plans among the Eastern Mediterranean
countries. Within this context, the University of Balamand (UOB) developed a web-based utility
(based on FAO’s ARTFISH software) dubbed FLOUCA Web to collect catch and effort data for the
marine fisheries sector. Data are collected and entered locally by MoA staff. FLOUCA Web offers a
variety of statistical diagnostics that are in line with the requirements of regional and international
fisheries bodies. MOA started reporting catch data to FAO as of 2014. Moreover, the same project
spearheaded collecting socio-economic data for the sector since 2011. FAO-Eastmed is also
collaborating with the CNRS-L to put in place a system of data collection of biological parameters of
some flag species in line with the Data Collection Reference Framework (DCRF) issued by GFCM and
it has recently (2016) initiated – in collaboration with MoA and UOB – a bottom-up process for the
development of a management plan for the small pelagic fishery in Lebanon.
Threats According to (Plan Bleu and UNEP, 2000), more than 60 percent of Lebanon’s population lives in the
coastal zone. The impact of population density and economic activities on marine biodiversity is
therefore immense and pose formidable challenges to coastal zone management, including the
conservation of marine resources, and the protection of sea-based livelihoods and the
Mediterranean Sea. The high population density over the coastal zone and particularly around
coastal slums of major cities (MOE & UNDP, 2010), has led to a degradation of the coastal ecosystem
due to wastewater effluents, public discharges and uncontrolled management of the coastal zones
(Faour, et al., 2004; Khalaf, et al., 2009). In 2007, there are 53 identified wastewater outfalls along
the Lebanese coasts and moderately eutrophic areas have been identified (Abboud Abi Saab, et al.,
2008). In addition, dumpsites are found in different areas along the coast. High levels of polycyclic
aromatic hydrocarbons (PAH) were found in sediments and mollusc bivalves sampled in the area of

83
Tyre Marine Reserve, few kilometres south of Tyre (UNEP, 2007). Industrial plants (tannery, steel,
cement, fertilizers, food processing, etc.), tourism settlements, agricultural effluents and oil shipping
(Ricerca e Cooperazione NGO, 2005) are further sources of land-based pollution.
The marine environment has been marginalised for decades and was often managed like an
expendable resource. Short of sufficient inland space, extensive facilities are built infringing on the
public maritime domain and/or protrude into the sea, including wastewater treatment plants,
highways, and sports stadiums. The private sector has also implemented oversized sea-filling projects
for real estate development. These practices are not sustainable and have immeasurable and
irreversible impacts on marine biodiversity and coastal habitats such as altering wave patterns,
preventing sand replenishment, destructing nursery coastal areas and reducing public access (UNDP,
2012).
Fortunately, some particularly destructive such as bottom drifting nets and bottom trawls are not
practiced in Lebanon (Greenpeace, 2010). However, the concentration of fishing effort in a narrow
coastal strip (see paragraphs Lebanese Fisheries Overview and Fishing fleet, gears and grounds),
coupled with the use of harmful practices has led to a likely overexploitation of many coastal
commercial species.
According to (UNDP, 2012), the cost of environmental degradation in Lebanon linked to land and
wildlife resources is estimated at $100 million per year, or 0.6% of Lebanon’s GDP. On the other
hand, the limited knowledge of market and fish consumption patterns or potentialities in new
harvested or cultivated products, together with the lack of a strategic vision to define priorities,
hamper the creation of job opportunities (Samir Majdalani (DWF) personal communication).

84

85
Chapter 4
Distribution, abundance, diversity
and structure of demersal species
exploited by Lebanon’s artisanal
fisheries

86

87
Chapter 4
Part I: Analysis of structure and distribution of
demersal species exploited by Lebanon’s
artisanal fisheries
Part II: Short Communication
Pattern of distribution and diversity of demersal
assemblages in the eastern Mediterranean Sea

88

89
Analysis of structure and distribution of demersal species exploited by Lebanon’s artisanal fisheries
LELLI Stefano 1, 2, 3*, LTEIF Myriam1, JEMAA Sharif1, KHALAF Gaby 1, COLLOCA Francesco5, VERDOIT-JARRAYA Marion 2, 3, 4
1 Lebanese National Council for Scientific Research – National Centre for Marine Sciences (CNRS-L/CNSM), Batroun, Lebanon
2 Université de Perpignan Via Domitia, Centre de Formation et de Recherche sur les Environnements Méditerranéens, UMR 5110, 52 Avenue Paul Alduy, 66860, Perpignan, France
3 CNRS, Centre de Formation et de Recherche sur les Environnements Méditerranéens, UMR 5110, 52 Avenue Paul Alduy, 66860, Perpignan, France
4 Centre de Recherche sur les Ecosystèmes Marins (CREM), impasse du solarium, 66420 Port-Barcarès, France
5 CNR‐IAMC, Mazara del Vallo (TP), Italy
* Corresponding author. E-mail address: [email protected] (S. Lelli)
Telephone: +39 3406871090
ABSTRACT
Lebanon’s fisheries sector is composed of a little artisanal fishing fleet, namely 2,005 licensed vessels
below 12 m in length using fishing techniques mostly based on passive gears. Due to its geographical
location, Lebanon represents an outpost for a comprehensive understanding of the dynamics driving
the colonization of the Mediterranean by Indo-Pacific and Red Sea species. A 3-year experimental
fishing surveys program was conducted. Sampling stations were surveyed by means of
experimental nets lowered up to 300 m depth aiming at assessing the distribution and
abundance of fisheries resources along the Lebanese continental shelf and mid-upper slope. We
deemed fishery-independent survey as the most appropriate tool to provide valuable measures of
relative abundance, rates of population change and size and sex composition for a wide range of
species.
A diversified mix of teleostean, selacean, cephalopod and crustacean species composes catches of
Lebanese demersal fisheries. In three years of data collection, a total of 121 hauls were executed and
97 Km of nets (0.351 Km2) were lowered. 3,579 specimens belonging to 129 species and 73 families
were collected with an overall weight of 601 Kg. The catch was composed by 18 crustaceans, 8
cephalopods, 91 teleosteans and 12 elasmobranchs. Sargocentron rubrum was the most abundant
species, with the highest numerical occurrence, overall weight and CPUE. Dentex macrophthalmus
was the second species in terms of numerical abundance and occurrence, whereas Phycis phycis,
Merluccius merluccius and Lagocephalus sceleratus were reported relatively high in weight. Among

90
12 species of elasmobranchs caught in this study, 6 are considered threatened with extinction by the
IUCN Red List. Among those, Gymnura altavela and Squatina aculeata are considered critically
endangered, facing an extremely high risk of extinction in the wild. In our study, 17 non-indigenous
species (NIS) of Indo-Pacific origin – 13 fish and 4 crustacean species - were recorded over the
Lebanese coastal waters, 15 of which demersal, one pelagic (the herring Etrumeus teres) and one
with a mixed benthic-pelagic behaviour (the portunid crab Charybdis longicollis).
Data showed the depth to cause a general decrease in the numerical abundance and biomass
(beyond 150 m depth) probably related to a general reduction in food availability that affects
epibenthic and demersal assemblages on the slope. This pattern was due to a reduction of the
abundance of teleosteans, which decreased with depth, while decapod crustaceans and
elasmobranchs showed an opposite trend increasing from the coastal shelf to the middle slope.
Keywords: fishing impact; Levantine basin; spatiotemporal variations, small-scale fishery, fauna;
species composition
INTRODUCTION
Marine capture from fisheries provides food and offers livelihood opportunities for world’s
population. Therefore, assessing their state of conservation and the efficiency at which they are
exploited is a major societal objective for natural scientists worldwide (Pauly, et al., 2002; Branch, et
al., 2011).
In the Mediterranean basin, demersal species account for roughly 30% of total landings from the
region, and represent therefore an important resource for the fishery sector (Lleonart & Maynou,
2003). However, strong concern exists regarding the long-term sustainability of demersal fisheries.
Indeed, according to recent assessments, most Mediterranean demersal stocks are overexploited
(see Colloca, et al. (2013) for a recent review and GFCM’s recommendation 34/2010/1) and
approximately 75% of demersal Mediterranean species are not assessed. Indeed, the Mediterranean
demersal stocks have been subject to trawling at least since 1700 (Osio G. C., 2012), one of the
longest trawl fishery exploitation in the Western world. Mediterranean demersal fisheries are
multispecific, with more than a hundred species of fish, crustaceans and mollusks being targeted
(Lleonart & Maynou, 2003). The few stocks considered to be exploited sustainably are either short-
lived small pelagics or crustaceans (Osio, et al., 2015). In addition to overexploitation, there is
evidence of biodiversity threats, habitat loss and degradation of ecosystem functioning caused by
fishing practices (Coll, et al., 2010).
The overexploitation of fishery resources has led to a major fisheries crisis. In this context, artisanal
fisheries, and in particular small-scale coastal fisheries, appear as relevant alternatives for a
sustainable use of coastal resources.
The artisanal fishing sector provides direct employment to tens of millions of people, and indirect
employment to tens of millions more (UNEP, 2005). Artisanal fishing comprises 90% of all fishing jobs
worldwide, approximately 45% of the world’s fisheries, and nearly a quarter of the world catch
(UNEP, 2004). They provide critical income and edible protein to hundreds of millions of people
across the globe. They employ twenty-four times more fishers than large-scale fisheries, for an
equivalent annual catch for human consumption (Jacquet & Pauly, 2008). Total annual fuel oil
consumption by these fisheries is much lower and discards are small compared to large-scale

91
fisheries (Kelleher, 2005; Jacquet & Pauly, 2008). In addition, bottom trawling has an impact on the
habitats whose extent and duration vary depending on local conditions (Jones, 1992). Artisanal
fisheries in the Mediterranean Sea represent roughly 86% of the approximately 42 000 fishing boats
exploiting coastal ad offshore stocks (Maynou, et al., 2013). In the Mediterranean Sea, small-scale
coastal fisheries (SSF) mainly operate on the continental shelf (0–200m depth), in areas which can be
reached within a few hours from the home ports (Farrugio & Le Corre, 1993; Colloca, et al., 2004;
Tzanatos, et al., 2006; Forcada, et al., 2010; Maynou, et al., 2011; FAO, 2015). Foremost
characteristics of the sector are the high diversification of gears and techniques, the multitude of
species exploited, the changing patterns of gears use in time and space and the varying degree of
fishermen’s dependence on fishing (Tzanatos, et al., 2006). Boats can be active fully or part-time of
the year, and their activity is characterized by a diverse array of métiers which can be defined as
target species, fishing gears, grounds and techniques, with frequent seasonal and spatial changes to
adapt to varying resource availability (Colloca, et al., 2004; Lelli, et al., 2007; Forcada, et al., 2010).
Lebanon’s fisheries sector is composed of a little artisanal fishing fleet, namely 2,005 licensed vessels
(in 2015 according to the Department of Fisheries and Wildlife (DFW) of the Lebanese Ministry of
Agriculture) predominantly operated by rather aged fishers using old boats with dated equipment
(Pinello & Dimech, 2013). Most of the boats are motorized and below 12 m in length using fishing
techniques mostly based on passive gears such as gillnets, trammel nets, longlines, and purse seines.
Fishing operations are mostly carried out at depths of up to 50 m (Sacchi & Dimech, 2011; Brême,
2004; Lelli, et al., 2007). Few vessels are equipped with GPS, while the rest have very limited
navigational or safety equipment (Majdalani, 2004; Sacchi & Dimech, 2011). Lebanese coastal waters
contain a significant richness of marine organisms with more than 80 fish species being of
commercial importance (Nader, et al., 2012).
Illegal fishing behaviors and harmful or unsustainable practices such as the use of small mesh nets
and explosives thrive as a result of an outdated legislation and the lack of its enforcement (Sacchi &
Dimech, 2011). Lack of urban and industrial waste management along with the absence of an
effective sanitation network are contaminating marine and fresh waters. Coastal areas are subject to
uncontrolled urban sprawl and increasing processes of artificialization. It is widely agreed that human
activities are affecting in a worrying manner the narrow coastal area environment leading to a critical
increase in its exposure to geological hazards. Human pressure on the coastal area, along with the
low public investment in the sector during the past decades have narrowed the economic value of
the sector and therefore negatively affected fishers’ lives (DAR-IAURIF, 2010; UNDP, 2012; World
Bank, 2011; MoE/UNDP/ECODIT, 2011). Despite its chaotic management, the Lebanese fishing sector
represents a unique case in the Mediterranean, being the only one solely composed by small-scale
artisanal vessels.
Due to its geographical location, Lebanon also represents an outpost for a comprehensive
understanding of the dynamics driving the colonization of the Mediterranean by Indo-Pacific and Red
Sea species. The knowledge on the impact of Lebanon’s fleet on fisheries coastal resources – both
non-indigenous and endemic - is still very limited though, being available only scattered information
on distribution, abundance and biological characteristics of few fish and shellfish stocks (Colloca &
Lelli, 2012; Lelli, 2007; Carpentieri, et al., 2009; Bariche, et al., 2006; Bariche, 2003; Nader, et al.,
2014; Nader, et al., 2012; George, et al., 1964).
Lebanon is moving its first steps in the fulfilment of international requirements in terms of data
collection on its halieutic resources through stocks, catch and effort assessments (FAO EastMed,
2014). International organizations and donors have granted funds and capacity building to develop

92
adequate research programmes to support the capability of the Lebanese Government to define new
measures towards an appropriate and sustainable management of fishing resources. The idea of an
overall Country data collection to gain information on abundance and distribution of Lebanese
fisheries resources stemmed from a series of meetings that took place in 2012 aiming at coordinating
the efforts of international organisations (i.e. FAO, CIHEAM, Italian Cooperation) and Lebanese
stakeholders such as public institutions and academia.
Financed by the Italian Cooperation in Lebanon, in 2012 the project CIHEAM-PESCA LIBANO
“Technical Assistance to the Ministry of Agriculture in the field of fishery development” aimed at
providing the Lebanese Ministry of Agriculture (MoA) with advanced tools designed for a proper
management of marine and fisheries resources. This was achieved by strengthening capabilities of
the MoA staff and assessing the potentialities of marine coastal resources. The project gathered
scattered data fisheries related from different concerned institutions, on the one hand. On the other,
it actively collected data that emerged to be important for a correct management of the sector and
still missing. The project had been working on the land to map infrastructures and activities linked to
fisheries, and at sea to assess the distribution and abundance of demersal species exploited by the
Lebanese artisanal fleet. The National Council for Scientific Research, Lebanon (CNRS-L), in charge of
the implementation of the fishing surveys through its Marine Centre, gave follow up executing
seasonal data collection at sea in the North Lebanon.
The objective of this paper is to address part of the aforementioned gaps, describing composition,
spatial distribution, depth and relative abundance of demersal communities exploited by the
Lebanese small-scale fisheries. It allows also to highlight the portion of Lessepsian species in the
catches by analyzing CPUE (in number and weight) data from the surveys. We also intend to
contribute to widen the arrays of available methodologies for fisheries independent data collections
especially in areas where trawling is not possible or convenient. As eastern Mediterranean halieutic
species are poorly studied and very little information is available for most of the commercially
relevant species, this set of information can represent a valid tool to improve the management of
coastal habitats also with the aim to ensure the long-term sustainability of fishery resources.

93
MATERIALS AND METHODS
Study area Situated in the central part of the Levantine Basin (Eastern Mediterranean), Lebanon is
geographically limited by latitude 33°- 35°N and longitude 35° 30’-36° 20’ E. Its coastal stretch is
about 225 km long from Arida (north) to Ras el Naqoura (south) on the Levantine Basin of the
Mediterranean Sea.
The continental shelf is relatively wide
in the north, offshore of the Akkar plain
(about 20 km), and in the south,
offshore of Saida and Tyre (Nabatiyeh
plateau). Between Beirut and Batroun,
the shelf is extremely narrow and the
margin exhibits its steepest slope, with
the water depth abruptly increasing
from 100 to 1500 m in less than 5 km.
Along the entire margin the continental
slope is incised by canyons, most of
them connected to rivers flowing from
the mountains.
Sea cliffs made of limestone border
most of the shores and sometimes
descend directly into the sea. They are
separated by gravel or sand beaches,
composed partly of shell fragments and
mostly of detrital sand (Emery &
George, 1963). Figure 17. Map of study area: Lebanon, eastern Mediterranean.
There is a minimal variation in tides.
Lebanon has a typical Mediterranean climate, with an average annual temperature of 20°C and about
300 sunny days each year. It is also characterised by a relatively high average rainfall, ranging from
700 to 1000 mm along the coast to 1,400 mm on Mount Lebanon. Surface water temperatures show
high seasonal variation and range from 15°C in winter to 30°C in summer. The water in the upper 50
m is well mixed in winter and becomes stratified during the rest of the year (Greenpeace, 2010).
The Lebanese coastal waters are characterized by thermophilic biota of Mediterranean and Indo-
Pacific origin (Abboud-Abi Saab, et al., 2013; Bitar, et al., 2007). The local biodiversity is undergoing
rapid alteration under the combined pressures of climate change and anthropogenic impacts.
Protection measures, for either species or ecosystems, are still rare. Native marine flora and fauna
are competing with invading species originating mainly from the Indo-Pacific oceans. The features of
the Lebanese coastline with no closed bays or gulf consent to coastal waters to continuously mix thus
preventing conditions of eutrophication and to disperse nutrients and pollutants (Abboud – Abi Saab,
2012).

94
Sampling Design Description of the scientific surveys. The CIHEAM-Pesca Libano Project and the CNRS-L planned and
implemented a 3-year experimental fishing surveys program. Sampling stations were surveyed by
means of experimental gillnets, trammel nets and lowered up to 300 m depth aiming at assessing the
distribution and abundance of fisheries resources along the Lebanese. We deemed fishery-
independent survey as the most appropriate tool to provide valuable measures of relative
abundance, rates of population change and size and sex composition for a wide range of species. In
fact, fishery-independent surveys form the cornerstone of many stock assessments for bony fishes
and shellfish species, they are less subject to the unknown and often confounding factors that
complicate the interpretation of fishery-dependent indices of stock status. Thus fishery-independent
surveys strike a balance between the ability to make inferences about one or more populations
versus the usage of a specific area by one or more species (Rago, 2005).
Spatial stratification. The predominantly used approach for the definition of a fishery-independent
survey sampling design is stratification where the total survey area is broken down into strata
possessing common features regarding the species composition and their densities and length
structures. If the strata are well selected, i.e. characterised by a low variability within the strata and
clear differences between strata, the stratification is a convenient way of increasing the precision of
the abundance estimates (Cochran, 1977). Survey effort may be allocated between strata according
to their size or may be optimised if a priori knowledge on the variability of interest is known (Sparre
& Venema, 1992). Within each stratum, the fishing stations are chosen randomly.
It is therefore clear that the stratification scheme depends on the objective established for the
survey. As the ultimate aim of the abundance survey in Lebanese waters was to obtain an estimate of
the relative abundance and spatial distribution of main commercial stocks, it was necessary to adopt
a stratification that could allow sampling a relative large array of species with different depth ranges.
At the same time, it was required to cover the entire Lebanese coast in order to gather enough data
to map the spatial distribution of the stocks. Table 13 and figure 18 summarise the stratification
approach adopted for the surveys based on the definition of four coastal regions from North to South
(Akkar shelf, Tripoli-Beirut; Beirut-Saida; Saida-Naqoura) and 2 depth strata (0-100 m; 100-150 m).
The total number of sampling stations was 48, spatially allocated randomly but proportionally to the
extension of each area.
Table 13. Survey areas according to regions and bathymetric strata over the Lebanese continental shelf.
REGION Area in the bathymetry
0-100m (km2) n. hauls
Area in the bathymetry
100-150m (km2) n. hauls
1. AKKAR SHELF 473.6 12 124.4 3
2. TRIPOLI-BEIRUT 183.3 5 92.05 3
3. BEIRUT-SAIDA 189.8 5 99.6 3
4. SAIDA-NAQOURA 386.4 11 221.7 6
total 1233.1 33 539.7 15

95
Figure 18. Maps of investigated area showing the randomised distribution of sampling stations along the Lebanese continental shelf. Left: Akkar shelf and Tripoli-Beirut regions. Left: northern sectors (Akkar shelf and Tripoli-Beirut). Right: southern sectors (Beirut-Saida and Saida-Naqoura).
Repercussions of the Syrian conflict and related safety measures led us to shift southward or to
delete sampling stations closer to the Syrian border. Other sampling points were slightly shifted due
to technical impediments arisen during sampling activities at sea. Minor differences in mean depth
registered at the same stations between years were due to minor differences in the route
undertaken during the haul. With the aim of broadening the spectrum of information collected both
in terms of better definition of the distribution of demersal species inhabiting the upper sector of the
continental slope, a total of 12 sampling stations were added at depths ranging between 165 and 300
meters. Hauls were distributed along the whole coast-line, trying to evenly cover major Lebanese
fishing fields (2 hauls in Akkar Shelf, 3 in the Tripoli-Beirut region, 3 in Beirut-Saida, 4 in Saida-
Naqoura).
Protocols Set for Sampling Activities and Data Collection Nine artisanal fishers from nine different ports in Lebanon distributed in the north, south and central
regions of the country were chartered to lower the gear at the sampling stations with the specified
coordinates in order to benefit from knowledge and familiarity of the fishermen with their usual
fishing grounds. Vessels with minimum requirements were selected to carry out fishing operations
without endangering crew and staff. The length of the vessels ranged from 8.75 to 11 m and their
gross tonnage ranged from 3.10 to 5.01. A global positioning system (GPS) was used to reach the
right haul and depth was confirmed using a sonar. Date, type of gear, net meshes, coordinates and
depth for each haul were noted.
Sampling gears In Lebanon, the most important commercial species are typically coastal and distributed over areas
where standard trawling cannot be carried out. In this situation, other fishing gears (e.g. longlines,
gillnets and traps) had to be used to survey untrawlable areas and species. Moreover, trawling
activities are interdicted and no licenses are issued by the Lebanese Government (University of
Balamand, 2016). Following the good results obtained in the exploratory fishing survey implemented

96
in March-May 2012 (Colloca & Lelli, 2012), gillnets were selected as sampling gear for data collection.
Moreover, taking into consideration the relatively high CPUEs observed in Lebanese waters when
compared with other Mediterranean areas, the dimension of each patch of net was limited to about
250 m length, for a total of 750-1000m of nets employed during each sampling haul.
Gillnets with mesh sizes of 26, 30 and 40 mm were lowered at depths less than 100 m; trammel nets
with mesh sizes of 22, 24, 26, 28 and 30 mm were lowered at depths greater than 100 m. The mesh
sizes included in net series used for stocks surveying were selected to enable full coverage of the
potential size distribution of fish that may be encountered. Due to the incompleteness of the
information on the size composition of demersal resources in Lebanon, different mesh sizes covering
a wide range and rigged with a hanging ratio around 0.5 had been used. Specifications of technical
characteristics of nets used during the fishing surveys are summarised in table 14.
Table 14. Technical characteristics of gillnets and trammel nets used for the implementation of the fishing surveys.
Gillnets Trammel Nets
Net yarn Material PA mono-filament PA multi-filament Diameter 0.26/0.30/0.30 mm 0.28/0.28/0.30/0.30 mm
Stretched mesh size 52/60/80 mm 22/24/26/30 (internal wall) 44/48/52/60 (external wall)
Panel height 4.4/3.9/3.9 m 3.0 m
Panel length 500/472/500 m 180/240/240/300 m
Colour light green light green/ light green/ light yellow/ light yellow
Bolsh twin
Material Twisted PE Twisted PE
Diameter 1.2 mm 6 mm
Float rope
Material Twisted PE Twisted PE
Diameter 12/14/16 mm 6 mm
Length 250 m 180/240/240/300 m
N. bolshes 1920/1560/1250
Bolsh size 0.13/0.16/0.20 m
N. meshes per bolsh 5
Hanging ratio 0.50/0.53/0.5 0.50/0.53/0.50/0.50
Floats
Material PVC PVC
Size 6.7x4.0 cm 8.0x5.0 cm
N. floats 390
Lead rope
Material Twisted PE Twisted PE
Diameter 12/14/16 mm 4/5/5/6 mm
Length 250 m 180/240/240/300 m
N. bolshes 192/156/125
Bolsh size 0.13/0.16/0.20 m
N. meshes per bolsh 5 2
Lead weight 140 g/m 260/666/666/666 g/m
Hanging ratio 0.5/0.53/0.50 0.50/0.53/0.50/0.50

97
Sampling period In 2012, a total of 47 hauls were carried out in the period June 9 to September 4, 2012 for a total of
35.25 Km of nets deployed. In 2013, 49 hauls were executed between January 3 and August 29, 2013.
A total of 36.75 Km of nets had been lowered up to 150 meters depth. Between September 24 and
October 13, 2014, 13 sampling stations located in the Akkar Shelf and Tripoli-Beirut regions were
surveyed by means of 13 Km of nets. 12 sampling stations located in deeper waters (165-300 m
depth) were surveyed between April 2013 and October 2014.
Measures and biological parameters recorded after collection. Fishermen lowered the nets in the afternoon and retrieved them 12 hours later at the sunrise. The
catch was collected and stored in boxes or bins divided according the mesh size of the net that
captured the specimen. Operations of extraction of the catch from the nets were usually completed
at the port (with the exception of days with poor catch) where researchers collected and reported on
ad hoc sheets. Species collected from the survey were identified using the identification guides of
(Fischer, et al., 1987) and the three CIESM Atlases on Fishes (Golani, et al., 2002), Crustaceans (Galil,
et al., 2002) and Molluscs (Zenetos, et al., 2003). All the individuals collected - irrespective the
species - were measured and weighed. Sex and maturity stage were determined for all the
individuals. When the catch of a certain species was too abundant to be wholly measured,
representative sub-samples of the catch were taken. For fish (bony fishes and Elasmobranches), the
total length with the tail fully extended was recorded. The measurement unit is the lower half
centimetre. For crustaceans, the cephalon-thoracic length at the lower millimetre was measured,
while for cephalopods, the dorsal mantle length at the lower half centimetre was noted down. For
octopods, the measure is taken along the line passing through the eyes. Standardised protocols and
minimum requirements adopted during the surveys are summarised in table 15.

98
Table 15. Protocols and minimum requirements adopted.
Nets management
Soak time Approximate 12 hours, overnight
Lowering time Afternoon
Retrieving time Dawn
Operators Professional fishermen
Vessels' minimum requirements
LOA > 7m
Engine Power > 16 hp
Winch Hydraulic or Motorised
Available equipments GPS, Fishfinder, Safety equipments
Biological data collection MEDITS programme protocols (MEDITS Working Group, 2013)
Biometric: length Lower half centimetre (fish)
Biometric: weight Nearest 1 gram
Biological: sex & maturity stages
MEDITS programme protocols (CODES OF SEXUAL
MATURITY FOR FISH, CRUSTACEANS AND CEPHALOPODS) Biometric & Biological Parameters
Collected on all the specimens
Statistical analyses The catch per unit effort (CPUE) is an indirect measure of the abundance of a target species.
Standardized CPUE analysis is widely used to evaluate trends in population density. However, while
analyzing data, it has to be taken in mind that mechanism modifying the catchability coefficient or
overdispersion of some pelagic species (Fonteneau et al., 1999) can bias our results and lead to
relevant mistakes in their interpretation. To reduce the incidence of the catchability factor, we used
different types of experimental gears whereas we focused our study on demersal species
underexposing our results to bias due to big schools highly dispersed pelagic species. The CPUE was
calculated per each species. Each year was calculated separately to standardize the effort (as Km2 of
nets used) using the statistical software ‘R’ (R Development Core Team, 2014) in kilogram and in
number according to the following:
3. CPUE in kilograms considered by year:
CPUE Kg, Y =
where is the weight in Kg per species considered by year, is the effort reported as Km2
of nets deployed by year.
4. CPUE in number considered by year:
CPUE Kg, Y =

99
Where is the number of individual per species considered by year, is the effort reported
as Km2 of nets deployed by year.
We used the Pearson’s chi-square test (goodness-of-fit or chi-square test for independence) to test
the correlation between depth and different taxa’s distribution.
Maps were realized and performed on the Quantum Geographic Information System (qGIS) software
(Quantum GIS Development Team, 2012) for the scientific survey data.

100
RESULTS
2012 survey A total of 47 hauls using 0.75 km net with three mesh sizes (24, 30, 40 mm) where carried out in the
period June 9 to September 4, 2012 between 10 and 150 m depth. 35.25 Km of gillnets were
deployed. 583 individuals belonging to 67 species and 46 families were collected with an overall
weight of approximately 100 Kg. The catch was composed by:
11 crustaceans
3 cephalopods
51 teleosteans
2 elasmobranchs (Squatina aculeata, Raja clavata)
The catch was generally very poor in most of the sampling points with an average yield lower than 1
specimens/km net for most of the species. The most abundant species was Sargocentron rubrum, a
by-catch species of gillnets and trammel nets fisheries, with 1,148.93 specimens/km2 net, followed
by the common pandora (Pagellus erythrinus, 283.69 specimens/km2 net) and juveniles of amberjack
(Seriola dumerili, 255.32 specimens/km2 net).
Figure 19. The map representing the total catch per haul (bubble plots of the observed abundances) in 2012 survey.

101
The entire surveyed area had been broken in two strata. 32 hauls were performed in the shallower
one (0-99 meters depth) and 15 in the deeper one (100-150 m). Within the first stratum,
bathymetries up to 49 meters were surveyed by means of 19 sampling stations in which 40.8 Kg of
overall landings were harvested. This represents 40% of the overall weight of the species caught. 13
sampling points were placed between 50 and 99 meters depths. These resulted to provide the
highest yields with 3.2 Kg per haul and 41.2 Kg for the whole substratum. As a result of the hauls
carried out in the first stratum, 443 individuals were collected, 36.6% were belonging to the species
S. rubrum, 7.7% to S. dumerili, 4.7% to P. erythrinus and 4.1% to L. sceleratus (see table 16). Deepest
waters ranging from 100 to 150 m counted 15 hauls that provided 20 kg of catches, less than 20% of
the overall sampled specimens.
Table 16. Catch per strata in the 2012 survey.
Stratum Substratum N. of Hauls N. of
Individuals Catch (Kg)
Avrg Catch
(Kg/haul) St.dev. σ (Kg)
0 - 99 32 443 82.0 2.64 3.53
0 - 49 19 262 40.8 2.26 2.25
50 - 99 13 181 41.2 3.17 4.72
100 - 150 15 122 20.0 1.33 1.38
Total 47 565 102.0
As a result of the hauls carried out in the second stratum, 122 individuals were collected, 15.6% were
belonging to the species P. erythrinus, 13.1% to C. linguatula, 10.7% to M. goltziana, 5.7% to D.
macrophthalmus and M. merluccius.
Figure 20. Catch composition (percentage of occurrence) per stratum.
2013 survey A total of 49 hauls using 0.75 km of gillnets up to 100 meters depth and trammel nets between 100
and 150 m were executed between 10 and 150 m depth. 24.75 Km of gillnets in 33 hauls and 12.0 Km

102
of trammel nets in 16 hauls had been lowered. 2104 individuals belonging to 100 species and 57
families were collected with an overall weight of approximately 365 Kg. The catch was composed by
species belonging to the following groups:
15 crustaceans
5 cephalopods
71 teleosteans
9 elasmobranchs
15,585.19 individuals had been collected per Km2 of nets. As in the first survey, S. rubrum resulted to
be by far the most abundant species with yields almost five times higher than the previous survey,
i.e. 5444.44 specimens/km2 nets. Due to the higher efficiency and reduced selectivity of the nets
used in deeper waters, Aristaeomorpha foliacea and Dentex macrophthalmus showed relatively high
yields (1,392.59 and 1200.00 specimens/Km2 of nets respectively).
Figure 21. The map representing the total catch per haul (bubble plots of the observed abundances) in survey 2013.
33 hauls were performed in the shallower stratum (0-99 meters depth) and 16 in the deeper one
(100-150 m). Within the first stratum, bathymetries up to 49 meters were surveyed by means of 19
sampling stations that returned an overall catch of less than 40 Kg. 13 sampling points were placed
between 50 and 99 meters depths providing 73.5 Kg of catch; more than 5 Kg each survey tow (Table
17).

103
Table 17. Catch per strata in 2013 survey.
Stratum Substratum Nr. of Hauls Nr. of
Individuals Catch (Kg)
Avrg Catch
(Kg/haul)
St.dev. σ
(Kg)
0 - 99 33 903 112.1 3.40 6.11
0 - 49 19 343 38.6 2.03 2.12
50 - 99 14 560 73.5 5.25 8.72
100 - 150 16 1188 250.9 15.68 28.06
Total 49 2091 363.0
As a result of the hauls carried out in the first stratum, 903 individuals were collected, 73.3% were
belonging to the species S. rubrum, 3.0% to the crab P. pelagicus and 2.9% to D. vulgaris. Deepest
waters ranging from 100 to 150 m counted 16 hauls that provided 251 kg of catches, more than 69%
of the overall sampled specimens. 1188 individuals were collected in this stratum, 15.7% were
belonging to the species A. foliacea, 13.6% to D. macrophthalmus, 6.44% to M. merluccius and P.
phycis.
Figure 22. Percentage of occurrence of the most collected species in relation to strata.
2014 survey A total of 13 hauls using 1 km of trammel nets between 10 and 150 m were carried out in the period
September 24 to October 13. 10 Km of nets in 10 hauls in the bathymetric range 0-99 m and 3 Km of
in 3 hauls between 100 and 150 m depth had been lowered in the water off Tripoli and the Akkar
shelf. 354 individuals belonging to 37 species and 25 families were collected with an overall weight of
approximately 38 Kg (Figure 23). The catch was composed by species belonging to the following
groups:
1 cephalopod (Sepia officinalis)
34 teleosteans
2 elasmobranchs (Dasyatis pastinaca and Rhinobatos rhinobatos)

104
9,076.92 individuals had been collected per Km2 of nets. As in the previous surveys, S. rubrum
resulted to be by far the most abundant species, i.e. 5,435.90 specimens/km2 nets. Another
Lessepsian species, Siganus rivulatus, showed relatively elevate yields (871.79 specimens/Km2 of
nets).
Figure 23. The map representing the total catch per haul (bubble plots of the observed abundances) in survey 2014.
10 hauls were performed in the shallower stratum (0-99 meters depth) returning 33.5 Kg and 3 in the
deeper one (100-150 m) providing 4.5 Kg of catch (Table 18).
Table 18. Catch per strata in 2014 survey.
Stratum Nr. of Hauls Nr. of
Individuals Catch (Kg)
Avrg Catch
(Kg/haul)
St.dev. σ
(Kg)
0 - 99 10 325 33.4 3.35 3.02
100 - 150 3 29 4.6 1.52 0.64
Total 13 354 38.1
As a result of the hauls carried out in the first stratum, 325 individuals were collected, 60.0% were
belonging to the species S. rubrum, 10.5% to the marbled spinefoot S. rivulatus and 2.8% to F.
commersonii.

105
Deepest waters ranging from 100 to 150 m counted 3 hauls that provided 4.6 Kg. S. rubrum
accounted for 58.6% of the collected specimens (all collected at 100 m depth) whereas the bathy-
demersal species Helicolenus dactylopterus for 31.3%.
Figure 24. Percentage of occurrence of the most collected species according to stratum.
Deeper waters survey, i.e. beyond 150 meters depth Twelve sampling stations had been surveyed by means of a total of 12 km of trammel nets at depths
ranging between 165 and 300 m depth. Sampling stations were located 2 in the Akkar shelf region,
three in the Tripoli-Beirut, three in the Beirut-Saida, four in the Saida-Naqoura region.
538 individuals belonging to 52 species and 36 families were collected with an overall weight of
approximately 98.5 Kg. The catch was composed by species belonging to the following groups:
10 crustaceans
5 cephalopods
30 teleosteans
6 elasmobranchs
This means that 13,794.87 individuals and had been collected each Km2 of nets.

106
Figure 25. The map representing the total catch for each haul (bubble plots of the observed abundances).
As far as the weight of the resources collected is concerned, the two elasmobranchs Heptranchias
perlo and Centrophorus granulosus were the most abundant species, respectively 13.0 Kg (three
individuals) and 10.9 Kg (two individuals). 54 individuals and 10.9 Kg of Phycis phycis were pulled
aboard. In terms of number of specimens collected, D. macrophthalmus resulted to be the most
numerous with 2435.90 specimens/km2 nets (17.66% of all collected specimens), followed by A.
foliacea 1923.08 specimens/km2 nets with an occurrence of 13.94%.
Aggregated dataset In three years of data collection, a total of 121 hauls were executed and 97 Km of nets (0.351 Km2)
were lowered. 3,579 specimens belonging to 129 species and 73 families were collected with an
overall weight of 601 Kg. The catch was composed by species belonging to the following taxa:
18 crustaceans
8 cephalopods
91 teleosteans
12 elasmobranchs
Sargocentron rubrum is the most abundant species, with the highest numerical occurrence, overall
weight and CPUE, i.e. 3159.54 specimens/km2 nets. Species composition, abundance and depth
distribution is shown in Table 19.

107
Among the bony fish species, six (Dentex dentex, Epinephelus aeneus, E. marginatus, Merluccius
merluccius, Sardinella maderensis, and Sciaena umbra) are included in the IUCN Red List as
considered threatened to a certain extent with extinction. Dentex macrophthalmus was the second
species in terms of numerical abundance and occurrence (CPUE=754.986 specimens every Km2 of
nets), whereas Phycis phycis, M. merluccius and Lagocephalus sceleratus were reported relatively
high in weight (27.334 Kg, 24.902 Kg and 24.584 Kg respectively collected. Neither crustaceans nor
cephalopods species reported in this study were included in the IUCN Red List. The giant red shrimp
Aristaeomorpha foliacea was found relatively abundant in the lower part of the continental shelf and
upper slope (754.986 specimens/Km2 nets) while the spiny spider crab Maja goltziana was the most
abundant crustacean in weight (15.351 Kg). Sepia officinalis (16 specimens and 2.150 Kg collected)
was the most abundant cephalopod. Among 12 species of elasmobranchs caught in this study, 6 are
considered threatened with extinction by the IUCN Red List. Among those, Gymnura altavela and
Squatina aculeata are considered critically endangered, facing an extremely high risk of extinction in
the wild. Raja miraletus was the most abundant in terms of number of specimens collected (N=52,
148.148 specimens/Km2 nets) whereas Centrophorus granulosus was the second most abundant
species in weight of the whole study (105.000 Kg).

108
Table 19. List of species collected in the 4 surveys 2012, 2013, 2014 and deeper waters in the eastern Mediterranean. Total weight per species stated in grams (Tot Weight (g)), number of specimens collected (No Specs), percentage of occurrence in sampling stations (O%, and by year) CPUE (number of specimens by Km2 of nets and kg/Km2 of nets) percentage of specimens (number of specimens over the total number of specimens collected). Last four columns report the species’ occurrence by depth stratum (SSh=shallow shelf, < 50 m depth; MSh=medium shelf, 50 to 99 m depth; DSh=deep shelf, 100 to 150 m depth; CSl=upper continental slope, 151 to 300 m depth). *=1 to 10 specimens; **=10 to 50 specimens; ***= >50 specimens.
In the column “species”, in [] the International Union for the Conservation of Nature (IUCN) Red List Category for each species caught: no mentions=no assessment or data deficiency or least concern; CR=Critically Endangered; EN=Endangered; VU=Vulnerable; NT=Near Threatened. When categorization differs, Mediterranean category is reported as “in Med”. (L)=Lessepsian migrant.
Species Family Tot
Weight (g)
No Specs
O% O%
2012 O%
2013 O%
2014
CPUE (Specs/
Km2 nets)
CPUE (Weight/ Km2 nets)
% (No Specs/ Specs Tot)
SSh MSh DSh CSl
Aulopus filamentosus Aulopidae 466 3 2.479 0.000 5.085 0.000 8.547 1.328 0.08
*
Auxis rochei Scombridae 7957 23 19.008 34.043 11.864 0.000 65.527 22.670 0.64 ** * * *
Balistes capriscus Balistidae 90 1 0.826 0.000 0.000 6.667 2.849 0.256 0.03 * Boops boops Sparidae 27 1 0.826 0.000 1.695 0.000 2.849 0.077 0.03
*
Bothus podas podas Bothidae 23.9 1 0.826 2.128 0.000 0.000 2.849 0.068 0.03
* Capros aper Caproidae 16 1 0.826 0.000 1.695 0.000 2.849 0.046 0.03
*
Caranx crysos Carangidae 311 1 0.826 2.128 0.000 0.000 2.849 0.886 0.03 * Chauliodus sloani Stomiidae 3 1 0.826 0.000 1.695 0.000 2.849 0.009 0.03
*
Chelidonichthys lucerna Triglidae 358 5 4.132 0.000 8.475 0.000 14.245 1.020 0.14
* Chlorophthalmus agassizii Chlorophthalmidae 17 1 0.826 0.000 1.695 0.000 2.849 0.048 0.03
*
Citharus linguatula Citharidae 2480 61 50.413 59.574 55.932 0.000 173.789 7.066 1.70 * * ** *
Coelorinchus caelorhincus Macrouridae 1040 33 27.273 0.000 55.932 0.000 94.017 2.963 0.92
** **
Conger conger Congridae 8903 12 9.917 0.000 20.339 0.000 34.188 25.365 0.34 *
* *
Dactylopterus volitans Dactylopteridae 7423.6 16 13.223 29.787 3.390 0.000 45.584 21.150 0.45
* * Dentex dentex [VU] Sparidae 1539.2 4 3.306 0.000 6.780 0.000 11.396 4.385 0.11 * * * Dentex macrophthalmus Sparidae 11714.3 265 219.008 17.021 435.593 0.000 754.986 33.374 7.40
* *** ***
Dentex maroccanus Sparidae 374 7 5.785 0.000 11.864 0.000 19.943 1.066 0.20
* Diplodus annularis Sparidae 34 1 0.826 0.000 1.695 0.000 2.849 0.097 0.03 *
Diplodus sargus sargus Sparidae 1138.5 16 13.223 12.766 13.559 13.333 45.584 3.244 0.45 ** * Diplodus vulgaris Sparidae 2286.9 36 29.752 6.383 44.068 46.667 102.564 6.515 1.01 *
Echelus myrus Ophichthidae 249 1 0.826 0.000 1.695 0.000 2.849 0.709 0.03
* Echeneis naucrates Echeneidae 288.7 2 1.653 2.128 0.000 6.667 5.698 0.823 0.06
* *
Epinephelus aeneus [NT] Serranidae 7343.1 4 3.306 6.383 1.695 0.000 11.396 20.921 0.11
* * Epinephelus marginatus [EN] Serranidae 560 2 1.653 4.255 0.000 0.000 5.698 1.595 0.06
*
Epinephelus sp. Serranidae 340 1 0.826 0.000 1.695 0.000 2.849 0.969 0.03
* Etrumeus teres (L) Dussumieriidae 737.5 11 9.091 14.894 0.000 26.667 31.339 2.101 0.31
**

109
Euthynnus alletteratus Scombridae 2795.6 9 7.438 2.128 13.559 0.000 25.641 7.965 0.25 * * Fish (NOT IDENTIFIED) NA 16 1 0.826 0.000 1.695 0.000 2.849 0.046 0.03
*
Fistularia commersonii (L) Fistulariidae 10120.3 26 21.488 8.511 22.034 60.000 74.074 28.833 0.73 * ** * Helicolenus dactylopterus Sebastidae 6230.1 73 60.331 29.787 79.661 80.000 207.977 17.750 2.04 * * ** **
Hoplostethus mediterraneus Trachichthyidae 349 15 12.397 0.000 25.424 0.000 42.735 0.994 0.42
* *
Lagocephalus sceleratus (L) Tetraodontidae 24583.6 28 23.140 44.681 6.780 20.000 79.772 70.039 0.78 ** ** * *
Lagocephalus spadiceus (L) Tetraodontidae 1551.5 6 4.959 0.000 1.695 33.333 17.094 4.420 0.17 * *
*
Lepidorhombus boscii Scophthalmidae 142.2 1 0.826 2.128 0.000 0.000 2.849 0.405 0.03
* Lepidorhombus whiffiagonis Scophthalmidae 1327.9 3 2.479 2.128 3.390 0.000 8.547 3.783 0.08 *
* *
Lithognathus mormyrus Sparidae 677.9 7 5.785 6.383 6.780 0.000 19.943 1.931 0.20 * Liza ramada Mugilidae 496.9 2 1.653 0.000 0.000 13.333 5.698 1.416 0.06 * Lophius budegassa Lophiidae 4640 3 2.479 0.000 5.085 0.000 8.547 13.219 0.08
* *
Merluccius merluccius [VU] in Med Merlucciidae 24902 103 85.124 14.894 162.712 0.000 293.447 70.946 2.88
* *** **
Microchirus ocellatus Soleidae 129.9 5 4.132 2.128 6.780 0.000 14.245 0.370 0.14
* * Mullus barbatus Mullidae 4373.9 45 37.190 12.766 66.102 0.000 128.205 12.461 1.26
* *** *
Mullus sp. Mullidae 190 1 0.826 0.000 1.695 0.000 2.849 0.541 0.03
* Mullus surmuletus Mullidae 6648 50 41.322 0.000 84.746 0.000 142.450 18.940 1.40
*** *
Muraena helena Muraenidae 5669 6 4.959 0.000 10.169 0.000 17.094 16.151 0.17
* * Mycteroperca rubra Serranidae 2221.2 11 9.091 8.511 11.864 0.000 31.339 6.328 0.31 * * * Nemipterus randalli (L) Nemipteridae 864.4 13 10.744 2.128 15.254 20.000 37.037 2.463 0.36
* *
Oblada melanura Sparidae 454.2 4 3.306 2.128 1.695 13.333 11.396 1.294 0.11 * Ophidion barbatum Ophidiidae 30 1 0.826 0.000 1.695 0.000 2.849 0.085 0.03
*
Pagellus acarne Sparidae 6363.8 125 103.306 6.383 203.390 13.333 356.125 18.130 3.49 * * *** ***
Pagellus erythrinus Sparidae 8755.3 97 80.165 85.106 86.441 40.000 276.353 24.944 2.71 ** ** *** *
Pagrus auriga Sparidae 298.5 1 0.826 2.128 0.000 0.000 2.849 0.850 0.03
* Pagrus caeruleostictus Sparidae 5303.1 30 24.793 27.660 23.729 20.000 85.470 15.109 0.84 ** * * *
Pagrus pagrus Sparidae 5118.8 30 24.793 17.021 37.288 0.000 85.470 14.583 0.84 * * ** *
Pegusa impar Soleidae 74 1 0.826 0.000 1.695 0.000 2.849 0.211 0.03 * Pempheris vanicolensis (L) Pempheridae 653.2 13 10.744 19.149 6.780 0.000 37.037 1.861 0.36 * * *
Phycis blennoides Phycidae 2885.5 23 19.008 0.000 37.288 6.667 65.527 8.221 0.64
** *
Phycis phycis Phycidae 27334.7 145 119.835 14.894 232.203 6.667 413.105 77.877 4.05 * * *** ***
Pomadasys incisus Haemulidae 1939.7 18 14.876 23.404 8.475 13.333 51.282 5.526 0.50 ** * Pomadasys stridens (L) Haemulidae 65.1 1 0.826 0.000 0.000 6.667 2.849 0.185 0.03
*
Pseudocaranx dentex Carangidae 190 1 0.826 2.128 0.000 0.000 2.849 0.541 0.03 * Sardinella aurita Clupeidae 405.9 6 4.959 8.511 3.390 6.667 17.094 1.156 0.17 *
* Sardinella maderensis [VU] Clupeidae 139.3 1 0.826 0.000 0.000 0.000 2.849 0.397 0.03 *

110
Sargocentron rubrum (L) Holocentridae 108189 1109 916.529 344.681 1245.763 1413.333 3159.544 308.231 30.99 *** *** *** Saurida lessepsianus (L) Synodontidae 17 1 0.826 0.000 1.695 0.000 2.849 0.048 0.03
*
Sciaena umbra [NT]-[VU] in Med Sciaenidae 738.6 6 4.959 10.638 1.695 0.000 17.094 2.104 0.17 *
Scomber japonicus Scombridae 1493.2 21 17.355 25.532 10.169 20.000 59.829 4.254 0.59 ** * * Scomber scombrus Scombridae 1056 7 5.785 0.000 11.864 0.000 19.943 3.009 0.20
*
Scorpaena elongata Scorpaenidae 7116 31 25.620 0.000 52.542 0.000 88.319 20.274 0.87
* ** **
Scorpaena notata Scorpaenidae 1279 10 8.264 0.000 16.949 0.000 28.490 3.644 0.28
* *
Scorpaena porcus Scorpaenidae 814.6 5 4.132 0.000 3.390 20.000 14.245 2.321 0.14 * * Scorpaena scrofa Scorpaenidae 1051.4 11 9.091 4.255 11.864 13.333 31.339 2.995 0.31 * * * *
Seriola dumerili Carangidae 8413.5 42 34.711 76.596 10.169 0.000 119.658 23.970 1.17 ** * * Serranus cabrilla Serranidae 975.7 17 14.050 0.000 20.339 33.333 48.433 2.780 0.47 * * * *
Serranus scriba Serranidae 109 1 0.826 0.000 0.000 6.667 2.849 0.311 0.03 * Siganus luridus (L) Siganidae 2032.1 21 17.355 14.894 22.034 6.667 59.829 5.789 0.59 ** * *
Siganus rivulatus (L) Siganidae 4640.5 67 55.372 34.043 28.814 226.667 190.883 13.221 1.87 *** ** * Solea solea Soleidae 346 2 1.653 0.000 3.390 0.000 5.698 0.986 0.06
*
Sparisoma cretense Scaridae 316.7 5 4.132 2.128 0.000 26.667 14.245 0.902 0.14 * * Sphoeroides pachygaster Tetraodontidae 2659 3 2.479 0.000 5.085 0.000 8.547 7.575 0.08
* *
Stephanolepis diaspros (L) Monacanthidae 2513 26 21.488 27.660 10.169 46.667 74.074 7.160 0.73 ** * * Synodus saurus Synodontidae 82 1 0.826 2.128 0.000 0.000 2.849 0.234 0.03 *
Trachinotus ovatus Carangidae 416.6 4 3.306 0.000 1.695 20.000 11.396 1.187 0.11 * * Trachinus draco Trachinidae 540.6 1 0.826 2.128 0.000 0.000 2.849 1.540 0.03
*
Trachinus radiatus Trachinidae 162 1 0.826 0.000 1.695 0.000 2.849 0.462 0.03
* * Trachinus sp. Trachinidae 319 1 0.826 0.000 1.695 0.000 2.849 0.909 0.03 *
Trachurus picturatus Carangidae 5805.9 21 17.355 0.000 33.898 6.667 59.829 16.541 0.59
** Trachurus trachurus Carangidae 200.7 4 3.306 0.000 0.000 26.667 11.396 0.572 0.11
*
Trichiurus lepturus Trichiuridae 254 3 2.479 2.128 3.390 0.000 8.547 0.724 0.08
* *
Trigloporus lastoviza Triglidae 1313.5 18 14.876 14.894 18.644 0.000 51.282 3.742 0.50 * * * *
Trygla lyra Triglidae 157.3 5 4.132 10.638 0.000 0.000 14.245 0.448 0.14
* Umbrina cirrosa Sciaenidae 1077 4 3.306 0.000 6.780 0.000 11.396 3.068 0.11 *
*
Upeneus moluccensis (L) Mullidae 54 2 1.653 0.000 3.390 0.000 5.698 0.154 0.06
* Uranoscopus scaber Uranoscopidae 1411.6 8 6.612 2.128 8.475 13.333 22.792 4.022 0.22 * * * Xyrichthys novacula Labridae 83.6 2 1.653 2.128 0.000 6.667 5.698 0.238 0.06 *
Aristaeomorpha foliacea Aristeidae 8059.6 265 219.008 4.255 445.763 0.000 754.986 22.962 7.40
* *** ***
Aristeus antennatus Aristeidae 383.1 12 9.917 2.128 18.644 0.000 34.188 1.091 0.34
* *
Calappa granulata Calappidae 4312.3 26 21.488 6.383 38.983 0.000 74.074 12.286 0.73
* ** **
Charybdis longicollis (L) Portunidae 343.8 17 14.050 0.000 28.814 0.000 48.433 0.979 0.47 * * * *

111
Goneplax rhomboides Goneplacidae 4 1 0.826 0.000 1.695 0.000 2.849 0.011 0.03
*
Homola barbata Homolidae 29 3 2.479 0.000 5.085 0.000 8.547 0.083 0.08
* *
Liocarcinus depurator Portunidae 156 5 4.132 8.511 1.695 0.000 14.245 0.444 0.14 * *
*
Maja goltziana Majidae 15351.3 107 88.430 40.426 149.153 0.000 304.843 43.736 2.99
* *** **
Marsupenaeus japonicus (L) Penaeidae 24.3 3 2.479 2.128 3.390 0.000 8.547 0.069 0.08 * Medorippe lanata Dorippidae 15 1 0.826 0.000 1.695 0.000 2.849 0.043 0.03
*
Myra subgranulata (L) Leucosiidae 104 3 2.479 0.000 3.390 0.000 8.547 0.296 0.08
* Parapandalus narval Pandalidae 14 2 1.653 0.000 3.390 0.000 5.698 0.040 0.06
*
Parapenaeus longirostris Pandalidae 236.1 19 15.702 12.766 22.034 0.000 54.131 0.673 0.53 *
** *
Parthenope sp. Parthenopidae 259 9 7.438 0.000 15.254 0.000 25.641 0.738 0.25
* *
Plesionika edwardsi Pandalidae 20 2 1.653 0.000 3.390 0.000 5.698 0.057 0.06
* Portunus pelagicus (L) Portunidae 2633.1 39 32.231 25.532 45.763 0.000 111.111 7.502 1.09 ** *
Scyllarides latus Scyllaridae 449.7 2 1.653 2.128 1.695 0.000 5.698 1.281 0.06
* Squilla mantis Squillidae 41.6 1 0.826 2.128 0.000 0.000 2.849 0.119 0.03
*
Illex coindetii Ommastrephidae 1181 7 5.785 6.383 6.780 0.000 19.943 3.365 0.20
* *
Loligo vulgaris Loliginidae 180 1 0.826 2.128 0.000 0.000 2.849 0.513 0.03 * Octopus vulgaris Octopodidae 1165 2 1.653 0.000 3.390 0.000 5.698 3.319 0.06 *
*
Sepia elongata Sepiidae 85 1 0.826 0.000 1.695 0.000 2.849 0.242 0.03
* Sepia officinalis Sepiidae 2150.4 16 13.223 0.000 22.034 20.000 45.584 6.126 0.45 * * * *
Sepia orbignyana Sepiidae 701 9 7.438 0.000 15.254 0.000 25.641 1.997 0.25
* * *
Sepia sp. Sepiidae 136 1 0.826 0.000 1.695 0.000 2.849 0.387 0.03
*
Todarodes sagittatus Ommastrephidae 622 2 1.653 4.255 0.000 0.000 5.698 1.772 0.06
* Todaropsis eblanae Ommastrephidae 120 1 0.826 0.000 1.695 0.000 2.849 0.342 0.03
*
Centrophorus granulosus Centrophoridae 105000 21 17.355 0.000 35.593 0.000 59.829 299.145 0.59
** * Dalatias licha [NT] – [VU]
in Med Dalatiidae 13200 2 1.653 0.000 3.390 0.000 5.698 37.607 0.06
* Dasyatis marmorata Dasyatidae 2780 4 3.306 0.000 6.780 0.000 11.396 7.920 0.11 * * * Dasyatis pastinaca Dasyatidae 4071 4 3.306 0.000 3.390 13.333 11.396 11.598 0.11
* *
Gymnura altavela [VU] – [CR] in Med Gymnuridae 453 1 0.826 0.000 1.695 0.000 2.849 1.291 0.03
*
Heptranchias perlo [NT] Hexanchidae 13000 3 2.479 0.000 5.085 0.000 8.547 37.037 0.08
*
Raja clavata [NT] Rajidae 18340 21 17.355 2.128 33.898 0.000 59.829 52.251 0.59
* * **
Raja miraletus Rajidae 11717 52 42.975 0.000 88.136 0.000 148.148 33.382 1.45
* ** *
Rhinobatos rhinobatos [EN] Rhinobatidae 2180 3 2.479 0.000 0.000 20.000 8.547 6.211 0.08
* * Squatina aculeata [CR] Squatinidae 12000 1 0.826 2.128 0.000 0.000 2.849 34.188 0.03
*
Torpedo marmorata Torpedinidae 7646 22 18.182 0.000 37.288 0.000 62.678 21.783 0.61 *
** *
Torpedo nobiliana Torpedinidae 2635 7 5.785 0.000 11.864 0.000 19.943 7.507 0.20
*

112
Depth distribution The relationship between depth and catch per unit of effort (CPUE) is shown in Figure 26. Net surface was
calculated separately according to depth to normalize abundance results. Numerical abundance was
significantly correlated with depth. Telosteans (bony fishes) showed highest CPUE over the coastal shelf.
Crustaceans and elasmobranchs showed highest abundances in deeper waters, over the deeper shelf and
the upper slope. Cephalopods showed an unclear trend with bulk of abundance in the medium-deeper
shelf and a sharp peak at 250 m depth.
Figure 26.Relationship between sampling depth and CPUE in specimens/Km2 of nets for the main taxa of demersal organisms obtained in the eastern Mediterranean Sea.
The relationships between depth and CPUE for some of the most abundant demersal species according to
this study is shown in Figure 27. A variety of patterns of the bathymetric distribution of the studied species
was found:
S. rubrum and Siganus rivulatus exhibited a distribution restricted to the coastal shelf with bulk of
abundance set between 30 and 40 m depth. Pagellus acarne showed a wide distribution with few
specimens collected between 30 and 80 meters, a bulk at 200 meters with a decreasing trend down to 220
meters depth.
Four species (Merluccius merluccius, Dentex macrpphthalmus, Phycis phycis and Maja goltziana) showed an
increasing trend of population density with depth, within the depth range of this study. For P. phycis and M.
goltziana, we can assume that there was a peak in population density deeper than the maximum depth
surveyed. These species also reveal a bulk of abundance at 120-140 meters.
CPUE
(spec
/Km2)
Depth (m) Depth (m)
CPUE
(spec/
Km2)
Bony

113
A. foliacea showed the highest abundance between 130 and 140 meters followed by a decreasing trend of
population density with depth. At the deepest limit of the depth distribution of this study, this species
showed a growing trend that make us presume a peak in population density deeper than the maximum
depth surveyed.
Raja miraletus showed a narrow depth distribution mainly limited to 130 meters; 85% of the specimens
were collected at this depth.
CPUE (Specs/Km2 nets) CPUE (Specs/Km2 nets) CPUE (Specs/Km2 nets)
Dep
th (
-m)
Dep
th (
-m)

114
Figure 27. Depth distribution between 10 and 300 meters depth for nine species in the eastern Mediterranean.
Lessepsian species. As shown in table 19, a total of 17 Lessepsian species (distributed in 14 families), 13
teleosteans and 4 crustaceans were collected in our study. They amounted to almost 160 Kg and 1386
specimens collected: this represents 26.47% of the total weight and 38.73% in number of specimens
collected. Only 4 individuals (315 g) belonging to the three Lessepsian species, Charybdis longicollis,
Lagocephalus sceleratus and L. spadiceus were collected over the upper slope, representing 0.29% of the
total number of Lessepsian specimens collected for this study.
CPUE (Specs/Km2 nets) CPUE (Specs/Km2 nets) CPUE (Specs/Km2 nets)
Dep
th (
-m)

115
DISCUSSION
Coastal, demersal stocks are subject to various threats worldwide, especially in the Mediterranean Sea,
which is considered a hotspot of biodiversity but at the same time a hotspot of threat for demersal species
(Coll, et al., 2010; Ben Rais Lasram, et al., 2008). Overfishing, bycatch, introduction of non-indigenous
species (NIS), pollution, habitat loss and climate change are the foremost sources of stress affecting this fish
group (Coll, et al., 2010). Presence and status of demersal populations has been described for most regions
of the Mediterranean (e.g. Colloca, et al., 2003; Gaertner, et al., 2007; Quignard & Tomasini, 2007; Ben Rais
Lasram, et al., 2009; Coll, et al., 2010; Gaertner, et al., 2013; Granger, et al., 2015) with the exception of the
eastern basin and notably along the Lebanese coast where information on abundance, distribution and
assemblages of demersal species is still deficient. As such, the Levantine Basin is described as low in species
richness, due to the unfavourable conditions prevailing in the area - such as high salinity (Por &
Dimentman, 2006) - but also, most likely to a reduced sampling effort. A lack of data in several eastern and
southern regions of the Mediterranean basin may have strongly influenced results and considerations on
spatial patterns.
This study represents the only evaluation of demersal resources, distribution and diversity along the
Lebanese coast, Eastern Mediterranean since around 50 years. This paper shows results obtained from
landings obtained by fisheries independent scientific surveys carried out in Lebanese coastal waters.
Sampling protocol We deemed fishery-independent survey as the most appropriate tool to provide valuable measures of
relative abundance, rates of population change and size and sex composition for a wide range of demersal
species. In fact, fishery-independent surveys form the cornerstone of many stock assessments for bony
fishes and shellfish species, as they are less subject to the unknown and often confounding factors that
complicate the interpretation of fishery-dependent indices of stock status (Rago, 2005). Thus fishery-
independent surveys strike a balance between the ability to make inferences about one or more
populations versus the usage of a specific area by one or more species (Rago, 2005).
For the selection of the sampling gear, we considered took into consideration that mechanisms modifying
the catchability coefficient or overdispersion of some pelagic species (Fonteneau, et al., 1999), can bias our
results and lead to relevant mistakes in their interpretation. To reduce the incidence of the catchability
factor, we used different types of experimental gears and we focused our study on demersal species
underexposing our results to bias due to big schools highly dispersed pelagic species. Nonetheless, In the
case of Lebanon, the most important commercial species are typical coastal and distributed over areas
where standard trawling cannot be carried out (Brême, 2004; Carpentieri, et al., 2009). For this reason,
backed by fishermen and scientists, we finally developed an experimental trammel net suitable for
operating over the continental shelf and upper slope, with poor selectivity properties to catch a variety of
species and sizes of fish and other organisms. In fact, if compared to gillnets, trammel nets of different
mesh sizes ensure similar mechanisms of capture in terms of snagging (the fish is caught by twine
entangling with the fish oral area), gilling (caught with the mesh behind the gill cover); wedging (caught by
the largest part of the body) (Karlsen & Bjarnason, 1986; Grati, et al., 2015), whereas the entangling factor
increases due to the presence and configuration of additional two sheets of netting (Cochrane, 2002).
Variation of abundance index The analysis of the Catch Per Unit Effort (CPUE) and total weight variation of the demersal fish observed
during this study provided indications of the spatio-temporal variation of their distribution and abundance.

116
Although the causes for the spatial distribution of a fish population are still poorly understood, density-
dependent processes are often suggested as a possible explanation (Myers & Stokes, 1989; MacCall, 1990;
Casini, et al., 2005) , as well as environmental factors (Corten & van de Kamp, 1996; Heessen, 1996; Rose &
Kulka, 1999), pollution, habitat loss induced by anthropogenic activities including degree of stock
exploitation (Winters & Wheeler, 1985) and recent warming of the climate system (Gray, et al., 2005;
Poulard & Blanchard, 2005; Rochet, et al., 2010). Factors affecting fish abundance and distribution often
operate at regional scales (Heessen & Daan, 1996; Rose & Kulka, 1999). However, the nature of Lebanese
water, availability of prey, daily and seasonal movements for breeding and feeding, as well as fishing
techniques and the depths at fishing can explain to a certain extent, the variation in distribution and
abundance (Bianchi, 1992; Koslow, 1993; Gordon, et al., 1995). Due to the uniqueness of this study in the
region, no trend could be estimated concerning the variation in abundance and biomass of demersal fish
inhabiting the coastal waters.
Spatial and depth variation The survey of the year 2012 resulted in an overall low CPUE without relevant differences among sector.
With the exception of one haul carried in out in region ‘Beirut-Saida’, all the sampling stations provided less
than 10 Kg of samples. Instead, in 2013 the yields in the northern sectors (‘Akkar Shelf’ and ‘Tripoli-Beirut’)
remained similar to the previous year whilst ‘Beirut-Saida’ and ‘Saida-Naqoura’ sectors gave an average for
the two areas of more than 10 Kg per haul.
Data showed the depth to cause a general decrease in the numerical abundance and biomass (beyond 150
m depth) probably related to a general reduction in food availability that affects epibenthic and demersal
assemblages on the slope (Peres, 1985; Sanders & Hessler, 1969). This pattern was due to a reduction of
the abundance of teleosteans, which decreased with depth, while decapod crustaceans and elasmobranchs
showed an opposite trend increasing from the coastal shelf to the middle slope. This trend is similar to the
one described by Colloca, et al. (2003) as a result of the MEDITS campaign run in Italian Central
Mediterranean Sea. Abundant shelf species (Mullus barbatus, Pagellus erythrinus, Sargocentron rubrum,
Siganus rivulatus) and slope species (Dentex macrophthalmus, Merluccius merluccius, Phycis phycis,
Aristaeomorpha foliacea, etc.) have their nursery grounds, respectively, on the coastal shelf and shallow
slope (Ardizzone & Corsi, 1997; Golani & Ben-Tuvia, 1985; Bariche, 2012) and contributed to the increased
dominance in these regions. The most abundant elasmobranches were Raja miraletus and Centrophorus
granulosus. The latter is a demersal shark caught in large individuals probably as a result of the selectivity
of the trammel nets that usually intercept bigger individuals (Lteif, et al., 2017; Coelho, et al., 2005). Lteif et
al (2017) also reported that the Levantine area along the coast of Lebanon is a reproductive area for C.
granulosus (reported as C. uyato).
Biodiversity and Lessepsian species. One only previous systematic experience of data collection on the Lebanese halieutic resources was
performed by (George, et al., 1964). Their study relied almost entirely on commercial fishermen as supplier
of the specimens. A few specimens were obtained through limited shore seining and the poisoning of
coastal pot holes. They described 177 fish species inhabiting Lebanese coastal waters. It is worth
mentioning the inclusion in the list of species not directly collected but reported from adjacent waters,
adding a non-empirical element to this report (Golani, 1996).
In our study, 17 NIS of Lessepsian origin – 13 fish and 4 crustacean species - were recorded over the
Lebanese coastal waters, 15 of which demersal, one pelagic (the herring Etrumeus teres) and one with a
mixed benthic-pelagic behaviour (the portunid crab Charybdis longicollis). George, et al. (1964) reported 19
Lessepsian species over the 177 collected. This means that in 50 years the ratio of the autochthon fishing
resources remained steady, with an apparent slight decrease from 89% to 87%. Although in terms of

117
biomass (not mentioned in the study of George, et al., 1964) we can assume that 50 years ago this was
considerably poorer than today, in terms of number of species, the trend, at this stage, is not so evident. As
a result of 7 years of data collection carried out with various fishing gears over the Syrian waters, Saad
(2005) reported 224 species of Osteichthyes (bony fishes), 37 of which were NIS migrant from the Red Sea
(16.5%). In an extended work realised by Carpentieri, et al. (2009) in South Lebanon, a total of 25
Lessepsian species over 110 identified (23%) were recorded. This indicates that back then 77% of the total
catch was made up by Mediterranean species.
In absolute terms, in 2012, Zenetos, et al. (2012) reported 193 NIS species of Molluscs, 125 of Crustaceans
and 105 of fishes in the eastern Mediterranean. NIS numbers more than doubled between 1980 and 2016
and are substantially greater in the Levant than in the western Mediterranean (Galil, et al., 2017). This
confirms that the Mediterranean Sea – and more in specific its easternmost shores - is one of the hottest
hotspots of marine bioinvasions on Earth (Rilov & Crooks, 2009). The success of Lessepsian migrants in the
colonization of the eastern Mediterranean has been probably the result of occupation of an unsaturated
niche and of out-competing local species on resources such as food and shelter. NIS, in fact, may have
altered the evolutionary pathway of native species by competitive exclusion, niche displacement,
predation, and other ecological and genetic mechanisms (Mooney & Cleland, 2001).
ACKNOWLEDGEMENT
This study could not have been completed without the support of the Lebanese fishermen, their bravery
and tough job in the sea. The communities of fishermen are the ultimate beneficiaries of all our efforts
aimed at creating new and sustainable sources of income and improving their quality of life. Data and
financial funding for this study was provided in the framework of the CIHEAM-PESCA Libano project, of the
CANA project on “Establishing Monitoring and Sustainable Development of the Lebanese Sea” (both
financed by the Italian Cooperation) and within the Grant Research Programme of the CNRS-L.

118
Part II. Short Communication
Pattern of distribution and diversity of demersal
assemblages in the eastern Mediterranean Sea

119

120
Pattern of distribution and diversity of demersal assemblages in the eastern Mediterranean Sea
LELLI Stefano 1, 2, 3*, JEMAA Sharif1, LTEIF Myriam1, VERDOIT-JARRAYA Marion 2, 3, 4, COLLOCA Francesco5,
KHALAF Gaby 1
1 Lebanese National Council for Scientific Research – National Centre for Marine Sciences (CNRS-L/CNSM),
Batroun, Lebanon
2 Université de Perpignan Via Domitia, Centre de Formation et de Recherche sur les Environnements
Méditerranéens, UMR 5110, 52 Avenue Paul Alduy, 66860, Perpignan, France
3 CNRS, Centre de Formation et de Recherche sur les Environnements Méditerranéens, UMR 5110, 52
Avenue Paul Alduy, 66860, Perpignan, France
4 Centre de Recherche sur les Ecosystèmes Marins (CREM), impasse du solarium, 66420 Port-Barcarès,
France
5 CNR‐IAMC, Mazara del Vallo (TP), Italy
* Corresponding author. E-mail address: [email protected] (S. Lelli)
Telephone: +39 3406871090
ABSTRACT
The understanding of patterns of spatial distribution of fish populations is a critical consideration
particularly in the eastern Mediterranean Sea, where the faunal composition has been drastically altered by
the migration of numerous Indo-Pacific species from the Red Sea following the construction of the Suez
Canal in 1869. This migration can cause loss of native biodiversity, habitat destruction, pollution and
economic damages. Additionally, the eastern Mediterranean displays peculiar environmental
characteristics such as high temperature, high salinity, extreme oligotrophy and high anthropogenic
pressure with relevant effects on coastal ecosystems. Specimens were collected in the framework of a
three-year fishery-independent survey from June 2012 to October 2014 in the Lebanese marine waters,
Levantine Sea (eastern Mediterranean). Species assemblages occurring along the Lebanese continental
shelf and exploitable using gillnets and trammel nets were investigated. The analysis of the data collected
shows the occurrence of 6 clusters of stations with a different species composition that can configure 4
major assemblages along the Lebanese continental shelf and the upper slope.

121
Keywords: fishing impact; Levantine basin; spatiotemporal variations, small-scale fishery, fauna; species
composition
INTRODUCTION
Mediterranean small-scale fishing fleet are made up of approximately 65 000 vessels run by 130 000 fishers
(Sacchi & Dimech, 2011). These small-scale fisheries are characterized by the use of more than 50 types of
fishing gears to target species according to the fishing season (FAO, 2015). In Lebanon, the fishing fleet is
entirely composed of artisanal vessels using fixed gear (i.e. trammel nets, gillnets, longlines, traps) and
purse seiner nets for small pelagics. Fishing gears are fairly diversified and designed to exploit a wide range
of species in the coastal area with landings characterized by a great number of species (Carpentieri, et al.,
2009). In relation to these characteristics, understanding and future management of these fisheries should
require a multispecies approach, which considers the community (i.e. assemblages) and not the single
species as the basic unit of the analysis (Pitcher, 2000).
Numerous Authors analyzed faunal changes and the establishment of certain assemblages that occur in the
areas targeted by small-scale fisheries, i.e. continental shelf and upper slope. They proved that the spatial
distribution of demersal species is mainly influenced by depth, type of substratum and physical
characteristics (such as temperature and salinity) of the water masses, e.g. Mahon & Smith (1989); Bianchi
(1992); Fujita, et al. (1995); McClatchie, et al. (1997); Magnussen (2002); Gaertner, et al. (2005);
Maravelias, et al. (2007). Some species appear to be widely distributed independently of the environmental
gradients (Colloca, et al., 2003) even though biotic interactions among assemblage members seem to be of
less importance (Mahon & Smith, 1989; Sale, et al., 1994).
The understanding of patterns of spatial distribution of fish populations is a critical consideration
particularly in the eastern Mediterranean, where the faunal composition has been drastically altered by the
migration of numerous Indo-Pacific species from the Red Sea following the construction of the Suez Canal
in 1869 (Por, 1978; Galil & Zenetos, 2002). According to Mooney, et al. (2005) and Rilov & Galil (2009), this
migration can cause loss of native biodiversity, habitat destruction, pollution and economic damages.
Additionally, the eastern Mediterranean displays peculiar environmental characteristics such as high
temperature, high salinity, extreme oligotrophy and high anthropogenic pressure with relevant effects on
coastal ecosystems (Coll, et al., 2010).
The objective of the present study is to investigate and describe composition and spatial distribution of
demersal communities occurring on the Lebanese continental shelf and upper slope, in the Levantine Basin,
with a view of creating sound baseline for future protection and management measures of demersal
species along the Lebanese coast.

122
MATERIALS AND METHODS
Specimens were collected from June 2012 to October 2014 in the Lebanese marine waters, Levantine Sea
(eastern Mediterranean). Lebanese coastal line is about 225 km and the continental shelf is relatively wide
in the north, offshore of the Akkar plain (about 20 km), and in the south, offshore of Saida and Tyre
(Nabatiyeh plateau). Between Beirut and Batroun however, the shelf is extremely narrow and the margin
exhibits its steepest slope, with the water depth abruptly increasing from 100 to 1500 m in less than 5 km.
Along the entire margin the continental slope is incised by canyons, most of them connected to rivers
flowing from the mountains.
Lebanese coastal waters were broken down into 4 regions (Figure 28) to allow geographical-based analysis.
Total number of sampling stations was 48, spatially allocated randomly but proportionally to the extension
of each area. Specimens were sampled using trammel and gill nets with different mesh sizes lowered by
artisanal fishing vessels. The species were then identified using the identification guides of Fischer, et al.
(1987) and the three CIESM Atlases on Fishes (Golani, et al., 2002), Crustaceans (Galil, et al., 2002) and
Molluscs (Zenetos et al., 2003). All the individuals collected - irrespective the species - were measured and
weighed, additionally sex and maturity stage were determined. Collected specimens were stored on board
and returned to the laboratory. In the laboratory, each specimen collected was measured and weighed. A
measuring tape was used to measure fish total lengths (LT) to the nearest 0.1 centimeter (cm). Total
weights (wet weight, W) were measured to the nearest 0.01 gram (g) using a digital balance. For
crustaceans, the cephalothoracic length (CL) at the lower millimeter (mm) was measured.
Figure 28. Location of the sampling area in Lebanese marine waters, eastern Mediterranean. Lebanese coastal waters were break down into 4 regions based mainly on the conformation of the continental shelf (A: Akkar shelf; N: North; C: Center; S: South). Bathymetries up to 100 meters depth are shown.
Statistical analyses To evaluate dissimilarity patterns among assemblages, we used:
1. nonmetric multidimensional scaling (nMDS) based on Bray–Curtis similarity
2. maps of clusters
3. clusters by depth

123
A nMDS was performed on the matrix of CPUE in kilograms and number separately of the different
demersal species caught according to the scientific survey factors (gear, region, depth, and season). The
data (CPUE in kilograms and number or total weight) were log transformed before the analyses into
log(x+1) in order to homogenize the variances and normalize the distributions. Both nMDS analyses were
performed using the metaMDS function of the ‘vegan’ package on the statistical software ‘R project’ (R
Development Core Team, 2014) on 2012 and 2013 combined datasets.

124
RESULTS
Species assemblages occurring along the Lebanese continental shelf and exploitable using gillnets and
trammel nets have been investigated. The analysis of the data collected shows the occurrence of 6 clusters
of stations with a different species composition that can configure 4 major assemblages along the Lebanese
continental shelf and the upper slope., as shown in figures 29 and 30.
Figure 29. Cluster dendogram of surveyed stations along the Lebanese coast.
Figure 30. Multidimensional scaling of sampling stations along the Lebanese coast.

125
DISCUSSION
In the present work, structure and distribution of demersal fish assemblages were examined on the
continental shelf and upper slope of Lebanese waters, eastern Mediterranean Sea.
Clusters 1, 2 and 3 (including 16 sampling stations) feature poor catches located in north Lebanon and
more frequently in shallow waters. A small number of individuals of Sargocentron rubrum, Portunus
pelagicus characterised some of the hauls belonging to these clusters. In general, it is impossible to identify
any pattern.
Cluster 4 (6 sampling stations) reports stations located between Tripoli and Tyre at depths comprised
between 40 and 100 m. All the stations are characterised by the redcoat S. rubrum as dominant species of
the catches. This is typically a species inhabiting rocky bottoms, in coastal reefs or hidden in caves and
cracks of rocks especially during the day. This species was usually associated with Fistularia commersoni,
Pagellus acarne and siganids (species inhabiting bottoms of different nature) and the benthopelagic species
Trachurus picturatus.
Cluster 5 (26 sampling stations) is quite complex to examine as it includes hauls located over three sectors
(N, C, S), i.e. between Chekka (north Lebanon) and Naqoura (south) at all depths surveyed. To define a
pattern ecologically driven, the cluster may be divided into two sub-clusters that are easily detectable in
the multidimensional scaling shown in Figure 30. Hauls indicated as 40, 41, 43, 44 and 21, 27, 46 are all
located at depths between 100 and 150 m. Thus, they appear to be closely related to Cluster 6 showing an
assemblage typical of mobile bottoms in the deeper continental shelf. Teleosts (bony fishes) as Dentex
macrophthalmus, Phycis phycis, Merluccius merluccius, Pagellus spp., and the Crustaceans Maja goltziana
and Aristaemorpha foliacea resulted the most common species for this sub-cluster. It is interesting to
notice that the stations 40, 41, 43, 44 and those belonging to cluster 6 are all located in the Southern
Lebanese waters, defining a cluster of stations with common geographical location. The rest of the cluster
returned species found in mixed bottoms (sand/rocks) and caves in shallower waters (10 to 90 meters
depth) such as Diplodus vulgaris and S. rubrum.
Cluster 6 (3 sampling stations) comprises hauls located in the southern deeper continental shelf. The group
of species identified in this cluster is typical of sandy/muddy bottoms in the deeper continental shelf and
upper slope. The red giant shrimp A. foliacea is particularly abundant being associated with D.
macrophthalmus, M. merluccius, Mullus spp., the hollowsnout grenadier Coelorinchus caelorhincus,
Helicolenus dactylopterus, P. acarne, Phycis spp. and the selacean Centrophorus granulosus.
ACKNOWLEDGEMENT
This study could not have been completed without the support of the Lebanese fishermen, their bravery
and tough job in the sea. The communities of fishermen are the ultimate beneficiaries of all our efforts
aimed at creating new and sustainable sources of income and improving their quality of life. Data and
financial funding for this study was provided in the framework of the CIHEAM-PESCA Libano project, of the
CANA project on “Establishing Monitoring and Sustainable Development of the Lebanese Sea” (both
financed by the Italian Cooperation) and within the Grant Research Programme of the CNRS-L.

126
Chapter 5
Weight-length relationships

127

128
Chapter 5
Weight-length relationships
Information on weight-length relationships (WLR) of demersal species was almost absent along the
Lebanese coast. In Chapter 5, WLRs have been presented for thirty demersal species in Lebanese marine
waters, eastern Mediterranean. Some of of these species are commercially relevant and/or NIS.
Part I. Weight-length relationships of 3 demersal
fish species from Lebanese marine waters, eastern
Mediterranean
The WLRs of 3 demersal fish species (constituting Part 1 of chapter 5) had been submitted to the revue
‘Journal of Applied Ichthyology’ and accepted on July 4th, 2017, with the title “Weight-length relationships
of 3 demersal fish species from Lebanese marine waters, eastern Mediterranean” (DOI: 10.1111/jai.13459).
These species were selected because no WLRs had previously been published in the Mediterranean for
these species.
How to cite this article: Lelli S, Lteif M, Jemaa S, Khalaf G, Verdoit-Jarraya M., 2017. Weight- length
relationships of 3 demersal fish species from Lebanese marine waters, eastern Mediterranean. J.
Appl. Ichthyol. 2017;00:1–4 (early version). https://doi. org/10.1111/jai.13459
Part II. Weight-length relationships of 27 demersal
species from Lebanese marine waters, eastern
Mediterranean
It is envisaged to publish the WLRs of the other species in the revue ‘Egyptian Journal of Aquatic Research’
and they are presented following the previous article (Part 2 of chapter 5).

129

130
Weight-length relationships of 3 demersal fish species from Lebanese marine waters, eastern Mediterranean
Lelli S.1, 2, 3, 4*, Lteif M.1, Jemaa S.1, Khalaf G.1, Verdoit-Jarraya M.2, 3, 4
1 Lebanese National Council for Scientific Research – National Center for Marine Sciences (CNRS-L/CNSM), Batroun, Lebanon
2 Université de Perpignan Via Domitia, Centre de Formation et de Recherche sur les Environnements Méditerranéens, UMR 5110, 52 Avenue Paul Alduy, 66860, Perpignan, France
3 CNRS, Centre de Formation et de Recherche sur les Environnements Méditerranéens, UMR 5110, 52 Avenue Paul Alduy, 66860, Perpignan, France
4 Centre de Recherche sur les Ecosystèmes Marins (CREM), impasse du solarium, 66420 Port-Barcarès, France
Correspondence. Stefano Lelli, National Center for Marine Sciences (CNRS-L/CNSM), Batroun, Lebanon. Email: [email protected]
Funding information. Italian Ministry of Foreign Affairs and International Cooperation; Grant Research. Programme of the CNRS-L.
ABSTRACT
Weight-length relationships (WLRs) were estimated for 3 demersal species, from the Lebanese marine
waters, eastern Mediterranean, namely Coelorinchus caelorhincus (Risso, 1810), Scorpaena elongata
Cadenat, 1943 and Stephanolepis diaspros Fraser-Brunner, 1940. The specimens were collected using
trammel and gill nets from June 2012 to October 2014. The values of parameter b of the WLRs W=aLb
ranged from 2.922 to 3.708. Pronounced sexual dimorphism in WLR was observed for S. diaspros and none
showed a WLR-based geographical pattern of distribution. WLRs reported in this study should be applied
only within the observed length ranges.
Keywords: Lebanon, weight-length regressions, fishes
INTRODUCTION
Length and weight data are useful in fisheries management and standard results of fish sampling programs.
Weight–length relationships (WLRs) are used for estimating the weight corresponding to a given length,
and condition factors are used for comparing the condition, fatness, or well-being (Tesch, 1968) of fish,

131
based on the assumption that heavier fish of a given length are in better condition. Both concepts have
been used in fisheries research since the beginning of the 20th century (Froese, 2006). WLRs are only
known for a restricted number of species, which hampers efforts to model aquatic ecosystems. On the one
hand WLRs are used to predict the weight from the length of a fish, which is particularly useful for
computing the biomass of a sample of fish from the length-frequency of that sample. On the other, WLR for
a given population can be compared to average parameters taken from other regions, in different years in
order to identify the relative condition or robustness of the population (Le Cren, E. D. 1951). Hence, WLR is
considered an important tool in fisheries management (Froese et al., 2011).
Eastern Mediterranean halieutic species are poorly studied and very little biological information is
available, notably for most of the commercially relevant species. There is an urgent need to manage and
regulate small-scale coastal fisheries in the region to ensure the long-term sustainability of fishery
resources, and this requires basic population dynamics information for the target species (Santos et al.,
1995). In Lebanon, Colloca & Lelli (2012) and Khalaf et al. (2014) characterized WLRs for the striped soldier
shrimp Plesionika edwardsii, the puffer fish Lagocephalus sceleratus.
In this paper, WLRs were estimated for 3 coastal species, i.e. Coelorhynchus coelorhynchus, Scorpaena
elongata, Stephanolepsis diaspros. We are providing wider size ranges than those found in science
literature and to the best of our knowledge, this study presents the first estimation of WLRs for S. elongata.
Specimens were captured in Lebanese waters in the framework of a multiannual fisheries-independent
data collection for the assessment of demersal coastal species. Sex and geographic distribution effects on
WLRs was also examined.
MATERIALS AND METHODS
The specimens were collected from June 2012 to October 2014 in the Lebanese marine waters, Levantine
Sea (eastern Mediterranean). Lebanese coastal line (220 km) was broken down into 4 regions (Figure 31) to
allow geographical-based analysis. Specimens were sampled using trammel and gill nets with different
mesh sizes lowered by artisanal fishing vessels. All the individuals collected - irrespective the species - were
measured and weighed; additionally sex and maturity stage were determined. Collected specimens were
stored on board and returned to the laboratory where they were measured and weighed. A mesuring tape
was used to measure fish total lengths (TL) to the nearest 0.1 centimeter (cm). Total weights (wet weight,
TW) were measured to the nearest 0.01 gram (g) using a digital balance. Biological data were collected
following the Medits Handbook, Version 7 (2013).
The parameters a and b, of the WLR curve (W = aLb) were estimated using a nonlinear least squares
function nls in the statistical software R (R Development Core Team, 2014). The start values of these
parameters were derived from the log transformation of the two variables (ln W = ln a + b ln L) using the
linear model function lm. The coefficient of determination (r2) aids in determining the accuracy of the
model prediction skills. Finally, statistical comparison of WLR between sexes (tests were only performed
for species with sample size for each sex modality upper than 5 individuals) and geographical sectors
was performed by applying ANCOVA tests (Zar, 1996). When significant differences were observed, WLR
was estimated for each sex; when no significant differences were observed, one WLR was estimated for the
sexes combined (comprising Non-determined individuals). Standard deviations of b were calculated to

132
detect substantial deviation from isometric growth (b=3). Significant difference of b values from 3, which
represent isometric growth, was tested with the T-test (Pauly, D., 1993).
Figure 31. Location of the sampling area in Lebanese marine waters, eastern Mediterranean. Lebanese coastal waters were break down into 4 regions based mainly on the conformation of the continental shelf (A: Akkar shelf; N: North; C: Center; S: South). Bathymetries up to 100 meters depth are shown.
RESULTS
A total of 90 individuals belonging to three species were examined in this study. Among them,
Stephanolepis diaspros is an early Red Sea immigrant in the Mediterranean Sea firstly reported by Steinitz
(1927) in Palestinian waters. The length and weight characteristics, as well as the sample size and
parameters of the WLRs are represented in table 20. The sample sizes ranged from a minimum of 26
individuals for S. diaspros to a maximum of 33 for C. caelorhincus. Pronounced sexual dimorphism in WLR
was observed for S. diaspros with significant differences in the slopes of WLR between males and females
(ANCOVA; P< 0.05). The values of the allometric coefficient (b) ranged from a minimum of 2.922 for S.
diaspros (all individuals) to a maximum of 3.708 for male specimens of S. diaspros (Table 20). The three
species evidenced a nearly isometric growth with a mean b value of 3.027 (SD. 0.096). All relations were
highly significant (P<0,001), the most accurate model was shown to be that of S. elongata (r2= 0.990) and
the least one was that of C. caelorhincus (r2 = 0.560).
No WLR-based geographical pattern of distribution were found.
Estimated WLR parameters should be considered only as mean annual values for most of these species
since the data were collected over an extensive period of time and are not representative of any particular
season.

133
Table 20. The length and weight characteristics as well as the parameters of the length-weight relationships (W=aLb) for 3 species caught in the Lebanese waters, eastern Mediterranean. When significant differences between sexes were observed, WLR was estimated for each sex; when no significant differences were observed, one WLR was estimated for the sexes combined (comprising non-determined individuals). Sex (F = female; M = male; All = includes F, M and non-determined individuals); N is the sample size; W is the weight; SD is the standard deviation; a and b are the parameters of the length-weight relationships; r2 is the coefficient of determination. Meaning of the letters and symbol in exponent in the first column: L for Lessepsian species, * for species for which it is the first information available on WLRs. In the first column, number of individuals in each sex modalities are specified. P-value, significance between male and female [in bold, significant differences (P<0.05)], with tests only performed for species with sample size for each sex modality upper than 5 individuals.
Species Sex N Samples characteristics Relation parameters P-value
TL min–TL max
(mm)
W min–W max
(g) a (10-3) b (10-3) SD (b) r2
Coelorhynchus
coelorhynchus (Risso, 1810)
20 F; 8 M ; 5 ND
All 33 11.0-24.0 9.0-125.0 0.004 3.110 0.618 0.56 0.78
Scorpaena elongata
Cadenat, 1943 *
18 F ; 9 M ; 4 ND
All 31 14.0-41.5 36.0-1124.0 0.013 3.050 0.046 0.99 0.44
Stephanolepis diaspros
Fraser-Brunner, 1940 L, All 26 10.5-25.0 14.0-244.0 0.020 2.922 0.251 0.84 0.01
7 F ; 15 M ; 4 ND M 15 13.5-22.0 14.0-190.0 0.002 3.708 0.350 0.87

134
DISCUSSION
Information related to the WLR of demersal species is almost absent along the Lebanese coast. Froese
(2006) and Froese et al. (2014) had analyzed the WLR of all fishes available on the Fishbase website
(www.fishbase.org) using meta-analysis and Bayesian methods. A few studies carried out by Turkish
Authors (Başusta et al., 2013; Ergüden et al., 2009; Ergüden et al., 2017; Gündoğdu et al., 2016; Özvarol,
2014; Sangun et al., 2007; Taskavak and Bilecenoglu, 2001) bring together information on WLRs for
demersal species in the northern part of the eastern Mediterranean. This information allowed us
comparisons only with S. diaspros, whose WLR shows corresponding negative allometric pattern in Sangun
et al., 2007. C. coelorhynchus showed different allometric patterns as those reported in other
Mediterranean sub-regions (Aegean and Adriatic Sea) by Ungaro et al. 2001; Filiz, & Bilge 2004 and Filiz et
al. 2006, whereas no references are available in the eastern Mediterranean. No references whatsoever are
reported on Fishbase website (Froese & Pauly 2017) on S. elongata.
As pointed out by Petrakis and Stergiou (1995), use of the WLR should be limited to the sizes in the
estimation of the parameters. However, this may act as a tool to support fisheries management measures
by establishing a minimum catch weight limit when lengths are estimated at sea. In Lebanon, where
management measures are limited or outdated and the fishing pressure is high on coastal fisheries
resources while fishing practices targeting juvenile fishes are partially driven by the market (Bariche et al.,
2006; Sacchi & Dimech., 2011; Colloca & Lelli 2012), the use of basic but powerful descriptive tools of
halieutic populations such as WLRs is highly recommended.
ACKNOWLEDGEMENTS
This study could not have been completed without the support of the Lebanese fishermen, their bravery
and tough job in the sea. The communities of fishermen are the ultimate beneficiaries of all our efforts
aimed at creating new and sustainable sources of income and improving their quality of life. Data and
financial funding for this study was provided in the framework of the CIHEAM-PESCA Libano project, of the
CANA project on “Establishing Monitoring and Sustainable Development of the Lebanese Sea” (both
financed by the Italian Cooperation) and within the Grant Research Programme of the CNRS-L.
Conflict of interest
The author certifies that there is no conflict of interest.

135

136
Part II. Weight-length relationships of 27 demersal species
from Lebanese marine waters, eastern Mediterranean
Weight-length relationships of 27 demersal species from Lebanese marine
waters, eastern Mediterranean
LELLI Stefano 1, 2, 3*, LTEIF Myriam1, JEMAA Sharif1, KHALAF Gaby 1, VERDOIT-JARRAYA Marion 2, 3, 4
1 Lebanese National Council for Scientific Research – National Centre for Marine Sciences (CNRS-L/CNSM),
Batroun, Lebanon
2 Université de Perpignan Via Domitia, Centre de Formation et de Recherche sur les Environnements
Méditerranéens, UMR 5110, 52 Avenue Paul Alduy, 66860, Perpignan, France
3 CNRS, Centre de Formation et de Recherche sur les Environnements Méditerranéens, UMR 5110, 52
Avenue Paul Alduy, 66860, Perpignan, France
4 Centre de Recherche sur les Ecosystèmes Marins (CREM), impasse du solarium, 66420 Port-Barcarès,
France
* Corresponding author. E-mail address: [email protected] (S. Lelli)
Telephone: +39 3406871090

137
ABSTRACT
Weight-length relationships (WLRs) were estimated for 27 demersal species, from the Lebanese marine
waters, eastern Mediterranean (21 teleost fish, 3 elasmobranch fish and 3 crustaceans), namely
Aristaeomorpha foliacea, Auxis rochei, Citharus linguatula, Dentex macrophthalmus, Diplodus vulgaris,
Fistularia commersonii, Helicolenus dactylopterus, Lagocephalus sceleratus, Maja goltziana, Merluccius
merluccius, Mullus barbatus, Mullus surmuletus, Pagellus acarne, Pagellus erythrinus, Pagrus
caeruleostictus, Pagrus pagrus, Phycis blennoides, Phycis phycis, Portunus pelagicus, Raja clavata, Raja
miraletus Sargocentron rubrum, Seriola dumerili, Siganus luridus, Siganus rivulatus, Torpedo marmorata,
Trachurus picturatus. Among these species, 6 were Lessepsian migrants, 13 were commercially important
and 22 were described for the first time in this area. The specimens were collected using trammel and gill
nets from June 2012 to October 2014. The values of parameter b of the WLRs W=aLb ranged from 1.818 to
3.494. Pronounced sexual dimorphism in WLR was observed for M. barbatus, P. erythrinus, P. phycis, S.
rubrum, and T. marmorata. S. rubrum also showed a WLR-based geographical pattern of distribution. WLRs
reported in this study should be applied only within the observed length ranges.
Keywords: Lebanon, weight-length regressions, fishes
INTRODUCTION
Length and weight data are useful in fisheries management and standard results of fish sampling programs.
Weight–length relationships (WLRs) are used for estimating the weight corresponding to a given length,
and condition factors are used for comparing the condition, fatness, or well-being (Tesch, 1968) of fish,
based on the assumption that heavier fish of a given length are in better condition. Both concepts have
been used in fisheries research since the beginning of the 20th century (Froese, 2006). WLRs are only
known for a restricted number of species, which hampers efforts to model aquatic ecosystems. On the one
hand WLRs are used to predict the weight from the length of a fish, which is particularly useful for
computing the biomass of a sample of fish from the length-frequency of that sample. On the other, WLR for
a given population can be compared to average parameters taken from other regions, in different years in
order to identify the relative condition or robustness of the population (Le Cren, E. D. 1951). Hence, WLR is
considered an important tool in fisheries management (Froese et al., 2011).
Eastern Mediterranean halieutic species are poorly studied and very little biological information is
available, notably for most of the commercially relevant species. There is an urgent need to manage and
regulate small-scale coastal fisheries in the region to ensure the long-term sustainability of fishery
resources, and this requires basic population dynamics information for the target species (Santos et al.,
1995). In Lebanon, Colloca & Lelli (2012), Khalaf et al. (2014) and Lteif et al. (2016) characterized WLRs for
the striped soldier shrimp Plesionika edwardsii, the puffer fish Lagocephalus sceleratus and 8 cartilaginous
fish species respectively. Furthermore, since 2015, the Lebanese National Council for Scientific Research
(CNRS-L) with the support of the FAO EastMed project is running a monthly-based biological data collection
on 3 species (Pagellus erythrinus, Lithognathus mormyrus and Sardinella aurita), which includes also the
estimation of their WLRs (data not yet published).
In this paper, WLRs were estimated for 27 coastal species captured in Lebanese waters using data collected
in the framework of a multiannual fisheries-independent data collection for the assessment of demersal
coastal species. It represents the first information available on WLRs for 22 of these species along the
Libano-Syrian coast, namely Aristaeomorpha foliacea, Auxis rochei, Citharus linguatula, Dentex

138
macrophthalmus, Diplodus vulgaris, Fistularia commersonii, Helicolenus dactylopterus, Maja goltziana,
Merluccius merluccius, Mullus barbatus, Mullus surmuletus, Pagellus acarne, Pagrus caeruleostictus, Pagrus
pagrus, Phycis blennoides, Phycis phycis, Portunus pelagicus, Sargocentron rubrum, Seriola dumerili, Siganus
luridus, Siganus rivulatus, Trachurus picturatus. Also, to the best of our knowledge, this study presents the
first estimation of WLRs for Auxis rochei and Maja goltziana.
It aims at providing information for sound population dynamic based models reporting data on the most
common demersal species and those that are mostly targeted by local artisanal fisheries. Sex and
geographic distribution effects on WLRs was also examined.
MATERIALS AND METHODS
The specimens were collected from June 2012 to October 2014 in the Lebanese marine waters, Levantine
Sea (eastern Mediterranean). Lebanese coastal line (220 km) was break down into 4 regions (Figure 32) to
allow geographical-based analysis. Specimens were sampled using trammel and gill nets with different
mesh sizes lowered by artisanal fishing vessels.
Figure 32. Location of the sampling area in Lebanese marine waters, eastern Mediterranean. Lebanese coastal waters were break down into 4 regions based mainly on the conformation of the continental shelf (A: Akkar shelf; N: North; C: Center; S: South). Bathymetri es up to 100 meters depth are shown.
The species were then identified using the identification guides of Fischer et al. (1987) and the three CIESM
Atlases on Fishes (Golani et al., 2002), Crustaceans (Galil et al., 2002) and Molluscs (Zenetos et al., 2003). All
the individuals collected - irrespective the species - were measured and weighed, additionally sex and
maturity stage were determined. Collected specimens were stored on board and returned to the
laboratory. In the laboratory, each specimen collected was measured and weighed. A measuring tape was
used to measure fish total lengths (TL) to the nearest 0.1 centimeter (cm). Total weights (wet weight, TW)
were measured to the nearest 0.01 gram (g) using a digital balance. For crustaceans, the cephalothoracic

139
length (CL) at the lower millimeter (mm) was measured. Standardized protocols and minimum
requirements adopted during the surveys are summarized in table 21.
Table 20. Protocols and minimum requirements adopted for nets management, vessels minimum requirements and biological data collection. *Medits Handbook, 2013.
Nets management
Soak time Approximate 12 hours, overnight
Lowering time Afternoon
Retrieving time Dawn
Operators Professional artisanal fishermen
Vessels' minimum requirements
LOA > 7m
Engine Power > 16 hp
Winch Hydraulic or Motorised
Available equipment GPS, Fishfinder, Safety equipment
Biological data collection
Biometric: length TL, nearest 0.1 cm (fish) CL, lower mm (crustaceans)
Biometric: weight Nearest 0.01 grams
Biological: sex & maturity stages
MEDITS programme protocols* (Codes of sexual maturity for Fish, Crustaceans and Cephalopods)
Biometric & Biological Parameters
Collected on all the specimens
The parameters a and b, of the WLR curve (W = aLb) were estimated using a nonlinear least squares
function nls in the statistical software R (R Development Core Team, 2014). The start values of these
parameters were derived from the log transformation of the two variables (ln W = ln a + b ln L) using the
linear model function lm. The coefficient of determination (r2) aids in determining the accuracy of the
model prediction skills. Finally, statistical comparison of WLR between sexes (tests were only performed for
species with sample size for each sex modality upper than 5 individuals) and geographical sectors was
performed by applying ANCOVA tests (Zar, 1996). When significant differences were observed, WLR was
estimated for each sex; when no significant differences were observed, one WLR was estimated for the
sexes combined (comprising Non-determined individuals). Standard deviations of b were calculated to
detect substantial deviation from isometric growth (b=3). Significant difference of b values from 3, which
represent isometric growth, was tested with the T-test (Pauly, D., 1993).
RESULTS
A total of 2931 individuals, comprising 21 bony fish species, 3 selaceans (3 batoids) and 3 crustaceans were
examined in this study. Among them, 6 species (22.2%) were Lessepsian migrants (Fistularia commersonii,
Lagocephalus sceleratus, Portunus pelagicus, Sargocentron rubrum, Siganus luridus and Siganus rivulatus.

140
Table 22. The length and weight characteristics as well as the parameters of the length-weight relationships (W=aLb) for 27 species caught in the Lebanese waters, eastern Mediterranean. When significant differences between sexes were observed, WLR was estimated for the sexes combined (comprising non-determined individuals). Taxonomy corresponds to classification of
the species collected (P = bony fishes; S = selaceans; K = crustaceans); Sex (F = female; M = male; All = includes F, M and non-determined individuals); N is the sample size; / is the mean
of total length or carapace length; W is the weight; SD is the standard deviation; a and b are the parameters of the length-weight relationships; r2 is the coefficient of determination; Growth type (A+ = positive allometry; A- = negative allometry; I = isometry). Meaning of the letters and symbol in exponent in the first column: L for Lessepsian species, * for species for which it is the first information available on WLRs, and C for commercially important species for the Lebanese coast. In the first column, number of individuals in each sex modalities are specified. P-value, significance between male and female [in bold, significant differences (P<0.05)], with tests only performed for species with sample size for each sex modality upper than 5 individuals.
Species Taxo Sex N Samples characteristics Relation parameters P-value Growth
nomy
(cm)/ (mm)
(min–max) SD
(g)
(min–max) SD a (10-3) b (10-3) SD (b) r2
type
Aristaeomorpha foliacea
(Risso, 1827)*, C
205 F ;55 M; 5 ND
K All 265 4.74 (2.4-5.8) 0.47 30.41 (6.0-65.0) 8.20 0.700 2.414 0.119 0.72 0.95 A-
Auxis rochei (Risso,
1810)**
6F; 3 M; 13 ND
P All 22 28.84(16.0-47.0) 7.14 361.68 (60.0-1166.0) 298.27 0.054 2.595 0.316 0.95 0.95 A-
Citharus linguatula
(Linnaeus, 1758)*
46 F; 10M; 5 ND
P All 61 16.43 (11.0-22.0) 2.37 40.66 (12.7-97.0) 21.47 0.004 3.248 0.279 0.74 0.15 A+
Dentex macrophthalmus
(Bloch, 1791)*
139 F; 72M; 54 ND
P All 265 13.93 (8.0-23.0) 2.24 44.20 (9.0-195.0) 22.56 0.022 2.868 0.042 0.92 0.80 A-
Diplodus vulgaris (Geoffroy
Saint-Hilaire, 1817) *, C 5 F ; 17 M ; 14 ND
P All 36 15.50 (11.5-19.5) 1.99 63.52 (26.9-130.0) 24.11 0.016 3.012 0.194 0.91 0.12 I
Fistularia commersonii
(Rüppell, 1838) L,*
18 F ; 8 M
P All 26 84,98 (56.0-
112.0) 10.75 389.24 (128.0-578.0) 116.62 0.120 1.818 0.293 0.68 0.17 A-
Helicolenus dactylopterus
(Delaroche, 1809)*
16 F ; 20 M ; 37 ND
P All 73 16.01 (8.0-27.5) 4.16 85.34 (7.0-384.0) 77.15 0.012 3.134 0.103 0.97 0.14 A+
Lagocephalus sceleratus
(Gmelin, 1789) L,
11 F; 15 M ; 2 ND
P All 28 39.36 (23.0-71.0) 10.90 877.99 (139.0-3375.0) 825.23 0.118 2.400 0.261 0.89 0.64 A-

141
Maja goltziana d'Olivera,
1888 **
32 F ; 69 M
K All 101 8.10 (3.2-11.8) 2.21 151.99 (6.0-554.0) 114.21 0.420 2.746 0.229 0.92 0.64 A-
Merluccius merluccius
(Linnaeus, 1758) *, C
28 F ; 49 M ; 26 ND
P All 103 30.95 (18.0-51.0) 6.48 241.77 (60.0-938.0) 158.49 0.022 2.679 0.087 0.86 0.92 A-
Mullus barbatus (Linnaeus,
1758) *, C P All 45 19.94 (13.0-27.0) 3.28 97.20 (23.0-230.0) 47.34 0.017 2.869 0.138 0.93 0.04 A-
25 F ; 6 M ; 14 ND F 25 20.90 (13.0-27.0) 3.27 113.90 (26.2-230.0) 50.39 0.012 2.993 0.122 0.96 A-
Mullus surmuletus
(Linnaeus, 1758) *, C
30 F ; 11 M ; 9 ND
P All 50 22.08 (16.5-27.0) 2.70 132.96 (57.0-244.0) 48.75 0.021 2.813 0.170 0.88 0.71 A-
Pagellus acarne (Risso,
1827)*, C
39 F; 35 M ; 51 ND
P All 125 15.75 (9.0-21.0) 2.38 50.91 (8.0-106.7) 20.68 0.018 2.856 0.120 0.92 0.33 A-
Pagellus erythrinus
(Linnaeus, 1758), C P All 97 17.96 (10.0-30.0) 3.47 90.26 (13.0-370.7) 56.56 0.021 2.870 0.070 0.93 0.03 A-
37 F ; 30 M ; 30 ND F 37 17.74 (14.0-27.0) 2.82 82.64 (38.0-265.7) 43.15 0.019 2.887 0.113 0.92 A-
M 30 18.75 (14.0-30.0) 3.92 108.45 (37.0-370.7) 70.33 0.033 2.729 0.102 0.95 A-
Pagrus caeruleostictus
(Valenciennes, 1830)*, C
11 F, 9 M; 10 ND
P All 30 20.40 (14.5-48.0) 7.73 176.77 (60.0-1600.0) 295.15 0.068 2.521 0.245 0.94 0.46 A-
Pagrus pagrus (Linnaeus,
1758) *, C
20 F ; 7 M; 3 ND
P All 30 21.30 (16.0-40.0) 4.92 170.63 (61.0-936.0) 164.26 0.018 2.951 0.050 0.96 0.62 A-
Phycis blennoides
(Brünnich, 1768) *
2 F ; 18 M ; 3 ND
P All 23 24.57 (22.5-39.5) 3.49 125.46 (81.0-516.5) 88.09 0.005 3.138 0.067 0.93 - A+
Phycis phycis (Linnaeus,
1766) * P All 145 25.54 (14.0-42.0) 4.96 188.52 (40.0-868.0) 153.78 0.003 3.343 0.066 0.90 0.05 A+
53 F ; 42 M ; 50 ND F 53 26.60 (20.0-42.0) 4.78 213.32 (77.0-868.0) 145.11 0.006 3.145 0.107 0.87 A+
M 42 26.27 (14.0-40.0) 5.80 205.19 (40.0-783.0) 184.04 0.002 3.515 0.142 0.91 A+
Portunus pelagicus
(Linnaeus, 1758) L,*, C
18 F ; 12 M ; 1 ND
K All 31 4.79 (3-8.4) 1.26 84.94 (13.1-318.2) 73.86 1.259 2.601 0.099 0.90 0.91 A-
Raja clavata (Linnaeus,
1758)
9 F ; 11 M
S All 20 48.55 (25.0-70.0) 12.97 906.05 (62.0-2300.0) 739.44 0.004 3.150 0.264 0.98 0.37 A+

142
Raja miraletus (Linnaeus,
1758)
22 F ; 29 M ; 1 ND
S All 52 34.69 (25.0-44.0) 3.46 225.33 (72.0-490.0) 88.84 0.001 3.494 0.190 0.89 0.71 A+
Sargocentron rubrum
(Forsskål, 1775) L,* P All 1109 17.38 (12.0-22.0) 1.69 97.56 (33.2-248.0) 29.74 0.018 2.993 0.045 0.86 0.03 I
432 F ; 314 M ; 363 ND F 432 17.33 (12.5-21.5) 1.55 96.36 (33.2-216.4) 27.27 0.016 3.035 0.076 0.85 I
M 314 17.18 (12.6-22.0) 1.72 92.43 (35.4-248.0) 28.92 0.018 2.995 0.078 0.86 I
Seriola dumerili (Risso,
1810) *, C
15 F; 11 M; 16 ND
P All 42 24.93 (17.5-31.0) 3.76 200.32 (86.6-367.1) 80.80 0.031 2.715 0.190 0.88 0.76 A-
Siganus luridus (Rüppell,
1829)L,*, C
9 F; 9 M ; 3 ND
P All 21 18.45 (14.5-29.0) 3.63 96.77 (41.8-303.3) 63.66 0.029 2.754 0.145 0.93 0.92 A-
Siganus rivulatus (Forsskål
& Niebuhr, 1775) L,*, C
33 F ; 14 M ; 20 ND
P All 67 17.76 (11.0-25.5) 2.63 69.26 (31.8-200.0) 30.68 0.027 2.706 0.110 0.80 0.35 A-
Torpedo marmorata (Risso,
1810) S All 22 25.18 (14.0-30.5) 3.71 347.55 (51.0-550.0) 107.30 0.398 2.093 0.273 0.87 0.03 A-
6 F ; 16 M M 16 25.00 (14.0-30.0) 3.49 327.69 (51.0-474.0) 95.74 0.352 2.118 0.312 0.95 A-
Trachurus picturatus
(Bowdich, 1825)*
4 F ; 7 M ; 10 ND
P All 21 31.26 (18.0-35.0) 4.23 276.47 (54.9-432.0) 94.18 0.004 3.254 0.428 0.93 - A+

143
The length and weight characteristics, as well as the sample size and parameters of the WLRs are
represented in Table 22. These results provide new maximum lengths and weights for these species
along the Lebanese coast. The sample sizes ranged from a minimum of 20 individuals for Raja clavata
to a maximum of 1109 for S. rubrum. A minimum of 5 individuals was used to estimate WLR per
sexual category. Pronounced sexual dimorphism in WLR was observed for M. barbatus, P. erythrinus,
P. phycis, S. rubrum and T. marmorata with significant differences in the slopes of WLR between
males and females (ANCOVA; P< 0.05). There were no significant differences in slopes between
males and females in any of the other species. The values of the allometric coefficient (b) ranged
from a minimum of 1.818 for F. commersonii to a maximum of 3.494 for Raja miraletus (Table 22)
with a mean b value of 2.841 (SD. 0.376). One species evidenced isometric growth (I), 8 species
showed positive allometry (A+), and 18 species had negative allometry (A-). All relations were highly
significant (P<0,001) with 59.26% r2 greater than 0.9. At species level, the most accurate model was
shown to be that of Raja clavata (r2= 0.98) and the least one was that of Fistularia commersonii (r2 =
0.68).
WLRs patterns by geographical distribution were investigated in species with more than 80
individuals available (i.e. A. foliacea, D. macrophthalmus, M. goltziana, M. merluccius, P. acarne, P.
erythrinus, P. phycis, S. rubrum). Highly significant (P<0.001) differences in WLRs among regions were
found only in S. rubrum (Table 23) while a significant (P<0.05) difference at regional level was
obtained for M. goltziana. In both cases, the WLR in the south sector showed a lower rate of growth
of the body weight.
Table 21. Test for differences in slopes of the weight-length relationships for fish species caught in four different regions. ni and bi are respectively the sample size and the regression slope for each region i. P is the significance of covariance analysis bet ween region for H0: b1 = b2 = b3 = b4 [in bold, significant differences (P<0.05)].
Species Akkar shelf North Center South P
n1 b1 n2 b2 n3 b3 n4 b4
A. foliacea 0 - 19 2.477 80 2.355 105 2.426 0.927
D. macrophthalmus 4 2.785 63 2.845 48 2.799 150 2.845 0.2843
M. goltziana 13 3.123 18 2.936 25 3.028 51 2.882 0.076
M. merluccius 1 - 9 2.741 6 2.611 86 2.721 0.308
P. acarne 4 2.970 67 2.916 13 3.004 41 2.978 0.147
P. erythrinus 26 2.921 57 2.885 1 2.731 13 2.947 0.247
P. phycis 1 - 62 2.797 17 2.720 65 2.833 0.064
S. rubrum 348 3.027 121 3.040 361 3.047 279 3.108 <2.2e-
16
Estimated WLR parameters should be considered only as mean annual values for most of these
species since the data were collected over an extensive period of time and are not representative of
any particular season.

144
DISCUSSION
Information related to the length-weight relationships of demersal species is almost absent along the
Lebanese coast. Froese (2006) and Froese et al. (2014) had analyzed the length-weight relationships
of all fishes available on the Fishbase website (www.fishbase.org) using meta-analysis and Bayesian
methods. A few studies carried out by Turkish Authors (Başusta et al., 2013; Ergüden et al., 2009;
Ergüden et al., 2017; Gündoğdu et al., 2015; Özvarol, 2014; Sangun et al., 2007; Taskavak and
Bilecenoglu, 2001) bring together information on WLRs for demersal species in the northern part of
the eastern Mediterranean. This information allowed us comparisons with 15 species examined in
the present study, i.e. C. linguatula, D. vulgaris, F. commersonii, L. sceleratus, M. merluccius, M.
barbatus, M. surmuletus, P. acarne, P. erythrinus, P. caeruleostictus, P. pagrus, S. rubrum, S. luridus,
S. rivulatus. WLRs show corresponding allometric patterns as those reported in aforementioned
studies except for M. barbatus and M. surmuletus that differ from those reported by Özvarol 2014
and Sangun et al. 2007. In Lebanese waters, Lagocephalus sceleratus, Raja miraletus and Torpedo
marmorata showed same allometric patterns as those reported by Khalaf et al. (2014) and Lteif et al.
(2016), whilst Raja miraletus behavior differ from the one described by the last Authors (Table 24).
Table 22. Weight-length relationships (WLRs) for combined sex samples in Lebanese waters. a and b are the parameters of the WLRs (W=aLb). Growth type: A+ = positive allometry and A- = negative allometry. Comparison between this study and previous ones: K reports data from Khalaf et al. (2004) and L from Lteif et al. (2016).
Species This study Previous studies K, L This study /
Previous studies a (10-3) b (10-3) a (10-3) b (10-3)
Lagocephalus sceleratus (Gmelin, 1789) 0.118 2.400 0.014K 2.306K A- / A-K
Raja clavata (Linnaeus, 1758) 0.004 3.150 0.002 L 3.327 L A+ / A+ L
Raja miraletus (Linnaeus, 1758) 0.001 3.494 0.352 L 2.118 L A+ / A- L
Torpedo marmorata (Risso, 1810) 0.398 2.093 1.337 L 1.752 L A- / A- L
The observed difference among regions could be due to the sampling procedure, such as an uneven
sampling period. The sample of S. rubrum was relatively large (1109 specimens) and covered a
reasonable size range, suggesting that the differences in slope could reflect the influence of
differences in environmental or habitat factors (Morato et al., 2001). Moreover, according to Bagenal
and Tesch (1978) and Gonçalves et al. (1997), the b parameters generally do not vary significantly
throughout the year, unlike parameter a which may vary seasonally, daily and between habitats. As
pointed out by Petrakis and Stergiou (1995), use of the WLR should be limited to the sizes in the
estimation of the parameters. However, this may act as a tool to support fisheries management
measures by establishing a minimum catch weight limit when lengths are estimated at sea. In
Lebanon - where management measures are limited or outdated and the fishing pressure is high on
coastal fisheries resources while fishing practices targeting juvenile fishes are partially driven by the
market (Bariche et al., 2006; Sacchi & Dimech., 2011; Colloca & Lelli 2012), the use of basic but
powerful descriptive tools of halieutic populations such as WLRs is highly recommended.

145
ACKNOWLEDGEMENTS
This study could not have been completed without the support of the Lebanese fishermen, their
bravery and tough job in the sea. The communities of fishermen are the ultimate beneficiaries of all
our efforts aimed at creating new and sustainable sources of income and improving their quality of
life. Data and financial funding for this study was provided in the framework of the CIHEAM-PESCA
Libano project, of the CANA project on “Establishing Monitoring and Sustainable Development of the
Lebanese Sea” (both financed by the Italian Cooperation) and within the Grant Research Programme
of the CNRS-L.

146
Chapter 6
Population biology of the Lessepsian
migrant Sargocentron rubrum (Forsskål,
1775) along Lebanon’s coast, eastern
Mediterranean

147

148
Chapter 6
Population biology of the Lessepsian migrant
Sargocentron rubrum (Forsskål, 1775) along
Lebanon’s coast, eastern Mediterranean

149

150
Population biology of the Lessepsian migrant Sargocentron rubrum
(Forsskål, 1775) along Lebanon’s coast, eastern Mediterranean
LELLI Stefano 1, 2, 3*, KHALAF Gaby 1, LTEIF Myriam1, JEMAA Sharif1, COLLOCA Francesco5, VERDOIT-
JARRAYA Marion 2, 3, 4
1 Lebanese National Council for Scientific Research – National Centre for Marine Sciences (CNRS-
L/CNSM), Batroun, Lebanon
2 Université de Perpignan Via Domitia, Centre de Formation et de Recherche sur les Environnements
Méditerranéens, UMR 5110, 52 Avenue Paul Alduy, 66860, Perpignan, France
3 CNRS, Centre de Formation et de Recherche sur les Environnements Méditerranéens, UMR 5110, 52
Avenue Paul Alduy, 66860, Perpignan, France
4 Centre de Recherche sur les Ecosystèmes Marins (CREM), impasse du solarium, 66420 Port-Barcarès,
France
5 CNR‐IAMC, Mazara del Vallo (TP), Italy
* Corresponding author. E-mail address: [email protected] (S. Lelli).
Telephone: +39 3406871090
ABSTRACT
This study focuses on the biology of the Mediterranean population of the redcoat Sargocentron
rubrum, an Indo-Pacific fish species firstly reported in Palestine in 1946. Between June 2012 and
October 2014, 1109 individuals were collected by trammel and gill nets with different mesh sizes
lowered by artisanal fishing vessels over coastal Lebanese marine waters at depths ranging from 10
to 100 m. The total length (LT) of the specimens ranged from 12 to 22 cm, and the mean ± s.d. was
17.38 ± 1.69 cm. The most common LT class was 18 cm. Total weight of the specimens ranged from
33 to 248 g, and the mean ± s.d. was 97.56 ± 29.74 g. A total of 432 males and 314 females were
collected, and the sex ratio was significantly different from 1:1. Weight and LT relationship showed a
slightly negative allometric growth (b=2.993 and r2 =0.86), and the mean±s.d. LT at which 50% of the
individuals were sexually mature was 17.62 ± 2.28 cm for females and 17.45 ± 3.87 cm for males. The
primary prey items found in the fish stomachs were crabs (infraorder Brachyura) and in particular
those belonging to the genus Thalamita. S. rubrum is an extremely active predator between May and
August whereas it feeds lightly in colder seasons. Stomachs gave the highest abundance both in
terms of number and weight in the month of August. The lifespan of S. rubrum exceeds 6 years old
with a maximum attainable size, L∞ = 21.315. The results of this study will help to parameterize
models of the population dynamics for this exploited fish stock to better understand its role in the
ecosystem functioning and the interactions with other commercially exploited native species.

151
Key words: Teleostean; non indigenous; Lebanon; life history; fishing, reproductive biology.
INTRODUCTION
Following the cut of the Suez Canal, completed in 1869, that connected two water bodies with
different abiotic characteristics and distinct peculiar biotas, the number of fish species migrating
from the Red Sea to the Mediterranean, known as Lessepsian migrants (Por, 1971), increased
steadily in the decades following the 1920s but accelerated dramatically after the year 2000,
reaching 101 species in 2014 (Arndt & Schembri, 2015). Hundreds of other taxa (Galil, 2009; Zenetos,
et al., 2012) moved in the Mediterranean at the same time, giving rise to one of the greatest
biogeographic convolutions ever witnessed by the contemporary globe (Por, 2010). Currently,
Lessepsian fish species constitute a large proportion of commercial captures in eastern
Mediterranean countries (Goren & Galil, 2005; Carpentieri, et al., 2009; Edelist et al., 2011).
Demersal resources of the eastern Mediterranean have become a mixture of indigenous and non-
indigenous species (NIS) mainly of Lessepsian origins (Galil et al., 2017) but crossing the Suez Canal
does not guarantee successful settlement and dispersal of populations. While hydrological conditions
are important in understanding the successful spreading of many NIS (Mavruk & Avsar, 2008),
species’ external morphology (Azzurro, et al., 2014) and their ecology are key determinants for
settlement and dispersal success (Galil et al., 2017; Rilov & Galil, 2009). The majority of successful
fish invaders in the Mediterranean are spawning, shallow water, benthic carnivores (Rilov & Galil,
2009). Assemblages composition is mainly driven by depth and easternmost sectors are witnessing
deadly competitions whereby some native species are being probably replaced by NIS occupying
similar ecological niches (Edelist et al., 2013). The overall trophic space is widening out under the
increasing redundancy of the novel community in a nutrient-deprived ecosystem. Consequently,
Eastern Mediterranean demersal communities are far from being in a steady state (Fanelli et al.,
2015).
The redcoat Sargocentron rubrum (Forsskål, 1775) belongs to the family Holocentridae (Figure 33). It
is an Indo-West Pacific species whose distribution ranges from Tonga (Randall, et al., 2003), Japan
and northwestern Australia to eastern Africa (Fiona & Mark, 2002) and the Red Sea (Randall, 1998).
From there via the Suez Canal, it moved into the Mediterranean, as one of the earliest Red Sea
immigrant. It was firstly reported in Palestine in 1946 (Haas & Steinitz, 1947; Laskaridis, 1948) and
only one year later in Greek waters, off the northeast end of Rhodes island (Laskaridis, 1948). In the
easternmost waters of the Levantine basin, by mid 1960s, S. rubrum is already considered as a
‘common’ fish species (George et al., 1964; Ben-Tuvia, 1966). It is currently considered as a
successful invader (Azzurro et al., 2014) and is reported abundant in its easternmost area of
distribution (Golani, 1998; Carpentieri et al., 2009; Colloca & Lelli, 2012; Lelli, 2007; Harmelin-Vivien
et al., 2005; Edelist & Spanier, 2009) although its Mediterranean distribution is mainly limited to the
eastern part (Zenetos, et al., 2015). It is commonly caught by passive gears and bottom trawls in
Egypt, Palestine, Lebanon, Turkey, Cyprus, Greece (Megisti Island, Crete and Rhodes) (EastMed,
2010) and Israel (Golani & Ben-Tuvia, 1985). Due to its hard-scaled body and sharp spines, S. rubrum
is not appreciated by consumers and thus has a low value on the market (approximately 1 USD per
kilogram) (Golani & Darom, 1999; Colloca & Lelli, 2012) or it is not sold, discarded or consumed by
fishers and their families.

152
Figure 31. An embalmed specimen of Sargocentron rubrum exposed in the Lebanese fishing port of Ouzaii (Beirut).
It is found in coastal waters up to 85 meters depth (Randall, 1998) commonly between 10 and 40 m
(Golani, 1981; Harmelin-Vivien et al., 2005) on rocky grounds, particularly during the day in caves and
cracks of rocks. It typically occurs in aggregations, feeding mainly on benthic crabs, shrimps and small
fishes (Golani & Ben-Tuvia, 1985). Its eggs and larvae are pelagic (Ben-Tuvia, 1986). Surprisingly,
using DNA barcoding techniques, (Bariche, et al., 2015) got to the conclusion that more than one
species belonging to the genus Sargocentron has entered over time the Mediterranean from the Red
Sea, remaining unreported and probably misidentified. The subtropical reef-associated
Holocentridae species native to the western Atlantic Ocean Holocentrus adscensionis has been
recently recorded in Maltese waters by (Vella, et al., 2016).
Rare are the studies performed on the redcoat in the eastern Mediterranean, and none along
Lebanese coastal waters. This study essentially reflects the biological aspects of the redcoat fish
population in response to the needs for such information. The objectives were to contribute to a
better knowledge of the population biology and to increase the knowledge on age determination,
growth, sexual maturity, reproduction and nutritional strategy for this species in the Lebanese
marine waters. Length and weight data, sex ratio, length-weight relationships, length at which 50% of
the individuals matured, condition factor as well as the main prey items found in the stomachs of this
species are presented and compared to available data from other areas. This study provides a first
evaluation of the population health condition in the Mediterranean Sea habitat and aims, at a longer
term, to better understand the role of this species in the ecosystem functioning and the interactions
with other commercially exploited native species and to stimulate, in case of necessity, the
implementation of regulations to control the spread of this species.

153
MATERIALS AND METHODS
A total of 1109 specimens of redcoat were collected from June 2012 to October 2014 in the Lebanese
marine waters, Levantine Sea (eastern Mediterranean). Lebanese coastal line (225 km) was break
down into 4 regions (Figure 34) to allow geographical-based analysis. Specimens were sampled using
trammel and gill nets with different mesh sizes lowered by artisanal fishing vessels.
Figure 32. Location of the sampling area in Lebanese marine waters, eastern Mediterranean. Lebanese coastal waters were break down into 4 regions based mainly on the conformation of the continental shelf (A: Akkar shelf; N: North; C: Center; S: South). Bathymetries up to 100 meters depth are shown.
All the individuals collected - irrespective the species - were measured and weighed, additionally sex
and maturity stage were determined. Collected specimens were stored on board and returned to the
laboratory. In the laboratory, each specimen collected was measured and weighed. A measuring tape
was used to measure fish total lengths (TL) to the nearest 0.1 centimeter (cm). Total weights (wet
weight, W) were measured to the nearest 0.01 gram (g) using a digital balance. Standardized
protocols and minimum requirements adopted during the surveys are summarized in Table 25.

154
Table 23. Protocols and minimum requirements adopted for nets management, vessels minimum requirements and biological data collection. * MEDITS Working Group, 2013.
Nets management
Soak time Approximate 12 hours, overnight
Lowering time Afternoon
Retrieving time Dawn
Operators Professional artisanal fishermen
Vessels' minimum requirements
LOA > 7m
Engine Power > 16 hp
Winch Hydraulic or Motorised
Available equipment GPS, Fishfinder, Safety equipment
Biological data collection
Biometric: length TL, nearest 0.1 cm (fish) CL, lower mm (crustaceans)
Biometric: weight Nearest 0.01 grams
Biological: sex & maturity stages
MEDITS programme protocols* (Codes of sexual maturity for Fish, Crustaceans and Cephalopods)
Biometric & Biological Parameters
Collected on all the specimens
Sex determination Sexual stages were identified on a scale from 1 to 4. Additionally, the class zero was added to identify
undetermined specimens, the class 2 and 4 were divided into 3 and 2 subclasses respectively
(MEDITS Working Group, 2013). Maturity stages for males and females were as follows: 1)
Immature=Virgin; 2a) Virgin Developing; 2b) Recovering; 2c) Maturing; 3: Mature/Spawner; 4a)
Spent; 4b) Resting.
Condition fish index The Fulton’s condition factor (CF) (Fulton, 1904) was also computed using total weight (WT) and total
length (LT), where:
CF = WT × LT -3 × 100
The K is used to compare the ‘condition’, ‘fatness’, or ’well-being’ of fish, based on the assumption
that heavier fish of a given length are in better condition (Froese, 2006).
Weight-Length Relationship The parameters a and b, of the Weight-Length Relationship (WLR) curve (W = aLb) were estimated
using a nonlinear least squares function nls in the statistical software R (R Development Core Team,
2014). The start values of these parameters were derived from the log transformation of the two
variables (ln W = ln a + b ln L) using the linear model function lm. The coefficient of determination (r2)
aids in determining the accuracy of the model prediction skills. Finally, statistical comparison of WLR
between sexes and geographical sectors was performed by applying ANCOVA tests (Zar, 1996).
Standard deviations of b were calculated to detect substantial deviation from isometric growth (b=3).

155
Significant difference of b values from 3, which represent isometric growth, was tested with the T-
test (Pauly, 1993).
Ageing fish and growth curves To assess the annual nature of otolith rings, the seasonal evolution of the marginal ring of the otolith
was determined from fish having 2 to 6 rings. Whole otoliths were observed under reflected light
against a dark background, so that alternating dark and white rings called hyaline and opaque,
respectively, could be seen. The hyaline rings formed at an annual rate (true annuli) were detected.
These otoliths were viewed while immersed in water (Williams & Bedford, 1974). The technique of
otolith sectioning as described by Bedford (1983) was not followed because whole otoliths were
considered better for measuring the marginal increments and because of the fragility of the sections.
Once the rings were considered to be annual, each specimen was assigned to a year class, taking into
account the data of capture, the annuli counts, their formation period, and the reproductive biology
of the species in the area (Figure 35). Although data on spawning of this species in the
Mediterranean is scarce, Golani & Ben-Tuvia (1985) place the spawning season in July-August.
Otoliths were read under a light microscope, coupled to a high-resolution video camera and monitor
system, following standard procedures.
Figure 33. Otoliths of a specimen of Sargocentron rubrum collected in the month of February and the interpretation based on the alternation of hyaline areas and opaque, thin annual rings laid winter. (Photo: Salvatore Gancitano).
Analysis of length-at-age data was performed in the statistical software R (R Development Core
Team, 2014) to estimate growth parameters K and L. This allows non-linear estimation of growth
parameters from length at-age data. The Von Bertalanffy’s plot is used to estimate to from the known
age/length data and estimated L∞ and K. The method is based on the regression analysis of the
following formula:

156
-ln (1-Lt / L∞) = -K * to + K * t
Where: the age t is the independent variable (x) and (-ln (1-L (t)/ L)) is the dependent variable (y) of
the linear regression. L∞ is the asymptotic LT, Lt the LT at age t, K the growth curvature parameter,
and t0 is the theoretical age when fish would have been at zero LT .
Stomach content analysis The total weight of the stomach (WS) was measured. Stomachs with food contents were preserved in
70% alcohol until identification. The stomach contents were then rinsed under tap water. Their
weight was measured if possible to the nearest gram, counted and identified to the lowest possible
taxon. The total weight of each prey group was measured if possible to the nearest gram. According
to Hyslop (1980), two indices were calculated. The coefficient of vacuity (CV) was calculated to reflect
the richness or lack of food in the environment:
CV = EV × N-1 × 100
where EV is the number of empty stomachs and N is the total number of stomachs examined.
The percentage of fullness (FI) was also calculated for each stomach:
FI = WP× WS-1 × 100
where WP is the weight of the prey items in each stomach. Stomach fullness was classed based on a
five-point scale estimated by the percentage of fullness:
empty, partially empty (1-25%), slightly full (26-50%), partially full (51-75%), and full (76-100%).
Moreover, three indices were used to show the significance of different prey items. The frequency of
occurrence (O%), the coefficient of prey numerical abundance (N%), and the percentage of weight
(W%) (Hynes, 1950; Hyslop, 1980; Bowen, 1983):
O% = NP × M-1 × 100
N% = n × nP-1 × 100
W% = m × mP-1 × 100
where NP is the number of stomachs containing a specific prey group, M is the number of stomachs
with prey remains, n is the number of prey of each taxonomic group, nP is the total number of prey
items, m is the mass of prey of each taxonomic group, and mP is the total mass of prey items. Out of
these indices, the importance of each food item in the diet was obtained by the Index of Relative
Importance (IRI) (Pinkas et al., 1971) modified by Hacunda (1981):
IRI = O% × (N% + W%)
Statistical analyses The LT and WT were used to generate the WLR using a non-linear power regression (WT=aLT
b) (LeCren,
1951) where a and b are the parameters to be estimated. A non-linear power regression was also
used to determine the relationship between the WG and LT of male specimens (WG=aLTb). Non-linear
regressions were used to represent any regression of weight on length because any weights will scale

157
to the cubic power of length (Froese, 2006). In addition, the length at which 50% of the fish are
mature (L50) was estimated across all length classes using a logistic curve from a generalized linear
model (GLM) with logit link using the function glm in the statistical software R (R Development Core
Team, 2014). Furthermore, statistical comparison of WLRs between the sexes was evaluated with an
ANCOVA test. A Shapiro-Wilk normality test was used to test for normality in the sample and the
Wilcoxon rank sum test was used to test for differences in length, weight and per cent fullness
between the males and females. A Kruskal-Wallis rank sum test was used to examine the differences
between LT and WT with respect to sexual maturity and between the biological indices (IG, IH and K)
according to the season. The 𝜒2 goodness of fit test [alpha=0.05, (Zar, 2010)] was used to examine
significant deviations from the expected sex ratio.
To determine the feeding strategy of the species, feeding strategy graphs were plotted following the
method of Costello (1990). The feeding strategy graphs illustrate the dominance and rarity of each
type of prey in both seasons and whether the feeding strategy is specialized or generalized.
RESULTS
Morphometric measurements and depth distribution A total of 1109 individuals (432 females, 314 males and 363 undetermined or immature) of redcoat
ranging from 12 to 22 cm in TL (meanTL ± SD = 17.38 ± 1.69 cm, N=1109) and from 33.2 to 248.0 g in
W (meanW ± SD = 97.56 ± 29.74 g, N=1109) were studied. Specimens were collected at depths
ranging from 10 to 100 m, with nearly 80% (884 individuals) of the specimens collected at depths
between 30 and 60 m. The sex ratio of males to females was found to be 0.73. Therefore, significant
differences between the number of males and females were observed and with a sex ratio
significantly different from 1:1 (P<0.05).
Separate length–frequency distributions by sex show similar length ranges, i.e. 12.5-22 and 12.5-21.5
cm TL for male and female respectively (Figure 36). Most frequent length classes are 17 and 18 cm TL
for male, and 18-19 cm TL for females. For the whole sample, the most frequent length class is 18 cm
TL. Most frequent length classes are 17 and 18 cm TL for male, and 18-19 cm TL for females. For the
whole sample, the most frequent length class is 18 cm TL. Similar weight ranges were also found, i.e.
35.4-248.0 g and 33.2-216.4 g for male and female respectively, with average values of
101.37 25.559 g and 103.60 24.186 g. Males and females showed no significant differences in
length and weight distributions.

158
Figure 34. The length frequency distribution of the redcoat S. rubrum for the whole sample ( ), males ( ) and females ( ).
Weight-Length relationship (WLR) WLR for S. rubrum evidenced isometric growth (I) for the whole sample and for males and slightly
positive allometric growth for females. All relations were highly significant (P<0,001) with r2 greater
than 0.85 for the three groups. Intercepts a varied between 0.016 and 0.018. Pronounced sexual
dimorphism in WLR was observed with significant differences in the slopes of WLR between males
and females (ANCOVA; P< 0.05) (Figure 37).
Figure 35. The weight–length relationship of S. rubrum for the whole sample (N=1109). Males (● and continuous line) and females (o and pointed line) are displayed separately. For females, the equation of the fitted exponential regression

159
model with r2=0.85 is: WT = 0,016*LT3.035. For males: r2=0.86; WT = 0,018*LT
2.995. For whole individuals collected, the equation with r2=0.86 is: WT = 0,018*LT
2.993.
WLR patterns by geographical distribution were investigated and a highly significant (P<0.001)
differences in WLRs among regions was found (Table 26). In particular, sector 4 ‘South’ showed a
clear positive allometric growth.
Table 24. Test for differences in slopes of the weight-length relationships for S. rubrum specimens caught in four different regions. ni and bi are respectively the sample size and the regression slope for each region i. P is the significance of covariance analysis between region for H0: b1 = b2 = b3 = b4 [significant difference (P<0.05)].
P
n1 b1 n2 b2 n3 b3 n4 b4
348 3.027 121 3.04 361 3.047 279 3.108 <2.2e-16
Sector 1 - Akkar Shelf Sector 2 - North Sector 3 - Center Sector 4 - South
Sexual maturity and biological indices All stages of maturity were observed among the specimens collected during the study period both
for males and females. Males and females were equally distributed among all of the observed
maturity stages (Figure 38).

160
4b) Resting
4a) Spent
3) Mature / Spawner
2c) Maturing
2b) Recovering
2a) Virgin developing
Immature - Virgin
Figure 36. Percentages of S. rubrum individuals with respect to the stage of maturity as categorized by MEDITS (2013) and sex (Males ; Females ).
In addition, significant differences were observed among weights and lengths of specimens for each
maturity stage regardless of whether the sexes were analysed in combination or separately.
Taking into account substages as defined by MEDITS Handbook (2013), males and females were both
predominantly found of substages 2b “Recovering” and 3 ”Mature/Spawner”. Females always
attained a longer size than males except for maturing/developing category in which average sizes are
identical. The smallest mature male was observed at 15 cm LT and the smallest mature female at 15.5
20 cm LT.
Spawning season Mature individuals have been collected for males and females over the four seasons but very few
individuals were found in autumn and winter. For females, mature individuals prevail in spring
whereas for males, they prevail in summer and spring. For females, immature individuals prevail in
autumn and summer and for male, they prevail in winter and fall (Figure 39).
The results of the Kruskall –Wallis test indicates a significant difference between the maturity stages
and the season for males and females.

161
Figure 379. Percentages of maturity stages by seasons females (top) and for males (bottom) of S. rubrum in the eastern Mediterranean. Immature/vergin; maturing/developing; mature/spawner; resting/spent.
The length at which 50% of males and females attain maturity is estimated by fitting a logistic
regression curve. The latter indicated that the length at 50% maturity (L50) was 16.91 ± 2.28 cm for
females and 16.46 ± 3.87 cm for males (Figure 40).
Season
Perc
enta
ge o
f m
atu
rity
sta
ges

162
Figure 38. The proportion of mature redcoat, S. rubrum to length class to estimate the length at 50% maturity (L50) in logistic regressions. LT is the total length.
Stomach content analysis A total of 123 S. rubrum stomachs were examined. 79 stomachs were found to contain food items,
and 44 stomachs were empty or contained non-identifiable food items at any taxonomic level. The
coefficient of vacuity was 35.77% for all specimens and 13.82%, 17.07% and 4.88% for female, male
and undetermined specimens, respectively. The highest rates of the full stomachs (36.36%) belonged
to males of the biggest length classes and males and females of the 16 to 18 cm LT (Figure 41).
Figure 39. The proportion of full and empty stomachs of S. rubrum by sex according to length classes.
The redcoat S. rubrum was found to prey upon 8 categories (classes) of preys, namely the red algae
Florideophyceae; Polychaetas; Malacostraca (subphylum Crustacea) specifically the orders
LT (cm) LT (cm)
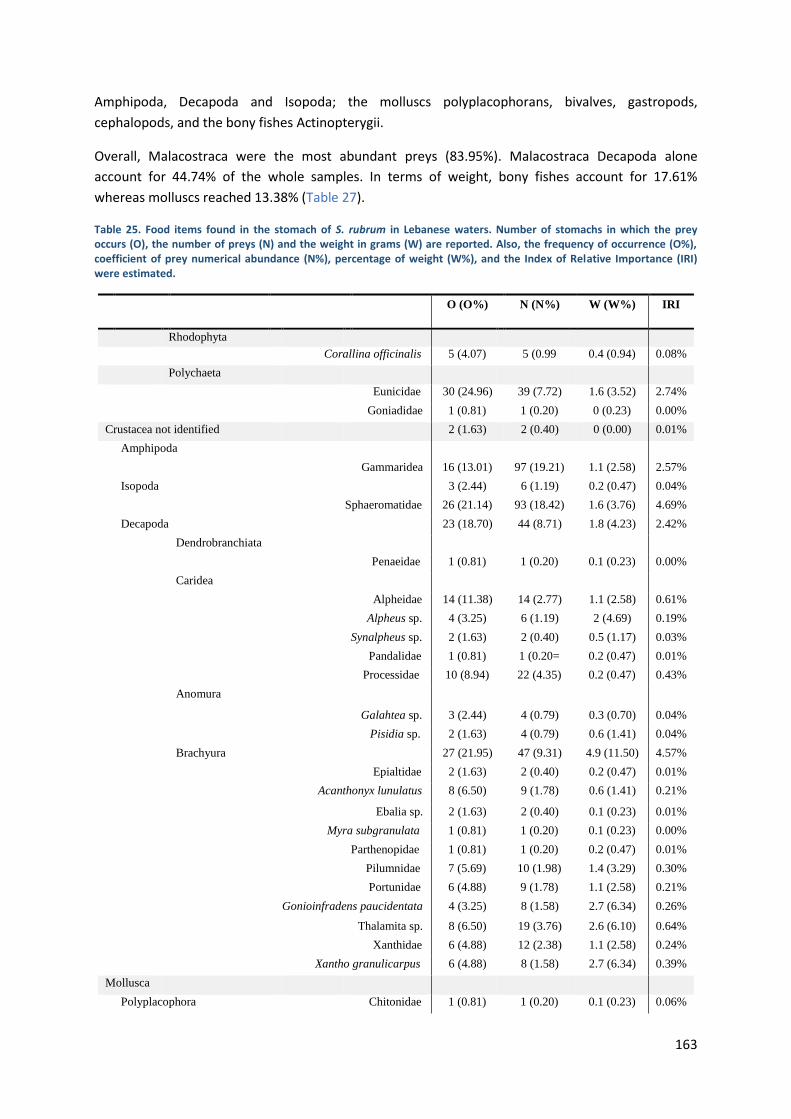
163
Amphipoda, Decapoda and Isopoda; the molluscs polyplacophorans, bivalves, gastropods,
cephalopods, and the bony fishes Actinopterygii.
Overall, Malacostraca were the most abundant preys (83.95%). Malacostraca Decapoda alone
account for 44.74% of the whole samples. In terms of weight, bony fishes account for 17.61%
whereas molluscs reached 13.38% (Table 27).
Table 25. Food items found in the stomach of S. rubrum in Lebanese waters. Number of stomachs in which the prey occurs (O), the number of preys (N) and the weight in grams (W) are reported. Also, the frequency of occurrence (O%), coefficient of prey numerical abundance (N%), percentage of weight (W%), and the Index of Relative Importance (IRI) were estimated.
O (O%) N (N%) W (W%) IRI
Rhodophyta
Corallina officinalis 5 (4.07) 5 (0.99 0.4 (0.94) 0.08%
Polychaeta
Eunicidae 30 (24.96) 39 (7.72) 1.6 (3.52) 2.74%
Goniadidae 1 (0.81) 1 (0.20) 0 (0.23) 0.00%
Crustacea not identified 2 (1.63) 2 (0.40) 0 (0.00) 0.01%
Amphipoda
Gammaridea 16 (13.01) 97 (19.21) 1.1 (2.58) 2.57%
Isopoda
3 (2.44) 6 (1.19) 0.2 (0.47) 0.04%
Sphaeromatidae 26 (21.14) 93 (18.42) 1.6 (3.76) 4.69%
Decapoda
23 (18.70) 44 (8.71) 1.8 (4.23) 2.42%
Dendrobranchiata
Penaeidae 1 (0.81) 1 (0.20) 0.1 (0.23) 0.00%
Caridea
Alpheidae 14 (11.38) 14 (2.77) 1.1 (2.58) 0.61%
Alpheus sp. 4 (3.25) 6 (1.19) 2 (4.69) 0.19%
Synalpheus sp. 2 (1.63) 2 (0.40) 0.5 (1.17) 0.03%
Pandalidae 1 (0.81) 1 (0.20= 0.2 (0.47) 0.01%
Processidae 10 (8.94) 22 (4.35) 0.2 (0.47) 0.43%
Anomura
Galahtea sp. 3 (2.44) 4 (0.79) 0.3 (0.70) 0.04%
Pisidia sp. 2 (1.63) 4 (0.79) 0.6 (1.41) 0.04%
Brachyura
27 (21.95) 47 (9.31) 4.9 (11.50) 4.57%
Epialtidae 2 (1.63) 2 (0.40) 0.2 (0.47) 0.01%
Acanthonyx lunulatus 8 (6.50) 9 (1.78) 0.6 (1.41) 0.21%
Ebalia sp. 2 (1.63) 2 (0.40) 0.1 (0.23) 0.01%
Myra subgranulata 1 (0.81) 1 (0.20) 0.1 (0.23) 0.00%
Parthenopidae 1 (0.81) 1 (0.20) 0.2 (0.47) 0.01%
Pilumnidae 7 (5.69) 10 (1.98) 1.4 (3.29) 0.30%
Portunidae 6 (4.88) 9 (1.78) 1.1 (2.58) 0.21%
Gonioinfradens paucidentata 4 (3.25) 8 (1.58) 2.7 (6.34) 0.26%
Thalamita sp. 8 (6.50) 19 (3.76) 2.6 (6.10) 0.64%
Xanthidae 6 (4.88) 12 (2.38) 1.1 (2.58) 0.24%
Xantho granulicarpus 6 (4.88) 8 (1.58) 2.7 (6.34) 0.39%
Mollusca
Polyplacophora Chitonidae 1 (0.81) 1 (0.20) 0.1 (0.23) 0.06%

164
Chiton sp. 3 (2.44) 3 (0.59) 0.8 (1.88) 0.06%
Gastropoda
3 (2.44) 3 (0.59) 0.6 (1.41) 0.05%
Pyramidellidae 1 (0.81) 1 (0.20) 0.1 (0.23) 0.00%
Retusidae 1 (0.81) 1 (0.20) 0.1 (0.23) 0.00%
Nassariidae 3 (2.44) 4 (0.79) 1 (2.35) 0.08%
Cephalopoda
2 (1.63) 2 (0.40) 2.5 (5.87) 0.10%
Cephalopoda Octopodidae 1 (0.81) 1 (0.20) 0.2 (0.47) 0.01%
Bivalvia
1 (0.81) 1 (0.20) 0.3 (0.70) 0.01%
Actinopterygii not identified
5 (4.07) 5 (0.99) 0.4 (0.94) 0.08%
Atheriniformes Atherina sp. 1 (0.81) 1 (0.20) 0.9 (2.11) 0.02%
Clupeiformes Clupeidae 1 (0.81) 1 (0.20) 0.8 (1.88) 0.02%
Clupeiformes Sardinella aurita 2 (1.63) 2 (0.40) 1.9 (4.46) 0.08%
Clupeiformes Engraulis encrasicolus 2 (1.63) 2 (0.40) 1 (2.35) 0.04%
Perciformes Gobiidae 4 (3.25) 4 (0.79) 1.5 (3.52) 0.14%
Perciformes Labridae 3 (2.44) 3 (0.59) 0.6 (1.41) 0.05%
Perciformes Serranidae 1 (0.81) 1 (0.20) 0.4 (0.94) 0.01%
The analysis of the weight of prey items in stomachs (WP) according to the month showed that the
heaviest stomach contents were found primarily in August and secondly in June whereas all the
stomachs collected in the month of September were empty. No empty stomachs were found in
August (Figure 42).
Figure 40. Weight of the prey items in each stomach (WP) collected for S. rubrum in Lebanese waters by month of collection.
Numerical abundance (N%), and the percentage of weight (W%) were also monthly estimated. Both
N% and W% showed biggest presence in terms of number and weight of preys in the months of
August and May whereas the poorest were found in September (no preys whatsoever) and October
(Figure 43).

165
Figure 41. Numerical abundance (N%, grey curve), and the percentage of weight (W%, black curve) of preys in stomach contents of S. rubrum collected in Lebanese coastal waters.
In all seasons, according to IRI, Brachyura was the most abundant prey group with a peak value in
summer (IRI =41.49%). Isopoda are remarkably abundant in spring (IRI =9.82%) and summer (IRI
=10.80%) while in the latter season, polychaeta occurs in more than half of the stomach analysed
(O%=51.71) (Table 28). Rhodophyta and Anomura were found only in summer while Polychaeta were
absent from stomach contents in fall. Caridea, whose IRI varies through season between 7.88% in
spring and 1.87% in fall, in summer show a high occurrence in stomach contents (O%=41.38).
Mollusca and bony fishes play a limited role in terms of occurrence (O%) and abundance (N%),
although their percentage of weight (W%) give higher relevance both for pelagic and demersal
species.
Table 26. Variation in the diet of S. rubrum in terms of the frequency of occurrence (O%), coefficient of prey numerical abundance (N%), percentage of weight (W%), and Index of Relative Importance (IRI) through seasons.
Prey Group N% O% W% IRI N% O% W% IRI N% O% W% IRI N% O% W% IRI
Rhodophyta 0.00% 0.00% 0.00% 0.00% 0.00% 0.00% 0.00% 0.00% 1.66% 17.24% 1.81% 0.60% 0.00% 0.00% 0.00% 0.00%
Polychaeta 12.50% 13.33% 4.62% 2.28% 12.75% 36.67% 6.62% 7.10% 5.98% 51.72% 3.25% 4.77% 0.00% 0.00% 0.00% 0.00%
Amphipoda 4.69% 3.33% 0.49% 0.17% 5.88% 16.67% 0.87% 1.12% 29.24% 27.59% 4.50% 9.31% 3.03% 2.86% 0.21% 0.09%
Isopoda 12.50% 16.67% 2.10% 2.43% 26.47% 30.00% 6.25% 9.82% 20.93% 41.38% 5.17% 10.80% 12.12% 5.71% 1.36% 0.77%
"other Decapoda" 12.50% 23.33% 4.88% 4.06% 18.63% 36.67% 10.21% 10.57% 5.65% 17.24% 3.24% 1.53% 0.00% 0.00% 0.00% 0.00%
Caridea 10.94% 16.67% 8.99% 3.32% 13.73% 26.67% 15.83% 7.88% 5.32% 41.38% 6.42% 4.86% 21.21% 5.71% 11.60% 1.87%
Anomura 0.00% 0.00% 0.00% 0.00% 0.00% 0.00% 0.00% 0.00% 2.66% 17.24% 4.06% 1.16% 0.00% 0.00% 0.00% 0.00%
Brachyura 39.06% 36.67% 49.94% 32.64% 14.71% 30.00% 26.39% 12.33% 24.58% 58.62% 46.19% 41.49% 42.42% 20.00% 36.08% 15.70%
Mollusca 1.56% 3.33% 4.84% 0.21% 2.94% 10.00% 14.09% 1.70% 1.66% 13.79% 8.33% 1.38% 15.15% 8.57% 34.40% 4.25%
"other Fish" 0.00% 0.00% 0.00% 0.00% 1.96% 6.67% 2.04% 0.27% 0.33% 3.45% 0.36% 0.02% 6.06% 5.71% 2.98% 0.52%
"pelagic fish" 1.56% 3.33% 11.08% 0.42% 0.98% 3.33% 9.76% 0.36% 1.33% 13.79% 13.84% 2.09% 0.00% 0.00% 0.00% 0.00%
"demersal fish" 4.69% 10.00% 13.54% 1.82% 1.96% 6.67% 7.95% 0.66% 0.66% 6.90% 2.82% 0.24% 0.00% 0.00% 0.00% 0.00%
WINTER SPRING SUMMER FALL
Analysis of feeding strategy according to the Costello graphs showed that the redcoat had a mixed
feeding strategy based mainly on crustaceans and particularly brachyurans especially in winter and
fall (Figure 43 a, d) when this was particularly evident. Amphipoda is the most abundant (N%) in

166
summer (Figure 44 c) prey group while Polychaeta were relevant feeding items in spring and summer
(Figure 44 b, c).
Figure 42. Feeding strategy graphs for S. rubrum specimens in the winter (a), spring (b), summer (c) and fall (d) seasons.
The Lebanese coastal waters are characterized by thermophilic biota of Mediterranean and Indo-
Pacific origin (Abboud-Abi Saab et al., 2013; Bitar et al., 2007). The local biodiversity is undergoing
rapid alterations under the combined pressures of climate change and human impact. Native marine
flora and fauna are competing with invading organisms originating from the Indo-Pacific and Atlantic
a
d
c
b
O%

167
oceans (MoE/UNDP/ECODIT, 2011) (Abboud – Abi Saab, 2012). The features of the Lebanese
coastline with no closed bays or gulf consent to coastal waters to continuously mix thus preventing
conditions of eutrophication and to disperse nutrients and pollutants.
Age and growth The sample consisted of individuals ranging from age 21 to 81 months old individuals, i.e. from the
class I to the class VI of age. 104 otoliths were analyzed and used to calculate von Bertalanffy growth
function (VBGF)(Figure 45). The number of individuals and length interval at age data according to
sexes combined are in Table 29 along with length estimated from the VBGF. Results of direct age
reading were only partial matching those obtained from VBGF: for age class I (only one individual
analysed) there was no correspondence; age classes II and III showed no correspondence although
results from observations clearly move towards VBGF. A good correspondence was found for age
classes IV, V and VI.
Table 27. Number of otoliths analyzed (N), total length (LT) range and mean length (±standard deviation, SD) at each age group of S. rubrum. TLVBGC gives the LT of the fish according to von Bertalanffy growth function.
Age N Range (cm) Mean length (cm) SD TLVBGF
1 1 14 14 7.672
2 16 13.0-16.5 14.84 0.83 11.769
3 52 13.5-17.5 15.72 1.07 14.635
4 20 14.5-17.5 16.38 0.87 16.640
5 13 16.0-20.5 17.38 1.50 18.044
6 2 19.0-20.5 19.75 1.06 19.026
Figure 43. Von Bertalanffy growth curve in length of S. rubrum in the eastern Mediterranean.

168
The parameters of the VBGF were as follows: the maximum attainable size, L∞ = 21.315 cm; the
growth coefficient K = 0.357; the hypothetical time at which the fish would have been zero size t0 =
0.250.
DISCUSSION
The population of redcoat inhabiting the eastern Mediterranean has reached considerable size since
more than three decades (Golani & Ben-Tuvia, 1985). According to the CIHEAM-Pesca Libano
experimental surveys that provided most of the specimens for the present study, Sargocentron
rubrum is the most abundant coastal demersal species in Lebanon constituting 31% of the specimen
collected (see Chapter 4 of this thesis). The easternmost shores of the Mediterranean Sea are one of
the hottest hotspots of marine bioinvasions on earth (Rilov & Crooks, 2009). Due to its proximity to
the Suez Canal, its favorable conditions (warmer, saltier waters) but also to the faunal
impoverishment and unoccupied niches, the Eastern Mediterranean shows the greatest occurrence
of non-indigenous species. S. rubrum is a spawning, shallow water, benthic carnivore, which
constitutes the profile of the successful fish invader according to Rilov & Galil (2009).
Additionally, S. rubrum is a nocturnal predator mainly feeding on macro-zoobenthos, which was an
underexploited niche given that only Apogon imberbis and the other Red Sea immigrant, Pempheris
vanicolensis present the same trophic scheme (Golani & Ben-Tuvia, 1985). Despite its successful
settlement in coastal waters of the eastern Mediterranean, and its ability to breed over long
distances, reproducing in open water or scattering eggs over the substratum (Thresher, 1984), the
Mediterranean distribution of S. rubrum remains limited westward to the eastern Aegean even
though it was reported in the coastal waters of Rhodes (Greece) about 70 years ago (Laskaridis,
1948).
Redcoat specimens were collected mainly over mixed and rocky bottoms at depths ranging from 10
to 100 m - predominantly 30 to 60 m - slightly deeper than 10-40 m depth range previously reported
in the Mediterranean by (Riedl, 1966), Golani (1981), Golani, et al., 1983, Golani & Ben-Tuvia (1985).
Harmelin-Vivien et al. (2005). However, this depth range matches with the one reported by Randall
(1998) for S. rubrum over its entire geographical ditribution.
The maximum LT of the specimens in this study (22 cm) was much smaller than the maximum length
observed worldwide (32 cm according to Fischer, et al., 1990) but bigger than previous specimens
collected in the Mediterranean (20.0 cm for Mouneimné (1978), 18.0 cm for Golani & Ben-Tuvia,
1985), 16.7 cm for Taskavak & Bilecenoglu (2001), 21.4 cm for Can, et al. (2002), 20.1 in Özvarol &
Tatlises (2017). Maximum weight recorded in this study was correspondigly higher than those
previously mentioned. Males and females showed no significant differences in length and weight
distributions, suggesting that there is no segregation by size or sex. Gregarious species like S. rubrum
are better able to exploit resources when living in groups because it is easier to find and catch prey,
but when resources are limited, intraspecific competition can become problematic, inducing
individuals within a population to spatial and temporal segregation by size and sex. This lack of
segregation is a further signal of the healthy condition and apparent availability of resources for S.
rubrum in Lebanese waters.
The weigth - length relationship observed in this study is consistent with the findings in India
(Muddula Krishna, et al., 2015) and eastern Mediterranean (Mouneimné, 1978; Taskavak &

169
Bilecenoglu, 2001; Can et al., 2002; Özvarol & Tatlises, 2017). Despite the virtually isometric growth
of the whole sample, of male and and female individuals, the latter highlighted a clearer positive
allometric growth. Furthermore, there is a clear indication that weight-length relationship in the
region ‘South’ showed a marked positive growth. This discrepancy may have been caused by
differences in the sample size, habitat and physiological status. This variation in size and growth may
have been caused by a reduced fishing-related mortality in the region.
S. rubrum showed a partially defined seasonal reproduction with a peak spawning period in spring
and a “latent” season in fall. The latter was also highlighted by Golani & Ben-Tuvia (1985) although
said latency was stretching over the whole spring season. In our study, in winter we observed an
increase of mature individuals leading to the spring peak (particularly evident in female individuals)
and a following decline in summer. This behaviour differs from the one described more than three
decades ago by Golani & Ben-Tuvia (1985) and Mouneimné (1978). Said Authors got to the
conclusion that redcoat is a summer spawner. It is not clear whether the expansion of the spawning
period observed in the present study toward the colder season (spring) can be the result of an
uneven data collection by season or can suggest an adaptation of the species to the Mediterranean
environment or can be the result of the variation of abiotic traits, such as the sea water temperature.
Despite the eastern Mediterranean is known to be an oligotrophic basin (Azov, 1991), Lebanese
waters show some moderate inshore eutrophication and heavily eutrophied local systems (Abboud
Abi Saab, et al., 2008). Here, low coefficient of vacuity in top predators show a considerable food
availability (Lteif, et al., 2016), which is also confirmed by the predominance of full stomachs
observed in this study for males, females, and all size categories of S. rubrum.
S. rubrum is an extremely active predator between May and August whereas it feeds lightly in colder
seasons. This is perfectly in line with the findings of Golani, et al. (1983). Likewise, the composition of
the diet is coherent with Golani, et al. (1983) but also with other species of the same genus (Randall,
1967; Vivien, 1973; Woods & Sonoda, 1973; Vivien & Peyrot-Clausade, 1974; Matthey & Reynold,
1979; Arias-González, et al., 2004). Benthic crustaceans, in particular crabs (infraorder Brachyura) are
the main component in the diet of S. rubrum.
This becomes even more evident in winter and fall when the feeding activity is lower whereas in
spring and summer S. rubrum diversified more its diet feeding significantly also on amphipods,
isopods, other decapods, polychaetas and shrimps belonging to the families Alpheidae, Pandalidae
and Processidae. This seasonal shift in diet appears to be related to the availability of each prey item
in the study area. The presence in the stomach contents of specimens belonging to the family
Processidae, confirms the nocturnal predation habits and based on the analysis of the bulk of the
preys, it is evident that the redcoat feeds mainly over rocky bottoms. However, few species are also
indicators of predatory activity over soft bottoms (i.e. Charybdis longicollis and Myra subgranulata)
and in the water column (some species clupeiformes) (Figure 46).

170
Figure 46. A portunid crab belonging to the genus Thalamita observed in stomach contents of a specimen of S. rubrum sampled in Lebanese coastal waters.
The life span of most tropical fishes is short and occasionally exceeds 2-3 years (Gulland, 1969). In
Indian waters, Anbalagan, et al. (2016) calculated the life span of about 3.5 years for S. rubrum. They
indicated that S. rubrum attains a length of about 18 cm during the first year, 22 cm and 23 cm
during the second and third years respectively. In the Mediterranean, Golani & Ben-Tuvia (1985)
outlined a much slower growth based on otoliths reading, reporting a total length of 9.5 cm for the
first year, 12.8 cm for the second year and 14.4 and 15.5 cm for the third and fourth year. In our
study, the age determination does not differ consistently from the latter, suggesting a similar reading
pattern. However, the fourth year (last age class in the study of Golani & Ben-Tuvia) was considerably
different probably due to an increased number of specimens available for this study. According to
our study, the lifespan of S. rubrum exceeds age of 6 years old, which is almost double than the value
found in Indian waters by Anbalagan, et al. (2016).
Despite the important ecological role of S. rubrum in the Mediterranean and in general of the family
Holocentridae worldwide, biological traits, abundance and behavior of this species have been
scarcely investigated. S. rubrum is commonly available for aquariums and is traded from the Pacific
and Indian Ocean (Blasiola, 2000), hence levels of exploitation recently increased in some areas
(Anbalagan, et al., 2016). In the Mediterranean, it has a scarce commercial value on fishing markets
and it is usually discarded (Figure 47).

171
Figure 44. Two specimens of S. rubrum discarded at sea in the port of Sarafand, Lebanon along with various litter.
Three decades after the study of Golani & Ben-Tuvia (1985), the maximum length and thus the
lifespan of the population increased. The Lebanese population of S. rubrum does not seem to suffer
from overfishing or other threats. However, management measures on demersal resources highly
affected by fishing activities should take into consideration the ecological role of S. rubrum and the
ongoing expansion of the presence of the family Holocentridae to other species. Data presented in
this study are meant to parameterize models of population dynamics for this fish stock to better
understand its role in the ecosystem functioning and the interactions with other commercially
exploited native species.

172
Acknowledgements
This study could not have been completed without the support of the Lebanese fishermen, their
bravery and tough job in the sea. The communities of fishermen are the ultimate beneficiaries of all
our efforts aimed at creating new and sustainable sources of income and improving their quality of
life. Data and financial funding for this study was provided in the framework of the CIHEAM-PESCA
Libano project, of the CANA project on “Establishing Monitoring and Sustainable Development of the
Lebanese Sea” (both financed by the Italian Cooperation) and within the Grant Research Programme
of the CNRS-L. We are particularly grateful to Fabien Morat and Philippe Lenfant for their help in
identifying redcoat’s preys from otoliths and Salvino Gancitano (IAMC-CNR) for sharing his
knowledge on the art of fish sclerochronology.

173
Chapter 7
General discussion,
conclusion and perspectives

174

175
Chapter 7
General discussion, conclusion and perspectives
As an absolute prime in Lebanon, in 2012 the project CIHEAM-Pesca Libano - in coordination with
major Lebanese and international actors in the fisheries research - had been implementing
experimental fishing surveys to assess the distribution and abundance of fisheries resources along
the entire Lebanese coast in order to deliver a scientific advice to the Lebanese Government for an
enhanced fisheries management. The idea of an overall Country data collection to gain information
on abundance and distribution of Lebanese fisheries resources stemmed from a series of meetings
that took place in 2012 aiming at coordinating the efforts of international organizations (i.e. FAO,
CIHEAM, Italian Cooperation) and Lebanese stakeholders such as public institutions and academia.
Financed by the Italian Cooperation in Lebanon, the project CIHEAM-Pesca Libano “Technical
Assistance to the Ministry of Agriculture in the field of fishery development” aimed at providing the
Lebanese Ministry of Agriculture (MoA) with advanced tools designed for a proper management of
marine and fisheries resources. This was meant to be achieved by strengthening capabilities of the
MoA staff and assessing the potentialities of marine coastal resources. The National Council for
Scientific Research, Lebanon (CNRS-L), in charge of the implementation of the fishing surveys through
its Marine Centre, gave further follow up executing seasonal data collection at sea in the North
Lebanon.
Adopting appropriate methodologies Abundance surveys are frequently used to gain information on stock size and distribution. In marine
areas, demersal fish species are typically surveyed by bottom trawls whereas pelagic species are
predominantly surveyed by acoustic methods calibrated by trawl catches. Trawl surveys are aimed at
assessing species distributed over soft bottoms (i.e. sandy, muddy bottoms) whereas they cannot be
used for those species inhabiting rocky or sandy-rocky habitats (Sparre & Venema, 1992). In the case
of Lebanon, the most important commercial species are typical coastal and distributed over areas
where standard trawling cannot be carried out. In this situation, other fishing gears (e.g. longlines,
gillnets and traps) had to be used to survey untrawable areas and species. Moreover, trawling
activities are interdicted in the Lebanese territorial waters (University of Balamand, 2016).
For this reason, backed by fishermen and scientists, we developed an experimental trammel net
suitable for operating over the continental shelf and upper slope, with poor selectivity properties to
catch a variety of species and sizes of fish and other organisms. In fact, if compared to gillnets,
trammel nets of different mesh sizes ensure similar mechanisms of capture in terms of snagging (the
fish is caught by twine entangling with the fish oral area), gilling (caught with the mesh behind the gill
cover); wedging (caught by the largest part of the body) (Karlsen & Bjarnason, 1986 ; Grati, et al.,
2015), whereas the entangling factor increases due to the presence and configuration of additional
two sheets of netting (Cochrane, 2002).

176
We deemed fishery-independent survey as the most appropriate tool to provide valuable measures
of relative abundance, rates of population change and size and sex composition for a wide range of
demersal species. In fact, fishery-independent surveys form the cornerstone of many stock
assessments for bony fishes and shellfish species, as they are less subject to the unknown and often
confounding factors that complicate the interpretation of fishery-dependent indices of stock status
(Rago, 2005). Thus fishery-independent surveys strike a balance between the ability to make
inferences about one or more populations versus the usage of a specific area by one or more species.
DEMERSAL SPECIES
Presence and diversity Coastal, demersal stocks are subject to various threats worldwide, especially in the Mediterranean
Sea, which is considered a hotspot of biodiversity but at the same time a hotspot of threat for
demersal species (Coll et al., 2010 ; Ben Rais Lasram et al., 2008). Overfishing, bycatch, introduction
of non-indigenous species (NIS), pollution, habitat loss and climate change are the foremost sources
of stress affecting this fish groups (Coll et al., 2010). Presence and status of demersal populations has
been described for most regions of the Mediterranean (e.g. Colloca et al., 2003; Gaertner et al.,
2007; Quignard & Tomasini, 2007; Ben Rais Lasram et al., 2009; Coll et al., 2010; Gaertner et al.,
2013; Granger, et al., 2014) with the exception of the eastern basin and notably along the Lebanese
coast where information on abundance, distribution and assemblages of demersal species is still
deficient. As such, the Levantine Basin is described as low in species richness, due to the
unfavourable conditions prevailing in the area - such as high salinity (Por & Dimentman, 2006) - but
also, most likely to a reduced sampling effort. A lack of data in several eastern and southern regions
of the Mediterranean basin may have strongly influenced results and considerations on spatial
patterns. However, some studies are in progress and a recent study focus on demersal species along
the depth gradient within the South Aegean and Cretan Seas (Eastern Mediterranean) (Peristeraki et
al., 2017).
Fisheries can affect species relationships and, as observed by Pauly et al. (1998), intensive fishing
causes larger and long-lived species to disappear (Bianchi et al., 2000), generating a significant
selection pressure for early maturation maturation (Stearns, 1992; Uusi-Heikkilä et al., 2015) and
creating impoverished ecosystems (Colloca et al., 2003). In the Mediterranean, such effect has been
documented for elasmobranchs which have undergone marked reduction of stock abundance and
local extinction (Aldebert, 1997). Along the Lebanese coast, recent studies have contributed to the
improvement of the knowledge of these cartilaginous fishes (Lteif, 2015; Lteif et al., 2016a & 2016b;
Lteif et al., 2017). Small-scale fisheries are known to have a lower environmental impact (FAO, 2015),
however Lebanese government is engaged in putting into effect management measures that need
sound scientific advice on halieutic resources base on an increased knowledge on:
1. the diversity and distribution patterns of these (and pelagic) species along the Lebanese
coast in relation to depth and the occurrence of alien species of Indo-Pacific origin;
2. their life-history traits.
These two main aspects are discussed in order to better understand the causes of underlying
diversity patterns and to assist various environmental management actions, particularly those
related to the implementation of fisheries management measures in Lebanon. In the long run, the

177
findings of the study are meant to contribute to the setup of an effective, scientific-based fisheries
management in the eastern Mediterranean.
Demersal fish species are demanded worldwide for their highly valuable parts. Annual per capita
consumption of demersal species has stabilized at about 2.9 kg. Demersal fish remain among the
main species favoured by consumers in Northern Europe and in North America (annual per capita
consumption of 9.2 and 4.3 kg, respectively, in 2013). Cephalopods are mainly preferred by
Mediterranean and East Asian countries (FAO, 2016).
Worldwide, the most abundant demersal species ordered in terms of average annual landings from
1950 to 2009 were Alaska pollock, Atlantic cod, largehead hairtail, blue whiting, sandeels, haddock,
saithe, Cape hakes, Atlantic redfishes, and flatfishes. These ten species produced 37 percent of the
total demersal landings in 2009 with a common pattern of decreasing trend in catch. Most of these
species had a peak catch in the 1960s or 1970s. Stocks condition vary with country or region.
Mediterranean and Black Sea (Area 37) had 50 percent of fish stock overfished (FAO, 2011).
Mediterranean fisheries are dominated by small-scale vessels, dispersed across a large number of
landing places in most countries (FAO, 2011). A characteristic of the Mediterranean fisheries is the
capability to exploit a variety of demersal species while generally lacking large monospecific stocks.
As a result, Mediterranean fisheries have developed a multitude of métiers and scales of
investments. Production is essentially concentrated on the continental shelf and capture fishing on
the coasts. Yearly volumes are limited (1.5 to 1.7 million tons/year), representing less than 1 percent
of global catches (UNEP/MAP-Plan Bleu, 2009). There is serious cause for concern as regards the
status of economically and commercially important species (hake, red mullet, common prawn, sole,
sardine and tuna), victims of unsustainable overexploitation.
Up to 85 percent of stocks for which a validated assessment exist are fished outside biologically
sustainable limits. European hake stocks show the highest fishing pressure, with a fishing mortality
rate that is an average of 5 times higher than the target while only a few stocks of demersal species,
such as whiting, some shrimp species, picarel and red mullet, are estimated to be fished at or below
the reference point for fishing mortality (FAO, 2016).
In the framework of the present study, a total of 129 species were recorded at depths ranging from
10 to 300 m. Most of these species are demersal including the most economically relevant species,
i.e. European hake (Merluccius merluccius), red mullet (Mullus spp.), pandoras (Pagellus spp.) and
red shrimps (Aristeus antennatus and Aristaeomorpha foliacea). The high rate of occurrence of the
red shrimps –particularly that of A. foliacea – was undoubtedly remarkable. The geographically
widespread giant red shrimp, A. foliacea, is one of the most important exploited crustaceans, having
a long traditional and economical significance for the deep fishery of the western and central
Mediterranean (Papaconstantinou & Kapiris, 2003). It occurs along the continental slope from 150 m
to 1850 m with a peak in abundance between 300 m and 700 m, showing a preference for muddy
bottoms, with aggregations mainly in submarine trenches and canyons (Ragonese et al., 1997). The
species was rarely recorded in the eastern Mediterranean probably due to a lack of studies
implemented in those areas and its stocks are considered pristine in some areas as its exploitation
has not yet been developed (Papaconstantinou & Kapiris, 2003; Gönülal et al., 2010). In our
experimental surveys A. foliacea has been observed at depths ranging from 90 to 200 meters.

178
Lessepsian species In our study, 17 NIS of Lessepsian origin (13 fish and 4 crustacean species) were recorded over the
Lebanese coastal waters, 15 of which demersal, one pelagic (the herring Etrumeus teres) and one
with a mixed benthic-pelagic behaviour (the portunid crab Charybdis longicollis) (Table 30). Only one
previous systematic experience of data collection on the Lebanese halieutic resources over the entire
Country’s coastal waters was performed by Carl J. George and Victoria A. Athanassiou from the
American University of Beirut (AUB) and Ismat Boulos of the Lebanese Ministry of Agriculture in
1964. In the booklet titled, “The Fishes of the Coastal Waters of Lebanon” (George et al., 1964), they
described and reported 177 fish species inhabiting Lebanese coastal waters, 19 of Indo-Pacific origins
(it is worth to mention the inclusion in the list of species not directly collected but reported from
adjacent waters, adding a non-empirical element to this report (Golani, 1996).
Two Lessepsian species, the spinefoot fish Siganus rivulatus and the goaldband goatfish Upeneus
moluccensis were by that time already considered as “very common,” clearly affirming how Lebanese
waters are a conquered realm for invasive subtropical species, at least since the early 1960s.
Table 28. List of non-indigenous species (NIS) collected in the present study in the eastern Mediterranean. Total weight per species stated in grams (Tot Weight (g)), number of specimens collected (No Specs), percentage of occurrence in sampling stations (O%) CPUE (number of specimens by Km2 of nets and kg/Km2 of nets) percentage of specimens (number of specimens over the total number of specimens collected). Last four columns report the species’ occurrence by depth stratum (SSh=shallow shelf, < 50 m depth; MSh=medium shelf, 50 to 99 m depth; DSh=deep shelf, 100 to 150 m depth; CSl=upper continental slope, 151 to 300 m depth). *=1 to 10 specimens; **=10 to 50 specimens; ***= >50 specimens.
Species Family
Tot
Weight
(g)
No
Specs O%
CPUE
(Specs/
Km2 nets)
CPUE
(Weight/
Km2 nets)
%
(No Specs/
Specs Tot)
SSh MSh DSh CSl
Etrumeus teres Dussumieriidae 737.5 11 9.091 31.339 2.101 0.31
**
Fistularia commersonii Fistulariidae 10120.3 26 21.488 74.074 28.833 0.73 * ** *
Lagocephalus sceleratus Tetraodontidae 24583.6 28 23.140 79.772 70.039 0.78 ** ** * *
Lagocephalus spadiceus Tetraodontidae 1551.5 6 4.959 17.094 4.420 0.17 * *
*
Nemipterus randalli Nemipteridae 864.4 13 10.744 37.037 2.463 0.36
* *
Pempheris vanicolensis Pempheridae 653.2 13 10.744 37.037 1.861 0.36 * * *
Pomadasys stridens Haemulidae 65.1 1 0.826 2.849 0.185 0.03
*
Sargocentron rubrum Holocentridae 108189 1109 916.529 3159.544 308.231 30.99 *** *** ***
Saurida lessepsianus Synodontidae 17 1 0.826 2.849 0.048 0.03
*
Siganus luridus Siganidae 2032.1 21 17.355 59.829 5.789 0.59 ** * *
Siganus rivulatus Siganidae 4640.5 67 55.372 190.883 13.221 1.87 *** ** *
Stephanolepis diaspros Monacanthidae 2513 26 21.488 74.074 7.160 0.73 ** * *
Upeneus moluccensis Mullidae 54 2 1.653 5.698 0.154 0.06
*
Charybdis longicollis Portunidae 343.8 17 14.050 48.433 0.979 0.47 * * * *
Marsupenaeus japonicus Penaeidae 24.3 3 2.479 8.547 0.069 0.08 *
Myra subgranulata Leucosiidae 104 3 2.479 8.547 0.296 0.08
*
Portunus pelagicus Portunidae 2633.1 39 32.231 111.111 7.502 1.09 ** *

179
This means that in 50 years the percentage of the autochthon fishing resources remained steady,
with an apparent slight decrease from 89% to 87%. Although in terms of biomass (not mentioned in
the study of George et al., 1964) we can assume that 50 years ago this was considerably poorer than
today, in terms of number of species, the trend, at this stage, is not so evident. As a result of 7 years
of data collection carried out with various fishing gears over the Syrian waters, (Saad, 2005) reported
224 species of Osteichthyes (bony fishes), 37 of which were NIS migrant from the Red Sea (16.5%). In
an extended work realised by (Carpentieri et al., 2009) a total of 25 Lessepsian species over 110
identified (23%) were recorded. This indicates that back then only 77% of the total catch was made
up by Mediterranean species.
In absolute terms, by 2012, (Zenetos et al., 2012) reported 193 NIS species of Mollusks, 125 of
Crustaceans and 105 of fishes in the eastern Mediterranean. NIS numbers more than doubled
between 1980 and 2016 and are substantially greater in the Levant than in the western
Mediterranean (Galil et al., 2017). This confirms that the Mediterranean Sea – and more in specific its
easternmost shores - is one of the hottest hotspots of marine bioinvasions on Earth (Rilov & Crooks,
2009). The success of Lessepsian migrants in the colonization of the eastern Mediterranean has been
probably the result of occupation of an unsaturated niche and of out-competing local species on
resources such as food and shelter. NIS, in fact, may have altered the evolutionary pathway of native
species by competitive exclusion, niche displacement, predation, and other ecological and genetic
mechanisms (Mooney & Cleland, 2001). The study of Parravicini et al. (2015) examine the
conservatism of the climatic niche by using the example of the invasion by Indo-Pacific tropical fishes
into the Mediterranean Sea and showed that tropical invaders may spread far beyond their native
niches. Dispersal and establishment success of Lessepsian fish immigrants are influenced by different
ecological traits. The accelerated rate of entry was attributed by many authors to an increase in the
Mediterranean surface water temperature (Ben Rais Lasram & Mouillot, 2009). However, the Suez
Canal has been repeatedly deepened and widened during the last decades and following the study of
Arndt & Schembri (2015) the increased immigration rate of Red Sea fishes might also be related to
reduced dispersal barriers. Indeed, by analysing the relationship between dispersal and
establishment success and a pool of different traits for 101 Lessepsian fish species using generalized
linear models, their models did not reveal a significant relationship between the sea surface
temperature in the native range of immigrant fishes and their dispersal or establishment success in
the Mediterranean Sea. The minimum depth in which a species was observed was the only significant
trait influencing dispersal success. This trait is likely related to the architecture of the Suez Canal
since until the 1970s only species with a very low minimum depth were recorded to have entered the
Mediterranean, but species occurring in deeper water started to immigrate after 1980 when the
canal was deepened to 19.5 m. The establishment success of Lessepsian fishes was also significantly
linked to size and spawning type. Benthic spawners and species with adhesive eggs representing
successful colonizers. Moreover, successful colonizers were species with a tendency to form schools,
whereas solitary species were less successful. The recent extension of the Suez Canal, completed on
the 6 of August 2015, may exacerbate the threat of dramatic increase in the introduced number of
alien species. It should double vessel traffic within the Canal, with the current average of 49 transits
per day expected to increase to 97 passages per day (SCA, 2015).
Another study of Belkamer et al. (2013), compile data on species traits, geographical distribution,
and environmental affinity of the entire pool of reef-associated fish species in the Red Sea and more
generally across the Indo-Pacific. They use this extensive data to identify the prime characteristics
separating Red Sea species that have become alien in the Mediterranean from those that have not.
They find that alien species occupy a larger range of environments in their native ranges, explaining
their ability to colonize the seasonal Mediterranean. Red Sea species that naturally experience high

180
maximum temperatures in their native range have a high probability of becoming alien. Thus,
contrary to predictions of an accelerating number of aliens following increased water temperatures,
hotter summers in this region may prevent the establishment of many alien species. They further
find that additional processes, such as competition, promote ecological diversity among alien
species. They use these results to provide a first quantitative ranking of the potential of Red Sea
species to become established in the eastern Mediterranean.
However, in deeper waters assemblages, we observed that autochthon species prevail. Those
assemblages are mainly characterised by commercially valuable species such as the red mullets
(Mullus surmuletus and M. barbatus), the European hake (Merluccius merluccius) and the red giant
shrimp (Aristaeomorpha foliacea). As shown in Table 1, NIS of Lessepsian origins are more abundant
in the shallow continental shelf becoming scarcer in deeper continental shelf and virtually absent
over the slope. Shallow water preference of Lessepsian fish previously documented by (Golani & Ben-
Tuvia, 1989; Golani, 1996) is confirmed by the outcomes of the present study. In particular, the
Mediterranean coralligenous seems to contain several components similar to Red Sea biogenic
habitats favouring benthic-demersal species migrating from the Red Sea in the occupation of spatial
niches; this may explain the high abundance of these species in the studied area (Spanier et al.,
1989). The invasion of fishes into the Mediterranean is combined with the simultaneous invasion of
marine mollusks, crustaceans, foraminifera, polychaetas and a host of other invertebrates and algae
(Rilov & Galil, 2009; Golani, 2010). According to the present study, the most abundant Lessepsian fish
species in Lebanese waters is by far the redcoat, Sargocentron rubrum. S. rubrum is a nocturnal
predator mainly feeding on macro-zoobenthos, which was an underexploited niche given that only
Apogon imberbis and the other Red Sea immigrant, Pempheris vanicolensis present the same trophic
scheme (Golani & Ben-Tuvia, 1985). Despite its successful settlement in coastal waters of the eastern
Mediterranean, and its ability to breed over long distances, reproducing in open water or scattering
eggs over the substratum (Thresher, 1984), the Mediterranean distribution of S. rubrum remains
limited westward to the eastern Aegean even though it was reported in the coastal waters of Rhodes
(Greece) about 70 years ago (Laskaridis, 1948).
Redcoat specimens were collected mainly over mixed and rocky bottoms at depths ranging from 10
to 100 m - predominantly 30 to 60 m - slightly deeper than 10-40 m depth range previously reported
in the Mediterranean by (Riedl, 1966 ; Golani, 1981 ; Golani et al., 1983 ; Golani & Ben-Tuvia, 1985 ;
Harmelin-Vivien et al., 2005). However, this depth range matches with the one reported by (Randall,
1998) for S. rubrum over its entire geographical ditribution. Three decades after the study of Golani
& Ben-Tuvia (1985), based on our study, the maximum length and thus the lifespan of the population
increased in the Mediterranean. The Lebanese population of S. rubrum does not seem to suffer from
overfishing or other threats. However, management measures on demersal resources highly affected
by fishing activities should take into consideration the ecological role of S. rubrum, the possible
expansion of its geographical bundaries and the ongoing enlargement of the presence of the family
Holocentridae in the Mediterranean (Vella et al., 2016).
Weight Length Relationships Information related to the length-weight relationships of demersal species is almost absent along the
Lebanese coast. Froese (2006) and Froese et al. (2014) had analyzed the length-weight relationships
of all fishes available on the Fishbase website (www.fishbase.org) using meta-analysis and Bayesian
methods. A few studies carried out by Turkish Authors (Başusta et al., 2013 ; Erguden et al., 2009 ;
Erguden et al., 2017 ; Özvarol, 2014 ; Sangun et al., 2007 ; Taskavak & Bilecenoglu, 2001) bring
together information on WLRs for demersal species in the northern part of the eastern

181
Mediterranean. This information allowed us comparisons with 15 species examined in the present
study, among the others some commercially relevant species (Merluccius merluccius, Mullus
barbatus, M. surmuletus, Pagellus acarne, P. erythrinus) and some Lessepsian migrants (Fistularia
commersonii, Lagocephalus sceleratus, Sargocentron rubrum, Siganus luridus, S. rivulatus,
Stephanolepis diaspros). Some differences were recorded among different areas surveyed in our
study.These could be due to sampling procedures or they could reflect the influence of differences in
environmental or habitat factors (Morato et al., 2001). WLRs may act as a tool to support fisheries
management measures by establishing a minimum catch weight limit when lengths are estimated at
sea. In Lebanon - where management measures are limited or outdated and the fishing pressure is
high on coastal fisheries resources while fishing practices targeting juvenile fishes are partially driven
by the market (Bariche et al., 2006 ; Colloca & Lelli, 2012 ; Sacchi & Dimech, 2011), the use of basic
but powerful descriptive tools of halieutic populations such as WLRs is highly recommended.
Abundance index and spatio-temporal variations The analysis of the Catch Per Unit Effort (CPUE) and total weight variation of the demersal fish
observed during this study provided indications of the spatio-temporal variation of their distribution
and abundance. Although the causes for the spatial distribution of a fish population are still poorly
understood, density-dependent processes are often suggested as a possible explanation (Myers &
Stokes, 1989 ; MacCall, 1990 ; Casini et al., 2005), as well as environmental factors (Corten & van de
Kamp, 1996; Heessen, 1996; Rose & Kulka, 1999), pollution, habitat loss induced by anthropogenic
activities including degree of stock exploitation (Winters & Wheeler, 1985) and recent warming of
the climate system (Jennings & Kaiser 1998; Gray et al. 2005; Poulard & Blanchard 2005; Rochet et al.
2010). Factors affecting fish abundance and distribution often operate at regional scales (Heessen &
Daan, 1996; Rose & Kulka, 1999). However, the nature of Lebanese water, availability of prey, daily
and seasonal movements for breeding and feeding, as well as, fishing techniques and the depths at
fishing can explain to a certain extent, the variation in distribution and abundance (Bianchi, 1992;
Koslow, 1993, and Gordon et al., 1995). Due to the uniqueness of this study in the region, no trend
could be estimated concerning the variation in abundance and biomass of demersal fish inhabiting
the coastal waters.
Communities (assemblages) are dynamic under constantly changing conditions, and in the long term
no community is stable with respect to evolutionary change (Williamson, 1987). Hence, whether
communities can ever be considered stable is largely dependent upon the temporal scale of any
investigation (Connell & Sousa, 1983; Wiens, 1984; Wiens et al., 1986).
Numerous Authors analyzed faunal changes and the establishment of certain assemblages that occur
in the areas targeted by small-scale fisheries, i.e. continental shelf and upper slope. They proved that
the spatial distribution of demersal species is mainly influenced by depth, type of substratum and
physical characteristics (such as temperature and salinity) of the water masses, e.g. Mahon & Smith,
(1989), Bianchi (1992), Fujita et al. (1995), McClatchie, et al. (1997), Magnussen (2002), Gaertner, et
al. (2005), Maravelias, et al. (2007). Some species appear to be widely distributed independently of
the environmental gradients (Colloca et al., 2003) even though biotic interactions among assemblage
members seem to be of less importance (Mahon & Smith, 1989; Sale et al., 1994).
The understanding of patterns of spatial distribution of fish populations is a critical consideration
particularly in the eastern Mediterranean Sea, where the faunal composition has been drastically
altered by the migration of numerous Indo-Pacific species from the Red Sea following the
construction of the Suez Canal in 1869 (Por, 1978; Galil & Zenetos, 2002).

182
Regarding the spatio-temporal diversity and distribution of the species observed in this study, both
showed seasonal variations and, in some cases, slight regional differences. Habitat selection by
demersal species depends on several biotic and abiotic factors. Depth and temperatures account for
much of the spatial variation in the species composition of demersal fish communities. Temperature
is the key abiotic factor that controls the rate of metabolism and growth and prey abundance is the
key biotic factor that influences habitat quality (Swain & Benoit, 2006). Seasonal changes in species
composition and abundance also reflects spawning events and migrations (Livingston et al., 1976 ;
Yoklavich et al., 1991 ; Potter et al., 1997). Water temperature and salinity have been considered the
most influential physico-chemical factors determining the distribution and abundance of fish faunas
(Haedrich et al., 1983 ; Kennish, 1990) and hence strong correlations between these factors and
species is expected (Allen, 1982 ; Potter et al., 1986 ; De Ben et al., 1990). Other factors may drive
pattern of abbundance and distribution, including habitat structure, wave exposure, outflow of
freshwater from the inland, turbidity, nutrient levels and heavy metal concentrations (Edgar & Shaw,
1995 ; Jenkins & Sutherland, 1997).
Strategic management planning The valorisation of fisheries in Lebanon sectors should be pursued through management plans that would jump-start the operationalization of marine spatial planning. This could be done, to begin with, by assessing abundance and distribution of fishing resources, identifying spawning grounds, selecting zones allocated to aquaculture, establishing fishing restricted areas, discovering new fishing grounds.
Already in 2014, the General Fisheries Commission for the Mediterranean (GFCM) recognised the effort done by the CIHEAM-Pesca Libano project in putting the basis for standardised data collection in Lebanon (GFCM, 2014). The management of fisheries requires monitoring of the variation in resource abundance on the basis of international standardized procedure. Several Mediterranean countries are currently participating to the international fish abundance surveys program called MEDITS. GFCM was exploring the possibilities to set up similar surveys programs for non-European countries. In consideration of the obstacles in performing MEDITS-like surveys in Lebanese waters, GFCM proposed fishery independent abundance surveys to be performed by using sets of passive gears upgrading methodologies and gears already used for the data collection of the CIHEAM-Pesca Libano (described in Chapter 3) (GFCM, 2014).
In 2017, GFCM formally stated that MEDITS-like scientific surveys are expected to be conducted in Lebanon by 2019-2020 (GFCM, 2017). In anticipation and support of this activity, FAO-EastMed project planned (EastMed, 2016) and financed experimental surveys in offshore fishing grounds using CIHEAM-Pesca Libano methodologies.
Mediterranean fisheries policies have been developed in order to adjust the fishing effort in relation to the availability of fishery resources and to evaluate the fishing capacity of national fleets. Because of the wide variety of species characterizing Mediterranean fisheries, fishery management in the Mediterranean is not based on catch control via TACs and quotas. Furthermore, the results of this study can encourage to a longer term the implementation or the effective management of Marine Protected Areas (MPAs) along the Lebanese coast. The Ministry of Environment of Lebanon and IUCN-Med (International Union for Conservation of Nature in Mediterranean sea), with OAPN (Organismo Autónomo Parques Nacionales of Spain), AECID (Spanish Agency for International Cooperation and Development) and MAVA foundation, UNEP-MAP (Mediterranean Action Plan for the Barcelona Convention) and RAC/SPA (Regional Activity Center for Specially Protected Areas ) launched in 2008 a project to support the development of a network of MPAs along the Lebanese coast (“Supporting management of important marine Habitats and species in Lebanon”; 2010-2012).

183
In 2012, 2013 and 2016, several Lebanese localities spread over the Lebanese shores were surveyed, aiming at the definition of coastal areas worth to be safeguarded for further and wider coastal protection and sustainable management.
In turn, this could stimulate experiences of co-managed that bring in fishermen and Local Authorities. Fishers would be trained and supported in diversifying sources of livelihoods. Activities around eco-tourism and sea-related attractions would be promoted. Fishermen would also be involved in marine ecosystem monitoring activities.
Life history aspects and overexploitation Studies on life history parameters such as age and growth, along with basic information on
distribution, abundance, movements, feeding, reproduction and genetics, are essential for scientists
to understand and predict how populations will evolve and how they will respond to different
stimuli.
Due to the broad definition of the term “demersal”, different life history traits are shown in this
group. Generally, demersal species show relatively restricted adult movements. Their pelagic juvenile
stages represent their most important dispersal mechanism (Cowen et al., 2006) although genetic
evidences show that pelagic stages often fail to fully achieve their dispersal potential (Jin-Xian et al.,
2007).
Early-life-histories vary greatly among demersal species. Some species may spawn benthic eggs from
which pelagic larvae hatch while others may display life cycles where both the eggs and the larvae
are pelagic. In other cases, peculiar forms of parental care evolved (Riginos & Victor, 2001). Pelagic
larval duration as well as the spatial distribution of pelagic stages also shows great variability among
marine species. In the Mediterraenan, the Common two-banded bream (Diplodus vulgaris), the
Striped red mullet (Mullus surmuletus), and the Comber (Serranus cabrilla) have an extended pelagic
larval duration. An intermediate condition is shown by the Saddled bream (Oblada melanura), which
spawns pelagic eggs and has offshore larvae but with a shorter pelagic duration. The Blackfaced
blenny (Tripterygion delaisi) and the Cardinal fish (Apogon imberbis) are species with low potential
for dispersal, producing benthic or mouth-brooded eggs, inshore larvae, and having shorter pelagic
larval duration. The Peacock wrasse (Symphodus tinca) releases benthic eggs (Galarzaa, et al., 2009).
Understandably, direct withdrawal of fish individuals due to fishing activities may induce changes in
the demographic characteristics of populations, including genetic variations (Rochet, 1998). Several
Authors, such as (Pauly, 1979; Gulland & Garcia, 1984; Sharp & Csirke, 1984; Greenstreet & Hall,
1996; Sainsbury et al., 1997; Haedrich & Barnes, 1997; Bianchi, et al., 2000) documented changes in
the structure of demersal fish communities. However, the understanding of how fishing activities
affect demersal fish communities is still unclear. There is the evidence that the size structure of
demersal fish communities is affected by fishing with an overall trend of reduction in large fish and
relative increase in small fish (Bianchi et al., 2000). Data from more than 230 populations reveal a
median reduction of 83 percent in breeding population size from known historic levels.
As a matter of fact, formal stock assessments (endorsed by GFCM) have not been carried out in
Lebanon. However, private universities, the National Council for Scientific Research - Lebanon (CNRS-
L) and FAO in coordination with the Ministry of Agriculture are putting the bases for a steady data
collection to allow sound stock assessments. FAO-EastMed project is supporting Lebanese public
institutions in building a new generation of scientists able to routinely run assessment of most
common local and shared stocks. Similarly, catch and effort assessment system is still in calibration
phase. In 2015, the Fish Landing Operational Utility for Catch Assessment – FLOUCA, developed for

184
storage and analysis of catch and effort data – was extended to cover the whole Lebanese coast. The
system scope includes several key variables, such as catch, effort, CPUE, prices, values and average
weight of individuals. The system launched in 2015 continued also in 2016 and in 2017 based on the
new GFCM DCRF and is expected to provide soon clear results on landings and species abundances.
Moreover, some Authors provided information on trends and abundances of Lebanese halieutic
resources.
The outcomes of visual census observations carried out in 2012 and 2013 showed typical
characteristics of overexploited fish populations (RAC/SPA - UNEP/MAP, 2014). Observed
abundances and biomasses were lower in the South (Nakoura and Tyre) than those in the Central-
North Lebanon (Raouché, Ras Chekaa and Enfeh). However, the high heterogeneity of habitats that
occurs in the study area makes it possible to host a high diversity of fish species (RAC/SPA -
UNEP/MAP, 2014). This is confirmed by the reconstruction of total catches for Lebanese coastal
regions from 1950-2010. Also in this case, (Nader et al., 2014) estimated a reduction in fish stocks of
this region over years. Lelli et al. (2007), Bariche et al. (2006), Sacchi & Dimech (2011), Colloca & Lelli
(2012) noted that the effort of Lebanon’s fishing fleet is concentrated mainly within the 6 nautical
miles leading to a high fishing pressure on the coastal fisheries resources particularly within the 3
nautical miles zone.
On the other hand, it should be noted that the status of halieutic resources between 6 and 12
nautical miles is not known, but it can be considered as virgin stocks as nearly no fishing activities are
conducted in the said area. A short offshore survey carried out by (Colloca & Lelli, 2012), set off a
preliminary evaluation of the potentiality of offshore fishing grounds for local artisanal fishery in
South Lebanon. This survey showed good yields (CPUEs higher than those of European
Mediterranean countries) for the European hake (Merluccius merluccius) and the small shrimp
Plesionika edwardsii (Colloca & Lelli, 2012).
In a general trend of declining of coastal resources, this thesis presented the case of Sargocentron
rubrum, a well settled Lessepsian species whose life traits indicate on the one hand the healthy
condition of the Lebanese population, and on the other the trend of the Mediterranean population
to reach standard population’s parameter typical of the Indo-Pacific populations. Three decades after
the study of Golani & Ben-Tuvia (1985), the maximum length and thus the lifespan of the population
increased and the spawning season expanded over a wider period.

185
BACKGROUND AND RECOMMENDATIONS
Lebanon’s fisheries sector is composed of a little artisanal fishing fleet, namely 2,005 licensed vessels
(in 2015 according to the DFW) predominantly operated by rather aged fishers using old boats with
dated equipment (Pinello & Dimech, 2013). Most of the boats are motorized and below 12 m in
length using fishing techniques mostly based on passive gears such as gillnets, trammel nets,
longlines, and purse seines. Fishing operations are mostly carried out at depths of up to 50 m (Sacchi
& Dimech, 2011; Brême, 2004; Lelli et al., 2007. Few vessels are equipped with GPS, while the rest
have very limited navigational or safety equipment (Majdalani, 2004; Sacchi & Dimech, 2011).
Lebanese coastal waters contain a significant richness of marine organisms with more than 80 fish
species being of commercial importance (Nader et al., 2012). Illegal fishing behaviors and harmful or
unsustainable practices such as the use of small mesh nets and explosives thrive as a result of an
outdated legislation and the lack of its enforcement (Sacchi & Dimech, 2011). Major anthropogenic
threats are hindering the potential of coastal communities also resulting in ecosystem degradation
further aggravating the on-going phenomena of coastal erosion, destruction of fish nurseries,
destruction of bio-constructions. They include i) the artificialization of the coast line, including the
excessive number of fishing ports, landing sites and infrastructural development along the coastal
areas, ii) sea filling, iii) the privatization of coastal domain and iv) the inadequate waste management.
The revenue of the Lebanese fishing fleet generated an average annual salary of about USD 4,300 (on
a full-time equivalent basis) which is below the Lebanon’s minimum wage for the manufacturing
sector (FAO EastMed, 2016). In 2011 the annual salary was approximately USD 3,000/fisher to about
3,229 fishers and a gross income of USD 7,400/fisher-owner (Pinello & Dimech, 2013). According to
the Department of Fisheries and Wildlife of the Ministry of Agriculture, in 2014, Lebanon started
reporting to FAO, fisheries catch data (2,998 tons in 2014 and 3,483 tons in 2015) based on the
system developed by FAO EastMed Project. Considering the local consumption of about 35.000 tons,
more than 75% of the consumed fish is imported from abroad. Marine capture fisheries compromise
about 0.06 % of the Lebanese GDP (Pinello & Dimech, 2013). Hence, it is not surprising that fishing
communities are considered among the poorest in the Country and most marginalized (Figure 48).
Figure 458. The average salaries against the national minimum wages and the poverty line at regional level. Source: (FAO EastMed, 2016)

186
There is neither a contract of employment in Lebanon nor any social security cover, which could
protect fishers in case of disability, loss of employment and retirement (PescaMed, 2011). Thus,
fishers remain heavily reliant on their earnings, possibly on private safety nets (such as remittances)
or the credit system.
In the framework of the present study, a huge dataset was collected, creating hitches and strategic
complications that had to be handled by a limited staff. Here is the breakdown of the of open issues
and recommendations:
The implementation of annual surveys for the fishery-independent assessment of the
distribution and abundance of fisheries resources along the entire Lebanese coast has to turn
into a constant exercise to ensure continuous and comparable sets of data for a correct
management of the resources.
When an adequate budget would be made available, the implementation of a second yearly-
based survey to carry out in winter time (namely January and February) has to be considered
a prerequisite to properly investigate species, biology and distribution according to the
season.
Protocols defined for sampling design, data collection and data treatment - in which the
Project abides by international standards adopted in the Mediterranean - have to be
followed in order to allow comparisons among different years defining trends and variations.
The ecological role of a defined set of commercial species has to be thoroughly studied
through the analysis of their stomach contents. Their age has to be identified by using bony
structures of fish containing record of seasonal growth patterns (scales, otoliths, etc.).
Knowledge of fish age characteristics is necessary for stock assessments, and to develop
management or conservation plans.
With regard to the sampling gears, it is strongly advised to widen the use of the trammel nets
to the full depth range surveyed (0 - 150 m depth) disposing of the gillnets sunk in the first
survey. As the Project did not follow international protocols or recommendations in the
definition of the sampling gear, future improvements and/or fine-tuning can be applied.
Staff of public Institutions involved (mainly MoA and CNRS-L) have to be steadily assigned to
the aforementioned activities and properly trained to increase and update their knowledge
on these domains. Capacity/institutional building has to be addressed to executive level to
properly set priorities and autonomously assess strategies.
In order to liaise with the world of operators towards the constant acquisition of scientific
information, it is advisable to create a network of focal points (i.e. fishermen) distributed in
major Lebanese ports and ready to report on abnormal or unexpected catches or sightings.
To increase the ecological knowledge on the macro-system continental shelf / continental
slope; following the interesting results obtained by previous local surveys especially
concerning the presence of sexually mature female individuals belonging to the species M.
merluccius in Lebanese waters; to collect detailed information on the stock of red giant
shrimp identified by the surveys implemented by the Project; it is advised to set up a survey
for the investigation of demersal and benthic resources in the continental slope also
envisaging the support of international concerned organisations and of a well-equipped
fishing trawler.

187
CONCLUSION AND PERSPECTIVES
In Lebanon for the future, cost, scale and complexity of marine research require clear vision and
strategic goals, domestic commitment, international cooperation, and integrated plans. Different
initiatives, projects and institutions have planted their seeds in the past few years and these are the
key lessons learnt:
- A continuous enhancement of the cooperation with concerned institutions in Lebanon and
throughout the Mediterranean.
- A strong commitment to establish long-term observation systems, databases and systematic
evaluation, providing for long-term time-series datasets on the marine environment.
- The promotion of regional advancement and improvement of marine research.
- The continuous building of capacities of individuals, researchers, technicians while also
initiating a positive multiplier effect with and ministries’ officers and decision makers.
- The outstanding expansion of knowledge of the marine environment as a whole, its physical
and biological parameters and processes, with emphasis upon its characteristic as a habitat
for living resources, its geological and geophysical properties, including non-living resources
in shallow and deep areas.
- Research and monitoring of marine pollution to measure and assess the effects of human
activities, notably those resulting in degradation and contamination, especially in the coastal
zones.
- The enforcement of channels of communication between the academia and the general
public, raising awareness on the status of the marine environment and on the impact of
people's common behaviour on it.
Quantitative understanding of responses to fishing activities is necessary to allow managers and
decision makers to set sound strategies. In other words, the management of fisheries requires
monitoring of the variation in resource abundance and distribution on the basis of international
standardized procedure. Several Mediterranean countries are currently participating to the
international fish abundance surveys program called MEDITS. The exploration phase to set up similar
survey programs for Lebanon already started but fishery independent abundance surveys might be
performed by using sets of passive gears: this can help researchers to get acquainted with these
methodologies using a reduced amount of human and monetary resources. Upgrading and improving
are suggested in the previous paragraph. Here, it is worth focusing on new tools already developed in
other countries that can complement data collected through fishing surveys.
Sampling hard structures for the estimation of age data. Knowledge of the age of individuals of fish populations greatly improves analyses of temporal
variation in structure and abundance. The age structure of the population can be described and rates
of key processes such as growth, recruitment, and mortality, can be quantified. This is crucial when
considering dynamics of exploited populations and managing fisheries resources. In addition to the
total increase in mortality rate caused by fishing, it is imperative to determine how the increased
mortality is distributed among age groups in the population. Age-structured population analyses are
therefore incorporated in the classical fish stock assessment models (Panfili et al., 2002). In many

188
cases a certain practice with otolith reading for each specific species is required. Otoliths of Pagellus
may be tricky for the correct identification of winter rings, ageing schemes and ring overlapping in
oldest specimens. In the case of Sargocentron rubrum, Golani & Ben-Tuvia (1985) and Mouneimné
(1978) got to different conclusion for the first winter ring reading, leading to different ageing for the
species.
Genetic analysis In the last two decades, molecular techniques have been used to assess population sub-structuring
(e.g. definition of stocks) or clarify the phylogenetic relationship among species in a wide range of
animal populations, including many fish species (Rocha-Olivares et al., 2000; Takeyama et al., 2001).
Insights from genetic analyses can be useful for addressing population genetic issues, revealing
whether two disjunctive populations share a common gene pool (Heist et al., 1995) or clarifying
taxonomic relationships between species (Gardner & Ward, 2002). In this context, using DNA
barcoding techniques, Bariche, et al. (2015) got to the conclusion that more than one species
belonging to the genus Sargocentron has entered over time the Mediterranean from the Red Sea,
remaining unreported and probably misidentified.
However, in spite of rapid advent of molecular methods, it is important to support and develop the
traditional taxonomic knowledge for proper identification of new non-indigenous species. The
participants of the last CIESM Congress Session ‘Alien records’ expressed their opinion that
appropriately supervised 'citizen science' can also provide through social networks important data on
exotic species status (established, not established, rare, common, etc.), their secondary spread and
impacts (Azzurro et al., 2013; Bariche et al., 2013). Provided that data are scientifically validated and
standardized, such method is especially useful for relatively large conspicuous species, such as fish.
Community involvement is also an important instrument to raise public awareness on the subject of
migration of marine species in the Mediterranean.
Stable isotopes In the eastern Mediterranean where NIS are altering previous equilibria, it is essential to properly
answer to questions concerning the functional consequences of species replacements (Woodward et
al., 2010). Stable isotopes analyses of nitrogen and carbon together with recently developed
analytical tools to characterize the trophic structure of the perturbed rocky reef fish community was
used in the eastern Mediterranean Sea by Fanelli et al. (2015). This is powerful way to depict the
trophic characteristics of organisms, upon which niche research relies (Newsome et al., 2007), offers
long-term estimates of the prey that have been incorporated into predator tissue, with promising
applications in invasion biology (e.g. Bodey et al. 2011). Stable isotope composition provides an
indication of the origin and transformations of organic matter to trace the use and fluxes of
resources from the individual to the community level (Newsome et al., 2012).
Assess migratory species and Lessepsian species Migratory species distribution is crucial to properly assess stocks. Bias can be generated when
knowledge of migratory patterns of species are not known or underestimated. There are several
ways to acquire knowledge about possible migrations of the species under study. An obvious and
cheap way is to lap the knowledge of the fishermen. Common echo-sounders are very useful for the
detection of vertical migrations, while more sophisticated acoustic equipment can be used to map
the distribution and estimate the abundance, in relatively short time, in particular of small pelagic

189
fish. The classical way to study movements (and growth) of fish and invertebrates is a tagging
programme. Identification tags are attached externally or placed in the body cavity, the fish is
measured and released at a known spot, and a reward is given for any tag returned. Sophisticated
acoustic and radio tags have been developed which allow the continuous observation of the
movements of single fish as followed from a research vessel. The latest developments, usually
applied in tuna research, include tags that are released at a pre-set moment, pop to the surface and
transmit to a satellite (Sparre & Venema, 1992).
Due to its geographical location, Lebanon represents also an outpost for a comprehensive
understanding of the dynamics driving the colonization of the Mediterranean by Indo-Pacific and Red
Sea species. The Mediterranean Sea – and more in specific its easternmost shores - is one of the
hottest hotspots of marine bio-invasions on earth (Rilov & Crooks, 2009).
Other issues A certain number of action should be executed to allow a sustainable growth of the entire system
that can drive the progress towards an autonomous, reliable and internationally acceptable
assessment of the halieutic resources in Lebanon. Training on fishing gear technology, stock
assessment methods, statistics are needed for researchers, ministry staff and managers. They should
be backed by a continuous effort towards the development of the PhD programme in subjects
related to the marine ecology. Multidisciplinary staff are to be built in order to respond to the rapid
development of the sciences in this sector. They should include different expertise in biology, natural
sciences, taxonomy, statistics, economy, social sciences, IT, etc. The behaviour of fishermen at sea
have to be better understood and monitored to define ratio and content of by-catch and discards,
fishing grounds, expenses and incomes, compliance with regulations. Fishing trials should be
organised and conducted with professional fishers to increase the array of metiers available.
Small-Scale Fisheries (SSF) in Lebanon can develop in the context of food security and poverty
alleviation (FAO, 2012). The SSF Guidelines should be grounded in a number of basic principles (FAO,
2012):
Resource governance, access regimes and enforcement
Safety at sea
Social and economic development
Disaster risks and climate change
Post-harvest employment and value chains
Social and gender equity
Policy coherence, institutional coordination and collaboration
Research and information needs, sources and exchange
Capacity development
Implementation support and monitoring
The social and cultural role of SSFs reflects the historic links to adjacent fishery resources, traditions
and values, and supporting local cohesion. Around the world, about half of people involved in SSFs
value chain are women, mainly engaged in post-harvest activities, handling the fish after it is caught
and ensuring that this important source of nutrition reaches more than 1 billion consumers for whom
fish is a key component of their diets (World Bank, 2010).

190
List of figures
Figure 1. The Mediterranean Sea and Black Sea make up together FAO Fishing Area 37. The GFCM,
that has the responsibility and authority to oversee the full process of fisheries management,
undertake scientific evaluations and take decisions to ensure sustainability of fisheries resources in
its area of application, identified five subregions (Western Mediterranean Sea, Ionian Sea, Adriatic
Sea, Eastern Mediterranean Sea and Black Sea). On basis of the new GFCM agreement
(www.fao.org/gfcm/background/legal-framework) that refers to the “subregional approach to
fisheries management and aquaculture development in order to better address the specificities of
the Mediterranean and the Black Sea”, the concept of subregions has been introduced during the
revision process of the fishery data collection framework of GFCM and then reflected into the DCRF
document. Subregions are furtherly divided in Geographical Subareas (GSAs) for a total of 30 GSAs in
the Mediterranean and Black Sea region. Modified from (GFCM, 2016). ............................................ 15
Figure 2. World capture fisheries and aquaculture production between 1950 and 2014. From (FAO,
2016)...................................................................................................................................................... 16
Figure 3. Catch over time by three groups, i.e. pelagic, demersal and other species between 1950 and
2009. From (FAO, 2011) ........................................................................................................................ 17
Figure 4. The enlargement of the Suez Canal (cross section, m²) and the numbers of species probably
introduced through the Suez Canal. ENIS: Erythrean non-indigenous species. From
Galil, et al. (2017). ................................................................................................................................. 25
Figure 5. Number of non-indigenous species (NIS) the Mediterranean. In red, the fraction of species
probably introduced via the Suez Canal. The circle sizes are proportionate to the total number of NIS
recorded in the country. Modified from (Galil, et al., 2017). ................................................................ 26
Figure 6. Number of marine alien species per major groups in the MSFD subregions of the
Mediterranean Sea. Modified from (Zenetos, et al., 2012). ................................................................. 26
Figure 7. Ecological classifications of non-indigenous fish in the Mediterranean Sea. From (Rilov &
Galil, 2009). ........................................................................................................................................... 27
Figure 8. Meadow with Halophila stipulacea (Cove of the military station of Ras El Bassit – photo: R.
D. Grandrive). From: (Bitar, et al., 2003) ............................................................................................... 27
Figure 9. A specimen of Rhopilema nomadica observed in Lebanese waters, during routine sampling
activities implemented by the CNRS-Lebanon along the Lebanese coastal waters.
Photo: Ghazi Bitar.................................................................................................................................. 29
Figure 10. Map of study area in Lebanon .............................................................................................. 34

191
Figure 11. Maps of investigated area showing the randomised distribution of sampling stations along
the Lebanese continental shelf. Left: northern sectors (Akkar shelf and Tripoli-Beirut). Right: southern
sectors (Beirut-Saida and Saida-Naqoura). ........................................................................................... 37
Figure 12. The graph of Costello (1990) and its interpretation concerning feeding strategy and prey
importance (with O% as the frequency of occurrence and N% as the coefficient of prey numerical
abundance). ........................................................................................................................................... 48
Figure 13. Bathymetric mapping of the Lebanese coast at depths greater than 200 meters. Sea Floor
Relief Map Scale 1:200.000 The Shalimar Cruise IFREMER-IPGP-CNRS (2003). Modified from (CANA-
CNRS, 2012) ........................................................................................................................................... 63
Figure 14. Mean monthly variations for 2000-2012 period of Sea Surface Temperature (SST) and Air
Temperature (AT) in Lebanese marine waters (eastern Mediterranean) (Abboud Abi Saab, et al.,
2013)...................................................................................................................................................... 64
Figure 15. Number of species/taxon observed in the two Lebanon missions (06/2012, 08-09/2013)
(RAC/SPA - UNEP/MAP, 2014). .............................................................................................................. 65
Figure 16. A new arrival in Lebanese waters, the jellyfish Aequorea forskalea, observed in the coastal
area of Beirut on April 2016. First record in Lebanese coastal waters. (Photo Ali Baddreddine). Source
(CANA-CNRS, 2016). .............................................................................................................................. 65
Figure 17. Map of study area: Lebanon, eastern Mediterranean. ........................................................ 93
Figure 18. Maps of investigated area showing the randomised distribution of sampling stations along
the Lebanese continental shelf. Left: Akkar shelf and Tripoli-Beirut regions. Left: northern sectors
(Akkar shelf and Tripoli-Beirut). Right: southern sectors (Beirut-Saida and Saida-Naqoura). .............. 95
Figure 19. The map representing the total catch per haul (bubble plots of the observed abundances)
in 2012 survey. .................................................................................................................................... 100
Figure 20. Catch composition (percentage of occurrence) per stratum. ............................................ 101
Figure 21. The map representing the total catch per haul (bubble plots of the observed abundances)
in survey 2013. .................................................................................................................................... 102
Figure 22. Percentage of occurrence of the most collected species in relation to strata. ................. 103
Figure 23. The map representing the total catch per haul (bubble plots of the observed abundances)
in survey 2014. .................................................................................................................................... 104
Figure 24. Percentage of occurrence of the most collected species according to stratum. ............... 105
Figure 25. The map representing the total catch for each haul (bubble plots of the observed
abundances). ....................................................................................................................................... 106
Figure 26. Relationship between sampling depth and CPUE in specimens/Km2 of nets for the main
taxa of demersal organisms obtained in the eastern Mediterranean Sea. ........................................ 112

192
Figure 27. Depth distribution between 10 and 300 meters depth for nine species in the eastern
Mediterranean. ................................................................................................................................... 114
Figure 28. Location of the sampling area in Lebanese marine waters, eastern Mediterranean.
Lebanese coastal waters were break down into 4 regions based mainly on the conformation of the
continental shelf (A: Akkar shelf; N: North; C: Center; S: South). Bathymetries up to 100 meters depth
are shown. ........................................................................................................................................... 122
Figure 29. Cluster dendogram of surveyed stations along the Lebanese coast.................................. 124
Figure 30. Multidimensional scaling of sampling stations along the Lebanese coast. ....................... 124
Figure 31. Location of the sampling area in Lebanese marine waters, eastern Mediterranean.
Lebanese coastal waters were break down into 4 regions based mainly on the conformation of the
continental shelf (A: Akkar shelf; N: North; C: Center; S: South). Bathymetries up to 100 meters depth
are shown. .......................................................................................................................................... 124
Figure 32. Location of the sampling area in Lebanese marine waters, eastern Mediterranean.
Lebanese coastal waters were break down into 4 regions based mainly on the conformation of the
continental shelf (A: Akkar shelf; N: North; C: Center; S: South). Bathymetri es up to 100 meters
depth are shown. ................................................................................................................................ 138
Figure 33. An embalmed specimen of Sargocentron rubrum exposed in the Lebanese fishing port of
Ouzaii (Beirut). ..................................................................................................................................... 152
Figure 34. Location of the sampling area in Lebanese marine waters, eastern Mediterranean.
Lebanese coastal waters were break down into 4 regions based mainly on the conformation of the
continental shelf (A: Akkar shelf; N: North; C: Center; S: South). Bathymetries up to 100 meters depth
are shown. ........................................................................................................................................... 153
Figure 35. Otoliths of a specimen of S. rubrum collected in the month of February and the
interpretation based on the alternation of hyaline areas and opaque, thin annual rings laid winter.
(Photo: Salvatore Gancitano). ............................................................................................................. 155
Figure 36. The length frequency distribution of the redcoat S. rubrum for the whole sample ( ),
males ( ) and females ( ). .......................................................................................................... 158
Figure 37. The weight–length relationship of S. rubrum for the whole sample (N=1109). Males (● and
continuous line) and females (o and pointed line) are displayed separately. For females, the equation
of the fitted exponential regression model with r2=0.85 is: WT = 0,016*LT3.035. For males: r2=0.86;
WT = 0,018*LT2.995. For whole individuals collected, the equation with r2=0.86 is: WT = 0,018*LT
2.993.
............................................................................................................................................................. 158
Figure 38. Percentages of S. rubrum individuals with respect to the stage of maturity as categorized
by MEDITS (2013) and sex (Males ; Females ). ................................................................... 160
Figure 39. Percentages of maturity stages by seasons females (top) and for males (bottom) of S.
rubrum in the eastern Mediterranean. Immature/vergin; maturing/developing;
mature/spawner; resting/spent. .................................................................................................. 161

193
Figure 40. The proportion of mature redcoat, S. rubrum to length class to estimate the length at 50%
maturity (L50) in logistic regressions. LT is the total length. .............................................................. 162
Figure 41. The proportion of full and empty stomachs of S. rubrum by sex according to length
classes. ................................................................................................................................................. 162
Figure 42. Weight of the prey items in each stomach (WP) collected for S. rubrum in Lebanese waters
by month of collection. ....................................................................................................................... 164
Figure 43. Numerical abundance (N%, grey curve), and the percentage of weight (W%, black curve) of
preys in stomach contents of S. rubrum collected in Lebanese coastal waters. ................................ 165
Figure 44. Feeding strategy graphs for the redcoat S. rubrum specimens in the winter (a), spring (b),
summer (c) and fall (d) seasons........................................................................................................... 166
Figure 45. Von Bertalanffy growth curve in length of S. rubrum in the eastern Mediterranean. ...... 167
Figure 46. A portunid crab belonging to the genus Thalamita observed in stomach contents of a
specimen of S. rubrum sampled in Lebanese coastal waters. ............................................................ 170
Figure 47. Two specimens of S. rubrum discarded at sea in the port of Sarafand, Lebanon along with
various litter. ....................................................................................................................................... 171
Figure 48. The average salaries against the national minimum wages and the poverty line at regional
level. Source: (FAO EastMed, 2016) .................................................................................................... 185

194

195
List of tables
Table 1. Survey areas according to regions and bathymetric strata over the Lebanese continental
shelf. ...................................................................................................................................................... 37
Table 2. Location of the sampling stations and their identification code. ............................................ 38
Table 3. Technical characteristics of gillnets and trammel nets used for the implementation of the
fishing surveys. ...................................................................................................................................... 40
Table 4. Characteristics of the fishing vessels used in the surveys. ...................................................... 41
Table 5. Protocols and minimum requirements adopted. .................................................................... 42
Table 6. Gonad aspects, sexual maturation states and maturity stages for bony fishes (a),
cephalopods (b), crustaceans(c) and elasmobranches oviparous (d) as used in this study. ................ 44
Table 7. The main statistical tests performed in this study as well as their application purposes (LT,
WT, FI, IG, IH, and K are total length, total weight, fullness index, and condition factor, respectively.
M, F, Imm, and Mat are males, females, immature and mature individuals, respectively. ................. 53
Table 8. Lebanon demographic profile (Central Investigation Agency, 2017). ..................................... 61
Table 9. Fishing gears in Lebanon. Modified from (University of Balamand, 2016). ............................ 68
Table 10. Lebanon estimated catch data for 2015 (DFW 2016, personal communication) ................. 70
Table 11. Laws and regulations related to the fisheries sector in Lebanon. Modified from (University
of Balamand, 2016). .............................................................................................................................. 75
Table 12. Management measures for purse seines fishery. Modified from (University of Balamand,
2016)...................................................................................................................................................... 81
Table 13. Survey areas according to regions and bathymetric strata over the Lebanese continental
shelf. ...................................................................................................................................................... 94
Table 14. Technical characteristics of gillnets and trammel nets used for the implementation of the
fishing surveys. ...................................................................................................................................... 96
Table 15. Protocols and minimum requirements adopted. .................................................................. 98
Table 16. Catch per strata in the 2012 survey. .................................................................................... 101
Table 17. Catch per strata in 2013 survey. .......................................................................................... 103
Table 18. Catch per strata in 2014 survey. .......................................................................................... 104

196
Table 19. List of species collected in the 4 surveys 2012, 2013, 2014 and deeper waters in the eastern
Mediterranean. Total weight per species stated in grams (Tot Weight (g)), number of specimens
collected (No Specs), percentage of occurrence in sampling stations (O%, and by year) CPUE (number
of specimens by Km2 of nets and kg/Km2 of nets) percentage of specimens (number of specimens
over the total number of specimens collected). Last four columns report the species’ occurrence by
depth stratum (SSh=shallow shelf, < 50 m depth; MSh=medium shelf, 50 to 99 m depth; DSh=deep
shelf, 100 to 150 m depth; CSl=upper continental slope, 151 to 300 m depth). *=1 to 10 specimens;
**=10 to 50 specimens; ***= >50 specimens. .................................................................................... 108
Table 20. The length and weight characteristics as well as the parameters of the length-weight
relationships (W=aLb) for 3 species caught in the Lebanese waters, eastern Mediterranean. When
significant differences between sexes were observed, WLR was estimated for each sex; when no
significant differences were observed, one WLR was estimated for the sexes combined (comprising
non-determined individuals). Sex (F = female; M = male; All = includes F, M and non-determined
individuals); N is the sample size; W is the weight; SD is the standard deviation; a and b are the
parameters of the length-weight relationships; r2 is the coefficient of determination. Meaning of the
letters and symbol in exponent in the first column: L for Lessepsian species, * for species for which it
is the first information available on WLRs. In the first column, number of individuals in each sex
modalities are specified. P-value, significance between male and female [in bold, significant
differences (P<0.05)], with tests only performed for species with sample size for each sex modality
upper than 5 individuals. .................................................................................................................. 1393
Table 21. Protocols and minimum requirements adopted for nets management, vessels minimum
requirements and biological data collection. *Medits Handbook, 2013. ........................................... 139
Table 22. The length and weight characteristics as well as the parameters of the length-weight
relationships (W=aLb) for 27 species caught in the Lebanese waters, eastern Mediterranean. When
significant differences between sexes were observed, WLR was estimated for the sexes combined
(comprising non-determined individuals). Taxonomy corresponds to classification of the species
collected (P = bony fishes; S = selaceans; K = crustaceans); Sex (F = female; M = male; All = includes F,
M and non-determined individuals); N is the sample size; / is the mean of total length or
carapace length; W is the weight; SD is the standard deviation; a and b are the parameters of the
length-weight relationships; r2 is the coefficient of determination; Growth type (A+ = positive
allometry; A- = negative allometry; I = isometry). Meaning of the letters and symbol in exponent in
the first column: L for Lessepsian species, * for species for which it is the first information available
on WLRs, and C for commercially important species for the Lebanese coast. In the first column,
number of individuals in each sex modalities are specified. P-value, significance between male and
female [in bold, significant differences (P<0.05)], with tests only performed for species with sample
size for each sex modality upper than 5 individuals. .......................................................................... 140
Table 23. Test for differences in slopes of the weight-length relationships for fish species caught in
four different regions. ni and bi are respectively the sample size and the regression slope for each
region i. P is the significance of covariance analysis bet ween region for H0: b1 = b2 = b3 = b4 [in bold,
significant differences (P<0.05)]. ......................................................................................................... 143
Table 24. Weight-length relationships (WLRs) for combined sex samples in Lebanese waters. a and b
are the parameters of the WLRs (W=aLb). Growth type: A+ = positive allometry and A- = negative

197
allometry. Comparison between this study and previous ones: K reports data from Khalaf et al. (2004)
and L from Lteif et al. (2016). .............................................................................................................. 144
Table 25. Protocols and minimum requirements adopted for nets management, vessels minimum
requirements and biological data collection. * MEDITS Working Group, 2013. ................................. 154
Table 26. Test for differences in slopes of the weight-length relationships for redcoat specimens
caught in four different regions. ni and bi are respectively the sample size and the regression slope for
each region i. P is the significance of covariance analysis between region for H0: b1 = b2 = b3 = b4
[significant difference (P<0.05)]. ......................................................................................................... 159
Table 27. Food items found in the stomach of S. rubrum in Lebanese waters. Number of stomachs in
which the prey occurs (O), the number of preys (N) and the weight in grams (W) are reported. Also,
the frequency of occurrence (O%), coefficient of prey numerical abundance (N%), percentage of
weight (W%), and the Index of Relative Importance (IRI) were estimated. ....................................... 163
Table 28. Variation in the diet of S. rubrum in terms of the frequency of occurrence (O%), coefficient
of prey numerical abundance (N%), percentage of weight (W%), and Index of Relative Importance
(IRI) through seasons. .......................................................................................................................... 165
Table 29. Number of otoliths analyzed (N), total length (LT) range and mean length (±standard
deviation, SD) at each age group of S. rubrum. TLVBGC gives the LT of the fish according to von
Bertalanffy growth function. ............................................................................................................... 167
Table 30. List of non-indigenous species (NIS) collected in the present study in the eastern
Mediterranean. Total weight per species stated in grams (Tot Weight (g)), number of specimens
collected (No Specs), percentage of occurrence in sampling stations (O%) CPUE (number of
specimens by Km2 of nets and kg/Km2 of nets) percentage of specimens (number of specimens over
the total number of specimens collected). Last four columns report the species’ occurrence by depth
stratum (SSh=shallow shelf, < 50 m depth; MSh=medium shelf, 50 to 99 m depth; DSh=deep shelf,
100 to 150 m depth; CSl=upper continental slope, 151 to 300 m depth). *=1 to 10 specimens; **=10
to 50 specimens; ***= >50 specimens. ............................................................................................... 178

198

199
References
Abboud Abi Saab, M. (1985). Contribution à l’étude des populations microplanctoniques des eaux
côtières libanaises (Méditerranée orientale). Thèse à l’université D’Aix-Marseille II, 281 p.
Abboud Abi Saab, M. (2012). Marine biodiversity in coastal waters. (H. Kouyoumjian, & M. Hamzé,
Eds.) INCAM-EU/CNRS Lebanon.
Abboud Abi Saab, M., Fakhri, M., & Hassoun, A. R. (2013). Inter-annual variations of water and air
temperatures in Lebanese coastal waters (2000-2012). Oceanography & Sustainable Marine
Production: A Challenge of Managing Marine Resources in a Changing Climate - ICOSMaP –
2013. Kuantan- Malaysia, 29-31 October 2013 INOC.
Abboud Abi Saab, M., Fakhri, M., Hassoun, A., Tilbian, M., Kassab, M. T., & Matar, N. (2012). Effects
of continental input on marine environment in the Lebanese coastal waters. In: INOC-CNRS,
International Conference on “Land-Sea Interactions in the Coastal Zone” Jounieh - Lebanon.
Abboud-Abi Saab, M., Fakhri, M., Kassab, M. T., & Matar, N. (2013). Seasonal and spatial variations of
the dinoflagellate Ostreopsis siamensis in the Lebanese coastal waters (Eastern
Mediterranean). Cryptogamie, Algologie, 34 (1), 57-67.
Abboud Abi Saab, M., Fakhri, M., Sadek, E., & Matar, N. (2008). An estimate of the environmental
status of Lebanese littoral waters using nutrients and chlorophyll as indicators. Lebanese
Science Journal, 9 (1), 18.
Abella, A., & Serena, F. (1995). Definizione di assemblaggi demersali nell'alto Tirreno. Biol. Mar.
Medit., S2, 451— 453.
Abercrombie, D. L., Clarke, S. C., & Shivji, M. S. (2005). Global-scale identification of hammerhead
sharks: Application to assessment of the international fin trade and law enforcement.
Conservation Genetics, 6, 775–788.
Administration Centrale de la Statistique. (2006). Compendium statistique national sur les
statistiques de l’environnement au Liban 2006.
Akyol, O., Unal, V., Ceyhan, T., & Bilecenoglu, M. (2005). First confirmed record of Lagocephalus
sceleratus (Gmelin 1789) in the Mediterranean Sea. Journal of Fish Biology, 6 (44), 1183-
1186.
ALI/LCEC. (2006). Understanding Energy Use in the Industrial Sector of Lebanon. a Preliminary
Analysis of the ALI/LCEC Survey results.
Allen, L. G. (1982). Seasonal abundance, composition and productivity of the littoral fish assemblage
in Upper Newport Bay, California. Fish Bull, 80, 769-790.
Anbalagan, T., Murugan, A., Jawahar, P., Vijayanand, P., Saravanan, R., & Veerappan, N. (2016). Age
and growth of squirrel fish, Sargocentron rubrum, (Forsskal, 1775) from Cuddalore waters,
Southeast coast of India. Indian Journal of Geo Marine Sciences, 45(12), 1742-1748.

200
Ardizzone, G. D., & Corsi, F. (1997). Atlas of Italian Demersal Fishery Resources. Biologia Marina
Meditterranea, 4, 568 pp.
Arias-González, J. E., Galzin, R., & Harmelin-Vivien, M. (2004). Spatial, Ontogenetic, and Temporal
Variation in the Feeding Habits of the Squirrelfish Sargocentron Microstoma on Reefs in
Moorea, French Polynesia. Bulletin of Marine Science, 75 (3), 473-480.
Arndt, E., & Schembri, P. J. (2015). Common traits associated with establishment and spread of
Lessepsian fishes in the Mediterranean Sea. Mar Biol, 162, 2141–2153.
Ashkar, J., Lurie, Y., Levy, Y., Azzam, Z., Litmanovich, M., Golik, M., Gurevycha, B., Golani, D.,
Eisenman, A. (2008). Lessepsian migration and tetrodotoxin poisoning due to Lagocephalus
sceleratus in the eastern Mediterranean, . Toxicon 52, 964-968.
Aydin, M. (2011). Growth, Reproduction and diet of pufferfish (Lagocephalus sceleratus Gmelin,
1789) from Turkey’s Mediterranean Sea coast. Turkish Journal of Fisheries and Aquatic
Sciences, 11, 569-576.
Azov, Y. (1991). Eastern Mediterranean - a marine desert? Marine Pollution Bullettin, 23, 225-232.
Azzurro E., Broglio E., Maynou F. & Bariche M. (2013). Citizen science detects the undetected: the
case of Abudefduf saxatilis from the Mediterranean Sea. Management of Biological
Invasions, 4: 167-170. ;
Azzurro, E., Castriota, L., Falautano, M., Giardina, F., & Andaloro, F. (2014). The silver-cheeked
toadfish Lagocephalus sceleratus (Gmelin, 1789) reaches Italian waters. J. Appl. Ichthyol., 30
(5), 1050-1052.
Azzurro, E., Victor, M. T., Lombarte, A., Maynou, M., Simberloff, D., Rodríguez‐Pérez, A., & Solé, R. V.
(2014). External morphology explains the success of biological invasions. Ecology Letters, 17,
1455–1463.
Bagenal, T. B.; Tesch, F. W., (1978). Age and growth. In: Methods for assessment of fish production in
fresh waters, 3rd edn. T. Bagenal (Ed.). IBP Handbook No. 3. Blackwell Science Publications,
Oxford, pp. 101–136.
Bakun, A. (2006). Fronts and eddies as key structures in the habitat of marine fish larvae:
opportunity, adaptive response and competitive advantage. Sci. Mar., 70 (S2), 105-122.
Bariche, M. (2003). Biology and ecology of two Lessepsian species (Siganus rivulatus and Siganus
luridus, Teleostei Siganidae) on the Lebanese coast. Cybium, 27, 52.
Bariche, M. (2012). Field identification guide to the living marine resources of the Eastern and
Southern Mediterranean. FAO Species Identification Guide for Fishery Purposes, 610 pp.
Bariche, M., Alwan, N., & El-Fadel, M. (2006). Structure and biological characteristics of purse seine
landings off the Lebanese coast (eastern Mediterranean). Fisheries Research, 82, 246-252.
Bariche, M., Letourneur, Y., & Harmelin-Vivien, M. (2004). Temporal fluctuations and settlement
patterns of native and Lessepsian herbivorous fishes on the Lebanese coast (Eastern
Mediterranean). Env Biol Fish, 70, 81–90.
Bariche M., Torres M., Azzurro E., 2013. The presence of the invasive Lionfish Pterois miles in the
Mediterranean Sea. Mediterranean Mar. Sci. 14: 292-294.

201
Bariche, M., Torres, M., Smith, C., Sayar, N., Azzurro, E., Baker, R., & Bernardi, G. (2015). Red Sea
fishes in the Mediterranean Sea: a preliminary investigation of a biological invasion using
DNA barcoding. J. Biogeogr., 42, 2363–2373.
Bas, C. (2009). The Mediterranean: A synoptic overview. Contributions to Science, 5, 25–39.
Bas Peired, C. (2005). The Mediterranean Sea: living resources and exploitation. CIHEAMIAMZ/FAO
CopeMed project, 509 pp.
Basson, P. W., Hardy, J. T., & Lakkis, V. (1976). Ecology of marine macroalgae in relation to pollution
along the coast of Lebanon. Acta Adriatica, 18, 307-325.
Başusta A., Başusta N. and Özer E.I., (2013). Length-Weight relationship of two Puffer fishes,
Lagocephalus sceleratus and Lagocephalus spadiceus, from Iskenderun Bay, Northeastern
Mediterranean, Turkey. Pakistan J. Zool., vol. 45(4), pp. 1047-1051
Bedford, B. C. (1983). A method for preparing sections of large number of otoliths embedded in black
polyester resin. J. Cons. Int. Explor. Mer., 41, 4-12.
Belmaker, J, Parravicini, V, Kulbicki, M, 2013. Ecological traits and environmental affinity explain Red
Sea fish introduction into the Mediterranean. Global Change Biology 19, 1373-1382.
Ben Rais Lasram, F., Guilhaumon, F., & Mouillot, D. (2009). Fish diversity patterns in the
Mediterranean Sea: deviations from amid-domain model. Mar Ecol Prog Ser., 376, 253–267.
Ben Rais Lasram, F., Tomasini, J. A., Romdhane, M. S., Do Chi, T., & Mouillot, D. (2008). Historical
colonization of the Mediterranean Sea by Atlanticfishes: do biological traits matter?
Hydrobiologia, 607, 51–62.
Ben-Tuvia, A. (1966). Red Sea fishes recently found in the Mediterranean. Copeia, 1966(2), 254-275.
Ben-Tuvia, A. (1986). Holocentridae. (P. P. Whitehead, M. L. Bauchot, J. C. Hureau, J. Nielsen, & E.
Tortonese, A cura di) In: Fishes of the north-eastern Atlantic and the Mediterranean. Volume
2, 753-755.
Bergstad, O. A., Menezes, G., & Høines, Å. S. (2008). Demersal fish on a mid-ocean ridge: Distribution
patterns and structuring factors. Deep Sea Research Part II: Topical Studies in Oceanography,
55, 1-2, 185-202.
Biagi, F., De Ranieri, S., Mori, M., Sartor, P., & Sbrana, M. (1989). Preliminary analysis of demersal fish
assemblages in the Northern Tyrrhenian Sea. Nova Thalassia, 10 Suppl. 1, 391—398.
Bianchi, C. N., & Morri, C. (2010). Marine biodiversity of the Mediterranean Sea: Situation, problems
and prospects for future research. Marine Pollution Bulletin, 40, 367–376.
Bianchi, G. (1992). Study of the demersal assemblages of the continental shelf and upper slope off
Congo and Gabon, based on the trawl surveys of the RV “Dr. Fridtjof Nansen”. Mar. EcolProg
Ser., 35, 9–23.
Bianchi, G., Gislason, H., Graham, K., Hill, L., Jin, X., Koranteng, K., Manickchand-Heileman S., Payá I.,
Sainsbury K., Sanchez F, Zwanenburg, K. (2000). Impact of fishing on size composition and
diversity of demersal fish communities. ICES Journal of Marine Science, 57, 558–571.

202
Bilecenoglu, M., Kaya, M., & Akalin, S. (2006). Range expansion of silverstripe blaasop, Lagocephalus
sceleratus (Gmelin, 1789), to the northern Aegean Sea. Aquatic Invasions, 1, 289-291.
Bitar, G. (1999). Sur les Caulerpa de la côte libanaise (Méditerranée orientale). Actes de l’atelier sur
les espèces de Caulerpa invasives en Méditerranée. Heraklion, Crete, Greece, 18-20 March
1998. PNUE, PAM, MED POL. MAP Technical Reports Series, 275-277.
Bitar, G., Dupuy de la Grandrive, R., & Foulquié, M. (2003). Second mission relating to the
Development of Marine Protected Areas on Syrian coasts, 1–18 August 2003. Mission Report.
Regional Project for the Development of Marine and Coastal Protected Areas in the
Mediterranean Region, 40pp.
Bitar, G., & Kouli-Bitar, S. (2001). Nouvelles données sur la faune et laflore benthiques de la côte
Libanaise. Migration Lessepsienne. Thalassia Salentina, 25, 71-74.
Bitar, G., Ocaña, O., & Ramos-Esplá, A. A. (2007). Contribution of the Red Ssea alien species to
structuring some benthic biocenosis inthe Lebanon coast (eastern Mediterranean). Rapp.
Comm. int. Mer Médit., 38, 437.
Bitar, G., Ramos-Esplá, A., Ocaña, O., Sghaier, Y., Forcada, A., Valle-Pérez, C., El Shaer, H., Verlaque,
M. (2017). Introduced marine macroflora of Lebanon and its distribution on the Levantine
coast. Mediterranean Marine Science, 18, 138-155.
Blasiola, G. C. (2000). The Saltwater Aquarium Handbook. Barron's Educational Series, 165 pp.
Blondel, J., & Aronson, J. (1999). Biology and Wildlife of the Mediterranean Region. Oxford University
Press, 328 pp.
Boudouresque, C. F. (2004). Marine biodiversity in the Mediterranean: Status of species, populations
and communities. Scientific Reports of Port-Cros National Park, France, 20, 97–146.
Boudouresque, C. F., Klein, J., Ruitton, S., & Verlaque, M. (2011). Biological Invasion: The Thau
Lagoon, a Japanese biological island in the Mediterranean Sea. In: Global change: mankind-
marine environment interactions. Ceccaldi, H.J., Dekeyser, I., Girault, M. & Stora, G. (Eds),
151-156.
Bowen, S. H. (1983). Quantitative description of the diet. (L. A. Nielsen, & D. L. Johnson, Eds.) In
Fisheries techniques, 468 pp.
Bradai, M. N., Saidi, B., & Enajjar, S. (2012). Elasmobranchs of the Mediterranean and Black sea:
status, ecology and biology. A Bibliographic Analysis. Studies and Reviews. General Fisheries
Commission for the Mediterranean. No. 91, 103 pp.
Braga, F. S. (1986). Estudo entre fator de condição e relação peso/comprimento para alguns peixes
marinhos. Revista Brasileira de Biologia, 46, 339-346.
Branch, T. A., Jensen, O. P., Ricard, D., Ye, Y., & Hilborn, R. (2011). Contrasting global trends in marine
fishery status obtained from catches and stock assessments. Conserv.Biol., 25, 777–786.
Brême, C. (2004). Analyse situationnelle de la Pêche côtière. Aspects techniques, économiques,
sociaux et commerciaux. Rapport mission au Liban TRANSTEC, CE.
Cacaud, P. (2005). Fisheries laws and regulations in the Mediterranean: a comparative study. Studies
and Reviews. General Fisheries Commission for the Mediterranean(75), 40 pp.

203
Calman, W. T. (1927). Appendix to the report on the Crustacea Decapoda (Brachyura). Zoological
results of the Cambridge expedition to the Suez Canal (1924). XIII. Trans Zool Soc London 217.
Can, M. F., Basusta, N., & Cekic, M. (2002). Weight-length relationships for selected fish species of
the small-scale fisheries off the south coast of Iskenderun Bay. Turk J. Vet. Anim. Sci., 26,
1181-1183.
CANA-CNRS. (2011). Sustainable aquaculture development and support to the Fishery sector. Final
Report. (R. Ugolini) 119 pp.
CANA-CNRS. (2012). CANA-CNRS A scientific vessel for Lebanon. Strengthening cooperation between
Italy and Lebanon towards the sustainable development of the marine environment. 59 pp.
CANA-CNRS. (2016). CANA-CNRS A scientific vessel for Lebanon. 80 pp.
Carpentieri, P., Lelli, S., Colloca, F., Mohanna, C., Bartolino, V., Moubayed, S., & Ardizzone, G. D.
(2009). Incidence of lessepsian migrants on landings of the artisanal fishery of South
Lebanon. JMBA 2 - Biodiversity Records 2, e71.
Casini, M., Cardinale, M., Hjelm, J., & Vitale, F. (2005). Trends in cpue and related changes in spatial
distribution of demersal fish species in the Kattegat and Skagerrak, eastern North Sea,
between 1981 and 2003. ICES Journal of Marine Science, 62, 671–682.
Carton, H., Singh, S. C., Tapponnier, P., Elias, A., Briais, A., Sursock, A., Jomaa, R, King, G.C.P., Daëron,
M., Jacques, E., Barrier, L. (2009). Seismic evidence for Neogene and active shortening
offshore of Lebanon (Shalimar cruise). Journal of Geophysical Research, 114.
Central Intelligence Agency. (2013). The World Factbook 2013-14.
Central Investigation Agency. (2017). CIA “The world factbook”.
https://www.cia.gov/library/publications/resources/the-world-factbook/geos/le.html.
Retrieved on May 19, 2017
Clarke, S. C., McAllister, M. K., Milner-Gulland, E. J., Kirkwood, G. P., Michielsens, C. G., Agnew, D. J., .
Pikitch, E.K., Nakano, H., Shivji, M. S. (2006). Global estimates of shark catches using trade
records from commercial markets. Ecology Letters, 9, 1115-1126.
Cochran, W. G. (1977). Sampling techniques, 3rd ed. New York: John Wills & Sons, 428 pp.
Cochrane, K. L. (2002). A fishery manager's guidebook. Management measures and their application.
FAO Fisheries Technical Paper. No. 424, 231 pp.
Coelho, R., Erzini, K., Bentes, L., Correia, C., Lino, P., Monteiro, P., Gonçalves, J. (2005). Semi-pelagic
longline and trammel net elasmobranch catches in southern Portugal: Catch composition,
catch rates and discards. Journal of Northwest Atlantic Fishery Science, 35, 531–537.
Cole, L. C. (1954). The Population Consequences of Life History Phenomena. The Quarterly Review of
Biology, 29 (2), 103-137.
Coll, M., Piroddi, C., Steenbeek, J., Kaschner, K., Lasram, L. B. R., Aguzzi, J., Ballesteros, E., Bianchi, C.
N., Corbera, J., Dailianis, T., Danovaro, R., Estrada, E., Froglia, C., Galil, B., Gasol, J. M.,
Gertwagen, R., Gil, J., Guilhaumon, F., Kesner-Reyes, K., Kitsos, M. S., Koukouras, A.,
Lampadariou, N., Laxamana, E., Lopez-Fe, C. M., De la Cuadra, Lotze, H. K., Martin, D.,
Mouillot, D., Oro, D., Raicevich, S., Rius-Barile, J., Saiz-Salinas, J. I., Vicente, C. S., Somot, S.,

204
Templado, J., Turon, X., Vafidis, D., Villanueva, R. & Voultsiadou, E. (2010). The Biodiversity of
the Mediterranean Sea: Estimates, Patterns, and Threats. PLoS ONE, 5.
Colloca, F., Cardinale, M., Belluscio, A., & Ardizzone, G. D. (2003). Pattern of distribution and diversity
of demersal assemblages. Estuarine, Coastal and Shelf Science, 56, 469–480.
Colloca, F., Cardinale, M., Maynou, F., Giannoulaki, M., Scarcella, G., Jenko, K., J. M. Bellido,
Fiorentino, F. (2013). Rebuilding Mediterranean fisheries: a new paradigm for ecological
sustainability. Fish Fish., 14, 89–109.
Colloca, F., Crespi, V., Cerasi, S., & Coppola, S. R. (2004). Structure and evolution of the artisanal
fishery in a southern Italian coastal area. Fish.Res., 69, 359–369.
Colloca, F., & Lelli, S. (2012). Report of the FAO EastMed support to the fishing trials carried out off
the South Lebanese Coast. GCP/INT/041/EC – GRE – ITA/TD-14.
Connell, J. H., & Sousa, W. P. (1983). On the evidence needed to judge ecological stability or
persistence. Am Nat, 121 (6), 789-824.
Conrath, C. L. (2005). Reproductive biology. In: Management techniques for elasmobranch fisheries
(Musick, J. A. & Bonfil, R., eds.), p. 251. Rome: FAO Fisheries Technical Paper.
Corten, A., & van de Kamp, G. (1996). Variation in the abundance of southern fish species in the
southern North Sea in relation to hydrography and wind. ICES Journal of Marine Science, 53,
1113-1119.
Costello, M. J. (1990). Predator feeding strategy and prey importance: a new graphical analysis.
Journal of Fish Biology, 36, 261-263.
Cowen, R. K., Paris, C. B., & Srinivasan, A. (2006). Scaling of connectivity in marine populations.
Science, 311, 522-527.
Crocetta, F., Agius, D., Balistreri, P., Bariche, M., Bayhan, Y. K., Çakir, M., , S. Ciriaco, M. Corsini-Foka,
A. Deidun, R. El Zrelli, D. Ergüden, J. Evans, M. Ghelia, M. Giavasi, P. Kleitou, G. Kondylatos, L.
Lipej, C. Mifsud, Y. Özvarol, A. Pagano, P. Portelli, D. Poursanidis, L. Rabaoui, P.J. Schembri, E.
TaŞkin, F. Tiralongo, A. Zenetos, (2015). New Mediterranean Biodiversity Records (October
2015). Mediterranean Marine Science, 16 (3), 682–702.
Culver, C. S., & Kuris, A. M. (2000). The apparent eradication of a locally established introduced
marine pest. Biol Invas, 2, 245–253.
Cuttelod, A., García, N., Malak, D. A., Temple, H., & Katariya, V. (2008). The Mediterranean: A
biodiversity hotspot under threat. In: The 2008 review of the IUCN red list of threatened
species (Vié, J. C., Hilton-Taylor, C. & Stuart, S. N., eds.). Switzerland: IUCN.
Danovaro, R., & Pusceddu, A. (2007). Ecomanagement of biodiversity and ecosystem functioning in
the Mediterranean Sea: Concerns and strategies. Chemistry and Ecology, 23, 347–360.
DAR-IAURIF. (2010). NPMPLT – National Physical Master Plan of the Lebanese Territory (2005). Final
Report.
Darwish, F., & Timberlake, R. (1999). Road User Charging Study: Charging Scenarios on the Basis of
Road Funding Requirements and Cost Allocation to Vehicles. in LTP, 58-71.

205
De Ben, W. A., Clothier, W. D., Ditsworth, G. R., & Baumgartner, D. J. (1990). Spatio-temporal
fluctuations of demersal fish and epibenthic crustaceans In Yaqulna Bay, Oregon. Estuaries,
13 (4), 469-478.
Department of State. U.S. Government. (2005). Annual Report on International Religious Freedom
2004, 781 pp.
D'Onghia, G., Mastrototaro, F., Matarrese, A., Politou, C. Y., & Mytilineou, C. (2003). Biodiversity of
the Upper Slope Demersal Community in the Eastern Mediterranean: Preliminary
Comparison BetweenTwo Areas With and Without Trawl Fishing. J. Northw. Atl. Fish. Sci., 31,
263—273.
D'Onghia, G., Tursi, A., Maiorano, P., Matarrese, A., & Panza, M. (1998). Demersal fish assemblages
from the bathyal grounds of the north-western Ionian Sea. Ital J. Zool., a5 suppl., 287—292.
Dulvy, N. K., Fowler, S. L., Musick, J. A., Cavanagh, R. D., Kyne, P. M., Harrison, L. R., Carlson, J.K.,
Davidson, L.N.D. Fordham, S.V., Francis, M.P., Pollock, C.M., Simpfendorfer, C.A., Burgess,
G.H., Carpenter, K.E., Compagno, L.J.V., Ebert, D.A., Gibson, C., Heupel, M.R., Livingstone,
S.R., Sanciangco, J.C., Stevens, J.D., Valenti, S., White, W.T., (2014). Extinction risk and
conservation of the world’s sharks and rays. eLife, 3, e00590.
EastMed. (2010). Report of the Sub-Regional Technical Meeting on the Lessepsian Migration and Its
Impact on Eastern Mediterranean Fishery. GCP/INT/041/EC-GRE-ITA/TD-04, 132 pp.
EastMed. (2016). Report of the 7th meeting of the EastMed Co-ordination Committee. Beirut,
Lebanon 19 – 20 May 2016. 16 pp.
ECODIT/MoE/LEDO. (2001). State of the Environment Report 2001. 246pp.
Edelist, D., Rilov, G., Golani, D., Carlton, J. T., & Spanier, E. (2013). Restructuring the sea: profound
shifts in the world’s most invaded marine ecosystem. Divers Distrib, 19, 69–77.
Edelist, D., Sonin, O., Golani, D., Rilov, G., & Spanier, E. (2011). Spatio-temporal patterns of catch and
discards of the Israeli Mediterranean trawl fishery in the early 1990s: ecological and
conservation perspectives. Sci Mar, 75, 641–652.
Edelist, D., & Spanier, E. (2009). Influence of Levantine artificial reefs on the fish assemblage of the
surrounding seabed. Med. Mar. Sci., 10 (1), 35-54.
EEA - UNEP/MAP. (2104). Horizon 2020 Mediterranean report. Toward shared environmental
information systems. EEA-UNEP/MAP joint report. European Environment Agency Technical
report No 6/2014, 142pp.
Edgar, G. J., & Shaw, C. (1995). The production and trophic ecology of shallow-water fish asseinblages
in southern Australia. 3 General relationships between sediments, seagrasses, Invertebrates
and fishes. J Exp Mar Biol Ecol, 194, 107-131.
El Zein, G. (2008). L'expérience aquacole libanaise. Les notes d’alerte du CIHEAM N°41 – 25 janvier
2008.
Emery, K. O., & George, C. J. (1963). The Shores of Lebanon. Misc. Pap. Nat. Sci. The American
University of Beirut, 1, 1-13.

206
Erguden D., Alagöz Ergüden S., Özdemir O., Gürlek M., (2017). Length-Weight Relationship and
Condition Factor of Spotted Flounder Citharus linguatula (Linnaeus, 1758) in Iskenderun
Bay, North-eastern Mediterranean, Turkey. NESciences, 2 (1): 11-17
Erguden D., Turan C. and Gurlek M., (2009). Weight–length relationships for 20 Lessepsian fish
species caught by bottom trawl on the coast of Iskenderun Bay (NE Mediterranean Sea,
Turkey). J. Appl. Ichthyol. 25 (2009), 133–135
European Commission. (2014). Communication from the Commission to the European Parliament
and the Council concerning a consultation on fishing opportunities for 2015 under the
Common Fisheries Policy. 388pp.
European Commission, Directorate-General for Maritime Affairs and Fisheries. (2016). Proposal for a
regulation of the European Parliament and of the Council establishing a mixed fishery multi-
annual plan for demersal stocks and their fisheries in the North Sea. COMMISSION STAFF
WORKING DOCUMENT - IMPACT ASSESSMENT, 80pp.
European Environment Agency. (2015). SOER 2015 — The European environment — state and
outlook.
European Environment Agency. (2015). State of Europe’s Seas Technical report No. 2/2015. 220pp.
Fanelli, E., Azzurro, E., Bariche, M., Cartes, J. E., & Maynou, F. (2015). Depicting the novel Eastern
Mediterranean food web: a stable isotopes study following Lessepsian fish invasion. Biol
Invasions, 17, 2163.
FAO. (2011). Review of the state of world marine fishery resources. (No. 569), 334pp.
FAO. (2012). FAO workshop on international guidelines for securing sustainable small-scale fisheries.
Workshop report.
FAO. (2015). First Regional Symposium on sustainable small-scale fisheries in the Mediterranean and
Black Sea, 27–30 November 2013, Saint Julian’s, Malta. FAO Fisheries and Aquaculture
Proceedings No. 39, 519pp.
FAO. (2016). The State of World Fisheries and Aquaculture 2016. Contributing to food security and
nutrition for all. 200 pp.
FAO. (2017). Lebanon at a glance. http://www.fao.org/lebanon/fao-in-lebanon/lebanon-at-a-
glance/en/. Retrieved May 19, 2017
FAO EastMed. (2014). Report of the 5th Meeting of the EastMed Co-ordination Committee.
GCP/INT/041/EC – GRE – ITA/TD-21.
FAO EastMed. (2016). A Sub-regional Analysis of the Socio-Economic situation of the Eastern
Mediterranean Fisheries. (D. Pinello , & Dimech M., Eds.) GCP/INT/250/EC-IT/TD-22.
Faour, G., Shaban, A., & Jaquet, J. M. (2004). Apport de la bande infrarouge thermique du capteur
etm+ de Landsat-7 dans la détection de la pollution de l’eau de mer sur le littoral libanais.
Télédétection, 4(2), 197–209.
Farrugio, H., & Le Corre, G. (1993). A sampling strategy and methodology for assessment and
monitoring of Mediterranean small-scale fisheries. Sci.Mar., 57, 131–137.

207
Féral, F. (2004). Maritime societies, fisheries law and institutions in the western Mediterranean. A
summary of collective rights and decentralized systems of professional discipline. FAO
Fisheries Technical Paper. No. 420, 54pp.
Filiz, H. and Bilge G., 2004. Length-weight relationships of 24 fish species from the North Aegean Sea,
Turkey. J. Appl. Ichthyol. 20: 431-432.
Filiz, H., Bilge G., Irmak E., Togulga M., Uckun D. and Akalin S., 2006. Age and growth of the
hollowsnout granadier, Caelorinchus caelorhincus (Risso, 1810), in the Aegean Sea. J. Appl.
Ichthyol. 22: 285-287.
Fiona, R. G., & Mark, W. W. (2002). Diversity of fishes in Seagrass Beds in the Quirimba Archipelago,
Northern Mozambique. Marine & Freshwater Research, 53, 115-121.
Fischer, W., Bauchot, M. L., & Schneider, M. (1987). Fiches FAO d’identification des espèces pour les
besoins de la pêche. Méditerranée et mer Noire. Zone de pêche 37. Volume I et II.
Publication préparée par la FAO, résultat d’un accord entre la FAO et la Commission des
Communautés Européennes (Projet GCP/INT/422/EEC) financée conjointement par ces deux
organisations, 1530 pp.
Fischer, W., Sousa, I., Silva, C., de Freitas, A., Poutiers, J. M., Schneider, W., Borges, T. C., Féral, J. P.,
Massinga, A. (1990). Fichas FAO de identificaçao de espécies para actividades de pesca. Guia
de campo das espécies comerciais marinhas e de águas salobras de Moçambique. Publicaçao
preparada em collaboraçao com o Instituto de Investigaçao Pesquiera de Moçambique, com
financiamento do Projecto PNUD/FAO MOZ/86/030 e de NORAD, 424 pp.
Fonteneau, A., Gaertner, D., & Nordstrom, V. (1999). An overview of problems in the catch per unit
of effort and abundance relationship for the tropical purse seine fisheries. Col.Vol.Sci.Pap.
ICCAT, 49(3), 259-276.
Forcada, A., Valle, C., Sánchez-Lizaso, J. L., Bayle-Sempere, J. T., & Corsi, F. (2010). Structure and
spatio-temporal dynamics of artisanal fisheries around a Mediterranean marine protected
area. ICES J. Mar. Sci., 67, 191-203.
Fox, H. M. (1924). The migration of a Red Sea crab through the Suez Canal. Nature, 93:714.
Froese, R. (2006). Cube law, condition factor and weight-length relationships: history, meta-analysis
and recommendations. J Appl Ichthyol, 22, 241–253.
Froese, R. and Pauly D. Editors. 2017. FishBase. World Wide Web electronic publication.
www.fishbase.org, version (02/2017).
Froese R., Thorson J. T., Reyes R. B., (2014). A Bayesian approach for estimating length-weight
relationships in fshes. Journal of Applied Ichthyology, 30 (1), 78-85
Froese R.; Tsikliras A. C., Stergiou K. I., (2011): Editorial note on weight-length relations of fishes. Acta
Ichthyol. Piscatoria 41, 261–263.
Fujita, T., Inada, T., & Ishito, Y. (1995). Depth-gradient structure of the demersal fish community on
the continental shelf and upper slope off Sendai Bay, Japan. Mar. Ecol. Prog. Ser., 118, 13-23.
Fulton, T. W. (1904). The rate of growth of fishes. Annual Report of the Fishery Board of Scotland, 22,
141-241.
208
Gaard, E., Gislason, A., Falkenhaug, T., Søiland, H., Musaeva, E., Vereshchaka, A., & Vinogradov, G.
(2008). Horizontal and vertical copepod distribution and abundance on the Mid-Atlantic
Ridge in June 2004. Deep-Sea Research II, 55, 59-71.
Gaertner, J. C., Bertrand, J. A., de Sola, L. G., Durbec, J. P., Ferrandis, E., & Souplet, A. (2005). Large
spatial scale variation of demersal fish assemblage structure on the continental shelf of the
NW Mediterranean Sea. Mar Ecol Prog Ser, 297, 245–257.
Gaertner, J., Bertrand, J., Relini, G., Papaconstantinou, C., Mazouni, N., de Sola, L., & et al. (2007).
Spatial pattern in species richness of demersal fish assemblages on the continental shelf of
the northern Mediterranean Sea: a multiscale analysis. Mar Ecol Prog Ser., 341, 191–203.
Gaertner, J. C., Maiorano, P., Mérigot, B., Colloca, F., Politou, C. Y., Gil De Sola, L., & et al. (2013).
Large-scale diversity of slope fishes: pattern in consistency between multiple diversity
indices. PLoSOne, 8. doi:https://doi.org/10. 1371/journal.pone.0066753.
Galarzaa, J. A., Carreras-Carbonell, J., Macpherson, E., Pascual, M., Roques, S., Turner, G. F., & Rico, C.
(2009). The influence of oceanographic fronts and early-life-history traits on connectivity
among littoral fish species. PNAS, 106 (5), 1473-1478.
Galil, B. S. (2000). A sea under siege – alien species in the Mediterranean. Biol Invas, 2, 77–186.
Galil, B. S. (2007). Loss or gain? Invasive aliens and biodiversity in the Mediterranean Sea. Mar Pollut
Bull, 55 (7–9), 314–322.
Galil, B. S. (2007). Seeing red: alien species along the Mediterranean coast of Israel. Aquatic
Invasions, 2, 281–312.
Galil, B. S. (2009). Taking stock: inventory of alien species in the Mediterranean Sea. Biol Invasions,
11 (2), 359–372.
Galil, B., Froglia, C., & Noel, P. (2002). CIESM Atlas of Exotic Species in the Mediterranean. Vol. 2.
Crustaceans: decapods and stomatopods. (F. Briand, Ed.) 192pp.
Galil, B. S., Marchini, A., & Occhipinti-Ambrogi, A. (2016). East is east and West is west? Management
of marine bioinvasions in the Mediterranean Sea. Estuarine, Coastal and Shelf Science.
doi:doi: 10.1016/j.ecss.2015.12.021.
Galil, B., Marchini, A., Occhipinti-Ambrogi, A., & Ojaveer, H. (2017). The enlargement of the Suez
Canal—Erythraean introductions and management challenges. Management of Biological
Invasions, 8.
Galil, B. S., Spanier, E., & Ferguson, W. W. (1990). The scyphomedusae of the Mediterranean coast of
Israel, including two Lessepsian migrants new to the Mediterranean. Zoologische
Mededelingen (Leiden), 64, 95–105.
Galil, B., & Zenetos, A. (2002). A sea change – exotics in the eastern Mediterranean. In: Leppäkoski E,
Olenin S, Gollasch S (eds) Invasive aquatic species of Europe : distributions, impacts and
management., 325–336.
Galil, B., Froglia, C., & Noël, P. (2002). CIESM Atlas of Exotic Species in the Mediterranean - Vol. 2.
Crustaceans decapods and stomatopods. CIESM Publications, 192 pp.

209
Galil, B., Marchini, A., Occhipinti-Ambrogi, A., & Ojaveer, H. (2017). The enlargement of the Suez
Canal—Erythraean introductions and management challenges. Management of Biological
Invasions, 8.
Gardner, M. G., & Ward, R. D. (2002). Taxonomic affinities within Australian and New Zealand
Mustelus sharks (Chondrichthyes: Triaakidae) inferred from allozymes, mitochondrial DNA
and precaudal vertebrae counts. Copeia, 2, 356–363.
George, C. J., Athanassiou, V. A., & Boulos, I. (1964). The fishes of the coastal waters of Lebanon.
Publication of The Faculty of Arts and Sciences. Miscellaneous Papers in the Natural Sciences,
4. American University of Beirut, 27 pp.
GFCM. (2014). Strategic Roadmap in support of Fisheries & Aquaculture in Lebanon. 33 pp.
GFCM & FAO. (2016). The State of Mediterranean and Black Sea Fisheries 2016. @FAO, 152pp.
GFCM. (2011). Report of the SCSA Working Group on stock Assessment of demersal species (Istanbul,
Turkey, 18–23 October 2010). GFCM: SAC13/2011/Inf.19.
GFCM. (2016). GFCM Data Collection Reference Framework (DCRF). Version: 2016.2.
GFCM. (2017). Report of the nineteenth session of the SCIENTIFIC ADVISORY COMMITTEE ON
FISHERIES. Ljubljana, Slovenia, 16–19 May 2017. FAO Fisheries and Aquaculture Report
No.1209, 174 pp.
Giorgi, F. (2006). 'Climate change hot-spots'. Geophysical Research Letters, 33(8), L08707.
Goedicke, T. R. (1972). Submarine canyons on the central continental shelf of Lebanon. The
Mediterranean Sea : A Natural Sedimentation Laboratory. (D. J. Stanley, Ed.) 800 pp.
Golani, D. (1981). The biology of Adioryx ruber (Forssk31, 1775) in the Mediterranean and
morphological and meristic comparison of the Mediterranean and the Red Sea populations.
M.Sc. Thesis, The Hebrew University of Jerusalem, 62 pp.
Golani, D. (1996). The marine ichthyofauna of the eastern Levantin-history, inventory, and
characterization. Journal of Zoology, 42, 15-55.
Golani, D. (1998). Impact of Red Sea fish migrants through the Suez Canal on the aquatic
environment of the eastern Mediterranean. Bulletin of Yale School of Forestry and
Environmental Studies, 103, 375-387.
Golani, D. (2010). Colonization of the Mediterranean by red sea fishes via the Suez Canal—Lessepsian
migration in Fish Invasions of the Mediterranean Sea: changes and renewal. In: Golani D,
Appelbaum-Golani B (eds) Fish invasions of the Mediterranean Sea: change and renewal,
145-188.
Golani, D., & Darom, D. (1999). Handbook of the Fishes of Israel. Keter Publishing House Ltd,
Jerusalem, Israel, 269 pp.
Golani, D., Ben-Tuvia, A., & Galil, B. (1983). Feeding habits of the Suez Canal migrant squirrelfish,
Sargocentron rubrum, in the Mediterranean Sea. Israel Journal of Zoology, 32, 194-204.
Golani, D., & Ben-Tuvia, A. (1985). The biology of the Indo-Pacific squirrelfish, Sargocentron rubrum
(Forsskål), a Suez Canal migrant to the eastern Mediterranean. J. Fish. Biol., 27, 249-258.

210
Golani, D., & Ben-Tuvia, A. (1995). Lessepsian migration and the Mediterranean fisheries of Israel. In:
Armantrout NB (ed) Conditions of the world’s aquatic habits. Proceedings of the World
Fishery Congress Theme 1, 279–289.
Golani, D., Orsi-Relini, L., Massuti, E., & Quignard, J. P. (2002). CIESM Atlas of Exotic Species in the
Mediterranean. Vol.1. Fishes. (F. Briand, Ed.) 254 pp.
Gollasch, S., Galil, B. S., & Cohen, A. N. (2006). Bridging divides: maritime canals as invasion corridors.
Springer, Dordrecht.
Goncalves J.M.S., Bentes L., Lino P.G., Ribeiro J., Canario A.V.M., Erzini K., (1997). Weight–length
relationships for selected fish species of the small-scale demersal fisheries of the south and
south-west coast of Portugal. Fish. Res. 30, 253–256.
Gönülal, O., Özcan, T., & Katagan, T. (2010). A contribution on the distribution of the giant red shrimp
A. foliacea (Risso, 1827) along the Aegean sea and Mediterranean part of Turkey. Rapp.
Comm. int. Mer Médit., 39, 534.
Gordon, J. D., Merrett, N. R., & Haedrich, R. L. (1995). Environmental and biological aspects of slope
dwelling fishes of the North Atlantic. In: Deep Water Fisheries of the North Atlantic Oceanic
Slope (Ed. A.G. Hopper), Kluwer Academic Publishers, 1–26.
Gore, R. H. (1986). Crustacean Biogeography. In: Crustacean Issues, 4, 316 pp.
Goren, M., & Galil, B. S. (2005). A review of changes in the fish assemblages of Levantine Inland and
marine ecosystems following the introduction of non-native fishes. J Appl Ichthyol, 21, 364–
370.
Government of Lebanon & United Nations. (2017). Lebanon crisis response plan. 2017- 2020. 184 pp.
Granger, V., Fromentin, J. M., Bez, N., Relini, G., Meynard , C., Gaertner, J. C., & et al. (2014). Large-
scale spatio-temporal monitoring highlights hotspots of demersal fish diversity in the
Mediterranean Sea. Prog Oceanogr., 5(130), 65–74.
Grati, F., Bolognini, L., Domenichetti, F., Fabi, G., Polidori, P., Santelli, A., ... Spagnolo, A. (2015). The
effect of monofilament thickness on the catches of gillnets for common sole in the
Mediterranean small-scale fishery. Fisheries Research, 164, 170–177.
Gray, C. A., Broadhurst, M. K., Johnson, D. D., & Young, D. J. (2005). Influence of hanging ratio, fishing
height, twine diameter and material of bottom-set gillnets on catches of dusky flathead
Platycephalus fuscus and non-target species in New South Wales, Australia. Fish. Sci., 71,
1217–1228.
Greenpeace. (2010). A Network of Marine Reserves in the Coastal Waters of Lebanon. (M. Barriche,
Ed.) 64 pp.
Greenstreet, S. P., & Hall, S. J. (1996). Fishing and the ground-fish assemblage structure in the North-
western North Sea: an analysis of long-term and spatial trends. Journal of Animal Ecology, 65,
577–598.
Gulland, J. A. (1969). Manual of methods for fish stock assessment. FAO Fisheries Technical Papers.
Gulland, J. A., & Garcia, S. (1984). Observed patterns in multispecies fisheries. In Exploitation of
Marine Communities, 155-190.

211
Gündoğdu S., Baylan M. and Çevik C., (2016). Comparative Study of the Length-Weight Relationships
of Some Fish Species along the Turkish Coasts. Medit. Mar. Sci., 17/1, 80-108.
Haas, G., & Steinitz, H. (1947). Erythrean fishes on the Mediterranean coast of Palestine. Nature, 160,
28.
Hacunda, J. S. (1981 ). Trophic relationships among demersal fishes in a coastal area of the Gulf of
Maine. Fishery Bulletin 79, 775-788.
Haedrich, R. L. (1983). Estuanne fishes. In: Ketchum BH (ed) Ecosystems of the world. 26 Estuaries and
enclosed seas, 183-207.
Haedrich, R. L., & Barnes, S. M. (1997). Changes over time of the size structure in an exploited shelf
fish community. Fisheries Research, 229–239.
Hall, M. A., Alverson, D. L., & Metuzals, K. I. (2000). Bycatch: problems and solutions. Marine
Pollution Bulletin, 41, 204–219.
Hacunda, J. S. (1981). Trophic relationships among demersal fishes in a coastal area of the Gulf of
Maine. Fishery Bulletin, 79, 775-788.
Halpern, B. S., Walbridge, S., Selkoe, K. A., Kappel, C. V., Micheli, F., & et al. (2008). A global map of
human impact on marine ecosystems. Science, 319, 948–952.
Hamadeh, S., Khouzami, M., & Tohmé, G. (1996). Biological diversity of Lebanon. Comprehensive
report. Ministry of Agriculture, United Nations Environment Programme (UNEP), Beirut
(Lebanon) 255 pp.
Hamzé, M., Khalaf, G., Fakhri, M., Sursock, A., & Lelli, S. (2014). Research Vessel CANA-CNRS. Five
years of research activities in the Eastern Mediterranean Sea. In: The Mediterranean Sea.
Fisheries and Beyond. Watch Letter n°31, 20-26. CIHEAM.
Harmelin-Vivien, M. L., Bitar, G., Harmelin, J. G., & Monestiez, P. (2005). The littoral fish community
of the Lebanese rocky coast (eastern Mediterranean Sea) with emphasis on Red Sea
immigrants. Biological Invasions, 7, 625–637.
Heessen, H. J. (1996). Time-series data for a selection of forty fish species caught during the
International Bottom Trawl Survey. ICES Journal of Marine Science, 53, 1079-1084.
Heessen, H. J., & Daan, N. (1996). Long-term trends in ten non-target North Sea fish species. ICES
Journal of Marine Science, 53, 1063-1078.
Heist, E. J., Graves, J. E., & Musick, J. A. (1995). Population genetics of the sandbar shark (Carcharinus
plumbeus) in the Gulf of Mexico and Mid-Atlantic Bight. Copeia, 555–562.
Herodotus. (5th Century BC). Histories, Book II.
Hsü, K. J., Montadert, L., Bernoulli, D., Bianca, M., Erickson, A., Garrison, R. E., & et al. (1977). History
of the Mediterranean salinity crisis. Nature, 267, 399–403.
Hutchings, J. A., & Reynolds, J. D. (2004). Marine Fish Population Collapses: Consequences for
Recovery and Extinction Risk. BioScience, 54 (4), 297-309.
Hynes, H. N. (1950). The food of freshwater sticklebacks (Gasterosteus aculeatus and Pygosteus
pungitius) with a review of methods used in studies of the food of fishes. Journal of Animal
Ecology, 19, 36-58.

212
Hyslop, E. J. (1980). Stomach contents analysis--a review of methods and their application. Journal of
Fish Biology, 17, 411-429.
IPCC. (2013). Climate Change 2013: The Physical Science Basis. Contribution of Working Group I to
the Fifth Assessment Report of the Intergovernmental Panel on Climate Change. (D. Q.-K.
edited by T.F. Stocker, A cura di)
IUCN. (2017). The IUCN Red List of Threatened Species. ([. 2. http://www.iucnredlist.org, A cura di)
Jacquet, J., & Pauly, D. (2008). Funding priorities: big barriers to small-scale fisheries. Conservation
Biology, 22, 832-835.
Jenkins, G. P., & Sutherland, C. R. (1997). The influence of habitat structure on nearshore fish
assemblages in a southern Australian embayment: colonisation and turnover rate of fishes
associated with artificial macrophyte beds of varying physical structure. J Exp Mar Biol Ecol,
218, 103-125.
Jin-Xian, L., Tian-Xiang, G., Shi-Fang, W., & Ya-Ping, Z. (2007). Pleistocene isolation in the
Northwestern Pacific marginal seas and limited dispersal in a marine fish, Chelon
haematocheilus (Temminck and Schlegel, 1845). Mol Ecol, 16 (2), 275-288.
Jones, J. B. (1992). Environmental impact of trawling on the seabed: a review. New Zealand Journal of
Marine and Freshwater Research, 26, 59-67.
JRC - Institute for the Protection and Security of the Citizen (IPSC) (2017). Tide chart: 100094 -
TAD_IDSL-21 Batroun. http://webcritech.jrc.ec.europa.eu/SeaLevelsDb/Home/TideChartPro/
/100094. Retrieved on October 12th 2017.
Jribi, I., & Bradai, M. N. (2012). First record of the Lessepsian migrant species Lagocephalus sceleratus
(Gmelin, 1789) (Actyinopterygii: Tetraodontidae) in the central Mediterranean. Bioinvasions
Records, 1, 49-52.
Karlsen, L., & Bjarnason, B. A. (1986). Small-scale fishing with driftnets. FAO Fish Technical Paper No.
284, 64 pp.
Kelleher, K. (2005). Discards in the world’s marine fisheries. An update. FAO Fisheries Technical Paper
No 470, 131.
Kennish, M. J. (1990). Ecology of estuaries, Vol 2. Biological aspects. CRC Press, Boca Raton.
Khalaf , G., Fakhri, M., Abi-Ghanem, C., Abboud Abi-Saab, M., & Mina, R. (2009). Impact of the
anthropogenic activities on the deterioration of the coastal ecosystem of Beirut city. Impact
of large coastal Mediterranean cities on marine ecosystems – Alexandria, Egypt 10-12
February 2009, 1-6.
Khalaf G., Saad A., Jemaa S., Sabour W., Lteif M. and Lelli S., (2014). Population Structure and Sexual
Maturity of the Pufferfish Lagocephalus sceleratus (Osteichthyes, Tetraodontidae) in the
Lebanese and Syrian Marine Waters (Eastern Mediterranean). Journal of Earth Science and
Engineering 4, 236-244.
Koslow, J. A. (1993). Community structure in North Atlantic deep-sea fishes. Prog. Oceanogr., 31,
321–338.
Lakkis, S., & Zeidane, R. (1991). Jellyfish swarm along the Lebanese coast. (Abstract). Lebanese
Association for Advancement of Sclence 11th Science Meeting, American University of Beirut.

213
Lande, R. (1996). Statistics and partitioning of species diversity, and similarity among multiple
communities. Oikos, 76, 5-13.
Larkin, P. A. (1979). Predator-prey relations in fishes: An overview of the theory. In Predator-prey
systems in fisheries management.
Laskaridis, K. (1948). Holocentrum rubrum (Forsk) and Lagocephalus lagocephalus (L) two newly
reported members of the Greek fishfauna (Dodecanesian islands). Praktika Hellen. Hydrobiol.
Inst., 2(1), 127-129.
Le Borgne, E., & Jacobs, T. (2016). Lebanon - Promoting Poverty Reduction and Shared Prosperity.
141 pp.
Lebanese Ministry of Environment / IUCN. (2012). Lebanon’s Marine Protected Area Strategy:
Supporting the management of important marine habitats and species in Lebanon. 64 pp.
Le Cren, E. D. (1951). The length-weight relationship and seasonal cycle in gonad weight and
condition in the perch (Perca flavescens). Journal of Animal Ecology, 20, 201–219.
Lelli, S. (2007). Evaluation and development of two fishing métiers within the Tyre fishery sector:
report on field survey carried out in June and July 2006. In: TYRE, reports on the fishing sector
(2005-2007), 9-44.
Lelli, S. (2014). First information on abundance, biology and distribution of the red giant shrimp
(Aristaeomorpha foliacea) in Lebanese waters. 20th LAAS International Science Conference.
Lelli, S., Carpentieri, P., Colloca, F., & Moubayed, S. (2007). Commercial landing and fishing metiers
within the artisanal fishery of Tyre, Lebanon. in Socio-economic development of the Fishing
Community of Tyre, Lebanon. In: TYRE, report on the fishing sector (2005-2007), 63-73.
Livingston, R. J., Kobylinski, G. J., Lewis, F. I., & Sheridan, P. F. (1976). Long-term fluctuations of
epibenthic fish and invertebrate populations in Apalachicola Bay, Florida. Fish Bull, 74 (2),
311-321.
Lleonart, J., & Maynou, F. (2003). Fish stock assessment in the Mediterranean: state of the art. Sci.
Mar., 67 (Suppl. 1), S37-S49.
Loefer, J. K., & Sedberry, G. R. (2003). Life history of the Atlantic sharpnose shark (Rhizoprionodon
terraenovae)(Richardson, 1836) off the southeastern United States. Fishery Bulletin, 101, 75-
88.
Lteif M., 2015. Biology, distribution and diversity of cartilaginous fish species along the Lebanese
coast, eastern Mediterranean. Ecology, environment. PhD dissertation, Université de
Perpignan. English. 310 p.
Lteif M., Mouawad R., Jemaa S., Khalaf G., Lenfant P., M. Verdoit-Jarraya, 2016. The length-weight
relationships of three sharks and five batoids in the Lebanese marine waters, eastern
Mediterranean. The Egyptian Journal of Aquatic Research. 42 (4), 475–477.
Lteif, M., Mouawad, R., Khalaf, G., Lenfant, P., Seret, B., & Verdoit-Jarraya, M. (2017). Population
biology of the little gulper shark Centrophorus uyato in Lebanese waters. J Fish Biol, Version
of Record online: 4 OCT 2017. doi:http://dx.doi.org/10.1111/jfb.13484.

214
Lteif M., Mouawad R., Khalaf G., Lenfant P., Verdoit-Jarraya M., 2016. Population biology of an
Endangered species: the Common Guitarfish Rhinobatos rhinobatos L. 1758 in the Lebanese
marine waters, eastern Mediterranean. Journal of Fish Biology 88, 1441–1459.
doi:10.1111/jfb.12921.
MacCall, A. D. (1990). Dynamic Geography of Marine Fish Populations. Washington University of
Washington Press.
Magnussen, E. (2002). Demersal fish assemblages of Faroe Bank: species composition, distribution,
biomass spectrum and diversity. Mar Ecol Prog Ser, 238, 211–225.
Magurran, A. E. (2004). Measuring Biological Diversity. Journal of Vegetation Science, 15 (6), 854-856.
Mahon, S., & Smith, R. W. (1989). Demersal fish assemblages on the Scotian shelf, northwest
Atlantic: spatial distribution and persistence. Can J Aquat Fish Sci, 46, 134–152.
Majdalani, S. (2004). The present status of fishery and information system in Lebanon.
GCP/INT/918/EC - TCP/INT/2904/TD-4.1. MedFisis Technical Document No. 4.1, 45pp.
Majdalani, S. (2005). Census of Lebanese Fishing Vessels and Fishing Facilities. Lebanese Republic
Ministry of Agriculture, Directorate of Rural Development & Natural Resources, Department
of Fisheries & Wildlife, 144p.
Majdalani, S. (2013). FAO FISHERY AND AQUACULTURE COUNTRY PROFILE.
Mamish, S., Durgham, H., & Said Al-Masri, M. (2012). First record of Aequorea globosa Eschscholtz,
1829 (Cnidaria:Hydrozoa) in the coast of Syria. Mediterranean Marine Science, 13 (2), 259-
261.
Maravelias, C. D., Tsitsika, E. V., & Papakonstantinou, C. (2007). Environmental influences on the
spatial distribution of European hake (Merluccius merluccius) and red mullet (Mullus
barbatus) in the Mediterranean. Ecological Research, 22, 678-685.
Margalef, R. (1985). Introduction to the Mediterranean. . In: R. Margalef, ed. Western. Series Key
Environments. Pergamon Press. 363 pp., 1–16 .
Matthey , I. K., & Reynold, W. W. (1979). Food habits of squirrelfish, Adioryx suborbitalis, in the Gulf
of California. Calif. Fish Game, 55, 62-64.
Mavruk, S., & Avsar, D. (2008). Non-native fishes in the Mediterranean from the Red Sea by way of
the Suez Canal. Rev. Fish Biol. Fisheries, 18, 251–262.
Maynou, F., Morales-Nin, B., & Cabellanas-Reboredo, M. (2013). Small-scale fishery in the Balearic
Islands (W Mediterranean): A socio-economic approach. Fisheries Research, 139, 11-17.
Maynou, F., Recasens, L., & Lombarte, A. (2011). Fishing tactics dynamics of a Mediterranean small-
scale coastal fishery. Aquat.LivingResour., 24, 149.
McClatchie, S., Millar, R. B., Webster, F., Lester, P. J., Hurst, R., & Bagley, N. (1997). Demersal fish
community diversity off New Zealand: Is it related to depth, latitude and regional surface
phytoplankton? Deep Sea Research Part I: Oceanographic Research Papers, 44, 4, 647-667.
MEDITS Working Group. (2013). MEDITS Handbook, 2013. International bottom trawl survey in the
Mediterranean. Medits Instructions Manual, Version n. 7. 120 pp.

215
Meléndez, M. J., Báez, J. C., Serna-Quintero, J. M., Camiñas, J. A., Fernández , I. d., Real, R., & et al.
(2017). Historical and ecological drivers of the spatial pattern of Chondrichthyes species
richness in the Mediterranean Sea. PLoS ONE, 12(4), e0175699.
Merrett, N. R., & Haedrich, R. L. (1997). Deep-Sea Demersal Fish and Fisheries. Chapman & Hall, 282
pp.
Micheli, F., Halpern, B. S., Walbridge, S., Ciriaco, S., Ferretti, F., Fraschetti, S., R. Lewison, L. Nykjaer,
Rosenberg, A. A. (2013). Cumulative human impacts on Mediterranean and Black Sea marine
ecosystems: assessing current pressures and opportunities. PLoS ONE, 8, e79889.
MOE & UNDP. (2010). Vulnerability and adaptation of coastal zones in Climate risks, vulnerability &
adaptation assessment (final report), 33 pp.
MOE Ministry of Environment. (2017). Protected Areas in Lebanon-Palm Islands Nature Reserve.
http://www.moe.gov.lb/ProtectedAreas/palmislands.htm. Retrieved May 19, 2017.
MoE/ECODIT. (2010). Lebanon state of the environment report, 241pp.
MoE/UNDP/ECODIT. (2011). State and Trends of the Lebanese Environment, 350pp.
Mooney, H. A., & Cleland, E. E. (2001). The evolutionary impact of invasive species. Proceedings of
the National Academy of Sciences of the United States of America, 98, 5446–5451.
Mooney, H. A., Mack, R. N., McNeeley, J. A., Neville, L. E., Schei, P. J., & Waage, J. K. (2005). Invasive
alien species. A new synthesis.
Morato T., Afonso P., Lourinho P., Barreiros J.P., (2001). Length–weight relationships for 21 coastal
fish species of the Azores, north-eastern Atlantic. Fisheries Research 50, 297–302.
Morfin, M., Bez, N., and Fromentin, J. M., (2016). Habitats of ten demersal species in the Gulf of Lions
and potential implications for spatial management. Mar Ecol Prog Ser. 547: 219–232.
Morfin, M., 2013. Dynamiques spatio-temporelles d’espèces démersales clés du golfe du Lion :
bénéfices potentiels d’aires marines protégées. Thèse de doctorat en Ecosystèmes et
sciences agronomiques, Université Montpellier 2.
Mouneimné, N. (1978). Poissons des côtes du Liban (Méditerranée Orientale), biologie et pêche.
These de Doctorat d’Etat ès-SciencesNaturelles, Université Pierre et Marie Curie, Paris VI.
Muddula Krishna, N., Govindarao, V., & Venu, D. (2015). Length –Weight relationships for some rock
pool fishes off Visakhapatnam, East Coast of India. International Journal of Fisheries and
Aquatic Studies, 2 (3), 139-140.
Mura, M., & Cau, A. (1994). Community structure of the decapod crustaceans in the middle bathyal
zone of the Sardinian Channel. Crustaceana, a7, 3, 259—266.
Myers, N., Mittermeier, R. A., Mittermeie, C., da Fonseca, G. A., & Kent, J. (2000). Biodiversity
hotspots for conservation priorities. Nature, 403, 853-858.
Myers, R., & Stokes, K. (1989). Density-dependent habitat utilisation of groundfish and the
improvement of research surveys, 1989 International Council for the Exploration of the Sea.
ICES Meeting, D:15.

216
Nader, M. R., El Indary, S., & Stamatopoulos, C. (2012). Assessment of the commercial fish species of
the coast of North Lebanon 2006-2011. INOC-CNRS“, International Conference on "Land-Sea
Interactions in the Coastal Zone". Jounieh - LEBANON, 06-08 November 2012, 478-484.
Nader, R. M., El Indary, S., & Roshan Moniri, N. (2014). Historical fisheries catch reconstruction for
Lebanon (GSA 27), 1950-2010. Fisheries Centre, University of British Columbia, Vancouver,
B.C. Canada, (11).
Nader, M., Indary, S., & Boustany, L. (2012). The Puffer Fish Lagocephalus sceleratus (Gmelin, 1789)
in the Eastern Mediterranean. FAO EastMed report, GCP/INT/041/EC- GRE-ITA/TD-10.
Nader, M. R., El Indary, S., & Stamatopoulos, C. (2012). Assessment of the commercial fish species of
the coast of North Lebanon 2006-2011. INOC-CNRS“, International Conference on "Land-Sea
Interactions in the Coastal Zone". Jounieh - LEBANON, 06-08 November 2012, 478-484.
Nentwig, W. (2007). Biological invasions. Ecological studies, Springer, 193 pp.
Newsome, S. D., Martìnez del Rio, C., Bearhop, S., & Phillips, D. L. (2007). A niche for isotopic ecology.
Front Ecol Environ, 5, 429–436.
Newsome, S. D., Yeakel, J. D., Wheatley, P. V., & Tinker, M. T. (2012). Tools for quantifying isotopic
niche space and dietary variation at the individual and population level. J Mammal, 93, 329–
341.
Notarbartolo di Sciara, G., & Agardy, T. (2009). Draft interim report to the RAC/SPA: Identification of
potential SPAMIs in Mediterranean Areas Beyond National Jurisdiction. (H. S. Contract no
01/2008-RAC/SPA, A cura di).
Opdal, A. F., Godø, O. R., Bergstad, O. A., & Fiksen, Ø. (2008). Distribution, identity, and possible
processes sustaining meso- and bathypelagic scattering layers on the northern Mid-Atlantic
Ridge. Deep-Sea Research II, 55, 45-58.
Osio, G. C. (2012). The historical fisheries in the Mediterranean Sea: a reconstruction of trawl gear
Effort and Trends in Demersal Fish Stocks. University of New Hampshire, New Hampshire
(PhD dissertation).
Osio, G. C., Orio, A., & Millar, C. P. (2015). Assessing the vulnerability of Mediterranean demersal
stocks and predicting exploitation status of un-assessed stocks In Development, testing, and
evaluation of data-poor assessment and fisheries management methods. Fish. Res., 171, 110-
121.
Ozturk, B. (2011). Draft Document on the Alien Species in the Mediterranean and the Black Sea.
General Fisheries Comission for the Mediterranean, Scientific Advisory Committee GFCM-SAC
12.
Özvarol Y., (2014). Length-weight relationships of 14 fish species from the Gulf of Antalya
northeastern Mediterranean Sea, Turkey. Turkish Journal of Zoology, 38 (3), 342-346.
Özvarol, Y., & Tatlises, A. (2017). Some biological aspects of Lessepsian Sargocentron rubrum
(Forsskål, 1775) in the north Cyprus, Mediterranean Sea. Scientific Papers. Series D. Animal
Science, 60, 359-361.
Panfili, Pontual H. (de)., Troadec H., Wright P.J. (eds) (2002). Manual of fish sclerochronology. Brest,
France : Ifremer-lRD coedition, 464 pp.

217
Papaconstantinou, C., & Kapiris, K. (2003). The biology of the giant red shrimp (Aristaeomorpha
foliacea) at an unexploited fishing ground in the Greek Ionian Sea. Fisheries Research, 62, 37–
51.
Parravicini, V, Azzurro, E, Kulbicki, M, Belmaker, J, (2015). Niche shift can impair the ability to predict
invasion risk in the marine realm: an illustration using Mediterranean fish invaders. Ecology
Letters 18, 246-253.
Pauly, D. (1979). Theory and management of tropical multispecies stocks: a review, with emphasis on
the Southeast Asian demersal fisheries. ICLARM Studies and Reviews. International Center for
Living Aquatic Resources Management, 1, 35 pp.
Pauly D., (1993). Fishbyte section editorial. Naga, The ICLARM Quarterly, 16, 26.
Pauly, D., Christensen, V., Guenette, S., Pitcher, T. J., Sumaila, U. R., Walters, C. J., . . . Zeller, D.
(2002). Towards sustainability in world fisheries. Nature, 418, 689–695.
Peillen, I., Normand, D., Bousader, M., Zakhia, C., & Khater, C. (2012). Définition du statut, du rôle, de
la fonction et des mécanismes de gestion des Parcs naturels nationaux et régionaux au Liban
et rédaction du cadre réglementaire y afférent. In Projet d‘Appui au Développement Local
dans le Nord du Liban: GFA Consulting Group GmbH.
Pérès, J. M. (1985). History of the Mediterranean biota and the colonization of the depths. In:
Margalef, R. (ed.) Key environments: Western Mediterranean, 198-232.
Pérès, J. M., & Picard, J. (1964). Nouveau manuel de bionomie benthique de la Mer Méditerranée.
Rec. Trav. Ft. Mar Kndoume, 47, 138.
Peristeraki, P., Tserpes, G., Lampadariou, N., & Stergiou, K. I. (2017). Comparing demersal
megafaunal species diversity along the depth gradient within the South Aegean and Cretan
Seas (Eastern Mediterranean). PLoS ONE, 12(9), e0184241. doi:
https://doi.org/10.1371/journal.pone.0184241
PescaMed. (2011). PescaMed project Development of cooperation in the Mediterranean Fishery
sector: World of labour, Producers’ organizations, consumers’ associations and training –
Country reports. 443 pp.
Petrakis G., Stergiou K.I., (1995). Weight–length relationships for 33 fish species in Greek waters.
Fish. Res. 21, 465–469.
Pielou, E. C. (1969). An introduction to mathematical ecology. Wiley. New York. US., 286 p.
Pielou, E. C. (1975). Ecological diversity. Nueva York. Wiley Interscience. 1975. viii, 165 p.
Pikitch, E. K., Santora, C., Babcock, E. A., Bakun, A., Bonfil, R., Conover, D. O., Dayton P, Doukakis P,
Fluharty D, Heneman B, Houde ED, Link J, Livingston PA, Mangel M, McAllister MK, Pope J,
Sainsbury KJ. (2004). Ecology. Ecosystem-based fishery management. Science, 305(5682),
346-7.
Pinello, D., & Dimech, M. (2013). Socio-Economic Analysis of the Lebanese Fishing Fleet.
GCP/INT/041/EC – GRE – ITA/TD-16.
Pinkas, L., Oliphant, M. S., & Iverson, I. K. (1971). Food habits of albacore, bluefin tuna, and bonito in
Californian waters. Fishery Bulletin, 152, 1-105.

218
Plan Bleu and UNEP. (2000). Policy and institutional assessment of solid waste management in
Lebanon. (N. El Jor, Ed.).
Por, F. D. (1971). One hundred years of Suez Canal: a century of Lessepsian migration—retrospect
and viewpoints. Syst Zool, 20, 138–159.
Por, F. D. (1978). Lessepsian migration: the influx of Red Sea biota into the Mediterranean by way of
the Suez Canal. Ecological Studies, 23, Springer-Verlag Berlin Heidelberg, 228 pp.
Por, F. D. (2010). The new Tethyan ichthyofauna of the Mediterranean—historical background and
prospect. In: Golani D, Appelbaum-Golani B (eds) Fish invasions of the Mediterranean Sea:
change and renewal, 13-33.
Por, F. D., & Dimentman, C. (2006). Mare Nostrum: Neogene and anthropic natural history of the
Mediterranean basin, with emphasis on the Levant. 349 pp.
Potter, I. C., Clandge, P. N., & Warwick, K. M. (1986). Consistency of seasonal changes in an estuarine
fish assemblage. Mar Ecol Prog Ser, 32, 217-228.
Potter, I. C., Claridge, P. N., Hyndes, G. A., & Clarke, K. R. (1997). Seasonal, annual and regional
variations in ichthyofaunal composition in the Inner Severn Estuary and Inner Bristol
Channel. J Mar Biol Assoc UK, 77, 507-525.
Poulard, J. C., & Blanchard, F. (2005). The impact of climate change on the fish community structure
of the eastern continental shelf of the Bay of Biscay. ICES J. Mar. Sci., 62, 1436–1443.
Quantum GIS Development Team. (2012). Quantum GIS Geographic Information System. Open
Source Geospatial Foundation Project.
Quignard, J. P., & Tomasini, J. A. (2000). Mediterranean fish biodiversity. Biol Mar Medit, 7, 1–66.
R Development Core Team (2014). R: A language and environment for statistical computing, 3.0.3 ed.
Vienna, Austria: R Foundation for Statistical Computing.
RAC/SPA - UNEP/MAP. (2014). Ecological characterization of sites of interest for conservation in
Lebanon: Enfeh Peninsula, Ras Chekaa cliffs, Raoucheh, Saida, Tyre and Nakoura. (A. A.
Ramos-Esplá, G. Bitar, G. Khalaf, H. El Shaer, A. Forcada, A. Limam, ... C. Valle, Eds.) 146pp +
annexes.
RAC/SPA - UNEP/MAP. (2014). Ecological characterization of sites of interest for conservation in
Lebanon: Enfeh Peninsula, Ras Chekaa cliffs, Raoucheh, Saida, Tyre and Nakoura. (A. B. By
Ramos-Esplá) 146pp + annexes.
Rago, P. J. (2005). Fishery independent sampling: survey techniques and data analyses. (J. A. Musick,
Ed.) In: Management techniques for elasmobranch fisheries. FAO Fisheries Technical Paper.
No. 474, 201-215.
Ragonese, S., Bertolino, F., & Bianchini, M. L. (1997). Biometric relationships of the red shrimp,
Aristaeomorpha foliacea Risso 1827, in the Strait of Sicily (Mediterranean Sea). Scientia
Marina, 61(3), 367-377.
Ramos Esplá, A., & Pérez, C. V. (2004). Marine biodiversity study of the Rosh Haniqra-Akhziv nature
reserves (Israel) to the establishment of a management plan. 126 pp.
Randall, J. E. (1967). Food habits of reef fishes of the West Indies. Stud. Trop. Oceanogr., 6, 665-847.

219
Randall, J. E. (1998). Revision of the Indo-Pacific squirrelfishes (Beryciformes: Holocentridae:
Holocentrinae) of the genus Sargocentron, with descriptions of four new species. Indo-Pac.
Fish., 27, 105 pp.
Randall, J. E., Williams, J. T., Smith, D. G., Kulbicki, M., Tham, G. M., Labrosse, P., Kronen, M., Clua, E.,
Mann, B. S. (2003). Checklist of the shore and epipelagic fishes of Tonga. Atoll Res. Bull. Nos.,
502, 35 pp.
Ricerca e Cooperazione NGO. (2005). Preliminary Analysis of the Fish Market and Credit Schemes in
Tyre, Lebanon. (C. L., Ed.) In: Tyre: a case Study Sociology, Technology & Economics of a
Community (2004-2005), 71-132.
Riedl, R. (1966). Biologie der Meereshöhlen: Topographie, Faunistik and Okologie eines
unterseeischen Lebensraumes. 636 pp.
Riginos, C., & Victor, B. C. (2001). Larval spatial distributions and other early life-history
characteristics predict genetic differentiation in eastern Pacific blennioid fishes. Proc. R. Soc.
Lond. B, 268, 1931-1936.
Rilov, G., & Crooks, J. A. (2009). Biological Invasions in Marine Ecosystems. Ecological, Management,
and Geographic Perspectives. Ecological Studies, 204(31), 641 pp.
Rilov, G., & Galil, B. (2009). Marine Bioinvasions in the Mediterranean Sea – History, Distribution and
Ecology. In: Biological Invasions in Marine Ecosystems. Ecological, Management, and
Geographic Perspectives. Ed. Gil Rilov and Jeffrey A. Crooks. Ecological Studies, 204(31), 549-
575.
Rocha-Olivares, A., Garber, N. M., & Stuck, K. C. (n.d.). High genetic diversity, large interoceanic
divergence and historical demography of the striped mullet. Journal of Fish Biology, 57,
1134–1149.
Rochet, M. J. (1998). Short-term effects of fishing on life history traits of fishes. ICES Journal of
Marine Science, 55, 371–391.
Rochet, M. J., Trenkel, V. M., Carpentier, A., Coppin, F., De Sola, L. G., & et al. (2010). Do changes in
environmental and fishing pressures impact marine communities? An empirical assessment.
Journal of Applied Ecology, 47, 741–750.
Rolland, J. C. (2003). Lebanon: Current Issues and Background. Nova Science Pub Inc, 235 pp.
Rose, G. A., & Kulka, D. W. (1999). Hyperaggregation of fish and fisheries: how catch-per-unit-effort
increased as the northern cod (Gadus morhua) declined. Canadian Journal of Fisheries and
Aquatic Sciences, 56(1), 118-127.
Saad, A. (2005). Check – list of Bony Fish Collected from the Coast of Syria. Turkish Journal of
Fisheries and Aquatic Sciences, 5, 99-106.
Sabrah, M., El-Ganainy, A., & Zaky, M. (2006). Biology and toxicity of the puffer fish Lagocephalus
Sceleratus from the Gulf of Suez. Egyptian Journal of Aquatic Research, 32(1), 283-297.
Sacchi, J., & Dimech, M. (2011). Report of the FAO EastMed Assessment of the Fishing Gears in
Lebanon. GCP/INT/041/EC – GRE – ITA/TD-09, 78 pp.

220
Sainsbury, K. J., Campbell, R. A., Lindholm, R., & Whitelaw, A. W. (1997). Experimental management
of an Australian multispecies fishery: examining the possibility of trawl-induced habitat
modification. In Global Trends: Fisheries Management, 107–112.
Sala, E., Kizilkaya, Z., Yildirim, D., & Ballesteros, E. (2011). Alien marine fishes deplete algal biomass in
the eastern Mediterranean. PLoS ONE, 6, e17356.
Sale, P. F., Guy, J. A., & Steel, W. J. (1994). Ecological structure of assemblages of coral reef fishes on
isolated patch reefs. Oecologia, 98, 83–99.
Samaha, C., zu Dohna, H., & Bariche, M. (2016). Analysis of Red Sea fish species’ introductions into
the Mediterranean reveals shifts in introduction patterns. Journal of Biogeography, 11 pp.
Sanders, H. L., & Hessler, R. R. (1969). Ecology of the deep-sea benthos. Science, 162, 1419-1424.
Sangun L., Akamca E., Akar M., (2007). Length–weight relationships for 39 fish species from North-
Eastern Mediterranean coasts of Turkey. Turk. J. Fish. Aquat. Sci. 7, 37–40
Santos R.S., Hawkins S., Monteiro L.R., Alves M., Isidro E.J., (1995). Case studies and reviews. Marine
research, resources and conservation in the Azores. Aquat. Conserv.: Mar. Freshwat.
Ecosyst. 5, 311–354.
Sarà, M. (1985). Ecological factors and their biogeographic consequences in the Mediterranean
ecosystem. In: Moraitous-Apostolopoulou M, Kiortsis V, editors. Mediterranean Marine
Ecosystems. New York: Plenum Press, 1–17.
SCA, Suez Canal Authority, (2015). available at: http://www.suezcanal.gov.eg/
Serena, F. (2005). Field identification guide to the sharks and rays of the Mediterranean and Black
Sea. FAO Species Identification Guide for Fishery Purposes. Rome, FAO , 97pp 11 colour
plates + egg cases.
Sharp, G., & Csirke, J. (1984). Proceedings of the Expert Consultation to examine changes in
abundance and species composition of neritic fish resources. FAO Fisheries Report 291, 2,
553 pp.
Simpson, E. H. (1949). Measurement of diversity. Nature, 163, 688.
Sparre, P., & Venema, S. C. (1992). Introduction to tropical fish stock assessment. FAO Fish. Tech.
Pap. No. 306/1, Rev. 2, 407 pp.
Stearns, S. C. (1992). The Evolution of Life Histories. Oxford University Press, 262 pp.
Stefanescu, C., Morales-Nin, B., & Massutì, E. (1994). Fish assemblages on the slope in the Catalan
Sea (Western Mediterranean): influence of a submarine canyon. J. mar. biol. Ass. U.K., 74,
499—512.
Steinitz, H. (1970). A critical list of immigrants via the Suez Canal. Biota of the Red Sea and Eastern
Mediterranean, 59–63.
Steinitz W., 1927. Beiträge zur Kenntnis der Küstenfauna Palästinas. I. Pubblicazioni della Stazione
Zoologica di Napoli, 8(3-4): 311-353

221
Stevens, J. D., Bonfil, R., Dulvy, N. K., & Walker, P. A. (2000). The effects of fishing on sharks, rays, and
chimaeras (chondrichthyans), and the implications for marine ecosystems. ICES Journal of
Marine Science: Journal du Conseil, 57, 476-494.
Štirn, J. (1970). Some notes on western trends of Lessepsian migration. In: Journées Ichthyologiques,
Rome, 30 Nov – 1 Dec., CIESM, Monaco, 187–190.
Streftaris, N., & Zenetos, A. (2006). Alien marine species in the Mediterranean—The 100 “worst
invasives” and their impact. Mediterranean Marine Science, 7(1), 87-118.
Sundseth, K. (2009). Natura 2000 species in the Mediterranean Region,12 pp.
Sursock, A., Fakhri, M., & Hamzé, M. (2014). Bathymétrie. In: CANA-CNRS A scientific vessel for
Lebanon. Main scientific achievements towards strengthening the sustainable development
of the marine environment, 128 pp.
Sutton, T. T., Porteiro, F. M., Heino, M., Byrkjedal, I., Langhelle, G., Anderson, C. I., . . . Bergstad, O. A.
(2008). Vertical Structure, Biomass and Topographic Association of Deep-Pelagic Fishes in
Relation to a Mid-Ocean Ridge System. Deep-Sea Research II, 55, 161–184.
Swain, D. P., & Benoit, H. P. (2006). Change in habitat associations and geographic distribution of
thorny skate (Amblyraja radiata) in the southern Gulf of St Lawrence: density-dependent
habitat selection or response to environmental change? Fisheries Oceanography, 15, 166-
182.
Takeyama, H., Chow, S., Tsuzuki, H., & Matsunaga, T. (2001). Mitochondrial DNA sequence variation
within and between tuna Thunnus species and its application to species identification.
Journal of Fish Biology, 58, 1646–1657.
Taskavak, E., & Bilecenoglu, M. (2001). Length–weight relationships for 18 Lessepsian (Red Sea)
immigrant fish species from the eastern Mediterranean coasts of Turkey. J. Mar. Biol. Ass.
UK, 81, 895–896.
Tesch, F. W. (1968). Age and growth. (W. E. Ricker, Ed.) In: Methods for assessment of fish production
in fresh waters, 93–123 pp.
Thresher, R. E. (1984). Reproduction in Reef Fishes. 339 pp.
Tzanatos, E., Somarakis, S., Tserpes, G., & Koutsikopoulos, C. (2006). Identifying and classifying small-
scale fisheries métiers in the Mediterranean: a case study in the Patraikos Gulf, Greece. Fish
Res, 81, 158–168.
UNDP. (2012). National Report for the United Nations Conference on Sustainable Development (Rio +
20). (K. E.-J. Chabarekh, Ed.) 48pp.
UNEP. (2004). Fisheries subsidies and sustainable fisheries management. UNEP/ETB Bulletin, June.
UNEP. (2005). Artisanal Fishing: Promoting Poverty Reduction and Community Development Through
New WTO Rules on Fisheries Subsidies An Issue and Options Paper. 50 pp.
UNEP. (2007). Lebanon Post-Conflict Environmental Assessment. 181 pp.
UNEP/MAP. (2007). Annex XIII. Draft Guidelines for Controlling the Vectors of Introduction into the
Mediterranean of NonIndigenous Species and Invasive Marine Species. In: Report of the
eighth meeting of national Focal Points for SPAs.

222
UNEP/MAP-Plan Bleu. (2009). State of the Environment and Development in the Mediterranean.
UNEP/MAP-Plan Bleu, Athens, 200 pp.
Ungaro N., Vlora A., Marano C.A., Rivas G. and Modica A., 2001. Occurrence and biometrics of a new
Caelorinchus species (Macrouridae) for the southern adriatic sea. Cybium 25(2): 185-190.
United Nations Statistics Division. (2016). The World Statistics Pocketbook. Last update in UNdata: Jul
2016. http://data.un.org/CountryProfile.aspx?crName=LEBANON.
University of Balamand. (2016). Purse Seine Fisheries: Baseline Report. 59 pp.
Uusi-Heikkilä, S., Whiteley, A. R., Kuparinen, A., Matsumura, S., Venturelli, P. A., Wolter, C., Slate, J.,
Primmer, C. R., Meinelt, T., Killen, S. S., Bierbach, D., Polverino, G., Ludwig, A., Arlinghaus, R.
(2015). The evolutionary legacy of size-selective harvesting extends from genes to
populations. Evol. Appl., 8, 597–620.
Vella, A., Vella, N., & Agius Darmanin, S. (2016). The first record of the longjaw squirrelfish,
Holocentrus adscensionis (Osbeck, 1765) (Holocentriformes: Holocentridae), in the
Mediterranean Sea. Natural and Engineering Sciences, 1(3), 78-85.
Vivien, M. L. (1973). Contribution ala connaissance de l'ethologie alimentaire de l'ichtyofouna du
platier interne des recifs coralliens de Tulear (Madagascar). Tethys, Suppl. 5, 219-305.
Vivien, M. L., & Peyrot-Clausade, M. (1974). A comparative study of the feeding behaviour of three
coral reef fishes (Holocentridae) with special reference to the polychaetes of the reef
cryptofauna as prey. Proc. 2nd Int. Coral Reef Symp. 1. Great Barrier Reef, 179-192.
Voultsiadou, E., & Vafidis, D. (2007). Marine invertebrate diversity in Aristotle's zoology.
Contributions to Zoology, 76, 103–120.
Wasson, K., Zabin, C. J., Bedinger, L., Diaz, M. C., & Pearse, J. S. (2001). Biological invasions of
estuaries without international shipping: the importance of intraregional transport. Biol
Conserv, 102, 143–153.
Watson, R., & Pauly, D. (2001). Global Overfishing. In National Geographic Atlas of the Ocean: The
Deep Frontier, 163 pp.
Weissenberger, J. (2016). Multiannual plan for North Sea. EPRS | European Parliamentary Research
Service, 8 pp.
WFP Logistics. (2008). Logistics Capacity Assessment - Lebanon Road Netweork (last update Dec.
2014). http://dlca.logcluster.org/display/public/DLCA/2.3+Lebanon+Road+Network.
Retrieved May 19, 2017.
Wiens, J. A. (1984). On understanding a non-equilibrium world: myth and reality in community
patterns and processes. In: Strong DR Jr, Simberloff D, Abele LG, Thistle AB (eds) Ecological
communities - conceptual issues and the evidence, 439-457.
Wiens, J. A., Addicott, J. F., Case, E. J., & Diamond, J. (1986). Overview: the importance of spatial and
temporal scale in ecological investigations. In: Diamond J, Case EJ (eds) Community ecology,
145-153.
Williams, T., & Bedford, B. C. (1974). The use of otoliths for age determination. In: Bagenal, T.B. (Ed.).
Ageing of Fish, 114-123.

223
Williamson, M. (1987). Are communities ever stable? In: Gray AJ, Crawley MJ, Edwards PJ (eds)
Colonization, succession and stability, 353-371.
Winters, G. H., & Wheeler, J. P. (1985). Interaction between stock area, stock abundance, and
catchability coefficient. Canadian Journal of Fisheries and Aquatic Sciences, 42, 989-998.
Woods, L. P., & Sonoda, P. M. (1973). Order Berycomorphi (Beryciformes). Mem. Sears Found. Mar.
Res., 1(6), 263-296.
Woodward, G., Perkins, D. M., & Brown, L. E. (2010). Climate changeand freshwater ecosystems:
impacts across multiple levelsof organization. Philos Trans R Soc Lond Ser B Biol Sci, 365,
2093–2106.
World Bank. (2009). Energy efficiency study in Lebanon. 114 pp.
World Bank. (2011). Republic of Lebanon. Country Environmental Analysis. 136 pp.
World Bank. (2015). Lebanon economic monitor, Fall 2015 - THE GREAT CAPTURE. 43 pp.
World Bank. (2016). Lebanon Economic Monitor, Fall 2016. Global Practice for Macroeconomics &
Fiscal Management, GMFDR MIDDLE EAST AND NORTH AFRICA REGION, 46 pp.
World Bank, Food and Agriculture Organization and World Fish Centre. (2010). The Hidden Harvests -
The global contribution of capture fisheries.
Yoklavich, M. M., Cailliet, G. M., Barry, J. P., Ambrose, D. A., & Antrim, B. S. (1991). Temporal and
spatial patterns in abundance and diversity of fish assemblages in Elkhorn Slough, California.
Estuaries, 14(4), 465-480.
Zar J.H., (1996). Biostatistical Analysis, 3rd Edition. Prentice-Hall, Englewood Cliffs, NJ, 662 pp.
Zenetos, A., Akel, E., Apostolidis, C., Bilecenoğlu, M., Bitar, G., Buchet, V., Chalari, N., Corsini-Foka,
M., Crocetta, F., Dogrammatzi, A., Drakulić, M., Fanelli, G., Giglio, G., Imsiridou, A., Kapiris, K.,
Pkarachle, P. K., Kavadas, S., Kondylatos, G., Lefkaditou, E., Lipej, L., Mavrič, B., Minos, G.,
Moussa, R., Pancucci-Papadopoulou M. A., Prato, E., Renda, W., Ríos, N., Rizkalla, S. I., Russo,
F., Servonnat, M., Siapatis, A., Sperone, E., Theodorou, J. A., Tiralongo, F., Tzovenis I. (2015).
New Mediterranean biodiversity records. Mediterranean Marine Science, 16(1), 266–
284.Zenetos, A., Cinar, M., Papadopoulou, M. P., Harmelin, J., Furnari, G., Andaloro, F.,
Zibrowius, H. (2005). Annotated list of marine alien species in the Mediterranean with
records of the worst invasive species. Mediterranean Marine Science, 6(2), 63-118.
Zenetos, A., Gofas, S., Morri, C., Rosso, A., Violanti, D., Garcia Raso, J. E., Cinar, M. E., Almogi-Labin,
A., Ates, A. S., Azzurro, E., Ballesteros, E., Bianchi, C. N., Bilecenoglu, M., Gambi, M. C.,
Giangrande, A., Gravili, C., Hyams-Kaphzan, O., Karachle, P. K., Katsanevakis, S., Lipej, L.,
Mastrototaro, F., Mineur, F., Pancucci-Papadopoulou, M. A., Ramos Espla, A., Salas, C., San
Martin, G., Sfriso, A., Streftaris, N., Verlaque M. (2012). Alien species in the Mediterranean
Sea by 2012. A contribution to the application of European Union’s Marine Strategy
Framework Directive (MSFD). Part 2. Introduction trends and pathways. Medit Mar Sci, 13(2),
328–352.
Zenetos, A., Gofas, S., Russo, G., & Templado, J. (2003). CIESM Atlas of Exotic Species in the
Mediterranean. Vol. 3. Molluscs. (F. Briand, Ed.) 376 pp.

224
Zenetos, A., Siokou-Frangou, I., & Gotsis-Skretas, O. (2002). The Mediterranean Sea - blue oxygen-
rich, nutrient-poor waters. (E. i. Agency), A cura di) In: Europe's biodiversity - biogeographical
regions and seas.

225
ANNEXES

226
ANNEX 1. Communication to the 45th congress of the Italian Society of
Marine Biology, May 9-23, 2014.
Référence : LA PORTA B., L. NICOLETTI, R. MOUAWAD, M. TARGUSI, P. LA VALLE, L. LATTANZI, S.
LELLI, 2014. Benthic assemblages along the highly urbanized coast of Lebanon (Eastern
Mediterranean Sea). 45ème congré de la Société Italienne de Biologie Marine, 9-23 mai 2014,
166-167.

227

228

229
ANNEX 2. First page of a 2014’s publication in the Journal of earth Science
and Enginnering.
Citation : KHALAF G., SAAD A., JEMAA S., SABOUR W., LTEIF M. AND LELLI S. (2014) - Population structure and
sexual maturity of the Pufferfish Lagocephalus sceleratus (Osteichthyes, Tetraodontidae) in the Lebanese and
Syrian marine waters (Eastern Mediterranean). Journal of Earth Science and Engineering 4, 236-244.
230
ANNEX 3. Two communications to the ‘Watch Letter’ (CIHEAM), N°31,
december 2014.

231

232

233

234

235

236

237
Citations: HAMZÉ M., KHALAF G., FAKHRI M., SURSOCK A., LELLI S. (2014) - Research Vessel CANA-CNRS. Five
years of research activities in the Eastern Mediterranean Sea. The Mediterranean Sea. Fisheries and Beyond
Paris: CIHEAM, December 2014 - Watch Letter n°31.

238

239

240

241

242
Citations: ZUCCARO M., TREVISI R., GALLI D., LELLI S., UGOLINI R., DI TERLIZZI B., MALORGIO G. (2014) - Fishery and aquaculture cooperation for the development of Mediterranean coastal communities. The Mediterranean Sea. Fisheries and Beyond Paris: CIHEAM, December 2014 - Watch Letter n°31.

243
ANNEX 4. First pages of the CANA book of 2014 and 2016.

244
(…)

245
Citation : KHALAF G., FAKHRI M., LELLI S. (2014) - Marine Hydrobiology: Hydrology, Coastal Pollution,
Fishery and Cetacean. In: CANA-CNRS. A SCIENTIFIC VESSEL FOR LEBANON 2013-2014. 66-95.

246
(…)
Citation : LELLI S. (2016). An Unlikely Mediterranean Sea: Invasive Fish Species in Lebanese Waters. In: CANA-
CNRS. A SCIENTIFIC VESSEL FOR LEBANON 2009-2015. 55-58.

247
ANNEX 5. First page of a 2014’s communication in the 20th International
Scientific Conference New Frontiers in Sciences
Citation : LELLI S., LTEIF M., JEMAA S. and KHALAF G. (2014) - First information on abundance, biology and distribution
of the red giant shrimp (Aristaeomorpha foliacea) in Lebanese waters. 20th LAAS International Science Conference -
Advanced Research for Better Tomorrow. March 27-29.

248
ANNEX 6. First page of a 2017’s publication in the New Medit revue.
Citation : MULAZZANI L., ZANASI C., ERRICO A., PUGLIESE P., ZUCCARO M., ZERROUKI R., MEDANI M., OUAZZANI
TNACHERI M., MOHANNA C., HAMZA H., LELLI S. (2017) - The comparative analysis of Mediterranean coastal
communities: six case studies. NEW MEDIT N. 2/2017. 27-37.

249
ANNEX 7. First page of a 2017’s publication in the Journal of applied Ichtyology.
Citation : LELLI, S. LTEIF M., JEMAA S., KHALAF G., M. VERDOIT-JARRAYA, 2018. Weight-length relationships of 3
demersal fish species from Lebanese marine waters, eastern Mediterranean. Journal of Applied Ichthyology. 34 (1),
153–156. DOI: 10.1111/jai.13459.

250
Résumé substantiel de la thèse en français
Préambule concernant la langue de rédaction de la thèse.
La langue des thèses et mémoires dans les établissements publics et privés d’enseignement est le français,
sauf exceptions justifiées par les nécessités de l’enseignement des langues et cultures régionales ou
étrangères ou lorsque les enseignants sont des professeurs associés ou invités étrangers. La maîtrise de la
langue française fait partie des objectifs fondamentaux de l’enseignement. Pour les thèses en cotutelle, la
langue dans laquelle est rédigée la thèse en cotutelle est définie par la convention conclue entre les
établissements contractants. Lorsque cette langue n’est pas le français, la rédaction est complétée par un
résumé substantiel en langue française.
Une synthèse d’une vingtaine de pages en français, intégrée au manuscrit, mettant en évidence les apports
principaux du travail de thèse est requise par l’Ecole Doctorale 305.

251
Résumé substantiel de la thèse en langue française
Contribution à une meilleure connaissance de la biologie, la distribution et la diversité des espèces
démersales le long de la côte libanaise, Méditerranée orientale : un focus sur les espèces de poissons
lesseptiennes.
A l’heure actuelle, la biodiversité marine est menacée par l'accroissement des activités anthropiques.
Malgré sa faible étendue à l’échelle mondiale, la mer Méditerranée est l'un des principaux réservoirs de
biodiversité marine, comptant environ 17 000 espèces macroscopiques. Un grand nombre de ses
ressources côtières notamment halieutiques sont menacées d'effondrement écologique en raison d'une
mauvaise gestion, d'abus, et des crises sociales et politiques. L'introduction d'espèces non indigènes, la
surpêche, la pollution, le changement climatique et la dégradation des habitats, comptent parmi les
principales menaces des écosystèmes marins méditerranéens.
L'objectif de la présente thèse était d'améliorer la connaissance et la compréhension de la biologie et de
l’écologie des ressources démersales libanaises afin de contribuer à l'amélioration de l'exploitation durable
future des ressources halieutiques dans cette région. Une attention particulière a été portée sur les espèces
lesseptiennes qui abondent dans cette région depuis l’ouverture du canal de Suez afin de mieux
appréhender le rôle qu’elles tiennent dans le fonctionnement des écosystèmes de cette région. Cette étude
est issue des activités mises en œuvre dans le cadre de projets financés par la Coopération italienne et
pilotés par le Centre international des hautes études agronomiques méditerranéennes de Bari et le Conseil
national libanais pour la recherche scientifique. Ces projets prévoyaient la collaboration d'organisations
italiennes, libanaises et internationales et impliquaient des scientifiques et des étudiants d'Italie, du Liban
et de France.
Chapitre I - Introduction générale. Contexte, problématique et objectifs.
La mer Méditerranée : Biodiversité, menaces et pêcheries
Aperçu géographique. La Méditerranée est une mer semi-fermée située au carrefour de l'Afrique, de
l'Europe et de l'Asie. Elle est divisée au niveau du détroit de Sicile, en deux sous-régions occidentale et
orientale. Elle a été connectée artificiellement à la mer Rouge et à la région de l'Indo-Pacifique lors de la
construction du canal de Suez en 1869. En se déplaçant vers l'est, les eaux deviennent plus chaudes et plus
salées pour couler au niveau de la mer du Levant. Les masses d'eau remontent ensuite vers l'ouest et
sortent par le détroit de Gibraltar.
Elle est globalement considérée comme une mer oligotrophe et la baisse progressive de la teneur en
éléments nutritifs, au fur et à mesure que l'eau se déplace d'ouest en est, entraîne une réduction globale
de la productivité. Le climat méditerranéen se caractérise par des étés chauds et secs et des hivers frais et
humides. Les températures de l'eau à la surface de la mer montrent une forte saisonnalité et des gradients
importants le long des axes ouest-est et nord-sud.

252
Biodiversité. La mer Méditerranée est considérée comme un point chaud de la biodiversité mondiale
malgré sa faible surface. Selon les auteurs, les estimations du pourcentage du nombre d’espèces marines
macroscopiques méditerranéennes connues varient de 4 à 18% des espèces mondiales. Le biote marin
actuel méditerranéen est principalement d'origine atlantique, mais la variété de climats et l'hydrologie
particulière de cette mer a contribué à la co-occurrence et à la survie d’organismes issus de régions
tempérées et sub-tropicales. Le niveau d’endémisme est relativement élevé (25 à 30% du niveau mondial)
et il existe plusieurs habitats uniques, notamment les herbiers marins endémiques de Posidonia oceanica et
les habitats des grands fonds marins et pélagiques qui abritent des espèces et des écosystèmes uniques
dont certains sont en voie de disparition. La biodiversité de la Méditerranée a été, dans le passé, et sera,
dans le futur, continuellement modifiée et modelée par des catastrophes naturelles et anthropiques.
Néanmoins, au cours des deux derniers siècles, la biodiversité s'est modifiée à un rythme alarmant
notamment en raison de l'arrivée de nouvelles espèces liées aux activités anthropiques avec une
accélération apparente du taux d'invasions enregistrées au cours des dernières décennies.
Menaces. Le littoral est sous l'influence d'intérêts concurrents qui ont provoqué une détérioration marquée
de la qualité des eaux côtières, des sites écologiques et des ressources naturelles. Les activités terrestres
modifient les habitats naturels en raison du ruissellement des sédiments, des nutriments, des toxines et
des polluants. Les changements dans les écosystèmes du large comprennent l'extraction des ressources
minérales, la pollution due au trafic maritime et la construction d'infrastructures pour le développement
pétrolier ou les parcs éoliens offshore. Les fermes piscicoles intensives peuvent libérer d'énormes quantités
de déchets organiques et d'eau contaminée dans l'environnement naturel et propager les parasites et les
maladies.
Les effets des activités humaines sont plus importants en Méditerranée en comparaison à toutes les autres
mers du monde. De plus, la plupart du bassin méditerranéen est non géré et exposé à des menaces
actuelles et futures dont les causes les plus importantes pour les espèces méditerranéennes sont la perte
et la dégradation des habitats, la pollution, la surexploitation (aquaculture non durable et surpêche),
l'eutrophisation, le trafic maritime, les espèces exotiques envahissantes, les perturbations humaines, les
prises accessoires et le changement climatique.
Concernant ce dernier facteur, une augmentation globale du niveau de la mer d'environ 3 mm par an au
cours des deux dernières décennies est également préoccupante, en particulier sur les rives sud de la
Méditerranée.
La surexploitation, les prises accessoires, de même que les rejets non déclarés de ressources marines et les
captures accidentelles d'espèces vulnérables peuvent entraîner la perte de ressources biologiques,
entraînant d’importants impacts biologiques et écologiques. En Méditerranée, de nombreux stocks
exploités commercialement ne sont toujours pas correctement évalués. Parmi ceux évalués, 91% des stocks
étaient surexploités en 2014. En particulier, la surexploitation des top-prédateurs, engendrant un
changement de biomasse et de composition spécifique, pourrait avoir un impact plus important que prévu
sur la stabilité des écosystèmes, en particulier marins, que la suppression d’espèces de plus bas niveaux
trophiques.
Pêcheries. La pêche et l'aquaculture doivent permettent de répondre aux besoins alimentaires et
nutritionnels urgents d’une population mondiale en expansion tout en conciliant ces activités avec le
caractère limité des ressources naturelles. Par ailleurs, ce secteur procure des moyens d’existence et des
revenus, tant directement qu’indirectement, à une part importante de la population mondiale et contribue
ainsi de façon déterminante à son bien-être et à sa prospérité. Si la part des captures issues des pêches

253
demeure stable, la production de l’aquaculture ne cesse d’augmenter et est responsable de la croissance
impressionnante de l'offre de poisson pour la consommation humaine.
Des communautés de pêcheurs existent dans tout le bassin méditerranéen depuis des temps
immémoriaux. De nos jours, des pêcheries industrielles (ciblant principalement les petits pélagiques tels
que anchois et sardines), semi-industrielles et artisanales coexistent dans la région en utilisant une grande
variété d'engins de pêche. Les pêcheries méditerranéennes exploitent généralement un large éventail de
stocks de poissons benthiques, démersaux et pélagiques, ainsi que des mollusques et des crustacés. En
raison de la configuration semi-fermée du bassin méditerranéen, de nombreux stocks sont communément
partagés entre les flottes de différents pays. La flotte de pêche opérant en Méditerranée est estimée entre
80 000 et 100 000 navires pour environ 300 000 pêcheurs, mais il s’agirait d’une sous-estimation de la taille
réelle de la flotte en raison du manque de données relatives à certains Etats riverains de la Méditerranée et
de la mer Noire ou d'acteurs non étatiques. Les captures en Méditerranée ne représentent qu’une faible
partie des captures totales dans le monde (un peu plus de 1%) mais leurs évaluations sont difficiles en
raison des caractéristiques multi-spécifiques et multi-engins de la plupart de ses activités de pêche, de la
dispersion des sites de débarquement et de la faible proportion des captures qui passe généralement par le
biais des marchés de poissons organisés. La pêche en Méditerranée a tendance à être concentrée dans les
zones côtières et environ 85 % de la production est attribuables à six pays (Italie, Turquie, Grèce, Espagne,
Tunisie et Algérie).
Espèces démersales. Statut et traits d’histoires de vie.
Aperçu dans le monde entier. À l'échelle mondiale, les espèces pélagiques représentent la plus grande
proportion des captures marines mondiales, suivies par les espèces démersales. Ces dernières sont définies
comme les espèces vivant au fond de la colonne d'eau ou près de celles-ci, notamment pour satisfaire leurs
besoins alimentaires. Ces espèces se trouvent habituellement sur le plateau continental ou à proximité, et
sur ou près du talus continental ou le long du littoral.
Depuis le milieu des années 70, les captures d'espèces démersales au niveau mondial se sont stabilisées en
dessous de 20 millions de tonnes. Dix espèces (colin de l'Alaska, morue franche, Poisson-sabre, merlan
bleu, lançon, églefin, lieu noir, merlu du Cap, sébaste atlantique et poissons plats) ont produit 37% des
débarquements démersaux totaux en 2009, avec une tendance décroissante comme celle des captures
totales. La consommation annuelle d'espèces démersales par habitant s'est stabilisée à environ 2,9 kg. Pour
capturer ces espèces, les navires utilisent une variété de techniques et d'engins de pêche, les plus
importants étant les chaluts de fond et les sennes, ainsi que les chaluts à perche. Nombre de ces pêcheries
capturent non seulement des spécimens d'une seule espèce ciblée, mais capturent simultanément
plusieurs espèces présentes dans la zone de pêche, dans des proportions variables. Par conséquent, ces
pêcheries sont appelées « pêcheries mixtes ».
Traits d'histoire de vie des espèces démersales. En raison de la large définition du terme « démersal »,
différents traits d'histoire de vie sont présentés dans ce groupe. Généralement, les espèces démersales
montrent des mouvements d'adultes relativement restreints. Leurs stades juvéniles pélagiques
représentent leur mécanisme de dispersion le plus important, bien que des preuves génétiques montrent
que les stades pélagiques échouent souvent à atteindre leur potentiel de dispersion. Elles vivent près du
fond mais ne dépendent pas de ce dernier. Elles circulent généralement dans la colonne d'eau pour se
nourrir. Elles rassemblent des espèces à haute valeur marchande, souvent regroupées sous le terme de «

254
poisson blanc » en référence à la couleur de leur chair, comme la morue, le lieu (également connu sous le
nom de colin) ou le merlu.
Les traits d’histoires de vie des stades relatifs à la reproduction varient considérablement parmi les espèces
démersales. Certaines espèces peuvent pondre des œufs benthiques dont les larves pélagiques éclosent,
tandis que d'autres peuvent afficher des cycles de vie où les œufs et les larves sont pélagiques. Dans
d'autres cas, des formes particulières de soins parentaux ont évolué. La durée des larves pélagiques ainsi
que la distribution spatiale des stades pélagiques montrent également une grande variabilité parmi ces
espèces. Naturellement, le retrait direct des individus de poissons en raison des activités de pêche peut
induire des changements dans les caractéristiques démographiques des populations, y compris les
variations génétiques. Cependant, la compréhension de la façon dont les activités de pêche affectent les
communautés de poissons démersaux n'est pas encore claire. Il existe des preuves que la taille de ces
communautés est influencée par la pêche avec une tendance générale à la réduction des grands poissons
et à l'augmentation relative des petits poissons.
Espèces démersales méditerranéennes (EDM). Statut, pêcheries et menaces
EDM - Statut. Les espèces démersales méditerranéennes les plus importantes comprennent des poissons
tels que le merlu, le rouget, le merlan bleu, le merlan, les baudroies, la bogue, le picarel, des mollusques
bivalves (Chamelea gallina), des céphalopodes tels que le poulpe et la seiche et des crustacés (crevettes).
En Méditerranée, la profondeur joue le rôle principal dans la différenciation de ce groupe. Ces espèces
représentent environ 30% des captures totales déclarées en Méditerranée et en mer Noire. Dans cette
zone, les captures totales ont augmenté régulièrement, passant d'environ 0,7 million de tonnes en 1950 à
environ 2 millions de tonnes pendant la période 1982-1988. Elles ont soudainement décliné à environ 1,3
million de tonnes suite à l'effondrement de la pêcherie de sprat et d'anchois de la mer Noire et ont depuis
repris légèrement pour atteindre environ 1,5 million de tonnes. Entre-temps, les captures déclarées de la
plupart des poissons et crustacés démersaux et semi-pélagiques ont augmenté régulièrement jusqu'à la
période allant des années 80 à la fin des années 1990. Cela a été suivi par des déclins de plusieurs espèces
ces dernières années.
EDM - Pêcheries et menaces. Les pêcheries méditerranéennes sont dominées par de petits navires,
dispersés sur un grand nombre de sites de débarquement dans la plupart des pays. Une caractéristique des
pêcheries méditerranéennes est la capacité d'exploiter une variété d'espèces démersales tout en manquant
généralement de grands stocks mono-spécifiques. En conséquence, les pêcheries méditerranéennes ont
développé une multitude de métiers et d'échelles d'investissements. La production est essentiellement
concentrée sur le plateau continental et le littoral. Les volumes annuels sont limités (1,5 à 1,7 million de
tonnes / an), ce qui représente moins de 1% des captures mondiales. La situation des espèces
économiquement et commercialement importantes (merlu, rouget, crevette grise, sole, sardine et thon),
qui sont victimes d'une surexploitation non durable, est gravement préoccupante.
La durabilité des pêcheries méditerranéennes est également fortement affectée par les effets de
l'augmentation de la pollution due aux activités humaines côtières, la dégradation de l'habitat,
l'introduction d'espèces non indigènes et les impacts des changements climatiques. L'aquaculture a
également connu une croissance importante (pisciculture d'eau de mer pour le bar, la dorade et le «
grossissement » du thon) avec un double résultat : d'une part une augmentation de la production avec un
impact réduit en termes d'effort de pêche, d'autre part, cela a entraîné une dégradation de la qualité de
l'environnement marin et des habitats. Jusqu'à 85% des stocks pour lesquels une évaluation validée existe

255
sont pêchés en dehors des limites biologiquement viables. Les stocks de merlu européens présentent la
plus forte pression de pêche, avec un taux de mortalité par pêche en moyenne 5 fois plus élevé que la cible,
alors que seuls quelques stocks d'espèces démersales, comme le merlan, certaines espèces de crevettes, le
picarel et le rouget être pêché au niveau ou en dessous du point de référence pour la mortalité par pêche.
Les introductions d'espèces non indigènes ont provoqué des changements majeurs, en particulier en
Méditerranée orientale, où un nombre croissant d'espèces indo-pacifiques sont en train de s'établir dans
des populations reproductrices entrant en Méditerranée orientale par le canal de Suez (migrants
lessepsiens). Certaines de ces espèces ont un intérêt commercial, mais d'autres affectent négativement
l'économie de la pêche ainsi que l'environnement marin. Le poisson-globe, Lagocephalus sceleratus se
répand largement sur les eaux de la Méditerranée orientale sans concurrents naturels, créant des
problèmes majeurs pour les pêcheries de la région. Il est considéré comme l'une des pires espèces invasives
de la Méditerranée, avec un impact significatif sur l'écosystème environnant et sur le secteur de la pêche. Il
est capable de déchirer et d'endommager les lignes de filets de pêche et les longues lignes. L. sceleratus est
considéré comme un risque sérieux pour les consommateurs, car il contient une forte toxine paralytique
appelée tétrodotoxine, qui peut être mortelle pour l'homme.
Divers outils de gestion pour les écosystèmes côtiers
Actuellement, au niveau national et international, les politiciens, scientifiques et gestionnaires disposent
d’un nombre important d'outils pour la gestion des zones côtières et des écosystèmes marins
(réglementations, aire marines protégées, …). Des politiques de pêche méditerranéennes ont été
développées afin d'ajuster l'effort de pêche en fonction de la disponibilité des ressources halieutiques et
d'évaluer la capacité de pêche des flottes nationales. En raison de la grande variété d'espèces caractérisant
les pêcheries méditerranéennes, la gestion de la pêche en Méditerranée n'est pas basée sur le contrôle des
captures via les Totaux Autorisés de Captures et les quotas. La réglementation de l'effort de pêche total à
travers des permis limités et des mesures techniques telles que les fermetures de zones et de saisons, les
limitations d'engins et les tailles limitées des débarquements sont les piliers de l'effort de pêche total à
quelques exceptions près (comme le thon rouge qui est actuellement soumis à un système de quota dans
toute la Méditerranée). La plupart des pays ont également introduit dans certains segments de la flotte une
limitation du nombre de licences délivrées.
Les activités de pêche des États membres de l'UE sont réglementées par la politique commune de la pêche
de l'Union européenne tandis que les pays tiers définissent leurs propres mesures de gestion de la pêche et
veillent généralement à la cohérence avec les règlements de la Commission générale des pêches en
Méditerranée (CGPM). La lutte contre la pêche illicite, non déclarée et non réglementée, la mise en œuvre
de plans de gestion pour l'exploitation durable de tous les stocks de poissons et les mesures visant à
réduire les prises accessoires, les rejets et les captures accidentelles d'espèces vulnérables.
Une approche écosystémique de la gestion des pêches semble particulièrement utile pour la Méditerranée
et peut être rentable en prenant en compte les considérations environnementales et économiques et en
s'attaquant aux problèmes intersectoriels. Le besoin de coopération et de coordination entre tous les pays
riverains de la Méditerranée est reconnu depuis longtemps est a engendré l’établissement de diverses
conventions et partenariats. Les principales priorités du secteur comprennent la nécessité d'un
engagement politique fort, d'une coopération intergouvernementale et de la fourniture d'une assistance
technique aux États riverains. Les conditions préalables essentielles sont une base de connaissances

256
consolidée, une collecte et une analyse améliorées des données et l'élaboration de mécanismes de gestion
et de co-gestion intégrés aux objectifs environnementaux, y compris les aires marines protégées.
Espèces démersales de la Méditerranée orientale
En Méditerranée, la richesse des espèces présente un gradient d'ouest en est, la Méditerranée occidentale
ayant les plus hautes valeurs de richesse spécifique, probablement en raison de l'afflux d'espèces
atlantiques et de la large gamme de conditions physico-chimiques. Le bassin du Levant et le côté sud-est
ont en général la plus faible richesse spécifique, due aux conditions défavorables de la zone, comme la
salinité élevée et aussi probablement du fait d’un effort d'échantillonnage plus réduit. La Méditerranée
orientale est considérée comme l'un des bassins les plus oligotrophes du monde. Le bassin du Levant a été
affecté par deux grandes activités humaines qui ont influencé son écosystème : 1) la construction du
barrage d'Assouan a entraîné la disparition de la sédimentation fluviale et des éléments nutritifs en
Méditerranée, entraînant une forte diminution des populations de petits pélagiques et la chute
subséquente de 90% de l'industrie égyptienne de la senne coulissante ; et 2) la construction du canal de
Suez, achevée en 1869, qui reliait deux masses d'eaux avec des caractéristiques abiotiques différentes et
des biotas particuliers distincts. Le nombre d'espèces de poissons migrant vers la Méditerranée, connu sous
le nom de migrateurs lessepsiens, a augmenté de façon constante dans les décennies qui ont suivi les
années 1920, mais s'est accéléré de façon spectaculaire après l'an 2000. Des centaines d'autres taxons sont
entrés en Méditerranée en même temps, donnant lieu à l'une des plus grandes circonvolutions
biogéographiques jamais observée dans le monde contemporain.
Au total, le nombre total d'espèces lessepsiennes marines (envahisseurs via le canal de Suez) s’élève à plus
de 790 en mer Méditerranée, dont certaines ayant colonisé avec succès les écosystèmes marins
méditerranéens. En outre, la Méditerranée est également influencée par des espèces introduites à partir de
l'océan Atlantique par le détroit de Gibraltar et qui ont atteint la mer Adriatique et même, pour certaines,
le bassin oriental. Leur nombre croissant a un impact sur les populations indigènes et peut amener à une
réduction de l'abondance des espèces endémiques.
Actuellement, les espèces de poissons lessepsiens constituent une grande partie des captures
commerciales, menaçant de remplacer de nombreux poissons indigènes par leurs homologues exotiques.
C'est le cas de l’emblématique saupe, Sarpa salpa, poisson indigène méditerranéen, qui pourrait être
remplacée par le migrant lesseptien Siganus rivulatus le long des eaux côtières libanaises. Cependant, selon
certains auteurs aucune espèce méditerranéenne n'aurait disparu depuis l'ouverture du canal de Suez.
En résumé, les ressources démersales de la Méditerranée orientale sont un mélange d'espèces indigènes et
non indigènes principalement d'origine lessepsienne. La composition des assemblages est principalement
tirée par la profondeur et les secteurs les plus à l'est sont témoins de compétitions meurtrières où les
espèces indigènes sont probablement remplacées par des NEI occupant des niches écologiques similaires.
L'espace trophique global s'élargit sous la redondance croissante de la nouvelle communauté dans un
écosystème pauvre en éléments nutritifs. Par conséquent, les communautés démersales de la
Méditerranée orientale sont loin d'être dans un état stable.
Objectifs de l'étude

257
La poursuite des travaux de recherche sur les espèces démersales le long de la côte libanaise était une
nécessité. En effet, ce groupe a été progressivement exploité dans cette région et très peu de
connaissances n’existaient sur la présence et la répartition de ces espèces le long de ces côtes. Dans ce
contexte, les objectifs de cette thèse étaient de contribuer à une meilleure connaissance :
1. des communautés démersales exploitées par les pêcheries artisanales libanaises via des pêches
expérimentales, notamment les espèces lessepsiennes et du contexte socio-économique de ces pêcheries ;
2. de l'abondance relative et la répartition spatio-temporelle des espèces démersales libanaises et des
informations biologiques, notamment les relations longueur-poids de ces espèces ; et d’établir un
inventaire de la diversité de ces espèces dans cette région ;
3. de la biologie et l’écologie d'une espèce de poisson démersale lessepsienne abondamment trouvée dans
les captures : l’holocentre rouge, Sargocentrum rubrum.
Certains chapitres de la thèse sont présentés sous forme d'articles. Après une introduction générale,
constituant le chapitre I, la thèse est divisée comme suit :
Le chapitre II décrit le « matériel et les méthodes », généraux incluant une description de la zone étudiée,
le protocole d’échantillonnage et la collecte de données ainsi que les analyses et tests statistiques utilisés
tout au long de la présente thèse.
Le chapitre III est une revue bibliographique du secteur de la pêche au Liban décrivant les caractéristiques
socioéconomiques, le contexte environnemental et les aspects liés à la gouvernance.
Le chapitre IV est consacré à l'étude de la répartition et de la diversité des espèces démersales exploitées
par les pêcheries artisanales de la Méditerranée orientale et inclue une description et une analyse des
assemblages biologiques des espèces démersales le long du plateau continental libanais.
Le chapitre V. Le chapitre V présente l'estimation des relations poids-longueur de plusieurs de ces espèces
capturées dans les eaux libanaises.
Le chapitre VI présente la biologie et l'écologie d’une espèce de poisson lessepsienne, l’holocentre rouge,
Sargocentron rubrum, dans les eaux libanaises.
Enfin, la discussion générale, la conclusion et les perspectives de ce travail sont présentées dans le dernier
chapitre (chapitre VII). Des annexes sont incluses à la fin de la thèse pour compléter et améliorer son
contenu.
Ci-après sont brièvement résumés le contenu et les principaux apports de chacun des chapitres et de la
thèse.

258
Chapitre II - Matériel et Méthode
Caractéristiques de la zone d'étude
La zone d’étude est située le long des côtes libanaises dans la partie centrale du bassin levantin
(Méditerranée orientale). La côte du Liban s’étend sur environ 225 km avec un plateau continental étroit,
en particulier dans le sud. La profondeur moyenne du plateau continental est de 20 à 40 m et la pente,
parallèle à la côte et située à une distance de 25 à 30 km de cette dernière, s’étend de 1100 à 1400 m de
profondeur, avant d'atteindre la plaine abyssale. Cette dernière est incisée à certains endroit par des
canyons, la plupart liés à des rivières qui coulent des montagnes.
La direction dominante de la circulation générale le long de la côte du Liban est celle du nord durant la
plupart de l'année en plus de la présence d’un courant tourbillonnaire de sens général antihoraire en
Méditerranée orientale. Les mouvements d'eau le long de la côte sont également fortement liés aux
courants de surface et aux facteurs météorologiques saisonniers. Les conditions océanographiques
particulières des zones au large des côtes libanaises peuvent améliorer les accumulations de larves et de
juvéniles et créer des habitats favorables à leur croissance et à leur survie. L'eau dans les 50 premiers
mètres est bien mélangée en hiver et devient stratifiée pendant le reste de l'année. Les caractéristiques de
la côte libanaise sans baies fermées ou golfe consentent aux eaux côtières à se mélanger en continu,
empêchant ainsi les conditions d'eutrophisation et de disperser les nutriments et les polluants.
De manière générale, le Liban bénéficie d'un climat typiquement méditerranéen avec deux saisons très
contrastées : un hiver froid et fortement humide ; et un été long, chaud et sec et deux saisons
intermédiaires (printemps et automne).
Les eaux côtières libanaises sont caractérisées par des biotes thermophiles d'origine méditerranéenne et
indo-pacifique. La biodiversité locale subit une altération rapide sous les pressions combinées du
changement climatique et des impacts anthropiques. Cette côte est à l’heure actuelle, menacée par
l'urbanisation (les principales villes côtières sont majoritairement jointives). La faune et la flore marines
indigènes sont en compétition avec des espèces envahissantes provenant des océans Indo-Pacifique et
Atlantique. Les fonds sont essentiellement rugueux avec de larges plaques rocheuses qui conviennent au
déploiement d’engins de pêche démersaux. Les mesures de protection, pour les espèces ou les
écosystèmes, sont encore rares.
Collecte des données.
La collecte des données a été réalisée à partir de 2012 à 2014, selon trois protocoles différents en vue
d’évaluer la répartition et l'abondance d’un maximum de ressources halieutiques d’espèces démersales le
long de la côte libanaise.
Le projet CIHEAM PESCA Libano. Financé par la Coopération Italienne au Liban, le projet CIHEAM-PESCA
LIBANO « Assistance Technique au Ministère de l'Agriculture dans le domaine du développement de la
pêche » visait à fournir au Ministère libanais de l'Agriculture des outils avancés pour une bonne gestion des
ressources marines et halieutiques. Le Conseil National de la Recherche Scientifique du Liban (CNRS-L),

259
était chargé de la mise en œuvre de l’échantillonnage de pêche et a assuré le suivi de la collecte saisonnière
des données en mer dans le Nord Liban.
L’échantillonnage a été effectué en 2012, 2013 et 2014, durant lequel divers types d’engins de pêches
(filets maillant, trémail et palangre) ont été déployés sur 62 sites le long de la côte libanaise, à des
profondeurs allant de 10 à 600 m. En raison du manque d'information sur la composition en taille des
ressources démersales au Liban, différents maillages couvrant une large gamme ont été utilisés. Au Liban,
les activités de chalutage sont interdites dans les eaux territoriales libanaises. Un plan d'échantillonnage
stratifié a été employé, consistant en des pêches expérimentales indépendantes de la pêche commerciale.
Les strates possédaient des caractéristiques communes concernant la composition des espèces et leurs
densités et structures de longueur. Neuf pêcheurs artisanaux issus de huit ports différents ont été
embauchés pour déployer les engins à des coordonnées spécifiées. La longueur des navires variait de 8,75 à
11 m et leur tonnage brut allait de 3,10 à 5,01 tonnes. En général, l'équipage incluait 2 à 4 personnes (avec
au minimum un scientifique) et un maximum de 2 mises à l’eau d’engin a été effectué par jour, selon les
conditions météorologiques et les conditions techniques du navire. Pour chaque trait, les espèces
recueillies ont été identifiées et la date, la profondeur, le point GPS, le type d'engin déployé, et les mailles
des filets utilisés étaient notés. Les espèces ont été identifiées selon divers guides d'identification des
poissons de la Méditerranée orientale et les sexes étaient différenciés afin d’en déduire le sexe-ratio ainsi
que le stade de maturité. Aucun appât n’était employé lors du déploiement des filets, mais des appâts ont
systématiquement été accrochés aux hameçons des palangres (poissons hachés, tels que des harengs, des
maquereaux ou des thons).
Tous les spécimens prélevés indépendamment de l'espèce ont été mesurés et pesés. Lorsque les prises
d'une espèce donnée étaient trop abondantes pour être entièrement mesurées, des sous-échantillons
représentatifs de la capture ont été prélevés. Les protocoles standardisés et les exigences minimales
adoptées au cours des enquêtes étaient basés sur les protocoles du programme MEDITS.
Indices biologiques et maturité sexuelle
Diverses données biologiques ont été collectées, en plus de celles précédemment citées, pour l'étude
approfondie des espèces collectées et en particulier de l'espèce de poisson Sargocentron rubrum. Des
dissections des échantillons ont été effectuées et des mesures supplémentaires ont été prises, incluant le
poids de l'estomac et sa teneur, la collecte des otolithes et le macro-examen des gonades. Certaines de ces
mesures ont été utilisées pour calculer des indices biologiques importants, tels que le facteur de condition
qui indique les périodes de stress ou de phénomènes physiologiques, tels que, le frai, l'accouplement, les
modifications de la densité de la population, les conditions d'alimentation, ou les variations de
température.
Les stades de maturité sexuelle de chaque individus capturé (poissons, crustacés et céphalopodes) ont été
identifiés selon les protocoles du programme MEDITS déterminée par l'observation des gonades mâles et
femelles et des états de maturation sexuelle.
Analyse des contenus stomacaux.
L'analyse des contenus stomacaux n'a été réalisée dans cette étude que pour l’espèce de poisson
Sargocentron rubrum, pour laquelle plusieurs estomacs étaient pleins. Au cours de la dissection de cette

260
espèce cible, les estomacs ont été enlevés et leurs poids totaux ont été mesurés. Les estomacs contenant
des aliments ont été conservés dans de l'alcool à 70% jusqu'à identification du contenu. Le nombre
d’estomacs vides a également été noté. Chaque proie a été identifiée au plus proche taxon possible et
comptabilisé. Le poids total de chaque groupe proie a été mesuré si possible au gramme le plus proche.
Plusieurs indices ont ensuite été calculés pour analyser le régime alimentaire de l’espèces cible étudiée,
reflétant sa composition alimentaire et sa stratégie d'alimentation.
Composition du régime alimentaire. Le coefficient de vacuité, reflétant la richesse ou le manque de
nourriture dans l'environnement a été calculé et le pourcentage de remplissage de l’estomac a été évalué
et classé par catégories. De plus, trois indices ont été calculés pour montrer l'importance des différentes
proies dans le régime alimentaire des espèces cibles : la fréquence d’occurrence, le coefficient d’abondance
numérique des proies et les pourcentages de poids. Ces trois indices ont servi au calcul d’un 4ème indice,
l'indice d'importance relative, afin de mieux refléter l'importance de chaque proie dans les estomacs des
espèces cibles.
Stratégie nutritives. Enfin, des pourcentages de l'indice d'importance relative ont été établis pour chaque
type de proie afin de faciliter les comparaisons entre les types d'aliments. La stratégie d'alimentation de
l'espèce cible a été analysée afin d’illustrer en particulier la dominance et la rareté de chaque groupe de
proies durant les deux saisons et de la stratégie d'alimentation (spécialiste ou généraliste).
Estimation de l’âge des poissons et courbes de croissance
Les otolithes (concrétion minérale trouvée dans l’oreille interne des poissons téléostéens) ont été
employées pour estimer l'âge du poissons Sargocentron rubrum (la zone opaque correspond à une
croissance rapide et la zone translucide à une croissance lente du poisson). Une fois que les anneaux ont
été considérés comme annuels, chaque spécimen a été assigné à une classe d'âge, en tenant compte des
données de capture, des dénombrements d'annuli, de leur période de formation et de la biologie
reproductive de l'espèce dans la région.
Les paramètres de croissance de la relation non linéaire de Von Bertalanffy ont été estimés à partir de
l'analyse des données de longueur selon l'âge et a été réalisée dans le logiciel statistique R.
Analyses de données
Captures par unité d’effort. La capture par unité d'effort (CPUE) a été calculée seulement pour les espèces
capturées au cours de l'échantillonnage scientifique CIHEAM-PESCA Libano, au cours duquel des palangres,
trémails et filets maillants ont été déployés à des traits spécifiques avec des coordonnées et des
profondeurs prédéterminées. La CPUE pour les espèces prises lors de l'échantillonnage a été calculée au
moyen du logiciel statistique 'R ' en kilogrammes et en nombre.
Indices de biodiversité. Le nombre total d'individus et le nombre total d'espèces recensées dans
l'échantillon a été déterminé afin d’évaluer les variations saisonnière et spatiale de biodiversité. Pour ce
faire, plusieurs indices de diversité ont été calculés : l'indice de Shannon, l'indice de Simpson et l’indice de
diversité taxonomique
Enfin, la comparaison et l'interprétation des données a nécessité l'utilisation de plusieurs tests inférentiels
(Wilcoxon, Kruskal –Wallis, Chi-deux de Pearson, …) et analyses statistiques descriptives (Analyse en

261
composante principale, Analyse canonique des correspondances ...) ou outils de modélisation (régressions
linéaires et non linéaires, ANCOVA, ...). Au préalable, des transformations de données (i. e. logarithmiques)
se sont quelquefois avérées nécessaires, selon le cas d’étude considéré.

262
Chapitre III -Revue de la littérature sur le contexte socio-économique, environnemental et le secteur de
la pêche au Liban : une analyse du contexte
Le chapitre III a été dédié à une synthèse bibliographique et une analyse du contexte socio-économique,
environnemental et du secteur de la pêche au Liban afin de mieux cerner l’influence que peut avoir le
contexte local libanais sur les pêcheries des ressources démersales.
Contexte socio-économique
Le Liban est un petit pays (10 452 km2) à revenu intermédiaire, avec un PIB par habitant de 9 928 USD en
2013. Sa population est estimée à 6 237 738 en juillet 2016, dont 88% sont urbains. Plus d'un tiers de la
population est concentrée dans sa capitale, Beyrouth. Il se classe 12ème sur 21 en Méditerranée en termes
de PIB et d'indice de développement humain. Le Liban se caractérise par une économie axée sur les
services et un secteur agricole faible. Les principaux sous-secteurs sont le commerce, le tourisme et les
services financiers. La zone côtière est considérée comme la zone la plus riche mais en même temps la plus
menacée du Liban. Le Liban continue de faire face à d'énormes défis découlant de la guerre en Syrie, y
compris l'accueil de la plus grande assemblée de réfugiés syriens, proportionnellement à la population. Le
secteur de la production agricole et halieutique joue un rôle mineur dans l'économie. Il contribue à environ
5% du PIB et à 8% de la main-d'œuvre effective, ce qui correspond à environ 30% de la demande
alimentaire nationale et a été constant au cours des dix dernières années.
Infrastructures : Transports. Le Liban comptait environ 22 000 km de routes en 2001, dont 30% sont
classées et relèvent de l’autorité nationale, tandis que les 70% restants sont des routes non classées gérées
par les municipalités. Actuellement, le Liban a l'un des ratios voiture / personnes les plus élevés au monde
avec une voiture pour trois personnes. Beyrouth et Tripoli accueillent les deux plus grands ports
commerciaux du Liban, et on observe une diminution du nombre total de navires de charge et de navires-
citernes, passant de 3 887 navires en 1996 à 3 054 en 2000. Le transport terrestre, maritime et aérien
entraîne des impacts importants et divers sur l'environnement en particulier le rejet des d'eaux de ballast.
Infrastructures : Énergie. Le Liban est actuellement confronté à un sérieux défi énergétique lié à la
réalisation de ses objectifs de développement social et économique en raison du manque de ressources
énergétiques nationales, de capacités de production réduites et de la demande croissante d'énergie.
L’Electricité du Liban, établissement public produisant, transmettant et distribuant l'électricité à tous les
territoires libanais, s'efforce continuellement d'assurer la livraison continue de son électricité mais le
secteur de l'énergie souffre d'années de mauvaise gouvernance, d'une gestion insuffisante des agences du
secteur et d'une grande inefficacité dans ses infrastructures, notamment les centrales électriques et les
réseaux de transport et de distribution. Le taux d'électrification au Liban est d'environ 99,9%, mais ce taux
élevé ne se reflète pas dans la continuité de l'alimentation électrique et des services fournis et de
nombreux consommateurs ont considérablement investi dans des groupes électrogènes de secours du fait
des pénuries d'approvisionnement, ce qui a fortement affecté l'efficacité énergétique du pays. Le Liban ne
produit pas de pétrole ou de charbon et la plupart de ses besoins en énergie, c'est-à-dire principalement
des produits pétroliers, sont importés. Les options d'énergie renouvelable sont disponibles mais ne sont
pas largement utilisées (elles ne représentaient que 4% du bilan énergétique du pays en 2006).

263
Population. Le patrimoine culturel et linguistique du peuple libanais est un mélange d'éléments indigènes
et de cultures étrangères qui sont venus gouverner cette région et son peuple au cours de milliers
d'années. Environ 93% de la population du Liban comprend de nombreuses sectes musulmanes et
dénominations chrétiennes. Parce que la question de l'équilibre religieux est une question politique
sensible, aucun recensement national n'a été effectué depuis 1932, avant la fondation de l'Etat libanais
moderne. Par conséquent, il n'y a pas de données précises sur les pourcentages relatifs de la population
des principales religions et groupes. Il y a de 8,6 à 14 millions de Libanais et de descendants de Libanais
dans le monde entier.
Emploi. Au Liban, les interventions en matière de protection sociale comprennent les assurances sociales et
les interventions sur le marché du travail (y compris les régimes contributifs tels que les retraites), les
services sociaux (accès à des services tels que la santé et l'éducation) et les programmes d'assistance
sociale ciblés. Cependant, ces programmes n'atteignent qu'une petite partie de la population, ce qui
n'inclut généralement pas les communautés de pêcheurs. Il n'y a ni contrat de travail au Liban ni couverture
sociale qui pourrait protéger les pêcheurs en cas d'invalidité, de perte d'emploi et de retraite. Ainsi, les
pêcheurs restent fortement tributaires de leurs revenus, éventuellement sur des filets de sécurité privés
(tels que les envois de fonds) ou sur le système de crédit.
Ces dernières années, l'offre de main-d'œuvre peu qualifiée a rapidement augmenté en raison de la crise
syrienne, réduisant les revenus des Libanais à faible revenu et pauvres. En 2012, le secteur de la pêche
maritime employait 3 200 personnes (la majeure partie des opérateurs du secteur étant libanaise).
Système de crédit. Bien que le Liban se porte bien sur le plan régional en prêtant aux petites et moyennes
entreprises, la culture de prêt conservatrice du pays limite l'accès au crédit, bien que partiellement atténué
par les programmes incitatifs du gouvernement et de la Banque du Liban. Les entreprises libanaises
dépendent fortement du secteur bancaire pour leur financement, puisque 53% de toutes les entreprises
déclarent avoir bénéficié d'un prêt bancaire. Certaines facilités de crédit bancaire sont dans la pratique
disponibles aussi pour les micro-entreprises et les pêcheurs. Peu de banques offrent un petit crédit et
aucune ne le fait sans aucune garantie. Par conséquent, seuls les pêcheurs qui possèdent un bateau ou un
autre bien de valeur peuvent demander un prêt. La facilité de crédit la plus courante desservant les
communautés de pêcheurs est celle fournie par les vendeurs de poisson. Outre la subvention annuelle que
certains donnent habituellement aux pêcheurs, ils sont souvent disponibles pour leur prêter de l'argent
supplémentaire au cours de l'année. La seule obligation des pêcheurs est de vendre leur poisson à leurs
prêteurs. Les autres facilités de crédit disponibles pour les communautés de pêche sont les micro-crédits
qui comptent généralement sur des engagements forts et un taux de remboursement élevé.
Contexte environnemental
Environnement physique. Le Liban est l'un des plus petits pays du monde ayant une superficie de 10 452
km2. Il est principalement montagneux et bordé par la Syrie au nord et à l’est et la Palestine occupé au sud.
Le Liban dispose également d'un vaste réseau hydrologique de 2000 rivières dont une douzaine traversant
la côte libanaise et qui jouent par conséquent un rôle important dans la qualité des eaux côtières marines.
La côte libanaise est relativement courte - environ 225 km et affiche une forte densité de population. En
général, le Liban bénéficie d'un climat méditerranéen typique avec deux saisons très contrastées : un hiver
froid et fortement humide et un été long, chaud et sec et deux saisons intermédiaires (printemps et
automne). La variation mensuelle moyenne de la température de la surface de la mer entre 2000 et 2012 a
varié entre 17,82 ° C au minimum en mars et 29,71 ° C au maximum en août la variation mensuelle
moyenne de la température de l'air a varié entre un minimum de 12,4 ° C en janvier et un maximum de
27,59 ° C en août.

264
Biodiversité. L'état de la biodiversité marine au Liban a été évalué en 1996 puis examiné à travers plusieurs
articles publiés et non publiés. Selon certaines études, la mer côtière du pays comprendrait 1685 espèces,
dont 367 espèces de poissons, avec 50 d’entre elles d’intérêt commercial. Le phytoplancton englobe 580
espèces, tandis que le zooplancton représente la plus grande part de la diversité faunique marine avec plus
de 747 espèces recensées. Le micro-zoobenthos est représenté avec 12 espèces connues alors que le
macro-zoobenthos est diversifié et englobe 662 espèces. Au moins 3 espèces de reptiles (tortues
caouannes, tortues marines vertes et marines) et 5 espèces de mammifères (dauphins et marsouins), moins
fréquentes dans les communautés locales eaux, baleines et phoques). Les informations sur l'état de
conservation sont principalement disponibles pour certaines espèces (tortues et cétacés). L'étude sur la
biodiversité de la biodiversité a identifié des habitats rocheux, sableux et herbeux submergés ainsi que des
communautés de sciaphile, de photophile, d'endofaune et d'épifaune, dont 68 espèces menacées.
Secteur de la pêche
Aperçu des pêches libanaises. Le secteur de la pêche au Liban se compose d'une petite flotte de pêche
artisanale, à savoir 2 005 navires sous licence (en 2015) exploités principalement par des pêcheurs âgés
utilisant de vieux bateaux munis d'équipements anciens. La plupart des bateaux sont motorisés et
mesurent moins de 12 m en utilisant des techniques de pêche essentiellement basées sur des engins
passifs tels que les filets maillants, les trémails, les palangres et les sennes coulissantes. Les opérations de
pêche sont principalement réalisées à des profondeurs allant jusqu'à 50 m. Peu de navires sont équipés de
GPS, tandis que le reste a un équipement de navigation ou de sécurité très limité. Les eaux côtières
libanaises contiennent une grande quantité d'organismes marins avec plus de 80 espèces de poissons
d'importance commerciale. Les comportements de pêche illégale et les pratiques néfastes ou non durables
telles que l'utilisation de filets à mailles courtes et d'explosifs se développent à la suite d'une législation
obsolète et de son manque d'application. Le manque de gestion des déchets urbains et industriels ainsi que
l'absence d'un réseau d'assainissement efficace contaminent les eaux marines et les eaux douces. Les zones
côtières sont soumises à un étalement urbain incontrôlé et à des processus croissants d'artificialisation. Il
est largement admis que les activités humaines affectent de manière inquiétante l'environnement étroit
des zones côtières, ce qui entraîne une augmentation critique de son exposition aux risques géologiques. La
pression humaine exercée sur la zone côtière et les faibles investissements publics dans le secteur au cours
des dernières décennies ont réduit la valeur économique du secteur et, par conséquent, affecté la vie des
pêcheurs.
Malgré sa gestion chaotique, le secteur de la pêche libanaise représente un cas unique en Méditerranée,
étant le seul composé uniquement de petits bateaux artisanaux. En raison de sa situation géographique, le
Liban représente également un avant-poste pour une compréhension globale de la dynamique de la
colonisation de la Méditerranée par les espèces indo-pacifiques et de la mer Rouge. Les connaissances sur
l'impact de la flotte libanaise sur les ressources côtières des pêcheries - invasives et endémiques - sont
encore très limitées, étant donné que l'on ne dispose que d'informations éparses sur la répartition,
l'abondance et les caractéristiques biologiques de quelques stocks de poissons et de crustacés.
Le Liban est en train de faire ses premiers pas dans la satisfaction des exigences internationales en matière
de collecte de données sur ses ressources halieutiques à travers des évaluations des stocks, des prises et de
l'effort. Les organisations internationales et les donateurs ont accordé des fonds et un renforcement des
capacités pour développer des programmes de recherche adéquats afin de soutenir la capacité du

265
Gouvernement libanais à définir de nouvelles mesures pour une gestion appropriée et durable des
ressources halieutiques.
Flotte, engins et terrains de pêche. La majeure partie de la flotte de pêche est constituée de navires
artisanaux polyvalents, un petit bateau de pêche de 3 à 15 m, habituellement en bois, généralement non
ponté ; et avec / sans moteurs in-bord ou hors-bord. En 2015, la longueur moyenne des navires de pêche
autorisés est de 7,2 m avec 546 navires de moins de 6 m de longueur, 1 420 bateaux de 6 à 12 m et 39
bateaux de plus de 12 m de longueur. Les zones de pêche sont délimitées par la loi entre 500 m et 6 nm du
rivage et les sorties sont limitées à 24 heures par sorties de pêche. Aussi, 78 % des pêcheurs pêchent à
moins de 3 milles marins de la côte et moins de 10 naviguent au-delà des 6 milles marins. Les techniques de
pêche au Liban consistent principalement en des engins passifs tels que les filets maillants, les trémails, les
palangres, les sennes coulissantes, les lamparos et les sennes de plage.
Ressources halieutiques. Les stocks de poissons au Liban n'ont pas été régulièrement évalués. Les
universités privées, le Conseil national de la recherche scientifique du Liban (CNRS-L) et la FAO, en
coordination avec le Ministère de l'agriculture, ont posé les bases d'une collecte régulière de données pour
permettre des évaluations fiables des stocks. Une seule expérience systématique de collecte de données
sur les ressources halieutiques libanaises avait été réalisée par George, et al., 1964. Leur étude reposait
presque entièrement sur les pêcheurs commerciaux en tant que fournisseurs des spécimens. Ils ont décrit
177 espèces, dont 19 lessepsiens.
Des études récentes sur la pêche aux petits pélagiques ont montré qu'une fraction significative des
spécimens débarqués étaient des juvéniles. Les petites pêcheries pélagiques constituent environ les deux
tiers des débarquements libanais. Les pratiques de pêche ciblant les poissons juvéniles sont en partie
influencées par le marché puisqu'elles favorisent les plus petits poissons, qui sont consommés entiers. De
plus, tous les efforts de la flotte se concentrent principalement dans les 6 milles nautiques, ce qui entraîne
une forte pression de pêche sur les ressources halieutiques côtières, notamment dans la zone des 3 milles.
Le statut des ressources halieutiques entre 6 et 12 milles nautiques n'est pas connu, mais il peut être
considéré comme des stocks vierges puisque pratiquement aucune activité de pêche n'est pratiquée dans
cette zone. Une étude de courte durée a permis de procéder à une évaluation préliminaire de la
potentialité des zones de pêche hauturière pour la pêche artisanale locale au Sud-Liban qui a montré de
bons rendements (CPUE plus élevés que ceux des pays méditerranéens européens) pour le merlu européen
et une espèce de crevette.
Profil des prises de poissons marins.
Au Liban, les débarquements sont composés d'un grand nombre d'espèces, dont beaucoup sont des
migrants lesseptiens. Une vingtaine d’espèces représenteraient 80% des captures et les sardines et les
anchois sont les espèces les plus importantes représentant plus de 25% de la production. Le pays importe
78% des produits de la mer consommés. L'exportation est négligeable par rapport à l'importation, ce qui
signifie que la production nationale représente environ 22% des produits de la mer consommés, ce qui rend
le pays fortement tributaire de l'importation. En 2011, la production annuelle des pêches de capture
marines était évaluée à 4 632 tonnes dont 803 tonnes provenant de l'aquaculture et la consommation de
produits de la mer par habitant était de 6,03 kg en 2005, soit environ le tiers de la moyenne en
Méditerranée.

266
Gestion des pêcheries La gestion des secteurs libanais de la pêche et de l'aquaculture relève du Ministère
de l'agriculture des pêches et de la faune. Au niveau local et professionnel, le secteur de la pêche au Liban
est représenté par 34 coopératives de pêcheurs dans le cadre de l'Union générale des coopératives
regroupant environ 43% des armateurs / exploitants. En général, ils ne fonctionnent pas comme un collectif
selon un plan défini mais principalement basé sur les initiatives des individus. Cela rend ces coopératives
incapables de prendre les bonnes décisions au profit des pêcheurs. En ce qui concerne les syndicats de
pêcheurs, 5 sont actifs dans le pays. Le rôle des syndicats est de faire pression pour l'amélioration et le
développement du secteur au sein du gouvernement. Il n'existe pas d'accord collectif national de travail en
vigueur pour les opérateurs du secteur.
Les principaux ministères concernés par le secteur de la pêche sont les suivants : le Ministère de
l'agriculture (MOA), le Ministère des Travaux Publics et des Transports (MOPWT), le Ministère de
l'environnement et le Ministère du Travail (MOL).
La principale loi sur les pêches (Loi n ° 2775-Surveillance de la pêche côtière, 28/9/1929) est obsolète et
remonte à 1929 pendant le mandat français pour le Liban. La FAO, la CGPM et le MOA ont rédigé une
nouvelle loi qui a été finalisée en décembre 2014 et envoyée au Conseil des ministres pour approbation et
transmise au Parlement pour discussion, amendements et ratification éventuelle.
En ce qui concerne les engins de pêche et leurs caractéristiques techniques, il existe actuellement un
nombre très limité de réglementations et de restrictions sur les engins de pêche dans la législation libanaise
en matière de pêche. La législation concerne la taille de l'engin et le maillage ainsi que les pratiques de
chalutage de fond, de filets statiques et de surface et divers engins employés pour les petits poissons
pélagiques (sennes et lamparos). En particulier, le chalutage est interdit dans les eaux territoriales
libanaises et il n'existe actuellement aucun chalutier enregistré dans le registre de la flotte de pêche
libanaise.
Le manque de ressources financières et d’une gestion claire et efficace des politiques ont conduit à négliger
le potentiel des secteurs de la pêche et de l'aquaculture et entraîné un déclin progressif de leur
productivité ainsi que du niveau de vie des pêcheurs et des travailleurs du secteur de la pêche impliqués
dans des activités auxiliaires. En revanche, la connaissance limitée des modes de consommation et des
potentialités du marché et du poisson dans les nouveaux produits récoltés ou cultivés, associée à l'absence
d'une vision stratégique pour définir les priorités, entrave la création d'emplois. Au cours des dernières
années, le projet FAO-EastMed, en collaboration avec le MoA, soutient le développement de plans de
gestion des pêches cohérents au niveau régional entre les pays de la Méditerranée orientale.
Menaces
Plus de 60% de la population libanaise vit dans la zone côtière. L'impact de la densité de population et des
activités économiques sur la biodiversité marine est donc immense et pose de formidables défis à la
gestion des zones côtières, notamment la conservation des ressources marines et la protection des moyens
de subsistance issus de la mer Méditerranée. La forte densité de population sur la zone côtière a conduit à
une dégradation de l'écosystème côtier due aux effluents d'eaux usées, aux décharges publiques et à la
gestion incontrôlée des zones côtières. Les installations industrielles (tannerie, acier, ciment, engrais,
transformation des aliments, etc.), les établissements touristiques, les effluents agricoles et le transport
maritime de pétrole sont d'autres sources de pollution d’origine terrestre.

267
L'environnement marin a été négligé pendant des décennies et a souvent été géré comme une ressource
consommable. La concentration de l'effort de pêche dans une étroite bande côtière, associée à l'utilisation
de pratiques néfastes, a probablement entraîné une surexploitation de nombreuses espèces commerciales
côtières. Néanmoins, heureusement, les filets dérivants de fond et les chaluts de fond ne sont pas employé
au Liban.
Le coût de la dégradation de l'environnement au Liban lié aux ressources terrestres et fauniques est estimé
à 100 millions de dollars par an, soit 0,6% du PIB du Liban. D'autre part, la connaissance limitée des modes
de consommation et des potentialités du marché et du poisson dans les nouveaux produits récoltés ou
cultivés ainsi que l'absence de vision stratégique pour définir les priorités entravent la création
d'opportunités d'emploi.
Chapitre IV – Partie 1. Pattern de répartition, diversité et abondance des assemblages démersaux le long
de la côte libanaise en Méditerranée orientale et structure des assemblages
Partie 1. Pattern de répartition, diversité et abondance des assemblages démersaux le long de la côte
libanaise en Méditerranée orientale
Dans une première partie du chapitre 4, l'accent a été mis sur les différents aspects de la distribution
spatiale et saisonnière, la diversité, la biologie et l'écologie des ressources démersales le long de la côte
libanaise, en Méditerranée orientale. Cette étude constitue la seule évaluation depuis 50 ans des
ressources démersales dans cette région.
Dans le bassin méditerranéen, les espèces démersales représentent environ 30% des débarquements
totaux de la région et représentent donc une ressource importante pour la pêcherie. Cependant, la
durabilité à long terme des pêches démersales suscite de vives préoccupations. En effet, d'après les
évaluations récentes, la plupart des stocks démersaux méditerranéens sont surexploités. Dans ce contexte,
la pêche artisanale, et en particulier la pêche côtière à petite échelle, apparaissent comme des alternatives
pertinentes pour une utilisation durable des ressources côtières. Le secteur de la pêche du Liban se
compose d'une petite flotte de pêche artisanale, à savoir 2 005 navires de moins de 12 m de longueur,
utilisant des techniques de pêche essentiellement basées sur des engins passifs. En raison de sa situation
géographique, le Liban représente un avant-poste pour une compréhension globale de la dynamique de la
colonisation de la Méditerranée par les espèces indo-pacifiques et de la mer Rouge.
Un programme de relevés expérimentaux de pêche de trois ans a été mené, issues du projet scientifique
CIHEAM-PESCA Libano réalisé avec la participation du Ministère de l'Agriculture et le Centre national pour
les sciences marines - Conseil national libanais pour la recherche scientifique (CNRSL). Les stations
d'échantillonnage ont été étudiées au moyen de filets maillant expérimentaux abaissés jusqu'à 300 m de
profondeur visant à évaluer la répartition et l'abondance des ressources halieutiques le long des Libanais.
Nous avons estimé que le relevé indépendant de la pêche était l'outil le plus approprié pour fournir des
mesures précieuses de l'abondance relative, des taux de variation de la population, de la taille et de la
composition par sexe pour un large éventail d'espèces.
En trois ans de collecte de données, 121 traits ont été exécutés et 97 km de filets (0,351 km2) ont été
abaissés. 3 579 spécimens appartenant à 129 espèces et 73 familles ont été recueillis avec un poids total de
601 kg. La capture était composée d’un mélange diversifié d’espèces incluant 18 crustacés, 8 céphalopodes,

268
91 téléostéens et 12 espèces d'élasmobranches (n’incluant aucune chimère). Sargocentron rubrum était
l'espèce la plus abondante, avec l'occurrence numérique la plus élevée, le poids total et la CPUE. Dentex
macrophthalmus était la deuxième espèce en termes d'abondance et d'occurrence numérique, alors que
Phycis phycis, M. merluccius et Lagocephalus sceleratus étaient relativement élevés en poids. Parmi les 12
espèces d'élasmobranches capturées dans cette étude, 6 sont considérées menacées d'extinction par la
Liste rouge de l'UICN. Parmi ceux-ci, Gymnura altavela et Squatina aculeata sont considérés comme en
danger critique, faisant face à un risque extrêmement élevé d'extinction dans la nature. Dans notre étude,
17 espèces non indigènes d'origine lessepsienne (13 poissons et 4 espèces de crustacés) ont été recensées
dans les eaux côtières libanaises, dont 15 démersales, un pélagique (le hareng Etrumeus teres) et un autre
benthique mixte comportement -pelagique (le crabe portunidé Charybdis longicollis).
Les données ont montré que la profondeur pour provoquer une diminution générale de l'abondance
numérique et de la biomasse (au-delà de 150 m de profondeur) liée à une réduction générale de la
disponibilité alimentaire qui affecte les assemblages épibenthiques et démersaux sur la pente. Ce schéma
était dû à une diminution de l'abondance des téléostéens, qui diminuait avec la profondeur, alors que les
crustacés décapodes et les élasmobranches montraient une tendance opposée augmentant du plateau
côtier à la pente moyenne.
Partie 2. Pattern de répartition et diversité et structure des assemblages démersaux le long de la côte
libanaise en Méditerranée orientale.
Dans la seconde partie du chapitre 4, des assemblages de poissons démersaux ont été décrits à partir de 48
stations de pêche le long des côtes libanaises en Méditerranée orientale. Une méthode de classification
hiérarchique ascendante a été utilisée pour identifier les stations où les captures étaient similaires, en
termes de composition des espèces et de biomasse, et six assemblages ont été identifiés. La capture par
unité d'effort a été utilisée comme un indice de l'abondance des poissons démersaux capturés et a montré
des variations saisonnières et spatiales de distribution et selon la profondeur. L'analyse des données
collectées a montré la présence de 6 groupes de stations avec une composition différente des espèces avec
4 assemblages majeurs dans les eaux libanaises : les groupes 1, 2 et 3 (16 stations d'échantillonnage)
présentaient des captures médiocres dans le nord du Liban et plus fréquemment dans les eaux peu
profondes. Un petit nombre d'individus de Sargocentron rubrum, Portunus pelagicus, caractérisait certaines
des remontées appartenant à ces groupes. Le cluster 4 (6 stations d'échantillonnage) rapportait des
stations situées entre la plate-forme d'Akkar et Tyr à des profondeurs comprises entre 40 et 100 m. Toutes
les stations étaient caractérisées par S. rubrum comme espèce dominante des captures. C'est typiquement
une espèce habitant les fonds rocheux, dans les récifs côtiers ou cachée dans des cavernes et des fissures
de roches particulièrement pendant la journée. Cette espèce était habituellement associée à Fistularia
commersoni, à Pagellus acarne et aux siganidés (espèces vivant dans des fonds de différentes natures) et à
l'espèce bentho-pélagique Trachurus picturatus. Le cluster 5 (26 stations) était assez complexe à examiner
car il comprenait des traits situés entre Chekka (Nord Liban) et Naqoura (Sud) à toutes les profondeurs
étudiées. Le groupe 6 (3 stations) comprenait des traits situés dans le plateau continental sud plus profond.
Le groupe d'espèces identifiées dans ce groupe est typique des fonds sablo-vaseux dans le plateau
continental plus profond et la pente supérieure. La crevette géante rouge A. foliacea était particulièrement
abondante étant associée à d’autres espèces typiques.
Cette étude peut servir de base pour évaluer les menaces des opérations de pêche et être une base de
réflexion pour la mise en place de mesures de conservation possibles pour les espèces de poissons
démersaux le long de la côte Libanaise en vue d’une gestion plus durable des ressources.

269
Chapitre V - Les relations longueur-poids d’une trentaine d’espèces démersales dans les eaux marines
libanaises, Méditerranée orientale.
Dans le chapitre 5, des relations longueur-poids (RLP) ont été présentées pour une trentaine d’espèces
démersales dans les eaux marines libanaises, en Méditerranée orientale.
L'information relative aux RLT des espèces démersales était presque absente le long de la côte libanaise.
Cette étude a permis d’établir des RLT pour une trentaine d’espèces, parmi lesquelles certaines
commercialement importantes et des migrateurs lessepsiens. Les RLT peuvent servir d'outil pour soutenir
les mesures de gestion des pêches en fixant une limite minimale de capture lorsque les longueurs sont
estimées en mer.
Les RLP de 3 espèces de poissons démersaux ont été publiées dans la revue « journal of applied
Ichtyology ». Il s’agissait d’espèces pour lesquelles aucune RLP n’avait jusqu’alors été publiée en
Méditerranée. Le résumé de cette étude est indiqué ci-après :
Les RLP ont été estimées pour 3 espèces démersales, des eaux marines libanaises, Méditerranée orientale,
à savoir Coelorinchus caelorhincus (Risso, 1810), Scorpaena elongata (Cadenat, 1943) et Stephanolepsis
diaspros (Fraser Brunner, 1940). Les spécimens ont été prélevés au moyen de trémails et de filets maillants
de juin 2012 à octobre 2014. Les valeurs du paramètre b des RLP W = aLb allaient de 2.922 à 3.708. Un
dimorphisme sexuel prononcé dans la RLP a été observé pour S. diaspros et aucune espèce n'a montré un
modèle de distribution géographique fondé sur la RLP. Ces relations signalées dans cette étude ne doivent
être appliquées que dans les gammes de longueurs observées.
Il est envisagé de publier les RLP des autres espèces dans la revue « Egyptian Journal of Aquatic Research »
et elles sont présentées à la suite du précédent article. Des comparaisons ont été effectuées avec les RLT
établies dans d’autres régions géographiques proches. Les différences observées pourraient être dues à des
procédures d'échantillonnage ou refléter l'influence des différences de facteurs environnementaux ou
d'habitat.
Les RLT présentées dans cette étude sont uniquement utiles et efficaces pour les populations de poissons
démersaux de la côte libanaise et pour les gammes de longueur et les sexes spécifiques étudiés.
Chapitre V - Biologie des populations du migrant Lessepsien Sargocentron rubrum (Forsskål, 1775) le long
de la côte libanaise, Méditerranée orientale
Dans le dernier chapitre de la thèse, un focus a été porté sur la biologie et l’écologie d’une espèce
lesseptienne la plus abondante dans les captures des eaux côtières libanaises.
Cette étude se concentre sur la biologie et l’écologie de la population d’Holocentre rouge Sargocentron
rubrum, une espèce de poisson téléostéen et lessepsienne des eaux côtières libanaises. Entre juin 2012 et
octobre 2014, 1109 individus ont été capturés par des trémails et des filets maillants de maillages
différents, abaissés par les navires de pêche artisanale au-dessus des eaux marines libanaises côtières à des

270
profondeurs allant de 10 à 100 m. La longueur totale (LT) des spécimens échantillonnés variait de 12 à 22
cm avec une moyenne et un écart-type (sd) qui était respectivement de 17,38 et 1,69 cm. La classe de LT la
plus courante était de 18 cm. Le poids total des spécimens variait de 33 à 248 g, et la moyenne ± sd était de
97,56 ± 29,74 g. Un total de 432 mâles et 314 femelles ont été recueillis, et le rapport de masculinité était
significativement différent de 1: 1. Le poids et la relation longueur-poids ont montré une croissance
allométrique légèrement négative (b = 2,993 et r2 = 0,86), et la moyenne ± sd des LT où 50% des individus
étaient sexuellement matures était de 17,62 ± 2,28 cm pour les femelles et de 17,45 ± 3,87 cm pour les
mâles. Les principales proies trouvées dans les estomacs de poissons étaient des crabes (infra-ordre des
Brachyura) et en particulier ceux appartenant au genre Thalamita. S. rubrum est un prédateur
extrêmement actif entre mai et août alors qu'il se nourrit peu lors des saisons froides. Les estomacs ont
montré la plus grande abondance en termes de nombre et de poids au mois d'août. La durée de vie de S.
rubrum est supérieure à 6 ans avec une taille maximale réalisable, L∞ = 21.315 cm. Les résultats de cette
étude permettront de paramétrer les modèles de dynamique des populations de ce stock halieutique
exploité afin de mieux comprendre son rôle dans le fonctionnement de l'écosystème et les interactions
avec d'autres espèces indigènes exploitées commercialement.
Chapitre VII - Discussion générale, conclusion et perspectives
Les espèces démersales sont soumises à diverses menaces à travers le monde, en particulier en mer
Méditerranée. La présence et le statut des populations démersales ont été décrits pour la plupart des
régions méditerranéennes à l'exception du bassin oriental et notamment le long de la côte syro-libanaise
où les informations sur l'abondance, la répartition et les assemblages de ce groupe d’espèces sont encore
déficientes. Dans ce contexte, deux principaux aspects ont été abordés :
- La distribution et la diversité de ce groupe d’espèces le long de la côte libanaise et l’établissement de
relations taille-poids pour les espèces trouvées dans les captures ;
- L’approfondissement des connaissances relatives à certains traits d'histoire de vie d’une espèce de
poisson lesseptienne majoritairement exploitée dans la région, l’holocentre rouge.
Adopter des méthodologies appropriées. Les enquêtes sur l'abondance sont fréquemment utilisées pour
obtenir des informations sur la taille et la répartition du stock. Les espèces de poissons démersaux marins
sur fond meubles sont généralement arpentées par des chaluts de fond, tandis que les espèces pélagiques
sont majoritairement étudiées par des méthodes acoustiques calibrées par les captures au chalut. Dans le
cas du Liban, les espèces commerciales les plus importantes sont typiquement côtières et réparties sur des
zones où le chalutage standard ne peut pas être effectué. Dans cette situation, d'autres engins de pêche
(par exemple des palangres, des filets maillants et des pièges) devaient être utilisés pour explorer les zones.
De plus, les activités de chalutage sont interdites dans les eaux territoriales libanaises. Pour cette raison,
soutenus par des pêcheurs et des scientifiques, nous avons développé un filet expérimental capable de
fonctionner sur le plateau continental et la pente supérieure, avec de mauvaises propriétés de sélectivité
pour capturer une variété d'espèces et de tailles de poissons et d'autres organismes. Nous avons estimé
que des relevés indépendants de la pêche était l'outil le plus approprié pour fournir des mesures précieuses
de l'abondance relative, des taux de variation de la population, de la taille et de la composition par sexe
pour un large éventail d'espèces démersales. En fait, ce type de relevés constituent la pierre angulaire de

271
nombreuses évaluations des stocks de poissons osseux et de mollusques, car ils sont moins sujets aux
facteurs inconnus et souvent confondants qui compliquent l'interprétation des indices de l'état des stocks.
ESPÈCES DÉMERSALES
Présence et diversité. La surpêche, les prises accessoires, l'introduction d'espèces non indigènes, la
pollution, la perte d'habitat et le changement climatique sont les principales sources de stress affectant les
ressources démersales méditerranéennes. Le bassin du Levant est décrit comme ayant une faible diversité
biologique en raison des conditions défavorables qui prévalent dans la zone mais aussi, le plus
probablement, d’un effort d'échantillonnage réduit. Les pêches peuvent affecter les relations entre les
espèces et la pêche intensive entraîne la disparition d'espèces plus grandes et à longue durée de vie,
générant une pression de sélection importante pour la maturation précoce et des écosystèmes moins
résilients.
Le gouvernement libanais est engagé dans la mise en œuvre de mesures de gestion sur les ressources
halieutiques qui nécessitent un avis scientifique solide, sur la base d'une connaissance accrue sur la
diversité et la répartition de ces espèces (et pélagiques) le long de la côte libanaise par rapport à la
profondeur et à la présence d'espèces exotiques d'origine indo-pacifique et sur leurs traits de vie. C’est
pourquoi cetta étude s’est focalisée sur ces principaux aspects et à long terme, les résultats de l'étude sont
censés contribuer à la mise en place d'une gestion des pêches plus efficace et durable en Méditerranée
orientale.
Les espèces de poissons démersaux sont exigées dans le monde entier pour leurs parties de grande valeur
et l'état des stocks varie selon le pays ou la région. En Méditerranée et la mer Noire, 50 % du stock de
poissons est surpêché. Les pêcheries méditerranéennes sont dominées par de petits navires, dispersés sur
un grand nombre de sites de débarquement dans la plupart des pays. Elles ont développé une multitude de
métiers et d'échelles d'investissements. Dans le cadre de la présente étude, un total de 129 espèces ont été
enregistrées à des profondeurs allant de 10 à 300 m. La plupart de ces espèces était démersales, et incluait
les espèces les plus importantes sur le plan économique, à savoir le merlu européen, le rouget, la pandorée
et les crevettes rouges. Les fluctuations et les pics des indices de diversité des espèces démersales selon les
saisons et les régions le long de la côte libanaise ont été étudiés.
Espèces lesseptiennes. Dans notre étude, 129 espèces dont 17 espèces d'origine lessepsienne (environ 13%
incluant 13 poissons et 4 espèces de crustacés) ont été recensés dans les eaux côtières libanaises, incluant
15 démersales, 1 pélagique (le hareng Etrumeus teres) et 1 à comportement mixte benthique-pélagique.
Avant cette étude, un seul inventaire des ressources halieutiques libanaises sur l'ensemble des eaux
côtières du pays datant de 1964 était disponible. Dans ce recensement, 177 espèces de poissons dont 19
d'origine indo-pacifique étaient signalées (soit presque 11 %).
Cela signifie qu'en 50 ans, le pourcentage du nombre d’espèces halieutiques autochtones est resté
relativement stable. Bien qu'on peut supposer qu’en termes de biomasse, les valeurs étaient plus faibles il y
a 50 ans qu'aujourd'hui. A la suite d’une étude dans les eaux syriennes, 224 espèces de poissons osseux ont
été signalées, dont 37 étaient lesseptiennes (16,5%). Dans une autre étude, la proportion estimée est plus
importante (25 espèces lesseptiennes sur plus de 110 espèces identifiées, soit 23%).
La mer Méditerranée - et plus particulièrement ses côtes orientales - est l'un des points chauds les plus
chauds des bioinvasions marines sur Terre. Le succès des migrants de Lesseps dans la colonisation de la
Méditerranée orientale a probablement été le résultat de l'occupation d'une niche insaturée et d'espèces

272
locales sur-compétitives sur des ressources telles que la nourriture et le logement. De nombreux auteurs
attribuent le taux d'entrée accéléré à une augmentation de la température de l'eau de surface en
Méditerranée. Cependant, le canal de Suez a été approfondi et élargi à plusieurs reprises au cours des
dernières décennies et suite selon d’autres auteurs, l'augmentation du taux d'immigration des poissons de
la mer Rouge pourrait également être davantage liée à la réduction des barrières de dispersion. Le succès
de l'établissement des poissons de Lesseps était également significativement lié à la taille et au type de
ponte. La récente extension du canal de Suez en 2015, pourrait exacerber la menace de la menace d'une
augmentation spectaculaire du nombre d'espèces exotiques introduites.
Cependant, dans les assemblages d'eaux plus profondes, nous avons observé que les espèces autochtones
prévalent confirmant la préférence des poissons lesseptiens pour les eaux peu profondes. Selon la présente
étude, l'espèce la plus abondante de poissons de Lesseps dans les eaux libanaises est de loin, Sargocentron
rubrum. Malgré sa colonisation réussie dans les eaux côtières de la Méditerranée orientale et sa capacité à
se reproduire sur de longues distances, se reproduisant en eau libre ou dispersant des œufs sur le substrat,
la répartition méditerranéenne de cette espèce reste limitée à l'ouest de la mer Egée bien qu'il ait été
signalé dans les eaux côtières en Grèce il y a environ 70 ans.
La population libanaise de S. rubrum ne semble pas souffrir de surpêche ou d'autres menaces. Cependant,
les mesures de gestion des ressources démersales, fortement affectées par les activités de pêche, devraient
tenir compte du rôle écologique de cette espèce et de l'extension possible de ses congénères
géographiques et de l'élargissement continu de la présence de la famille des Holocentridae en
Méditerranée.
Indice d'abondance et variations spatio-temporelles. L'analyse de l'effort de capture par unité (CPUE) et
de la variation totale de poids des poissons démersaux observée durant cette étude a permis d'obtenir des
indications sur la variation spatio-temporelle de leur distribution et de leur abondance. Bien que les causes
de la distribution spatiale d'une population de poissons soient encore mal comprises, les processus
dépendants de la densité sont souvent suggérés comme une explication possible ainsi que le
réchauffement récent du système climatique. Cependant, la nature des eaux libanaises, la disponibilité des
proies, les mouvements journaliers et saisonniers de reproduction et d'alimentation ainsi que les
techniques de pêche et les profondeurs de la pêche peuvent expliquer dans une certaine mesure la
variation de la distribution et de l'abondance.
De nombreux auteurs ont analysé les changements fauniques et l'établissement de certains assemblages
qui se produisent dans les zones ciblées par la pêche artisanale, c'est-à-dire le plateau continental et la
pente supérieure. Ils ont prouvé que la distribution spatiale des espèces démersales est principalement
influencée par la profondeur, le type de substrat et les caractéristiques physiques des masses d'eau.
En ce qui concerne la diversité spatio-temporelle et la répartition des espèces observées dans cette étude,
les deux ont montré des variations saisonnières et, dans certains cas, de légères différences régionales. La
sélection de l'habitat par les espèces démersales dépend de plusieurs facteurs biotiques et abiotiques tels
que la profondeur, la température et la salinité. D'autres facteurs peuvent expliquer la structure de
l'abondance et de la répartition, notamment la structure de l'habitat, l'exposition des vagues, les rivières, la
turbidité, les niveaux de nutriments ou encore les concentrations en métaux lourds.

273
Planification de la gestion stratégique. La valorisation des pêcheries au Liban devrait être poursuivie à
travers des plans de gestion qui relanceraient l'opérationnalisation de la planification spatiale marine. Cela
pourrait être fait en évaluant l'abondance et la répartition des ressources halieutiques, en identifiant les
frayères, en sélectionnant les zones affectées à l'aquaculture, en établissant des zones de pêche
réglementées, ou encore en découvrant de nouvelles zones de pêche.
En 2017, la Commission générale des pêches pour la Méditerranée (CGPM) a formellement déclaré que des
enquêtes scientifiques de type MEDITS (programme international d'échantillonnage de l'abondance des
poissons démersaux) devraient être menées au Liban d'ici 2019-2020.
En outre, les résultats de cette étude peuvent encourager à plus long terme la mise en œuvre ou la gestion
efficace des Aires Marines Protégées (AMP) le long de la côte libanaise, ce qui à terme serait bénéfique aux
pêcheurs. Dans ce cadre des activités autour de l'écotourisme pourraient être encouragées.
Aspects du cycle de vie et surexploitation. Des études sur les paramètres du cycle de vie tels que l'âge et la
croissance, ainsi que des informations de base sur la répartition, l'abondance, les mouvements,
l'alimentation, la reproduction et la génétique sont essentielles pour comprendre et prédire comment les
populations évolueront et réagiront aux différents stimuli. En raison de la définition large du terme «
démersal », différents traits d'histoire de vie sont présentés dans ce groupe. Généralement, les espèces
démersales montrent des mouvements d'adultes relativement restreints. Leurs stades juvéniles pélagiques
représentent leur mécanisme de dispersion le plus important, bien que des preuves génétiques montrent
que les stades pélagiques échouent souvent à atteindre leur potentiel de dispersion.
Les évaluations formelles des stocks n'ont pas été effectuées au Liban. Des outils opérationnels
d'évaluation des captures sont en cours de développement et devraient fournir rapidement des résultats
clairs sur les débarquements et l'abondance des espèces. L'effort de la flotte de pêche libanaise se
concentre principalement dans les 6 milles nautiques entraînant une pression de pêche élevée les
ressources halieutiques côtières, en particulier dans la zone des 3 milles marins. L'état des ressources
halieutiques hauturières entre 6 et 12 milles marins n'est pas connu, mais il peut être considéré comme des
stocks vierges car pratiquement aucune activité de pêche n'est pratiquée dans cette zone. Les abondances
et des biomasses observées dans cette étude ont montré des signes de surexploitation et étaient plus
faibles dans le Sud que dans le Nord et centre du Liban. Cependant, la grande hétérogénéité des habitats
présents dans la zone d'étude permet d'accueillir une grande diversité d'espèces de poissons.
Contexte et recommandations.
Les revenus de la flotte de pêche libanaise ont généré un salaire annuel moyen d'environ 4 300 USD, ce qui
est inférieur au salaire minimum du Liban pour le secteur manufacturier. Le Liban a commencé à faire
rapport à la FAO sur les captures de pêche (2 998 tonnes en 2014 et 3 483 tonnes en 2015) sur la base du
système FAO EastMed. Les communautés de pêcheurs soient considérées parmi les plus pauvres du pays et
les plus marginalisées. Il n'y a ni contrat de travail au Liban, ni couverture sociale, qui pourrait protéger les
pêcheurs en cas d'invalidité, de perte d'emploi et de retraite.
Les données collectées dans cette étude nous amènent à faire un certain nombre de recommandations : 1)
des échantillonnages de la répartition et de l'abondance des ressources halieutiques sur l'ensemble de la
côte libanaise indépendants de la pêche devraient à l’avenir être plus réguliers pour assurer des ensembles
de données continus et comparables pour une gestion correcte des ressources ; 2) lorsque les ressources
financières le permettraient, la mise en œuvre d'un second échantillonnage en période hivernale (janvier et

274
février) serait nécessaire pour améliorer les connaissances sur la biologie et la répartition des espèces selon
la saison ; 3) le rôle écologique d'un ensemble défini d'espèces commerciales doit être étudié en
profondeur à travers l'analyse de leur contenu stomacal ; 4) leur âge doit être identifié en utilisant les
otolithes des poissons ; 5) en ce qui concerne les engins d'échantillonnage, il est fortement conseillé
d'élargir l'utilisation des trémails à l'ensemble de la profondeur étudiée (0 à 150 m de profondeur) ; 6 ) afin
d'assurer la liaison avec le secteur des opérateurs vers l'acquisition constante d'informations scientifiques,
il est conseillé de créer un réseau de points focaux (pêcheurs) répartis dans les principaux ports libanais et
prêts à signaler les captures ou observations anormales ou imprévues. Il conviendrait également d’accroître
les connaissances écologiques sur le plateau continental et la pente continentale.
CONCLUSION ET PERSPECTIVES
La compréhension quantitative des réponses aux activités de pêche est nécessaire pour permettre aux
gestionnaires et aux décideurs d'établir des stratégies rationnelles. En d'autres termes, la gestion des
pêches nécessite un suivi de la variation de l'abondance et de la répartition des ressources sur la base d'une
procédure normalisée internationale. Plusieurs pays méditerranéens participent actuellement au
programme international d'enquêtes sur l'abondance des poissons appelé MEDITS. Ici, il vaut la peine de se
concentrer sur de nouveaux outils déjà développés dans d'autres pays, qui peuvent compléter les données
recueillies grâce aux enquêtes sur la pêche.
La structure d'âge de la population peut être décrite et les taux de processus clés tels que la croissance, le
recrutement et la mortalité peuvent être quantifiés. Les otolithes de Pagellus peuvent être difficiles pour
l'identification correcte des anneaux d'hiver, les schémas de vieillissement et le chevauchement des
anneaux dans les spécimens les plus anciens. Dans le cas de Sargocentron rubrum, et ont abouti à une
conclusion différente pour la première lecture du cycle d'hiver, entraînant un vieillissement différent pour
l'espèce.
Analyse génétique et science citoyenne. La difficulté d'identifier les espèces a rendu la surveillance du
commerce des produits dérivés de requins et empêché l'évaluation quantitative des stocks. Les résultats
des analyses génétiques peuvent être utiles pour aborder les questions de génétique des populations, en
révélant si deux populations disjonctives partagent un pool génétique commun ou en clarifiant les relations
taxinomiques entre les espèces. Dans ce contexte, en utilisant les techniques de code-barres de l'ADN, on
est arrivé à la conclusion que plus d'une espèce appartenant au genre Sargocentron est entrée dans le
temps la Méditerranée de la mer Rouge, non signalée et probablement mal identifiée. La participation
communautaire est également un instrument important pour sensibiliser le public au problème des
espèces marines envahissantes.
Les isotopes stables. En particulier, en Méditerranée orientale, où les NEI modifient les équilibres
précédents, il est essentiel de répondre correctement aux questions concernant les conséquences
fonctionnelles des remplacements d'espèces. C'est une façon puissante de représenter les caractéristiques
trophiques des organismes sur lesquels s'appuie la recherche de niche qui propose des estimations à long
terme des proies incorporées dans les tissus prédateurs, avec des applications prometteuses en biologie de
l'invasion. La composition isotopique stable fournit une indication de l'origine et des transformations de la
matière organique pour retracer l'utilisation et les flux des ressources de l'individu au niveau de la
communauté.

275
La répartition des espèces migratrices est cruciale pour bien évaluer les stocks. Le biais peut être généré
lorsque la connaissance des schémas migratoires des espèces n'est pas connue ou sous-estimée. Une façon
évidente et peu coûteuse est de consulter les connaissances des pêcheurs. Les échosondeurs communs
sont très utiles pour la détection des migrations verticales, tandis que des équipements acoustiques plus
sophistiqués peuvent être utilisés pour cartographier la distribution et estimer l'abondance, en
relativement peu de temps, en particulier des petits poissons pélagiques.
La façon classique d'étudier les mouvements des poissons et des invertébrés est un programme de
marquage. Des étiquettes d'identification sont attachées à l'extérieur ou placées dans la cavité corporelle,
le poisson est mesuré et relâché à un endroit connu, et une récompense est donnée pour toute étiquette
retournée. Des étiquettes acoustiques et radio sophistiquées ont été développées pour permettre
l'observation continue des mouvements d'un seul poisson comme suite d'un navire de recherche. La mer
Méditerranée - et plus particulièrement ses côtes orientales - est l'un des points chauds les plus chauds des
invasions marines sur terre.
Autres issues. Un certain nombre d'actions devraient être mises en œuvre pour permettre une croissance
durable de l'ensemble du système pouvant conduire à une évaluation autonome, fiable et
internationalement acceptable des ressources halieutiques au Liban. Ils devraient être soutenus par un
effort continu vers le développement du programme de doctorat dans des sujets liés à l'écologie marine.
Un personnel pluridisciplinaire doit être mis en place afin de répondre au développement rapide des
sciences dans ce secteur. Des essais de pêche devraient être organisés et menés avec des pêcheurs
professionnels afin d'augmenter le nombre de métiers disponibles.
Le rôle social et culturel des pêcheries artisanales reflète les liens historiques avec les ressources
halieutiques, les traditions et les valeurs adjacentes et le soutien de la cohésion locale. Partout dans le
monde, environ la moitié des personnes impliquées dans le secteur de la pêche sont des femmes,
principalement engagées dans des activités post-récolte, manipulant le poisson après sa capture et
assurant que cette source importante de nutrition atteint plus d'un milliard de consommateurs pour
lesquels composante clé de leur alimentation.

276

277
Abstract (1000 characters)
The aim of this study was to contribute to a better knowledge of demersal species in the Lebanese coastal
waters, Eastern Mediterranean. Various aspect related to the distribution, diversity and biology of these
species were studied. The data were collected from a three-year experimental survey in the framework of
the ‘CIHEAM-PESCA Libano project’. A highly diversified mix of fish species (teleosteans and selaceans),
cephalopods and crustaceans were sampled. Spatio-temporal distribution and diversity was evaluated
respectively using the ‘Catch Per Unit Effort’ which was considered as an approximation of an abundance
index and the total number of species caught in the surveys.
Length-weight relationships have been established for several species with sufficient numbers of
individuals. Finally, emphasis was placed on the biology and ecology of a Lessepsian species, the redcoat,
Sargocentron rubrum. This study is a first step in fisheries management and conservation in this region.
Keywords
Lebanon, Conservation, Fisheries, Life history, Ecology, Suez Channel
Résumé
L’objectif de cette étude était de contribuer à une meilleure connaissance des espèces démersales dans les
eaux côtières libanaises en Méditerranée orientale. Différents aspects relatifs à la distribution, la diversité,
et la biologie de ces espèces ont été étudiés. Les données ont été collectées à partir de captures
expérimentales dans le cadre du projet ‘CIHEAM-PESCA Libano’. Un mélange hautement diversifié
d'espèces de poissons (téléostéens et sélaciens), de céphalopodes et de crustacés, ainsi que de organismes
macro-benthiques ont été échantillonnés. La distribution spatio-temporelle et la diversité ont été évaluées
respectivement à l'aide de la ‘capture par unité d'effort’ qui a été assimilée à un indice d’abondance et du
nombre total d'espèces capturées dans les relevés.
Des relations longueur-poids ont été établies pour plusieurs espèces présentant un nombre d’individus
suffisant. Finalement, l'accent a été porté sur la biologie et l'écologie d'une espèce lesseptienne et
exploitée, l’holocentre rouge, Sargocentron rubrum. Cette étude constitue une première étape dans la
gestion des pêches et la conservation dans cette région.
Mots clés
Liban, Conservation, Pêcheries, Traits de vie, Ecology, Canal de Suez

278
Abstract (4000 characters)
Due to its geographical location, Lebanon represents an outpost for a comprehensive understanding of the
dynamics driving the colonization of the Mediterranean by Indo-Pacific and Red Sea species. A 3-year experimental fishing surveys program was initiated in the framework of the ‘CIHEAM-PESCA Libano
project’ and was continued by the National Council for Scientific Research, Lebanon (CNRS-L). Sampling stations were surveyed by means of experimental nets lowered up to 300 m depth aiming at assessing the distribution and abundance of fisheries resources along the Lebanese continental shelf and mid-upper slope. A fishery-independent survey was deemed as the most appropriate tool to provide valuable measures of relative abundance, rates of population change, size and sex composition for a wide range of species.
A highly diversified mix of fish species (bony fishes and selaceans), cephalopods and crustaceans. This gave us the chance to:
1. Investigate the biodiversity of Lebanese demersal species 2. Collect information on biological traits, relative abundance and distribution of demersal species 3. Widen the knowledge on demersal communities exploited by Lebanese artisanal fisheries 4. Investigate the ecological traits of the redcoat, a key demersal Lessepsian fish species
Spatio-temporal distribution and diversity was evaluated respectively using the ‘Catch Per Unit Effort’ which was considered as an estimation of an abundance index and the total number of species caught in the surveys. Data showed the depth to cause a general decrease in the numerical abundance and biomass (beyond 150 m depth) due to a reduction of the abundance of bony fishes, which decreased with depth, while decapod crustaceans and elasmobranchs showed an opposite trend increasing from the coastal shelf to the middle slope.
As the understanding of patterns of spatial distribution of fish populations is a critical consideration particularly in the eastern Mediterranean Sea, where the faunal composition has been drastically altered by the migration of numerous Indo-Pacific species from the Red Sea, species assemblages occurring along the Lebanese continental shelf and exploitable using gillnets and trammel nets were investigated.
In Lebanon - where management measures are limited or outdated and the fishing pressure is high on coastal fisheries resources while fishing practices targeting juvenile fishes are partially driven by the market - the use of basic but powerful descriptive tools of halieutic populations such as WLRs is highly recommended. In this study, WLRs were established for 30 species (24 bony fishes, 3 elasmobranches and 3 crustaceans).
The population of the redcoat, Sargocentron rubrum, a Lessepsian species inhabiting the eastern Mediterranean has reached considerable size since more than three decades. According to the present study is the most abundant coastal demersal species in Lebanon. Despite its important ecological role, biological traits, abundance and behavior of this species have been scarcely investigated. Hence, the biology and ecology of this species were deeply investigated and parameters for population dynamics were assessed as a tool to better understand its role in the ecosystem functioning and the interactions with other commercially exploited native species.
The present thesis also includes a description of the Lebanon’s fisheries sector that includes socioeconomic characteristics, environmental context and governance-related aspects, and a short essay on main traits, history, causes and effect of the so called Lessepsian migration based on original contents and bibliographic review.