GIS-based River Flood Hazard Mapping in Urban Area (A ...
13
Sina Alaghmand et al. / International Journal of Engineering and Technology Vol.2 (6), 2010, 488-500 GIS-based River Flood Hazard Mapping in Urban Area (A Case Study in Kayu Ara River Basin, Malaysia) Sina Alaghmand 1 , Rozi bin Abdullah 2 , Ismail Abustan 2 and Behdokht Vosoogh 3 1 Ph.D. Student in Water Research Centre, University of South Australia Address: H2-19, Water Research Centre, Mawson Lakes Campus, University of South Australia, 5095, Adelaide, Australia. H/P: +61405090947 Email: [email protected] , [email protected] 2 Assoc. Prof. of School of Civil Engineering, Universiti Sains Malaysia (USM) 3 B.Sc. Student in Department of Water Engineering, Gorgan University of Agricultural Sciences and Natural Resources, Iran Abstract: In the past decades, thousands of lives have been lost, directly or indirectly, by flooding. In fact, of all natural hazards, floods pose the most widely distributed natural hazard to life today. Sungai Kayu Ara river basin which is located in the west part of the Kuala Lumpur in Malaysia was the case study of this research. In order to perform river flood hazard mapping HEC-HMS and HEC-RAS were utilized as hydrologic and hydraulic models, respectively. The generated river flood hazard was based on water depth and flow velocity maps which were prepared according to hydraulic model results in GIS environment. The results show that, magnitude of rainfall event (ARI) and river basin land-use development condition have significant influences on the river flood hazard maps pattern. Moreover, magnitude of rainfall event caused more influences on the river flood hazard map in comparison with land-use development condition for Sungai Kayu Ara river basin. I. INTRODUCTION Starting in the year 2000s, extreme rainfall events with high intensity are not longer a new issue in Malaysian urban cities, especially in the West Coast area. This phenomenon is formed mostly through convection process [1]. Hence, flooding is one of the major natural hazards affecting communities across Malaysia and has caused damages worth millions of dollars every year. The required allocation for flood mitigation projects has increased almost 600% (RM 6000 million) for the 8 th Malaysian Plan compared to RM 1000 million during the 7 th Malaysian Plan [2]. River flood hazard management is the process under which different bodies try to reduce the current and the future vulnerability of human society to natural hazards. The main objectives of river flood hazard mapping can be sorted as follows: to prevent loss of life, to minimize property damage, to minimize social disruption and to encourage coordinated approach for land/water use. The role of flood mapping in river engineering is an important feature in planning and management: basis for managing flood plains, engineering & planning tool, first step in flood plain management, part of legislation for regulating development and basis for pursuing structural and non- structural measures. Hazard is defined as threatening event, or the probability of occurrence of a potentially damaging phenomenon within a given time period and area. Hazard refers to the probability of a potentially dangerous phenomenon occurring in a given location within a specified period of time [3]. Thus, it can be defined that hazard (or cause) as a potential threat to humans and their welfare and risk (or consequence) as the probability of the specific hazard occurrence [4, 5]. Human practices such as the alteration of natural drainage, the creation of landfills, or the destruction of the natural environments and increased groundwater extraction may radically alter the pattern of the hazard behaviour. Results of human habitation such as unplanned rapid urban development, uncontrolled logging of natural forests or major changes in land-use can influence the spatial and temporal pattern of the hazards. River flood mapping is the process of determining inundation extents and depth by comparing river water levels with ground surface elevation. The process requires the understanding of flow dynamics over the flood plain, topographic relationships and the sound judgments of the modeller [4, 6]. Flood hazard maps produced may include water depth, flood extent, flow velocity and flood duration. This is a basic and important indicator for the flood plain land use development planning and regulations [7]. River flood hazard mapping was first initiated in 1988 in the United States by the Hydrologic Engineering Centre (HEC) of the U.S. Army Corps of Engineers [5, 8]. The purpose of the study is mainly to produce flood hazard maps for the National Insurance Program (NFIP) due to the reluctance of private insurance industry in providing insurance policies as a result of catastrophic losses [5]. All the existing methods for flood plain mapping can be grouped into the following three major categories namely the analytical method, the historical method and the physiographic method [9]. All these three methods share two common steps for flood plain mapping; determination of water surface profiles and transfer of water elevation from profiles to maps. Essentially these three methods use the same procedure to delineate flood plain boundaries by determining the flood elevation at each river cross section. The boundaries are then interpolated between the cross ISSN : 0975-4024 488
-
Upload
khangminh22 -
Category
Documents
-
view
4 -
download
0
Transcript of GIS-based River Flood Hazard Mapping in Urban Area (A ...

Sina Alaghmand et al. / International Journal of Engineering and Technology Vol.2 (6), 2010, 488-500
GIS-based River Flood Hazard Mapping in Urban Area (A Case Study in Kayu Ara River
Basin, Malaysia)
Sina Alaghmand1, Rozi bin Abdullah2, Ismail Abustan2 and Behdokht Vosoogh3
1 Ph.D. Student in Water Research Centre, University of South Australia Address: H2-19, Water Research Centre, Mawson Lakes Campus, University of South Australia, 5095, Adelaide, Australia.
H/P: +61405090947 Email: [email protected], [email protected]
2 Assoc. Prof. of School of Civil Engineering, Universiti Sains Malaysia (USM) 3 B.Sc. Student in Department of Water Engineering, Gorgan University of Agricultural Sciences and Natural Resources, Iran
Abstract: In the past decades, thousands of lives have been
lost, directly or indirectly, by flooding. In fact, of all natural hazards, floods pose the most widely distributed natural hazard to life today. Sungai Kayu Ara river basin which is located in the west part of the Kuala Lumpur in Malaysia was the case study of this research. In order to perform river flood hazard mapping HEC-HMS and HEC-RAS were utilized as hydrologic and hydraulic models, respectively. The generated river flood hazard was based on water depth and flow velocity maps which were prepared according to hydraulic model results in GIS environment. The results show that, magnitude of rainfall event (ARI) and river basin land-use development condition have significant influences on the river flood hazard maps pattern. Moreover, magnitude of rainfall event caused more influences on the river flood hazard map in comparison with land-use development condition for Sungai Kayu Ara river basin.
I. INTRODUCTION
Starting in the year 2000s, extreme rainfall events with high intensity are not longer a new issue in Malaysian urban cities, especially in the West Coast area. This phenomenon is formed mostly through convection process [1]. Hence, flooding is one of the major natural hazards affecting communities across Malaysia and has caused damages worth millions of dollars every year. The required allocation for flood mitigation projects has increased almost 600% (RM 6000 million) for the 8th Malaysian Plan compared to RM 1000 million during the 7th Malaysian Plan [2].
River flood hazard management is the process under which different bodies try to reduce the current and the future vulnerability of human society to natural hazards. The main objectives of river flood hazard mapping can be sorted as follows: to prevent loss of life, to minimize property damage, to minimize social disruption and to encourage coordinated approach for land/water use. The role of flood mapping in river engineering is an important feature in planning and management: basis for managing flood plains, engineering & planning tool, first step in flood plain management, part of legislation for regulating development and basis for pursuing structural and non-structural measures.
Hazard is defined as threatening event, or the probability of occurrence of a potentially damaging phenomenon within a given time period and area. Hazard refers to the probability of a potentially dangerous phenomenon occurring in a given location within a specified period of time [3]. Thus, it can be defined that hazard (or cause) as a potential threat to humans and their welfare and risk (or consequence) as the probability of the specific hazard occurrence [4, 5]. Human practices such as the alteration of natural drainage, the creation of landfills, or the destruction of the natural environments and increased groundwater extraction may radically alter the pattern of the hazard behaviour. Results of human habitation such as unplanned rapid urban development, uncontrolled logging of natural forests or major changes in land-use can influence the spatial and temporal pattern of the hazards.
River flood mapping is the process of determining inundation extents and depth by comparing river water levels with ground surface elevation. The process requires the understanding of flow dynamics over the flood plain, topographic relationships and the sound judgments of the modeller [4, 6]. Flood hazard maps produced may include water depth, flood extent, flow velocity and flood duration. This is a basic and important indicator for the flood plain land use development planning and regulations [7]. River flood hazard mapping was first initiated in 1988 in the United States by the Hydrologic Engineering Centre (HEC) of the U.S. Army Corps of Engineers [5, 8]. The purpose of the study is mainly to produce flood hazard maps for the National Insurance Program (NFIP) due to the reluctance of private insurance industry in providing insurance policies as a result of catastrophic losses [5]. All the existing methods for flood plain mapping can be grouped into the following three major categories namely the analytical method, the historical method and the physiographic method [9]. All these three methods share two common steps for flood plain mapping; determination of water surface profiles and transfer of water elevation from profiles to maps. Essentially these three methods use the same procedure to delineate flood plain boundaries by determining the flood elevation at each river cross section. The boundaries are then interpolated between the cross
ISSN : 0975-4024 488
Sina Alaghmand et al. / International Journal of Engineering and Technology Vol.2 (6), 2010, 488-500
section. The three methods differ only in their way of determining the water surface profile. Only the analytical approach can meet the requirement of the Urban Storm-water Management Manual for Malaysia (SWMM), as specified in Volume 4, Chapter 11 which requires that any new development proposals should include base flood elevation (BFE) information [10]. These three methods are labour-intensive, involving the manual interpretation of aerial photos and contour maps and full of uncertainties during the entire mapping process. Because of the high cost incurred, flood plain maps are very difficult to update using these traditional manual methods [4]. Nowadays, scientists and engineers take advantages from computer modelling techniques in determining river flood modelling. Computer models for the determination of river flood generally consists of four parts [11], these are: i. The extraction of geospatial data for use in the
hydrological and hydraulic models (HEC-GeoHMS and HEC-GeoRAS).
ii. The hydrologic model which develops rainfall-runoff from a design rainfall or historic rainfall event (HEC-HMS).
iii. The hydraulic model which routes the runoff through stream channels to determine water surface profiles (including depth and velocity) at specific locations along the stream network (HEC-RAS).
iv. A tool for floodplain mapping and visualization (HEC-GeoRAS). Combination of the hydraulic series data within a
spatial interface, such as a Geographical Information System (GIS) and Remote Sensing (RS), are the key to graphical visualizations on the hydraulic modelling. The increasing availability of very high performance GIS software packages such as ArcGIS offers new opportunities for engineers to perform flood inundation analysis in conjunction with hydraulic models with interactive visualization within immerse decision support environments [4, 12-15]. The GIS technology has the ability to capture, store, manipulate, analyze, and visualize the diverse sets of geo-referenced data [16-18]. On the other hand, hydraulic is inherently spatial and hydraulic models have large spatially distributed data requirements [6, 19, 20]. The integration of hydraulic model and GIS is therefore quite natural. The GIS allows modulation and simulation of different scenarios and the graphic representation of the different alternatives.
In recent years, efforts have been made to integrate hydraulic models and GIS to facilitate the manipulation of the model output which led to the establishment of a new branch of hydraulics and hydrology, namely, hydro-informatics [21-23]. Hydro-informatics encompasses the use of advanced information technology procedures to improve the level of technology in predicting the governing processes of water science and engineering [24]. Traditional computational hydraulic tools which use the FORTRAN programming language running under the MS-DOS system can now be presented in more usable forms.
The introduction of framework based system integrating the object-oriented methodologies in creating modelling tools using Windows Graphical User Interfaces (GUIs) may provide an understandable and highly visualized output for both the hydraulic experts and non-specialist users [21, 23, 25-27]. This concept has also alleviated the desired modularity and re-use of the existing modules in software developments [23, 28, 29]. In general there are four methods for incorporation of river basin models into GIS. They are classified as stand alone system, loose coupling system, tight coupling system and embedded system. In this regard, two ArcGIS extensions which were utilized in this research to incorporate river basin into GIS were HEC-GeoRAS and HEC-GeoHMS those are classified as tight coupling system. These GIS extensions were used to extract the geometry input data and also river flood visualization [30-36].
II. MATERIALS AND METHODS
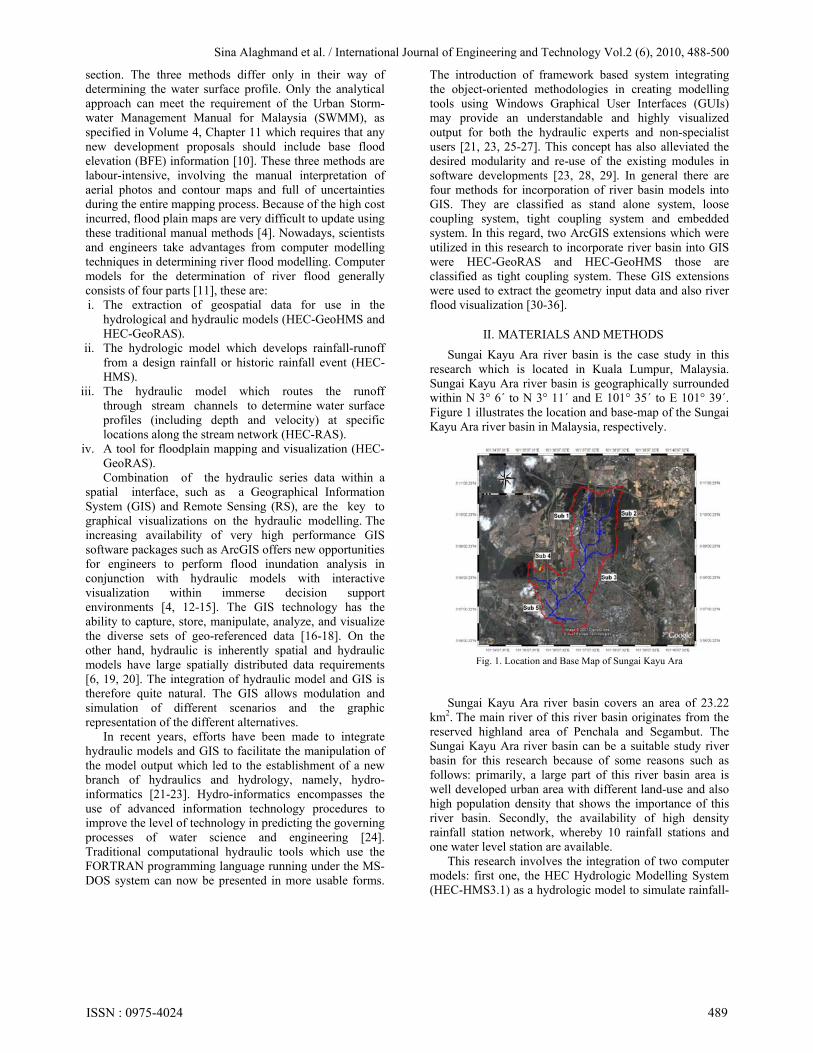
Sungai Kayu Ara river basin is the case study in this research which is located in Kuala Lumpur, Malaysia. Sungai Kayu Ara river basin is geographically surrounded within N 3° 6΄ to N 3° 11΄ and E 101° 35΄ to E 101° 39΄. Figure 1 illustrates the location and base-map of the Sungai Kayu Ara river basin in Malaysia, respectively.
Fig. 1. Location and Base Map of Sungai Kayu Ara
Sungai Kayu Ara river basin covers an area of 23.22 km2. The main river of this river basin originates from the reserved highland area of Penchala and Segambut. The Sungai Kayu Ara river basin can be a suitable study river basin for this research because of some reasons such as follows: primarily, a large part of this river basin area is well developed urban area with different land-use and also high population density that shows the importance of this river basin. Secondly, the availability of high density rainfall station network, whereby 10 rainfall stations and one water level station are available.
This research involves the integration of two computer models: first one, the HEC Hydrologic Modelling System (HEC-HMS3.1) as a hydrologic model to simulate rainfall-
ISSN : 0975-4024 489
Sina Alaghmand et al. / International Journal of Engineering and Technology Vol.2 (6), 2010, 488-500
runoff process and second one, the HEC River Analysis System (HEC-RAS4.0) as a hydraulic model to route the runoff through stream channels to determine water surface profiles at specific locations along the stream network. In order to assess the effects of rainfall event magnitude (ARI) and also river basin land-use development condition on river flood hazard maps, hydrological modelling, hydraulic modelling and river flood mapping were conducted for three different ARI event (20, 50 and 100 years) in existing, intermediate and ultimate river basin development conditions using rainfall events with 60 minutes duration (9 scenarios). Note that, in order to differentiate between the various developments conditions, different percentages of imperviousness are estimated for each development conditions. For instance, the percentage of imperviousness for ultimate development condition is higher than intermediate and also existing development conditions. Table I represents the imperviousness percentages for each development conditions for Sungai Kayu Ara river basin.
The methodology of this research for river basin modelling for river flood hazard mapping for Sungai Kayu Ara river basin includes four main components; hydrological modelling, hydraulic modelling, river flood visualization and river flood hazard mapping. Note that, in this research, river flood mapping (visualization) and river flood hazard mapping were differentiated. It means that, river flood mapping consists of visualization of hydraulic modelling results in forms of water depth and flow velocity along the river, while river flood hazard mapping process combines (overlay) water depth and flow velocity maps to recognition and demonstration of the various river flood hazard categories.
Table I. Percentage of Imperviousness Area in Different Development
Conditions
Imperviousness (%)
Development Condition
Existing Intermediate Ultimate
Sub-River Basin 1
26 50 90
Sub-River Basin 2
26 50 90
Sub-River Basin 3
66 80 90
Sub-River Basin 4
36 70 90
Sub-River Basin 5
66 80 90
A. Hydrological Modelling Sungai Kayu Ara River Basin
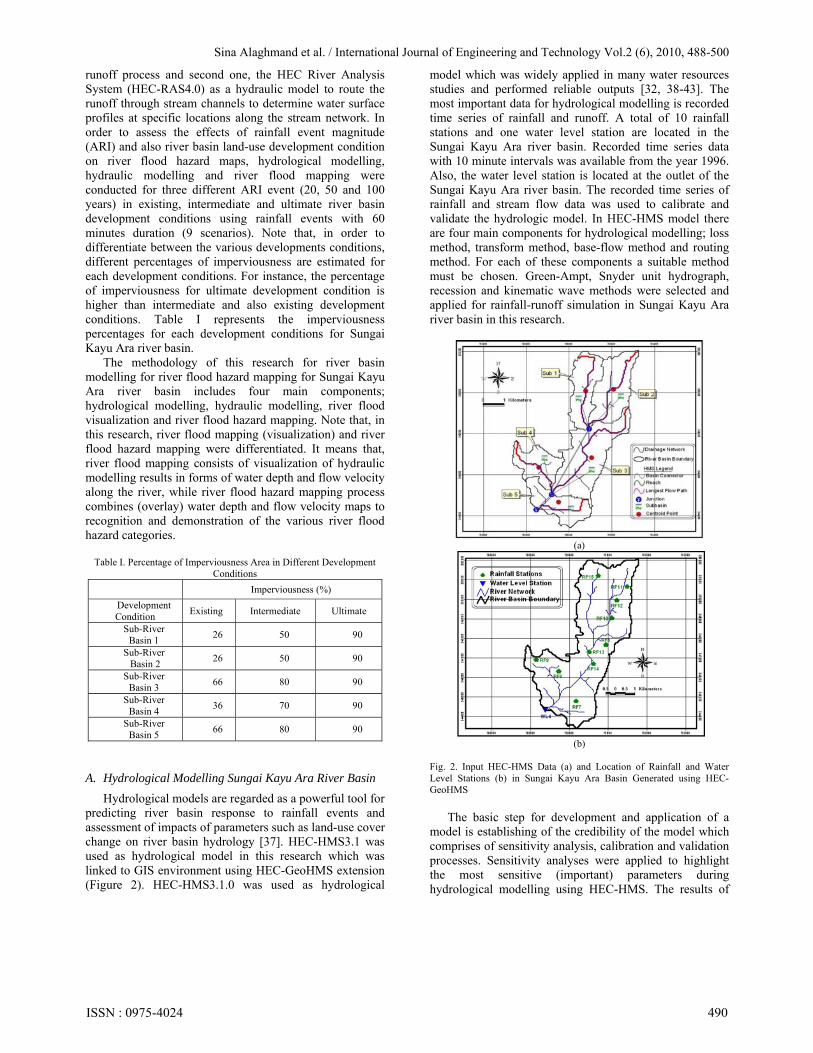
Hydrological models are regarded as a powerful tool for predicting river basin response to rainfall events and assessment of impacts of parameters such as land-use cover change on river basin hydrology [37]. HEC-HMS3.1 was used as hydrological model in this research which was linked to GIS environment using HEC-GeoHMS extension (Figure 2). HEC-HMS3.1.0 was used as hydrological
model which was widely applied in many water resources studies and performed reliable outputs [32, 38-43]. The most important data for hydrological modelling is recorded time series of rainfall and runoff. A total of 10 rainfall stations and one water level station are located in the Sungai Kayu Ara river basin. Recorded time series data with 10 minute intervals was available from the year 1996. Also, the water level station is located at the outlet of the Sungai Kayu Ara river basin. The recorded time series of rainfall and stream flow data was used to calibrate and validate the hydrologic model. In HEC-HMS model there are four main components for hydrological modelling; loss method, transform method, base-flow method and routing method. For each of these components a suitable method must be chosen. Green-Ampt, Snyder unit hydrograph, recession and kinematic wave methods were selected and applied for rainfall-runoff simulation in Sungai Kayu Ara river basin in this research.
(a)
(b)
Fig. 2. Input HEC-HMS Data (a) and Location of Rainfall and Water Level Stations (b) in Sungai Kayu Ara Basin Generated using HEC-GeoHMS
The basic step for development and application of a
model is establishing of the credibility of the model which comprises of sensitivity analysis, calibration and validation processes. Sensitivity analyses were applied to highlight the most sensitive (important) parameters during hydrological modelling using HEC-HMS. The results of
ISSN : 0975-4024 490

Sina Alaghmand et al. / International Journal of Engineering and Technology Vol.2 (6), 2010, 488-500
sensitivity analysis showed that imperviousness, lag-time and peaking coefficient were the most sensitive parameters. Schlesinger [44] defined model calibration as the procedure of adjustment of parameter values of a model to reproduce the response of a river basin under study within the range of accuracy specified in the performance criteria. Also, model validation is considered as substantiation that a model within its domain of applicability possesses a satisfactory range of accuracy consistent with the intended application of the model. Among the recorded rainfall and water level time series obtained from rainfall and water level stations, 18 rainfall events were selected for calibration and 18 rainfall events for validation process. By applying the 18 calibration rainfall events data set the best set of values for each parameter were identified that best represent the hydrologic model of Sungai Kayu Ara river basin. The credibility of the hydrological model was evaluated using 18 validation rainfall event data set.
The established hydrological model for Sungai Kayu Ara simulated the rainfall-runoff process based on based on rainfall design hyetograph extracted from MSMA guideline. In fact, the calculated design rainfall hyetographs were the input for hydrological model. The results of the hydrological model were direct runoff hydrograph for each scenario. Figure 3 shows the simulated runoff peak and volume for each defined scenarios for Sungai Kayu Ara river basin.
0
50
100
150
200
250
300
350
400
450
0:0
0
0:2
0
0:4
0
1:0
0
1:2
0
1:4
0
2:0
0
2:2
0
2:4
0
3:0
0
3:2
0
3:4
0
4:0
0
4:2
0
4:4
0
5:0
0
5:2
0
5:4
0
6:0
0
Time (hh:mm)
Dis
cha
rge
(m
3/s
)
20 yearsARI,ExistingCondition
20 years ARI,IntermediateCondition
20 years ARI,UltimateCondition
(a)
0
50
100
150
200
250
300
350
400
450
500
0:0
0
0:2
5
0:5
0
1:1
5
1:4
0
2:0
5
2:3
0
2:5
5
3:2
0
3:4
5
4:1
0
4:3
5
5:0
0
5:2
5
5:5
0
Time (hh:mm)
Dis
cha
rge
(m
3/s
)
50 yearsARI,ExistingCondition
50 years ARI,IntermediateCondition
50 years ARI,UltimateCondition
(b)
0
100
200
300
400
500
0:00
0:25
0:50
1:15
1:40
2:05
2:30
2:55
3:20
3:45
4:10
4:35
5:00
5:25
5:50
Time (hh:mm)
Dis
char
ge (
m3/
s)
100 yearsARI,ExistingCondition
100 years ARI,IntermediateCondition
100 years ARI,UltimateCondition
(c)
Fig. 3. Simulated Runoff Hydrographs for Rainfall Events with 20 (a), 50 (b) and 100 (c) years ARI
A total of 9 direct runoff hydrographs were produced
by HEC-HMS hydrological model. The effect of the different land-use development conditions and rainfall events ARI can be assessed and investigated based on Figure 3. The results indicate that an increase of percentage of imperviousness due to river basin development (urbanization) significantly increase the runoff volume and peak discharge. For instance, an increase of river basin land-use development from existing condition to intermediate and consequently ultimate conditions, lead to an increase of runoff volume and peak flow discharge. Rainfall event ARI shows the probability of occurrence of a specific magnitude of rainfall event in future. An increase of ARI corresponds to the probability of occurrence of a higher magnitude of rainfall event. Hence, an increase of magnitude of rainfall event (higher ARI), the generated runoff volume and peak flow discharge is increased significantly. This shows that, the magnitude of rainfall (event ARI) has direct relation with runoff volume and peak flow discharge. In other words, the generated runoff hydrographs for each scenario shows that an increase magnitude of rainfall (ARI) the peak flow discharge of runoff hydrograph is significantly increased. This leads to wider river flood extent, higher water level and flow velocity. The input of hydraulic model is the runoff hydrographs generated by hydrological model, and so, changes in runoff hydrograph peak flow has direct influences on generated river flood severity. The magnitude of rainfall event alters the characteristics of the river flood which leads to alteration of the river flood effects and damages.
B. Hydraulic Modelling and River Flood Visualization
Hydraulic models are utilized in order to simulate the behaviour of the flow in the main channel and floodplain of a river. The runoff hydrographs which were generated in hydrological modelling were used as the main input for hydraulic modelling. The other important input for hydraulic modelling is geometry data of the river which
ISSN : 0975-4024 491
Sina Alaghmand et al. / International Journal of Engineering and Technology Vol.2 (6), 2010, 488-500
were prepared using HEC-GeoRAS extension. HEC-RAS4.0 is hydraulic model created by the Hydrologic Engineering Centre which was utilized as hydraulic model in this research. HEC-RAS is a well-known and popular hydraulic model which widely has been utilized in different water resources studies in different parts of the world [34, 45-47].
Hydraulic modelling in this research was conducted for the last 5.1 km of main river of the Sungai Kayu Ara river basin. The hydraulic modelling required preparation of surveyed data for 5.1 km of the study reach of main river which include the 25 cross sections at 200m interval. The geometric data for Sungai Kayu Ara river basin have been created via HEC-GeoRAS. Initially the Digital Elevation Model (DEM) of the study river basin is necessary, to this aim, the available surveyed cross section data with 200m intervals for main channel and digital contour lines for flood plain are applied. Then, by using HEC-GeoRAS extension in ArcGIS environment, required geometry data such as: stream centreline, main channel banks, flow path centreline and, cross sectional cut lines were created.
The calibration process of HEC-RAS hydraulic modelling for Sungai Kayu Ara river basin included a total of 20 flood events. The flood events for calibration were selected from the historical data between the years 1996 to 2004 for the water level station which was located at the outlet of the Sungai Kayu Ara river basin. In the validation process, HEC-RAS4.0 simulates the flood events using the calibrated parameters. In validation process it was desirable to keep the calibrated parameter values constant. A total of 10 rainfall events, other than calibration rainfall events, were employed to validate the model.
Following the establishment of the HEC-RAS model credibility (calibration and validation processes) the hydraulic model was fully equipped for hydraulic modelling. The four steps for river flood mapping using the HEC-HMS4.0 hydrological model, HEC-RAS hydraulic model and the HEC-GeoRAS extension were: a. Extraction of the stream geometry data from the
modified digital elevation model (DEM) using HEC-GeoRAS for use in the HEC-RAS steady flow model
b. Processing the geometry data in HEC-RAS c. Integration of hydrologic data which were generated
with HEC-HMS as initial flow and boundary conditions in the HEC-RAS steady flow data file
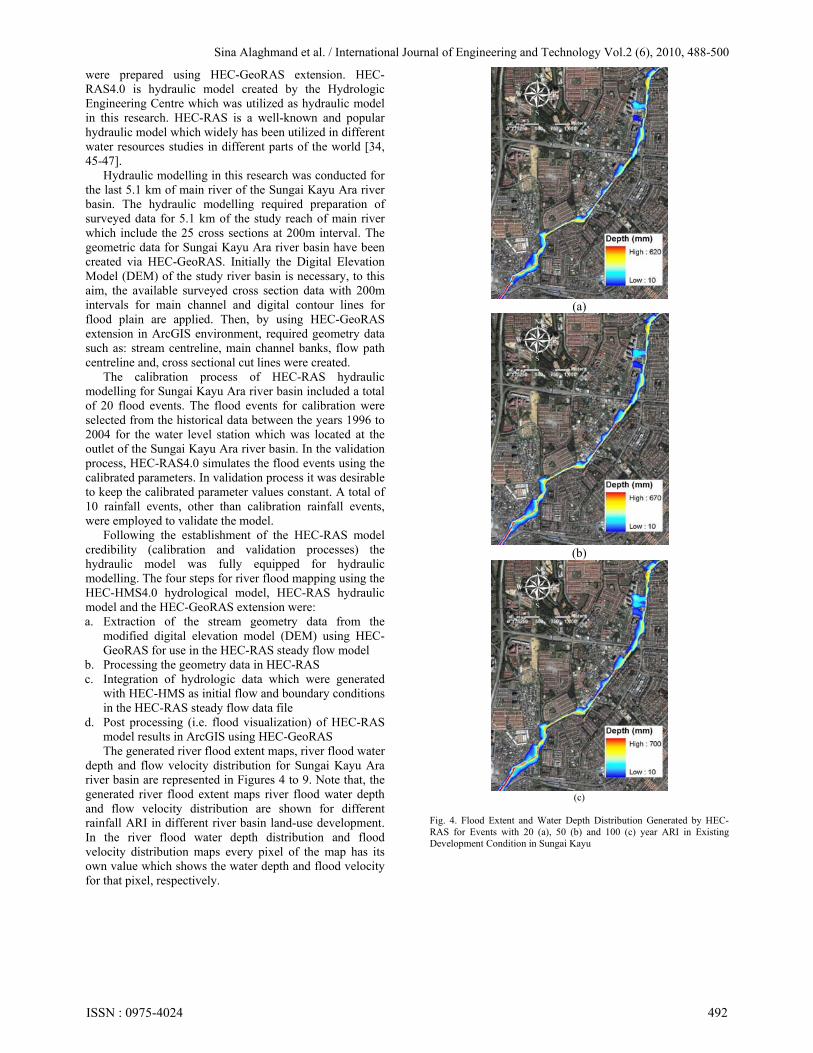
d. Post processing (i.e. flood visualization) of HEC-RAS model results in ArcGIS using HEC-GeoRAS The generated river flood extent maps, river flood water
depth and flow velocity distribution for Sungai Kayu Ara river basin are represented in Figures 4 to 9. Note that, the generated river flood extent maps river flood water depth and flow velocity distribution are shown for different rainfall ARI in different river basin land-use development. In the river flood water depth distribution and flood velocity distribution maps every pixel of the map has its own value which shows the water depth and flood velocity for that pixel, respectively.
(a)
(b)
(c)
Fig. 4. Flood Extent and Water Depth Distribution Generated by HEC-RAS for Events with 20 (a), 50 (b) and 100 (c) year ARI in Existing Development Condition in Sungai Kayu
ISSN : 0975-4024 492
Sina Alaghmand et al. / International Journal of Engineering and Technology Vol.2 (6), 2010, 488-500
(a)
(b)
(c)
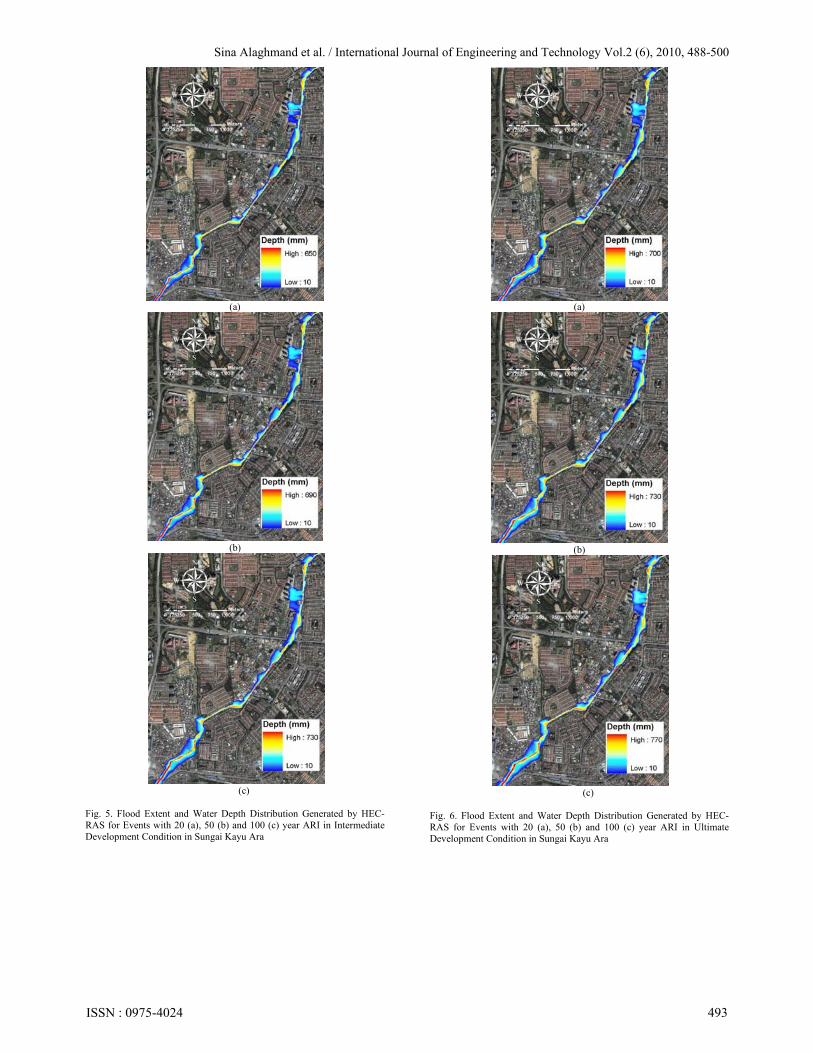
Fig. 5. Flood Extent and Water Depth Distribution Generated by HEC-RAS for Events with 20 (a), 50 (b) and 100 (c) year ARI in Intermediate Development Condition in Sungai Kayu Ara
(a)
(b)
(c)
Fig. 6. Flood Extent and Water Depth Distribution Generated by HEC-RAS for Events with 20 (a), 50 (b) and 100 (c) year ARI in Ultimate Development Condition in Sungai Kayu Ara
ISSN : 0975-4024 493
Sina Alaghmand et al. / International Journal of Engineering and Technology Vol.2 (6), 2010, 488-500
(a)
(b)
(c)
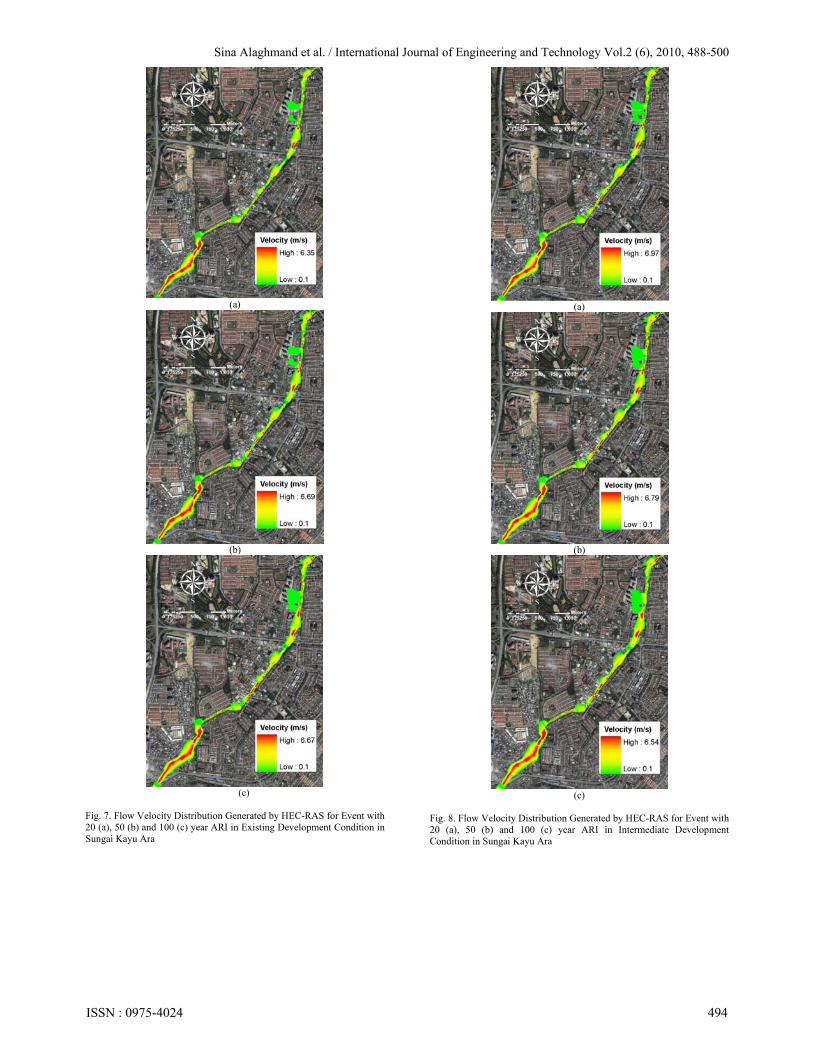
Fig. 7. Flow Velocity Distribution Generated by HEC-RAS for Event with 20 (a), 50 (b) and 100 (c) year ARI in Existing Development Condition in Sungai Kayu Ara
(a)
(b)
(c)
Fig. 8. Flow Velocity Distribution Generated by HEC-RAS for Event with 20 (a), 50 (b) and 100 (c) year ARI in Intermediate Development Condition in Sungai Kayu Ara
ISSN : 0975-4024 494
Sina Alaghmand et al. / International Journal of Engineering and Technology Vol.2 (6), 2010, 488-500
(a)
(b)
(c)
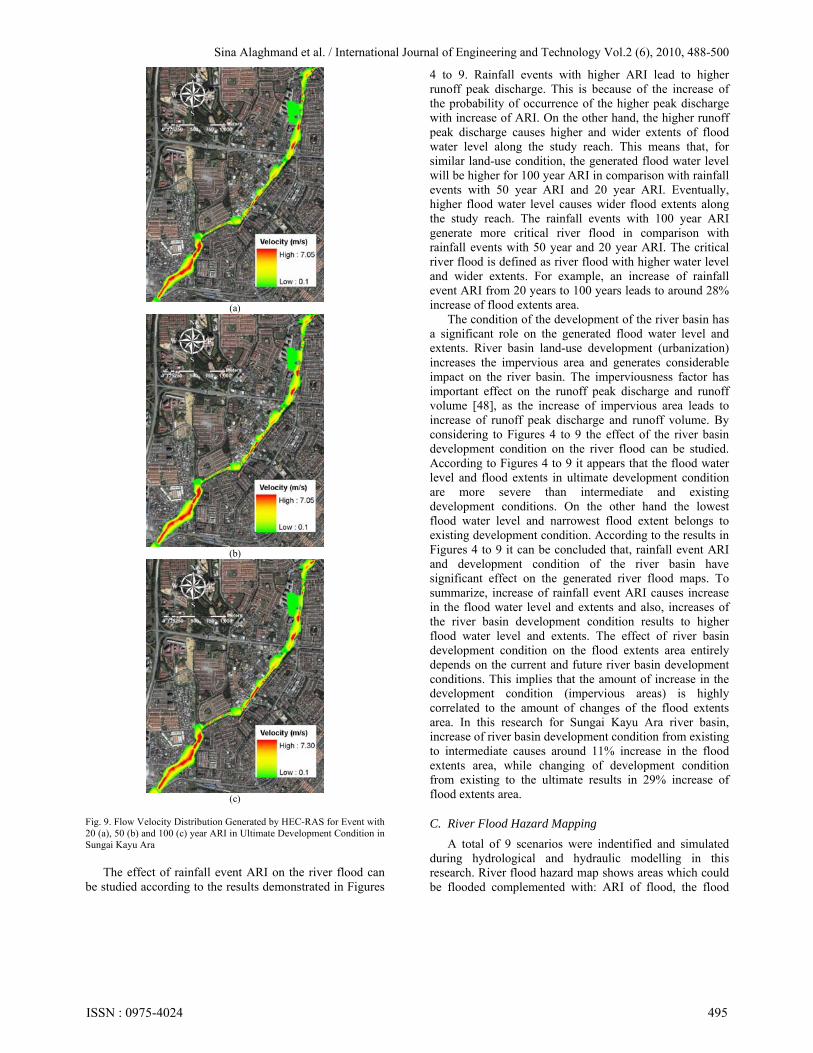
Fig. 9. Flow Velocity Distribution Generated by HEC-RAS for Event with 20 (a), 50 (b) and 100 (c) year ARI in Ultimate Development Condition in Sungai Kayu Ara
The effect of rainfall event ARI on the river flood can
be studied according to the results demonstrated in Figures
4 to 9. Rainfall events with higher ARI lead to higher runoff peak discharge. This is because of the increase of the probability of occurrence of the higher peak discharge with increase of ARI. On the other hand, the higher runoff peak discharge causes higher and wider extents of flood water level along the study reach. This means that, for similar land-use condition, the generated flood water level will be higher for 100 year ARI in comparison with rainfall events with 50 year ARI and 20 year ARI. Eventually, higher flood water level causes wider flood extents along the study reach. The rainfall events with 100 year ARI generate more critical river flood in comparison with rainfall events with 50 year and 20 year ARI. The critical river flood is defined as river flood with higher water level and wider extents. For example, an increase of rainfall event ARI from 20 years to 100 years leads to around 28% increase of flood extents area.
The condition of the development of the river basin has a significant role on the generated flood water level and extents. River basin land-use development (urbanization) increases the impervious area and generates considerable impact on the river basin. The imperviousness factor has important effect on the runoff peak discharge and runoff volume [48], as the increase of impervious area leads to increase of runoff peak discharge and runoff volume. By considering to Figures 4 to 9 the effect of the river basin development condition on the river flood can be studied. According to Figures 4 to 9 it appears that the flood water level and flood extents in ultimate development condition are more severe than intermediate and existing development conditions. On the other hand the lowest flood water level and narrowest flood extent belongs to existing development condition. According to the results in Figures 4 to 9 it can be concluded that, rainfall event ARI and development condition of the river basin have significant effect on the generated river flood maps. To summarize, increase of rainfall event ARI causes increase in the flood water level and extents and also, increases of the river basin development condition results to higher flood water level and extents. The effect of river basin development condition on the flood extents area entirely depends on the current and future river basin development conditions. This implies that the amount of increase in the development condition (impervious areas) is highly correlated to the amount of changes of the flood extents area. In this research for Sungai Kayu Ara river basin, increase of river basin development condition from existing to intermediate causes around 11% increase in the flood extents area, while changing of development condition from existing to the ultimate results in 29% increase of flood extents area.
C. River Flood Hazard Mapping
A total of 9 scenarios were indentified and simulated during hydrological and hydraulic modelling in this research. River flood hazard map shows areas which could be flooded complemented with: ARI of flood, the flood
ISSN : 0975-4024 495
Sina Alaghmand et al. / International Journal of Engineering and Technology Vol.2 (6), 2010, 488-500
extent; water depth or water level and flow velocity. River flood hazard map should cover the geographical areas which could be flooded according to different scenarios [49]. The magnitude of the damage depends on the flood characteristics especially in terms of water depth and flow velocity [50]. In this research, water depth and flow velocity are considered as two main parameters which associate with river flood hazard.
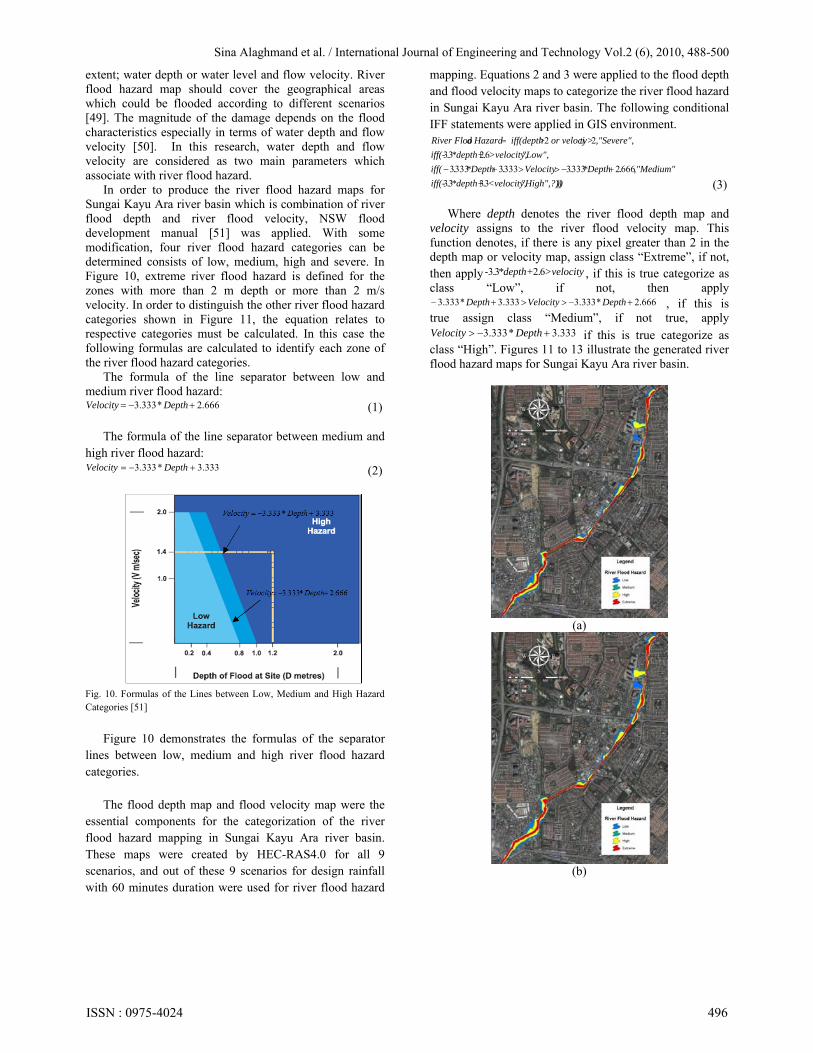
In order to produce the river flood hazard maps for Sungai Kayu Ara river basin which is combination of river flood depth and river flood velocity, NSW flood development manual [51] was applied. With some modification, four river flood hazard categories can be determined consists of low, medium, high and severe. In Figure 10, extreme river flood hazard is defined for the zones with more than 2 m depth or more than 2 m/s velocity. In order to distinguish the other river flood hazard categories shown in Figure 11, the equation relates to respective categories must be calculated. In this case the following formulas are calculated to identify each zone of the river flood hazard categories.
The formula of the line separator between low and medium river flood hazard:
666.2*333.3 DepthVelocity (1)
The formula of the line separator between medium and high river flood hazard:
333.3*333.3 DepthVelocity (2)
Fig. 10. Formulas of the Lines between Low, Medium and High Hazard Categories [51]
Figure 10 demonstrates the formulas of the separator
lines between low, medium and high river flood hazard categories.
The flood depth map and flood velocity map were the
essential components for the categorization of the river flood hazard mapping in Sungai Kayu Ara river basin. These maps were created by HEC-RAS4.0 for all 9 scenarios, and out of these 9 scenarios for design rainfall with 60 minutes duration were used for river flood hazard
mapping. Equations 2 and 3 were applied to the flood depth and flood velocity maps to categorize the river flood hazard in Sungai Kayu Ara river basin. The following conditional IFF statements were applied in GIS environment.
))"High",?))<velocity,.*depth+.iff(-
,"Medium".*Depth.Velocity.*Depth.iff(
"Low", >velocity,.*depth+.iff(-
,"Severe",ty> or veloci> iff(depthd HazardRiver Floo
3333
6662333333333333
6233
22
(3)
Where depth denotes the river flood depth map and velocity assigns to the river flood velocity map. This function denotes, if there is any pixel greater than 2 in the depth map or velocity map, assign class “Extreme”, if not, then apply >velocity.*depth+.- 6233 , if this is true categorize as class “Low”, if not, then apply
666.2*333.3333.3*333.3 DepthVelocityDepth , if this is true assign class “Medium”, if not true, apply
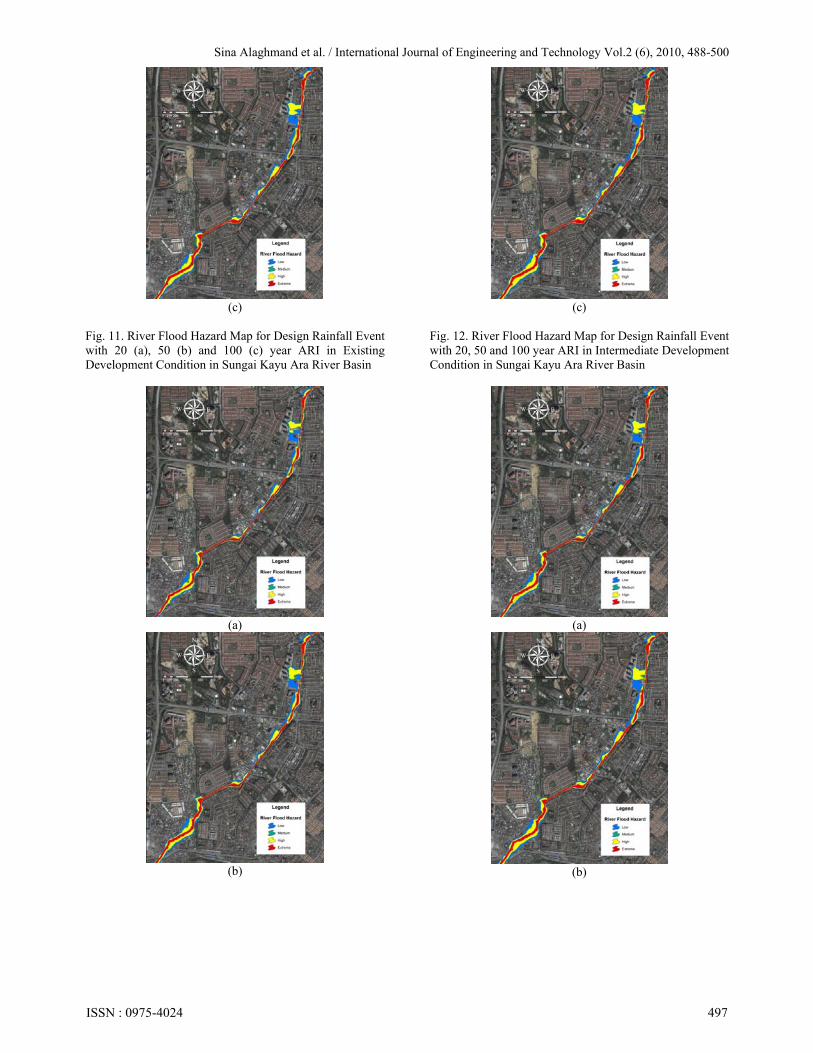
333.3*333.3 DepthVelocity if this is true categorize as class “High”. Figures 11 to 13 illustrate the generated river flood hazard maps for Sungai Kayu Ara river basin.
(a)
(b)
ISSN : 0975-4024 496
Sina Alaghmand et al. / International Journal of Engineering and Technology Vol.2 (6), 2010, 488-500
(c)
Fig. 11. River Flood Hazard Map for Design Rainfall Event with 20 (a), 50 (b) and 100 (c) year ARI in Existing Development Condition in Sungai Kayu Ara River Basin
(a)
(b)
(c)
Fig. 12. River Flood Hazard Map for Design Rainfall Event with 20, 50 and 100 year ARI in Intermediate Development Condition in Sungai Kayu Ara River Basin
(a)
(b)
ISSN : 0975-4024 497
Sina Alaghmand et al. / International Journal of Engineering and Technology Vol.2 (6), 2010, 488-500
(c)
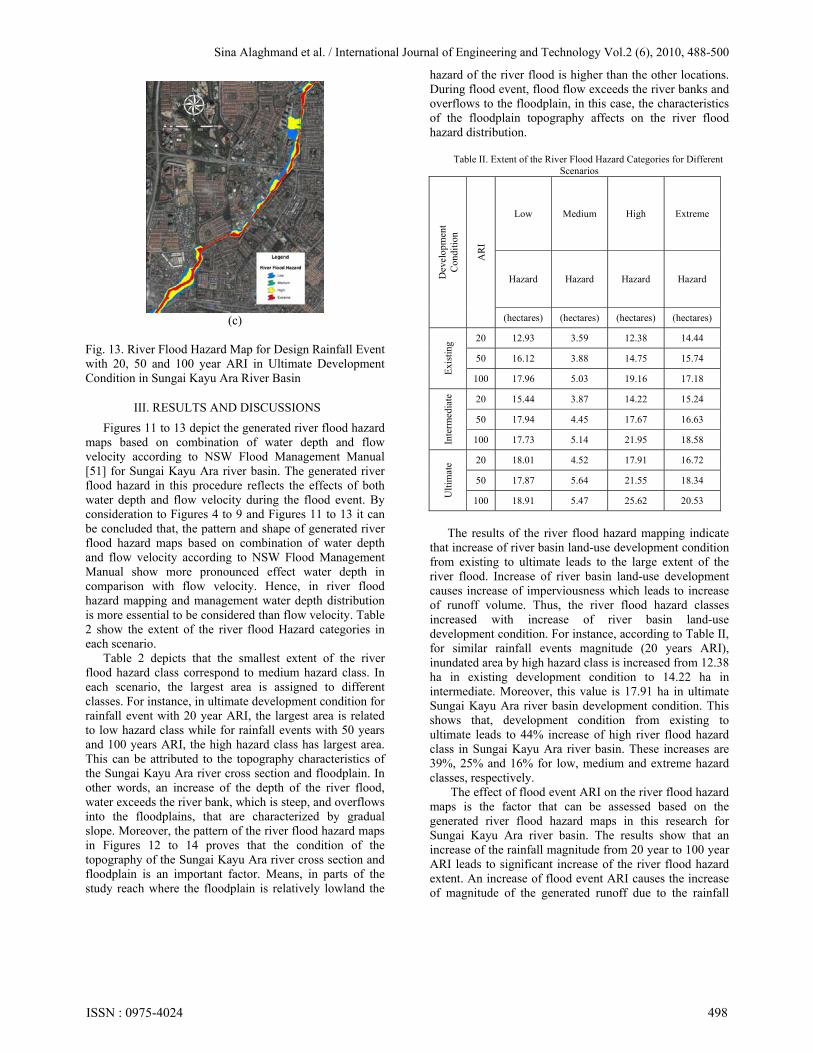
Fig. 13. River Flood Hazard Map for Design Rainfall Event with 20, 50 and 100 year ARI in Ultimate Development Condition in Sungai Kayu Ara River Basin
III. RESULTS AND DISCUSSIONS
Figures 11 to 13 depict the generated river flood hazard maps based on combination of water depth and flow velocity according to NSW Flood Management Manual [51] for Sungai Kayu Ara river basin. The generated river flood hazard in this procedure reflects the effects of both water depth and flow velocity during the flood event. By consideration to Figures 4 to 9 and Figures 11 to 13 it can be concluded that, the pattern and shape of generated river flood hazard maps based on combination of water depth and flow velocity according to NSW Flood Management Manual show more pronounced effect water depth in comparison with flow velocity. Hence, in river flood hazard mapping and management water depth distribution is more essential to be considered than flow velocity. Table 2 show the extent of the river flood Hazard categories in each scenario.
Table 2 depicts that the smallest extent of the river flood hazard class correspond to medium hazard class. In each scenario, the largest area is assigned to different classes. For instance, in ultimate development condition for rainfall event with 20 year ARI, the largest area is related to low hazard class while for rainfall events with 50 years and 100 years ARI, the high hazard class has largest area. This can be attributed to the topography characteristics of the Sungai Kayu Ara river cross section and floodplain. In other words, an increase of the depth of the river flood, water exceeds the river bank, which is steep, and overflows into the floodplains, that are characterized by gradual slope. Moreover, the pattern of the river flood hazard maps in Figures 12 to 14 proves that the condition of the topography of the Sungai Kayu Ara river cross section and floodplain is an important factor. Means, in parts of the study reach where the floodplain is relatively lowland the
hazard of the river flood is higher than the other locations. During flood event, flood flow exceeds the river banks and overflows to the floodplain, in this case, the characteristics of the floodplain topography affects on the river flood hazard distribution.
Table II. Extent of the River Flood Hazard Categories for Different
Scenarios
Dev
elop
men
t C
ondi
tion
AR
I
Low Medium High Extreme
Hazard Hazard Hazard Hazard
(hectares) (hectares) (hectares) (hectares)
Exi
stin
g 20 12.93 3.59 12.38 14.44
50 16.12 3.88 14.75 15.74
100 17.96 5.03 19.16 17.18
Inte
rmed
iate
20 15.44 3.87 14.22 15.24
50 17.94 4.45 17.67 16.63
100 17.73 5.14 21.95 18.58 U
ltim
ate 20 18.01 4.52 17.91 16.72
50 17.87 5.64 21.55 18.34
100 18.91 5.47 25.62 20.53
The results of the river flood hazard mapping indicate
that increase of river basin land-use development condition from existing to ultimate leads to the large extent of the river flood. Increase of river basin land-use development causes increase of imperviousness which leads to increase of runoff volume. Thus, the river flood hazard classes increased with increase of river basin land-use development condition. For instance, according to Table II, for similar rainfall events magnitude (20 years ARI), inundated area by high hazard class is increased from 12.38 ha in existing development condition to 14.22 ha in intermediate. Moreover, this value is 17.91 ha in ultimate Sungai Kayu Ara river basin development condition. This shows that, development condition from existing to ultimate leads to 44% increase of high river flood hazard class in Sungai Kayu Ara river basin. These increases are 39%, 25% and 16% for low, medium and extreme hazard classes, respectively.
The effect of flood event ARI on the river flood hazard maps is the factor that can be assessed based on the generated river flood hazard maps in this research for Sungai Kayu Ara river basin. The results show that an increase of the rainfall magnitude from 20 year to 100 year ARI leads to significant increase of the river flood hazard extent. An increase of flood event ARI causes the increase of magnitude of the generated runoff due to the rainfall
ISSN : 0975-4024 498

Sina Alaghmand et al. / International Journal of Engineering and Technology Vol.2 (6), 2010, 488-500
event; therefore, this contributes to enlargement of the area of the river flood hazard classes. Eventually, increase of rainfall event magnitude leads to boost the river flood hazard classes. For example, in existing river basin development condition, the area of high hazard class changes from 12.38ha to 19.16 for rainfall events ARI from 20 years to 100 years. This means that, 54% increase of high hazard class can be observed by increase of rainfall event magnitude from 20 to 100 year ARI.
According to the results denoted in Table II it is possible to compare the effects of river basin land-use development condition and flood event ARI on the river flood hazard map. An increase of river basin land-use development from existing to ultimate scenario for similar flood event ARI shows that the area of river flood hazard is significantly increased. For instance, extreme river flood hazard class is increased 15% correspond to the changes of river basin land-use development condition from existing to ultimate. On the other hand, 19% increase is noted in area of extreme river flood hazard class due to the changes of the flood event ARI from 20 years to 100 years in similar river basin development condition. This shows that, in this research, effect of flood event magnitude (ARI) is more considerable than river basin land-use development condition in river flood hazard mapping and management in Sungai Kayu Ara River Basin.
IV. CONCLUSIONS
Following conclusions can be considered according to results of this research:
i. An increase of river basin land-use development condition leads to increase of imperviousness of the river basin and an increase of the volume and peak discharge of the generated runoff hydrograph.
ii. An increase of magnitude of rainfall event (ARI), the volume and peak discharge of the generated runoff hydrograph increase significantly.
iii. HEC-GeoRAS and HEC-GeoHMS can be utilized for preparation of input geometric data for HEC-RAS hydraulic model and HEC-HMS hydrological model, respectively, and also for visualization of the hydraulic model results.
iv. The generated water level by hydraulic model is significantly sensitive to river basin land-use development condition and magnitude (ARI) of rainfall event.
v. River flood water depth and flow velocity are the most important elements of river flood hazard mapping.
vi. The generated river flood hazard pattern distribution is more influenced by water depth in comparison with flow velocity that shows hazard produced by water depth is more considerable than flow velocity during river flood event.
vii. Rainfall events magnitude (ARI) has more effect on river flood hazard map in comparison with river basin land-use development condition.
V. REFERENCES
[1] A. F. Embi and D. N. Mohd. The Changing Microclimate in Urban Areas – The Urban Heat Island Connection [Online]. Available: http://www.kkr.gov.my
[2] K. Abdullah, "Flood Problem and Storm water Management Manual for Malaysia (USMM). Keynote Address:Flood Problem and Storm water Management Manual for Malaysia (USMM)," presented at the Seminar on Introduction to Storm water Management Manual for Malaysia, Kelantan. Malaysia, 2000.
[3] D. Alexander, Natural Disasters. New York, USA: Chapman & Hall, 1993.
[4] S. K. Sinnakaudan, et al., "Flood risk mapping for Pari River incorporating sediment transport," Environmental Modelling & Software, vol. 18, pp. 119-130, 2003.
[5] K. Smith, Environmental Hazards: Assessing Risk and Reducing Disaster, 2nd ed. London, England: Routledge, 1996.
[6] N. S. Noman, et al., "Review of Automated Floodplain Delineation from Digital Terrain Models " Journal of Water Resources Planning and Management, vol. 127, pp. 394-402, 2001.
[7] G. S. Walesh, Urban Surface Water Management. Chichester, USA: John Wiley & Sons Ltd, 1989.
[8] A. D. Feldman and H. J. Owen, "Communication of Flood-risk Information: Hydrology and Hydraulic Workshop on Risk Based Analysis for Flood Damage Reduction Studies," USACE, California, USA1997.
[9] K. Smith and R. Ward, Floods: Physical Processes and Human Impacts. Chichester, USA: John Wiley & Sons Ltd., 1998.
[10] DID, Urban Stormwater Management Manual for Malaysia. Kuala Lumpur, Malaysia: Department of Irrigation and Drainage Malaysia, 2000.
[11] D. B. Snead, "Development and Application of Unsteady Flood Models Using Geographic Information Systems," M.Sc. Thesis, Civil Engineering, The University of Texas at Austin, Austin, USA, 2000.
[12] A. Ab. Ghani, et al., "Issues and Practices in Designing a Holistic Flood Risk Mapping System," in National Civil Engineering Conference- AWAM 99, Lumut, Perak, Malaysia, 1999.
[13] ESRI, "Understanding GIS: The Arc/Info Method," Environmental System Research Institute Inc, New York, USA1992.
[14] ESRI, "Using the ArcvieGISw Spatial Analyst," Environmental System Research Institute Inc, New York, USA1996.
[15] ESRI, "Using the ArcviewGIS Dialogue Designer (version 1.0)," Environmental System Research Institute Inc, New York, USA2001.
[16] S. Aronoff, Geography Information System: A Management Perspective. Canada: WDL Publications, 1989.
[17] P. A. Burrough, Principles of Geography Information System (GIS) for Land Resources Assessment. Oxford, England: Clarendon Press, 1986.
[18] M. F. Goodchild, The State of GIS for Environmental Problem Solving. In Environmental Modeling with GIS. New York, USA: Oxford University Press, 1993.
[19] M. S. Horritt and P. D. Bates, "Evaluation of 1D and 2D numerical models for predicting river flood inundation," Journal of Hydrology, vol. 268, pp. 87-99, 2002.
[20] J. Jones, et al., "Updating Flood Maps Efficiently: Building on Existing Hydraulic Information and Modern Elevation Data with a GIS," U.S. Geological Survey (USGS), Reston, USA1998.
[21] H. A. Karimi and B. H. Houston, "Evaluating Strategies for Integrating Environmental Models with GIS: Current Trends and Future Needs," Journal of Computer, Environment and Urban Systems, vol. 20, pp. 413-425, 1996.
ISSN : 0975-4024 499
Sina Alaghmand et al. / International Journal of Engineering and Technology Vol.2 (6), 2010, 488-500
[22] S. J. Winterbottom and D. J. Gilvear, "A GIS-based approach to mapping probabilities of river bank erosion: regulated River Tummel, Scotland," Regulated Rivers: Research & Management, vol. 16, pp. 127-140, 2000.
[23] L. Yang, et al., "Integration of a 1D River Model with Object-oriented Methodology," Journal of Environmental Modeling and Software, vol. 17, pp. 693-701, 2002.
[24] M. B. Abbott, " Introducing Hydroinformatics," Journal of Hydroinformatics, vol. 1, pp. 3-19, 1999.
[25] C. Huang and H. Inoue, "Soft risk maps of natural disasters and their applications to decision-making," Information Sciences, vol. 177, pp. 1583-1592, 2007.
[26] D. C. L. Lam, et al., "Integration of GIS with other Software Systems: Integration versus Interconnection," presented at the The 3rd International Conference on GIS and Environmental Modeling, Santa Fe, New Mexico, USA, 1996.
[27] D. Pullar and D. Springer, "Towards Integrating GIS and Catchment Models," Journal of Environmental Modeling and Software, vol. 12, pp. 451-459, 2000.
[28] USACE, Hydrologic Engineering Center-River Analysis System (HEC-RAS) Users Manual. Washington, DC: United States Army Corps of Engineers, 2006.
[29] Z. Ye, et al., "Map-base Surface Simulation Models: An Object-oriented and GIS Approach," The University of Texas at Austin, Texas, USA1996.
[30] J. M. Cunderlik and S. P. Simonovic, "Inverse flood risk modelling under changing climatic conditions," Hydrological Processes, vol. 21, pp. 563-577, 2007.
[31] L. Norman, et al., "Flood hazard awareness and hydrologic modelling at Ambos Nogales, United States–Mexico border," Journal of Flood Risk Management, vol. 3, pp. 151-165, 2010.
[32] L. O. Olang and J. Fürst, "Effects of land cover change on flood peak discharges and runoff volumes: model estimates for the Nyando River Basin, Kenya," Hydrological Processes, pp. n/a-n/a, 2010.
[33] I. Reinfelds, et al., "Refinement of the wetted perimeter breakpoint method for setting cease-to-pump limits or minimum environmental flows," River Research and Applications, vol. 20, pp. 671-685, 2004.
[34] I. Reinfelds, et al., "Hydraulic assessment of environmental flow regimes to facilitate fish passage through natural riffles: Shoalhaven river below Tallowa Dam, New South Wales, Australia," River Research and Applications, vol. 26, pp. 589-604, 2010.
[35] H. Thomas and T. R. Nisbet, "An assessment of the impact of floodplain woodland on flood flows," Water and Environment Journal, vol. 21, pp. 114-126, 2007.
[36] P. B. Shafroth, et al., "Ecosystem effects of environmental flows: modelling and experimental floods in a dryland river," Freshwater Biology, vol. 55, pp. 68-85, 2010.
[37] P. G. Whitehead and M. Robinson, "Experimental basin studies--an international and historical perspective of forest impacts," Journal of Hydrology, vol. 145, pp. 217-230, 1993.
[38] Y. Chen, et al., "Impacts of land use change scenarios on storm-runoff generation in Xitiaoxi basin, China," Quaternary International, vol. 208, pp. 121-128, 2009.
[39] A. García, et al., "Surface water resources assessment in scarcely gauged basins in the north of Spain," Journal of Hydrology, vol. 356, pp. 312-326, 2008.
[40] R. Gaytán, et al., "Computation of changes in the run-off regimen of the Lake Santa Ana watershed (Zacatecas, Mexico)," Lakes & Reservoirs: Research & Management, vol. 13, pp. 155-167, 2008.
[41] C. He and T. E. Croley Ii, "Application of a distributed large basin runoff model in the Great Lakes basin," Control Engineering Practice, vol. 15, pp. 1001-1011, 2007.
[42] M. R. Kousari, et al., "Sensitivity analysis and impact quantification of the main factors affecting peak discharge in the SCS curve number method: An analysis of Iranian watersheds," Quaternary International, vol. In Press, Corrected Proof.
[43] Y.-P. Lin, et al., "Developing and comparing optimal and empirical land-use models for the development of an urbanized watershed forest in Taiwan," Landscape and Urban Planning, vol. 92, pp. 242-254, 2009.
[44] S. Schlesinger, "Terminology for Model Credibility " Journal of Simulation, vol. 32, p. 103, 1979.
[45] B. P. Buchanan, et al., "Monitoring and assessment of a river restoration project in central New York," River Research and Applications, pp. n/a-n/a, 2010.
[46] J. H. Halleraker, et al., "Application of multiscale environmental flow methodologies as tools for optimized management of a Norwegian regulated national salmon watercourse," River Research and Applications, vol. 23, pp. 493-510, 2007.
[47] G. Seckin, et al., "Forecasting backwater through bridge constrictions in Mississippi River Basin," River Research and Applications, vol. 25, pp. 315-328, 2009.
[48] S. Alaghmand, " River Modelling for Flood Risk Map Prediction (A Case Study of Sungai Kayu Ara)," M.Sc. Thesis, School of Civil Engineering, University of Science Malaysia, Penang, 2009.
[49] EXCIMAP, "Atlas of Flood Maps," European Exchange Circle on Flood Mapping2007.
[50] APFM, "Urban Flood Risk Management, A Tool for Integrated Flood Management," Associated Program on Flood Management, Australia2008.
[51] NSW, "Floodplain Development Manual: the management of flood liable land," Department of Infrastructure, Planning and Natural Resources. New South Wales Government, Australia2005.
ISSN : 0975-4024 500