Flood Inundation Mapping Using Remote Sensing and GIS ...
100
1 | Page Flood Inundation Mapping Using Remote Sensing and GIS Techniques: A Case Study of Sokoto plain, Nigeria. Oluwadamilare O. Ajayi Thesis submitted in partial fulfilment of the requirements for the award of Masters of Geospatial Information Science June 2016. School of the Environment Faculty of Science and Engineering Flinders University of South Australia
-
Upload
khangminh22 -
Category
Documents
-
view
5 -
download
0
Transcript of Flood Inundation Mapping Using Remote Sensing and GIS ...

1 | P a g e
Flood Inundation Mapping Using Remote Sensing and
GIS Techniques: A Case Study of Sokoto plain,
Nigeria.
Oluwadamilare O. Ajayi
Thesis submitted in partial fulfilment of the requirements for the award of
Masters of Geospatial Information Science
June 2016.
School of the Environment
Faculty of Science and Engineering
Flinders University of South Australia

2 | P a g e
Table of Contents
Declaration ---------------------------------------------------------------------------------------------- 6
Acknowledgements ---------------------------------------------------------------------------------- 7
List of Figures ----------------------------------------------------------------------------------------- 8
List of Table -------------------------------------------------------------------------------------------- 9
List of Acronyms -------------------------------------------------------------------------------- 10-11
Abstract ------------------------------------------------------------------------------------------------- 12
Keywords ----------------------------------------------------------------------------------------------- 13
Chapter 1- Introduction ---------------------------------------------------------------------- 14-25
1.1 Background of study ---------------------------------------------------------------------------- 14-15
1.2 Problem definition ------------------------------------------------------------------------------- 15-18
1.3 Research questions ---------------------------------------------------------------------------------- 18
1.4 Research aims and objectives ------------------------------------------------------------------ 18-19
1.5 Scope of study and anticipated outcomes - --------------------------------------------------19-20
1.6 Study area---------------------------------------------------------------------------------------------20
1.6.1 Location----------------------------------------------------------------------------------------20-21
1.6.2 Relief and drainage-------------------------------------------------------------------------------21
1.6.3 Climate and vegetation---------------------------------------------------------------------------22
1.6.4 Geology and soil-----------------------------------------------------------------------------------22
1.6.5 Brief historical account of floods in Sokoto State-----------------------------------------22-25

3 | P a g e
1.7 Thesis structure--------------------------------------------------------------------------------------25
Chapter 2- Literature Review ------------------------------------------------------------- 26-49
2.1 Floods management---------------------------------------------------------------------------------26
2.1.1 Definition of floods --------------------------------------------------------------------------- 26-27
2.1.2 The Principal types of floods ---------------------------------------------------------------- 27-28
2.1.3 Causes of floods ------------------------------------------------------------------------------- 28-29
2.1.4 Hazards associated with floods -------------------------------------------------------------29-30
2.1.5 Understanding the areas liable to floods ---- --------------------------------------------------31
2.1.6 Flood mapping in floodplains----------------------------------------------------------------31-32
2.2 The concept of disaster risk management---------------------------------------------------------32
2.2.1 Defining natural hazards and disaster-------------------------------------------------------31-32
2.2.2 Defining vulnerability and capacity to cope------------------------------------------------32-33
2.2.3 Defining flood hazard ----------------------------------------------------------------------------34
2.2.4 Defining flood risk--------------------------------------------------------------------------------34
2.3 Review of GIS and remote sensing flooding ---------------------------------------------------- 35
2.3.1 GIS application for monitoring and mapping flood -------------- -----------------------35-38
2.3.2 Remote sensing application for monitoring and mapping flood-------------------------38-39
2.3.3 Microwave remote sensing for flood monitoring and mapping-------------------------39-41
2.3.4 Optical remote sensing for flood monitoring and mapping -----------------------------41-42
2.3.5 Spectral indices techniques for delineation of flood extent and water bodies---------42-43
2.3.5.1 The normalised difference vegetation index------------ --------------------------------43-44

4 | P a g e
2.3.5.2 The normalised difference water index----------- ---------------------------------------44-45
2.3.5.3 The modified normalised difference water index---------------------------------------45-47
2.3.6 Satellite remote sensing MODIS data-------------------------------------------------------47-49
Chapter 3-Research methods -------------------------------------------------------------- 50-59
3.1 Main data and pre-processing ---------------------------------------------------------------------- 50
3.1.1 MODIS MOD09A1 and MYD09A1 ------------------------------------------------------- 50-53
3.1.2 LandScan population data -------------------------------------------------------------------53-54
3.2 Delineating water features using the normalised difference water index-----------------------
------------------------------------------------------------------------------------------------------ ---55-56
3.3 Mapping flood inundation and extent using the modified normalised difference water index
---------------------------------------------------------------------------------------------------------- 56-57
3.4 Mapping flood inundation extent and frequency -------------------------------------------57-58
3.5 Flood risk/vulnerability-------------------------------------------------------------------------58-59
Chapter 4-Results and Discussion -------------------------------------------------------59-74
4.1 Mapping flood inundation extent using the normalised difference water index -------- 59-60
4.2 Mapping flood inundation extent using the modified normalised difference water
index ---------------------------------------------------------------------------------------------------- 60-66
4.3 Flood frequency map----------------------------------------------------------------------------66-67
4.4 Risk/vulnerability -------------------------------------------------------------------------------- 67-72
4.5 Mitigation management-------------------------------------------------------------------------72-74
Chapter 5-Conclusion ------------------------------------------------------------------------- 75-81
5.1 Research findings -------------------------------------------------------------------------------- 75-76

5 | P a g e
5.2 Outcomes ----------------------------------------------------------------------------------------- 76-77
5.3 Limitations ------------------------------------------------------------------------------------------- 77
5.3.1 Selection of satellite data ------------------------------------------------------------------------- 78
5.3.2 Water mapping models and integration of population data ----------------------------- 78-79
5.3.3 Population data --------------------------------------------------------------------------------- 79-80
5.3.4 The modifiable areal unit problem -------------------------------------------------------------- 80
5.3.5 Cloud problems associated with the data -------------------------------------------------- 80-81
5.4 Recommendations for future research ----------------------------------------------------------- 81
References ------------------------------------------------------------------------------------------ 82-98

6 | P a g e
Declaration
I hereby declare that the following thesis is a product of my own research. All information
contained within this document is original work and to the best of my knowledge has not
featured in any other published and unpublished literature, except where due reference has been
given in the text.
Oluwadamilare Olawale Ajayi
……………………………………………
June 2016.

7 | P a g e
Acknowledgements
The search for knowledge is compulsory for both men and women. It is in line with this that
this becomes very necessary and inevitable. I am so grateful to the one true God who has been
with me every step of the way since the beginning of this academic journey. I owe my entire
accomplishments to God, and I am glad that He is always there to make a way.
I would like to express my deep gratitude to a number of people for their significant assistance
throughout the period of my master’s degree. Many thanks to my supervisor, Stephen Fildes
who had been an inspiration and guide to me in the world of remote sensing. Despite his very
tight schedules, he still created time, out of no time, to make this work a reality. It has been
great privilege learning and working with you.
I want to say a big thank you to my family for being there for me at every single step of my
life. My parents, Wale and Folakemi Ajayi, you remain the best parents for me. This would
never be possible without your sacrifice and I would love to thank you for believing in me even
when I never believed in myself. To my sisters, brother, grandparents, and niece, I appreciate
all the video calls and messages to check in on me, making sure I am good.
To a good friend I made, Akintunde Ogunlola, words alone are not enough to appreciate your
advice and words of encouragement towards the success and completion of my program.
My gratitude also goes to the Goessling family for making me feel like a part of the family as
coming to an unfamiliar country without knowing anybody could be a difficult. My gratitude
also goes to Tolu Osayomi, the Lutheran church family, Erick, Sonia, Kunle, Kingsley,
Lorraine and Dummins family. I thank you all for your goodwill and support at all times.

8 | P a g e
List of Figures
Figure 1.1 (a-c): Nested map series showing Africa, Nigeria, Sokoto and the LGAs.
Figure 1.1 (d): Map of Nigeria showing the Sokoto River basin.
Figure 1.2-1.4: Flooding in Sokoto state, Northern Nigeria, September 2010.
Figure 1.5: Submerged houses by the August 2015 flood in Sokoto state, Northern Nigeria.
Figure 3.1- 3.4: Images showing the pre-flood and the closest (during) flood event over Sokoto
State.
Figure 3.5: Map Showing the LandScan GRID population counts and density data of the Study
area.
Figure 3.6: Methodology for NDWI calculation.
Figure 3.7: Methodology for MNDWI calculation.
Figure 4.1: Map showing the NDWI results.
Figure 4.2: Map showing the MNDWI results.
Figure 4.3: MNDWI September 22, 2015 flood.
Figure 4.4: Map showing the inundated areas for each period.
Figure 4.5: Map showing the combined final flood inundation extent (largest inundated area).
Figure 4.6: Map showing the frequency of inundation with the inundation times.
Figure 4.7: Map showing the population distribution within the affected areas.

9 | P a g e
List of Tables
Table 2.1: Two derived most commonly used water indices that can be used to detect the
spatial and temporal distribution of flood on MODIS data.
Table 2.2: Wavelength and names of reflectance bands (1-7) in MODIS.
Table 3.1: Satellite Data used.
Table 4.1: MODIS data dates used and the area inundated (km2).
Table 4.2: Frequency of inundation and the total area of Inundation (km2).
Table 4.3: Total population within flood affected areas.
Table 4.4: The LGAs land area (km2), the total area inundated (km2) and the population
vulnerable.
Table 4.5: The LGAs, 2006-population census, projected 2014 population from the 2006
census and the 2014 LandScan population figures.
Table 4.6: The land area (km2), the total area Inundated (km2) and the percentage of area
inundated per LGA.

10 | P a g e
List of Acronyms
AHP- Analytical Hierarchy Process
AU- African Union
AVHRR- Advanced Very High-Resolution Radiometer
DEM- Digital Elevation Model
DRR- Disaster Risk Reduction
DTM- Digital Terrain Model
EC- European Council
EOS- Earth Observation System
EME- Electro Magnetic Energy
ETM- Enhanced Thematic Mapper
FAO- Food and Agriculture Organization of the United Nations
GIS- Geographic Information Systems
GPW- Gridded Population of the World
JERS-1- Japan Earth Resources Satellite
LGA- Local Government Area
LIDAR- Light Detection Ranging
LSWI- Land Surface Water Index
MAUP- Modifiable Areal Unit Problem
MCE- Multi-Criteria Evaluation
ML- Maximum Likelihood
MNDWI- Modified Normalized Difference Water Index
MODIS- Moderate Resolution Imaging Spectro-radiometer

11 | P a g e
MSF- Medecins Sans Frontieres
NASA- National Aeronautics and Space Administration
NBS- National Bureau of Statistics
NEMA- National Emergency Management Agency Nigeria
NEPAD- New Partnership for Africa’s Development
NDVI- Normalized Difference Vegetation Index
NDWI- Normalized Difference Water Index
NIR- Near Infrared
NOAA- National Oceanic and Atmospheric Administration
NRCS- Nigerian Red Cross Society
ORNL- Oak Ridge National Laboratories
RS- Remote Sensing
RADAR- Radio detection and Ranging
SAR- Synthetic Radar Aperture
SEMA- Sokoto Emergency Management Agency
SPOT- Satellites Pour l’Observation de la Terre
SWIR- Shortwave Infrared
TIN- Triangulated Irregular Network
TM- Thematic Mapper
UNFCCC- United Nations Framework Convention on Climate Change
UNISDR- United Nations International Strategy for Disaster Reduction
UNICEF- United Nations International Children’s Emergency Fund
WHO- World Health Organization

12 | P a g e
Abstract
Flooding is one of the most frequent and devastating natural disasters and can often result in
severe damage to agricultural products, commercial infrastructure, personal property and loss
of human lives. Accurate delineation of flooded waters is an important research issue in
determining both economic and personal risk. Determining the spatial extent and temporal
pattern of flood inundation events has largely been achieved using remotely sensed imagery
due to its synoptic and repeatable abilities. Along with Geographical Information Science (GIS)
techniques, these technologies help facilitate the development of rapidly accessible inundation
and vulnerability maps that will help prioritize mitigation efforts. This is particularly important
in developing countries such as Nigeria where population growth is rapid and flood
management resources are scarce. Specifically, this study focuses on the Sokoto-Rima river
system in Sokoto State, Nigeria. The river system is key to the local agrarian economy and is
subject to frequent flood events that have impacted upon agrarian systems and displaced
thousands of people in recent years.
Central to this study is the use of the Moderate Resolution Imaging Spectroradiometer
(MODIS), which offers frequent synoptic coverage at a national scale and is freely available.
Multitemporal MODIS imagery is used here to measure flood frequency and extent through
the Modified Normalised Difference Water Index (MNDWI) for selected flood periods 2003,
2010, 2012 and 2015. LandScan GRID population data from Oaks Ridge National Laboratory
(ORNL) and the projected population data derived from the most recent Nigerian census data
2006 is used to estimate population vulnerable to flood inundation.
The delineation of inundated areas from non-inundated areas was undertaken using a threshold
technique of the Modified normalized difference water index (MNDWI). The frequency and
maximum spatial extent of floods, generated by comparing the four periods of flood extents,
was informative and identified populations and Local government areas (LGAs) vulnerable to
flooding. In a developing country where spatial information and infrastructure is limited, we
report a simple, cost effective, and successful approach to detecting and mapping floods in the
Sokoto region. Considering that MODIS data products are freely available and have broad
national coverage that allow frequent observations, the results demonstrate a cost effective
method of detecting and quantifying the extent of floods in Sokoto, Nigeria.

13 | P a g e
Keywords
RS, GIS, Flood, MODIS, NDVI, NDWI, MNDWI, LandScan, Sokoto.

14 | P a g e
CHAPTER 1
1.1 Background of study
Floods are considered to be the most persistent and devastating natural hazard around the globe
(Berz et al, 2001; Sanyal and Lu, 2004) impacting on average 99million people each year
between 2000 and 2008 (WHO, 2010). The incidence of flood events has become more
frequent and severe around the world, a situation that has been attributed to climate change and
sea level rise (Clark, 1998). Consequently, it is understood that risk associated with flooding
will not subside in the future, where frequency and intensity of flooding is likely to increase
and will undermine numerous areas across the globe (McCarthy, 2001; Jonkman, 2005).
Today, the frequency and extent of so called ‘1-in-100 year’ floods are occurring on an annual
basis, which particularly effects developing nations (Klijn, 2009; Wisner et al, 2004). This is
largely as a result of poor infrastructure and housing facilities, inadequate warning systems,
low income and preparedness (Wisner et al, 2004). This is particularly true for Nigeria, the
focus country of this study.
Although storm severity in Nigeria generally cannot be compared to those that occur in some
developed countries (e.g. Hurricane Sandy or Hurricane Katrina), the aftermath of flooding in
Nigeria can be severe and is now of great concern to people and a challenging issue for
governments (Emuh, 2008; Egbinola, Olaniran and Amanambu, 2014). The present trend and
future scenarios of flooding demand accurate temporal and spatial information on their
potential risks and hazards, particularly in developing countries like Nigeria.
The advancements in the fields of Geographical information science (GIS) and remote sensing
(RS) over the last two decades have largely, facilitated the operation of flood risk assessment
and mapping. RS and GIS now play a major role in the management of natural hazards, such as
flooding, as their occurrence and impact is spatially inherent (Coppock, 1995). First order flood
risk management typically involves the generation of flood hazard maps showing areas prone
to flooding based on historical flood data. However, in developing nations, historical data that
accurately identifies flood extents and frequency can be poorly recorded and subjective, leading
to inaccuracies in flood risk zoning and compromising mitigation efforts. Spatial technologes
and infrastructure can play an important role in helping to acquire reliable, accurate and
repeatably obtained spatial information on flood events. Moreover, spatial technology like GIS
not only provide a way of visualizing the spatial distribution of flood events, but also allows

15 | P a g e
the potential to further analyse and estimate likely damages caused by flooding (Clark, 1998;
Haussmann and Weber, 1998).
Likewise, Joyce et al. (2009) suggests that RS is an essential tool in every stage of managing
disasters; giving quick-response teams valuable near real-time information used in assessment
and recovery efforts. While Joyce et al. (2009) notes some challenges that need to be overcome
in connecting and obtaining information quickly, RS has proved to be a principal tool in the
assessment, mapping and management of natural disasters. Moreover, the integration of both
GIS and RS typically extends on the potential limitations of a single technology, that when
combined enables greater capacity to obtain timely spatial information and improved capacity
for flood risk assessment, identification and monitoring flood disaster (Pradhan, Pirasteh and
Shafie, 2009; Pradhan and Shafie, 2009). Combined GIS and RS methods also help us to
understand the causes of flooding by providing objective information on the spatio-temporal
dynamics and evolution of flooding in specific areas (Smith, 1997; Brakenbridge et al, 2003;
Brakenbridge et al, 2007). Importantly, space-borne sensors like the Moderate Resolution
Imaging Spectroradiometer (MODIS) provide broad scale reliable and repeatable global
coverage of moderate-to-large flood events over inaccessible areas or places where there are
limited means of local flood monitoring information (Brakenbridge, 2006; Birkett et al, 2002).
1.2 Problem definition
Natural disasters such as floods have constituted a major problem in many developed and
developing countries. It has been recognised that flood events are one of the main factors that
keep Africa’s growing populace of city inhabitants from escaping poverty and hinders the
United Nations 2020 goal of accomplishing notable change in the lives of the populace living
in the regions of the African continent (Douglas et al, 2008). This is because most of the African
cities do not have the infrastructure to withstand severe weather conditions and the means and
equipment to monitor them. Poor flood mitigation planning in African cities, building along
floodplains, and dam failures, coupled with other inappropriate environmental practices,
contribute towards putting the African population at a higher risk.
In Nigeria, nearly 90 percent of natural hazard causing damages are because of flood events
(Adeoye, Ayanlade, and Babatimehin, 2009). Flood events in the country have become a typical

16 | P a g e
and recurrent event, having devastating effects on human livelihoods and infrastructural
development. Unfortunately, the effect is felt more by some people than others in a way that
recuperation is unlikely to be accomplished without external help (Blaikie et al, 1994). The
nation’s cities have, at different times, been affected by severe flooding, particularly in the
densely populated urban areas like Port-Harcourt, Lagos, Aba, Kano, Ibadan, and Sokoto,
resulting in loss of life and destruction of properties (Emuh, 2008; Mordi, 2011; Amaize, 2011).
The Sokoto region in Nigeria is one of the major floodplain areas in Nigeria. The plains are
seasonally flooded by the Sokoto-Rima River and rainwater run-off during the rainy season.
The land area in this location is near flat, making drainage of water on the terrain slow,
permitting retention of flooded waters that disperse over large areas during large rain events.
The Sokoto plains, in addition to its natural environment and processes, offers important
economic benefits such as local large-scale irrigation farming, agriculture, animal grazing,
small-scale fishing and flood recession agriculture (Mohammed, 2002). To support these
activities and for flood mitigation, the Bakolori and Goronyo dams were built in 1978 and 1984
respectively. The Bakolori dam was built on the River Sokoto, a major water supply tributary
of the River Rima, which in turn feeds the Niger River and supplies the Bakolori irrigation
project (Mohammed, 2002). The Goronyo dam was constructed on the Rima River to control
flooding and to release water in the dry season to the area and the neighbouring state, Kebbi
state, for irrigation purposes (Akane and Jurgen, 2005). Unfortunately, both dams have fallen
into disrepair where repeated severe flood events have led to major siltation with the dams,
significantly reducing their water holding capacity, along with the collapse of the main wall on
both dams. Consequently, the Sokoto plains are now once again subject to considerable flooding
resulting in the loss of properties and lives (Akane and Jurgen, 2005). This has been exacerbated
by changing rainfall regimes in the region to less frequent but more intense rainfall events. This
has resulted in the further reduction and loss of activities such as flood recession grazing,
agricultural lands, fishing activities, biodiversity and reduction in vegetation succession (Ekpoh
and Ekpenyong, 2011). In particular, the floods of 2009, 2012, 2013 and 2015, all of which
affected large areas of the state including the Sokoto plains, serve as clear evidence of their
destructive nature and their adverse effect on agricultural products, livestock, property as well
as human lives.
Despite this, “floods are acknowledged to be among the most manageable of disasters” (Keys,
Angus and Benning, 1996). Several studies have been carried out on flooding in Nigeria, looking

17 | P a g e
at their impact and plans for their abatement across many areas of the country (Ayoade and
Akintola, 1980; Akintola 1994; Adeloye and Rustum 2011; Ologunorisa, 2009; Ishaya,
Ifatimehin and Abaje, 2009; Egbinola, Olaniran and Amanambu, 2014). However, despite the
well-established value of GIS and RS as a critical decision support tool for flood hazard, risk
mapping and management, only a few studies incorporating these technologies have been
carried out in Nigeria (Ikusemoran, Anthony, and Maryah, 2013; Muhammad and Iyortim,
2013; Ojigi, Adbulbakiri and Aderoju, 2013; Nwilo, Olayinka and Ayila, 2012). Of these
studies, none have focused on the Sokoto region; the primary focus of this current study. This
is unfortunate because it has increasingly been acknowledged by Egbinola, Olaniran and
Amanambu, (2014); Abah, (2013) and Isma’il and Saanyol, (2013) that areas like the
floodplains of Sokoto region, which experiences repeated perennial flooding due to its location,
topography and recent heavy rainfall, should benefit from these RS and GIS decision support
tools.
Like other flood-prone areas in Nigeria, a review of the flood events in Sokoto State shows that
flood management and flooding has become one of the primary concerns of people and
government decision makers (Amunobi, 2013). With the frequency in flooding likely to
increase because of environmental changes (Bhuiyan and Dutta, 2012; Karamouz et al, 2011),
there is a growing demand for accurate flood maps for managing disaster risk. Therefore, this
study seeks to obtain baseline information on the temporal dynamics of flooding, their extent,
and potential risk to human life in the Sokoto Sate region. Information about flooding
underscores and justifies the need for this study, in order to help our understanding of flood
events in this region that may assist mitigation efforts with the objective of minimising their
destructive power.
GIS and RS have been mainstream decision support tools used to acquire, store, and analyse
environmental information for the past two decades (Lillesand and Kiefer, 2004). These
technologies have had a profound impact on progressing research techniques and outcomes in
geography over this period. These innovations have been utilized for managing numerous flood
prone and floodplain areas around the world. Specifically, therefore, this study investigates a
RS approach to detecting and mapping temporal flood extents using existing image analysis
methods along the Sokoto-Rima river system in Sokoto State, Nigeria. GIS is then used to
estimate the population living within flood-affected areas in order to develop flood risk and
inundation maps for Sokoto region of Nigeria. Notably, developing countries like Nigeria have
poor spatial data infrastructure and resources to acquire high precision information. These

18 | P a g e
countries often rely on global data sets to supplement local spatial information that is scarce or
incomplete. Consequently, MODIS imagery and LandScan GRID population data are used to
conduct this research where no other means of doing so is available. However, these data sets
are of high quality, providing reliable consistent and repeatable information in the face of
limited local data. MODIS data provides a daily global coverage of land surface information,
while the LandScan GRID population data “is the finest resolution global population
distribution available representing ambient population” (ORNL, 2016) that aims to account
for people's mobility.
1.3 Research questions
Specifically, this research sets out to answer the following questions:
1. What is the most suitable image analysis method to delineate flooded areas along the
Sokoto-Rima river system?
2. What are the various geospatial techniques available for delineating flooded areas and
their extent?
3. What is the extent of flooded areas in each of the LGAs along the Sokoto-Rima river
system?
4. Where and how many people are at risk from flooding?
5. How suitable is MODIS imagery in delineating flooded areas along the Sokoto-Rima
river system?
6. How suitable is LandScan population data in identifying people at risk from flooding?
1.4 Research aims and objectives
From the research questions posed, the primary aim of this study is to develop a better
understanding of the temporal flood extents and the people at risk from flooding along the
Sokoto-Rima river system in Nigeria in order to prioritise mitigation efforts for disaster risk
reduction in this area.
To this end, the study explores the use of remote sensing (RS) and geographical information
science (GIS) technology through freely available MODIS imagery and LandScan GRID

19 | P a g e
population data in estimating population risk to flood events where the specific objectives of
the study are:
1. To investigate whether the temporal and spatial resolution of MODIS imagery can
suitably reveal all recorded severe flood events over the selected periods.
2. Investigate a suitable image analysis technique that will adequately map the distribution
and quantify flooded areas for each of the recorded flood events.
3. To develop frequency of inundation and spatial distribution maps of these flood events.
4. To assess the suitability of the LandScan GRID population data to reveal real
population concentrations against normalised population counts recorded at the LGA
level from the most recent Nigerian census, conducted in 2006.
5. To investigate the spatial relationship between flooded areas and population
concentrations to identify the number of people that are vulnerable to flood events using
GIS.
6. To evaluate flood risk mapping results against historical records of people affected by
these flood events.
1.5 Scope of study and anticipated outcomes
This study examines the use of Moderate Resolution Imaging Spectro-radiometer (MODIS) data
and the LandScan GRID population data to map inundation and estimate the number of people
at risk/vulnerable in Sokoto, Nigeria. Some of the terms and concepts associated with flood
mapping and disaster risk management will be discussed along with the applications of remote
sensing (RS) and Geographical information system (GIS) in monitoring and mapping flood
events. The focus of this study is to detect the flood, identify the areas at risk, estimate the total
number of people vulnerable using the LandScan GRID population data (2014) and create a
flood inundation map showing the areas vulnerable to flooding.
This research will be an addition to the studies of flood hazards/risk/vulnerability mapping in
Nigeria. This study, contributes towards reducing the impacts of floods in Sokoto, Nigeria
because it will serve as input for the integration of flood risks management strategies and spatial

20 | P a g e
planning in the area. The flood inundation maps can further be utilized for easy and quick
identification of areas of potential flood hazard to minimize losses. In addition, this
methodology can be used as a tool by the authorities concerned to control and apply
management and land zoning, reduce flood hazards, protect the environment, provide insurance
and plan development.
1.6 Study area
1.6.1 Location
The study area for this research is Sokoto located in the North-western region of Nigeria. The
state is located at latitude 13° 03’ 39” N and Longitude 5° 14’ 20” E, and was established in
1976 (Figure 1). The state was one of the largest in Nigeria before two other states Zamfara
and Kebbi were carved out of Sokoto State in the early and mid-90s. The state covers a land
area of approximately 33,777km2 and shares its borders with the Niger Republic to the north,
Benin-republic to the west and Niger State to the southeast. With a population of more than 4.3
million, Sokoto-city, which is the modern day capital of the state, remains the most densely
settled part of the state.
1.4.2 Relief and Drainage
a) Nigeria in Africa b) Sokoto state in Nigeria

21 | P a g e
c) Sokoto State LGAs d) Map showing River Sokoto and its
tributaries.
Figure 1.1 (a-c) - Nested map series showing Africa, Nigeria, Sokoto and the LGAs (Source:
GIS-DIVA vector dataset).
Figure 1.1 (d) Map of Nigeria showing the River Sokoto and its tributaries (Wikipedia, 2016).
1.6.2 Relief and drainage
The Sokoto area is situated within the Iullemeden basin, which is surrounded by the
Precambrian basement complex (Greigert, 1961). The area is covered by a progression of
sedimentary rocks that has been deposited over the basement complex. These rock sediments
were laid down under different environmental settings varying from continental to marine
events. The relief of area is generally a lowland with an average height of 300m above sea
level, known as the Sokoto plains. Davis (1982) described this relief as a monotony of lowland
disrupted by mesas and escarpments and these escarpments, along with the hills, ascend to
around 488m.
The area is drained by the River Sokoto-Rima and its tributaries, most of which rise in the
South-eastern area of the state and in Kaduna the neighbouring State. Two of the tributaries
flow in a northerly direction to join Rima while the two other tributaries, flow westwards to
22 | P a g e
join the main River Sokoto.
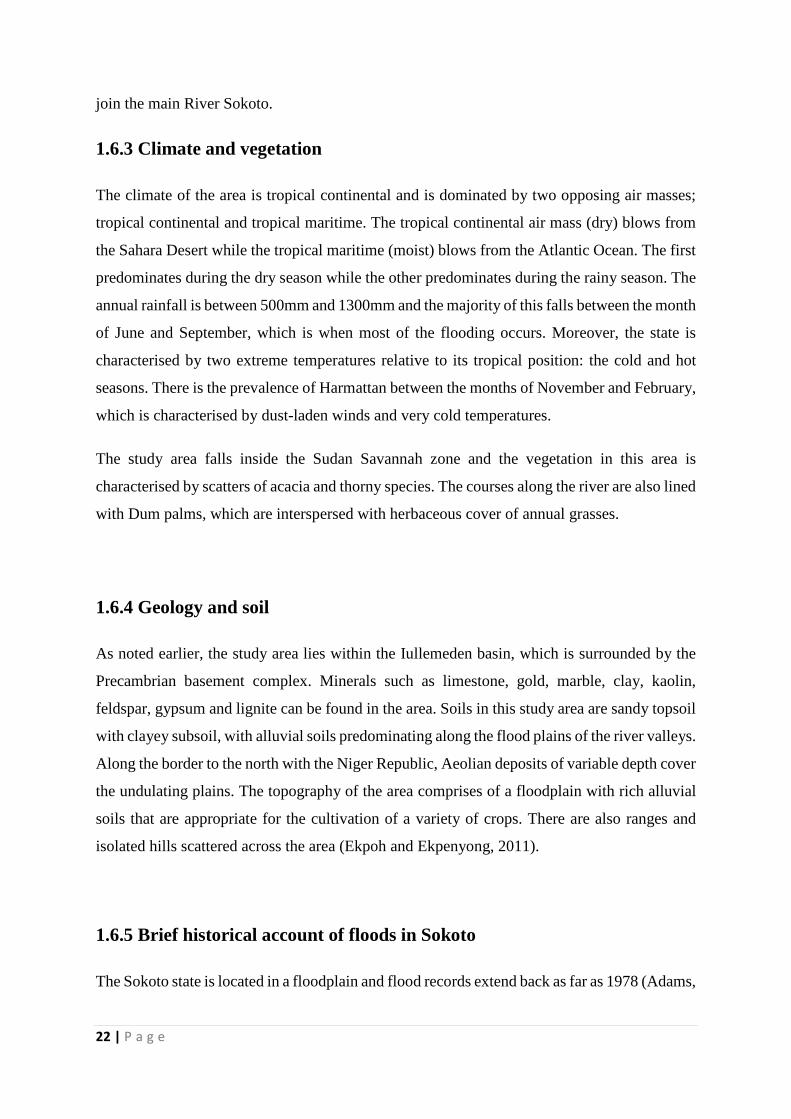
1.6.3 Climate and vegetation
The climate of the area is tropical continental and is dominated by two opposing air masses;
tropical continental and tropical maritime. The tropical continental air mass (dry) blows from
the Sahara Desert while the tropical maritime (moist) blows from the Atlantic Ocean. The first
predominates during the dry season while the other predominates during the rainy season. The
annual rainfall is between 500mm and 1300mm and the majority of this falls between the month
of June and September, which is when most of the flooding occurs. Moreover, the state is
characterised by two extreme temperatures relative to its tropical position: the cold and hot
seasons. There is the prevalence of Harmattan between the months of November and February,
which is characterised by dust-laden winds and very cold temperatures.
The study area falls inside the Sudan Savannah zone and the vegetation in this area is
characterised by scatters of acacia and thorny species. The courses along the river are also lined
with Dum palms, which are interspersed with herbaceous cover of annual grasses.
1.6.4 Geology and soil
As noted earlier, the study area lies within the Iullemeden basin, which is surrounded by the
Precambrian basement complex. Minerals such as limestone, gold, marble, clay, kaolin,
feldspar, gypsum and lignite can be found in the area. Soils in this study area are sandy topsoil
with clayey subsoil, with alluvial soils predominating along the flood plains of the river valleys.
Along the border to the north with the Niger Republic, Aeolian deposits of variable depth cover
the undulating plains. The topography of the area comprises of a floodplain with rich alluvial
soils that are appropriate for the cultivation of a variety of crops. There are also ranges and
isolated hills scattered across the area (Ekpoh and Ekpenyong, 2011).
1.6.5 Brief historical account of floods in Sokoto
The Sokoto state is located in a floodplain and flood records extend back as far as 1978 (Adams,

23 | P a g e
1992). Occurrences of floods in this area of the nation in recent times have been of great
concern and a challenge to the government, researchers, and people. There have been
journalistic and non-quantitative reports of flooding for different locations in the country
including Sokoto Sate. However, they are superficial, subjective and lack directions for policy
makers and professionals (Aderogba, 2012).
During the last decade in Nigeria, flooding has been on the increase as a result of climate
change coupled with intensive human activities. The 2009 floods in Nigeria affected 150,000
people and displaced tens of thousands across the Northern states including Sokoto state
(NEMA, 2009). The substantial downpour in the northern part of the country and neighbouring
country Niger Republic during the months of August and September 2010 also brought about
extreme flooding in Sokoto State (Figure 1.2-1.4). The flood situation in the state during this
period was compounded by the overflow of the Rima River and the breakdown of Goronyo
Dam amid the first week of September 2010. Numerous houses were submerged and hectares
of farmland including domesticated animals and crops were washed away by floodwater that
claimed over 40 lives and displaced a huge number of families in 50 communities of 11 Local
Governments areas out of the 23 that made up the Study area (People’s daily online, 2010).
According to the Nigerian Red Cross Society (NRCS) after an in-depth assessment of the 2012
flood, with support from the International Federation, 10,214 farms were destroyed, 1,524
water wells contaminated by floodwater, while 1,786 toilet facilities were damaged and 2,972
families were displaced by the flood (NRCS, 2011). The floods also damaged some public
infrastructure including schools, roads, bridges and the Usmanu Dan Fodio University, Sokoto
State. After the rainfall ceased and floodwaters receded, access to some of the affected areas
was still a major problem due to the collapse of bridges and the difficult terrain. Egbinola,
Olaniran and Amanambu (2014) described the 2012 flooding as the worst in more than 40years
where, 33 out of the 36 states in the country were affected and an estimation of about 7million
individuals were affected by the floods. This, led to about 363 deaths and more than 600,000
houses damaged or destroyed with the internal displacement of 2,157,419 people (Egbinola,
Olaniran and Amanambu, 2014). The recent severe flooding in September 2015 began with
heavy rainfall that resulted in an increase, overflow and release of excess water from the
Goronyo Dam by the River Sokoto, which led to an evacuation of no fewer than 10,000 people
from the 20 flood-prone communities in the Sokoto region (Figure 1.5) (Premium times, 2016).

24 | P a g e
Figure 1.2 Figure 1.3
Figure 1.4 Figure 1.5
Figure 1.2-1.4 Flooding in Sokoto state, Northern Nigeria, September 2010. (Source: Chris
Houston/MedecinsSansFrontieres (MSF)
Figure 1.5 Submerged houses by the August 2015 flood in Sokoto state, Northern Nigeria.
(Source: Nigerian eye new).
These specific flood events underpin this study where it is hoped to quantify the extent of these
flood events for the purpose of understanding and mitigation for risk reduction. This will help
further to contribute towards reducing the impacts of floods in Sokoto, Nigeria because it will

25 | P a g e
serve as input for the integration of flood risks management strategies and spatial planning in
the area. The flood inundation maps can further be utilized for easy and quick identification of
areas of potential flood hazard to minimize losses.
1.7 Thesis structure
Chapter 2 of this thesis will review the different definitions of flood; discuss the principle types
of flood, causes of flood and the hazards usually associated with flood events. This will be
followed by a look at flood mapping and a review of the different terms and concept used in
disaster risk management. Chapter 2 will conclude with a review of RS and GIS applications
for monitoring and mapping flood inundation and how some of these techniques have been
used and sometimes combined in mapping flood hazard, risk and inundation.
Chapter 3 focuses on the methods used in carrying out this research. Specifically, it will present
data sources used for mapping inundation and estimating the population at risk; how the data
was processed and the methods used in order to detect and map the frequency of flooding and
its impact on populous places.
Chapter 4 presents the results of this study along with a discussion on the information derived
from the flood analysis. The extent of inundation and the population at risk will be explained.
Chapter 5 concludes the thesis with the research findings, outcomes, limitations and
recommendations for future studies.

26 | P a g e
Chapter 2
2.1 Flood management
2.1.1 Definition of flood
Flood remains the most frequently reported, and costliest disaster around the globe,
constituting over forty percent of natural global catastrophe (Tapsell and Tunstall, 2008). It is
for sure the most well-known of all the natural hazards which frequently claims over 20,000
lives every year and has impacts on about seventy-five million people around the world (Smith,
2006).
Flooding, though a common event all over the world, is more widespread and has weighted
impact in developing countries like Nigeria (Andjelkovic, 2001). This event has emerged to
be one of the main issues of concern in the development of the country as the frequencies of
such events and the magnitude of the misfortunes as far as lives and properties are concerned
are becoming frightening (Oyebande, 1983; Emuh, 2008).
The definitions used to describe flooding are many and may mean something different to
different researchers with respect to the context and location in which it is used (Brooks,
Adger, and Kelly, 2005; Brooks, 2003). Nicholls (2002), in defining floods, described it as a
process whereby water brought into a drainage channel is more than it can convey. The
abundant water flows over the banks and spreads out to the surrounding areas, creating the
condition where we have a flood.
According to Burt et al, (2002), flood can be said to be an unusual water accumulation above
the ground, which is created as a result of heavy rainfall, rapid runoff from concrete surfaces
or high tides. Natural floodplains happen to be a characteristics feature of some rivers. The
most severe floods happen along coastal areas. In these regions, substantial precipitation and
poor soil combine to bring about flooding.
Smith and Ward (1998) demonstrates that there are a number of components utilised to depict
the nature of flooding and its extent. For example, its range of coverage, the speed of flow, the
volume of water released by time and duration. However, these factors are generally influenced
by the amount of rainfall, soil type, the period of year, geomorphic characteristics as well as
slope of terrain. In general, the reasons for increasing flood events in many parts of the world

27 | P a g e
are as a result of climate change, increasing population, changes in land-use pattern and land
subsidence (Smith and Ward, 1998; Bhuiyan and Dutta, 2012; Karamouz et al, 2011). Issues
linked to flooding and populace vulnerability have considerably increased in last few decades
as a result of a number of factors including urbanization in the areas liable to flood, increase
in the density of the households, sub-standard constructions and settlement pattern and changes
in the land-use pattern (Pelling, 2003). In addition, the dangers of floodwaters are associated
with various factors such as rate of rising waters and recurrence, load of sediment, water depth,
velocity and duration (Klijn, 2009).
2.1.2 The principal types of floods
There are different nomenclatures given to describe types of flood events and they can be
described or characterised according to the source of water, the geography of the area receiving
it, the river course and velocity, or the cause. The major different types of flood include; fluvial
floods, urban floods, coastal floods, and pluvial floods.
Coastal floods are brought about by extreme storm events bringing severe onshore coastal
winds and vast waves typically coupled with high tides that floods estuaries and coastal zones
with ocean water (Klijn, 2009; Wright et al, 2008; EC, 2007). Usually, large areas are affected
and means of living and human lives can be lost in the process. Forecasts of a coastal storm
can normally be between a couple of hours to days ahead (Klijn, 2009) while the conceivable
rise in the level of the sea can happen between four to eight hours after the storm surge has
begun (Wright et al, 2008). Flooding along the coast is usually followed by huge, battering
waves and floating debris that lead to erosion of the beach and large-scale destruction to
infrastructure along the coastline (Wright et al, 2008).
River floods, on the other hand, are caused as a result of long periods of precipitation in the
catchment zone that lead to an increasing level of water that eventually overflows the banks of
the river (Wright et al, 2008; EC, 2007). This type of flood starts slowly and is typically
confined to floodplains (Wright et al, 2008; Wisner et al, 2004). They are often known by their
slow speed that effect largely inundated zones that can bring about many damages but few
fatalities (Klijn, 2009).

28 | P a g e
Flash floods occur in hilly areas, in the upper level of the basin of a river during extreme rainfall
(Wright et al, 2008; Klijn, 2009). Even though this type of flood occurs under the subdivision
of river flooding (Wisner et al, 2004; Wright et al, 2008), they are regularly considered as
another type of flood because of the extreme damage and high fatalities they can bring about.
Klijn (2009) refers to this type of flood as “small-scale killers” as these floods are the small
types that can happen regularly. The high speed and load of debris of this type of flood (Wright
et al, 2008) and the trouble in anticipating them (Klijn, 2009) make early warning and
evacuation a big problem.
The Ponding or Pluvial flood types occur when water from precipitation begins to accumulate
in low-lying areas with soil types that are clayey in nature (Klijn, 2009). This type of flood
starts slowly and can be predicted days ahead, though they can bring about major damage,
particularly in urban zones, however not often with fatalities (Klijn, 2009).
Lastly, urban flood types can result from flash floods, river floods or coastal flooding. Urban
flooding often results from a lack of good drainage, impervious surfaces, coupled with high
rainfall. Most urban areas have paved surfaces with little soil and poor drainage systems, which
do not allow the amount of rain that is falling to drain away. In developing countries in
particular, where there are little or no drainage/stormwater systems, water disperses quickly
over impervious surfaces and is deposited in another place leading to a flood. The condition is
known for its repetitive and systemic effect it has on the area, regardless of whether they are
close to or located in a floodplain or water body (Klijn, 2009).
2.1.3 Causes of flood
Floods usually are most commonly caused by excessively prolonged and/or heavy rainfall
when the natural watercourse does not have the ability to convey surplus water. However, there
are also other ways in which floods can occur apart from heavy or prolonged rainfall, which
can be ascribed to other natural hazards or human-caused hazards like dam failure or storm
surge associated with a tropical cyclone or high tides coinciding with higher than ordinary river
levels (Wisner et al, 2004; EC, 2007). Ojo (2011) identifies that floods in developing countries
are often caused by economic pressures from developers, lack of institutional capacity at the
municipal level, poor or lack of standard drainage system on roads, unrealistic regulations,

29 | P a g e
unregulated developments, and the ineffectiveness of planning regulation by permitting
development on flood plains.
Climate change is a significant driver of flooding and it is a problem that is identified with the
physical, social, economic and cultural environment of any country. This is a key component
of the environment that mould and re-mould different individual activities in a particular
environment. The United Nations Framework Convention on Climate Change (UNFCCC)
defines climate change “as a change of climate which is attributable directly or indirectly to
human activity that alters the composition of the global atmosphere and which is in addition
to natural climate variability observed over comparable time periods” (UN-ISDR, 2009a).
Human activities such as burning of fossil fuels, industrialization, deforestation, technology
development, natural factors such as solar radiation, agricultural activities and urbanization are
significant causes of climate change (Mshelia, 2005). This change in the climate is making
weather less predictable, particularly in the developing countries such as Nigeria where means
and equipment to manage and predict weather conditions are not sufficient (Nwafor, 2007).
This unpredictability of precipitation during the rainy season has brought about untold hardship
in many regions across the country.
2.1.4 Hazards associated with flooding
Notably, flood events do not necessarily constitute a hazard where it is a necessary requirement
of some natural ecosystems and where regular “controlled” flood events necessitate irrigation
for crops. However, flooding can become a hazard when it is uncontrolled and where there is
the potential for negative impacts on infrastructure and human lives. This is more evident in
coastal and floodplain areas where the desire to live in areas susceptible to flooding out ways
the perceived risk.
Flood effects can be grouped into primary, secondary and tertiary or long-term effects (Klijn,
2009; EC, 2007). Primary flood effects are those that happen as a result of direct contact
with flooded water, such as injuries and loss of life, secondary flood effects are those associated
with health implications and disruption of services. Tertiary flood effects are those long-term
effects such as economic loss due to disruption to food production and tourism or restoration
of ecosystems and infrastructure due to realignment of river channels. All through the last

30 | P a g e
century, flood events have been one of the costliest disasters in terms of both human casualties
and property damage. Pelling et al, (2004) estimated that over one hundred and ninety-six
million individuals in more than ninety nations are vulnerable to flooding calamity each year.
Floods have effects on both individuals and communities and have environmental, economic
and social consequences. The impacts of floods can also be both positive and negative, and
they vary greatly depending on the flood extent and the location of the flood, and the
vulnerability and value of the built and natural environments they affect. However, the negative
effect of flooding is usually more than the positive.
As indicated earlier, a rise in the occurrence of flooding and its effects can be attributed to the
impact of climate change and the propensity of people to dwell in areas that are liable to flood
(Klijn, 2009; Wisner et al, 2004). In spite of the risk, people living in areas prone to flooding
often do so as a matter of ignorance or by choice. However, many people living in flood-
affected areas or move back into areas where severe flooding has occurred, do so as they have
little choice. This is particularly true in developing countries where flood plains are often
crucial to their means of living. They move back to these areas (Wright et al, 2008; Wisner et
al, 2004) where the soils are rich in nutrients and where the river provides water for aquaculture
and irrigation of crops like the Sokoto plains where agriculture is their main practice and source
of income.
Archived and reported severe flood events/disasters in Nigeria afford good insights into flood-
related issues and the potential extent of flood risk in the country. For example, during the 2012
flood event, 33 out of the 36 states in the country was affected and an estimation of about
7million individuals were affected by the floods, leading to about 363 deaths and more than
600,000 houses damaged or destroyed leading to the internal displacement of 2,157,419 people
(Egbinola, Olaniran and Amanambu, 2014). This is the worst the country experienced for more
than 40 years. The 2012 flood event lasted seven days and during this period, Sokoto State
witnessed a full season of flooding as a result of the dam breakage on Rima River, which
resulted in no fewer than 50 villages been ravaged by floods, displacement of more than
130,000 people in nine councils and the death of eight people. Out of the 50 villages in this
location, 20 were completely submerged, while major roads and bridges were destroyed
(UNICEF, 2013).

31 | P a g e
2.1.5 Understanding the areas liable to flooding
The regions along a river that are liable to flood disaster can be separated into distinctive zones,
specifically the floodway, floodplain, and flood line. The first is recognised by high stream
speeds, the presence of flowing debris with possible erosion and deep water levels. Any
development apart from infrastructure that is critical like bridges should never be allowed in
this area (Wright et al, 2008; UN-ISDR, 2004). The other, floodplain represents all the zones
encompassing the channel of the river that can be immersed amid the event of a flood (Wright
et al, 2008). There exists no determinable limit for a floodplain as there is no restriction on the
size of a flood. As the elevation of a point on the floodplain increases, the likelihood of
immersion reduces (Alexander, 2001). A flood line, however, is just a line that characterizes a
range whereby no development ought to occur, as it is a sign of the flood water level with a
predefined yearly exceedance likelihood (Alexander, 2001).
2.1.6 Flood mapping in floodplains
In numerous floodplain environments, maintenance occurs naturally by natural flooding
regimes (Junk, 2002) fed by rainfall and river waters (Barber et al, 1996). Natural floods are
very important in this type of ecosystem. This natural flooding period helps to maintain the soil
fertility in natural and agricultural floodplain areas by transportation of sediments and nutrients.
However, understanding the frequency, extent and changes that are likely to occur because of
flooding in a particular floodplain is important because it enables better planning and timing
of urgent and non-urgent restoration and mitigation efforts.
To enable more strategic management of flooding in floodplain areas, there is a need for
information that is regularly collected and up-to-date that informs decision makers about the
characteristics of natural flood regimes. This should include both non-spatial and spatial
information. Multitemporal flood maps are invaluable in this regard (Michael, 2007). Flood
mapping have been undertaken using different techniques (Sandholt et al, 2003, Wang, 2006)
which include the utilization of airborne remote sensing (RS), hydrodynamic models, and
ground survey. However, because of the difficulties in accessing and acquiring information
over many, widely dispersed floodplain areas that can be hundreds of square kilometres in size,
these techniques are time-consuming and expensive. Utilizing these methods is often then

32 | P a g e
limited to smaller regional areas. Satellite RS presents the most reliable way for mapping large,
inaccessible floodplains like the Sokoto plains. Microwave and/or optical sensors on board
satellites gives a synoptic view over vast areas (Toyra et al, 2002). A good example is a study
by Rachael et al, (2015) that used Landsat TM imagery to map inundation in the heterogeneous
floodplain wetlands of the Macquarie Marshes, Australia. The marshes which covers an area
of 19,850 hectares in South-east Australia, is one of the largest semi-permanent freshwater
wetlands in the area.
2.2 The concept of disaster risk management
It is important to understand common concepts utilised in disaster risk management in view of
the fact that this study forms a component of a progression towards minimising risk. Different
terms and definitions are additionally included for a more comprehensive overview. Disaster
Risk Reduction (DRR) underpins the motivation for this study and this defined as the structured
growth and application of strategies, practices, and policies to reduce vulnerabilities and disaster
risks in every part of a community, to avoid or to reduce the harmful effects of hazards (UN-
ISDR, 2004). As earlier, pointed out in the first chapter, natural disasters, and floods specifically
have become recurrent and this is likely to continue in the future because of climate change. It
might hence, not be attainable to mitigate all floods and their associated risk. What is important
though is to attempt to comprehensively understand flood risk and related impacts in the context
of DRR. This is made possible by obtaining baseline information through the development of
flood risk, inundation and hazard maps, which can be utilized to outline proper measures to
control and reduce the impacts of flooding and to strengthen and shape the ability by which
people can adapt (AU and NEPAD, 2004). Notably, flood risk/vulnerability maps are those
maps showing the projected damage or losses experienced by flooding, whereas flood hazard
maps are those showing the inundation area (Tsakiris, Nalbantis and Pistrika, 2009; EC, 2007).
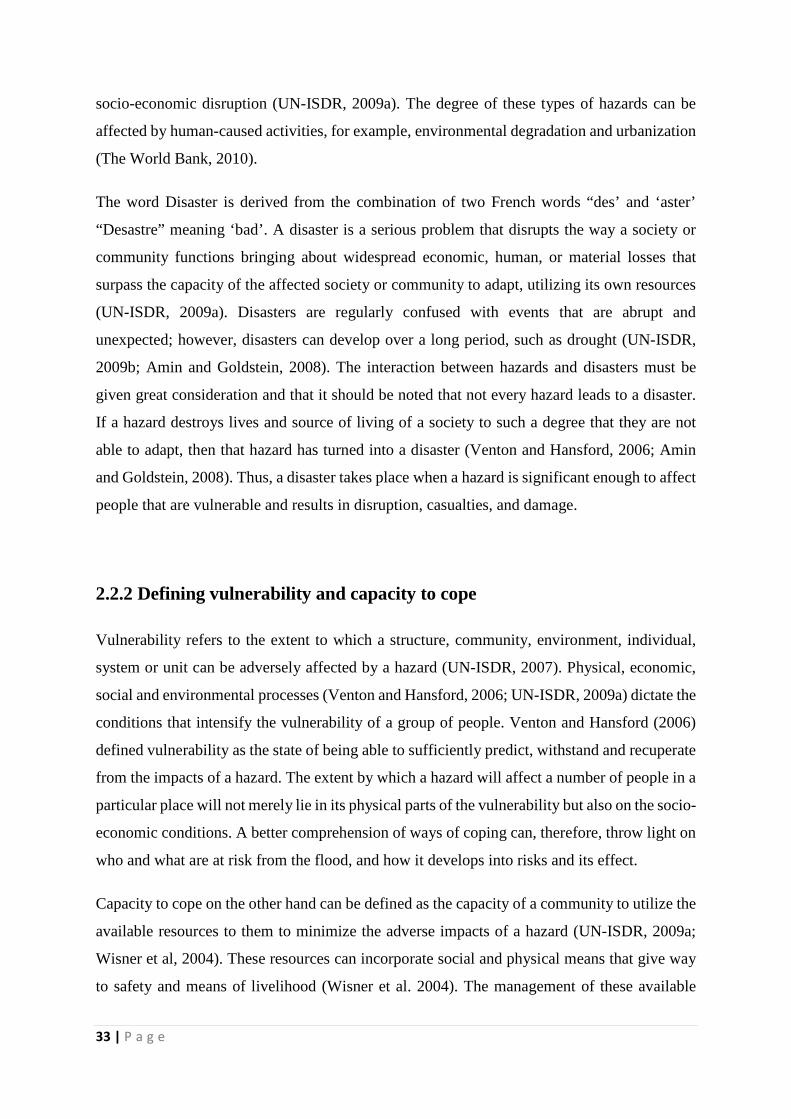
2.2.1 Defining natural hazards and disaster
Natural hazards refer to those natural phenomena or processes that occur in the biosphere, such
as geological, hydrological or climatological processes (UN-ISDR, 2007) that can bring about
harm, loss of life, loss of livelihoods, damage to properties, environmental degradation, or
33 | P a g e
socio-economic disruption (UN-ISDR, 2009a). The degree of these types of hazards can be
affected by human-caused activities, for example, environmental degradation and urbanization
(The World Bank, 2010).
The word Disaster is derived from the combination of two French words “des’ and ‘aster’
“Desastre” meaning ‘bad’. A disaster is a serious problem that disrupts the way a society or
community functions bringing about widespread economic, human, or material losses that
surpass the capacity of the affected society or community to adapt, utilizing its own resources
(UN-ISDR, 2009a). Disasters are regularly confused with events that are abrupt and
unexpected; however, disasters can develop over a long period, such as drought (UN-ISDR,
2009b; Amin and Goldstein, 2008). The interaction between hazards and disasters must be
given great consideration and that it should be noted that not every hazard leads to a disaster.
If a hazard destroys lives and source of living of a society to such a degree that they are not
able to adapt, then that hazard has turned into a disaster (Venton and Hansford, 2006; Amin
and Goldstein, 2008). Thus, a disaster takes place when a hazard is significant enough to affect
people that are vulnerable and results in disruption, casualties, and damage.
2.2.2 Defining vulnerability and capacity to cope
Vulnerability refers to the extent to which a structure, community, environment, individual,
system or unit can be adversely affected by a hazard (UN-ISDR, 2007). Physical, economic,
social and environmental processes (Venton and Hansford, 2006; UN-ISDR, 2009a) dictate the
conditions that intensify the vulnerability of a group of people. Venton and Hansford (2006)
defined vulnerability as the state of being able to sufficiently predict, withstand and recuperate
from the impacts of a hazard. The extent by which a hazard will affect a number of people in a
particular place will not merely lie in its physical parts of the vulnerability but also on the socio-
economic conditions. A better comprehension of ways of coping can, therefore, throw light on
who and what are at risk from the flood, and how it develops into risks and its effect.
Capacity to cope on the other hand can be defined as the capacity of a community to utilize the
available resources to them to minimize the adverse impacts of a hazard (UN-ISDR, 2009a;
Wisner et al, 2004). These resources can incorporate social and physical means that give way
to safety and means of livelihood (Wisner et al. 2004). The management of these available

34 | P a g e
resources is a continual operation that takes place after, during and before a hazard (UN-ISDR,
2009a). Hazards, as we know, are always prevalent, but it only becomes a disaster when there
is a greater vulnerability and less of a capacity to cope.
2.2.3 Defining flood hazard
The word hazard has its origin in French word ‘hasard’ and in Arabic ‘az-Zahr’ meaning
‘chance’. Hazard as defined by the UN-ISDR (2009a) as a potentially damaging phenomenon,
physical event or human activity or condition that may bring about harm, loss of lives, loss of
livelihoods and properties, environmental damage or disrupt the social and economic sector.
Hazards can be grouped into two different categories namely artificial and natural. While the
artificial hazards are those due to the negligence of humans like pollution, dam failure, and
poor waste disposals etc. natural hazards are those caused typically as a result of natural
phenomenon like tsunamis, cyclones, earthquakes, flooding etc. (UN-ISDR, 2009a). Flood
hazard, therefore, is defined as the exposure to flooding and depends on flood extents and
magnitudes like the depth of the flood, duration, and velocity.
2.2.4 Defining flood risk
Often when people talk about risk, they actually mean hazard. However, risk is defined as the
likelihood of expected losses or harmful outcomes such as personal injuries, deaths, means of
livelihood and economic loss as a result of the interaction between human-induced or natural
hazards and associated vulnerable conditions (UN-ISDR, 2004). Like studies undertaken by
Kron (2005) and Karim, Mimura and Nobuoka, (2005) who both defined flood risk as a result
of flood vulnerability and hazard. Risk is described “generally as the uncertain product of a
hazard and its potential loss” (Kron, 2005; Crichton, 2002). It has been defined as an extent
of the overall adverse effects of flooding (Dang, Babel and Luong, 2010). It includes the notion
of risk to life, the trouble and chance of removing people and their belongings amid a flood,
production loss and possible damage to buildings, social disruptions, and destruction to public
properties. Importantly, since people have the ability to react and shield themselves from the
impacts of hazards, the capacity to cope is incorporated into the notion of risk (Baas et al,
2008).

35 | P a g e
2.3 Review of GIS and remote sensing in flood management
As noted earlier, floods have been acknowledged to be among the most manageable of disasters
(Keys, Angus and Benning, 1996). Geographical information system (GIS) along with Remote
sensing (RS) technology has been shown to be an important tool for flood monitoring and
mapping in recent years (Lillesand and Kiefer, 2004). The focus of these decision support tools
revolves around the preparation of flood maps (risk/hazard) for vulnerable areas and the
delineation of flood zones.
A GIS is an information system designed to acquire, store, process and display spatial or
geographical referenced data (Goodchild, 2006). Coppock (1995) notes that GIS has a key part
to play in flood mapping and other disaster management scenarios because natural disasters
are multidimensional and the spatial component is intrinsic. A key point of using GIS in flood
management is not just because of its visualization capabilities of flooding, but it also provides
spatial analysis tools to help estimate possible damage and risk to vulnerable areas. RS, on the
other hand, is the primary way in which information on flood extent and frequency is derived.
Satellite images acquired during, before and after a flood event can give valuable information
about the occurrence of flooding, their intensity and progress. These images can also provide
information on delineating the river course, its spill channels, embankments and spurs affected
by flooding that allow appropriate mitigation and flood relief measures to be planned and
executed on time.
2.3.1 GIS applications for monitoring and mapping floods
Accurate floodplain mapping is one of the most valuable tools for avoiding severe losses from
floods (social and economic). Geographical information system (GIS) is a tool that can be
utilized in each progression of the assessment of flood risk for modelling, management of data,
and prediction (Goodchild, 2006; Maidment, Robayo and Merwade 2005). Currently, GIS is
being utilized as a major tool for preparing flood hazard maps in many flood prone and
floodplain areas. Azagra-Camino (1999) used GIS to model the extent of potential flood areas
concentrating on a small study zone making use of a more exact terrain model developed from
a Triangulated Irregular Network (TIN). The TIN was created from stereo aerial photographs,
which brought about a highly precise landscape illustration of the area of study. Azagra-

36 | P a g e
Camino (1999) was then able to develop a topographic digital elevation model (DEM) from
the TIN and derived channel and stream geometry for utilization in a flood model. The flood
visualization results gave highly precise two-dimensional (2D) and three-dimensional (3D)
flood hazard maps. Yalcin, (2002) utilised multi-criteria evaluation (MCE) technique to
examine and discover the vulnerable flood zones in northern Turkey. In this study, GIS was
incorporated with MCE. The study used seven criteria which were developed into spatial data
layers using GIS software. A criteria ranking method was used to order the importance of each
layer/criteria where a Boolean approach, and pairwise techniques were utilized to make a
composite map of the flood vulnerable areas. Based on this technique, three separate results
were produced and differences between the three were analysed. Their study provided and
showed useful ways to examine alternatives and evaluate criteria to reduce uncertainty for the
decision solution. Lawal (2012) also used a multi-criteria evaluation method alongside
Analytical Hierarchy Process (AHP) within a GIS to assess flood susceptible zones. The
outcome of the assessment indicated zones that are susceptible to flooding which also helped
in the effective decision-making and development of control policies. The decisions and control
policies indicated that structural measures alone could not withstand the current flood
phenomenon common in most parts of the world today; therefore, the requirement for a
sustainable method to control flood is unavoidable. Importantly, since about 80 percent of data
used by decision makers is connected geographically (Malczewski, 1999), GIS provides the
ability to model these spatial relationships for better decision making.
Dutta, Herath and Musiake, (2003) also utilised a mathematical model for assessing the
estimate of losses caused as a result of flooding in Japan. The model created is a combined
flood misfortune distributed estimation model and a physically based hydrological distributed
model. They showed how the model requires multi-temporal spatial data such as Satellites Pour
l’Observation de la Terre (SPOT) and Landsat satellite data to obtain comprehensive land cover
information and to delineate the urban flood zone. The study showed how the spatial model
output was equivalent to actual damages observed. The model was likewise demonstrated to
perform better in assessing the damage caused by flooding in an urban area compared to the
damage in rural areas. This study also showed that the process of using data from different
sensors is not straightforward and often requires iterative experiments to arrive at an optimal
result.

37 | P a g e
Sanyal and Lu (2004) also utilized GIS for evaluation of flood damage in the monsoon Asia
by designing a Flood Hazard Map where its key function was to support proper planning of
land use in flood-prone zones. It produced readily available, easily read flood hazard maps and
charts, which assist the managers and planners in determining zones that are at risk and set up
their efforts of alleviation/reaction.
Hardmeyer and Spencer (2007) used GIS to develop flood hazard maps in Rhode Island
indicating zones where the flood is likely to occur and reoccur in an urban area on the island.
They report that the GIS map was extremely valuable to town planners and other administrators
in viewing the potential flood zones and the likely damages that could occur. This would allow
them to recognize priority zones, therefore, improving flood relief arrangement and
communication of the data to the general population and different stakeholders.
Fox et al., (2008) in North Carolina, USA used a 3D ArcGIS visualization method to evaluate
flood problem in this area. The visualization methodology was exceptionally valuable and
helped in the recognition of flood areas for successful decision-making. This study has
additionally demonstrated that GIS information can easily aid in risk aversion, through
mapping of land cover, dangerous zones, drainage patterns and through spatial modelling.
Furthermore, Konadu and Fosu (2009) in their study in the city of Accra, Ghana utilized a
vector based GIS and Digital elevation model (DEM) to outline watershed limits and foresee
regions of possible overflow during a flood event. In their GIS study, raster-based analysis was
conducted to create information on the direction of flow, stream segmentation and other
processes. These data were valuable in building a vector representation of the drainage lines in
the catchment area. The extent of the flood was simulated based on the inferred drainage lines,
ability to hold precipitation run-off and their depth. Zones that could face possible flooding
where indicated using the flood level contours obtained from the selected flood water levels.
A study carried out Samarasinghe et al, (2010) in Kalu-Ganga River, Sri Lanka is also an
illustration in which these earth observing methods have effectively been utilized in analysing
flood risk and mapping. In their study, two images obtained amid the dry season and during
flooding were analysed to determine flood range. Their outcomes show that flood range derived
from the information were similar to those collected when one of the flood inundation models
was utilized and based on this, they were able to ascertain their model. The study additionally
utilized GIS information and capacities for flood imitation and risk mapping. They were able

38 | P a g e
to do this in a GIS environment by overlaying vulnerability and flood hazard values with the
polygon map of the region, Samarasinghe et al, (2010) were able to map out high, medium and
low flood risk areas.
Also in India, Sanyal and Lu (2004) utilized Landsat Enhanced Thematic Mapper Plus (ETM+)
and SAR images to segregate zones of flooded and non-flooded areas. The study pinpoint some
major issues experienced in extracting information accurately from the affected flood areas on
SAR images. A common problem associated with the relation between roughness of the terrain
and surface water and the radar wavelength. In addition, dense forest cover acts as an obstacle
to accurately identifying flooded areas from this imagery. In some African settlements that are
rural in nature and often surrounded by trees, it will be very difficult to detect flooding within
this type of settlement as a result of this.
Notably, almost all of the studies described above were largely facilitated by the acquisition
and use of relatively high-resolution and high precision data recorded at a local or regional
scale. In some developing countries, like Nigeria, the availability of such high precision
information is limited or non-existent, as a result of inadequate spatial infrastructure which
hinder the progress of such studies.
2.3.2 Remote sensing applications for monitoring and mapping floods
Floods can be monitored and mapped with remote sensing (RS) data acquired via satellites and
aircraft, or even from ground-based platforms. An advantage of satellite RS is its capacity to
capture events on the Earth’s surface at or close to the time of their occurrence, including its
ability to monitor the progress of events through time (Michael, 2007). Moreover, satellite data
allows the monitoring of flooding over large regions.
Generally, to map flood areas, two RS data sets are required: one dataset containing
information collected before the flood event and the other acquired amid the flood occurrence
(Wang, Colby, and Mulcahy, 2002). The first image data acquired is normally used as a
reference, mapping all features in flood plain areas, while the second is typically acquired
during the flood event in order to delineate flood boundaries and map inundation areas.

39 | P a g e
The type of sensor and data processing methods that exist to extract information from imagery
about floods are many. Sensors on board satellites that record flood events may operate in
different regions of the Electromagnetic Spectrum (EMS) (visible, near infrared, thermal and
microwave regions). This is possible using either Radio Detection and Ranging (RADAR) or
optical RS systems. RADAR is an active remote sensing system that records the backscatter of
transmitted radio waves from Earth surface features. RADAR is an invaluable RS technology
that can record information during unfavourable climatic conditions amid flood events where
cloud cover prevents the use of standard optical systems. The long microwave/radio
wavelengths transmit and penetrate through atmospheric constituents including the condensed
water vapour that form clouds. However, both sensor types make satellite observation one of
the most dependable techniques to study the area.
2.3.3 Microwave remote sensing for monitoring and mapping floods
The surface of the Earth can be imaged using space borne Radio Detection and Ranging
(RADAR) sensors in all weather conditions, day or night. “Active microwave sensors, like
Synthetic Aperture Radar (SAR), provide their own illumination and record the amount of
incident energy returned from the imaged surface” (Townsend, 2002). SAR can penetrate open
forest cover, aquatic plants, and cloud cover to detect standing water (Horritt, Mason, and
Luckman, 2001; Brivio et al., 2002; Townsend, 2002; Lawrence et al, 2005). The ability to
penetrate clouds with RADAR systems is a key benefit for monitoring flood events since they
usually happen amid times of extended precipitation (Townsend and Walsh, 1998; Kiage et al,
2005; Stevens, 2013). However, the interpretation SAR imagery is less straightforward than
when using visible/near infrared imagery. Floods are typically revealed in RADAR imagery as
dark areas due to the low backscatter return from smooth surfaces, such as water. Water also
has a unique dielectric property. As a result, water in this type of condition returns low RADAR
signals and is shown with low backscatter on RADAR image data. On the other hand, partly
inundated vegetation appears brighter on RADAR images differentiating them from other
features (Michael, 2007). It is feasible to utilize these attributes of inundated vegetation and
water for mapping wetland floods (Jensen, 2000).
Consequently, numerous studies have been conducted effectively using RADAR data. For
example, Henry et al, (2006) utilised advanced multi-polarized SAR data for mapping flood

40 | P a g e
after the heavy rainfall over the central European alpine basin, which caused a devastating
flood on the Elbe River in 2002. In addition, Honda, Francis and Sah, (1997) also carried out
a study “Flood Monitoring in Central Plane of Thailand Using JERS-1 SAR Data” for the
central plane of Thailand. In another study, Townsend, (2002) in the forests of the Roanoke
River floodplain in North Carolina analysed some Radarsat scenes imaged from September 22,
1996 and February 28, 1998 in delineating flood inundation. These studies demonstrate that
images acquired from SAR have the capacity and ability to monitor and map flood events.
Notably, Townsend and Walsh (1998) used SAR imagery to map flood extents within the lower
Roanoke River floodplain in North Carolina and compared these results with a higher
resolution Digital Elevation Model (DEM)-based GIS flood cover model. The results show that
both the DEM/GIS flood cover model and the RS SAR images gave a comparable delineation
of the flood event. However, the main drawback of the use of this method is that it is very
dependent of the accuracy of the DEM. In the absence of highly accurate DEMs required for
mapping floods in relatively flat areas, multi-date SAR and/or optical RS serves as an
alternative, provided these instruments have an adequate temporal resolution to capture the
flood event.
In the study by Townsend and Walsh (1998) within the lower Roanoke River floodplain, North
Carolina. The DEM was utilised to generate GIS models representing potential flood cover and
wetness. They also used SAR imagery obtained from satellites to derive possible flood areas.
Their outcomes show that both the GIS model and RS SAR images obtained gave a comparable
result of the flood event. However, the main drawback of the use of this method is that it is
very dependent of the accuracy of the DEM. In the absence of highly accurate DEMs required
for mapping floods in relatively flat areas, multi-date SAR and or optical RS serves as an
alternative, provided these instruments have an adequate temporal resolution to capture the
flood event.
Stereo pairs of RADAR images can also be used to create very accurate Digital Terrain Models
(DTM) through stereo interferometry. The DTM and/or DEMs are the core spatial data set used
to develop hydrological models for flood hazard assessment where they are used to define
water catchment area, watercourse delineation, accumulation points, stream flows and thus can
predict the spatial distribution and frequency of flood events. Similarly, light detection and
ranging (LiDAR) imagery is now being used to produce a high-density last return point surface
from which a highly accurate DTM is produced. The mapping of geomorphological features

41 | P a g e
using LiDAR imagery and subsequent modelling of water flow through a landscape have been
demonstrated by Jones et al, (2007) and by Marks and Bates, (2000). In addition, LiDAR
imaging can also be used to detect flood depth (Schumann et al, 2008). However, one of the
primary limitations of LiDAR data is its limited availability and high cost.
RS data, particularly SAR data, represents a good alternative for mapping the total flood extent
of these floodplains, because of its ability to provide timely and continuous information, since
they can be acquired during both day and night and are less affected by atmospheric conditions
than optical data. However, the presence of emergent vegetation, waves, and rapidly moving
water can lead to roughness on the surface of open water bodies and thus a higher backscatter
return, making them hard to differentiate from other land surface types that are not flooded
(Smith, 1997). A good example is a study by Sanyal and Lu (2004) who used SAR images to
segregate zones of flooded and non-flooded areas in India, along with Landsat Enhanced
Thematic Mapper Plus (ETM+) imagery. The study highlighted common issues encountered
in accurately extracting information from flood-affected areas from the SAR imagery. Further
limitations to this are that the data are expensive (freely unavailable) and it has a long revisit
time, which is often unsuitable in delineating flood extent at the peak of the event or monitoring
flood progression. Moreover, SAR data are liable to speckle or “salt and pepper” noise, “a
multiplicative random type of noise that considerably minimizes the interpretability of the
images and limits classification methods where these images need to be filtered in a way to
increase the signal-to-noise ratio” (Brivio et al, 2002).
2.3.4 Optical remote sensing for monitoring and mapping floods
Optical remote sensing (RS) is generally utilised to monitor floods in both the urban and natural
environments (Townsend and Walsh, 1998; Birkett, 2000; Shaikh, Green and Cross, 2001).
These passive sensors record naturally reflected or emitted electromagnetic energy (EME) from
different Earth surface features. Land cover types, including water bodies, are differentiated
and identified by their spectral properties, as a result of their specific physiological and
chemical composition. Where trees, floating vegetation and clouds do not cover the surface of
the water, high-resolution visible, near infrared (NIR) and shortwave infrared (SWIR) sensors
gives a better delineation of flooded areas. NIR and SWIR images are particularly valuable
because these wavelengths are strongly absorbed by water, yet strongly reflected by land,

42 | P a g e
which provides good contrast between these broad land cover types (Shoji et al 1999; Birkett,
2000; Jensen, 2000). A number of optical sensors have been utilised for decades for
successfully mapping floods (Michael, 2007). RS sensors such as Moderate Resolution
Imaging Spectro-radiometer (MODIS), Satellites Pour L’Observation De La Terre (SPOT),
Landsat, and Advanced Very High Resolution Radiometer (AVHRR) have all been utilized for
mapping flood effectively (Sheng, Gong and Xiao, 2001; Toyra et al, 2002; Sandholt et al,
2003; Shamsedddin et al., 2006).
Numerous authors have delineated floods utilizing the visible and NIR bands with a high level
of accuracy. For example, Sheng, Gong and Xiao, (2001) utilised density slicing of the NIR
band of the AVHRR for flood delineation. Sandholt et al, (2003) also utilised the visible and
NIR bands to map floods in the River valley of Senegal using Landsat Thematic Mapper (TM)
data and the maximum likelihood (ML) classification method. Brakenbridge (2006) used
MODIS data band 1 (Red) and band 6 (SWIR) for major flood detection, measurement and
mapping in Europe and the United States. Townsend and Walsh (1998), Shoji et al, (1999),
Domenikiotis, Loukas and Dalezios, (2003) and Tan et al, (2004) used the Normalised
Difference Vegetation Index (NDVI) computed from the Red and NIR bands of
NOAA/AVHRR and Landsat TM to identify floods (Equation 1). Importantly, other water
indices will be discussed in the next sub-section.
Consequently, the achievable accuracies when utilizing optical data for mapping flood events
is a component of numerous factors including those specified previously. This type of data is
further impacted by numerous atmospheric effects, which may need to be corrected,
particularly when conducting multi-temporal studies. The unfavourable weather conditions that
often occur during flood events limit the use of optical sensors for flood mapping due to clouds
that obscure the scene (Jensen, 2000). This is the main reason why microwave sensors have
been explored for their ability to map surface water (Stevens, 2013).
2.3.5 Spectral indices techniques for delineation of flood extent and water
bodies.
There is a range of image analysis techniques specifically designed to map standing water,
including the single band density slicing (Frazier and Page, 2000), supervised and unsupervised

43 | P a g e
classification (Sheng, Shah and Smith, 2008; Huang, Chen and Wu, 2014), and spectral water
indices and band ratios (Li et al, 2013; Jiang et al, 2014; Yao et al, 2015). Of these water body-
mapping techniques, spectral water index methods are reliable, user friendly, efficient and cost
effective in terms of computation (Ryu, Won and Min, 2002). In the past few decades, different
water indices have been proposed. The two most commonly used water indices include the
Normalized Difference Water Index (NDWI) proposed by McFeeters (1996) and the Modified
Normalized Difference Water Index (MNDWI) proposed by Xu (2006). Earlier indices include
the Normalized Difference Water Vegetation Index (NDVI) proposed by Rouse et al, (1974).
Table 2.1 Two derived most commonly used water indices that can be used to detect the spatial
and temporal distribution of flood on MODIS data.
No. Indices Equation
1. Normalized difference water index (NDWI) 𝑁𝑁𝑁𝑁𝑁𝑁𝑁𝑁 = 𝛲𝛲(𝑔𝑔𝑔𝑔𝑔𝑔𝑔𝑔𝑔𝑔)−𝛲𝛲(𝑔𝑔𝑛𝑛𝑔𝑔)
𝛲𝛲(𝑔𝑔𝑔𝑔𝑔𝑔𝑔𝑔𝑔𝑔)+ 𝛲𝛲(𝑔𝑔𝑛𝑛𝑔𝑔)...(McFeeters, 1996)
2. Modified normalized difference water index (MNDWI)
𝑀𝑀𝑁𝑁𝑁𝑁𝑁𝑁𝑁𝑁 = 𝛲𝛲(𝑔𝑔𝑔𝑔𝑔𝑔𝑔𝑔𝑔𝑔)− 𝛲𝛲(𝑠𝑠𝑠𝑠𝑛𝑛𝑔𝑔)𝛲𝛲(𝑔𝑔𝑔𝑔𝑔𝑔𝑔𝑔𝑔𝑔)+ 𝛲𝛲(𝑠𝑠𝑠𝑠𝑛𝑛𝑔𝑔)
…(Xu, 2006)
Where;
Ρgreen = reflectance in Green wavelengths (545-565nm, MODIS band 4)
Ρnir = reflectance in NIR wavelengths (841-876nm, MODIS band 2)
Ρswir = reflectance in SWIR wavelengths (1628-1652nm, MODIS band 6)
2.3.5.1 The normalised difference vegetation index
The NDVI has been used to recognise and map surface waters (Rogers and Kearny, 2004). The
NDVI is a normalised ration between the Red versus the NIR wavelength (Equation 1)
producing and index range between -1 and +1 where values above a specified index threshold
value (typically around 0.2) denote vegetated areas. Values closer to one (1) represent actively
growing green vegetation, while values less than Zero (0) indicate non-vegetated areas
including water. The NDVI was first used by Rouse et al, (1974) to normalise the variations in
reflectance as a result of changes in the solar zenith angle while studying vegetation systems

44 | P a g e
across the Great plains in Central USA. While the NDVI has been used for mapping standing
water, its main use is to map variations in vegetation radiative response. Consequently,
improvements to this model saw the development of more dedicated water index models
including the Normalised Difference Water Index (NDWI) by McFeeters’ (1996) and
Modified Normalised Difference Water Index (MNDWI) by Xu (2006).
𝑁𝑁𝑁𝑁𝑁𝑁𝑁𝑁 = 𝛲𝛲(𝑔𝑔𝑛𝑛𝑔𝑔)−𝛲𝛲(𝑔𝑔𝑔𝑔𝑟𝑟)𝛲𝛲(𝑔𝑔𝑛𝑛𝑔𝑔)+ 𝛲𝛲(𝑔𝑔𝑔𝑔𝑟𝑟)
…………………………………………………………Equation 1
Where;
Ρred = reflectance in RED wavelengths (621-670nm, MODIS band 1)
Ρnir = reflectance in NIR wavelengths (841-876nm, MODIS band 2)
2.3.5.2 The normalised difference water index
The NDWI proposed by McFeeters (1996) is a widely used index in identifying water-related
surfaces. It uses the same normalised formula as the NDVI but substitutes the Red band with
the Green wavelength band to produce values between -1 and +1 (Equation 2). The NIR
wavelength used in the NDWI highly contrasts vegetation cover from moisture content in the
soil, which allows discrimination of water features from vegetated features. An alternative
NDWI proposed by Gao (1996) (NDWIGAO), substitutes the Green and the NIR bands with
NIR and SWIR respectively to produce a normalised ratio index designed to monitor changes
in the water content of leaves (Equation 3).
The higher values of McFeeters (1996) NDWI indicate an increased contrast between water
and non-water features by reducing the low reflectance values of water in the NIR band while
maximizing the higher reflectance value of water in the Green band (McFeeters, 1996).
Therefore, making vegetation and soil have negative values while the water features have a
positive value (McFeeters, 1996). Index results depict vegetation and soil with mostly negative
index values, while water features have mostly positive values (McFeeters, 1996). To isolate
and extract water areas alone, the key is to determine a threshold index value in which water
can be separated from other land features. Various studies have been done that uses the NDWI
and the spectroscopic characterisation of the NIR band to detect water content in different areas

45 | P a g e
(McFeeters, 2006; Tong et al, 2004; Rogers and Kearney, 2004). Notably, the NDWI does
suffer from false positive values in the presence of shadow and dark vegetation where water
signatures exhibit similar signatures. Moreover, the NDWI has difficulties in separating water
features from built-up urban features as many urban features usually have positive values
mixed with water features. The MNDWI was proposed by Xu, (2006) to overcome these
limitations of the NDWI index.
𝑁𝑁𝑁𝑁𝑁𝑁𝑁𝑁McFeeters = 𝛲𝛲(𝑔𝑔𝑔𝑔𝑔𝑔𝑔𝑔𝑔𝑔)−𝛲𝛲(𝑔𝑔𝑛𝑛𝑔𝑔)𝛲𝛲(𝑔𝑔𝑔𝑔𝑔𝑔𝑔𝑔𝑔𝑔)+ 𝛲𝛲(𝑔𝑔𝑛𝑛𝑔𝑔)
..................................................................Equation 2
𝑁𝑁𝑁𝑁𝑁𝑁𝑁𝑁GAO =𝛲𝛲(𝑔𝑔𝑛𝑛𝑔𝑔)−𝛲𝛲(𝑠𝑠𝑠𝑠𝑛𝑛𝑔𝑔)𝛲𝛲(𝑔𝑔𝑛𝑛𝑔𝑔)+ 𝛲𝛲(𝑠𝑠𝑠𝑠𝑛𝑛𝑔𝑔)
................................................................................Equation 3
Where;
Ρgreen = reflectance in Green wavelengths (545-565nm, MODIS band 4)
Ρswir = reflectance in SWIR wavelengths (1628-1652nm, MODIS band 6)
Ρnir = reflectance in NIR wavelengths (841-876nm, MODIS band 2)
2.3.5.3 The modified normalised difference water index
The MNDWI modifies McFeeters’ NDWI where the Near infrared (NIR) band is substituted
for the Shortwave Infrared (SWIR) band to better delineate water features (Equation 4).
According to Xu (2006), the MNDWI is less susceptible to shadow noise and is more suitable
in delineating water bodies in the presence of built-up land areas where the introduction of the
SWIR band helps to effectively reduce built-up land noise over the NDWI. The selection of
wavelength bands for the MNDWI takes advantage of the high SWIR reflectance of soil to
contrast the low reflectance of SWIR by water features (including vegetation) and making use
of the Green wavelength to maximize the reflectance of water features (Xu, 2006).
It has been argued though that the use of the Green wavelength can bias water index results by
the higher green reflectance from vegetation than surrounding non-water features, such as soils
and bare ground (Takeuchi and Yasuoka 2004; Brakenbridge 2006). To compensate, a variant
of the MNDWI is proposed by Takeuchi and Yasuoka (2004) where the Green band is

46 | P a g e
substituted for the Red wavelength band and is used with the Moderate Resolution Imaging
Spectro-radiometer (MODIS) optical sensor (Equation 5). This MNDWI has been found to be
sensitive to surface water in the presence of mixed cells (pixels) of both dry land and wetland
areas and reduces the influence of the reflectance of green vegetation. Another alternative
example is given by Brakenbridge (2006), who used MODIS data band 1 (Red) and band 6
(SWIR) for major detection, measurement and mapping of floods in Europe and the United
States. However, in areas where the background soil colour is dominated by red soils, this
variant of the MNDWI is biased by the high reflectance in the Red wavelength band where the
original MNDWI by Xu (2006), which uses the Green band, becomes a more suitable substitute
(Mizuouchi et al, 2014) if the later does not perform well. Further attempts to normalise for
both the Green and Red reflectance bias has been conducted by Mizuouchi et al, (2014). Where
water features rely on detecting differences between visible and SWIR wavelength reflectance,
Mizuouchi et al, (2014) developed an MNDWI that uses the average of all three visible
wavelengths ‘colours’ instead of using only Green or Red (Equation 6). Their study showed
that this MNDWI was able to mitigate the effects of the red soils, while it “somewhat
mitigated” the effects of the green vegetation compared with the MNDWI of Xu (2006),
arguing that their water index is better in avoiding the bias of background colours. Notably
though, numerous studies have demonstrated that the MNDWI developed by Xu (2006) is
suitable in enhancing water information and can extract water bodies with greater accuracy
than NDWI (Ji, Zhang and Wylie, 2009; Li et al, 2013; Xu, 2006; Singh et al, 2015).
The primary challenge usually involved in the use of each of this spectral water index technique
is to identify a suitable index threshold value that can adequately differentiate non-water from
water features, particularly in the context of flooded waters. Despite the spectral contrast
between water and non-water areas, each of these water indices perform inconstantly with
varying levels of water turbidity and suspended sediment load, typically present during flood
events where water is highly contaminated with soils and debris. These contaminants
significantly reduce the spectral contrast between water and non-water areas making it difficult
to identify a single index threshold value that will separate the two. Once a threshold is
determined though, pixels pertaining to water can be separated from the non-water features and
a thematic map layer produced to show the extent of standing water.
𝑀𝑀𝑁𝑁𝑁𝑁𝑁𝑁𝑁𝑁 = 𝛲𝛲(𝑔𝑔𝑔𝑔𝑔𝑔𝑔𝑔𝑔𝑔)− 𝛲𝛲(𝑠𝑠𝑠𝑠𝑛𝑛𝑔𝑔)𝛲𝛲(𝑔𝑔𝑔𝑔𝑔𝑔𝑔𝑔𝑔𝑔)+ 𝛲𝛲(𝑠𝑠𝑠𝑠𝑛𝑛𝑔𝑔)
….……………………………………………. Equation 4

47 | P a g e
𝑀𝑀𝑁𝑁𝑁𝑁𝑁𝑁𝑁𝑁 = 𝛲𝛲(𝑔𝑔𝑔𝑔𝑟𝑟)− 𝛲𝛲(𝑠𝑠𝑠𝑠𝑛𝑛𝑔𝑔)𝛲𝛲(𝑔𝑔𝑔𝑔𝑟𝑟)+ 𝛲𝛲(𝑠𝑠𝑠𝑠𝑛𝑛𝑔𝑔)
….………………………………………………. Equation 5
𝑀𝑀𝑁𝑁𝑁𝑁𝑁𝑁𝑁𝑁 = 𝛲𝛲(𝑔𝑔𝑔𝑔𝑟𝑟+𝑔𝑔𝑔𝑔𝑔𝑔𝑔𝑔𝑔𝑔+𝑏𝑏𝑏𝑏𝑏𝑏𝑔𝑔)− 3𝑠𝑠𝑠𝑠𝑛𝑛𝑔𝑔𝛲𝛲(𝑔𝑔𝑔𝑔𝑟𝑟+𝑔𝑔𝑔𝑔𝑔𝑔𝑔𝑔𝑔𝑔+𝑏𝑏𝑏𝑏𝑏𝑏𝑔𝑔)+ 3𝑠𝑠𝑠𝑠𝑛𝑛𝑔𝑔
….………………………….………. Equation 6
Where;
Ρgreen = reflectance in Green wavelengths (545-565nm, MODIS band 4)
Ρswir = reflectance in SWIR wavelengths (1628-1652nm, MODIS band 6)
Ρred = reflectance in RED wavelengths (621-670nm, MODIS band 1)
Ρblue = reflectance in Blue wavelengths (459-479nm, MODIS band 3)
2.3.6 Satellite remote sensing MODIS data
The utilisation of spatial data within a GIS platform captured by Earth observing systems
(EOS) technology has become a reliable, integrated and well-developed approach to disaster
and risk management (Islam and Sado, 2000; Sanyal and Lu, 2006; Yang and Rystedt, 2002;
Bapalu and Sinha, 2003). The principal data used in this research is the Moderate Resolution
Imaging Spectro-radiometer (MODIS) imagery acquired on board NASA’s Terra and Aqua
satellites, which acquires 36 spectral bands that expands between the visible to the thermal
infrared wavelengths (Running et al, 2011). MODIS bands 1 through to 7 are designed
specifically for RS of Earth surface features at a spatial resolution of 250m and 500m for bands
1-2 and bands 3-7 respectively (Running et al, 2011).
The MODIS instrument operates on both the Aqua and Terra satellite spacecraft and can obtain
global coverage of the Earth every one to two days with a swath width of 2,330km (cross track)
by 10km (along track at nadir) (NASA, 2015). Aqua orbits the Earth south to north crossing
over the equator in the afternoon while the Terra satellite, on the other hand, is timed in such a
way that it passes over the equator north to south in the morning. The broad swath width
(2,330km) of the MODIS instrument enables data to be captured with a very high temporal
cycle, which is one of this instruments primary advantages (Marsalek et al, 2004). While it is
an optical sensor subject to atmosphertic attenuation (cloud), its very high repeat cycle enables

48 | P a g e
near realtime information capture (NASA, 2015), along with the ability to stich together many
images acquired over several days as a single composite image to minimise the effects of cloud
cover. The MODIS composite data product is thus well suited for mapping river/floodplain
flood events, as apposed to flash foods, where river/floodplain flooding is slow and extends
over vast areas where the landscape is relatively flat.
The high temporal imaging capability of MODIS makes it very useful in analysing natural
hazards such as floods and more broadly is a popular and dependable data source for disaster
management and assessment (Brakenbridge et al, 2003). Specifically, it has been widely used
for vulnerability analysis, flood assessment, mapping, mitigation, and warning (Brakenbridge
et al, 2003; Islam, Bala and Haque, 2009; Zheng et al, 2008; Chen et al, 2012). Brakenbridge
et al, 2003 showed that MODIS data can be utilised to recognise areas that are flooded from
non-flooded areas, even with its broad/coarse spatial resolution. This can be very crucial in
regions where no other methods of mapping and monitoring floods are available.
The primary limitation of MODIS imagery is its coarse spatial resolution. Unlike satellite
sensors such as Landsat, which has a spatial resolution of 30m, the 250m and 500m spatial
resolution of MODIS imagery makes it suitable only for mapping large-scale homogeneous
phenomenon. Hence, despite its coarse resolution, MODIS is well suited to mapping broad-
scale floodplain flooding. Notably, while Landsat imagery is also freely available and has a
much higher spatial resolution, its temporal acquisition cycle is only every 16 days. Even large-
scale flood events may defy detection when using Landsat imagery as these flood events can
come and go before the satellite’s return visit; even then, clouds may obscure the scene and a
further 16 days must past before reimaging. Importantly, the high temporal cycle of MODIS
enables a higher likelihood of flood capture and allows for the development of a composite
image to help mitigate contamination by clouds. All this makes MODIS imagery a suitable
data source for delineation and mapping of inundated areas in this type of environment where
no other means is available. Table 2.2 shows the sensor characteristics of MODIS for
reflectance bands (1-7).

49 | P a g e
Table 2.2 Wavelengths and names of reflectance bands (1-7) in MODIS.
Band Common name Wavelength (nm)
Reflectance mid-point (nm)
Spatial resolution (m)
Band 1 Red 620-670 ~650 250
Band 2 Near infrared (NIR) 841-876 ~860 250
Band 3 Blue 459-479 ~470 500
Band 4 Green 545-565 ~550 500
Band 5 Mid-Infrared (MIR) 1230-1250 ~1240 500
Band 6 Shortwave Infrared (SWIR) 1 1628-1652 ~1640 500
Band 7 Shortwave Infrared (SWIR) 2 2105-2155 ~2125 500
In concluding this chapter, previous studies show the importance of using RS and GIS in
assessing, monitoring and mapping flooding. In particular, MODIS data, because of its high
temporal imaging capability used to mitigate the influence of clouds makes it a very useful
alternative to Radio Detection and Ranging (RADAR) imagery for analysing natural hazards
such as floods. Moreover, optical sensors like MODIS enable the development and use of
dedicated spectral water indices to differentiate water from non-water features. Specifically,
the MNDWI proposed by Xu (2006) provides significant benefits over the NDWI by providing
higher contrast between water and other built-up features (Ji, Zhang and Wylie, 2009). Notably,
variants of MNDWI by Takeuchi and Yasuoka (2004) and Mizuouchi et al, (2014) also show
benefits over the standard NDWI. The next chapter describes the data and methods used in the
analyses of the data over Sokoto State, Nigeria with the aim of investigating their suitability
by way of detecting and mapping flood inundation to aid in mitigation effect.

50 | P a g e
Chapter 3
Research methods
This chapter focuses on the methods used in carrying out this research. Specifically, it will
present data sources used for mapping inundation and estimating the population at risk; how
the data was processed and the methods used in order to detect and map the frequency of
flooding and its impact on populous places.
3.1 Main Data and pre-processing
3.1.1 MODIS MOD09A1 and MYD09A1
The principal data used in this research is the Moderate Resolution Imaging Spectroradiometer
(MODIS) imagery acquired on board NASA’s Terra and Aqua satellites. The MODIS image
data used is designated MYD09A1 (Aqua) and MOD09A1 (Terra) with differences in their
orbital acquisition bringing about various viewing and cloud-cover conditions. During an eight-
day period, the level three 8-day composite surface reflectance products, delivered in the
sinusoidal projection (for both MYD09A1 and MOD09A1), contain the best observations as
chosen on the basis of the absence of clouds and aerosol loading at 500m, low view angle, and
high observation coverage (USGS, 2016). The frequent acquisition of MODIS imagery allows
effective monitoring of the regular changes in water bodies and their extent.
This study investigates four major flood events in the Sokoto state region, which occurred on
or close to October 8, 2003; October 16, 2010; September 21, 2012; and September 22, 2015.
The closest pre-flood cloud-free MODIS imagery and the first useful (during) flood images
were acquired from NASA which can be downloaded from NASA, (2016). These images were
first used to visually investigate the area before and during each flood event to determine their
suitability for further image analysis. Figures 3.1 through 3.4 show the MODIS imagery over
Sokoto state study area before and during each flood event under investigation. The light blue
areas depicted in each image is standing water/inundated areas, with the Goronyo dam evident
in the upper north east of each image. Following this initial visual investigation, each image
was used as input to several flood mapping models to delineate standing water and its extent,
as detailed in Section 3.2 and 3.3 below.

51 | P a g e
Table 3.1 Satellite data used.
No. Dates of Flood Before Flood Data Composition Resolution
1. 8 OCT 2003 18 JUNE 2003 MODIS TERRA 8-day 250-500m
2. 16 OCT 2010 2 JUNE 2010 MODIS AQUA 8-day 250-500m
3. 21 SEPT 2012 24 MAY 2012 MODIS AQUA 8-day 250-500m
4. 22 SEPT 2015 4 JULY 2015 MODIS TERRA 8-day 250-500m
Figure 3.1 (a) MODIS Non-flood image June 18, 2003 (b) MODIS Flood image Oct 8 2003

52 | P a g e
Figure 3.2 (a) MODIS Non-flood image June 2, 2010 (b) MODIS Flood image Oct 16 2010
Figure 3.3 (a) MODIS Non-flood Image May 24, 2012 (b) MODIS Flood Image Sept 21 2012

53 | P a g e
Figure 3.4 (a) MODIS Non-flood Image July 4, 2015 (b) MODIS Flood Image Sept 22 2015
Figure 3.1–3.4 Images showing the pre-flood and during/closest flood event over Sokoto State.
3.1.2 LandScan population data
Despite the review provided in the preceding chapter on flood risk, there is no scientific
consensus on the appropriate ways to measure population at risk (Andresen and Jenion, 2010).
However, while crude, clearly understanding the spatial distribution of the population within,
or proximal to, areas subject to flooding provides important information about personal risk to
life, livelihoods and infrastructure. However, the Nigerian population census data lacks
locational specificity and is aggregated and uniformly distributed to the considerably large
Local Government Area (LGA) level. Consequently, the 2014 ambient global population
dataset from LandScan obtained from Oaks Ridge National Laboratory (ORNL) was used as
an alternative data set to estimate the population at risk from flooding over the study area.
Unlike the traditional Nigerian census data that ties the location of people to just their homes
before aggregation to the LGA level, the LandScan data aims to account for people's mobility
and provide more locational specificity. This data aims to map the presence of people
everywhere, for instance, on roads, in schools, or on farms rather than in their homes only. It
was developed as a part of the ORNL global population project (Dobson et al, 2000). It is based

54 | P a g e
on the information from night-time light sources, census data, elevation distribution, and
AVHRR land-cover by allocating a certain number of people to each 1 by 1 km cell based on
the relative likelihood of population occurrence on the factors mentioned (Dobson et al, 2000).
“It is the finest resolution global population distribution data available and represents an
ambient populace” (ORNL, 2016). The advantages of LandScan, as compared with others like
the Gridded population of the world (GPW), “include its better output resolution of 30 arc-
seconds, as opposed to 2.5 arc-minutes, and the use of an extensive model to predict population
distribution within administrative units” (FAO, 2016). The data is also available free of charge
by continent.
In addition to this data, the Census data for 2006 in Nigeria was acquired in text form from
National population commission, Nigeria (NPC, 2006). This data along with the administrative
boundaries of Nigeria acquired from DIVA-GIS.org was used to input the population figures
for each LGA by creating a field in its attribute table in the ArcGIS (version 10.2) environment.
The LandScan GRID data was used to analyse the number of people at risk from flooding in
each of the LGAs and the state in total. Projected 2014 population estimates calculated from
the 2006 Nigerian census was compared with the LandScan GRID population data over the
same region for 2014 to help validate and build confidence in the risk estimates. Projected 2014
population estimates were determined using the population growth rate of 2.7% by the united
nations (UNdata, 2016) to derive the population figures.
Figure 3.5 Map Showing the LandScan GRID population counts and density data of the Study
area (Source: ORNL, 2014).

55 | P a g e
3.2 Delineating water features using the normalized difference water index
Importantly, during the time of each of the Sokoto floods, considerable vegetation cover
dominated the landscape. Consequently, heavy vegetation cover may bias the use of the Green
wavelength band and thus as proposed by Takeuchi and Yasuoka, (2004) and Brakenbridge,
(2006), substituting the Green with the Red may reduce the influence of the green vegetation
in mapping more clearly flooded waters. The Normalized Difference Water Index (NDWI) was
first used with the Green wavelength but it produced a considerably noisy image. As a result,
the Green visible band was substituted for the Red wavelength band in the NDWI calculation
(Equation 7).
Using the October 8, 2003 and October 16, 2010 MODIS flood images; the NDWI was
computed using the Red (Red- MODIS band 1) and the SWIR (SWIR- MODIS band 6)
wavelengths. Where the SWIR band is subtracted from the Red band before being normalised
(ratio) by the sum of the two bands as shown in (Equation 7). The calculation was built within
ERDAS IMAGINE’s Spatial Modeller (Version 15) where an overview of the method can be
seen in Figure 3.6.
𝑁𝑁𝑁𝑁𝑁𝑁𝑁𝑁 = 𝛲𝛲(𝑔𝑔𝑔𝑔𝑟𝑟)−𝛲𝛲(𝑠𝑠𝑠𝑠𝑛𝑛𝑔𝑔)𝛲𝛲(𝑔𝑔𝑔𝑔𝑟𝑟)+ 𝛲𝛲(𝑠𝑠𝑠𝑠𝑛𝑛𝑔𝑔)
......................................................................................Equation 7
Where;
Red= reflectance in RED wavelengths, 621-670nm (MODIS band 1)
SWIR= reflectance in SWIR wavelengths 1628-1652nm (MODIS band 6)
The results of the NDWI produce an index of values ranging between -1 and +1 where a pixel
value closer to 1 indicates that the area of a single pixel consists largely of water (see Figure
4.1, Chapter 4). To isolate those pixels that contain water and thus separate water from non-
water features, an optimal threshold value of the water index is required. In order to achieve
this, an initial threshold value of zero was used. When comparing the zero value threshold
applied to the NDWI results with the Red and SWIR bands of MODIS imagery, most obvious
flooded areas contained positive NDWI values, while soil and vegetated surfaces contained
negative or zero values. However, quite a few land features (non-water features) including
urban features contained some positive NDWI values such that they could not be differentiated

56 | P a g e
from water (see Figure 4.1, Chapter 4). This led to the use of the MNDWI in search of
improving water delineation.
Figure 3.6 Methodology for NDWI calculation.
3.3 Delineating water features using the modified normalized difference
water index
The MNDWI is used here to address the limitation of the NDWI where urban features also
contained positive values along with water features. The MNDWI index was proposed by Xu,
(2006) to correct this problem by suppressing land features while water features are enhanced.
The MNDWI serves as the main technique used to map water from non-water features in this
study where an overview of the method is shown in Figure 3.7. The MNDWI was applied to
the same four MODIS flood images of October 8, 2003, October 16, 2010, September 21, 2012
and September 22, 2015. The Green (Green- MODIS band 4) and the SWIR (SWIR- MODIS
band 6) wavelength bands were used where the SWIR band is subtracted from the green band
before being normalised (ratio) by the sum of the two bands as in Equation 4. Notably, the
Green wavelength band in the MNDWI was not substituted for the Red band in this case as the
standard MNDWI of Xu (2006), with the inclusion of the MIR wavelength, produced a
considerably less noisy image and confidently delineated water from non-water features. The
calculation was once again built within ERDAS IMAGINE’s Spatial Modeller (Version 15)
where an overview of the method can be seen in Figure 3.7.

57 | P a g e
𝑀𝑀𝑁𝑁𝑁𝑁𝑁𝑁𝑁𝑁 = 𝛲𝛲(𝑔𝑔𝑔𝑔𝑔𝑔𝑔𝑔𝑔𝑔)−𝛲𝛲(𝑠𝑠𝑠𝑠𝑛𝑛𝑔𝑔)𝛲𝛲(𝑔𝑔𝑔𝑔𝑔𝑔𝑔𝑔𝑔𝑔)+ 𝛲𝛲(𝑠𝑠𝑠𝑠𝑛𝑛𝑔𝑔)
……………………………………………….…Equation 4
Where;
Green= reflectance in Green wavelengths, 545-565nm (MODIS band 4)
SWIR= reflectance in SWIR wavelengths, 1628-1652nm (MODIS band 6)
Like the NDWI, the MNDWI also produces an index of values ranging between -1 and +1
where water features are denoted by higher positive values. An index threshold value of zero
was used once again to distinguish non-water from water features in the MNDWI images. The
MNDWI produced considerably better results in delineating water features than that of the
NDWI and are presented in Chapter 4, which confirms its suitability in this landscape.
Figure 3.7 Methodology for MNDWI calculation.
3.4 Mapping flood inundation extent and frequency
The MNDWI was confirmed to map water features more accurately and consistently than that
of the NDWI. Subsequently, the MNDWI was applied to all MODIS images to detect flood
inundation extent for the four major flood events. Importantly, considerable investigation was
conducted comparing pre-flood MODIS imagery with MNDWI results to determine an index
threshold value that appropriately delineated water from non-water areas. A value of ‘0’ was

58 | P a g e
concluded to be the most suitable for the Sokoto landscape. The MNDWI for each date was
then recoded into binary thematic layers with values ‘1’ and ‘0’ for flooded and non-flooded
areas respectively. Each thematic map shows the full extent of flood inundation for each period
and is presented in Chapter 4, Figures 4.4. ArcGIS Spatial Analyst Tools (version 10.2) was
then used to combine all flood inundation periods together to reveal a combined flood extent
map, presented in Chapter 4, Figure 4.5. The Spatial Analyst Tools were used again to overlay
and sum each of the flood inundation areas for each period together to produce a single spatial
frequency layer in Chapter 4, Figure 4.6 that shows the number of times an area, defined by
the spatial resolution of the MODIS imagery, was inundated by water for the four chosen times.
Finally, four flood inundation extents for each year were mapped and one combined inundation
map showing the largest inundation for the four periods.
3.5 Flood risk/vulnerability
In assessing the distribution of the population vulnerable to flood hazard, the flood inundation
maps were combined with LandScan demographic data using spatial overlay analysis in
ArcGIS (version 10.2). The LandScan population data, aggregated to l km raster (GRID) cells,
was first converted into vector format and reprojected to the same coordinate system as the
flood extent raster layers. Each of the flood extent layers, including the combined flood layer,
were also converted to vector polygon layers.
The combined flood extent layer was then overlayed to intersect with the LandScan population
grid of vector cells. This process computes the geographic intersection between two input
layers where the newly created layer carries the attributes of both the LandScan population
distribution data and the flood inundation area information. Subsequently, a summation of the
total population within flood affected areas was calculated and is presented in Table 4.3 of the
results section. Figure 4.7 is also presented in Chapter 4 showing graphically the population
distribution within the flood affected areas. A more detailed risk assessment focused on
calculating the population at risk within each LGA where flood mitigation efforts are typically
managed at this administrative level. To do so, the LGA administrative boundaries were used
to intersect with the combined LandScan and flood extent layer from which a ‘population at-
risk’ count could be calculated for each LGA. The results are presented in Table 4.4 in Chapter
4.

59 | P a g e
Chapter 4
Results and Discussion
This chapter will first present the results of the water indices used to map flood inundation
extent and frequency across the Sokoto State using the methods outlined in Chapter 3. This
will be followed by a discussion of these specific flood events before results are presented that
outline those populations at-risk from flooding in each Local Government Area (LGA). The
chapter concludes with a discussion on the risk assessment results, suitability of Moderate
Resolution Imaging Spectro-radiometer (MODIS) imagery and LandScan GRID population
data for mapping flood inundation, estimating the number of people vulnerable and mitigation
management approaches.
4.1 Mapping flood inundation extent using the normalised difference water
index
The Normalised Difference Water Index (NDWI) was first tested and applied to the MODIS
flood image acquired on October 8, 2003 and October 16, 2010, where subsequent comparisons
between the original MODIS image and NDWI allowed judgement of an index threshold
estimate that suitably separated water from non-water areas. However, it was found that some
clearly delineated standing water areas shared the same/similar positive index values as urban
areas, and thus water features could not be confidently separated, as shown in Figure 4.1 where
the white areas show locations that are flooded by water and the black/grey areas show land
area that have mixture of floodwaters and land not flooded.
As identified by Xu (2006), the NDWI has been found to be susceptible to misclassification of
water features with shadowing and built-up areas, and this was certainly found to be the case
here when using the NDWI when applied to the first two MODIS flood images, as illustrated
in figure 4.1 where there is a mismatch between the inundated areas (white areas) and the land
areas not inundated in the MODIS image scene. Therefore, the MNDWI proposed by Xu
(1996) was investigated as a potential alternative to improve floodwater mapping results.

60 | P a g e
a) October 16, 2010
b) October 8, 2003
Figure 4.1 Map showing the NDWI results
4.2 Mapping flood inundation extent using the modified normalised
difference water index
Following the MNDWI procedure outlined in Chapter 3, after a suitable index threshold was
determined through the evaluation of the original MODIS flood image, floodwaters were more

61 | P a g e
confidently separated from non-water features using this method, as shown in Figure 4.2.
Figure 4.2 shows how the MNDWI enhances the open water features and inundated area while
efficiently suppressing and even removing built‐up land noise as well as vegetation and soil
noise in the Sokoto area. The results shown in Figure 4.3 confirms the suitability of the
MNDWI over this landscape where it was subsequently applied to each of the MODIS image
flood dates as shown in Figure 4.3.
Notably, the inclusion of the MIR wavelength band in the MNDWI calculation seems to
mitigate any bias from the green wavelength where considerable green vegetation is present in
the scene by increasing the contrast between the two wavelengths compared with the NIR
wavelength alone. This has helped delineate more clearly standing water from non-water
features despite variation in green reflectance across the landscape.
Figure 4.2 Map showing MNDWI result (October 16, 2010)

62 | P a g e
a) October 16, 2010
b) October 8, 2003

63 | P a g e
c) September 21, 2012
d) September 22, 2015
Figure 4.3 Map showing the MNDWI results for the four periods

64 | P a g e
ArcGIS was then used to recode each output MNDWI raster grids to constraining layers of
flooded (‘1’) and non-flooded (‘0’) areas and coloured before summing each layer together to
create a final combined flood extent map presented in Figure 4.5. This map shows all areas
vulnerable to flooding throughout the study period. Table 4.1 lists the flood extent areas from
largest to smallest, while Figure 4.4 shows the spatial extent of each flood event separately.
The maps clearly show that the 2015 flood event was the most extensive with an inundated
area of 1464.82km2. This was a result of the high rainfall during this period, which led to the
collapse and subsequent overflow of the Goronyo dam wall in the State.
According to the Nigerian meteorological centre, rainfall for the State between the month of
July and September 2015 was between 388mm to 2962mm, which was much higher than the
monthly average of 161mm, in the area (Climate-data, 2016). The impact assessment
undertaken by the NEMA (2015) of the 2015 flood showed that this event led to the
displacement of over 100,000 people and destruction of farmlands, agricultural produce with
no fewer than 7,577 farmers and 2,500 hectares of agricultural land destroyed, which was
widely reported in newspapers (Channels, 2015; Vanguard, 2015). However, despite the
damage and destruction this flood had caused, people still moved back to these flood prone
areas because of its usefulness of the area in terms of their main agricultural practice, means of
livelihood and economy (Our world, 2014; Premium times, 2016; The Guardian, 2016).
Table 4.1. MODIS data dates used and the area (km2) inundated.
No. MODIS data flood dates Inundated area (km2)
1. September 22, 2015 1464.82
2. September 21, 2012 819.09
3. October 8, 2003 561.95
4. October 8, 2003 317.25

65 | P a g e
a) September 22, 2015 flood b) October 08, 2003 flood
c) October 16, 2010 flood (d) September 21, 2012 flood
Figure 4.4 Map showing the inundated areas for each period.

66 | P a g e
Fig 4.5. Map showing the combined final flood inundation extent (largest inundated area)
4.3 Flood frequency map
The map shown in Figure 4.6 was derived using the Spatial Analyst toolset in the ArcGIS
environment (10.2) by overlaying and summing each of the inundation periods together. This
effectively labelled each image pixel with a frequency value of the number of times it was
inundated by water for the four flood periods. This was subsequently overlayed with the Local
Government Areas (LGAs). Consequently, areas (groups of pixels) labelled 1 through 4
indicate the frequency of inundation for the selected time period.
Importantly, areas with the highest frequency of inundation with a value of ‘4’ should be
marked as the most vulnerable areas, while areas that were inundated only once should be
marked as least vulnerable. The total combined flooded area for all four flood periods is
1,509.9km2, with the total area for each inundation period presented in Table 4.2. Areas that
were inundated four times out of the 4 flood events are dispalyed in red and totaled 441.6km2.
Note these area includes all river channels and permanent water bodies. Areas inundated three
out of the 4 flood events are displayed in yellow and totaled 248.56km2. Areas inundated twice
out of the 4 flood events are dispalyed as dark blue and totaled 145.35km2, while areas
inundated only once out of the 4 flood events are displayed in light blue and extended over
674.42km2 (44.7% of the combined flooded area).

67 | P a g e
Figure 4.6 Map showing the frequency of inundation with the inundation times.
Table 4.2. Frequency of inundation and the total area of inundation (km2).
No. Inundation times Inundated area (km2) Total %
1. 1 674.42 44.7 2. 2 145.32 9.6 3. 3 248.56 16.5 4. 4 441.60 29.2 Total 1509.9 100
4.4 Risk/vulnerability
The creation of a risk/vulnerability map in this study is demographically driven and based on
population data. The population vulnerable was estimated using the LandScan GRID
population data from Oaks Ridge National Laboratory (ORNL). Combining the inundation
map with the population data, the spatial distribution of people vulnerable to the total flood
was derived. The total population vulnerable to flood been 1,053,172 out of the total population
of 4,338,418.
At the LGA level, the results show that people that are close to the floodplain and river area
like the Goronyo, Illela, Kware, Gwadabawa, Rabah, Binji, Yabo are much more vulnerable to
flood. For instance, in Yabo, Gwadabawa, and Kware LGAs, there are 129,737, 134,086 and
106,889 people estimated that could be affected respectively which includes 39.1, 106.1,

68 | P a g e
105.78km2 of land vulnerable to flooding respectively. Because these LGAs are located close
to the floodplains and river area and with high population, they are likely to be more vulnerable
to flood hazard. This is in line with the report by Channels which states that Gwadabawa,
Wurno, and Goronyo LGA in the state was heavily affected by the 2015 flood after a heavy
rainfall that lasted more than a week (Channels, 2015). In addition, according to the various
news report, it was also reported that the LGAs of Gwadabawa, Wurno, Goronyo Rabah,
Kware, Binji, Kebbe, Wammako in the Sokoto area are always the most affected by flood
disaster, which is in line with this study’s result (Premium times, 2016; The Guardian, 2016;
Today, 2016; Channels, 2015; Vanguard, 2015). These areas are close to the river and
floodplain region and as a result of the agrarian nature of the people, most people use the river
and surrounding floodplain area for growing agricultural products and rearing animals.
To be able to develop a realistic risk minimization and preparedness methodology, there is a
need for emergency response managers to estimate the number of visitors, farmers, employees
and resident who could potentially be exposed to possible hazards. This is the reason for the
use of the ambient population data (LandScan), which endeavours to measure the actual
distribution of people present (rather than living) in a geographical location. Moreover, the
LandScan population data is aggregated to 1km grid cells as opposed to the much coarser
aggregation of the Nigerian census data to the much larger LGA level. The use of population
data aggregated to the LGA level alone would make it very difficult to identify varying
concentrations of people within these LGAs necessary to determine more accurately those who
are at risk from flooding. In support of the independent 2014 LandScan population data and in
recognition of the ‘official’ 2006 Sokoto Sate population count obtained from the last Nigerian
census, the latter was projected to a 2014 population estimate for comparison and support of
the LandScan population data. Using the varying annual population growth rate estimate for
Nigeria (as a surrogate for Sokoto State) between the years 2006 and 2014 from the United
States Census Bureau’s International Statistics (data), the projected 2014 population estimate
is 4, 582,255. Comparison with the LandScan population count shows a relative difference of
only 243,807, a percentage difference of 5.5 people between the two demographic data sets,
which further supports the use of the LandScan data but with the significant benefit of
locational specificity.
The result in this study, therefore, indicate that the method and data used is effective and can
be applied to identify the areas that are vulnerable to flooding where flooding is on a large

69 | P a g e
scale. This is particularly true for the Sokoto State where large rainfall events that cause severe
flooding extends over very large areas (many hundreds of kilometres) where the land is very
flat. In this case, uncontrolled water is often not channelled or confined to the floodplain areas
and will overflow and disperse over very large areas. The reason for the high number of
vulnerable people in Sokoto State is that the majority of people live along and close to the
floodplains and rivers where these areas serve as a major source of income to the local
community. Agriculture is the main source of livelihood for the people in this area, most people
engage in large scale farming, flood recession agriculture and animal rearing which contributes
to the economy of the state.
As indicated in Chapter 2, developing countries like Nigeria have poor spatial data
infrastructure and resources to acquire and manage high precision information acquired over
vast areas. These countries often rely on global data sets to supplement local spatial information
that is scarce or incomplete. Using these data sets of the Sokoto State region, the extent of
severe flooding and the population at-risk can be estimated to help support and prioritise flood
mitigation efforts.
Figure 4.7 Map showing the population distribution within the affected flood areas
Table 4.3 Total population within flood affected areas
No. State Population vulnerable
1. Sokoto 1,053,172

70 | P a g e
Table 4.4 The LGAs land area (km2), the total area inundated (km2) and the population
vulnerable.
No. LGA Land-area (km2)
Area-inundated (Km2)
LandScan 2014 population
Population vulnerable
1. Binji 526.00 69.542 131,958 60,313 2. Bodinga 553.179 4.508 201,986 12,457 3. Dannge-Shuni 1194.494 5.716 221,127 1,284 4. Gada 1190.464 0.147 276,735 - 5. Goronyo 1647.867 126.129 209,802 71,356 6. Gudu 3990.259 118.616 123, 084 70,352 7. Gwadabawa 1006.775 106.101 259,253 129,737 8. Illela 1295.346 168.383 177,817 85,650 9. Isa 2080.139 52.234 177,952 58,715 10. Kebbe 2747.769 60.135 150,838 27,486 11. Kware 700.556 105.783 161,768 134,086 12. Rabah 2648.705 196.957 176,836 109,787 13. Sabon-Birni 2238.677 188.359 235,154 82,679 14. Shagari 1292.438 32.782 183,591 20,785 15. Silame 608.762 2.706 132,286 984 16. Sokoto North 39.457 - 260,697 - 17. Sokoto South 30.250 - 225,371 - 18. Tambuwal 2199.529 98.512 253,602 16,732 19. Tangaza 2452.411 15.086 142,455 15,636 20. Tureta 1289.281 2.565 96,099 261 21. Wamakko 569.730 50.969 206,931 10,191 22. Wurno 640.348 65.574 190,088 50,995 23. Yabo 826.108 39.098 142,988 106,889 Total 31,768.584 1509.902 4,338, 418 1,053,172

71 | P a g e
Table 4.5 The LGAs, 2006-population census, projected 2014 population from the 2006 census
and the 2014 LandScan population figures.
No. LGA 2006 population 2014 projected population
LandScan 2014 population
1. Binji 104,274 142,560 131,958 2. Bodinga 174,302 212,588 201,986 3. Dannge-Shuni 193,443 231,729 221,127 4. Gada 249,051 287,337 276,735 5. Goronyo 182,118 220,404 209,802 6. Gudu 95,400 133,686 123, 084 7. Gwadabawa 231,569 269,855 259,253 8. Illela 150,133 188,419 177,817 9. Isa 150,268 188,554 177,952 10. Kebbe 123,154 161,440 150,838 11. Kware 134,084 172,370 161,768 12. Rabah 149,152 187,438 176,836 13. Sabon-Birni 207,470 245,756 235,154 14. Shagari 155,907 194,193 183,591 15. Silame 104,601 142,887 132,286 16. Sokoto North 233,012 271,298 260,697 17. Sokoto South 197,686 235,972 225,371 18. Tambuwal 225,917 264,203 253,602 19. Tangaza 114,770 153,056 142,455 20. Tureta 68,414 106,700 96,099 21. Wamakko 179,246 217,532 206,931 22. Wurno 162,403 200,689 190,088 23. Yabo 115,302 153,589 142,988 Total 3,702,676 4, 582,255 4,338, 418

72 | P a g e
Table 4.6 The land area (km2), the total area inundated (km2) and the percentage of area
inundated per LGA.
No. LGA Land Area (km2) Area Inundated (km2) Area Inundated (%)
1. Binji 526.00 69.542 4.6 2. Bodinga 553.179 4.508 0.3 3. Dannge-Shuni 1194.494 5.716 0.4 4. Gada 1190.464 0.147 0.0 5. Goronyo 1647.867 126.129 8.4 6. Gudu 3990.259 118.616 7.9 7. Gwadabawa 1006.775 106.101 7.0 8. Illela 1295.346 168.383 11.2 9. Isa 2080.139 52.234 3.5 10. Kebbe 2747.769 60.135 4 11. Kware 700.556 105.783 7 12. Rabah 2648.705 196.957 13 13. Sabon-Birni 2238.677 188.359 12.4 14. Shagari 1292.438 32.782 2.2 15. Silame 608.762 2.706 0.2 16. Sokoto North 39.457 - 0.0 17. Sokoto South 30.250 - 0.0 18. Tambuwal 2199.529 98.512 6.5 19. Tangaza 2452.411 15.086 1 20. Tureta 1289.281 2.565 0.2 21. Wamakko 569.730 50.969 3.4 22. Wurno 640.348 65.574 4.3 23. Yabo 826.108 39.098 2.5 Total 31,768.584 1509.902 100
4.5 Mitigation management
The motivation for this study and the results presented above can be used to help support flood
mitigation efforts. Flood mitigation can be defined as those measures that are taken before the
flood disaster occurs to minimize or eliminate the impacts and risk of flooding through
proactive measures. In order to support these measures, base-line information about where

73 | P a g e
flood hazard and risk occurs must be established. Mitigation of flood hazards or risk can be
attempted in two ways, including a structural approach or non-structural approach and/or the
combination of both approaches to decrease the vulnerability to flooding (NTG, 2016). The
structural approach also known as the engineering approach seeks to prevent the advance of
floodwaters, usually through an engineered measure such as building of a levee, retention
ponds, dam or floodwall. These structures can be built alongside the channel or a river or even
the floodplain to provide an outlet for the water during flood events or trapping the water for
some period of time before releasing it at a controlled rate to prevent flooding downstream
(CDEMA, 2010).
Non-structural mitigation measures are efforts that can be done to manage the use of the flood
prone and flood plain areas to reduce the likely damage caused by flooding that can normally
be expected to occur. This can be done after a better understanding of the behaviour of the
river, the areas liable to flooding and probability of flooding. These can be regulatory
approaches that people or government agencies can undertake to minimise the vulnerability to
flooding. Some examples of non-structural measures that can be taken in this case are zonation
of the floodplain by passing laws that restrict habitation and construction in the floodplain
areas. These areas can be zoned for strictly agriculture and recreational uses whereby lives and
properties are not at risk when these flood events occur. In addition, structures that are high
enough off the ground and that withstand the velocity of the flood should only be allowed
within the floodplain and flood prone areas to reduce the risk of flood destroying and washing
away buildings and critical infrastructure.
Integration of engineering and regulatory measures can be effective. For example, governments
can purchase and remove buildings that are close to the river and flood plain areas including
building of dams and levees away from the river allowing natural movement and storage of
floodwaters. This area can then be protected and used to restrict access to the river and
floodplain areas. This combination of non-structural and structural approaches will help reduce
losses as a result of flooding, help preserve and maintain the natural floodplain and riparian
ecosystem of the area.
An overall flood control management plan to manage recurrent disasters associated with
flooding in this region will require continued monitoring of persistent flood event to gain a
better understanding of areas and people who are vulnerable. Remote sensing and GIS

74 | P a g e
technologies are well placed to provide such information in support of both mitigation and
emergency measures to minimise and overcome the damage caused by a flood disaster.

75 | P a g e
Chapter 5
Conclusion
5.1 Research findings
The primary aim of this study is to develop a better understanding of the temporal flood extents
and the people at risk from flooding in Sokoto State in Nigeria, with the intention of obtaining
base-line information that will help prioritise flood mitigation efforts for disaster risk reduction.
In doing so, inundation maps for the four major flood events of October 8, 2003, October 16,
2010, September 21, 2012, and September 22, 2015 were derived using remote sensing (RS)
techniques. Subsequently, LandScan GRID population data was used to identify people most
vulnerable to these flood events. Importantly, this study introduces a simple but efficient and
cost effective method for the analysis of flood inundation mapping extent and frequency using
imagery acquired from the Moderate Resolution Imaging Spectroradiometer (MODIS). The
use of MODIS data and the Modified Normalised Difference Water Index (MNDWI) technique
for discriminating between water and non-water features can be used to identify and map the
areal extent of inundation in developing countries like Nigeria where no other means to acquire,
monitor and map floods is available on a large scale. This study has demonstrated that the
unique capability of satellite imagery like that provided by the MODIS coupled with the
MNDWI technique can be used in detecting inundation areas and their extent to create
inundation maps particularly useful in a developing country like Nigeria. Moreover, as this
area in Nigeria is one of the major floodplains in the country, it is suggested that this technique
of mapping flood inundation has the potential to be applied to other areas in Nigeria, other
countries in Africa and/or developing countries around the world; where no better means of
acquiring data and mapping natural hazards is available.
It is no doubt that Nigeria, like many other countries in the world, is affected by flooding and
different factors are responsible for this. The result of this study show that over a million people
are vulnerable to flood occurrences in this area and that the majority of these people live along
the floodplain and river areas. This is in line with NEMA (2012, 2015), which states that the
majority of the populace live close to the floodplain and river systems because of the benefit
they derive from these areas and that people are not discouraged by the negative impact that
might result during flood events. It was confirmed that risk/vulnerability mapping is very
important for the development of planning in the State.

76 | P a g e
This result also shows that the LandScan GRID data used with the MODIS inundation mapping
produced a reasonable estimate of the population vulnerable to flooding in Sokoto, Nigeria.
Importantly, the projected 2014 population data derived from the last official Nigerian census
in 2006 was used to test the validity of the 2014 LandScan population data with only a 5.5%
error margin. While the next Nigerian census is scheduled for later this year (2016), population
data will once again be aggregated to the LGA level as its smallest administrative unit. This
unfortunately prevents locational specificity of the presence and density of people living in
specific areas, which is necessary for disaster management efforts. Consequently, alternative
demographic information like that of LandScan will continue to play an important role in
providing more precise information on the spatial distribution of people and place.
This study has investigated, through its literature review and implementation of its methods, a
number of geospatial techniques for delineating flooded areas. Specifically, the MNDWI
derived using MODIS imagery has shown to be a useful combination in delineating inundated
areas in this landscape after severe broad-scale flooding. At this scale, LandScan population
data has also been shown to provide valuable information by quantifying the number of people
at-risk in these areas through simple GIS analysis techniques. The combination of GIS and
remote-sensing has been proven to be of great importance for mapping and management of
flood risk due to different resolutions, such as the spatial, temporal, and structure of data. In
doing so, this study has successfully answered the research questions posed in this thesis; the
results of which can be used as valuable base-line information for flood mitigation programs
and management.
5.2 Outcomes
Sokoto state, Nigeria is used here as a focus study area due to its vulnerability to severe flood
events as a result of high rainfall, flat land, its lack of flood control and infrastructure and
history of large-scale flooding. This study concentrated on developing a flood detection method
for flood inundation hazard and risk mapping by utilizing simple but effective remote sensing
and GIS methods and freely available global data sets, in the absence of more detailed ‘on-
ground’ higher resolution information, with considerable success.

77 | P a g e
Overall, while this study does not provide absolute locational specificity of people at risk, it
does provide valuable broad-scale information about where the larger population is at risk from
flooding. This can help to focus resources based on national or state level assessment. In this
context, the flood inundation hazard and risk maps provide valuable state-wide baseline
information. While the limitations of this study will be discussed in the next section, the
outcomes of such hazard and risk mapping and the methods used may:
- Serve as input for the integration of flood risk management strategies and spatial planning in
the area.
-Provide the concerned authorities with a method that can be used as a legal tool to control and
apply management and land zoning, protect the environment, decrease flood hazards, provide
insurance and plan development.
- Increase the awareness in the use of RS and GIS technology and geo-processing methods that
provide that facilitate mapping the extent of flooding and estimating the spatial distribution of
population vulnerable to this flood hazard in the state and country.
- The flood inundation maps can further be utilized for quick identification of locations of
potential flood hazard to reduce the losses involved.
- Be useful and beneficial in evaluating and assessing wide range of disaster through the use of
different spatial functionalities, like the vector and raster analysis, topographic operations and
intersect operations which can assist in anticipating management and relief of natural disasters
including flooding.
5.3 Limitations
While this study has demonstrated a successful approach to estimating populations at risk from
flooding using the MNDWI technique on MODIS imagery and LandScan population data,
detailed below are some of the challenges encountered.

78 | P a g e
5.3.1 Selection of satellite data
The choice of imagery is a critical but generally underestimated requirement in flood mapping.
Various sensors on-board Earth observation satellites (EOS) provide resolution characteristics
suitable for mapping inundated areas as a result of flooding. However, each system has its
advantages and disadvantages in terms of its spatial, spectral, and temporal characteristics.
While the goal is to provide the highest possible accuracy on flood hazard extent, and thus
locational specificity of people at risk, this may not be possible. For example, initial
investigation was made into the use of freely available Landsat imagery that would provide
30m spatial resolution. However, due to the reduced temporal cycle (16 days) and considerable
cloud that was present during all four major flood events, these events remained undetected or
were obscured by clouds making Landsat imagery unsuitable. Nevertheless, high-resolution
sensors should not be dismissed altogether. For example, SPOT-6/7 imagery provides a
multispectral spatial resolution of 6m but with a substantially improved revisit time due to its
off-nadir viewing capabilities and the use of two orbiting satellites. While a 45 degree viewing
angle is possible, the more geometrically stable <20 degree viewing angle reduces revisit times
to every 4 days with both SPOT-6 and 7 image acquisitions and a further reduction to 2-day
revisit time with <30 degree viewing angle with both SPOT-6 and 7 acquisitions. Notably, the
SPOT imagery is not freely available but could be purchased as part of an organisation’s spatial
information capture program that would serve to derive a range of data products, including
environmental mapping and monitoring, land cover mapping, land cover land use change
(LCLUC) and baseline and/or near real-time information for disaster management.
5.3.2 Water mapping models and integration with population data
Alternative water mapping models have been widely discussed in this thesis. It should be noted
though that one technique found to be suitable in its ability to map water in one environment
may not be suitable in another. Experimentation will need to be conducted commencing with
an understanding of the characteristics of the study area and its landscape composition in order
to target a suitable water mapping algorithm. While this study proposes that the water mapping
approach used here can be applied to other areas in Africa, the specific water model will need
to be carefully investigated. This also extends to a suitable threshold value used to separate
water from non-water areas. Specifically, water indices perform inconsistently with varying

79 | P a g e
levels of water turbidity and suspended sediment load, typically present during flood events
where water is highly contaminated with soils and debris. These contaminants significantly
reduce the spectral contrast between water and non-water areas making it difficult to identify
a single index value threshold that separate the two.
It should also be noted that the intersection between the delineated water boundaries derived
from the MODIS imagery and the LandScan GRID population data might introduce errors by
overestimating the population at risk. The disadvantage of the intersect/overlay method with
the gridded population data is that the total population in a grid is classified as being vulnerable
whether or not the total grid area is actually inundated. This is primarily due to the coarse
resolution 1km2 LandScan grid size where the overlay method only needs any portion of the
population grid cell to intersect with the water boundary and the total population for that grid
cell is counted as at-risk. This approach, and the use of coarse resolution data, may lead to an
over-estimation of the population at risk/vulnerable in the study area.
5.3.3 Population data
The ambient population is the total number of people likely to be present in a location as
opposed to just people residing there, with the counts for each cell (1km2) being based on
probability coefficients (Dobson et al, 2000). The coefficients based on land cover, road
proximity, night-time light and slope are verified to be accurate to within ten percent of the
given values. However, with a 1km2 cell size, this dataset is believed to be too coarse for local
planning. Also, with this data, positional or attribute errors and inconsistencies are to be
expected in large dissimilar spatial data (ORNL, 2016).
A further limitation of the data is that for each country, the model used to arrive at the
population count does not take into consideration the spatial continuity of the road networks
between them, bringing about uneven changes in the density of counts at country boundaries,
which might affect the estimation of the population vulnerable to flooding. Likewise, the
underlying models for deriving this data have not been published, so the assumptions utilized
by LandScan to distribute populace numbers to pixels are not known, which affects our
understanding of how the population distribution is derived. Despite this, projected 2014
population counts derived from the official 2006 Nigerian census closely aligned with

80 | P a g e
population estimates derived from the LandScan population dataset, which instilled confidence
in the use of the LandScan data product.
5.3.4 The modifiable areal unit problem
The modifiable areal unit problem (MAUP) is one of the most obstinate issues in spatial
analysis where spatial data collected from point locations is aggregated to arbitrary boundaries
(Wong and Amrhein, 1996). Spatial data classified or tabulated at different spatial scales or
distinctive zonal systems for the same locale will not give consistent analysis results. For
example, the population count given to a specific 1km grid cell will be influenced by the
position of the grid location over the study area, where the assumption of uniformity
(aggregation) applies in each grid cell. While the grid cell positions are fixed they are arbitrarily
placed and a shift in the grid cell positions (a different origin perhaps) will alter the population
count in each grid cell, which in turn will affect the total summation of population counts when
intersected with the flood extent layer. This is also true if the grid cell size was aggregated to a
smaller or larger grid cell size. Consequently, while these global data sets provide valuable
information and every effort is made to minimise error in the risk calculation, their arbitrary
aggregation to 1km grid cells will introduce error into the final calculation of people at risk.
While absolute counts of people at risk from flooding are sought from this analysis, the relative
number of people at risk across the study area is likely to be more robust than absolute counts.
5.3.5 Cloud problems associated with the data
The MODIS data utilised in this study is of a coarser spatial resolution (250-1000m) and the
suitability of this data was much dependent on the requirements by the user. Despite the fact
that the MODIS sensors images at a sub-daily interval, cloud was still a major issue, especially
during the peak periods of the flood. Most of the images free of cloud of the flood events were
only available several days after the peak of the flood, which led to the development of flood
hazard maps based on image data acquired when the flood level was reduced. However, despite
all the limitations, when data free of cloud cover is available, MODIS can show a large flood’s
movement through time and it is valuable for providing flood extent maps during or after a
flood incident. In terms of this, the SAR data with a better resolution and cloud penetrating

81 | P a g e
capabilities is also recommended for further flood hazard studies in the Country, which may
provide a better mapping result, but subject to the limitations discussed in Chapter 2.
5.4 Recommendations for future research
The main aim of this research is to identify flooded areas, create a flood inundation hazard map
of the Sokoto region and give an estimation of the number of people vulnerable to flooding,
which has not been without its challenges. Based on the findings of this study, the following
recommendations are made in support of minimising the impacts of flood disaster in the state.
- The integration of other floodwater detection techniques with the use of an accurate
DEM that will help in identifying flood areas more accurately than the single use of the
MNDWI. Combining high-resolution DEM, for example LiDAR, with moderate to
high resolution imagery, including radar data in inundation characterization will be the
future focus of on-going study.
- Linking hydrological data with the frequency and inundation extent maps to aid in
better understanding of the spatial and temporal patterns of flood inundation. This will,
enhance the knowledge of the characteristics (hydrological) of the floodplain
ecosystem.
- The combination of the RS data and topographic analysis, which will help illustrate the
interaction between floodplain environments and flood processes.
- An automated way of analysing and mapping the terrain of Sokoto State to be able to
generate a database and a plan for monitoring and managing flood disaster monitoring
in the area.
- Public enlightenment and awareness on areas vulnerable to flooding, which can be done
in their own local dialect through schools, newspapers or television channels the
majority of people have access to.

82 | P a g e
REFERENCE
Abah R. C., 2013. An application of geographic information system in mapping flood risk zones
in a North central city in Nigeria, African Journal of Environmental Science and Technology,
Vol. 7, Iss. 6, pp. 365-371.
Adams W. M., 1992. Development’s deaf ear: Downstream users and water releases from the
Bakolori Dam, Nigeria. World development Vol. 21. No. 9, pp. 1405-1416.
Adeoye N. O., Ayanlade A., and Babatimehin O., 2009. “Climate change and menace of floods
in Nigerian cities: socio-economic implications”. Advances in Natural and Applied Sciences,
Vol. 3, No. 3, pp. 369-377.
Adeloye, J. A., and Rustum, R. 2011. Lagos (Nigeria) flooding and influence of urban
planning. Urban Design and Planning, Vol. 164, Iss. DP3 pp. 175–187.
Aderogba K. A., 2012. Global warming and challenges of flood in Lagos Metropolis, Nigeria.
Academic Research International, Vol. 2, No 1, pp. 448 – 468.
African Union (AU) and New Partnership for Africa’s Development (NEPAD), 2004. Disaster
Risk Reduction for Sustainable Development in Africa. [ONLINE] Available at:
http://www.unisdr.org/files/13093_AFRICAREGIONALDRRSTRATEGYfullPDF.pdf.
[Accessed 9 May 2016].
Akane H., and Jurgen S., 2005. Bakolori Dam and Bakolori Irrigation Project- Sokoto River,
Nigeria. Eawag aquatic research institute.
Akintola F. O., 1994. Flooding phenomenon. In: M.O. Filani, F. O., Akintola and C. O.,
Ikoprukpo, eds. Ibadan Region, Chapter 22. Nigeria: Rex Charles Pub., pp. 244-255.
Alexander W. J. R., 2001. Flood Risk Reduction Measures. University of Pretoria, Pretoria,
South Africa.
Amaize E., 2011. “Flood displaces 50 Villagers in Delta State”, in Vanguard: Towards a
Better Life for the People. Lagos: Vanguard Media Limited. (Monday, July 4). pp. 9.
Amin S., and Goldstein M., 2008. Data Against Natural Disasters Establishing Effective
Systems for Relief, Recovery, and Reconstruction, The World Bank, Washington, DC.

83 | P a g e
Amunobi A. I., 2013. Housing, vulnerability resilience and adaptation strategies to flood
hazard. A case study of Shiroro Town in Niger State, North Central Nigeria. Developing
countries studies, Vol. 3, No. 12, pp. 73-81.
Andjelkovic I., 2001. International Hydrological Programme: Guidelines on Non-structural
Measures in Urban Flood Management, UNESCO, Paris.
Andresen M. A., and Jenion G. W., 2010. Ambient populations and the calculation of crime
rates and risk. Security Journal, Vol. 23, No. 2, pp. 114–133.
Ayoade J. O., and Akintola F., 1980. Flood perception in two Nigerian cities. Environment
International, Vol. 4, pp. 227–280.
Azagra E., 1999. Flood Plain Visualization Using Tins. Unpublished Master's Thesis. Austin:
University of Texas.
Baas S., Ramasamy S., Depryck J. D. and Battista F., 2008. Disaster Risk Management
Systems Analysis. A Guide Book, FOA, Rome, January 2008.
Bapalu G. V., and Sinha R., 2003. GIS in flood hazard mapping: a case study of Kosi River
basin, Kanpur, India. Geology, Vol. 15, No. 3, pp. 204- 207.
Barber D. G., Hochheim K. P., Dixon R., Mosscrop D. R., and Mcmullan M. J., 1996. The role
of earth observation technologies in flood mapping: A Manitoba case study, Canadian Journal
of Remote sensing, Vol. 22, No. 1, pp. 137-143.
Berz G., Kron W., Loster T., Rauch E., Schimetschek J., Schmieder J., Siebert A., Smolka A.,
and Wirtz A., 2001. World map of natural hazards: A global view of distribution and intensity
of significant exposures, Natural Hazards, Vol. 23, pp. 443-465.
Bhuiyan J., and Dutta D., 2012. Analysis of Flood Vulnerability and Assessment of the Impacts
in Coastal Zones of Bangladesh due to Potential Sea Level Rise. Natural Hazards, 61:729–
743.
Birkett C. M., 2000. Synergistic remote sensing of Lake Chad: variability of basin inundation.
Remote sensing of Environment, Vol. 72, pp. 218-236.

84 | P a g e
Birkett C. M., Mertes, L. A. K., Dunne, T., Costa, M. H., and Jasinski, M. J., 2002. “Surface
water dynamics in the Amazon Basin: Application of satellite radar altimetry.” J. Geophys. Res
Atmos., Vol. 107, No. D20, pp. 8059.
Blaikie P., T. Cannon I., Davis, and Wisner B., 1994. At Risk: Natural Hazards, People's
Vulnerability, and Disasters. London: Routledge.
Brakenbridge G., Anderson E., Nghiem, S., Caquard S., and Shabaneh T. B., 2003. “Flood
warnings, flood disaster assessments, and flood hazard reduction: The roles of orbital remote
sensing,” in Proc. 30th Int. RSE, Honolulu, HI.
Brakenbridge R., 2006. “MODIS-based flood detection, mapping and measurement: The
potential for operational hydrological applications,” in Trans boundary Floods: Reducing Risks
through Flood Management. New York: Springer-Verlag, pp. 1–12.
Brakenbridge G. R., Nghiem S. V., Anderson E., and Mic R., 2007. Orbital microwave
measurement of river discharge and ice status. Water Resources. Res., Vol. 43, No. 4, pp. W04
405.
Brivio P. A., Colombo R., Maggi M., and Tomasoni R., 2002. Integration of remote sensing
data and GIS for accurate mapping of flooded areas. International Journal of Remote Sensing
Vol. 23, No. 3, pp. 429–441.
Brooks N., 2003. Vulnerability, risk and adaptation: a conceptual framework. Tyndall Centre
working paper no. 38, Tyndall Centre for Climate Change Research University of East Anglia,
Norwich, UK, pp. 4.
Brooks N., Adger W. N., and Kelly P. M., 2005. The determinants of vulnerability and adaptive
capacity at the national level and the implication for adaptation. Global Environ Change, Vol.
15, No. 2, pp. 151–163.
Burt T., Bates P., Stewart M., Claxton A., Anderson M., and Price D., 2002. “Water Table
Fluctuations within the Floodplain of the River Severn, England”. Journal of Hydrology, Vol.
262, Iss.1-4, pp 1-20.
Channels, 2015. Hundreds Displaced as Flood Destroys 180 Houses in Sokoto, Kaduna.
[ONLINE] Available at: http://guardian.ng/news/flood-destroys-n100m-farm-produce-in-
sokoto-state-2/. [Accessed 11 April 2016].

85 | P a g e
Chen Y., Wang W., Cuddy S., Pollino C., Merrin L. E., 2012. Spatial modelling of potential
water retention under floodplain inundation using remote sensing and GIS. In: Proceedings of
iEMSs 2012: The 6th International congress on environmental modelling and Software
modelling, Leipzig Germany.
Clark M. J., 1998. Putting water in its place: A perspective on GIS in hydrology and water
management. Hydrological Processes, Vol. 12, pp. 823–834.
Climate-data.org, 2016. Climate: Sokoto. [ONLINE] Available at: http://en.climate-
data.org/location/4737/. [Accessed 11 April 2016].
Coppock J. T., 1995. GIS and natural hazard: an overview from a GIS perspective, In Carrara
A, Guzzetti F (eds), Geographical Information System in Assessing Natural Hazard, Kluwer
Academic, Netherlands, pp. 21-34.
Crichton D., 2002. UK and global insurance responses to flood hazard. Water Int., Vol. 27, pp.
119-131.
Dang N. M., Babel M. S., and Luong H. T., 2010. Evaluation of food risk parameters in the
day river flood diversion area, Red River Delta, Vietnam. Natural Hazards.
Davies G., 1982. Geology in Sokoto State in Maps. (Ibadan: Ibadan University Press) pp. 6-7.
Dobson J. E., Bright E. A., Coleman P. R., Durfee R. C., and Worley B. A., 2000. "A Global
Population database for Estimating Populations at Risk". Photogrammetric Engineering &
Remote Sensing, Vol. 66, No. 7.
Domenikiotis C., Loukas A., and Dalezios N. R., 2003. The use of NOAA/AVHRR satellite
data for monitoring and assessment of forest fires and floods. Natural hazards and earth System
Sciences, Vol. 3, pp. 115-128.
Douglas I., Alam I. K., Maghenda, M., McDonnell Y., McLean L., and Campbell J., 2008.
Climate change, flooding and the urban poor in Africa”. Environment and Urbanization, Vol.
20, No. 1, April, pp. 187–205.
Dutta D., Herath S., and Musiake K., 2003. A mathematical model for flood loss estimation.
Journal of Hydrology, Vol. 277, pp. 24-49.

86 | P a g e
Egbinola C. N., Olaniran H. D., and Amanambu A. C., 2014. Flood management in Cities of
Developing Countries: The Example of Ibadan, Nigeria. Journal of Flood Risk Management.
Ekpoh I. J., and EkpenyongNsa (FRGS), 2011. The Effects of Recent Climatic Variations on
Water Yield in the Sokoto Region of Northern Nigeria; International Journal of Business and
Social Science Vol. 2 No. 7; [Special Issue–April 2011 Netherlands Environmental Assessment
Agency, 2005, The Effects of Climate Change in the Netherlands.
Emuh C. N., 2008. Sustainability science in flood disaster risk reduction. In: F.E. Bisong, ed.
Geography and millennium development goals: Proceedings of the 50th Annual Conference of
the Association of Nigerian Geographers. Calabar, Nigeria, ISBN978-8073-71-0, 179–184.
European Council (EC), 2007. EU Directive of the European Parliament and the European
Council on the Assessment and Management of Flood Risks (2007/60/EU).
Food and Agriculture Organization of the United Nations (FAO), 2016. Review of existing
georeferenced population dataset. [ONLINE] Available at:
ftp://ftp.fao.org/docrep/fao/009/a0310e/a0310e01.pdf. [Accessed 1 September 2016].
Fox J., Dobson G., Phillips M., and Pierce T., 2008. Visualization as a decision support tool –
Asheville’s North fork reservoir (Buncombe County, North Carolina) and the balance between
drought and flood mitigation. In: American Society of Dam Safety Officials Southeast
Regional Conference April 13- 16 2008, UNC-Asheville NC.
Frazier P. S., and Page K. J., 2000. Water body detection and delineation with Landsat TM
data. Photogrammetric Engineering and Remote Sensing, Vol. 66, pp. 1461-1467.
Gao B. C., 1996. A Normalized Difference Water Index (NDWI) for remote sensing of
vegetation liquid water from Space. Remote sensing of Environment, Vol. 58, pp. 257-266.
Greigert J., 1961. Introduction a la reconnaissance hydrologique du Bassin Occidentale du
Niger: Dakar, Senegal Direction Federale de Mines et de la Geologie.
Goodchild M., 2006. GIS and disasters: Planning for catastrophe. Computers, Environment and
Urban Systems, Vol. 30, pp. 227–229.

87 | P a g e
Hardmeyer K., and Spencer M. A., 2007. Using Risk-Based Analysis and Geographic
Information Systems to Assess Flooding Problems in an Urban Watershed in Rhode Island.
Environment Management, Vol. 39, pp. 563-574.
Haussmann P., and Weber M., 1998. Possible contributions of hydro-informatics to risk
analysis in insurance, In: Proc. 2nd International Conference on Hydro-informatics, Zurich,
Switzerland, 9–13 September, Balkema, Rotterdam.
Henry J. B., Chastanet P., Fellah K., and Desnos, Y. L., 2006. Envisat multi-polarized ASAR
data for flood mapping. International Journal of Remote Sensing, Vol. 27, No. 10, pp. 1921–
1929.
Honda K. C., Francis X. J., and Sah V. P., 1997. Flood monitoring in central plain of Thailand
using JERS-1 SAR data. Proc. 18th Asian Conference of Remote Sensing, Malaysia.
Horritt M. S., Mason, D. C., and Luckman A. J., 2001. Flood boundary delineation from
Synthetic Aperture Radar imagery using a statistical active contour model. International
Journal of Remote Sensing, Vol. 22, No. 13, pp. 2489–2507.
Huang C., Chen Y., and Wu J. P., 2014. Mapping spatio-temporal flood inundation dynamics
at large river basin scale using time-series flow data and MODIS imagery. Int. Journal Appl.
Earth Obs. Geoinf. Vol. 26, pp. 350-362.
Ikusemoran M., Anthony D., and Maryah A. U., 2013. GIS based assessment of flood risk and
vulnerability in the Benue floodplains, Adamawa State, Nigeria. Journal of Geography and
geology, Vol. 5, No. 4, pp. 148-160.
Ishaya S., Ifatimehin O. O., and Abaje I. B., 2009. Mapping flood vulnerable areas in a
developing urban centre of Nigeria. Journal of Sustainable Development in Africa, Vol. 11,
No. 4.
Islam M. M., and Sado K., 2000. Development of flood hazard maps of Bangladesh using
NOAA-AVHRR images with GIS. Hydrological Sciences-Journal-desSciences Hydrologist,
Vol. 45, No. 3, pp. 337-355.
Islam S. A., Bala S. K., and Haque A., 2009. “Flood Inundation map Bangladesh Using MODIS Surface
Reflectance Data,” Proceedings of the 2nd International Conference on Water and Flood
Management (ICWFM), Dhaka, pp. 739-748.

88 | P a g e
Isma’il M., and Saanyol I. O., 2013. Application of Remote Sensing (RS) and Geographic
Information Systems (GIS) in flood vulnerability mapping: Case study of River Kaduna,
International Journal of Geomatics and Geosciences, Vol. 3, Iss. 3, pp. 618-627.
Jensen J. R., 2000. Remote Sensing of the Environment: An Earth Resource Perspective. Saddle
River: Prentice-Hall.
Jiang H., Feng M., Zhu Y. Q., Lu N., Huang J. X., and Xiao T., 2014. An automated method
for extracting rivers and lakes from Landsat imagery. Remote Sens. Vol. 6, pp. 5067-5089.
Ji L., Zhang L., and Wylie B., 2009. Analysis of Dynamic Thresholds for the Normalized
Difference Water Index. Photogrammetric Engineering and remote sensing, Vol. 75, pp. 1307-
1317.
Jones A. F., Brewer P. A., Johnstone E., and Macklin M. G., 2007. High-resolution
interpretative geomorphological mapping of river valley environments using airborne LIDAR
data. Earth Surface Processes and Landforms, Vol. 32, pp. 1574-1592.
Jonkman S. N., 2005. “Global perspectives on loss of human life caused by floods.” Natural
Hazards, Vol. 34, No. 2, pp. 151–175.
Joyce K. E., Belliss S., Samsonov S., McNeill S., and Glassey P. J., 2009. A review of the
status of satellite remote sensing image processing techniques for mapping natural hazards and
disasters. Progress in Physical Geography, Vol. 33, No. 2, pp. 1-25.
Junk W. J., 2002. Long-term environmental and future of tropical wetlands. Environmental
Conservation, Vol. 29, No. 4, pp. 414-435.
Karamouz M., Noori N., Moridi A., Ahmadi A., 2011. Evaluation of floodplain variability
considering impacts of climate change. Hydrological Processes, Vol. 25, pp. 90-103.
Karim M. F., Mimura N., and Nobuoka H., 2005. Management of storm surge flood risk in the
coastal region of Bangladesh. In: Proceedings of the first International Conference on Coastal
Zone Management and Engineering in the Middle East.
Keys C., Angus D. and Benning N., 1996. Developing our expertise in the management of
flooding: some recent initiatives. Australian Journal of Emergency Management, Vol. 11, No.
4, pp. 38-43.

89 | P a g e
Kiage L. M., Walker N. D., Balasubramanian S., Babin A., and Barras J., 2005. Application of
Radarsat-1 synthetic aperture radar imagery to assess hurricane-related flooding of coastal
Louisiana. International Journal of Remote Sensing, Vol. 26, No. 24, pp. 5359–5380.
Klijn F., 2009. Flood risk assessment and flood risk management: An introduction and
guidance based on experience and findings of Flood site (an EU-funded Integrated Project).
Delft: Deltares, Delft Hydraulics.
Konadu D. D., and Fosu C., 2009. Digital Elevation Models and GIS for Watershed Modelling
and Flood Prediction - A Case Study of Accra Ghana. Appropriate Technologies for
Environmental Protection in the Developing World, pp. 325-332.
Kron W., 2005. Flood Risk = Hazard · Values · Vulnerability. Water Int., Vol. 30, No. 1, pp.
58-68.
Lawal D., 2012. Detecting flood susceptible areas using GIS-based analytic hierarchy process.
In: 2012 International Conference on Future Environment and Energy IPCBEE. IACSIT Press,
Singapore.
Lawrence M. K., Walker N. D., Balasubramanian S., and Baras J., 2005. Application of
Radarsat-1 synthetic aperture radar imagery to assess hurricane-related flooding of coastal
Louisiana. International Journal of Remote Sensing, Vol. 26, No. 24, pp. 5359–5380.
Li W. B., Du Z. Q., Ling F., Zhou, D. B., Wang H. L., Gui Y. M., Sun B. Y., and Zhang X. M.,
2013. A comparison of land surface water mapping using the normalized difference water
index from TM, ETM plus and ALI. Remote Sensing, Vol. 5, pp. 5530-5549.
Lillesand T. M., and Kiefer R. W., 2004. Remote sensing and Image interpretation 4th. Wiley,
New York. pp. 724.
Maidment D. R., Robayo O., and Merwade V., 2005. ‘Hydrologic modelling’, in Maguire, D.
J., Batty M. and Goodchild M. F. (eds.) GIS, Spatial Analysis, and Modelling, pp. 319–332,
Redlands, CA: ESRI Press.
Malczewski J., 1999. GIS and Multiple-criteria Decision Analysis, New York: John Wiley &
Sons.

90 | P a g e
Marks K., and Bates P., 2000. Integration of high-resolution topographic data with floodplain
flow models. Hydrological Processes, Vol. 14, pp. 2109-2122.
Marsalek J., Stancalie G., Brakenridge R., Ungureanu V., Kerenyi J., Szekeres J., 2004. NATO
Science for Peace project on management of transboundary floods in the Crisul-Körös river
system (Romania-Hungary). In: Flood Risk Management: Hazards, Vulnerability, Mitigation
Measures, Proc. of NATO Advanced Research Workshop, Ostrov u Tise, Czech Republic, Oct.
6-10, pp. 191–202.
McCarthy J., 2001. Climate Change: Impacts, Adaptation, and Vulnerability: Contribution of
Working Group II to the Third Assessment Report of the Intergovernmental Panel on Climate
Change. Cambridge, U.K.: Cambridge Univ. Press, 2001.
McFeeters S. K., 1996. The Use of Normalized Difference Water Index (NDWI) in the
delineation of open water features. International Journal of Remote sensing, Vol. 17, No. 7,
pp. 1425-1432.
Michael S. A., 2007. Multitemporal remote sensing for mapping and monitoring floods: an
approach towards validation of the KAFRIBA model, Kafue flats, Zambia. International
Institute for Geo-information science and earth observation, Enschede, The Netherlands.
Mizuochi H., Hiyama T., Ohta T., and Kenlo N. N., 2014. Evaluation of the Surface Water
Distribution in North-Central Namibia Based on MODIS and AMSR Series. Remote Sensing,
Vol. 6, pp. 7660-7682.
Mohammed K. Y., 2002. Development and challenges of Bakolori irrigation project in Sokoto
State, Nigeria. Nordic Journal of African studies, Vol. 11, Iss. 3, pp. 411- 430.
Mordi R., 2011. “The Tsunami in the making”. The Tell: Nigerian Independent Weekly. Lagos:
Tell Communications Limited. No. 29 (July 25), pp. 54 -63.
Mshelia A. D., 2005. Adaptation strategies to climate change. Journal of Energy and
environment, Vol. 18, No. 3, pp. 18-24.
Muhammad I., and Iyortim O. S., 2013. Application of Remote sensing and GIS for flood
Vulnerability mapping: case study of River Kaduna, Nigeria. International Journal of
Geomatics and Geosciences. Vol. 3, No. 3.

91 | P a g e
NASA, 2016. Data. [ONLINE] Available at: http://modis.gsfc.nasa.gov/data/. [Accessed 8
June 2016].
NASA, 2015. MODIS design. [ONLINE] Available at:
http://modis.gsfc.nasa.gov/about/design.php. [Accessed 15 March 2016].
National population commission, Nigeria (NPC). 2006. National and State Population and
Housing Tables: 2006 Census Priority Tables (Vol 1). [ONLINE] Available at:
http://population.gov.ng./index.php/publications/138-national-and-state-population-and-
housing-tables-2006-census-priority-tables-Vol-1. [Accessed 1 June 2016].
Nigerian Emergency Management Agency (NEMA), 2009. Unpublished report on flood
disaster in Nigeria, Abuja. Government press.
Nicholls R. J., 2002. Rising sea levels: potential impacts and responses. In: Hester R, Harrison
RM (Eds) Global environmental change. Issue in Environmental Science and Technology,
Vol.17, pp. 83–107, Royal Society of Chemistry, Cambridge.
Nigerian Red Cross Society (NRCS), 2011. Nigeria: floods. [ONLINE] Available at:
http://www.ifrc.org/docs/appeals/10/MDRNG008dfr.pdf. [Accessed 11 April 2016].
Northern Territory Government (NTG). 2016. What is flood mitigation? [ONLINE] Available
at: https://dlpe.nt.gov.au/flood-mitigation/what-is-flood-mitigation. [Accessed 8 August
2016].
Nwafor J. C., 2007. Global climate change: The driver of multiple causes of flood intensity in
sub-Saharan Africa. Paper presented at the International Conference on Climate Change and
Economic Sustainability held at Nnamdi Azikwe University, Enugu, Nigeria.
Nwilo P. C., Olayinka N. D., and Ayila D. A., 2012. Flood modelling and vulnerability
assessment of settlements in the floodplains using GIS and cellular framework approach.
Global journal of human social sciences, Vol. 12, Iss. 3.
Oaks Ridge National Laboratory (ORNL). 2016. LandScan. [ONLINE] Available at:
http://web.ornl.gov/sci/landscan/. [Accessed 5 May 2016].
Ojigi M. L., Abdulkadri F. I., and Aderoju M. O., 2013. Geospatial mapping and analysis of
the 2012 flood disaster in central part of Nigeria. A paper presented at the 8th National GIS
symposium, Dammam, Saudi Arabia April 15- 17.

92 | P a g e
Ojo O., 2011. Flooding: A Major Impediment to Sustainable Development. Being a Paper
Presented at the 2011 Mandatory Continuing Professional Development (MCPD) of the
Nigerian Institution of Estate Surveyors and Valuers (NISEV) Ogun State Branch on Thursday,
December 01, 2011.
Ologunorisa T. E., 2009. Strategies for Mitigation of Flood Risk in the Niger Delta, Nigeria.
Journal of Appl. Sci. Environ. Management, Vol. 13, No. 2, pp. 17- 22.
Our world, 2014. Determined actions brings real change to Sokoto. [ONLINE] Available at:
http://www.theworldfolio.com/files/file/report-54526f2c83aa5.pdf. [Accessed 21 April 2016].
Oyebande L., 1983. Rainfall intensity-duration-frequency curves and maps for Nigeria.
Department of Geography, University of Lagos, Akoka, Lagos.
Pelling M., 2003. The Vulnerability of Cities: Natural Disasters and Social Resilience,
Earthscan Publications, Sterling VA.
Pelling M., Maskrey A., Ruiz P., and Hall L., 2004. Reducing disaster risk: A challenge for
development – A global report. New York: United Nations Development Programme.
People’s Daily Online, 2010. Flood claims 48 lives, displaces 35,000 persons in Nigeria's
Sokoto State. [ONLINE] Available at: http://en.people.cn/90001/90777/90855/7141914.html.
[Accessed 11 April 2016].
Pradhan B., and Shafie M., 2009. Flood hazard assessment for cloud prone rainy areas in a
typical tropical environment. Disaster Advances, Vol. 2, No. 2, pp. 7–15.
Pradhan B., Pirasteh S., Shafie M., 2009. Maximum flood prone area mapping using
RADARSAT images and GIS: Kelantan river basin. International Journal of Geoinformatics,
Vol. 5, No. 2, pp. 11–23.
Premium Times, 2016. National Tragedy: Floods kill 53, displace 100,420 people across
Nigeria. [ONLINE] Available at: http://www.premiumtimesng.com/news/headlines/190364-
national-tragedy-floods-kill-53-displace-100420-people-across-nigeria.html. [Accessed 11
April 2016].

93 | P a g e
Rachael F. T., Richard T. K., Kingsford, Yi Lu, Cox, Neil C. S., and Simon J. H., 2015.
Mapping Inundation in the heterogeneous floodplain wetlands of the Macquarie Marshes, using
Landsat TM. Journal of Hydrology, Vol. 524, pp. 194-213.
Rogers A. S., and Kearney M. S., 2004. Reducing signature variability in unmixing coastal
marsh thematic Mapper Scenes using spectral indices. International Journal of Remote
Sensing, Vol. 20, pp. 2317-2335.
Rouse J. W, Haas R. H., Scheel J. A., and Deering D. W., 1974. Monitoring Vegetation Systems
in the Great Plains with ERTS. Proceedings, 3rd Earth Resource Technology Satellite (ERTS)
Symposium, Vol. 1, pp. 48-62.
Running S. W., Justice C. O., Salomonson V. V., Hall D., Barker J., Kaufman Y. J., Strahler
A. H., Huete A. R., Muller, J. P., Vanderbilt V., Wan Z.M., Teillet P., and Carneggie D., 1994.
Terrestrial remote sensing science and algorithms planned for EOS/MODIS. International
Journal of Remote Sensing, Vol. 15, pp. 3587–3620.
Ryu, J. H., Won, J. S., Min, K. D., 2002. Waterline extraction from Landsat TM data in a tidal
flat- A case study in Gomso Bay, Korea. Remote Sensing of Environment, Vol. 83, pp. 442-
456.
Samarasinghe S. M. J. S., Nandalab H. K., Weliwitiyac D. P., Fowzed J. S. M., Hazarikad M.
K., and Samarakoond L., 2010. Application of remote sensing and GIS for flood risk analysis:
A case study at Kalu-Ganga River, Sri Lanka. Int. Arch. Photogr. Remote Sensing Spatial
Information Science, Vol. 38, Part 8, Kyoto Japan 2010.
Sandholt I., Nyborg L., Fog B., Lô M., Boucum O., and Rasmussen K., 2003. Remote sensing
techniques for flood monitoring in the Senegal River Valley. Danish Journal of Geography,
Vol. 103, No. 1, pp. 71–81.
Sanyal J., and Lu X. X., 2004. Application of remote sensing in flood management with special
reference to monsoon Asia: a review. Natural Hazards, Vol. 33, pp. 283-301.
Sanyal J., and Lu X. X., 2006. Application of GIS in flood hazard mapping: A case study of
Gangetic West Bengal, India. Proceedings of Map Asia 2003, Malaysia.

94 | P a g e
Schumann G., Matgen P., Cutler M. E. J., Black A., Hoffmann L., and Pfister L., 2008.
Comparison of remotely sensed water stages from LIDAR, topographic contours and SRTM.
ISPRS Journal of Photogrammetry and Remote Sens., Vol. 63, pp. 283-296.
Shaikh M., Green D., and Cross H., 2001. A remote sensing approach to determine
environmental flows for wetlands of the lower Darling river, New south wales, Australia,
International Journal of Remote Sensing, Vol. 22, No. 9, pp. 1737-1751.
Shamsedddin M. A. H., Hata T., Tada A., Bashir M. A., and Tanakamaru T., 2006. Estimation
of flooded area in the bahr El-Jebel basin using remote sensing techniques. Hydrology and
earth System Sciences Discussions, Vol. 3, pp. 1851-1877.
Sheng Y., Gong P., and Xiao Q., 2001. Quantitative dynamic flood monitoring with NOAA
AVHRR. International Journal of remote Sensing, Vol. 9, pp. 1709-1724.
Sheng, Y. W., Shah, C. A., Smith, L. C., 2008. Automated image registration for hydrologic
change detection in the lake-rich Arctic. IEEE Geosci. Remote Sens. Lett. Vol. 5, pp. 414-418.
Singh K. V., Setia R., Sahoo S., Prsad A., Pateriya, B., 2015. Evaluation of NDWI and MNDWI
for assessment of waterlogging by integrating digital elevation model and groundwater level.
Geocarto Int., Vol. 30, pp. 650-661.
Shoji T., Tomohisa K., Yuzo S., and Kishi S., 1999. Comparative study for flood detection
using JERS-1 SAR and Landsat TM data, IEEE, pp. 873-875.
Smith L. C., 1997. Satellite remote sensing of river inundation area, stage, and discharge: A
review. Hydrological Processes, Vol. 11, No. 10, pp. 1427–1439.
Smith K., and Ward R., 1998. Floods: physical processes and human impacts. John Wiley and
Sons, Chichester, USA
Smith K., 2006. Environmental hazards, assessing risk and reducing disaster. Routledge,
London.
Stevens T. B., 2013. Synthetic aperture radar for coastal flood mapping. NASA Global Change
Master Directory. Data Originator: LSU Earth Scan Laboratory, Baton Rouge.
http://www.esl.lsu.edu/home/

95 | P a g e
Takeuchi W., Yasuoka Y., 2004. Development of normalized vegetation, soil and water indices
derived from satellite remote sensing data. J. Jpn Soc. Photogramm. Remote Sensing, Vol. 43,
pp. 7–19. (In Japanese)
Tapsell S. M., and Tunstall S. M., 2008. “I wish I’d never heard of Banbury”: the relationship
between “place” and the health impacts from flooding. Health place, Vol. 14, pp. 133-154.
Tan Q., Bi S., Hu J., Liu Z., 2004. Measuring Lake water level using multi-source remote
sensing images combined with hydrological statistical data, IEEE, pp. 4885-4888.
The Caribbean disaster emergency management agency (CDEMA), 2010. Flood preparedness.
[ONLINE] Available at:
http://www.weready.org/flood/index.php?option=com_content&view=article&id=28&Itemid
=29. [Accessed 8 August 2016].
The Guardian, 2016. Flood destroys N100m farm produce in Sokoto State. [ONLINE]
Available at: http://guardian.ng/news/flood-destroys-n100m-farm-produce-in-sokoto-state-2/.
[Accessed 11 April 2016].
The World Bank 2010. Natural hazards, unnatural disasters: The economics of effective
prevention. Washington: The World Bank.
Today, 2016. 11 dead as flood destroys 86,710 hectares of farmland in Sokoto, Kebbi, Zamfara.
[ONLINE] Available at: https://www.today.ng/news/14541/11-dead-as-flood-destroys-86710-
hectares-of-farmland-in-sokoto-kebbi-zamfara. [Accessed 11 April 2016].
Tong P. H. S., Auda Y., Populus J., Azipuru M., Habshi A. A., and Blasco F., 2004. Assessment
from space of mangroves evolution in the Mekong Delta, in relation to extensive shrimp
farming. International Journal of Remote Sensing, Vol. 25, pp. 4795-4812.
Townsend P. A., and Walsh S. J., 1998. Modelling floodplain inundation using an integrated
GIS with radar and optical remote sensing. Geomorphology, Vol. 21, pp. 295-312.
Townsend P. A., 2002. Relationship between forest structure and the detection of flood
inundation in forested wetlands using C-band SAR. International Journal of Remote Sensing,
Vol. 23, No. 3, pp. 443–460.
Toyra J., Pietroniro A., Martz L. W., and Prowse T. D., 2002. A multi-sensor approach to
wetland monitoring. Remote sensing of Environment, Vol. 16, pp. 1569-1581.

96 | P a g e
Tsakiris G., Nalbantis I., and Pistrika A., 2009. Critical Technical Issues on EU Flood
Directive, European Water, 25/26, pp. 39–51.
United Nations-data (UNdata), 2016. Nigeria. [ONLINE] Available at:
http://data.un.org/CountryProfile.aspx?crName=Nigeria. [Accessed 23 May 2016].
UNICEF, 2013. UNICEF Nigeria Situation Report. [ONLINE] Available at:
http://www.unicef.org/appeals/files/UNICEF_Nigeria_SitRep_February_2013.pdf. [Accessed
11 April 2016].
UN-ISDR (International Strategy for Disaster Reduction), 2004. “Living with risk. A global
review of disaster reduction initiatives.” Inter-Agency Secretariat of the international strategy
for disaster reduction.
UN-ISDR (International Strategy for Disaster Reduction), 2007. Disaster risk reduction: A
global review 2007. Geneva: ISDR.
UN-ISDR (International Strategy for Disaster Reduction), 2009a. 2009 UNISDR terminology
on disaster risk reduction. Geneva: ISDR.
UN-ISDR (International Strategy for Disaster Reduction), 2009b. Global assessment report on
disaster risk reduction. Geneva: ISDR.
USGS, 2016. Surface Reflectance 8-day L3 Global 500m. [ONLINE] Available at:
https://lpdaac.usgs.gov/dataset_discovery/modis/modis_products_table/mod09a1. [Accessed
28 July 2016].
Vanguard, 2015. 11 die, 86, 710 hectares of farmland destroyed by flood in Sokoto, Kebbi,
Zamfara – NEMA. [ONLINE] Available at: http://www.vanguardngr.com/2015/09/11-die-86-
710-hectares-of-farmland-destroyed-by-flood-in-sokoto-kebbi-zamfara-nema/. [Accessed 11
April 2016].
Venton P., and Hansford B., 2006. Reducing Risk of Disaster in Our Communities. Tear fund,
Teddington.
Wang Y., Colby J. D., and Mulcahy K. A., 2002. An efficient method for mapping flood extent
in a coastal flood using Landsat TM and DEM data. International Journal of remote Sensing,
Vol. 23, No. 18, pp. 3681-3696.

97 | P a g e
Wang Y., 2006. Mapping the Extent of a flood: what we have learned and how we could do
better, Department of Geography, East Carolina University, Greenville. Online material
available at
http://www.bing.com/search?q=Mapping+the+Extent+of+a+flood%3A+what+we+have+lear
ned+and+how+we+could+do+better,+Department+of+Geography,+East+carolina+Universit
y,+greenville&src=IE-TopResult&FORM=IETR02&conversationid=
Wikipedia. 2016. Sokoto River. [ONLINE] Available at:
https://en.wikipedia.org/wiki/Sokoto_River. [Accessed 10 August 2016].
Wisner B., Blaikie P., Cannon T., and Davis I., 2004. At risk: Natural hazards, people’s
vulnerability and disasters. New York: Routledge.
Wong D., and Amrhein C., 1996. “Research on the MAUP: old wine in a new bottle, or real
breakthrough?'' Geographical Systems, Vol. 3, pp 73-76.
World Health Organization (WHO), 2010. World Disasters Report, 2010. Chapter 2 and 6:
World Disasters Report 2010 – Focus on Urban Risk. Retrieved from:
http://www.ifrc.org/en/publications-and-reports/world-disasters-report/wdr2010/, (Accessed
November 5, 2015).
Wright N. G., Villanueva, Bates P. D., Mason D.C., Wilson D. C., Pender G. and Neelz S.,
2008. Case study of the use of Remotely Sensed data for modelling flood inundation on the
River Severn, U.K. Journal of Hydraulic Engineering, ASCE, Vol. 134, No. 5, pp. 533-540.
Xu H., 2006. Modification of Normalized Difference Water Index (NDWI) to enhance open
water features in remotely sensed imagery. International Journal of Remote sensing, Vol. 24,
No. 14, pp. 3025-30533.
Yao, F. F., Wang, C., Dong, D., Luo, J. C., Shen, Z.F., and Yang, K. H., 2015. High resolution
mapping of urban surface water using ZY-3 multispectral imagery. Remote Sens. Vol. 7, pp.
12336-12355.
Yang X., and Rystedt B., 2002. Predicting flood inundation and risk using GIS and
Hydrodynamic model: a case study of Eskilstuna, Sweden. Indian Cartographer, Vol. 22, pp.
183-191.
Yalcin G., 2002. Multiple criteria analysis for flood vulnerable areas, Turkey.

98 | P a g e
Zheng N., Takara K., Tachikawa Y., and Kozan O., 2008. Analysis of Vulnerability to flood
hazard based on land use and population distribution in the Huaihe River basin, China, Annuals
of Disaster Prevention Research Institute, Kyoto University, No. 51 B.

Gudu
Isa
Kebbe
Rabah
Illela
Tangazar
Tambawal
Gada
Tureta
Sabon Birni
Goronyo
Shagari
Yabo
Binji KwareWurno
Dange-Shuni
Gwadabaw
Silame
Bodinga
WamakkoSokoto NorthSokoto South
µ
Appendix 1 Flood Risk Map of Sokoto State.
0 25 50 75 10012.5KilometersLegend
Very high riskHigh risk
Low riskMedium risk
State boundary
*Flood risk based on the flood events and the population vulnerable.

Gudu
Isa
Kebbe
Rabah
Illela
Tangazar
Tambawal
Gada
Tureta
Sabon Birni
Goronyo
Shagari
Yabo
Binji KwareWurno
Dange-Shuni
Gwadabaw
Silame
Bodinga
WamakkoSokoto NorthSokoto South
µ
Appendix 2 Flood risk Map based on Frequency of Inundation.
0 25 50 75 10012.5KilometersLegend
Low risk
State boundary
*Flood risk based on the frequency of inundation for the four flood selected periods.
High riskMedium risk