Hydrologic Considerations for Estimation of Storage-Capacity ...

Water Resources Management12: 229–249, 1998.© 1998Kluwer Academic Publishers. Printed in the Netherlands.
229
Coupling GIS with Hydrologic andHydraulic Flood Modelling
FRANCISCO NUNES CORREIA1, FILIPE CASTRO REGO2, MARIA DAGRAÇA SARAIVA3 and ISABEL RAMOS4
1 Instituto Superior Técnico, Lisboa, Portugal2 Planege, Lisboa, Portugal3 Instituto Superior de Agronomia, Lisboa, Portugal4 Centro Nacional de Informação Geográfica, Lisboa, Portugal
(Received: 24 March 1997; in final form: 15 November 1997)
Abstract. Geographic Information Systems (GIS) have been recognised as a powerful means tointegrate and analyse data from various sources in the context of comprehensive floodplain manage-ment. As part of this comprehensive approach to floodplain management, it is very important to beable to predict the consequences of different scenarios in terms of flooded areas and associated risk.Hydrologic and hydraulic modelling plays a crucial role and there is much to gain in incorporatingthese modelling capabilities in GIS. This is still a rather complex task and research is being doneon the full integration of these models. Interfacing between these models and GIS may be a veryefficient way of overcoming the difficulties and getting very good results in terms of engineeringpractice. This paper presents results based on the use of Intergraph GIS coupled with Idrisi GIS.Using these two systems substantially increased the flexibility of using GIS as a tool for flood studies.A lumped (XSRAIN) and a distributed (OMEGA) hydrologic models were used to simulate floodhydrographs. The well known HEC-2 Hydraulic model was used to compute flooded areas. Thesemodels were applied in the Livramento catchment with very good results. The computation of floodedareas for different flood scenarios, and its representation in GIS, can be used in the assessment ofaffected property and associated damages. This is a very useful GIS-based approach to floodplainmanagement.
Key words: flood analysis, flood hazard, GIS, hydraulic modelling, hydrologic modelling.
1. Introduction and Background
In a previous paper (Correiaet al., 1997), the merit of using GIS as a tool forcomprehensive and participatory flood plain management was emphasised. In thatpaper, the need for incorporating hydrologic and hydraulic models in GIS, and thedifficulties associated with it, were clearly stressed.
Although the use of one single GIS is generally an efficient approach, thereare circumstances in which it may be necessary or desirable to couple a complexGIS with a simplified one. Good examples of these circumstances arise from thecooperation between teams with different equipments or from the need to use amore sophisticated system when a simpler one proves to be insufficient.
warm1085.tex; 4/06/1998; 8:46; p.1INTERLINIE: PC3:warm1203: Pipsnr.: 162093 (warmkap:mathfam) v.1.15

230 FRANCISCO NUNES CORREIA ET AL.
Figure 1. Integration of Intergraph and IDRISI GIS.
In this paper Intergraph GIS is used as the basis for storing and overlayinginformation and for displaying results. Idrisi GIS, supported by a common PC, isused for running the hydrologic and the hydraulic models.
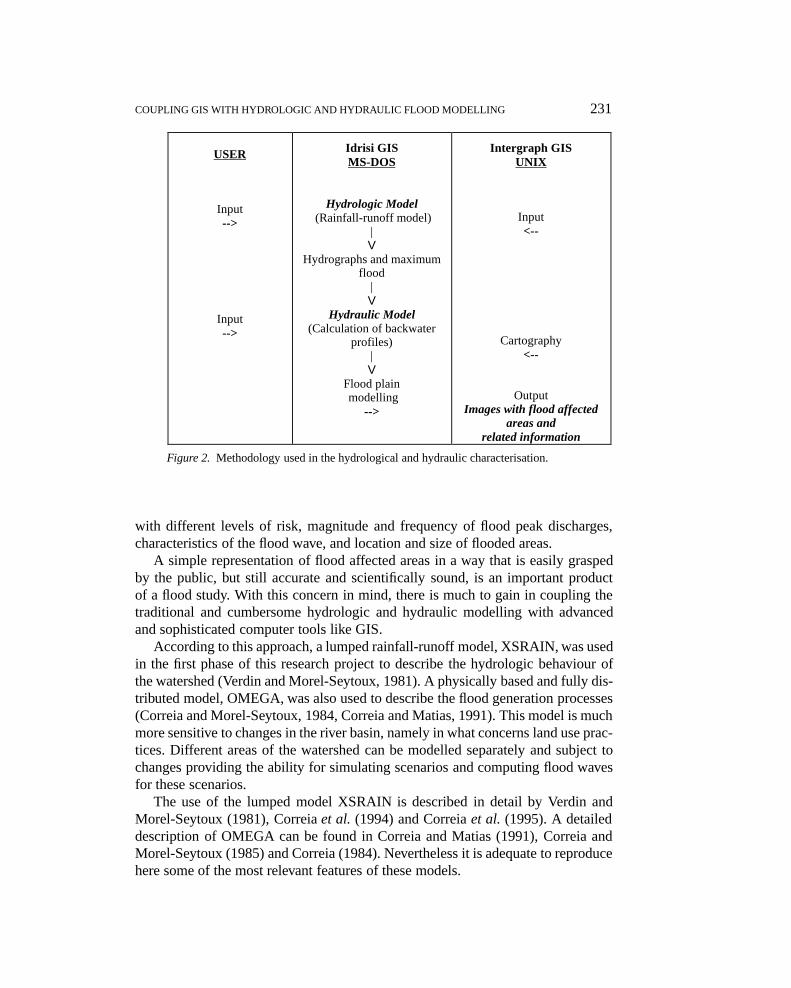
The architecture of this coupled system, the relationship between the two com-ponents and the interface with the user, are displayed in Figures 1 and 2.
In this paper, the use of different hydrologic and hydraulic models and theresults obtained in the simulation of historic and predicted floods are presented.A lumped and a distributed model are used and the impact of urban developmentis assessed. The area of study is the Livramento catchment (24 km2), in Setúbal,located 35 km south of Lisbon. This case study is presented with more detail inCorreiaet al. (1997).
The research reported in this paper was conducted in the framework of EU-ROflood 1 and 2, projects partially funded by the EU, under the Climatologyand Natural Hazards area of the Environment Research Programme. JNICT, thePortuguese Board for Science and Technology, also supported Portuguese partic-ipation in these projects. Other collaborators of EUROflood are referred to in theacknowledgements. A more detailed description of these projects can be found inPenning-Rowsell and Fordham (1994) and Penning-Rowsell (1996).
2. Hydrologic and Hydraulic Modelling
2.1. LUMPED AND DISTRIBUTED HYDROLOGIC MODELLING
The mapping of flood affected areas is a basic tool for flood risk assessment. Themost important hydrologic and hydraulic variables relevant to flood hazard assess-ment are: meteorological data, namely rainfall depths and intensities associated
warm1085.tex; 4/06/1998; 8:46; p.2
COUPLING GIS WITH HYDROLOGIC AND HYDRAULIC FLOOD MODELLING 231
USER
Input-->
Input-->
Idrisi GISMS-DOS
Hydrologic Model (Rainfall-runoff model)
|V
Hydrographs and maximumflood
|V
Hydraulic Model(Calculation of backwater
profiles)|V
Flood plain modelling
-->
Intergraph GISUNIX
Input<--
Cartography<--
OutputImages with flood affected
areas andrelated information
Figure 2. Methodology used in the hydrological and hydraulic characterisation.
with different levels of risk, magnitude and frequency of flood peak discharges,characteristics of the flood wave, and location and size of flooded areas.
A simple representation of flood affected areas in a way that is easily graspedby the public, but still accurate and scientifically sound, is an important productof a flood study. With this concern in mind, there is much to gain in coupling thetraditional and cumbersome hydrologic and hydraulic modelling with advancedand sophisticated computer tools like GIS.
According to this approach, a lumped rainfall-runoff model, XSRAIN, was usedin the first phase of this research project to describe the hydrologic behaviour ofthe watershed (Verdin and Morel-Seytoux, 1981). A physically based and fully dis-tributed model, OMEGA, was also used to describe the flood generation processes(Correia and Morel-Seytoux, 1984, Correia and Matias, 1991). This model is muchmore sensitive to changes in the river basin, namely in what concerns land use prac-tices. Different areas of the watershed can be modelled separately and subject tochanges providing the ability for simulating scenarios and computing flood wavesfor these scenarios.
The use of the lumped model XSRAIN is described in detail by Verdin andMorel-Seytoux (1981), Correiaet al. (1994) and Correiaet al. (1995). A detaileddescription of OMEGA can be found in Correia and Matias (1991), Correia andMorel-Seytoux (1985) and Correia (1984). Nevertheless it is adequate to reproducehere some of the most relevant features of these models.
warm1085.tex; 4/06/1998; 8:46; p.3

232 FRANCISCO NUNES CORREIA ET AL.
2.2. BRIEF DESCRIPTION OF XSRAIN HYDROLOGIC MODEL
The XSRAIN model can generate a flood hydrograph for a given rainfall event. Torun XSRAIN it is necessary to input data such as: watershed boundary, watershedarea, average watershed slope, length of the principal water course, Curve Num-ber (CN) according to US Soil Conservation Service Tables (see Correia, 1983),rainfall time distribution, and time step for rainfall-runoff computation.
When using this type of model, the time pattern of the rainfall event is veryimportant. It is adequate to use a synthetic design storm pattern for this purpose.There are several techniques for establishing a design storm. The use of Huff quar-tile storm hyetographs is one of these techniques which description can be foundin Correia (1989).
When a Huff time distribution or any other rainfall pattern is considered, theexcess rainfall hyetograph is computed by physically based infiltration equationsthat are specially appropriate for variable rainfall patterns. The parameters usedby these equations are the saturated hydraulic conductivity and the storage suctionfactor at a field capacity. One of the merits of XSRAIN model is to compute thevalues of these parameters based on the tabulated values of the Curve Number(CN).
The value of CN depends on the hydrologic group of soil, the land use, and thetreatment or practice of the surface. Since the model is lumped, average values overthe watershed must be considered. CN ranges from 0 (infinite transmission) to 100(watershed thoroughly impervious).
Observed rainfall data can be used instead of a synthetic design storm pattern.This is specially important for calibrating the model based on historic events.
The output of this model is the flood wave hydrograph corresponding to therainfall pattern that was being specified as input. This flood wave is defined byvalues of instantaneous discharge in m3/s at the time steps that are being consid-ered. The values of successive instantaneous discharges or the peak value can betransferred to the hydraulic model in order to compute the flooded area.
2.3. BRIEF DESCRIPTION OF OMEGA HYDROLOGIC MODEL
OMEGA is as a package of fully compatible and consistent computer watershedmodels designed for simulation or real time forecasting of river flows, and in-cluding complete calibration procedures. It can be used for event or continuoussimulation of river discharges and can be utilised in a lumped or distributed fash-ion. When used as a distributed model, the spatial variability of the input and thewatershed response may be fully considered.
OMEGA incorporates to a large extent the physical conceptualisation of the hy-drological processes. The description of the complex and highly non-linear processesof infiltration, ponding and redistribution of water in soil is addressed with specialattention. The modern theory of infiltration provides us with tools that can be
warm1085.tex; 4/06/1998; 8:46; p.4

COUPLING GIS WITH HYDROLOGIC AND HYDRAULIC FLOOD MODELLING 233
adequately incorporated in rainfall-runoff models, enhancing the possibilities ofthese models and improving their results.
Three totally compatible versions of the model were implemented, namely thebasic simulation version, the parameter calibration version and the real-time fore-cast version. This triple formulation adds a large degree of versatility. In previousapplications the model showed a remarkable ability to adapt to different hydrologicconditions, going from a mountainous and wet region to a semi-arid and flat one,and provided consistently good results in practical applications (Correia, 1984).
Some of the most important features of OMEGA relevant to this research workare the following:
a) OMEGA attempts to incorporate to a large extent the physical conceptualisa-tion of the hydrological process. This is principally achieved in the descriptionof the highly non-linear processes of infiltration, ponding and redistributionof water in the soil. These processes play a crucial role in the determinationof the total amount and time distribution of excess rainfall. No linearisationsare considered because these processes are intrinsically highly non-linear. Nosimple storage balance equations are formulated although mass balance isobviously guaranteed.
b) OMEGA can be used as an event simulation model or as a continuous model.Different time steps can be considered and a changing time step can be ac-commodated, from one minute to a few hours. OMEGA can be used in anoff-line simulation of the watershed behaviour or in a real time forecastingframework in which the filtering capabilities are activated but none of thephysical conceptualisations are lost.
c) OMEGA was developed with very attractive calibration procedures. Auto-matic parameter optimisation is combined with engineering judgement. Allparameters have a physical meaning, their value ranges are known, and cali-bration proceeds as a multi-step interactive dialogue with the user. If few dataare available the physical basis of the model allows for a tentative estimationof parameters based on a field survey. This tentative is used as anapriori tobe improved by the few data that can be used.
d) OMEGA is a distributed model with respect to both the parameters and inputs.In this way spatial variability can be taken into consideration and phenomenasuch as the movement of a storm over the watershed can be considered. Thischaracteristic makes the model very adequate to all types of studies in whichthe impact of spatial variability is relevant. Naturally, OMEGA can be alsoused as a lumped model.
The fully distributed approach and the detailed description of the interface be-tween surface and subsurface processes, accomplished by OMEGA, make it veryattractive to use the model in the study of spatial variability of parameters and itsimpact on catchment response. This is the case of land use changes caused by urban
warm1085.tex; 4/06/1998; 8:46; p.5

234 FRANCISCO NUNES CORREIA ET AL.
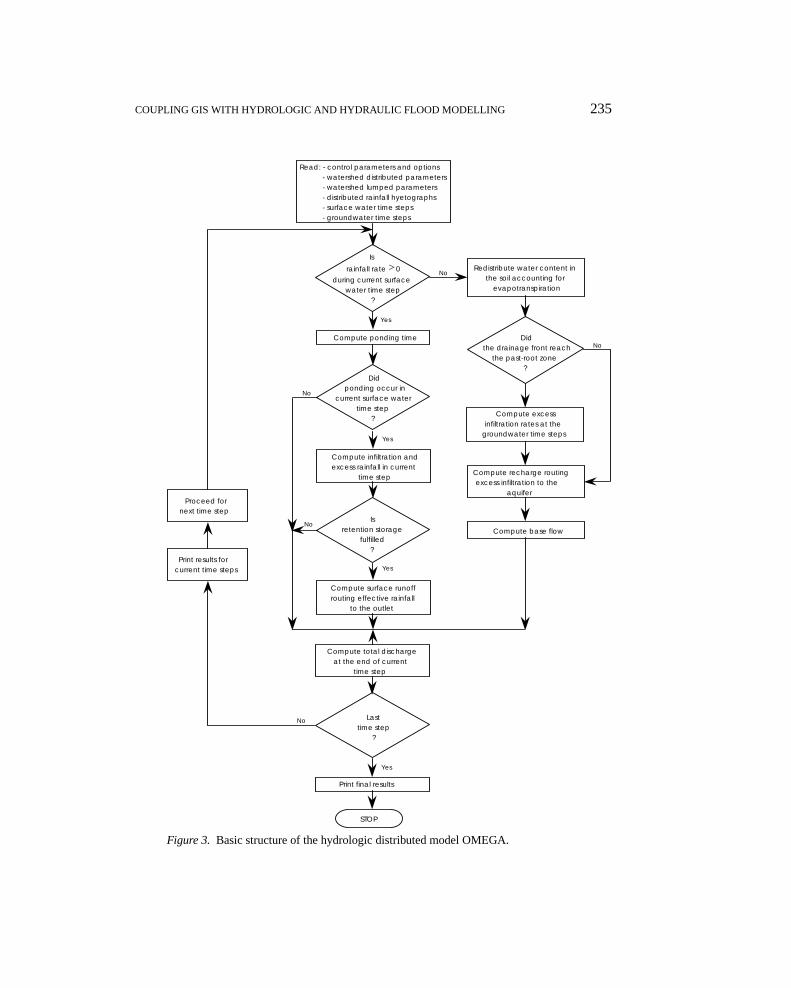
growth and the impact of these changes on the flood regime. In fact, a distributedmodel like OMEGA can be used to analyse and compare different scenarios ofurban development and assess its relevance in terms of flood hazards. The generalflowchart with the structure of the simulation procedures are displayed in Figure 3.The use of OMEGA as a distributed model is presented in Figure 4.
Naturally, OMEGA is much more demanding in terms of required data andmuch more complex in terms of parameter calibration, when compared to a lumpedmodel like XSRAIN. This should be faced as a trade off for the better capa-bilities in comparing alternative scenarios for urban development. However, thesemi-automatic calibration procedures incorporated in the model allow for a ratherexpedite calibration of the parameters, principally when plenty of information isalready available in the GIS database.
2.4. HYDRAULIC MOD ELLING
The determination of backwater profiles for flood hazards of various frequenciesis based on the hydraulic model HEC-2, developed by the Hydrologic EngineeringCentre of the US Army Corps of Engineers. This model provides the calculationand graphical presentation of backwater profiles for steady flow conditions. Super-critical or subcritical flows in natural or lined cross sections, for several flow rates,can be considered. Profiles with or without singularities such as bridges, culvertsor structures in the overbank region can be also considered.
To use this hydraulic model the user have to input the following data: identifyand describe a number of cross sections necessary to represent the river geometryand all singularities; roughness coefficients of overbanks and channel; water ele-vation for the first cross section (downstream section if the flow is subcritical orupstream section if the flow is supercritical); discharge value.
After running the backwater program (HEC-2 or an equivalent model), some ofthe most relevant results are: the computed water surface elevations; the cumulativevolumes of water in river since the first cross section; the mean velocity in thechannel. This information can be transferred back to the GIS and flood affectedareas can be displayed. A more complete description of these procedures can befound in previous papers like Correiaet al. (1994) and Correiaet al. (1995).
3. Coupling GIS with Hydrologic and Hydraulic Modelling
Hydrologic and hydraulic modelling deal frequently and extensively with spatialdata. Input, parameters and output are space-time defined. Under these circum-stances it is very attractive to use GIS tools to perform the most relevant spacebased operations. GIS are commonly equipped with tools that are relevant to theimplementation of hydrologic and hydraulic models, like algorithms for the cal-culation of watershed contours, slope, Digital Terrain Models (DTM), networkfunctions, and the ability to overlay images.
warm1085.tex; 4/06/1998; 8:46; p.6
COUPLING GIS WITH HYDROLOGIC AND HYDRAULIC FLOOD MODELLING 235
Read: - control parameters and options- watershed distributed parameters- watershed lumped parameters - distributed rainfall hyetographs - surface water time steps - groundwater time steps
Is rainfall rate >0
during current surface water time step
?
Did ponding occur in
current surface water time step
?
Compute ponding time
Compute infiltration and excess rainfall in current
time step
Is retention storage
fulfilled ?
Compute surface runoff routing effective rainfall
to the outlet
Compute total discharge at the end of current
time step
Last time step
?
Print final results
STOP
Did the drainage front reach
the past-root zone ?
Redistribute water content in the soil accounting for
evapotranspiration
Compute excess infiltration rates at the
groundwater time steps
Compute recharge routing excess infiltration to the
aquifer
Compute base flow
Proceed for next time step
Print results for current time steps
No
No
Yes
Yes
Yes
Yes
No
No
No
Figure 3. Basic structure of the hydrologic distributed model OMEGA.
warm1085.tex; 4/06/1998; 8:46; p.7

236 FRANCISCO NUNES CORREIA ET AL.
Figure 4. Use of OMEGA as a distributed rainfall-runoff model.
warm1085.tex; 4/06/1998; 8:46; p.8

COUPLING GIS WITH HYDROLOGIC AND HYDRAULIC FLOOD MODELLING 237
Attempts in coupling GIS with hydrologic and hydraulic models started in 1975,when the Hydrologic Engineering Centre (HEC) worked on the integration ofHEC-1 in a GIS using a grid based method. The result of this effort was HEC-SAM (Spatial Analysis Methodology). In this approach, GIS served simply as adatabase to feed the hydrologic model (Males and Grayman, 1992).
Another well known approach in this field is TOPMODEL. This is a topograph-ically based surface water model developed in 1979. This semi-distributed modelmakes direct use of detailed DTM data. Romanowiczet al. (1993) report on thelimitations of this attempt from a hydrological point of view.
There is a trend among commercial GIS towards a better interface with a widerrange of data types and a closer integration within a single software system of whatwere once separated and disparate software capabilities. CAD and GIS have beenalready integrated into a single system. Raster and vector have been merged andremote sensing techniques have been coupled with GIS. This trend will continueand all sorts of environmental models, including hydrologic and hydraulic models,will be increasingly incorporated in a GIS framework. DeVautier and Feldman(1993) present a complete review of GIS-based modelling approaches. Correiaetal. (1997) also address this topic.
The weakness of GIS is that the time based processes are not easily accom-modated. To circumvent this limitation it is possible to couple the GIS with aperipheral computer in which the hydrologic and hydraulic models are run. Resultscan be transferred back to the GIS and space based operations can proceed in thissystem (Figures 1 and 2). This proved to be a good approach for both hydrologicalmodels being used (XSRAIN and OMEGA) and for the hydraulic model used forflood mapping (HEC 2).
As described in Correiaet al.(1994) and Correiaet al.(1995), each GIS systemhas its own architecture, capabilities and limitations. For a given level of applica-tion results may be equivalent but the implementation process is quite GIS specificand demands a specific methodological approach.
4. Application to Livramento Catchment in Setúbal
As a preliminary task, the existing cartography (source data) has to be convertedfrom their existing form into one that can be used by the GIS at hand. This issuecan be done by manual digitising or by map scanning. Both processes create a geo-referenced database files in digital format. In some cases the agencies responsiblefor data publication can provide the user with cartography that is already in digitalform. This is a tremendous breakthrough since it is usually manageable to convertthis source information to the system that is being used.
In the Setúbal case study, it was possible to purchase from the Portuguese Mili-tary Cartography Service the topographic map with some of the basic informationat the 1:25,000 scale. This map was used as the basis for superimposing other layerswith all sorts of relevant information. The various sorts of data were manipulated
warm1085.tex; 4/06/1998; 8:46; p.9

238 FRANCISCO NUNES CORREIA ET AL.
in order to produce the necessary input for running the hydrological model, suchas watershed parameters and cumulative rainfall depths.
Precipitation values corresponding to design storms of a given return period andfor a specified duration can be stored in the database and selected by the user for aspecific run of the hydrologic model. As an alternative, a historic storm can be alsostored in the data base and used for model validation or to assess the response tochanges in the watershed.
The parameters of the hydrologic models are very much related to soil charac-teristics and land use. Soil characteristics can be derived from the existing hydroge-ological and soil maps. Land use maps can be established from aerial photography.
Urban developed areas play a crucial role in the hydrologic regime as theycreate large impervious areas. Since the existing and digitised land use maps arefrom 1984, it was necessary to update them with more recent information. Re-mote sensing data was used for this purpose. Aerial photographs from 1989, at a1:15,000 scale, were used, taking advantage of image processing tools availablewith Intergraph GIS system. After saving the geographically referenced images, itis possible to load and overlay the older land use map in vector format. The overlaidmap can be manipulated and edited with the photography being a backdrop imageto the vector design file.
Both the land use map and the hydrogeological map (in vector format) hadto be reclassified through ORACLE database manipulations to fit into land useand hydrologic group classes established in the Curve Number (CN) tables. Asexplained in 2.2, CN values play an important role as a hydrological parameter inXSRAIN and also as a surrogate calibration parameter in OMEGA.
For the sake of simplicity in running the OMEGA model, the relevant layers ofinformation were transferred from the Intergraph equipment to a common 486 PC.The GIS IDRISI, developed by Clark University, in Massachusetts, U.S.A., wasused to compute most of the hydrologic parameters, creating input files that can beused directly by the model. This was extensively done by Rego (1996).
The transferability between Intergraph and IDRISI was found to be manageableand the most relevant hydrologic and hydraulic information, like Digital TerrainModel (DTM), type of soils, land use maps, hydrographic network, and hydro-geological maps, are available in both systems. In fact, all data input and pre-processing are executed with the Intergraph GIS on a UNIX platform. Hydrologicand hydraulic models are ran on a MS DOS or Windows platform and IDRISI GIScan also be used on this more common portable platform.
Vector-raster conversions were done within the Intergraph, taking advantage ofthe existing database linkage to the polygons with different database records fordifferent cell values. The image size considered as satisfactory for the 1:25,000analysis is a 15 m× 15 m, meaning 500 rows and 550 columns. After the vector-raster conversion, all maps – including class of soil, land use and Digital TerrainModel (DTM) – can be transferred to IDRISI in ASCII files.
warm1085.tex; 4/06/1998; 8:46; p.10

COUPLING GIS WITH HYDROLOGIC AND HYDRAULIC FLOOD MODELLING 239
In order to create a CN map, the CN value is computed automatically for eachcell by overlaying land use classification and type of soil.
The terrain modelling software creates DTM maps and files automatically. Rel-evant watershed descriptors are derived from DTM. Therefore, slope, aspect andelevation maps can be very easily obtained in a GIS environment.
A general conclusion at this stage is that it is better to use a simple GIS if acomplex rainfall-runoff model is being used, at least at a preliminary stage whenmany experimental runs are needed. As experience grows, good calibration of themodel is achieved and a good control of all operations is acquired, then the couplingwith a more complex GIS can be attempted.
As with XSRAIN model, both a synthetic design storm and a historical recordcan be used with OMEGA. However, OMEGA is more flexible because spatialvariability of the rainfall inputs can be also considered. This is particularly impor-tant when simulating the movement of a storm over a watershed.
The most relevant output of the model is a flood hydrograph expressed in termsof instantaneous flood discharges at specified time steps. This flood hydrograph,or simply the peak discharge, must be used as the input of the hydraulic model inorder to evaluate the flood affected area and other relevant parameters such as flowvelocities at different points. The flood affected area can be transferred back to theGIS and represented as a flood map for the rainfall event under consideration.
The results obtained by Rego (1996) with OMEGA as a lumped model forthe 1983 flood event are displayed on Figure 5. A good agreement between ob-served and computed discharge can be observed for this event. Using OMEGA asa distributed model for the same flood event led to the results displayed on Figure 6.
There is no significant improvement in the agreement between computed andobserved discharge when the distributed model is used (Figure 6), compared withthe results obtained with the lumped model (Figure 5). This is true for the overallduration of the flood event under consideration. However, if we look at the peakdischarge the agreement is significantly better with the distributed model. This isessential because the flood peak discharge is used for computing the inundationarea.
It should be emphasised that the main advantage of using the distributed modelis not getting a better fit. The main advantage is that the distributed model whenappropriately calibrated allows for the simulation of future scenarios of differen-tiated evolution of land use in the catchment. This is a very important feature inriver basins subject to significant urban growth.
Using the flood peak discharge with the HEC 2 hydraulic model, the floodaffected area for different storm events can be computed directly by the IDRISImodel. Results obtained by Rego (1996) are presented in Figure 7, for the 1983flood event.
The distributed hydrologic model was used to compute the 100 year returnperiod flood peak for a scenario of intense urban development in the catchment.The result of this simulation is presented in Figure 8.
warm1085.tex; 4/06/1998; 8:46; p.11

240 FRANCISCO NUNES CORREIA ET AL.
Figure 5. Flood event of 1983 using OMEGA as a lumped model.
Figure 6. Flood event of 1983 using OMEGA as a distributed model.
warm1085.tex; 4/06/1998; 8:46; p.12

COUPLING GIS WITH HYDROLOGIC AND HYDRAULIC FLOOD MODELLING 241
Figure 7. Flood affected area for the 1983 flood event computed by HEC 2 and IDRISI.
5. Stepwise Procedure for Flood Mapping
With the support of hydrologic and hydraulic models, different flooding scenarioscan be calculated. The preparation of flooded area maps in the GIS is a complextask mainly because the DTM represents the terrain with no construction at all. Inan urban environment, the consideration of buildings and other relevant structuresis essential. Therefore, the intersection of the water level with the terrain is notenough for representing the flood map.
In the specific case of Setúbal, there are two main regions to be considered: thevalley in which the river is open and no significant obstacle was built on the floodaffected area; the urbanised area in which the buildings are located and the riverwas canalised and transformed in a sewage system.
On the upstream region, an open space area, the water level is determined by thecomputation of HEC-2. On the downstream region, a direct computation of waterlevel along the streets is not feasible with HEC-2. Therefore, the water level at theupstream section of this region is considered equal to the level of the downstreamsection of the upstream region given by the HEC-2 model. The downstream level isestimated by guess, considering the water depth likely to occur at a control sectiondefined by Luísa Todi Avenue. The error in this estimation does not have a largeinfluence over the global result of the determination of the flooded area.
warm1085.tex; 4/06/1998; 8:46; p.13

242 FRANCISCO NUNES CORREIA ET AL.
Figure 8. Flood affected area for the 100 year flood event considering a scenario of intenseurban development.
A way to control the accuracy of the results is to compare the obtained vol-ume determined by the GIS system with the computed volume of the flood by thehydrological and hydraulic models.
The definition of the flooded areas within the urban area of Setúbal is done at a1:2,000 scale. A topographic survey of the urban area of Setúbal was recently doneand it is possible to obtain the topographic data already in digital format.
These recent topographic maps contain two types of information that are di-rectly relevant for the computation of the flooded areas by the hydraulic model.On the one hand, elevation data, provided as contours, that will help defining theflooded area. This information is displayed in Figure 9 as it can be obtained fromthe GIS. On the other hand, data about the location of buildings and other physicalstructures that constrain the water flow in the urbanised areas. This information isshown in Figure 10.
These two types of data can be split into two layers of information. The contourlines are used by GIS to automatically prepare a DTM. The contour lines areinterrupted by the buildings but, in a first stage, this is ignored and the floodedarea is computed as if there were no buildings at all.
warm1085.tex; 4/06/1998; 8:46; p.14

COUPLING GIS WITH HYDROLOGIC AND HYDRAULIC FLOOD MODELLING 243
1500m
N
Figure 9. Elevation data in the form of contours used by GIS for computing the DTM.
The hydrologic model provide us with a theoretical water depth as if there wasno urban area. Afterwards the volume occupied by the buildings is filled in, raisingthe water level as shown in Figure 11.
The Vector Analysis Module (Intergraph-MGE) and the Terrain Modeller(MSM) are tools used by GIS to perform the required computations. To be ableto measure the exact area occupied by the buildings, the data needs to be convertedfrom CAD to GIS format, meaning that all the polygons need to be properly closed,so that they may be linked to the alphanumeric data base in which each area willbe calculated by the system and filled up in the attached table.
This procedure is quite time consuming but it enables the analysis of otheraspects, such as number and utilisation of affected buildings which is possibleby linking the polygons to the census data or other field survey. The availableinformation may be attached to the geographical units and may be used for allsorts of purposes like the automatic computation of affected property and expecteddamages.
The use of the DTM is done by iterations, using the MSM software to intersecttwo surfaces, namely the DTM itself and the water surface without buildings (levela in Figure 11). The boundary of the flooded region for this non-built condition issuperimposed on the layer with the buildings, allowing for the identification of theunits included in the flooded area.
A new level for the water depth is then computed (level b in Figure 11) anda larger flooded area is found. It is necessary to check whether new buildings areflooded and repeat the process until convergence is achieved. The application of
warm1085.tex; 4/06/1998; 8:46; p.15

244 FRANCISCO NUNES CORREIA ET AL.
1500m
N
Figure 10. Encroachment of buildings and other physical structures constraining water flow.
(a)(b)
Figure 11. Preparation of flood maps in urban areas: (a) water depth for the non builttopography; (b) actual water depth considering developed areas.
this procedure to the floodplain of Livramento catchment in Setúbal is presented inFigure 12.
Of course, this is a simplification of reality. But it is a very effective one becauseit can be automatically performed by GIS software and it can be easily used forassessing the impact of different urban growth scenarios on flood affected areas.This assessment is one of the most important objectives of this research work givenits importance for policy formulation.
warm1085.tex; 4/06/1998; 8:46; p.16

COUPLING GIS WITH HYDROLOGIC AND HYDRAULIC FLOOD MODELLING 245
Figure 12. Flooded area in Setubal: a) without urban encroachment; b) when buildings andother physical infrastructure are considered.
A detail of the final result that can be obtained by this methodology is presentedin Figure 13. It is interesting to emphasise again that all sorts of information canbe stored in the data basis for each building polygon. Relevant information can beused for estimating flood damages or for identifying critical situations during floodemergencies.
Buildings, and other physical structures, are not entirely closed and thereforethey allow some water to percolate through them during a flood event. Thus, it iswise to consider some coefficient of perviousness when buildings are implantedin the flooded affected areas. Water depths registered during past events may helpcalibrate this coefficient.
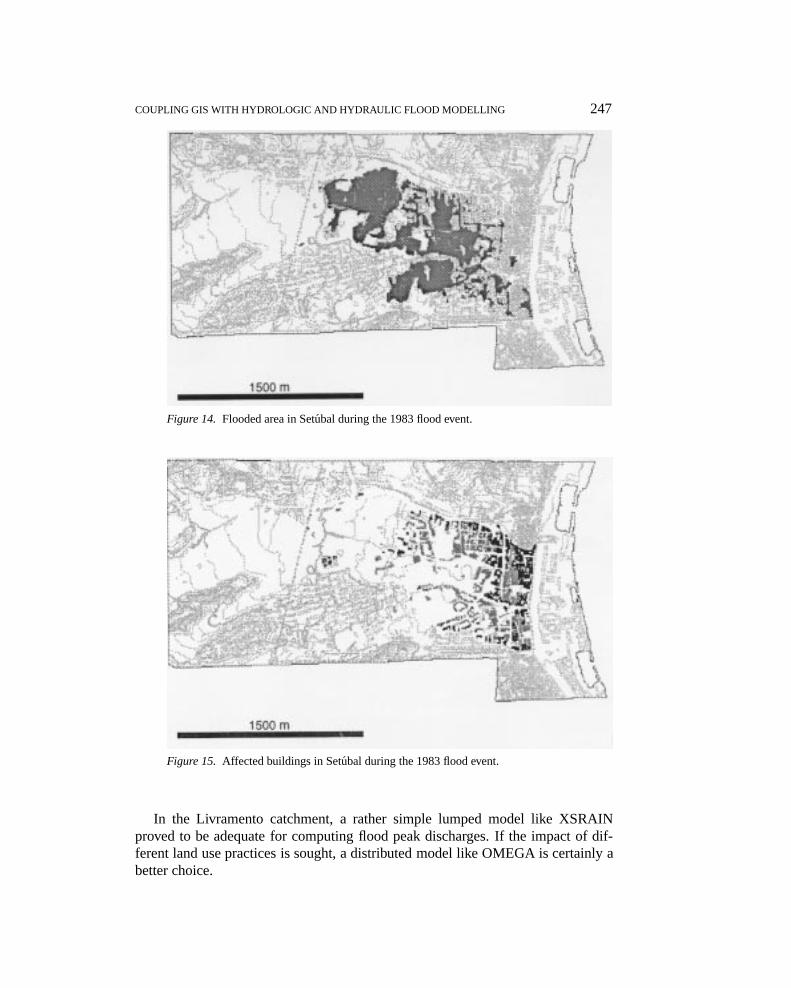
These procedures were done for the historic 1983 flood event and can be re-peated for flood storms with specific characteristics like the 100-year design stormor the Probable Maximum Flood. Data for the 1983 and the 100-year return periodflood events are presented in Table I. The flooded area in the 1983 flood event isshown in Figure 14. The affected buildings in this historic event are presented inFigure 15. The correspondence of observed and computed data proved to be verygood. This information is very useful for computing flood damages for this andother scenarios.
warm1085.tex; 4/06/1998; 8:46; p.17

246 FRANCISCO NUNES CORREIA ET AL.
500 m
N
Figure 13. Buildings affected by a given water depth, computed automatically by GIS.
Table I. Basic hydraulic data for the 1983 flood event and forthe 100-year design flood event
Hydraulic Data 1983 100 year flood
Volume of water (m3) 598,000 1,413,000
Water level at an upstream 10.29 10.50
reference section (m)
Water level at the beginning of 6.71 7.20
the culvert reach (m)
Water level at a downstream 3.20 3.20
reference section (m)
6. Conclusions
Floodplain management relies heavily on hydrologic and hydraulic modelling. Theresponse of the floodplain, including the definition of flooded areas for differ-ent scenarios, are essential steps for making decisions on the protection that isreasonable to adopt.
There is a panoply of hydrologic and hydraulic models that can be used forfloodplain management. These models vary significantly and may have differentdegrees of complexity. More complex models are not necessarily better for somespecific uses. Usually, simpler models have less requirements in terms of input dataand may be more adequate if data is scarce. More complex models are more de-manding but they allow a more thoroughly simulation of a wide range of situations.
warm1085.tex; 4/06/1998; 8:46; p.18
COUPLING GIS WITH HYDROLOGIC AND HYDRAULIC FLOOD MODELLING 247
Figure 14. Flooded area in Setubal during the 1983 flood event.
Figure 15. Affected buildings in Setubal during the 1983 flood event.
In the Livramento catchment, a rather simple lumped model like XSRAINproved to be adequate for computing flood peak discharges. If the impact of dif-ferent land use practices is sought, a distributed model like OMEGA is certainly abetter choice.
warm1085.tex; 4/06/1998; 8:46; p.19

248 FRANCISCO NUNES CORREIA ET AL.
Suburban catchments in fast developing areas are very dynamic in terms ofhuman occupation. This fact should be taken into consideration when studyingflood hazards in these areas. The assessment of different scenarios is essential andthese scenarios may include different storm conditions, different flood protectionmeasures and different land use practices.
The coupling of hydrologic and hydraulic models with GIS is a very fruitfulway of studying different scenarios. This coupling still raises difficulties becauseGIS are not yet fully suitable for the representation of time dependent phenom-ena. However, this limitation can be circumvented by doing part of the hydrologicand hydraulic calculations in a different system that is linked to the GIS. Prelim-inary calculation of parameters can be done in the GIS using the several layersof information available, the results used as input of the models, and the resultscommunicated back to the GIS in which complementary calculations, like expectedflood damages, can be computed and displayed.
This approach provides a very useful tool, not only for doing a good techni-cal work but also for communicating results in a simple but yet rigorous way toall the interested parties, namely the relevant actors and the public involved indecision-making processes. In other words, this methodology is adequate for acomprehensive and participatory approach to floodplain management as sought byEUROflood project.
Acknowledgements
EUROflood research project was made possible with the support of the EuropeanCommunity. Funding for this research project was provided by the EC under theClimatology and Natural Hazards component of the Environment Research Pro-gramme. The Portuguese National Board for Science and Technology (JNICT),also played a very crucial role at an early stage of this research project. Prof.Edmund Penning-Rowsel must be acknowledged as coordinator of EUROflood.Middlesex University, IST, Delft Hydraulics, Braschel + Schmitz, CERGRENE,LNEC, Catania University, and Polytechnic University of Catalunya were the or-ganisations participating in the project, which provided interesting exchange ofviews and scientific contributions. Research work in Portugal was done with thesupport of JNICT, CNIG, ISA and LNEC.
References
Bowles, D. and O’Connell, P.: 1991,Recent Advances in the Modelling of Hydrologic Systems, NATOASI Series C, Vol. 345, Kluwer Academic Publishers, Dordrecht, the Netherlands.
Correia, F. N.: 1983,Alguns Procedimentos Adoptados pelo Soil Conservation Service para o Estudodo Impacto da Urbanização nos Caudais de Cheia(Procedures adopted by the Soil ConservationService for the study of the impact of urbanisation in flood discharges), Technical Report No. ITH7, Laboratório Nacional de Engenharia Civil, Lisbon.
warm1085.tex; 4/06/1998; 8:46; p.20

COUPLING GIS WITH HYDROLOGIC AND HYDRAULIC FLOOD MODELLING 249
Correia, F. N.: 1984,OMEGA, a Watershed Model for Simulation, Parameter Calibration and Real-Time Forecast of River Flows, Ph. D. Dissertation, Civil Engineering Department, Colorado StateUniversity, Fort Collins, Colorado, U.S.A.
Correia, F. N.: 1989,The Use of Huff Quartile Time Distributions and Rearrangement Techniquesin Establishing a Design Storm Hyetograph, Memória588, Laboratório Nacional de EngenhariaCivil, Lisbon.
Correia, F. N. and Morel-Seytoux, H.: 1985,USER’s Manual for OMEGA – A Package of FORTRAN77 Programs for Simulation, Parameter Calibration and Real-Time Forecast of River Flows,Technical Report No. ITH 18, Laboratório Nacional de Engenharia Civil, Lisbon.
Correia, F. N. and Matias, P.: 1991,OMEGA: Impact of Spatial Variability of Infiltration Parame-ters on Catchment Response, in: Bowles, D. and P. O’Connell (eds),Recent Advances in theModelling of Hydrologic Systems, NATO ASI Series C, Vol. 345, Kluwer Academic Publishers,Dordrecht, the Netherlands.
Correia, F. N. and Morel-Seytoux, H.: 1985,USER’s Manual for OMEGA – A Package of FORTRAN77 Programs for Simulation, Parameter Calibration and Real-Time Forecast of River Flows,Technical Report No. ITH 18, Laboratório Nacional de Engenharia Civil, Lisbon.
Correia, F. N., Saraiva, M. G., Rocha, J., Bernardo, F. and Ramos, I.: 1995, Public Perception onFlood Risk and Flood Defence Policies, in: Gardineret al. (1995),Defence from Floods andFloodplain Management, NATO ASI Series Vol. 299, Kluwer Academic Publishers, Dordrecht,the Netherlands.
Correia, F.N., Saraiva, M.G., Rocha, J., Fordham, M., Bernardo, F., Ramos, I., Marques, Z. andSoczka, L.: 1994, The Planning of Flood Alleviation Measures: Interface with the Public, in:Penning-Rowsell, E. and M. Fordham (eds),Floods across Europe. Flood Hazard Assessment,Modelling and Management, Middlesex University Press, London.
Correia, F. N., Saraiva, M. G. and Ramos, I.: 1997, GIS-Based Flood Analysis and FloodplainManagement, submitted to publication inWater Resour. Manage., Kluwer Academic Publishers,Dordrecht, the Netherlands.
DeVautier and Feldman: 1993, Review of GIS applications in Hydrologic Modelling,J. WaterResour. Plan. Manage.119(2).
Males, R. M. and Grayman, W. M.: 1992, Past, Present and Future of Geographic Information Sys-tems, in:Water Resources(Water Resources Geographig Information Systems Issue) no. 87, TheUniversities Council on Water Resources.
Penning-Rowsell, E. (ed.): 1996,Improving Flood Hazard Management Across Europe, MiddlesexUniversity Press, London.
Penning-Rowsell, E. and Fordham, M (eds): 1994,Floods across Europe. Flood Hazard Assessment,Modelling and Management, Middlesex University Press, London.
Rego, F.: 1996,Utilização de Sistemas de Informação Geográfica e da Modelação Hidrológicae Hidráulica na Definição de Leitos de Cheia(Use of Geographic Information Systems andHydrologic and Hydraulic Modelling in the Definition of Flooded Areas), Master of ScienceThesis, Instituto Superior Técnico, Lisbon.
Romanowiczet al.: 1993, Topmodel as an Application module within GIS, in: Kovar and Nachtnebel(ed.), HidroGIS’93: Application of Geographic Information System in Hydrology and WaterResources, Proceedings of the Vienna Conference, IAHS Publ. no. 211, Viena.
Verdin, J. and Morel-Seytoux, H.: 1981,User’s Manual for XSRAIN-a Fortran IV Programme forCalculation of Flood Hydrografic for ungaged Watershed, Federal Highway Administration.Washington D.C.
warm1085.tex; 4/06/1998; 8:46; p.21
Copyright © 2022 FDOKUMEN