PowerPoint Presentation - The hydrologic cycle - Barasat ...
Upload
khangminh22Category
view
0download
0
Appendix A:
Hydrologic Analysis

APPENDIX A
HYDROLOGIC ANALYSIS
City of Greenville – Swift Creek Watershed Master Plan Page A‐1
WK Dickson & Co., Inc.
Two different models were used to develop design flows for the primary and secondary
systems. For each system analyzed, the hydrologic model(s) was selected based on the
complexity of the stormwater conveyance system.
The US Army Corps of Engineers (USACE) HEC‐HMS model was selected to model the
primary systems defined as the main stems of Swift Creek, SCUT1, and Gum Swamp. HEC‐
HMS simulates the surface runoff response to precipitation for an interconnected system of
surfaces, channels, and ponds. Input data for the HEC‐HMS model was developed using
topographic, land use, and soils maps in GIS to delineate and calculate the basin areas and
SCS hydrologic parameters. The HEC‐HMS model offers a variety of methods for simulating
the rainfall‐runoff response, hydrograph development, channel and pond routing. The
selection of methods for the analyses is based on the study objectives, data availability, and
watershed characteristics. The precipitation data for the 24‐hour duration, NRCS Type III
storm was used to represent the synthetic rainfall event. The NRCS curve number approach
was selected to calculate runoff volumes from the precipitation data, and the sub‐basin unit
hydrographs for these flood volumes were developed using the NRCS lag times. Where
appropriate, reservoir routing was selected to model attenuation behind culvert
embankments.
For the secondary systems that may: (a) have significant backwater effects from rising water
surface elevations within the Primary Systems, (b) have attenuation within drainage ditches
or behind roadways, and (c) show a sensitivity to the timing response of runoff to rainfall,
the Storm Water Management Model (SWMM) developed by the Environmental Protection
Agency (EPA) was selected as the hydrologic and hydraulic model. The NRCS curve
number approach was selected to calculate runoff volumes from the precipitation data, and
the sub‐basin unit hydrographs for these flood volumes were developed using the watershed
width parameter. SWMM simulates the surface runoff response to precipitation for an
interconnected system of surfaces, channels, and ponds. Input data for the SWMM model
was developed using topographic data, land use data, and soils maps in GIS to delineate and
calculate the basin areas and NRCS hydrologic parameters. The SWMM model offers a
variety of methods for simulating the rainfall‐runoff response, hydrograph development,
and channel routing. One advantage to using SWMM to model both hydrology and
hydraulics is that channel routing is modeled in the EXTRAN (hydraulics) block
automatically based on the geometry and nature of the conveyance system. This eliminates
the need to iterate between a hydrologic model and a hydraulic model to produce reasonable
flows.

APPENDIX A
HYDROLOGIC ANALYSIS
City of Greenville – Swift Creek Watershed Master Plan Page A‐2
WK Dickson & Co., Inc.
Table A‐1 lists the different systems and the modeling methodology applied to each system.
Table A‐1: Project Area Model Selection Project Area Model Selection
Swift Creek Primary System HEC‐HMS
SCUT1 Primary System HEC‐HMS
Gum Swamp Primary System HEC‐HMS
Davenport Farm Road System SWMM
Watershed Delineation and Connectivity
Watersheds were delineated for the Primary Systems and the secondary system utilizing digital
LiDAR data available from the State of North Carolina and the stormwater inventory. The
preliminary watersheds were created using automated procedures in a GIS platform and then
adjusted as necessary based on the conveyance system and known ridge lines. Each flood
control project watershed for the Primary Systems was subdivided into sub‐watersheds selected
at hydrologically and hydraulically significant points, such as major roadway crossings, stream
convergences, known problem areas, etc. Each sub‐watershed for the secondary systems was
selected as the area that drained to each inlet modeled on the secondary system. Forty‐three (43)
sub‐watersheds were delineated for the Primary Systems ranging in size from 14 to 876 acres.
Sub‐watersheds were delineated as necessary for the secondary systems to accurately model the
hydraulics of the system. The watershed maps included in Appendix C illustrate the sub‐
watershed and hydrologic connectivity for the primary system.
Soils
The NRCS curve number method uses basin characteristics, such as soil types and land use,
to compute the runoff response. The infiltration rate of a soil influences the volume of
surface runoff that results from given storm events. Soils with high infiltration rates produce
lower runoff than soils with lower infiltration rates. The Soil Conservation Service has
prepared soil maps for Pitt County that identify four primary soil groups. This data is
available digitally and was obtained for the City of Greenville.
The groups (A, B, C, and D) correspond to decreasing rates of infiltration. A general
description of the four soil groups taken from the USDA, SCS, NEH‐4 (1972) is presented in
Table A‐2.

APPENDIX A
HYDROLOGIC ANALYSIS
City of Greenville – Swift Creek Watershed Master Plan Page A‐3
WK Dickson & Co., Inc.
Table A‐2: Hydrologic Soils Groups
Soil Group Description
A
Group A soils have high infiltration rates even when thoroughly wetted and consist
chiefly of deep, well to excessively drained sand or gravels. These soils have a high
rate of water transmission (greater than 0.3 inches per hour).
B
Group B soils have moderate infiltration rates even when thoroughly wetted and
consist chiefly of moderately deep to deep, moderately well to well drained soils
with moderately fine to moderately coarse texture. These soils have a moderate rate
of water transmission (0.15 to 0.3 inches per hour).
C
Group C soils have slow infiltration rates when thoroughly wetted and consist
chiefly of soils with a layer that impedes downward movement of water, or soils
with moderately fine to fine texture. These soils have a slow rate of water
transmission (0.5 to 0.15 inches per hour).
D
Group D soils have a very slow infiltration rate when thoroughly wetted and
consist chiefly of clay soils with a high swelling potential, soils with a permanent
high water table, soils with a clay pan or clay layer at or near the surface, and
shallow soils over nearly impervious material. These soils have a very slow rate of
water transmission (0 to 0.05 inches per hour).
A/D
B/D
The first letter applies to the drained condition and the second to the undrained
condition. For the purpose of hydrologic soil group, adequately drained means that
the seasonal high water table is kept at least 60 centimeters (24 inches) below the
surface.
Soils within the watershed are predominantly NRCS hydrologic soil groups C soils, although
seven (6) different hydrologic soil groups are represented in some quantity in the Swift
Creek watershed (See Table A‐3 and Appendix C).
Table A‐3: Area Distribution of Hydrologic Soil Groups
Soil Group Total Area (acre) Percent of Total Area
A 78 2%
B 954 23%
C 1,734 42%
D 970 24%
A/D 12 < 1%
B/D 345 8%
Water cover makes up the remaining one (1) acre of the Swift Creek Watershed.

APPENDIX A
HYDROLOGIC ANALYSIS
City of Greenville – Swift Creek Watershed Master Plan Page A‐4
WK Dickson & Co., Inc.
Land Use
Land use is the watershed cover condition as it relates to the actual type of development and
zoning within the watershed. Land use influences the runoff characteristics of a watershed,
and combined with other basin characteristics, is used to determine the SCS curve number
for the basin.
The existing zoned land uses for the Swift Creek Watershed were provided by the City of
Greenville. These zoning maps were used to develop peak flows for the watershed. Twelve
(12) land use categories were delineated within the Swift Creek Watershed based on the
information provided and field observation of the current uses (See Appendix C).
In its entirety, the Swift Creek Watershed covers an area of approximately 4,100 acres
(6.4square miles). Land use in the watershed is about 55 percent built out as shown on the
Existing Conditions Land Use Map included in Appendix C. Percentages of each existing
and future land use groups and the correlating acreage are listed in Table A‐4 below.
Table A‐4: Swift Creek Watershed Land Use
Existing Future
Land Use Category Area
(acres)
Percent of
Basin Area
Area
(acres)
Percent of
Basin Area
Right‐of‐Way 289 7% 289 7%
Industrial 4 < 1% 4 < 1%
Commercial 151 4% 303 7%
Mixed Use/Office/Institutional 425 10% 411 10%
Office/Institutional/Medical 22 1% 20 < 1%
Office/Institutional/Multi‐Family 100 2% 100 2%
High Density Residential 142 3% 252 6%
Medium Density Residential 374 9% 488 12%
Low Density Residential 553 14% 482 12%
Very Low Density Residential 243 6% 1,521 37%
Conservation/Open Space 584 14% 224 5%
Agricultural/Cropland 1,207 29% ‐ ‐

APPENDIX A
HYDROLOGIC ANALYSIS
City of Greenville – Swift Creek Watershed Master Plan Page A‐5
WK Dickson & Co., Inc.
NRCS Curve Numbers
The NRCS curve number approach was used in computing the runoff response. Runoff
curve numbers (RCNs) were generated by using the NRCS document entitled Urban
Hydrology for Small Watersheds, dated June 1986 and commonly referred to as TR‐55. This
method relates the drainage characteristics of the hydrologic soil group, land use category,
and antecedent moisture conditions (AMC) to a runoff curve number. The runoff curve
number and an estimate of the initial surface moisture storage capacity are used to calculate
a total runoff depth for a storm in a basin.
The AMC refers to the total rainfall in a 5‐day period preceding a storm and relates to the
soil moisture condition at the beginning of the storm event. The AMC value can be used as a
calibration tool in the hydrologic computations where AMC‐1 represents ʺdryʺ conditions
and AMC‐3 represents ʺwetʺ conditions. The average antecedent moisture conditions (AMC‐
2) are generally considered most representative for the humid southeastern portion of the
country and were used for the hydrologic calculations in this study.
Runoff curve numbers were determined for each sub‐basin based on the soil group, land use,
and average antecedent moisture condition for the area. The curve numbers calculated for
this study are listed in Table A‐5 below.
Table A‐5: Curve Numbers Based on Land Use and Soil Groups
Land Use Category Soil Group
A B C D
Commercial 89 92 94 95
Conservation/Open Space/Agricultural* 49 69 79 84
Open Space, Good Condition 39 61 74 80
Very Low Residential 49 69 79 84
Low Density Residential 51 68 79 84
Medium Density Residential 54 70 80 85
High Density Residential 61 75 83 87
Office/Institutional/Multifamily 77 85 90 92
Right‐of‐Way 83 89 92 93 *Assumed fair condition
For each sub‐basin, the curve number was determined and weighted by area to calculate the
composite curve number for each sub‐basin. A summary of the hydrologic input data for the
Primary Systems, including the runoff curve numbers, is shown in Table A‐6. The detailed
calculations are included in Appendix E (runoff curve numbers) and Appendix F (times of
concentration).

APPENDIX A
HYDROLOGIC ANALYSIS
City of Greenville – Swift Creek Watershed Master Plan Page A‐6
WK Dickson & Co., Inc.
Table A‐6: Summary of Hydrologic Input Data Drainage Basin
ID
Drainage Area
(acre)
Existing
RCN
Future
RCN
Lag Time*
(minutes)
GS‐1A 102.5 71 77 90
GS‐1B 152.0 72 81 225
GS‐1C 321.8 76 81 300
GS‐1D 64.3 78 78 20
GS‐2A 292.1 77 80 210
GS‐2B 43.9 82 85 30
GS‐2C 36.8 77 78 20
GS‐3 82.4 80 80 55
GS‐4A 48.3 82 82 30
GS‐4B 74.3 82 82 120
GS‐4C 63.3 80 80 120
GS‐4D 84.9 78 78 150
GS‐4E 33.5 79 79 60
GS‐5A 97.2 73 76 150
GS‐5B 30.5 81 81 20
GS‐5C 26.0 83 83 15
GS‐5D 86.5 81 81 120
GS‐6 106.7 74 76 120
SC‐1A 98.6 84 85 240
SC‐1B 65.1 74 78 60
SC‐1C 129.2 74 92 150
SC‐1D 100.1 75 80 240
SC‐1E 111.5 82 82 120
SC‐2A 102.3 75 90 180
SC‐2B 58.2 81 81 20
SC‐3A 55.5** 66 73 180
SC‐3B 62.0 78 79 50
SC‐3C 34.8 79 80 40
SC‐4 107.6 77 77 45
SC‐5A 22.5 82 82 27
SC‐5B 49.2 80 76 65
SC‐6 876.5 80 80 125
SCUT‐1A 46.0 80 80 46
SCUT‐1B 47.0 71 76 92
SCUT‐1C 35.1 79 79 24
SCUT‐1D 41.2 76 88 113
SCUT‐2 29.1 86 86 90
SCUT‐3 59.8 84 84 51
SCUT‐4A 166.0 89 88 86
SCUT‐4B 31.0 89 91 10
SCUT‐4C 34.4 84 91 30
SCUT‐4D 26.3 87 87 18
SCUT‐5 39.5 87 87 35

APPENDIX A
HYDROLOGIC ANALYSIS
City of Greenville – Swift Creek Watershed Master Plan Page A‐7
WK Dickson & Co., Inc.
Rainfall
Rainfall distributions for Greenville are derived using the NRCS Type III standard
distribution. Total rainfall volumes for the modeled frequency storms were based on data
published on the NOAA website, http://hdsc.nws.noaa.gov/hdsc/pfds/orb/nc_pfds.html.
Table A‐7 shows the total rainfall volumes used for this study based on precipitation data
collected in Greenville, North Carolina
Table A‐7: Design Storm Rainfall Depths
Design Storm Rainfall Depth (in)
2‐year, 24‐hour 3.76
10‐year, 24‐hour 5.81
25‐year, 24‐hour 7.23
50‐year, 24‐hour 8.47
100‐year, 24‐hour 9.84
While the depth‐duration‐frequency curves are calculated based on real rainfall data, the
rainfall data used for the SWMM and HEC‐HMS models represent the Type III synthetic
rainfall distribution. Actual runoff is based on several factors including rainfall intensity,
duration and the antecedent moisture conditions of the watershed.
Hydrograph Translation
The lag time, as defined by the NRCS for use in the NRCS dimensionless unit hydrograph
method, is the time, or lag, between the center of mass of rainfall excess and the peak of the
unit hydrograph. The lag time is based on the sub‐watershed time of concentration, or travel
time, and is a function of the sub‐watershed size, shape, slope, cover, and other basin
characteristics. For the NRCS method, the sub‐watershed lag time is calculated to be 0.6
times the time of concentration for each sub‐watershed.
The times of concentration for the sub‐watersheds were calculated from the methodology
described in TR‐55. A summary of the calculations is shown in Appendix F. The longest
flow path is divided into three types of flow; overland flow, shallow concentrated flow, and
channel flow. A spreadsheet was developed to tabulate the incremental travel times for each
type of flow for each sub‐basin. The incremental travel times were totaled and multiplied by
0.6 to compute the lag time for each sub‐basin. The equation detailing the travel time for
sheet flow is as follows:
Tt = Travel Time in hours
n = Manning Roughness Coefficient (Paved=0.011, Unpaved=0.24)
Tt = .007 (nL) 0.8
(P2) 0.5 s0.4

APPENDIX A
HYDROLOGIC ANALYSIS
City of Greenville – Swift Creek Watershed Master Plan Page A‐8
WK Dickson & Co., Inc.
L = flow length in feet
P2 = 2‐year, 24 hour rainfall = 3.76 inches
S = slope of hydraulic grade line (land slope in ft/ft)
For shallow concentrated flow, the velocity (V) is calculated for either paved or unpaved
sections by using the following equations:
Unpaved V = 16.1345 (S)1/2
Paved V = 20.3282 (S)1/2
The travel time for shallow flow is then calculated by dividing the flow length (L in feet) by
velocity as follows:
Tt = Travel Time = L / (3600*V)
The open channel travel times are determined by a modified version of the Manning
equation, which is as follows:
V = Average full‐flow velocity (ft/s)
R = Hydraulic radius (ft)
S = Slope of hydraulic grade line (ft/ft)
n = Manning roughness coefficient
Instead of a time of concentration parameter, the SWMM model uses a watershed width
parameter to create the unit hydrograph used in the model that will translate the rainfall into
runoff. The watershed width is a parameter unique to SWMM that typically represents the
watershed area divided by the longest flow path. The width parameter is typically
calibrated to flow gauge data, if available. The Swift Creek Watershed lacks flow gauge
data, so the peak flows from SWMM were compared to flows developed using the Rational
Method. Based on the flow comparison, the watershed widths for each basin were increased
in some instances to produce reasonable flows. Increasing the watershed width parameters
is not an uncommon practice for calibrating models for areas with gradual slopes and
moderate conveyance systems.
V = 1.49 R 2/3 S 0.5
n

APPENDIX A
HYDROLOGIC ANALYSIS
City of Greenville – Swift Creek Watershed Master Plan Page A‐9
WK Dickson & Co., Inc.
Channel Elements
Flood peaks attenuate, or reduce, as they travel downstream due to the storage characteristic
of the stream reach. The Muskingum‐Cunge routing method in HEC‐HMS was selected to
define the storage characteristic of selected stream reaches in the Swift Creek Watershed. It
can be described as a hydrologic routing method based on physical parameters of the
channel and floodplain. Input data for this method consists of representative
channel/floodplain sections, reach length, Manningʹs roughness coefficient, and channel bed
slope. This method provides advantages over other hydrologic techniques based on the
relative size and slope of the channels and floodplains in the watershed.
Structure and Pond Routing
Reservoir storage routing was used for routing hydrographs through the storage areas
upstream from undersized structures (culverts). HEC‐HMS is able to model the effects of an
undersized culvert through inputs defining the relationship between water volume or area
and elevation and the relationship between outflow and water surface elevations. The
relationship between outflow and water surface elevations is developed using an iterative
process between HEC‐HMS and HEC‐RAS. A rating curve generated using HEC‐RAS
defines the outflow of the water leaving this system.
Structures having fill heights greater than or equal to 50% of the height of the structure were
assumed to provide significant peak flow attenuation and, therefore, were routed in the
HEC‐HMS model. In addition, any structure which exhibited significant upstream
floodplain storage or significant backwater from the HEC‐RAS model output would be
analyzed for providing peak flow attenuation.
For each structure, the cutoff point in the backwater pool was determined where the
structure routing ends and upstream channel routing begins. This determination was
necessary so that available storage areas calculated for channel and structure routing did not
overlap. The following procedure was used for this determination:
The approximate limit of the 100‐year frequency flood backwater pool was delineated
in the topographic map.
The distance from the upstream face of the structure to the upstream limit of the pool
was measured.
From the upstream end of the backwater pool, a distance equal to 20% of the total
pool length was measured in the downstream direction and the point marked on the
topographic map.
Through this point a line was drawn perpendicular to the contour lines.
This line was then designated as the cutoff point to be used as the upstream limit of
the channel routing.

APPENDIX A
HYDROLOGIC ANALYSIS
City of Greenville – Swift Creek Watershed Master Plan Page A‐10
WK Dickson & Co., Inc.
For each structure, the elevation‐storage relation for the Modified Puls method was derived
by calculating the surface area of the topographic contours from the upstream face of the
structure to the routing cutoff point associated with the structure. A pair of “SA” (storage
area) – “SE” (elevation) records, the elevation‐storage relation for each structure was input
from the delineated information. To avoid interpolating storage areas for each stage‐
discharge point, a separate stage‐discharge relation was entered into the HEC‐HMS model
on a pair of “SQ” (discharge) – “SE” (elevation) records based on the HEC‐RAS model
output.
However, the method described in the previous paragraph does not account for the
reduction in tailwater on the structure due to the attenuation effects of the upstream storage,
which in turn can affect the stage‐discharge relation of the structure. Therefore, an iterative
process for storage structures was followed with an objective to obtain a set of peak
discharge values, runoff volumes, and water surface elevations that are “balanced” between
the two models. The process was initiated by inputting a set of discharges into the HEC‐RAS
model to develop a set of discharge‐storage relations for each reach. This initial set of
relations was input into the HEC‐HMS model. These values were supplemented by the
depth‐storage relation for each structure.
The HEC‐HMS model was run with these values to derive new discharges at downstream
locations. These new values were input into the HEC‐RAS model and it was recomputed.
The new discharges and water surface elevations listed in the HEC‐HMS summary output
were compared with the discharges listed in the previous HEC‐RAS run. When the values
stabilized, the model was considered “balanced”. If not then additional iterations were
performed. Typically, three iterations are adequate to derive a balanced model.
Summary of Hydrologic Model Results
The HEC‐HMS model was used to compute peak runoff for the 2‐, 10‐, 25‐, 50‐ and 100‐ year
design storms for the existing conditions.
The results of the hydrologic model are summarized in Table A‐8. The HEC‐HMS input and
output are included in Appendix H. Additionally, a CD is included in Appendix J and
contains the digital files for the HEC‐HMS model.

APPENDIX A
HYDROLOGIC ANALYSIS
City of Greenville – Swift Creek Watershed Master Plan Page A‐11
WK Dickson & Co., Inc.
Table A‐8: Existing Conditions Flows from HEC‐HMS for Swift Creek Watershed
HEC‐HMS
Node
Road Name /
Location
HEC‐
RAS
Station
Storm Event
2‐year
(cfs)
10‐year
(cfs)
25‐year
(cfs)
50‐year
(cfs)
100‐year
(cfs)
SWIFT CREEK
U/S Limit SC Upstream Limit of
Swift Creek 241994 122 249 342 426 520
Thomas
Langston – SC
Thomas Langston
Road 239601 173 358 496 620 754
Sterling Trace
Drive
Sterling Trace
Drive 237845 189 416 628 805 993
SWIFT CREEK UT1
U/S Limit SCUT Upstream Limit of
SCUT1 4495 67 138 190 236 288
Thomas
Langston –
SCUT
Thomas Langston
Road 3997 68 145 203 253 309
Belfair Drive Belfair Drive 3015 84 163 220 283 351
Sterling Pointe
Drive
Sterling Pointe
Drive 1635 123 239 315 412 514
GUM SWAMP
U/S Limit GS Upstream Limit of
Gum Swamp 9293 76 160 223 280 345
Frog Level Road Frog Level Road 7759 172 368 513 660 825
Comparison of Peak Flows
For comparison purposes, flood peaks were estimated using the U.S. Geological Survey
(USGS) publication entitled ʺThe National Flood‐Frequency Program – Methods for
Estimating Flood Magnitude and Frequency in Rural and Urban Areas in North Carolina –
USGS Fact Sheet 007‐00” (2001) at key locations within the watershed. Table A‐9 compares
the peak flows determined from the USGS regional regression equations the Coastal‐Plain
region versus the peak flows from HEC‐HMS. Additional, the peak flows from HEC‐HMS
were also compared to available FEMA flows.

APPENDIX A
HYDROLOGIC ANALYSIS
City of Greenville – Swift Creek Watershed Master Plan Page A‐12
WK Dickson & Co., Inc.
Table A‐9: Comparison of Existing Conditions Peak Flows
Methodology Location 2‐Year
(cfs)
10‐Year
(cfs)
25‐Year
(cfs)
50‐Year
(cfs)
100‐Year
(cfs)
SWIFT CREEK
HEC‐HMS
Thomas Langston
Drive 173 358 496 620 754
Sterling Trace
Drive 189 416 628 805 993
USGS – Regional
Regression Equations:
Urban Coastal Plains
(2001)
Thomas Langston
Drive 331 733 1,060 1,236 1,404
Sterling Trace
Drive 363 792 1,138 1,325 1,503
FEMA Flows
Thomas Langston
Drive ‐ 314 ‐ 594 750
Sterling Trace
Drive ‐ 433 ‐ 806 1,010
SCUT1
HEC‐HMS
Thomas Langston
Drive 68 145 203 253 309
Belfair Drive 84 163 220 283 351
Sterling Pointe Drive 123 239 315 412 514
USGS – Regional
Regression Equations:
Urban Coastal Plains
(2001)
Thomas Langston
Drive 54 161 272 333 397
Belfair Drive 90 245 396 477 559
Sterling Pointe Drive 126 323 504 601 696
GUM SWAMP
HEC‐HMS Frog Level Road 172 368 513 660 825
USGS – Regional
Regression Equations:
Urban Coastal Plains
(2001)
Frog Level Road 311 716 1,051 1,241 1,427
FEMA Flows Frog Level Road ‐ ‐ ‐ ‐ 841

Appendix B:
Hydraulic Analysis

APPENDIX B
HYDRAULIC ANALYSIS
City of Greenville – Swift Creek Watershed Master Plan Page B‐1
WK Dickson & Co., Inc.
The purpose of the hydraulic modeling analysis is to determine an existing level of flooding
for the stormwater drainage network and to develop proposed solutions to mitigate
flooding, on both the primary systems and the secondary systems. Three different modeling
methodologies were used depending on the complexity and location of the conveyance
system. For the primary systems comprised of Swift Creek, SCUT1, and Gum Swamp, the
Hydrologic Engineering Center River Analysis System (HEC‐RAS) was used for hydraulic
modeling. For the secondary system, SWMM was the selected model due to the complex
nature of the system. Table B‐1 lists the project areas that were modeled using each
approach.
Table B‐1: Project Area Model Selection
Project Area Model Selection
Swift Creek Primary System HEC‐RAS
SCUT1 Primary System HEC‐RAS
Gum Swamp Primary System HEC‐RAS
Davenport Farm Road System SWMM
HEC‐RAS Model
The HEC‐RAS model calculates water surface profiles for steady, gradually varied flow, both
sub‐critical and supercritical, for user‐specified discharges. The standard step backwater
analysis for sub‐critical flow was modeled for the Swift Creek, SCUT1, and Gum Swamp
Primary System. The model calculates the effect of obstructions, such as culverts, and
building structures in the channel and floodplain on the water surface profile. The hydraulic
computations are based on the solution of a one‐dimensional energy equation with energy
loss due to friction evaluated by Manningʹs equation.
Input data for the HEC‐RAS computer model includes the following:
Cross‐section geometry of the channel and floodplain.
Roughness coefficients to describe the characteristics of the channel and floodplain.
Size, shape, and characteristics of culverts and roadways along the stream reach.
Energy loss coefficients for flow in the channel and at roadway crossings.
Primary System Study Limits
As discussed with City of Greenville stormwater staff, study limits for the hydraulic
evaluation of the primary systems include the segment of Swift Creek from approximately
2,400 feet upstream of Thomas Langston Road crossing at the upstream end to its confluence
with an unnamed tributary to Swift Creek (referred to as SCUT1); Swift Creek UT1 from
approximately 650 feet upstream of Thomas Langston Road crossing at the upstream end to
its confluence with Swift Creek at the downstream end; and Gum Swamp from to
approximately 1,600 feet upstream of the Frog Level Road crossing at the upstream end to
approximately 1,500 feet upstream of its confluence with Swift Creek at the downstream end.

APPENDIX B
HYDRAULIC ANALYSIS
City of Greenville – Swift Creek Watershed Master Plan Page B‐2
WK Dickson & Co., Inc.
Stormwater Inventory
For the Swift Creek Watershed Master Plan, stormwater utility infrastructure throughout the
watershed was collected by WK Dickson personnel to compile a Geographic Information
System (GIS) stormwater inventory database for the City. This was accomplished by using
Global Positioning Systems (GPS) as the primary means of data capture. WK Dickson
employed survey grade GPS to locate the x, y, and z coordinates of each visible stormwater
system structure and conventional surveying techniques to obtain other attributes including
but not limited to size, material, slope, and length. Additionally, attributes were also
collected for select streams and open channel. Data was obtained for those streams and open
channels required to complete connectivity for modeling purposed. The data was collected
using horizontal datum NAD 1983 and vertical datum NAVD 1988
Attributes collected as part of the inventory were used to populate the various models. Field
visits and digital photographs for each structure and channel were used to estimate the
roughness coefficients and energy loss coefficients. The topographic data used for the Swift
Creek Watershed Master Plan was the State of North Carolina’s LiDAR data.
Cross Sections
Cross sections utilized in the HEC‐RAS model were based on the existing FEMA cross
sections (where available). These surveyed cross sections were augmented with additional
cross sections surveyed by WK Dickson. The surveyed cross section points were than
merged with the digital elevation model based on the LiDAR data. Cross sections were
located perpendicular to the flow and at intervals along the stream to characterize the flow
capacity of the channel and floodplain for the primary system. Along stream reaches where
the shape, size, and geometry of the cross‐section are varying, cross sections were cut at
closer intervals than for reaches having little change in channel characteristic. Additional
sections were cut as required by the HEC‐RAS program to sufficiently model structures such
as culverts.
Surveyed cross sections are identified by station number, which for the HEC‐RAS model,
refers to the approximate linear distance upstream from a reference point on the main
channel or tributary reach. The cross sections depict the locations of cut sections from field
topographic surveys. Similarly, the cross section at each road crossing represents the top‐of‐
road cross section. The cross sections just upstream and just downstream of highest point of
roadway (commonly referred to as the weir) represent the locations of the upstream and
downstream faces, respectively, of the bridge or culvert in an area not impacted by roadway
fill.

APPENDIX B
HYDRAULIC ANALYSIS
City of Greenville – Swift Creek Watershed Master Plan Page B‐3
WK Dickson & Co., Inc.
Roughness Coefficients
Manning’s roughness coefficients, or ʹnʹ values, represent the resistance to flow and influence
the flow capacity of channels and floodplains. The HEC‐RAS model uses these coefficients to
compute friction loss longitudinally in the channel and floodplain. The roughness value is a
function of the type and density of the vegetation, channel bottom and stream bank material,
degree of channel meandering, and depth of flow.
Roughness coefficients were determined for all stream reaches for which hydraulic analyses
were performed. The “horizontal variation in n‐values” option was enabled to allow for
correct modeling of the widely varied surfaces on a given cross‐section. The right or left
bank of the stream is referenced facing downstream. Roughness coefficients used in this
study are listed in Table B‐2.
Table B‐2: Roughness Coefficients
All roughness coefficients were estimated through field observation and by referencing
standard engineering manuals.
Culvert and Roadway Data
Culverts generally have different characteristics than the channel and floodplains away from
roadway crossings. Often culverts constrict flood flows in the channel and floodplain, which
may create backwater effects upstream of the structure. The constriction can produce
increased velocities and result in localized scour.
For culvert analysis, the HEC‐RAS model utilizes the concepts of ʺinletʺ control and ʺoutletʺ
control to simplify complicated culvert hydraulics. Inlet control flow occurs when the flow
carrying capacity of the culvert entrance is less than the flow capacity of the culvert barrel.
Outlet control flow occurs when the culvert carrying capacity is limited by downstream
conditions or by the flow capacity of the culvert barrel.
During inlet control computations, the culvert inlet acts as either a weir or an orifice, and the
resulting headwater is computed. The equations used by HEC‐RAS are the same as those
developed by the Federal Highway Administration during extensive laboratory testing,
which describe the inlet control headwater under various conditions.
For outlet control flow conditions, the required headwater is computed considering various
conditions. For culverts flowing full, a form of the Bernoulli Equation, which considers
Location Range of ‘n’ values
Main Channel 0.04 ‐ 0.06
Left Overbank 0.045 ‐ 0.15
Right Overbank 0.06‐ 0.15

APPENDIX B
HYDRAULIC ANALYSIS
City of Greenville – Swift Creek Watershed Master Plan Page B‐4
WK Dickson & Co., Inc.
friction losses, entrance losses and exit losses is utilized. Friction losses are based on
Manningʹs equation. Entrance losses are computed as a coefficient times the velocity head in
the culvert at the upstream end. Exit losses are computed as a coefficient times the change in
velocity head from just inside the culvert (at the downstream end) to outside the culvert.
When the culvert is not flowing full, the direct step backwater procedure is used to calculate
the profile through the culvert up to the culvert inlet. An entrance loss is then computed and
added to the energy inside the culvert to obtain the upstream headwater. Culvert input data
for the HEC‐RAS model include:
Shape and dimensions of the structure openings;
Culvert length;
Entrance loss coefficient, exit loss coefficient and coefficient of discharge for weir flow
during roadway overtopping;
Upstream and downstream invert elevations;
Federal Highway Administration chart number for the culvert type;
Top‐of‐road elevations to describe the weir during roadway overtopping and the
weir crest length; and
Four cross sections are required; one cross section sufficiently downstream of the
culvert that flow is not affected by the culvert, one at the downstream end of the
culvert, one at the upstream end of the culvert, and one located far enough upstream
that the culvert has no effect on flow.
Energy Loss Coefficients
Contraction and expansion of flow produces energy losses caused by the transition. The
magnitude of these losses is related to the velocity and the estimated loss coefficient. Where
the transitions are gradual, the losses are small. At abrupt changes in cross‐sectional area, the
losses are higher. Energy losses resulting from expansion are greater than losses associated
with contraction. Energy loss coefficients used for the Swift Creek Watershed hydraulic
models are presented in Table B‐3.
Table B‐3: Energy Loss Coefficients
Type of Transition Expansion Contraction
None 0 0
Gradual 0.3 0.1
Culvert sections 0.5 0.3

APPENDIX B
HYDRAULIC ANALYSIS
City of Greenville – Swift Creek Watershed Master Plan Page B‐5
WK Dickson & Co., Inc.
Starting Water Surface Elevation
The starting water surface elevations for the Swift Creek, SCUT1, and Gum Swamp HEC‐
RAS models were calculated using the slope‐area method, which is based on normal depth.
The calculated slopes are as follows:
0.003 feet/feet for Swift Creek Main Branch
0.004 feet/feet for Swift Creek UT1
0.0026 for feet/feet for Gum Swamp
Model Run Descriptions and Assumptions
The HEC‐RAS model was used to compute flood elevations at each cross‐section for the
Swift Creek, SCUT1, and Gum Swamp Primary Systems for the 2‐, 10‐, 25‐, 50‐ and 100‐year
floods. A hard copy of the HEC‐RAS input and output is included in Appendix H, while a
digital copy of the input and output is located on the CD in Appendix J.
The hydraulic analysis for this study is based only on the condition of unobstructed flow.
Therefore, flood elevations shown on the profiles are considered valid only if hydraulic
structures remain unobstructed and do not fail. Flood elevations may be raised by debris
blockage of the culvert, channel, or floodplain.
Model Validation
Efforts were made to verify the models for various storm events. Feedback obtained from
the questionnaires was reviewed for relevant information that could be used to verify the
model. The comments and responses received were not specific enough to verify the model.
Likewise, the information received during the public meetings was not useful for the
purposes of verifying the models. The City Staff was able to provide some feedback that
was useful during the model validation process.
During the validation process, the flows and water surface elevations initially calculated
were determined to be significantly higher than the FEMA flow and base flood elevations.
Furthermore, the results from the initial existing conditions model were not aligned with
some of the feedback received from the City. The flows were calibrated to get results to
more closely match FEMA flows, USGS Regional Regression flows, and City feedback.
Open Channel Systems and Roadway Flooding
Six (6) roadway crossings were analyzed for flooding potential in the Swift Creek Watershed
Master Plan. All roadway crossings that were analyzed in this study are listed in Tables B‐4a‐
B‐4c along with the minimum top‐of‐road elevations and the 2‐, 10‐, 25‐, 50‐ and 100‐year
flood elevations at the crossing for existing and proposed conditions.

APPENDIX B
HYDRAULIC ANALYSIS
City of Greenville – Swift Creek Watershed Master Plan Page B‐6
WK Dickson & Co., Inc.
Table B‐4a: Overtopping Analysis of Roadway Crossings – Existing Conditions
Location
Minimum
Elevation at
Top of Road
(feet NAVD)
Desired
Level of
Service
(Year)
Calculated Water Surface Elevations (feet NAVD)
2‐year
flood
10‐year
flood
25‐year
flood
50‐year
flood
100‐year
flood
SWIFT CREEK
Thomas Langston Road
(Culvert) 67.48 25‐year 64.13 67.61 68.16 68.43 68.65
Sterling Trace Drive
(Culvert) 62.53 25‐year 62.28 63.25 63.57 63.80 63.95
SWIFT CREEK UT1
Thomas Langston Road
(Culvert) 66.81 25‐year 65.97 67.36 67.53 67.66 67.76
Belfair Drive (Culvert) 64.81 25‐year 62.59 64.50 65.33 65.79 66.04
Sterling Pointe Drive
(Culvert) 60.71 25‐year 60.47 61.74 62.07 62.26 62.40
GUM SWAMP
Frog Level Road
(Culvert) 65.11 25‐year 62.70 64.96 65.31 65.46 65.63
*Bold text indicates the existing water surface has exceeded the crest or low point in the road thereby causing flooding.
** Green shade indicates crossing meets desired level of service. Red shade indicates crossing does not meet desired level of service.
Table B‐4b: Overtopping Analysis of Roadway Crossings – Alternative #1
Location
Minimum
Elevation at
Top of Road
(feet NAVD)
Desired
Level of
Service
(Year)
Calculated Water Surface Elevations (feet NAVD)
2‐year
flood
10‐year
flood
25‐year
flood
50‐year
flood
100‐year
flood
SWIFT CREEK
Thomas Langston Road
(Proposed 10’ x 6’ RCBC
with Floodplain
Benching)
67.48 25‐year 63.12 65.90 66.44 67.78 68.19
Sterling Trace Drive
(Proposed Twin 10’ x 6’
RCBCs with Floodplain
Benching)
62.53 25‐year 60.09 61.30 62.17 62.84 63.19
SWIFT CREEK UT1
Thomas Langston Road
(Existing 42” RCP and
Proposed Twin 42”
Floodplain Culverts and
Benching)
66.81 25‐year 63.65 64.94 66.03 67.08 67.36
Belfair Drive
(Proposed Twin 6’ x 4’
RCBC)
64.81 25‐year 62.41 63.63 64.59 65.17 65.61

APPENDIX B
HYDRAULIC ANALYSIS
City of Greenville – Swift Creek Watershed Master Plan Page B‐7
WK Dickson & Co., Inc.
Location
Minimum
Elevation at
Top of Road
(feet NAVD)
Desired
Level of
Service
(Year)
Calculated Water Surface Elevations (feet NAVD)
2‐year
flood
10‐year
flood
25‐year
flood
50‐year
flood
100‐year
flood
Sterling Pointe Drive
(Proposed Twin 11’ x 4’
RCBCs with Floodplain
Benching)
60.71 25‐year 58.85 59.90 60.54 61.04 61.46
GUM SWAMP
Frog Level Road
(Proposed Twin 7’ x 6’
RCBC with Floodplain
Benching)
65.11 25‐year 62.04 63.64 64.56 65.18 65.41
*Bold text indicates the existing water surface has exceeded the crest or low point in the road thereby causing flooding.
** Green shade indicates crossing meets desired level of service. Red shade indicates crossing does not meet desired level of service.
Table B‐4c: Overtopping Analysis of Roadway Crossings – Alternative #2
Location
Minimum
Elevation at
Top of Road
(feet NAVD)
Desired
Level of
Service
(Year)
Calculated Water Surface Elevations (feet
NAVD)
2‐year
flood
10‐year
flood
25‐year
flood
50‐year
flood
100‐year
flood
SWIFT CREEK
Thomas Langston Road
(Proposed 10’ x 6’ RCBCs
with Detention Ponds)
67.48 25‐year 62.56 64.73 66.46 67.76 68.17
Sterling Trace Drive
(Proposed Twin 10’ x 6’
RCBCs with Reduced
Floodplain Benching and
Detention Ponds)
62.53 25‐year 60.10 61.41 62.21 62.90 63.24
SWIFT CREEK UT1
Thomas Langston Road
(Existing 42” RCP with
Detention Pond)
66.81 25‐year 64.24 65.20 65.81 66.44 67.05
Belfair Drive
(Existing Twin 48” RCPs
with Detention Pond)
64.81 25‐year 61.52 62.42 62.95 63.39 64.02
Sterling Pointe Drive
(Proposed Twin 10’ x 4’
RCBCs with Detention
Pond)
60.71 25‐year 59.27 60.18 60.68 61.02 61.35
GUM SWAMP – NO ALTERNATIVE #2*Bold text indicates the existing water surface has exceeded the crest or low point in the road thereby causing flooding.
** Green shade indicates crossing meets desired level of service. Red shade indicates crossing does not meet desired level of service.

APPENDIX B
HYDRAULIC ANALYSIS
City of Greenville – Swift Creek Watershed Master Plan Page B‐8
WK Dickson & Co., Inc.
SWMM
SWMM is a dynamic rainfall‐runoff model capable of modeling the hydrologic response of a
watershed and hydraulic routing throughout a stormwater conveyance system. The model
calculates the effect of backwater, flat or negative slopes, energy losses, and minor
headlosses associated with bends, entrances and exits.
Input data for the EPA SWMM (hydraulics) computer model include the following:
Conveyance pipes including structure inverts, pipe sizes and lengths;
Open channel cross section geometries;
Roughness coefficients for pipes and channels;
Energy loss coefficients for flow in the pipes and channels;
Storage rating curves; and
Overland flow characteristics.
SWMM provides an accurate evaluation of the existing and proposed conditions because it
combines hydrology and hydraulics while accounting for the routing effects of the channel
and overbank storage areas. Because hydrology and hydraulics are combined, changes to
peak flows or water surface elevations resulting from proposed modifications to the existing
channels or culverts are calculated in the model in one step. Additionally, changes to flows
from proposed pipes and channel improvements are seen both upstream and downstream,
reducing the potential for a stormwater system having increased flooding downstream.
Energy Loss Coefficients
Contraction and expansion of flow produces energy losses caused by the transition. The
magnitude of these losses is related to the velocity and the estimated loss coefficient. Where
the transitions are gradual, the losses are small. At abrupt changes in cross‐sectional area, the
losses are higher. Energy losses resulting from expansion are greater than losses associated
with contraction. Energy loss coefficients used for the hydraulic SWMM models are
presented in Table B‐5 below:
Table B‐5: Energy Loss Coefficients for SWMM Models
Type of Transition Expansion Contraction
None 0 0
Manhole/Inlet 0.7 0.5
Open Channel 1 0.5–Headwall/ 0.9 ‐ Projecting

APPENDIX B
HYDRAULIC ANALYSIS
City of Greenville – Swift Creek Watershed Master Plan Page B‐9
WK Dickson & Co., Inc.
Additional energy losses for structures having bends were divided between the two joining
pipes. The bend losses used for this project are based on NCDOT values, and are shown
below in Table B‐6.
Table B‐6: Bend Loss Coefficients
Angle (°) Loss Coefficient Angle (°) Loss Coefficient
90 0.70 40 0.38
80 0.66 30 0.28
70 0.61 25 0.22
60 0.55 20 0.16
50 0.47 15 0.10

Appendix C:
Watershed, Landuse, and Soils Maps
List of Contents:
1. Swift Creek Watershed Map
2. Swift Creek Existing Landuse Map
3. Swift Creek Future Landuse Map
4. Swift Creek Soils Map

SC-6
GS-1C
GS-2A
GS-1BSC-4
GS-6
SC-1CSCUT-4A
SC-1E
SC-2A
GS-3GS-1A
SC-1DSC-1A
GS-5A GS-5D
GS-4D
GS-4B
SC-1B
GS-1D
GS-4C
SC-2BSCUT-3
GS-4A
GS-4E
SC-3B
SC-3A
SC-5BGS-2B
GS-2C
SC-3C
SCUT-1B
SCUT-5
SCUT-1A
SCUT-1D
GS-5B
SCUT-1C
GS-5C
SCUT-4C
SCUT-2 SCUT-4B
SC-5A SCUT-4D
Swift
Creek
Gum
Swamp
N obel Canal
Fork Swamp
Greens Mill Run Greens Mill Run
£¤13
UV903
UV11
UV43
903
Dickinson Ave
Memorial Dr
Evan
s St
11
1700
Greenville Blvd
123 Hwy
Cooper St
FireTower Rd
Firetower Rd
Main St Tar Rd
1700
11
Memo
rial D
r
Evans St
11 Legend
StreamsMinor StreamsWater BodiesPrimary - Drainage Basins
StreetsExpresswayHighwayMajor RoadLocal RoadETJ
PQ
Swift Creek WatershedMaster PlanAppendix C-1
Primary System Watersheds0 3,000 6,0001,500
1 inch = 3,000 feet

Gum Swamp
Swift
Creek
Greens Mi ll Run
Nobel CanalNobel Canal
£¤13
£¤264
UV11
UV43Dickinson Ave
Memorial Dr
11
123 Hwy
Greenville Blvd
Firetower RdDickinson Ave
11
LegendETJCity of GreenvilleWatershed
StreetsExpresswayHighwayMajor RoadLocal RoadStreamsMinor StreamsWater Bodies
Existing Land UseRight of WayIndustrialCommercialMixed Use/Office/InstitutionalOffice/Institutional/MedicalOffice/Institutional/Multi-FamilyHigh Density ResidentialMedium Density ResidentialLow Density ResidentialVery Low Density ResidentialConservation/Open SpaceAgricultural/Cropland
PQ
Swift Creek WatershedMaster PlanAppendix C-2
Existing Land Use Map0 3,000 6,0001,500
1 inch = 3,000 feet

Gum Swamp
Swift
Creek
Greens Mill Run
N obel Canal
£¤13UV11
UV43Dickinson AveMemorial Dr
11
123 Hwy
Greenville Blvd
Firetower RdDickinson Ave
11
LegendETJCity of GreenvilleWatershed
StreetsExpresswayHighwayMajor RoadLocal RoadStreamsMinor StreamsWater Bodies
Future Land UseRight of WayIndustrialCommercialMixed Use/Office/InstitutionalMedical CoreOffice/Institutional/MedicalOffice/Institutional/Multi-FamilyHigh Density ResidentialMedium Density ResidentialLow Density ResidentialVery Low Density ResidentialConservation/Open Space
PQ
Swift Creek WatershedMaster PlanAppendix C-3
Future Land Use Map0 3,000 6,0001,500
1 inch = 3,000 feet

Gum Swamp
Swift
Cree
k
Fork Swamp£¤13
UV11
UV43Dickinson Ave
Memorial Dr
11
Greenville Blvd
123 Hwy
Firetower Rd Fire Tower Rd
11 Legend
WatershedStreamsMinor Streams
StreetsExpresswayHighwayMajor RoadLocal Road
Hydrologic Soil GroupAA/DBB/DCD
PQ
Swift Creek WatershedMaster PlanAppendix C-4
Soils Map0 2,500 5,0001,250
1 inch = 2,500 feet

Appendix D:
Citizen Input
List of Contents:
1. General Survey Results (Table D‐1)
2. Frequency and Location of Flooding Question Responses (Table D‐2)
3. Impacted/Threatened by Erosion (Table D‐3)
4. City Funds Utilization (Table D‐4)
5. Greenville Watershed Master Plans Questionnaire
6. Swift Creek Public Meeting Minutes

APPENDIX D
CITIZEN INPUT ‐ RESULTS OF SURVEYS
City of Greenville – Swift Creek Watershed Master Plan Page D‐1
WK Dickson & Co., Inc.
Table D‐1: General Survey Results
Survey
Question
Number
Question
Survey Response
Yes No Maybe
1
Have you ever experienced flooding on your
system property during a (non‐Hurricane)
storm?
2 3 ‐
4 Have you ever noticed flooded streets in your
neighborhood? 2 3 ‐
5
Has flooding increased on your property due to
changes on nearby properties or drainage
systems?
2 3 ‐
6 Have you had any erosion on your property
associated with a stream or drainage ditch? 2 3 ‐
8
Are you aware that the City of Greenville is
currently analyzing and looking for possible
solutions to erosion, flooding and water quality
issues throughout the City with a watershed
master planning process?
3 2 ‐
9
If a cost‐sharing program was made available
along with training, would you be willing to
install a project such as a rain garden, cistern,
backyard wetland, etc. to help improve water
quality in your area?
1 ‐ 4
10
Are you aware of how the City of Greenville
currently spends or utilizes its stormwater
utility fee? ‐ 4 ‐

APPENDIX D
CITIZEN INPUT ‐ RESULTS OF SURVEYS
City of Greenville – Swift Creek Watershed Master Plan Page D‐2
WK Dickson & Co., Inc.
Table D‐2: Frequency and Location of Flooding Question Responses (Question 2)
Frequency
of Flooding
Flooding Location
Storage
Building
AC
Unit
Crawl
Space
Living
Space
Yard
flooding
from
stream/ditch
Yard
flooding
from street
runoff
Yard
flooding
from
adjacent
property
Never ‐ ‐ ‐ ‐ ‐ ‐ ‐ Less than
once per
year
‐ ‐ ‐ ‐ ‐ ‐
‐
Once per
year 1 ‐ 1 ‐ 1 ‐
‐
2‐3 times
per year ‐ ‐ ‐ ‐ ‐ ‐
‐
More than 3
times per
year
‐ ‐ 1 ‐ 1 ‐ 1
Every time
it rains ‐ ‐ ‐ ‐ ‐ ‐ ‐
Table D‐3: Impacted/Threatened by Erosion (Question 7)
Item Number of Responses
Street ‐
Yard 1
Garage ‐
Fence ‐
Other ‐
Table D‐4: How should City utilize funds to address stormwater runoff, erosion
and flooding issues? (Question 11)
Item Number of Responses
Develop cost‐share program for installation of water projects to
reduce stormwater flows 2
Develop incentives for replanting riparian areas 3
Develop program to address erosion on private property ‐
Construct and maintain water quality control practices on
private property 2
Stream restoration 4
Buyout of flood‐prone properties 1
Other ‐

Over To Continue
The City of Greenville’s Stormwater Management Program is conducing a citywide study to identify flooding, erosion, and water quality concerns. Your answers will help us target our efforts. Please take this brief survey to let us know what you are experiencing. Thank you for your participation! 1. Have you ever experienced flooding on your property during a (non‐Hurricane) storm? Yes No If yes, please provide the address where this flooding is occurring. ______________________________________________________________________________________
2. If yes, which of the following would apply and what is the frequency?
Water in storage building ______________________________________
Water on air condition units _____________________________________
Water in crawl space __________________________________________
Water up to, or in the living space ________________________________
Yard flooding from stream/ditch _________________________________
Yard flooding from street runoff _________________________________
Yard flooding from adjacent property _____________________________
3. List dates, locations, and depth of water (ex: On May 10, 2014, at my mailbox it was 2 feet deep)
_____________________________________________________________________________________________________________________________________________________________________________________________________________________________________________________________________
4. Have you ever noticed flooded streets in your neighborhood? Yes No
If yes, tell us when, the locations, and depth of water.
______________________________________________________________________________________________________________________________________________________________________________
5. Has flooding increased on your property due to any changes on nearby properties or drainage systems? If yes, what were those changes and the approximate timeframe?
Yes No
_______________________________________________________________________________________
6. Have you had any erosion on your property associated with a stream or drainage ditch? Yes No
7. If yes, which of the following are impacted or threatened by erosion Street Yard
Building/House Fence
Other _________________________________________________________________________
GREENVILLE WATERSHED MASTER PLANS QUESTIONNAIRE
FREQUENCY
A Less than once a year
B Once a year C 2‐3 times a year D More than 3 times
a year

8. Are you aware that the City of Greenville is currently analyzing and looking for possible solutions to flooding, erosion, and water quality issues throughout the City with a watershed master planning process?
Yes No
9. If a cost‐sharing program was made available along with training, would you be willing to install a project such as a rain garden, cistern, backyard wetland, etc. to help improve water quality in your area?
Yes No Maybe
10. Are you aware of how the City of Greenville currently spends or utilizes its stormwater utility fee?
Yes No
11. In what ways should the City of Greenville utilize funds to address excessive stormwater runoff, erosion and flooding issues throughout the City? (Check all that apply)
Examples include the following:
Develop cost‐sharing program for installation of projects to reduce stormwater flows
Develop incentives for replanting areas adjacent to streams
Construct and maintain regional detention facilities on public properties
Construct and maintain water quality facilities on public properties
Stream restoration
Buyout of flood prone properties Other __________________________
12. Is there anything else you would like for us to know about water quality issues in your area? _______________________________________________________________________________________
_______________________________________________________________________________________
May we contact you if we need additional information about flooding and erosion in your area?
Name: _____________________________________________________________________________________
Property Address: ____________________________________________________________________________
Primary Residence or Business (if different from Property Address): ____________________________________
Phone # (if needed for a response by the City): ____________________________________________________
How long have you been at this location?________________________________________________
To Send This Comment Form
Direct Mail: Greenville Watershed Master Plans
c/o The Wooten Company 301 West 14th Street
Greenville, NC 27834 FAX: 252-757-3221
E-Mail:[email protected]

City of Gree
Public Meet
City of Gr
Division o
Watershe
City of GrLisa Kirby,
Amanda Bo
Victor Long
Marla Hill,
1. Welco
2. Quest
O
D
h
3. Partic
39‐
‐
enville Watershe
ting – November
reenville, De
of Stormwat
ed Master P
reenville and Project Manag
oone, City of G
g, City of Gree
PEQ
ome and Purp
Residents Watershedthey have
The meetimark the land speak and observ
AttendeesProject mathen invitethe field asCity’s publa descripti
tions/Comme
Observed city
itch along the
oles are deve
cipant Feedba
904 Frog LeveErosion in
Water has
ed Master Plan
r 5, 2014
ept. of Public
ter Managem
lan Public M
Consultant Ager, City of Gre
Greenville
nville
pose of Meet
of Greenvilled Master Planexperienced.
ng began witocation of thwith staff anvations.
were then inanager Lisa Kied consultantssessment of ic involvemeon of next ste
ents by Partic
workers over
e street flood
eloping in ditc
ack at Station
el Road – Faythe back
come up to t
c Works
ment
Meeting
Attendees eenville
Meeti
ing
’s Swift Creekn process and.
h an open hoeir property, d consultants
nvited to hearirby explainedt Tom Murrayf the watershent commitmeeps and then
ipants
rcutting and k
ds, fills up and
ches and gett
s
ye Barefoot
the air condit
Swift Cree
November
Location: S
Tom Murray
Stefani Barlo
Scott Sigmon
Inga Kenned
ng Summa
k watershed wd to give their
ouse where atidentify areas of the City’s
r a short presd the overall y of W.K. Dicked. Inga Kennent and activi the open ho
killing vegetat
d could one d
ing larger. Co
tioning unit
ek Watershe
r 3, 2014
South Centr
y, W.K. Dickson
ow, W.K. Dicks
n, W.K. Dickson
dy, PEQ
ry
were invited tr input on sto
ttendees cous of flooding s Stormwater
sentation on tpurpose of thkson to descrinedy of PEQ sities. Lisa Kirbuse resumed
tion around c
ay overflow o
ould the stree
ed
ral High Scho
n
son
n
to learn morermwater issu
ld view waterand other stor Division abo
the Watershehe master plaibe the findinshared informby ended the .
city‐maintaine
onto the high
et be in dange
P a g e |
ool
e about the ues and challe
rshed maps tormwater issout their prob
ed Master Plaanning procesngs to date fromation about presentation
ed ditches
hway; also lar
er of collapsin
1
enges
o ues, lems
an. ss and om the n with
ge
ng?

City of Gree
Public Meet
‐
39
‐
‐
‐
34
‐
74
‐
enville Watershe
ting – November
Too shallo
903 Frog Leve
Erosion on
Sinkholes i
Swales fill
400 Saybrook
City maint
45 Seneca Ct
Debris clog
ed Master Plan
r 5, 2014
w – could thi
el Road (and
n the road fro
in roadside sw
up and flood
k Ct – Charles
ained walking
– Mike Howe
gging culvert
s be deeper o
lot beside) –
ont
wale
the edge of t
s Klahn
g area around
ell
from drainag
or wider?
Della Harrell
the travel lan
d pond is mow
ge area from M
ne
wed too close
Masters Lane
ely and grasse
e and Nicklau
P a g e |
es in the swa
s Drive
2
le die

Appendix E:
SCS Hydrology Calculations
List of Contents:
1. Existing Curve Number Calculations
2. Future Curve Number Calculations

Project: City of Greenville ‐ Swift Creek Watershed
Conditions: Existing
Prepared by: SMB
Checked by: TLM
Date: August 11, 2015
Soil Area Area Product of
Landuse Group RCN (Acres) (Sq. Mi.) RCN and Area
D 85.000 0.033 0.000 3
D 84.000 0.003 0.000 0
B 61.000 26.115 0.041 1593
B/D 61.000 13.191 0.021 805
C 74.000 32.672 0.051 2418
D 80.000 29.598 0.046 2368
C 92.000 0.440 0.001 40
D 93.000 0.473 0.001 44
Totals = 102.5 0.160 7270.7
Total (weighted) RCN = total product/total area = 70.92
RCN used = 71
Soil Area Area Product of
Landuse Group RCN (Acres) (Sq. Mi.) RCN and Area
D 92 0.5 0.001 47
B/D 70 0.3 0.000 22
C 80 3.5 0.005 280
D 85 6.4 0.010 548
D 84 0.6 0.001 47
B 61 0.1 0.000 6
B/D 61 3.0 0.005 186
C 74 21.3 0.033 1576
D 80 1.1 0.002 88
B/D 61 0.0 0.000 1
C 74 2.5 0.004 187
B 89 12.8 0.020 1135
B/D 89 18.2 0.028 1619
C 92 29.4 0.046 2709
D 93 52.2 0.082 4852
Totals = 152.0 0.237 13303.6
Total (weighted) RCN = total product/total area = 87.53
RCN used = 72
SCS Runoff Curve Number ‐ Primary System
Right of Way
Right of Way
Medium Density Residential
Right of Way
Right of Way
Mixed Use/Office/Institutional
Medium Density Residential
Subbasin: GS ‐ 1A
Medium Density Residential
Medium Density Residential
Very Low Density Residential
Open Space, Good Condition
Open Space, Good Condition
Open Space, Good Condition
Subbasin: GS ‐ 1B
Open Space, Good Condition
Open Space, Good Condition
Open Space, Good Condition
Open Space, Good Condition
Open Space, Good Condition
Very Low Density Residential
Open Space, Good Condition
Open Space, Good Condition
Right of Way
Right of Way

Soil Area Area Product of
Landuse Group RCN (Acres) (Sq. Mi.) RCN and Area
B 89 0.1 0.000 7
C 92 1.5 0.002 134
D 93 1.4 0.002 130
C 90 0.7 0.001 61
D 92 0.4 0.001 39
C 83 0.1 0.000 8
C 80 1.0 0.001 76
C 79 1.1 0.002 88
D 84 7.1 0.011 597
C 79 1.2 0.002 95
D 84 12.2 0.019 1021
B 61 2.8 0.004 170
B/D 61 0.1 0.000 6
C 74 2.3 0.004 170
D 80 15.6 0.024 1246
B 61 16.6 0.026 1012
B/D 61 11.4 0.018 698
C 74 119.2 0.186 8824
D 80 127.1 0.199 10172
Totals = 321.8 0.503 24553.8
Total (weighted) RCN = total product/total area = 76.29
RCN used = 76
Soil Area Area Product of
Landuse Group RCN (Acres) (Sq. Mi.) RCN and Area
B 89 2.1 0.003 187
B/D 89 0.4 0.001 34
C 92 2.6 0.004 236
D 93 1.4 0.002 127
B/D 75 2.8 0.004 212
B 70 0.7 0.001 47
C 80 0.1 0.000 7
B 68 7.1 0.011 480
B/D 68 1.5 0.002 101
C 79 7.8 0.012 616
D 84 6.7 0.011 565
B 69 3.2 0.005 222
B/D 69 8.0 0.013 553
C 79 9.1 0.014 722
D 84 8.3 0.013 697
B 69 0.2 0.000 12
B/D 69 0.9 0.001 65
C 79 0.0 0.000 3
D 84 0.5 0.001 43
B 69 0.5 0.001 37
D 84 0.3 0.001 28
Totals = 64.3 0.100 4993.6
Total (weighted) RCN = total product/total area = 77.70
RCN used = 78
Open Space, Good Condition
Open Space, Good Condition
Right‐Of‐Way
Mixed Use/Office/Institutional
Conservation/Open Space
Mixed Use/Office/Institutional
Right‐Of‐Way
Right‐Of‐Way
Agricultural/Cropland
Agricultural/Cropland
Subbasin: GS ‐ 1C
Medium Density Residential
Medium Density Residential
Right‐Of‐Way
Subbasin: GS ‐ 1D
Low Density Residential
Low Density Residential
Low Density Residential
Low Density Residential
Very Low Density Residential
Very Low Density Residential
Very Low Density Residential
Very Low Density Residential
Agricultural/Cropland
Agricultural/Cropland
Right‐Of‐Way
Right‐Of‐Way
Right‐Of‐Way
High Density Residential
Conservation/Open Space
Very Low Density Residential
Agricultural/Cropland
Agricultural/Cropland
Agricultural/Cropland
Agricultural/Cropland
Open Space, Good Condition
Open Space, Good Condition
Very Low Density Residential
High Density Residential
Medium Density Residential
Low Density Residential
Low Density Residential

Soil Area Area Product of
Landuse Group RCN (Acres) (Sq. Mi.) RCN and Area
B 89 0.6 0.001 52
C 92 7.6 0.012 702
D 93 1.4 0.002 134
C 91 1.8 0.003 166
D 93 1.6 0.003 149
C 94 4.3 0.007 402
C 90 1.1 0.002 102
D 92 1.2 0.002 111
C 80 2.2 0.003 176
D 85 2.2 0.003 185
B 68 0.2 0.000 17
C 79 5.4 0.008 429
D 84 6.2 0.010 520
B 69 0.1 0.000 7
C 79 21.1 0.033 1664
D 84 7.3 0.011 617
C 79 4.2 0.007 329
Agricultural/Cropland B 74 21.9 0.034 1624
C 80 140.4 0.219 11232
D 61 61.1 0.096 3729
Totals = 292.13 0.456 22350.0
Total (weighted) RCN = total product/total area = 76.51
RCN used = 77
Soil Area Area Product of
Landuse Group RCN (Acres) (Sq. Mi.) RCN and Area
B 89 0.9 0.001 81
C 92 4.8 0.007 437
D 93 3.0 0.005 284
C 83 0.1 0.000 7
B 70 3.0 0.005 210
C 80 14.5 0.023 1163
D 85 8.0 0.012 678
B 68 0.2 0.000 11
C 79 2.4 0.004 190
D 84 0.3 0.000 22
C 79 0.1 0.000 10
B 69 0.1 0.000 5
C 79 6.6 0.010 522
Totals = 43.9 0.069 3618.8
Total (weighted) RCN = total product/total area = 82.37
RCN used = 82
Subbasin: GS ‐ 2B
Low Density Residential
Low Density Residential
Subbasin: GS ‐ 2A
Mixed Use/Office/Institutional
Medium Density Residential
Medium Density Residential
Very Low Density Residential
Very Low Density Residential
Very Low Density Residential
Open Space, Good Condition
Agricultural/Cropland
Agricultural/Cropland
Right‐Of‐Way
Right‐Of‐Way
Right‐Of‐Way
Industrial
Industrial
Low Density Residential
Commercial
Mixed Use/Office/Institutional
Right‐Of‐Way
Medium Density Residential
Medium Density Residential
Medium Density Residential
Low Density Residential
Low Density Residential
Right‐Of‐Way
Right‐Of‐Way
High Density Residential
Low Density Residential
Very Low Density Residential
Conservation/Open Space
Conservation/Open Space

Soil Area Area Product of
Landuse Group RCN (Acres) (Sq. Mi.) RCN and Area
B 89 0.7 0.001 63
C 92 1.2 0.002 110
D 93 0.4 0.001 35
B 75 0.7 0.001 52
C 83 0.5 0.001 40
D 87 0.7 0.001 62
C 80 0.3 0.001 28
D 85 0.5 0.001 39
B 68 1.1 0.002 78
C 79 0.1 0.000 6
B 69 1.6 0.003 111
C 79 6.7 0.010 530
D 84 3.7 0.006 310
B 69 0.0 0.000 3
B/D 69 0.1 0.000 9
C 79 7.3 0.011 574
D 84 0.1 0.000 6
B 69 9.8 0.015 676
D 84 1.3 0.002 112
Totals = 36.8 0.058 2843.8
Total (weighted) RCN = total product/total area = 77.18
RCN used = 77
Soil Area Area Product of
Landuse Group RCN (Acres) (Sq. Mi.) RCN and Area
B 89 5.0 0.008 442
C 92 4.1 0.006 378
D 93 1.0 0.002 97
B 75 4.7 0.007 352
C 83 0.6 0.001 51
D 87 0.7 0.001 65
B 70 1.3 0.002 91
C 80 2.2 0.003 173
D 85 1.8 0.003 150
B 68 4.7 0.007 317
C 79 23.4 0.037 1847
D 84 6.5 0.010 549
B 69 5.8 0.009 397
C 79 7.2 0.011 568
D 84 8.2 0.013 685
B 69 1.0 0.002 68
C 79 1.5 0.002 115
D 84 2.8 0.004 238
Totals = 82.35 0.129 6583.2
Total (weighted) RCN = total product/total area = 79.94
RCN used = 80
Very Low Density Residential
Very Low Density Residential
Conservation/Open Space
Conservation/Open Space
High Density Residential
High Density Residential
Medium Density Residential
Medium Density Residential
Low Density Residential
Low Density Residential
Very Low Density Residential
Right‐Of‐Way
Right‐Of‐Way
High Density Residential
Right‐Of‐Way
Subbasin: GS ‐ 2C
Very Low Density Residential
Very Low Density Residential
Conservation/Open Space
Conservation/Open Space
Conservation/Open Space
Conservation/Open Space
Conservation/Open Space
Conservation/Open Space
High Density Residential
High Density Residential
Medium Density Residential
Subbasin: GS ‐3
Right‐Of‐Way
Right‐Of‐Way
Medium Density Residential
Right‐Of‐Way
High Density Residential
Conservation/Open Space
Medium Density Residential
Low Density Residential
Low Density Residential
Low Density Residential
Very Low Density Residential

Soil Area Area Product of
Landuse Group RCN (Acres) (Sq. Mi.) RCN and Area
B 83 0.6 0.001 51
C 92 2.8 0.004 258
D 93 1.9 0.003 175
B 75 0.003 0.000 0
B/D 75 0.04 0.000 3
C 83 0.7 0.001 60
D 87 0.2 0.000 21
B 70 1.6 0.003 115
B/D 70 0.2 0.000 14
C 80 11.2 0.017 896
D 85 0.2 0.000 19
B 68 0.0 0.000 1
C 79 6.8 0.011 539
D 84 12.4 0.019 1042
B 69 0.2 0.000 11
C 79 1.0 0.002 82
D 84 0.2 0.000 13
B 69 0.6 0.001 43
C 79 5.2 0.008 410
D 84 2.3 0.004 195
Totals = 48.31 0.075 3948.4
Total (weighted) RCN = total product/total area = 81.74
RCN used = 82
Soil Area Area Product of
Landuse Group RCN (Acres) (Sq. Mi.) RCN and Area
B 89 3.2 0.005 282
C 93 9.6 0.015 888
D 92 0.9 0.001 79
B 75 6.6 0.010 493
C 83 12.7 0.020 1053
D 87 1.4 0.002 120
B 70 1.6 0.003 115
C 80 17.8 0.028 1423
D 85 0.2 0.000 15
B 68 1.8 0.003 122
C 79 16.9 0.026 1334
D 84 1.4 0.002 116
B 69 0.4 0.001 27
Totals = 74.3 0.116 6066.9
Total (weighted) RCN = total product/total area = 81.68
RCN used = 82
Low Density Residential
Low Density Residential
Conservation/Open Space
Conservation/Open Space
Right‐Of‐Way
Right‐Of‐Way
Right‐Of‐Way
High Density Residential
High Density Residential
High Density Residential
High Density Residential
Medium Density Residential
Medium Density Residential
Subbasin: GS ‐ 4A
Right‐Of‐Way
Right‐Of‐Way
Subbasin: GS ‐ 4B
Medium Density Residential
Low Density Residential
Very Low Density Residential
Very Low Density Residential
Very Low Density Residential
Conservation/Open Space
Conservation/Open Space
Right‐Of‐Way
Medium Density Residential
High Density Residential
High Density Residential
High Density Residential
Medium Density Residential
Medium Density Residential
Medium Density Residential
Low Density Residential
Low Density Residential
Low Density Residential

Soil Area Area Product of
Landuse Group RCN (Acres) (Sq. Mi.) RCN and Area
B 89 0.7 0.001 64
C 92 5.5 0.009 503
B 75 3.0 0.005 228
C 87 14.8 0.023 1289
C 80 2.1 0.003 171
B 68 2.9 0.005 199
C 79 27.9 0.044 2202
C 79 0.1 0.000 6
B 69 3.3 0.005 226
C 79 2.9 0.005 232
Totals = 63.28 0.099 5120.9
Total (weighted) RCN = total product/total area = 80.92
RCN used = 81
Soil Area Area Product of
Landuse Group RCN (Acres) (Sq. Mi.) RCN and Area
B 89 4.7 0.007 419
C 92 4.4 0.007 406
D 93 1.0 0.002 95
B 75 4.3 0.007 324
C 83 2.1 0.003 174
D 87 0.5 0.001 48
B 70 5.4 0.008 378
C 80 3.2 0.005 259
D 85 1.3 0.002 108
B 68 12.6 0.020 854
C 79 20.5 0.032 1623
D 84 6.3 0.010 529
B 69 0.0 0.000 0
C 79 1.8 0.003 141
B 69 8.2 0.013 563
C 79 7.9 0.012 622
D 84 0.7 0.001 57
Totals = 84.90 0.133 6598.5
Total (weighted) RCN = total product/total area = 77.72
RCN used = 78
Right‐Of‐Way
Right‐Of‐Way
Right‐Of‐Way
High Density Residential
High Density Residential
Conservation/Open Space
Conservation/Open Space
Conservation/Open Space
Subbasin: GS ‐ 4C
Medium Density Residential
Medium Density Residential
Medium Density Residential
Low Density Residential
Low Density Residential
Very Low Density Residential
Very Low Density Residential
Low Density Residential
Conservation/Open Space
High Density Residential
Subbasin: GS ‐ 4D
Right‐Of‐Way
Right‐Of‐Way
High Density Residential
High Density Residential
Medium Density Residential
Low Density Residential
Low Density Residential
Very Low Density Residential
Conservation/Open Space

Soil Area Area Product of
Landuse Group RCN (Acres) (Sq. Mi.) RCN and Area
B 89 3.5 0.006 315
C 92 3.3 0.005 302
D 93 0.1 0.000 13
B 75 5.0 0.008 375
C 83 2.7 0.004 227
D 87 0.4 0.001 38
B 70 4.4 0.007 307
C 80 2.3 0.004 183
D 85 0.3 0.000 23
B 68 5.1 0.008 346
C 79 0.8 0.001 63
D 84 0.00003 0.000 0
C 79 0.2 0.000 14
D 84 1.3 0.002 106
D 84 0.9 0.001 79
B 69 1.0 0.002 71
C 79 2.2 0.003 171
D 84 0.002 0.000 0
Totals = 33.5 0.052 2633.2
Total (weighted) RCN = total product/total area = 78.51
RCN used = 78.5
Soil Area Area Product of
Landuse Group RCN (Acres) (Sq. Mi.) RCN and Area
B 89 1.5 0.002 138
C 92 0.004 0.000 0
D 93 0.1 0.000 12
C 90 0.01 0.000 1
D 92 0.2 0.000 23
B 85 11.7 0.018 996
D 92 1.4 0.002 128
B 75 0.03 0.000 2
C 83 1.0 0.002 84
D 87 3.3 0.005 291
B 70 2.7 0.004 187
C 80 0.1 0.000 9
B 68 5.0 0.008 343
D 84 1.8 0.003 151
D 84 0.5 0.001 42
B 61 0.3 0.000 19
C 74 0.2 0.000 12
D 80 9.0 0.014 722
B 61 34.6 0.054 2112
C 74 10.3 0.016 760
D 80 13.2 0.021 1056
Totals = 97.2 0.152 7090.3
Total (weighted) RCN = total product/total area = 72.96
RCN used = 73
Medium Density Residential
Subbasin: GS ‐ 4E
Right‐Of‐Way
Right‐Of‐Way
Right‐Of‐Way
Mixed Use/Office/Institutional
Mixed Use/Office/Institutional
Office/Institutional/Multi‐Family
Office/Institutional/Multi‐Family
High Density Residential
High Density Residential
Right‐Of‐Way
Right‐Of‐Way
Right‐Of‐Way
Low Density Residential
Very Low Density Residential
Open Space, Good Condition
Open Space, Good Condition
Open Space, Good Condition
Open Space, Good Condition
Open Space, Good Condition
Open Space, Good Condition
Subbasin: GS ‐ 5A
Low Density Residential
Low Density Residential
Low Density Residential
Very Low Density Residential
Very Low Density Residential
Agricultural/Cropland
Conservation/Open Space
Conservation/Open Space
High Density Residential
Medium Density Residential
Medium Density Residential
Low Density Residential
Conservation/Open Space
High Density Residential
High Density Residential
High Density Residential
Medium Density Residential
Medium Density Residential

Soil Area Area Product of
Landuse Group RCN (Acres) (Sq. Mi.) RCN and Area
B 89 3.1 0.005 279
C 92 3.6 0.006 334
D 93 0.2 0.000 20
C 90 0.1 0.000 9
B 75 12.4 0.019 927
C 83 8.1 0.013 674
D 87 0.8 0.001 68
B 70 1.6 0.003 112
C 80 0.4 0.001 28
B 68 0.1 0.000 8
C 79 0.1 0.000 5
C 79 0.04 0.000 3
Totals = 30.5 0.048 2468.0
Total (weighted) RCN = total product/total area = 80.86
RCN used = 81
Soil Area Area Product of
Landuse Group RCN (Acres) (Sq. Mi.) RCN and Area
B 89 1.5 0.002 133
B 85 8.5 0.013 723
C 90 4.6 0.007 414
D 92 3.3 0.005 302
B 85 0.01 0.000 1
D 92 0.004 0.000 0
B 75 1.0 0.002 78
C 83 0.2 0.000 20
B 70 1.9 0.003 136
B 68 2.7 0.004 185
C 79 1.0 0.002 79
D 84 1.2 0.002 100
Totals = 26.03 0.041 2170.9
Total (weighted) RCN = total product/total area = 83.41
RCN used = 83
Low Density Residential
Low Density Residential
Conservation/Open Space
Right‐Of‐Way
Right‐Of‐Way
Subbasin: GS ‐ 5B
High Density Residential
Medium Density Residential
Low Density Residential
Low Density Residential
Subbasin: GS ‐ 5C
Low Density Residential
Mixed Use/Office/Institutional
Mixed Use/Office/Institutional
Mixed Use/Office/Institutional
Right‐Of‐Way
Right‐Of‐Way
High Density Residential
Mixed Use/Office/Institutional
High Density Residential
High Density Residential
High Density Residential
Medium Density Residential
Medium Density Residential
Office/Institutional/Multi‐Family
Office/Institutional/Multi‐Family

Soil Area Area Product of
Landuse Group RCN (Acres) (Sq. Mi.) RCN and Area
B 89 5.5 0.009 488
C 92 1.4 0.002 128
D 93 2.3 0.004 211
A 77 5.0 0.008 383
B 85 20.6 0.032 1754
C 90 5.0 0.008 449
D 92 7.0 0.011 640
B 70 1.3 0.002 94
B 68 21.5 0.034 1464
C 79 6.2 0.010 490
D 84 10.7 0.017 901
Totals = 86.52 0.135 7003.6
Total (weighted) RCN = total product/total area = 80.95
RCN used = 81
Soil Area Area Product of
Landuse Group RCN (Acres) (Sq. Mi.) RCN and Area
B 89 1.3 0.002 115
C 92 0.2 0.000 20
D 93 0.1 0.000 6
A 77 7.7 0.012 594
B 85 25.8 0.040 2190
C 90 11.8 0.018 1063
D 92 1.3 0.002 116
A 51 0.03 0.000 1
B 68 3.7 0.006 248
C 79 1.2 0.002 95
D 84 2.4 0.004 206
A 49 3.0 0.005 149
B 69 0.9 0.001 62
C 79 0.3 0.000 22
D 84 0.3 0.000 25
A 39 13.3 0.021 521
B 61 7.3 0.011 444
C 74 6.3 0.010 464
D 80 19.8 0.031 1588
Totals = 106.70 0.167 7927.8
Total (weighted) RCN = total product/total area = 74.30
RCN used = 74
Subbasin: GS ‐ 5D
Right‐Of‐Way
Low Density Residential
Low Density Residential
Right‐Of‐Way
Right‐Of‐Way
Mixed Use/Office/Institutional
Mixed Use/Office/Institutional
Mixed Use/Office/Institutional
Mixed Use/Office/Institutional
Medium Density Residential
Low Density Residential
Open Space, Good Condition
Open Space, Good Condition
Mixed Use/Office/Institutional
Very Low Density Residential
Very Low Density Residential
Very Low Density Residential
Very Low Density Residential
Subbasin: GS ‐ 6
Open Space, Good Condition
Open Space, Good Condition
Right‐Of‐Way
Right‐Of‐Way
Right‐Of‐Way
Mixed Use/Office/Institutional
Mixed Use/Office/Institutional
Mixed Use/Office/Institutional
Low Density Residential
Low Density Residential
Low Density Residential
Low Density Residential

Soil Area Area Product of
Landuse Group RCN (Acres) (Sq. Mi.) RCN and Area
B 89 0.3 0.000 28
C 92 4.7 0.007 430
D 93 3.5 0.005 326
C 94 28.2 0.044 2651
D 95 0.3 0.000 29
C 83 2.2 0.003 179
B 70 0.5 0.001 37
C 80 12.1 0.019 972
D 85 0.5 0.001 39
B 68 1.2 0.002 79
C 79 14.3 0.022 1128
D 84 4.6 0.007 385
B 61 0.0 0.000 1
C 74 23.9 0.037 1771
D 80 2.1 0.003 169
Totals = 98.38 0.154 8223.4
Total (weighted) RCN = total product/total area = 83.59
RCN used = 84
Soil Area Area Product of
Landuse Group RCN (Acres) (Sq. Mi.) RCN and Area
B 89 2.5 0.004 224
C 92 3.7 0.006 342
B 75 5.5 0.009 411
C 83 2.7 0.004 221
D 87 0.3 0.000 23
B 70 7.0 0.011 489
C 80 4.9 0.008 394
B 68 1.8 0.003 120
C 79 10.8 0.017 850
B 61 17.4 0.027 1063
C 74 6.0 0.009 447
D 80 0.7 0.001 56
C 79 1.8 0.003 146
Totals = 65.07 0.102 4784.2
Total (weighted) RCN = total product/total area = 73.53
RCN used = 74
Low Density Residential
Low Density Residential
Conservation/Open Space
Conservation/Open Space
High Density Residential
High Density Residential
High Density Residential
Medium Density Residential
Medium Density Residential
Low Density Residential
Low Density Residential
Subbasin: SC ‐ 1A
Right‐Of‐Way
Medium Density Residential
Medium Density Residential
Medium Density Residential
Low Density Residential
Conservation/Open Space
Subbasin: SC ‐ 1B
Right‐Of‐Way
Right‐Of‐Way
Right‐Of‐Way
Right‐Of‐Way
Commercial
Commercial
High Density Residential
Open Space, Good Condition
Open Space, Good Condition
Open Space, Good Condition
Conservation/Open Space

Soil Area Area Product of
Landuse Group RCN (Acres) (Sq. Mi.) RCN and Area
B 89 2.3 0.004 200
B/D 89 0.2 0.000 22
C 92 2.3 0.004 216
D 93 2.0 0.003 182
B 68 17.9 0.028 1220
B/D 68 3.0 0.005 207
C 79 25.2 0.039 1994
D 84 12.2 0.019 1026
B 61 23.9 0.037 1457
C 74 27.3 0.043 2022
D 80 12.9 0.020 1034
Totals = 129.35 0.202 9578.3
Total (weighted) RCN = total product/total area = 74.05
RCN used = 74
Soil Area Area Product of
Landuse Group RCN (Acres) (Sq. Mi.) RCN and Area
C 92 0.8 0.001 75
D 93 0.2 0.000 22
B 75 2.3 0.004 169
C 83 0.5 0.001 40
D 87 0.1 0.000 8
C 79 7.2 0.011 566
D 84 3.9 0.006 329
C 79 0.6 0.001 49
D 84 1.0 0.002 87
B 61 2.4 0.004 144
B/D 61 14.5 0.023 883
C 74 35.6 0.056 2632
D 80 31.1 0.049 2488
Totals = 100.11 0.156 7491.4
Total (weighted) RCN = total product/total area = 74.83
RCN used = 75
Low Density Residential
Open Space, Good Condition
Open Space, Good Condition
Open Space, Good Condition
Subbasin: SC ‐ 1D
High Density Residential
Low Density Residential
Low Density Residential
Very Low Density Residential
Very Low Density Residential
Open Space, Good Condition
Open Space, Good Condition
Open Space, Good Condition
Open Space, Good Condition
Right‐Of‐Way
Right‐Of‐Way
High Density Residential
High Density Residential
Low Density Residential
Low Density Residential
Right‐Of‐Way
Right‐Of‐Way
Right‐Of‐Way
Right‐Of‐Way
Low Density Residential
Subbasin: SC ‐ 1C

Soil Area Area Product of
Landuse Group RCN (Acres) (Sq. Mi.) RCN and Area
B 89 0.2 0.000 20
C 92 8.9 0.014 818
D 93 3.0 0.005 277
C 83 0.1 0.000 12
D 87 1.0 0.002 85
B 70 0.4 0.001 29
C 80 21.3 0.033 1707
D 85 8.9 0.014 758
B 68 0.4 0.001 29
C 79 30.4 0.047 2399
D 84 13.3 0.021 1117
B 69 0.0 0.000 1
C 79 8.6 0.013 681
D 84 2.1 0.003 175
B 69 0.5 0.001 32
C 79 8.9 0.014 705
D 84 3.4 0.005 287
Totals = 111.50 0.174 9132.3
Total (weighted) RCN = total product/total area = 81.90
RCN used = 82
Soil Area Area Product of
Landuse Group RCN (Acres) (Sq. Mi.) RCN and Area
C 90 30.0 0.047 2700
B/D 61 42.8 0.067 2610
D 80 29.5 0.046 2362
Totals = 102.31 0.160 7671.8
Total (weighted) RCN = total product/total area = 74.99
RCN used = 75
Medium Density Residential
High Density Residential
High Density Residential
Medium Density Residential
Right‐Of‐Way
Right‐Of‐Way
Right‐Of‐Way
Subbasin: SC ‐ 1E
Conservation/Open Space
Subbasin: SC ‐ 2A
Mixed Use/Office/Institutional
Open Space, Good Condition
Open Space, Good Condition
Medium Density Residential
Low Density Residential
Low Density Residential
Low Density Residential
Very Low Density Residential
Very Low Density Residential
Very Low Density Residential
Conservation/Open Space
Conservation/Open Space

Soil Area Area Product of
Landuse Group RCN (Acres) (Sq. Mi.) RCN and Area
B 89 0.6 0.001 57
B/D 89 0.3 0.001 30
C 92 6.4 0.010 590
D 93 0.3 0.001 30
B 70 2.2 0.003 155
B/D 70 2.4 0.004 167
C 80 19.9 0.031 1591
D 85 3.9 0.006 333
B 68 0.1 0.000 10
B/D 68 0.3 0.001 23
C 79 1.0 0.002 79
D 84 0.1 0.000 8
B 69 0.6 0.001 44
B/D 69 0.7 0.001 50
C 79 4.3 0.007 338
B/D 69 0.4 0.001 28
C 79 11.4 0.018 904
D 84 3.0 0.005 253
Totals = 58.20 0.091 4690.1
Total (weighted) RCN = total product/total area = 80.58
RCN used = 80.5
Soil Area Area Product of
Landuse Group RCN (Acres) (Sq. Mi.) RCN and Area
B/D 69 0.1 0.0001 6
B/D 61 33.7 0.0526 2054
C 74 21.7 0.034 1608
Totals = 55.49 0.087 3668.1
Total (weighted) RCN = total product/total area = 66.10
RCN used = 66
Low Density Residential
Very Low Density Residential
Very Low Density Residential
Very Low Density Residential
Conservation/Open Space
Conservation/Open Space
Conservation/Open Space
Subbasin: SC ‐ 3A
Subbasin: SC ‐ 2B
Right‐Of‐Way
Right‐Of‐Way
Right‐Of‐Way
Right‐Of‐Way
Medium Density Residential
Medium Density Residential
Medium Density Residential
Medium Density Residential
Low Density Residential
Low Density Residential
Low Density Residential
Low Density Residential
Conservation/Open Space
Conservation/Open Space

Soil Area Area Product of
Landuse Group RCN (Acres) (Sq. Mi.) RCN and Area
B 89 2.2 0.003 194
B/D 89 0.9 0.001 84
C 92 4.4 0.007 407
D 93 1.5 0.002 138
B 85 0.7 0.001 63
B/D 85 1.9 0.003 162
C 90 0.9 0.001 78
D 92 0.01 0.000 1
B/D 75 0.02 0.000 1
C 83 0.1 0.000 5
B 70 7.2 0.011 507
B/D 70 2.7 0.004 188
C 80 14.1 0.022 1125
D 85 1.0 0.002 89
B 68 0.2 0.000 14
B/D 68 1.8 0.003 121
C 79 0.4 0.001 32
D 84 1.9 0.003 162
B 69 2.6 0.004 178
B/D 69 7.1 0.011 489
C 79 9.3 0.014 732
D 84 1.1 0.002 93
Totals = 62.02 0.097 4862.7
Total (weighted) RCN = total product/total area = 78.40
RCN used = 78
Soil Area Area Product of
Landuse Group RCN (Acres) (Sq. Mi.) RCN and Area
B 89 1.5 0.002 138
C 92 3.3 0.005 308
D 93 0.4 0.001 33
B 70 3.5 0.006 246
B/D 70 0.3 0.000 20
C 80 5.3 0.008 425
D 85 1.2 0.002 105
B 68 1.6 0.003 110
B/D 68 0.0004 0.000 0
C 79 2.0 0.003 158
D 84 0.3 0.000 22
B 69 1.4 0.002 96
C 79 8.7 0.014 686
C 79 5.2 0.008 413
Totals = 34.78 0.054 2759.8
Total (weighted) RCN = total product/total area = 79.35
RCN used = 79
Medium Density Residential
Low Density Residential
Low Density Residential
Low Density Residential
Low Density Residential
Conservation/Open Space
High Density Residential
Medium Density Residential
Medium Density Residential
Medium Density Residential
Low Density Residential
Low Density Residential
Low Density Residential
Low Density Residential
Very Low Density Residential
Very Low Density Residential
Conservation/Open Space
Conservation/Open Space
Conservation/Open Space
Conservation/Open Space
Subbasin: SC ‐ 3C
Right‐Of‐Way
Right‐Of‐Way
Medium Density Residential
Medium Density Residential
Right‐Of‐Way
Medium Density Residential
Medium Density Residential
Right‐Of‐Way
Right‐Of‐Way
Right‐Of‐Way
Mixed Use/Office/Institutional
Mixed Use/Office/Institutional
Mixed Use/Office/Institutional
Mixed Use/Office/Institutional
High Density Residential
Subbasin: SC ‐ 3B
Right‐Of‐Way

Soil Area Area Product of
Landuse Group RCN (Acres) (Sq. Mi.) RCN and Area
B 89 9.3 0.015 828
C 92 4.0 0.006 364
D 93 1.1 0.002 102
B 75 2.1 0.003 160
C 83 1.5 0.002 129
B 70 8.4 0.013 589
C 80 4.9 0.008 392
D 85 0.9 0.001 79
B 68 25.1 0.039 1707
C 79 0.3 0.000 25
D 84 8.8 0.014 740
B 69 15.1 0.024 1045
C 79 2.6 0.004 203
D 84 10.0 0.016 839
B 69 1.4 0.002 96
C 79 9.4 0.015 745
D 84 2.6 0.004 219
Totals = 107.63 0.168 8260.9
Total (weighted) RCN = total product/total area = 76.75
RCN used = 77
Soil Area Area Product of
Landuse Group RCN (Acres) (Sq. Mi.) RCN and Area
B 89 1.8 0.003 156
C 92 2.5 0.004 228
D 93 0.1 0.000 10
B 85 0.3 0.000 27
C 90 2.5 0.004 225
D 92 0.5 0.001 43
B 75 1.6 0.003 120
C 83 2.3 0.004 194
B 70 2.8 0.004 199
C 80 6.2 0.010 497
D 85 0.7 0.001 56
B 68 0.1 0.000 7
C 79 0.8 0.001 63
D 84 0.3 0.001 29
Totals = 22.51 0.035 1853.0
Total (weighted) RCN = total product/total area = 82.32
RCN used = 82
Subbasin: SC ‐ 4
Office/Institutional/Multi‐Family
Office/Institutional/Multi‐Family
Office/Institutional/Multi‐Family
High Density Residential
High Density Residential
Medium Density Residential
Medium Density Residential
Right‐Of‐Way
Medium Density Residential
Medium Density Residential
Medium Density Residential
Low Density Residential
Low Density Residential
Low Density Residential
Very Low Density Residential
Very Low Density Residential
Very Low Density Residential
Medium Density Residential
Low Density Residential
Low Density Residential
Low Density Residential
Right‐Of‐Way
Right‐Of‐Way
Right‐Of‐Way
High Density Residential
High Density Residential
Conservation/Open Space
Conservation/Open Space
Right‐Of‐Way
Right‐Of‐Way
Conservation/Open Space
Subbasin: SC ‐ 5A

Soil Area Area Product of
Landuse Group RCN (Acres) (Sq. Mi.) RCN and Area
B 89 2.9 0.005 261
D 93 0.8 0.001 78
B 85 2.0 0.003 168
C 90 0.0 0.000 0
D 92 1.1 0.002 105
B 75 0.2 0.000 17
B 70 2.9 0.004 200
C 80 0.0 0.000 0
D 85 2.1 0.003 176
B 68 8.4 0.013 569
D 84 5.7 0.009 478
D 84 2.3 0.004 196
B 78 15.1 0.024 1175
C 85 1.1 0.002 94
D 89 4.6 0.007 410
Totals = 49.21 0.077 3926.8
Total (weighted) RCN = total product/total area = 79.80
RCN used = 80
Subbasin: SC ‐ 5B
Office/Institutional/Multi‐Family
High Density Residential
Medium Density Residential
Medium Density Residential
Right‐Of‐Way
Right‐Of‐Way
Office/Institutional/Medical
Office/Institutional/Multi‐Family
Medium Density Residential
Low Density Residential
Low Density Residential
Very Low Density Residential
Agricultural/Cropland
Agricultural/Cropland
Agricultural/Cropland

Soil Area Area Product of
Landuse Group RCN (Acres) (Sq. Mi.) RCN and Area
A 83 2.0 0.003 168
B 89 17.7 0.028 1579
B/D 89 10.6 0.017 944
C 92 29.8 0.047 2739
D 93 2.9 0.005 269
B 92 24.3 0.038 2237
B/D 92 15.1 0.024 1388
C 94 27.1 0.042 2549
D 95 11.4 0.018 1080
A 77 14.3 0.022 1100
B 85 29.4 0.046 2502
B/D 85 25.5 0.040 2170
C 90 48.0 0.075 4316
D 92 62.4 0.097 5739
D 92 0.0 0.000 4
B 75 3.1 0.005 231
C 83 2.1 0.003 173
D 87 0.6 0.001 52
B 70 24.9 0.039 1741
C 80 30.8 0.048 2463
D 85 1.3 0.002 107
A 51 4.8 0.008 246
B 68 14.9 0.023 1014
B/D 68 0.3 0.000 21
C 79 47.5 0.074 3751
D 84 0.8 0.001 71
A 49 1.8 0.003 88
A/D 49 0.3 0.000 13
B 69 18.0 0.028 1240
B/D 69 1.8 0.003 125
C 79 26.1 0.041 2061
D 84 17.0 0.027 1429
A 49 6.9 0.011 340
A/D 49 12.7 0.020 624
B 69 2.6 0.004 181
B/D 69 2.1 0.003 147
C 79 13.0 0.020 1025
D 84 14.2 0.022 1194
A 49 11.9 0.019 585
B 69 68.6 0.107 4736
B/D 69 24.9 0.039 1715
C 79 133.4 0.208 10542
D 84 69.5 0.109 5840
Totals = 876.52 1.370 70536.2
Total (weighted) RCN = total product/total area = 80.47
RCN used = 80
Subbasin: SC ‐ 6
Agricultural/Cropland
Right‐Of‐Way
Right‐Of‐Way
Right‐Of‐Way
Right‐Of‐Way
Right‐Of‐Way
Commercial
Commercial
Commercial
Commercial
Mixed Use/Office/Institutional
Mixed Use/Office/Institutional
Mixed Use/Office/Institutional
Mixed Use/Office/Institutional
Mixed Use/Office/Institutional
Office/Institutional/Multi‐Family
High Density Residential
High Density Residential
High Density Residential
Medium Density Residential
Medium Density Residential
Medium Density Residential
Low Density Residential
Low Density Residential
Low Density Residential
Low Density Residential
Low Density Residential
Very Low Density Residential
Very Low Density Residential
Very Low Density Residential
Very Low Density Residential
Very Low Density Residential
Very Low Density Residential
Conservation/Open Space
Agricultural/Cropland
Agricultural/Cropland
Agricultural/Cropland
Agricultural/Cropland
Agricultural/Cropland
Conservation/Open Space
Conservation/Open Space
Conservation/Open Space
Conservation/Open Space

Soil Area Area Product of
Landuse Group RCN (Acres) (Sq. Mi.) RCN and Area
B 89 0.3 0.000 22
B/D 89 2.3 0.004 206
C 92 2.0 0.003 183
D 93 2.8 0.004 256
B 75 0.3 0.000 20
B/D 75 6.2 0.010 463
C 83 2.1 0.003 172
D 87 3.8 0.006 331
B 70 1.4 0.002 99
B/D 70 4.4 0.007 307
C 80 3.3 0.005 267
D 85 6.4 0.010 541
B/D 68 1.2 0.002 81
C 79 0.2 0.000 15
D 84 0.3 0.000 22
B/D 69 0.6 0.001 39
D 84 1.4 0.002 117
B 69 0.2 0.000 13
B/D 69 5.7 0.009 391
C 79 0.4 0.001 34
D 84 1.0 0.002 82
Totals = 45.97 0.072 3660.4
Total (weighted) RCN = total product/total area = 79.62
RCN used = 80
Soil Area Area Product of
Landuse Group RCN (Acres) (Sq. Mi.) RCN and Area
B 89 0.1 0.000 7
C 92 0.0 0.000 4
B/D 85 0.0 0.000 3
B/D 75 0.1 0.000 8
B 70 0.1 0.000 6
C 80 0.7 0.001 55
D 85 0.7 0.001 64
B/D 68 1.3 0.002 91
C 79 0.3 0.001 25
D 84 0.5 0.001 43
B/D 69 44.4 0.069 3064
C 79 3.6 0.006 285
D 84 2.2 0.003 187
Totals = 54.21 0.085 3843.2
Total (weighted) RCN = total product/total area = 70.89
RCN used = 71
Medium Density Residential
Medium Density Residential
Low Density Residential
Low Density Residential
Low Density Residential
Very Low Density Residential
Very Low Density Residential
Right‐Of‐Way
Right‐Of‐Way
Right‐Of‐Way
High Density Residential
High Density Residential
High Density Residential
High Density Residential
Medium Density Residential
Medium Density Residential
Conservation/Open Space
Conservation/Open Space
Conservation/Open Space
Conservation/Open Space
Subbasin: SCUT ‐ 1B
Right‐Of‐Way
Right‐Of‐Way
Office/Institutional/Multi‐Family
High Density Residential
Medium Density Residential
Medium Density Residential
Medium Density Residential
Low Density Residential
Low Density Residential
Conservation/Open Space
Conservation/Open Space
Low Density Residential
Conservation/Open Space
Right‐Of‐Way
Subbasin: SCUT ‐ 1A

Soil Area Area Product of
Landuse Group RCN (Acres) (Sq. Mi.) RCN and Area
B 89 3.8 0.006 339
B/D 89 0.4 0.001 40
C 92 2.7 0.004 249
D 93 0.0 0.000 2
B 75 4.1 0.006 304
B/D 75 0.1 0.000 5
C 83 3.1 0.005 259
B 70 7.5 0.012 528
B/D 70 1.0 0.002 73
C 80 9.5 0.015 758
D 85 0.9 0.001 79
B 68 0.4 0.001 26
C 79 1.4 0.002 110
D 84 0.1 0.000 8
Totals = 35.06 0.055 2777.9
Total (weighted) RCN = total product/total area = 79.23
RCN used = 79
Soil Area Area Product of
Landuse Group RCN (Acres) (Sq. Mi.) RCN and Area
B 89 0.8 0.001 67
C 92 0.3 0.000 27
D 93 0.1 0.000 9
B 92 0.1 0.000 10
B/D 92 0.8 0.001 75
C 94 1.9 0.003 181
B 85 0.3 0.000 24
B/D 85 0.0 0.000 2
C 90 2.0 0.003 176
D 92 0.2 0.000 23
D 85 0.0 0.000 1
B 68 0.4 0.001 27
B/D 68 10.0 0.016 682
C 79 3.4 0.005 269
D 84 0.0 0.000 2
B 69 4.8 0.008 334
B/D 69 7.9 0.012 542
C 79 4.5 0.007 356
D 84 3.8 0.006 322
Totals = 41.39 0.065 3127.4
Total (weighted) RCN = total product/total area = 75.56
RCN used = 76
Subbasin: SCUT ‐ 1C
Right‐Of‐Way
Office/Institutional/Multi‐Family
Right‐Of‐Way
Right‐Of‐Way
High Density Residential
Medium Density Residential
Medium Density Residential
Medium Density Residential
Medium Density Residential
Low Density Residential
Low Density Residential
Right‐Of‐Way
High Density Residential
High Density Residential
Conservation/Open Space
Conservation/Open Space
Conservation/Open Space
Conservation/Open Space
Low Density Residential
Subbasin: SCUT ‐ 1D
Office/Institutional/Multi‐Family
Office/Institutional/Multi‐Family
Medium Density Residential
Low Density Residential
Low Density Residential
Low Density Residential
Low Density Residential
Right‐Of‐Way
Right‐Of‐Way
Right‐Of‐Way
Commercial
Commercial
Commercial
Office/Institutional/Multi‐Family

Soil Area Area Product of
Landuse Group RCN (Acres) (Sq. Mi.) RCN and Area
B 89 0.7 0.001 59
C 92 0.2 0.000 17
D 93 0.1 0.000 12
B 85 14.7 0.023 1248
C 90 2.1 0.003 193
D 92 1.1 0.002 106
B 85 2.3 0.004 192
C 90 2.0 0.003 179
D 92 2.7 0.004 250
B 70 2.6 0.004 180
C 80 0.2 0.000 18
D 85 0.2 0.000 20
W 100 0.1 0.000 13
Totals = 29.08 0.045 2486.6
Total (weighted) RCN = total product/total area = 85.51
RCN used = 86
Soil Area Area Product of
Landuse Group RCN (Acres) (Sq. Mi.) RCN and Area
B 89 5.0 0.008 447
C 92 0.8 0.001 71
D 93 0.7 0.001 62
B 92 3.7 0.006 336
C 94 2.0 0.003 189
B 85 0.0 0.000 0
B 85 19.6 0.031 1669
C 90 6.4 0.010 580
D 92 6.7 0.011 619
B 75 0.1 0.000 10
B 70 7.0 0.011 491
D 85 0.8 0.001 65
B 68 5.1 0.008 345
C 79 0.2 0.000 15
B 69 1.2 0.002 81
B 69 0.3 0.000 20
D 84 0.1 0.000 9
W 100 0.1 0.000 10
Totals = 59.78 0.093 5019.6
Total (weighted) RCN = total product/total area = 83.96
RCN used = 84
Medium Density Residential
Water
Subbasin: SCUT ‐ 3
Subbasin: SCUT ‐ 2
Low Density Residential
Very Low Density Residential
Conservation/Open Space
Conservation/Open Space
Water
Right‐Of‐Way
Right‐Of‐Way
Right‐Of‐Way
Office/Institutional/Medical
Office/Institutional/Multi‐Family
Medium Density Residential
Right‐Of‐Way
Medium Density Residential
Low Density Residential
Medium Density Residential
Right‐Of‐Way
Right‐Of‐Way
Commercial
Commercial
Office/Institutional/Medical
Office/Institutional/Multi‐Family
Office/Institutional/Multi‐Family
Office/Institutional/Multi‐Family
High Density Residential
Office/Institutional/Medical
Office/Institutional/Medical
Office/Institutional/Multi‐Family
Office/Institutional/Multi‐Family
Medium Density Residential

Soil Area Area Product of
Landuse Group RCN (Acres) (Sq. Mi.) RCN and Area
B 89 0.1 0.000 11
B/D 93 1.1 0.002 104
C 92 1.5 0.002 138
D 93 0.5 0.001 49
A 89 1.2 0.002 104
B 92 28.2 0.044 2593
B/D 95 24.4 0.038 2318
C 94 23.2 0.036 2177
D 95 10.9 0.017 1035
A 77 0.0 0.000 0
B 85 2.5 0.004 213
B/D 92 0.0 0.000 1
C 90 0.4 0.001 38
B 85 3.2 0.005 271
B/D 92 5.8 0.009 531
B/D 84 0.9 0.001 75
B 69 10.2 0.016 701
B/D 84 32.5 0.051 2728
C 79 2.0 0.003 155
W 100 1.9 0.003 190
Totals = 150.38 0.235 13433.2
Total (weighted) RCN = total product/total area = 89.33
RCN used = 89*
Soil Area Area Product of
Landuse Group RCN (Acres) (Sq. Mi.) RCN and Area
B 89 0.3 0.000 25
C 92 3.7 0.006 341
D 93 0.0 0.000 0
B 92 3.5 0.005 323
C 94 8.3 0.013 785
D 95 4.7 0.007 446
B 85 0.4 0.001 37
C 90 0.9 0.001 79
D 92 0.7 0.001 62
B 85 1.3 0.002 111
C 90 0.3 0.001 31
D 92 0.7 0.001 65
B 75 0.9 0.001 64
C 83 0.3 0.000 25
C 79 0.0 0.000 1
B 69 2.2 0.003 152
C 79 0.0 0.000 0
B 69 1.0 0.002 68
C 79 0.1 0.000 10
D 84 1.6 0.002 134
Totals = 30.95 0.048 2758.0
Total (weighted) RCN = total product/total area = 89.11
RCN used = 89
Subbasin: SCUT ‐ 4A
Right‐Of‐Way
Mixed Use/Office/Institutional
Mixed Use/Office/Institutional
Office/Institutional/Medical
Office/Institutional/Multi‐Family
Office/Institutional/Multi‐Family
Low Density Residential
Right‐Of‐Way
Right‐Of‐Way
Right‐Of‐Way
Commercial
Commercial
Commercial
Commercial
Commercial
Mixed Use/Office/Institutional
Conservation/Open Space
Conservation/Open Space
Conservation/Open Space
Water
Subbasin: SCUT ‐ 4B
Right‐Of‐Way
Office/Institutional/Multi‐Family
Office/Institutional/Multi‐Family
High Density Residential
Right‐Of‐Way
Right‐Of‐Way
Commercial
Commercial
Commercial
Office/Institutional/Medical
Office/Institutional/Medical
Office/Institutional/Medical
Office/Institutional/Multi‐Family
High Density Residential
Low Density Residential
Very Low Density Residential
Very Low Density Residential
Conservation/Open Space
Conservation/Open Space
Conservation/Open Space

Soil Area Area Product of
Landuse Group RCN (Acres) (Sq. Mi.) RCN and Area
B 89 0.1 0.000 9
C 92 1.8 0.003 165
D 93 0.0 0.000 2
C 94 2.4 0.004 223
D 95 0.0 0.000 2
B 85 3.7 0.006 315
C 90 4.2 0.007 378
D 92 2.8 0.004 257
B 68 0.8 0.001 52
C 79 2.5 0.004 194
D 84 0.4 0.001 37
B 69 0.7 0.001 48
C 79 8.1 0.013 641
D 84 6.9 0.011 584
Totals = 34.44 0.054 2907.2
Total (weighted) RCN = total product/total area = 84.42
RCN used = 84
Soil Area Area Product of
Landuse Group RCN (Acres) (Sq. Mi.) RCN and Area
B 89 0.4 0.001 33
C 92 0.3 0.001 30
D 93 0.4 0.001 36
A 77 1.6 0.002 122
B 85 5.2 0.008 441
C 90 0.4 0.001 39
D 92 1.1 0.002 101
A 77 0.0 0.000 1
B 85 7.2 0.011 613
C 90 0.0 0.000 1
D 92 7.9 0.012 725
B 68 0.2 0.000 10
C 79 1.2 0.002 98
W 100 0.4 0.001 41
Totals = 26.33 0.041 2293.6
Total (weighted) RCN = total product/total area = 87.10
RCN used = 87
Office/Institutional/Multi‐Family
Office/Institutional/Multi‐Family
Office/Institutional/Multi‐Family
Low Density Residential
Low Density Residential
Subbasin: SCUT ‐ 4C
Mixed Use/Office/Institutional
Office/Institutional/Multi‐Family
Office/Institutional/Multi‐Family
Office/Institutional/Multi‐Family
Office/Institutional/Multi‐Family
Low Density Residential
Low Density Residential
Water
Right‐Of‐Way
Conservation/Open Space
Conservation/Open Space
Conservation/Open Space
Right‐Of‐Way
Right‐Of‐Way
Mixed Use/Office/Institutional
Mixed Use/Office/Institutional
Mixed Use/Office/Institutional
Low Density Residential
Subbasin: SCUT ‐ 4D
Right‐Of‐Way
Right‐Of‐Way
Right‐Of‐Way
Commercial
Commercial

Soil Area Area Product of
Landuse Group RCN (Acres) (Sq. Mi.) RCN and Area
B 89 0.3 0.000 27
C 92 0.6 0.001 60
A 77 3.7 0.006 286
B 85 12.3 0.019 1045
C 90 4.1 0.006 372
D 92 7.3 0.011 667
B 85 7.4 0.012 626
C 90 2.1 0.003 186
D 92 1.8 0.003 165
Totals = 39.55 0.062 3432.0
Total (weighted) RCN = total product/total area = 86.78
RCN used = 87
Mixed Use/Office/Institutional
Mixed Use/Office/Institutional
Office/Institutional/Multi‐Family
Office/Institutional/Multi‐Family
Office/Institutional/Multi‐Family
Subbasin: SCUT ‐ 5
Right‐Of‐Way
Right‐Of‐Way
Mixed Use/Office/Institutional
Mixed Use/Office/Institutional

Project: City of Greenville ‐ Swift Creek Watershed
Conditions: Future
Prepared by: SMB
Checked by: TLM
Date: 9/8/2015
Soil Area Area Product of
Landuse Group RCN (Acres) (Sq. Mi.) RCN and Area
C 92 0.4 0.001 40
D 93 0.5 0.001 44
D 85 0.0 0.000 3
B 69 26.1 0.041 1802
B/D 69 13.2 0.021 910
C 79 32.7 0.051 2581
D 84 29.6 0.046 2486
Totals = 102.5 0.160 7866.9
Total (weighted) RCN = total product/total area = 76.73
RCN used = 77
Soil Area Area Product of
Landuse Group RCN (Acres) (Sq. Mi.) RCN and Area
B 89 0.5 0.001 45
B/D 89 0.3 0.000 28
C 92 3.5 0.005 322
D 93 6.4 0.010 599
D 92 0.6 0.001 52
B/D 70 0.1 0.000 7
C 80 3.0 0.005 244
D 85 22.0 0.034 1867
B 69 12.8 0.020 880
B/D 69 18.2 0.028 1256
C 79 32.0 0.050 2527
D 84 52.6 0.082 4419
Totals = 152.0 0.237 12245.8
Total (weighted) RCN = total product/total area = 80.57
RCN used = 81
SCS Runoff Curve Number ‐ Primary System
Right‐Of‐Way
Right‐Of‐Way
Medium Density Residential
Right‐Of‐Way
Right‐Of‐Way
Mixed Use/Office/Institutional
Medium Density Residential
Subbasin: GS ‐ 1A
Very Low Density Residential
Very Low Density Residential
Very Low Density Residential
Very Low Density Residential
Right‐Of‐Way
Very Low Density Residential
Subbasin: GS ‐ 1B
Very Low Density Residential
Very Low Density Residential
Very Low Density Residential
Right‐Of‐Way
Medium Density Residential
Medium Density Residential

Soil Area Area Product of
Landuse Group RCN (Acres) (Sq. Mi.) RCN and Area
B 89 0.1 0.000 7
C 92 1.5 0.002 134
D 93 1.4 0.002 130
C 90 0.7 0.001 61
D 92 0.4 0.001 39
C 83 0.1 0.000 8
C 80 1.0 0.001 76
C 79 1.1 0.002 88
D 84 7.1 0.011 597
B 69 16.2 0.025 1118
B/D 69 1.3 0.002 88
C 79 108.2 0.169 8550
D 84 133.8 0.209 11238
B 69 3.2 0.005 218
B/D 69 10.3 0.016 709
C 79 14.5 0.023 1146
D 84 21.1 0.033 1771
Totals = 321.8 0.503 25979.7
Total (weighted) RCN = total product/total area = 80.72
RCN used = 81
Soil Area Area Product of
Landuse Group RCN (Acres) (Sq. Mi.) RCN and Area
B 89 2.1 0.003 187
B/D 89 0.4 0.001 34
C 92 2.6 0.004 236
D 93 1.4 0.002 127
B/D 75 2.8 0.004 212
B 70 0.7 0.001 47
C 80 0.1 0.000 7
B 68 7.1 0.011 480
B/D 68 1.5 0.002 101
C 79 7.8 0.012 616
D 84 6.7 0.011 565
B 69 3.4 0.005 236
B/D 69 8.5 0.013 588
C 79 9.7 0.015 764
D 84 9.6 0.015 803
Totals = 64.3 0.100 5005.1
Total (weighted) RCN = total product/total area = 77.88
RCN used = 78
Mixed Use/Office/Institutional
Subbasin: GS ‐ 1C
Low Density Residential
Low Density Residential
Right‐Of‐Way
Right‐Of‐Way
Right‐Of‐Way
High Density Residential
Very Low Density Residential
Very Low Density Residential
Right‐Of‐Way
Right‐Of‐Way
Mixed Use/Office/Institutional
High Density Residential
Medium Density Residential
Very Low Density Residential
Very Low Density Residential
Very Low Density Residential
Conservation/Open Space
Conservation/Open Space
Conservation/Open Space
Conservation/Open Space
Medium Density Residential
Medium Density Residential
Right‐Of‐Way
Right‐Of‐Way
Subbasin: GS ‐ 1D
Low Density Residential
Low Density Residential
Low Density Residential
Low Density Residential
Very Low Density Residential
Very Low Density Residential
Very Low Density Residential

Soil Area Area Product of
Landuse Group RCN (Acres) (Sq. Mi.) RCN and Area
B 89 0.6 0.001 52
C 92 7.6 0.012 702
D 93 1.4 0.002 134
C 91 1.8 0.003 166
D 93 1.6 0.003 149
C 94 4.3 0.007 402
C 90 1.1 0.002 102
D 92 1.2 0.002 111
B 70 0.2 0.000 17
C 80 3.4 0.005 271
D 85 2.9 0.005 250
C 79 12.5 0.020 988
D 84 5.4 0.008 457
B 69 22.0 0.034 1521
C 79 157.4 0.246 12432
D 84 68.5 0.107 5753
Totals = 292.13 0.456 23508.4
Total (weighted) RCN = total product/total area = 80.47
RCN used = 80
Soil Area Area Product of
Landuse Group RCN (Acres) (Sq. Mi.) RCN and Area
B 92 0.9 0.001 84
C 94 4.8 0.007 447
D 95 3.0 0.005 290
B 85 0.1 0.000 6
C 90 6.5 0.010 584
B 70 3.2 0.005 221
C 80 17.1 0.027 1366
D 85 8.2 0.013 694
C 79 0.2 0.000 15
D 84 0.1 0.000 7
Totals = 43.9 0.069 3712.4
Total (weighted) RCN = total product/total area = 84.50
RCN used = 85
Right‐Of‐Way
Mixed Use/Office/Institutional
Low Density Residential
Right‐Of‐Way
Right‐Of‐Way
Subbasin: GS ‐ 2A
Right‐Of‐Way
Industrial
Industrial
Medium Density Residential
Right‐Of‐Way
Right‐Of‐Way
Mixed Use/Office/Institutional
Medium Density Residential
Medium Density Residential
Medium Density Residential
Low Density Residential
Subbasin: GS ‐ 2B
Medium Density Residential
Medium Density Residential
Very Low Density Residential
Very Low Density Residential
Very Low Density Residential
Low Density Residential
Low Density Residential
Commercial
Mixed Use/Office/Institutional
Mixed Use/Office/Institutional

Soil Area Area Product of
Landuse Group RCN (Acres) (Sq. Mi.) RCN and Area
B 89 0.7 0.001 63
C 95 1.2 0.002 113
D 93 0.4 0.001 35
B 75 0.7 0.001 52
C 83 0.5 0.001 40
D 87 0.8 0.001 72
C 80 0.3 0.001 28
D 85 0.5 0.001 39
B 68 1.1 0.002 78
C 79 0.1 0.000 6
B 69 6.3 0.010 434
C 79 13.2 0.021 1045
D 84 1.7 0.003 146
B 69 2.6 0.004 182
B/D 69 0.1 0.000 5
C 79 3.3 0.005 258
D 84 3.2 0.005 271
D 89 0.1 0.000 7
Totals = 36.8 0.058 2874.3
Total (weighted) RCN = total product/total area = 78.01
RCN used = 78
Soil Area Area Product of
Landuse Group RCN (Acres) (Sq. Mi.) RCN and Area
B 89 5.0 0.008 442
C 92 4.1 0.006 378
D 93 1.0 0.002 97
B 75 4.7 0.007 352
C 83 0.4 0.001 37
D 87 0.7 0.001 65
B 70 2.7 0.004 186
C 80 7.3 0.011 580
D 85 5.3 0.008 453
B 68 4.3 0.007 291
C 79 21.3 0.033 1679
D 84 5.5 0.009 465
B 69 5.8 0.009 397
C 79 5.8 0.009 462
D 84 7.6 0.012 636
D 84 0.9 0.001 73
Totals = 82.35 0.129 6592.9
Total (weighted) RCN = total product/total area = 80.06
RCN used = 80
Very Low Density Residential
Conservation/Open Space
Conservation/Open Space
Conservation/Open Space
Conservation/Open Space
Agricultural/Cropland
Medium Density Residential
Right‐Of‐Way
High Density Residential
Medium Density Residential
Low Density Residential
Low Density Residential
Low Density Residential
Very Low Density Residential
Very Low Density Residential
Medium Density Residential
High Density Residential
High Density Residential
Subbasin: GS ‐ 3
Right‐Of‐Way
Subbasin: GS ‐ 2C
Right‐Of‐Way
Right‐Of‐Way
Very Low Density Residential
Very Low Density Residential
Conservation/Open Space
Right‐Of‐Way
Right‐Of‐Way
High Density Residential
High Density Residential
High Density Residential
Medium Density Residential
Medium Density Residential
Low Density Residential
Low Density Residential
Very Low Density Residential

Soil Area Area Product of
Landuse Group RCN (Acres) (Sq. Mi.) RCN and Area
B 89 0.6 0.001 55
C 92 2.8 0.004 258
D 93 1.9 0.003 175
B 75 0.1 0.000 10
C 83 0.4 0.001 31
D 87 0.1 0.000 8
B 70 1.5 0.002 105
B/D 70 0.2 0.000 17
C 80 16.7 0.026 1337
D 85 2.7 0.004 229
B 68 0.6 0.001 44
C 79 6.8 0.011 540
D 84 12.4 0.019 1042
B 69 0.2 0.000 11
C 79 1.0 0.002 82
D 84 0.2 0.000 13
Totals = 48.31 0.075 3958.1
Total (weighted) RCN = total product/total area = 81.94
RCN used = 82
Soil Area Area Product of
Landuse Group RCN (Acres) (Sq. Mi.) RCN and Area
B 89 3.2 0.005 282
C 92 9.6 0.015 879
D 93 0.9 0.001 80
B 75 7.1 0.011 534
C 83 14.2 0.022 1175
D 87 1.6 0.002 135
B 70 1.1 0.002 77
C 80 16.3 0.025 1305
B 68 2.2 0.003 147
C 79 16.9 0.026 1334
D 84 1.4 0.002 116
B 69 0.0 0.000 2
Totals = 74.3 0.116 6065.3
Total (weighted) RCN = total product/total area = 81.66
RCN used = 82
Medium Density Residential
Right‐Of‐Way
Right‐Of‐Way
Right‐Of‐Way
High Density Residential
High Density Residential
High Density Residential
Low Density Residential
Low Density Residential
Medium Density Residential
Low Density Residential
Right‐Of‐Way
Subbasin: GS ‐ 4B
Medium Density Residential
Very Low Density Residential
Very Low Density Residential
Very Low Density Residential
Right‐Of‐Way
Medium Density Residential
Conservation/Open Space
Low Density Residential
Medium Density Residential
High Density Residential
High Density Residential
High Density Residential
Medium Density Residential
Low Density Residential
Low Density Residential
Subbasin: GS ‐ 4A
Right‐Of‐Way

Soil Area Area Product of
Landuse Group RCN (Acres) (Sq. Mi.) RCN and Area
B 89 0.7 0.001 64
C 92 5.5 0.009 503
B 75 3.0 0.005 228
C 83 14.8 0.023 1230
C 80 2.1 0.003 171
B 68 2.9 0.005 199
C 79 27.9 0.044 2202
B 69 3.3 0.005 226
C 79 3.0 0.005 238
Totals = 63.28 0.099 5061.7
Total (weighted) RCN = total product/total area = 79.99
RCN used = 80
Soil Area Area Product of
Landuse Group RCN (Acres) (Sq. Mi.) RCN and Area
B 89 4.7 0.007 419
C 92 4.4 0.007 406
D 93 1.0 0.002 95
B 75 4.3 0.007 324
C 83 2.1 0.003 174
D 87 0.5 0.001 48
B 70 21.3 0.033 1488
C 80 21.4 0.033 1709
D 85 4.2 0.007 354
B 68 1.8 0.003 121
C 79 9.0 0.014 709
D 84 4.1 0.006 343
B 69 3.1 0.005 212
C 79 3.1 0.005 245
Totals = 84.90 0.133 6646.2
Total (weighted) RCN = total product/total area = 78.28
RCN used = 78
Right‐Of‐Way
Right‐Of‐Way
High Density Residential
High Density Residential
Medium Density Residential
Low Density Residential
Low Density Residential
Very Low Density Residential
Very Low Density Residential
Subbasin: GS ‐ 4D
Right‐Of‐Way
Right‐Of‐Way
Right‐Of‐Way
High Density Residential
High Density Residential
High Density Residential
Low Density Residential
Medium Density Residential
Medium Density Residential
Medium Density Residential
Low Density Residential
Low Density Residential
Very Low Density Residential
Very Low Density Residential
Subbasin: GS ‐ 4C

Soil Area Area Product of
Landuse Group RCN (Acres) (Sq. Mi.) RCN and Area
B 89 3.5 0.006 315
C 92 3.3 0.005 302
D 93 0.1 0.000 13
B 75 5.0 0.008 375
C 83 2.7 0.004 227
D 87 0.4 0.001 38
B 70 4.4 0.007 307
C 80 2.3 0.004 183
D 85 0.3 0.000 23
B 69 5.1 0.008 351
C 79 0.8 0.001 63
D 84 0.0 0.000 0
C 79 0.2 0.000 14
D 84 1.3 0.002 106
B 69 0.9 0.001 65
C 79 1.0 0.002 81
D 84 2.2 0.003 182
Totals = 33.5 0.052 2645.2
Total (weighted) RCN = total product/total area = 78.87
RCN used = 79
Soil Area Area Product of
Landuse Group RCN (Acres) (Sq. Mi.) RCN and Area
B 89 1.5 0.002 138
C 92 0.0 0.000 0
D 93 0.1 0.000 12
C 85 0.0 0.000 1
D 92 0.2 0.000 23
B 85 11.7 0.018 996
D 92 1.4 0.002 128
B 75 0.0 0.000 2
C 83 1.0 0.002 84
D 87 3.2 0.005 274
B 70 2.7 0.004 187
C 80 0.1 0.000 9
B 68 4.3 0.007 293
D 84 1.8 0.003 151
B 69 35.7 0.056 2461
C 79 10.3 0.016 811
D 84 5.9 0.009 496
C 61 0.2 0.000 10
D 74 17.0 0.027 1260
Totals = 97.2 0.152 7337.8
Total (weighted) RCN = total product/total area = 75.51
RCN used = 76
Low Density Residential
Very Low Density Residential
Very Low Density Residential
Very Low Density Residential
Conservation/Open Space
Conservation/Open Space
High Density Residential
Medium Density Residential
Medium Density Residential
High Density Residential
High Density Residential
Medium Density Residential
Right‐Of‐Way
Right‐Of‐Way
Right‐Of‐Way
Right‐Of‐Way
Right‐Of‐Way
Subbasin: GS ‐ 4E
Medium Density Residential
Medium Density Residential
Low Density Residential
Low Density Residential
Low Density Residential
Very Low Density Residential
Very Low Density Residential
Low Density Residential
Mixed Use/Office/Institutional
Mixed Use/Office/Institutional
Office/Institutional/Multi‐Family
Office/Institutional/Multi‐Family
High Density Residential
High Density Residential
Conservation/Open Space
Conservation/Open Space
Conservation/Open Space
Right‐Of‐Way
High Density Residential
Subbasin: GS ‐ 5A

Soil Area Area Product of
Landuse Group RCN (Acres) (Sq. Mi.) RCN and Area
B 89 3.1 0.005 279
C 92 3.6 0.006 334
D 93 0.2 0.000 20
C 90 0.1 0.000 9
B 75 12.4 0.019 927
C 83 8.2 0.013 677
D 87 0.8 0.001 68
B 70 1.6 0.003 112
C 80 0.4 0.001 28
B 68 0.1 0.000 8
C 79 0.1 0.000 5
Totals = 30.5 0.048 2468.2
Total (weighted) RCN = total product/total area = 80.86
RCN used = 81
Soil Area Area Product of
Landuse Group RCN (Acres) (Sq. Mi.) RCN and Area
B 89 1.5 0.002 133
B 85 8.5 0.013 723
C 90 4.6 0.007 414
D 92 3.3 0.005 302
B 85 0.0 0.000 1
D 92 0.0 0.000 0
B 75 1.0 0.002 78
C 83 0.2 0.000 20
B 70 1.9 0.003 136
B 68 2.7 0.004 185
C 79 1.0 0.002 79
D 84 1.2 0.002 100
Totals = 26.03 0.041 2170.9
Total (weighted) RCN = total product/total area = 83.41
RCN used = 83
Mixed Use/Office/Institutional
High Density Residential
High Density Residential
High Density Residential
Low Density Residential
Right‐Of‐Way
High Density Residential
High Density Residential
Medium Density Residential
Subbasin: GS ‐ 5C
Low Density Residential
Medium Density Residential
Medium Density Residential
Mixed Use/Office/Institutional
Mixed Use/Office/Institutional
Right‐Of‐Way
Right‐Of‐Way
Right‐Of‐Way
Subbasin: GS ‐ 5B
Mixed Use/Office/Institutional
Office/Institutional/Multi‐Family
Office/Institutional/Multi‐Family
Low Density Residential
Low Density Residential
Low Density Residential

Soil Area Area Product of
Landuse Group RCN (Acres) (Sq. Mi.) RCN and Area
B 89 5.5 0.009 488
C 92 1.4 0.002 128
D 93 2.3 0.004 211
A 77 5.0 0.008 383
B 85 20.6 0.032 1754
C 90 5.0 0.008 449
D 92 7.0 0.011 640
B 70 1.3 0.002 94
B 68 21.5 0.034 1464
C 79 6.2 0.010 490
D 84 10.7 0.017 901
Totals = 86.52 0.135 7003.6
Total (weighted) RCN = total product/total area = 80.95
RCN used = 81
Soil Area Area Product of
Landuse Group RCN (Acres) (Sq. Mi.) RCN and Area
B 89 1.3 0.002 115
C 92 0.2 0.000 20
D 93 0.1 0.000 6
A 77 7.7 0.012 594
B 85 25.8 0.040 2190
C 90 11.8 0.018 1063
D 92 1.3 0.002 116
A 51 0.0 0.000 1
B 68 3.7 0.006 248
C 79 1.2 0.002 95
D 84 2.4 0.004 206
A 49 16.4 0.026 803
B 69 8.2 0.013 564
C 79 6.5 0.010 517
D 84 0.3 0.000 25
D 80 19.8 0.031 1588
Totals = 106.70 0.167 8150.8
Total (weighted) RCN = total product/total area = 76.39
RCN used = 76
Low Density Residential
Low Density Residential
Very Low Density Residential
Very Low Density Residential
Very Low Density Residential
Very Low Density Residential
Conservation/Open Space
Mixed Use/Office/Institutional
Right‐Of‐Way
Right‐Of‐Way
Subbasin: GS ‐ 5D
Right‐Of‐Way
Mixed Use/Office/Institutional
Mixed Use/Office/Institutional
Subbasin: GS ‐ 6
Right‐Of‐Way
Right‐Of‐Way
Right‐Of‐Way
Mixed Use/Office/Institutional
Mixed Use/Office/Institutional
Mixed Use/Office/Institutional
Medium Density Residential
Low Density Residential
Low Density Residential
Low Density Residential
Mixed Use/Office/Institutional
Mixed Use/Office/Institutional
Low Density Residential
Low Density Residential

Soil Area Area Product of
Landuse Group RCN (Acres) (Sq. Mi.) RCN and Area
B 89 0.3 0.000 28
C 92 4.7 0.007 430
D 93 3.5 0.005 323
C 94 28.2 0.044 2651
D 95 0.3 0.000 29
C 83 2.2 0.003 179
B 70 0.5 0.001 37
C 80 12.1 0.019 972
D 85 0.5 0.001 39
B 68 1.2 0.002 79
C 79 14.3 0.022 1128
D 84 4.6 0.007 385
B 69 0.0 0.000 2
C 79 23.9 0.037 1890
D 84 2.1 0.003 178
V
Totals = 98.34 0.154 8348.8
Total (weighted) RCN = total product/total area = 84.89
RCN used = 85
Soil Area Area Product of
Landuse Group RCN (Acres) (Sq. Mi.) RCN and Area
B 89 2.5 0.004 224
C 92 3.7 0.006 342
B 75 22.9 0.036 1718
C 83 8.7 0.014 722
D 87 1.0 0.002 84
B 70 7.0 0.011 489
C 80 4.9 0.008 394
B 68 1.8 0.003 120
C 79 10.8 0.017 850
C 79 1.8 0.003 146
Totals = 65.07 0.102 5087.3
Total (weighted) RCN = total product/total area = 78.19
RCN used = 78
Low Density Residential
Low Density Residential
Low Density Residential
Very Low Density Residential
Very Low Density Residential
Very Low Density Residential
Subbasin: SC ‐ 1A
Right‐Of‐Way
Right‐Of‐Way
Right‐Of‐Way
Commercial
Commercial
High Density Residential
Medium Density Residential
Medium Density Residential
Medium Density Residential
High Density Residential
High Density Residential
Medium Density Residential
Medium Density Residential
Low Density Residential
Low Density Residential
Very Low Density Residential
Subbasin: SC ‐ 1B
Right‐Of‐Way
Right‐Of‐Way
High Density Residential

Soil Area Area Product of
Landuse Group RCN (Acres) (Sq. Mi.) RCN and Area
B 89 2.3 0.004 200
B/D 89 0.2 0.000 22
C 92 2.3 0.004 216
D 93 2.0 0.003 182
B 92 38.8 0.061 3568
B/D 92 1.7 0.003 160
C 94 44.5 0.070 4185
D 95 23.1 0.036 2199
B 85 0.1 0.000 9
C 90 1.9 0.003 167
D 92 0.5 0.001 43
B 75 0.1 0.000 5
C 83 1.6 0.003 135
D 87 1.4 0.002 119
B 68 2.9 0.004 195
B/D 68 1.3 0.002 89
C 79 4.6 0.007 360
D 84 0.1 0.000 12
Totals = 129.35 0.202 11865.8
Total (weighted) RCN = total product/total area = 91.73
RCN used = 92
Soil Area Area Product of
Landuse Group RCN (Acres) (Sq. Mi.) RCN and Area
C 92 0.8 0.001 75
D 93 0.2 0.000 22
B 92 2.3 0.004 211
C 94 1.7 0.003 163
B 75 2.3 0.004 169
B/D 75 0.6 0.001 46
C 83 8.4 0.013 701
D 87 12.3 0.019 1071
D 85 0.1 0.000 6
C 68 7.2 0.011 487
D 84 3.9 0.006 329
B 69 0.1 0.000 4
B/D 69 13.9 0.022 956
C 79 26.5 0.041 2093
D 84 19.9 0.031 1668
Totals = 100.11 0.156 8000.4
Total (weighted) RCN = total product/total area = 79.92
RCN used = 80
Subbasin: SC ‐ 1C
Subbasin: SC ‐ 1D
Right‐Of‐Way
Right‐Of‐Way
Commercial
Commercial
Low Density Residential
Mixed Use/Office/Institutional
Mixed Use/Office/Institutional
Mixed Use/Office/Institutional
High Density Residential
High Density Residential
High Density Residential
Low Density Residential
Low Density Residential
Low Density Residential
Right‐Of‐Way
Right‐Of‐Way
Right‐Of‐Way
Right‐Of‐Way
Commercial
Commercial
Commercial
Commercial
Very Low Density Residential
Very Low Density Residential
High Density Residential
High Density Residential
High Density Residential
High Density Residential
Medium Density Residential
Low Density Residential
Low Density Residential
Very Low Density Residential
Very Low Density Residential

Soil Area Area Product of
Landuse Group RCN (Acres) (Sq. Mi.) RCN and Area
B 89 0.2 0.000 20
C 92 8.9 0.014 818
D 93 3.0 0.005 277
B 85 0.5 0.001 40
C 90 3.1 0.005 277
C 83 0.1 0.000 12
D 87 1.0 0.002 85
B 70 0.8 0.001 58
C 80 21.7 0.034 1736
D 85 11.0 0.017 936
C 79 34.3 0.054 2711
D 84 13.3 0.021 1117
B 69 0.0 0.000 1
C 79 10.2 0.016 803
D 84 3.4 0.005 286
Totals = 111.50 0.174 9176.9
Total (weighted) RCN = total product/total area = 82.30
RCN used = 82
Soil Area Area Product of
Landuse Group RCN (Acres) (Sq. Mi.) RCN and Area
B 89 0.3 0.000 26
B/D 92 0.1 0.000 7
C 93 0.3 0.000 25
B 85 1.5 0.002 126
B/D 85 19.7 0.031 1674
C 90 50.9 0.080 4585
D 92 29.5 0.046 2711
B/D 70 0.0 0.000 2
D 70 0.1 0.000 4
B/D 68 0.0 0.000 1
D 84 0.0 0.000 0
Totals = 102.32 0.160 9160.3
Total (weighted) RCN = total product/total area = 89.53
RCN used = 90
Low Density Residential
Right‐Of‐Way
Subbasin: SC ‐ 1E
Right‐Of‐Way
Right‐Of‐Way
Mixed Use/Office/Institutional
Mixed Use/Office/Institutional
High Density Residential
High Density Residential
Medium Density Residential
Medium Density Residential
Medium Density Residential
Subbasin: SC ‐ 2A
Low Density Residential
Low Density Residential
Very Low Density Residential
Very Low Density Residential
Very Low Density Residential
Medium Density Residential
Medium Density Residential
Low Density Residential
Right‐Of‐Way
Right‐Of‐Way
Right‐Of‐Way
Mixed Use/Office/Institutional
Mixed Use/Office/Institutional
Mixed Use/Office/Institutional
Mixed Use/Office/Institutional

Soil Area Area Product of
Landuse Group RCN (Acres) (Sq. Mi.) RCN and Area
B 89 0.6 0.001 57
B/D 89 0.3 0.001 30
C 92 6.4 0.010 590
D 93 0.3 0.001 30
B 70 2.2 0.003 155
B/D 70 2.8 0.004 196
C 80 31.3 0.049 2506
D 85 6.9 0.011 589
B 68 0.1 0.000 10
B/D 68 0.3 0.001 23
C 79 1.0 0.002 79
D 84 0.1 0.000 8
B 69 0.6 0.001 44
B/D 69 0.7 0.001 50
C 79 4.3 0.007 338
Totals = 58.20 0.091 4705.0
Total (weighted) RCN = total product/total area = 80.84
RCN used = 81
Soil Area Area Product of
Landuse Group RCN (Acres) (Sq. Mi.) RCN and Area
B/D 75 0.1 0.000 7
B/D 70 3.8 0.006 264
C 80 6.5 0.010 520
B/D 68 29.9 0.047 2032
D 79 15.2 0.024 1204
Totals = 55.49 0.087 4027.0
Total (weighted) RCN = total product/total area = 72.57
RCN used = 73
Medium Density Residential
Low Density Residential
Low Density Residential
Low Density Residential
Low Density Residential
Very Low Density Residential
Very Low Density Residential
Very Low Density Residential
High Density Residential
Medium Density Residential
Medium Density Residential
Subbasin: SC ‐ 3A
Very Low Density Residential
Very Low Density Residential
Right‐Of‐Way
Right‐Of‐Way
Right‐Of‐Way
Right‐Of‐Way
Medium Density Residential
Medium Density Residential
Medium Density Residential
Subbasin: SC ‐ 2B

Soil Area Area Product of
Landuse Group RCN (Acres) (Sq. Mi.) RCN and Area
B 89 2.2 0.003 194
B/D 89 0.9 0.001 84
C 92 4.4 0.007 407
D 93 1.5 0.002 138
B 85 0.7 0.001 63
B/D 85 1.9 0.003 162
C 90 0.9 0.001 78
D 92 0.0 0.000 1
B/D 75 0.0 0.000 1
C 83 0.1 0.000 5
B 70 9.8 0.015 687
B/D 70 9.8 0.015 684
C 80 23.3 0.036 1866
D 85 2.2 0.003 183
B 68 0.2 0.000 14
B/D 68 1.8 0.003 121
C 79 0.4 0.001 32
D 84 1.9 0.003 162
Totals = 62.02 0.097 4882.7
Total (weighted) RCN = total product/total area = 78.73
RCN used = 79
Soil Area Area Product of
Landuse Group RCN (Acres) (Sq. Mi.) RCN and Area
B 89 1.5 0.002 138
C 92 3.3 0.005 308
D 93 0.4 0.001 33
B 70 3.5 0.006 246
B/D 70 0.3 0.000 20
C 80 10.5 0.016 844
D 85 1.2 0.002 105
B 68 1.6 0.003 110
B/D 68 0.0 0.000 0
C 79 2.0 0.003 158
D 84 0.3 0.000 22
B 69 1.4 0.002 96
C 79 8.7 0.014 686
Totals = 34.78 0.054 2765.0
Total (weighted) RCN = total product/total area = 79.50
RCN used = 80
Right‐Of‐Way
Medium Density Residential
Medium Density Residential
Medium Density Residential
Subbasin: SC ‐ 3B
Medium Density Residential
Low Density Residential
Low Density Residential
Low Density Residential
Low Density Residential
Right‐Of‐Way
Right‐Of‐Way
Right‐Of‐Way
Mixed Use/Office/Institutional
Mixed Use/Office/Institutional
Mixed Use/Office/Institutional
Mixed Use/Office/Institutional
High Density Residential
High Density Residential
Subbasin: SC ‐ 3C
Right‐Of‐Way
Right‐Of‐Way
Right‐Of‐Way
Medium Density Residential
Medium Density Residential
Medium Density Residential
Medium Density Residential
Low Density Residential
Low Density Residential
Low Density Residential
Low Density Residential
Very Low Density Residential
Very Low Density Residential

Soil Area Area Product of
Landuse Group RCN (Acres) (Sq. Mi.) RCN and Area
B 89 9.3 0.015 828
C 92 4.0 0.006 364
D 93 1.1 0.002 102
B 75 2.1 0.003 160
C 83 1.5 0.002 129
B 70 8.4 0.013 589
C 80 5.5 0.009 440
D 85 0.9 0.001 79
B 68 25.1 0.039 1707
C 79 0.3 0.000 25
D 84 8.8 0.014 740
B 69 16.5 0.026 1140
C 79 11.4 0.018 901
D 84 10.0 0.016 839
B 69 0.0 0.000 1
D 84 2.6 0.004 219
Totals = 107.63 0.168 8261.5
Total (weighted) RCN = total product/total area = 76.76
RCN used = 77
Soil Area Area Product of
Landuse Group RCN (Acres) (Sq. Mi.) RCN and Area
B 89 1.8 0.003 156
C 92 2.5 0.004 228
D 93 0.1 0.000 10
B 85 0.3 0.000 27
C 90 2.5 0.004 225
D 92 0.5 0.001 43
B 75 1.6 0.003 120
C 83 2.3 0.004 194
B 70 2.8 0.004 199
C 80 6.2 0.010 497
D 85 0.7 0.001 56
B 68 0.1 0.000 7
C 79 0.8 0.001 63
D 84 0.3 0.001 29
Totals = 22.51 0.035 1853.0
Total (weighted) RCN = total product/total area = 82.32
RCN used = 82
Right‐Of‐Way
Right‐Of‐Way
Right‐Of‐Way
High Density Residential
High Density Residential
Subbasin: SC ‐ 4
Medium Density Residential
Medium Density Residential
Medium Density Residential
Low Density Residential
Low Density Residential
Low Density Residential
Very Low Density Residential
Very Low Density Residential
Very Low Density Residential
Conservation/Open Space
Conservation/Open Space
Right‐Of‐Way
Right‐Of‐Way
Subbasin: SC ‐ 5A
Right‐Of‐Way
Office/Institutional/Multi‐Family
Office/Institutional/Multi‐Family
Office/Institutional/Multi‐Family
High Density Residential
High Density Residential
Medium Density Residential
Medium Density Residential
Medium Density Residential
Low Density Residential
Low Density Residential
Low Density Residential

Soil Area Area Product of
Landuse Group RCN (Acres) (Sq. Mi.) RCN and Area
B 89 2.9 0.005 261
D 93 0.8 0.001 78
B 85 2.0 0.003 168
C 90 0.0 0.000 0
D 92 1.1 0.002 105
B 75 0.2 0.000 17
B 70 2.9 0.004 200
C 80 0.0 0.000 0
D 85 2.1 0.003 176
B 68 8.4 0.013 569
D 84 5.7 0.009 478
B 69 11.4 0.018 788
D 84 2.3 0.004 196
B 69 3.6 0.006 251
C 79 1.1 0.002 87
D 84 4.6 0.007 387
Totals = 49.21 0.077 3761.5
Total (weighted) RCN = total product/total area = 76.44
RCN used = 76
Right‐Of‐Way
Right‐Of‐Way
Office/Institutional/Medical
Office/Institutional/Multi‐Family
Subbasin: SC ‐ 5B
Office/Institutional/Multi‐Family
High Density Residential
Medium Density Residential
Medium Density Residential
Medium Density Residential
Low Density Residential
Low Density Residential
Very Low Density Residential
Very Low Density Residential
Conservation/Open Space
Conservation/Open Space
Conservation/Open Space

Soil Area Area Product of
Landuse Group RCN (Acres) (Sq. Mi.) RCN and Area
A 83 2.0 0.003 168
B 89 17.7 0.028 1579
B/D 89 10.6 0.017 944
C 92 29.8 0.047 2739
D 93 2.9 0.005 269
B 92 24.3 0.038 2237
B/D 92 15.1 0.024 1388
C 94 27.1 0.042 2549
D 95 11.4 0.018 1080
A 77 14.3 0.022 1100
B 85 29.4 0.046 2502
B/D 85 25.5 0.040 2170
C 90 47.1 0.074 4243
D 92 36.3 0.057 3341
D 92 0.0 0.000 4
B 75 3.1 0.005 231
C 83 2.1 0.003 173
D 87 0.6 0.001 52
B 70 24.9 0.039 1741
C 80 30.8 0.048 2463
D 85 1.3 0.002 107
A 51 4.8 0.008 246
B 68 14.9 0.023 1014
B/D 68 0.3 0.000 21
C 79 47.5 0.074 3751
D 84 0.8 0.001 71
A 49 22.9 0.036 1124
A/D 49 0.3 0.000 13
B 69 99.3 0.155 6855
B/D 69 29.3 0.046 2021
C 79 148.5 0.232 11733
D 84 40.4 0.063 3398
A/D 49 11.9 0.019 585
C 79 13.9 0.022 1101
D 84 85.1 0.133 7151
Totals = 876.52 1.370 70162.0
Total (weighted) RCN = total product/total area = 80.05
RCN used = 80
Conservation/Open Space
Conservation/Open Space
Conservation/Open Space
Right‐Of‐Way
Right‐Of‐Way
Subbasin: SC ‐ 6
Right‐Of‐Way
Right‐Of‐Way
Right‐Of‐Way
Commercial
Commercial
Commercial
Commercial
Mixed Use/Office/Institutional
Mixed Use/Office/Institutional
Mixed Use/Office/Institutional
Mixed Use/Office/Institutional
Mixed Use/Office/Institutional
Office/Institutional/Multi‐Family
Very Low Density Residential
Very Low Density Residential
Very Low Density Residential
Very Low Density Residential
High Density Residential
High Density Residential
Medium Density Residential
Medium Density Residential
Medium Density Residential
Low Density Residential
Low Density Residential
Low Density Residential
Low Density Residential
Low Density Residential
Very Low Density Residential
Very Low Density Residential
High Density Residential

Soil Area Area Product of
Landuse Group RCN (Acres) (Sq. Mi.) RCN and Area
B 89 0.3 0.000 22
B/D 89 2.3 0.004 206
C 92 2.0 0.003 183
D 93 2.8 0.004 256
B/D 85 0.1 0.000 8
D 92 0.5 0.001 42
B 75 0.3 0.000 20
B/D 75 11.5 0.018 861
C 83 2.1 0.003 172
D 87 3.8 0.006 331
B 70 1.6 0.002 111
B/D 70 4.6 0.007 325
C 80 3.8 0.006 302
D 85 6.9 0.011 585
B/D 68 1.2 0.002 81
C 79 0.2 0.000 15
D 84 0.3 0.000 22
B/D 69 0.6 0.001 39
D 84 1.4 0.002 117
Totals = 45.97 0.072 3698.9
Total (weighted) RCN = total product/total area = 80.46
RCN used = 80
Soil Area Area Product of
Landuse Group RCN (Acres) (Sq. Mi.) RCN and Area
B 89 0.1 0.000 7
C 92 0.0 0.000 4
B/D 85 0.0 0.000 3
B/D 75 42.8 0.067 3206
C 83 3.6 0.006 299
D 87 2.2 0.003 194
B 70 0.1 0.000 6
B/D 70 0.5 0.001 38
C 80 0.7 0.001 55
D 85 0.7 0.001 64
B/D 68 1.3 0.002 91
C 79 0.3 0.001 25
D 84 0.5 0.001 43
B/D 69 1.2 0.002 84
Totals = 54.20 0.085 4120.1
Total (weighted) RCN = total product/total area = 76.02
RCN used = 76
Office/Institutional/Multi‐Family
Low Density Residential
Low Density Residential
Medium Density Residential
Medium Density Residential
Medium Density Residential
Subbasin: SCUT ‐ 1B
Right‐Of‐Way
Right‐Of‐Way
Low Density Residential
Very Low Density Residential
Low Density Residential
Low Density Residential
Very Low Density Residential
Very Low Density Residential
Subbasin: SCUT ‐ 1A
High Density Residential
Medium Density Residential
Medium Density Residential
Medium Density Residential
Medium Density Residential
Low Density Residential
Right‐Of‐Way
Right‐Of‐Way
Right‐Of‐Way
Right‐Of‐Way
Office/Institutional/Multi‐Family
Office/Institutional/Multi‐Family
High Density Residential
High Density Residential
High Density Residential
High Density Residential
High Density Residential
High Density Residential
Medium Density Residential

Soil Area Area Product of
Landuse Group RCN (Acres) (Sq. Mi.) RCN and Area
B 89 3.8 0.006 339
B/D 89 0.4 0.001 40
C 92 2.7 0.004 249
D 93 0.0 0.000 2
B 75 4.1 0.006 304
B/D 75 0.1 0.000 5
C 83 3.1 0.005 259
B 70 7.5 0.012 528
B/D 70 1.0 0.002 73
C 80 9.5 0.015 758
D 85 0.9 0.001 79
B 68 0.4 0.001 26
C 79 1.4 0.002 110
D 84 0.1 0.000 8
Totals = 35.06 0.055 2777.9
Total (weighted) RCN = total product/total area = 79.23
RCN used = 79
Soil Area Area Product of
Landuse Group RCN (Acres) (Sq. Mi.) RCN and Area
B 89 0.8 0.001 67
C 92 0.3 0.000 27
D 93 0.1 0.000 9
B 92 5.0 0.008 455
B/D 92 5.3 0.008 485
C 95 13.1 0.020 1246
B 85 0.3 0.000 24
B/D 85 0.0 0.000 2
C 90 2.0 0.003 176
D 92 0.2 0.000 23
B/D 75 2.0 0.003 153
C 83 5.2 0.008 433
D 87 0.3 0.001 30
D 85 0.0 0.000 1
B 68 0.4 0.001 27
B/D 68 3.0 0.005 201
C 79 3.4 0.005 269
D 84 0.0 0.000 2
Totals = 41.39 0.065 3630.3
Total (weighted) RCN = total product/total area = 87.72
RCN used = 88
High Density Residential
Medium Density Residential
Right‐Of‐Way
Subbasin: SCUT ‐ 1C
Right‐Of‐Way
Right‐Of‐Way
Right‐Of‐Way
Right‐Of‐Way
High Density Residential
High Density Residential
High Density Residential
Low Density Residential
Low Density Residential
Low Density Residential
Low Density Residential
Subbasin: SCUT ‐ 1D
Medium Density Residential
Medium Density Residential
Medium Density Residential
Medium Density Residential
Low Density Residential
Low Density Residential
Conservation/Open Space
Right‐Of‐Way
Right‐Of‐Way
Commercial
Commercial
Commercial
Office/Institutional/Multi‐Family
Office/Institutional/Multi‐Family
Office/Institutional/Multi‐Family
Office/Institutional/Multi‐Family
High Density Residential
High Density Residential

Soil Area Area Product of
Landuse Group RCN (Acres) (Sq. Mi.) RCN and Area
B 89 0.7 0.001 59
C 92 0.2 0.000 17
D 93 0.1 0.000 12
B 85 14.7 0.023 1248
C 90 2.1 0.003 193
D 92 1.1 0.002 106
B 85 2.3 0.004 192
C 90 2.0 0.003 179
D 92 2.7 0.004 250
B 70 2.6 0.004 180
C 80 0.2 0.000 18
D 85 0.2 0.000 20
W 100 0.1 0.000 13
Totals = 29.08 0.045 2486.6
Total (weighted) RCN = total product/total area = 85.51
RCN used = 86
Soil Area Area Product of
Landuse Group RCN (Acres) (Sq. Mi.) RCN and Area
B 89 5.0 0.008 447
C 92 0.8 0.001 71
D 93 0.7 0.001 62
B 92 3.7 0.006 336
C 94 2.0 0.003 189
B 85 0.0 0.000 0
B 85 19.6 0.031 1669
C 90 6.4 0.010 580
D 92 6.7 0.011 619
B 75 0.1 0.000 10
B 70 7.0 0.011 491
D 85 0.8 0.001 65
B 68 5.1 0.008 345
C 79 0.2 0.000 15
B 69 1.2 0.002 81
B 69 0.3 0.000 20
D 84 0.1 0.000 9
W 100 0.1 0.000 10
Totals = 59.78 0.093 5019.6
Total (weighted) RCN = total product/total area = 83.96
RCN used = 84
Right‐Of‐Way
Office/Institutional/Multi‐Family
High Density Residential
Medium Density Residential
Medium Density Residential
Low Density Residential
Conservation/Open Space
Conservation/Open Space
Water
Right‐Of‐Way
Right‐Of‐Way
Commercial
Commercial
Office/Institutional/Medical
Office/Institutional/Multi‐Family
Office/Institutional/Multi‐Family
Low Density Residential
Very Low Density Residential
Medium Density Residential
Medium Density Residential
Medium Density Residential
Water
Subbasin: SCUT ‐ 3
Right‐Of‐Way
Right‐Of‐Way
Right‐Of‐Way
Office/Institutional/Medical
Office/Institutional/Medical
Office/Institutional/Medical
Office/Institutional/Multi‐Family
Office/Institutional/Multi‐Family
Office/Institutional/Multi‐Family
Subbasin: SCUT ‐ 2

Soil Area Area Product of
Landuse Group RCN (Acres) (Sq. Mi.) RCN and Area
B 89 0.1 0.000 11
B/D 89 1.1 0.002 99
C 92 1.5 0.002 138
D 93 0.5 0.001 49
A 89 1.2 0.002 104
B 92 38.0 0.059 3492
B/D 92 40.0 0.063 3680
C 94 25.5 0.040 2401
D 95 10.9 0.017 1035
A 77 0.0 0.000 0
B 85 2.5 0.004 213
B/D 85 0.0 0.000 1
B 85 3.2 0.005 271
B/D 85 5.8 0.009 494
B/D 75 5.3 0.008 397
B/D 68 9.3 0.015 633
B 69 0.4 0.001 27
B/D 69 3.0 0.005 207
W 100 1.9 0.003 190
Totals = 150.25 0.235 13443.8
Total (weighted) RCN = total product/total area = 89.47
RCN used = 89
Soil Area Area Product of
Landuse Group RCN (Acres) (Sq. Mi.) RCN and Area
B 89 0.3 0.000 25
C 92 3.7 0.006 341
D 93 0.0 0.000 0
B 92 4.9 0.008 453
C 94 9.4 0.015 879
D 95 7.0 0.011 662
B 85 1.3 0.002 111
C 90 0.3 0.001 31
D 92 0.7 0.001 65
B 75 0.9 0.001 64
C 83 0.3 0.000 25
C 79 0.0 0.000 1
B 69 2.2 0.003 152
C 79 0.0 0.000 0
Totals = 30.95 0.048 2808.6
Total (weighted) RCN = total product/total area = 90.74
RCN used = 91
Low Density Residential
Very Low Density Residential
Right‐Of‐Way
Right‐Of‐Way
Commercial
Very Low Density Residential
Commercial
Commercial
Office/Institutional/Multi‐Family
Office/Institutional/Multi‐Family
Office/Institutional/Multi‐Family
High Density Residential
High Density Residential
Subbasin: SCUT ‐ 4B
Right‐Of‐Way
Right‐Of‐Way
Commercial
Right‐Of‐Way
Right‐Of‐Way
Commercial
High Density Residential
Low Density Residential
Very Low Density Residential
Very Low Density Residential
Water
Commercial
Commercial
Commercial
Mixed Use/Office/Institutional
Mixed Use/Office/Institutional
Mixed Use/Office/Institutional
Office/Institutional/Multi‐Family
Office/Institutional/Multi‐Family
Subbasin: SCUT ‐ 4A
Right‐Of‐Way

Soil Area Area Product of
Landuse Group RCN (Acres) (Sq. Mi.) RCN and Area
B 89 0.1 0.000 9
C 92 1.8 0.003 165
D 93 0.0 0.000 2
B 92 0.7 0.001 64
C 94 11.5 0.018 1077
D 95 7.0 0.011 662
B 85 3.7 0.006 315
C 90 4.2 0.007 378
D 92 2.8 0.004 257
B 68 0.8 0.001 52
C 79 1.5 0.002 118
D 84 0.4 0.001 37
Totals = 34.44 0.054 3135.9
Total (weighted) RCN = total product/total area = 91.07
RCN used = 91
Soil Area Area Product of
Landuse Group RCN (Acres) (Sq. Mi.) RCN and Area
B 89 0.4 0.001 33
C 92 0.3 0.001 30
D 93 0.4 0.001 36
A 77 1.6 0.002 122
B 85 5.2 0.008 441
C 90 0.4 0.001 39
D 92 1.1 0.002 101
A 77 0.0 0.000 1
B 85 7.2 0.011 613
C 90 0.0 0.000 1
D 92 7.9 0.012 725
B 68 0.2 0.000 10
C 79 1.2 0.002 98
W 100 0.4 0.001 41
Totals = 26.33 0.041 2293.6
Total (weighted) RCN = total product/total area = 87.10
RCN used = 87
Right‐Of‐Way
Right‐Of‐Way
Right‐Of‐Way
Commercial
Subbasin: SCUT ‐ 4C
Mixed Use/Office/Institutional
Mixed Use/Office/Institutional
Office/Institutional/Multi‐Family
Office/Institutional/Multi‐Family
Office/Institutional/Multi‐Family
Office/Institutional/Multi‐Family
Low Density Residential
Low Density Residential
Water
Right‐Of‐Way
Right‐Of‐Way
Right‐Of‐Way
Mixed Use/Office/Institutional
Mixed Use/Office/Institutional
Commercial
Commercial
Office/Institutional/Multi‐Family
Office/Institutional/Multi‐Family
Office/Institutional/Multi‐Family
Low Density Residential
Low Density Residential
Low Density Residential
Subbasin: SCUT ‐ 4D

Soil Area Area Product of
Landuse Group RCN (Acres) (Sq. Mi.) RCN and Area
B 89 0.3 0.000 27
C 92 0.6 0.001 60
A 77 3.7 0.006 286
B 85 12.3 0.019 1045
C 90 4.1 0.006 372
D 92 7.3 0.011 667
B 85 7.4 0.012 626
C 90 2.1 0.003 186
D 92 1.8 0.003 165
Totals = 39.55 0.062 3432.0
Total (weighted) RCN = total product/total area = 86.78
RCN used = 87
Office/Institutional/Multi‐Family
Office/Institutional/Multi‐Family
Office/Institutional/Multi‐Family
Right‐Of‐Way
Right‐Of‐Way
Mixed Use/Office/Institutional
Mixed Use/Office/Institutional
Mixed Use/Office/Institutional
Mixed Use/Office/Institutional
Subbasin: SCUT ‐ 5

Appendix F:
Time of Concentration Calculations

Project: Greenville Watershed Master Plan
Prepared by: SMB
Checked by: DJK
Date: 5/5/2015
Sub-basinDescription n Flow P-2 Land Tt Surface Flow Slope Velocity Tt Channel Channel Hydraulic Slope n Velocity Flow Tt Tc Lag Calibration
Length Slope Description Length Area Perimeter Radius Length
(ft) (in) (ft/ft) (min) 0--Unpaved/1-Paved (ft) (ft/ft) (ft/s) (min) (ft2) (ft) (ft) (ft/ft) (ft/s) (ft) (min) (min) (min) (min)
GS-1A Woods 0.4 232 3.76 0.002 91.61 0 367 0.003 0.92 6.66 73 22.7 3.22 0.001 0.045 1.96 2719.5 23.08 121.35 72.81 90.00
GS-1B Woods 0.4 258 3.76 0.001 142.01 0 561 0.000 0.34 27.43 16.5 10.7 1.54 0.001 0.045 1.52 1684.6 18.41 187.86 112.71 225.00
GS-1C Woods 0.4 195 3.76 0.001 101.15 0 423 0.001 0.39 17.95 16.5 10.7 1.54 0.001 0.03 2.42 3012.5 20.76 146.13 87.68 300.0036.5 15.9 2.30 0.004 0.045 3.47 1307.3 6.28
GS-1D Grass 0.24 312 3.76 0.005 57.10 0 329 0.005 1.13 4.87 64.4 21.7 2.97 0.004 0.045 4.51 1389.3 5.13 67.11 40.26 20.00
GS-2A Grass 0.24 217 3.76 0.001 76.60 0 288 0.007 1.37 3.50 47 18.6 2.53 0.002 0.045 2.68 5351.4 33.29 113.38 68.03 210.00
GS-2B Woods 0.4 180 3.76 0.001 92.35 0 399 0.015 1.96 3.39 Pipe 0.003 0.013 5.00 1045.8 3.49 99.23 59.54 30
GS-2C Woods 0.4 195 3.76 0.001 135.21 0 468 0.008 1.47 5.31 47 18.6 2.53 0.006 0.045 4.84 1123.4 3.87 144.38 86.63 20
GS-3 Grass 0.24 284 3.76 0.007 46.11 0 529 0.005 1.15 7.66 23.6 12.8 1.84 0.004 0.03 4.92 1543.1 5.22 67.97 40.78 55.0073.5 22.7 3.24 0.001 0.045 1.64 883 8.97
GS-4A Grass 0.24 250 3.76 0.008 39.54 1 567 0.001 0.60 15.64 Pipe 0.004 0.013 5.00 574 1.91 57.95 34.77 3029.6 15.3 1.93 0.002 0.03 3.69 191 0.86
GS-4B Grass 0.24 189 3.76 0.001 65.12 0 426 0.004 0.98 7.26 Pipe 0.037 0.013 5.00 247 0.82 78.62 47.17 12028 13.9 2.01 0.002 0.03 3.87 1258 5.42
GS-4C Grass 0.24 256 3.76 0.006 45.52 0 396 0.004 1.08 6.13 Pipe 0.000 0.013 5.00 247 0.82 56.87 34.12 12053.6 19.5 2.75 0.002 0.03 4.76 1258 4.40
GS-4D Grass 0.24 234 3.76 0.001 83.72 0 225 0.005 1.16 3.23 Pipe 0.004 0.013 5.00 976 3.25 90.20 54.12 150.00
GS-4E Grass 0.24 289 3.76 0.003 70.10 0 328 0.006 1.23 4.45 Pipe 0.007 0.013 5.00 1237.6 4.13 80.00 48.00 60.0037.4 16.6 2.25 0.003 0.03 4.81 380 1.32
GS-5A Grass 0.24 163 3.76 0.002 54.26 0 576 0.003 0.95 10.09 28 13.9 2.01 0.009 0.03 7.41 1148.1 2.58 74.41 44.64 150.0091.9 25.3 3.63 0.001 0.045 3.02 1355 7.48
GS-5B Grass 0.24 220 3.76 0.004 49.65 1 216 0.002 1.02 3.55 Pipe 0.009 0.013 5.00 1147 3.82 57.02 34.21 20
GS-5C Grass 0.24 97 3.76 0.003 29.04 0 401 0.001 0.55 12.16 19.6 12.9 1.52 0.445 0.045 29.24 1510 0.86 42.06 25.24 15
GS-5D Grass 0.24 174 3.76 0.006 33.22 0 321 0.012 1.77 3.03 28 13.9 2.01 0.011 0.03 8.23 1118.3 2.27 43.71 26.23 12091.9 25.3 3.63 0.001 0.045 2.15 669 5.19
GS-6 Grass 0.24 149 3.76 0.009 25.29 0 386 0.004 1.02 6.33 28 13.9 2.01 0.009 0.03 7.56 1452.8 3.20 40.02 24.01 12091.9 25.3 3.63 0.001 0.045 2.15 669 5.19
SC-1A Grass 0.24 300 3.76 0.002 85.66 0 79 0.003 0.91 1.45 60 23.4 2.56 0.001 0.035 2.53 2007.6 13.23 100.34 60.20 240.00
SC-1B Grass 0.24 154 3.76 0.003 38.24 0 186 0.010 1.65 1.89 81.6 54.1 1.51 0.003 0.035 3.12 1935.5 10.33 50.46 30.27 60.00
SC-1C Woods 0.40 170 3.76 0.001 86.16 0 605 0.003 0.93 10.87 60 23.4 2.56 0.001 0.035 2.88 1803.5 10.42 107.45 64.47 150
SC-1D Woods 0.40 177 3.76 0.001 90.44 0 428 0.005 1.10 6.47 81.6 54.1 1.51 0.002 0.035 2.65 2678.8 16.83 113.74 68.24 240.00
SC-1E Woods 0.40 300 3.76 0.003 97.69 0 100 0.005 1.14 1.46 41 16.9 2.43 0.002 0.035 3.54 3800 17.91 117.06 70.23 120
SC-2A Woods 0.40 321 3.76 0.006 80.23 0 494 0.001 0.36 22.70 65.6 21.5 3.05 0.003 0.045 4.02 2753.8 11.42 114.35 68.61 180.00
SC-2B Grass 0.24 115 3.76 0.009 20.53 0 188 0.008 1.49 2.11 Pipe 0.005 0.013 5.00 864 2.88 31.28 18.77 2032.5 15.2 2.14 0.001 0.045 1.71 592 5.76
SC-3A Woods 0.40 175 3.76 0.011 38.75 0 307 0.001 0.46 11.14 16.5 10.7 1.54 0.001 0.045 1.30 2325.3 29.86 79.74 47.85 180.00
SC-3B Woods 0.40 191 3.76 0.003 74.91 0 289 0.004 1.00 4.81 Pipe 0.001 0.013 5.00 1455.9 4.85 87.68 52.61 50.0040.6 17.5 2.32 0.004 0.03 5.70 1061 3.10
Time of Concentration - Swift Creek WatershedSheet Flow Shallow Concentration Channel Flow

Sub-basinDescription n Flow P-2 Land Tt Surface Flow Slope Velocity Tt Channel Channel Hydraulic Slope n Velocity Flow Tt Tc Lag Calibration
Length Slope Description Length Area Perimeter Radius Length
(ft) (in) (ft/ft) (min) 0--Unpaved/1-Paved (ft) (ft/ft) (ft/s) (min) (ft2) (ft) (ft) (ft/ft) (ft/s) (ft) (min) (min) (min) (min)
Sheet Flow Shallow Concentration Channel Flow
SC-3C Grass 0.24 141 3.76 0.004 34.66 0 289 0.005 1.16 4.13 32.5 15.2 2.14 0.004 0.03 5.54 565 1.70 43.17 25.90 40.00Pipe 0.006 0.013 5.00 804.01 2.68
SC-4 Grass 0.24 328 3.76 0.001 126.00 0 585 0.004 0.98 9.91 Pipe 0.007 0.013 5.00 1087.1 3.62 142.98 85.79 45.0081 24.6 3.29 0.003 0.03 6.27 1296 3.44
SC-5A Grass 0.24 91 3.76 0.003 27.16 1 549 0.011 2.16 4.24 Pipe 0.003 0.013 5.00 1436.5 4.79 36.19 21.71 27.14
SC-5B Grass 0.24 368 3.76 0.004 67.80 0 315 0.007 1.33 3.94 28 13.9 2.01 0.019 0.03 11.09 589 0.89 86.81 52.09 65.1194.1 27.6 3.41 0.000 0.045 1.52 1292 14.18
SC-6 Grass 0.24 243 3.76 0.001 87.84 0 1465 0.000 0.30 81.94 28 13.9 2.01 0.005 0.03 5.62 3994 11.85 208.77 125.26 12594.1 27.6 3.41 0.001 0.045 1.91 3110 27.13
SCUT-1A Woods 0.40 216 3.76 0.005 65.80 0 293 0.005 1.09 4.47 Pipe 0.001 0.013 5.00 2059.1 6.86 77.14 46.28 46.00
SCUT-1B Woods 0.40 300 3.76 0.001 140.94 0 300 0.006 1.27 3.92 16.5 10.7 1.54 0.003 0.035 3.01 1465.5 8.12 152.98 91.79 92.00
SCUT-1C Grass 0.24 200 3.76 0.010 29.74 0 250 0.003 0.84 4.96 Pipe 0.003 0.013 5.00 1634.6 5.45 40.14 24.09 24
SCUT-1D Woods 0.40 301 3.76 0.001 170.78 0 214 0.001 0.55 6.47 8 7.7 1.04 0.003 0.03 2.84 1921.7 11.28 188.53 113.12 113.00
SCUT-2 Grass 0.24 300 3.76 0.002 85.66 1 670 0.001 0.68 16.33 47.5 18.5 2.57 0.006 0.03 7.07 810 1.91 103.90 62.34 90.00
SCUT-3 Grass 0.24 75 3.76 0.003 21.46 0 271 0.013 1.83 2.47 Pipe 0.008 0.013 5.00 759 2.53 42.57 25.54 51.0955.6 19.7 2.82 0.001 0.035 1.91 1845.1 16.11
SCUT-4A Woods 0.40 448 3.76 0.004 119.85 0 289 0.006 1.24 3.89 16.5 10.7 1.54 0.001 0.035 2.20 2479.1 18.78 142.52 85.51 85.51
SCUT-4B Grass 0.24 50 3.76 0.080 4.34 1 440 0.005 1.37 5.35 59 20.5 2.88 0.004 0.035 5.35 2091 6.52 16.21 9.73 10
SCUT-4C Grass 0.24 150 3.76 0.004 33.45 0 620 0.003 0.91 11.31 24 12.9 1.86 0.004 0.035 4.04 811 3.34 48.11 28.86 30
SCUT-4D Grass 0.24 150 3.76 0.013 21.32 0 350 0.006 1.22 4.78 24 12.9 1.86 0.008 0.035 5.75 1270 3.68 29.78 17.87 18
SCUT-5 Grass 0.24 260 3.76 0.008 41.43 0 379 0.001 0.41 15.26 130.8 31.2 4.19 0.011 0.035 11.63 1370.8 1.96 58.65 35.19 35

Appendix G:
Preliminary Opinion of Probable Construction Costs
List of Contents:
1. Unit Cost Table
2. Flood Control Projects
3. Stream Stabilization Projects
4. BMP Projects

Item Description
1 Mobilization (10%) LS2 Comprehensive Grading (20%) LS3 Excavation CY 25.00$ 4 Hauling CY 4.00$ 5 Clearing & Grubbing AC 5,000.00$ 6 Channel Grading including seeding SY 15.00$ 7 Construction Staking (0-300000) LS 3,000.00$ 8 Construction Staking (300000-800000) LS 6,000.00$ 9 Construction Staking (Greater than 800000) LS 10,000.00$
10 Select Material CY 25.00$ 11 Flowable Fill CY 500.00$ 12 8" Perforated PVC Underdrain LF 10.00$ 13 8" PVC Pipe, SDR 35 LF 10.00$ 14 15" PVC Pipe, SDR 35 LF 18.00$ 15 18" PVC Pipe, SDR 35 LF 25.00$ 16 24" PVC Pipe, SDR 35 LF 28.00$ 17 12" R.C. Pipe Culvert, Class III LF 45.00$ 18 15" R.C. Pipe Culvert, Class III LF 50.00$ 19 18" R.C. Pipe Culvert, Class III LF 55.00$ 20 18" R.C. Pipe Culvert, Class IV LF 60.00$ 21 24" R.C. Pipe Culvert, Class III LF 70.00$ 22 24" R.C. Pipe Culvert, Class IV LF 75.00$ 23 30" R.C. Pipe Culvert, Class III LF 90.00$ 24 30" R.C. Pipe Culvert, Class IV, 0' - 6' depth LF 100.00$ 25 36" R.C. Pipe Culvert, Class III LF 120.00$ 26 36" R.C. Pipe Culvert, Class IV LF 130.00$ 27 36" Steel Pipe Culvert (Tunnel Installation) LF 800.00$ 28 42" R.C. Pipe Culvert, Class III LF 150.00$ 29 42" R.C. Pipe Culvert, Class IV LF 165.00$ 30 48" R.C. Pipe Culvert, Class III LF 180.00$ 31 48" R.C. Pipe Culvert, Class IV LF 195.00$ 32 48" Steel Pipe Culvert (Tunnel Installation) LF 1,100.00$ 33 54" R.C. Pipe Culvert, Class III LF 200.00$ 34 60" R.C. Pipe Culvert, Class III LF 225.00$ 35 60" Steel Pipe Culvert (Tunnel Installation) LF 1,500.00$ 36 66" R.C. Pipe Culverts, Class III LF 260.00$ 37 72" R.C. Pipe Culvert, Class III LF 320.00$ 38 72" R.C. Pipe Culvert, Class IV LF 370.00$ 39 72" Steel Pipe Culvert (Tunnel Installation) LF 1,800.00$ 40 78" R.C. Pipe Culvert, Class III LF 350.00$ 41 4' x 4' Precast R.C. Box Culvert LF 400.00$ 42 5' x 3' Precast R.C. Box Culvert LF 450.00$ 43 5' x 4' Precast R.C. Box Culvert LF 500.00$ 44 6' x 3' Precast R.C. Box Culvert LF 600.00$ 45 6' x 4' Precast R.C. Box Culvert LF 650.00$ 46 6' x 5' Precast R.C. Box Culvert LF 700.00$ 47 7' x 5' Precast R.C. Box Culvert LF 750.00$ 48 7' x 6' Precast R.C. Box Culvert LF 850.00$ 49 7' x 7' Reinforced Concrete Box Culvert LF 1,200.00$ 50 8’ x 4’ Precast R.C. Box Culvert LF 750.00$ 51 8’ x 5’ Precast R.C. Box Culvert LF 900.00$ 52 8' X 6' Reinforced Concrete Box Culvert LF 1,200.00$ 53 9' x 5' Precast R.C. Box Culvert LF 1,100.00$ 54 9' X 6' Reinforced Concrete Box Culvert LF 1,400.00$ 55 10' x 4' Precast R.C. Box Culvert LF 1,050.00$ 56 10 x 5' Precast R.C. Box Culvert LF 1,200.00$ 57 10' x 6' Precast R.C. Box Culvert LF 1,450.00$ 58 11' x 4' Precast R.C. Box Culvert LF 1,150.00$ 59 11' x 6' Precast R.C. Box Culvert LF 1,500.00$ 60 11’ x 7’ Precast R.C. Box Culvert LF 1,800.00$ 61 Drainage Structures, Manhole EA 3,500.00$ 62 Drainage Structures, Inlet EA 3,000.00$ 63 Drainage Structures, DOT Standard Endwall EA 6,000.00$ 64 Drainage Structures, Box Culvert Custom Endwall EA 15,000.00$ 65 BMP Outlet Structure EA 4,000.00$ 66 Convert Yard Inlet to Junction Box EA 1,500.00$ 67 Curb Cut EA 400.00$ 68 Flared End Section, 18 inch EA 1,000.00$ 69 Flared End Section, 24 inch EA 2,000.00$ 70 Flared End Section, 36 inch EA 2,500.00$ 71 Flared End Section, 42 inch EA 2,500.00$ 72 Flared End Section, 48 inch EA 3,000.00$ 73 Custom Junction Box EA 15,000.00$ 74 Concrete Curb and Gutter LF 35.00$
Unit Costs - Swift Creek Watershed Master Plan
Unit Unit Price

Item Description Unit Unit Price 75 6" Concrete Driveway Replacement EA 1,500.00$ 76 4" Concrete Sidewalk LF 40.00$ 77 Concrete Pipe Plug EA 450.00$ 78 Asphalt Milling/Overlay SY 30.00$ 79 Asphalt Replacement (Surface, Base Course, & Milling) SY 55.00$ 80 ABC Stone TN 35.00$ 81 Rip Rap Stone, Class B TN 65.00$ 82 Rip Rap Stone, Class 1 TN 70.00$ 83 Rip Rap Stone, Class A TN 65.00$ 84 #5 stone TN 50.00$ 85 #57 stone TN 65.00$ 86 Gravel Walkway #78 stone TN 65.00$ 87 Stone Boulder TN 200.00$ 88 Sand 2S CY 60.00$ 89 Rock Grade Control EA 10,000.00$ 90 Traffic Control (Single 2-lane road) LS 10,000.00$ 91 Traffic Control (4+ lane road or multiple 2-lane roads) LS 20,000.00$ 92 Erosion Control (1-2 acre LOD) LS 15,000.00$ 93 Erosion Control (2-5 acre LOD) LS 30,000.00$ 94 Erosion Control (Greater than 5 acre LOD) LS 50,000.00$ 95 Erosion Control Matting SY 10.00$ 96 Fence Removal / Replacement LF 50.00$ 97 4' Personnel Gates EA 375.00$ 98 20' Roadway Gates EA 400.00$ 99 Soil Media CY 50.00$ 100 BMP Plantings SF 2.00$ 101 Riparian Seed Mix SY 1.50$ 102 Live Staking SY 15.00$ 103 Seeding and Mulching AC 7,500.00$ 104 Wood Retaining Wall (4' high) LF 100.00$ 105 Log Grade Control Structure EA 2,000.00$ 106 Gabion Wall LF 300.00$ 107 Foundation Protection EA 15,000.00$ 108 Utility Relocations (Minor Water line adjustments) LS 5,000.00$ 109 Utility Relocations (Substantial Water line adjustements inclu LS 15,000.00$ 110 Utility Relocations (Substantial sanitary sewer and water line LS 30,000.00$ 111 Buffer Plantings SY 4.00$ 112 PICP (Permeable Pavers), 3.5'' thick SF 20.00$ 113 Hauling CY 45.00$ 114 Cascade Boulder TN 75.00$ 115 Cobble TN 75.00$ 116 RSC Sand/Wood Chip Mixture CY 45.00$

1 Mobilization (10%) 1 LS 19,500.00$ 19,500.00$ 2 Comprehensive Grading (20%)* 1 LS 32,600.00$ 32,600.00$ 3 Construction Staking (300000-800000) 1 LS 6,000.00$ 6,000.00$ 4 7' x 6' Precast R.C. Box Culvert 128 LF 850.00$ 108,800.00$ 5 Asphalt Replacement (Surface, Base Course, & Milling) 50 SY 55.00$ 2,750.00$ 6 Drainage Structures, Box Culvert Custom Endwall 2 EA 15,000.00$ 30,000.00$ 7 Utility Relocations ** 1 LS 15,000.00$ 15,000.00$ 8 Excavation 5000 CY 25.00$ 125,000.00$ 9 Hauling 5000 CY 4.00$ 20,000.00$
10 Clearing & Grubbing 0.7 AC 5,000.00$ 3,500.00$ 11 Riparian Seed Mix 3000 SY 1.50$ 4,500.00$ 12 Erosion Control (Greater than 5 acre LOD) 1 LS 50,000.00$ 50,000.00$ 13 Traffic Control (Single 2-lane road) 1 LS 10,000.00$ 10,000.00$
Subtotal 417,700.00$ 30% Contingency $125,300.00
Total 543,000.00$ Design, Administration, Fiscal and Legal (30% of Construction Costs) 162,900.00
Total Opinion of Project Cost 705,900.00$
* Cost for comprehensive grading includes roadway excavation, saw cutting, compaction of select material, geotechnical recommendations, home owner coordination, tree and structure protection, structure removal and disposal, shoring, and culvert excavation.
** Cost for utility conflicts includes all utilities that need to be moved including sanitary sewer and potable water lines. Additional survey may be required to locate pressurized utilities.
The Engineer’s opinions of probable construction costs are made on the basis of the Engineer’s experience and qualifications and represent the Engineer’s best judgment as a professional generally familiar with the construction industry. Since the Engineer has no control over the cost of labor, materials, equipment, or services furnished by others; over the contractors methods of determining prices; or over competitive bidding or marketing conditions, the Engineer’s cannot and does not guarantee that proposal, bids or actual construction costs will not vary from opinions of probable construction costs prepared by the Engineer.
Frog Level Road (Gum Swamp)
Item Number Item Description Quantities Unit Unit Price Amount

1 Mobilization (10%) 1 LS 2,500.00$ 2,500.00$ 2 Comprehensive Grading (20%)* 1 LS 4,200.00$ 4,200.00$ 3 Construction Staking (300000-800000) 1 LS 6,000.00$ 6,000.00$ 4 Utility Relocations ** 1 LS 15,000.00$ 15,000.00$ 5 Excavation 98000 CY 25.00$ 2,450,000.00$ 6 Hauling 98000 CY 4.00$ 392,000.00$ 7 Clearing & Grubbing 11 AC 5,000.00$ 55,000.00$ 8 Riparian Seed Mix 53742 SY 1.50$ 80,613.00$ 9 Erosion Control (Greater than 5 acre LOD) 1 LS 50,000.00$ 50,000.00$
10 Traffic Control (Single 2-lane road) 1 LS 10,000.00$ 10,000.00$
Subtotal 3,055,300.00$ 30% Contingency $916,600.00
Total 3,971,900.00$ Design, Administration, Fiscal and Legal (30% of Construction Costs) 1,191,600.00
Total Opinion of Project Cost 5,163,500.00$
* Cost for comprehensive grading includes roadway excavation, saw cutting, compaction of select material, geotechnical recommendations, home owner coordination, tree and structure protection, structure removal and disposal, shoring, and culvert excavation.
** Cost for utility conflicts includes all utilities that need to be moved including sanitary sewer and potable water lines. Additional survey may be required to locate pressurized utilities.
The Engineer’s opinions of probable construction costs are made on the basis of the Engineer’s experience and qualifications and represent the Engineer’s best judgment as a professional generally familiar with the construction industry. Since the Engineer has no control over the cost of labor, materials, equipment, or services furnished by others; over the contractors methods of determining prices; or over competitive bidding or marketing conditions, the Engineer’s cannot and does not guarantee that proposal, bids or actual construction costs will not vary from opinions of probable construction costs prepared by the Engineer.
Gum Swamp Floodplain Benching
Item Number Item Description Quantities Unit Unit Price Amount

1 Mobilization (10%) 1 LS 20,400.00$ 20,400.00$ 2 Comprehensive Grading (20%)* 1 LS 34,000.00$ 34,000.00$ 3 Construction Staking (300000-800000) 1 LS 6,000.00$ 6,000.00$ 4 Select Material 407 CY 25.00$ 10,175.00$ 5 10' x 6' Precast R.C. Box Culvert 71 LF 1,450.00$ 102,950.00$ 6 Asphalt Replacement (Surface, Base Course, & Milling) 112 SY 55.00$ 6,160.00$ 7 Drainage Structures, Box Culvert Custom Endwall 2 EA 15,000.00$ 30,000.00$ 8 Utility Relocations ** 1 LS 15,000.00$ 15,000.00$ 9 Excavation 11199 CY 25.00$ 279,975.00$
10 Hauling 11199 CY 4.00$ 44,796.00$ 11 Clearing & Grubbing 3.53 AC 5,000.00$ 17,650.00$ 12 Riparian Seed Mix 17085 SY 1.50$ 25,627.80$ 13 Erosion Control (2-5 acre LOD) 1 LS 30,000.00$ 30,000.00$ 14 Traffic Control (Single 2-lane road) 1 LS 10,000.00$ 10,000.00$
Subtotal 622,700.00$ 30% Contingency $186,800.00
Total 809,500.00$ Design, Administration, Fiscal and Legal (30% of Construction Costs) 242,900.00
Total Opinion of Project Cost 1,052,400.00$
* Cost for comprehensive grading includes roadway excavation, saw cutting, compaction of select material, geotechnical recommendations, home owner coordination, tree and structure protection, structure removal and disposal, shoring, and culvert excavation.
** Cost for utility conflicts includes all utilities that need to be moved including sanitary sewer and potable water lines. Additional survey may be required to locate pressurized utilities.
The Engineer’s opinions of probable construction costs are made on the basis of the Engineer’s experience and qualifications and represent the Engineer’s best judgment as a professional generally familiar with the construction industry. Since the Engineer has no control over the cost of labor, materials, equipment, or services furnished by others; over the contractors methods of determining prices; or over competitive bidding or marketing conditions, the Engineer’s cannot and does not guarantee that proposal, bids or actual construction costs will not vary from opinions of probable construction costs prepared by the Engineer.
Thomas Langston Road (Swift Creek Main Branch) - Alternative #1
Item Number Item Description Quantities Unit Unit Price Amount

1 Mobilization (10%) 1 LS 20,400.00$ 20,400.00$ 2 Comprehensive Grading (20%)* 1 LS 34,000.00$ 34,000.00$ 3 Construction Staking (300000-800000) 1 LS 6,000.00$ 6,000.00$ 4 Select Material 407 CY 25.00$ 10,175.00$ 5 10' x 6' Precast R.C. Box Culvert 71 LF 1,450.00$ 102,950.00$ 6 Asphalt Replacement (Surface, Base Course, & Milling) 112 SY 55.00$ 6,160.00$ 7 Drainage Structures, Box Culvert Custom Endwall 2 EA 15,000.00$ 30,000.00$ 8 Utility Relocations ** 1 LS 15,000.00$ 15,000.00$ 9 Erosion Control (1-2 acre LOD) 1 LS 15,000.00$ 15,000.00$
10 Traffic Control (Single 2-lane road) 1 LS 10,000.00$ 10,000.00$
Subtotal 239,700.00$ 30% Contingency $71,900.00
Total 311,600.00$ Design, Administration, Fiscal and Legal (30% of Construction Costs) 93,500.00
Total Opinion of Project Cost 405,100.00$
* Cost for comprehensive grading includes roadway excavation, saw cutting, compaction of select material, geotechnical recommendations, home owner coordination, tree and structure protection, structure removal and disposal, shoring, and culvert excavation.
** Cost for utility conflicts includes all utilities that need to be moved including sanitary sewer and potable water lines. Additional survey may be required to locate pressurized utilities.
The Engineer’s opinions of probable construction costs are made on the basis of the Engineer’s experience and qualifications and represent the Engineer’s best judgment as a professional generally familiar with the construction industry. Since the Engineer has no control over the cost of labor, materials, equipment, or services furnished by others; over the contractors methods of determining prices; or over competitive bidding or marketing conditions, the Engineer’s cannot and does not guarantee that proposal, bids or actual construction costs will not vary from opinions of probable construction costs prepared by the Engineer.
Thomas Langston Road (Swift Creek Main Branch) - Alternative #2
Item Number Item Description Quantities Unit Unit Price Amount

1 Mobilization (10%) 1 LS 2,400.00$ 2,400.00$ 2 Comprehensive Grading (20%)* 1 LS 4,000.00$ 4,000.00$ 3 Construction Staking (Greater than 800000) 1 LS 10,000.00$ 10,000.00$ 4 Select Material 407 CY 25.00$ 10,175.00$ 5 Excavation 263,262 CY 25.00$ 6,581,541.67$ 6 Hauling 263,262 CY 4.00$ 1,053,046.67$ 7 Clearing & Grubbing 32.6 AC 5,000.00$ 163,000.00$ 8 Riparian Seed Mix 4840 SY 1.50$ 7,260.00$ 9 Erosion Control (Greater than 5 acre LOD) 1 LS 50,000.00$ 50,000.00$
10 Traffic Control (Single 2-lane road) 1 LS 10,000.00$ 10,000.00$
Subtotal 7,881,400.00$ 30% Contingency $2,364,400.00
Total 10,245,800.00$ Land Acquisition 900,000.00$
Design, Administration, Fiscal and Legal (30% of Construction Costs) 3,343,700.00Total Opinion of Project Cost 14,489,500.00$
* Cost for comprehensive grading includes roadway excavation, saw cutting, compaction of select material, geotechnical recommendations, home owner coordination, tree and structure protection, structure removal and disposal, shoring, and culvert excavation.
The Engineer’s opinions of probable construction costs are made on the basis of the Engineer’s experience and qualifications and represent the Engineer’s best judgment as a professional generally familiar with the construction industry. Since the Engineer has no control over the cost of labor, materials, equipment, or services furnished by others; over the contractors methods of determining prices; or over competitive bidding or marketing conditions, the Engineer’s cannot and does not guarantee that proposal, bids or actual construction costs will not vary from opinions of probable construction costs prepared by the Engineer.
Megan Drive Detention Pond
Item Number Item Description Quantities Unit Unit Price Amount

1 Mobilization (10%) 1 LS 27,700.00$ 27,700.00$ 2 Comprehensive Grading (20%)* 1 LS 46,200.00$ 46,200.00$ 3 Construction Staking (Greater than 800000) 1 LS 10,000.00$ 10,000.00$ 4 Select Material 211 CY 25.00$ 5,275.00$ 5 10' x 6' Precast R.C. Box Culvert 122 LF 1,450.00$ 176,900.00$ 6 Asphalt Replacement (Surface, Base Course, & Milling) 68 SY 55.00$ 3,740.00$ 7 Drainage Structures, Box Culvert Custom Endwall 2 EA 15,000.00$ 30,000.00$ 8 Utility Relocations ** 1 LS 5,000.00$ 5,000.00$ 9 Excavation 33303 CY 25.00$ 832,575.00$
10 Hauling 33303 CY 4.00$ 133,212.00$ 11 Clearing & Grubbing 6.64 AC 5,000.00$ 33,200.00$ 12 Riparian Seed Mix 32138 SY 1.50$ 48,206.40$ 13 Erosion Control (Greater than 5 acre LOD) 1 LS 50,000.00$ 50,000.00$ 14 Traffic Control (Single 2-lane road) 1 LS 10,000.00$ 10,000.00$
Subtotal 1,402,000.00$ 30% Contingency $420,600.00
Total 1,822,600.00$ Design, Administration, Fiscal and Legal (30% of Construction Costs) 546,800.00
Total Opinion of Project Cost 2,369,400.00$
* Cost for comprehensive grading includes roadway excavation, saw cutting, compaction of select material, geotechnical recommendations, home owner coordination, tree and structure protection, structure removal and disposal, shoring, and culvert excavation.
** Cost for utility conflicts includes all utilities that need to be moved including sanitary sewer and potable water lines. Additional survey may be required to locate pressurized utilities.
The Engineer’s opinions of probable construction costs are made on the basis of the Engineer’s experience and qualifications and represent the Engineer’s best judgment as a professional generally familiar with the construction industry. Since the Engineer has no control over the cost of labor, materials, equipment, or services furnished by others; over the contractors methods of determining prices; or over competitive bidding or marketing conditions, the Engineer’s cannot and does not guarantee that proposal, bids or actual construction costs will not vary from opinions of probable construction costs prepared by the Engineer.
Sterling Trace Drive (Swift Creek Main Branch) - Alternative #1
Item Number Item Description Quantities Unit Unit Price Amount

1 Mobilization (10%) 1 LS 27,700.00$ 27,700.00$ 2 Comprehensive Grading (20%)* 1 LS 46,200.00$ 46,200.00$ 3 Construction Staking (Greater than 800000) 1 LS 10,000.00$ 10,000.00$ 4 Select Material 211 CY 25.00$ 5,275.00$ 5 10' x 6' Precast R.C. Box Culvert 122 LF 1,450.00$ 176,900.00$ 6 Asphalt Replacement (Surface, Base Course, & Milling) 68 SY 55.00$ 3,740.00$ 7 Drainage Structures, Box Culvert Custom Endwall 2 EA 15,000.00$ 30,000.00$ 8 Utility Relocations ** 1 LS 5,000.00$ 5,000.00$ 9 Excavation 27876 CY 25.00$ 696,895.29$
10 Hauling 27876 CY 4.00$ 111,503.25$ 11 Clearing & Grubbing 6 AC 5,000.00$ 30,000.00$ 12 Riparian Seed Mix 29040 SY 1.50$ 43,560.00$ 13 Erosion Control (Greater than 5 acre LOD) 1 LS 50,000.00$ 50,000.00$ 14 Traffic Control (Single 2-lane road) 1 LS 10,000.00$ 10,000.00$
Subtotal 1,236,800.00$ 30% Contingency $371,000.00
Total 1,607,800.00$ Design, Administration, Fiscal and Legal (30% of Construction Costs) 482,300.00
Total Opinion of Project Cost 2,090,100.00$
* Cost for comprehensive grading includes roadway excavation, saw cutting, compaction of select material, geotechnical recommendations, home owner coordination, tree and structure protection, structure removal and disposal, shoring, and culvert excavation.
** Cost for utility conflicts includes all utilities that need to be moved including sanitary sewer and potable water lines. Additional survey may be required to locate pressurized utilities.
The Engineer’s opinions of probable construction costs are made on the basis of the Engineer’s experience and qualifications and represent the Engineer’s best judgment as a professional generally familiar with the construction industry. Since the Engineer has no control over the cost of labor, materials, equipment, or services furnished by others; over the contractors methods of determining prices; or over competitive bidding or marketing conditions, the Engineer’s cannot and does not guarantee that proposal, bids or actual construction costs will not vary from opinions of probable construction costs prepared by the Engineer.
Sterling Trace Drive (Swift Creek Main Branch) - Alternative #2
Item Number Item Description Quantities Unit Unit Price Amount

1 Mobilization (10%) 1 LS 18,500.00$ 18,500.00$ 2 Comprehensive Grading (20%)* 1 LS 30,800.00$ 30,800.00$ 3 Construction Staking (0-300000) 1 LS 3,000.00$ 3,000.00$ 4 Select Material 89 CY 25.00$ 2,225.00$ 5 42" R.C. Pipe Culvert, Class IV 114 LF 165.00$ 18,810.00$ 6 Drainage Structures, DOT Standard Endwall 2 EA 6,000.00$ 12,000.00$ 7 Concrete Curb and Gutter 30 LF 35.00$ 1,050.00$ 8 Asphalt Replacement (Surface, Base Course, & Milling) 54 SY 55.00$ 2,970.00$ 9 Excavation 2664 CY 25.00$ 66,600.00$
10 Hauling 2664 CY 4.00$ 10,656.00$ 11 Clearing & Grubbing 0.96 AC 5,000.00$ 4,800.00$ 12 Riparian Seed Mix 4646 SY 1.50$ 6,969.60$ 13 Traffic Control (Single 2-lane road) 1 LS 10,000.00$ 10,000.00$ 14 Utility Relocations** 1 LS 15,000.00$ 15,000.00$ 15 Erosion Control (1-2 acre LOD) 1 LS 15,000.00$ 15,000.00$
Subtotal 218,400.00$ 30% Contingency $65,500.00
Total 283,900.00$ Design, Administration, Fiscal and Legal (30% of Construction Costs) 85,200.00
Total Opinion of Project Cost 369,100.00$
* Cost for comprehensive grading includes roadway excavation, saw cutting, compaction of select material, geotechnical recommendations, home owner coordination, tree and structure protection, structure removal and disposal, shoring, and culvert excavation.
** Cost for utility conflicts includes all utilities that need to be moved including sanitary sewer and potable water lines. Additional survey may be required to locate pressurized utilities.
The Engineer’s opinions of probable construction costs are made on the basis of the Engineer’s experience and qualifications and represent the Engineer’s best judgment as a professional generally familiar with the construction industry. Since the Engineer has no control over the cost of labor, materials, equipment, or services furnished by others; over the contractors methods of determining prices; or over competitive bidding or marketing conditions, the Engineer’s cannot and does not guarantee that proposal, bids or actual construction costs will not vary from opinions of probable construction costs prepared by the Engineer.
Thomas Langston Road (SCUT1) - Alternative #1
Item Number Item Description Quantities Unit Unit Price Amount

1 Mobilization (10%) 1 LS 382,700.00$ 382,700.00$ 2 Comprehensive Grading (20%)* 1 LS 637,800.00$ 637,800.00$ 3 Construction Staking (Greater than 800000) 1 LS 10,000.00$ 10,000.00$ 4 Excavation 105000 CY 25.00$ 2,625,000.00$ 5 Hauling 105000 CY 4.00$ 420,000.00$ 6 Clearing & Grubbing 15.00 AC 5,000.00$ 75,000.00$ 7 Drainage Structures, DOT Standard Endwall 2 EA 6,000.00$ 12,000.00$ 8 Riparian Seed Mix 4840 SY 1.50$ 7,260.00$ 9 Traffic Control (Single 2-lane road) 1 LS 10,000.00$ 10,000.00$
10 Utility Relocations** 1 LS 30,000.00$ 30,000.00$ 11 Erosion Control (Greater than 5 acre LOD) 1 LS 50,000.00$ 50,000.00$
Subtotal 4,259,800.00$ 30% Contingency $1,277,900.00
Total 5,537,700.00$ Land Acquisition 330,000.00$
Design, Administration, Fiscal and Legal (30% of Construction Costs) 1,760,300.00Total Opinion of Project Cost 7,628,000.00$
* Cost for comprehensive grading includes roadway excavation, saw cutting, compaction of select material, geotechnical recommendations, home owner coordination, tree and structure protection, structure removal and disposal, shoring, and culvert excavation.
** Cost for utility conflicts includes all utilities that need to be moved including sanitary sewer and potable water lines. Additional survey may be required to locate pressurized utilities.
The Engineer’s opinions of probable construction costs are made on the basis of the Engineer’s experience and qualifications and represent the Engineer’s best judgment as a professional generally familiar with the construction industry. Since the Engineer has no control over the cost of labor, materials, equipment, or services furnished by others; over the contractors methods of determining prices; or over competitive bidding or marketing conditions, the Engineer’s cannot and does not guarantee that proposal, bids or actual construction costs will not vary from opinions of probable construction costs prepared by the Engineer.
Thomas Langston Detention Pond
Item Number Item Description Quantities Unit Unit Price Amount

1 Mobilization (10%) 1 LS 19,200.00$ 19,200.00$ 2 Comprehensive Grading (20%)* 1 LS 32,000.00$ 32,000.00$ 3 Construction Staking (0-300000) 1 LS 3,000.00$ 3,000.00$ 4 Select Material 143 CY 25.00$ 3,575.00$ 5 6' x 4' Precast R.C. Box Culvert 146 LF 650.00$ 94,900.00$ 6 Drainage Structures, Box Culvert Custom Endwall 2 EA 15,000.00$ 30,000.00$ 7 Concrete Curb and Gutter 32 LF 35.00$ 1,120.00$ 8 Asphalt Replacement (Surface, Base Course, & Milling) 48 SY 55.00$ 2,640.00$ 9 Traffic Control (Single 2-lane road) 1 LS 10,000.00$ 10,000.00$
10 Utility Relocations** 1 LS 15,000.00$ 15,000.00$ 11 Erosion Control (1-2 acre LOD) 1 LS 15,000.00$ 15,000.00$
Subtotal 226,400.00$ 30% Contingency $67,900.00
Total 294,300.00$ Design, Administration, Fiscal and Legal (30% of Construction Costs) 88,300.00
Total Opinion of Project Cost 382,600.00$
* Cost for comprehensive grading includes roadway excavation, saw cutting, compaction of select material, geotechnical recommendations, home owner coordination, tree and structure protection, structure removal and disposal, shoring, and culvert excavation.
** Cost for utility conflicts includes all utilities that need to be moved including sanitary sewer and potable water lines. Additional survey may be required to locate pressurized utilities.
The Engineer’s opinions of probable construction costs are made on the basis of the Engineer’s experience and qualifications and represent the Engineer’s best judgment as a professional generally familiar with the construction industry. Since the Engineer has no control over the cost of labor, materials, equipment, or services furnished by others; over the contractors methods of determining prices; or over competitive bidding or marketing conditions, the Engineer’s cannot and does not guarantee that proposal, bids or actual construction costs will not vary from opinions of probable construction costs prepared by the Engineer.
Belfair Drive - Alternative #1
Item Number Item Description Quantities Unit Unit Price Amount

1 Mobilization (10%) 1 LS 61,500.00$ 61,500.00$ 2 Comprehensive Grading (20%)* 1 LS 102,600.00$ 102,600.00$ 3 Construction Staking (300000-800000) 1 LS 6,000.00$ 6,000.00$ 4 Select Material 128 CY 25.00$ 3,200.00$ 5 11' x 4' Precast R.C. Box Culvert 114 LF 1,150.00$ 131,100.00$ 6 Drainage Structures, Box Culvert Custom Endwall 2 EA 15,000.00$ 30,000.00$ 7 Concrete Curb and Gutter 60 LF 35.00$ 2,100.00$ 8 Asphalt Replacement (Surface, Base Course, & Milling) 114 SY 55.00$ 6,270.00$ 9 Excavation 9323 CY 25.00$ 233,075.00$
10 Hauling 9323 CY 4.00$ 37,292.00$ 11 Clearing & Grubbing 1.94 AC 5,000.00$ 9,700.00$ 12 Riparian Seed Mix 9390 SY 1.50$ 14,084.40$ 13 Traffic Control (Single 2-lane road) 1 LS 10,000.00$ 10,000.00$ 14 Utility Relocations** 1 LS 30,000.00$ 30,000.00$ 15 Erosion Control (2-5 acre LOD) 1 LS 30,000.00$ 30,000.00$
Subtotal 706,900.00$ 30% Contingency $212,100.00
Total 919,000.00$ Design, Administration, Fiscal and Legal (30% of Construction Costs) 275,700.00
Total Opinion of Project Cost 1,194,700.00$
* Cost for comprehensive grading includes roadway excavation, saw cutting, compaction of select material, geotechnical recommendations, home owner coordination, tree and structure protection, structure removal and disposal, shoring, and culvert excavation.
** Cost for utility conflicts includes all utilities that need to be moved including sanitary sewer and potable water lines. Additional survey may be required to locate pressurized utilities.
The Engineer’s opinions of probable construction costs are made on the basis of the Engineer’s experience and qualifications and represent the Engineer’s best judgment as a professional generally familiar with the construction industry. Since the Engineer has no control over the cost of labor, materials, equipment, or services furnished by others; over the contractors methods of determining prices; or over competitive bidding or marketing conditions, the Engineer’s cannot and does not guarantee that proposal, bids or actual construction costs will not vary from opinions of probable construction costs prepared by the Engineer.
Sterling Pointe Drive - Alternative #1
Item Number Item Description Quantities Unit Unit Price Amount

1 Mobilization (10%) 1 LS 21,500.00$ 21,500.00$ 2 Comprehensive Grading (20%)* 1 LS 35,800.00$ 35,800.00$ 3 Construction Staking (0-300000) 1 LS 3,000.00$ 3,000.00$ 4 Select Material 120 CY 25.00$ 3,000.00$ 5 10' x 4' Precast R.C. Box Culvert 114 LF 1,050.00$ 119,700.00$ 6 Drainage Structures, Box Culvert Custom Endwall 2 EA 15,000.00$ 30,000.00$ 7 Concrete Curb and Gutter 56 LF 35.00$ 1,960.00$ 8 Asphalt Replacement (Surface, Base Course, & Milling) 114 SY 55.00$ 6,270.00$ 9 Traffic Control (Single 2-lane road) 1 LS 10,000.00$ 10,000.00$
10 Utility Relocations** 1 LS 5,000.00$ 5,000.00$ 11 Erosion Control (1-2 acre LOD) 1 LS 15,000.00$ 15,000.00$
Subtotal 251,200.00$ 30% Contingency $75,400.00
Total 326,600.00$ Design, Administration, Fiscal and Legal (30% of Construction Costs) 98,000.00
Total Opinion of Project Cost 424,600.00$
* Cost for comprehensive grading includes roadway excavation, saw cutting, compaction of select material, geotechnical recommendations, home owner coordination, tree and structure protection, structure removal and disposal, shoring, and culvert excavation.
** Cost for utility conflicts includes all utilities that need to be moved including sanitary sewer and potable water lines. Additional survey may be required to locate pressurized utilities.
The Engineer’s opinions of probable construction costs are made on the basis of the Engineer’s experience and qualifications and represent the Engineer’s best judgment as a professional generally familiar with the construction industry. Since the Engineer has no control over the cost of labor, materials, equipment, or services furnished by others; over the contractors methods of determining prices; or over competitive bidding or marketing conditions, the Engineer’s cannot and does not guarantee that proposal, bids or actual construction costs will not vary from opinions of probable construction costs prepared by the Engineer.
Sterling Pointe Drive - Alternative #2
Item Number Item Description Quantities Unit Unit Price Amount

1 Mobilization (10%) 1 LS 921,400.00$ 921,400.00$ 2 Comprehensive Grading (20%)* 1 LS 1,535,600.00$ 1,535,600.00$ 3 Construction Staking (Greater than 800000) 1 LS 10,000.00$ 10,000.00$ 4 Excavation 258133 CY 25.00$ 6,453,333.33$ 5 Hauling 258133 CY 4.00$ 1,032,533.33$ 6 Clearing & Grubbing 32.00 AC 5,000.00$ 160,000.00$ 7 Riparian Seed Mix 4840 SY 1.50$ 7,260.00$ 8 Traffic Control (Single 2-lane road) 1 LS 10,000.00$ 10,000.00$ 9 Utility Relocations** 1 LS 5,000.00$ 5,000.00$
10 Erosion Control (Greater than 5 acre LOD) 1 LS 50,000.00$ 50,000.00$
Subtotal 10,185,100.00$ 30% Contingency $3,055,500.00
Total 13,240,600.00$ Land Acquisition 820,000.00$
Design, Administration, Fiscal and Legal (30% of Construction Costs) 4,218,200.00Total Opinion of Project Cost 18,278,800.00$
* Cost for comprehensive grading includes roadway excavation, saw cutting, compaction of select material, geotechnical recommendations, home owner coordination, tree and structure protection, structure removal and disposal, shoring, and culvert excavation.
** Cost for utility conflicts includes all utilities that need to be moved including sanitary sewer and potable water lines. Additional survey may be required to locate pressurized utilities.
The Engineer’s opinions of probable construction costs are made on the basis of the Engineer’s experience and qualifications and represent the Engineer’s best judgment as a professional generally familiar with the construction industry. Since the Engineer has no control over the cost of labor, materials, equipment, or services furnished by others; over the contractors methods of determining prices; or over competitive bidding or marketing conditions, the Engineer’s cannot and does not guarantee that proposal, bids or actual construction costs will not vary from opinions of probable construction costs prepared by the Engineer.
Pitt County Community College Proposed Regional Detention Pond
Item Number Item Description Quantities Unit Unit Price Amount

1 Mobilization (10%) 1 LS 43,645.00$ 43,645.00$ 2 Comprehensive Grading* 1 LS 72,800.00$ 72,800.00$ 3 Construction Staking (300000-800000) 1 LS 6,000.00$ 6,000.00$ 4 Channel Grading 5310 SY 15.00$ 79,650.00$ 5 Erosion Control Matting 5310 SY 10.00$ 53,100.00$ 6 Live Staking 2070 SY 15.00$ 31,050.00$ 7 Riparian Seed Mix 5310 SY 1.50$ 7,965.00$ 8 Buffer Plantings 3472 SY 4.00$ 13,888.89$ 9 Rip Rap Stone, Class 1 100 TN 70.00$ 7,000.00$
10 Gabion Wall 500 LF 300.00$ 150,000.00$ 11 Erosion Control (1-2 acre LOD) 1 LS 15,000.00$ 15,000.00$
Subtotal 480,100.00$ 30% Contingency $144,000.00
Total 624,100.00$ Design, Administration, Fiscal and Legal (30% of Construction Costs) 187,200.00
Total Opinion of Project Cost 811,300.00$
* Cost for comprehensive grading includes roadway excavation, saw cutting, compaction of select material, geotechnical recommendations, home owner coordination, tree and structure protection, structure removal and disposal, shoring, and culvert excavation.
The Engineer’s opinions of probable construction costs are made on the basis of the Engineer’s experience and qualifications and represent the Engineer’s best judgment as a professional generally familiar with the construction industry. Since the Engineer has no control over the cost of labor, materials, equipment, or services furnished by others; over the contractors methods of determining prices; or over competitive bidding or marketing conditions, the Engineer’s cannot and does not guarantee that proposal, bids or actual construction costs will not vary from opinions of probable construction costs prepared by the Engineer.
Stream Stabilization Project #1 - Thomas Langston Road (Swift Creek Main Branch)
Item Number Item Description Quantities Unit Unit Price Amount

1 Mobilization (10%) 1 LS 3,766.00$ 3,766.00$ 2 Comprehensive Grading* 1 LS 6,200.00$ 6,200.00$ 3 Construction Staking (0-300000) 1 LS 3,000.00$ 3,000.00$ 4 Channel Grading 240 SY 15.00$ 3,600.00$ 5 Erosion Control Matting 240 SY 10.00$ 2,400.00$ 6 Live Staking 240 SY 15.00$ 3,600.00$ 7 Riparian Seed Mix 240 SY 1.50$ 360.00$ 8 Rip Rap Stone, Class 1 50 TN 70.00$ 3,500.00$ 9 Erosion Control (1-2 acre LOD) 1 LS 15,000.00$ 15,000.00$
Subtotal 41,400.00$ 30% Contingency $12,400.00
Total 53,800.00$ Design, Administration, Fiscal and Legal (30% of Construction Costs) 16,100.00
Total Opinion of Project Cost 69,900.00$ * Cost for comprehensive grading includes roadway excavation, saw cutting, compaction of select material, geotechnical recommendations, home owner coordination, tree and structure protection, structure removal and disposal, shoring, and culvert excavation.
The Engineer’s opinions of probable construction costs are made on the basis of the Engineer’s experience and qualifications and represent the Engineer’s best judgment as a professional generally familiar with the construction industry. Since the Engineer has no control over the cost of labor, materials, equipment, or services furnished by others; over the contractors methods of determining prices; or over competitive bidding or marketing conditions, the Engineer’s cannot and does not guarantee that proposal, bids or actual construction costs will not vary from opinions of probable construction costs prepared by the Engineer.
Stream Stabilization Project #2- Thomas Langston Culvert (SCUT1)
Item Number Item Description Quantities Unit Unit Price Amount

Ridgewood Elementary School BioretentionPreliminary Opinion of Probable Construction Cost
Item Description Unit Unit Price Amount
1 Mobilization (10%) 1 LS 17,590.00$ 17,590.00$ 2 Comprehensive Grading (20%) 1 LS 29,400.00$ 29,400.00$ 3 Erosion Control (1-2 acre LOD) 1 LS 15,000.00$ 15,000.00$ 4 Excavation 1204 CY 25.00$ 30,092.59$ 5 Hauling 1204 CY 4.00$ 4,814.81$ 6 Soil Media 1204 CY 50.00$ 60,185.19$ 7 Construction Staking (0-300000) 1 EA 3,000.00$ 3,000.00$ 8 BMP Plantings 6500 SF 2.00$ 13,000.00$ 9 Seeding and Mulching 0.15 AC 7,500.00$ 1,119.15$
10 24" R.C. Pipe Culvert, Class III 91 LF 70.00$ 6,370.00$ 11 24" R.C. Pipe Culvert, Class IV 26 LF 75.00$ 1,950.00$ 12 Flared End Section, 24 inch 1 EA 2,000.00$ 2,000.00$ 13 Drainage Structures, Inlet 3 EA 3,000.00$ 9,000.00$
Subtotal 193,521.74$ 30% Contingency 58,100.00$
Total 251,621.74$ Design, Administration, Fiscal and Legal (30% of Construction Costs) 75,500.00$
Total Opinion of Project Cost 327,100.00$
QUANTITIES
* Cost for comprehensive grading includes roadway excavation, saw cutting, compaction of select material, geotechnical recommendations, home owner coordination, tree and structure protection, structure removal and disposal, shoring, and culvert excavation.
The Engineer’s opinions of probable construction costs are made on the basis of the Engineer’s experience and qualifications and represent the Engineer’s best judgment as a professional generally familiar with the construction industry. Since the Engineer has no control over the cost of labor, materials, equipment, or services furnished by others; over the contractors methods of determining prices; or over competitive bidding or marketing conditions, the Engineer’s cannot and does not guarantee that proposal, bids or actual construction costs will not vary from opinions of probable construction costs prepared by the Engineer.

Pinecrest Water Quality SwalePreliminary Opinion of Probable Construction Cost
Item Description Unit Unit Price Amount
1 Mobilization (10%) 1 LS 2,840.00$ 2,840.00$ 2 Comprehensive Grading (20%) 1 LS 4,800.00$ 4,800.00$ 3 Erosion Control (1-2 acre LOD) 1 LS 15,000.00$ 15,000.00$ 4 Excavation 256 CY 25.00$ 6,388.89$ 5 Hauling 256 CY 4.00$ 1,022.22$ 6 Seeding and Mulching 0.2 AC 7,500.00$ 1,188.02$
Subtotal 31,239.13$ 30% Contingency 9,400.00$
Total 40,639.13$ Design, Administration, Fiscal and Legal (30% of Construction Costs) 12,200.00$
Total Opinion of Project Cost 52,800.00$
QUANTITIES
* Cost for comprehensive grading includes roadway excavation, saw cutting, compaction of select material, geotechnical recommendations, home owner coordination, tree and structure protection, structure removal and disposal, shoring, and culvert excavation.
The Engineer’s opinions of probable construction costs are made on the basis of the Engineer’s experience and qualifications and represent the Engineer’s best judgment as a professional generally familiar with the construction industry. Since the Engineer has no control over the cost of labor, materials, equipment, or services furnished by others; over the contractors methods of determining prices; or over competitive bidding or marketing conditions, the Engineer’s cannot and does not guarantee that proposal, bids or actual construction costs will not vary from opinions of probable construction costs prepared by the Engineer.

Emerald Park BioretentionPreliminary Opinion of Probable Construction Cost
Item Description Unit Unit Price Amount
1 Mobilization (10%) 1 LS 12,670.00$ 12,670.00$ 2 Comprehensive Grading (20%) 1 LS 20,600.00$ 20,600.00$ 3 Construction Staking (0-300000) 1 LS 3,000.00$ 3,000.00$ 4 Erosion Control (1-2 acre LOD) 1 LS 15,000.00$ 15,000.00$ 5 Excavation 796 CY 25.00$ 19,907.41$ 6 Hauling 796 CY 4.00$ 3,185.19$ 7 Soil Media 796 CY 50.00$ 39,814.81$ 8 BMP Plantings 4300 SF 2.00$ 8,600.00$ 9 Seeding and Mulching 0.1 AC 7,500.00$ 740.36$
10 18" R.C. Pipe Culvert, Class III 66 LF 55.00$ 3,630.00$ 11 Flared End Section, 18 inch 1 EA 1,000.00$ 1,000.00$ 12 Asphalt Replacement (Surface, Base Course, & Milling) 41 SY 55.00$ 2,245.83$ 13 Drainage Structures, Inlet 3 EA 3,000.00$ 9,000.00$
Subtotal 139,393.60$ 30% Contingency 41,800.00$
Total 181,193.60$ Design, Administration, Fiscal and Legal (30% of Construction Costs) 54,400.00$
Total Opinion of Project Cost 236,000.00$
QUANTITIES
* Cost for comprehensive grading includes roadway excavation, saw cutting, compaction of select material, geotechnical recommendations, home owner coordination, tree and structure protection, structure removal and disposal, shoring, and culvert excavation.
The Engineer’s opinions of probable construction costs are made on the basis of the Engineer’s experience and qualifications and represent the Engineer’s best judgment as a professional generally familiar with the construction industry. Since the Engineer has no control over the cost of labor, materials, equipment, or services furnished by others; over the contractors methods of determining prices; or over competitive bidding or marketing conditions, the Engineer’s cannot and does not guarantee that proposal, bids or actual construction costs will not vary from opinions of probable construction costs prepared by the Engineer.

Davenport Farm Road Water Quality SwalePreliminary Opinion of Probable Construction Cost
Item Description Unit Unit Price Amount
1 Mobilization (10%) 1 LS 5,390.00$ 5,390.00$ 2 Comprehensive Grading (20%) 1 LS 9,000.00$ 9,000.00$ 3 Erosion Control (1-2 acre LOD) 1 LS 15,000.00$ 15,000.00$ 4 Excavation 992 CY 25.00$ 24,791.67$ 5 Hauling 992 CY 4.00$ 3,966.67$ 6 Seeding and Mulching 0.2 AC 7,500.00$ 1,188.02$
Subtotal 59,336.35$ 30% Contingency 17,800.00$
Total 77,136.35$ Design, Administration, Fiscal and Legal (30% of Construction Costs) 23,100.00$
Total Opinion of Project Cost 100,200.00$
QUANTITIES
* Cost for comprehensive grading includes roadway excavation, saw cutting, compaction of select material, geotechnical recommendations, home owner coordination, tree and structure protection, structure removal and disposal, shoring, and culvert excavation.
The Engineer’s opinions of probable construction costs are made on the basis of the Engineer’s experience and qualifications and represent the Engineer’s best judgment as a professional generally familiar with the construction industry. Since the Engineer has no control over the cost of labor, materials, equipment, or services furnished by others; over the contractors methods of determining prices; or over competitive bidding or marketing conditions, the Engineer’s cannot and does not guarantee that proposal, bids or actual construction costs will not vary from opinions of probable construction costs prepared by the Engineer.

South Bend Regenerative Stormwater ConveyancePreliminary Opinion of Probable Construction Cost
Item Description Unit Unit Price Amount
1 Mobilization (10%) 1 LS 9,990.00$ 9,990.00$ 2 Excavation 778 CY 25.00$ 19,444.44$ 3 Hauling 778 CY 4.00$ 3,111.11$ 4 RSC Sand/Wood Chip Mixture 1167 CY 45.00$ 52,500.00$ 5 Cascade Boulders 173 TN 75.00$ 13,000.00$ 6 Cobble 173 TN 75.00$ 13,000.00$ 7 BMP Plantings 3200 SF 2.00$ 6,400.00$ 8 Erosion Control (1-2 acre LOD) 1 LS 15,000.00$ 15,000.00$
Subtotal 132,445.56$ 30% Contingency 39,700.00$
Total 172,145.56$ Design, Administration, Fiscal and Legal (30% of Construction Costs) 51,600.00$
Total Opinion of Project Cost 223,700.00$
QUANTITIES
* Cost for comprehensive grading includes roadway excavation, saw cutting, compaction of select material, geotechnical recommendations, home owner coordination, tree and structure protection, structure removal and disposal, shoring, and culvert excavation.
The Engineer’s opinions of probable construction costs are made on the basis of the Engineer’s experience and qualifications and represent the Engineer’s best judgment as a professional generally familiar with the construction industry. Since the Engineer has no control over the cost of labor, materials, equipment, or services furnished by others; over the contractors methods of determining prices; or over competitive bidding or marketing conditions, the Engineer’s cannot and does not guarantee that proposal, bids or actual construction costs will not vary from opinions of probable construction costs prepared by the Engineer.

Wells Fargo Wet Pond RetrofitPreliminary Opinion of Probable Construction Cost
Item Description Unit Unit Price Amount
1 Mobilization (10%) 1 LS 10,760.00$ 10,760.00$ 2 Comprehensive Grading (20%) 1 LS 18,000.00$ 18,000.00$ 3 Erosion Control (1-2 acre LOD) 1 LS 15,000.00$ 15,000.00$ 4 Excavation 1556 CY 25.00$ 38,888.89$ 5 Hauling 1556 CY 4.00$ 6,222.22$ 6 Construction Staking (0-300000) 1 EA 3,000.00$ 3,000.00$ 7 Drainage Structures, Inlet 1 EA 3,000.00$ 3,000.00$ 8 36" R.C. Pipe Culvert, Class III 175 LF 120.00$ 21,000.00$ 9 Flared End Section, 36 inch 1 EA 2,500.00$ 2,500.00$
Subtotal 118,371.11$ 30% Contingency 35,500.00$
Total 153,871.11$ Design, Administration, Fiscal and Legal (30% of Construction Costs) 46,200.00$
Total Opinion of Project Cost 200,100.00$
QUANTITIES
* Cost for comprehensive grading includes roadway excavation, saw cutting, compaction of select material, geotechnical recommendations, home owner coordination, tree and structure protection, structure removal and disposal, shoring, and culvert excavation.
The Engineer’s opinions of probable construction costs are made on the basis of the Engineer’s experience and qualifications and represent the Engineer’s best judgment as a professional generally familiar with the construction industry. Since the Engineer has no control over the cost of labor, materials, equipment, or services furnished by others; over the contractors methods of determining prices; or over competitive bidding or marketing conditions, the Engineer’s cannot and does not guarantee that proposal, bids or actual construction costs will not vary from opinions of probable construction costs prepared by the Engineer.

Sterling Pointe Apartments Wet Pond RetrofitPreliminary Opinion of Probable Construction Cost
Item Description Unit Unit Price Amount
1 Mobilization (10%) 1 LS 5,520.00$ 5,520.00$ 2 Comprehensive Grading (20%) 1 LS 9,200.00$ 9,200.00$ 3 Erosion Control (1-2 acre LOD) 1 LS 15,000.00$ 15,000.00$ 4 Excavation 556 CY 25.00$ 13,888.89$ 5 Hauling 556 CY 4.00$ 2,222.22$ 6 Construction Staking (0-300000) 1 EA 3,000.00$ 3,000.00$ 7 Drainage Structures, Inlet 1 EA 3,000.00$ 3,000.00$ 8 36" R.C. Pipe Culvert, Class III 53 LF 120.00$ 6,360.00$ 9 Flared End Section, 36 inch 1 EA 2,500.00$ 2,500.00$
Subtotal 60,691.11$ 30% Contingency 18,200.00$
Total 78,891.11$ Design, Administration, Fiscal and Legal (30% of Construction Costs) 23,700.00$
Total Opinion of Project Cost 102,600.00$
QUANTITIES
* Cost for comprehensive grading includes roadway excavation, saw cutting, compaction of select material, geotechnical recommendations, home owner coordination, tree and structure protection, structure removal and disposal, shoring, and culvert excavation.
The Engineer’s opinions of probable construction costs are made on the basis of the Engineer’s experience and qualifications and represent the Engineer’s best judgment as a professional generally familiar with the construction industry. Since the Engineer has no control over the cost of labor, materials, equipment, or services furnished by others; over the contractors methods of determining prices; or over competitive bidding or marketing conditions, the Engineer’s cannot and does not guarantee that proposal, bids or actual construction costs will not vary from opinions of probable construction costs prepared by the Engineer.

South Central High Regenerative Stormwater ConveyancePreliminary Opinion of Probable Construction Cost
Item Description Unit Unit Price Amount
1 Mobilization (10%) 1 LS 6,740.00$ 6,740.00$ 2 Excavation 385 CY 25.00$ 9,629.63$ 3 Hauling 385 CY 4.00$ 1,540.74$ 4 RSC Sand/Wood Chip Mixture 578 CY 45.00$ 26,000.00$ 5 Cascade Boulders 154 TN 75.00$ 11,555.56$ 6 Cobble 154 TN 75.00$ 11,555.56$ 7 BMP Plantings 1625 SF 2.00$ 3,250.00$ 8 Erosion Control (1-2 acre LOD) 1 LS 15,000.00$ 15,000.00$
Subtotal 85,271.48$ 30% Contingency 25,600.00$
Total 110,871.48$ Design, Administration, Fiscal and Legal (30% of Construction Costs) 33,300.00$
Total Opinion of Project Cost 144,200.00$
QUANTITIES
* Cost for comprehensive grading includes roadway excavation, saw cutting, compaction of select material, geotechnical recommendations, home owner coordination, tree and structure protection, structure removal and disposal, shoring, and culvert excavation.
The Engineer’s opinions of probable construction costs are made on the basis of the Engineer’s experience and qualifications and represent the Engineer’s best judgment as a professional generally familiar with the construction industry. Since the Engineer has no control over the cost of labor, materials, equipment, or services furnished by others; over the contractors methods of determining prices; or over competitive bidding or marketing conditions, the Engineer’s cannot and does not guarantee that proposal, bids or actual construction costs will not vary from opinions of probable construction costs prepared by the Engineer.

South Central High BioretentionPreliminary Opinion of Probable Construction Cost
Item Description Unit Unit Price Amount
1 Mobilization (10%) 1 LS 69,570.00$ 69,570.00$ 2 Comprehensive Grading (20%) 1 LS 115,400.00$ 115,400.00$ 3 Construction Staking (0-300000) 1 LS 3,000.00$ 3,000.00$ 4 Erosion Control (1-2 acre LOD) 1 LS 15,000.00$ 15,000.00$ 5 Excavation 6111 CY 25.00$ 152,777.78$ 6 Hauling 6111 CY 4.00$ 24,444.44$ 7 Soil Media 6111 CY 50.00$ 305,555.56$ 8 BMP Plantings 33000 SF 2.00$ 66,000.00$ 9 Seeding and Mulching 0.8 AC 7,500.00$ 5,681.82$
10 42" R.C. Pipe Culvert, Class III 32 LF 150.00$ 4,800.00$ 11 Drainage Structures, Inlet 1 EA 3,000.00$ 3,000.00$
Subtotal 765,229.60$ 30% Contingency 229,600.00$
Total 994,829.60$ Design, Administration, Fiscal and Legal (30% of Construction Costs) 298,400.00$
Total Opinion of Project Cost 1,293,200.00$
QUANTITIES
* Cost for comprehensive grading includes roadway excavation, saw cutting, compaction of select material, geotechnical recommendations, home owner coordination, tree and structure protection, structure removal and disposal, shoring, and culvert excavation.
The Engineer’s opinions of probable construction costs are made on the basis of the Engineer’s experience and qualifications and represent the Engineer’s best judgment as a professional generally familiar with the construction industry. Since the Engineer has no control over the cost of labor, materials, equipment, or services furnished by others; over the contractors methods of determining prices; or over competitive bidding or marketing conditions, the Engineer’s cannot and does not guarantee that proposal, bids or actual construction costs will not vary from opinions of probable construction costs prepared by the Engineer.

Dana Brooke WetlandPreliminary Opinion of Probable Construction Cost
Item Description Unit Unit Price Amount
1 Mobilization (10%) 1 LS 49,930.00$ 49,930.00$ 2 Comprehensive Grading (20%) 1 LS 82,200.00$ 82,200.00$ 3 Construction Staking (300000-800000) 1 LS 6,000.00$ 6,000.00$ 4 Erosion Control (2-5 acre LOD) 1 LS 30,000.00$ 30,000.00$ 5 Excavation 6963 CY 25.00$ 174,074.07$ 6 Hauling 6963 CY 4.00$ 27,851.85$ 7 BMP Plantings 70500 SF 2.00$ 141,000.00$ 8 Seeding and Mulching 1.6 AC 7,500.00$ 12,138.43$ 9 42" R.C. Pipe Culvert, Class III 110 LF 150.00$ 16,500.00$
10 Drainage Structures, DOT Standard Endwall 1 EA 6,000.00$ 6,000.00$ 11 Drainage Structures, Manhole 1 EA 3,500.00$ 3,500.00$
Subtotal 549,194.36$ 30% Contingency 164,800.00$
Total 713,994.36$ Design, Administration, Fiscal and Legal (30% of Construction Costs) 214,200.00$
Total Opinion of Project Cost 928,200.00$
QUANTITIES
* Cost for comprehensive grading includes roadway excavation, saw cutting, compaction of select material, geotechnical recommendations, home owner coordination, tree and structure protection, structure removal and disposal, shoring, and culvert excavation.
The Engineer’s opinions of probable construction costs are made on the basis of the Engineer’s experience and qualifications and represent the Engineer’s best judgment as a professional generally familiar with the construction industry. Since the Engineer has no control over the cost of labor, materials, equipment, or services furnished by others; over the contractors methods of determining prices; or over competitive bidding or marketing conditions, the Engineer’s cannot and does not guarantee that proposal, bids or actual construction costs will not vary from opinions of probable construction costs prepared by the Engineer.

Appendix H:
Hydraulic & Hydrologic Input and Output Data
List of Contents:
1. HEC‐HMS Output (2‐,10‐,25‐,50‐, and 100‐Year Storms)
a. Existing Conditions b. Future Conditions c. Alternative #1 d. Alternative #2
2. Existing Conditions HEC‐RAS Output (2‐,10‐,25‐,50‐, and 100‐Year Storms)
a. Swift Creek
b. SCUT1 c. Gum Swamp
3. Future Conditions HEC‐RAS Output (2‐,10‐,25‐,50‐, and 100‐Year Storms)
a. Swift Creek
b. SCUT1 c. Gum Swamp
4. Alternative #1 HEC‐RAS Output (2‐,10‐,25‐,50‐, and 100‐Year Storms)
a. Swift Creek
b. SCUT1 c. Gum Swamp
5. Alternative #2 HEC‐RAS Output (2‐,10‐,25‐,50‐, and 100‐Year Storms)
a. Swift Creek
b. SCUT1

6. Existing Conditions SWMM Output for Davenport Farm Road
(10‐Year)
7. Alternative SWMM Output for Davenport Farm Road (10‐Year)

PRIMARY SYSTEM
EXISTING CONDITIONS:
HEC‐HMS OUTPUT

City of Greenville ‐ Swift Creek Watershed Master Plan ‐ HMS Output
Hydrologic ElementDrainage Area
(mi2)
Peak Discharge
(CFS)Time of Peak
Volume
(AC‐FT)
SC‐1C 0.20 32.6 04Aug2013, 15:55 14.5
SC‐1D 0.16 19 04Aug2013, 17:40 10.9
ADD SC‐1C‐1D 0.36 47.7 04Aug2013, 16:25 25.4
RT SC‐1C‐1D 0.36 47.7 04Aug2013, 16:30 25.3
SC‐1A 0.15 28.1 04Aug2013, 17:30 15.9
RT SC‐1A 0.15 28 04Aug2013, 17:40 15.7
SC‐1B 0.10 30.9 04Aug2013, 14:10 7.6
ADD SC‐1B 0.26 35.3 04Aug2013, 14:15 23.3
SC‐1E 0.17 48.2 04Aug2013, 15:15 18
RT SC‐1E 0.17 47.8 04Aug2013, 15:25 17.9
U/S Limit SC 0.79 121.5 04Aug2013, 15:55 66.5
RT ‐ Swift Creek 1 0.79 121.2 04Aug2013, 16:05 66.1
SC‐2A 0.16 23.9 04Aug2013, 16:30 11.8
SC‐2B 0.09 68.4 04Aug2013, 13:25 9.1
ADD SC‐2 1.04 151.6 04Aug2013, 16:05 87
SC‐3B 0.10 40.4 04Aug2013, 13:55 8.7
SC‐3A 0.09 7.7 04Aug2013, 16:45 4
ADD SC‐3A‐3B 0.18 41.5 04Aug2013, 14:00 12.7
RT SC‐3A‐3B 0.18 41.3 04Aug2013, 14:05 12.7
SC‐3C 0.05 27.1 04Aug2013, 13:45 5.1
ADD SC‐3 1.28 173.6 04Aug2013, 16:00 104.7
Thomas Langston ‐ SC 1.28 173.4 04Aug2013, 16:05 104.3
RT ‐ Swift Creek 2 1.28 173.4 04Aug2013, 16:05 102.9
SC‐4 0.17 71.2 04Aug2013, 13:50 14.5
Sterling Trace Drive 1.45 188.5 04Aug2013, 16:05 115.1
RT SC‐4 1.45 187.2 04Aug2013, 16:30 112.8
SC‐5B 0.08 29.6 04Aug2013, 14:15 7.5
SC‐5A 0.04 24.5 04Aug2013, 13:30 3.7
ADD SC‐5A‐5B 1.56 198.9 04Aug2013, 16:00 124
SCUT‐1B 0.07 14.1 04Aug2013, 14:50 4.7
SCUT‐1A 0.07 34.5 04Aug2013, 13:50 7
ADD SCUT‐1A‐1B 0.15 42.4 04Aug2013, 14:00 11.7
SCUT‐1C 0.05 35.6 04Aug2013, 13:30 5.2
U/S Limit SCUT 0.20 67.4 04Aug2013, 13:40 16.9
RT SCUT‐1C 0.20 63.8 04Aug2013, 13:50 16.7
SCUT‐1D 0.06 14.1 04Aug2013, 15:10 5.2
Thomas Langston Road ‐ SCUT 0.26 67.9 04Aug2013, 14:10 21.8
RT SCUT‐1D 0.26 67.3 04Aug2013, 14:20 21.7
SCUT‐2 0.05 18 04Aug2013, 14:40 5.5
Belfair Drive 0.31 83.6 04Aug2013, 14:30 27.1
RT ‐ UT to Swift Creek 1 0.31 83.6 04Aug2013, 14:30 26.7
SCUT‐3 0.09 49.7 04Aug2013, 13:55 10.7
Sterling Pointe Drive 0.40 123 04Aug2013, 14:20 36.8
RT ‐ UT to Swift Creek 2 0.40 122.6 04Aug2013, 14:20 36.7
SCUT‐4C 0.05 38.7 04Aug2013, 13:35 6.2
SCUT‐4B 0.05 63.5 04Aug2013, 13:10 6.7
SCUT‐4A 0.00 0 04Aug2013, 14:30 0
ADD SCUT‐4A‐4B 0.05 63.5 04Aug2013, 13:10 6.7
ADD SCUT‐4C 0.10 86.3 04Aug2013, 13:15 12.9
SCUT‐4D 0.04 41.5 04Aug2013, 13:20 5.3
ADD SCUT‐4D 0.14 125.1 04Aug2013, 13:15 18.2
RT SCUT‐4D 0.14 124.3 04Aug2013, 13:20 18.2
ADD SCUT 4 0.55 157.8 04Aug2013, 14:05 54.9
RT ‐ UT to Swift Creek 3 0.55 157.5 04Aug2013, 14:10 54.8
SCUT‐5 0.06 45.6 04Aug2013, 13:40 7.9
D/S Limit SCUT 0.61 188.8 04Aug2013, 14:00 62.8
2‐YEAR EXISTING
Appendix H
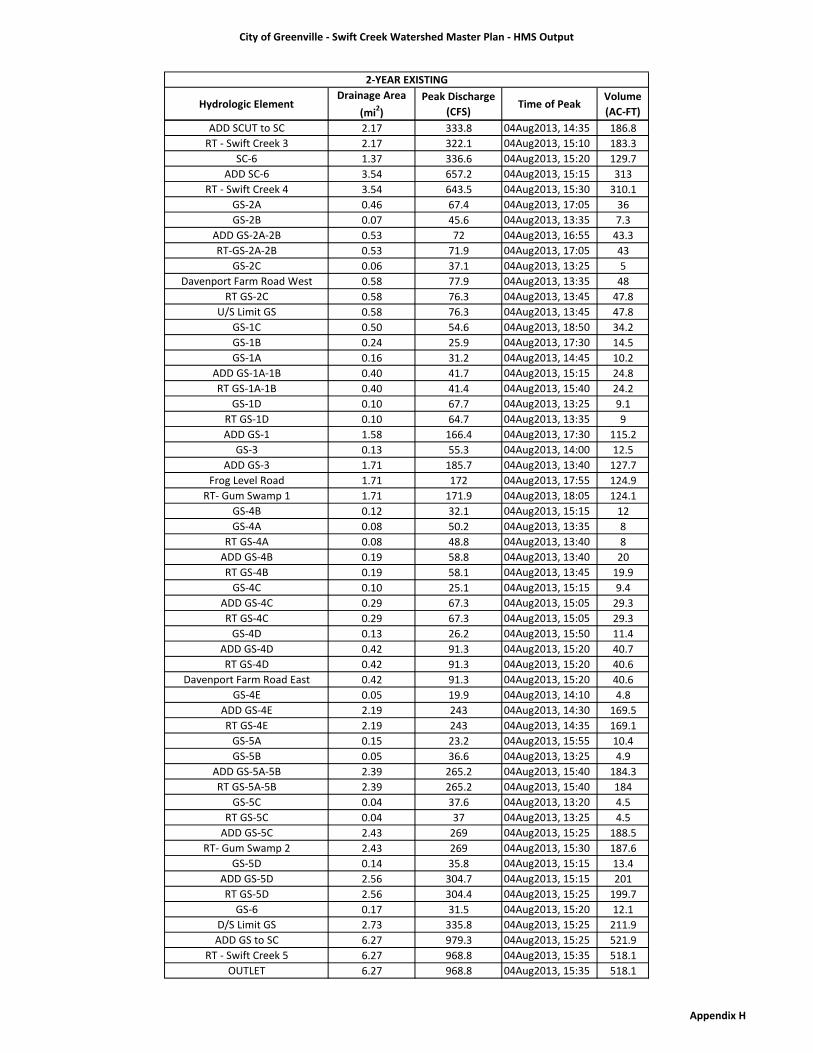
City of Greenville ‐ Swift Creek Watershed Master Plan ‐ HMS Output
Hydrologic ElementDrainage Area
(mi2)
Peak Discharge
(CFS)Time of Peak
Volume
(AC‐FT)
2‐YEAR EXISTING
ADD SCUT to SC 2.17 333.8 04Aug2013, 14:35 186.8
RT ‐ Swift Creek 3 2.17 322.1 04Aug2013, 15:10 183.3
SC‐6 1.37 336.6 04Aug2013, 15:20 129.7
ADD SC‐6 3.54 657.2 04Aug2013, 15:15 313
RT ‐ Swift Creek 4 3.54 643.5 04Aug2013, 15:30 310.1
GS‐2A 0.46 67.4 04Aug2013, 17:05 36
GS‐2B 0.07 45.6 04Aug2013, 13:35 7.3
ADD GS‐2A‐2B 0.53 72 04Aug2013, 16:55 43.3
RT‐GS‐2A‐2B 0.53 71.9 04Aug2013, 17:05 43
GS‐2C 0.06 37.1 04Aug2013, 13:25 5
Davenport Farm Road West 0.58 77.9 04Aug2013, 13:35 48
RT GS‐2C 0.58 76.3 04Aug2013, 13:45 47.8
U/S Limit GS 0.58 76.3 04Aug2013, 13:45 47.8
GS‐1C 0.50 54.6 04Aug2013, 18:50 34.2
GS‐1B 0.24 25.9 04Aug2013, 17:30 14.5
GS‐1A 0.16 31.2 04Aug2013, 14:45 10.2
ADD GS‐1A‐1B 0.40 41.7 04Aug2013, 15:15 24.8
RT GS‐1A‐1B 0.40 41.4 04Aug2013, 15:40 24.2
GS‐1D 0.10 67.7 04Aug2013, 13:25 9.1
RT GS‐1D 0.10 64.7 04Aug2013, 13:35 9
ADD GS‐1 1.58 166.4 04Aug2013, 17:30 115.2
GS‐3 0.13 55.3 04Aug2013, 14:00 12.5
ADD GS‐3 1.71 185.7 04Aug2013, 13:40 127.7
Frog Level Road 1.71 172 04Aug2013, 17:55 124.9
RT‐ Gum Swamp 1 1.71 171.9 04Aug2013, 18:05 124.1
GS‐4B 0.12 32.1 04Aug2013, 15:15 12
GS‐4A 0.08 50.2 04Aug2013, 13:35 8
RT GS‐4A 0.08 48.8 04Aug2013, 13:40 8
ADD GS‐4B 0.19 58.8 04Aug2013, 13:40 20
RT GS‐4B 0.19 58.1 04Aug2013, 13:45 19.9
GS‐4C 0.10 25.1 04Aug2013, 15:15 9.4
ADD GS‐4C 0.29 67.3 04Aug2013, 15:05 29.3
RT GS‐4C 0.29 67.3 04Aug2013, 15:05 29.3
GS‐4D 0.13 26.2 04Aug2013, 15:50 11.4
ADD GS‐4D 0.42 91.3 04Aug2013, 15:20 40.7
RT GS‐4D 0.42 91.3 04Aug2013, 15:20 40.6
Davenport Farm Road East 0.42 91.3 04Aug2013, 15:20 40.6
GS‐4E 0.05 19.9 04Aug2013, 14:10 4.8
ADD GS‐4E 2.19 243 04Aug2013, 14:30 169.5
RT GS‐4E 2.19 243 04Aug2013, 14:35 169.1
GS‐5A 0.15 23.2 04Aug2013, 15:55 10.4
GS‐5B 0.05 36.6 04Aug2013, 13:25 4.9
ADD GS‐5A‐5B 2.39 265.2 04Aug2013, 15:40 184.3
RT GS‐5A‐5B 2.39 265.2 04Aug2013, 15:40 184
GS‐5C 0.04 37.6 04Aug2013, 13:20 4.5
RT GS‐5C 0.04 37 04Aug2013, 13:25 4.5
ADD GS‐5C 2.43 269 04Aug2013, 15:25 188.5
RT‐ Gum Swamp 2 2.43 269 04Aug2013, 15:30 187.6
GS‐5D 0.14 35.8 04Aug2013, 15:15 13.4
ADD GS‐5D 2.56 304.7 04Aug2013, 15:15 201
RT GS‐5D 2.56 304.4 04Aug2013, 15:25 199.7
GS‐6 0.17 31.5 04Aug2013, 15:20 12.1
D/S Limit GS 2.73 335.8 04Aug2013, 15:25 211.9
ADD GS to SC 6.27 979.3 04Aug2013, 15:25 521.9
RT ‐ Swift Creek 5 6.27 968.8 04Aug2013, 15:35 518.1
OUTLET 6.27 968.8 04Aug2013, 15:35 518.1
Appendix H

City of Greenville ‐ Swift Creek Watershed Master Plan ‐ HMS Output
Hydrologic ElementDrainage Area
(mi2)
Peak Discharge
(CFS)Time of Peak
Volume
(AC‐FT)
SC‐1C 0.20 72 04Aug2013, 15:50 31.1
SC‐1D 0.16 41 04Aug2013, 17:30 23.3
ADD SC‐1C‐1D 0.36 104.7 04Aug2013, 16:15 54.3
RT SC‐1C‐1D 0.36 104.7 04Aug2013, 16:15 54.2
SC‐1A 0.15 52.5 04Aug2013, 17:25 29.9
RT SC‐1A 0.15 52.4 04Aug2013, 17:35 29.6
SC‐1B 0.10 68.1 04Aug2013, 14:05 16.2
ADD SC‐1B 0.26 79.2 04Aug2013, 14:10 45.9
SC‐1E 0.17 92.6 04Aug2013, 15:10 34.4
RT SC‐1E 0.17 91.9 04Aug2013, 15:20 34.2
U/S Limit SC 0.79 248.6 04Aug2013, 15:45 134.3
RT ‐ Swift Creek 1 0.79 247.7 04Aug2013, 15:55 133.5
SC‐2A 0.16 51.7 04Aug2013, 16:20 24.9
SC‐2B 0.09 132.6 04Aug2013, 13:25 17.7
ADD SC‐2 1.04 310.9 04Aug2013, 16:00 176.2
SC‐3B 0.10 82.6 04Aug2013, 13:55 17.5
SC‐3A 0.09 20.1 04Aug2013, 16:30 9.9
ADD SC‐3A‐3B 0.18 86.3 04Aug2013, 13:55 27.4
RT SC‐3A‐3B 0.18 86 04Aug2013, 14:00 27.3
SC‐3C 0.05 54.4 04Aug2013, 13:45 10.1
ADD SC‐3 1.28 358.7 04Aug2013, 15:50 213.7
Thomas Langston ‐ SC 1.28 358.1 04Aug2013, 15:55 213
RT ‐ Swift Creek 2 1.28 358 04Aug2013, 16:00 211.6
SC‐4 0.17 148.3 04Aug2013, 13:50 29.5
Sterling Trace Drive 1.45 415.6 04Aug2013, 14:30 238
RT SC‐4 1.45 395.5 04Aug2013, 15:15 235.6
SC‐5B 0.08 58.6 04Aug2013, 14:10 14.6
SC‐5A 0.04 46.7 04Aug2013, 13:30 7.1
ADD SC‐5A‐5B 1.56 439.1 04Aug2013, 14:55 257.4
SCUT‐1B 0.07 33.2 04Aug2013, 14:45 10.5
SCUT‐1A 0.07 68.1 04Aug2013, 13:50 13.7
ADD SCUT‐1A‐1B 0.15 88.7 04Aug2013, 14:00 24.2
SCUT‐1C 0.05 70.8 04Aug2013, 13:30 10.2
U/S Limit SCUT 0.20 138 04Aug2013, 13:40 34.5
RT SCUT‐1C 0.20 135.1 04Aug2013, 13:45 34.3
SCUT‐1D 0.06 30.1 04Aug2013, 15:05 10.7
Thomas Langston Road ‐ SCUT 0.26 145.1 04Aug2013, 13:55 44.9
RT SCUT‐1D 0.26 139.9 04Aug2013, 14:10 44.7
SCUT‐2 0.05 32.5 04Aug2013, 14:35 10.1
Belfair Drive 0.31 162.5 04Aug2013, 14:30 54.6
RT ‐ UT to Swift Creek 1 0.31 162.5 04Aug2013, 14:35 54.2
SCUT‐3 0.09 92.1 04Aug2013, 13:55 19.9
Sterling Pointe Drive 0.40 239.1 04Aug2013, 14:10 73.2
RT ‐ UT to Swift Creek 2 0.40 238.4 04Aug2013, 14:15 73.2
SCUT‐4C 0.05 71.3 04Aug2013, 13:35 11.5
SCUT‐4B 0.05 109 04Aug2013, 13:10 11.7
SCUT‐4A 0.00 0.1 04Aug2013, 14:30 0
ADD SCUT‐4A‐4B 0.05 109 04Aug2013, 13:10 11.8
ADD SCUT‐4C 0.10 152.6 04Aug2013, 13:15 23.3
SCUT‐4D 0.04 73.2 04Aug2013, 13:20 9.5
ADD SCUT‐4D 0.14 221.8 04Aug2013, 13:15 32.8
RT SCUT‐4D 0.14 219.5 04Aug2013, 13:20 32.8
ADD SCUT 4 0.55 304.3 04Aug2013, 14:05 105.9
RT ‐ UT to Swift Creek 3 0.55 301.1 04Aug2013, 14:10 105.8
SCUT‐5 0.06 80.5 04Aug2013, 13:40 14.2
D/S Limit SCUT 0.61 370.7 04Aug2013, 13:40 120
10‐YEAR EXISTING
Appendix H

City of Greenville ‐ Swift Creek Watershed Master Plan ‐ HMS Output
Hydrologic ElementDrainage Area
(mi2)
Peak Discharge
(CFS)Time of Peak
Volume
(AC‐FT)
10‐YEAR EXISTING
ADD SCUT to SC 2.17 729.9 04Aug2013, 14:30 377.4
RT ‐ Swift Creek 3 2.17 698.9 04Aug2013, 14:55 371.8
SC‐6 1.37 668.2 04Aug2013, 15:15 255
ADD SC‐6 3.54 1357.1 04Aug2013, 15:10 626.8
RT ‐ Swift Creek 4 3.54 1332.6 04Aug2013, 15:15 621.8
GS‐2A 0.46 140.7 04Aug2013, 16:55 74.2
GS‐2B 0.07 86.7 04Aug2013, 13:35 13.9
ADD GS‐2A‐2B 0.53 148.8 04Aug2013, 16:50 88.1
RT‐GS‐2A‐2B 0.53 148.6 04Aug2013, 16:55 87.7
GS‐2C 0.06 76.3 04Aug2013, 13:25 10.2
Davenport Farm Road West 0.58 162.3 04Aug2013, 13:35 97.9
RT GS‐2C 0.58 159.9 04Aug2013, 13:40 97.5
U/S Limit GS 0.58 159.9 04Aug2013, 13:40 97.5
GS‐1C 0.50 115.4 04Aug2013, 18:35 72.2
GS‐1B 0.24 59 04Aug2013, 17:15 32.4
GS‐1A 0.16 73.6 04Aug2013, 14:40 22.9
ADD GS‐1A‐1B 0.40 98.9 04Aug2013, 15:05 55.3
RT GS‐1A‐1B 0.40 98.3 04Aug2013, 15:30 54.4
GS‐1D 0.10 137 04Aug2013, 13:25 18.3
RT GS‐1D 0.10 130.5 04Aug2013, 13:30 18.2
ADD GS‐1 1.58 351.9 04Aug2013, 17:15 242.3
GS‐3 0.13 109.3 04Aug2013, 14:00 24.5
ADD GS‐3 1.71 390 04Aug2013, 13:40 266.8
Frog Level Road 1.71 367.9 04Aug2013, 17:15 262.3
RT‐ Gum Swamp 1 1.71 366.7 04Aug2013, 17:35 261.2
GS‐4B 0.12 61.7 04Aug2013, 15:10 22.9
GS‐4A 0.08 95.3 04Aug2013, 13:35 15.3
RT GS‐4A 0.08 92.4 04Aug2013, 13:35 15.3
ADD GS‐4B 0.19 114.6 04Aug2013, 13:40 38.2
RT GS‐4B 0.19 112.7 04Aug2013, 13:45 38.1
GS‐4C 0.10 49.7 04Aug2013, 15:10 18.5
ADD GS‐4C 0.29 132.5 04Aug2013, 13:50 56.6
RT GS‐4C 0.29 131.7 04Aug2013, 13:50 56.5
GS‐4D 0.13 53.7 04Aug2013, 15:45 23.1
ADD GS‐4D 0.42 179.5 04Aug2013, 15:15 79.5
RT GS‐4D 0.42 179.4 04Aug2013, 15:15 79.5
Davenport Farm Road East 0.42 179.4 04Aug2013, 15:15 79.5
GS‐4E 0.05 40.4 04Aug2013, 14:05 9.6
ADD GS‐4E 2.19 511.6 04Aug2013, 14:30 350.3
RT GS‐4E 2.19 511.1 04Aug2013, 14:40 349.6
GS‐5A 0.15 52.3 04Aug2013, 15:50 22.6
GS‐5B 0.05 70.4 04Aug2013, 13:25 9.4
ADD GS‐5A‐5B 2.39 559.9 04Aug2013, 14:50 381.6
RT GS‐5A‐5B 2.39 559.2 04Aug2013, 14:55 381
GS‐5C 0.04 70.2 04Aug2013, 13:15 8.5
RT GS‐5C 0.04 70 04Aug2013, 13:20 8.5
ADD GS‐5C 2.43 567.7 04Aug2013, 14:50 389.5
RT‐ Gum Swamp 2 2.43 566.1 04Aug2013, 15:05 387.9
GS‐5D 0.14 69.9 04Aug2013, 15:10 25.9
ADD GS‐5D 2.56 636 04Aug2013, 15:10 413.9
RT GS‐5D 2.56 634.8 04Aug2013, 15:20 411.8
GS‐6 0.17 69.6 04Aug2013, 15:15 26
D/S Limit GS 2.73 704.1 04Aug2013, 15:20 437.7
ADD GS to SC 6.27 2036.5 04Aug2013, 15:15 1059.6
RT ‐ Swift Creek 5 6.27 2015.4 04Aug2013, 15:25 1053.4
OUTLET 6.27 2015.4 04Aug2013, 15:25 1053.4
Appendix H

City of Greenville ‐ Swift Creek Watershed Master Plan ‐ HMS Output
Hydrologic ElementDrainage Area
(mi2)
Peak Discharge
(CFS)Time of Peak
Volume
(AC‐FT)
SC‐1C 0.20 101.8 04Aug2013, 15:45 43.7
SC‐1D 0.16 57.6 04Aug2013, 17:25 32.7
ADD SC‐1C‐1D 0.36 147.9 04Aug2013, 16:10 76.4
RT SC‐1C‐1D 0.36 147.8 04Aug2013, 16:15 76.2
SC‐1A 0.15 69.8 04Aug2013, 17:20 40
RT SC‐1A 0.15 69.7 04Aug2013, 17:30 39.7
SC‐1B 0.10 96.1 04Aug2013, 14:05 22.7
ADD SC‐1B 0.26 112.4 04Aug2013, 14:10 62.5
SC‐1E 0.17 124.3 04Aug2013, 15:10 46.3
RT SC‐1E 0.17 123.3 04Aug2013, 15:15 46.1
U/S Limit SC 0.79 342.4 04Aug2013, 15:45 184.8
RT ‐ Swift Creek 1 0.79 341 04Aug2013, 15:50 183.8
SC‐2A 0.16 72.6 04Aug2013, 16:20 34.9
SC‐2B 0.09 178.2 04Aug2013, 13:25 24.1
ADD SC‐2 1.04 428.6 04Aug2013, 15:55 242.8
SC‐3B 0.10 113.3 04Aug2013, 13:55 24
SC‐3A 0.09 30.2 04Aug2013, 16:25 14.7
ADD SC‐3A‐3B 0.18 119.8 04Aug2013, 13:55 38.7
RT SC‐3A‐3B 0.18 119.1 04Aug2013, 14:00 38.6
SC‐3C 0.05 74 04Aug2013, 13:45 13.8
ADD SC‐3 1.28 496.1 04Aug2013, 15:45 295.3
Thomas Langston ‐ SC 1.28 495.9 04Aug2013, 15:50 294.5
RT ‐ Swift Creek 2 1.28 495.9 04Aug2013, 15:50 293.1
SC‐4 0.17 204.6 04Aug2013, 13:50 40.8
Sterling Trace Drive 1.45 627.5 04Aug2013, 14:10 330
RT SC‐4 1.45 562.5 04Aug2013, 14:45 326.9
SC‐5B 0.08 79.5 04Aug2013, 14:10 19.9
SC‐5A 0.04 62.4 04Aug2013, 13:30 9.6
ADD SC‐5A‐5B 1.56 640.3 04Aug2013, 14:35 356.4
SCUT‐1B 0.07 48 04Aug2013, 14:40 15
SCUT‐1A 0.07 92.3 04Aug2013, 13:50 18.7
ADD SCUT‐1A‐1B 0.15 122.9 04Aug2013, 14:00 33.7
SCUT‐1C 0.05 96.3 04Aug2013, 13:25 14
U/S Limit SCUT 0.20 189.9 04Aug2013, 13:35 47.7
RT SCUT‐1C 0.20 187.3 04Aug2013, 13:45 47.5
SCUT‐1D 0.06 41.9 04Aug2013, 15:05 14.9
Thomas Langston Road ‐ SCUT 0.26 202.8 04Aug2013, 13:55 62.2
RT SCUT‐1D 0.26 197.2 04Aug2013, 14:05 62.1
SCUT‐2 0.05 42.6 04Aug2013, 14:35 13.3
Belfair Drive 0.31 220.2 04Aug2013, 14:30 75.2
RT ‐ UT to Swift Creek 1 0.31 220.2 04Aug2013, 14:35 74.7
SCUT‐3 0.09 121.9 04Aug2013, 13:55 26.5
Sterling Pointe Drive 0.40 315.3 04Aug2013, 14:15 100.2
RT ‐ UT to Swift Creek 2 0.40 314.4 04Aug2013, 14:15 100.1
SCUT‐4C 0.05 94.1 04Aug2013, 13:35 15.3
SCUT‐4B 0.05 140.3 04Aug2013, 13:10 15.3
SCUT‐4A 0.00 0.1 04Aug2013, 14:30 0
ADD SCUT‐4A‐4B 0.05 140.4 04Aug2013, 13:10 15.3
ADD SCUT‐4C 0.10 198.7 04Aug2013, 13:15 30.7
SCUT‐4D 0.04 95.1 04Aug2013, 13:20 12.5
ADD SCUT‐4D 0.14 288.9 04Aug2013, 13:15 43.2
RT SCUT‐4D 0.14 285.6 04Aug2013, 13:20 43.2
ADD SCUT 4 0.55 410.8 04Aug2013, 13:55 143.3
RT ‐ UT to Swift Creek 3 0.55 408.1 04Aug2013, 14:00 143
SCUT‐5 0.06 104.7 04Aug2013, 13:40 18.7
D/S Limit SCUT 0.61 494.7 04Aug2013, 13:50 161.7
25‐YEAR EXISTING
Appendix H

City of Greenville ‐ Swift Creek Watershed Master Plan ‐ HMS Output
Hydrologic ElementDrainage Area
(mi2)
Peak Discharge
(CFS)Time of Peak
Volume
(AC‐FT)
25‐YEAR EXISTING
ADD SCUT to SC 2.17 1055 04Aug2013, 14:25 518.1
RT ‐ Swift Creek 3 2.17 998.6 04Aug2013, 14:40 510.2
SC‐6 1.37 908.3 04Aug2013, 15:15 347.3
ADD SC‐6 3.54 1869 04Aug2013, 15:00 857.5
RT ‐ Swift Creek 4 3.54 1836.1 04Aug2013, 15:10 851.5
GS‐2A 0.46 195 04Aug2013, 16:50 102.9
GS‐2B 0.07 115.7 04Aug2013, 13:35 18.7
ADD GS‐2A‐2B 0.53 205.5 04Aug2013, 16:50 121.6
RT‐GS‐2A‐2B 0.53 205.3 04Aug2013, 16:55 121.2
GS‐2C 0.06 104.8 04Aug2013, 13:25 14
Davenport Farm Road West 0.58 225.4 04Aug2013, 13:30 135.2
RT GS‐2C 0.58 222.7 04Aug2013, 13:40 134.8
U/S Limit GS 0.58 222.7 04Aug2013, 13:40 134.8
GS‐1C 0.50 160.9 04Aug2013, 18:35 101
GS‐1B 0.24 84.4 04Aug2013, 17:10 46.3
GS‐1A 0.16 106.2 04Aug2013, 14:40 32.7
ADD GS‐1A‐1B 0.40 143.7 04Aug2013, 15:05 79
RT GS‐1A‐1B 0.40 142.8 04Aug2013, 15:25 77.8
GS‐1D 0.10 186.9 04Aug2013, 13:25 25.1
RT GS‐1D 0.10 179.3 04Aug2013, 13:30 25
ADD GS‐1 1.58 491 04Aug2013, 17:10 338.6
GS‐3 0.13 148.1 04Aug2013, 14:00 33.4
ADD GS‐3 1.71 547.8 04Aug2013, 13:40 371.9
Frog Level Road 1.71 512.8 04Aug2013, 17:10 366.1
RT‐ Gum Swamp 1 1.71 511.4 04Aug2013, 17:25 364.6
GS‐4B 0.12 82.8 04Aug2013, 15:10 30.9
GS‐4A 0.08 127.2 04Aug2013, 13:35 20.6
RT GS‐4A 0.08 124 04Aug2013, 13:35 20.6
ADD GS‐4B 0.19 154.6 04Aug2013, 13:40 51.4
RT GS‐4B 0.19 151.5 04Aug2013, 13:45 51.3
GS‐4C 0.10 67.6 04Aug2013, 15:10 25.1
ADD GS‐4C 0.29 179.4 04Aug2013, 13:45 76.5
RT GS‐4C 0.29 178.7 04Aug2013, 13:50 76.4
GS‐4D 0.13 73.9 04Aug2013, 15:45 31.8
ADD GS‐4D 0.42 243.1 04Aug2013, 15:15 108.1
RT GS‐4D 0.42 243.1 04Aug2013, 15:15 108.1
Davenport Farm Road East 0.42 243.1 04Aug2013, 15:15 108.1
GS‐4E 0.05 55.3 04Aug2013, 14:05 13.1
ADD GS‐4E 2.19 736.1 04Aug2013, 14:20 485.8
RT GS‐4E 2.19 735.3 04Aug2013, 14:30 484.7
GS‐5A 0.15 74.4 04Aug2013, 15:45 32
GS‐5B 0.05 94.4 04Aug2013, 13:25 12.8
ADD GS‐5A‐5B 2.39 799.9 04Aug2013, 14:35 529.5
RT GS‐5A‐5B 2.39 796.3 04Aug2013, 14:40 528.7
GS‐5C 0.04 93.4 04Aug2013, 13:15 11.4
RT GS‐5C 0.04 92.5 04Aug2013, 13:20 11.4
ADD GS‐5C 2.43 808.8 04Aug2013, 14:35 540.1
RT‐ Gum Swamp 2 2.43 802.1 04Aug2013, 14:45 538.2
GS‐5D 0.14 94.4 04Aug2013, 15:10 35.1
ADD GS‐5D 2.56 893.5 04Aug2013, 14:55 573.3
RT GS‐5D 2.56 891 04Aug2013, 15:05 570.6
GS‐6 0.17 98.4 04Aug2013, 15:10 36.5
D/S Limit GS 2.73 989.1 04Aug2013, 15:10 607.1
ADD GS to SC 6.27 2825.1 04Aug2013, 15:10 1458.5
RT ‐ Swift Creek 5 6.27 2794.5 04Aug2013, 15:15 1450.8
OUTLET 6.27 2794.5 04Aug2013, 15:15 1450.8
Appendix H

City of Greenville ‐ Swift Creek Watershed Master Plan ‐ HMS Output
Hydrologic ElementDrainage Area
(mi2)
Peak Discharge
(CFS)Time of Peak
Volume
(AC‐FT)
SC‐1C 0.20 128.6 04Aug2013, 15:45 55.2
SC‐1D 0.16 72.5 04Aug2013, 17:25 41.2
ADD SC‐1C‐1D 0.36 186.8 04Aug2013, 16:10 96.4
RT SC‐1C‐1D 0.36 186.8 04Aug2013, 16:10 96.3
SC‐1A 0.15 85.1 04Aug2013, 17:20 49.1
RT SC‐1A 0.15 85 04Aug2013, 17:25 48.7
SC‐1B 0.10 121.1 04Aug2013, 14:05 28.7
ADD SC‐1B 0.26 142.3 04Aug2013, 14:10 77.4
SC‐1E 0.17 152.2 04Aug2013, 15:10 57
RT SC‐1E 0.17 151.1 04Aug2013, 15:15 56.7
U/S Limit SC 0.79 426.3 04Aug2013, 15:40 230.4
RT ‐ Swift Creek 1 0.79 425 04Aug2013, 15:50 229.3
SC‐2A 0.16 91.3 04Aug2013, 16:15 44
SC‐2B 0.09 218.3 04Aug2013, 13:25 29.7
ADD SC‐2 1.04 534.2 04Aug2013, 15:50 302.9
SC‐3B 0.10 140.4 04Aug2013, 13:55 29.9
SC‐3A 0.09 39.5 04Aug2013, 16:20 19.1
ADD SC‐3A‐3B 0.18 149.8 04Aug2013, 13:55 49
RT SC‐3A‐3B 0.18 149.2 04Aug2013, 14:00 48.9
SC‐3C 0.05 91.3 04Aug2013, 13:45 17.2
ADD SC‐3 1.28 620 04Aug2013, 15:45 369
Thomas Langston ‐ SC 1.28 619.8 04Aug2013, 15:45 368.2
RT ‐ Swift Creek 2 1.28 619.7 04Aug2013, 15:50 366.7
SC‐4 0.17 254.6 04Aug2013, 13:50 50.9
Sterling Trace Drive 1.45 805.4 04Aug2013, 14:05 413
RT SC‐4 1.45 721.4 04Aug2013, 14:35 408.7
SC‐5B 0.08 97.9 04Aug2013, 14:10 24.6
SC‐5A 0.04 76.1 04Aug2013, 13:30 11.8
ADD SC‐5A‐5B 1.56 826.8 04Aug2013, 14:30 445.1
SCUT‐1B 0.07 61.4 04Aug2013, 14:40 19.1
SCUT‐1A 0.07 113.5 04Aug2013, 13:50 23.1
ADD SCUT‐1A‐1B 0.15 153.4 04Aug2013, 14:00 42.2
SCUT‐1C 0.05 118.9 04Aug2013, 13:25 17.3
U/S Limit SCUT 0.20 236 04Aug2013, 13:35 59.6
RT SCUT‐1C 0.20 232.8 04Aug2013, 13:45 59.4
SCUT‐1D 0.06 52.4 04Aug2013, 15:00 18.7
Thomas Langston Road ‐ SCUT 0.26 253.1 04Aug2013, 13:55 77.9
RT SCUT‐1D 0.26 252.2 04Aug2013, 13:55 77.7
SCUT‐2 0.05 51.4 04Aug2013, 14:35 16.2
Belfair Drive 0.31 283.4 04Aug2013, 14:20 93.7
RT ‐ UT to Swift Creek 1 0.31 284 04Aug2013, 14:20 93.2
SCUT‐3 0.09 147.9 04Aug2013, 13:55 32.4
Sterling Pointe Drive 0.40 411.8 04Aug2013, 14:15 124.4
RT ‐ UT to Swift Creek 2 0.40 410.1 04Aug2013, 14:15 124.4
SCUT‐4C 0.05 113.9 04Aug2013, 13:35 18.7
SCUT‐4B 0.05 167.5 04Aug2013, 13:10 18.4
SCUT‐4A 0.00 0.1 04Aug2013, 14:30 0
ADD SCUT‐4A‐4B 0.05 167.5 04Aug2013, 13:10 18.5
ADD SCUT‐4C 0.10 238.8 04Aug2013, 13:15 37.2
SCUT‐4D 0.04 114.2 04Aug2013, 13:20 15.2
ADD SCUT‐4D 0.14 347.3 04Aug2013, 13:15 52.4
RT SCUT‐4D 0.14 343.3 04Aug2013, 13:20 52.4
ADD SCUT 4 0.55 504.6 04Aug2013, 14:10 176.7
RT ‐ UT to Swift Creek 3 0.55 502.4 04Aug2013, 14:15 176.4
SCUT‐5 0.06 125.6 04Aug2013, 13:40 22.7
D/S Limit SCUT 0.61 615.7 04Aug2013, 13:45 199.1
50‐YEAR EXISTING
Appendix H

City of Greenville ‐ Swift Creek Watershed Master Plan ‐ HMS Output
Hydrologic ElementDrainage Area
(mi2)
Peak Discharge
(CFS)Time of Peak
Volume
(AC‐FT)
50‐YEAR EXISTING
ADD SCUT to SC 2.17 1372.7 04Aug2013, 14:20 644.2
RT ‐ Swift Creek 3 2.17 1284.8 04Aug2013, 14:35 634.6
SC‐6 1.37 1120.5 04Aug2013, 15:15 429.9
ADD SC‐6 3.54 2328.7 04Aug2013, 14:55 1064.4
RT ‐ Swift Creek 4 3.54 2287 04Aug2013, 15:05 1057.4
GS‐2A 0.46 243.5 04Aug2013, 16:50 128.8
GS‐2B 0.07 141.1 04Aug2013, 13:35 23
ADD GS‐2A‐2B 0.53 256.2 04Aug2013, 16:45 151.8
RT‐GS‐2A‐2B 0.53 256 04Aug2013, 16:50 151.3
GS‐2C 0.06 130.1 04Aug2013, 13:25 17.5
Davenport Farm Road West 0.58 283.1 04Aug2013, 13:30 168.8
RT GS‐2C 0.58 279.6 04Aug2013, 13:35 168.3
U/S Limit GS 0.58 279.6 04Aug2013, 13:35 168.3
GS‐1C 0.50 201.8 04Aug2013, 18:30 127.1
GS‐1B 0.24 107.6 04Aug2013, 17:10 59
GS‐1A 0.16 135.7 04Aug2013, 14:40 41.7
ADD GS‐1A‐1B 0.40 184.8 04Aug2013, 15:00 100.7
RT GS‐1A‐1B 0.40 183.6 04Aug2013, 15:20 99.3
GS‐1D 0.10 231 04Aug2013, 13:25 31.2
RT GS‐1D 0.10 221.9 04Aug2013, 13:30 31.1
ADD GS‐1 1.58 616 04Aug2013, 17:05 425.8
GS‐3 0.13 182.3 04Aug2013, 14:00 41.3
ADD GS‐3 1.71 690 04Aug2013, 13:40 467
Frog Level Road 1.71 660.1 04Aug2013, 13:50 459.6
RT‐ Gum Swamp 1 1.71 641 04Aug2013, 17:20 458
GS‐4B 0.12 101.4 04Aug2013, 15:10 38
GS‐4A 0.08 155.2 04Aug2013, 13:35 25.3
RT GS‐4A 0.08 151.2 04Aug2013, 13:35 25.3
ADD GS‐4B 0.19 190.1 04Aug2013, 13:40 63.2
RT GS‐4B 0.19 186 04Aug2013, 13:40 63.1
GS‐4C 0.10 83.3 04Aug2013, 15:10 31.1
ADD GS‐4C 0.29 221.3 04Aug2013, 13:45 94.2
RT GS‐4C 0.29 220.3 04Aug2013, 13:50 94.1
GS‐4D 0.13 91.9 04Aug2013, 15:40 39.6
ADD GS‐4D 0.42 299.3 04Aug2013, 15:10 133.7
RT GS‐4D 0.42 299.3 04Aug2013, 15:15 133.7
Davenport Farm Road East 0.42 299.3 04Aug2013, 15:15 133.7
GS‐4E 0.05 68.4 04Aug2013, 14:05 16.3
ADD GS‐4E 2.19 938.9 04Aug2013, 14:10 608
RT GS‐4E 2.19 938.1 04Aug2013, 14:20 606.7
GS‐5A 0.15 94.4 04Aug2013, 15:45 40.5
GS‐5B 0.05 115.4 04Aug2013, 13:20 15.7
ADD GS‐5A‐5B 2.39 1016.2 04Aug2013, 14:25 662.9
RT GS‐5A‐5B 2.39 1010.2 04Aug2013, 14:30 662.1
GS‐5C 0.04 113.7 04Aug2013, 13:15 13.9
RT GS‐5C 0.04 112.9 04Aug2013, 13:20 13.9
ADD GS‐5C 2.43 1027 04Aug2013, 14:25 676
RT‐ Gum Swamp 2 2.43 1016.3 04Aug2013, 14:35 673.8
GS‐5D 0.14 116 04Aug2013, 15:10 43.4
ADD GS‐5D 2.56 1123.3 04Aug2013, 14:45 717.1
RT GS‐5D 2.56 1119.7 04Aug2013, 14:55 713.8
GS‐6 0.17 124.2 04Aug2013, 15:10 46.1
D/S Limit GS 2.73 1241.8 04Aug2013, 15:00 759.9
ADD GS to SC 6.27 3528.5 04Aug2013, 15:00 1817.3
RT ‐ Swift Creek 5 6.27 3490 04Aug2013, 15:10 1808.6
OUTLET 6.27 3490 04Aug2013, 15:10 1808.6
Appendix H

City of Greenville ‐ Swift Creek Watershed Master Plan ‐ HMS Output
Hydrologic ElementDrainage Area
(mi2)
Peak Discharge
(CFS)Time of Peak
Volume
(AC‐FT)
SC‐1C 0.20 158.7 04Aug2013, 15:45 68.2
SC‐1D 0.16 89.2 04Aug2013, 17:25 50.8
ADD SC‐1C‐1D 0.36 230.7 04Aug2013, 16:05 119.1
RT SC‐1C‐1D 0.36 230.6 04Aug2013, 16:10 118.9
SC‐1A 0.15 102 04Aug2013, 17:20 59.1
RT SC‐1A 0.15 101.9 04Aug2013, 17:25 58.7
SC‐1B 0.10 149.2 04Aug2013, 14:05 35.4
ADD SC‐1B 0.26 175.8 04Aug2013, 14:10 94.1
SC‐1E 0.17 183.1 04Aug2013, 15:05 68.9
RT SC‐1E 0.17 181.8 04Aug2013, 15:15 68.6
U/S Limit SC 0.79 520 04Aug2013, 15:40 281.7
RT ‐ Swift Creek 1 0.79 515.5 04Aug2013, 15:55 280.2
SC‐2A 0.16 112.4 04Aug2013, 16:15 54.2
SC‐2B 0.09 263 04Aug2013, 13:20 36
ADD SC‐2 1.04 649.7 04Aug2013, 15:55 370.4
SC‐3B 0.10 170.5 04Aug2013, 13:55 36.5
SC‐3A 0.09 50.3 04Aug2013, 16:20 24.2
ADD SC‐3A‐3B 0.18 183.5 04Aug2013, 13:55 60.7
RT SC‐3A‐3B 0.18 182.6 04Aug2013, 14:00 60.6
SC‐3C 0.05 110.5 04Aug2013, 13:45 20.9
ADD SC‐3 1.28 753.9 04Aug2013, 15:45 451.9
Thomas Langston ‐ SC 1.28 753.7 04Aug2013, 15:50 451
RT ‐ Swift Creek 2 1.28 753.6 04Aug2013, 15:50 449.5
SC‐4 0.17 310 04Aug2013, 13:50 62.3
Sterling Trace Drive 1.45 993.4 04Aug2013, 14:00 506.2
RT SC‐4 1.45 900 04Aug2013, 14:30 500.4
SC‐5B 0.08 118.3 04Aug2013, 14:10 29.9
SC‐5A 0.04 91.3 04Aug2013, 13:30 14.3
ADD SC‐5A‐5B 1.56 1034 04Aug2013, 14:25 544.5
SCUT‐1B 0.07 76.5 04Aug2013, 14:40 23.8
SCUT‐1A 0.07 137 04Aug2013, 13:50 28.1
ADD SCUT‐1A‐1B 0.15 187.4 04Aug2013, 14:00 51.9
SCUT‐1C 0.05 143.9 04Aug2013, 13:25 21.1
U/S Limit SCUT 0.20 287.5 04Aug2013, 13:35 73
RT SCUT‐1C 0.20 283.3 04Aug2013, 13:45 72.8
SCUT‐1D 0.06 64.3 04Aug2013, 15:00 23
Thomas Langston Road ‐ SCUT 0.26 309.2 04Aug2013, 13:50 95.6
RT SCUT‐1D 0.26 309.2 04Aug2013, 13:55 95.4
SCUT‐2 0.05 61.2 04Aug2013, 14:35 19.4
Belfair Drive 0.31 351 04Aug2013, 14:10 114.5
RT ‐ UT to Swift Creek 1 0.31 351 04Aug2013, 14:10 114
SCUT‐3 0.09 176.5 04Aug2013, 13:55 39
Sterling Pointe Drive 0.40 513.6 04Aug2013, 14:05 151.6
RT ‐ UT to Swift Creek 2 0.40 513.2 04Aug2013, 14:10 151.5
SCUT‐4C 0.05 135.8 04Aug2013, 13:35 22.5
SCUT‐4B 0.05 197.3 04Aug2013, 13:10 21.9
SCUT‐4A 0.00 0.1 04Aug2013, 14:30 0
ADD SCUT‐4A‐4B 0.05 197.4 04Aug2013, 13:10 22
ADD SCUT‐4C 0.10 282.9 04Aug2013, 13:15 44.5
SCUT‐4D 0.04 135.1 04Aug2013, 13:20 18.1
ADD SCUT‐4D 0.14 411.5 04Aug2013, 13:15 62.6
RT SCUT‐4D 0.14 406.5 04Aug2013, 13:20 62.6
ADD SCUT 4 0.55 647 04Aug2013, 14:00 214.1
RT ‐ UT to Swift Creek 3 0.55 644.1 04Aug2013, 14:05 213.8
SCUT‐5 0.06 148.7 04Aug2013, 13:40 27.1
D/S Limit SCUT 0.61 744.6 04Aug2013, 14:00 240.9
100‐YEAR EXISTING
Appendix H

City of Greenville ‐ Swift Creek Watershed Master Plan ‐ HMS Output
Hydrologic ElementDrainage Area
(mi2)
Peak Discharge
(CFS)Time of Peak
Volume
(AC‐FT)
100‐YEAR EXISTING
ADD SCUT to SC 2.17 1732 04Aug2013, 14:10 785.4
RT ‐ Swift Creek 3 2.17 1610.1 04Aug2013, 14:25 774.2
SC‐6 1.37 1355.9 04Aug2013, 15:15 522.5
ADD SC‐6 3.54 2833.5 04Aug2013, 14:50 1296.7
RT ‐ Swift Creek 4 3.54 2785 04Aug2013, 15:00 1288.8
GS‐2A 0.46 297.8 04Aug2013, 16:50 158
GS‐2B 0.07 169.1 04Aug2013, 13:35 27.8
ADD GS‐2A‐2B 0.53 312.9 04Aug2013, 16:45 185.8
RT‐GS‐2A‐2B 0.53 312.7 04Aug2013, 16:50 185.3
GS‐2C 0.06 158 04Aug2013, 13:25 21.4
Davenport Farm Road West 0.58 349 04Aug2013, 13:30 206.7
RT GS‐2C 0.58 344.8 04Aug2013, 13:35 206.2
U/S Limit GS 0.58 344.8 04Aug2013, 13:35 206.2
GS‐1C 0.50 247.7 04Aug2013, 18:30 156.6
GS‐1B 0.24 133.8 04Aug2013, 17:10 73.4
GS‐1A 0.16 169.1 04Aug2013, 14:40 52
ADD GS‐1A‐1B 0.40 231.5 04Aug2013, 15:00 125.4
RT GS‐1A‐1B 0.40 230 04Aug2013, 15:20 123.9
GS‐1D 0.10 279.8 04Aug2013, 13:25 38.1
RT GS‐1D 0.10 269.1 04Aug2013, 13:30 38
ADD GS‐1 1.58 756.4 04Aug2013, 17:05 524.7
GS‐3 0.13 220.1 04Aug2013, 14:00 50.1
ADD GS‐3 1.71 851.1 04Aug2013, 13:40 574.8
Frog Level Road 1.71 825 04Aug2013, 13:45 565.4
RT‐ Gum Swamp 1 1.71 786.9 04Aug2013, 17:15 563.8
GS‐4B 0.12 121.9 04Aug2013, 15:05 45.9
GS‐4A 0.08 186 04Aug2013, 13:35 30.6
RT GS‐4A 0.08 181.2 04Aug2013, 13:35 30.5
ADD GS‐4B 0.19 229.1 04Aug2013, 13:40 76.5
RT GS‐4B 0.19 224.6 04Aug2013, 13:40 76.4
GS‐4C 0.10 100.8 04Aug2013, 15:10 37.8
ADD GS‐4C 0.29 268 04Aug2013, 13:45 114.1
RT GS‐4C 0.29 266.6 04Aug2013, 13:50 114
GS‐4D 0.13 112 04Aug2013, 15:40 48.4
ADD GS‐4D 0.42 361.8 04Aug2013, 15:10 162.4
RT GS‐4D 0.42 361.7 04Aug2013, 15:10 162.4
Davenport Farm Road East 0.42 361.7 04Aug2013, 15:10 162.4
GS‐4E 0.05 83 04Aug2013, 14:05 19.9
ADD GS‐4E 2.19 1171.7 04Aug2013, 14:05 746
RT GS‐4E 2.19 1170.1 04Aug2013, 14:15 744.4
GS‐5A 0.15 116.9 04Aug2013, 15:45 50.2
GS‐5B 0.05 138.9 04Aug2013, 13:20 19
ADD GS‐5A‐5B 2.39 1264 04Aug2013, 14:15 813.7
RT GS‐5A‐5B 2.39 1254.7 04Aug2013, 14:20 812.7
GS‐5C 0.04 136 04Aug2013, 13:15 16.8
RT GS‐5C 0.04 133.5 04Aug2013, 13:20 16.8
ADD GS‐5C 2.43 1277.1 04Aug2013, 14:15 829.5
RT‐ Gum Swamp 2 2.43 1260.1 04Aug2013, 14:25 826.9
GS‐5D 0.14 140 04Aug2013, 15:10 52.6
ADD GS‐5D 2.56 1381.7 04Aug2013, 14:35 879.5
RT GS‐5D 2.56 1376.3 04Aug2013, 14:45 875.7
GS‐6 0.17 153.3 04Aug2013, 15:10 57
D/S Limit GS 2.73 1523.5 04Aug2013, 14:55 932.7
ADD GS to SC 6.27 4308 04Aug2013, 14:55 2221.5
RT ‐ Swift Creek 5 6.27 4262.6 04Aug2013, 15:05 2211.7
OUTLET 6.27 4262.6 04Aug2013, 15:05 2211.7
Appendix H

PRIMARY SYSTEM
FUTURE CONDITIONS:
HEC‐HMS OUTPUT

City of Greenville ‐ Swift Creek Watershed Master Plan ‐ HMS Output
Hydrologic ElementDrainage Area
(mi2)
Peak Discharge
(CFS)Time of Peak
Volume
(AC‐FT)
SC‐1C 0.20 204.4 04Aug2013, 15:35 92.5
SC‐1D 0.16 97.5 04Aug2013, 17:20 56
ADD SC‐1C‐1D 0.36 281 04Aug2013, 15:55 148.4
RT SC‐1C‐1D 0.36 280.8 04Aug2013, 15:55 148.3
SC‐1A 0.15 103.4 04Aug2013, 17:15 60.1
RT SC‐1A 0.15 103.3 04Aug2013, 17:25 59.7
SC‐1B 0.10 159.8 04Aug2013, 14:05 38.2
ADD SC‐1B 0.26 187.1 04Aug2013, 14:10 97.9
SC‐1E 0.17 183.1 04Aug2013, 15:05 68.9
RT SC‐1E 0.17 181.8 04Aug2013, 15:15 68.6
U/S Limit SC 0.79 578.1 04Aug2013, 15:35 314.8
RT ‐ Swift Creek 1 0.79 574.6 04Aug2013, 15:50 313.4
SC‐2A 0.16 139.9 04Aug2013, 16:10 70.1
SC‐2B 0.09 264.8 04Aug2013, 13:20 36.3
ADD SC‐2 1.04 737.2 04Aug2013, 15:50 419.9
SC‐3B 0.10 173.2 04Aug2013, 13:55 37.2
SC‐3A 0.09 58.8 04Aug2013, 16:15 28.3
ADD SC‐3A‐3B 0.18 190.7 04Aug2013, 13:55 65.5
RT SC‐3A‐3B 0.18 190 04Aug2013, 14:00 65.4
SC‐3C 0.05 112.1 04Aug2013, 13:45 21.3
ADD SC‐3 1.28 852.6 04Aug2013, 15:40 506.5
Thomas Langston ‐ SC 1.28 852.4 04Aug2013, 15:45 505.6
RT ‐ Swift Creek 2 1.28 852.2 04Aug2013, 15:45 504
SC‐4 0.17 310 04Aug2013, 13:50 62.3
Sterling Trace Drive 1.45 1067.4 04Aug2013, 14:05 560.5
RT SC‐4 1.45 981.6 04Aug2013, 14:30 554.3
SC‐5B 0.08 118.3 04Aug2013, 14:10 29.9
SC‐5A 0.04 91.3 04Aug2013, 13:30 14.3
ADD SC‐5A‐5B 1.56 1116.4 04Aug2013, 14:25 598.4
SCUT‐1B 0.07 84.2 04Aug2013, 14:40 26.4
SCUT‐1A 0.07 137 04Aug2013, 13:50 28.1
ADD SCUT‐1A‐1B 0.15 194.6 04Aug2013, 14:00 54.4
SCUT‐1C 0.05 143.9 04Aug2013, 13:25 21.1
U/S Limit SCUT 0.20 292.7 04Aug2013, 13:35 75.5
RT SCUT‐1C 0.20 288.9 04Aug2013, 13:45 75.3
SCUT‐1D 0.06 76.3 04Aug2013, 15:00 28.2
Thomas Langston Road ‐ SCUT 0.26 324.7 04Aug2013, 13:55 103.3
RT SCUT‐1D 0.26 324.5 04Aug2013, 13:55 103.1
SCUT‐2 0.05 61.2 04Aug2013, 14:35 19.4
Belfair Drive 0.31 368.5 04Aug2013, 14:10 122.2
RT ‐ UT to Swift Creek 1 0.31 368.5 04Aug2013, 14:15 121.7
SCUT‐3 0.09 176.5 04Aug2013, 13:55 39
Sterling Pointe Drive 0.40 531.4 04Aug2013, 14:10 159.3
RT ‐ UT to Swift Creek 2 0.40 531.1 04Aug2013, 14:10 159.2
SCUT‐4C 0.05 145.3 04Aug2013, 13:30 25
SCUT‐4B 0.05 200.4 04Aug2013, 13:10 22.6
SCUT‐4A 0.00 0.1 04Aug2013, 14:30 0
ADD SCUT‐4A‐4B 0.05 200.5 04Aug2013, 13:10 22.6
ADD SCUT‐4C 0.10 294.3 04Aug2013, 13:15 47.6
SCUT‐4D 0.04 135.1 04Aug2013, 13:20 18.1
ADD SCUT‐4D 0.14 422.9 04Aug2013, 13:15 65.7
RT SCUT‐4D 0.14 418.1 04Aug2013, 13:20 65.7
ADD SCUT 4 0.55 674.7 04Aug2013, 14:00 224.9
RT ‐ UT to Swift Creek 3 0.55 668 04Aug2013, 14:05 224.7
SCUT‐5 0.06 148.7 04Aug2013, 13:40 27.1
100‐YEAR FUTURE
Appendix H

City of Greenville ‐ Swift Creek Watershed Master Plan ‐ HMS Output
Hydrologic ElementDrainage Area
(mi2)
Peak Discharge
(CFS)Time of Peak
Volume
(AC‐FT)
100‐YEAR FUTURE
D/S Limit SCUT 0.61 771.8 04Aug2013, 14:00 251.8
ADD SCUT to SC 2.17 1836.8 04Aug2013, 14:10 850.3
RT ‐ Swift Creek 3 2.17 1715.8 04Aug2013, 14:25 838.8
SC‐6 1.37 1355.9 04Aug2013, 15:15 522.5
ADD SC‐6 3.54 2934.4 04Aug2013, 14:50 1361.3
RT ‐ Swift Creek 4 3.54 2887 04Aug2013, 15:00 1353.3
GS‐2A 0.46 313.4 04Aug2013, 16:45 167.1
GS‐2B 0.07 175.2 04Aug2013, 13:35 29.2
ADD GS‐2A‐2B 0.53 328.8 04Aug2013, 16:40 196.3
RT‐GS‐2A‐2B 0.53 328.6 04Aug2013, 16:45 195.8
GS‐2C 0.06 160.4 04Aug2013, 13:25 21.8
Davenport Farm Road West 0.58 365.4 04Aug2013, 13:30 217.6
RT GS‐2C 0.58 361.1 04Aug2013, 13:35 217
U/S Limit GS 0.58 361.1 04Aug2013, 13:35 217
GS‐1C 0.50 270.1 04Aug2013, 18:25 172.5
GS‐1B 0.24 157.6 04Aug2013, 17:05 87.5
GS‐1A 0.16 189.5 04Aug2013, 14:35 58.6
ADD GS‐1A‐1B 0.40 268.8 04Aug2013, 15:00 146.1
RT GS‐1A‐1B 0.40 267.3 04Aug2013, 15:15 144.5
GS‐1D 0.10 279.8 04Aug2013, 13:25 38.1
RT GS‐1D 0.10 269.1 04Aug2013, 13:30 38
ADD GS‐1 1.58 824.9 04Aug2013, 17:00 572
GS‐3 0.13 220.1 04Aug2013, 14:00 50.1
ADD GS‐3 1.71 900 04Aug2013, 13:40 622.1
Frog Level Road 1.71 879.6 04Aug2013, 13:45 612.2
RT‐ Gum Swamp 1 1.71 856.3 04Aug2013, 17:10 610.7
GS‐4B 0.12 121.9 04Aug2013, 15:05 45.9
GS‐4A 0.08 186 04Aug2013, 13:35 30.6
RT GS‐4A 0.08 181.2 04Aug2013, 13:35 30.5
ADD GS‐4B 0.19 229.1 04Aug2013, 13:40 76.5
RT GS‐4B 0.19 224.6 04Aug2013, 13:40 76.4
GS‐4C 0.10 100.8 04Aug2013, 15:10 37.8
ADD GS‐4C 0.29 268 04Aug2013, 13:45 114.1
RT GS‐4C 0.29 266.6 04Aug2013, 13:50 114
GS‐4D 0.13 112 04Aug2013, 15:40 48.4
ADD GS‐4D 0.42 361.8 04Aug2013, 15:10 162.4
RT GS‐4D 0.42 361.7 04Aug2013, 15:10 162.4
Davenport Farm Road East 0.42 361.7 04Aug2013, 15:10 162.4
GS‐4E 0.05 83.7 04Aug2013, 14:05 20
ADD GS‐4E 2.19 1227.5 04Aug2013, 14:05 793.1
RT GS‐4E 2.19 1224.7 04Aug2013, 14:15 791.6
GS‐5A 0.15 123.8 04Aug2013, 15:40 53.3
GS‐5B 0.05 138.9 04Aug2013, 13:20 19
ADD GS‐5A‐5B 2.39 1324.1 04Aug2013, 14:15 863.9
RT GS‐5A‐5B 2.39 1314.3 04Aug2013, 14:15 862.9
GS‐5C 0.04 136 04Aug2013, 13:15 16.8
RT GS‐5C 0.04 133.5 04Aug2013, 13:20 16.8
ADD GS‐5C 2.43 1338.3 04Aug2013, 14:15 879.7
RT‐ Gum Swamp 2 2.43 1320.4 04Aug2013, 14:25 877
GS‐5D 0.14 140 04Aug2013, 15:10 52.6
ADD GS‐5D 2.56 1441.6 04Aug2013, 14:35 929.6
RT GS‐5D 2.56 1437.5 04Aug2013, 14:45 925.8
GS‐6 0.17 159.1 04Aug2013, 15:10 59.2
D/S Limit GS 2.73 1592.9 04Aug2013, 15:00 985
ADD GS to SC 6.27 4479.9 04Aug2013, 15:00 2338.4
RT ‐ Swift Creek 5 6.27 4436.5 04Aug2013, 15:05 2328.4
OUTLET 6.27 4436.5 04Aug2013, 15:05 2328.4
Appendix H

PRIMARY SYSTEM
ALTERNATIVE #1:
HEC‐HMS OUTPUT

City of Greenville ‐ Swift Creek Watershed Master Plan ‐ HMS Output
Hydrologic ElementDrainage Area
(mi2)
Peak Discharge
(CFS)Time of Peak
Volume
(AC‐FT)
SC‐1C 0.20 68.9 04Aug2013, 15:40 30
SC‐1D 0.16 24.1 04Aug2013, 17:35 13.7
ADD SC‐1C‐1D 0.36 86.1 04Aug2013, 15:55 43.6
RT SC‐1C‐1D 0.36 86.1 04Aug2013, 16:00 43.6
SC‐1A 0.15 29.2 04Aug2013, 17:25 16.6
RT SC‐1A 0.15 29.2 04Aug2013, 17:40 16.4
SC‐1B 0.10 37.7 04Aug2013, 14:10 9.1
ADD SC‐1B 0.26 42.4 04Aug2013, 14:15 25.5
SC‐1E 0.17 48.2 04Aug2013, 15:15 18
RT SC‐1E 0.17 47.8 04Aug2013, 15:25 17.9
U/S Limit SC 0.79 164.7 04Aug2013, 15:45 86.9
RT ‐ Swift Creek 1 0.79 164.2 04Aug2013, 15:55 86.4
SC‐2A 0.16 44.9 04Aug2013, 16:15 21.7
SC‐2B 0.09 69.9 04Aug2013, 13:25 9.3
ADD SC‐2 1.04 216 04Aug2013, 16:00 117.4
SC‐3B 0.10 42.3 04Aug2013, 13:55 9.1
SC‐3A 0.09 11.7 04Aug2013, 16:35 5.8
ADD SC‐3A‐3B 0.18 44.5 04Aug2013, 14:00 14.9
RT SC‐3A‐3B 0.18 44.3 04Aug2013, 14:05 14.9
SC‐3C 0.05 28.4 04Aug2013, 13:45 5.3
ADD SC‐3 1.28 243.2 04Aug2013, 15:50 137.6
Thomas Langston ‐ SC 1.28 243.1 04Aug2013, 15:55 137.3
RT ‐ Swift Creek 2 1.28 243.1 04Aug2013, 15:55 136
SC‐4 0.17 71.2 04Aug2013, 13:50 14.5
Sterling Trace Drive 1.45 259.5 04Aug2013, 15:50 149.1
RT SC‐4 1.45 257.2 04Aug2013, 16:15 147.1
SC‐5B 0.08 29.6 04Aug2013, 14:15 7.5
SC‐5A 0.04 24.5 04Aug2013, 13:30 3.7
ADD SC‐5A‐5B 1.56 269.9 04Aug2013, 16:00 158.3
SCUT‐1B 0.07 18.5 04Aug2013, 14:45 5.9
SCUT‐1A 0.07 34.5 04Aug2013, 13:50 7
ADD SCUT‐1A‐1B 0.15 46.1 04Aug2013, 14:00 13
SCUT‐1C 0.05 35.6 04Aug2013, 13:30 5.2
U/S Limit SCUT 0.20 69.9 04Aug2013, 13:40 18.1
RT SCUT‐1C 0.20 66.3 04Aug2013, 13:55 18
SCUT‐1D 0.06 23.5 04Aug2013, 15:00 8.4
Thomas Langston Road ‐ SCUT 0.26 80 04Aug2013, 14:10 26.3
RT SCUT‐1D 0.26 79.2 04Aug2013, 14:20 26.2
SCUT‐2 0.05 18 04Aug2013, 14:40 5.5
Belfair Drive 0.31 96.2 04Aug2013, 14:25 31.7
RT ‐ UT to Swift Creek 1 0.31 96.1 04Aug2013, 14:25 31.3
SCUT‐3 0.09 49.7 04Aug2013, 13:55 10.7
Sterling Pointe Drive 0.40 136.4 04Aug2013, 14:15 41.7
RT ‐ UT to Swift Creek 2 0.40 136.1 04Aug2013, 14:15 41.7
SCUT‐4C 0.05 48.9 04Aug2013, 13:35 8
SCUT‐4B 0.05 67.5 04Aug2013, 13:10 7.2
SCUT‐4A 0.00 0 04Aug2013, 14:30 0
ADD SCUT‐4A‐4B 0.05 67.5 04Aug2013, 13:10 7.2
ADD SCUT‐4C 0.10 98.6 04Aug2013, 13:15 15.2
SCUT‐4D 0.04 41.5 04Aug2013, 13:20 5.3
ADD SCUT‐4D 0.14 137.4 04Aug2013, 13:15 20.5
RT SCUT‐4D 0.14 136.8 04Aug2013, 13:20 20.5
ADD SCUT 4 0.55 184.9 04Aug2013, 14:05 62.2
RT ‐ UT to Swift Creek 3 0.55 184.6 04Aug2013, 14:10 62.1
SCUT‐5 0.06 45.6 04Aug2013, 13:40 7.9
2‐YEAR ALTERNATIVE #1
Appendix H

City of Greenville ‐ Swift Creek Watershed Master Plan ‐ HMS Output
Hydrologic ElementDrainage Area
(mi2)
Peak Discharge
(CFS)Time of Peak
Volume
(AC‐FT)
2‐YEAR ALTERNATIVE #1
D/S Limit SCUT 0.61 229.1 04Aug2013, 13:40 70
ADD SCUT to SC 2.17 441.8 04Aug2013, 14:25 228.3
RT ‐ Swift Creek 3 2.17 422.1 04Aug2013, 14:55 224.6
SC‐6 1.37 336.6 04Aug2013, 15:20 129.7
ADD SC‐6 3.54 752.2 04Aug2013, 15:15 354.3
RT ‐ Swift Creek 4 3.54 737.6 04Aug2013, 15:25 351.2
GS‐2A 0.46 77.5 04Aug2013, 17:00 41
GS‐2B 0.07 51.3 04Aug2013, 13:35 8.2
ADD GS‐2A‐2B 0.53 82.4 04Aug2013, 16:55 49.2
RT‐GS‐2A‐2B 0.53 82.3 04Aug2013, 17:00 49
GS‐2C 0.06 38.8 04Aug2013, 13:25 5.2
Davenport Farm Road West 0.58 87.3 04Aug2013, 13:35 54.2
RT GS‐2C 0.58 85.5 04Aug2013, 13:40 54
U/S Limit GS 0.58 85.5 04Aug2013, 13:40 54
GS‐1C 0.50 68.6 04Aug2013, 18:40 42.8
GS‐1B 0.24 40.1 04Aug2013, 17:15 22
GS‐1A 0.16 43.1 04Aug2013, 14:40 13.6
ADD GS‐1A‐1B 0.40 61.6 04Aug2013, 15:10 35.5
RT GS‐1A‐1B 0.40 61.3 04Aug2013, 15:40 34.8
GS‐1D 0.10 67.7 04Aug2013, 13:25 9.1
RT GS‐1D 0.10 64.7 04Aug2013, 13:35 9
ADD GS‐1 1.58 208 04Aug2013, 17:20 140.7
GS‐3 0.13 55.3 04Aug2013, 14:00 12.5
ADD GS‐3 1.71 217.1 04Aug2013, 17:15 153.2
Frog Level Road 1.71 211.2 04Aug2013, 18:00 150.1
RT‐ Gum Swamp 1 1.71 211.2 04Aug2013, 18:05 149.4
GS‐4B 0.12 32.1 04Aug2013, 15:15 12
GS‐4A 0.08 50.2 04Aug2013, 13:35 8
RT GS‐4A 0.08 48.8 04Aug2013, 13:40 8
ADD GS‐4B 0.19 58.8 04Aug2013, 13:40 20
RT GS‐4B 0.19 58.1 04Aug2013, 13:45 19.9
GS‐4C 0.10 25.1 04Aug2013, 15:15 9.4
ADD GS‐4C 0.29 67.3 04Aug2013, 15:05 29.3
RT GS‐4C 0.29 67.3 04Aug2013, 15:05 29.3
GS‐4D 0.13 26.2 04Aug2013, 15:50 11.4
ADD GS‐4D 0.42 91.3 04Aug2013, 15:20 40.7
RT GS‐4D 0.42 91.3 04Aug2013, 15:20 40.6
Davenport Farm Road East 0.42 91.3 04Aug2013, 15:20 40.6
GS‐4E 0.05 20.4 04Aug2013, 14:10 4.9
ADD GS‐4E 2.19 269.7 04Aug2013, 16:00 194.9
RT GS‐4E 2.19 269.7 04Aug2013, 16:05 194.4
GS‐5A 0.15 27.2 04Aug2013, 15:55 11.9
GS‐5B 0.05 36.6 04Aug2013, 13:25 4.9
ADD GS‐5A‐5B 2.39 300.7 04Aug2013, 15:55 211.2
RT GS‐5A‐5B 2.39 300.6 04Aug2013, 16:00 210.8
GS‐5C 0.04 37.6 04Aug2013, 13:20 4.5
RT GS‐5C 0.04 37 04Aug2013, 13:25 4.5
ADD GS‐5C 2.43 304 04Aug2013, 15:55 215.4
RT‐ Gum Swamp 2 2.43 303.7 04Aug2013, 16:05 214.4
GS‐5D 0.14 35.8 04Aug2013, 15:15 13.4
ADD GS‐5D 2.56 336.4 04Aug2013, 15:40 227.7
RT GS‐5D 2.56 336.1 04Aug2013, 15:50 226.3
GS‐6 0.17 34.9 04Aug2013, 15:20 13.3
D/S Limit GS 2.73 369.6 04Aug2013, 15:35 239.7
ADD GS to SC 6.27 1106.1 04Aug2013, 15:25 590.9
RT ‐ Swift Creek 5 6.27 1094.4 04Aug2013, 15:35 586.8
OUTLET 6.27 1094.4 04Aug2013, 15:35 586.8
Appendix H

City of Greenville ‐ Swift Creek Watershed Master Plan ‐ HMS Output
Hydrologic ElementDrainage Area
(mi2)
Peak Discharge
(CFS)Time of Peak
Volume
(AC‐FT)
SC‐1C 0.20 114.9 04Aug2013, 15:35 50.8
SC‐1D 0.16 47.8 04Aug2013, 17:25 27.1
ADD SC‐1C‐1D 0.36 150.9 04Aug2013, 15:55 77.9
RT SC‐1C‐1D 0.36 150.8 04Aug2013, 16:00 77.8
SC‐1A 0.15 53.8 04Aug2013, 17:20 30.7
RT SC‐1A 0.15 53.7 04Aug2013, 17:30 30.5
SC‐1B 0.10 77.2 04Aug2013, 14:05 18.3
ADD SC‐1B 0.26 88.8 04Aug2013, 14:10 48.8
SC‐1E 0.17 92.6 04Aug2013, 15:10 34.4
RT SC‐1E 0.17 91.9 04Aug2013, 15:20 34.2
U/S Limit SC 0.79 301.2 04Aug2013, 15:40 160.8
RT ‐ Swift Creek 1 0.79 300 04Aug2013, 15:50 160
SC‐2A 0.16 77 04Aug2013, 16:10 37.8
SC‐2B 0.09 134.3 04Aug2013, 13:25 18
ADD SC‐2 1.04 389.1 04Aug2013, 15:55 215.7
SC‐3B 0.10 85 04Aug2013, 13:55 18
SC‐3A 0.09 26.3 04Aug2013, 16:25 12.7
ADD SC‐3A‐3B 0.18 91.1 04Aug2013, 13:55 30.7
RT SC‐3A‐3B 0.18 90.8 04Aug2013, 14:00 30.7
SC‐3C 0.05 55.9 04Aug2013, 13:45 10.4
ADD SC‐3 1.28 444.6 04Aug2013, 15:45 256.8
Thomas Langston ‐ SC 1.28 444.4 04Aug2013, 15:50 256.4
RT ‐ Swift Creek 2 1.28 444.4 04Aug2013, 15:50 255
SC‐4 0.17 148.3 04Aug2013, 13:50 29.5
Sterling Trace Drive 1.45 511.2 04Aug2013, 14:10 282.8
RT SC‐4 1.45 479.3 04Aug2013, 14:50 280.7
SC‐5B 0.08 58.6 04Aug2013, 14:10 14.6
SC‐5A 0.04 46.7 04Aug2013, 13:30 7.1
ADD SC‐5A‐5B 1.56 537.6 04Aug2013, 14:35 302.4
SCUT‐1B 0.07 39.5 04Aug2013, 14:40 12.3
SCUT‐1A 0.07 68.1 04Aug2013, 13:50 13.7
ADD SCUT‐1A‐1B 0.15 94.1 04Aug2013, 14:00 26.1
SCUT‐1C 0.05 70.8 04Aug2013, 13:30 10.2
U/S Limit SCUT 0.20 142 04Aug2013, 13:40 36.3
RT SCUT‐1C 0.20 139.4 04Aug2013, 13:45 36.1
SCUT‐1D 0.06 41.3 04Aug2013, 15:00 14.9
Thomas Langston Road ‐ SCUT 0.26 159.8 04Aug2013, 13:55 51
RT SCUT‐1D 0.26 155.7 04Aug2013, 14:05 50.8
SCUT‐2 0.05 32.5 04Aug2013, 14:35 10.1
Belfair Drive 0.31 183.4 04Aug2013, 14:15 60.8
RT ‐ UT to Swift Creek 1 0.31 183.4 04Aug2013, 14:20 60.3
SCUT‐3 0.09 92.1 04Aug2013, 13:55 19.9
Sterling Pointe Drive 0.40 266.6 04Aug2013, 14:10 79.9
RT ‐ UT to Swift Creek 2 0.40 265.9 04Aug2013, 14:10 79.8
SCUT‐4C 0.05 81.7 04Aug2013, 13:35 13.7
SCUT‐4B 0.05 112.8 04Aug2013, 13:10 12.3
SCUT‐4A 0.00 0.1 04Aug2013, 14:30 0
ADD SCUT‐4A‐4B 0.05 112.8 04Aug2013, 13:10 12.3
ADD SCUT‐4C 0.10 165.3 04Aug2013, 13:15 26
SCUT‐4D 0.04 73.2 04Aug2013, 13:20 9.5
ADD SCUT‐4D 0.14 234.4 04Aug2013, 13:15 35.5
RT SCUT‐4D 0.14 232.6 04Aug2013, 13:20 35.5
ADD SCUT 4 0.55 350.5 04Aug2013, 13:55 115.3
RT ‐ UT to Swift Creek 3 0.55 348.1 04Aug2013, 14:00 115.1
SCUT‐5 0.06 80.5 04Aug2013, 13:40 14.2
10‐YEAR ALTERNATIVE #1
Appendix H

City of Greenville ‐ Swift Creek Watershed Master Plan ‐ HMS Output
Hydrologic ElementDrainage Area
(mi2)
Peak Discharge
(CFS)Time of Peak
Volume
(AC‐FT)
10‐YEAR ALTERNATIVE #1
D/S Limit SCUT 0.61 413.8 04Aug2013, 13:45 129.4
ADD SCUT to SC 2.17 891.5 04Aug2013, 14:15 431.8
RT ‐ Swift Creek 3 2.17 840.4 04Aug2013, 14:35 426
SC‐6 1.37 668.2 04Aug2013, 15:15 255
ADD SC‐6 3.54 1469.8 04Aug2013, 15:00 681
RT ‐ Swift Creek 4 3.54 1444.5 04Aug2013, 15:10 675.9
GS‐2A 0.46 153.8 04Aug2013, 16:50 81.2
GS‐2B 0.07 93 04Aug2013, 13:35 15.1
ADD GS‐2A‐2B 0.53 162.3 04Aug2013, 16:50 96.2
RT‐GS‐2A‐2B 0.53 162.2 04Aug2013, 16:55 95.8
GS‐2C 0.06 78.5 04Aug2013, 13:25 10.5
Davenport Farm Road West 0.58 175 04Aug2013, 13:35 106.3
RT GS‐2C 0.58 172.5 04Aug2013, 13:40 105.9
U/S Limit GS 0.58 172.5 04Aug2013, 13:40 105.9
GS‐1C 0.50 133.9 04Aug2013, 18:30 84.2
GS‐1B 0.24 78.3 04Aug2013, 17:10 43
GS‐1A 0.16 90 04Aug2013, 14:40 27.7
ADD GS‐1A‐1B 0.40 127.6 04Aug2013, 15:05 70.7
RT GS‐1A‐1B 0.40 126.8 04Aug2013, 15:25 69.6
GS‐1D 0.10 137 04Aug2013, 13:25 18.3
RT GS‐1D 0.10 130.5 04Aug2013, 13:30 18.2
ADD GS‐1 1.58 407.9 04Aug2013, 17:10 277.9
GS‐3 0.13 109.3 04Aug2013, 14:00 24.5
ADD GS‐3 1.71 425 04Aug2013, 17:00 302.4
Frog Level Road 1.71 424.2 04Aug2013, 17:15 297.6
RT‐ Gum Swamp 1 1.71 423 04Aug2013, 17:30 296.5
GS‐4B 0.12 61.7 04Aug2013, 15:10 22.9
GS‐4A 0.08 95.3 04Aug2013, 13:35 15.3
RT GS‐4A 0.08 92.4 04Aug2013, 13:35 15.3
ADD GS‐4B 0.19 114.6 04Aug2013, 13:40 38.2
RT GS‐4B 0.19 112.7 04Aug2013, 13:45 38.1
GS‐4C 0.10 49.7 04Aug2013, 15:10 18.5
ADD GS‐4C 0.29 132.5 04Aug2013, 13:50 56.6
RT GS‐4C 0.29 131.7 04Aug2013, 13:50 56.5
GS‐4D 0.13 53.7 04Aug2013, 15:45 23.1
ADD GS‐4D 0.42 179.5 04Aug2013, 15:15 79.5
RT GS‐4D 0.42 179.4 04Aug2013, 15:15 79.5
Davenport Farm Road East 0.42 179.4 04Aug2013, 15:15 79.5
GS‐4E 0.05 41 04Aug2013, 14:05 9.7
ADD GS‐4E 2.19 552.6 04Aug2013, 14:35 385.7
RT GS‐4E 2.19 552.4 04Aug2013, 16:00 384.8
GS‐5A 0.15 57.8 04Aug2013, 15:45 24.9
GS‐5B 0.05 70.4 04Aug2013, 13:25 9.4
ADD GS‐5A‐5B 2.39 616.6 04Aug2013, 15:55 419.1
RT GS‐5A‐5B 2.39 616.3 04Aug2013, 15:55 418.5
GS‐5C 0.04 70.2 04Aug2013, 13:15 8.5
RT GS‐5C 0.04 70 04Aug2013, 13:20 8.5
ADD GS‐5C 2.43 622.3 04Aug2013, 15:55 427
RT‐ Gum Swamp 2 2.43 621.8 04Aug2013, 16:00 425.3
GS‐5D 0.14 69.9 04Aug2013, 15:10 25.9
ADD GS‐5D 2.56 686.3 04Aug2013, 15:25 451.2
RT GS‐5D 2.56 685.8 04Aug2013, 15:40 448.9
GS‐6 0.17 74.3 04Aug2013, 15:15 27.7
D/S Limit GS 2.73 758.4 04Aug2013, 15:25 476.6
ADD GS to SC 6.27 2199.7 04Aug2013, 15:10 1152.5
RT ‐ Swift Creek 5 6.27 2178.2 04Aug2013, 15:20 1146.1
OUTLET 6.27 2178.2 04Aug2013, 15:20 1146.1
Appendix H

City of Greenville ‐ Swift Creek Watershed Master Plan ‐ HMS Output
Hydrologic ElementDrainage Area
(mi2)
Peak Discharge
(CFS)Time of Peak
Volume
(AC‐FT)
SC‐1C 0.20 146.6 04Aug2013, 15:35 65.4
SC‐1D 0.16 65.1 04Aug2013, 17:25 37.1
ADD SC‐1C‐1D 0.36 196.6 04Aug2013, 15:55 102.5
RT SC‐1C‐1D 0.36 196.5 04Aug2013, 16:00 102.4
SC‐1A 0.15 71.2 04Aug2013, 17:20 41
RT SC‐1A 0.15 71.1 04Aug2013, 17:30 40.6
SC‐1B 0.10 106 04Aug2013, 14:05 25.1
ADD SC‐1B 0.26 122.9 04Aug2013, 14:10 65.8
SC‐1E 0.17 124.3 04Aug2013, 15:10 46.3
RT SC‐1E 0.17 123.3 04Aug2013, 15:15 46.1
U/S Limit SC 0.79 398.1 04Aug2013, 15:40 214.2
RT ‐ Swift Creek 1 0.79 396.9 04Aug2013, 15:45 213.2
SC‐2A 0.16 99.2 04Aug2013, 16:10 49.1
SC‐2B 0.09 180 04Aug2013, 13:25 24.3
ADD SC‐2 1.04 511.8 04Aug2013, 15:50 286.7
SC‐3B 0.10 115.8 04Aug2013, 13:55 24.6
SC‐3A 0.09 37.4 04Aug2013, 16:20 18
ADD SC‐3A‐3B 0.18 125.6 04Aug2013, 13:55 42.6
RT SC‐3A‐3B 0.18 125.3 04Aug2013, 14:00 42.5
SC‐3C 0.05 75.6 04Aug2013, 13:45 14.2
ADD SC‐3 1.28 588.6 04Aug2013, 15:40 343.4
Thomas Langston ‐ SC 1.28 587.7 04Aug2013, 15:50 343
RT ‐ Swift Creek 2 1.28 587.7 04Aug2013, 15:50 341.5
SC‐4 0.17 204.6 04Aug2013, 13:50 40.8
Sterling Trace Drive 1.45 702.9 04Aug2013, 14:05 380.4
RT SC‐4 1.45 652.4 04Aug2013, 14:40 377.2
SC‐5B 0.08 79.5 04Aug2013, 14:10 19.9
SC‐5A 0.04 62.4 04Aug2013, 13:30 9.6
ADD SC‐5A‐5B 1.56 738.3 04Aug2013, 14:30 406.7
SCUT‐1B 0.07 55 04Aug2013, 14:40 17.1
SCUT‐1A 0.07 92.3 04Aug2013, 13:50 18.7
ADD SCUT‐1A‐1B 0.15 129.1 04Aug2013, 14:00 35.8
SCUT‐1C 0.05 96.3 04Aug2013, 13:25 14
U/S Limit SCUT 0.20 194.3 04Aug2013, 13:40 49.8
RT SCUT‐1C 0.20 192 04Aug2013, 13:45 49.6
SCUT‐1D 0.06 53.7 04Aug2013, 15:00 19.6
Thomas Langston Road ‐ SCUT 0.26 215.7 04Aug2013, 13:55 69
RT SCUT‐1D 0.26 211.9 04Aug2013, 14:10 68.9
SCUT‐2 0.05 42.6 04Aug2013, 14:35 13.3
Belfair Drive 0.31 249.3 04Aug2013, 14:20 82.1
RT ‐ UT to Swift Creek 1 0.31 249.4 04Aug2013, 14:20 81.6
SCUT‐3 0.09 121.9 04Aug2013, 13:55 26.5
Sterling Pointe Drive 0.40 358.2 04Aug2013, 14:10 107.8
RT ‐ UT to Swift Creek 2 0.40 357.5 04Aug2013, 14:10 107.7
SCUT‐4C 0.05 104.2 04Aug2013, 13:30 17.7
SCUT‐4B 0.05 143.9 04Aug2013, 13:10 15.9
SCUT‐4A 0.00 0.1 04Aug2013, 14:30 0
ADD SCUT‐4A‐4B 0.05 143.9 04Aug2013, 13:10 15.9
ADD SCUT‐4C 0.10 211 04Aug2013, 13:15 33.6
SCUT‐4D 0.04 95.1 04Aug2013, 13:20 12.5
ADD SCUT‐4D 0.14 301.2 04Aug2013, 13:15 46.1
RT SCUT‐4D 0.14 298.3 04Aug2013, 13:20 46.1
ADD SCUT 4 0.55 466.4 04Aug2013, 13:50 153.8
RT ‐ UT to Swift Creek 3 0.55 465.3 04Aug2013, 13:55 153.5
SCUT‐5 0.06 104.7 04Aug2013, 13:40 18.7
25‐YEAR ALTERNATIVE #1
Appendix H

City of Greenville ‐ Swift Creek Watershed Master Plan ‐ HMS Output
Hydrologic ElementDrainage Area
(mi2)
Peak Discharge
(CFS)Time of Peak
Volume
(AC‐FT)
25‐YEAR ALTERNATIVE #1
D/S Limit SCUT 0.61 560.8 04Aug2013, 13:45 172.3
ADD SCUT to SC 2.17 1222.3 04Aug2013, 14:15 579
RT ‐ Swift Creek 3 2.17 1151.6 04Aug2013, 14:30 571
SC‐6 1.37 908.3 04Aug2013, 15:15 347.3
ADD SC‐6 3.54 1987.6 04Aug2013, 14:55 918.3
RT ‐ Swift Creek 4 3.54 1953.9 04Aug2013, 15:05 912.2
GS‐2A 0.46 209.4 04Aug2013, 16:50 110.8
GS‐2B 0.07 122.1 04Aug2013, 13:35 20
ADD GS‐2A‐2B 0.53 220.3 04Aug2013, 16:45 130.7
RT‐GS‐2A‐2B 0.53 220.1 04Aug2013, 16:50 130.3
GS‐2C 0.06 107.2 04Aug2013, 13:25 14.4
Davenport Farm Road West 0.58 239.9 04Aug2013, 13:30 144.6
RT GS‐2C 0.58 236.9 04Aug2013, 13:40 144.2
U/S Limit GS 0.58 236.9 04Aug2013, 13:40 144.2
GS‐1C 0.50 181.3 04Aug2013, 18:30 114.6
GS‐1B 0.24 106 04Aug2013, 17:05 58.3
GS‐1A 0.16 124.5 04Aug2013, 14:40 38.3
ADD GS‐1A‐1B 0.40 176.5 04Aug2013, 15:00 96.6
RT GS‐1A‐1B 0.40 175.4 04Aug2013, 15:20 95.4
GS‐1D 0.10 186.9 04Aug2013, 13:25 25.1
RT GS‐1D 0.10 179.3 04Aug2013, 13:30 25
ADD GS‐1 1.58 553.1 04Aug2013, 17:05 379.2
GS‐3 0.13 148.1 04Aug2013, 14:00 33.4
ADD GS‐3 1.71 586.4 04Aug2013, 13:40 412.6
Frog Level Road 1.71 575.3 04Aug2013, 17:05 406.3
RT‐ Gum Swamp 1 1.71 573.9 04Aug2013, 17:20 404.8
GS‐4B 0.12 82.8 04Aug2013, 15:10 30.9
GS‐4A 0.08 127.2 04Aug2013, 13:35 20.6
RT GS‐4A 0.08 124 04Aug2013, 13:35 20.6
ADD GS‐4B 0.19 154.6 04Aug2013, 13:40 51.4
RT GS‐4B 0.19 151.5 04Aug2013, 13:45 51.3
GS‐4C 0.10 67.6 04Aug2013, 15:10 25.1
ADD GS‐4C 0.29 179.4 04Aug2013, 13:45 76.5
RT GS‐4C 0.29 178.7 04Aug2013, 13:50 76.4
GS‐4D 0.13 73.9 04Aug2013, 15:45 31.8
ADD GS‐4D 0.42 243.1 04Aug2013, 15:15 108.1
RT GS‐4D 0.42 243.1 04Aug2013, 15:15 108.1
Davenport Farm Road East 0.42 243.1 04Aug2013, 15:15 108.1
GS‐4E 0.05 55.9 04Aug2013, 14:05 13.3
ADD GS‐4E 2.19 783.4 04Aug2013, 14:20 526.2
RT GS‐4E 2.19 782.8 04Aug2013, 14:30 525
GS‐5A 0.15 80.6 04Aug2013, 15:45 34.6
GS‐5B 0.05 94.4 04Aug2013, 13:25 12.8
ADD GS‐5A‐5B 2.39 852.3 04Aug2013, 14:30 572.4
RT GS‐5A‐5B 2.39 849.1 04Aug2013, 14:35 571.6
GS‐5C 0.04 93.4 04Aug2013, 13:15 11.4
RT GS‐5C 0.04 92.5 04Aug2013, 13:20 11.4
ADD GS‐5C 2.43 861.6 04Aug2013, 14:35 583
RT‐ Gum Swamp 2 2.43 855.4 04Aug2013, 15:55 581
GS‐5D 0.14 94.4 04Aug2013, 15:10 35.1
ADD GS‐5D 2.56 947.2 04Aug2013, 14:55 616.1
RT GS‐5D 2.56 945.7 04Aug2013, 15:10 613.2
GS‐6 0.17 103.6 04Aug2013, 15:10 38.4
D/S Limit GS 2.73 1049.4 04Aug2013, 15:10 651.6
ADD GS to SC 6.27 3002.4 04Aug2013, 15:05 1563.9
RT ‐ Swift Creek 5 6.27 2970.8 04Aug2013, 15:10 1556
OUTLET 6.27 2970.8 04Aug2013, 15:10 1556
Appendix H

City of Greenville ‐ Swift Creek Watershed Master Plan ‐ HMS Output
Hydrologic ElementDrainage Area
(mi2)
Peak Discharge
(CFS)Time of Peak
Volume
(AC‐FT)
SC‐1C 0.20 174.1 04Aug2013, 15:35 78.3
SC‐1D 0.16 80.4 04Aug2013, 17:20 46
ADD SC‐1C‐1D 0.36 236.6 04Aug2013, 15:55 124.2
RT SC‐1C‐1D 0.36 236.5 04Aug2013, 15:55 124.1
SC‐1A 0.15 86.5 04Aug2013, 17:20 50
RT SC‐1A 0.15 86.4 04Aug2013, 17:25 49.7
SC‐1B 0.10 131.5 04Aug2013, 14:05 31.3
ADD SC‐1B 0.26 153.3 04Aug2013, 14:10 80.9
SC‐1E 0.17 152.2 04Aug2013, 15:10 57
RT SC‐1E 0.17 151.1 04Aug2013, 15:15 56.7
U/S Limit SC 0.79 483.6 04Aug2013, 15:35 261.8
RT ‐ Swift Creek 1 0.79 479.4 04Aug2013, 15:50 260.4
SC‐2A 0.16 118.6 04Aug2013, 16:10 59.1
SC‐2B 0.09 220 04Aug2013, 13:20 30
ADD SC‐2 1.04 617.1 04Aug2013, 15:50 349.5
SC‐3B 0.10 143 04Aug2013, 13:55 30.5
SC‐3A 0.09 47.5 04Aug2013, 16:20 22.9
ADD SC‐3A‐3B 0.18 156.4 04Aug2013, 13:55 53.4
RT SC‐3A‐3B 0.18 156 04Aug2013, 14:00 53.3
SC‐3C 0.05 92.9 04Aug2013, 13:45 17.5
ADD SC‐3 1.28 711.3 04Aug2013, 15:45 420.3
Thomas Langston ‐ SC 1.28 710.7 04Aug2013, 15:50 419.8
RT ‐ Swift Creek 2 1.28 710.5 04Aug2013, 15:50 418.3
SC‐4 0.17 254.6 04Aug2013, 13:50 50.9
Sterling Trace Drive 1.45 869.4 04Aug2013, 14:05 467.1
RT SC‐4 1.45 808.8 04Aug2013, 14:35 463
SC‐5B 0.08 97.9 04Aug2013, 14:10 24.6
SC‐5A 0.04 76.1 04Aug2013, 13:30 11.8
ADD SC‐5A‐5B 1.56 918.5 04Aug2013, 14:25 499.4
SCUT‐1B 0.07 68.8 04Aug2013, 14:40 21.5
SCUT‐1A 0.07 113.5 04Aug2013, 13:50 23.1
ADD SCUT‐1A‐1B 0.15 160.1 04Aug2013, 14:00 44.6
SCUT‐1C 0.05 118.9 04Aug2013, 13:25 17.3
U/S Limit SCUT 0.20 240.8 04Aug2013, 13:35 61.9
RT SCUT‐1C 0.20 237.9 04Aug2013, 13:45 61.7
SCUT‐1D 0.06 64.4 04Aug2013, 15:00 23.7
Thomas Langston Road ‐ SCUT 0.26 266.7 04Aug2013, 13:55 85.2
RT SCUT‐1D 0.26 266.2 04Aug2013, 14:00 85.1
SCUT‐2 0.05 51.4 04Aug2013, 14:35 16.2
Belfair Drive 0.31 302.8 04Aug2013, 14:15 101.1
RT ‐ UT to Swift Creek 1 0.31 302.8 04Aug2013, 14:20 100.6
SCUT‐3 0.09 147.9 04Aug2013, 13:55 32.4
Sterling Pointe Drive 0.40 439.7 04Aug2013, 14:05 132.6
RT ‐ UT to Swift Creek 2 0.40 438.8 04Aug2013, 14:05 132.5
SCUT‐4C 0.05 123.7 04Aug2013, 13:30 21.2
SCUT‐4B 0.05 170.8 04Aug2013, 13:10 19.1
SCUT‐4A 0.00 0.1 04Aug2013, 14:30 0
ADD SCUT‐4A‐4B 0.05 170.9 04Aug2013, 13:10 19.1
ADD SCUT‐4C 0.10 250.7 04Aug2013, 13:15 40.3
SCUT‐4D 0.04 114.2 04Aug2013, 13:20 15.2
ADD SCUT‐4D 0.14 359.2 04Aug2013, 13:15 55.4
RT SCUT‐4D 0.14 355.3 04Aug2013, 13:20 55.4
ADD SCUT 4 0.55 573 04Aug2013, 13:55 187.9
RT ‐ UT to Swift Creek 3 0.55 571.3 04Aug2013, 14:00 187.7
SCUT‐5 0.06 125.6 04Aug2013, 13:40 22.7
50‐YEAR ALTERNATIVE #1
Appendix H

City of Greenville ‐ Swift Creek Watershed Master Plan ‐ HMS Output
Hydrologic ElementDrainage Area
(mi2)
Peak Discharge
(CFS)Time of Peak
Volume
(AC‐FT)
50‐YEAR ALTERNATIVE #1
D/S Limit SCUT 0.61 682.3 04Aug2013, 13:45 210.4
ADD SCUT to SC 2.17 1519.6 04Aug2013, 14:10 709.7
RT ‐ Swift Creek 3 2.17 1427.4 04Aug2013, 14:25 700.3
SC‐6 1.37 1120.5 04Aug2013, 15:15 429.9
ADD SC‐6 3.54 2444.6 04Aug2013, 14:55 1130.2
RT ‐ Swift Creek 4 3.54 2405.8 04Aug2013, 15:00 1123.2
GS‐2A 0.46 258.6 04Aug2013, 16:50 137.3
GS‐2B 0.07 147.4 04Aug2013, 13:35 24.4
ADD GS‐2A‐2B 0.53 271.7 04Aug2013, 16:45 161.6
RT‐GS‐2A‐2B 0.53 271.5 04Aug2013, 16:50 161.1
GS‐2C 0.06 132.4 04Aug2013, 13:25 17.9
Davenport Farm Road West 0.58 298.6 04Aug2013, 13:30 178.9
RT GS‐2C 0.58 295.1 04Aug2013, 13:35 178.5
U/S Limit GS 0.58 295.1 04Aug2013, 13:35 178.5
GS‐1C 0.50 223.3 04Aug2013, 18:25 141.9
GS‐1B 0.24 130.4 04Aug2013, 17:05 72.1
GS‐1A 0.16 155.2 04Aug2013, 14:35 47.8
ADD GS‐1A‐1B 0.40 220.1 04Aug2013, 15:00 119.9
RT GS‐1A‐1B 0.40 218.8 04Aug2013, 15:20 118.5
GS‐1D 0.10 231 04Aug2013, 13:25 31.2
RT GS‐1D 0.10 221.9 04Aug2013, 13:30 31.1
ADD GS‐1 1.58 681.7 04Aug2013, 17:00 470
GS‐3 0.13 182.3 04Aug2013, 14:00 41.3
ADD GS‐3 1.71 733.9 04Aug2013, 13:40 511.3
Frog Level Road 1.71 708.8 04Aug2013, 17:05 503.3
RT‐ Gum Swamp 1 1.71 707.3 04Aug2013, 17:15 501.8
GS‐4B 0.12 101.4 04Aug2013, 15:10 38
GS‐4A 0.08 155.2 04Aug2013, 13:35 25.3
RT GS‐4A 0.08 151.2 04Aug2013, 13:35 25.3
ADD GS‐4B 0.19 190.1 04Aug2013, 13:40 63.2
RT GS‐4B 0.19 186 04Aug2013, 13:40 63.1
GS‐4C 0.10 83.3 04Aug2013, 15:10 31.1
ADD GS‐4C 0.29 221.3 04Aug2013, 13:45 94.2
RT GS‐4C 0.29 220.3 04Aug2013, 13:50 94.1
GS‐4D 0.13 91.9 04Aug2013, 15:40 39.6
ADD GS‐4D 0.42 299.3 04Aug2013, 15:10 133.7
RT GS‐4D 0.42 299.3 04Aug2013, 15:15 133.7
Davenport Farm Road East 0.42 299.3 04Aug2013, 15:15 133.7
GS‐4E 0.05 69.1 04Aug2013, 14:05 16.5
ADD GS‐4E 2.19 991.6 04Aug2013, 14:10 651.9
RT GS‐4E 2.19 990.9 04Aug2013, 14:20 650.6
GS‐5A 0.15 101 04Aug2013, 15:45 43.4
GS‐5B 0.05 115.4 04Aug2013, 13:20 15.7
ADD GS‐5A‐5B 2.39 1073.2 04Aug2013, 14:25 709.7
RT GS‐5A‐5B 2.39 1067.7 04Aug2013, 14:25 708.8
GS‐5C 0.04 113.7 04Aug2013, 13:15 13.9
RT GS‐5C 0.04 112.9 04Aug2013, 13:20 13.9
ADD GS‐5C 2.43 1084.7 04Aug2013, 14:25 722.7
RT‐ Gum Swamp 2 2.43 1074.3 04Aug2013, 14:35 720.4
GS‐5D 0.14 116 04Aug2013, 15:10 43.4
ADD GS‐5D 2.56 1181.9 04Aug2013, 14:45 763.7
RT GS‐5D 2.56 1179.1 04Aug2013, 14:55 760.4
GS‐6 0.17 129.8 04Aug2013, 15:10 48.2
D/S Limit GS 2.73 1307.9 04Aug2013, 15:05 808.6
ADD GS to SC 6.27 3713.6 04Aug2013, 15:00 1931.8
RT ‐ Swift Creek 5 6.27 3674.9 04Aug2013, 15:05 1922.9
OUTLET 6.27 3674.9 04Aug2013, 15:05 1922.9
Appendix H

City of Greenville ‐ Swift Creek Watershed Master Plan ‐ HMS Output
Hydrologic ElementDrainage Area
(mi2)
Peak Discharge
(CFS)Time of Peak
Volume
(AC‐FT)
SC‐1C 0.20 204.4 04Aug2013, 15:35 92.5
SC‐1D 0.16 97.5 04Aug2013, 17:20 56
ADD SC‐1C‐1D 0.36 281 04Aug2013, 15:55 148.4
RT SC‐1C‐1D 0.36 280.8 04Aug2013, 15:55 148.3
SC‐1A 0.15 103.4 04Aug2013, 17:15 60.1
RT SC‐1A 0.15 103.3 04Aug2013, 17:25 59.7
SC‐1B 0.10 159.8 04Aug2013, 14:05 38.2
ADD SC‐1B 0.26 187.1 04Aug2013, 14:10 97.9
SC‐1E 0.17 183.1 04Aug2013, 15:05 68.9
RT SC‐1E 0.17 181.8 04Aug2013, 15:15 68.6
U/S Limit SC 0.79 578.1 04Aug2013, 15:35 314.8
RT ‐ Swift Creek 1 0.79 574.6 04Aug2013, 15:50 313.4
SC‐2A 0.16 139.9 04Aug2013, 16:10 70.1
SC‐2B 0.09 264.8 04Aug2013, 13:20 36.3
ADD SC‐2 1.04 737.2 04Aug2013, 15:50 419.9
SC‐3B 0.10 173.2 04Aug2013, 13:55 37.2
SC‐3A 0.09 58.8 04Aug2013, 16:15 28.3
ADD SC‐3A‐3B 0.18 190.7 04Aug2013, 13:55 65.5
RT SC‐3A‐3B 0.18 190 04Aug2013, 14:00 65.4
SC‐3C 0.05 112.1 04Aug2013, 13:45 21.3
ADD SC‐3 1.28 852.6 04Aug2013, 15:40 506.5
Thomas Langston ‐ SC 1.28 852.4 04Aug2013, 15:45 506.1
RT ‐ Swift Creek 2 1.28 852.3 04Aug2013, 15:45 504.5
SC‐4 0.17 310 04Aug2013, 13:50 62.3
Sterling Trace Drive 1.45 1057.8 04Aug2013, 14:05 564.5
RT SC‐4 1.45 985.8 04Aug2013, 14:30 559
SC‐5B 0.08 118.3 04Aug2013, 14:10 29.9
SC‐5A 0.04 91.3 04Aug2013, 13:30 14.3
ADD SC‐5A‐5B 1.56 1122.6 04Aug2013, 14:20 603.2
SCUT‐1B 0.07 84.2 04Aug2013, 14:40 26.4
SCUT‐1A 0.07 137 04Aug2013, 13:50 28.1
ADD SCUT‐1A‐1B 0.15 194.6 04Aug2013, 14:00 54.4
SCUT‐1C 0.05 143.9 04Aug2013, 13:25 21.1
U/S Limit SCUT 0.20 292.7 04Aug2013, 13:35 75.5
RT SCUT‐1C 0.20 288.9 04Aug2013, 13:45 75.3
SCUT‐1D 0.06 76.3 04Aug2013, 15:00 28.2
Thomas Langston Road ‐ SCUT 0.26 324.9 04Aug2013, 13:55 103.4
RT SCUT‐1D 0.26 324.8 04Aug2013, 13:55 103.2
SCUT‐2 0.05 61.2 04Aug2013, 14:35 19.4
Belfair Drive 0.31 362 04Aug2013, 14:15 122.4
RT ‐ UT to Swift Creek 1 0.31 362.1 04Aug2013, 14:20 121.9
SCUT‐3 0.09 176.5 04Aug2013, 13:55 39
Sterling Pointe Drive 0.40 521.6 04Aug2013, 14:10 160.4
RT ‐ UT to Swift Creek 2 0.40 520.9 04Aug2013, 14:10 160.3
SCUT‐4C 0.05 145.3 04Aug2013, 13:30 25
SCUT‐4B 0.05 200.4 04Aug2013, 13:10 22.6
SCUT‐4A 0.00 0.1 04Aug2013, 14:30 0
ADD SCUT‐4A‐4B 0.05 200.5 04Aug2013, 13:10 22.6
ADD SCUT‐4C 0.10 294.3 04Aug2013, 13:15 47.6
SCUT‐4D 0.04 135.1 04Aug2013, 13:20 18.1
ADD SCUT‐4D 0.14 422.9 04Aug2013, 13:15 65.7
RT SCUT‐4D 0.14 418.1 04Aug2013, 13:20 65.7
ADD SCUT 4 0.55 692.6 04Aug2013, 13:50 226.1
RT ‐ UT to Swift Creek 3 0.55 686.8 04Aug2013, 13:55 225.8
SCUT‐5 0.06 148.7 04Aug2013, 13:40 27.1
100‐YEAR ALTERNATIVE #1
Appendix H

City of Greenville ‐ Swift Creek Watershed Master Plan ‐ HMS Output
Hydrologic ElementDrainage Area
(mi2)
Peak Discharge
(CFS)Time of Peak
Volume
(AC‐FT)
100‐YEAR ALTERNATIVE #1
D/S Limit SCUT 0.61 822.7 04Aug2013, 13:45 252.9
ADD SCUT to SC 2.17 1841.2 04Aug2013, 14:10 856.1
RT ‐ Swift Creek 3 2.17 1736.4 04Aug2013, 14:25 845.1
SC‐6 1.37 1355.9 04Aug2013, 15:15 522.5
ADD SC‐6 3.54 2945.1 04Aug2013, 14:50 1367.7
RT ‐ Swift Creek 4 3.54 2900 04Aug2013, 14:55 1359.8
GS‐2A 0.46 313.4 04Aug2013, 16:45 167.1
GS‐2B 0.07 175.2 04Aug2013, 13:35 29.2
ADD GS‐2A‐2B 0.53 328.8 04Aug2013, 16:40 196.3
RT‐GS‐2A‐2B 0.53 328.6 04Aug2013, 16:45 195.8
GS‐2C 0.06 160.4 04Aug2013, 13:25 21.8
Davenport Farm Road West 0.58 365.4 04Aug2013, 13:30 217.6
RT GS‐2C 0.58 361.1 04Aug2013, 13:35 217
U/S Limit GS 0.58 361.1 04Aug2013, 13:35 217
GS‐1C 0.50 270.1 04Aug2013, 18:25 172.5
GS‐1B 0.24 157.6 04Aug2013, 17:05 87.5
GS‐1A 0.16 189.5 04Aug2013, 14:35 58.6
ADD GS‐1A‐1B 0.40 268.8 04Aug2013, 15:00 146.1
RT GS‐1A‐1B 0.40 267.3 04Aug2013, 15:15 144.5
GS‐1D 0.10 279.8 04Aug2013, 13:25 38.1
RT GS‐1D 0.10 269.1 04Aug2013, 13:30 38
ADD GS‐1 1.58 824.9 04Aug2013, 17:00 572
GS‐3 0.13 220.1 04Aug2013, 14:00 50.1
ADD GS‐3 1.71 900 04Aug2013, 13:40 622.1
Frog Level Road 1.71 879.6 04Aug2013, 13:45 612.2
RT‐ Gum Swamp 1 1.71 856.3 04Aug2013, 17:10 610.7
GS‐4B 0.12 121.9 04Aug2013, 15:05 45.9
GS‐4A 0.08 186 04Aug2013, 13:35 30.6
RT GS‐4A 0.08 181.2 04Aug2013, 13:35 30.5
ADD GS‐4B 0.19 229.1 04Aug2013, 13:40 76.5
RT GS‐4B 0.19 224.6 04Aug2013, 13:40 76.4
GS‐4C 0.10 100.8 04Aug2013, 15:10 37.8
ADD GS‐4C 0.29 268 04Aug2013, 13:45 114.1
RT GS‐4C 0.29 266.6 04Aug2013, 13:50 114
GS‐4D 0.13 112 04Aug2013, 15:40 48.4
ADD GS‐4D 0.42 361.8 04Aug2013, 15:10 162.4
RT GS‐4D 0.42 361.7 04Aug2013, 15:10 162.4
Davenport Farm Road East 0.42 361.7 04Aug2013, 15:10 162.4
GS‐4E 0.05 83.7 04Aug2013, 14:05 20
ADD GS‐4E 2.19 1227.5 04Aug2013, 14:05 793.1
RT GS‐4E 2.19 1224.7 04Aug2013, 14:15 791.6
GS‐5A 0.15 123.8 04Aug2013, 15:40 53.3
GS‐5B 0.05 138.9 04Aug2013, 13:20 19
ADD GS‐5A‐5B 2.39 1324.1 04Aug2013, 14:15 863.9
RT GS‐5A‐5B 2.39 1314.3 04Aug2013, 14:15 862.9
GS‐5C 0.04 136 04Aug2013, 13:15 16.8
RT GS‐5C 0.04 133.5 04Aug2013, 13:20 16.8
ADD GS‐5C 2.43 1338.3 04Aug2013, 14:15 879.7
RT‐ Gum Swamp 2 2.43 1320.4 04Aug2013, 14:25 877
GS‐5D 0.14 140 04Aug2013, 15:10 52.6
ADD GS‐5D 2.56 1441.6 04Aug2013, 14:35 929.6
RT GS‐5D 2.56 1437.5 04Aug2013, 14:45 925.8
GS‐6 0.17 159.1 04Aug2013, 15:10 59.2
D/S Limit GS 2.73 1592.9 04Aug2013, 15:00 985
ADD GS to SC 6.27 4492.8 04Aug2013, 14:55 2344.9
RT ‐ Swift Creek 5 6.27 4451.3 04Aug2013, 15:05 2335.1
OUTLET 6.27 4451.3 04Aug2013, 15:05 2335.1
Appendix H

PRIMARY SYSTEM
ALTERNATIVE #2:
HEC‐HMS OUTPUT

City of Greenville ‐ Swift Creek Watershed Master Plan ‐ HMS Output
Hydrologic ElementDrainage Area
(mi2)
Peak Discharge
(CFS)Time of Peak
Volume
(AC‐FT)
SC‐1C 0.20 68.9 04Aug2013, 15:40 30
SC‐1D 0.16 24.1 04Aug2013, 17:35 13.7
Proposed Swift Det _23 0.36 4.5 05Aug2013, 01:30 2.3
RT SC‐1C‐1D 0.36 4.5 05Aug2013, 01:30 2.3
SC‐1A 0.15 29.2 04Aug2013, 17:25 16.6
RT SC‐1A 0.15 29.2 04Aug2013, 17:40 16.4
SC‐1B 0.10 37.7 04Aug2013, 14:10 9.1
ADD SC‐1B 0.26 42.4 04Aug2013, 14:15 25.5
SC‐1E 0.17 48.2 04Aug2013, 15:15 18
RT SC‐1E 0.17 47.8 04Aug2013, 15:25 17.9
U/S Limit SC 0.79 80.7 04Aug2013, 15:25 45.6
RT ‐ Swift Creek 1 0.79 80.6 04Aug2013, 15:35 45.2
SC‐2A 0.16 44.9 04Aug2013, 16:15 21.7
SC‐2B 0.09 69.9 04Aug2013, 13:25 9.3
ADD SC‐2 1.04 131.7 04Aug2013, 15:50 76.3
SC‐3B 0.10 42.3 04Aug2013, 13:55 9.1
SC‐3A 0.09 11.7 04Aug2013, 16:35 5.8
ADD SC‐3A‐3B 0.18 44.5 04Aug2013, 14:00 14.9
RT SC‐3A‐3B 0.18 44.3 04Aug2013, 14:05 14.9
SC‐3C 0.05 28.4 04Aug2013, 13:45 5.3
ADD SC‐3 1.28 161.5 04Aug2013, 14:10 96.4
Thomas Langston ‐ SC 1.28 161.5 04Aug2013, 14:10 96.2
RT ‐ Swift Creek 2 1.28 161.3 04Aug2013, 14:15 95
SC‐4 0.17 71.2 04Aug2013, 13:50 14.5
Sterling Trace Drive 1.45 225.2 04Aug2013, 14:05 108.3
RT SC‐4 1.45 199.6 04Aug2013, 14:55 106.2
SC‐5A 0.04 24.5 04Aug2013, 13:30 3.7
ADD SC‐5A‐5B 1.48 204.6 04Aug2013, 14:50 109.9
SCUT‐1B 0.07 18.5 04Aug2013, 14:45 5.9
SCUT‐1A 0.07 34.5 04Aug2013, 13:50 7
ADD SCUT‐1A‐1B 0.15 46.1 04Aug2013, 14:00 13
SCUT‐1C 0.05 35.6 04Aug2013, 13:30 5.2
Proposed Swift Det_17 0.20 5.4 04Aug2013, 21:30 4.8
RT SCUT‐1C 0.20 5.4 04Aug2013, 21:40 4.6
SCUT‐1D 0.06 23.5 04Aug2013, 15:00 8.4
Thomas Langston Road ‐ SCUT 0.26 26.9 04Aug2013, 15:10 12.9
RT SCUT‐1D 0.26 26.9 04Aug2013, 15:10 12.8
SCUT‐2 0.05 18 04Aug2013, 14:40 5.5
Belfair Drive 0.31 43.6 04Aug2013, 15:00 18.2
RT ‐ UT to Swift Creek 1 0.31 43.6 04Aug2013, 15:00 17.8
SCUT‐3 0.09 49.7 04Aug2013, 13:55 10.7
Sterling Pointe Drive 0.40 73.7 04Aug2013, 14:30 28.3
RT ‐ UT to Swift Creek 2 0.40 73.6 04Aug2013, 14:35 28.2
SCUT‐4C 0.05 48.9 04Aug2013, 13:35 8
SCUT‐4B 0.05 67.5 04Aug2013, 13:10 7.2
SCUT‐4A 0.00 0 04Aug2013, 14:30 0
ADD SCUT‐4A‐4B 0.05 67.5 04Aug2013, 13:10 7.2
ADD SCUT‐4C 0.10 98.6 04Aug2013, 13:15 15.2
SCUT‐4D 0.04 41.5 04Aug2013, 13:20 5.3
ADD SCUT‐4D 0.14 137.4 04Aug2013, 13:15 20.5
RT SCUT‐4D 0.14 136.8 04Aug2013, 13:20 20.5
ADD SCUT 4 0.55 154.1 04Aug2013, 13:25 48.7
RT ‐ UT to Swift Creek 3 0.55 153.3 04Aug2013, 13:30 48.6
SCUT‐5 0.06 45.6 04Aug2013, 13:40 7.9
D/S Limit SCUT 0.61 196.3 04Aug2013, 13:35 56.5
2‐YEAR ALTERNATIVE #2
Appendix H

City of Greenville ‐ Swift Creek Watershed Master Plan ‐ HMS Output
Hydrologic ElementDrainage Area
(mi2)
Peak Discharge
(CFS)Time of Peak
Volume
(AC‐FT)
2‐YEAR ALTERNATIVE #2
SC‐5B 0.08 29.6 04Aug2013, 14:15 7.5
ADD SCUT to SC 2.17 347.1 04Aug2013, 14:25 173.9
RT ‐ Swift Creek 3 2.17 332.7 04Aug2013, 14:55 170.6
SC‐6 1.37 336.6 04Aug2013, 15:20 129.7
ADD SC‐6 3.54 661.3 04Aug2013, 15:10 300.3
RT ‐ Swift Creek 4 3.54 647.5 04Aug2013, 15:20 297.5
GS‐2A 0.46 77.5 04Aug2013, 17:00 41
GS‐2B 0.07 51.3 04Aug2013, 13:35 8.2
ADD GS‐2A‐2B 0.53 82.4 04Aug2013, 16:55 49.2
RT‐GS‐2A‐2B 0.53 82.3 04Aug2013, 17:00 49
GS‐2C 0.06 38.8 04Aug2013, 13:25 5.2
Davenport Farm Road West 0.58 87.3 04Aug2013, 13:35 54.2
RT GS‐2C 0.58 85.5 04Aug2013, 13:40 54
U/S Limit GS 0.58 85.5 04Aug2013, 13:40 54
GS‐1C 0.50 68.6 04Aug2013, 18:40 42.8
GS‐1B 0.24 40.1 04Aug2013, 17:15 22
GS‐1A 0.16 43.1 04Aug2013, 14:40 13.6
ADD GS‐1A‐1B 0.40 61.6 04Aug2013, 15:10 35.5
RT GS‐1A‐1B 0.40 61.3 04Aug2013, 15:40 34.8
GS‐1D 0.10 67.7 04Aug2013, 13:25 9.1
RT GS‐1D 0.10 64.7 04Aug2013, 13:35 9
ADD GS‐1 1.58 208 04Aug2013, 17:20 140.7
GS‐3 0.13 55.3 04Aug2013, 14:00 12.5
ADD GS‐3 1.71 217.1 04Aug2013, 17:15 153.2
Frog Level Road 1.71 211.2 04Aug2013, 18:00 150.1
RT‐ Gum Swamp 1 1.71 211.2 04Aug2013, 18:05 149.4
GS‐4B 0.12 32.1 04Aug2013, 15:15 12
GS‐4A 0.08 50.2 04Aug2013, 13:35 8
RT GS‐4A 0.08 48.8 04Aug2013, 13:40 8
ADD GS‐4B 0.19 58.8 04Aug2013, 13:40 20
RT GS‐4B 0.19 58.1 04Aug2013, 13:45 19.9
GS‐4C 0.10 25.1 04Aug2013, 15:15 9.4
ADD GS‐4C 0.29 67.3 04Aug2013, 15:05 29.3
RT GS‐4C 0.29 67.3 04Aug2013, 15:05 29.3
GS‐4D 0.13 26.2 04Aug2013, 15:50 11.4
ADD GS‐4D 0.42 91.3 04Aug2013, 15:20 40.7
RT GS‐4D 0.42 91.3 04Aug2013, 15:20 40.6
Davenport Farm Road East 0.42 91.3 04Aug2013, 15:20 40.6
GS‐4E 0.05 20.4 04Aug2013, 14:10 4.9
ADD GS‐4E 2.19 269.7 04Aug2013, 16:00 194.9
RT GS‐4E 2.19 269.7 04Aug2013, 16:05 194.4
GS‐5A 0.15 27.2 04Aug2013, 15:55 11.9
GS‐5B 0.05 36.6 04Aug2013, 13:25 4.9
ADD GS‐5A‐5B 2.39 300.7 04Aug2013, 15:55 211.2
RT GS‐5A‐5B 2.39 300.6 04Aug2013, 16:00 210.8
GS‐5C 0.04 37.6 04Aug2013, 13:20 4.5
RT GS‐5C 0.04 37 04Aug2013, 13:25 4.5
ADD GS‐5C 2.43 304 04Aug2013, 15:55 215.4
RT‐ Gum Swamp 2 2.43 303.7 04Aug2013, 16:05 214.4
GS‐5D 0.14 35.8 04Aug2013, 15:15 13.4
ADD GS‐5D 2.56 336.4 04Aug2013, 15:40 227.7
RT GS‐5D 2.56 336.1 04Aug2013, 15:50 226.3
GS‐6 0.17 34.9 04Aug2013, 15:20 13.3
D/S Limit GS 2.73 369.6 04Aug2013, 15:35 239.7
ADD GS to SC 6.27 1015.7 04Aug2013, 15:25 537.1
RT ‐ Swift Creek 5 6.27 1004.6 04Aug2013, 15:30 533.3
OUTLET 6.27 1004.6 04Aug2013, 15:30 533.3
Appendix H

City of Greenville ‐ Swift Creek Watershed Master Plan ‐ HMS Output
Hydrologic ElementDrainage Area
(mi2)
Peak Discharge
(CFS)Time of Peak
Volume
(AC‐FT)
SC‐1C 0.20 114.9 04Aug2013, 15:35 50.8
SC‐1D 0.16 47.8 04Aug2013, 17:25 27.1
Proposed Swift Det _23 0.36 11.5 05Aug2013, 01:30 7
RT SC‐1C‐1D 0.36 11.5 05Aug2013, 01:30 6.9
SC‐1A 0.15 53.8 04Aug2013, 17:20 30.7
RT SC‐1A 0.15 53.7 04Aug2013, 17:30 30.5
SC‐1B 0.10 77.2 04Aug2013, 14:05 18.3
ADD SC‐1B 0.26 88.8 04Aug2013, 14:10 48.8
SC‐1E 0.17 92.6 04Aug2013, 15:10 34.4
RT SC‐1E 0.17 91.9 04Aug2013, 15:20 34.2
U/S Limit SC 0.79 157.4 04Aug2013, 15:10 89.9
RT ‐ Swift Creek 1 0.79 157.2 04Aug2013, 15:15 89.2
SC‐2A 0.16 77 04Aug2013, 16:10 37.8
SC‐2B 0.09 134.3 04Aug2013, 13:25 18
ADD SC‐2 1.04 243.4 04Aug2013, 15:35 145
SC‐3B 0.10 85 04Aug2013, 13:55 18
SC‐3A 0.09 26.3 04Aug2013, 16:25 12.7
ADD SC‐3A‐3B 0.18 91.1 04Aug2013, 13:55 30.7
RT SC‐3A‐3B 0.18 90.8 04Aug2013, 14:00 30.7
SC‐3C 0.05 55.9 04Aug2013, 13:45 10.4
ADD SC‐3 1.28 329.3 04Aug2013, 14:00 186.1
Thomas Langston ‐ SC 1.28 329.2 04Aug2013, 14:00 185.7
RT ‐ Swift Creek 2 1.28 328.9 04Aug2013, 14:05 184.3
SC‐4 0.17 148.3 04Aug2013, 13:50 29.5
Sterling Trace Drive 1.45 458.5 04Aug2013, 14:05 212.4
RT SC‐4 1.45 418.7 04Aug2013, 14:35 210.4
SC‐5A 0.04 46.7 04Aug2013, 13:30 7.1
ADD SC‐5A‐5B 1.48 429.7 04Aug2013, 14:35 217.6
SCUT‐1B 0.07 39.5 04Aug2013, 14:40 12.3
SCUT‐1A 0.07 68.1 04Aug2013, 13:50 13.7
ADD SCUT‐1A‐1B 0.15 94.1 04Aug2013, 14:00 26.1
SCUT‐1C 0.05 70.8 04Aug2013, 13:30 10.2
Proposed Swift Det_17 0.20 10.8 04Aug2013, 20:35 9.8
RT SCUT‐1C 0.20 10.8 04Aug2013, 20:40 9.6
SCUT‐1D 0.06 41.3 04Aug2013, 15:00 14.9
Thomas Langston Road ‐ SCUT 0.26 48.6 04Aug2013, 15:05 24.4
RT SCUT‐1D 0.26 48.6 04Aug2013, 15:10 24.2
SCUT‐2 0.05 32.5 04Aug2013, 14:35 10.1
Belfair Drive 0.31 78.7 04Aug2013, 14:55 34.1
RT ‐ UT to Swift Creek 1 0.31 78.7 04Aug2013, 15:00 33.7
SCUT‐3 0.09 92.1 04Aug2013, 13:55 19.9
Sterling Pointe Drive 0.40 140.6 04Aug2013, 14:20 53.2
RT ‐ UT to Swift Creek 2 0.40 140.3 04Aug2013, 14:20 53.1
SCUT‐4C 0.05 81.7 04Aug2013, 13:35 13.7
SCUT‐4B 0.05 112.8 04Aug2013, 13:10 12.3
SCUT‐4A 0.00 0.1 04Aug2013, 14:30 0
ADD SCUT‐4A‐4B 0.05 112.8 04Aug2013, 13:10 12.3
ADD SCUT‐4C 0.10 165.3 04Aug2013, 13:15 26
SCUT‐4D 0.04 73.2 04Aug2013, 13:20 9.5
ADD SCUT‐4D 0.14 234.4 04Aug2013, 13:15 35.5
RT SCUT‐4D 0.14 232.6 04Aug2013, 13:20 35.5
ADD SCUT 4 0.55 279.2 04Aug2013, 13:25 88.6
RT ‐ UT to Swift Creek 3 0.55 273.8 04Aug2013, 13:30 88.3
SCUT‐5 0.06 80.5 04Aug2013, 13:40 14.2
D/S Limit SCUT 0.61 350.1 04Aug2013, 13:35 102.6
10‐YEAR ALTERNATIVE #2
Appendix H

City of Greenville ‐ Swift Creek Watershed Master Plan ‐ HMS Output
Hydrologic ElementDrainage Area
(mi2)
Peak Discharge
(CFS)Time of Peak
Volume
(AC‐FT)
10‐YEAR ALTERNATIVE #2
SC‐5B 0.08 58.6 04Aug2013, 14:10 14.6
ADD SCUT to SC 2.17 719 04Aug2013, 14:15 334.8
RT ‐ Swift Creek 3 2.17 681.2 04Aug2013, 14:35 329.6
SC‐6 1.37 668.2 04Aug2013, 15:15 255
ADD SC‐6 3.54 1308.9 04Aug2013, 15:00 584.7
RT ‐ Swift Creek 4 3.54 1283.7 04Aug2013, 15:10 580
GS‐2A 0.46 153.8 04Aug2013, 16:50 81.2
GS‐2B 0.07 93 04Aug2013, 13:35 15.1
ADD GS‐2A‐2B 0.53 162.3 04Aug2013, 16:50 96.2
RT‐GS‐2A‐2B 0.53 162.2 04Aug2013, 16:55 95.8
GS‐2C 0.06 78.5 04Aug2013, 13:25 10.5
Davenport Farm Road West 0.58 175 04Aug2013, 13:35 106.3
RT GS‐2C 0.58 172.5 04Aug2013, 13:40 105.9
U/S Limit GS 0.58 172.5 04Aug2013, 13:40 105.9
GS‐1C 0.50 133.9 04Aug2013, 18:30 84.2
GS‐1B 0.24 78.3 04Aug2013, 17:10 43
GS‐1A 0.16 90 04Aug2013, 14:40 27.7
ADD GS‐1A‐1B 0.40 127.6 04Aug2013, 15:05 70.7
RT GS‐1A‐1B 0.40 126.8 04Aug2013, 15:25 69.6
GS‐1D 0.10 137 04Aug2013, 13:25 18.3
RT GS‐1D 0.10 130.5 04Aug2013, 13:30 18.2
ADD GS‐1 1.58 407.9 04Aug2013, 17:10 277.9
GS‐3 0.13 109.3 04Aug2013, 14:00 24.5
ADD GS‐3 1.71 425 04Aug2013, 17:00 302.4
Frog Level Road 1.71 424.2 04Aug2013, 17:15 297.6
RT‐ Gum Swamp 1 1.71 423 04Aug2013, 17:30 296.5
GS‐4B 0.12 61.7 04Aug2013, 15:10 22.9
GS‐4A 0.08 95.3 04Aug2013, 13:35 15.3
RT GS‐4A 0.08 92.4 04Aug2013, 13:35 15.3
ADD GS‐4B 0.19 114.6 04Aug2013, 13:40 38.2
RT GS‐4B 0.19 112.7 04Aug2013, 13:45 38.1
GS‐4C 0.10 49.7 04Aug2013, 15:10 18.5
ADD GS‐4C 0.29 132.5 04Aug2013, 13:50 56.6
RT GS‐4C 0.29 131.7 04Aug2013, 13:50 56.5
GS‐4D 0.13 53.7 04Aug2013, 15:45 23.1
ADD GS‐4D 0.42 179.5 04Aug2013, 15:15 79.5
RT GS‐4D 0.42 179.4 04Aug2013, 15:15 79.5
Davenport Farm Road East 0.42 179.4 04Aug2013, 15:15 79.5
GS‐4E 0.05 41 04Aug2013, 14:05 9.7
ADD GS‐4E 2.19 552.6 04Aug2013, 14:35 385.7
RT GS‐4E 2.19 552.4 04Aug2013, 16:00 384.8
GS‐5A 0.15 57.8 04Aug2013, 15:45 24.9
GS‐5B 0.05 70.4 04Aug2013, 13:25 9.4
ADD GS‐5A‐5B 2.39 616.6 04Aug2013, 15:55 419.1
RT GS‐5A‐5B 2.39 616.3 04Aug2013, 15:55 418.5
GS‐5C 0.04 70.2 04Aug2013, 13:15 8.5
RT GS‐5C 0.04 70 04Aug2013, 13:20 8.5
ADD GS‐5C 2.43 622.3 04Aug2013, 15:55 427
RT‐ Gum Swamp 2 2.43 621.8 04Aug2013, 16:00 425.3
GS‐5D 0.14 69.9 04Aug2013, 15:10 25.9
ADD GS‐5D 2.56 686.3 04Aug2013, 15:25 451.2
RT GS‐5D 2.56 685.8 04Aug2013, 15:40 448.9
GS‐6 0.17 74.3 04Aug2013, 15:15 27.7
D/S Limit GS 2.73 758.4 04Aug2013, 15:25 476.6
ADD GS to SC 6.27 2038.8 04Aug2013, 15:10 1056.5
RT ‐ Swift Creek 5 6.27 2017 04Aug2013, 15:15 1050.4
OUTLET 6.27 2017 04Aug2013, 15:15 1050.4
Appendix H

City of Greenville ‐ Swift Creek Watershed Master Plan ‐ HMS Output
Hydrologic ElementDrainage Area
(mi2)
Peak Discharge
(CFS)Time of Peak
Volume
(AC‐FT)
SC‐1C 0.20 146.6 04Aug2013, 15:35 65.4
SC‐1D 0.16 65.1 04Aug2013, 17:25 37.1
Proposed Swift Det _23 0.36 15.8 05Aug2013, 01:30 10.1
RT SC‐1C‐1D 0.36 15.8 05Aug2013, 01:30 10
SC‐1A 0.15 71.2 04Aug2013, 17:20 41
RT SC‐1A 0.15 71.1 04Aug2013, 17:30 40.6
SC‐1B 0.10 106 04Aug2013, 14:05 25.1
ADD SC‐1B 0.26 122.9 04Aug2013, 14:10 65.8
SC‐1E 0.17 124.3 04Aug2013, 15:10 46.3
RT SC‐1E 0.17 123.3 04Aug2013, 15:15 46.1
U/S Limit SC 0.79 213.3 04Aug2013, 14:55 121.9
RT ‐ Swift Creek 1 0.79 213.1 04Aug2013, 15:05 121.1
SC‐2A 0.16 99.2 04Aug2013, 16:10 49.1
SC‐2B 0.09 180 04Aug2013, 13:25 24.3
ADD SC‐2 1.04 322.8 04Aug2013, 15:30 194.5
SC‐3B 0.10 115.8 04Aug2013, 13:55 24.6
SC‐3A 0.09 37.4 04Aug2013, 16:20 18
ADD SC‐3A‐3B 0.18 125.6 04Aug2013, 13:55 42.6
RT SC‐3A‐3B 0.18 125.3 04Aug2013, 14:00 42.5
SC‐3C 0.05 75.6 04Aug2013, 13:45 14.2
ADD SC‐3 1.28 453.1 04Aug2013, 14:00 251.2
Thomas Langston ‐ SC 1.28 452.2 04Aug2013, 14:05 250.8
RT ‐ Swift Creek 2 1.28 452.3 04Aug2013, 14:05 249.4
SC‐4 0.17 204.6 04Aug2013, 13:50 40.8
Sterling Trace Drive 1.45 628.8 04Aug2013, 14:05 288.6
RT SC‐4 1.45 577.3 04Aug2013, 14:30 286.1
SC‐5A 0.04 62.4 04Aug2013, 13:30 9.6
ADD SC‐5A‐5B 1.48 593 04Aug2013, 14:30 295.7
SCUT‐1B 0.07 55 04Aug2013, 14:40 17.1
SCUT‐1A 0.07 92.3 04Aug2013, 13:50 18.7
ADD SCUT‐1A‐1B 0.15 129.1 04Aug2013, 14:00 35.8
SCUT‐1C 0.05 96.3 04Aug2013, 13:25 14
Proposed Swift Det_17 0.20 16.3 04Aug2013, 19:45 14.6
RT SCUT‐1C 0.20 16.3 04Aug2013, 19:55 14.3
SCUT‐1D 0.06 53.7 04Aug2013, 15:00 19.6
Thomas Langston Road ‐ SCUT 0.26 64.1 04Aug2013, 15:05 33.7
RT SCUT‐1D 0.26 64.1 04Aug2013, 15:10 33.6
SCUT‐2 0.05 42.6 04Aug2013, 14:35 13.3
Belfair Drive 0.31 103.4 04Aug2013, 14:55 46.7
RT ‐ UT to Swift Creek 1 0.31 103.3 04Aug2013, 14:55 46.2
SCUT‐3 0.09 121.9 04Aug2013, 13:55 26.5
Sterling Pointe Drive 0.40 188.9 04Aug2013, 14:10 72.3
RT ‐ UT to Swift Creek 2 0.40 188.3 04Aug2013, 14:10 72.1
SCUT‐4C 0.05 104.2 04Aug2013, 13:30 17.7
SCUT‐4B 0.05 143.9 04Aug2013, 13:10 15.9
SCUT‐4A 0.00 0.1 04Aug2013, 14:30 0
ADD SCUT‐4A‐4B 0.05 143.9 04Aug2013, 13:10 15.9
ADD SCUT‐4C 0.10 211 04Aug2013, 13:15 33.6
SCUT‐4D 0.04 95.1 04Aug2013, 13:20 12.5
ADD SCUT‐4D 0.14 301.2 04Aug2013, 13:15 46.1
RT SCUT‐4D 0.14 298.3 04Aug2013, 13:20 46.1
ADD SCUT 4 0.55 365.7 04Aug2013, 13:20 118.2
RT ‐ UT to Swift Creek 3 0.55 358.3 04Aug2013, 13:30 118
SCUT‐5 0.06 104.7 04Aug2013, 13:40 18.7
D/S Limit SCUT 0.61 457.7 04Aug2013, 13:30 136.7
25‐YEAR ALTERNATIVE #2
Appendix H

City of Greenville ‐ Swift Creek Watershed Master Plan ‐ HMS Output
Hydrologic ElementDrainage Area
(mi2)
Peak Discharge
(CFS)Time of Peak
Volume
(AC‐FT)
25‐YEAR ALTERNATIVE #2
SC‐5B 0.08 79.5 04Aug2013, 14:10 19.9
ADD SCUT to SC 2.17 988 04Aug2013, 14:10 452.3
RT ‐ Swift Creek 3 2.17 933.6 04Aug2013, 14:30 445.3
SC‐6 1.37 908.3 04Aug2013, 15:15 347.3
ADD SC‐6 3.54 1772.1 04Aug2013, 14:55 792.6
RT ‐ Swift Creek 4 3.54 1740.7 04Aug2013, 15:05 786.9
GS‐2A 0.46 209.4 04Aug2013, 16:50 110.8
GS‐2B 0.07 122.1 04Aug2013, 13:35 20
ADD GS‐2A‐2B 0.53 220.3 04Aug2013, 16:45 130.7
RT‐GS‐2A‐2B 0.53 220.1 04Aug2013, 16:50 130.3
GS‐2C 0.06 107.2 04Aug2013, 13:25 14.4
Davenport Farm Road West 0.58 239.9 04Aug2013, 13:30 144.6
RT GS‐2C 0.58 236.9 04Aug2013, 13:40 144.2
U/S Limit GS 0.58 236.9 04Aug2013, 13:40 144.2
GS‐1C 0.50 181.3 04Aug2013, 18:30 114.6
GS‐1B 0.24 106 04Aug2013, 17:05 58.3
GS‐1A 0.16 124.5 04Aug2013, 14:40 38.3
ADD GS‐1A‐1B 0.40 176.5 04Aug2013, 15:00 96.6
RT GS‐1A‐1B 0.40 175.4 04Aug2013, 15:20 95.4
GS‐1D 0.10 186.9 04Aug2013, 13:25 25.1
RT GS‐1D 0.10 179.3 04Aug2013, 13:30 25
ADD GS‐1 1.58 553.1 04Aug2013, 17:05 379.2
GS‐3 0.13 148.1 04Aug2013, 14:00 33.4
ADD GS‐3 1.71 586.4 04Aug2013, 13:40 412.6
Frog Level Road 1.71 575.3 04Aug2013, 17:05 406.3
RT‐ Gum Swamp 1 1.71 573.9 04Aug2013, 17:20 404.8
GS‐4B 0.12 82.8 04Aug2013, 15:10 30.9
GS‐4A 0.08 127.2 04Aug2013, 13:35 20.6
RT GS‐4A 0.08 124 04Aug2013, 13:35 20.6
ADD GS‐4B 0.19 154.6 04Aug2013, 13:40 51.4
RT GS‐4B 0.19 151.5 04Aug2013, 13:45 51.3
GS‐4C 0.10 67.6 04Aug2013, 15:10 25.1
ADD GS‐4C 0.29 179.4 04Aug2013, 13:45 76.5
RT GS‐4C 0.29 178.7 04Aug2013, 13:50 76.4
GS‐4D 0.13 73.9 04Aug2013, 15:45 31.8
ADD GS‐4D 0.42 243.1 04Aug2013, 15:15 108.1
RT GS‐4D 0.42 243.1 04Aug2013, 15:15 108.1
Davenport Farm Road East 0.42 243.1 04Aug2013, 15:15 108.1
GS‐4E 0.05 55.9 04Aug2013, 14:05 13.3
ADD GS‐4E 2.19 783.4 04Aug2013, 14:20 526.2
RT GS‐4E 2.19 782.8 04Aug2013, 14:30 525
GS‐5A 0.15 80.6 04Aug2013, 15:45 34.6
GS‐5B 0.05 94.4 04Aug2013, 13:25 12.8
ADD GS‐5A‐5B 2.39 852.3 04Aug2013, 14:30 572.4
RT GS‐5A‐5B 2.39 849.1 04Aug2013, 14:35 571.6
GS‐5C 0.04 93.4 04Aug2013, 13:15 11.4
RT GS‐5C 0.04 92.5 04Aug2013, 13:20 11.4
ADD GS‐5C 2.43 861.6 04Aug2013, 14:35 583
RT‐ Gum Swamp 2 2.43 855.4 04Aug2013, 15:55 581
GS‐5D 0.14 94.4 04Aug2013, 15:10 35.1
ADD GS‐5D 2.56 947.2 04Aug2013, 14:55 616.1
RT GS‐5D 2.56 945.7 04Aug2013, 15:10 613.2
GS‐6 0.17 103.6 04Aug2013, 15:10 38.4
D/S Limit GS 2.73 1049.4 04Aug2013, 15:10 651.6
ADD GS to SC 6.27 2789.3 04Aug2013, 15:05 1438.5
RT ‐ Swift Creek 5 6.27 2757.3 04Aug2013, 15:10 1430.9
OUTLET 6.27 2757.3 04Aug2013, 15:10 1430.9
Appendix H

City of Greenville ‐ Swift Creek Watershed Master Plan ‐ HMS Output
Hydrologic ElementDrainage Area
(mi2)
Peak Discharge
(CFS)Time of Peak
Volume
(AC‐FT)
SC‐1C 0.20 174.1 04Aug2013, 15:35 78.3
SC‐1D 0.16 80.4 04Aug2013, 17:20 46
Proposed Swift Det _23 0.36 19.6 05Aug2013, 01:30 12.9
RT SC‐1C‐1D 0.36 19.6 05Aug2013, 01:30 12.8
SC‐1A 0.15 86.5 04Aug2013, 17:20 50
RT SC‐1A 0.15 86.4 04Aug2013, 17:25 49.7
SC‐1B 0.10 131.5 04Aug2013, 14:05 31.3
ADD SC‐1B 0.26 153.3 04Aug2013, 14:10 80.9
SC‐1E 0.17 152.2 04Aug2013, 15:10 57
RT SC‐1E 0.17 151.1 04Aug2013, 15:15 56.7
U/S Limit SC 0.79 263.7 04Aug2013, 14:40 150.4
RT ‐ Swift Creek 1 0.79 262.8 04Aug2013, 15:00 149.5
SC‐2A 0.16 118.6 04Aug2013, 16:10 59.1
SC‐2B 0.09 220 04Aug2013, 13:20 30
ADD SC‐2 1.04 393.5 04Aug2013, 15:30 238.5
SC‐3B 0.10 143 04Aug2013, 13:55 30.5
SC‐3A 0.09 47.5 04Aug2013, 16:20 22.9
ADD SC‐3A‐3B 0.18 156.4 04Aug2013, 13:55 53.4
RT SC‐3A‐3B 0.18 156 04Aug2013, 14:00 53.3
SC‐3C 0.05 92.9 04Aug2013, 13:45 17.5
ADD SC‐3 1.28 563.2 04Aug2013, 13:55 309.3
Thomas Langston ‐ SC 1.28 562.1 04Aug2013, 14:00 308.9
RT ‐ Swift Creek 2 1.28 561.9 04Aug2013, 14:05 307.5
SC‐4 0.17 254.6 04Aug2013, 13:50 50.9
Sterling Trace Drive 1.45 801.7 04Aug2013, 14:00 356.6
RT SC‐4 1.45 717 04Aug2013, 14:25 353.3
SC‐5A 0.04 76.1 04Aug2013, 13:30 11.8
ADD SC‐5A‐5B 1.48 738.5 04Aug2013, 14:20 365.1
SCUT‐1B 0.07 68.8 04Aug2013, 14:40 21.5
SCUT‐1A 0.07 113.5 04Aug2013, 13:50 23.1
ADD SCUT‐1A‐1B 0.15 160.1 04Aug2013, 14:00 44.6
SCUT‐1C 0.05 118.9 04Aug2013, 13:25 17.3
Proposed Swift Det_17 0.20 20.4 04Aug2013, 19:35 18.7
RT SCUT‐1C 0.20 20.4 04Aug2013, 19:45 18.4
SCUT‐1D 0.06 64.4 04Aug2013, 15:00 23.7
Thomas Langston Road ‐ SCUT 0.26 78.6 04Aug2013, 15:10 41.8
RT SCUT‐1D 0.26 78.1 04Aug2013, 15:20 41.7
SCUT‐2 0.05 51.4 04Aug2013, 14:35 16.2
Belfair Drive 0.31 123.3 04Aug2013, 15:00 57.6
RT ‐ UT to Swift Creek 1 0.31 123.3 04Aug2013, 15:00 57.1
SCUT‐3 0.09 147.9 04Aug2013, 13:55 32.4
Sterling Pointe Drive 0.40 229.2 04Aug2013, 14:10 89
RT ‐ UT to Swift Creek 2 0.40 228.8 04Aug2013, 14:10 88.9
SCUT‐4C 0.05 123.7 04Aug2013, 13:30 21.2
SCUT‐4B 0.05 170.8 04Aug2013, 13:10 19.1
SCUT‐4A 0.00 0.1 04Aug2013, 14:30 0
ADD SCUT‐4A‐4B 0.05 170.9 04Aug2013, 13:10 19.1
ADD SCUT‐4C 0.10 250.7 04Aug2013, 13:15 40.3
SCUT‐4D 0.04 114.2 04Aug2013, 13:20 15.2
ADD SCUT‐4D 0.14 359.2 04Aug2013, 13:15 55.4
RT SCUT‐4D 0.14 355.3 04Aug2013, 13:20 55.4
ADD SCUT 4 0.55 438.3 04Aug2013, 13:20 144.3
RT ‐ UT to Swift Creek 3 0.55 431.3 04Aug2013, 13:30 144
SCUT‐5 0.06 125.6 04Aug2013, 13:40 22.7
D/S Limit SCUT 0.61 551.1 04Aug2013, 13:30 166.7
50‐YEAR ALTERNATIVE #2
Appendix H

City of Greenville ‐ Swift Creek Watershed Master Plan ‐ HMS Output
Hydrologic ElementDrainage Area
(mi2)
Peak Discharge
(CFS)Time of Peak
Volume
(AC‐FT)
50‐YEAR ALTERNATIVE #2
SC‐5B 0.08 97.9 04Aug2013, 14:10 24.6
ADD SCUT to SC 2.17 1241.4 04Aug2013, 14:05 556.3
RT ‐ Swift Creek 3 2.17 1162.7 04Aug2013, 14:25 547.6
SC‐6 1.37 1120.5 04Aug2013, 15:15 429.9
ADD SC‐6 3.54 2169.6 04Aug2013, 14:55 977.5
RT ‐ Swift Creek 4 3.54 2133.7 04Aug2013, 15:00 970.9
GS‐2A 0.46 258.6 04Aug2013, 16:50 137.3
GS‐2B 0.07 147.4 04Aug2013, 13:35 24.4
ADD GS‐2A‐2B 0.53 271.7 04Aug2013, 16:45 161.6
RT‐GS‐2A‐2B 0.53 271.5 04Aug2013, 16:50 161.1
GS‐2C 0.06 132.4 04Aug2013, 13:25 17.9
Davenport Farm Road West 0.58 298.6 04Aug2013, 13:30 178.9
RT GS‐2C 0.58 295.1 04Aug2013, 13:35 178.5
U/S Limit GS 0.58 295.1 04Aug2013, 13:35 178.5
GS‐1C 0.50 223.3 04Aug2013, 18:25 141.9
GS‐1B 0.24 130.4 04Aug2013, 17:05 72.1
GS‐1A 0.16 155.2 04Aug2013, 14:35 47.8
ADD GS‐1A‐1B 0.40 220.1 04Aug2013, 15:00 119.9
RT GS‐1A‐1B 0.40 218.8 04Aug2013, 15:20 118.5
GS‐1D 0.10 231 04Aug2013, 13:25 31.2
RT GS‐1D 0.10 221.9 04Aug2013, 13:30 31.1
ADD GS‐1 1.58 681.7 04Aug2013, 17:00 470
GS‐3 0.13 182.3 04Aug2013, 14:00 41.3
ADD GS‐3 1.71 733.9 04Aug2013, 13:40 511.3
Frog Level Road 1.71 708.8 04Aug2013, 17:05 503.3
RT‐ Gum Swamp 1 1.71 707.3 04Aug2013, 17:15 501.8
GS‐4B 0.12 101.4 04Aug2013, 15:10 38
GS‐4A 0.08 155.2 04Aug2013, 13:35 25.3
RT GS‐4A 0.08 151.2 04Aug2013, 13:35 25.3
ADD GS‐4B 0.19 190.1 04Aug2013, 13:40 63.2
RT GS‐4B 0.19 186 04Aug2013, 13:40 63.1
GS‐4C 0.10 83.3 04Aug2013, 15:10 31.1
ADD GS‐4C 0.29 221.3 04Aug2013, 13:45 94.2
RT GS‐4C 0.29 220.3 04Aug2013, 13:50 94.1
GS‐4D 0.13 91.9 04Aug2013, 15:40 39.6
ADD GS‐4D 0.42 299.3 04Aug2013, 15:10 133.7
RT GS‐4D 0.42 299.3 04Aug2013, 15:15 133.7
Davenport Farm Road East 0.42 299.3 04Aug2013, 15:15 133.7
GS‐4E 0.05 69.1 04Aug2013, 14:05 16.5
ADD GS‐4E 2.19 991.6 04Aug2013, 14:10 651.9
RT GS‐4E 2.19 990.9 04Aug2013, 14:20 650.6
GS‐5A 0.15 101 04Aug2013, 15:45 43.4
GS‐5B 0.05 115.4 04Aug2013, 13:20 15.7
ADD GS‐5A‐5B 2.39 1073.2 04Aug2013, 14:25 709.7
RT GS‐5A‐5B 2.39 1067.7 04Aug2013, 14:25 708.8
GS‐5C 0.04 113.7 04Aug2013, 13:15 13.9
RT GS‐5C 0.04 112.9 04Aug2013, 13:20 13.9
ADD GS‐5C 2.43 1084.7 04Aug2013, 14:25 722.7
RT‐ Gum Swamp 2 2.43 1074.3 04Aug2013, 14:35 720.4
GS‐5D 0.14 116 04Aug2013, 15:10 43.4
ADD GS‐5D 2.56 1181.9 04Aug2013, 14:45 763.7
RT GS‐5D 2.56 1179.1 04Aug2013, 14:55 760.4
GS‐6 0.17 129.8 04Aug2013, 15:10 48.2
D/S Limit GS 2.73 1307.9 04Aug2013, 15:05 808.6
ADD GS to SC 6.27 3441.4 04Aug2013, 15:00 1779.4
RT ‐ Swift Creek 5 6.27 3404.6 04Aug2013, 15:05 1770.9
OUTLET 6.27 3404.6 04Aug2013, 15:05 1770.9
Appendix H

City of Greenville ‐ Swift Creek Watershed Master Plan ‐ HMS Output
Hydrologic ElementDrainage Area
(mi2)
Peak Discharge
(CFS)Time of Peak
Volume
(AC‐FT)
SC‐1C 0.20 204.4 04Aug2013, 15:35 92.5
SC‐1D 0.16 97.5 04Aug2013, 17:20 56
Proposed Swift Det _23 0.36 23.4 05Aug2013, 01:30 15.9
RT SC‐1C‐1D 0.36 23.4 05Aug2013, 01:30 15.7
SC‐1A 0.15 103.4 04Aug2013, 17:15 60.1
RT SC‐1A 0.15 103.3 04Aug2013, 17:25 59.7
SC‐1B 0.10 159.8 04Aug2013, 14:05 38.2
ADD SC‐1B 0.26 187.1 04Aug2013, 14:10 97.9
SC‐1E 0.17 183.1 04Aug2013, 15:05 68.9
RT SC‐1E 0.17 181.8 04Aug2013, 15:15 68.6
U/S Limit SC 0.79 320.1 04Aug2013, 14:40 182.3
RT ‐ Swift Creek 1 0.79 318.5 04Aug2013, 14:55 181.1
SC‐2A 0.16 139.9 04Aug2013, 16:10 70.1
SC‐2B 0.09 264.8 04Aug2013, 13:20 36.3
ADD SC‐2 1.04 472.4 04Aug2013, 15:30 287.6
SC‐3B 0.10 173.2 04Aug2013, 13:55 37.2
SC‐3A 0.09 58.8 04Aug2013, 16:15 28.3
ADD SC‐3A‐3B 0.18 190.7 04Aug2013, 13:55 65.5
RT SC‐3A‐3B 0.18 190 04Aug2013, 14:00 65.4
SC‐3C 0.05 112.1 04Aug2013, 13:45 21.3
ADD SC‐3 1.28 683.6 04Aug2013, 13:55 374.2
Thomas Langston ‐ SC 1.28 679.3 04Aug2013, 14:05 373.8
RT ‐ Swift Creek 2 1.28 679.3 04Aug2013, 14:05 372.3
SC‐4 0.17 310 04Aug2013, 13:50 62.3
Sterling Trace Drive 1.45 971.5 04Aug2013, 14:00 432.6
RT SC‐4 1.45 879 04Aug2013, 14:20 428.2
SC‐5A 0.04 91.3 04Aug2013, 13:30 14.3
ADD SC‐5A‐5B 1.48 906.8 04Aug2013, 14:20 442.5
SCUT‐1B 0.07 84.2 04Aug2013, 14:40 26.4
SCUT‐1A 0.07 137 04Aug2013, 13:50 28.1
ADD SCUT‐1A‐1B 0.15 194.6 04Aug2013, 14:00 54.4
SCUT‐1C 0.05 143.9 04Aug2013, 13:25 21.1
Proposed Swift Det_17 0.20 24.3 04Aug2013, 19:35 22.5
RT SCUT‐1C 0.20 24.3 04Aug2013, 19:45 22.2
SCUT‐1D 0.06 76.3 04Aug2013, 15:00 28.2
Thomas Langston Road ‐ SCUT 0.26 94.7 04Aug2013, 15:05 50.2
RT SCUT‐1D 0.26 94 04Aug2013, 15:15 50
SCUT‐2 0.05 61.2 04Aug2013, 14:35 19.4
Belfair Drive 0.31 147.6 04Aug2013, 15:00 69.1
RT ‐ UT to Swift Creek 1 0.31 147.5 04Aug2013, 15:05 68.6
SCUT‐3 0.09 176.5 04Aug2013, 13:55 39
Sterling Pointe Drive 0.40 274.1 04Aug2013, 14:10 107
RT ‐ UT to Swift Creek 2 0.40 273.5 04Aug2013, 14:10 106.8
SCUT‐4C 0.05 145.3 04Aug2013, 13:30 25
SCUT‐4B 0.05 200.4 04Aug2013, 13:10 22.6
SCUT‐4A 0.00 0.1 04Aug2013, 14:30 0
ADD SCUT‐4A‐4B 0.05 200.5 04Aug2013, 13:10 22.6
ADD SCUT‐4C 0.10 294.3 04Aug2013, 13:15 47.6
SCUT‐4D 0.04 135.1 04Aug2013, 13:20 18.1
ADD SCUT‐4D 0.14 422.9 04Aug2013, 13:15 65.7
RT SCUT‐4D 0.14 418.1 04Aug2013, 13:20 65.7
ADD SCUT 4 0.55 520.7 04Aug2013, 13:20 172.6
RT ‐ UT to Swift Creek 3 0.55 514.5 04Aug2013, 13:25 172.2
SCUT‐5 0.06 148.7 04Aug2013, 13:40 27.1
D/S Limit SCUT 0.61 655.5 04Aug2013, 13:30 199.3
100‐YEAR ALTERNATIVE #2
Appendix H

City of Greenville ‐ Swift Creek Watershed Master Plan ‐ HMS Output
Hydrologic ElementDrainage Area
(mi2)
Peak Discharge
(CFS)Time of Peak
Volume
(AC‐FT)
100‐YEAR ALTERNATIVE #2
SC‐5B 0.08 118.3 04Aug2013, 14:10 29.9
ADD SCUT to SC 2.17 1518.1 04Aug2013, 14:05 671.7
RT ‐ Swift Creek 3 2.17 1422.5 04Aug2013, 14:20 661.5
SC‐6 1.37 1355.9 04Aug2013, 15:15 522.5
ADD SC‐6 3.54 2619.7 04Aug2013, 14:50 1184
RT ‐ Swift Creek 4 3.54 2577.3 04Aug2013, 14:55 1176.6
GS‐2A 0.46 313.4 04Aug2013, 16:45 167.1
GS‐2B 0.07 175.2 04Aug2013, 13:35 29.2
ADD GS‐2A‐2B 0.53 328.8 04Aug2013, 16:40 196.3
RT‐GS‐2A‐2B 0.53 328.6 04Aug2013, 16:45 195.8
GS‐2C 0.06 160.4 04Aug2013, 13:25 21.8
Davenport Farm Road West 0.58 365.4 04Aug2013, 13:30 217.6
RT GS‐2C 0.58 361.1 04Aug2013, 13:35 217
U/S Limit GS 0.58 361.1 04Aug2013, 13:35 217
GS‐1C 0.50 270.1 04Aug2013, 18:25 172.5
GS‐1B 0.24 157.6 04Aug2013, 17:05 87.5
GS‐1A 0.16 189.5 04Aug2013, 14:35 58.6
ADD GS‐1A‐1B 0.40 268.8 04Aug2013, 15:00 146.1
RT GS‐1A‐1B 0.40 267.3 04Aug2013, 15:15 144.5
GS‐1D 0.10 279.8 04Aug2013, 13:25 38.1
RT GS‐1D 0.10 269.1 04Aug2013, 13:30 38
ADD GS‐1 1.58 824.9 04Aug2013, 17:00 572
GS‐3 0.13 220.1 04Aug2013, 14:00 50.1
ADD GS‐3 1.71 900 04Aug2013, 13:40 622.1
Frog Level Road 1.71 879.6 04Aug2013, 13:45 612.2
RT‐ Gum Swamp 1 1.71 856.3 04Aug2013, 17:10 610.7
GS‐4B 0.12 121.9 04Aug2013, 15:05 45.9
GS‐4A 0.08 186 04Aug2013, 13:35 30.6
RT GS‐4A 0.08 181.2 04Aug2013, 13:35 30.5
ADD GS‐4B 0.19 229.1 04Aug2013, 13:40 76.5
RT GS‐4B 0.19 224.6 04Aug2013, 13:40 76.4
GS‐4C 0.10 100.8 04Aug2013, 15:10 37.8
ADD GS‐4C 0.29 268 04Aug2013, 13:45 114.1
RT GS‐4C 0.29 266.6 04Aug2013, 13:50 114
GS‐4D 0.13 112 04Aug2013, 15:40 48.4
ADD GS‐4D 0.42 361.8 04Aug2013, 15:10 162.4
RT GS‐4D 0.42 361.7 04Aug2013, 15:10 162.4
Davenport Farm Road East 0.42 361.7 04Aug2013, 15:10 162.4
GS‐4E 0.05 83.7 04Aug2013, 14:05 20
ADD GS‐4E 2.19 1227.5 04Aug2013, 14:05 793.1
RT GS‐4E 2.19 1224.7 04Aug2013, 14:15 791.6
GS‐5A 0.15 123.8 04Aug2013, 15:40 53.3
GS‐5B 0.05 138.9 04Aug2013, 13:20 19
ADD GS‐5A‐5B 2.39 1324.1 04Aug2013, 14:15 863.9
RT GS‐5A‐5B 2.39 1314.3 04Aug2013, 14:15 862.9
GS‐5C 0.04 136 04Aug2013, 13:15 16.8
RT GS‐5C 0.04 133.5 04Aug2013, 13:20 16.8
ADD GS‐5C 2.43 1338.3 04Aug2013, 14:15 879.7
RT‐ Gum Swamp 2 2.43 1320.4 04Aug2013, 14:25 877
GS‐5D 0.14 140 04Aug2013, 15:10 52.6
ADD GS‐5D 2.56 1441.6 04Aug2013, 14:35 929.6
RT GS‐5D 2.56 1437.5 04Aug2013, 14:45 925.8
GS‐6 0.17 159.1 04Aug2013, 15:10 59.2
D/S Limit GS 2.73 1592.9 04Aug2013, 15:00 985
ADD GS to SC 6.27 4170 04Aug2013, 14:55 2161.6
RT ‐ Swift Creek 5 6.27 4128 04Aug2013, 15:05 2152
OUTLET 6.27 4128 04Aug2013, 15:05 2152
Appendix H

PRIMARY SYSTEM
EXISTING CONDITIONS:
HEC‐RAS OUTPUT

HEC-RAS Plan: Swift Cr - Ex River: Swift Creek Reach: Reach-1
Reach River Sta Profile Q Total Min Ch El W.S. Elev Crit W.S. E.G. Elev E.G. Slope Vel Chnl Flow Area Top Width Froude # Chl
(cfs) (ft) (ft) (ft) (ft) (ft/ft) (ft/s) (sq ft) (ft)
Reach-1 234198 2-year 199.00 51.54 55.52 54.10 55.73 0.003004 3.72 55.27 26.55 0.39
Reach-1 234198 10-year 439.00 51.54 56.93 55.26 57.22 0.003002 4.69 251.46 350.92 0.40
Reach-1 234198 25-year 640.00 51.54 57.45 56.25 57.74 0.003001 5.07 451.49 426.51 0.41
Reach-1 234198 50-year 827.00 51.54 57.80 57.22 58.08 0.003001 5.31 606.57 454.27 0.42
Reach-1 234198 100-year 1034.00 51.54 58.14 57.52 58.41 0.003001 5.55 767.97 487.59 0.42
Reach-1 234875 2-year 199.00 52.10 56.86 56.98 0.001227 2.81 103.07 161.15 0.26
Reach-1 234875 10-year 439.00 52.10 58.12 58.19 0.000780 2.69 515.23 443.34 0.22
Reach-1 234875 25-year 640.00 52.10 58.62 58.68 0.000751 2.82 746.49 486.05 0.21
Reach-1 234875 50-year 827.00 52.10 58.98 59.03 0.000772 2.99 931.84 549.63 0.22
Reach-1 234875 100-year 1034.00 52.10 59.31 59.36 0.000765 3.08 1116.59 568.65 0.22
Reach-1 235139 2-year 199.00 51.75 57.14 53.74 57.20 0.000545 1.97 112.83 145.26 0.18
Reach-1 235139 10-year 439.00 51.75 58.31 54.90 58.36 0.000567 2.24 499.97 474.06 0.18
Reach-1 235139 25-year 640.00 51.75 58.80 55.66 58.84 0.000548 2.35 740.43 512.36 0.18
Reach-1 235139 50-year 827.00 51.75 59.16 56.28 59.20 0.000546 2.45 930.19 547.16 0.18
Reach-1 235139 100-year 1034.00 51.75 59.48 57.96 59.53 0.000559 2.58 1115.40 584.92 0.19
Reach-1 235165 Bridge
Reach-1 235183 2-year 199.00 51.76 57.45 53.84 57.48 0.000310 1.56 127.96 159.25 0.14
Reach-1 235183 10-year 439.00 51.76 59.39 54.92 59.41 0.000138 1.28 883.63 480.04 0.10
Reach-1 235183 25-year 640.00 51.76 59.76 55.60 59.78 0.000201 1.62 1070.52 546.71 0.12
Reach-1 235183 50-year 827.00 51.76 59.96 56.14 59.99 0.000268 1.92 1182.98 551.34 0.14
Reach-1 235183 100-year 1034.00 51.76 60.13 56.64 60.17 0.000351 2.24 1278.79 555.42 0.16
Reach-1 235196 2-year 199.00 52.47 57.43 54.93 57.51 0.000992 2.33 85.51 401.55 0.23
Reach-1 235196 10-year 439.00 52.47 59.39 56.11 59.41 0.000259 1.60 644.79 598.98 0.13
Reach-1 235196 25-year 640.00 52.47 59.79 56.83 59.80 0.000064 0.84 2010.71 603.93 0.06
Reach-1 235196 50-year 827.00 52.47 60.01 57.35 60.01 0.000089 1.01 2142.30 606.30 0.08
Reach-1 235196 100-year 1034.00 52.47 60.20 57.86 60.20 0.000118 1.19 2256.83 608.36 0.09
Reach-1 235219 Culvert
Reach-1 235247 2-year 199.00 53.17 58.50 56.02 58.56 0.000696 1.92 108.02 418.79 0.21
Reach-1 235247 10-year 439.00 53.17 59.52 57.09 59.56 0.000507 1.96 528.54 508.86 0.18
Reach-1 235247 25-year 640.00 53.17 59.85 57.73 59.87 0.000328 1.66 1023.86 525.28 0.15
Reach-1 235247 50-year 827.00 53.17 60.07 58.30 60.09 0.000413 1.92 1137.09 536.71 0.16
1

HEC-RAS Plan: Swift Cr - Ex River: Swift Creek Reach: Reach-1 (Continued)
Reach River Sta Profile Q Total Min Ch El W.S. Elev Crit W.S. E.G. Elev E.G. Slope Vel Chnl Flow Area Top Width Froude # Chl
(cfs) (ft) (ft) (ft) (ft) (ft/ft) (ft/s) (sq ft) (ft)
Reach-1 235247 100-year 1034.00 53.17 60.26 58.80 60.29 0.000506 2.19 1244.71 551.80 0.18
Reach-1 235428 2-year 189.00 53.13 58.62 55.76 58.65 0.000368 1.65 312.40 260.75 0.15
Reach-1 235428 10-year 416.00 53.13 59.60 56.96 59.65 0.000512 2.27 592.58 313.11 0.18
Reach-1 235428 25-year 628.00 53.13 59.89 58.14 59.97 0.000846 3.03 685.95 324.53 0.24
Reach-1 235428 50-year 805.00 53.13 60.11 58.48 60.22 0.001101 3.56 758.57 332.57 0.27
Reach-1 235428 100-year 993.00 53.13 60.32 58.73 60.45 0.001361 4.06 828.02 358.48 0.30
Reach-1 235914 2-year 189.00 53.95 58.86 58.97 0.001184 2.65 111.95 132.14 0.25
Reach-1 235914 10-year 416.00 53.95 59.92 60.05 0.001342 3.38 326.22 242.74 0.28
Reach-1 235914 25-year 628.00 53.95 60.39 60.56 0.001699 4.06 447.96 277.65 0.32
Reach-1 235914 50-year 805.00 53.95 60.73 60.91 0.001846 4.43 547.06 297.19 0.34
Reach-1 235914 100-year 993.00 53.95 61.05 61.24 0.001942 4.73 643.33 306.94 0.35
Reach-1 236412 2-year 189.00 54.78 59.40 59.46 0.000779 2.10 199.56 247.21 0.21
Reach-1 236412 10-year 416.00 54.78 60.48 60.52 0.000628 2.25 543.11 375.31 0.19
Reach-1 236412 25-year 628.00 54.78 61.05 61.10 0.000656 2.51 776.49 431.29 0.20
Reach-1 236412 50-year 805.00 54.78 61.44 61.49 0.000687 2.70 950.68 465.97 0.21
Reach-1 236412 100-year 993.00 54.78 61.79 61.84 0.000699 2.85 1115.42 482.33 0.21
Reach-1 236856 2-year 189.00 54.38 59.81 57.31 59.93 0.001425 2.82 87.16 100.28 0.27
Reach-1 236856 10-year 416.00 54.38 60.82 58.66 61.01 0.001981 3.85 254.71 213.47 0.33
Reach-1 236856 25-year 628.00 54.38 61.41 60.23 61.61 0.002136 4.36 392.78 255.47 0.35
Reach-1 236856 50-year 805.00 54.38 61.81 60.68 62.02 0.002186 4.66 503.70 304.05 0.36
Reach-1 236856 100-year 993.00 54.38 62.16 61.07 62.38 0.002259 4.94 617.96 351.59 0.37
Reach-1 237179 2-year 189.00 55.37 60.27 60.38 0.001414 2.81 82.12 95.95 0.27
Reach-1 237179 10-year 416.00 55.37 61.42 61.57 0.001570 3.51 284.69 221.76 0.30
Reach-1 237179 25-year 628.00 55.37 62.04 62.20 0.001643 3.92 427.14 238.12 0.31
Reach-1 237179 50-year 805.00 55.37 62.45 62.62 0.001712 4.23 527.63 249.00 0.32
Reach-1 237179 100-year 993.00 55.37 62.82 63.00 0.001797 4.53 621.55 258.76 0.33
Reach-1 237456 2-year 189.00 55.98 60.68 58.47 60.78 0.001408 2.65 92.49 171.09 0.27
Reach-1 237456 10-year 416.00 55.98 61.87 59.71 61.98 0.001322 3.04 289.24 295.71 0.28
Reach-1 237456 25-year 628.00 55.98 62.51 61.01 62.62 0.001358 3.42 412.70 330.60 0.29
Reach-1 237456 50-year 805.00 55.98 62.91 61.44 62.98 0.000966 3.05 791.98 351.37 0.25
Reach-1 237456 100-year 993.00 55.98 63.29 61.68 63.37 0.000971 3.22 930.10 360.61 0.25
2

HEC-RAS Plan: Swift Cr - Ex River: Swift Creek Reach: Reach-1 (Continued)
Reach River Sta Profile Q Total Min Ch El W.S. Elev Crit W.S. E.G. Elev E.G. Slope Vel Chnl Flow Area Top Width Froude # Chl
(cfs) (ft) (ft) (ft) (ft) (ft/ft) (ft/s) (sq ft) (ft)
Reach-1 237708 2-year 189.00 56.29 61.02 58.87 61.12 0.001240 2.51 101.50 154.22 0.26
Reach-1 237708 10-year 416.00 56.29 62.22 60.03 62.31 0.001072 2.85 475.08 423.98 0.26
Reach-1 237708 25-year 628.00 56.29 62.87 61.09 62.96 0.000953 2.99 759.66 468.11 0.25
Reach-1 237708 50-year 805.00 56.29 63.18 61.77 63.27 0.001072 3.31 897.11 488.20 0.27
Reach-1 237708 100-year 993.00 56.29 63.57 61.87 63.66 0.001047 3.45 1074.57 504.37 0.27
Reach-1 237781 Culvert
Reach-1 237845 2-year 189.00 56.31 62.28 59.03 62.33 0.000476 1.84 151.77 363.88 0.16
Reach-1 237845 10-year 416.00 56.31 63.25 60.28 63.29 0.000390 1.93 685.43 441.57 0.15
Reach-1 237845 25-year 628.00 56.31 63.57 61.18 63.60 0.000464 2.19 985.44 487.13 0.17
Reach-1 237845 50-year 805.00 56.31 63.80 61.70 63.84 0.000615 2.60 1066.15 521.14 0.20
Reach-1 237845 100-year 993.00 56.31 63.95 62.23 64.02 0.000813 3.05 1121.49 535.30 0.23
Reach-1 238094 2-year 173.00 56.52 62.41 59.10 62.47 0.000700 2.08 107.60 286.72 0.19
Reach-1 238094 10-year 358.00 56.52 63.35 60.27 63.46 0.001055 2.90 302.50 490.86 0.24
Reach-1 238094 25-year 496.00 56.52 63.68 60.93 63.82 0.001364 3.44 392.41 545.07 0.27
Reach-1 238094 50-year 620.00 56.52 63.94 61.45 64.10 0.001553 3.80 466.84 555.52 0.30
Reach-1 238094 100-year 754.00 56.52 64.15 62.20 64.34 0.001824 4.23 524.10 563.53 0.32
Reach-1 238526 2-year 173.00 56.20 62.57 57.78 62.59 0.000133 1.13 164.38 62.57 0.09
Reach-1 238526 10-year 358.00 56.20 63.63 58.64 63.68 0.000285 1.86 241.92 170.48 0.14
Reach-1 238526 25-year 496.00 56.20 64.05 59.17 64.13 0.000414 2.35 304.67 227.24 0.17
Reach-1 238526 50-year 620.00 56.20 64.37 59.58 64.48 0.000517 2.72 363.83 247.32 0.19
Reach-1 238526 100-year 754.00 56.20 64.66 59.99 64.79 0.000634 3.10 419.01 277.99 0.21
Reach-1 238936 2-year 173.00 56.88 62.63 58.64 62.65 0.000163 1.15 150.54 37.22 0.10
Reach-1 238936 10-year 358.00 56.88 63.76 59.39 63.81 0.000333 1.84 195.27 44.47 0.15
Reach-1 238936 25-year 496.00 56.88 64.23 59.85 64.31 0.000480 2.32 217.43 50.28 0.18
Reach-1 238936 50-year 620.00 56.88 64.60 60.22 64.71 0.000602 2.71 236.83 54.78 0.20
Reach-1 238936 100-year 754.00 56.88 64.92 60.59 65.07 0.000732 3.10 255.50 58.64 0.23
Reach-1 239177 2-year 173.00 57.85 62.62 60.74 62.80 0.002494 3.39 50.97 17.72 0.35
Reach-1 239177 10-year 358.00 57.85 63.72 61.96 64.11 0.004197 4.96 72.21 20.79 0.47
Reach-1 239177 25-year 496.00 57.85 64.16 62.65 64.74 0.005811 6.08 81.60 40.19 0.56
Reach-1 239177 50-year 620.00 57.85 64.50 63.18 65.25 0.007164 6.95 90.12 84.64 0.62
Reach-1 239177 100-year 754.00 57.85 64.79 63.69 65.73 0.008623 7.82 104.92 135.47 0.69
3

HEC-RAS Plan: Swift Cr - Ex River: Swift Creek Reach: Reach-1 (Continued)
Reach River Sta Profile Q Total Min Ch El W.S. Elev Crit W.S. E.G. Elev E.G. Slope Vel Chnl Flow Area Top Width Froude # Chl
(cfs) (ft) (ft) (ft) (ft) (ft/ft) (ft/s) (sq ft) (ft)
Reach-1 239470 2-year 173.00 57.77 63.02 59.59 63.06 0.000359 1.62 106.73 27.00 0.14
Reach-1 239470 10-year 358.00 57.77 64.48 60.45 64.57 0.000611 2.42 148.24 30.02 0.19
Reach-1 239470 25-year 496.00 57.77 65.23 60.97 65.36 0.000783 2.89 171.44 31.59 0.22
Reach-1 239470 50-year 620.00 57.77 65.84 61.40 66.00 0.000900 3.25 192.27 45.04 0.24
Reach-1 239470 100-year 754.00 57.77 66.41 61.82 66.61 0.000988 3.57 222.61 62.59 0.25
Reach-1 239543 Culvert
Reach-1 239601 2-year 173.00 57.56 64.13 59.56 64.16 0.000210 1.35 127.92 27.66 0.11
Reach-1 239601 10-year 358.00 57.56 67.61 60.51 67.63 0.000097 1.24 485.36 329.39 0.08
Reach-1 239601 25-year 496.00 57.56 68.16 61.08 68.19 0.000124 1.48 600.82 387.08 0.09
Reach-1 239601 50-year 620.00 57.56 68.43 61.54 68.47 0.000160 1.71 657.64 411.02 0.11
Reach-1 239601 100-year 754.00 57.56 68.65 61.99 68.69 0.000200 1.95 749.64 429.43 0.12
Reach-1 239904 2-year 152.00 58.41 64.22 60.78 64.28 0.000698 1.95 77.79 23.70 0.19
Reach-1 239904 10-year 311.00 58.41 67.65 61.91 67.68 0.000241 1.46 361.74 306.27 0.11
Reach-1 239904 25-year 429.00 58.41 68.21 62.61 68.24 0.000247 1.57 529.08 348.54 0.12
Reach-1 239904 50-year 534.00 58.41 68.49 63.16 68.53 0.000281 1.73 622.57 372.44 0.13
Reach-1 239904 100-year 650.00 58.41 68.73 63.66 68.77 0.000313 1.87 748.49 392.22 0.13
Reach-1 240316 2-year 152.00 59.47 64.64 64.83 0.002715 3.49 43.52 14.20 0.35
Reach-1 240316 10-year 311.00 59.47 67.78 67.86 0.000775 2.46 241.46 187.63 0.20
Reach-1 240316 25-year 429.00 59.47 68.35 68.42 0.000755 2.57 366.95 255.90 0.20
Reach-1 240316 50-year 534.00 59.47 68.65 68.72 0.000812 2.74 449.89 287.95 0.21
Reach-1 240316 100-year 650.00 59.47 68.90 68.98 0.000886 2.96 525.00 308.11 0.22
Reach-1 240800 2-year 152.00 60.78 65.71 65.83 0.001624 2.80 54.32 18.24 0.29
Reach-1 240800 10-year 311.00 60.78 68.15 68.23 0.000769 2.52 181.77 133.85 0.21
Reach-1 240800 25-year 429.00 60.78 68.71 68.81 0.000845 2.81 274.10 191.48 0.22
Reach-1 240800 50-year 534.00 60.78 69.05 69.16 0.000936 3.05 343.46 224.07 0.23
Reach-1 240800 100-year 650.00 60.78 69.34 69.46 0.001061 3.34 414.47 263.01 0.25
Reach-1 241107 2-year 152.00 61.47 66.28 66.44 0.002369 3.20 48.07 22.36 0.34
Reach-1 241107 10-year 311.00 61.47 68.42 68.51 0.001096 2.71 205.50 160.86 0.24
Reach-1 241107 25-year 429.00 61.47 69.01 69.10 0.001024 2.79 318.43 221.31 0.24
Reach-1 241107 50-year 534.00 61.47 69.37 69.46 0.001021 2.91 404.63 257.16 0.24
Reach-1 241107 100-year 650.00 61.47 69.70 69.79 0.001024 3.02 494.68 289.92 0.24
4

HEC-RAS Plan: Swift Cr - Ex River: Swift Creek Reach: Reach-1 (Continued)
Reach River Sta Profile Q Total Min Ch El W.S. Elev Crit W.S. E.G. Elev E.G. Slope Vel Chnl Flow Area Top Width Froude # Chl
(cfs) (ft) (ft) (ft) (ft) (ft/ft) (ft/s) (sq ft) (ft)
Reach-1 241592 2-year 122.00 62.40 67.11 67.18 0.000964 2.14 57.01 20.07 0.22
Reach-1 241592 10-year 249.00 62.40 68.90 68.99 0.000861 2.44 126.89 93.05 0.22
Reach-1 241592 25-year 342.00 62.40 69.47 69.57 0.000910 2.70 193.14 139.27 0.23
Reach-1 241592 50-year 426.00 62.40 69.84 69.95 0.000970 2.91 249.81 170.74 0.24
Reach-1 241592 100-year 520.00 62.40 70.17 70.29 0.001020 3.09 320.12 240.16 0.25
Reach-1 241994 2-year 122.00 63.58 67.52 67.60 0.001130 2.23 54.61 20.44 0.24
Reach-1 241994 10-year 249.00 63.58 69.26 69.36 0.000959 2.51 121.75 72.67 0.23
Reach-1 241994 25-year 342.00 63.58 69.86 69.96 0.001026 2.78 172.06 96.15 0.24
Reach-1 241994 50-year 426.00 63.58 70.25 70.37 0.001109 3.04 235.20 227.67 0.26
Reach-1 241994 100-year 520.00 63.58 70.60 70.72 0.001100 3.15 329.00 307.38 0.26
5

HEC-RAS Plan: Gum Swamp - Ex River: Gum Swamp Reach: Reach - 1
Reach River Sta Profile Q Total Min Ch El W.S. Elev Crit W.S. E.G. Elev E.G. Slope Vel Chnl Flow Area Top Width Froude # Chl
(cfs) (ft) (ft) (ft) (ft) (ft/ft) (ft/s) (sq ft) (ft)
Reach - 1 663.5 2-Year 305.00 46.81 52.94 50.33 53.35 0.002603 5.28 74.92 19.31 0.38
Reach - 1 663.5 10-Year 636.00 46.81 54.83 52.37 55.28 0.002605 6.35 347.35 294.78 0.40
Reach - 1 663.5 25-Year 894.00 46.81 55.40 54.72 55.80 0.002603 6.66 525.41 326.04 0.41
Reach - 1 663.5 50-Year 1123.00 46.81 55.81 55.25 56.18 0.002603 6.87 662.90 345.86 0.41
Reach - 1 663.5 100-Year 1382.00 46.81 56.23 55.51 56.57 0.002602 7.09 812.67 380.08 0.41
Reach - 1 1000.0 2-Year 305.00 46.98 53.77 53.93 0.001144 3.75 178.58 132.52 0.26
Reach - 1 1000.0 10-Year 636.00 46.98 55.65 55.74 0.000726 3.54 733.28 376.36 0.21
Reach - 1 1000.0 25-Year 894.00 46.98 56.19 56.28 0.000817 3.91 943.83 398.26 0.23
Reach - 1 1000.0 50-Year 1123.00 46.98 56.59 56.68 0.000887 4.20 1105.20 414.26 0.24
Reach - 1 1000.0 100-Year 1382.00 46.98 57.00 57.09 0.000943 4.45 1276.52 430.60 0.25
Reach - 1 1500.0 2-Year 305.00 47.40 54.34 54.60 0.001455 4.31 111.15 57.17 0.29
Reach - 1 1500.0 10-Year 636.00 47.40 56.03 56.32 0.001669 5.36 432.29 365.66 0.33
Reach - 1 1500.0 25-Year 894.00 47.40 56.64 56.91 0.001737 5.73 703.17 519.15 0.34
Reach - 1 1500.0 50-Year 1123.00 47.40 57.08 57.31 0.001609 5.69 938.25 543.71 0.33
Reach - 1 1500.0 100-Year 1382.00 47.40 57.51 57.70 0.001461 5.59 1178.37 566.96 0.31
Reach - 1 2000.0 2-Year 305.00 47.83 55.08 55.36 0.001562 4.37 98.35 25.33 0.29
Reach - 1 2000.0 10-Year 636.00 47.83 56.87 57.17 0.001705 5.31 499.46 398.28 0.32
Reach - 1 2000.0 25-Year 894.00 47.83 57.51 57.75 0.001601 5.40 761.52 420.53 0.31
Reach - 1 2000.0 50-Year 1123.00 47.83 57.90 58.14 0.001704 5.72 930.59 452.15 0.32
Reach - 1 2000.0 100-Year 1382.00 47.83 58.28 58.51 0.001756 5.95 1105.21 463.93 0.33
Reach - 1 2535.0 2-Year 305.00 48.54 55.91 56.16 0.001414 4.21 116.87 62.82 0.28
Reach - 1 2535.0 10-Year 636.00 48.54 57.75 57.93 0.001183 4.48 635.37 423.94 0.26
Reach - 1 2535.0 25-Year 894.00 48.54 58.34 58.52 0.001264 4.83 918.93 512.41 0.28
Reach - 1 2535.0 50-Year 1123.00 48.54 58.76 58.92 0.001235 4.92 1136.53 519.70 0.27
Reach - 1 2535.0 100-Year 1382.00 48.54 59.16 59.31 0.001248 5.07 1345.45 530.94 0.28
Reach - 1 3000.0 2-Year 265.00 48.92 56.54 56.75 0.001143 3.83 118.68 99.80 0.25
Reach - 1 3000.0 10-Year 560.00 48.92 58.29 58.49 0.001183 4.49 500.61 356.36 0.26
Reach - 1 3000.0 25-Year 800.00 48.92 58.92 59.13 0.001342 5.00 756.81 466.31 0.28
Reach - 1 3000.0 50-Year 1016.00 48.92 59.34 59.54 0.001399 5.26 971.28 565.92 0.29
Reach - 1 3000.0 100-Year 1264.00 48.92 59.75 59.93 0.001390 5.38 1206.30 580.20 0.29
Reach - 1 3500.0 2-Year 265.00 49.52 57.12 57.28 0.000951 3.49 152.01 116.26 0.23
Reach - 1 3500.0 10-Year 560.00 49.52 58.87 59.00 0.000858 3.82 695.10 443.05 0.22
1

HEC-RAS Plan: Gum Swamp - Ex River: Gum Swamp Reach: Reach - 1 (Continued)
Reach River Sta Profile Q Total Min Ch El W.S. Elev Crit W.S. E.G. Elev E.G. Slope Vel Chnl Flow Area Top Width Froude # Chl
(cfs) (ft) (ft) (ft) (ft) (ft/ft) (ft/s) (sq ft) (ft)
Reach - 1 3500.0 25-Year 800.00 49.52 59.56 59.66 0.000829 3.94 1021.54 506.76 0.22
Reach - 1 3500.0 50-Year 1016.00 49.52 59.99 60.09 0.000861 4.14 1248.84 541.91 0.23
Reach - 1 3500.0 100-Year 1264.00 49.52 60.39 60.49 0.000907 4.36 1472.50 570.59 0.24
Reach - 1 4000.0 2-Year 265.00 50.17 57.61 57.82 0.001174 3.82 107.13 29.69 0.25
Reach - 1 4000.0 10-Year 560.00 50.17 59.31 55.49 59.70 0.001973 5.70 306.63 277.80 0.34
Reach - 1 4000.0 25-Year 800.00 50.17 59.98 60.39 0.002209 6.34 536.47 382.54 0.36
Reach - 1 4000.0 50-Year 1016.00 50.17 60.45 60.81 0.002158 6.47 727.04 423.70 0.36
Reach - 1 4000.0 100-Year 1264.00 50.17 60.90 61.22 0.002118 6.59 921.06 451.42 0.36
Reach - 1 4500.0 2-Year 265.00 51.25 58.25 58.49 0.001488 4.12 98.06 29.00 0.28
Reach - 1 4500.0 10-Year 560.00 51.25 60.30 60.51 0.001291 4.59 464.72 261.52 0.27
Reach - 1 4500.0 25-Year 800.00 51.25 61.06 61.25 0.001307 4.87 675.59 309.14 0.28
Reach - 1 4500.0 50-Year 1016.00 51.25 61.51 61.71 0.001465 5.32 828.44 363.60 0.30
Reach - 1 4500.0 100-Year 1264.00 51.25 61.93 62.14 0.001577 5.67 989.00 394.19 0.31
Reach - 1 5000.0 2-Year 243.00 51.44 58.92 59.07 0.000877 3.31 141.64 66.00 0.22
Reach - 1 5000.0 10-Year 512.00 51.44 60.90 61.01 0.000772 3.65 596.29 333.88 0.21
Reach - 1 5000.0 25-Year 736.00 51.44 61.65 61.75 0.000767 3.84 867.47 377.71 0.21
Reach - 1 5000.0 50-Year 939.00 51.44 62.15 62.25 0.000786 4.01 1061.30 391.49 0.22
Reach - 1 5000.0 100-Year 1172.00 51.44 62.61 62.71 0.000831 4.25 1245.70 404.16 0.23
Reach - 1 5500.0 2-Year 243.00 52.17 59.39 59.55 0.001041 3.44 119.98 31.56 0.23
Reach - 1 5500.0 10-Year 512.00 52.17 61.30 61.63 0.001706 5.18 351.66 325.10 0.31
Reach - 1 5500.0 25-Year 736.00 52.17 62.07 62.34 0.001608 5.31 621.76 377.29 0.30
Reach - 1 5500.0 50-Year 939.00 52.17 62.59 62.83 0.001560 5.42 827.87 410.28 0.30
Reach - 1 5500.0 100-Year 1172.00 52.17 63.09 63.30 0.001539 5.56 1037.88 441.37 0.30
Reach - 1 6000.0 2-Year 243.00 52.71 59.93 60.08 0.001090 3.47 132.51 35.29 0.23
Reach - 1 6000.0 10-Year 512.00 52.71 62.16 62.32 0.001088 4.17 564.67 384.75 0.24
Reach - 1 6000.0 25-Year 736.00 52.71 62.85 62.98 0.001027 4.26 851.28 421.72 0.24
Reach - 1 6000.0 50-Year 939.00 52.71 63.35 63.46 0.001017 4.38 1062.02 436.44 0.24
Reach - 1 6000.0 100-Year 1172.00 52.71 63.83 63.95 0.001089 4.67 1288.76 492.35 0.25
Reach - 1 6400 2-Year 243.00 55.71 60.55 60.72 0.002542 3.37 72.00 21.91 0.33
Reach - 1 6400 10-Year 512.00 55.71 62.54 62.58 0.000426 1.75 386.70 553.23 0.14
Reach - 1 6400 25-Year 736.00 55.71 63.09 63.12 0.000148 1.11 705.42 605.10 0.09
Reach - 1 6400 50-Year 939.00 55.71 63.53 63.55 0.000084 0.88 971.80 615.52 0.07
2

HEC-RAS Plan: Gum Swamp - Ex River: Gum Swamp Reach: Reach - 1 (Continued)
Reach River Sta Profile Q Total Min Ch El W.S. Elev Crit W.S. E.G. Elev E.G. Slope Vel Chnl Flow Area Top Width Froude # Chl
(cfs) (ft) (ft) (ft) (ft) (ft/ft) (ft/s) (sq ft) (ft)
Reach - 1 6400 100-Year 1172.00 55.71 64.00 64.02 0.000055 0.75 1269.24 672.05 0.05
Reach - 1 6909 2-Year 172.00 55.80 61.58 61.66 0.001224 2.30 74.69 23.79 0.23
Reach - 1 6909 10-Year 368.00 55.80 62.83 62.94 0.001410 2.88 307.93 331.69 0.25
Reach - 1 6909 25-Year 513.00 55.80 63.17 63.30 0.001696 3.28 427.19 355.72 0.28
Reach - 1 6909 50-Year 660.00 55.80 63.55 63.67 0.001694 3.42 566.52 375.81 0.29
Reach - 1 6909 100-Year 825.00 55.80 64.00 64.11 0.001523 3.40 744.49 415.44 0.27
Reach - 1 7470 2-Year 172.00 56.41 62.26 62.34 0.001209 2.29 75.25 23.94 0.23
Reach - 1 7470 10-Year 368.00 56.41 63.64 63.76 0.001516 2.98 245.90 291.97 0.26
Reach - 1 7470 25-Year 513.00 56.41 64.11 64.24 0.001659 3.30 405.41 399.97 0.28
Reach - 1 7470 50-Year 660.00 56.41 64.49 64.62 0.001660 3.45 565.55 441.48 0.28
Reach - 1 7470 100-Year 825.00 56.41 64.87 64.99 0.001609 3.54 741.95 481.19 0.28
Reach - 1 7628 2-Year 172.00 56.38 62.45 59.63 62.53 0.001148 2.25 76.43 23.71 0.22
Reach - 1 7628 10-Year 368.00 56.38 63.87 60.82 64.03 0.001651 3.20 131.01 78.43 0.28
Reach - 1 7628 25-Year 513.00 56.38 64.36 61.48 64.55 0.001951 3.69 255.21 338.76 0.30
Reach - 1 7628 50-Year 660.00 56.38 64.74 62.04 64.93 0.001939 3.84 396.16 396.78 0.31
Reach - 1 7628 100-Year 825.00 56.38 65.12 62.60 65.28 0.001803 3.89 553.09 443.08 0.30
Reach - 1 7705 Culvert
Reach - 1 7759 2-Year 172.00 56.45 62.70 59.55 62.77 0.000904 2.06 83.53 24.83 0.20
Reach - 1 7759 10-Year 368.00 56.45 64.96 60.77 65.05 0.000734 2.43 175.27 410.72 0.19
Reach - 1 7759 25-Year 513.00 56.45 65.31 61.43 65.37 0.000599 2.27 600.74 534.81 0.17
Reach - 1 7759 50-Year 660.00 56.45 65.46 62.00 65.54 0.000810 2.69 684.15 568.71 0.20
Reach - 1 7759 100-Year 825.00 56.45 65.63 62.56 65.72 0.001011 3.07 783.57 606.66 0.23
Reach - 1 7930 2-Year 166.00 57.33 62.87 62.95 0.001220 2.31 71.90 22.35 0.23
Reach - 1 7930 10-Year 352.00 57.33 65.12 65.17 0.000562 2.01 432.92 428.13 0.16
Reach - 1 7930 25-Year 491.00 57.33 65.42 65.48 0.000716 2.34 571.83 498.62 0.18
Reach - 1 7930 50-Year 616.00 57.33 65.62 65.68 0.000863 2.63 672.72 549.56 0.20
Reach - 1 7930 100-Year 756.00 57.33 65.82 65.90 0.000975 2.87 793.15 604.25 0.22
Reach - 1 8400 2-Year 166.00 57.72 63.53 63.63 0.001682 2.57 64.58 21.24 0.26
Reach - 1 8400 10-Year 352.00 57.72 65.43 65.48 0.000775 2.21 383.91 369.05 0.19
Reach - 1 8400 25-Year 491.00 57.72 65.79 65.85 0.000874 2.47 528.94 425.30 0.20
Reach - 1 8400 50-Year 616.00 57.72 66.05 66.11 0.000946 2.67 639.28 440.02 0.21
3

HEC-RAS Plan: Gum Swamp - Ex River: Gum Swamp Reach: Reach - 1 (Continued)
Reach River Sta Profile Q Total Min Ch El W.S. Elev Crit W.S. E.G. Elev E.G. Slope Vel Chnl Flow Area Top Width Froude # Chl
(cfs) (ft) (ft) (ft) (ft) (ft/ft) (ft/s) (sq ft) (ft)
Reach - 1 8400 100-Year 756.00 57.72 66.30 66.36 0.000995 2.83 751.88 449.17 0.22
Reach - 1 8872 2-Year 166.00 59.13 64.00 64.04 0.000524 1.64 101.30 28.67 0.15
Reach - 1 8872 10-Year 352.00 59.13 65.75 65.83 0.000682 2.27 155.85 35.28 0.18
Reach - 1 8872 25-Year 491.00 59.13 66.18 66.31 0.000987 2.86 220.02 309.82 0.22
Reach - 1 8872 50-Year 616.00 59.13 66.48 66.63 0.001175 3.22 315.01 327.94 0.24
Reach - 1 8872 100-Year 756.00 59.13 66.76 66.93 0.001324 3.51 412.42 362.93 0.26
Reach - 1 9293 2-Year 76.00 60.27 64.28 64.42 0.003963 3.01 25.28 11.93 0.36
Reach - 1 9293 10-Year 160.00 60.27 66.11 63.85 66.24 0.002446 3.01 79.66 287.45 0.30
Reach - 1 9293 25-Year 223.00 60.27 66.70 66.76 0.001217 2.31 282.59 397.26 0.22
Reach - 1 9293 50-Year 280.00 60.27 67.05 67.08 0.000833 1.99 431.36 455.96 0.18
Reach - 1 9293 100-Year 345.00 60.27 67.35 67.37 0.000630 1.79 575.93 505.41 0.16
4

HEC-RAS Plan: SCUT1 - Ex River: Swift Creek UT1 Reach: Reach1
Reach River Sta Profile Q Total Min Ch El W.S. Elev Crit W.S. E.G. Elev E.G. Slope Vel Chnl Flow Area Top Width Froude # Chl
(cfs) (ft) (ft) (ft) (ft) (ft/ft) (ft/s) (sq ft) (ft)
Reach1 231 2-Year 158.00 53.45 57.01 55.90 57.24 0.004002 3.84 41.09 17.71 0.44
Reach1 231 10-Year 304.00 53.45 58.20 56.74 58.52 0.004002 4.61 89.04 152.97 0.46
Reach1 231 25-Year 411.00 53.45 58.60 57.26 58.91 0.004004 4.84 155.90 188.62 0.46
Reach1 231 50-Year 505.00 53.45 58.85 57.67 59.15 0.004001 4.98 207.04 211.87 0.46
Reach1 231 100-Year 647.00 53.45 59.16 58.76 59.45 0.004001 5.14 277.71 240.33 0.47
Reach1 584 2-Year 158.00 53.78 58.02 58.14 0.001728 2.82 57.32 95.29 0.30
Reach1 584 10-Year 304.00 53.78 59.19 59.28 0.001280 2.83 197.55 146.73 0.27
Reach1 584 25-Year 411.00 53.78 59.59 59.69 0.001379 3.06 260.97 165.56 0.28
Reach1 584 50-Year 505.00 53.78 59.86 59.97 0.001493 3.28 307.32 177.90 0.29
Reach1 584 100-Year 647.00 53.78 60.19 60.31 0.001635 3.58 367.58 188.43 0.31
Reach1 1005 2-Year 158.00 54.86 58.74 58.80 0.001383 2.27 132.31 147.97 0.27
Reach1 1005 10-Year 304.00 54.86 59.69 59.73 0.000874 2.09 290.00 180.30 0.22
Reach1 1005 25-Year 411.00 54.86 60.11 60.15 0.000848 2.22 367.02 188.38 0.22
Reach1 1005 50-Year 505.00 54.86 60.41 60.45 0.000865 2.35 423.61 194.10 0.22
Reach1 1005 100-Year 647.00 54.86 60.78 60.83 0.000928 2.58 497.98 205.90 0.24
Reach1 1429 2-Year 123.00 54.48 59.33 59.43 0.001570 2.55 48.32 18.82 0.28
Reach1 1429 10-Year 239.00 54.48 60.14 60.35 0.002713 3.69 64.70 21.65 0.38
Reach1 1429 25-Year 315.00 54.48 60.52 60.81 0.003369 4.29 73.35 23.01 0.42
Reach1 1429 50-Year 412.00 54.48 60.81 61.22 0.004566 5.15 80.02 24.01 0.50
Reach1 1429 100-Year 514.00 54.48 61.17 61.69 0.005366 5.78 88.90 25.27 0.54
Reach1 1546 2-Year 123.00 55.52 59.53 58.04 59.65 0.002208 2.77 44.38 20.64 0.33
Reach1 1546 10-Year 239.00 55.52 60.47 58.86 60.68 0.002899 3.63 65.81 24.96 0.39
Reach1 1546 25-Year 315.00 55.52 60.95 59.27 61.20 0.003168 4.03 78.24 27.15 0.42
Reach1 1546 50-Year 412.00 55.52 61.40 59.73 61.72 0.003620 4.53 90.98 29.23 0.45
Reach1 1546 100-Year 514.00 55.52 61.89 60.14 62.26 0.003774 4.86 105.69 31.45 0.47
Reach1 1588.5 Culvert
Reach1 1635 2-Year 123.00 55.72 60.47 57.86 60.51 0.000537 1.60 77.04 28.72 0.17
Reach1 1635 10-Year 239.00 55.72 61.74 58.61 61.80 0.000601 2.06 117.25 34.54 0.19
Reach1 1635 25-Year 315.00 55.72 62.07 59.00 62.16 0.000794 2.47 137.94 184.61 0.22
Reach1 1635 50-Year 412.00 55.72 62.26 59.43 62.39 0.001061 2.94 178.77 223.37 0.26
Reach1 1635 100-Year 514.00 55.72 62.40 59.81 62.56 0.001337 3.37 210.62 239.71 0.29
1

HEC-RAS Plan: SCUT1 - Ex River: Swift Creek UT1 Reach: Reach1 (Continued)
Reach River Sta Profile Q Total Min Ch El W.S. Elev Crit W.S. E.G. Elev E.G. Slope Vel Chnl Flow Area Top Width Froude # Chl
(cfs) (ft) (ft) (ft) (ft) (ft/ft) (ft/s) (sq ft) (ft)
Reach1 1798 2-Year 84.00 56.04 60.56 60.57 0.000191 1.01 83.44 29.31 0.10
Reach1 1798 10-Year 163.00 56.04 61.85 61.88 0.000223 1.33 126.41 37.08 0.12
Reach1 1798 25-Year 220.00 56.04 62.22 62.26 0.000303 1.62 154.13 123.58 0.14
Reach1 1798 50-Year 283.00 56.04 62.47 62.52 0.000387 1.88 187.35 140.69 0.16
Reach1 1798 100-Year 351.00 56.04 62.66 62.73 0.000480 2.14 215.47 153.69 0.18
Reach1 2289 2-Year 84.00 56.55 60.72 60.84 0.002680 2.75 30.57 15.77 0.35
Reach1 2289 10-Year 163.00 56.55 62.02 62.16 0.002140 2.98 54.77 21.33 0.33
Reach1 2289 25-Year 220.00 56.55 62.45 62.63 0.002514 3.43 64.23 23.50 0.36
Reach1 2289 50-Year 283.00 56.55 62.75 62.99 0.003048 3.97 71.63 25.66 0.40
Reach1 2289 100-Year 351.00 56.55 62.99 63.31 0.003703 4.55 78.09 27.41 0.45
Reach1 2669 2-Year 84.00 57.94 61.79 61.91 0.002985 2.72 30.92 18.07 0.37
Reach1 2669 10-Year 163.00 57.94 62.89 63.03 0.002427 3.01 54.41 25.02 0.35
Reach1 2669 25-Year 220.00 57.94 63.39 63.56 0.002369 3.31 67.83 28.40 0.35
Reach1 2669 50-Year 283.00 57.94 63.83 64.03 0.002435 3.63 80.91 31.34 0.37
Reach1 2669 100-Year 351.00 57.94 64.23 64.47 0.002514 3.93 94.18 34.07 0.38
Reach1 2906 2-Year 84.00 59.36 62.26 60.69 62.31 0.001018 1.84 45.58 22.29 0.23
Reach1 2906 10-Year 163.00 59.36 63.33 61.25 63.41 0.001070 2.28 71.61 26.16 0.24
Reach1 2906 25-Year 220.00 59.36 63.86 61.56 63.96 0.001174 2.56 85.92 28.06 0.26
Reach1 2906 50-Year 283.00 59.36 64.34 61.88 64.46 0.001287 2.84 99.70 29.78 0.27
Reach1 2906 100-Year 351.00 59.36 64.78 62.18 64.93 0.001394 3.10 113.24 31.37 0.29
Reach1 2952.5 Culvert
Reach1 3015 2-Year 84.00 60.48 62.59 61.59 62.67 0.001959 2.21 37.99 23.35 0.31
Reach1 3015 10-Year 163.00 60.48 64.50 62.06 64.55 0.000626 1.84 88.62 29.79 0.19
Reach1 3015 25-Year 220.00 60.48 65.33 62.34 65.38 0.000538 1.92 115.38 37.04 0.18
Reach1 3015 50-Year 283.00 60.48 65.79 62.63 65.87 0.000604 2.17 134.30 44.25 0.19
Reach1 3015 100-Year 351.00 60.48 66.04 62.90 66.14 0.000766 2.53 155.98 247.80 0.22
Reach1 3270 2-Year 68.00 59.93 63.17 63.28 0.002965 2.68 25.41 15.23 0.37
Reach1 3270 10-Year 145.00 59.93 64.71 64.82 0.001780 2.67 54.30 22.21 0.30
Reach1 3270 25-Year 203.00 59.93 65.50 65.62 0.001433 2.79 74.09 27.85 0.28
Reach1 3270 50-Year 253.00 59.93 65.98 66.12 0.001406 2.99 88.22 31.30 0.28
Reach1 3270 100-Year 309.00 59.93 66.27 66.41 0.001368 3.11 158.90 275.56 0.28
2

HEC-RAS Plan: SCUT1 - Ex River: Swift Creek UT1 Reach: Reach1 (Continued)
Reach River Sta Profile Q Total Min Ch El W.S. Elev Crit W.S. E.G. Elev E.G. Slope Vel Chnl Flow Area Top Width Froude # Chl
(cfs) (ft) (ft) (ft) (ft) (ft/ft) (ft/s) (sq ft) (ft)
Reach1 3690 2-Year 68.00 59.63 64.14 64.23 0.001785 2.37 28.65 12.14 0.27
Reach1 3690 10-Year 145.00 59.63 65.50 65.64 0.002107 3.04 47.66 16.42 0.31
Reach1 3690 25-Year 203.00 59.63 66.18 63.74 66.33 0.001945 3.22 98.35 243.73 0.30
Reach1 3690 50-Year 253.00 59.63 66.58 66.65 0.001135 2.59 207.29 294.38 0.24
Reach1 3690 100-Year 309.00 59.63 66.83 66.88 0.000904 2.37 283.89 325.38 0.21
Reach1 3808 2-Year 68.00 59.63 64.34 64.42 0.001430 2.18 31.17 12.69 0.25
Reach1 3808 10-Year 145.00 59.63 65.74 65.87 0.001669 2.81 52.20 20.72 0.28
Reach1 3808 25-Year 203.00 59.63 66.43 66.50 0.001083 2.48 163.38 275.04 0.23
Reach1 3808 50-Year 253.00 59.63 66.72 66.77 0.000797 2.20 249.23 311.73 0.20
Reach1 3808 100-Year 309.00 59.63 66.94 66.97 0.000694 2.11 319.58 338.86 0.19
Reach1 3936 2-Year 68.00 59.42 64.50 61.71 64.53 0.000465 1.42 47.83 17.39 0.15
Reach1 3936 10-Year 145.00 59.42 65.95 62.56 66.01 0.000606 1.90 76.27 21.70 0.18
Reach1 3936 25-Year 203.00 59.42 66.54 63.03 66.61 0.000688 2.14 127.81 152.08 0.19
Reach1 3936 50-Year 253.00 59.42 66.81 63.38 66.88 0.000756 2.32 174.40 206.71 0.20
Reach1 3936 100-Year 309.00 59.42 67.01 63.74 67.09 0.000836 2.50 221.85 253.54 0.22
Reach1 3967.5 Culvert
Reach1 3997 2-Year 68.00 61.44 65.97 63.50 66.00 0.000533 1.44 47.08 19.45 0.16
Reach1 3997 10-Year 145.00 61.44 67.36 64.32 67.38 0.000281 1.30 220.43 250.05 0.13
Reach1 3997 25-Year 203.00 61.44 67.53 64.77 67.55 0.000403 1.60 264.44 281.03 0.15
Reach1 3997 50-Year 253.00 61.44 67.66 65.10 67.69 0.000489 1.80 302.26 304.15 0.17
Reach1 3997 100-Year 309.00 61.44 67.76 65.43 67.80 0.000595 2.02 335.32 321.93 0.19
Reach1 4120 2-Year 67.00 61.75 66.04 66.07 0.000584 1.47 46.24 38.66 0.17
Reach1 4120 10-Year 138.00 61.75 67.40 67.41 0.000197 1.08 223.27 195.19 0.11
Reach1 4120 25-Year 190.00 61.75 67.58 67.60 0.000253 1.26 259.50 204.23 0.12
Reach1 4120 50-Year 236.00 61.75 67.72 67.74 0.000294 1.38 288.52 211.19 0.13
Reach1 4120 100-Year 288.00 61.75 67.84 67.86 0.000349 1.53 313.95 217.10 0.14
Reach1 4307.5* 2-Year 67.00 62.35 66.17 66.23 0.001262 2.05 32.67 14.87 0.24
Reach1 4307.5* 10-Year 138.00 62.35 67.42 67.51 0.001307 2.49 69.64 121.59 0.26
Reach1 4307.5* 25-Year 190.00 62.35 67.60 67.73 0.001815 3.03 94.90 156.02 0.31
Reach1 4307.5* 50-Year 236.00 62.35 67.75 67.89 0.002118 3.34 119.52 183.46 0.33
Reach1 4307.5* 100-Year 288.00 62.35 67.88 68.04 0.002416 3.64 145.02 208.11 0.36
3

HEC-RAS Plan: SCUT1 - Ex River: Swift Creek UT1 Reach: Reach1 (Continued)
Reach River Sta Profile Q Total Min Ch El W.S. Elev Crit W.S. E.G. Elev E.G. Slope Vel Chnl Flow Area Top Width Froude # Chl
(cfs) (ft) (ft) (ft) (ft) (ft/ft) (ft/s) (sq ft) (ft)
Reach1 4495 2-Year 67.00 62.94 66.46 66.59 0.002719 2.85 23.54 10.66 0.34
Reach1 4495 10-Year 138.00 62.94 67.70 67.90 0.003110 3.59 38.47 13.34 0.37
Reach1 4495 25-Year 190.00 62.94 67.98 66.38 68.30 0.004581 4.49 42.29 14.75 0.45
Reach1 4495 50-Year 236.00 62.94 68.17 66.76 68.59 0.005784 5.21 50.92 78.89 0.51
Reach1 4495 100-Year 288.00 62.94 68.35 67.14 68.85 0.006707 5.76 70.79 134.27 0.56
4

PRIMARY SYSTEM
FUTURE CONDITIONS:
HEC‐RAS OUTPUT

HEC-RAS Plan: Fut_Base River: Swift Creek Reach: Reach-1
Reach River Sta Profile Q Total Min Ch El W.S. Elev Crit W.S. E.G. Elev E.G. Slope Vel Chnl Flow Area Top Width Froude # Chl
(cfs) (ft) (ft) (ft) (ft) (ft/ft) (ft/s) (sq ft) (ft)
Reach-1 234198 2-year 266.00 51.54 56.05 54.47 56.31 0.003003 4.12 79.15 63.57 0.40
Reach-1 234198 10-year 508.00 51.54 57.13 55.55 57.42 0.003002 4.84 324.17 373.01 0.41
Reach-1 234198 25-year 718.00 51.54 57.60 57.03 57.89 0.003002 5.18 518.67 439.94 0.41
Reach-1 234198 50-year 907.00 51.54 57.94 57.36 58.21 0.003001 5.41 670.42 471.80 0.42
Reach-1 234198 100-year 1116.00 51.54 58.26 57.60 58.52 0.003000 5.63 825.28 492.50 0.42
Reach-1 234875 2-year 266.00 52.10 57.37 57.47 0.001074 2.82 218.32 293.96 0.25
Reach-1 234875 10-year 508.00 52.10 58.31 58.37 0.000762 2.73 600.74 459.40 0.21
Reach-1 234875 25-year 718.00 52.10 58.77 58.83 0.000755 2.88 823.94 515.05 0.22
Reach-1 234875 50-year 907.00 52.10 59.11 59.17 0.000769 3.03 1006.31 558.52 0.22
Reach-1 234875 100-year 1116.00 52.10 59.42 59.48 0.000766 3.13 1182.70 574.63 0.22
Reach-1 235139 2-year 266.00 51.75 57.62 54.10 57.69 0.000573 2.11 225.53 318.43 0.18
Reach-1 235139 10-year 508.00 51.75 58.49 55.18 58.54 0.000558 2.28 588.48 489.36 0.18
Reach-1 235139 25-year 718.00 51.75 58.95 55.93 59.00 0.000548 2.40 820.78 524.12 0.18
Reach-1 235139 50-year 907.00 51.75 59.29 56.52 59.34 0.000554 2.51 1004.17 565.17 0.19
Reach-1 235139 100-year 1116.00 51.75 59.60 58.05 59.65 0.000571 2.64 1183.15 588.99 0.19
Reach-1 235165 Bridge
Reach-1 235183 2-year 266.00 51.76 58.07 54.19 58.12 0.000335 1.79 148.69 320.04 0.15
Reach-1 235183 10-year 508.00 51.76 59.56 55.17 59.58 0.000154 1.39 967.89 516.32 0.10
Reach-1 235183 25-year 718.00 51.76 59.85 55.84 59.87 0.000228 1.75 1120.61 548.78 0.13
Reach-1 235183 50-year 907.00 51.76 60.03 56.34 60.07 0.000300 2.04 1222.71 552.97 0.15
Reach-1 235183 100-year 1116.00 51.76 60.19 56.82 60.24 0.000385 2.36 1312.24 556.98 0.17
Reach-1 235196 2-year 266.00 52.47 58.05 55.31 58.16 0.000992 2.59 102.77 504.67 0.24
Reach-1 235196 10-year 508.00 52.47 59.56 56.38 59.59 0.000281 1.70 700.56 601.17 0.13
Reach-1 235196 25-year 718.00 52.47 59.89 57.07 59.89 0.000074 0.91 2069.11 604.98 0.07
Reach-1 235196 50-year 907.00 52.47 60.09 57.55 60.09 0.000100 1.08 2189.48 607.15 0.08
Reach-1 235196 100-year 1116.00 52.47 60.26 58.04 60.27 0.000131 1.27 2297.37 610.79 0.09
Reach-1 235219 Culvert
Reach-1 235247 2-year 266.00 53.17 59.05 56.37 59.07 0.000368 1.55 388.42 493.09 0.15
Reach-1 235247 10-year 508.00 53.17 59.63 57.32 59.68 0.000583 2.14 562.50 514.36 0.19
Reach-1 235247 25-year 718.00 53.17 59.95 57.98 59.97 0.000362 1.77 1074.55 530.05 0.15
Reach-1 235247 50-year 907.00 53.17 60.18 58.46 60.21 0.000430 1.99 1199.10 543.33 0.17
1

HEC-RAS Plan: Fut_Base River: Swift Creek Reach: Reach-1 (Continued)
Reach River Sta Profile Q Total Min Ch El W.S. Elev Crit W.S. E.G. Elev E.G. Slope Vel Chnl Flow Area Top Width Froude # Chl
(cfs) (ft) (ft) (ft) (ft) (ft/ft) (ft/s) (sq ft) (ft)
Reach-1 235247 100-year 1116.00 53.17 60.31 58.88 60.35 0.000555 2.30 1272.75 556.44 0.19
Reach-1 235428 2-year 256.00 53.13 59.10 56.16 59.14 0.000350 1.75 444.27 286.07 0.15
Reach-1 235428 10-year 494.00 53.13 59.72 57.70 59.78 0.000630 2.56 631.52 318.35 0.20
Reach-1 235428 25-year 703.00 53.13 59.99 58.32 60.08 0.000954 3.26 718.29 328.14 0.25
Reach-1 235428 50-year 877.00 53.13 60.23 58.59 60.34 0.001162 3.71 797.26 345.10 0.28
Reach-1 235428 100-year 1067.00 53.13 60.37 58.82 60.52 0.001488 4.27 847.00 367.24 0.32
Reach-1 235914 2-year 256.00 53.95 59.33 59.44 0.001149 2.84 193.17 208.47 0.26
Reach-1 235914 10-year 494.00 53.95 60.11 60.25 0.001480 3.65 372.86 253.15 0.30
Reach-1 235914 25-year 703.00 53.95 60.54 60.72 0.001778 4.24 491.25 290.49 0.33
Reach-1 235914 50-year 877.00 53.95 60.87 61.05 0.001854 4.52 589.35 301.74 0.34
Reach-1 235914 100-year 1067.00 53.95 61.16 61.35 0.001993 4.85 676.40 310.08 0.36
Reach-1 236412 2-year 256.00 54.78 59.84 59.89 0.000661 2.08 327.89 307.27 0.19
Reach-1 236412 10-year 494.00 54.78 60.71 60.75 0.000640 2.36 631.96 403.39 0.20
Reach-1 236412 25-year 703.00 54.78 61.23 61.27 0.000660 2.58 852.57 450.06 0.20
Reach-1 236412 50-year 877.00 54.78 61.59 61.63 0.000685 2.75 1019.38 472.86 0.21
Reach-1 236412 100-year 1067.00 54.78 61.91 61.96 0.000706 2.90 1174.66 488.09 0.22
Reach-1 236856 2-year 256.00 54.38 60.20 57.76 60.35 0.001671 3.21 139.96 157.03 0.30
Reach-1 236856 10-year 494.00 54.38 61.06 59.03 61.25 0.002063 4.08 307.10 233.24 0.34
Reach-1 236856 25-year 703.00 54.38 61.58 60.48 61.79 0.002162 4.49 438.86 272.73 0.36
Reach-1 236856 50-year 877.00 54.38 61.95 60.80 62.17 0.002261 4.82 549.06 324.20 0.37
Reach-1 236856 100-year 1067.00 54.38 62.29 61.16 62.51 0.002253 5.01 661.33 377.80 0.37
Reach-1 237179 2-year 256.00 55.37 60.72 60.86 0.001493 3.09 143.32 165.35 0.28
Reach-1 237179 10-year 494.00 55.37 61.67 61.82 0.001590 3.67 341.45 228.43 0.30
Reach-1 237179 25-year 703.00 55.37 62.22 62.38 0.001676 4.06 470.68 242.89 0.32
Reach-1 237179 50-year 877.00 55.37 62.62 62.79 0.001719 4.32 568.41 253.28 0.32
Reach-1 237179 100-year 1067.00 55.37 62.95 63.13 0.001844 4.65 653.94 262.04 0.34
Reach-1 237456 2-year 256.00 55.98 61.16 58.90 61.26 0.001396 2.79 159.79 261.45 0.28
Reach-1 237456 10-year 494.00 55.98 62.13 60.05 62.24 0.001333 3.19 338.11 308.92 0.28
Reach-1 237456 25-year 703.00 55.98 62.70 61.27 62.76 0.000926 2.90 719.09 339.99 0.24
Reach-1 237456 50-year 877.00 55.98 63.07 61.53 63.14 0.000958 3.11 849.65 355.24 0.25
Reach-1 237456 100-year 1067.00 55.98 63.43 61.76 63.51 0.000983 3.30 979.19 365.25 0.25
2

HEC-RAS Plan: Fut_Base River: Swift Creek Reach: Reach-1 (Continued)
Reach River Sta Profile Q Total Min Ch El W.S. Elev Crit W.S. E.G. Elev E.G. Slope Vel Chnl Flow Area Top Width Froude # Chl
(cfs) (ft) (ft) (ft) (ft) (ft/ft) (ft/s) (sq ft) (ft)
Reach-1 237708 2-year 256.00 56.29 61.51 59.26 61.61 0.001237 2.70 188.93 294.65 0.27
Reach-1 237708 10-year 494.00 56.29 62.48 60.35 62.57 0.001011 2.90 588.09 441.21 0.25
Reach-1 237708 25-year 703.00 56.29 62.96 61.31 63.05 0.001068 3.21 798.47 473.81 0.26
Reach-1 237708 50-year 877.00 56.29 63.34 61.87 63.43 0.001052 3.36 970.33 496.38 0.27
Reach-1 237708 100-year 1067.00 56.29 63.71 62.19 63.80 0.001045 3.51 1137.92 507.24 0.27
Reach-1 237781 Culvert
Reach-1 237845 2-year 256.00 56.31 62.85 59.45 62.87 0.000222 1.38 573.76 402.90 0.11
Reach-1 237845 10-year 494.00 56.31 63.39 60.66 63.42 0.000340 1.84 925.17 461.28 0.14
Reach-1 237845 25-year 703.00 56.31 63.68 61.40 63.72 0.000523 2.36 1024.24 503.70 0.18
Reach-1 237845 50-year 877.00 56.31 63.82 61.90 63.87 0.000715 2.81 1074.05 523.16 0.21
Reach-1 237845 100-year 1067.00 56.31 64.01 62.38 64.08 0.000894 3.22 1141.82 540.29 0.24
Reach-1 238094 2-year 242.00 56.52 62.91 59.59 62.99 0.000819 2.42 187.07 408.20 0.21
Reach-1 238094 10-year 444.00 56.52 63.47 60.69 63.62 0.001403 3.39 335.66 529.48 0.28
Reach-1 238094 25-year 588.00 56.52 63.80 61.33 63.97 0.001647 3.84 427.50 550.01 0.30
Reach-1 238094 50-year 711.00 56.52 63.99 61.80 64.19 0.001933 4.27 480.26 557.40 0.33
Reach-1 238094 100-year 852.00 56.52 64.23 63.06 64.45 0.002138 4.62 546.16 566.61 0.35
Reach-1 238526 2-year 242.00 56.20 63.11 58.14 63.14 0.000184 1.41 195.73 72.78 0.11
Reach-1 238526 10-year 444.00 56.20 63.84 58.98 63.91 0.000381 2.20 271.54 200.36 0.16
Reach-1 238526 25-year 588.00 56.20 64.25 59.47 64.35 0.000507 2.66 340.89 241.43 0.19
Reach-1 238526 50-year 711.00 56.20 64.52 59.86 64.64 0.000616 3.01 391.26 256.57 0.21
Reach-1 238526 100-year 852.00 56.20 64.82 60.27 64.97 0.000726 3.37 453.70 290.26 0.23
Reach-1 238936 2-year 242.00 56.88 63.20 58.95 63.23 0.000219 1.41 172.11 39.07 0.12
Reach-1 238936 10-year 444.00 56.88 64.01 59.69 64.08 0.000439 2.17 206.75 47.57 0.17
Reach-1 238936 25-year 588.00 56.88 64.47 60.13 64.57 0.000586 2.63 229.92 53.28 0.20
Reach-1 238936 50-year 711.00 56.88 64.78 60.48 64.92 0.000709 3.00 247.12 56.94 0.22
Reach-1 238936 100-year 852.00 56.88 65.12 60.84 65.30 0.000837 3.39 267.84 68.64 0.24
Reach-1 239177 2-year 242.00 57.85 63.18 61.25 63.42 0.002970 3.95 61.33 19.28 0.39
Reach-1 239177 10-year 444.00 57.85 63.95 62.40 64.47 0.005419 5.76 77.09 21.43 0.54
Reach-1 239177 25-year 588.00 57.85 64.38 63.05 65.10 0.007001 6.80 86.52 63.37 0.61
Reach-1 239177 50-year 711.00 57.85 64.65 63.53 65.56 0.008461 7.66 96.96 114.89 0.68
Reach-1 239177 100-year 852.00 57.85 64.96 64.03 66.05 0.009707 8.42 116.14 158.25 0.73
3

HEC-RAS Plan: Fut_Base River: Swift Creek Reach: Reach-1 (Continued)
Reach River Sta Profile Q Total Min Ch El W.S. Elev Crit W.S. E.G. Elev E.G. Slope Vel Chnl Flow Area Top Width Froude # Chl
(cfs) (ft) (ft) (ft) (ft) (ft/ft) (ft/s) (sq ft) (ft)
Reach-1 239470 2-year 242.00 57.77 63.69 59.94 63.75 0.000447 1.93 125.28 28.39 0.16
Reach-1 239470 10-year 444.00 57.77 64.93 60.78 65.05 0.000733 2.74 162.12 30.97 0.21
Reach-1 239470 25-year 588.00 57.77 65.67 61.29 65.83 0.000882 3.17 185.69 34.40 0.23
Reach-1 239470 50-year 711.00 57.77 66.22 61.68 66.41 0.000968 3.48 211.25 59.23 0.25
Reach-1 239470 100-year 852.00 57.77 66.79 62.10 67.01 0.001038 3.77 249.37 83.41 0.26
Reach-1 239543 Culvert
Reach-1 239601 2-year 242.00 57.56 65.40 59.95 65.43 0.000206 1.47 165.91 44.43 0.11
Reach-1 239601 10-year 444.00 57.56 68.02 60.88 68.04 0.000110 1.37 570.96 374.01 0.09
Reach-1 239601 25-year 588.00 57.56 68.38 61.43 68.41 0.000150 1.65 645.96 406.30 0.10
Reach-1 239601 50-year 711.00 57.56 68.57 61.85 68.61 0.000192 1.90 686.43 422.67 0.12
Reach-1 239601 100-year 852.00 57.56 68.76 62.29 68.81 0.000236 2.14 781.87 438.78 0.13
Reach-1 239904 2-year 216.00 58.41 65.48 61.29 65.54 0.000562 1.94 111.17 29.40 0.18
Reach-1 239904 10-year 389.00 58.41 68.06 62.36 68.09 0.000239 1.51 483.02 336.17 0.11
Reach-1 239904 25-year 512.00 58.41 68.43 63.04 68.47 0.000276 1.70 602.45 367.42 0.12
Reach-1 239904 50-year 617.00 58.41 68.64 63.53 68.68 0.000321 1.88 674.51 385.09 0.14
Reach-1 239904 100-year 737.00 58.41 68.85 63.99 68.90 0.000354 2.02 798.36 404.47 0.14
Reach-1 240316 2-year 216.00 59.47 65.79 65.99 0.002196 3.52 61.38 16.68 0.32
Reach-1 240316 10-year 389.00 59.47 68.19 68.26 0.000744 2.51 329.42 238.07 0.20
Reach-1 240316 25-year 512.00 59.47 68.59 68.66 0.000806 2.72 431.95 282.42 0.21
Reach-1 240316 50-year 617.00 59.47 68.82 68.90 0.000879 2.92 500.51 301.68 0.22
Reach-1 240316 100-year 737.00 59.47 69.05 69.13 0.000960 3.13 571.33 321.56 0.23
Reach-1 240800 2-year 216.00 60.78 66.70 66.83 0.001397 2.88 83.30 47.16 0.27
Reach-1 240800 10-year 389.00 60.78 68.55 68.65 0.000814 2.71 244.84 175.94 0.22
Reach-1 240800 25-year 512.00 60.78 68.98 69.09 0.000921 3.01 328.74 217.56 0.23
Reach-1 240800 50-year 617.00 60.78 69.25 69.37 0.001034 3.27 392.33 250.72 0.25
Reach-1 240800 100-year 737.00 60.78 69.52 69.66 0.001148 3.52 465.17 289.19 0.26
Reach-1 241107 2-year 216.00 61.47 67.19 67.34 0.001958 3.22 79.81 54.80 0.32
Reach-1 241107 10-year 389.00 61.47 68.84 68.93 0.001040 2.75 282.60 204.66 0.24
Reach-1 241107 25-year 512.00 61.47 69.30 69.39 0.001022 2.89 386.62 250.10 0.24
Reach-1 241107 50-year 617.00 61.47 69.61 69.69 0.001030 3.00 468.00 280.61 0.24
Reach-1 241107 100-year 737.00 61.47 69.91 70.00 0.001038 3.11 557.18 310.91 0.25
4

HEC-RAS Plan: Fut_Base River: Swift Creek Reach: Reach-1 (Continued)
Reach River Sta Profile Q Total Min Ch El W.S. Elev Crit W.S. E.G. Elev E.G. Slope Vel Chnl Flow Area Top Width Froude # Chl
(cfs) (ft) (ft) (ft) (ft) (ft/ft) (ft/s) (sq ft) (ft)
Reach-1 241592 2-year 165.00 62.40 67.91 67.99 0.000866 2.22 74.25 22.66 0.22
Reach-1 241592 10-year 301.00 62.40 69.30 69.39 0.000842 2.54 170.20 125.21 0.22
Reach-1 241592 25-year 398.00 62.40 69.76 69.86 0.000917 2.80 236.81 163.86 0.23
Reach-1 241592 50-year 484.00 62.40 70.08 70.19 0.000985 3.01 297.30 232.68 0.24
Reach-1 241592 100-year 578.00 62.40 70.39 70.50 0.001006 3.13 373.69 270.68 0.25
Reach-1 241994 2-year 165.00 63.58 68.28 68.37 0.001007 2.32 71.65 29.53 0.23
Reach-1 241994 10-year 301.00 63.58 69.66 69.76 0.000969 2.63 153.69 89.08 0.23
Reach-1 241994 25-year 398.00 63.58 70.15 70.27 0.001076 2.96 214.23 205.66 0.25
Reach-1 241994 50-year 484.00 63.58 70.49 70.61 0.001085 3.09 296.95 282.69 0.25
Reach-1 241994 100-year 578.00 63.58 70.80 70.92 0.001057 3.17 395.48 349.55 0.25
5

HEC-RAS Plan: Fut_Base River: Swift Creek UT1 Reach: Reach1
Reach River Sta Profile Q Total Min Ch El W.S. Elev Crit W.S. E.G. Elev E.G. Slope Vel Chnl Flow Area Top Width Froude # Chl
(cfs) (ft) (ft) (ft) (ft) (ft/ft) (ft/s) (sq ft) (ft)
Reach1 231 2-Year 168.00 53.45 57.11 55.97 57.35 0.004002 3.92 42.89 17.92 0.45
Reach1 231 10-Year 321.00 53.45 58.28 56.83 58.60 0.004002 4.66 100.84 159.84 0.46
Reach1 231 25-Year 428.00 53.45 58.65 57.33 58.95 0.004005 4.87 165.46 193.18 0.46
Reach1 231 50-Year 533.00 53.45 58.92 57.78 59.21 0.004001 5.01 221.47 217.99 0.46
Reach1 231 100-Year 675.00 53.45 59.22 58.80 59.50 0.004001 5.17 291.02 245.32 0.47
Reach1 584 2-Year 168.00 53.78 58.13 58.25 0.001712 2.86 67.91 99.56 0.30
Reach1 584 10-Year 321.00 53.78 59.26 59.36 0.001288 2.86 208.90 150.27 0.27
Reach1 584 25-Year 428.00 53.78 59.65 59.75 0.001399 3.10 269.81 168.02 0.28
Reach1 584 50-Year 533.00 53.78 59.93 60.04 0.001522 3.34 319.79 180.13 0.29
Reach1 584 100-Year 675.00 53.78 60.25 60.37 0.001663 3.63 378.49 190.28 0.31
Reach1 1005 2-Year 168.00 54.86 58.83 58.88 0.001291 2.23 145.69 151.27 0.26
Reach1 1005 10-Year 321.00 54.86 59.77 59.81 0.000863 2.11 303.57 181.75 0.22
Reach1 1005 25-Year 428.00 54.86 60.17 60.21 0.000850 2.25 377.85 189.49 0.22
Reach1 1005 50-Year 533.00 54.86 60.48 60.53 0.000874 2.40 438.80 195.60 0.23
Reach1 1005 100-Year 675.00 54.86 60.85 60.90 0.000941 2.62 511.82 208.43 0.24
Reach1 1429 2-Year 130.00 54.48 59.40 59.50 0.001635 2.62 49.60 19.06 0.29
Reach1 1429 10-Year 247.00 54.48 60.20 60.42 0.002736 3.74 66.10 21.88 0.38
Reach1 1429 25-Year 327.00 54.48 60.58 60.88 0.003470 4.38 74.60 23.20 0.43
Reach1 1429 50-Year 431.00 54.48 60.88 61.31 0.004711 5.27 81.81 24.26 0.51
Reach1 1429 100-Year 531.00 54.48 61.23 61.77 0.005451 5.86 90.56 25.50 0.55
Reach1 1546 2-Year 130.00 55.52 59.61 58.10 59.73 0.002247 2.83 45.95 20.99 0.34
Reach1 1546 10-Year 247.00 55.52 60.54 58.90 60.75 0.002891 3.66 67.51 25.27 0.39
Reach1 1546 25-Year 327.00 55.52 61.02 59.33 61.28 0.003204 4.08 80.12 27.47 0.42
Reach1 1546 50-Year 431.00 55.52 61.50 59.80 61.83 0.003650 4.59 93.81 29.67 0.46
Reach1 1546 100-Year 531.00 55.52 61.97 60.21 62.34 0.003782 4.91 108.25 35.58 0.47
Reach1 1588.5 Culvert
Reach1 1635 2-Year 130.00 55.72 60.66 57.91 60.70 0.000497 1.57 82.61 29.69 0.17
Reach1 1635 10-Year 247.00 55.72 61.80 58.66 61.87 0.000610 2.09 119.30 34.80 0.19
Reach1 1635 25-Year 327.00 55.72 62.10 59.06 62.20 0.000824 2.53 144.51 192.30 0.23
Reach1 1635 50-Year 431.00 55.72 62.28 59.50 62.42 0.001131 3.04 182.78 225.49 0.27
Reach1 1635 100-Year 531.00 55.72 62.40 59.88 62.57 0.001424 3.48 210.86 239.83 0.30
1

HEC-RAS Plan: Fut_Base River: Swift Creek UT1 Reach: Reach1 (Continued)
Reach River Sta Profile Q Total Min Ch El W.S. Elev Crit W.S. E.G. Elev E.G. Slope Vel Chnl Flow Area Top Width Froude # Chl
(cfs) (ft) (ft) (ft) (ft) (ft/ft) (ft/s) (sq ft) (ft)
Reach1 1798 2-Year 94.00 56.04 60.74 60.76 0.000197 1.06 88.98 30.42 0.11
Reach1 1798 10-Year 176.00 56.04 61.91 61.94 0.000248 1.41 128.67 37.44 0.12
Reach1 1798 25-Year 239.00 56.04 62.26 62.30 0.000345 1.73 159.02 126.24 0.15
Reach1 1798 50-Year 302.00 56.04 62.50 62.56 0.000426 1.98 191.67 142.76 0.17
Reach1 1798 100-Year 369.00 56.04 62.68 62.75 0.000520 2.23 218.12 154.86 0.18
Reach1 2289 2-Year 94.00 56.55 60.91 61.03 0.002607 2.80 33.62 16.57 0.35
Reach1 2289 10-Year 176.00 56.55 62.10 62.25 0.002299 3.12 56.48 21.66 0.34
Reach1 2289 25-Year 239.00 56.55 62.52 62.72 0.002758 3.63 65.85 24.00 0.38
Reach1 2289 50-Year 302.00 56.55 62.81 63.07 0.003281 4.16 73.10 26.07 0.42
Reach1 2289 100-Year 369.00 56.55 63.04 63.38 0.003929 4.72 79.29 27.72 0.46
Reach1 2669 2-Year 94.00 57.94 61.96 62.08 0.002930 2.77 33.97 19.09 0.37
Reach1 2669 10-Year 176.00 57.94 63.00 63.15 0.002428 3.09 57.37 25.80 0.35
Reach1 2669 25-Year 239.00 57.94 63.52 63.70 0.002409 3.42 71.63 29.28 0.36
Reach1 2669 50-Year 302.00 57.94 63.94 64.15 0.002473 3.73 84.48 32.10 0.37
Reach1 2669 100-Year 369.00 57.94 64.33 64.58 0.002536 4.01 97.56 34.73 0.38
Reach1 2906 2-Year 94.00 59.36 62.42 60.78 62.48 0.001021 1.91 49.26 22.88 0.23
Reach1 2906 10-Year 176.00 59.36 63.46 61.32 63.54 0.001100 2.35 74.91 26.61 0.25
Reach1 2906 25-Year 239.00 59.36 64.01 61.66 64.12 0.001214 2.65 90.10 28.59 0.26
Reach1 2906 50-Year 302.00 59.36 64.46 61.96 64.60 0.001322 2.92 103.49 30.23 0.28
Reach1 2906 100-Year 369.00 59.36 64.89 62.26 65.04 0.001421 3.16 116.63 31.76 0.29
Reach1 2952.5 Culvert
Reach1 3015 2-Year 94.00 60.48 62.82 61.66 62.89 0.001657 2.17 43.35 24.11 0.28
Reach1 3015 10-Year 176.00 60.48 64.81 62.13 64.86 0.000548 1.79 98.05 30.84 0.18
Reach1 3015 25-Year 239.00 60.48 65.48 62.43 65.55 0.000555 2.00 121.36 39.47 0.18
Reach1 3015 50-Year 302.00 60.48 65.90 62.70 65.98 0.000629 2.25 139.32 45.98 0.20
Reach1 3015 100-Year 369.00 60.48 66.10 62.97 66.20 0.000795 2.59 170.54 263.90 0.22
Reach1 3270 2-Year 78.00 59.93 63.33 63.45 0.003008 2.78 28.01 15.98 0.37
Reach1 3270 10-Year 158.00 59.93 64.99 65.10 0.001511 2.61 60.79 24.15 0.28
Reach1 3270 25-Year 217.00 59.93 65.66 65.78 0.001398 2.83 78.60 29.00 0.28
Reach1 3270 50-Year 268.00 59.93 66.10 66.24 0.001389 3.03 112.23 249.95 0.28
Reach1 3270 100-Year 325.00 59.93 66.34 66.47 0.001338 3.11 176.93 285.01 0.28
2

HEC-RAS Plan: Fut_Base River: Swift Creek UT1 Reach: Reach1 (Continued)
Reach River Sta Profile Q Total Min Ch El W.S. Elev Crit W.S. E.G. Elev E.G. Slope Vel Chnl Flow Area Top Width Froude # Chl
(cfs) (ft) (ft) (ft) (ft) (ft/ft) (ft/s) (sq ft) (ft)
Reach1 3690 2-Year 78.00 59.63 64.34 64.44 0.001880 2.50 31.18 12.69 0.28
Reach1 3690 10-Year 158.00 59.63 65.70 65.85 0.002068 3.11 51.28 19.92 0.31
Reach1 3690 25-Year 217.00 59.63 66.30 63.86 66.43 0.001676 3.04 130.30 259.51 0.28
Reach1 3690 50-Year 268.00 59.63 66.67 66.73 0.001003 2.46 235.30 306.08 0.22
Reach1 3690 100-Year 325.00 59.63 66.88 66.93 0.000880 2.36 300.89 331.87 0.21
Reach1 3808 2-Year 78.00 59.63 64.56 64.64 0.001500 2.30 33.96 13.27 0.25
Reach1 3808 10-Year 158.00 59.63 65.94 66.07 0.001650 2.87 56.61 24.19 0.28
Reach1 3808 25-Year 217.00 59.63 66.52 66.58 0.000987 2.39 188.35 286.20 0.22
Reach1 3808 50-Year 268.00 59.63 66.80 66.84 0.000738 2.14 273.23 321.24 0.19
Reach1 3808 100-Year 325.00 59.63 66.98 67.02 0.000683 2.10 336.14 344.93 0.19
Reach1 3936 2-Year 78.00 59.42 64.72 61.84 64.76 0.000493 1.50 51.84 18.06 0.16
Reach1 3936 10-Year 158.00 59.42 66.15 62.66 66.21 0.000615 1.95 84.70 65.93 0.18
Reach1 3936 25-Year 217.00 59.42 66.62 63.14 66.69 0.000715 2.20 139.78 167.53 0.20
Reach1 3936 50-Year 268.00 59.42 66.88 63.49 66.95 0.000769 2.36 189.40 222.54 0.21
Reach1 3936 100-Year 325.00 59.42 67.06 63.84 67.14 0.000861 2.56 234.15 264.34 0.22
Reach1 3967.5 Culvert
Reach1 3997 2-Year 78.00 61.44 66.38 63.63 66.41 0.000438 1.38 60.42 69.98 0.15
Reach1 3997 10-Year 158.00 61.44 67.42 64.42 67.44 0.000298 1.36 235.64 261.18 0.13
Reach1 3997 25-Year 217.00 61.44 67.54 64.87 67.57 0.000444 1.68 269.68 284.50 0.16
Reach1 3997 50-Year 268.00 61.44 67.70 65.20 67.73 0.000504 1.84 315.81 311.56 0.17
Reach1 3997 100-Year 325.00 61.44 67.72 65.52 67.77 0.000709 2.19 322.86 315.35 0.20
Reach1 4120 2-Year 70.00 61.75 66.44 66.46 0.000354 1.24 73.35 94.68 0.14
Reach1 4120 10-Year 142.00 61.75 67.46 67.47 0.000183 1.05 235.42 198.26 0.10
Reach1 4120 25-Year 194.00 61.75 67.60 67.62 0.000251 1.26 264.42 205.42 0.12
Reach1 4120 50-Year 241.00 61.75 67.77 67.78 0.000281 1.36 298.23 213.47 0.13
Reach1 4120 100-Year 293.00 61.75 67.81 67.84 0.000378 1.58 308.75 215.91 0.15
Reach1 4307.5* 2-Year 70.00 62.35 66.52 66.57 0.000910 1.84 38.13 16.00 0.21
Reach1 4307.5* 10-Year 142.00 62.35 67.48 67.57 0.001259 2.47 77.07 132.64 0.25
Reach1 4307.5* 25-Year 194.00 62.35 67.62 67.75 0.001811 3.03 98.65 160.50 0.31
Reach1 4307.5* 50-Year 241.00 62.35 67.79 67.93 0.002015 3.28 128.10 192.11 0.33
Reach1 4307.5* 100-Year 293.00 62.35 67.85 68.03 0.002616 3.78 140.57 204.02 0.37
3

HEC-RAS Plan: Fut_Base River: Swift Creek UT1 Reach: Reach1 (Continued)
Reach River Sta Profile Q Total Min Ch El W.S. Elev Crit W.S. E.G. Elev E.G. Slope Vel Chnl Flow Area Top Width Froude # Chl
(cfs) (ft) (ft) (ft) (ft) (ft/ft) (ft/s) (sq ft) (ft)
Reach1 4495 2-Year 70.00 62.94 66.73 66.84 0.002155 2.64 26.54 11.24 0.30
Reach1 4495 10-Year 142.00 62.94 67.75 67.96 0.003154 3.63 39.10 13.44 0.38
Reach1 4495 25-Year 194.00 62.94 68.00 66.42 68.33 0.004680 4.56 42.63 19.39 0.46
Reach1 4495 50-Year 241.00 62.94 68.19 66.80 68.62 0.005901 5.27 52.41 85.28 0.52
Reach1 4495 100-Year 293.00 62.94 68.38 67.18 68.87 0.006662 5.76 74.20 138.43 0.56
4

HEC-RAS Plan: Fut_Base River: Gum Swamp Reach: Reach - 1
Reach River Sta Profile Q Total Min Ch El W.S. Elev Crit W.S. E.G. Elev E.G. Slope Vel Chnl Flow Area Top Width Froude # Chl
(cfs) (ft) (ft) (ft) (ft) (ft/ft) (ft/s) (sq ft) (ft)
Reach - 1 663.5 2-Year 336.00 46.81 53.28 50.55 53.72 0.002603 5.48 82.31 33.59 0.39
Reach - 1 663.5 10-Year 686.00 46.81 54.96 52.65 55.40 0.002602 6.42 386.07 304.64 0.40
Reach - 1 663.5 25-Year 947.00 46.81 55.51 54.77 55.89 0.002602 6.71 558.59 330.93 0.41
Reach - 1 663.5 50-Year 1182.00 46.81 55.91 55.31 56.27 0.002603 6.92 696.45 350.52 0.41
Reach - 1 663.5 100-Year 1442.00 46.81 56.31 55.57 56.65 0.002601 7.13 844.15 390.17 0.41
Reach - 1 1000.0 2-Year 336.00 46.98 54.12 54.27 0.001017 3.67 251.85 229.96 0.25
Reach - 1 1000.0 10-Year 686.00 46.98 55.77 55.86 0.000742 3.61 779.08 381.23 0.22
Reach - 1 1000.0 25-Year 947.00 46.98 56.29 56.38 0.000835 3.98 982.70 402.17 0.23
Reach - 1 1000.0 50-Year 1182.00 46.98 56.68 56.78 0.000903 4.26 1144.42 418.06 0.24
Reach - 1 1000.0 100-Year 1442.00 46.98 57.08 57.17 0.000960 4.51 1311.45 433.86 0.25
Reach - 1 1500.0 2-Year 336.00 47.40 54.64 54.91 0.001464 4.45 132.22 87.24 0.30
Reach - 1 1500.0 10-Year 686.00 47.40 56.16 56.45 0.001677 5.43 483.31 402.54 0.33
Reach - 1 1500.0 25-Year 947.00 47.40 56.75 57.02 0.001764 5.82 759.77 525.76 0.34
Reach - 1 1500.0 50-Year 1182.00 47.40 57.18 57.40 0.001571 5.66 994.40 549.23 0.32
Reach - 1 1500.0 100-Year 1442.00 47.40 57.60 57.78 0.001443 5.58 1228.50 571.70 0.31
Reach - 1 2000.0 2-Year 336.00 47.83 55.39 55.68 0.001613 4.57 110.87 69.72 0.30
Reach - 1 2000.0 10-Year 686.00 47.83 57.01 57.29 0.001680 5.33 554.69 403.13 0.31
Reach - 1 2000.0 25-Year 947.00 47.83 57.63 57.86 0.001577 5.40 811.72 424.00 0.31
Reach - 1 2000.0 50-Year 1182.00 47.83 57.99 58.23 0.001720 5.78 971.33 454.93 0.32
Reach - 1 2000.0 100-Year 1442.00 47.83 58.37 58.59 0.001767 6.00 1143.44 466.47 0.33
Reach - 1 2535.0 2-Year 336.00 48.54 56.24 56.49 0.001404 4.32 155.26 180.06 0.28
Reach - 1 2535.0 10-Year 686.00 48.54 57.88 58.06 0.001201 4.56 690.22 455.31 0.27
Reach - 1 2535.0 25-Year 947.00 48.54 58.45 58.62 0.001253 4.85 973.54 515.01 0.27
Reach - 1 2535.0 50-Year 1182.00 48.54 58.86 59.01 0.001236 4.95 1185.82 521.11 0.27
Reach - 1 2535.0 100-Year 1442.00 48.54 59.25 59.39 0.001252 5.11 1391.16 534.03 0.28
Reach - 1 3000.0 2-Year 301.00 48.92 56.88 57.10 0.001179 4.01 158.84 138.12 0.25
Reach - 1 3000.0 10-Year 617.00 48.92 58.43 58.64 0.001292 4.74 552.18 380.19 0.27
Reach - 1 3000.0 25-Year 852.00 48.92 59.03 59.23 0.001365 5.08 806.75 489.83 0.29
Reach - 1 3000.0 50-Year 1073.00 48.92 59.44 59.64 0.001421 5.33 1027.35 576.56 0.29
Reach - 1 3000.0 100-Year 1324.00 48.92 59.84 60.01 0.001387 5.40 1257.47 581.24 0.29
Reach - 1 3500.0 2-Year 301.00 49.52 57.47 57.63 0.000955 3.61 208.65 210.99 0.23
Reach - 1 3500.0 10-Year 617.00 49.52 59.06 59.17 0.000850 3.85 778.41 462.98 0.22
1

HEC-RAS Plan: Fut_Base River: Gum Swamp Reach: Reach - 1 (Continued)
Reach River Sta Profile Q Total Min Ch El W.S. Elev Crit W.S. E.G. Elev E.G. Slope Vel Chnl Flow Area Top Width Froude # Chl
(cfs) (ft) (ft) (ft) (ft) (ft/ft) (ft/s) (sq ft) (ft)
Reach - 1 3500.0 25-Year 852.00 49.52 59.67 59.77 0.000837 3.99 1078.71 516.01 0.22
Reach - 1 3500.0 50-Year 1073.00 49.52 60.09 60.19 0.000867 4.18 1305.78 549.35 0.23
Reach - 1 3500.0 100-Year 1324.00 49.52 60.48 60.58 0.000919 4.41 1522.43 576.80 0.24
Reach - 1 4000.0 2-Year 301.00 50.17 57.97 58.20 0.001267 4.10 121.38 50.90 0.26
Reach - 1 4000.0 10-Year 617.00 50.17 59.47 55.80 59.92 0.002193 6.09 356.42 308.64 0.36
Reach - 1 4000.0 25-Year 852.00 50.17 60.10 60.50 0.002182 6.35 583.90 387.74 0.36
Reach - 1 4000.0 50-Year 1073.00 50.17 60.57 60.91 0.002139 6.49 774.94 430.71 0.36
Reach - 1 4000.0 100-Year 1324.00 50.17 60.99 61.31 0.002114 6.63 964.86 457.45 0.36
Reach - 1 4500.0 2-Year 301.00 51.25 58.64 58.89 0.001490 4.29 137.31 134.57 0.28
Reach - 1 4500.0 10-Year 617.00 51.25 60.56 60.74 0.001219 4.54 531.95 268.14 0.27
Reach - 1 4500.0 25-Year 852.00 51.25 61.17 61.36 0.001341 4.97 710.60 325.70 0.28
Reach - 1 4500.0 50-Year 1073.00 51.25 61.61 61.81 0.001494 5.41 866.24 371.03 0.30
Reach - 1 4500.0 100-Year 1324.00 51.25 62.02 62.23 0.001600 5.75 1026.54 401.01 0.31
Reach - 1 5000.0 2-Year 270.00 51.44 59.32 59.47 0.000881 3.44 178.79 122.33 0.22
Reach - 1 5000.0 10-Year 553.00 51.44 61.11 61.22 0.000730 3.61 671.26 352.14 0.21
Reach - 1 5000.0 25-Year 783.00 51.44 61.77 61.87 0.000772 3.88 913.84 381.05 0.22
Reach - 1 5000.0 50-Year 992.00 51.44 62.26 62.36 0.000796 4.07 1105.62 394.57 0.22
Reach - 1 5000.0 100-Year 1228.00 51.44 62.72 62.82 0.000841 4.30 1287.31 406.96 0.23
Reach - 1 5500.0 2-Year 270.00 52.17 59.79 59.95 0.001034 3.56 132.92 33.32 0.23
Reach - 1 5500.0 10-Year 553.00 52.17 61.51 61.80 0.001625 5.13 418.51 340.31 0.30
Reach - 1 5500.0 25-Year 783.00 52.17 62.20 62.46 0.001600 5.35 670.51 385.35 0.30
Reach - 1 5500.0 50-Year 992.00 52.17 62.71 62.94 0.001554 5.45 877.41 417.82 0.30
Reach - 1 5500.0 100-Year 1228.00 52.17 63.20 63.41 0.001535 5.59 1086.27 448.23 0.30
Reach - 1 6000.0 2-Year 270.00 52.71 60.33 60.48 0.001076 3.58 147.11 43.34 0.23
Reach - 1 6000.0 10-Year 553.00 52.71 62.32 62.47 0.001064 4.17 628.18 405.56 0.24
Reach - 1 6000.0 25-Year 783.00 52.71 62.98 63.10 0.001024 4.28 902.41 425.34 0.24
Reach - 1 6000.0 50-Year 992.00 52.71 63.46 63.58 0.001018 4.41 1112.99 450.36 0.24
Reach - 1 6000.0 100-Year 1228.00 52.71 63.94 64.06 0.001095 4.71 1341.82 501.52 0.25
Reach - 1 6400 2-Year 270.00 55.71 60.92 61.09 0.002306 3.36 80.33 23.07 0.32
Reach - 1 6400 10-Year 553.00 55.71 62.66 62.69 0.000324 1.55 450.26 565.81 0.12
Reach - 1 6400 25-Year 783.00 55.71 63.19 63.22 0.000127 1.04 767.75 607.56 0.08
Reach - 1 6400 50-Year 992.00 55.71 63.63 63.66 0.000075 0.85 1037.59 618.96 0.06
2

HEC-RAS Plan: Fut_Base River: Gum Swamp Reach: Reach - 1 (Continued)
Reach River Sta Profile Q Total Min Ch El W.S. Elev Crit W.S. E.G. Elev E.G. Slope Vel Chnl Flow Area Top Width Froude # Chl
(cfs) (ft) (ft) (ft) (ft) (ft/ft) (ft/s) (sq ft) (ft)
Reach - 1 6400 100-Year 1228.00 55.71 64.10 64.12 0.000051 0.73 1340.46 703.72 0.05
Reach - 1 6909 2-Year 211.00 55.80 61.92 62.02 0.001379 2.54 83.16 25.00 0.25
Reach - 1 6909 10-Year 424.00 55.80 62.88 63.01 0.001740 3.22 326.00 339.49 0.28
Reach - 1 6909 25-Year 575.00 55.80 63.25 63.39 0.001911 3.52 455.86 360.01 0.30
Reach - 1 6909 50-Year 709.00 55.80 63.65 63.77 0.001727 3.49 603.94 384.95 0.29
Reach - 1 6909 100-Year 880.00 55.80 64.10 64.21 0.001537 3.46 785.73 422.12 0.28
Reach - 1 7470 2-Year 211.00 56.41 62.68 62.77 0.001289 2.47 85.59 29.20 0.24
Reach - 1 7470 10-Year 424.00 56.41 63.82 63.95 0.001608 3.14 301.61 326.37 0.27
Reach - 1 7470 25-Year 575.00 56.41 64.26 64.40 0.001690 3.40 469.29 417.06 0.28
Reach - 1 7470 50-Year 709.00 56.41 64.60 64.73 0.001664 3.50 614.75 452.86 0.28
Reach - 1 7470 100-Year 880.00 56.41 64.97 65.10 0.001613 3.58 792.90 491.60 0.28
Reach - 1 7628 2-Year 211.00 56.38 62.88 59.92 62.97 0.001221 2.43 86.94 25.19 0.23
Reach - 1 7628 10-Year 424.00 56.38 64.07 61.08 64.25 0.001891 3.51 162.34 291.49 0.30
Reach - 1 7628 25-Year 575.00 56.38 64.52 61.72 64.72 0.001985 3.79 312.16 364.44 0.31
Reach - 1 7628 50-Year 709.00 56.38 64.85 62.21 65.03 0.001916 3.87 440.73 410.46 0.31
Reach - 1 7628 100-Year 880.00 56.38 65.22 62.77 65.38 0.001781 3.91 600.24 456.07 0.30
Reach - 1 7705 Culvert
Reach - 1 7759 2-Year 211.00 56.45 63.22 59.84 63.30 0.000877 2.18 98.84 36.07 0.20
Reach - 1 7759 10-Year 424.00 56.45 65.18 61.04 65.22 0.000488 2.02 531.20 494.60 0.16
Reach - 1 7759 25-Year 575.00 56.45 65.39 61.69 65.45 0.000678 2.44 643.16 552.31 0.18
Reach - 1 7759 50-Year 709.00 56.45 65.52 62.17 65.60 0.000869 2.81 715.79 581.06 0.21
Reach - 1 7759 100-Year 880.00 56.45 65.67 62.74 65.77 0.001095 3.21 806.74 615.16 0.24
Reach - 1 7930 2-Year 208.00 57.33 63.39 63.49 0.001262 2.48 84.00 24.03 0.23
Reach - 1 7930 10-Year 408.00 57.33 65.27 65.32 0.000614 2.14 497.72 462.38 0.17
Reach - 1 7930 25-Year 553.00 57.33 65.52 65.58 0.000800 2.50 619.17 523.40 0.20
Reach - 1 7930 50-Year 682.00 57.33 65.68 65.76 0.000967 2.81 709.17 566.67 0.22
Reach - 1 7930 100-Year 825.00 57.33 65.88 65.96 0.001080 3.04 825.81 618.25 0.23
Reach - 1 8400 2-Year 208.00 57.72 64.06 64.17 0.001679 2.72 81.69 114.92 0.26
Reach - 1 8400 10-Year 408.00 57.72 65.60 65.65 0.000807 2.31 448.12 395.65 0.19
Reach - 1 8400 25-Year 553.00 57.72 65.92 65.98 0.000917 2.58 583.94 433.21 0.21
Reach - 1 8400 50-Year 682.00 57.72 66.15 66.22 0.000994 2.77 686.61 444.34 0.22
3

HEC-RAS Plan: Fut_Base River: Gum Swamp Reach: Reach - 1 (Continued)
Reach River Sta Profile Q Total Min Ch El W.S. Elev Crit W.S. E.G. Elev E.G. Slope Vel Chnl Flow Area Top Width Froude # Chl
(cfs) (ft) (ft) (ft) (ft) (ft/ft) (ft/s) (sq ft) (ft)
Reach - 1 8400 100-Year 825.00 57.72 66.39 66.46 0.001044 2.93 794.16 452.19 0.22
Reach - 1 8872 2-Year 208.00 59.13 64.55 64.60 0.000541 1.77 117.33 30.00 0.16
Reach - 1 8872 10-Year 408.00 59.13 65.94 66.04 0.000810 2.53 162.83 36.51 0.20
Reach - 1 8872 25-Year 553.00 59.13 66.33 66.47 0.001090 3.06 268.07 319.80 0.23
Reach - 1 8872 50-Year 682.00 59.13 66.61 66.77 0.001261 3.38 358.73 339.02 0.25
Reach - 1 8872 100-Year 825.00 59.13 66.88 67.06 0.001394 3.64 456.14 381.28 0.27
Reach - 1 9293 2-Year 86.00 60.27 64.83 64.94 0.002648 2.67 32.27 13.43 0.30
Reach - 1 9293 10-Year 173.00 60.27 66.37 66.46 0.001604 2.53 162.40 331.92 0.25
Reach - 1 9293 25-Year 237.00 60.27 66.88 66.92 0.000898 2.03 355.54 427.75 0.19
Reach - 1 9293 50-Year 295.00 60.27 67.19 67.21 0.000668 1.81 496.11 478.74 0.16
Reach - 1 9293 100-Year 361.00 60.27 67.47 67.49 0.000531 1.67 636.06 524.57 0.15
4

PRIMARY SYSTEM
ALTERNATIVE #1:
HEC‐RAS OUTPUT

HEC-RAS Plan: FINAL ALT 1 River: Swift Creek Reach: Reach-1
Reach River Sta Profile Q Total Min Ch El W.S. Elev Crit W.S. E.G. Elev E.G. Slope Vel Chnl Flow Area Top Width Froude # Chl
(cfs) (ft) (ft) (ft) (ft) (ft/ft) (ft/s) (sq ft) (ft)
Reach-1 234198 2-year 270.00 51.54 56.08 54.49 56.34 0.003004 4.14 80.97 64.99 0.40
Reach-1 234198 10-year 538.00 51.54 57.21 55.69 57.50 0.003002 4.89 353.68 382.35 0.41
Reach-1 234198 25-year 735.00 51.54 57.64 57.06 57.92 0.003001 5.20 532.83 442.28 0.41
Reach-1 234198 50-year 917.00 51.54 57.96 57.37 58.23 0.003001 5.42 677.98 475.35 0.42
Reach-1 234198 100-year 1121.00 51.54 58.27 57.61 58.53 0.003000 5.63 828.71 492.80 0.42
Reach-1 234875 2-year 270.00 52.10 57.39 57.49 0.001062 2.82 225.60 306.90 0.24
Reach-1 234875 10-year 538.00 52.10 58.39 58.45 0.000759 2.75 635.31 465.86 0.21
Reach-1 234875 25-year 735.00 52.10 58.81 58.86 0.000757 2.90 840.11 520.59 0.22
Reach-1 234875 50-year 917.00 52.10 59.12 59.18 0.000774 3.04 1012.65 559.11 0.22
Reach-1 234875 100-year 1121.00 52.10 59.43 59.48 0.000766 3.13 1186.63 574.99 0.22
Reach-1 235139 2-year 270.00 51.75 57.65 54.13 57.71 0.000573 2.12 232.59 324.27 0.18
Reach-1 235139 10-year 538.00 51.75 58.57 55.30 58.62 0.000555 2.29 624.54 494.92 0.18
Reach-1 235139 25-year 735.00 51.75 58.98 55.99 59.03 0.000549 2.41 837.32 526.50 0.18
Reach-1 235139 50-year 917.00 51.75 59.30 56.55 59.35 0.000557 2.52 1011.12 566.39 0.19
Reach-1 235139 100-year 1121.00 51.75 59.60 58.05 59.65 0.000571 2.64 1187.17 589.19 0.19
Reach-1 235165 Bridge
Reach-1 235183 2-year 270.00 51.76 58.11 54.21 58.16 0.000338 1.80 149.75 337.51 0.15
Reach-1 235183 10-year 538.00 51.76 59.61 55.28 59.63 0.000164 1.44 992.11 525.62 0.11
Reach-1 235183 25-year 735.00 51.76 59.87 55.88 59.89 0.000234 1.77 1131.11 549.21 0.13
Reach-1 235183 50-year 917.00 51.76 60.04 56.37 60.08 0.000303 2.06 1227.71 553.18 0.15
Reach-1 235183 100-year 1121.00 51.76 60.20 56.83 60.24 0.000387 2.36 1314.25 557.06 0.17
Reach-1 235196 2-year 270.00 52.47 58.09 55.33 58.19 0.000999 2.60 103.66 512.38 0.24
Reach-1 235196 10-year 538.00 52.47 59.61 56.49 59.64 0.000299 1.77 715.75 601.77 0.14
Reach-1 235196 25-year 735.00 52.47 59.91 57.12 59.91 0.000076 0.93 2081.37 605.20 0.07
Reach-1 235196 50-year 917.00 52.47 60.10 57.58 60.10 0.000101 1.09 2195.40 607.25 0.08
Reach-1 235196 100-year 1121.00 52.47 60.27 58.06 60.28 0.000131 1.27 2299.81 610.93 0.09
Reach-1 235219 Culvert
Reach-1 235247 2-year 270.00 53.17 59.08 56.39 59.10 0.000363 1.54 396.84 493.58 0.15
Reach-1 235247 10-year 538.00 53.17 59.66 57.43 59.71 0.000634 2.24 570.04 515.57 0.20
Reach-1 235247 25-year 735.00 53.17 59.96 58.04 59.99 0.000371 1.80 1083.36 530.88 0.16
Reach-1 235247 50-year 917.00 53.17 60.14 58.48 60.17 0.000462 2.05 1177.20 541.34 0.17
1

HEC-RAS Plan: FINAL ALT 1 River: Swift Creek Reach: Reach-1 (Continued)
Reach River Sta Profile Q Total Min Ch El W.S. Elev Crit W.S. E.G. Elev E.G. Slope Vel Chnl Flow Area Top Width Froude # Chl
(cfs) (ft) (ft) (ft) (ft) (ft/ft) (ft/s) (sq ft) (ft)
Reach-1 235247 100-year 1121.00 53.17 60.34 58.88 60.37 0.000546 2.29 1285.33 558.51 0.19
Reach-1 235428 2-year 260.00 53.13 59.13 56.19 59.16 0.000349 1.75 452.33 287.61 0.15
Reach-1 235428 10-year 509.00 53.13 59.75 57.70 59.81 0.000646 2.60 641.38 319.48 0.21
Reach-1 235428 25-year 705.00 53.13 60.01 58.33 60.10 0.000942 3.25 724.11 328.78 0.25
Reach-1 235428 50-year 872.00 53.13 60.19 58.58 60.31 0.001191 3.74 785.18 339.97 0.28
Reach-1 235428 100-year 1062.00 53.13 60.40 58.81 60.54 0.001444 4.22 854.38 369.28 0.31
Reach-1 235914 2-year 260.00 53.95 59.22 59.22 0.000054 0.72 865.04 312.08 0.06
Reach-1 235914 10-year 509.00 53.95 59.92 59.92 0.000106 1.12 1093.51 340.82 0.09
Reach-1 235914 25-year 705.00 53.95 60.25 60.26 0.000156 1.41 1208.91 358.50 0.10
Reach-1 235914 50-year 872.00 53.95 60.50 60.51 0.000198 1.63 1300.35 377.01 0.12
Reach-1 235914 100-year 1062.00 53.95 60.76 60.78 0.000236 1.84 1402.41 384.42 0.13
Reach-1 236412 2-year 260.00 54.78 59.26 59.26 0.000145 0.95 619.46 367.34 0.09
Reach-1 236412 10-year 509.00 54.78 59.99 60.00 0.000212 1.31 916.64 423.40 0.12
Reach-1 236412 25-year 705.00 54.78 60.35 60.36 0.000270 1.57 1071.25 438.23 0.13
Reach-1 236412 50-year 872.00 54.78 60.62 60.63 0.000311 1.75 1191.42 449.41 0.14
Reach-1 236412 100-year 1062.00 54.78 60.90 60.92 0.000348 1.93 1322.41 461.30 0.15
Reach-1 236856 2-year 260.00 54.38 59.33 59.34 0.000193 1.07 504.01 226.21 0.10
Reach-1 236856 10-year 509.00 54.38 60.10 60.11 0.000300 1.47 708.12 311.40 0.13
Reach-1 236856 25-year 705.00 54.38 60.49 60.51 0.000382 1.77 834.51 336.71 0.15
Reach-1 236856 50-year 872.00 54.38 60.78 60.81 0.000441 1.99 935.54 358.62 0.16
Reach-1 236856 100-year 1062.00 54.38 61.09 61.12 0.000494 2.20 1049.75 382.59 0.18
Reach-1 237179 2-year 260.00 55.37 59.42 59.43 0.000423 1.55 376.85 208.09 0.16
Reach-1 237179 10-year 509.00 55.37 60.22 60.24 0.000543 2.06 556.97 244.83 0.19
Reach-1 237179 25-year 705.00 55.37 60.64 60.67 0.000651 2.41 663.26 263.29 0.21
Reach-1 237179 50-year 872.00 55.37 60.95 60.99 0.000725 2.67 747.14 275.29 0.22
Reach-1 237179 100-year 1062.00 55.37 61.27 61.32 0.000788 2.91 837.05 280.22 0.23
Reach-1 237456 2-year 260.00 55.98 59.56 58.71 59.67 0.002223 3.36 156.68 130.20 0.35
Reach-1 237456 10-year 509.00 55.98 60.39 59.27 60.54 0.002555 4.27 262.51 234.09 0.39
Reach-1 237456 25-year 705.00 55.98 60.84 59.61 61.01 0.002717 4.76 344.92 265.79 0.42
Reach-1 237456 50-year 872.00 55.98 61.17 59.87 61.35 0.002779 5.07 412.46 291.72 0.43
Reach-1 237456 100-year 1062.00 55.98 61.51 60.13 61.70 0.002779 5.33 486.08 302.53 0.43
2

HEC-RAS Plan: FINAL ALT 1 River: Swift Creek Reach: Reach-1 (Continued)
Reach River Sta Profile Q Total Min Ch El W.S. Elev Crit W.S. E.G. Elev E.G. Slope Vel Chnl Flow Area Top Width Froude # Chl
(cfs) (ft) (ft) (ft) (ft) (ft/ft) (ft/s) (sq ft) (ft)
Reach-1 237708 2-year 260.00 56.29 59.92 57.67 59.98 0.000643 2.01 172.19 130.41 0.19
Reach-1 237708 10-year 509.00 56.29 60.87 58.57 60.98 0.001031 2.93 233.12 170.88 0.24
Reach-1 237708 25-year 705.00 56.29 61.37 58.99 61.53 0.001346 3.55 265.57 258.64 0.28
Reach-1 237708 50-year 872.00 56.29 61.70 59.28 61.77 0.000768 2.79 624.35 337.45 0.21
Reach-1 237708 100-year 1062.00 56.29 62.07 59.59 62.15 0.000840 3.05 762.27 419.59 0.23
Reach-1 237781 Culvert
Reach-1 237845 2-year 260.00 56.31 60.09 57.90 60.18 0.001043 2.46 105.58 125.05 0.24
Reach-1 237845 10-year 509.00 56.31 61.30 58.67 61.49 0.001519 3.50 161.63 294.35 0.29
Reach-1 237845 25-year 705.00 56.31 62.17 59.19 62.41 0.001588 3.97 220.03 358.75 0.30
Reach-1 237845 50-year 872.00 56.31 62.84 59.57 62.97 0.000985 3.38 646.65 402.28 0.24
Reach-1 237845 100-year 1062.00 56.31 63.19 60.00 63.34 0.001119 3.74 742.45 433.24 0.26
Reach-1 238094 2-year 243.00 56.52 60.32 58.96 60.33 0.000294 1.28 443.06 308.05 0.13
Reach-1 238094 10-year 445.00 56.52 61.63 59.20 61.64 0.000181 1.29 781.29 364.00 0.11
Reach-1 238094 25-year 588.00 56.52 62.56 59.34 62.57 0.000137 1.27 1036.22 398.62 0.10
Reach-1 238094 50-year 710.00 56.52 63.08 59.45 63.08 0.000134 1.34 1195.50 476.46 0.10
Reach-1 238094 100-year 852.00 56.52 63.46 59.55 63.47 0.000145 1.46 1340.88 551.42 0.10
Reach-1 238526 2-year 243.00 56.20 60.45 58.11 60.47 0.000326 1.58 286.08 131.69 0.14
Reach-1 238526 10-year 445.00 56.20 61.72 59.07 61.75 0.000297 1.83 460.09 141.81 0.14
Reach-1 238526 25-year 588.00 56.20 62.62 59.33 62.66 0.000255 1.89 591.36 148.99 0.14
Reach-1 238526 50-year 710.00 56.20 63.14 59.51 63.17 0.000263 2.03 669.08 153.08 0.14
Reach-1 238526 100-year 852.00 56.20 63.53 59.70 63.57 0.000296 2.24 734.70 194.79 0.15
Reach-1 238936 2-year 243.00 56.88 60.64 58.96 60.71 0.001049 2.34 137.26 63.16 0.25
Reach-1 238936 10-year 445.00 56.88 61.88 59.69 61.97 0.000956 2.73 218.10 67.11 0.25
Reach-1 238936 25-year 588.00 56.88 62.75 60.00 62.85 0.000832 2.83 277.85 69.89 0.24
Reach-1 238936 50-year 710.00 56.88 63.26 60.24 63.38 0.000852 3.02 314.10 71.52 0.24
Reach-1 238936 100-year 852.00 56.88 63.66 60.50 63.80 0.000938 3.33 343.28 75.46 0.26
Reach-1 239177 2-year 243.00 57.85 61.03 60.68 61.25 0.005554 4.50 97.72 78.43 0.54
Reach-1 239177 10-year 445.00 57.85 62.20 61.12 62.36 0.002770 4.24 190.74 81.18 0.41
Reach-1 239177 25-year 588.00 57.85 63.01 61.39 63.16 0.001966 4.14 257.70 83.10 0.36
Reach-1 239177 50-year 710.00 57.85 63.53 61.58 63.68 0.001804 4.28 300.46 84.30 0.35
Reach-1 239177 100-year 852.00 57.85 63.95 61.80 64.12 0.001849 4.59 336.15 85.29 0.36
3

HEC-RAS Plan: FINAL ALT 1 River: Swift Creek Reach: Reach-1 (Continued)
Reach River Sta Profile Q Total Min Ch El W.S. Elev Crit W.S. E.G. Elev E.G. Slope Vel Chnl Flow Area Top Width Froude # Chl
(cfs) (ft) (ft) (ft) (ft) (ft/ft) (ft/s) (sq ft) (ft)
Reach-1 239470 2-year 243.00 57.77 61.95 59.95 62.10 0.001677 3.08 78.99 24.77 0.30
Reach-1 239470 10-year 445.00 57.77 62.93 60.79 63.21 0.002541 4.27 104.25 26.81 0.38
Reach-1 239470 25-year 588.00 57.77 63.60 61.29 63.96 0.002792 4.79 122.81 28.21 0.40
Reach-1 239470 50-year 710.00 57.77 64.08 61.68 64.50 0.003031 5.20 136.44 29.20 0.42
Reach-1 239470 100-year 852.00 57.77 64.51 62.10 65.02 0.003394 5.71 149.30 30.10 0.45
Reach-1 239543 Culvert
Reach-1 239601 2-year 243.00 57.56 63.12 59.95 63.21 0.000796 2.41 101.01 25.35 0.21
Reach-1 239601 10-year 445.00 57.56 65.90 60.88 65.99 0.000526 2.46 186.48 136.69 0.18
Reach-1 239601 25-year 588.00 57.56 66.44 61.43 66.57 0.000688 2.95 208.81 177.86 0.21
Reach-1 239601 50-year 710.00 57.56 67.78 61.85 67.85 0.000335 2.35 521.48 349.89 0.15
Reach-1 239601 100-year 852.00 57.56 68.19 62.29 68.27 0.000358 2.51 607.16 389.85 0.16
Reach-1 239904 2-year 216.00 58.41 63.45 61.29 63.65 0.002609 3.55 60.92 20.22 0.36
Reach-1 239904 10-year 389.00 58.41 66.10 62.36 66.24 0.001236 2.98 130.58 34.10 0.26
Reach-1 239904 25-year 512.00 58.41 66.70 63.04 66.88 0.001466 3.39 162.83 102.28 0.28
Reach-1 239904 50-year 617.00 58.41 67.92 63.53 68.00 0.000708 2.56 438.62 323.82 0.20
Reach-1 239904 100-year 737.00 58.41 68.33 63.99 68.41 0.000638 2.56 567.98 358.67 0.19
Reach-1 240316 2-year 216.00 59.47 64.78 65.13 0.004858 4.74 45.54 14.50 0.47
Reach-1 240316 10-year 389.00 59.47 66.76 67.10 0.003436 4.77 104.03 86.17 0.41
Reach-1 240316 25-year 512.00 59.47 67.46 67.75 0.003018 4.71 186.94 151.11 0.39
Reach-1 240316 50-year 617.00 59.47 68.29 68.45 0.001663 3.79 353.56 249.68 0.29
Reach-1 240316 100-year 737.00 59.47 68.67 68.81 0.001502 3.74 456.80 289.87 0.28
Reach-1 240800 2-year 216.00 60.78 66.36 66.52 0.001869 3.22 69.30 34.17 0.31
Reach-1 240800 10-year 389.00 60.78 67.97 68.13 0.001405 3.35 161.35 72.13 0.28
Reach-1 240800 25-year 512.00 60.78 68.56 68.72 0.001403 3.56 245.84 176.49 0.28
Reach-1 240800 50-year 617.00 60.78 69.01 69.16 0.001302 3.58 334.52 220.14 0.28
Reach-1 240800 100-year 737.00 60.78 69.35 69.51 0.001353 3.77 416.87 264.31 0.28
Reach-1 241107 2-year 216.00 61.47 66.99 67.17 0.002374 3.48 70.23 43.48 0.35
Reach-1 241107 10-year 389.00 61.47 68.46 68.60 0.001647 3.33 211.26 164.62 0.30
Reach-1 241107 25-year 512.00 61.47 69.04 69.16 0.001409 3.28 324.64 224.08 0.28
Reach-1 241107 50-year 617.00 61.47 69.45 69.55 0.001243 3.24 424.57 264.77 0.27
Reach-1 241107 100-year 737.00 61.47 69.80 69.90 0.001175 3.27 523.89 299.77 0.26
4

HEC-RAS Plan: FINAL ALT 1 River: Swift Creek Reach: Reach-1 (Continued)
Reach River Sta Profile Q Total Min Ch El W.S. Elev Crit W.S. E.G. Elev E.G. Slope Vel Chnl Flow Area Top Width Froude # Chl
(cfs) (ft) (ft) (ft) (ft) (ft/ft) (ft/s) (sq ft) (ft)
Reach-1 241592 2-year 165.00 62.40 67.83 67.91 0.000927 2.28 72.37 22.40 0.22
Reach-1 241592 10-year 301.00 62.40 69.13 69.23 0.001004 2.72 149.77 111.21 0.24
Reach-1 241592 25-year 398.00 62.40 69.64 69.75 0.001043 2.95 216.97 152.76 0.25
Reach-1 241592 50-year 484.00 62.40 70.00 70.12 0.001068 3.10 279.00 195.86 0.25
Reach-1 241592 100-year 578.00 62.40 70.33 70.45 0.001067 3.21 358.63 261.46 0.26
Reach-1 241994 2-year 165.00 63.58 68.22 68.31 0.001061 2.36 69.98 26.93 0.24
Reach-1 241994 10-year 301.00 63.58 69.54 69.65 0.001085 2.74 143.92 85.04 0.25
Reach-1 241994 25-year 398.00 63.58 70.07 70.20 0.001169 3.05 198.89 187.93 0.26
Reach-1 241994 50-year 484.00 63.58 70.44 70.57 0.001149 3.17 283.38 271.55 0.26
Reach-1 241994 100-year 578.00 63.58 70.76 70.89 0.001103 3.22 383.82 343.43 0.26
5

HEC-RAS Plan: FINAL ALT 1 River: Swift Creek UT1 Reach: Reach1
Reach River Sta Profile Q Total Min Ch El W.S. Elev Crit W.S. E.G. Elev E.G. Slope Vel Chnl Flow Area Top Width Froude # Chl
(cfs) (ft) (ft) (ft) (ft) (ft/ft) (ft/s) (sq ft) (ft)
Reach1 231 2-Year 185.00 53.45 56.49 56.32 56.61 0.004004 3.51 130.26 218.19 0.44
Reach1 231 10-Year 351.00 53.45 56.90 56.57 57.01 0.004002 3.91 220.17 219.24 0.45
Reach1 231 25-Year 466.00 53.45 57.13 56.72 57.24 0.004003 4.12 270.39 219.83 0.46
Reach1 231 50-Year 573.00 53.45 57.32 56.82 57.44 0.004001 4.29 312.39 220.32 0.46
Reach1 231 100-Year 693.00 53.45 57.51 56.93 57.64 0.004007 4.46 355.42 220.82 0.46
Reach1 584 2-Year 185.00 53.78 57.17 57.20 0.000906 1.85 222.78 179.29 0.22
Reach1 584 10-Year 351.00 53.78 57.68 57.72 0.001200 2.38 315.02 184.67 0.26
Reach1 584 25-Year 466.00 53.78 57.95 58.00 0.001356 2.67 366.35 187.59 0.27
Reach1 584 50-Year 573.00 53.78 58.18 58.23 0.001477 2.90 409.15 190.00 0.29
Reach1 584 100-Year 693.00 53.78 58.41 58.47 0.001594 3.13 453.14 192.49 0.30
Reach1 1005 2-Year 185.00 54.86 57.84 58.10 0.007153 4.55 61.83 58.05 0.59
Reach1 1005 10-Year 351.00 54.86 58.50 58.78 0.006434 5.13 144.92 153.56 0.58
Reach1 1005 25-Year 466.00 54.86 58.84 59.08 0.005470 5.09 199.01 176.92 0.55
Reach1 1005 50-Year 573.00 54.86 59.10 59.33 0.004950 5.15 246.70 184.38 0.53
Reach1 1005 100-Year 693.00 54.86 59.37 59.59 0.004585 5.25 295.98 191.69 0.52
Reach1 1429 2-Year 136.00 54.48 58.73 58.76 0.000497 1.62 145.86 66.69 0.17
Reach1 1429 10-Year 267.00 54.48 59.55 59.60 0.000739 2.33 201.88 70.86 0.21
Reach1 1429 25-Year 358.00 54.48 59.91 59.98 0.000932 2.78 227.87 72.72 0.24
Reach1 1429 50-Year 440.00 54.48 60.20 60.28 0.001087 3.15 249.04 74.20 0.27
Reach1 1429 100-Year 522.00 54.48 60.48 60.58 0.001212 3.46 269.91 75.62 0.28
Reach1 1546 2-Year 136.00 55.50 58.78 56.35 58.80 0.000311 1.29 105.24 32.81 0.13
Reach1 1546 10-Year 267.00 55.50 59.62 56.82 59.68 0.000584 2.01 132.86 33.03 0.18
Reach1 1546 25-Year 358.00 55.50 60.00 57.10 60.09 0.000797 2.46 145.43 33.12 0.21
Reach1 1546 50-Year 440.00 55.50 60.30 57.33 60.42 0.000984 2.83 155.45 33.20 0.23
Reach1 1546 100-Year 522.00 55.50 60.59 57.55 60.74 0.001156 3.16 165.06 33.27 0.25
Reach1 1588.5 Culvert
Reach1 1635 2-Year 136.00 55.72 58.85 57.01 58.89 0.000600 1.62 84.21 31.90 0.18
Reach1 1635 10-Year 267.00 55.72 59.90 57.49 59.98 0.000815 2.27 117.87 32.32 0.21
Reach1 1635 25-Year 358.00 55.72 60.54 57.77 60.65 0.000890 2.58 138.80 32.57 0.22
Reach1 1635 50-Year 440.00 55.72 61.04 58.01 61.17 0.000954 2.84 155.14 33.34 0.23
Reach1 1635 100-Year 522.00 55.72 61.46 58.23 61.61 0.001026 3.09 169.33 34.52 0.24
1

HEC-RAS Plan: FINAL ALT 1 River: Swift Creek UT1 Reach: Reach1 (Continued)
Reach River Sta Profile Q Total Min Ch El W.S. Elev Crit W.S. E.G. Elev E.G. Slope Vel Chnl Flow Area Top Width Froude # Chl
(cfs) (ft) (ft) (ft) (ft) (ft/ft) (ft/s) (sq ft) (ft)
Reach1 1798 2-Year 96.00 56.04 58.97 59.05 0.001741 2.27 42.34 22.95 0.29
Reach1 1798 10-Year 183.00 56.04 60.05 60.16 0.001547 2.64 69.32 27.02 0.29
Reach1 1798 25-Year 249.00 56.04 60.71 60.83 0.001434 2.84 87.92 30.21 0.29
Reach1 1798 50-Year 303.00 56.04 61.21 61.35 0.001313 2.95 103.99 33.25 0.28
Reach1 1798 100-Year 362.00 56.04 61.64 61.79 0.001298 3.12 118.82 35.83 0.28
Reach1 2289 2-Year 96.00 56.55 60.32 59.48 60.56 0.006175 3.89 24.68 14.09 0.52
Reach1 2289 10-Year 183.00 56.55 61.26 61.59 0.006345 4.61 39.71 18.07 0.55
Reach1 2289 25-Year 249.00 56.55 61.81 62.19 0.006234 4.94 50.39 20.43 0.55
Reach1 2289 50-Year 303.00 56.55 62.22 62.63 0.006051 5.13 59.05 22.16 0.55
Reach1 2289 100-Year 362.00 56.55 62.61 63.05 0.005734 5.31 68.16 24.67 0.56
Reach1 2669 2-Year 96.00 57.94 62.00 62.12 0.002881 2.76 34.75 19.34 0.36
Reach1 2669 10-Year 183.00 57.94 63.04 63.20 0.002981 3.13 58.42 26.07 0.37
Reach1 2669 25-Year 249.00 57.94 63.65 63.82 0.003075 3.30 75.55 30.17 0.37
Reach1 2669 50-Year 303.00 57.94 64.07 64.25 0.003117 3.41 88.81 32.99 0.37
Reach1 2669 100-Year 362.00 57.94 64.46 64.66 0.003180 3.54 102.23 35.63 0.37
Reach1 2906 2-Year 96.00 58.90 62.32 59.95 62.35 0.000419 1.41 68.28 24.98 0.15
Reach1 2906 10-Year 183.00 58.90 63.43 60.49 63.48 0.000552 1.87 97.70 28.22 0.18
Reach1 2906 25-Year 249.00 58.90 64.06 60.82 64.13 0.000630 2.14 116.23 30.09 0.19
Reach1 2906 50-Year 303.00 58.90 64.50 61.07 64.59 0.000688 2.34 129.66 31.37 0.20
Reach1 2906 100-Year 362.00 58.90 64.91 61.32 65.01 0.000753 2.54 142.79 32.58 0.21
Reach1 2952.5 Culvert
Reach1 3015 2-Year 96.00 59.40 62.41 60.37 62.45 0.000530 1.51 63.64 25.14 0.17
Reach1 3015 10-Year 183.00 59.40 63.69 60.87 63.75 0.000555 1.87 97.99 28.55 0.18
Reach1 3015 25-Year 249.00 59.40 64.59 61.18 64.65 0.000519 2.00 124.71 30.94 0.18
Reach1 3015 50-Year 303.00 59.40 65.17 61.42 65.24 0.000517 2.12 143.24 35.04 0.18
Reach1 3015 100-Year 362.00 59.40 65.61 61.66 65.69 0.000549 2.30 160.19 41.72 0.18
Reach1 3270 2-Year 80.00 59.93 62.64 62.72 0.003297 2.76 56.86 102.20 0.38
Reach1 3270 10-Year 160.00 59.93 63.88 63.90 0.000625 1.76 188.93 110.87 0.18
Reach1 3270 25-Year 216.00 59.93 64.76 64.77 0.000327 1.52 288.48 116.98 0.14
Reach1 3270 50-Year 267.00 59.93 65.33 65.35 0.000265 1.51 356.97 121.00 0.13
Reach1 3270 100-Year 325.00 59.93 65.79 65.80 0.000254 1.58 412.84 124.19 0.13
2

HEC-RAS Plan: FINAL ALT 1 River: Swift Creek UT1 Reach: Reach1 (Continued)
Reach River Sta Profile Q Total Min Ch El W.S. Elev Crit W.S. E.G. Elev E.G. Slope Vel Chnl Flow Area Top Width Froude # Chl
(cfs) (ft) (ft) (ft) (ft) (ft/ft) (ft/s) (sq ft) (ft)
Reach1 3690 2-Year 80.00 59.63 63.33 63.36 0.000851 1.70 92.64 70.02 0.20
Reach1 3690 10-Year 160.00 59.63 64.17 64.20 0.000792 2.01 154.25 77.01 0.20
Reach1 3690 25-Year 216.00 59.63 64.92 64.95 0.000556 1.94 214.46 83.28 0.17
Reach1 3690 50-Year 267.00 59.63 65.47 65.49 0.000480 1.97 261.16 87.83 0.16
Reach1 3690 100-Year 325.00 59.63 65.92 65.95 0.000470 2.07 301.53 91.59 0.16
Reach1 3808 2-Year 80.00 59.63 63.43 63.45 0.000701 1.58 99.25 70.80 0.18
Reach1 3808 10-Year 160.00 59.63 64.26 64.29 0.000697 1.92 161.21 77.76 0.19
Reach1 3808 25-Year 216.00 59.63 64.99 65.01 0.000518 1.89 219.82 83.81 0.17
Reach1 3808 50-Year 267.00 59.63 65.52 65.55 0.000455 1.93 266.07 88.30 0.16
Reach1 3808 100-Year 325.00 59.63 65.97 66.00 0.000448 2.04 306.55 92.04 0.16
Reach1 3936 2-Year 80.00 59.42 63.53 61.88 63.62 0.001836 2.47 32.39 14.53 0.29
Reach1 3936 10-Year 160.00 59.42 64.34 62.69 64.54 0.002999 3.54 45.18 16.93 0.38
Reach1 3936 25-Year 216.00 59.42 65.02 63.13 65.24 0.002879 3.76 57.38 18.95 0.38
Reach1 3936 50-Year 267.00 59.42 65.53 63.48 65.78 0.002845 3.95 67.52 20.47 0.38
Reach1 3936 100-Year 325.00 59.42 65.97 63.84 66.25 0.003002 4.24 76.65 21.75 0.40
Reach1 3967.5 Culvert
Reach1 3997 2-Year 80.00 61.44 63.65 63.65 64.27 0.024659 6.31 12.68 10.31 1.00
Reach1 3997 10-Year 160.00 61.44 64.94 64.44 65.41 0.010534 5.48 29.22 15.40 0.70
Reach1 3997 25-Year 216.00 61.44 66.03 64.86 66.34 0.004992 4.46 48.49 27.13 0.50
Reach1 3997 50-Year 267.00 61.44 67.08 65.18 67.20 0.001687 3.07 143.29 198.40 0.30
Reach1 3997 100-Year 325.00 61.44 67.36 65.52 67.45 0.001416 2.93 219.95 249.69 0.28
Reach1 4120 2-Year 70.00 61.75 65.06 65.16 0.002355 2.49 28.08 15.91 0.33
Reach1 4120 10-Year 142.00 61.75 65.97 66.13 0.002846 3.20 44.43 19.95 0.38
Reach1 4120 25-Year 194.00 61.75 66.64 66.77 0.001979 3.04 94.97 122.16 0.33
Reach1 4120 50-Year 241.00 61.75 67.32 67.36 0.000723 2.05 207.55 191.13 0.20
Reach1 4120 100-Year 293.00 61.75 67.55 67.59 0.000644 2.00 252.99 202.63 0.19
Reach1 4307.5* 2-Year 70.00 62.35 65.55 65.68 0.003141 2.91 24.03 12.89 0.38
Reach1 4307.5* 10-Year 142.00 62.35 66.54 66.75 0.003673 3.70 38.41 16.05 0.42
Reach1 4307.5* 25-Year 194.00 62.35 67.06 67.32 0.003957 4.11 47.24 21.05 0.44
Reach1 4307.5* 50-Year 241.00 62.35 67.41 65.95 67.70 0.004015 4.36 69.06 120.68 0.45
Reach1 4307.5* 100-Year 293.00 62.35 67.61 66.28 67.91 0.004205 4.62 97.12 158.69 0.47
3

HEC-RAS Plan: FINAL ALT 1 River: Swift Creek UT1 Reach: Reach1 (Continued)
Reach River Sta Profile Q Total Min Ch El W.S. Elev Crit W.S. E.G. Elev E.G. Slope Vel Chnl Flow Area Top Width Froude # Chl
(cfs) (ft) (ft) (ft) (ft) (ft/ft) (ft/s) (sq ft) (ft)
Reach1 4495 2-Year 70.00 62.94 66.19 66.37 0.004163 3.37 20.75 10.07 0.41
Reach1 4495 10-Year 142.00 62.94 67.28 67.57 0.004946 4.30 33.02 12.43 0.46
Reach1 4495 25-Year 194.00 62.94 67.85 68.21 0.005373 4.79 40.46 13.66 0.49
Reach1 4495 50-Year 241.00 62.94 68.22 66.79 68.63 0.005730 5.21 54.54 93.64 0.51
Reach1 4495 100-Year 293.00 62.94 68.45 67.18 68.88 0.005895 5.48 84.49 150.27 0.52
4

HEC-RAS Plan: FINAL ALT 1 River: Gum Swamp Reach: Reach - 1
Reach River Sta Profile Q Total Min Ch El W.S. Elev Crit W.S. E.G. Elev E.G. Slope Vel Chnl Flow Area Top Width Froude # Chl
(cfs) (ft) (ft) (ft) (ft) (ft/ft) (ft/s) (sq ft) (ft)
Reach - 1 663.5 2-Year 336.00 46.81 53.28 50.55 53.72 0.002603 5.48 82.31 33.59 0.39
Reach - 1 663.5 10-Year 686.00 46.81 54.96 52.64 55.40 0.002602 6.42 386.07 304.64 0.40
Reach - 1 663.5 25-Year 947.00 46.81 55.50 55.09 55.89 0.002602 6.71 558.52 330.92 0.41
Reach - 1 663.5 50-Year 1182.00 46.81 55.91 55.35 56.27 0.002603 6.92 696.42 350.52 0.41
Reach - 1 663.5 100-Year 1442.00 46.81 56.31 55.57 56.65 0.002601 7.13 844.15 390.17 0.41
Reach - 1 1000.0 2-Year 336.00 46.98 54.12 54.27 0.001017 3.67 251.85 229.96 0.25
Reach - 1 1000.0 10-Year 686.00 46.98 55.77 55.86 0.000742 3.61 779.10 381.23 0.22
Reach - 1 1000.0 25-Year 947.00 46.98 56.29 56.38 0.000835 3.98 982.69 402.17 0.23
Reach - 1 1000.0 50-Year 1182.00 46.98 56.68 56.78 0.000903 4.26 1144.41 418.06 0.24
Reach - 1 1000.0 100-Year 1442.00 46.98 57.08 57.17 0.000960 4.51 1311.45 433.86 0.25
Reach - 1 1500.0 2-Year 336.00 47.40 54.64 54.91 0.001464 4.45 132.22 87.24 0.30
Reach - 1 1500.0 10-Year 686.00 47.40 56.16 56.45 0.001677 5.43 483.32 402.55 0.33
Reach - 1 1500.0 25-Year 947.00 47.40 56.75 57.02 0.001764 5.82 759.76 525.76 0.34
Reach - 1 1500.0 50-Year 1182.00 47.40 57.18 57.40 0.001571 5.66 994.40 549.23 0.32
Reach - 1 1500.0 100-Year 1442.00 47.40 57.60 57.78 0.001443 5.58 1228.50 571.70 0.31
Reach - 1 2000.0 2-Year 336.00 47.83 55.01 55.02 0.000061 0.86 753.98 158.06 0.06
Reach - 1 2000.0 10-Year 686.00 47.83 56.60 56.61 0.000098 1.25 1156.02 385.68 0.08
Reach - 1 2000.0 25-Year 947.00 47.83 57.20 57.21 0.000132 1.52 1395.49 409.75 0.09
Reach - 1 2000.0 50-Year 1182.00 47.83 57.59 57.61 0.000165 1.74 1559.14 422.84 0.10
Reach - 1 2000.0 100-Year 1442.00 47.83 57.99 58.01 0.000200 1.97 1734.48 454.86 0.11
Reach - 1 2535.0 2-Year 336.00 48.54 55.06 55.07 0.000195 1.44 468.44 120.48 0.10
Reach - 1 2535.0 10-Year 686.00 48.54 56.68 56.70 0.000355 2.26 762.94 317.70 0.14
Reach - 1 2535.0 25-Year 947.00 48.54 57.30 57.33 0.000409 2.55 984.46 380.96 0.15
Reach - 1 2535.0 50-Year 1182.00 48.54 57.72 57.75 0.000465 2.80 1151.65 430.49 0.17
Reach - 1 2535.0 100-Year 1442.00 48.54 58.14 58.18 0.000514 3.04 1349.91 501.59 0.17
Reach - 1 3000.0 2-Year 301.00 48.92 55.13 55.13 0.000084 0.90 642.35 155.59 0.07
Reach - 1 3000.0 10-Year 617.00 48.92 56.80 56.81 0.000142 1.38 924.16 195.36 0.09
Reach - 1 3000.0 25-Year 852.00 48.92 57.45 57.47 0.000202 1.74 1070.55 276.90 0.11
Reach - 1 3000.0 50-Year 1073.00 48.92 57.89 57.91 0.000246 1.99 1207.00 332.41 0.12
Reach - 1 3000.0 100-Year 1324.00 48.92 58.33 58.36 0.000284 2.21 1368.15 400.80 0.13
Reach - 1 3500.0 2-Year 301.00 49.52 55.18 55.19 0.000154 1.15 550.72 173.85 0.09
Reach - 1 3500.0 10-Year 617.00 49.52 56.88 56.89 0.000189 1.52 882.87 218.26 0.10
1

HEC-RAS Plan: FINAL ALT 1 River: Gum Swamp Reach: Reach - 1 (Continued)
Reach River Sta Profile Q Total Min Ch El W.S. Elev Crit W.S. E.G. Elev E.G. Slope Vel Chnl Flow Area Top Width Froude # Chl
(cfs) (ft) (ft) (ft) (ft) (ft/ft) (ft/s) (sq ft) (ft)
Reach - 1 3500.0 25-Year 852.00 49.52 57.56 57.58 0.000237 1.81 1051.17 287.46 0.11
Reach - 1 3500.0 50-Year 1073.00 49.52 58.02 58.04 0.000280 2.04 1197.52 365.63 0.13
Reach - 1 3500.0 100-Year 1324.00 49.52 58.48 58.51 0.000317 2.26 1380.27 417.95 0.13
Reach - 1 4000.0 2-Year 301.00 50.17 55.28 55.29 0.000269 1.41 419.49 131.91 0.11
Reach - 1 4000.0 10-Year 617.00 50.17 56.99 57.01 0.000291 1.79 650.21 138.18 0.12
Reach - 1 4000.0 25-Year 852.00 50.17 57.70 57.72 0.000364 2.14 749.34 143.79 0.14
Reach - 1 4000.0 50-Year 1073.00 50.17 58.19 58.22 0.000460 2.52 822.96 156.37 0.16
Reach - 1 4000.0 100-Year 1324.00 50.17 58.67 58.72 0.000563 2.90 905.08 198.04 0.18
Reach - 1 4500.0 2-Year 301.00 51.25 55.49 55.51 0.000808 2.14 300.85 138.07 0.19
Reach - 1 4500.0 10-Year 617.00 51.25 57.18 57.21 0.000579 2.29 555.04 162.37 0.17
Reach - 1 4500.0 25-Year 852.00 51.25 57.93 57.96 0.000621 2.58 679.91 173.24 0.18
Reach - 1 4500.0 50-Year 1073.00 51.25 58.46 58.50 0.000686 2.86 774.95 181.89 0.19
Reach - 1 4500.0 100-Year 1324.00 51.25 59.00 59.05 0.000759 3.16 875.80 194.00 0.20
Reach - 1 5000.0 2-Year 270.00 51.44 55.85 55.88 0.000650 1.98 276.30 112.16 0.17
Reach - 1 5000.0 10-Year 553.00 51.44 57.46 57.49 0.000560 2.28 471.84 130.88 0.17
Reach - 1 5000.0 25-Year 783.00 51.44 58.24 58.28 0.000637 2.64 576.31 140.57 0.18
Reach - 1 5000.0 50-Year 992.00 51.44 58.80 58.85 0.000707 2.94 659.17 150.94 0.19
Reach - 1 5000.0 100-Year 1228.00 51.44 59.37 59.43 0.000772 3.24 747.84 161.30 0.21
Reach - 1 5500.0 2-Year 270.00 52.17 56.30 56.35 0.001432 2.73 193.32 88.21 0.24
Reach - 1 5500.0 10-Year 553.00 52.17 57.83 57.90 0.001184 3.11 333.96 94.66 0.23
Reach - 1 5500.0 25-Year 783.00 52.17 58.64 58.72 0.001270 3.53 411.94 98.05 0.25
Reach - 1 5500.0 50-Year 992.00 52.17 59.25 59.35 0.001361 3.88 471.98 100.58 0.26
Reach - 1 5500.0 100-Year 1228.00 52.17 59.85 59.96 0.001453 4.24 533.28 103.10 0.27
Reach - 1 6000.0 2-Year 270.00 52.71 56.89 56.92 0.000912 2.17 257.89 119.10 0.19
Reach - 1 6000.0 10-Year 553.00 52.71 58.34 58.38 0.000784 2.48 436.74 127.16 0.19
Reach - 1 6000.0 25-Year 783.00 52.71 59.18 59.23 0.000803 2.76 545.72 131.83 0.20
Reach - 1 6000.0 50-Year 992.00 52.71 59.82 59.87 0.000833 3.00 631.37 135.38 0.20
Reach - 1 6000.0 100-Year 1228.00 52.71 60.46 60.52 0.000866 3.25 718.89 138.92 0.21
Reach - 1 6400 2-Year 270.00 55.71 58.34 58.34 58.83 0.017439 5.82 59.98 78.15 0.81
Reach - 1 6400 10-Year 553.00 55.71 58.96 58.96 59.62 0.018337 7.26 109.29 81.22 0.87
Reach - 1 6400 25-Year 783.00 55.71 59.64 60.19 0.012006 6.89 165.94 84.61 0.73
Reach - 1 6400 50-Year 992.00 55.71 60.30 60.77 0.008365 6.48 223.14 87.89 0.63
2

HEC-RAS Plan: FINAL ALT 1 River: Gum Swamp Reach: Reach - 1 (Continued)
Reach River Sta Profile Q Total Min Ch El W.S. Elev Crit W.S. E.G. Elev E.G. Slope Vel Chnl Flow Area Top Width Froude # Chl
(cfs) (ft) (ft) (ft) (ft) (ft/ft) (ft/s) (sq ft) (ft)
Reach - 1 6400 100-Year 1228.00 55.71 60.95 61.38 0.006637 6.36 280.66 91.08 0.57
Reach - 1 6909 2-Year 211.00 55.80 61.41 61.55 0.002125 2.98 70.84 23.21 0.30
Reach - 1 6909 10-Year 424.00 55.80 62.60 60.31 62.80 0.002546 3.76 236.16 298.67 0.34
Reach - 1 6909 25-Year 575.00 55.80 62.96 60.95 63.18 0.002871 4.17 352.31 344.27 0.37
Reach - 1 6909 50-Year 709.00 55.80 63.21 61.43 63.44 0.003064 4.44 441.78 357.91 0.38
Reach - 1 6909 100-Year 880.00 55.80 63.55 62.70 63.76 0.003039 4.58 563.89 375.16 0.38
Reach - 1 7470 2-Year 211.00 56.41 61.95 61.97 0.000359 1.34 233.92 84.71 0.13
Reach - 1 7470 10-Year 424.00 56.41 63.29 63.32 0.000460 1.82 388.80 214.10 0.15
Reach - 1 7470 25-Year 575.00 56.41 63.77 63.81 0.000572 2.13 515.58 315.97 0.17
Reach - 1 7470 50-Year 709.00 56.41 64.10 64.15 0.000663 2.37 634.47 399.30 0.19
Reach - 1 7470 100-Year 880.00 56.41 64.47 64.52 0.000739 2.59 788.90 439.57 0.20
Reach - 1 7628 2-Year 211.00 56.38 62.01 59.71 62.03 0.000488 1.58 207.34 69.90 0.15
Reach - 1 7628 10-Year 424.00 56.38 63.37 60.24 63.41 0.000620 2.08 307.46 85.88 0.17
Reach - 1 7628 25-Year 575.00 56.38 63.86 60.54 63.92 0.000791 2.52 355.46 111.13 0.20
Reach - 1 7628 50-Year 709.00 56.38 64.22 60.76 64.28 0.000978 2.93 440.92 331.26 0.22
Reach - 1 7628 100-Year 880.00 56.38 64.60 61.03 64.67 0.001061 3.19 576.40 378.71 0.23
Reach - 1 7705 Culvert
Reach - 1 7759 2-Year 211.00 56.45 62.04 59.86 62.20 0.002544 3.22 65.53 21.38 0.32
Reach - 1 7759 10-Year 424.00 56.45 63.64 61.08 63.89 0.002580 4.03 119.40 84.30 0.34
Reach - 1 7759 25-Year 575.00 56.45 64.56 61.74 64.82 0.002242 4.28 168.74 394.22 0.33
Reach - 1 7759 50-Year 709.00 56.45 65.18 62.25 65.29 0.001124 3.26 637.45 511.82 0.24
Reach - 1 7759 100-Year 880.00 56.45 65.41 62.82 65.53 0.001287 3.59 758.80 560.69 0.26
Reach - 1 7930 2-Year 208.00 57.33 62.48 62.65 0.002677 3.28 63.48 21.10 0.33
Reach - 1 7930 10-Year 408.00 57.33 64.11 61.55 64.35 0.002793 3.96 121.11 197.96 0.35
Reach - 1 7930 25-Year 553.00 57.33 65.05 65.18 0.001535 3.30 402.64 410.94 0.27
Reach - 1 7930 50-Year 682.00 57.33 65.39 65.51 0.001442 3.31 556.79 491.49 0.26
Reach - 1 7930 100-Year 825.00 57.33 65.65 65.77 0.001476 3.46 692.08 558.71 0.27
Reach - 1 8400 2-Year 208.00 57.72 63.68 63.82 0.002320 3.07 67.79 21.75 0.31
Reach - 1 8400 10-Year 408.00 57.72 65.20 65.30 0.001482 2.95 303.34 322.45 0.26
Reach - 1 8400 25-Year 553.00 57.72 65.74 65.82 0.001198 2.88 506.56 417.70 0.23
Reach - 1 8400 50-Year 682.00 57.72 66.04 66.12 0.001165 2.96 637.78 439.89 0.23
3

HEC-RAS Plan: FINAL ALT 1 River: Gum Swamp Reach: Reach - 1 (Continued)
Reach River Sta Profile Q Total Min Ch El W.S. Elev Crit W.S. E.G. Elev E.G. Slope Vel Chnl Flow Area Top Width Froude # Chl
(cfs) (ft) (ft) (ft) (ft) (ft/ft) (ft/s) (sq ft) (ft)
Reach - 1 8400 100-Year 825.00 57.72 66.31 66.38 0.001171 3.07 755.82 449.45 0.24
Reach - 1 8872 2-Year 208.00 59.13 64.30 64.36 0.000650 1.89 109.99 29.40 0.17
Reach - 1 8872 10-Year 408.00 59.13 65.74 65.84 0.000924 2.64 155.36 35.19 0.21
Reach - 1 8872 25-Year 553.00 59.13 66.25 66.40 0.001179 3.15 241.13 314.24 0.24
Reach - 1 8872 50-Year 682.00 59.13 66.56 66.73 0.001325 3.44 342.37 332.25 0.26
Reach - 1 8872 100-Year 825.00 59.13 66.84 67.03 0.001450 3.70 441.95 375.43 0.27
Reach - 1 9293 2-Year 86.00 60.27 64.64 64.77 0.003279 2.89 29.78 12.92 0.34
Reach - 1 9293 10-Year 173.00 60.27 66.22 66.34 0.002298 2.97 112.11 306.61 0.29
Reach - 1 9293 25-Year 237.00 60.27 66.84 66.88 0.000988 2.11 338.74 421.24 0.20
Reach - 1 9293 50-Year 295.00 60.27 67.17 67.20 0.000700 1.85 486.75 475.52 0.17
Reach - 1 9293 100-Year 361.00 60.27 67.45 67.47 0.000548 1.69 628.46 522.20 0.15
4

PRIMARY SYSTEM
ALTERNATIVE #2:
HEC‐RAS OUTPUT

HEC-RAS Plan: FINAL ALT 2 River: Swift Creek Reach: Reach-1
Reach River Sta Profile Q Total Min Ch El W.S. Elev Crit W.S. E.G. Elev E.G. Slope Vel Chnl Flow Area Top Width Froude # Chl
(cfs) (ft) (ft) (ft) (ft) (ft/ft) (ft/s) (sq ft) (ft)
Reach-1 234198 2-year 205.00 51.54 55.57 54.13 55.79 0.003005 3.76 56.67 27.31 0.39
Reach-1 234198 10-year 430.00 51.54 56.90 55.23 57.19 0.003003 4.67 240.19 340.61 0.40
Reach-1 234198 25-year 593.00 51.54 57.34 56.01 57.63 0.003002 4.99 406.06 408.22 0.41
Reach-1 234198 50-year 739.00 51.54 57.64 57.05 57.92 0.003000 5.20 536.14 442.83 0.41
Reach-1 234198 100-year 907.00 51.54 57.94 57.34 58.21 0.003001 5.41 670.43 471.80 0.42
Reach-1 234875 2-year 205.00 52.10 56.92 57.03 0.001218 2.82 112.53 174.86 0.26
Reach-1 234875 10-year 430.00 52.10 58.09 58.16 0.000787 2.69 502.26 440.74 0.22
Reach-1 234875 25-year 593.00 52.10 58.51 58.57 0.000755 2.79 695.97 476.99 0.21
Reach-1 234875 50-year 739.00 52.10 58.81 58.87 0.000758 2.90 844.12 522.31 0.22
Reach-1 234875 100-year 907.00 52.10 59.11 59.17 0.000769 3.02 1006.46 558.53 0.22
Reach-1 235139 2-year 205.00 51.75 57.20 53.78 57.26 0.000550 1.99 121.55 170.26 0.18
Reach-1 235139 10-year 430.00 51.75 58.28 54.86 58.34 0.000570 2.24 486.94 471.64 0.18
Reach-1 235139 25-year 593.00 51.75 58.69 55.50 58.74 0.000551 2.33 687.90 504.53 0.18
Reach-1 235139 50-year 739.00 51.75 58.99 56.00 59.04 0.000549 2.41 841.38 527.09 0.18
Reach-1 235139 100-year 907.00 51.75 59.29 56.52 59.34 0.000554 2.51 1004.28 565.19 0.19
Reach-1 235165 Bridge
Reach-1 235183 2-year 205.00 51.76 57.51 53.87 57.55 0.000310 1.57 130.16 165.98 0.14
Reach-1 235183 10-year 430.00 51.76 59.38 54.88 59.39 0.000134 1.27 877.24 478.82 0.10
Reach-1 235183 25-year 593.00 51.76 59.69 55.46 59.71 0.000183 1.53 1036.16 542.14 0.11
Reach-1 235183 50-year 739.00 51.76 59.87 55.90 59.90 0.000236 1.78 1132.69 549.28 0.13
Reach-1 235183 100-year 907.00 51.76 60.03 56.34 60.07 0.000299 2.04 1223.08 552.99 0.15
Reach-1 235196 2-year 205.00 52.47 57.50 54.96 57.58 0.000984 2.35 87.33 408.79 0.23
Reach-1 235196 10-year 430.00 52.47 59.38 56.08 59.40 0.000252 1.57 640.46 598.81 0.13
Reach-1 235196 25-year 593.00 52.47 59.73 56.68 59.73 0.000058 0.79 1970.72 603.21 0.06
Reach-1 235196 50-year 739.00 52.47 59.91 57.13 59.92 0.000077 0.93 2083.31 605.24 0.07
Reach-1 235196 100-year 907.00 52.47 60.09 57.55 60.09 0.000100 1.08 2189.86 607.15 0.08
Reach-1 235219 Culvert
Reach-1 235247 2-year 205.00 53.17 58.63 56.05 58.68 0.000637 1.88 114.23 437.53 0.20
Reach-1 235247 10-year 430.00 53.17 59.51 57.06 59.55 0.000494 1.94 524.85 508.25 0.18
Reach-1 235247 25-year 593.00 53.17 59.78 57.59 59.80 0.000313 1.60 984.79 521.57 0.14
Reach-1 235247 50-year 739.00 53.17 59.97 58.05 59.99 0.000371 1.80 1087.57 531.27 0.16
1

HEC-RAS Plan: FINAL ALT 2 River: Swift Creek Reach: Reach-1 (Continued)
Reach River Sta Profile Q Total Min Ch El W.S. Elev Crit W.S. E.G. Elev E.G. Slope Vel Chnl Flow Area Top Width Froude # Chl
(cfs) (ft) (ft) (ft) (ft) (ft/ft) (ft/s) (sq ft) (ft)
Reach-1 235247 100-year 907.00 53.17 60.12 58.46 60.15 0.000465 2.05 1164.86 539.92 0.18
Reach-1 235428 2-year 225.00 53.13 58.74 55.99 58.78 0.000440 1.84 343.54 266.14 0.16
Reach-1 235428 10-year 459.00 53.13 59.59 57.14 59.65 0.000631 2.52 589.34 312.54 0.20
Reach-1 235428 25-year 629.00 53.13 59.82 58.15 59.90 0.000922 3.13 661.28 321.75 0.25
Reach-1 235428 50-year 802.00 53.13 60.01 58.49 60.13 0.001211 3.69 726.07 329.00 0.28
Reach-1 235428 100-year 972.00 53.13 60.17 58.70 60.31 0.001517 4.21 776.82 336.40 0.32
Reach-1 235914 2-year 225.00 53.95 58.84 58.84 0.000060 0.72 750.35 296.61 0.06
Reach-1 235914 10-year 459.00 53.95 59.75 59.75 0.000101 1.06 1035.88 333.80 0.08
Reach-1 235914 25-year 629.00 53.95 60.04 60.05 0.000145 1.33 1137.45 346.07 0.10
Reach-1 235914 50-year 802.00 53.95 60.32 60.33 0.000191 1.57 1233.69 363.61 0.12
Reach-1 235914 100-year 972.00 53.95 60.55 60.56 0.000236 1.80 1318.71 379.81 0.13
Reach-1 236412 2-year 225.00 54.78 58.89 58.89 0.000188 1.01 491.87 317.44 0.10
Reach-1 236412 10-year 459.00 54.78 59.81 59.82 0.000214 1.28 843.84 417.97 0.11
Reach-1 236412 25-year 629.00 54.78 60.14 60.15 0.000271 1.52 981.25 429.66 0.13
Reach-1 236412 50-year 802.00 54.78 60.43 60.45 0.000318 1.72 1110.46 441.91 0.14
Reach-1 236412 100-year 972.00 54.78 60.69 60.70 0.000360 1.90 1223.13 452.32 0.15
Reach-1 236856 2-year 225.00 54.38 58.98 58.99 0.000235 1.12 428.93 209.90 0.11
Reach-1 236856 10-year 459.00 54.38 59.93 59.94 0.000295 1.42 655.47 294.53 0.13
Reach-1 236856 25-year 629.00 54.38 60.28 60.30 0.000377 1.70 765.97 323.88 0.15
Reach-1 236856 50-year 802.00 54.38 60.61 60.63 0.000442 1.94 873.04 343.20 0.16
Reach-1 236856 100-year 972.00 54.38 60.88 60.90 0.000502 2.15 970.13 368.83 0.18
Reach-1 237179 2-year 225.00 55.37 59.09 59.17 0.001641 2.83 150.96 103.70 0.30
Reach-1 237179 10-year 459.00 55.37 60.04 60.16 0.001810 3.64 262.81 135.66 0.34
Reach-1 237179 25-year 629.00 55.37 60.43 60.58 0.002178 4.27 318.62 157.69 0.37
Reach-1 237179 50-year 802.00 55.37 60.76 60.95 0.002447 4.77 376.05 186.96 0.40
Reach-1 237179 100-year 972.00 55.37 61.04 61.30 0.003143 5.63 431.36 210.08 0.46
Reach-1 237456 2-year 225.00 55.98 59.62 58.69 59.74 0.002683 3.36 113.71 98.77 0.38
Reach-1 237456 10-year 459.00 55.98 60.63 59.38 60.79 0.002932 4.08 217.89 217.77 0.41
Reach-1 237456 25-year 629.00 55.98 61.11 59.76 61.28 0.003023 4.39 295.60 258.07 0.42
Reach-1 237456 50-year 802.00 55.98 61.52 60.09 61.69 0.003003 4.58 372.22 277.39 0.42
Reach-1 237456 100-year 972.00 55.98 61.94 60.49 62.11 0.002703 4.67 455.63 298.97 0.41
2

HEC-RAS Plan: FINAL ALT 2 River: Swift Creek Reach: Reach-1 (Continued)
Reach River Sta Profile Q Total Min Ch El W.S. Elev Crit W.S. E.G. Elev E.G. Slope Vel Chnl Flow Area Top Width Froude # Chl
(cfs) (ft) (ft) (ft) (ft) (ft/ft) (ft/s) (sq ft) (ft)
Reach-1 237708 2-year 225.00 56.29 59.99 57.55 60.02 0.000451 1.70 176.27 130.84 0.16
Reach-1 237708 10-year 459.00 56.29 61.10 58.45 61.18 0.000697 2.48 248.26 211.38 0.20
Reach-1 237708 25-year 629.00 56.29 61.57 58.84 61.61 0.000455 2.11 551.97 308.08 0.16
Reach-1 237708 50-year 802.00 56.29 62.00 59.17 62.04 0.000508 2.35 732.16 416.04 0.18
Reach-1 237708 100-year 972.00 56.29 62.41 59.45 62.46 0.000524 2.50 906.02 436.15 0.18
Reach-1 237781 Culvert
Reach-1 237845 2-year 225.00 56.31 60.10 57.78 60.17 0.000771 2.12 106.07 127.68 0.20
Reach-1 237845 10-year 459.00 56.31 61.41 58.53 61.56 0.001137 3.07 168.11 301.68 0.25
Reach-1 237845 25-year 629.00 56.31 62.21 58.99 62.39 0.001236 3.52 222.54 360.36 0.27
Reach-1 237845 50-year 802.00 56.31 62.90 59.41 63.01 0.000796 3.06 662.43 405.20 0.22
Reach-1 237845 100-year 972.00 56.31 63.24 59.80 63.37 0.000897 3.37 758.91 440.37 0.23
Reach-1 238094 2-year 162.00 56.52 60.35 59.01 60.58 0.003935 3.89 41.63 77.90 0.43
Reach-1 238094 10-year 329.00 56.52 61.75 60.11 62.11 0.004374 4.86 71.74 140.08 0.47
Reach-1 238094 25-year 452.00 56.52 62.58 60.73 62.91 0.003578 4.83 180.30 329.37 0.43
Reach-1 238094 50-year 562.00 56.52 63.11 61.21 63.38 0.002831 4.62 327.93 456.53 0.39
Reach-1 238094 100-year 679.00 56.52 63.50 62.28 63.73 0.002466 4.51 464.73 538.42 0.37
Reach-1 238526 2-year 162.00 56.20 60.94 57.72 60.98 0.000370 1.58 102.64 28.27 0.15
Reach-1 238526 10-year 329.00 56.20 62.55 58.52 62.62 0.000491 2.17 163.30 62.25 0.17
Reach-1 238526 25-year 452.00 56.20 63.33 59.01 63.43 0.000556 2.51 217.67 90.31 0.19
Reach-1 238526 50-year 562.00 56.20 63.78 59.39 63.90 0.000633 2.82 287.70 191.98 0.20
Reach-1 238526 100-year 679.00 56.20 64.12 59.76 64.27 0.000721 3.13 361.15 236.05 0.22
Reach-1 238936 2-year 162.00 56.88 61.11 58.59 61.15 0.000489 1.66 97.77 32.23 0.17
Reach-1 238936 10-year 329.00 56.88 62.76 59.29 62.83 0.000540 2.12 155.41 37.65 0.18
Reach-1 238936 25-year 452.00 56.88 63.58 59.72 63.67 0.000598 2.42 187.35 42.20 0.20
Reach-1 238936 50-year 562.00 56.88 64.06 60.06 64.17 0.000682 2.72 209.05 48.16 0.21
Reach-1 238936 100-year 679.00 56.88 64.43 60.39 64.58 0.000797 3.05 228.09 52.85 0.23
Reach-1 239177 2-year 162.00 57.85 61.08 60.66 61.64 0.012291 6.02 26.93 13.43 0.75
Reach-1 239177 10-year 329.00 57.85 62.72 61.79 63.32 0.008254 6.24 52.68 17.99 0.64
Reach-1 239177 25-year 452.00 57.85 63.51 62.44 64.20 0.007899 6.66 67.87 20.20 0.64
Reach-1 239177 50-year 562.00 57.85 63.96 62.94 64.78 0.008637 7.28 77.24 21.61 0.68
Reach-1 239177 100-year 679.00 57.85 64.30 63.41 65.30 0.009858 8.02 84.69 53.12 0.73
3

HEC-RAS Plan: FINAL ALT 2 River: Swift Creek Reach: Reach-1 (Continued)
Reach River Sta Profile Q Total Min Ch El W.S. Elev Crit W.S. E.G. Elev E.G. Slope Vel Chnl Flow Area Top Width Froude # Chl
(cfs) (ft) (ft) (ft) (ft) (ft/ft) (ft/s) (sq ft) (ft)
Reach-1 239470 2-year 162.00 57.77 62.20 59.53 62.26 0.000596 1.90 85.36 25.30 0.18
Reach-1 239470 10-year 329.00 57.77 63.89 60.33 63.98 0.000732 2.51 130.85 28.79 0.21
Reach-1 239470 25-year 452.00 57.77 64.79 60.81 64.92 0.000819 2.86 157.77 30.68 0.22
Reach-1 239470 50-year 562.00 57.77 65.44 61.20 65.59 0.000907 3.16 177.99 32.02 0.24
Reach-1 239470 100-year 679.00 57.77 66.02 61.58 66.21 0.000978 3.44 200.91 46.77 0.25
Reach-1 239543 Culvert
Reach-1 239601 2-year 162.00 57.56 62.56 59.50 62.62 0.000532 1.86 87.24 24.08 0.17
Reach-1 239601 10-year 329.00 57.56 64.73 60.38 64.81 0.000540 2.27 144.85 29.02 0.18
Reach-1 239601 25-year 452.00 57.56 66.46 60.91 66.54 0.000401 2.26 209.87 178.71 0.16
Reach-1 239601 50-year 562.00 57.56 67.76 61.33 67.81 0.000213 1.87 517.40 347.86 0.12
Reach-1 239601 100-year 679.00 57.56 68.17 61.74 68.22 0.000231 2.01 602.77 387.93 0.13
Reach-1 239904 2-year 132.00 58.41 62.78 60.60 62.90 0.001719 2.73 48.38 17.18 0.29
Reach-1 239904 10-year 243.00 58.41 64.93 61.48 65.03 0.001045 2.54 95.80 26.92 0.24
Reach-1 239904 25-year 323.00 58.41 66.61 61.99 66.68 0.000619 2.19 154.43 83.22 0.18
Reach-1 239904 50-year 394.00 58.41 67.85 62.39 67.89 0.000312 1.68 418.86 318.53 0.13
Reach-1 239904 100-year 472.00 58.41 68.27 62.84 68.30 0.000281 1.68 547.03 353.25 0.13
Reach-1 240316 2-year 132.00 59.47 63.77 64.03 0.004636 4.12 32.03 12.34 0.45
Reach-1 240316 10-year 243.00 59.47 65.52 65.80 0.003406 4.27 56.86 16.09 0.40
Reach-1 240316 25-year 323.00 59.47 66.94 67.14 0.002005 3.70 121.56 103.36 0.31
Reach-1 240316 50-year 394.00 59.47 68.02 68.11 0.000941 2.78 289.52 217.52 0.22
Reach-1 240316 100-year 472.00 59.47 68.42 68.50 0.000836 2.72 386.44 264.68 0.21
Reach-1 240800 2-year 132.00 60.78 65.27 65.39 0.001850 2.83 46.57 16.97 0.30
Reach-1 240800 10-year 243.00 60.78 66.78 66.93 0.001658 3.16 86.87 49.41 0.30
Reach-1 240800 25-year 323.00 60.78 67.76 67.88 0.001175 2.98 146.04 67.64 0.26
Reach-1 240800 50-year 394.00 60.78 68.46 68.56 0.000918 2.85 228.40 166.12 0.23
Reach-1 240800 100-year 472.00 60.78 68.82 68.93 0.000916 2.95 295.97 202.33 0.23
Reach-1 241107 2-year 132.00 61.47 65.91 66.07 0.002596 3.20 41.29 16.26 0.35
Reach-1 241107 10-year 243.00 61.47 67.34 67.51 0.002130 3.42 88.73 64.25 0.33
Reach-1 241107 25-year 323.00 61.47 68.17 68.30 0.001573 3.18 167.65 132.75 0.29
Reach-1 241107 50-year 394.00 61.47 68.78 68.88 0.001151 2.87 270.44 198.79 0.25
Reach-1 241107 100-year 472.00 61.47 69.15 69.23 0.001051 2.87 348.81 234.57 0.24
4

HEC-RAS Plan: FINAL ALT 2 River: Swift Creek Reach: Reach-1 (Continued)
Reach River Sta Profile Q Total Min Ch El W.S. Elev Crit W.S. E.G. Elev E.G. Slope Vel Chnl Flow Area Top Width Froude # Chl
(cfs) (ft) (ft) (ft) (ft) (ft/ft) (ft/s) (sq ft) (ft)
Reach-1 241592 2-year 81.00 62.40 66.69 66.74 0.000639 1.65 49.01 18.75 0.18
Reach-1 241592 10-year 157.00 62.40 68.07 68.13 0.000690 2.02 77.99 27.45 0.19
Reach-1 241592 25-year 213.00 62.40 68.77 68.84 0.000713 2.19 115.17 80.78 0.20
Reach-1 241592 50-year 264.00 62.40 69.25 69.33 0.000680 2.27 164.36 121.37 0.20
Reach-1 241592 100-year 320.00 62.40 69.58 69.66 0.000710 2.42 209.36 148.40 0.20
Reach-1 241994 2-year 81.00 63.58 66.99 67.04 0.000890 1.83 44.20 18.73 0.21
Reach-1 241994 10-year 157.00 63.58 68.37 68.44 0.000843 2.14 74.41 33.39 0.21
Reach-1 241994 25-year 213.00 63.58 69.07 69.15 0.000834 2.30 108.63 64.24 0.21
Reach-1 241994 50-year 264.00 63.58 69.55 69.63 0.000833 2.40 144.09 85.13 0.22
Reach-1 241994 100-year 320.00 63.58 69.89 69.98 0.000867 2.57 175.50 97.42 0.22
5

HEC-RAS Plan: FINAL ALT 2 River: Swift Creek UT1 Reach: Reach1
Reach River Sta Profile Q Total Min Ch El W.S. Elev Crit W.S. E.G. Elev E.G. Slope Vel Chnl Flow Area Top Width Froude # Chl
(cfs) (ft) (ft) (ft) (ft) (ft/ft) (ft/s) (sq ft) (ft)
Reach1 231 2-Year 154.00 53.45 56.97 55.87 57.20 0.004003 3.82 40.36 17.62 0.44
Reach1 231 10-Year 279.00 53.45 58.07 56.62 58.39 0.004007 4.54 69.73 141.01 0.46
Reach1 231 25-Year 366.00 53.45 58.45 57.06 58.77 0.004003 4.76 129.48 175.40 0.46
Reach1 231 50-Year 438.00 53.45 58.67 57.38 58.98 0.004005 4.88 171.00 195.77 0.46
Reach1 231 100-Year 521.00 53.45 58.89 57.66 59.18 0.004005 5.00 215.18 215.34 0.46
Reach1 584 2-Year 154.00 53.78 57.97 58.10 0.001722 2.80 55.03 20.27 0.30
Reach1 584 10-Year 279.00 53.78 59.06 59.15 0.001283 2.79 179.14 140.79 0.27
Reach1 584 25-Year 366.00 53.78 59.44 59.54 0.001328 2.96 236.19 158.47 0.27
Reach1 584 50-Year 438.00 53.78 59.67 59.78 0.001412 3.13 274.81 169.39 0.28
Reach1 584 100-Year 521.00 53.78 59.90 60.01 0.001509 3.31 314.61 179.20 0.29
Reach1 1005 2-Year 154.00 54.86 58.70 58.76 0.001431 2.29 126.56 146.52 0.27
Reach1 1005 10-Year 279.00 54.86 59.57 59.61 0.000899 2.08 268.29 177.33 0.22
Reach1 1005 25-Year 366.00 54.86 59.95 59.99 0.000849 2.16 336.73 185.24 0.22
Reach1 1005 50-Year 438.00 54.86 60.20 60.24 0.000851 2.26 384.04 190.12 0.22
Reach1 1005 100-Year 521.00 54.86 60.45 60.50 0.000870 2.38 432.42 194.97 0.23
Reach1 1429 2-Year 74.00 54.48 59.18 59.22 0.000666 1.62 45.56 18.30 0.18
Reach1 1429 10-Year 141.00 54.48 59.95 60.03 0.001120 2.32 60.70 21.00 0.24
Reach1 1429 25-Year 189.00 54.48 60.32 60.44 0.001445 2.75 68.70 22.29 0.28
Reach1 1429 50-Year 229.00 54.48 60.57 60.72 0.001708 3.07 74.49 23.18 0.30
Reach1 1429 100-Year 274.00 54.48 60.83 61.01 0.001984 3.40 80.55 24.08 0.33
Reach1 1546 2-Year 74.00 55.50 59.24 56.07 59.25 0.000061 0.61 120.49 32.93 0.06
Reach1 1546 10-Year 141.00 55.50 60.07 56.37 60.09 0.000117 0.95 147.91 33.14 0.08
Reach1 1546 25-Year 189.00 55.50 60.49 56.55 60.51 0.000161 1.17 161.70 33.25 0.09
Reach1 1546 50-Year 229.00 55.50 60.78 56.70 60.81 0.000198 1.34 171.47 33.32 0.10
Reach1 1546 100-Year 274.00 55.50 61.08 56.84 61.12 0.000240 1.51 181.45 33.39 0.11
Reach1 1588.5 Culvert
Reach1 1635 2-Year 74.00 55.72 59.27 56.72 59.28 0.000112 0.76 97.52 32.06 0.08
Reach1 1635 10-Year 141.00 55.72 60.18 57.03 60.19 0.000182 1.11 126.83 32.43 0.10
Reach1 1635 25-Year 189.00 55.72 60.68 57.22 60.71 0.000225 1.32 143.26 32.63 0.11
Reach1 1635 50-Year 229.00 55.72 61.02 57.36 61.06 0.000262 1.48 154.51 33.28 0.12
Reach1 1635 100-Year 274.00 55.72 61.35 57.51 61.39 0.000302 1.66 165.61 34.21 0.13
1

HEC-RAS Plan: FINAL ALT 2 River: Swift Creek UT1 Reach: Reach1 (Continued)
Reach River Sta Profile Q Total Min Ch El W.S. Elev Crit W.S. E.G. Elev E.G. Slope Vel Chnl Flow Area Top Width Froude # Chl
(cfs) (ft) (ft) (ft) (ft) (ft/ft) (ft/s) (sq ft) (ft)
Reach1 1798 2-Year 44.00 56.04 59.29 59.30 0.000230 0.88 49.76 24.14 0.11
Reach1 1798 10-Year 79.00 56.04 60.21 60.23 0.000243 1.07 73.61 27.61 0.12
Reach1 1798 25-Year 103.00 56.04 60.73 60.75 0.000241 1.17 88.50 30.33 0.12
Reach1 1798 50-Year 123.00 56.04 61.08 61.10 0.000245 1.25 99.54 32.44 0.12
Reach1 1798 100-Year 148.00 56.04 61.42 61.45 0.000262 1.36 110.90 34.47 0.13
Reach1 2289 2-Year 44.00 56.55 59.51 59.65 0.005214 3.02 14.56 10.61 0.45
Reach1 2289 10-Year 79.00 56.55 60.42 60.57 0.003603 3.03 26.10 14.52 0.40
Reach1 2289 25-Year 103.00 56.55 60.93 61.07 0.003044 3.03 33.97 16.67 0.37
Reach1 2289 50-Year 123.00 56.55 61.28 61.42 0.002801 3.07 40.06 18.15 0.36
Reach1 2289 100-Year 148.00 56.55 61.63 61.78 0.002705 3.17 46.65 19.64 0.36
Reach1 2669 2-Year 44.00 57.94 61.02 61.10 0.002932 2.35 18.73 13.25 0.35
Reach1 2669 10-Year 79.00 57.94 61.71 61.82 0.003017 2.69 29.36 17.53 0.37
Reach1 2669 25-Year 103.00 57.94 62.08 62.21 0.002936 2.83 36.42 19.87 0.37
Reach1 2669 50-Year 123.00 57.94 62.37 62.50 0.002841 2.91 42.27 21.62 0.37
Reach1 2669 100-Year 148.00 57.94 62.69 62.83 0.002786 2.98 49.60 23.69 0.36
Reach1 2906 2-Year 44.00 58.90 61.28 59.53 61.29 0.000318 1.00 43.79 21.91 0.13
Reach1 2906 10-Year 79.00 58.90 62.02 59.83 62.05 0.000394 1.30 60.89 24.09 0.14
Reach1 2906 25-Year 103.00 58.90 62.42 60.00 62.45 0.000436 1.46 70.71 25.26 0.15
Reach1 2906 50-Year 123.00 58.90 62.71 60.13 62.75 0.000467 1.57 78.23 26.12 0.16
Reach1 2906 100-Year 148.00 58.90 63.05 60.29 63.09 0.000499 1.70 87.11 27.10 0.17
Reach1 2952.5 Culvert
Reach1 3015 2-Year 44.00 59.40 61.52 59.98 61.54 0.000373 1.04 42.27 22.76 0.13
Reach1 3015 10-Year 79.00 59.40 62.42 60.25 62.44 0.000356 1.24 63.78 25.15 0.14
Reach1 3015 25-Year 103.00 59.40 62.95 60.41 62.98 0.000343 1.33 77.62 26.58 0.14
Reach1 3015 50-Year 123.00 59.40 63.39 60.53 63.42 0.000324 1.37 89.55 27.75 0.13
Reach1 3015 100-Year 148.00 59.40 64.02 60.68 64.05 0.000279 1.38 107.42 29.41 0.13
Reach1 3270 2-Year 27.00 59.93 61.63 61.84 0.012992 3.69 7.32 8.26 0.69
Reach1 3270 10-Year 49.00 59.93 62.54 62.67 0.004702 2.93 16.72 12.38 0.44
Reach1 3270 25-Year 64.00 59.93 63.07 63.18 0.003079 2.67 23.94 14.78 0.37
Reach1 3270 50-Year 79.00 59.93 63.50 63.60 0.002405 2.57 30.75 16.74 0.33
Reach1 3270 100-Year 95.00 59.93 64.11 64.19 0.001536 2.27 41.79 19.49 0.27
2

HEC-RAS Plan: FINAL ALT 2 River: Swift Creek UT1 Reach: Reach1 (Continued)
Reach River Sta Profile Q Total Min Ch El W.S. Elev Crit W.S. E.G. Elev E.G. Slope Vel Chnl Flow Area Top Width Froude # Chl
(cfs) (ft) (ft) (ft) (ft) (ft/ft) (ft/s) (sq ft) (ft)
Reach1 3690 2-Year 27.00 59.63 62.99 63.03 0.001193 1.63 16.53 9.01 0.21
Reach1 3690 10-Year 49.00 59.63 63.68 63.75 0.001585 2.10 23.37 10.88 0.25
Reach1 3690 25-Year 64.00 59.63 64.05 64.14 0.001744 2.32 27.61 11.90 0.27
Reach1 3690 50-Year 79.00 59.63 64.39 64.48 0.001840 2.49 31.74 12.81 0.28
Reach1 3690 100-Year 95.00 59.63 64.79 64.89 0.001767 2.56 37.06 13.90 0.28
Reach1 3808 2-Year 27.00 59.63 63.13 63.16 0.000989 1.52 17.76 9.37 0.19
Reach1 3808 10-Year 49.00 59.63 63.86 63.92 0.001279 1.93 25.36 11.37 0.23
Reach1 3808 25-Year 64.00 59.63 64.25 64.32 0.001399 2.13 30.01 12.44 0.24
Reach1 3808 50-Year 79.00 59.63 64.60 64.68 0.001477 2.29 34.49 13.38 0.25
Reach1 3808 100-Year 95.00 59.63 64.99 65.08 0.001448 2.38 39.95 14.45 0.25
Reach1 3936 2-Year 27.00 59.42 63.22 61.01 63.23 0.000308 0.96 28.07 13.62 0.12
Reach1 3936 10-Year 49.00 59.42 63.99 61.43 64.01 0.000406 1.24 39.42 15.89 0.14
Reach1 3936 25-Year 64.00 59.42 64.40 61.66 64.43 0.000453 1.39 46.17 17.11 0.15
Reach1 3936 50-Year 79.00 59.42 64.76 61.86 64.79 0.000488 1.50 52.52 18.17 0.16
Reach1 3936 100-Year 95.00 59.42 65.15 62.05 65.19 0.000495 1.58 59.95 19.35 0.16
Reach1 3967.5 Culvert
Reach1 3997 2-Year 27.00 61.44 64.24 62.81 64.27 0.000901 1.39 19.37 12.61 0.20
Reach1 3997 10-Year 49.00 61.44 65.20 63.23 65.24 0.000694 1.47 33.36 16.42 0.18
Reach1 3997 25-Year 64.00 61.44 65.81 63.45 65.84 0.000564 1.45 44.02 18.82 0.17
Reach1 3997 50-Year 79.00 61.44 66.44 63.64 66.47 0.000420 1.37 62.46 77.84 0.15
Reach1 3997 100-Year 95.00 61.44 67.05 63.83 67.06 0.000227 1.12 137.56 191.38 0.11
Reach1 4120 2-Year 5.00 61.75 64.32 64.32 0.000042 0.29 17.52 12.64 0.04
Reach1 4120 10-Year 11.00 61.75 65.28 65.28 0.000042 0.35 31.63 16.87 0.04
Reach1 4120 25-Year 16.00 61.75 65.88 65.88 0.000041 0.38 42.51 19.52 0.04
Reach1 4120 50-Year 20.00 61.75 66.49 66.50 0.000027 0.34 78.52 101.93 0.04
Reach1 4120 100-Year 24.00 61.75 67.08 67.08 0.000013 0.26 163.06 179.16 0.03
Reach1 4307.5* 2-Year 5.00 62.35 64.33 64.34 0.000142 0.47 10.74 9.03 0.08
Reach1 4307.5* 10-Year 11.00 62.35 65.29 65.29 0.000114 0.53 20.82 12.07 0.07
Reach1 4307.5* 25-Year 16.00 62.35 65.89 65.89 0.000103 0.56 28.59 13.97 0.07
Reach1 4307.5* 50-Year 20.00 62.35 66.50 66.50 0.000076 0.53 37.79 15.93 0.06
Reach1 4307.5* 100-Year 24.00 62.35 67.08 67.08 0.000059 0.50 47.69 22.88 0.05
3

HEC-RAS Plan: FINAL ALT 2 River: Swift Creek UT1 Reach: Reach1 (Continued)
Reach River Sta Profile Q Total Min Ch El W.S. Elev Crit W.S. E.G. Elev E.G. Slope Vel Chnl Flow Area Top Width Froude # Chl
(cfs) (ft) (ft) (ft) (ft) (ft/ft) (ft/s) (sq ft) (ft)
Reach1 4495 2-Year 5.00 62.94 64.38 64.39 0.000620 0.83 6.02 6.16 0.15
Reach1 4495 10-Year 11.00 62.94 65.31 65.31 0.000068 0.36 46.99 120.23 0.05
Reach1 4495 25-Year 16.00 62.94 65.89 65.89 0.000009 0.15 118.93 125.40 0.02
Reach1 4495 50-Year 20.00 62.94 66.51 66.51 0.000003 0.09 197.32 130.80 0.01
Reach1 4495 100-Year 24.00 62.94 67.08 67.08 0.000001 0.07 274.35 135.90 0.01
4

SECONDARY SYSTEM:
SWMM INPUT

SWMM Sub‐Basin
ID
Curve
Number
Area
(acres)
Area
(sq. ft.)
Width
(ft.)
Basin
Slope
(%)
SUB_GSMB010091 79 0.85 37,026 177 0.22
SUB_GSMB010078 70 27.67 1,205,305 3,240 0.38
SUB_GSMB010057 78 1.52 66,211 282 1.11
SUB_GSMB010055 75 15.17 660,805 1,069 1.11
SUB_1 74 17.73 772,319 772 0.42
SUB_2 76 37.10 1,616,076 1,443 0.26
Project: Greenville Master Plan
Location: Davenport
Prepared by : MB/EVH
Checked by: DJK
Date: June 2015

SECONDARY SYSTEM
EXISTING CONDITIONS:
SWMM OUTPUT

EPA STORM WATER MANAGEMENT MODEL - VERSION 5.0 (Build 5.0.022) --------------------------------------------------------------
Existing Conditions: Davenport Farm Road (10-Year) Starting WSEL from Gum Branch XS6400 10-Year = 62.63' ********************************************************* NOTE: The summary statistics displayed in this report are based on results found at every computational time step, not just on results from each reporting time step. ********************************************************* **************** Analysis Options **************** Flow Units ............... CFS Process Models: Rainfall/Runoff ........ YES Snowmelt ............... NO Groundwater ............ NO Flow Routing ........... YES Ponding Allowed ........ NO Water Quality .......... NO Infiltration Method ...... CURVE_NUMBER Flow Routing Method ...... DYNWAVE Starting Date ............ MAY-20-2010 00:00:00 Ending Date .............. MAY-21-2010 00:00:00 Antecedent Dry Days ...... 0.0 Report Time Step ......... 00:15:00 Wet Time Step ............ 00:10:00 Dry Time Step ............ 00:10:00 Routing Time Step ........ 10.00 sec
WARNING 04: minimum elevation drop used for Conduit DUMMY_CHANNEL
WARNING 02: maximum depth increased for Node GSMB010091
WARNING 02: maximum depth increased for Node GSMB010078
WARNING 02: maximum depth increased for Node GSMB010089
WARNING 02: maximum depth increased for Node GSMB010055
WARNING 02: maximum depth increased for Node GSMB010093 ************************** Volume Depth Runoff Quantity Continuity acre-feet inches ************************** --------- ------- Total Precipitation ...... 48.467 5.812 Evaporation Loss ......... 0.000 0.000 Infiltration Loss ........ 18.309 2.196 Surface Runoff ........... 28.410 3.407 Final Surface Storage .... 1.814 0.217 Continuity Error (%) ..... -0.135 ************************** Volume Volume Flow Routing Continuity acre-feet 10^6 gal ************************** --------- --------- Dry Weather Inflow ....... 0.000 0.000 Wet Weather Inflow ....... 28.313 9.226 Groundwater Inflow ....... 0.000 0.000 RDII Inflow .............. 0.000 0.000 External Inflow .......... 1.904 0.620 External Outflow ......... 8.452 2.754 Internal Outflow ......... 0.000 0.000 Storage Losses ........... 0.000 0.000 Initial Stored Volume .... 0.025 0.008 Final Stored Volume ...... 20.825 6.786 Continuity Error (%) ..... 3.189
Existing Conditions: Davenport Farm Road (10-Year)
SWMM 5 Page 1

************************* Highest Continuity Errors ************************* Node DUMMY_JUNCTION (20.30%) Node GSMB010055 (16.32%) Node GSMB010057 (5.92%) Node GSMB010077 (3.95%) Node GSMB010089 (3.75%) *************************** Time-Step Critical Elements *************************** Link DUMMY_CHANNEL (46.63%) Link 2_EX30CMP (13.33%) Link 6_EX_5x7_Arch_CMP (4.52%) Link 4_EX48RCP (3.40%) Link 1_EX24CMP (2.80%) ******************************** Highest Flow Instability Indexes ******************************** Link 8_EX48RCP (3) Link 7_OPENCHANNEL (3) Link 6_EX_5x7_Arch_CMP (3) Link 5_OPENCHANNEL (3) Link DUMMY_CHANNEL (3) ************************* Routing Time Step Summary ************************* Minimum Time Step : 0.50 sec Average Time Step : 7.03 sec Maximum Time Step : 10.00 sec Percent in Steady State : 0.00 Average Iterations per Step : 2.00 *************************** Subcatchment Runoff Summary *************************** -------------------------------------------------------------------------------------------------------- Total Total Total Total Total Total Peak Runoff Precip Runon Evap Infil Runoff Runoff Runoff Coeff Subcatchment in in in in in 10^6 gal CFS -------------------------------------------------------------------------------------------------------- SUB_GSMB010091 5.81 0.00 0.00 1.82 3.86 0.09 1.71 0.664 SUB_GSMB010078 5.81 0.00 0.00 2.47 3.20 2.41 39.99 0.551 SUB_GSMB010057 5.81 0.00 0.00 1.90 3.82 0.16 3.49 0.658 SUB_GSMB010055 5.81 0.00 0.00 2.12 3.55 1.46 25.32 0.611 SUB_1 5.81 0.00 0.00 2.19 3.37 1.62 18.13 0.579 SUB_2 5.81 0.00 0.00 2.05 3.49 3.52 38.57 0.601 ****************** Node Depth Summary ****************** --------------------------------------------------------------------- Average Maximum Maximum Time of Max Depth Depth HGL Occurrence Node Type Feet Feet Feet days hr:min --------------------------------------------------------------------- GSMB010091 JUNCTION 2.75 4.71 66.63 0 20:57 GSMB010078 JUNCTION 4.76 6.73 66.63 0 20:57 GSMB010057 JUNCTION 6.51 8.48 66.63 0 20:56 GSMB010089 JUNCTION 3.07 5.03 66.63 0 20:56 GSMB010077 JUNCTION 5.86 7.83 66.63 0 20:57 GSMB010055 JUNCTION 7.26 9.23 66.63 0 20:56 DUMMY_JUNCTION JUNCTION 8.27 10.23 66.63 0 20:56 GSMB010093 JUNCTION 1.84 3.66 66.63 0 20:58 Outlet OUTFALL 6.23 6.23 62.63 0 00:00
Existing Conditions: Davenport Farm Road (10-Year)
SWMM 5 Page 2

STORAGE_1 STORAGE 1.65 3.24 66.64 0 20:53 STORAGE_2 STORAGE 1.53 3.45 66.65 0 21:14 ******************* Node Inflow Summary ******************* ------------------------------------------------------------------------------------- Maximum Maximum Lateral Total Lateral Total Time of Max Inflow Inflow Inflow Inflow Occurrence Volume Volume Node Type CFS CFS days hr:min 10^6 gal 10^6 gal ------------------------------------------------------------------------------------- GSMB010091 JUNCTION 1.71 13.71 0 13:31 0.089 1.675 GSMB010078 JUNCTION 39.98 39.98 0 13:00 2.400 4.384 GSMB010057 JUNCTION 3.49 72.04 0 00:03 0.158 2.962 GSMB010089 JUNCTION 0.00 19.99 0 00:06 0.000 1.701 GSMB010077 JUNCTION 0.00 52.63 0 00:03 0.000 3.610 GSMB010055 JUNCTION 25.31 93.63 0 00:03 1.461 4.486 DUMMY_JUNCTION JUNCTION 0.00 279.52 0 00:00 0.000 3.927 GSMB010093 JUNCTION 0.00 17.09 0 14:24 0.000 2.023 Outlet OUTFALL 0.00 279.52 0 00:00 0.000 3.374 STORAGE_1 STORAGE 18.13 18.70 0 13:13 1.612 1.640 STORAGE_2 STORAGE 38.57 43.22 0 13:45 3.507 4.661 ********************** Node Surcharge Summary ********************** Surcharging occurs when water rises above the top of the highest conduit. --------------------------------------------------------------------- Max. Height Min. Depth Hours Above Crown Below Rim Node Type Surcharged Feet Feet --------------------------------------------------------------------- GSMB010057 JUNCTION 8.36 0.478 0.022 DUMMY_JUNCTION JUNCTION 8.05 0.428 1.772 ********************* Node Flooding Summary ********************* No nodes were flooded. ********************** Storage Volume Summary ********************** -------------------------------------------------------------------------------------------- Average Avg E&I Maximum Max Time of Max Maximum Volume Pcnt Pcnt Volume Pcnt Occurrence Outflow Storage Unit 1000 ft3 Full Loss 1000 ft3 Full days hr:min CFS -------------------------------------------------------------------------------------------- STORAGE_1 59.147 15 0 117.945 30 0 20:53 6.07 STORAGE_2 249.687 18 0 566.623 40 0 21:14 3.53 *********************** Outfall Loading Summary *********************** ----------------------------------------------------------- Flow Avg. Max. Total Freq. Flow Flow Volume Outfall Node Pcnt. CFS CFS 10^6 gal ----------------------------------------------------------- Outlet 99.98 6.65 279.52 3.374 ----------------------------------------------------------- System 99.98 6.65 279.52 3.374
Existing Conditions: Davenport Farm Road (10-Year)
SWMM 5 Page 3

******************** Link Flow Summary ******************** ----------------------------------------------------------------------------- Maximum Time of Max Maximum Max/ Max/ |Flow| Occurrence |Veloc| Full Full Link Type CFS days hr:min ft/sec Flow Depth ----------------------------------------------------------------------------- 1_EX24CMP CONDUIT 6.07 0 15:09 2.62 0.52 1.00 OVERLAND_1_EX24CMP CONDUIT 0.00 0 00:00 0.00 0.00 0.00 2_EX30CMP CONDUIT 17.01 0 14:24 3.89 1.17 1.00 OVERLAND_2_EX30CMP CONDUIT 0.00 0 00:00 0.00 0.00 0.00 3_OPENCHANNEL CONDUIT 13.40 0 13:32 1.18 0.07 0.70 4_EX48RCP CONDUIT 12.93 0 13:32 2.19 0.07 1.00 5_OPENCHANNEL CONDUIT 19.99 0 00:06 1.96 0.01 0.89 6_EX_5x7_Arch_CMP CONDUIT 35.21 0 13:00 3.64 0.08 0.98 OVERLAND_6_EX_5x7_Arch_CMP CONDUIT 14.06 0 17:15 0.19 0.00 0.53 7_OPENCHANNEL CONDUIT 52.63 0 00:03 2.96 0.13 1.00 8_EX48RCP CONDUIT 72.04 0 00:03 4.10 0.21 1.00 OVERLAND_8_EX48RCP CONDUIT 51.80 0 12:46 1.37 0.01 1.00 DUMMY_CHANNEL CONDUIT 279.52 0 00:00 12.06 38.26 1.00 9_OPENCHANNEL CONDUIT 86.38 0 00:03 4.07 0.86 1.00 OVERLAND_9_OPENCHANNEL CONDUIT 26.17 0 00:06 0.62 0.02 0.95 *************************** Flow Classification Summary *************************** ----------------------------------------------------------------------------------------- Adjusted --- Fraction of Time in Flow Class ---- Avg. Avg. /Actual Up Down Sub Sup Up Down Froude Flow Conduit Length Dry Dry Dry Crit Crit Crit Crit Number Change ----------------------------------------------------------------------------------------- 1_EX24CMP 1.00 0.25 0.00 0.00 0.74 0.01 0.00 0.00 0.13 0.0002 OVERLAND_1_EX24CMP 1.00 1.00 0.00 0.00 0.00 0.00 0.00 0.00 0.00 0.0000 2_EX30CMP 1.00 0.25 0.00 0.00 0.75 0.00 0.00 0.00 0.14 0.0002 OVERLAND_2_EX30CMP 1.00 1.00 0.00 0.00 0.00 0.00 0.00 0.00 0.00 0.0000 3_OPENCHANNEL 1.00 0.01 0.26 0.00 0.73 0.00 0.00 0.00 0.03 0.0000 4_EX48RCP 1.00 0.01 0.00 0.00 0.99 0.00 0.00 0.00 0.01 0.0002 5_OPENCHANNEL 1.00 0.00 0.00 0.00 0.99 0.00 0.00 0.00 0.01 0.0000 6_EX_5x7_Arch_CMP 1.00 0.00 0.00 0.00 1.00 0.00 0.00 0.00 0.01 0.0001 OVERLAND_6_EX_5x7_Arch_CMP 1.00 0.43 0.27 0.00 0.30 0.00 0.00 0.00 0.01 0.0000 7_OPENCHANNEL 1.00 0.00 0.00 0.00 1.00 0.00 0.00 0.00 0.01 0.0001 8_EX48RCP 1.00 0.00 0.00 0.00 1.00 0.00 0.00 0.00 0.00 0.0003 OVERLAND_8_EX48RCP 1.00 0.01 0.39 0.00 0.60 0.00 0.00 0.00 0.01 0.0000 DUMMY_CHANNEL 1.00 0.00 0.00 0.00 1.00 0.00 0.00 0.00 0.02 0.0100 9_OPENCHANNEL 1.00 0.00 0.00 0.00 1.00 0.00 0.00 0.00 0.01 0.0002 OVERLAND_9_OPENCHANNEL 1.00 0.00 0.00 0.00 0.99 0.00 0.00 0.00 0.01 0.0000 ************************* Conduit Surcharge Summary ************************* ---------------------------------------------------------------------------- Hours Hours --------- Hours Full -------- Above Full Capacity Conduit Both Ends Upstream Dnstream Normal Flow Limited ---------------------------------------------------------------------------- 1_EX24CMP 10.34 10.34 10.34 0.01 0.01 2_EX30CMP 8.69 8.69 8.69 1.36 0.01 4_EX48RCP 9.48 9.48 9.48 0.01 0.01 7_OPENCHANNEL 10.50 10.50 10.50 0.01 0.01 8_EX48RCP 23.92 23.92 23.92 0.01 0.01 OVERLAND_8_EX48RCP 8.36 8.36 8.36 0.01 0.01 DUMMY_CHANNEL 23.99 23.99 23.99 12.71 13.87 9_OPENCHANNEL 23.92 23.92 23.92 0.01 0.01
Analysis begun on: Tue Jan 12 15:11:46 2016 Analysis ended on: Tue Jan 12 15:11:47 2016 Total elapsed time: 00:00:01
Existing Conditions: Davenport Farm Road (10-Year)
SWMM 5 Page 4

SECONDARY SYSTEM
ALTERNATIVE:
SWMM OUTPUT

EPA STORM WATER MANAGEMENT MODEL - VERSION 5.0 (Build 5.0.022) --------------------------------------------------------------
Alternative: Davenport Farm Road(10-Year) Starting WSEL from Gum Branch XS6400 10-Year = 62.63' ********************************************************* NOTE: The summary statistics displayed in this report are based on results found at every computational time step, not just on results from each reporting time step. ********************************************************* **************** Analysis Options **************** Flow Units ............... CFS Process Models: Rainfall/Runoff ........ YES Snowmelt ............... NO Groundwater ............ NO Flow Routing ........... YES Ponding Allowed ........ NO Water Quality .......... NO Infiltration Method ...... CURVE_NUMBER Flow Routing Method ...... DYNWAVE Starting Date ............ MAY-20-2010 00:00:00 Ending Date .............. MAY-21-2010 00:00:00 Antecedent Dry Days ...... 0.0 Report Time Step ......... 00:15:00 Wet Time Step ............ 00:10:00 Dry Time Step ............ 00:10:00 Routing Time Step ........ 10.00 sec
WARNING 04: minimum elevation drop used for Conduit DUMMY_CHANNEL
WARNING 02: maximum depth increased for Node GSMB010091
WARNING 02: maximum depth increased for Node GSMB010078
WARNING 02: maximum depth increased for Node GSMB010089
WARNING 02: maximum depth increased for Node GSMB010055
WARNING 02: maximum depth increased for Node GSMB010093 ************************** Volume Depth Runoff Quantity Continuity acre-feet inches ************************** --------- ------- Total Precipitation ...... 48.467 5.812 Evaporation Loss ......... 0.000 0.000 Infiltration Loss ........ 18.309 2.196 Surface Runoff ........... 28.410 3.407 Final Surface Storage .... 1.814 0.217 Continuity Error (%) ..... -0.135 ************************** Volume Volume Flow Routing Continuity acre-feet 10^6 gal ************************** --------- --------- Dry Weather Inflow ....... 0.000 0.000 Wet Weather Inflow ....... 28.313 9.226 Groundwater Inflow ....... 0.000 0.000 RDII Inflow .............. 0.000 0.000 External Inflow .......... 1.904 0.620 External Outflow ......... 8.452 2.754 Internal Outflow ......... 0.000 0.000 Storage Losses ........... 0.000 0.000 Initial Stored Volume .... 0.025 0.008 Final Stored Volume ...... 20.825 6.786 Continuity Error (%) ..... 3.189
Alternative: Davenport Farm Road(10-Year)
SWMM 5 Page 1

************************* Highest Continuity Errors ************************* Node DUMMY_JUNCTION (20.30%) Node GSMB010055 (16.32%) Node GSMB010057 (5.92%) Node GSMB010077 (3.95%) Node GSMB010089 (3.75%) *************************** Time-Step Critical Elements *************************** Link DUMMY_CHANNEL (46.63%) Link 2_EX30CMP (13.33%) Link 6_EX_5x7_Arch_CMP (4.52%) Link 4_EX48RCP (3.40%) Link 1_EX24CMP (2.80%) ******************************** Highest Flow Instability Indexes ******************************** Link 8_EX48RCP (3) Link 7_OPENCHANNEL (3) Link 6_EX_5x7_Arch_CMP (3) Link 5_OPENCHANNEL (3) Link DUMMY_CHANNEL (3) ************************* Routing Time Step Summary ************************* Minimum Time Step : 0.50 sec Average Time Step : 7.03 sec Maximum Time Step : 10.00 sec Percent in Steady State : 0.00 Average Iterations per Step : 2.00 *************************** Subcatchment Runoff Summary *************************** -------------------------------------------------------------------------------------------------------- Total Total Total Total Total Total Peak Runoff Precip Runon Evap Infil Runoff Runoff Runoff Coeff Subcatchment in in in in in 10^6 gal CFS -------------------------------------------------------------------------------------------------------- SUB_GSMB010091 5.81 0.00 0.00 1.82 3.86 0.09 1.71 0.664 SUB_GSMB010078 5.81 0.00 0.00 2.47 3.20 2.41 39.99 0.551 SUB_GSMB010057 5.81 0.00 0.00 1.90 3.82 0.16 3.49 0.658 SUB_GSMB010055 5.81 0.00 0.00 2.12 3.55 1.46 25.32 0.611 SUB_1 5.81 0.00 0.00 2.19 3.37 1.62 18.13 0.579 SUB_2 5.81 0.00 0.00 2.05 3.49 3.52 38.57 0.601 ****************** Node Depth Summary ****************** --------------------------------------------------------------------- Average Maximum Maximum Time of Max Depth Depth HGL Occurrence Node Type Feet Feet Feet days hr:min --------------------------------------------------------------------- GSMB010091 JUNCTION 2.75 4.71 66.63 0 20:57 GSMB010078 JUNCTION 4.76 6.73 66.63 0 20:57 GSMB010057 JUNCTION 6.51 8.48 66.63 0 20:56 GSMB010089 JUNCTION 3.07 5.03 66.63 0 20:56 GSMB010077 JUNCTION 5.86 7.83 66.63 0 20:57 GSMB010055 JUNCTION 7.26 9.23 66.63 0 20:56 DUMMY_JUNCTION JUNCTION 8.27 10.23 66.63 0 20:56 GSMB010093 JUNCTION 1.84 3.66 66.63 0 20:58 Outlet OUTFALL 6.23 6.23 62.63 0 00:00
Alternative: Davenport Farm Road(10-Year)
SWMM 5 Page 2

STORAGE_1 STORAGE 1.65 3.24 66.64 0 20:53 STORAGE_2 STORAGE 1.53 3.45 66.65 0 21:14 ******************* Node Inflow Summary ******************* ------------------------------------------------------------------------------------- Maximum Maximum Lateral Total Lateral Total Time of Max Inflow Inflow Inflow Inflow Occurrence Volume Volume Node Type CFS CFS days hr:min 10^6 gal 10^6 gal ------------------------------------------------------------------------------------- GSMB010091 JUNCTION 1.71 13.71 0 13:31 0.089 1.675 GSMB010078 JUNCTION 39.98 39.98 0 13:00 2.400 4.384 GSMB010057 JUNCTION 3.49 72.04 0 00:03 0.158 2.962 GSMB010089 JUNCTION 0.00 19.99 0 00:06 0.000 1.701 GSMB010077 JUNCTION 0.00 52.63 0 00:03 0.000 3.610 GSMB010055 JUNCTION 25.31 93.63 0 00:03 1.461 4.486 DUMMY_JUNCTION JUNCTION 0.00 279.52 0 00:00 0.000 3.927 GSMB010093 JUNCTION 0.00 17.09 0 14:24 0.000 2.023 Outlet OUTFALL 0.00 279.52 0 00:00 0.000 3.374 STORAGE_1 STORAGE 18.13 18.70 0 13:13 1.612 1.640 STORAGE_2 STORAGE 38.57 43.22 0 13:45 3.507 4.661 ********************** Node Surcharge Summary ********************** Surcharging occurs when water rises above the top of the highest conduit. --------------------------------------------------------------------- Max. Height Min. Depth Hours Above Crown Below Rim Node Type Surcharged Feet Feet --------------------------------------------------------------------- GSMB010057 JUNCTION 8.36 0.478 0.022 DUMMY_JUNCTION JUNCTION 8.05 0.428 1.772 ********************* Node Flooding Summary ********************* No nodes were flooded. ********************** Storage Volume Summary ********************** -------------------------------------------------------------------------------------------- Average Avg E&I Maximum Max Time of Max Maximum Volume Pcnt Pcnt Volume Pcnt Occurrence Outflow Storage Unit 1000 ft3 Full Loss 1000 ft3 Full days hr:min CFS -------------------------------------------------------------------------------------------- STORAGE_1 59.147 15 0 117.945 30 0 20:53 6.07 STORAGE_2 249.687 18 0 566.623 40 0 21:14 3.53 *********************** Outfall Loading Summary *********************** ----------------------------------------------------------- Flow Avg. Max. Total Freq. Flow Flow Volume Outfall Node Pcnt. CFS CFS 10^6 gal ----------------------------------------------------------- Outlet 99.98 6.65 279.52 3.374 ----------------------------------------------------------- System 99.98 6.65 279.52 3.374
Alternative: Davenport Farm Road(10-Year)
SWMM 5 Page 3

******************** Link Flow Summary ******************** ----------------------------------------------------------------------------- Maximum Time of Max Maximum Max/ Max/ |Flow| Occurrence |Veloc| Full Full Link Type CFS days hr:min ft/sec Flow Depth ----------------------------------------------------------------------------- 1_EX24CMP CONDUIT 6.07 0 15:09 2.62 0.52 1.00 OVERLAND_1_EX24CMP CONDUIT 0.00 0 00:00 0.00 0.00 0.00 2_EX30CMP CONDUIT 17.01 0 14:24 3.89 1.17 1.00 OVERLAND_2_EX30CMP CONDUIT 0.00 0 00:00 0.00 0.00 0.00 3_OPENCHANNEL CONDUIT 13.40 0 13:32 1.18 0.07 0.70 4_EX48RCP CONDUIT 12.93 0 13:32 2.19 0.07 1.00 5_OPENCHANNEL CONDUIT 19.99 0 00:06 1.96 0.01 0.89 6_EX_5x7_Arch_CMP CONDUIT 35.21 0 13:00 3.64 0.08 0.98 OVERLAND_6_EX_5x7_Arch_CMP CONDUIT 14.06 0 17:15 0.19 0.00 0.53 7_OPENCHANNEL CONDUIT 52.63 0 00:03 2.96 0.13 1.00 8_EX48RCP CONDUIT 72.04 0 00:03 4.10 0.21 1.00 OVERLAND_8_EX48RCP CONDUIT 51.80 0 12:46 1.37 0.01 1.00 DUMMY_CHANNEL CONDUIT 279.52 0 00:00 12.06 38.26 1.00 9_OPENCHANNEL CONDUIT 86.38 0 00:03 4.07 0.86 1.00 OVERLAND_9_OPENCHANNEL CONDUIT 26.17 0 00:06 0.62 0.02 0.95 *************************** Flow Classification Summary *************************** ----------------------------------------------------------------------------------------- Adjusted --- Fraction of Time in Flow Class ---- Avg. Avg. /Actual Up Down Sub Sup Up Down Froude Flow Conduit Length Dry Dry Dry Crit Crit Crit Crit Number Change ----------------------------------------------------------------------------------------- 1_EX24CMP 1.00 0.25 0.00 0.00 0.74 0.01 0.00 0.00 0.13 0.0002 OVERLAND_1_EX24CMP 1.00 1.00 0.00 0.00 0.00 0.00 0.00 0.00 0.00 0.0000 2_EX30CMP 1.00 0.25 0.00 0.00 0.75 0.00 0.00 0.00 0.14 0.0002 OVERLAND_2_EX30CMP 1.00 1.00 0.00 0.00 0.00 0.00 0.00 0.00 0.00 0.0000 3_OPENCHANNEL 1.00 0.01 0.26 0.00 0.73 0.00 0.00 0.00 0.03 0.0000 4_EX48RCP 1.00 0.01 0.00 0.00 0.99 0.00 0.00 0.00 0.01 0.0002 5_OPENCHANNEL 1.00 0.00 0.00 0.00 0.99 0.00 0.00 0.00 0.01 0.0000 6_EX_5x7_Arch_CMP 1.00 0.00 0.00 0.00 1.00 0.00 0.00 0.00 0.01 0.0001 OVERLAND_6_EX_5x7_Arch_CMP 1.00 0.43 0.27 0.00 0.30 0.00 0.00 0.00 0.01 0.0000 7_OPENCHANNEL 1.00 0.00 0.00 0.00 1.00 0.00 0.00 0.00 0.01 0.0001 8_EX48RCP 1.00 0.00 0.00 0.00 1.00 0.00 0.00 0.00 0.00 0.0003 OVERLAND_8_EX48RCP 1.00 0.01 0.39 0.00 0.60 0.00 0.00 0.00 0.01 0.0000 DUMMY_CHANNEL 1.00 0.00 0.00 0.00 1.00 0.00 0.00 0.00 0.02 0.0100 9_OPENCHANNEL 1.00 0.00 0.00 0.00 1.00 0.00 0.00 0.00 0.01 0.0002 OVERLAND_9_OPENCHANNEL 1.00 0.00 0.00 0.00 0.99 0.00 0.00 0.00 0.01 0.0000 ************************* Conduit Surcharge Summary ************************* ---------------------------------------------------------------------------- Hours Hours --------- Hours Full -------- Above Full Capacity Conduit Both Ends Upstream Dnstream Normal Flow Limited ---------------------------------------------------------------------------- 1_EX24CMP 10.34 10.34 10.34 0.01 0.01 2_EX30CMP 8.69 8.69 8.69 1.36 0.01 4_EX48RCP 9.48 9.48 9.48 0.01 0.01 7_OPENCHANNEL 10.50 10.50 10.50 0.01 0.01 8_EX48RCP 23.92 23.92 23.92 0.01 0.01 OVERLAND_8_EX48RCP 8.36 8.36 8.36 0.01 0.01 DUMMY_CHANNEL 23.99 23.99 23.99 12.71 13.87 9_OPENCHANNEL 23.92 23.92 23.92 0.01 0.01
Analysis begun on: Tue Jan 12 15:14:32 2016 Analysis ended on: Tue Jan 12 15:14:33 2016 Total elapsed time: 00:00:01
Alternative: Davenport Farm Road(10-Year)
SWMM 5 Page 4

Appendix I:
BMP Conceptual Design and Nutrient Calculations
List of Contents:
1. BMP Conceptual Design Calculations
2. Nutrient Calculations
3. RSC Calculations

APPENDIX IBMP CONCEPTUAL DESIGN
DRAINAGE AREA INPUT PARAMETERSWater Quality Event (in) 1.00 Input
Pervious ImperviousDrainage Area (sq ft) 171,751 114,501 Input Sub-basin CN 80 93 Input S (in) 2.50 0.75 CalculatedR/O (in) 0.08 0.45 CalculatedSub-basin WQ Volume (sf*in) 14313 51570 CalculatedSub-basin WQ Volume (cf) 1193 4297 Calculated
Summary CalculationsTotal Watershed area (sq ft) 286,252 CalculatedTotal Watershed area (acres) 6.57 CalculatedTotal WQ Runoff Volume (sf*in) 65,882 CalculatedTotal WQ Runoff Volume (cf) 5,490 CalculatedPeak Flow Rate, cfs 24.20 CalculatedPipe Diameter, ft 22.78 24'' Calculated
Surface area of bioretentionAverage depth of water (in) 10 Input Surface area of bioretention (sf) 6,588 CalculatedSurface area of bioretention (ac) 0.151 CalculatedSurface area of bioretention, available (sf) 32,234 Input Surface area of bioretention, available (ac) 0.74 Input
Bioretention Pond - Ridgewood ElementaryProject: City of Greenville - Swift Creek Watershed Master PlanPrepared by: SMBChecked by: TLMDate: 10/26/15

Rv = runoff coefficient = 0.05 + 0.009 (I) Pj = 90%
A = area of the development site (acres). 12, 2.72 conversion factors
C = Rational Runoff Coefficient)
I = Intensity
Tc = Time of Concentration
DRAINAGE AREA INPUT PARAMETERSDrainage Area: 2.10 acres InputImpervious Area 0.63 acres Calculated% Impervious 30.00 percent InputRunoff volume1 0.84 inch-acre CalculatedRunoff volume 2 1.00 inch-acre CalculatedRunoff volume 3,630.00 cu ftLength 590.00 feet InputDepth 12.0 inches InputRequired Cross Section 6.2 sq feet CalculatedWidth 4.0SS 3.0 h/vDepth 1.0Top Width 10.0Area check 7.0
Water Quality Swale - PinecrestProject: City of Greenville - Swift Creek Watershed Master PlanPrepared by: SMBChecked by: TLMDate: 10/26/15

APPENDIX IBMP CONCEPTUAL DESIGN
DRAINAGE AREA INPUT PARAMETERSWater Quality Event (in) 1.00 Input
Pervious ImperviousDrainage Area (sq ft) 152,669 38,167 Input Sub-basin CN 80 93 Input S (in) 2.50 0.75 CalculatedR/O (in) 0.08 0.45 CalculatedSub-basin WQ Volume (sf*in) 12722 17190 CalculatedSub-basin WQ Volume (cf) 1060 1432 Calculated
Summary CalculationsTotal Watershed area (sq ft) 190,836 CalculatedTotal Watershed area (acres) 4.38 CalculatedTotal WQ Runoff Volume (sf*in) 29,912 CalculatedTotal WQ Runoff Volume (cf) 2,493 CalculatedPeak Flow Rate, cfs 12.12 CalculatedPipe Diameter, ft 17.58 18'' Calculated
Surface area of bioretentionAverage depth of water (in) 10 Input Surface area of bioretention (sf) 2,991 CalculatedSurface area of bioretention (ac) 0.069 CalculatedSurface area of bioretention, available (sf) 4,356 Input Surface area of bioretention, available (ac) 0.10 Input
Bioretention Pond - Emerald ParkProject: City of Greenville - Swift CreekWatershed Master PlanPrepared by: SMBChecked by: TLMDate: 10/26/2015

Rv = runoff coefficient = 0.05 + 0.009 (I) Pj = 90%
A = area of the development site (acres). 12, 2.72 conversion factors
C = Rational Runoff Coefficient)
I = Intensity
Tc = Time of Concentration
DRAINAGE AREA INPUT PARAMETERSDrainage Area: 4.75 acres InputImpervious Area 0.95 acres Calculated% Impervious 20.00 percent InputRunoff volume1 1.90 inch-acre CalculatedRunoff volume 2 1.00 inch-acre CalculatedRunoff volume 6,897.00 cu ftLength 1785.00 feet InputDepth 12.0 inches InputRequired Cross Section 3.9 sq feet CalculatedWidth 2.0SS 3.0 h/vDepth 1.5Top Width 5.0Area check 5.3
Water Quality Swale - Davenport Farm RoadProject: City of Greenville - Swift Creek Watershed Master PlanPrepared by: SMBChecked by: TLMDate: 10/26/15

APPENDIX IBMP CONCEPTUAL DESIGN
DRAINAGE AREA INPUT PARAMETERSWater Quality Event (in) 1.00 Input
Pervious ImperviousDrainage Area (sq ft) 1,631,113 407,778 Input Sub-basin CN 80 93 Input S (in) 2.50 0.75 CalculatedR/O (in) 0.08 0.45 CalculatedSub-basin WQ Volume (sf*in) 135926 183658 CalculatedSub-basin WQ Volume (cf) 11327 15305 Calculated
Summary CalculationsTotal Watershed area (sq ft) 2,038,891 CalculatedTotal Watershed area (acres) 46.81 CalculatedTotal WQ Runoff Volume (sf*in) 319,584 CalculatedTotal WQ Runoff Volume (cf) 26,632 CalculatedPeak Flow, cfs 129.46 Calculated
Surface area of RSCLength of Channel (ft) 350 Input Riffle Top Width (ft) 30 CalculatedRiffle Depth (ft) 2 CalculatedPool Depth (ft) 1 CalculatedNumber of Pools 15 CalculatedSurface Area of RSC (sf) 10,500 Calculated
Regenerative Stormwater Conveyance - South BendProject: City of Greenville - Swift Creek Watershed Master PlanPrepared by: SMBChecked by: TLMDate: 10/26/2015

APPENDIX IBMP CONCEPTUAL DESIGN
DRAINAGE AREA INPUT PARAMETERSWater Quality Event (in) 1.00 Input
Pervious ImperviousDrainage Area (sq ft) 217,532 507,575 Input Sub-basin CN 80 93 Input S (in) 2.50 0.75 CalculatedR/O (in) 0.08 0.45 CalculatedSub-basin WQ Volume (sf*in) 18128 228605 CalculatedSub-basin WQ Volume (cf) 1511 19050 Calculated
Summary CalculationsTotal Watershed area (sq ft) 725,107 CalculatedTotal Watershed area (acres) 16.65 CalculatedTotal WQ Runoff Volume (sf*in) 246,732 CalculatedTotal WQ Runoff Volume (cf) 20,561 CalculatedPeak Flow Rate, cfs 84.18 CalculatedPipe Diameter, ft 36.36 36'' Calculated
Surface area of Wet PondAverage depth of water (in) 12 Input Surface area of pond (sf) 20,561 CalculatedSurface area of pond (ac) 0.472 CalculatedSurface area of pond, available (sf) 27,000 Input Surface area of pond, available (ac) 0.62 Input
Wet Pond - Wells Fargo BankProject: City of Greenville - Swift Creek Watershed Master PlanPrepared by: SMBChecked by: TLMDate: 10/26/2015

APPENDIX IBMP CONCEPTUAL DESIGN
DRAINAGE AREA INPUT PARAMETERSWater Quality Event (in) 1.00 Input
Pervious ImperviousDrainage Area (sq ft) 297,337 302,663 Input Sub-basin CN 80 93 Input S (in) 2.50 0.75 CalculatedR/O (in) 0.08 0.45 CalculatedSub-basin WQ Volume (sf*in) 24778 136315 CalculatedSub-basin WQ Volume (cf) 2065 11360 Calculated
Summary CalculationsTotal Watershed area (sq ft) 600,000 CalculatedTotal Watershed area (acres) 13.77 CalculatedTotal WQ Runoff Volume (sf*in) 161,093 CalculatedTotal WQ Runoff Volume (cf) 13,424 CalculatedPeak Flow, cfs 57.31 CalculatedPipe Diameter, ft 31.48 36'' Calculated
Surface area of Wet PondAverage depth of water (in) 12 Input Surface area of pond (sf) 13,424 CalculatedSurface area of pond (ac) 0.31 CalculatedSurface area of pond, available (sf) 13,000 Input Surface area of pond, available (ac) 0.30 Input
Wet Pond Retrofit - Sterling Pointe ApartmentsProject: City of Greenville - Swift Creek Watershed Master PlanPrepared by: SMBChecked by: TLMDate: 10/26/2015

APPENDIX IBMP CONCEPTUAL DESIGN
DRAINAGE AREA INPUT PARAMETERSWater Quality Event (in) 1.00 Input
Pervious ImperviousDrainage Area (sq ft) 921,522 102,391 Input Sub-basin CN 74 93 Input S (in) 3.51 0.75 CalculatedR/O (in) 0.02 0.45 CalculatedSub-basin WQ Volume (sf*in) 21373 46115 CalculatedSub-basin WQ Volume (cf) 1781 3843 Calculated
Summary CalculationsTotal Watershed area (sq ft) 1,023,913 CalculatedTotal Watershed area (acres) 23.51 CalculatedTotal WQ Runoff Volume (sf*in) 67,489 CalculatedTotal WQ Runoff Volume (cf) 5,624 CalculatedPeak Flow, cfs 54.24 Calculated
Surface area of RSCLength of Channel (ft) 130 Input Riffle Top Width (ft) 40 CalculatedRiffle Depth (ft) 1 CalculatedPool Depth (ft) 2 CalculatedNumber of Pools 5 CalculatedSurface Area of RSC (sf) 5,200 Calculated
Regenerative Stormwater Conveyance - South Central High SchoolProject: City of Greenville - Swift Creek Watershed Master PlanPrepared by: SMBChecked by: TLMDate: 10/26/2015

APPENDIX IBMP CONCEPTUAL DESIGN
DRAINAGE AREA INPUT PARAMETERSWater Quality Event (in) 1.00 Input
Pervious ImperviousDrainage Area (sq ft) 570,957 570,957 Input Sub-basin CN 74 93 Input S (in) 3.51 0.75 CalculatedR/O (in) 0.02 0.45 CalculatedSub-basin WQ Volume (sf*in) 13242 257151 CalculatedSub-basin WQ Volume (cf) 1104 21429 Calculated
Summary CalculationsTotal Watershed area (sq ft) 1,141,914 CalculatedTotal Watershed area (acres) 26.21 CalculatedTotal WQ Runoff Volume (sf*in) 270,394 CalculatedTotal WQ Runoff Volume (cf) 22,533 CalculatedPeak Flow Rate, cfs 108.54 CalculatedPipe Diameter, ft 40.00 42'' Calculated
Surface area of bioretentionAverage depth of water (in) 10 Input Surface area of bioretention (sf) 27,039 CalculatedSurface area of bioretention (ac) 0.62 CalculatedSurface area of bioretention, available (sf) 33,000 Input Surface area of bioretention, available (ac) 0.76 Input
Bioretention Pond - South Central High SchoolProject: City of Greenville - Swift Creek Watershed Master PlanPrepared by: SMBChecked by: TLMDate: 10/26/2015

APPENDIX IBMP CONCEPTUAL DESIGN
DRAINAGE AREA INPUT PARAMETERSWater Quality Event (in) 1.00 Input
Pervious ImperviousDrainage Area (sq ft) 4,318,468 1,439,489 Input Sub-basin CN 74 93 Input S (in) 3.51 0.75 CalculatedR/O (in) 0.02 0.45 CalculatedSub-basin WQ Volume (sf*in) 100160 648326 CalculatedSub-basin WQ Volume (cf) 8347 54027 Calculated
Summary CalculationsTotal Watershed area (sq ft) 5,757,957 CalculatedTotal Watershed area (acres) 132.18 CalculatedTotal WQ Runoff Volume (sf*in) 748,486 CalculatedTotal WQ Runoff Volume (cf) 62,374 CalculatedPeak Flow Rate, cfs 93.55 CalculatedPipe Diameter, ft 37.83 42'' Calculated
Surface area of wetlandAverage depth of water (in) 8 Input Surface area of wetland (sf) 93,561 CalculatedSurface area of wetland (ac) 2.15 CalculatedSurface area of wetland, available (sf) 94,000 Input Surface area of wetland, available (ac) 2.22 Input
Water Quality Wetland - Dana BrookeProject: City of Greenville - Swift Creek Watershed Master PlanPrepared by: SMBChecked by: TLMDate: 10/26/2015

3. Development Summary
WATERSHED SUMMARY Ver2.0
Bioretention with
IWS80% 0.95 0.12
Bioretention
without IWS50% 1.00 0.12
Dry Detention Pond 10% 1.20 0.20
Grassed Swale 10% 1.21 0.26
Green Roof 50% 1.08 0.15
Level Spdr, Filter
Strip50% 1.20 0.15
Percent Difference Between:
Sand Filter 5% 0.92 0.14
*Negative percent difference values indicate a decrease in runoff volume, pollutant concentration or pollutant loading. Positive values indicate an increase. *if treating commercial parking lot, TP effluent concentration = 0.16 mg/L
BMP SUMMARY Ver2.0
BMP 1 BMP 2 BMP 3 BMP 1 BMP 2 BMP 3 BMP 1 BMP 2 BMP 3 BMP 1 BMP 2 BMP 3 BMP 1 BMP 2 BMP 3 BMP 1 BMP 2 BMP 3
Bioretention with
IWS‐‐ ‐‐ ‐‐ ‐‐ ‐‐ ‐‐ ‐‐ ‐‐ ‐‐ ‐‐ ‐‐ ‐‐ ‐‐ ‐‐ ‐‐ ‐‐ ‐‐
6.57 ‐‐ ‐‐ ‐‐ ‐‐ ‐‐ ‐‐ ‐‐ ‐‐ ‐‐ ‐‐ ‐‐ ‐‐ ‐‐ ‐‐ ‐‐ ‐‐ ‐‐
500,984 ‐‐ ‐‐ ‐‐ ‐‐ ‐‐ ‐‐ ‐‐ ‐‐ ‐‐ ‐‐ ‐‐ ‐‐ ‐‐ ‐‐ ‐‐ ‐‐ ‐‐
80% ‐‐ ‐‐ ‐‐ ‐‐ ‐‐ ‐‐ ‐‐ ‐‐ ‐‐ ‐‐ ‐‐ ‐‐ ‐‐ ‐‐ ‐‐ ‐‐ ‐‐
1.49 ‐‐ ‐‐ ‐‐ ‐‐ ‐‐ ‐‐ ‐‐ ‐‐ ‐‐ ‐‐ ‐‐ ‐‐ ‐‐ ‐‐ ‐‐ ‐‐ ‐‐
7.11 ‐‐ ‐‐ ‐‐ ‐‐ ‐‐ ‐‐ ‐‐ ‐‐ ‐‐ ‐‐ ‐‐ ‐‐ ‐‐ ‐‐ ‐‐ ‐‐ ‐‐
0.505 ‐‐ ‐‐ ‐‐ ‐‐ ‐‐ ‐‐ ‐‐ ‐‐ ‐‐ ‐‐ ‐‐ ‐‐ ‐‐ ‐‐ ‐‐ ‐‐ ‐‐
2.41 ‐‐ ‐‐ ‐‐ ‐‐ ‐‐ ‐‐ ‐‐ ‐‐ ‐‐ ‐‐ ‐‐ ‐‐ ‐‐ ‐‐ ‐‐ ‐‐ ‐‐
1.16 ‐‐ ‐‐ ‐‐ ‐‐ ‐‐ ‐‐ ‐‐ ‐‐ ‐‐ ‐‐ ‐‐ ‐‐ ‐‐ ‐‐ ‐‐ ‐‐ ‐‐
0.30 ‐‐ ‐‐ ‐‐ ‐‐ ‐‐ ‐‐ ‐‐ ‐‐ ‐‐ ‐‐ ‐‐ ‐‐ ‐‐ ‐‐ ‐‐ ‐‐ ‐‐
Volume Reduction
(%)
TN Effluent Concen.
(mg/L)
1.52
6.88
0.53
2.37
TP Effluent Concen.
(mg/L)
BMP VOLUME REDUCTIONS/EFFLUENT CONCENTRATIONS
Inflow Nitrogen EMC
(mg/L)
CATCHMENT 5
Percent Impervious
(%)
Annual Runoff Volume
(c.f.)475,829
Post‐Development Conditions
42.3%
499,660
1.50
7.10
0.57
286,189
Pre‐Development Conditions
40.0%
‐20%
‐‐
‐‐
Total Inflow Phosphorus
(lb/ac/yr)
BMP Outflow
Nitrogen (lbs/ac/yr)
Total Area Treated
(ac)
Percent Reduction in Phosphorus Load (%)
‐‐
CATCHMENT 2 CATCHMENT 3
1.22 ‐‐
Catchment Outflow
Total Nitrogen (lb/ac/yr)1.16
Percent Volume Reduced
(%)
BMP Outflow
Phosphorus (lbs/ac/yr)
Total Inflow Volume
(c.f.)
Total Inflow Nitrogen
(lb/ac/yr)
Inflow Phosphorus EMC
(mg/L)
Catchment Outflow Nitrogen EMC (mg/L)
CATCHMENT 4
‐‐ ‐‐
‐‐
Catchment Outflow
Total Phosphorus (lb/ac/yr)
84%
Catchment Outflow Phosphorus EMC
(mg/L)
Percent Reduction in Nitrogen Load (%)
CATCHMENT 1
Total Nitrogen EMC
(mg/L)
Total Nitrogen Loading
(lb/ac/yr)
Total Phosphorus EMC
(mg/L)
Total Phosphorus Loading
(lb/ac/yr)
Total Nitrogen Loading (lb/ac/yr)
Total Phosphorus EMC (mg/L)
Total Phosphorus Loading (lb/ac/yr)
Percent Impervious (%)
Annual Runoff Volume (c.f.)
Total Nitrogen EMC (mg/L)
‐‐0.297
88% ‐‐‐‐
‐‐
0.313
2.40
Ridgewood ElementarySMB
February 29, 2016
Development:Prepared By:
Date:
Post‐Development w/ BMPs
42.3%
100,197
1.22
1.16
0.31
0.30
REGION:
TOTAL DEVELOPMENT AREA (ft2):
Coastal
‐‐
‐‐
‐‐
‐‐
‐‐
CATCHMENT 6
‐‐ ‐‐‐‐
‐‐
‐‐
‐‐ ‐‐
‐‐ ‐‐
‐‐ ‐‐
‐‐ ‐‐‐‐
‐83%
‐40%
‐87%
Pre‐Dev. &
Post‐Dev. without BMPs
Post‐Dev without BMPs &
Post‐Dev with BMPs
‐80%
‐18%
‐84%
‐45%
‐88%
0%2%
5%
‐2%
3%
9%
1%
Pre‐Development &
Post‐Development with BMPs
2%
‐79%
0.39
0.15
0.11
0.12
Permeable
Pavement*
Water Harvesting
Wet Detention Pond
Wetland
60%
user defined
15%
25%
1.44
1.08
1.01
1.08
Return to Watershed Characteristics
Return to BMP Characteristics
Print Summary
Return to Instructions

3. Development Summary
WATERSHED SUMMARY Ver2.0
Bioretention with
IWS80% 0.95 0.12
Bioretention
without IWS50% 1.00 0.12
Dry Detention Pond 10% 1.20 0.20
Grassed Swale 10% 1.21 0.26
Green Roof 50% 1.08 0.15
Level Spdr, Filter
Strip50% 1.20 0.15
Percent Difference Between:
Sand Filter 5% 0.92 0.14
*Negative percent difference values indicate a decrease in runoff volume, pollutant concentration or pollutant loading. Positive values indicate an increase. *if treating commercial parking lot, TP effluent concentration = 0.16 mg/L
BMP SUMMARY Ver2.0
BMP 1 BMP 2 BMP 3 BMP 1 BMP 2 BMP 3 BMP 1 BMP 2 BMP 3 BMP 1 BMP 2 BMP 3 BMP 1 BMP 2 BMP 3 BMP 1 BMP 2 BMP 3
Grassed Swale ‐‐ ‐‐ ‐‐ ‐‐ ‐‐ ‐‐ ‐‐ ‐‐ ‐‐ ‐‐ ‐‐ ‐‐ ‐‐ ‐‐ ‐‐ ‐‐ ‐‐
2.10 ‐‐ ‐‐ ‐‐ ‐‐ ‐‐ ‐‐ ‐‐ ‐‐ ‐‐ ‐‐ ‐‐ ‐‐ ‐‐ ‐‐ ‐‐ ‐‐ ‐‐
135,397 ‐‐ ‐‐ ‐‐ ‐‐ ‐‐ ‐‐ ‐‐ ‐‐ ‐‐ ‐‐ ‐‐ ‐‐ ‐‐ ‐‐ ‐‐ ‐‐ ‐‐
10% ‐‐ ‐‐ ‐‐ ‐‐ ‐‐ ‐‐ ‐‐ ‐‐ ‐‐ ‐‐ ‐‐ ‐‐ ‐‐ ‐‐ ‐‐ ‐‐ ‐‐
1.51 ‐‐ ‐‐ ‐‐ ‐‐ ‐‐ ‐‐ ‐‐ ‐‐ ‐‐ ‐‐ ‐‐ ‐‐ ‐‐ ‐‐ ‐‐ ‐‐ ‐‐
6.07 ‐‐ ‐‐ ‐‐ ‐‐ ‐‐ ‐‐ ‐‐ ‐‐ ‐‐ ‐‐ ‐‐ ‐‐ ‐‐ ‐‐ ‐‐ ‐‐ ‐‐
0.478 ‐‐ ‐‐ ‐‐ ‐‐ ‐‐ ‐‐ ‐‐ ‐‐ ‐‐ ‐‐ ‐‐ ‐‐ ‐‐ ‐‐ ‐‐ ‐‐ ‐‐
1.92 ‐‐ ‐‐ ‐‐ ‐‐ ‐‐ ‐‐ ‐‐ ‐‐ ‐‐ ‐‐ ‐‐ ‐‐ ‐‐ ‐‐ ‐‐ ‐‐ ‐‐
4.37 ‐‐ ‐‐ ‐‐ ‐‐ ‐‐ ‐‐ ‐‐ ‐‐ ‐‐ ‐‐ ‐‐ ‐‐ ‐‐ ‐‐ ‐‐ ‐‐ ‐‐
0.93 ‐‐ ‐‐ ‐‐ ‐‐ ‐‐ ‐‐ ‐‐ ‐‐ ‐‐ ‐‐ ‐‐ ‐‐ ‐‐ ‐‐ ‐‐ ‐‐ ‐‐
Volume Reduction
(%)
TN Effluent Concen.
(mg/L)
1.58
5.58
0.53
1.86
TP Effluent Concen.
(mg/L)
BMP VOLUME REDUCTIONS/EFFLUENT CONCENTRATIONS
Inflow Nitrogen EMC
(mg/L)
CATCHMENT 5
Percent Impervious
(%)
Annual Runoff Volume
(c.f.)118,627
Post‐Development Conditions
34.8%
134,514
1.51
6.04
0.57
91,476
Pre‐Development Conditions
30.0%
‐23%
‐‐
‐‐
Total Inflow Phosphorus
(lb/ac/yr)
BMP Outflow
Nitrogen (lbs/ac/yr)
Total Area Treated
(ac)
Percent Reduction in Phosphorus Load (%)
‐‐
CATCHMENT 2 CATCHMENT 3
1.21 ‐‐
Catchment Outflow
Total Nitrogen (lb/ac/yr)4.37
Percent Volume Reduced
(%)
BMP Outflow
Phosphorus (lbs/ac/yr)
Total Inflow Volume
(c.f.)
Total Inflow Nitrogen
(lb/ac/yr)
Inflow Phosphorus EMC
(mg/L)
Catchment Outflow Nitrogen EMC (mg/L)
CATCHMENT 4
‐‐ ‐‐
‐‐
Catchment Outflow
Total Phosphorus (lb/ac/yr)
28%
Catchment Outflow Phosphorus EMC
(mg/L)
Percent Reduction in Nitrogen Load (%)
CATCHMENT 1
Total Nitrogen EMC
(mg/L)
Total Nitrogen Loading
(lb/ac/yr)
Total Phosphorus EMC
(mg/L)
Total Phosphorus Loading
(lb/ac/yr)
Total Nitrogen Loading (lb/ac/yr)
Total Phosphorus EMC (mg/L)
Total Phosphorus Loading (lb/ac/yr)
Percent Impervious (%)
Annual Runoff Volume (c.f.)
Total Nitrogen EMC (mg/L)
‐‐0.933
52% ‐‐‐‐
‐‐
0.258
1.92
PinecrestSMB
February 29, 2016
Development:Prepared By:
Date:
Post‐Development w/ BMPs
34.8%
121,857
1.21
4.37
0.26
0.93
REGION:
TOTAL DEVELOPMENT AREA (ft2):
Coastal
‐‐
‐‐
‐‐
‐‐
‐‐
CATCHMENT 6
‐‐ ‐‐‐‐
‐‐
‐‐
‐‐ ‐‐
‐‐ ‐‐
‐‐ ‐‐
‐‐ ‐‐‐‐
‐22%
‐51%
‐50%
Pre‐Dev. &
Post‐Dev. without BMPs
Post‐Dev without BMPs &
Post‐Dev with BMPs
‐9%
‐20%
‐28%
‐55%
‐51%
0%5%
13%
‐5%
8%
8%
3%
Pre‐Development &
Post‐Development with BMPs
5%
3%
0.39
0.15
0.11
0.12
Permeable
Pavement*
Water Harvesting
Wet Detention Pond
Wetland
60%
user defined
15%
25%
1.44
1.08
1.01
1.08
Return to Watershed Characteristics
Return to BMP Characteristics
Print Summary
Return to Instructions
3. Development Summary
WATERSHED SUMMARY Ver2.0
Bioretention with
IWS80% 0.95 0.12
Bioretention
without IWS50% 1.00 0.12
Dry Detention Pond 10% 1.20 0.20
Grassed Swale 10% 1.21 0.26
Green Roof 50% 1.08 0.15
Level Spdr, Filter
Strip50% 1.20 0.15
Percent Difference Between:
Sand Filter 5% 0.92 0.14
*Negative percent difference values indicate a decrease in runoff volume, pollutant concentration or pollutant loading. Positive values indicate an increase. *if treating commercial parking lot, TP effluent concentration = 0.16 mg/L
BMP SUMMARY Ver2.0
BMP 1 BMP 2 BMP 3 BMP 1 BMP 2 BMP 3 BMP 1 BMP 2 BMP 3 BMP 1 BMP 2 BMP 3 BMP 1 BMP 2 BMP 3 BMP 1 BMP 2 BMP 3
Bioretention with
IWS‐‐ ‐‐ ‐‐ ‐‐ ‐‐ ‐‐ ‐‐ ‐‐ ‐‐ ‐‐ ‐‐ ‐‐ ‐‐ ‐‐ ‐‐ ‐‐ ‐‐
4.38 ‐‐ ‐‐ ‐‐ ‐‐ ‐‐ ‐‐ ‐‐ ‐‐ ‐‐ ‐‐ ‐‐ ‐‐ ‐‐ ‐‐ ‐‐ ‐‐ ‐‐
194,643 ‐‐ ‐‐ ‐‐ ‐‐ ‐‐ ‐‐ ‐‐ ‐‐ ‐‐ ‐‐ ‐‐ ‐‐ ‐‐ ‐‐ ‐‐ ‐‐ ‐‐
80% ‐‐ ‐‐ ‐‐ ‐‐ ‐‐ ‐‐ ‐‐ ‐‐ ‐‐ ‐‐ ‐‐ ‐‐ ‐‐ ‐‐ ‐‐ ‐‐ ‐‐
1.63 ‐‐ ‐‐ ‐‐ ‐‐ ‐‐ ‐‐ ‐‐ ‐‐ ‐‐ ‐‐ ‐‐ ‐‐ ‐‐ ‐‐ ‐‐ ‐‐ ‐‐
4.51 ‐‐ ‐‐ ‐‐ ‐‐ ‐‐ ‐‐ ‐‐ ‐‐ ‐‐ ‐‐ ‐‐ ‐‐ ‐‐ ‐‐ ‐‐ ‐‐ ‐‐
0.497 ‐‐ ‐‐ ‐‐ ‐‐ ‐‐ ‐‐ ‐‐ ‐‐ ‐‐ ‐‐ ‐‐ ‐‐ ‐‐ ‐‐ ‐‐ ‐‐ ‐‐
1.38 ‐‐ ‐‐ ‐‐ ‐‐ ‐‐ ‐‐ ‐‐ ‐‐ ‐‐ ‐‐ ‐‐ ‐‐ ‐‐ ‐‐ ‐‐ ‐‐ ‐‐
0.71 ‐‐ ‐‐ ‐‐ ‐‐ ‐‐ ‐‐ ‐‐ ‐‐ ‐‐ ‐‐ ‐‐ ‐‐ ‐‐ ‐‐ ‐‐ ‐‐ ‐‐
0.17 ‐‐ ‐‐ ‐‐ ‐‐ ‐‐ ‐‐ ‐‐ ‐‐ ‐‐ ‐‐ ‐‐ ‐‐ ‐‐ ‐‐ ‐‐ ‐‐ ‐‐
Volume Reduction
(%)
TN Effluent Concen.
(mg/L)
1.69
4.28
0.53
1.35
TP Effluent Concen.
(mg/L)
BMP VOLUME REDUCTIONS/EFFLUENT CONCENTRATIONS
Inflow Nitrogen EMC
(mg/L)
CATCHMENT 5
Percent Impervious
(%)
Annual Runoff Volume
(c.f.)177,873
Post‐Development Conditions
22.3%
193,760
1.63
4.50
0.65
190,836
Pre‐Development Conditions
20.0%
‐24%
‐‐
‐‐
Total Inflow Phosphorus
(lb/ac/yr)
BMP Outflow
Nitrogen (lbs/ac/yr)
Total Area Treated
(ac)
Percent Reduction in Phosphorus Load (%)
‐‐
CATCHMENT 2 CATCHMENT 3
1.29 ‐‐
Catchment Outflow
Total Nitrogen (lb/ac/yr)0.71
Percent Volume Reduced
(%)
BMP Outflow
Phosphorus (lbs/ac/yr)
Total Inflow Volume
(c.f.)
Total Inflow Nitrogen
(lb/ac/yr)
Inflow Phosphorus EMC
(mg/L)
Catchment Outflow Nitrogen EMC (mg/L)
CATCHMENT 4
‐‐ ‐‐
‐‐
Catchment Outflow
Total Phosphorus (lb/ac/yr)
84%
Catchment Outflow Phosphorus EMC
(mg/L)
Percent Reduction in Nitrogen Load (%)
CATCHMENT 1
Total Nitrogen EMC
(mg/L)
Total Nitrogen Loading
(lb/ac/yr)
Total Phosphorus EMC
(mg/L)
Total Phosphorus Loading
(lb/ac/yr)
Total Nitrogen Loading (lb/ac/yr)
Total Phosphorus EMC (mg/L)
Total Phosphorus Loading (lb/ac/yr)
Percent Impervious (%)
Annual Runoff Volume (c.f.)
Total Nitrogen EMC (mg/L)
‐‐0.171
88% ‐‐‐‐
‐‐
0.309
1.38
Emerald ParkSMB
February 29, 2016
Development:Prepared By:
Date:
Post‐Development w/ BMPs
22.3%
38,929
1.29
0.71
0.31
0.17
REGION:
TOTAL DEVELOPMENT AREA (ft2):
Coastal
‐‐
‐‐
‐‐
‐‐
‐‐
CATCHMENT 6
‐‐ ‐‐‐‐
‐‐
‐‐
‐‐ ‐‐
‐‐ ‐‐
‐‐ ‐‐
‐‐ ‐‐‐‐
‐83%
‐42%
‐87%
Pre‐Dev. &
Post‐Dev. without BMPs
Post‐Dev without BMPs &
Post‐Dev with BMPs
‐80%
‐21%
‐84%
‐52%
‐88%
0%2%
9%
‐3%
5%
22%
2%
Pre‐Development &
Post‐Development with BMPs
2%
‐78%
0.39
0.15
0.11
0.12
Permeable
Pavement*
Water Harvesting
Wet Detention Pond
Wetland
60%
user defined
15%
25%
1.44
1.08
1.01
1.08
Return to Watershed Characteristics
Return to BMP Characteristics
Print Summary
Return to Instructions

3. Development Summary
WATERSHED SUMMARY Ver2.0
Bioretention with
IWS80% 0.95 0.12
Bioretention
without IWS50% 1.00 0.12
Dry Detention Pond 10% 1.20 0.20
Grassed Swale 10% 1.21 0.26
Green Roof 50% 1.08 0.15
Level Spdr, Filter
Strip50% 1.20 0.15
Percent Difference Between:
Sand Filter 5% 0.92 0.14
*Negative percent difference values indicate a decrease in runoff volume, pollutant concentration or pollutant loading. Positive values indicate an increase. *if treating commercial parking lot, TP effluent concentration = 0.16 mg/L
BMP SUMMARY Ver2.0
BMP 1 BMP 2 BMP 3 BMP 1 BMP 2 BMP 3 BMP 1 BMP 2 BMP 3 BMP 1 BMP 2 BMP 3 BMP 1 BMP 2 BMP 3 BMP 1 BMP 2 BMP 3
Grassed Swale ‐‐ ‐‐ ‐‐ ‐‐ ‐‐ ‐‐ ‐‐ ‐‐ ‐‐ ‐‐ ‐‐ ‐‐ ‐‐ ‐‐ ‐‐ ‐‐ ‐‐
4.75 ‐‐ ‐‐ ‐‐ ‐‐ ‐‐ ‐‐ ‐‐ ‐‐ ‐‐ ‐‐ ‐‐ ‐‐ ‐‐ ‐‐ ‐‐ ‐‐ ‐‐
216,332 ‐‐ ‐‐ ‐‐ ‐‐ ‐‐ ‐‐ ‐‐ ‐‐ ‐‐ ‐‐ ‐‐ ‐‐ ‐‐ ‐‐ ‐‐ ‐‐ ‐‐
10% ‐‐ ‐‐ ‐‐ ‐‐ ‐‐ ‐‐ ‐‐ ‐‐ ‐‐ ‐‐ ‐‐ ‐‐ ‐‐ ‐‐ ‐‐ ‐‐ ‐‐
1.61 ‐‐ ‐‐ ‐‐ ‐‐ ‐‐ ‐‐ ‐‐ ‐‐ ‐‐ ‐‐ ‐‐ ‐‐ ‐‐ ‐‐ ‐‐ ‐‐ ‐‐
4.58 ‐‐ ‐‐ ‐‐ ‐‐ ‐‐ ‐‐ ‐‐ ‐‐ ‐‐ ‐‐ ‐‐ ‐‐ ‐‐ ‐‐ ‐‐ ‐‐ ‐‐
0.488 ‐‐ ‐‐ ‐‐ ‐‐ ‐‐ ‐‐ ‐‐ ‐‐ ‐‐ ‐‐ ‐‐ ‐‐ ‐‐ ‐‐ ‐‐ ‐‐ ‐‐
1.39 ‐‐ ‐‐ ‐‐ ‐‐ ‐‐ ‐‐ ‐‐ ‐‐ ‐‐ ‐‐ ‐‐ ‐‐ ‐‐ ‐‐ ‐‐ ‐‐ ‐‐
3.09 ‐‐ ‐‐ ‐‐ ‐‐ ‐‐ ‐‐ ‐‐ ‐‐ ‐‐ ‐‐ ‐‐ ‐‐ ‐‐ ‐‐ ‐‐ ‐‐ ‐‐
0.66 ‐‐ ‐‐ ‐‐ ‐‐ ‐‐ ‐‐ ‐‐ ‐‐ ‐‐ ‐‐ ‐‐ ‐‐ ‐‐ ‐‐ ‐‐ ‐‐ ‐‐
0.39
0.15
0.11
0.12
Permeable
Pavement*
Water Harvesting
Wet Detention Pond
Wetland
60%
user defined
15%
25%
1.44
1.08
1.01
1.08
‐28%
‐52%
‐51%
Pre‐Dev. &
Post‐Dev. without BMPs
Post‐Dev without BMPs &
Post‐Dev with BMPs
‐9%
‐25%
‐32%
‐59%
‐52%
0%3%
12%
‐4%
7%
19%
3%
Pre‐Development &
Post‐Development with BMPs
3%
1%
‐‐
‐‐
‐‐
‐‐
‐‐
CATCHMENT 6
‐‐ ‐‐‐‐
‐‐
‐‐
‐‐ ‐‐
‐‐ ‐‐
‐‐ ‐‐
‐‐ ‐‐‐‐
‐‐0.659
53% ‐‐‐‐
‐‐
0.258
1.39
Davenport Farm RoadSMB
February 29, 2016
Development:Prepared By:
Date:
Post‐Development w/ BMPs
22.9%
194,699
1.21
3.09
0.26
0.66
REGION:
TOTAL DEVELOPMENT AREA (ft2):
Coastal
33%
Catchment Outflow Phosphorus EMC
(mg/L)
Percent Reduction in Nitrogen Load (%)
CATCHMENT 1
Total Nitrogen EMC
(mg/L)
Total Nitrogen Loading
(lb/ac/yr)
Total Phosphorus EMC
(mg/L)
Total Phosphorus Loading
(lb/ac/yr)
Total Nitrogen Loading (lb/ac/yr)
Total Phosphorus EMC (mg/L)
Total Phosphorus Loading (lb/ac/yr)
Percent Impervious (%)
Annual Runoff Volume (c.f.)
Total Nitrogen EMC (mg/L)
‐‐
‐‐
Total Inflow Phosphorus
(lb/ac/yr)
BMP Outflow
Nitrogen (lbs/ac/yr)
Total Area Treated
(ac)
Percent Reduction in Phosphorus Load (%)
‐‐
CATCHMENT 2 CATCHMENT 3
1.21 ‐‐
Catchment Outflow
Total Nitrogen (lb/ac/yr)3.09
Percent Volume Reduced
(%)
BMP Outflow
Phosphorus (lbs/ac/yr)
Total Inflow Volume
(c.f.)
Total Inflow Nitrogen
(lb/ac/yr)
Inflow Phosphorus EMC
(mg/L)
Catchment Outflow Nitrogen EMC (mg/L)
CATCHMENT 4
‐‐ ‐‐
‐‐
Catchment Outflow
Total Phosphorus (lb/ac/yr)
Volume Reduction
(%)
TN Effluent Concen.
(mg/L)
1.69
4.28
0.53
1.35
TP Effluent Concen.
(mg/L)
BMP VOLUME REDUCTIONS/EFFLUENT CONCENTRATIONS
Inflow Nitrogen EMC
(mg/L)
CATCHMENT 5
Percent Impervious
(%)
Annual Runoff Volume
(c.f.)192,856
Post‐Development Conditions
22.9%
215,097
1.61
4.56
0.64
206,910
Pre‐Development Conditions
20.0%
‐28%
Return to Watershed Characteristics
Return to BMP Characteristics
Print Summary
Return to Instructions

3. Development Summary
WATERSHED SUMMARY Ver2.0
Bioretention with
IWS80% 0.95 0.12
Bioretention
without IWS50% 1.00 0.12
Dry Detention Pond 10% 1.20 0.20
Grassed Swale 10% 1.21 0.26
Green Roof 50% 1.08 0.15
Level Spdr, Filter
Strip50% 1.20 0.15
Percent Difference Between:
Sand Filter 5% 0.92 0.14
*Negative percent difference values indicate a decrease in runoff volume, pollutant concentration or pollutant loading. Positive values indicate an increase. *if treating commercial parking lot, TP effluent concentration = 0.16 mg/L
BMP SUMMARY Ver2.0
BMP 1 BMP 2 BMP 3 BMP 1 BMP 2 BMP 3 BMP 1 BMP 2 BMP 3 BMP 1 BMP 2 BMP 3 BMP 1 BMP 2 BMP 3 BMP 1 BMP 2 BMP 3
Sand Filter ‐‐ ‐‐ ‐‐ ‐‐ ‐‐ ‐‐ ‐‐ ‐‐ ‐‐ ‐‐ ‐‐ ‐‐ ‐‐ ‐‐ ‐‐ ‐‐ ‐‐
46.81 ‐‐ ‐‐ ‐‐ ‐‐ ‐‐ ‐‐ ‐‐ ‐‐ ‐‐ ‐‐ ‐‐ ‐‐ ‐‐ ‐‐ ‐‐ ‐‐ ‐‐
1,940,822 ‐‐ ‐‐ ‐‐ ‐‐ ‐‐ ‐‐ ‐‐ ‐‐ ‐‐ ‐‐ ‐‐ ‐‐ ‐‐ ‐‐ ‐‐ ‐‐ ‐‐
5% ‐‐ ‐‐ ‐‐ ‐‐ ‐‐ ‐‐ ‐‐ ‐‐ ‐‐ ‐‐ ‐‐ ‐‐ ‐‐ ‐‐ ‐‐ ‐‐ ‐‐
1.67 ‐‐ ‐‐ ‐‐ ‐‐ ‐‐ ‐‐ ‐‐ ‐‐ ‐‐ ‐‐ ‐‐ ‐‐ ‐‐ ‐‐ ‐‐ ‐‐ ‐‐
4.33 ‐‐ ‐‐ ‐‐ ‐‐ ‐‐ ‐‐ ‐‐ ‐‐ ‐‐ ‐‐ ‐‐ ‐‐ ‐‐ ‐‐ ‐‐ ‐‐ ‐‐
0.524 ‐‐ ‐‐ ‐‐ ‐‐ ‐‐ ‐‐ ‐‐ ‐‐ ‐‐ ‐‐ ‐‐ ‐‐ ‐‐ ‐‐ ‐‐ ‐‐ ‐‐
1.36 ‐‐ ‐‐ ‐‐ ‐‐ ‐‐ ‐‐ ‐‐ ‐‐ ‐‐ ‐‐ ‐‐ ‐‐ ‐‐ ‐‐ ‐‐ ‐‐ ‐‐
2.45 ‐‐ ‐‐ ‐‐ ‐‐ ‐‐ ‐‐ ‐‐ ‐‐ ‐‐ ‐‐ ‐‐ ‐‐ ‐‐ ‐‐ ‐‐ ‐‐ ‐‐
0.44 ‐‐ ‐‐ ‐‐ ‐‐ ‐‐ ‐‐ ‐‐ ‐‐ ‐‐ ‐‐ ‐‐ ‐‐ ‐‐ ‐‐ ‐‐ ‐‐ ‐‐
0.39
0.15
0.11
0.12
Permeable
Pavement*
Water Harvesting
Wet Detention Pond
Wetland
60%
user defined
15%
25%
1.44
1.08
1.01
1.08
‐43%
‐66%
‐67%
Pre‐Dev. &
Post‐Dev. without BMPs
Post‐Dev without BMPs &
Post‐Dev with BMPs
‐5%
‐40%
‐43%
‐74%
‐67%
0%1%
2%
‐1%
1%
29%
0%
Pre‐Development &
Post‐Development with BMPs
1%
‐3%
‐‐
‐‐
‐‐
‐‐
‐‐
CATCHMENT 6
‐‐ ‐‐‐‐
‐‐
‐‐
‐‐ ‐‐
‐‐ ‐‐
‐‐ ‐‐
‐‐ ‐‐‐‐
‐‐0.443
67% ‐‐‐‐
‐‐
0.180
1.36
South BendSMB
February 29, 2016
Development:Prepared By:
Date:
Post‐Development w/ BMPs
20.5%
1,843,781
1.00
2.45
0.18
0.44
REGION:
TOTAL DEVELOPMENT AREA (ft2):
Coastal
43%
Catchment Outflow Phosphorus EMC
(mg/L)
Percent Reduction in Nitrogen Load (%)
CATCHMENT 1
Total Nitrogen EMC
(mg/L)
Total Nitrogen Loading
(lb/ac/yr)
Total Phosphorus EMC
(mg/L)
Total Phosphorus Loading
(lb/ac/yr)
Total Nitrogen Loading (lb/ac/yr)
Total Phosphorus EMC (mg/L)
Total Phosphorus Loading (lb/ac/yr)
Percent Impervious (%)
Annual Runoff Volume (c.f.)
Total Nitrogen EMC (mg/L)
‐‐
‐‐
Total Inflow Phosphorus
(lb/ac/yr)
BMP Outflow
Nitrogen (lbs/ac/yr)
Total Area Treated
(ac)
Percent Reduction in Phosphorus Load (%)
‐‐
CATCHMENT 2 CATCHMENT 3
1.00 ‐‐
Catchment Outflow
Total Nitrogen (lb/ac/yr)2.45
Percent Volume Reduced
(%)
BMP Outflow
Phosphorus (lbs/ac/yr)
Total Inflow Volume
(c.f.)
Total Inflow Nitrogen
(lb/ac/yr)
Inflow Phosphorus EMC
(mg/L)
Catchment Outflow Nitrogen EMC (mg/L)
CATCHMENT 4
‐‐ ‐‐
‐‐
Catchment Outflow
Total Phosphorus (lb/ac/yr)
Volume Reduction
(%)
TN Effluent Concen.
(mg/L)
1.69
4.28
0.53
1.35
TP Effluent Concen.
(mg/L)
BMP VOLUME REDUCTIONS/EFFLUENT CONCENTRATIONS
Inflow Nitrogen EMC
(mg/L)
CATCHMENT 5
Percent Impervious
(%)
Annual Runoff Volume
(c.f.)1,900,399
Post‐Development Conditions
20.5%
1,938,695
1.67
4.33
0.69
2,038,891
Pre‐Development Conditions
20.0%
‐41%
Return to Watershed Characteristics
Return to BMP Characteristics
Print Summary
Return to Instructions

3. Development Summary
WATERSHED SUMMARY Ver2.0
Bioretention with
IWS80% 0.95 0.12
Bioretention
without IWS50% 1.00 0.12
Dry Detention Pond 10% 1.20 0.20
Grassed Swale 10% 1.21 0.26
Green Roof 50% 1.08 0.15
Level Spdr, Filter
Strip50% 1.20 0.15
Percent Difference Between:
Sand Filter 5% 0.92 0.14
*Negative percent difference values indicate a decrease in runoff volume, pollutant concentration or pollutant loading. Positive values indicate an increase. *if treating commercial parking lot, TP effluent concentration = 0.16 mg/L
BMP SUMMARY Ver2.0
BMP 1 BMP 2 BMP 3 BMP 1 BMP 2 BMP 3 BMP 1 BMP 2 BMP 3 BMP 1 BMP 2 BMP 3 BMP 1 BMP 2 BMP 3 BMP 1 BMP 2 BMP 3
Wet Detention
Pond‐‐ ‐‐ ‐‐ ‐‐ ‐‐ ‐‐ ‐‐ ‐‐ ‐‐ ‐‐ ‐‐ ‐‐ ‐‐ ‐‐ ‐‐ ‐‐ ‐‐
16.65 ‐‐ ‐‐ ‐‐ ‐‐ ‐‐ ‐‐ ‐‐ ‐‐ ‐‐ ‐‐ ‐‐ ‐‐ ‐‐ ‐‐ ‐‐ ‐‐ ‐‐
2,102,124 ‐‐ ‐‐ ‐‐ ‐‐ ‐‐ ‐‐ ‐‐ ‐‐ ‐‐ ‐‐ ‐‐ ‐‐ ‐‐ ‐‐ ‐‐ ‐‐ ‐‐
15% ‐‐ ‐‐ ‐‐ ‐‐ ‐‐ ‐‐ ‐‐ ‐‐ ‐‐ ‐‐ ‐‐ ‐‐ ‐‐ ‐‐ ‐‐ ‐‐ ‐‐
1.41 ‐‐ ‐‐ ‐‐ ‐‐ ‐‐ ‐‐ ‐‐ ‐‐ ‐‐ ‐‐ ‐‐ ‐‐ ‐‐ ‐‐ ‐‐ ‐‐ ‐‐
11.15 ‐‐ ‐‐ ‐‐ ‐‐ ‐‐ ‐‐ ‐‐ ‐‐ ‐‐ ‐‐ ‐‐ ‐‐ ‐‐ ‐‐ ‐‐ ‐‐ ‐‐
0.502 ‐‐ ‐‐ ‐‐ ‐‐ ‐‐ ‐‐ ‐‐ ‐‐ ‐‐ ‐‐ ‐‐ ‐‐ ‐‐ ‐‐ ‐‐ ‐‐ ‐‐
3.96 ‐‐ ‐‐ ‐‐ ‐‐ ‐‐ ‐‐ ‐‐ ‐‐ ‐‐ ‐‐ ‐‐ ‐‐ ‐‐ ‐‐ ‐‐ ‐‐ ‐‐
7.07 ‐‐ ‐‐ ‐‐ ‐‐ ‐‐ ‐‐ ‐‐ ‐‐ ‐‐ ‐‐ ‐‐ ‐‐ ‐‐ ‐‐ ‐‐ ‐‐ ‐‐
1.06 ‐‐ ‐‐ ‐‐ ‐‐ ‐‐ ‐‐ ‐‐ ‐‐ ‐‐ ‐‐ ‐‐ ‐‐ ‐‐ ‐‐ ‐‐ ‐‐ ‐‐
Volume Reduction
(%)
TN Effluent Concen.
(mg/L)
1.43
10.94
0.51
3.93
TP Effluent Concen.
(mg/L)
BMP VOLUME REDUCTIONS/EFFLUENT CONCENTRATIONS
Inflow Nitrogen EMC
(mg/L)
CATCHMENT 5
Percent Impervious
(%)
Annual Runoff Volume
(c.f.)2,045,592
Post‐Development Conditions
73.7%
2,096,653
1.41
11.13
0.52
725,107
Pre‐Development Conditions
71.8%
‐26%
‐‐
‐‐
Total Inflow Phosphorus
(lb/ac/yr)
BMP Outflow
Nitrogen (lbs/ac/yr)
Total Area Treated
(ac)
Percent Reduction in Phosphorus Load (%)
‐‐
CATCHMENT 2 CATCHMENT 3
1.06 ‐‐
Catchment Outflow
Total Nitrogen (lb/ac/yr)7.07
Percent Volume Reduced
(%)
BMP Outflow
Phosphorus (lbs/ac/yr)
Total Inflow Volume
(c.f.)
Total Inflow Nitrogen
(lb/ac/yr)
Inflow Phosphorus EMC
(mg/L)
Catchment Outflow Nitrogen EMC (mg/L)
CATCHMENT 4
‐‐ ‐‐
‐‐
Catchment Outflow
Total Phosphorus (lb/ac/yr)
37%
Catchment Outflow Phosphorus EMC
(mg/L)
Percent Reduction in Nitrogen Load (%)
CATCHMENT 1
Total Nitrogen EMC
(mg/L)
Total Nitrogen Loading
(lb/ac/yr)
Total Phosphorus EMC
(mg/L)
Total Phosphorus Loading
(lb/ac/yr)
Total Nitrogen Loading (lb/ac/yr)
Total Phosphorus EMC (mg/L)
Total Phosphorus Loading (lb/ac/yr)
Percent Impervious (%)
Annual Runoff Volume (c.f.)
Total Nitrogen EMC (mg/L)
‐‐1.062
73% ‐‐‐‐
‐‐
0.159
3.96
Wells FargoSMB
February 29, 2016
Development:Prepared By:
Date:
Post‐Development w/ BMPs
73.7%
1,786,806
1.06
7.07
0.16
1.06
REGION:
TOTAL DEVELOPMENT AREA (ft2):
Coastal
‐‐
‐‐
‐‐
‐‐
‐‐
CATCHMENT 6
‐‐ ‐‐‐‐
‐‐
‐‐
‐‐ ‐‐
‐‐ ‐‐
‐‐ ‐‐
‐‐ ‐‐‐‐
‐35%
‐69%
‐73%
Pre‐Dev. &
Post‐Dev. without BMPs
Post‐Dev without BMPs &
Post‐Dev with BMPs
‐15%
‐25%
‐36%
‐70%
‐73%
0%2%
2%
‐1%
2%
2%
1%
Pre‐Development &
Post‐Development with BMPs
2%
‐13%
0.39
0.15
0.11
0.12
Permeable
Pavement*
Water Harvesting
Wet Detention Pond
Wetland
60%
user defined
15%
25%
1.44
1.08
1.01
1.08
Return to Watershed Characteristics
Return to BMP Characteristics
Print Summary
Return to Instructions

3. Development Summary
WATERSHED SUMMARY Ver2.0
Bioretention with
IWS80% 0.95 0.12
Bioretention
without IWS50% 1.00 0.12
Dry Detention Pond 10% 1.20 0.20
Grassed Swale 10% 1.21 0.26
Green Roof 50% 1.08 0.15
Level Spdr, Filter
Strip50% 1.20 0.15
Percent Difference Between:
Sand Filter 5% 0.92 0.14
*Negative percent difference values indicate a decrease in runoff volume, pollutant concentration or pollutant loading. Positive values indicate an increase. *if treating commercial parking lot, TP effluent concentration = 0.16 mg/L
BMP SUMMARY Ver2.0
BMP 1 BMP 2 BMP 3 BMP 1 BMP 2 BMP 3 BMP 1 BMP 2 BMP 3 BMP 1 BMP 2 BMP 3 BMP 1 BMP 2 BMP 3 BMP 1 BMP 2 BMP 3
Wet Detention
Pond‐‐ ‐‐ ‐‐ ‐‐ ‐‐ ‐‐ ‐‐ ‐‐ ‐‐ ‐‐ ‐‐ ‐‐ ‐‐ ‐‐ ‐‐ ‐‐ ‐‐
13.77 ‐‐ ‐‐ ‐‐ ‐‐ ‐‐ ‐‐ ‐‐ ‐‐ ‐‐ ‐‐ ‐‐ ‐‐ ‐‐ ‐‐ ‐‐ ‐‐ ‐‐
1,275,511 ‐‐ ‐‐ ‐‐ ‐‐ ‐‐ ‐‐ ‐‐ ‐‐ ‐‐ ‐‐ ‐‐ ‐‐ ‐‐ ‐‐ ‐‐ ‐‐ ‐‐
15% ‐‐ ‐‐ ‐‐ ‐‐ ‐‐ ‐‐ ‐‐ ‐‐ ‐‐ ‐‐ ‐‐ ‐‐ ‐‐ ‐‐ ‐‐ ‐‐ ‐‐
1.46 ‐‐ ‐‐ ‐‐ ‐‐ ‐‐ ‐‐ ‐‐ ‐‐ ‐‐ ‐‐ ‐‐ ‐‐ ‐‐ ‐‐ ‐‐ ‐‐ ‐‐
8.45 ‐‐ ‐‐ ‐‐ ‐‐ ‐‐ ‐‐ ‐‐ ‐‐ ‐‐ ‐‐ ‐‐ ‐‐ ‐‐ ‐‐ ‐‐ ‐‐ ‐‐
0.508 ‐‐ ‐‐ ‐‐ ‐‐ ‐‐ ‐‐ ‐‐ ‐‐ ‐‐ ‐‐ ‐‐ ‐‐ ‐‐ ‐‐ ‐‐ ‐‐ ‐‐
2.94 ‐‐ ‐‐ ‐‐ ‐‐ ‐‐ ‐‐ ‐‐ ‐‐ ‐‐ ‐‐ ‐‐ ‐‐ ‐‐ ‐‐ ‐‐ ‐‐ ‐‐
5.21 ‐‐ ‐‐ ‐‐ ‐‐ ‐‐ ‐‐ ‐‐ ‐‐ ‐‐ ‐‐ ‐‐ ‐‐ ‐‐ ‐‐ ‐‐ ‐‐ ‐‐
0.78 ‐‐ ‐‐ ‐‐ ‐‐ ‐‐ ‐‐ ‐‐ ‐‐ ‐‐ ‐‐ ‐‐ ‐‐ ‐‐ ‐‐ ‐‐ ‐‐ ‐‐
0.39
0.15
0.11
0.12
Permeable
Pavement*
Water Harvesting
Wet Detention Pond
Wetland
60%
user defined
15%
25%
1.44
1.08
1.01
1.08
‐38%
‐69%
‐73%
Pre‐Dev. &
Post‐Dev. without BMPs
Post‐Dev without BMPs &
Post‐Dev with BMPs
‐15%
‐27%
‐38%
‐71%
‐73%
0%1%
2%
‐1%
1%
7%
0%
Pre‐Development &
Post‐Development with BMPs
1%
‐13%
‐‐
‐‐
‐‐
‐‐
‐‐
CATCHMENT 6
‐‐ ‐‐‐‐
‐‐
‐‐
‐‐ ‐‐
‐‐ ‐‐
‐‐ ‐‐
‐‐ ‐‐‐‐
‐‐0.782
73% ‐‐‐‐
‐‐
0.159
2.93
Sterling Pointe ApartmentsSMB
February 29, 2016
Development:Prepared By:
Date:
Post‐Development w/ BMPs
52.6%
1,084,184
1.06
5.21
0.16
0.78
REGION:
TOTAL DEVELOPMENT AREA (ft2):
Coastal
38%
Catchment Outflow Phosphorus EMC
(mg/L)
Percent Reduction in Nitrogen Load (%)
CATCHMENT 1
Total Nitrogen EMC
(mg/L)
Total Nitrogen Loading
(lb/ac/yr)
Total Phosphorus EMC
(mg/L)
Total Phosphorus Loading
(lb/ac/yr)
Total Nitrogen Loading (lb/ac/yr)
Total Phosphorus EMC (mg/L)
Total Phosphorus Loading (lb/ac/yr)
Percent Impervious (%)
Annual Runoff Volume (c.f.)
Total Nitrogen EMC (mg/L)
‐‐
‐‐
Total Inflow Phosphorus
(lb/ac/yr)
BMP Outflow
Nitrogen (lbs/ac/yr)
Total Area Treated
(ac)
Percent Reduction in Phosphorus Load (%)
‐‐
CATCHMENT 2 CATCHMENT 3
1.06 ‐‐
Catchment Outflow
Total Nitrogen (lb/ac/yr)5.21
Percent Volume Reduced
(%)
BMP Outflow
Phosphorus (lbs/ac/yr)
Total Inflow Volume
(c.f.)
Total Inflow Nitrogen
(lb/ac/yr)
Inflow Phosphorus EMC
(mg/L)
Catchment Outflow Nitrogen EMC (mg/L)
CATCHMENT 4
‐‐ ‐‐
‐‐
Catchment Outflow
Total Phosphorus (lb/ac/yr)
Volume Reduction
(%)
TN Effluent Concen.
(mg/L)
1.47
8.34
0.52
2.92
TP Effluent Concen.
(mg/L)
BMP VOLUME REDUCTIONS/EFFLUENT CONCENTRATIONS
Inflow Nitrogen EMC
(mg/L)
CATCHMENT 5
Percent Impervious
(%)
Annual Runoff Volume
(c.f.)1,250,993
Post‐Development Conditions
52.6%
1,272,877
1.46
8.44
0.55
600,000
Pre‐Development Conditions
51.6%
‐28%
Return to Watershed Characteristics
Return to BMP Characteristics
Print Summary
Return to Instructions

3. Development Summary
WATERSHED SUMMARY Ver2.0
Bioretention with
IWS80% 0.95 0.12
Bioretention
without IWS50% 1.00 0.12
Dry Detention Pond 10% 1.20 0.20
Grassed Swale 10% 1.21 0.26
Green Roof 50% 1.08 0.15
Level Spdr, Filter
Strip50% 1.20 0.15
Percent Difference Between:
Sand Filter 5% 0.92 0.14
*Negative percent difference values indicate a decrease in runoff volume, pollutant concentration or pollutant loading. Positive values indicate an increase. *if treating commercial parking lot, TP effluent concentration = 0.16 mg/L
BMP SUMMARY Ver2.0
BMP 1 BMP 2 BMP 3 BMP 1 BMP 2 BMP 3 BMP 1 BMP 2 BMP 3 BMP 1 BMP 2 BMP 3 BMP 1 BMP 2 BMP 3 BMP 1 BMP 2 BMP 3
Sand Filter ‐‐ ‐‐ ‐‐ ‐‐ ‐‐ ‐‐ ‐‐ ‐‐ ‐‐ ‐‐ ‐‐ ‐‐ ‐‐ ‐‐ ‐‐ ‐‐ ‐‐
23.51 ‐‐ ‐‐ ‐‐ ‐‐ ‐‐ ‐‐ ‐‐ ‐‐ ‐‐ ‐‐ ‐‐ ‐‐ ‐‐ ‐‐ ‐‐ ‐‐ ‐‐
600,935 ‐‐ ‐‐ ‐‐ ‐‐ ‐‐ ‐‐ ‐‐ ‐‐ ‐‐ ‐‐ ‐‐ ‐‐ ‐‐ ‐‐ ‐‐ ‐‐ ‐‐
5% ‐‐ ‐‐ ‐‐ ‐‐ ‐‐ ‐‐ ‐‐ ‐‐ ‐‐ ‐‐ ‐‐ ‐‐ ‐‐ ‐‐ ‐‐ ‐‐ ‐‐
1.90 ‐‐ ‐‐ ‐‐ ‐‐ ‐‐ ‐‐ ‐‐ ‐‐ ‐‐ ‐‐ ‐‐ ‐‐ ‐‐ ‐‐ ‐‐ ‐‐ ‐‐
3.04 ‐‐ ‐‐ ‐‐ ‐‐ ‐‐ ‐‐ ‐‐ ‐‐ ‐‐ ‐‐ ‐‐ ‐‐ ‐‐ ‐‐ ‐‐ ‐‐ ‐‐
0.529 ‐‐ ‐‐ ‐‐ ‐‐ ‐‐ ‐‐ ‐‐ ‐‐ ‐‐ ‐‐ ‐‐ ‐‐ ‐‐ ‐‐ ‐‐ ‐‐ ‐‐
0.84 ‐‐ ‐‐ ‐‐ ‐‐ ‐‐ ‐‐ ‐‐ ‐‐ ‐‐ ‐‐ ‐‐ ‐‐ ‐‐ ‐‐ ‐‐ ‐‐ ‐‐
1.55 ‐‐ ‐‐ ‐‐ ‐‐ ‐‐ ‐‐ ‐‐ ‐‐ ‐‐ ‐‐ ‐‐ ‐‐ ‐‐ ‐‐ ‐‐ ‐‐ ‐‐
0.27 ‐‐ ‐‐ ‐‐ ‐‐ ‐‐ ‐‐ ‐‐ ‐‐ ‐‐ ‐‐ ‐‐ ‐‐ ‐‐ ‐‐ ‐‐ ‐‐ ‐‐
0.39
0.15
0.11
0.12
Permeable
Pavement*
Water Harvesting
Wet Detention Pond
Wetland
60%
user defined
15%
25%
1.44
1.08
1.01
1.08
‐48%
‐67%
‐67%
Pre‐Dev. &
Post‐Dev. without BMPs
Post‐Dev without BMPs &
Post‐Dev with BMPs
‐5%
‐46%
‐49%
‐78%
‐68%
0%1%
3%
‐2%
2%
53%
1%
Pre‐Development &
Post‐Development with BMPs
1%
‐2%
‐‐
‐‐
‐‐
‐‐
‐‐
CATCHMENT 6
‐‐ ‐‐‐‐
‐‐
‐‐
‐‐ ‐‐
‐‐ ‐‐
‐‐ ‐‐
‐‐ ‐‐‐‐
‐‐0.274
68% ‐‐‐‐
‐‐
0.181
0.84
South Central HighSMB
February 29, 2016
Development:Prepared By:
Date:
Post‐Development w/ BMPs
10.5%
570,889
1.02
1.55
0.18
0.27
REGION:
TOTAL DEVELOPMENT AREA (ft2):
Coastal
49%
Catchment Outflow Phosphorus EMC
(mg/L)
Percent Reduction in Nitrogen Load (%)
CATCHMENT 1
Total Nitrogen EMC
(mg/L)
Total Nitrogen Loading
(lb/ac/yr)
Total Phosphorus EMC
(mg/L)
Total Phosphorus Loading
(lb/ac/yr)
Total Nitrogen Loading (lb/ac/yr)
Total Phosphorus EMC (mg/L)
Total Phosphorus Loading (lb/ac/yr)
Percent Impervious (%)
Annual Runoff Volume (c.f.)
Total Nitrogen EMC (mg/L)
‐‐
‐‐
Total Inflow Phosphorus
(lb/ac/yr)
BMP Outflow
Nitrogen (lbs/ac/yr)
Total Area Treated
(ac)
Percent Reduction in Phosphorus Load (%)
‐‐
CATCHMENT 2 CATCHMENT 3
1.02 ‐‐
Catchment Outflow
Total Nitrogen (lb/ac/yr)1.55
Percent Volume Reduced
(%)
BMP Outflow
Phosphorus (lbs/ac/yr)
Total Inflow Volume
(c.f.)
Total Inflow Nitrogen
(lb/ac/yr)
Inflow Phosphorus EMC
(mg/L)
Catchment Outflow Nitrogen EMC (mg/L)
CATCHMENT 4
‐‐ ‐‐
‐‐
Catchment Outflow
Total Phosphorus (lb/ac/yr)
Volume Reduction
(%)
TN Effluent Concen.
(mg/L)
1.93
2.98
0.54
0.84
TP Effluent Concen.
(mg/L)
BMP VOLUME REDUCTIONS/EFFLUENT CONCENTRATIONS
Inflow Nitrogen EMC
(mg/L)
CATCHMENT 5
Percent Impervious
(%)
Annual Runoff Volume
(c.f.)580,916
Post‐Development Conditions
10.5%
599,882
1.90
3.03
0.83
1,023,913
Pre‐Development Conditions
10.0%
‐47%
Return to Watershed Characteristics
Return to BMP Characteristics
Print Summary
Return to Instructions

3. Development Summary
WATERSHED SUMMARY Ver2.0
Bioretention with
IWS80% 0.95 0.12
Bioretention
without IWS50% 1.00 0.12
Dry Detention Pond 10% 1.20 0.20
Grassed Swale 10% 1.21 0.26
Green Roof 50% 1.08 0.15
Level Spdr, Filter
Strip50% 1.20 0.15
Percent Difference Between:
Sand Filter 5% 0.92 0.14
*Negative percent difference values indicate a decrease in runoff volume, pollutant concentration or pollutant loading. Positive values indicate an increase. *if treating commercial parking lot, TP effluent concentration = 0.16 mg/L
BMP SUMMARY Ver2.0
BMP 1 BMP 2 BMP 3 BMP 1 BMP 2 BMP 3 BMP 1 BMP 2 BMP 3 BMP 1 BMP 2 BMP 3 BMP 1 BMP 2 BMP 3 BMP 1 BMP 2 BMP 3
Bioretention with
IWS‐‐ ‐‐ ‐‐ ‐‐ ‐‐ ‐‐ ‐‐ ‐‐ ‐‐ ‐‐ ‐‐ ‐‐ ‐‐ ‐‐ ‐‐ ‐‐ ‐‐
26.21 ‐‐ ‐‐ ‐‐ ‐‐ ‐‐ ‐‐ ‐‐ ‐‐ ‐‐ ‐‐ ‐‐ ‐‐ ‐‐ ‐‐ ‐‐ ‐‐ ‐‐
2,440,849 ‐‐ ‐‐ ‐‐ ‐‐ ‐‐ ‐‐ ‐‐ ‐‐ ‐‐ ‐‐ ‐‐ ‐‐ ‐‐ ‐‐ ‐‐ ‐‐ ‐‐
80% ‐‐ ‐‐ ‐‐ ‐‐ ‐‐ ‐‐ ‐‐ ‐‐ ‐‐ ‐‐ ‐‐ ‐‐ ‐‐ ‐‐ ‐‐ ‐‐ ‐‐
1.46 ‐‐ ‐‐ ‐‐ ‐‐ ‐‐ ‐‐ ‐‐ ‐‐ ‐‐ ‐‐ ‐‐ ‐‐ ‐‐ ‐‐ ‐‐ ‐‐ ‐‐
8.47 ‐‐ ‐‐ ‐‐ ‐‐ ‐‐ ‐‐ ‐‐ ‐‐ ‐‐ ‐‐ ‐‐ ‐‐ ‐‐ ‐‐ ‐‐ ‐‐ ‐‐
0.503 ‐‐ ‐‐ ‐‐ ‐‐ ‐‐ ‐‐ ‐‐ ‐‐ ‐‐ ‐‐ ‐‐ ‐‐ ‐‐ ‐‐ ‐‐ ‐‐ ‐‐
2.92 ‐‐ ‐‐ ‐‐ ‐‐ ‐‐ ‐‐ ‐‐ ‐‐ ‐‐ ‐‐ ‐‐ ‐‐ ‐‐ ‐‐ ‐‐ ‐‐ ‐‐
1.40 ‐‐ ‐‐ ‐‐ ‐‐ ‐‐ ‐‐ ‐‐ ‐‐ ‐‐ ‐‐ ‐‐ ‐‐ ‐‐ ‐‐ ‐‐ ‐‐ ‐‐
0.36 ‐‐ ‐‐ ‐‐ ‐‐ ‐‐ ‐‐ ‐‐ ‐‐ ‐‐ ‐‐ ‐‐ ‐‐ ‐‐ ‐‐ ‐‐ ‐‐ ‐‐
Volume Reduction
(%)
TN Effluent Concen.
(mg/L)
1.48
8.17
0.52
2.89
TP Effluent Concen.
(mg/L)
BMP VOLUME REDUCTIONS/EFFLUENT CONCENTRATIONS
Inflow Nitrogen EMC
(mg/L)
CATCHMENT 5
Percent Impervious
(%)
Annual Runoff Volume
(c.f.)2,313,803
Post‐Development Conditions
52.9%
2,434,162
1.46
8.45
0.55
1,141,914
Pre‐Development Conditions
50.0%
‐19%
‐‐
‐‐
Total Inflow Phosphorus
(lb/ac/yr)
BMP Outflow
Nitrogen (lbs/ac/yr)
Total Area Treated
(ac)
Percent Reduction in Phosphorus Load (%)
‐‐
CATCHMENT 2 CATCHMENT 3
1.20 ‐‐
Catchment Outflow
Total Nitrogen (lb/ac/yr)1.40
Percent Volume Reduced
(%)
BMP Outflow
Phosphorus (lbs/ac/yr)
Total Inflow Volume
(c.f.)
Total Inflow Nitrogen
(lb/ac/yr)
Inflow Phosphorus EMC
(mg/L)
Catchment Outflow Nitrogen EMC (mg/L)
CATCHMENT 4
‐‐ ‐‐
‐‐
Catchment Outflow
Total Phosphorus (lb/ac/yr)
84%
Catchment Outflow Phosphorus EMC
(mg/L)
Percent Reduction in Nitrogen Load (%)
CATCHMENT 1
Total Nitrogen EMC
(mg/L)
Total Nitrogen Loading
(lb/ac/yr)
Total Phosphorus EMC
(mg/L)
Total Phosphorus Loading
(lb/ac/yr)
Total Nitrogen Loading (lb/ac/yr)
Total Phosphorus EMC (mg/L)
Total Phosphorus Loading (lb/ac/yr)
Percent Impervious (%)
Annual Runoff Volume (c.f.)
Total Nitrogen EMC (mg/L)
‐‐0.361
88% ‐‐‐‐
‐‐
0.311
2.92
South Central HighSMB
February 29, 2016
Development:Prepared By:
Date:
Post‐Development w/ BMPs
52.9%
488,170
1.20
1.40
0.31
0.36
REGION:
TOTAL DEVELOPMENT AREA (ft2):
Coastal
‐‐
‐‐
‐‐
‐‐
‐‐
CATCHMENT 6
‐‐ ‐‐‐‐
‐‐
‐‐
‐‐ ‐‐
‐‐ ‐‐
‐‐ ‐‐
‐‐ ‐‐‐‐
‐83%
‐41%
‐87%
Pre‐Dev. &
Post‐Dev. without BMPs
Post‐Dev without BMPs &
Post‐Dev with BMPs
‐80%
‐17%
‐83%
‐43%
‐88%
0%3%
5%
‐2%
3%
5%
1%
Pre‐Development &
Post‐Development with BMPs
3%
‐79%
0.39
0.15
0.11
0.12
Permeable
Pavement*
Water Harvesting
Wet Detention Pond
Wetland
60%
user defined
15%
25%
1.44
1.08
1.01
1.08
Return to Watershed Characteristics
Return to BMP Characteristics
Print Summary
Return to Instructions

3. Development Summary
WATERSHED SUMMARY Ver2.0
Bioretention with
IWS80% 0.95 0.12
Bioretention
without IWS50% 1.00 0.12
Dry Detention Pond 10% 1.20 0.20
Grassed Swale 10% 1.21 0.26
Green Roof 50% 1.08 0.15
Level Spdr, Filter
Strip50% 1.20 0.15
Percent Difference Between:
Sand Filter 5% 0.92 0.14
*Negative percent difference values indicate a decrease in runoff volume, pollutant concentration or pollutant loading. Positive values indicate an increase. *if treating commercial parking lot, TP effluent concentration = 0.16 mg/L
BMP SUMMARY Ver2.0
BMP 1 BMP 2 BMP 3 BMP 1 BMP 2 BMP 3 BMP 1 BMP 2 BMP 3 BMP 1 BMP 2 BMP 3 BMP 1 BMP 2 BMP 3 BMP 1 BMP 2 BMP 3
Wetland ‐‐ ‐‐ ‐‐ ‐‐ ‐‐ ‐‐ ‐‐ ‐‐ ‐‐ ‐‐ ‐‐ ‐‐ ‐‐ ‐‐ ‐‐ ‐‐ ‐‐
132.18 ‐‐ ‐‐ ‐‐ ‐‐ ‐‐ ‐‐ ‐‐ ‐‐ ‐‐ ‐‐ ‐‐ ‐‐ ‐‐ ‐‐ ‐‐ ‐‐ ‐‐
6,778,771 ‐‐ ‐‐ ‐‐ ‐‐ ‐‐ ‐‐ ‐‐ ‐‐ ‐‐ ‐‐ ‐‐ ‐‐ ‐‐ ‐‐ ‐‐ ‐‐ ‐‐
25% ‐‐ ‐‐ ‐‐ ‐‐ ‐‐ ‐‐ ‐‐ ‐‐ ‐‐ ‐‐ ‐‐ ‐‐ ‐‐ ‐‐ ‐‐ ‐‐ ‐‐
1.59 ‐‐ ‐‐ ‐‐ ‐‐ ‐‐ ‐‐ ‐‐ ‐‐ ‐‐ ‐‐ ‐‐ ‐‐ ‐‐ ‐‐ ‐‐ ‐‐ ‐‐
5.10 ‐‐ ‐‐ ‐‐ ‐‐ ‐‐ ‐‐ ‐‐ ‐‐ ‐‐ ‐‐ ‐‐ ‐‐ ‐‐ ‐‐ ‐‐ ‐‐ ‐‐
0.508 ‐‐ ‐‐ ‐‐ ‐‐ ‐‐ ‐‐ ‐‐ ‐‐ ‐‐ ‐‐ ‐‐ ‐‐ ‐‐ ‐‐ ‐‐ ‐‐ ‐‐
1.63 ‐‐ ‐‐ ‐‐ ‐‐ ‐‐ ‐‐ ‐‐ ‐‐ ‐‐ ‐‐ ‐‐ ‐‐ ‐‐ ‐‐ ‐‐ ‐‐ ‐‐
2.75 ‐‐ ‐‐ ‐‐ ‐‐ ‐‐ ‐‐ ‐‐ ‐‐ ‐‐ ‐‐ ‐‐ ‐‐ ‐‐ ‐‐ ‐‐ ‐‐ ‐‐
0.41 ‐‐ ‐‐ ‐‐ ‐‐ ‐‐ ‐‐ ‐‐ ‐‐ ‐‐ ‐‐ ‐‐ ‐‐ ‐‐ ‐‐ ‐‐ ‐‐ ‐‐
Volume Reduction
(%)
TN Effluent Concen.
(mg/L)
1.63
4.93
0.53
1.61
TP Effluent Concen.
(mg/L)
BMP VOLUME REDUCTIONS/EFFLUENT CONCENTRATIONS
Inflow Nitrogen EMC
(mg/L)
CATCHMENT 5
Percent Impervious
(%)
Annual Runoff Volume
(c.f.)6,416,882
Post‐Development Conditions
26.6%
6,759,724
1.59
5.09
0.63
5,757,957
Pre‐Development Conditions
25.0%
‐29%
‐‐
‐‐
Total Inflow Phosphorus
(lb/ac/yr)
BMP Outflow
Nitrogen (lbs/ac/yr)
Total Area Treated
(ac)
Percent Reduction in Phosphorus Load (%)
‐‐
CATCHMENT 2 CATCHMENT 3
1.15 ‐‐
Catchment Outflow
Total Nitrogen (lb/ac/yr)2.75
Percent Volume Reduced
(%)
BMP Outflow
Phosphorus (lbs/ac/yr)
Total Inflow Volume
(c.f.)
Total Inflow Nitrogen
(lb/ac/yr)
Inflow Phosphorus EMC
(mg/L)
Catchment Outflow Nitrogen EMC (mg/L)
CATCHMENT 4
‐‐ ‐‐
‐‐
Catchment Outflow
Total Phosphorus (lb/ac/yr)
46%
Catchment Outflow Phosphorus EMC
(mg/L)
Percent Reduction in Nitrogen Load (%)
CATCHMENT 1
Total Nitrogen EMC
(mg/L)
Total Nitrogen Loading
(lb/ac/yr)
Total Phosphorus EMC
(mg/L)
Total Phosphorus Loading
(lb/ac/yr)
Total Nitrogen Loading (lb/ac/yr)
Total Phosphorus EMC (mg/L)
Total Phosphorus Loading (lb/ac/yr)
Percent Impervious (%)
Annual Runoff Volume (c.f.)
Total Nitrogen EMC (mg/L)
‐‐0.405
75% ‐‐‐‐
‐‐
0.169
1.63
Dana BrookeSMB
February 29, 2016
Development:Prepared By:
Date:
Post‐Development w/ BMPs
26.6%
5,084,078
1.15
2.75
0.17
0.41
REGION:
TOTAL DEVELOPMENT AREA (ft2):
Coastal
‐‐
‐‐
‐‐
‐‐
‐‐
CATCHMENT 6
‐‐ ‐‐‐‐
‐‐
‐‐
‐‐ ‐‐
‐‐ ‐‐
‐‐ ‐‐
‐‐ ‐‐‐‐
‐44%
‐68%
‐75%
Pre‐Dev. &
Post‐Dev. without BMPs
Post‐Dev without BMPs &
Post‐Dev with BMPs
‐25%
‐28%
‐46%
‐73%
‐75%
0%2%
5%
‐2%
3%
19%
1%
Pre‐Development &
Post‐Development with BMPs
2%
‐21%
0.39
0.15
0.11
0.12
Permeable
Pavement*
Water Harvesting
Wet Detention Pond
Wetland
60%
user defined
15%
25%
1.44
1.08
1.01
1.08
Return to Watershed Characteristics
Return to BMP Characteristics
Print Summary
Return to Instructions

*Note: This sheet is based of a RSC (SPSC) design model created by Anne Arundel County, MD.Stefani Barlow Input values shaded in Grey
Swift Creek - South Bend RSC Calculated values are noted with dotted pattern
T 100 10 1
tc
RCN
Qpre 129.46 129.46 129.46
Cobble d50 size Allowable Velocity (Supercritical)
Allowable Velocity (Subcritical)
Qpost 129.46 129.46 129.46 [inches] [ft/sec] [ft/sec]
L 350
4 5.1 7.1
delta E 10.0 Design Width (ft) 30.00 5 5.7 8.0
Lcascade 0.00 Design Depth (ft) 1.00
6 6.3 8.7
Cascade Height (ft)Maximum Allowable Cascade Slope (ft/ft)
Minimum Required Cascade length (ft)
Slopecascade 0.50 Roughness 0.05 7 6.8 9.4 4 0.5 8
Slope 0.03 A 20.00 8 7.2 10.1 5 0.5 10Lriffle 8.0 q 0.13 9 7.7 10.7 6 0.4 15
Nriffle 15 P 0.00 10 8.1 11.3 7 0.3 23
Npool 15 Rh 0.66 11 8.5 11.8 8 0.2 40
Lpool 16 Design Velocity (ft/sec) 14.66 12 8.8 12.3 9 0.1 90
d50 1.00 Conveyed Q (cfs) 293.14 15 9.9 13.8 >10 0.1 >100
W 40.0 18 10.8 15.1
D 2.0
Minimum Pool Depth "Use 3 pools" following
Cascade (ft) 0.80
hf 2.2
hf 1.0
10.0
0.8
n 0.05
A 53.33 0.20
P 40.27Rh 1.32Q 295.91V 5.55
15Provided cumulative pool depths (ft) = 16
Length of Channel, ft 350Riffle Top Width, ft 40.0Riffle Depth, ft 2.0Pool Depth, ft 1.0Number of Pools 15
Riffle Hydraulic Perimeter (ft), for parabolaRiffle Hydraulic Radius (ft), using Chow 1959
Calculated Flow for design parameters (cfs)Check Riffle Velocity (ft/sec)
Number of Pools (This is a preliminary estimate based on uniform length design…The Engineer may use varied pool and riffle length as permitted by the guidelines. Please check provided storage based on actual number of provided pools)
Computed Roughness
Pool Depth Inadequate
Subcritical Flow is PredominantRiffle Cross Section Area (ft2), for parabola
Entrenchment Ok.Theta - Intermediate step for solving
Enter desired pool depth (Maximum 3 ft)subcritical/ok Selected Cobble Size is Adequate for 100 year storm
Check Riffle Side Slope, Must be > 10H:1V
Check the Froude Number to ensure subcritical flow conditions Entrenchment ok
The cascade height is measured from the top of the cascade to the lowest point in the subsequent pool. Three full size pools are required at the bottom of a cascade.
Number of pool segments for project
Enter a trial median cobble diamater (ft)
Minimum top width of SPSC riffle channel (ft) Cascade is adequate,use 0 cascades
Minimum required length of pool (ft)
Maximum depth of SPSC riffle channel 10H:1V cross-section (ft) Adequate conveyance of design storm
SPSC (ft) ok
Cascade Slope (ft/ft)
Water Quality slope (ft/ft)Maximum Length of Riffle Channel/Weir (Not to exceed 8 ft)
Number of riffle segments/boulder weirs for project
Choose D50 Cobble size = 12 inchesPost development (No SPSC) Runoff Curve Number 85.00 Isbash curve for Stone Density = 165 lb/ft3
Post development (No BMP) discharge (cfs)
Total available length (ft)Cascade Design (maximum 5 ft
drop per segment)
Elevation drop over length (ft)
Total Cascade length for project (ft)
Pre development discharge (cfs)
Designer Engineer:Project Name:
Check parameters in bold
Checking the Channel Conveyance for the design floodDesign Return Period (Yr)
Time of Concentration in minutes (Before Development/Reference) 5.00
Cobble Gradation Table

*Note: This sheet is based of a RSC (SPSC) design model created by Anne Arundel County, MD.Stefani Barlow Input values shaded in Grey
Swift Creek - South Central High School RSC Calculated values are noted with dotted pattern
T 100 10 1
tc
RCN
Qpre 108.54 108.54 108.54
Cobble d50 size Allowable Velocity (Supercritical)
Allowable Velocity (Subcritical)
Qpost 108.54 108.54 108.54 [inches] [ft/sec] [ft/sec]
L 130
4 5.1 7.1
delta E 4.0 Design Width (ft) 30.00 5 5.7 8.0Lcascade 0.00 Design Depth (ft) 1.00 6 6.3 8.7
Slopecascade 0.50 Roughness 0.05
7 6.8 9.4
Cascade Height (ft)Maximum Allowable Cascade Slope (ft/ft)
Minimum Required Cascade length (ft)
Slope 0.03 A 20.00 8 7.2 10.1 4 0.5 8Lriffle 8.0 q 0.13 9 7.7 10.7 5 0.5 10
Nriffle 5 P 0.00 10 8.1 11.3 6 0.4 15
Npool 5 Rh 0.66 11 8.5 11.8 7 0.3 23
Lpool 16 Design Velocity (ft/sec) 16.45 12 8.8 12.3 8 0.2 40
d50 0.50 Conveyed Q (cfs) 329.04 15 9.9 13.8 9 0.1 90
W 40.0 18 10.8 15.1 >10 0.1 >100
D 1.0
Minimum Pool Depth "Use 3 pools" following
Cascade (ft) 0.80
hf 1.5
hf 2.0
20.0
0.9
n 0.05
A 26.67 0.10
P 40.07Rh 0.67Q 108.93V 4.08
5Provided cumulative pool depths (ft) = 7
Length of Channel, ft 130Riffle Top Width, ft 40.0Riffle Depth, ft 1.0Pool Depth, ft 2.0Number of Pools 5
The cascade height is measured from the top of the cascade to the lowest point in the subsequent pool. Three full size pools are required at the bottom of a cascade.
Cobble Gradation Table
Check the Froude Number to ensure subcritical flow conditions Entrenchment ok
Computed Roughness
Pool Depth Adequate
Subcritical Flow is PredominantRiffle Cross Section Area (ft2), for parabola
Entrenchment Ok.Theta - Intermediate step for solving
Riffle Hydraulic Perimeter (ft), for parabolaRiffle Hydraulic Radius (ft), using Chow 1959
Calculated Flow for design parameters (cfs)
Check Riffle Velocity (ft/sec)Number of Pools (This is a preliminary estimate based on uniform length design…The Engineer may use varied pool and riffle length as permitted by the guidelines. Please check provided storage based on actual number of provided pools)
Maximum depth of SPSC riffle channel 10H:1V cross-section (ft) Adequate conveyance of design storm
hf, Minimum required dead storage depth within the pools of the SPSC (ft) okEnter desired pool depth (Maximum 3 ft)
subcritical/ok Selected Cobble Size is Adequate for 100 year stormCheck Riffle Side Slope, Must be > 10H:1V
Number of pool segments for project
Enter a trial median cobble diamater (ft)
Minimum top width of SPSC riffle channel (ft) Cascade is adequate,use 0 cascades
Minimum required length of pool (ft)
Cascade Slope (ft/ft)
Water Quality slope (ft/ft)Maximum Length of Riffle Channel/Weir (Not to exceed 8 ft)
Number of riffle segments/boulder weirs for project
Choose D50 Cobble size = 6 inchesPost development (No SPSC) Runoff Curve Number 85.00 Isbash curve for Stone Density = 165 lb/ft3
Post development (No BMP) discharge (cfs)
Total available length (ft)Cascade Design (maximum 5 ft
drop per segment)
Elevation drop over length (ft)Total Cascade length for project (ft)
Pre development discharge (cfs)
Designer Engineer:Project Name:
Check parameters in bold
Checking the Channel Conveyance for the design flood
Design Return Period (Yr)
Time of Concentration in minutes (Before Development/Reference) 5.00

Appendix J:
Digital Copy of Hydrologic and Hydraulic Models
List of Contents:
1. Primary System HEC‐HMS Model (2‐,10‐,25‐,50‐, and 100‐Year Storms)
a. Existing Conditions b. Future Conditions c. Alternative #1 d. Alternative #2
2. Primary System HEC‐RAS Models (2‐,10‐,25‐,50‐, and 100‐Year Storms)
a. Swift Creek Main Branch
b. Swift Creek UT1
c. Gum Swamp
* The models include Existing and Future Conditions, as well as Alternatives*
3. Secondary System SWMM Models (10‐Year Storm)
a. Existing Conditions i. Davenport Farm Road
b. Alternative i. Davenport Farm Road

Appendix K:
Stream Assessment
List of Contents:
1. Stream Assessment Summary Table
2. Bank Erosion Hazard Index Output
3. Channel Stability Assessment Scores
4. Channel Stability Assessment Form

Assessment
Number BEHI Score BEHI Rating Stability Score
Stability
Rating Stream Reach
5 39.00 High 96 Fair Gum Swamp BEHI
8 41.00 Very High 101 Poor Swift Creek BEHI 1
9 37.40 High 94 Fair Swift Creek BEHI 2
15 43.60 Very High 85 Fair UT1‐SC BEHI

Bank Erosion Hazard Rating GuideStream Swift Creek BEHI 1 Reach Date 8/12/2014 Crew BSH, BPB
Bank Height (ft):
Bankfull Height (ft):
Value 1.0‐1.1 1.0‐0.9 100‐80 0‐20 100‐80
Index 1.0‐1.9 0.00 1.0‐1.9 0.00 1.0‐1.9 0.00 1.0‐1.9 0.00 1.0‐1.9 0.00
Value 1.11‐1.19 0.89‐0.5 0.55 79‐55 21‐60 79‐55 60.00
Index 2.0‐3.9 0.00 2.0‐3.9 3.66 2.0‐3.9 0.00 2.0‐3.9 0.00 2.0‐3.9 3.50
Value 1.2‐1.5 0.49‐0.3 54‐30 61‐80 80.00 54‐30
Index 4.0‐5.9 0.00 4.0‐5.9 0.00 4.0‐5.9 0.00 4.0‐5.9 5.90 4.0‐5.9 0.00
Value 1.6‐2.0 2.00 0.29‐0.15 29‐15 81‐90 29‐15
Index 6.0‐7.9 7.90 6.0‐7.9 0.00 6.0‐7.9 0.00 6.0‐7.9 0.00 6.0‐7.9 0.00
Value 2.1‐2.8 0.14‐0.05 14‐5.0 91‐119 14‐10
Index 8.0‐9.0 0.00 8.0‐9.0 0.00 8.0‐9.0 0.00 8.0‐9.0 0.00 8.0‐9.0 0.00
Value >2.8 <0.05 <5 2.75 >119 <10
Index 10 0.00 10 0.00 10 10.00 10 0.00 10 0.00
V = value, I = index SUB‐TOTAL (Sum one index from each column):
Bank Material Description:
Bank Materials
Bedrock (Bedrock banks have very low bank erosion potential)
Boulders (Banks composed of boulders have low bank erosion potential)
Cobble (Subtract 10 points. If sand/gravel matrix greater than 50% of bank material, then do not adjust)
Gravel (Add 5‐10 points depending percentage of bank material that is composed of sand)
Sand (Add 10 points)
Silt Clay (+ 0: no adjustment)
BANK MATERIAL ADJUSTMENT:
Stratification Comments:
Stratification
Add 5‐10 points depending on position of unstable layers in relation to bankfull stage
STRATIFICATION ADJUSTMENT:
VERY LOW LOW MODERATE HIGH VERY HIGH EXTREME
5‐9.5 10‐19.5 20‐29.5 30‐39.5 40‐45 46‐50
Bank location description (circle one) GRAND TOTAL:
Straight Reach Outside of Bend BEHI RATING:
Bank Height/ Root Depth/ Root Bank Angle Surface
Bankfull Ht Bank Height Density % (Degrees) Protection%
MODERATE
HIGH
VERY HIGH
Ban
k Erosion Potential
VERY LOW
LOW
41.0
VERY HIGH
EXTREME
31.0
10

Bank Erosion Hazard Rating GuideStream Swift Creek BEHI 2 Reach Date 8/13/2014 Crew BSH, BPB
Bank Height (ft):
Bankfull Height (ft):
Value 1.0‐1.1 1.0‐0.9 100‐80 0‐20 100‐80
Index 1.0‐1.9 0.00 1.0‐1.9 0.00 1.0‐1.9 0.00 1.0‐1.9 0.00 1.0‐1.9 0.00
Value 1.11‐1.19 0.89‐0.5 0.50 79‐55 21‐60 79‐55 70.00
Index 2.0‐3.9 0.00 2.0‐3.9 3.90 2.0‐3.9 0.00 2.0‐3.9 0.00 2.0‐3.9 2.71
Value 1.2‐1.5 1.50 0.49‐0.3 54‐30 61‐80 70.00 54‐30
Index 4.0‐5.9 5.90 4.0‐5.9 0.00 4.0‐5.9 0.00 4.0‐5.9 4.90 4.0‐5.9 0.00
Value 1.6‐2.0 0.29‐0.15 29‐15 81‐90 29‐15
Index 6.0‐7.9 0.00 6.0‐7.9 0.00 6.0‐7.9 0.00 6.0‐7.9 0.00 6.0‐7.9 0.00
Value 2.1‐2.8 0.14‐0.05 14‐5.0 91‐119 14‐10
Index 8.0‐9.0 0.00 8.0‐9.0 0.00 8.0‐9.0 0.00 8.0‐9.0 0.00 8.0‐9.0 0.00
Value >2.8 <0.05 <5 2.50 >119 <10
Index 10 0.00 10 0.00 10 10.00 10 0.00 10 0.00
V = value, I = index SUB‐TOTAL (Sum one index from each column):
Bank Material Description:
Bank Materials
Bedrock (Bedrock banks have very low bank erosion potential)
Boulders (Banks composed of boulders have low bank erosion potential)
Cobble (Subtract 10 points. If sand/gravel matrix greater than 50% of bank material, then do not adjust)
Gravel (Add 5‐10 points depending percentage of bank material that is composed of sand)
Sand (Add 10 points)
Silt Clay (+ 0: no adjustment)
BANK MATERIAL ADJUSTMENT:
Stratification Comments:
Stratification
Add 5‐10 points depending on position of unstable layers in relation to bankfull stage
STRATIFICATION ADJUSTMENT:
VERY LOW LOW MODERATE HIGH VERY HIGH EXTREME
5‐9.5 10‐19.5 20‐29.5 30‐39.5 40‐45 46‐50
Bank location description (circle one) GRAND TOTAL:
Straight Reach Outside of Bend BEHI RATING:
Bankfull Ht Bank Height Density % (Degrees) Protection%
Bank Height/ Root Depth/ Root Bank Angle Surface Ban
k Erosion Potential
VERY LOW
LOW
MODERATE
HIGH
VERY HIGH
EXTREME
27.4
10
37.4
HIGH

Bank Erosion Hazard Rating GuideStream UT1‐SC BEHI Reach Date 8/13/2014 Crew BSH,BPB
Bank Height (ft):
Bankfull Height (ft):
Value 1.0‐1.1 1.0‐0.9 100‐80 0‐20 100‐80 80.00
Index 1.0‐1.9 0.00 1.0‐1.9 0.00 1.0‐1.9 0.00 1.0‐1.9 0.00 1.0‐1.9 1.90
Value 1.11‐1.19 0.89‐0.5 79‐55 21‐60 79‐55
Index 2.0‐3.9 0.00 2.0‐3.9 0.00 2.0‐3.9 0.00 2.0‐3.9 0.00 2.0‐3.9 0.00
Value 1.2‐1.5 0.49‐0.3 54‐30 61‐80 80.00 54‐30
Index 4.0‐5.9 0.00 4.0‐5.9 0.00 4.0‐5.9 0.00 4.0‐5.9 5.90 4.0‐5.9 0.00
Value 1.6‐2.0 0.29‐0.15 0.20 29‐15 81‐90 29‐15
Index 6.0‐7.9 0.00 6.0‐7.9 7.22 6.0‐7.9 0.00 6.0‐7.9 0.00 6.0‐7.9 0.00
Value 2.1‐2.8 2.50 0.14‐0.05 14‐5.0 91‐119 14‐10
Index 8.0‐9.0 8.57 8.0‐9.0 0.00 8.0‐9.0 0.00 8.0‐9.0 0.00 8.0‐9.0 0.00
Value >2.8 <0.05 <5 1.00 >119 <10
Index 10 0.00 10 0.00 10 10.00 10 0.00 10 0.00
V = value, I = index SUB‐TOTAL (Sum one index from each column):
Bank Material Description:
Bank Materials
Bedrock (Bedrock banks have very low bank erosion potential)
Boulders (Banks composed of boulders have low bank erosion potential)
Cobble (Subtract 10 points. If sand/gravel matrix greater than 50% of bank material, then do not adjust)
Gravel (Add 5‐10 points depending percentage of bank material that is composed of sand)
Sand (Add 10 points)
Silt Clay (+ 0: no adjustment)
BANK MATERIAL ADJUSTMENT:
Stratification Comments:
Stratification
Add 5‐10 points depending on position of unstable layers in relation to bankfull stage
STRATIFICATION ADJUSTMENT:
VERY LOW LOW MODERATE HIGH VERY HIGH EXTREME
5‐9.5 10‐19.5 20‐29.5 30‐39.5 40‐45 46‐50
Bank location description (circle one) GRAND TOTAL:
Straight Reach Outside of Bend BEHI RATING:
Bank Height/ Root Depth/ Root Bank Angle Surface Ban
k Erosion Potential
VERY LOW
LOW
MODERATE
HIGH
43.6
Bankfull Ht Bank Height Density % (Degrees) Protection%
VERY HIGH
EXTREME
33.6
10
VERY HIGH

Bank Erosion Hazard Rating GuideStream Gum Swamp Reach Date 8/13/2014 Crew BSH, BPB
Bank Height (ft):
Bankfull Height (ft):
Value 1.0‐1.1 1.0‐0.9 100‐80 0‐20 100‐80
Index 1.0‐1.9 0.00 1.0‐1.9 0.00 1.0‐1.9 0.00 1.0‐1.9 0.00 1.0‐1.9 0.00
Value 1.11‐1.19 0.89‐0.5 0.56 79‐55 21‐60 79‐55 70.00
Index 2.0‐3.9 0.00 2.0‐3.9 3.61 2.0‐3.9 0.00 2.0‐3.9 0.00 2.0‐3.9 2.71
Value 1.2‐1.5 1.33 0.49‐0.3 54‐30 61‐80 54‐30
Index 4.0‐5.9 4.82 4.0‐5.9 0.00 4.0‐5.9 0.00 4.0‐5.9 0.00 4.0‐5.9 0.00
Value 1.6‐2.0 0.29‐0.15 29‐15 81‐90 90.00 29‐15
Index 6.0‐7.9 0.00 6.0‐7.9 0.00 6.0‐7.9 0.00 6.0‐7.9 7.90 6.0‐7.9 0.00
Value 2.1‐2.8 0.14‐0.05 14‐5.0 91‐119 14‐10
Index 8.0‐9.0 0.00 8.0‐9.0 0.00 8.0‐9.0 0.00 8.0‐9.0 0.00 8.0‐9.0 0.00
Value >2.8 <0.05 <5 2.81 >119 <10
Index 10 0.00 10 0.00 10 10.00 10 0.00 10 0.00
V = value, I = index SUB‐TOTAL (Sum one index from each column):
Bank Material Description:
Bank Materials
Bedrock (Bedrock banks have very low bank erosion potential)
Boulders (Banks composed of boulders have low bank erosion potential)
Cobble (Subtract 10 points. If sand/gravel matrix greater than 50% of bank material, then do not adjust)
Gravel (Add 5‐10 points depending percentage of bank material that is composed of sand)
Sand (Add 10 points)
Silt Clay (+ 0: no adjustment)
BANK MATERIAL ADJUSTMENT:
Stratification Comments:
Stratification
Add 5‐10 points depending on position of unstable layers in relation to bankfull stage
STRATIFICATION ADJUSTMENT:
VERY LOW LOW MODERATE HIGH VERY HIGH EXTREME
5‐9.5 10‐19.5 20‐29.5 30‐39.5 40‐45 46‐50
Bank location description (circle one) GRAND TOTAL:
Straight Reach Outside of Bend BEHI RATING:
Bank Height/ Root Depth/ Root Bank Angle Surface Ban
k Erosion Potential
VERY LOW
LOW
MODERATE
HIGH
Bankfull Ht Bank Height Density % (Degrees) Protection%
HIGH
VERY HIGH
EXTREME
29.0
10
39.0

Swift Creek BEHI 1 Swift Creek BEHI 2 UT1‐SC BEHIGum Swamp
BEHI
Watershed characteristics 11 9 9 8
Flow habit 11 8 5 9
Channel pattern 10 9 5 10
Entrenchment/channel confinement 10 9 9 9
Bed material 5 8 7 9
Bar development 7 6 10 9
Obstructions/debris jams 6 5 5 9
Bank soil texture and coherence 5 8 6 6
Average bankangle 9 9 10 10
Bank vegetation/protection 8 9 9 7
Bank cutting 9 7 6 5
Mass wasting/bank failure 10 7 4 5
Upstream distance to bridge
Score 101 94 85 96
Rating* Poor Fair Fair Fair
Channel Stability Assessment Scores

CHANNEL STABILITY ASSESSMENT FORM
Stability Indicator Excellent (1 -3 ) Good (4 - 6) Fair (7 - 9) Poor (10 - 12) Score1. Watershed and flood plain activity and characteristics
Stable, forested, undisturbed watershed
Occasional minor disturbances in the watershed, including cattle activity (grazing and/or access to stream), construction, logging, or other minor deforestation. Limited agricultural activities
Frequent disturbances in the watershed, including cattle activity, landslides, channel sand or gravel mining, logging, farming, or construction of buildings, roads, or other infrastructure. Urbanization over significant portion of watershed
Continual disturbances in the watershed. Significant cattle activity, landslides, channel sand or gravel mining, logging, farming, or construction of buildings, roads, or other infrastructure. Highly urbanized or rapidly urbanizing watershed
2. Flow habit Perennial stream with no flashy behavior
Perennial stream or ephemeral first-order stream with slightly increased rate of flooding
Perennial or intermittent stream with flashy behavior
Extremely flashy; flash floods prevalent mode of discharge; ephemeral stream other than first-order stream
3. Channel pattern Straight to meandering with low radius of curvature; primarily suspended load
Meandering, moderate radius of curvature; mix of suspended and bed loads; well-maintained engineered channel
Meandering with some braiding; tortuous meandering; primarily bed load; poorly maintained engineered channel
Braided; primarily bed load; engineered channel that is maintained
3. Channel pattern (revised) No evidence of channelization. Meandering, stable channel or straight (step-pool system, narrow valley), stable channel.
Appears to have previously been channelized. Stream is relatively stable. Channel has some meanders due to previous channel adjustment.
Appears to have previously been channelized. Stream is actively adjusting (meandering); localized areas of instability and/or erosion around bends. Straightened, stable channel.
Appears to have previously been channelized. Stream is actively adjusting (laterally and/or vertically) with few bends. Straight, unstable reach.
4. Entrenchment/ channel confinement
Active flood plain exists at top of banks; no sign of undercutting infrastructure; no levees
Active flood plain abandoned, but is currently rebuilding; minimal channel confinement; infrastructure not exposed; levees are low and set well back from the river
Moderate confinement in valley or channel walls; some exposure of infrastructure; terraces exist; flood plain abandoned; levees are moderate in size and have minimal setback from the river
Knickpoints visible downstream; exposed water lines or other infrastructure; channel-width-to-top-of-banks ration small; deeply confined; no active flood plain; levees are high and along the channel edge
5. Bed materiaFs = approximate portion of sand in the bed
Assorted sized tightly packed, overlapping, and possibly imbricated. Most material > 4 mm. Fs < 20%
Moderately packed with some overlapping. Very small amounts of material < 4 mm. 20 < Fs < 50%
Loose assortment with no apparent overlap. Small to medium amounts of material < 4 mm. 50 < Fs < 70%
Very loose assortment with no packing. Large amounts of material < 4 mm. Fs > 70%
6. Bar development For S < 0.02 and w/y > 12, bars are mature, narrow relative to stream width at low flow, well-vegetated, and composed of coarse gravel to cobbles. For S > 0.02 and w/y are < 12, no bars are evident
For S < 0.02 and w/y > 12, bars may have vegetation and/or be composed of coarse gravel to cobbles, but minimal recent growth of bar evident by lack of vegetation on portions of the bar. For S > 0.02 and w/y <12, no bars are evident
For S < 0.02 and w/y > 12, bar widths tend to be wide and composed of newly deposited coarse sand to small cobbles and/or may be sparsely vegetated. Bars forming for S > 0.02 and w/y < 12
Bar widths are generally greater than 1/2 the stream width at low flow. Bars are composed of extensive deposits of fine particles up to coarse gravel with little to no vegetation. No bars for S < 0.02 and w/y > 12
7. Obstructions, including bedrock outcrops, armor layer, LWD jams, grade control, bridge bed paving, revetments, dikes or vanes, riprap
Rare or not present Occasional, causing cross currents and minor bank and bottom erosion
Moderately frequent and occasionally unstable obstructions, cause noticeable erosion of the channel. Considerable sediment accumulation behind obstructions
Frequent and often unstable, causing a continual shift of sediment and flow. Traps are easily filled, causing channel to migrate and/or widen
8. Bank soil texture and coherence
Clay and silty clay; cohesive material Clay loam to sandy clay loam; minor amounts of noncohesive or unconsolidated mixtures; layers may exist, but are cohesive materials
Sandy clay to sandy loam; unconsolidated mixtures of glacial or other materials; small layers and lenses of noncohesive or unconsolidated mixtures
Loamy sand to sand; noncohesive material; unconsolidated mixtures of glacial or other materials; layers of lenses that include noncohesive sands and gravels
9. Average bank slope angle (where 90° is a vertical bank)
Bank slopes < 3H:1V (18°) for noncohesive or unconsolidated materials to < 1:1 (45°) in clays on both sides
Bank slopes up to 2H:1V (27°) in noncohesive or unconsolidated materials to 0.8:1 (50°) in clays on one or occasionally both banks
Bank slopes to 1H:1V (45°) in noncohesive or unconsolidated materials to 0.6:1 (60°) in clays common on one or both banks
Bank slopes over 45° in noncohesive or unconsolidated materials or over 60° in clays common on one or both banks
10. Vegetative or engineered bank protection
Wide band of woody vegetation with at least 90% density and cover. Primarily hard wood, leafy, deciduous trees with mature, healthy, and diverse vegetation located on the bank. Woody vegetation oriented vertically. In absence of vegetation, both banks are lined or heavily armored
Medium band of woody vegetation with 70-90% plant density and cover. A majority of hard wood, leafy, deciduous trees with maturing, diverse vegetation located on the bank. Wood vegetation oriented 80-90% from horizontal with minimal root exposure. Partial lining or armoring of one or both banks
Small band of woody vegetation with 50-70% plant density and cover. A majority of soft wood, piney, coniferous trees with young or old vegetation lacking in diversity located on or near the top of bank. Woody vegetation oriented at 70-80% from horizontal, often with evident root exposure. No lining of banks, but some armoring may be in place on one bank
Woody vegetation band may vary depending on age and health with less than 50% plant density and cover. Primarily soft wood, piney, coniferous trees with very young, old and dying, and/or monostand vegetation located off of the bank. Woody vegetation oriented at less than 70% from horizontal with extensive root exposure. No lining or armoring of banks
11. Bank cutting Little or none evident. Infrequent raw banks, insignificant percentage of total bank
Some intermittently along channel bends and at prominent constrictions. Raw banks comprise minor portion of bank in vertical direction
Significant and frequent on both banks. Raw banks comprise large portion of bank in vertical direction. Root mat overhangs
Almost continuous cuts on both banks, some extending over most of the banks. Undercutting and sod-root overhangs
12. Mass wasting or bank failure
No or little evidence of potential or very small amounts of mass wasting. Uniform channel width over the entire reach
Evidence of infrequent and/or minor mass wasting. Mostly healed over with vegetation. Relatively constant channel width and minimal scalloping of banks
Evidence of frequent and/or significant occurrences of mass wasting that can be aggravated by higher flows, which may cause undercutting and mass wasting of unstable banks. Channel width quite irregular, and scalloping of banks is evident
Frequent and extensive mass wasting. The potential for bank failure, as evidenced by tension cracks, massive undercuttings, and bank slumping is considerable. Channel width is highly irregular, and banks are scalloped
13. Upstream distance to bridge from meander impact point and alignment
More than 35 m; bridge is well-aligned with river flow
20-35 m; bridge is aligned with flow 10-20 m; bridge is skewed to flow, or flow alignment is otherwise not centered beneath bridge
Less than 10 m; bridge is poorly aligned with flow
Total Score
H = horizontal, V = vertical, Fs = fraction of sand, S = slope, w/y = width-to-depth ratio

Appendix L:
Prioritization Matrices
List of Contents:
1. Swift Creek Project Prioritization Matrix
2. Category Summary for Prioritization Matrix
3. Cost Effectiveness Ratio Summary

CATEGORY
TOTA
L W
EIGHTED SCO
RE
Frog Level Road (Gum Swamp) 5 50 1 10 3 30 5 30 0 0 1 6 1 6 0 0 3 9 141
Gum Swamp Floodplain Benching 5 50 1 10 1 10 5 30 0 0 3 18 1 6 1 6 3 9 139Thomas Langston Road (Swift Creek Main Branch) ‐ Alt 1 5 50 3 30 3 30 5 30 0 0 3 18 1 6 1 6 3 9 179Sterling Trace Drive (Swift Creek Main Branch) ‐ Alt 1 3 30 5 50 1 10 3 18 0 0 0 0 1 6 1 6 3 9 129Thomas Langston Road (SCUT1) ‐ Alt 1 5 50 3 30 3 30 5 30 0 0 1 6 1 6 0 0 3 9 161Belfair Drive (SCUT1) ‐ Alt 1 1 10 5 50 3 30 3 18 0 0 0 0 3 18 0 0 3 9 135Sterling Pointe Drive (SCUT1) ‐ Alt 1 3 30 5 50 1 10 3 18 0 0 1 6 1 6 1 6 3 9 135Alternative 2 ‐ SCUT1 5 50 5 50 1 10 5 30 3 18 0 0 0 0 1 6 0 0 164Alternative 2 ‐ Swift Creek Main Branch 5 50 5 50 0 0 5 30 3 18 0 0 0 0 1 6 0 0 154
Thomas Langston (Swift Creek Main Branch) 0 0 0 0 5 50 3 18 0 0 5 30 3 18 3 18 3 9 143
Thomas Langston (SCUT1) 0 0 0 0 1 10 1 6 0 0 1 6 5 30 1 6 3 9 67
Ridgewood Elementary School Bioretention 0 0 0 0 3 30 0 0 5 30 0 0 3 18 3 18 5 15 111
Pinecrest Water Quality Swale 0 0 0 0 3 30 0 0 3 18 0 0 3 18 1 6 3 9 81
Emerald Park Bioretention 0 0 0 0 3 30 0 0 5 30 0 0 3 18 3 18 3 9 105
Davenport Farm Water Quality Swale 0 0 0 0 3 30 0 0 3 18 0 0 3 18 1 6 3 9 81
South Bend RSC 0 0 0 0 1 10 0 0 5 30 0 0 3 18 3 18 3 9 85Wells Fargo Wet Pond Retrofit 0 0 0 0 3 30 0 0 5 30 0 0 1 6 1 6 3 9 81
Sterling Pointe Apartments Wet Pond Retrofit 0 0 0 0 5 50 0 0 5 30 0 0 3 18 1 6 3 9 113
South Central High School RSC 0 0 0 0 1 10 0 0 3 18 0 0 1 6 3 18 1 3 55
South Central High Bioretention 0 0 0 0 1 10 0 0 3 18 0 0 3 18 3 18 3 9 73
Dana Brooke Wetland 0 0 0 0 1 10 0 0 5 30 0 0 1 6 3 18 1 3 67
*Raw numbers are shown in left side of column and weighted numbers are provided in right side of column. Totals are based on weighted numbers.
Project Prioritization Matrix
Primary System Projects
Water Quality Projects
Public Health
and
Safety
Severity of Stree
t Flood
ing
(Pub
lic ROW)
Cost Effectiv
eness
Effect of Improv
emen
ts
Water Qua
lity ‐ B
MP
Water Qua
lity ‐ E
rosion
Co
ntrol
Implem
entatio
n Co
nstraints
Grant Fun
ding
Constructib
ility
Stream Stabilization Projects

Category General Description Score Evaluation CriteriaFlood water depth and/or velocity completely surrounds and threatens the structural integrity of habitable structures or vehicles.Finished Floor Flooding Occurs during the design storm.
Erosion of stream running parallel to road threatening roadway stability or safety for SecondaryFlood water surrounds structure but does not cause imminent danger. Crawl space and HVAC units are flooded.Yard flooding occurs and flood waters are near HVAC, crawl spaces or foundations.Model indicates flooding at nodes on private property or on roads/private property within a residential neighborhood.Minor yard flooding may occur but habitable structure is not directly affected.Model indicates no flooding at nodes on private property.
Street spread requirements are not met and are so severe that the street becomes impassable during the design storm or street flooding has spread into private property.Flooding is noted on NCDOT roads as a result spread issues on adjacent city owned street.Roadway overtopping exceeding 6" in depth for Primary Systems.Street spread requirements are not met and the streets are passable only through the center of the street.Flooding noted on collector and local streets.Roadway overtopping 0-6" in depth for Primary Systems
1Spread requirements exceeded but street flooding is considered minor nuisance for traffic.
0 Spread requirements are met.Project benefit ratio is greater than 1.5Stream Stabilization cost <$400 per linear footProject benefit ratio is between 0.5 and 1.5Stream Stabilization cost <$600 per linear footProject benefit ratio is between 0.075 and 0.5Stream Stabilization cost <$1,000 per linear footProject ratio is less than 0.075Stream Stabilization cost >$1,000 per linear foot
1
3
5
Public Health and Safety
Severity of Street Flooding (City Owned)
Evaluates impact of flood depths to or through an area
3Evaluates potential impact of flooding on public health and safety. Generally, refers to flooding in and around habitable structures.
5
1
0
5
3
Evaluates the benefit/cost of the proposed improvements
Cost Effectiveness
0

Category General Description Score Evaluation Criteria
Multiple major drainage issues are being resolved through the proposed improvements such as street spread and increased drainage capacity.Proposed improvements would resolve major drainage issues for more than 5 properties.Single drainage issue is being resolved and it is considered major.Proposed improvements would resolve drainage issues for 3-5 properties.Single drainage issue is being resolved and it is considered major.Proposed improvements would resolve drainage issues for 2-3 properties.Single drainage issue is being resolved and it is considered minor.Proposed improvements would resolve drainage issue(s) for a single property at most.
Provides both water quantity and water quality benefits.Does not use manufactured or proprietary BMP technology.Incorporates some form of green solution such as infiltration, LID, sustainability etc.Is considered a BMP retrofit.Provides water quality benefits but does not provide water quantity benefit.Is considered a BMP retrofitImprovements will have minimal impacts on water quality and would primarily serve as a demonstration project.Is considered a BMP retrofit.
0
Improvements will have no measurable impact on water quality and would serve only as a demonstration project.
5
3
5
Water Quality/Quantity
Evaluates the impact a BMP would have on water quality, water quantity and NPDES Phase II Compliance
1
0
Evaluates the number of drainage issues resolved and the number of citizens positively affected
Effect of Improvements
3
1

Category General Description Score Evaluation Criteria
5Severe erosion problems are evident and are contributing significantly to water quality issues.Moderate erosion problems are evident and are contributing to water quality issues.>2,000 Linear feet of floodplain benching with documented erosion.Minor erosion control issues are evident and are contributing to water quality issues. <2,000 Linear feet of floodplain benching with documented erosion.
0
Minor erosion control issues are evident and are not contributing to water quality issues in a significant way.
Only minor local or state permits required. Does not involve ACOE, DWQ or FEMA.Proposed improvements can be completed without permanent or temporary easements.Project can proceed independent of other stormwater improvements identified in the master plan.Requires State and Federal permits that are typically easy to obtain such as Nationwide permits, FEMA No Rise etc. Primarily requires temporary easements with only a few permanent easements needed to build the project.Improvements may have limited coordination with other projects such as DOT widening, GUC utility improvements or down stream drainage improvements. Significant delays in the schedule due to this coordination is not anticipated. Project can proceed independent of other stormwater improvements identified in the master plan.Project is self mitigating or requires very minor mitigation.
Numerous permits required including federal, state and local agencies. Examples would include an individual permit or FEMA CLOMR/LOMR.Extensive permanent and temporary easements are required.Project can not proceed independent of other stormwater improvements identified in the master plan.Requires floodplain benching.
3
1
5
1
3
Considers potential constraints that may either delay or make the project too difficult to construct. Some examples would include significant permitting issues, high mitigation costs, numerous easement needs, required partnering with other communities, the NCDOT, or railroads.
Implementation Constraints
Evaluates the severity of erosion control issues and impact on water quality
Open Channel - Erosion Control

Category General Description Score Evaluation Criteria
Project qualifies for multiple grants.Grant does not require significant match (20% match or less)City does not have an open grant from the agency providing the funding.Project meets all ranking criteria and will score highly in most if not all categories.
Project qualifies for only one type of grant funding.
Grant requires match between 20% and 50% range.City has an open grant from agency providing the funding.Project meets most if not all of the ranking criteria and will score high in key categories.
Project qualifies for only one type of grant funding.
Grant requires match equal to or greater than 50%.City has an open grant from agency providing the funding.Project meets some of the ranking criteria and may score high in one or two categories.
0 Project does not qualify for any type of grant funding
Limited to no site constraints.Limited to no utility conflicts.
Limited to no impacts on adjacent property owners.Limited to no impacts on traffic or surround neighborhoods.Some site constraints exist but are considered fairly minor.Some utility conflicts exist but are routine and do not require major utility relocation.Some traffic and neighborhood impacts occur but are fairly minor. Examples include temporary lane closures, occasional hauling or traffic detours though adjacent neighborhoods.Site constraints exist and are fairly major.Utility conflicts exist and require rerouting or relocation of existing utilities.Traffic and neighborhood impacts occur and are fairly major. Examples included extended road closures or hauling operations.
5
3Evaluates the availability and potential to receive grant funding
Grant Funding
1
Constructability
5
3
1
Evaluates relative constructability of the project including site constraints, traffic and neighborhood impacts, and impacts on adjacent property owners.

To calculate the project benefit ratio used in evaluating the cost effectiveness, the following steps were
taken for each project location:
1. The weighted scores for the Public Health and Safety, Severity of Street Flooding, and Effect of
Improvements categories were added together.
2. The sum of the three categories was divided by the total project cost.
3. The quotient was multiplied by a common multiplier, 5,000, to determine the benefit ratio.
4. The value was then assigned a score based on the evaluation criteria shown below for the cost
effectiveness criteria.
5. The applicable weighting factor is then applied to the score. The final number obtained is listed
in the project prioritization matrix.
Score Evaluation Criteria
5 Project benefit ratio is greater than 1.5
3 Project benefit ratio is between 0.5 and 1.5
1 Project benefit ratio is between 0.075 and 0.5
0 Project ratio is less than 0.075

The above table presents the weighting factors that will be applied to the prioritization criteria, with the
reason being that some criteria are viewed as more important (i.e. deserve a higher weighting) than
others. So each score of each prioritization criteria will be multiplied by the assigned weight factor for
that prioritization criteria category as shown in the Priority Matrix.
Weight Factor Criteria
10
Public Health and Safety
Severity of Street Flooding (Town Owned)
Cost Effectiveness
6
Effect of Improvements
Water Quality ‐ BMP and Erosion Control
Implementation Constraints
Grant Funding
3 Construction Impacts
Constructability

Appendix M:
Swift Creek Water Quality Monitoring – Final Report

SWIFT CREEK WATER QUALITY MONITORING
Dr. Eban Bean, Dr. Michael O’Driscoll, and Dr. Charles Humphrey
East Carolina University
Final Report Submitted to WK Dickson
March 4, 2016

i
TABLE OF CONTENTS EXECUTIVE SUMMARY ................................................................................................. 1 INTRODUCTION ............................................................................................................. 2
Study Location ............................................................................................................. 2 Current Condition ......................................................................................................... 5 Study Objectives .......................................................................................................... 5
METHODS ...................................................................................................................... 5 Water Quality Sampling and Measurements ............................................................... 5
TSS and Nutrient Analyses ...................................................................................... 6 Bacterial Analyses .................................................................................................... 7 Metals Analyses ....................................................................................................... 7 Isotope Analyses ...................................................................................................... 7 In Stream Measurements ......................................................................................... 7
Monitoring Sites ........................................................................................................... 7 Longitudinal Surveys ................................................................................................... 8
RESULTS AND DISCUSSION ...................................................................................... 10 Stream Flow .............................................................................................................. 10 Water Quality ............................................................................................................. 11
Turbidity ................................................................................................................. 11 Total Suspended Solids ......................................................................................... 13 Dissolved Organic Carbon ..................................................................................... 13 Specific Conductivity .............................................................................................. 14 Total Dissolved Nitrogen ........................................................................................ 16 Nitrate and Nitrite ................................................................................................... 17 15N and 18O Isotopes in NO3 .................................................................................. 18 Organic Nitrogen .................................................................................................... 24 Total Dissolved Phosphorus .................................................................................. 24 Dissolved Oxygen .................................................................................................. 25 E. Coli & Total Coliform .......................................................................................... 27 Metals .................................................................................................................... 29
CONCLUSIONS AND RECOMMENDATIONS ............................................................. 30 REFERENCES .............................................................................................................. 32

ii
APPENDICES ............................................................................................................... 33 APPENDIX A: Rating Curves and Discharge Records .............................................. 33
Rating Curves ........................................................................................................ 33 Discharge Records ................................................................................................. 33
APPENDIX B: Conductivity Records ......................................................................... 35 APPENDIX C: Water Quality Measurements and Concentrations ............................. 37
Temperature .......................................................................................................... 37 Dissolved Oxygen Saturation ................................................................................. 38 pH .......................................................................................................................... 39 Chloride .................................................................................................................. 40 Ammonia ................................................................................................................ 40

1
EXECUTIVE SUMMARY
East Carolina University was awarded an 18-month contract to monitor water quality in the Swift Creek (SC) watershed upstream of NC 102 (37.8 mi2) as part of the City of Greenville’s Watershed Master Planning project. The SC watershed was selected because it is currently listed on the 303d list of impaired waters for North Carolina.
The goal of the water quality monitoring program was to determine whether nutrients, pathogens, sediments, or metals are impairing SC, and if so, to locate any potential sources of degradation. Water quality monitoring included sampling stream flow during base and storm flow conditions at least four times at seven locations on SC (1-7), and two outfalls (SC9 & SC10). Two longitudinal surveys of water quality were conducted at 16 locations along SC. Stage and conductivity were recorded continuously at three locations within the watershed as well.
Sampling results were compared with water quality standards or surrogate standards to evaluate whether parameters may be contributing to stream degradation. Exceedance of standards occurred more frequently during storm flow events rather than baseflow events. Total suspended solids (TSS) concentrations exceeded 20 mg/l (North Carolina standard for High Quality Waters) during two storm flow events at nearly all sites on SC, while the turbidity standard (50 NTU) was violated during only one storm (November 24) at five sites, SC3 – SC7. Agricultural land use below the head waters was likely the most significant contributor of sediment loads to SC.
Results for E. coli exceeded EPA recommended levels (528 MPN/100 ml) during only one baseflow event (October 13) at all in-stream sites, while in-stream results from three storms exceeded the standard, primarily upstream of SC6. Similar trends were observed for storm flow concentrations of E. coli, chloride, and organic nitrogen, which could indicate a wastewater source.
Although nutrient concentrations did not exceed existing numeric standards, baseflow nitrate-nitrite concentrations exceeded conservative numeric guidelines set in Florida (0.3 mg/l). Nitrate concentrations steadily increased downstream from headwaters for baseflow and storm flow events. Baseflow concentrations were highest for the winter sampling, likely due to increased agricultural drainage in response to an elevated water table during this time of year. Results of 15N-NO3 isotope analyses suggest fertilizer or soil as the primary source of nitrate, although wastewater could not be ruled out due to possible mixing. Of note, baseflow 15N-NO3 from SC4 was most enriched, suggesting this was the site most likely to be influenced by wastewater. Additional monitoring and comparison of sewered and septic areas could help to determine wastewater-related N-inputs. In addition, baseflow nitrate concentrations at SC4 were elevated compared to in-stream concentrations at SC3 (upstream) and SC5 (downstream). Efforts to reduce nitrogen along the tributary upstream of SC4 would likely reduce nitrogen and improve water quality along the main stem.

2
Total dissolved phosphorus concentrations primarily exceeded numeric guidelines from Florida (0.06 mg/l) during one storm event (November 24). Otherwise, baseflow and storm flow concentrations generally increased downstream from head waters, where agricultural land use is more prevalent in the watershed.
None of the metals were found to exceed state standards, as concentrations were below detection limits for copper (10 µg/l) and lead (5 µg/l) and zinc concentrations were less than state standards (50 µg/l).
INTRODUCTION
Study Location
Swift Creek’s (SC’s) headwaters originate in the Greenville, NC area and the study area extends from its headwaters, down to the Route 102 Bridge at Ayden, NC. The SC watershed (HUC12: 030202020401) is located in the inner Coastal Plain, where the bulk of discharge to streams is from unconfined aquifers (Winner and Coble, 1996). The main stem of SC flows from urbanized headwaters to the south through a mostly agricultural watershed towards the Neuse River. Topographic relief and land cover are shown with the SC watershed boundary in Figures 1 and 2, respectively.
Soils within the SC watershed are mostly poorly drained with fine-loamy texture. Typically the surficial aquifer drains to streams and it is underlain at approximately 10-20 ft. below the surface by the Yorktown confining unit (which overlays the Yorktown aquifer). As much of the SC watershed is or was once used for agricultural production, drainage channels and tile drains serve as collectors of stormwater runoff within the rural catchments. These channels efficiently convey runoff to SC and its tributaries. Historical channelization has also reduced the channel length and increased the channel slope along sections of SC, which has led to incision, lateral erosion and disconnection between the stream channel and its flood plain.
On average, the watershed receives 125 cm (49.3 in.) of rain per year, ranging from a maximum of 15.0 cm (5.89 in.) in August to a low of 7.09 cm (2.79 in.) in November (Holder et al., 2006; Southeast Regional Climate Center, 2009). The mean air temperature is 16.2°C (61.2°F), from a low of -0.39°C (31.3°F) in January to a high of 21.2°C (70.2°F) in July (NCEI, 2015). Elevated evapotranspiration in the summer months can result in reductions in streamflow during this period. On an annual basis, evapotranspiration accounts for approximately 70% of precipitation losses (Sun et al. 2002). Based on previous studies in the region, groundwater inputs to streams are typically lowest during the period of June–November. Total discharge follows this seasonal pattern but may also increase during September due to increased runoff from tropical storms. Typically streamflow is greatest during March and lowest during October. Groundwater is usually the dominant source of streamflow, contributing approximately 60% of annual discharge (O’Driscoll et al. 2010).

3
Figure 1. Topography within and around Swift Creek watershed.

4
Figure 2. Land cover within and around Swift Creek watershed. Data from National Land Cover Data set.

5
Current Condition
The North Carolina Department of Environmental Quality (NCDEQ) currently lists Swift Creek as being a Class C surface water, meaning it is protected for secondary recreation (wading, boating, and other types of infrequent, unorganized, or incidental human body contact), fishing, wildlife, fish consumption, aquatic life (propagation, survival, and maintenance of biological integrity), and agriculture. In addition, NCDEQ has applied two supplemental classifications to Swift Creek. The Swamp Waters (Sw) supplemental classification is intended to recognize waters having “low velocities and other natural characteristics which are different from adjacent streams”, such as lower pH, lower dissolved oxygen, and higher temperatures (NCDENR, 2009). The Nutrient Sensitive Waters (NSW) supplemental classification is “intended for waters needing additional nutrient management due to their being subject to excessive growth of microscopic or macroscopic vegetation” and is applied to Swift Creek as a tributary to the Neuse River.
Since 1998, a 19.3 mile stretch of Swift Creek (from its source to 5.3 miles upstream of Clayroot Swamp) has been classified as impaired for not meeting the aquatic life standard due to a poor bioclassification rating for ecological or biological integrity of benthos. This classification does not specify the cause of the condition and may result from individual or multiple environmental factors.
Study Objectives
The goal of the water quality monitoring program was to determine whether nutrients, pathogens, sediments, or metals were contributing to impairment of Swift Creek.
METHODS Sampling and monitoring plans were developed to evaluate the flow and water quality over time within Swift Creek, upstream of NC 102.
Water Quality Sampling and Measurements
Seven in-stream (SC1-SC7) and two outfall (SC9, SC10) locations were selected for sampling along Swift Creek and its tributaries (Table 1 and Figure 3). Water quality samples and measurements were collected during baseflow and storm flow (or wet weather) events during the study period. These sites were distributed along SC and its tributaries to evaluate water quality throughout the watershed and determine if any section(s) of SC was more affected than others. In addition, baseflow and storm flow samples were collected across seasons to evaluate seasonal fluctuations of water quality.
Samples were collected during four baseflow and four storm flow events. All sites were sampled for each baseflow and storm sampling event. Samples were also collected in coordination with benthic sampling on August 18-21, 2014; when available results were included with those from the other four baseflow events. Seasonal baseflow and storm

6
flow event dates are listed in Table 2 and occurred approximately during each season between October 2014 and September 2015. Rainfall less than 1.00 in. during 72 hours (3 days) prior to sampling was required for baseflow events. This criterion was supported with monitoring data as storm hydrographs returned to baseflow within 72 hours of precipitation events, except for the largest of rainfall events. In addition, samples were also collected in conjunction with benthic sampling in August 2014 and met the criteria for baseflow sampling. Table 1. Locations of baseflow and stormwater monitoring sites along Swift Creek, an un-named tributary (SC4), and two outfalls (SC9, SC10).
Location Latitude Longitude Sampling Stage
Monitoring Conductivity Monitoring
SC 1 35° 33' 14.52" N 77° 24' 52.38" W Y
SC 2 35° 33' 13.62" N 77° 24' 48.54" W Y Y Y*
SC 3 35° 32' 44.4" N 77° 25' 11.1" W Y
SC 4 35° 32' 36.66" N 77° 25' 30.24" W Y
SC 5 35° 32' 17.1" N 77° 25' 7.92" W Y Y Y
SC 6 35° 30' 0.06" N 77° 25' 29.22" W Y Y Y
SC 7 35° 28' 10.02" N 77° 24' 1.98" W Y
SC 9 35° 32' 13.67" N 77° 25' 7.17" W Y
SC 10 35° 32' 14.02" N 77° 25' 7.08" W Y
Rain Gauge 35° 32' 31.2" N 77° 25' 37.2" W *Removed due to burial and operational issues.
Table 2. Sampling dates for baseflows, storm (wet weather) flows, and longitudinal surveys.
Sampling Dates
Baseflow 2014: Aug 18‐21, Oct 13; 2015: Feb 24, Apr 13, Aug 24a
Storm Flow 2014: Nov 24; 2015: Feb 2, Jul 13, Sep 25a,b
Longitudinal Surveys 2015: Apr 13, Aug 24 aSamples for metals analysis collected at SC 1, 3, and 5. bSamples for isotope analyses collected at all sampling sites.
The target threshold for storm flow sampling was set at 0.50 in. of rainfall within a three hour period. Only the July 13 event did not meet this criterion, when approximately 0.34 in. fell during a three hour period. Storm flow samples were collected by first flush sampling on November 24, 2014, and February 2, 2015. All other base flow and storm flow samples were collected via direct grab sampling. For grab sampling, bottles were rinsed in stream water three times prior to collecting each sample. Sample bottles were labeled with identification numbers and immediately put on ice after collection.
TSS and Nutrient Analyses For each sampling event, samples were collected in high density polyethylene (HDPE) bottles, for water quality analyses at the Environmental Research Lab. Samples were filtered on same day as they were collected. These analyses included Total Suspended Solids (TSS), nitrogen species (Ammonia (NH4), Nitrate+Nitrite (NO2+3), Total Dissolved

7
Nitrogen (TDN)), phosphate (PO4), Dissolved Organic Carbon (DOC), and chloride (Cl). Nutrient samples were frozen until analyses were performed.
Bacterial Analyses Samples for bacteria analyses were also collected for each sampling event. Analyses were completed at the ECU Environmental Health Sciences Water Laboratory. Bacteria samples were collected in sealed polyethylene terephthalate (PET) bottles and were analyzed for total coliform and E. coli. Samples were diluted (dilution factors of 10:100) before preparation and incubation because of anticipated high concentrations. Samples were prepared and incubated within 6 hours of collection. Samples were analyzed for total coliform and E. coli using the IDEXX Colilert substrate with Quantitray 2000 for most probable number (MPN) determination. The sample trays were incubated at 35°C for 24 hours and wells which illuminated yellow under laboratory lights were recorded as positives for total coliform. Tray wells that illuminated under a black light were recorded as positives for E. coli.
Metals Analyses Samples were collected of baseflow on August 24, 2015 and storm flow on September 25, 2015 for metals analyses (Copper (Cu), Lead (Pb), and Zinc (Zn)) at SC 1, 3, and 5. The sample analyses were performed by Environment One Laboratories, Inc. in Greenville, NC using EPA method 200.7 for Cu and Zn, and Standard Method 3113B-04 for Pb.
Isotope Analyses Storm flow samples were collected for isotope analyses on September 25, 2015. These samples will be analyzed at the University of California at Davis for N15 and O18 in NO3. These data will provide information on the sources of nitrogen entering SC. Samples were sent to UC Davis in December.
In Stream Measurements In stream water quality readings for temperature, specific conductivity, conductivity, dissolved oxygen concentration, and pH were measured using calibrated YSI 556 MPS sensors. Turbidity was measured using a HACH 2020we turbidimeter.
At each site, field sampling sheets were completed to record field meter readings, sample identification numbers, location of any photos, arrival and departure time, and relevant other notes. Field sheets were scanned and stored electronically.
Monitoring Sites
Three sites (SC 2, SC 5, and SC 6) were also selected as water level monitoring sites. At each monitoring site, Onset HOBO Water Level Data Loggers (U20-001 or U20L-01) were deployed to record and collect pressure every 30 minutes. Readings were corrected for atmospheric pressure fluctuations to estimate water level records. Staff gauges were also installed at each location. Stage was monitored at these sites during the period of January 9 through October 14, 2015.

8
Discharge was calculated from stage records using stage-discharge rating curves. Stage and discharge were measured on nine occasions during the monitoring period. Flow meters were used to measure the flow velocity across the stream cross-section. The cross-section area was estimated by measuring equally spaced depths across the channel width. Discharge was calculated as the product of the average flow velocity and cross-sectional area. Staff gauge water levels were also recorded and used to correct water level records as necessary.
The stage-discharge rating curves took the form of Q = C*(sn), where Q is the discharge (cfs), s is the stage (ft.), and C and n were values determined by linear regression. Rating curves were developed by linear regression of discharge and stage on log-log plots. Rating curve equations are listed in the Appendix.
These three sites were also instrumented with conductivity loggers. Conductivity can be used in place of direct measurement of other water quality parameters and at a much lower cost to record changes in water quality over time. Each site was instrumented with an Onset HOBO Fresh Water Conductivity Data Logger (U24-001) and set to record every 30 minutes.
Longitudinal Surveys
Two longitudinal surveys were conducted (April 15 and August 24) during base flow conditions along the main stem and tributaries of SC. These surveys were conducted to provide a finer spatial resolution of water quality variation along SC. Any significant changes along SC could detect where sources of water quality impairment may be entering. A total of 24 sites, including the 5 sampling sites and 11 additional sites, were included in these surveys (Figure 3). At each site, a YSI 556 MPS was used to measure temperature, specific conductivity, dissolved oxygen, and pH, while turbidity was measured using a LaMotte 2020we turbidimeter. At each site, field sampling sheets were completed to record field meter readings, sample identification numbers, location of any photos, arrival and departure time, and relevant other notes. Field sheets were scanned and stored electronically.

9
Figure 3. Swift Creek sampling and monitoring sites (SC 1-7, 9, 10; orange target symbols) and longitudinal sampling sites (1-16; green dots)

10
RESULTS AND DISCUSSION
Stream Flow
During the monitoring period (October 2014 - September 2015), baseflow was generally elevated during the late fall, winter, and early spring. During late spring, summer and early fall, baseflow was typically low (Figure 4). Data from the SC5 (Figure 4) is representative of discharge fluctuations at SC2 and SC6, included in Appendix A. Flow at SC6 was greater than at SC5 due to the larger watershed area, while flow at SC2 was less than at SC5 due to a smaller watershed area. Based on the discharge data, the October 2014 and February 2015 baseflow sampling events were during periods with greater baseflow and the April and August 2015 events were during periods of lower baseflow, presumably this could result in less dilution of non-point source contaminants on these dates.
Figure 4. Swift Creek discharge data collected at station SC5 compared to precipitation inputs over the course of the study. Baseflow and storm flow monitoring dates are indicated by blue and red arrows, respectively.
2014 / 2015

11
Water Quality
Turbidity Turbidity is an indicator of water clarity and serves as a metric for suspended sediment and colored dissolved organic matter. The NC standard for turbidity in surface waters is 50 NTU (instantaneous) or 25 NTU (10 day average). Turbidity measurements exceeded 50 NTU at five sites, SC 3-7 during one event (November 24). The turbidity measurements were between 25 and 50 NTU on five other storm flow and three baseflow sampling events. All longitudinal measurements were less than 20 NTU. In general, median turbidity values at each site increased during storm flows compared to baseflow (Figure 5). This is likely related to the increase in suspended sediments that commonly occurs during storm flow events. In addition, flushing of organic rich waters from riparian wetlands can also increase turbidity during storm events in coastal plain streams
Median storm flow turbidity at SC1 and SC2 were both 22 NTU. Runoff from active urban development in the headwaters upstream of SC 1 and SC 2 is likely mobilizing sediments into SC. Downstream, median storm flow turbidity increased from 13 NTU at SC3 to 24 NTU at SC 7. Agricultural runoff between SC 5 and SC 7 is likely the cause of increased turbidity at these downstream locations.
Baseflow turbidity measurements tended to decline downstream as shown by medians in Figure 5 and longitudinal survey measurements in Figure 6. . During the longitudinal surveys, there was a great deal of variability in baseflow turbidity measurements for the August sampling event (Figure 6), which may be related to increased algal growth during summer months at certain sites.

12
Figure 5. Box and whisker plots of turbidity measurements collected during baseflow (B) and storm or wet weather (W) flow conditions. Instantaneous turbidity limit of 50 NTU displayed for reference.
Figure 6. Swift Creek turbidity data collected during longitudinal surveys.
Outfalls All Sites
50 NTU
On Swift Creek North South
Towards Neuse River
Headwaters
Towards Neuse River Headwaters

13
Total Suspended Solids Storm flow TSS concentrations were generally higher than baseflow TSS values at each site, and storm flow medians were greater than corresponding base flow medians at each site (Figure 7). Although there is not a standard for most streams, NC has a TSS standard for high quality waters set at 20 mg/l. All but one baseflow sample had TSS concentrations less than this standard, while TSS concentrations during two storms exceeded 20 mg/l at nearly all in-stream sites, but only one site (SC2) exceeded 20 mg/l for the remaining two storms. The main pattern observed in TSS data was elevated TSS during storm events, with the greatest concentrations at SC5 and SC6, where TSS during storm events could be elevated to greater than 1000 mg/l (Figure 7). The two outfalls each exceeded 20 mg/l during three storms, while baseflow concentrations were typically lower.
Figure 7. Swift Creek total suspended solids data collected during baseflow (B) and storm or wet weather (W) flow conditions. SC 9 and SC10 are outfalls. The 20 mg/l for TSS in High Quality Waters is shown for reference.
Dissolved Organic Carbon Dissolved Organic Carbon (DOC) does not have a water quality criteria. It is produced by the decomposition of organic substances, commonly in streams or wetlands. Dissolved organic carbon (DOC) was relatively low in headwaters baseflow samples, and generally increased downstream, particularly between stations SC5 and SC7 (Figure 8). At most sites, there was an increase in DOC during storm events. This indicates a stormwater-related source which could include flushing of organics from wetlands and riparian areas, although leaking wastewater infrastructure may be a contributor as well.
Outfalls All Sites
On Swift Creek North South
Towards Neuse River
Headwaters
20 mg/l

14
Figure 8. Swift Creek dissolved organic carbon concentration data collected during baseflow (B) and storm or wet weather (W) flow conditions. SC 9 and 10 are outfalls.
Specific Conductivity Specific conductivity provides an indication of the concentration of dissolved ions in the water. It can also be used to indicate significant changes in water chemistry such as from wastewater or road salts. Chloride (Cl) is a primary ion in common salts. Since fluctuations of Cl concentrations and SC measurements were nearly identical, Cl results are included in Appendix C.
Median base flow specific conductivity values were greater for base flow than storm flow for all sites. Conductivity logger plots for SC2, SC5, and SC6 (included in Appendix B) generally showed a similar pattern of a sharp spike in conductivity at the beginning of storm events, followed by a sharp decrease as storm events extended, and increasing towards an equilibrium value following events as the end of the storm hydrograph and interflow taper off.
Conductivity values were generally less than 0.10 mS/cm throughout the record, except during a period in late January and March at SC 6, following road salt applications in Pitt County due to ice and snow events. Base flow conductivities decreased noticeably from late winter into summer before rising in the fall. This was likely due to agricultural drainage inputs fluctuating with groundwater elevation changes. Agricultural drainage made up a greater proportion of baseflow during the winter and late fall than in the summer. During the winter months, increased drainage transports leached dissolved
Outfalls All Sites
On Swift Creek North South
Towards Neuse River
Headwaters

15
ions from fields, whereas in a lower water table during the summer reduced drainage flows and transport of drainage.
In general, the stormwater outfalls had the most variable data. There was a subtle increase in median specific conductivity values when comparing the forested and urbanized headwater reach (SC1) vs the farthest downstream reach (SC7) during baseflow and storm flow conditions (Figure 9). During the longitudinal surveys (Figure 10), the comparison between the wetter and cooler April sampling data and the drier and warmer August sampling dates, suggests a slight difference in dilution occurs seasonally related to seasonal variations in groundwater recharge, most noticeable upstream of SC5.
Figure 9. Swift Creek specific conductivity data collected during baseflow (B) and storm or wet weather (W) flow conditions. SC 9 and 10 are outfalls.
Outfalls All Sites
On Swift Creek North South
Towards Neuse River
Headwaters

16
Figure 10. Swift Creek specific conductivity data collected during longitudinal surveys.
Total Dissolved Nitrogen Nitrogen is an essential nutrient in the environment and can be transformed between different species through biological processes. Total Dissolved Nitrogen (TDN) includes Ammonium (NH4), Nitrate and Nitrite (NO2+3), and more complex dissolved forms of cumulatively referred to as Organic Nitrogen (ON). TDN concentrations for base flows and storm flows are summarized in Figure 11. Based on guidelines already developed in Florida, their criteria for TDN in streams ranges between 0.67-1.87 mg/l depending on the region. Median baseflow and storm flow concentrations exceeded 0.67 mg/l for all sites except SC 1 and SC 10 during baseflow, although only one sample exceeded 1.87 mg/l (Figure 11). Generally, ammonium concentrations were relatively low (<0.25 mg/l at all sites/dates; see Appendix C for data plots), while nitrate was the dominant form of inorganic nitrogen found in Swift Creek samples (typically >0.25 mg/l).
Median storm flow concentrations were typically greater than baseflow concentrations for all in-stream and outfall sampling sites (Figure 11). Storm flow and baseflow concentrations were less variable for instream samples from sites upstream of SC 6 and had similar baseflow and storm flow trends. Concentrations tended to increase from the headwater sites, SC 1 and SC 2, towards SC 3. Higher concentrations from a tributary, SC 4, corresponded with slightly higher concentrations at SC 5 than upstream at SC 3. Baseflow and storm flow concentrations were similarly variable at SC 6 for baseflow and storm flow, increasing slightly from SC 5. Baseflow concentrations at SC 7 were greater than SC 6, however, storm flow concentrations slightly lower than at SC 6. Baseflow
Towards Neuse River Headwaters

17
concentrations were greater for the February and April samplings than the August and October samples. This corresponded with changes in specific conductivity and corresponds with grater transport of TDN during periods with higher water tables and increased agricultural drainage.
Nitrate and Nitrite Nitrate & nitrite (NO2+3) concentrations for base flows and storm flows are summarized in Figure 12. Reference streams (undisturbed, forested watersheds) in the southeastern Coastal Plain generally have nitrate concentrations below 0.3 mg/l (EPA, 2000), in contrast SC sites typically had nitrate concentrations greater than 0.3 mg/l indicating anthropogenic nitrate inputs are affecting downstream waters. The nitrate concentrations during baseflow conditions generally increased with distance downstream from headwaters (Figure 12), and median storm flow concentrations were less than base flow concentrations. At the lower portions of the study watershed, median nitrate concentrations were > 1 mg/l (SC 6 & SC 7) with the highest median concentration of 1.90 mg/l at an outfall, SC 10. The greatest base flow concentrations at each in-stream site occurred in February. Elevated concentrations were likely due to increased agricultural drainage during a period when groundwater levels were likely highest of all base flow sampling dates. These data and the general decline in nitrate
Outfalls All Sites North South
Towards Neuse River Headwaters
0.67 mg/l
On Swift Creek
Figure 11. Swift Creek total nitrogen concentration data collected during baseflow (B) and storm flow or wet weather (W) conditions. SC9 and SC10 are stormwater outfalls. The guideline concentration of 0.67 mg/l of TDN for Florida is shown for reference.

18
concentration during storm flow events indicate that groundwater transport of nitrate to the channel results in increasing concentrations downstream.
Figure 12. Swift Creek nitrate concentration data collected during baseflow (B) and storm or wet weather (W) flow conditions. SC 9 and 10 are outfalls. The estimate of 0.3 mg/l for nitrate in undisturbed coastal plain forests is shown for reference.
15N and 18O Isotopes in NO3
To help identify the source of NO2+3 during storm flows, samples from each site were collected on August 24 (base flow) and September 25 (storm flow) at each site for analyses of 15N and 18O isotopes in NO3. Since N in fertilizer is typically derived from atmospheric N, which is the reference standard used for 15N, 15N in nitrate derived from fertilizer is typically found at low levels (depleted) and the 15N composition of fertilizer should be close to 0 (Kendall et al. 2007). Since denitrifying bacteria reduce and remove nitrate from surface waters, and the bacteria preferentially remove the lighter 14N, the remaining nitrate becomes enriched with 15N. Similarly 18O becomes enriched as denitrification occurs. Therefore, as waters with nitrate experience denitrification the 15N and 18O become enriched in the nitrate pool remaining in the water. This means that samples with 15N values that are enriched may also suggest a nitrate source that was initially less enriched, if denitrification occurred as the nitrate cycled through the watershed. This trend is shown indicated by the denitrification arrow in Figure 13.
Outfalls All Sites
On Swift Creek North SouthTowards
Neuse River Headwaters
0.3 mg/l

19
Figure 13. 15N and 18O isotopes in nitrate measured at sampling stations along Swift Creek (SC) and Greens Mill Run (GMR) overlain on the source ranges (shaded) presented by Kendall et al. (2007). Sample collection for isotopic analyses occurred on 8/24//2015 (baseflow) and 9/25/2015 (storm flow). A: Fertilizer 15N 25-75th per centile range measured under crop fields and golf courses in eastern North Carolina (Spruill et al. 2002). B: Waste 15N 25-75th percentile range measured under septic drainfields, poultry, and hog farms in eastern North Carolina (Spruill et al. 2002, Iverson et al. 2015).
In Figure 13, the majority of samples fall in the range corresponding to soil and waste sources provided by Kendall et al. (2007). The ranges for nitrate sources from Kendall et al. (2007) are based on a broad range of data sources. Although the general ranges presented by Kendall et al. (2007) may represent the initial fertilizer sources in eastern North Carolina, it appears that there may be an offset as the nitrate sourced from fertilizer migrates through the soils, to the groundwater, and ultimately to a stream or wetland. Local work by Spruill et al. (2002) provided a tighter range of 15N values for groundwater underlying croplands and golf courses (most fertilizer sources had 15N from 4-10 o/oo) and underlying septic, poultry, and hog waste (most waste sources had 15N from 10 to 22 o/oo). Spruill et al. (2002) used a cutoff for 15N of 10 o/oo to discriminate between fertilizer and waste sources. In addition, Iverson et al. (2015) measured septic drainfield 15N in Pitt County and their median 15N value for 8 measurements was approximately 18 o/oo for groundwater and 11 o/oo for streams adjacent to septic systems. Recent work in Beaufort County by O’Driscoll et al. (2014) traced a septic plume and found that wastewater-affected groundwater was indicated by 15N compositions of approximately 10 o/oo or greater. Overall, these regional datasets suggest that wastewater in eastern NC tends to be on the enriched side of the range provide by Kendall et al. (2007), generally > 10 o/oo 15N-NO3. The study by Spruill et al. (2002) measured 15N in groundwater of the North Carolina Coastal Plain. Their data showed enriched fertilizer 15N relative to the ranges provided by Kendall and others (2007). It is likely that the enrichment that occurs between fertilizer application and transport to the groundwater (presumably linked to denitrification or mixing with more enriched soil N or wastewater sources) can explain this offset. We included the Spruill
A B

20
et al. (2002) data in Figure 13, as those may provide a tighter range for comparison with regional 15N data. Based on these data, the 15N range of our current study samples during late summer and early fall suggest fertilizer or soil N as the dominant source of nitrate in SC. However, wastewater influences could not be ruled out because when mixed with fertilizer or soil N sources, wastewater sources would tend to enrich samples and there were locations where enrichment was observed, particularly within Swift Creek.
To evaluate if mixing or denitrification is the mechanism for enrichment of 15N, a plot of NO3-N vs 15N-NO3 can provide insights. If denitrification is the mechanism for 15N enrichment, then an inverse relationship is expected between NO3-N and 15N, whereas if mixing with enriched sources of 15N is the mechanism then 15N would increase with increasing NO3-N concentrations. These plots are shown in Figure 14 and suggest that that enriched 15N compositions in surface water are more likely related to mixing with enriched sources rather than denitrification along the channel. The pattern of similar 15N across the SC watershed during baseflow conditions suggests a similar source of nitrates during baseflow (Figure 14).
Figure 14. Nitrate (NO3-N) vs δ15N for SC for the baseflow (8/24/15) and storm (9/25/15) events.

21
For Swift Creek, some results are closer to the range of potential waste sources provided by Kendall et al. (2007). However, those samples do not fall in the regional range provided by Spruill et al. (2002). Most of Swift Creek watershed is served by septic systems. Therefore it is expected that wastewater nitrogen inputs to streams may occur in the Swift Creek watershed. Site SC4 in particular had nitrate with enriched 15N, relative to the others. More monitoring and a comparison of septic vs. sewered neighborhoods could help further determine the wastewater-related N-inputs. These and other data suggest that the Swift Creek tributary upstream of the SC4 monitoring point is causing increases in nitrogen along the main stem. Efforts to reduce contaminants along this tributary would likely improve water quality along the main stem.
Based on median values for baseflow (7.94 15N-NO3 o/oo, 7.83 18O-NO3 o/oo), the 15N during baseflow along SC falls within the range of fertilizer (Spruill et al., 2002) or soil nitrogen (Kendall et al., 2007). From headwaters to the bottom of the watershed there was a subtle increase in 15N and 18O in nitrate during baseflow (Figure 15) and storm flow (Figure 16), suggesting some potential denitrification along the stream. The baseflow 18O in nitrate from SC2 was elevated (Figure 15), suggesting either lab error or a contrasting groundwater source from the other sites. However, since similar enrichment was observed during the storm event (Figure 16), it is unlikely that the enrichment was related to lab error.
Figure 15. SC δ15N and δ18O in nitrate trends from headwaters to lowest monitoring point during baseflow.

22
During the storm event, there was a slight decline in 15N and enrichment in 18O from headwaters to SC3, suggesting stormwater inputs (Figure 16). The enrichment in 15N at SC4 suggests potentially enriched inputs, possibly wastewater (previously discussed). These data suggest mixing of multiple N sources during the storm event. The effects of stormwater inputs on Swift Creek are less pronounced relative to those observed on Greens Mill Run.
Figure 16. SC δ15N and δ18O in nitrate trends from headwaters to lowest monitoring point during storm flow.
Along Swift Creek, nitrate concentrations were most elevated at SC4, both during the baseflow event and the storm event. During baseflow conditions, chloride concentrations were similar at monitoring stations (Figure 17). During the storm event, differences in chloride concentration between the monitoring sites and outfall (10) became more pronounced, presumably due to dilution effects (Figure 18).

23
Figure 17. Nitrate and chloride concentrations along SC during baseflow event.
Figure 18. Nitrate and chloride concentrations along SC during storm event.

24
Overall, the data presented suggest that fertilizer and soil nitrogen inputs are likely the dominant nitrogen sources. However, more detailed year-round surface water and groundwater isotopic monitoring would be needed to better isolate the dominant sources with greater certainty. Since the isotopic sampling was only conducted for one baseflow and one storm event during the summer, it is likely that there is seasonal and intra-storm variability in isotopic composition, further isotopic sampling could help better elucidate the major sources of nitrate inputs to these streams.
Organic Nitrogen Organic Nitrogen (ON) was relatively low in baseflow samples, but in contrast to nitrate it increased during runoff events (Figure 19). In some cases, during storm events ON was the dominant form of dissolved nitrogen in the stream. This indicates a stormwater-related source which could include flushing of organics from wetlands and riparian areas, and possibly leaking wastewater infrastructure. Although NC doesn’t currently have a standard for nitrogen in streams, nitrogen criteria are being developed for the future.
Figure 19. Swift Creek organic nitrogen concentration data collected during baseflow (B) and storm or wet weather (W) flow conditions. SC9 and SC10 are outfalls.
Total Dissolved Phosphorus Phosphorus is an essential nutrient in the environment as well and in excess can lead to algal blooms and eutrophication. Total Dissolved Phosphorus (TDP) includes phosphate (PO44) and other forms of soluble phosphorus. Based on guidelines already developed in Florida, criteria for TDP in streams range between 0.06 - 0.49 mg/l depending on the region. TDP along Swift Creek was generally lower during baseflow and typically increased during storm events. Based on guidelines already developed in Florida, criteria for TDP in streams ranges between 0.06-0.49 mg/l, depending on the region.
Outfalls All Sites
On Swift Creek North SouthTowards
Neuse River Headwaters

25
Along Swift Creek, during baseflow most sites had TDP concentrations that fell below or on the low end of this range, however as the watershed area increases downstream, most sites showed an increase in TDP concentrations, particularly during storm events. At all stream sites TDP was elevated above 0.06 mg/l during at least one storm event (Figure 20).
Figure 20. Swift Creek total dissolved phosphorus concentration data collected during baseflow (B) and storm or wet weather (W) flow conditions. SC9 and 10 are outfalls. The guideline of 0.06 mg/l for TDP for Florida is shown for reference.
Dissolved Oxygen North Carolina water quality standards (15A NCAC 2B) for dissolved oxygen for freshwater aquatic life is 5 mg/l (daily average), however there is no standard for streams classified as swamp waters. At SC 1, 2, 4, 6, and 7 dissolved oxygen was less than 5 mg/l on at least one date (Figure 21). The effects of low flows and warmer air temperatures on dissolved oxygen are evident in the longitudinal survey data (Figure 22). During the August longitudinal survey, most sites downstream of SC5 had dissolved oxygen concentrations below 5 mg/l. Low gradients, low streamflow, and warm temperatures can contribute to increased likelihood of low oxygen conditions in summer months. In addition, increased algal growth and decomposition can lead to dissolved oxygen declines.
Outfalls All Sites
On Swift Creek North SouthTowards
Neuse River Headwaters
0.06 mg/l

26
Figure 21. Swift Creek dissolved oxygen data collected during baseflow (B) and storm or wet weather (W) flow conditions. SC9 and 10 are outfalls. The NC standard daily average DO concentration of 5 mg/l is shown for reference.
Figure 22. Swift Creek dissolved oxygen data collected during longitudinal surveys. The NC standard daily average DO concentration of 5 mg/l is shown for reference.
Outfalls All Sites
On Swift Creek North SouthTowards
Neuse River Headwaters
5.0 mg/l
5.0 mg/l
Towards Neuse River Headwaters

27
E. Coli & Total Coliform E. coli is a species of fecal coliform bacteria used to indicate the presence of waste. The NC standard for E.Coli in Class C waters is 576/100 ml or 102.8. Analysis was mostly focused on E. coli, as that is the US EPA (1986) recommended indicator bacteria for fresh waters. As expected, total coliform concentrations were elevated relative to E. coli concentrations for each sampling location during baseflow and storm flow conditions. Total coliform concentrations were significantly higher (p = 0.0003) during baseflow and storm flow (p =0.0000) than E. coli concentrations.
Storm flow E. coli concentrations were elevated relative to baseflow E. coli concentrations for 6 of the 7 sampling locations along SC (Figure 23). Statistically significant differences (p = 0.0026) were observed when comparing E. coli concentrations for all baseflow samples (geometric mean = 151 MPN/100 mL or log10 = 2.178) to all storm flow samples (geometric mean = 487 MPN/100 mL or log10 = 2.687). Similar trends were found regarding total coliform concentrations (Figure 24). More specifically, the total coliform concentrations were elevated during storm flow conditions (geometric mean = 2,756 MPN/100 mL or log10 = 3.440) relative to baseflow conditions (geometric mean = 2,488 MPN/100 mL or log10 = 3.396) for all sampling locations, and the differences between the baseflow and storm flow samples were statistically significant (p = 0.0102).
SC-SSC-B
SC7-SSC7-B
SC6-SSC6-B
SC5-SSC5-B
SC4-SSC4-B
SC3-SSC3-B
SC2-SSC2-B
SC1-SSC1-B
5
4
3
2
1
0
E. c
oli (
Log1
0 M
PN/1
00 m
L)
Figure 23. Baseflow (B) and storm (S) or wet weather flow E. coli concentrations for Swift Creek along 7 sampling locations (1-7), and the pooled data (SC-B, SC-S). The NC standard for E. coli of 578/100 ml (102.8/100 ml) is shown for reference.
578 (or 102.8)/100 ml

28
SC-SSC-B
SC7-SSC7-B
SC6-SSC6-B
SC5-SSC5-B
SC4-SSC4-B
SC3-SSC3-B
SC2-SSC2-B
SC1-SSC1-B
5
4
3
2
1
0Tota
l Col
iform
(Log
10 M
PN/1
00 m
L)
Figure 24. Swift Creek baseflow (B) and storm (S) or wet weather flow total coliform concentrations along 7 sampling locations (1-7), and the pooled data (SC-B, SC-S).
There is subtle evidence in the increasing E. coli with chloride and nitrate along Swift Creek during the storm event (Figure 25). These together may indicate wastewater as a source. In addition, the E. coli concentrations in Swift Creek during baseflow conditions typically increased along the main stem of the creek from SC 1 to SC 7. Notably, concentrations on two tributaries, SC2 and SC4, were higher than concentrations at monitoring sites on the main stem but upstream of the confluences, SC1 and SC5, respectively. The drainage areas upstream of SC2 and SC4 have substantial residential development, generally more than other areas within the watershed. Pet waste or poorly functioning septic systems could be contributing to elevated E. coli in these areas.
When temperatures are warmer, bacteria grow more quickly, and animals are more active and may contribute more waste to streams. Baseflow E. coli concentrations were lowest during the February sampling event (geometric mean = 35 MPN/100 mL or log10
= 1.542), and highest during the October event (geometric mean = 1,079 MPN/100 mL or log10 = 3.033). The August and April sampling events yielded intermediate E. coli concentrations with 97 MPN/100 mL (log10 = 1.985) and 142 MPN/100 mL (log10 = 2.151), respectively. E. coli concentrations were significantly higher in October relative to February (p = 0.0020), April (p = 0.0021), and August (p = 0.0021). The geometric mean E. coli concentrations during storm flow were lowest in February (85 MPN/100 mL or log10 = 1.929), followed by July (612 MPN/100 mL or log10 = 2.786), September (678 MPN/100 mL or log10 = 2.831) and November (1,591 MPN/100 mL or log10 = 3.202). Storm flow E. coli concentrations in February were significantly lower than in November (p = 0.0017), July (p = 0.0130) and September (p = 0.0017).

29
Figure 25. E.Coli, Cl, and NO3 during the storm flow event sampled on 9/25/2015. From Swift Creek headwaters (1) to lowest monitoring station downstream (7).
Metals All results of metals analyses (Table 3) were below detection for Copper and Lead, with Zinc concentrations only above detection at SC1 (both samples) and SC3 (storm flow). The NC water quality standard for Zn in freshwaters is 50 ug/l (ppb). Table 3. Analytical results of metals analyses on baseflow and storm or wet weather flow samples.
Monitoring Site
Baseflow Storm (Wet Weather) Flow
8/24/2015 9/25/2015
Copper (μg/l) Lead (μg/l) Zinc (μg/l) Copper (μg/l) Lead (μg/l) Zinc (μg/l)
SC 1 <10 <5.0 13 <10 <5.0 11
SC 3 <10 <5.0 <10 <10 <5.0 11
SC 5 <10 <5.0 <10 <10 <5.0 <10 *Analytical method for analysis of Copper and Zinc: EPA 200.7; Analytical method for analysis of Lead: Standard Method 3113B-04.

30
CONCLUSIONS AND RECOMMENDATIONS
Several indicators suggested that pollutant and sediment inputs increased downstream. In general most water quality parameters increased as the watershed area expanded (Table 4). However, during summer dissolved oxygen decreased in the lower portions of the watershed. Overall, the water quality data suggested that urban and agricultural land-uses in the watershed have contributed non-point source pollution resulting in increases in nutrient, sediment, and bacteria inputs to Swift Creek. Most water quality parameters, with the exception of nitrate and dissolved oxygen, increased with storm flow; suggesting that improved stormwater management could help reduce water quality impairment. The nitrate decline during storm events suggests a groundwater source of nitrate. Presumably this is related to agricultural fertilizer inputs as the increases correspond to the lower portions of the watershed that contain extensive agricultural drainage which are most evident during winter when agricultural drainage increases due to the shallower water table.

31
Table 4. General water quality trends associated with stormwater inputs and distance downstream. NC water quality standards are indicated with an asterisk.
Runoff Events
Downstream Standard* or Guideline Level
Standards or Guidelines Exceeded
Specific Conductivity
n/a n/a
Dissolved Oxygen
5 mg/l* Yes
Turbidity 50NTU* Yes
Total Suspended Sediment
20 mg/l Yes
Nitrate 0.3 mg/l Yes
Dissolved Organic Nitrogen
n/a n/a
Total Dissolved Nitrogen
0.67 mg/l Yes
Total Dissolved Phosphorus
0.06 mg/l Yes
Dissolved Organic Carbon
n/a n/a
E. Coli 576/100ml* Yes
Total Coliform n/a n/a
summer
storm
storm
baseflow

32
REFERENCES Iverson, G., O'Driscoll, M., Humphrey, C., Manda, A., and Anderson-Evans, E.
Wastewater nitrogen contributions to coastal plain watersheds, North Carolina, USA. Water, Air, and Soil Pollution Oct. 226-325.
Kendall, C., Elliott, E.M., and Wankel, S.D., 2007. Tracing anthropogenic inputs of nitrogen to ecosystems, Chapter 12, In: R.H. Michener and K. Lajtha (Eds.), Stable Isotopes in Ecology and Environmental Science, 2nd edition, Blackwell Publishing, p. 375-449
National Centers for Environmental Information (NCEI). 2015. Summary of Monthly Normals 1981-2010, Greenville, NC; GHCND:USC00313638. National Oceanic and Atmospheric Administration, National Centers for Environmental Information, Asheville, NC.
North Carolina Department of Environmental Quality. 2015a. Administrative code sections 15A NCAC 2B .200-Classifications and Water Quality Standards Applicable to Surface Waters and Wetlands of N.C. Division of Water Resources, Raleigh, NC.
North Carolina Department of Environmental Quality. 2015b. River Basin Schedules of Assigned Classifications for Surface Waters: Tar-Pamlico. http://portal.ncdenr.org/web/wq/ps/csu/classifications Accessed: December 21, 2015.
O’Driscoll, M., Clinton, S., Jefferson, A., Manda, A., and McMillan, S. 2010. “Urbanization effects on watershed hydrology and in-stream processes in the Southern US.” Water. 2:605-648.
O’Driscoll, M., Humphrey, C., Deal, N., Lindbo, D. and Zarate-Bermudez, M. 2014. Meteorological influences on nitrogen dynamics of a coastal onsite wastewater treatment system. Journal of Environmental Quality 43(6):1873-85.
Spruill, T., Showers, W., and Howe, S. 2002. Application of classification-tree methods to identify nitrate sources in ground water. Journal of Environmental Quality 31(5):1538-1549.
Sun, G., McNulty, S. G., Amataya, D. M., Skaggs, R. W., Swift Jr., L. W., Shephard, J. P., and Riekerk, H. 200. “A comparison of the watershed hydrology of coastal forested wetlands and the mountainous uplands in the Southern US.” J. Hydrology. 263:92-104.
United States Environmental Protection Agency (EPA). 1986. Ambient Water Quality Criteria for Bacteria; EPA440/5–84–002; USEPA: Washington, DC, USA.
Winner, M. D., and Coble, R. W. 1996. “Hydrogeologic Framework of the North Carolina Coastal Plain”. USGS Professional Paper 1404-1. Washington, DC.

33
APPENDICES
APPENDIX A: Rating Curves and Discharge Records
Rating Curves
Rating curve equations for SC 2, SC 5, and SC 6 are listed below. Table A1. Rating curve coefficients (Q = C*hn) for the three stage monitoring sites.
Station Rating Curve Coefficients
C n
SC 2 2.84 1.84
SC 5 14.99 1.93
SC 6 5.53 2.96
Discharge Records
Figure A1. Discharge record for SC 2 monitoring site (January 9 - October 14, 2015).

34
Figure A2. Discharge record for SC5 monitoring site (January 9 - October 14, 2015).
Figure A3. Discharge data for SC6 monitoring site (January 9 - October 14, 2015). Gaps in data resulted from improper configuration of logger.

35
APPENDIX B: Conductivity Records
A conductivity logger was initially installed at SC2. However, the logger was initially configured to log conductivity every 30 seconds, rather than every 30 minutes. In May, the logger was no longer recoverable from the stilling well at the monitoring station and was not replaced.
Figure B1. Conductivity Record for SC2 (January 9 - May 6, 2015).

36
Figure 26. Conductivity record for SC5 (January 9 - October 14, 2015).
Figure B3. Conductivity record for SC6 (January 9 - October 14, 2015).

37
APPENDIX C: Water Quality Measurements and Concentrations
Temperature
Figure 27. Box and whisker plots of Temperatures recorded for base (B) and storm or wet weather (W) flows. SC-B and SC-W are combined for all base and storm flow values, respectively.
Figure C28. Temperature readings from longitudinal surveys on Swift Creek.

38
Dissolved Oxygen Saturation
Figure 29. Box and whisker plots of Dissolved Oxygen (% Saturation) recorded for base (B) and storm or wet weather (W) flows. SC-B and SC-W are combined for all base and storm flow values, respectively.
Figure 30. Dissolved Oxygen (% Saturated) readings from longitudinal surveys on Swift Creek.

39
pH
Figure C5. Box and whisker plots of pH recorded for base (B) and storm or wet weather (W) flows. SC-B and SC-W are combined for all base and storm flow values, respectively.
Figure C6. pH readings from longitudinal surveys on Swift Creek.

40
Chloride
Figure C7. Box and whisker plots of chloride concentrations for base (B) and storm or wet weather (W) flows. SC-B and SC-W are combined for all base and storm flow values, respectively.
Ammonia
Figure 31. Box and whisker plots of ammonia concentrations for base (B) and storm or wet weather (W) flows. SC-B and SC-W are combined for all base and storm flow values, respectively.
Copyright © 2022 FDOKUMEN