SUMMARY HYDROLOGIC MODELING REPORT Shultz Fire ...
36
SUMMARY HYDROLOGIC MODELING REPORT Shultz Fire Drainage Master Plan Prepared for: Coconino County Department of Public Works Attn. Randy Ryan, PE, CFM (Original Report; 12-1-10) By: Civiltec Engineering, Inc. Chris Dusza, P.E., C.F.M. [email protected] 9299 W. Olive Avenue, Ste. 405 Peoria, AZ 85345 Phone (623) 582-0970 Fax (623) 582-1973 Cell (623) 826-4262 Expires 3-31-2013
-
Upload
khangminh22 -
Category
Documents
-
view
0 -
download
0
Transcript of SUMMARY HYDROLOGIC MODELING REPORT Shultz Fire ...

SUMMARY HYDROLOGIC MODELING REPORT
Shultz Fire Drainage Master Plan
Prepared for: Coconino County Department of Public Works Attn. Randy Ryan, PE, CFM (Original Report; 12-1-10) By: Civiltec Engineering, Inc. Chris Dusza, P.E., C.F.M. [email protected] 9299 W. Olive Avenue, Ste. 405 Peoria, AZ 85345 Phone (623) 582-0970 Fax (623) 582-1973 Cell (623) 826-4262
Expires 3-31-2013

Table of Contents I. Introduction ................................................................................................................. 1
Figure 1. Study Area ................................................................................................... 2 II. Hydrologic Modeling ............................................................................................... 3
1. Rainfall-Runoff Model ............................................................................................. 3 2. Drainage Basin Delineation ..................................................................................... 3
Table 1. Basin Drainage Area Data ........................................................................... 4 3. Precipitation Data..................................................................................................... 5
Table 2. Upper Elevation Precipitation Depths .......................................................... 6 Table 3. Lower Elevation Precipitation Depths .......................................................... 6
4. Rainfall Losses ......................................................................................................... 7 Table 4. Land Use and Curve Numbers for Immediate Post Burn Condition (2010) 8 Table 5. Land Use and Curve Numbers for Anticipated Short Term Recovery Condition (2015) ......................................................................................................... 8 Table 6. Land Use and Curve Numbers for Anticipated Long Term Recovery Condition (2030) ......................................................................................................... 9
5. Channel and Storage Routing ................................................................................ 10 6. Hydrologic Modeling Results ................................................................................ 11
Table 7. Hydrologic Modeling Results – Immediate Post Burn Condition (2010) .. 11 Table 8. Hydrologic Modeling Results – Short Term Recovery Condition (2015) .. 13 Table 9. Hydrologic Modeling Results – Long Term Recovery Condition (2030) .. 15
7. Indirect Methods of Discharge Verification .......................................................... 17 Figure 2. Peak Discharge Relations and Envelope Curves ....................................... 17 Figure 3. Regional Regression Map......................................................................... 19 Table 10. Indirect Discharge Verification Results (100 yr.) ..................................... 20
III. Hydrologic Analysis Conclusion ........................................................................... 20 V. References ................................................................................................................... 21 VI. Appendix.................................................................................................................... 22

Summary Hydrologic Modeling Report – Shultz Fire Drainage Master Plan
Page 1
I. Introduction This hydrology study was recommended by the participants of the Ridgeline to Rio Summit as the first part of a Master Drainage Plan for the Timberline, Fernwood, Wupatki Trails, and Doney Park areas. These residential areas are impacted by watersheds which were burned during the Shultz Fire. The Shultz Fire burned approximately 15,000 acres (23.4 square miles) in June/July 2010. The hydrology, floodplains, and sediment yield impacting these residential areas in the post burn condition are significantly different than the pre burn condition. As the forest and watersheds begin to recover through time, the conditions are expected to improve. However, in the foreseeable future, it is expected that the watersheds will produce higher peak flow rates and sediment yields due to soil and vegetation losses within the burn area. The intent of this hydrology study is to quantify the peak flow rates impacting the study area in the immediate post burn condition (2010), at a point where some short term recovery has occurred (2015), and at a point where some longer term recovery has occurred (2030). This hydrology study provides estimates for clear flow peak flow rates only. No bulking of flows due to sediment and debris is considered. The study provides peak flow rate estimates for the 2, 10, 25, 50, and 100 year – 24 hour events. Future phases of the Drainage Master Plan should include; 1. Hydraulic Analysis 2. Sediment Transport Analysis 3. Groundwater Analysis (Cinder Lake area) 4. Drainage Solution Alternative Formulation 5. Drainage Solution Alternative Evaluation 6. Drainage Solution Construction Plan Development 7. Meetings and Coordination 8. Public Involvement.

Summary Hydrologic Modeling Report – Shultz Fire Drainage Master Plan
Page 2
Figure 1. Study Area cc
Wupatki Trails
Timberline
Fernwood
Cinder Lake
Landfill
Doney Park
SR 89
San Francisco Peaks
Summary Hydrologic Modeling Report – Shultz Fire Drainage Master Plan
Page 3
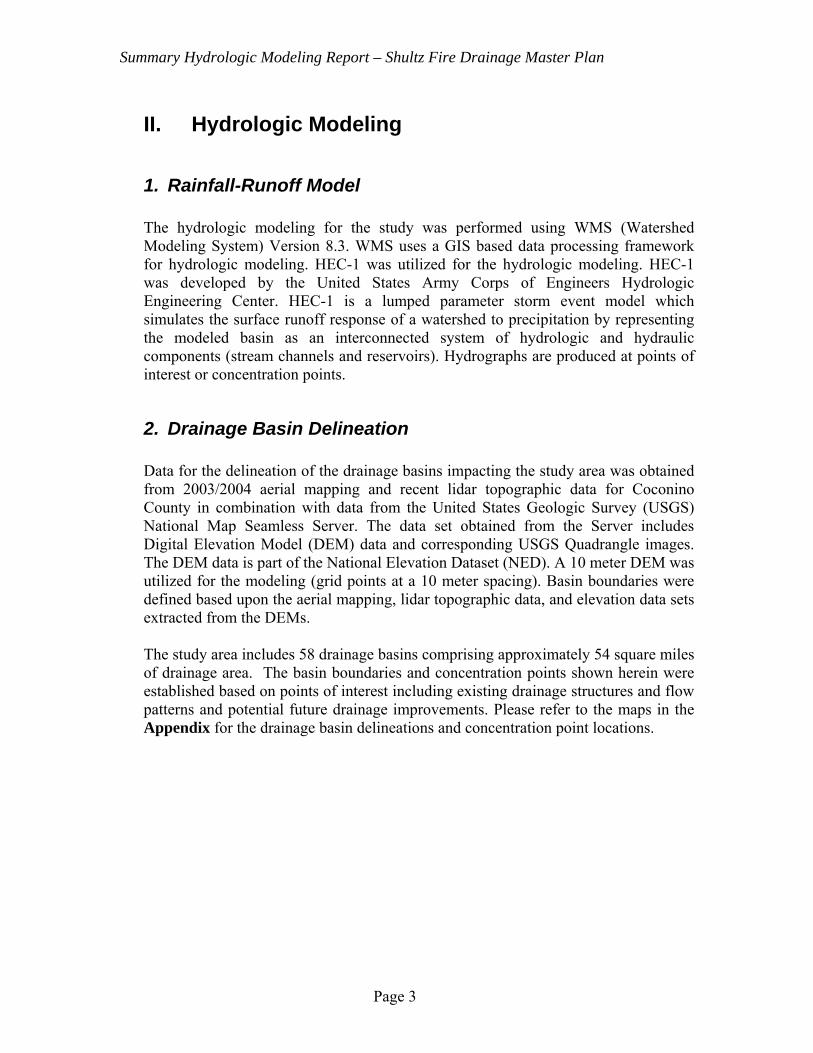
II. Hydrologic Modeling
1. Rainfall-Runoff Model
The hydrologic modeling for the study was performed using WMS (Watershed Modeling System) Version 8.3. WMS uses a GIS based data processing framework for hydrologic modeling. HEC-1 was utilized for the hydrologic modeling. HEC-1 was developed by the United States Army Corps of Engineers Hydrologic Engineering Center. HEC-1 is a lumped parameter storm event model which simulates the surface runoff response of a watershed to precipitation by representing the modeled basin as an interconnected system of hydrologic and hydraulic components (stream channels and reservoirs). Hydrographs are produced at points of interest or concentration points.
2. Drainage Basin Delineation
Data for the delineation of the drainage basins impacting the study area was obtained from 2003/2004 aerial mapping and recent lidar topographic data for Coconino County in combination with data from the United States Geologic Survey (USGS) National Map Seamless Server. The data set obtained from the Server includes Digital Elevation Model (DEM) data and corresponding USGS Quadrangle images. The DEM data is part of the National Elevation Dataset (NED). A 10 meter DEM was utilized for the modeling (grid points at a 10 meter spacing). Basin boundaries were defined based upon the aerial mapping, lidar topographic data, and elevation data sets extracted from the DEMs. The study area includes 58 drainage basins comprising approximately 54 square miles of drainage area. The basin boundaries and concentration points shown herein were established based on points of interest including existing drainage structures and flow patterns and potential future drainage improvements. Please refer to the maps in the Appendix for the drainage basin delineations and concentration point locations.

Summary Hydrologic Modeling Report – Shultz Fire Drainage Master Plan
Page 4
Table 1. Basin Drainage Area Data
Basin Drainage Area (square miles)100 0.96 101 6.92 102 8.63 103 0.12 104 0.22 105 1.01 106 0.17 107 0.57 108 0.08 109 0.14 110 0.75 111 1.00 112 0.90 113 0.51 114 0.03 115 0.25 116 0.32 117 0.16 118 0.38 119 0.59 120 0.24 121 0.19 122 0.28 123 0.06 124 0.29 125 0.10 126 0.53 127 2.58 128 2.30 129 0.48 130 0.22 131 0.34 132 0.19 133 0.65 134 0.75 135 1.95 136 0.98 137 0.79 138 0.20 139 0.06 140 0.18

Summary Hydrologic Modeling Report – Shultz Fire Drainage Master Plan
Page 5
141 0.24 142 0.18 143 0.84 144 4.84 145 2.18 146 0.04 147 1.13 148 0.45 149 0.42 150 0.04 151 1.00 152 1.50 153 0.56 154 1.06 155 0.28 156 1.27 157 0.59
Total 53.69
3. Precipitation Data
Rainfall data for the study area was obtained from the National Atmospheric and Oceanic Administration (NOAA) Atlas 14. The data was obtained using NOAA’s Hydrometeorological Design Studies Center Precipitation Frequency Data Server. The 54 square mile drainage model utilizes 2 point rainfall positional values representing the upper and lower elevations in the model. The upper elevation precipitation data was obtained at the approximate mid slope location of the San Francisco Peaks. The lower elevation precipitation data was obtained at the approximate location of SR 89.

Summary Hydrologic Modeling Report – Shultz Fire Drainage Master Plan
Page 6
Table 2. Upper Elevation Precipitation Depths
Recurrence Interval
5 min 15 min 1 hr 2 hr 3 hr 6 hr 12 hr 24 hr
2 yr 0.31 in 0.59 in 0.98 in 1.12 in 1.23 in 1.52 in 2.05 in 2.36 in10 yr 0.51 in 0.96 in 1.61 in 1.77 in 1.88 in 2.20 in 2.88 in 3.43 in 25 yr 0.64 in 1.20 in 2.01 in 2.21 in 2.31 in 2.66 in 3.39 in 4.09 in50 yr 0.74 in 1.40 in 2.34 in 2.57 in 2.66 in 3.03 in 3.79 in 4.61 in100 yr 0.86 in 1.62 in 2.70 in 2.96 in 3.06 in 3.44 in 4.21 in 5.16 in
Table 3. Lower Elevation Precipitation Depths
Recurrence Interval
5 min 15 min 1 hr 2 hr 3 hr 6 hr 12 hr 24 hr
2 yr 0.28 in 0.53 in 0.88 in 1.02 in 1.11 in 1.34 in 1.69 in 1.87 in10 yr 0.46 in 0.87 in 1.45 in 1.62 in 1.70 in 1.94 in 2.38 in 2.71 in 25 yr 0.58 in 1.09 in 1.82 in 2.02 in 2.09 in 2.35 in 2.81 in 3.22 in50 yr 0.68 in 1.28 in 2.13 in 2.36 in 2.42 in 2.68 in 3.14 in 3.62 in100 yr 0.78 in 1.48 in 2.47 in 2.73 in 2.78 in 3.05 in 3.49 in 4.04 in
The storm duration used for the study is the 24 hour event. The storm duration selected allows for all portions of the basins to contribute to the basin outlet and is based on the longest time of concentration (Tc) in the model. Depth – Area Reductions for point rainfall values based upon storm duration and total drainage area size were not used in the model.

Summary Hydrologic Modeling Report – Shultz Fire Drainage Master Plan
Page 7
4. Rainfall Losses Rainfall losses have been calculated for each basin based upon land use and underlying soil characteristics. Land use data was derived from aerial imagery and the Shultz Fire Burn Severity Map prepared by the US Forest Service. Land uses are characterized as follows. ● High Burn Severity with Slopes > 40% ● High Burn Severity with Slopes < 40% ● Moderate Burn Severity ● Low Severity Burn ● Unburned Forest ● 1 Acre Residential ● 2 Acre Residential ● Undeveloped Residential ● Landfill Detailed soil data from the Coconino National Forest Terrestrial Ecosystem Survey was used for this study.
Rainfall losses from infiltration were estimated using the Soil Conservation Service (SCS) Curve Number Method. The SCS’s Technical Release 55 Manual, Urban Hydrology for Small Watersheds (TR 55) and Burn Area Emergency Response Tools (methodology by Livingston and others 2005) prepared by the US Forest Service were used for guidance in Curve Number selection.
Curve Numbers were estimated for the immediate post burn condition (2010), anticipated short term recovery condition (2015), and the anticipated long term recovery condition (2030) based on Hydrologic Soil Group (HSG), vegetative cover, land use, and field observations. Area weighted averages were used to derive Curve Numbers for all basins.
Rainfall amounts are assumed uniformly over the entire watershed using a specified time distribution. Mass rainfall is converted into mass runoff using a the Curve Number. Curve Numbers combine infiltration losses with surface storage and estimate rainfall excess (runoff).
Timing parameters in the hydrologic models are based on lag times. The Lag Time is the time from the center of mass of the effective rainfall to the peak of the runoff hydrograph. Lag Times were calculated using the SCS Lag Time Equation.

Summary Hydrologic Modeling Report – Shultz Fire Drainage Master Plan
Page 8
Table 4. Land Use and Curve Numbers for Immediate Post Burn Condition (2010)
Land Use Curve
Number HSG A
Curve Number HSG
B
Curve Number HSG
C
Curve Number HSG
D High Burn Severity
Slopes > 40% 95 95 95 95
High Burn Severity Slopes < 40% 85 91 92 93
Moderate Burn Severity 73 80 83 85
Low Burn Severity 61 68 74 79 Unburned Forest 36 60 73 79
1 Acre Residential 51 68 79 84 2 Acre Residential 46 65 77 82
Undeveloped Residential 49 69 79 84
Landfill 77 86 91 94
Table 5. Land Use and Curve Numbers for Anticipated Short Term Recovery Condition (2015)
Land Use Curve
Number HSG A
Curve Number HSG
B
Curve Number HSG
C
Curve Number HSG
D High Burn Severity
Slopes > 40% 92 92 92 92
High Burn Severity Slopes < 40% 80 85 87 89
Moderate Burn Severity 65 75 80 82
Low Burn Severity 57 65 73 79 Unburned Forest 36 60 73 79
1 Acre Residential 51 68 79 84 2 Acre Residential 46 65 77 82
Undeveloped Residential 49 69 79 84
Landfill 77 86 91 94

Summary Hydrologic Modeling Report – Shultz Fire Drainage Master Plan
Page 9
Table 6. Land Use and Curve Numbers for Anticipated Long Term Recovery Condition (2030)
Land Use Curve
Number HSG A
Curve Number HSG
B
Curve Number HSG
C
Curve Number HSG
D High Burn Severity
Slopes > 40% 89 89 89 89
High Burn Severity Slopes < 40% 71 75 81 85
Moderate Burn Severity 43 65 76 80
Low Burn Severity 36 60 73 79 Unburned Forest 36 60 73 79
1 Acre Residential 51 68 79 84 2 Acre Residential 46 65 77 82
Undeveloped Residential 49 69 79 84
Landfill 77 86 91 94
No difference in Curve Numbers was used in the high burn severity areas where slopes are greater than 40%. These areas have lost a significant amount of soil during recent rainfall events (Summer 2010). Many of the soils in these areas were classified as HSG A or B according to the Coconino National Forest Terrestrial Ecosystem Survey. However, this survey was prepared prior to the fire and rainfall events. It is assumed that the soil horizons currently exposed are HSG D soils. Therefore, a representative HSG D curve number was assigned to all HSG classifications (A, B, C, or D) within this land use area.

Summary Hydrologic Modeling Report – Shultz Fire Drainage Master Plan
Page 10
5. Channel and Storage Routing
Channel routing was performed for basins in series in accordance with the Normal Depth Method of the Modified Puls channel routing procedures. Eight typical sections were used for channel routing. These typical sections are all represented by 8 point cross sections. Manning’s “n” values are assigned to the left and right overbank areas and the channel. These channels were defined as being generally characteristic for routing of respective upstream flows. Channel routing causes hydrograph transference and attenuation. The 8 channel cross sections are as follows. ● Forest ● Residential Lower Doney ● Residential Doney Bottom ● Residential T-F (Timberline – Fernwood) ● Residential Rectangular Small ● Residential Rectangular Large ● 89 ● 89 North

Summary Hydrologic Modeling Report – Shultz Fire Drainage Master Plan
Page 11
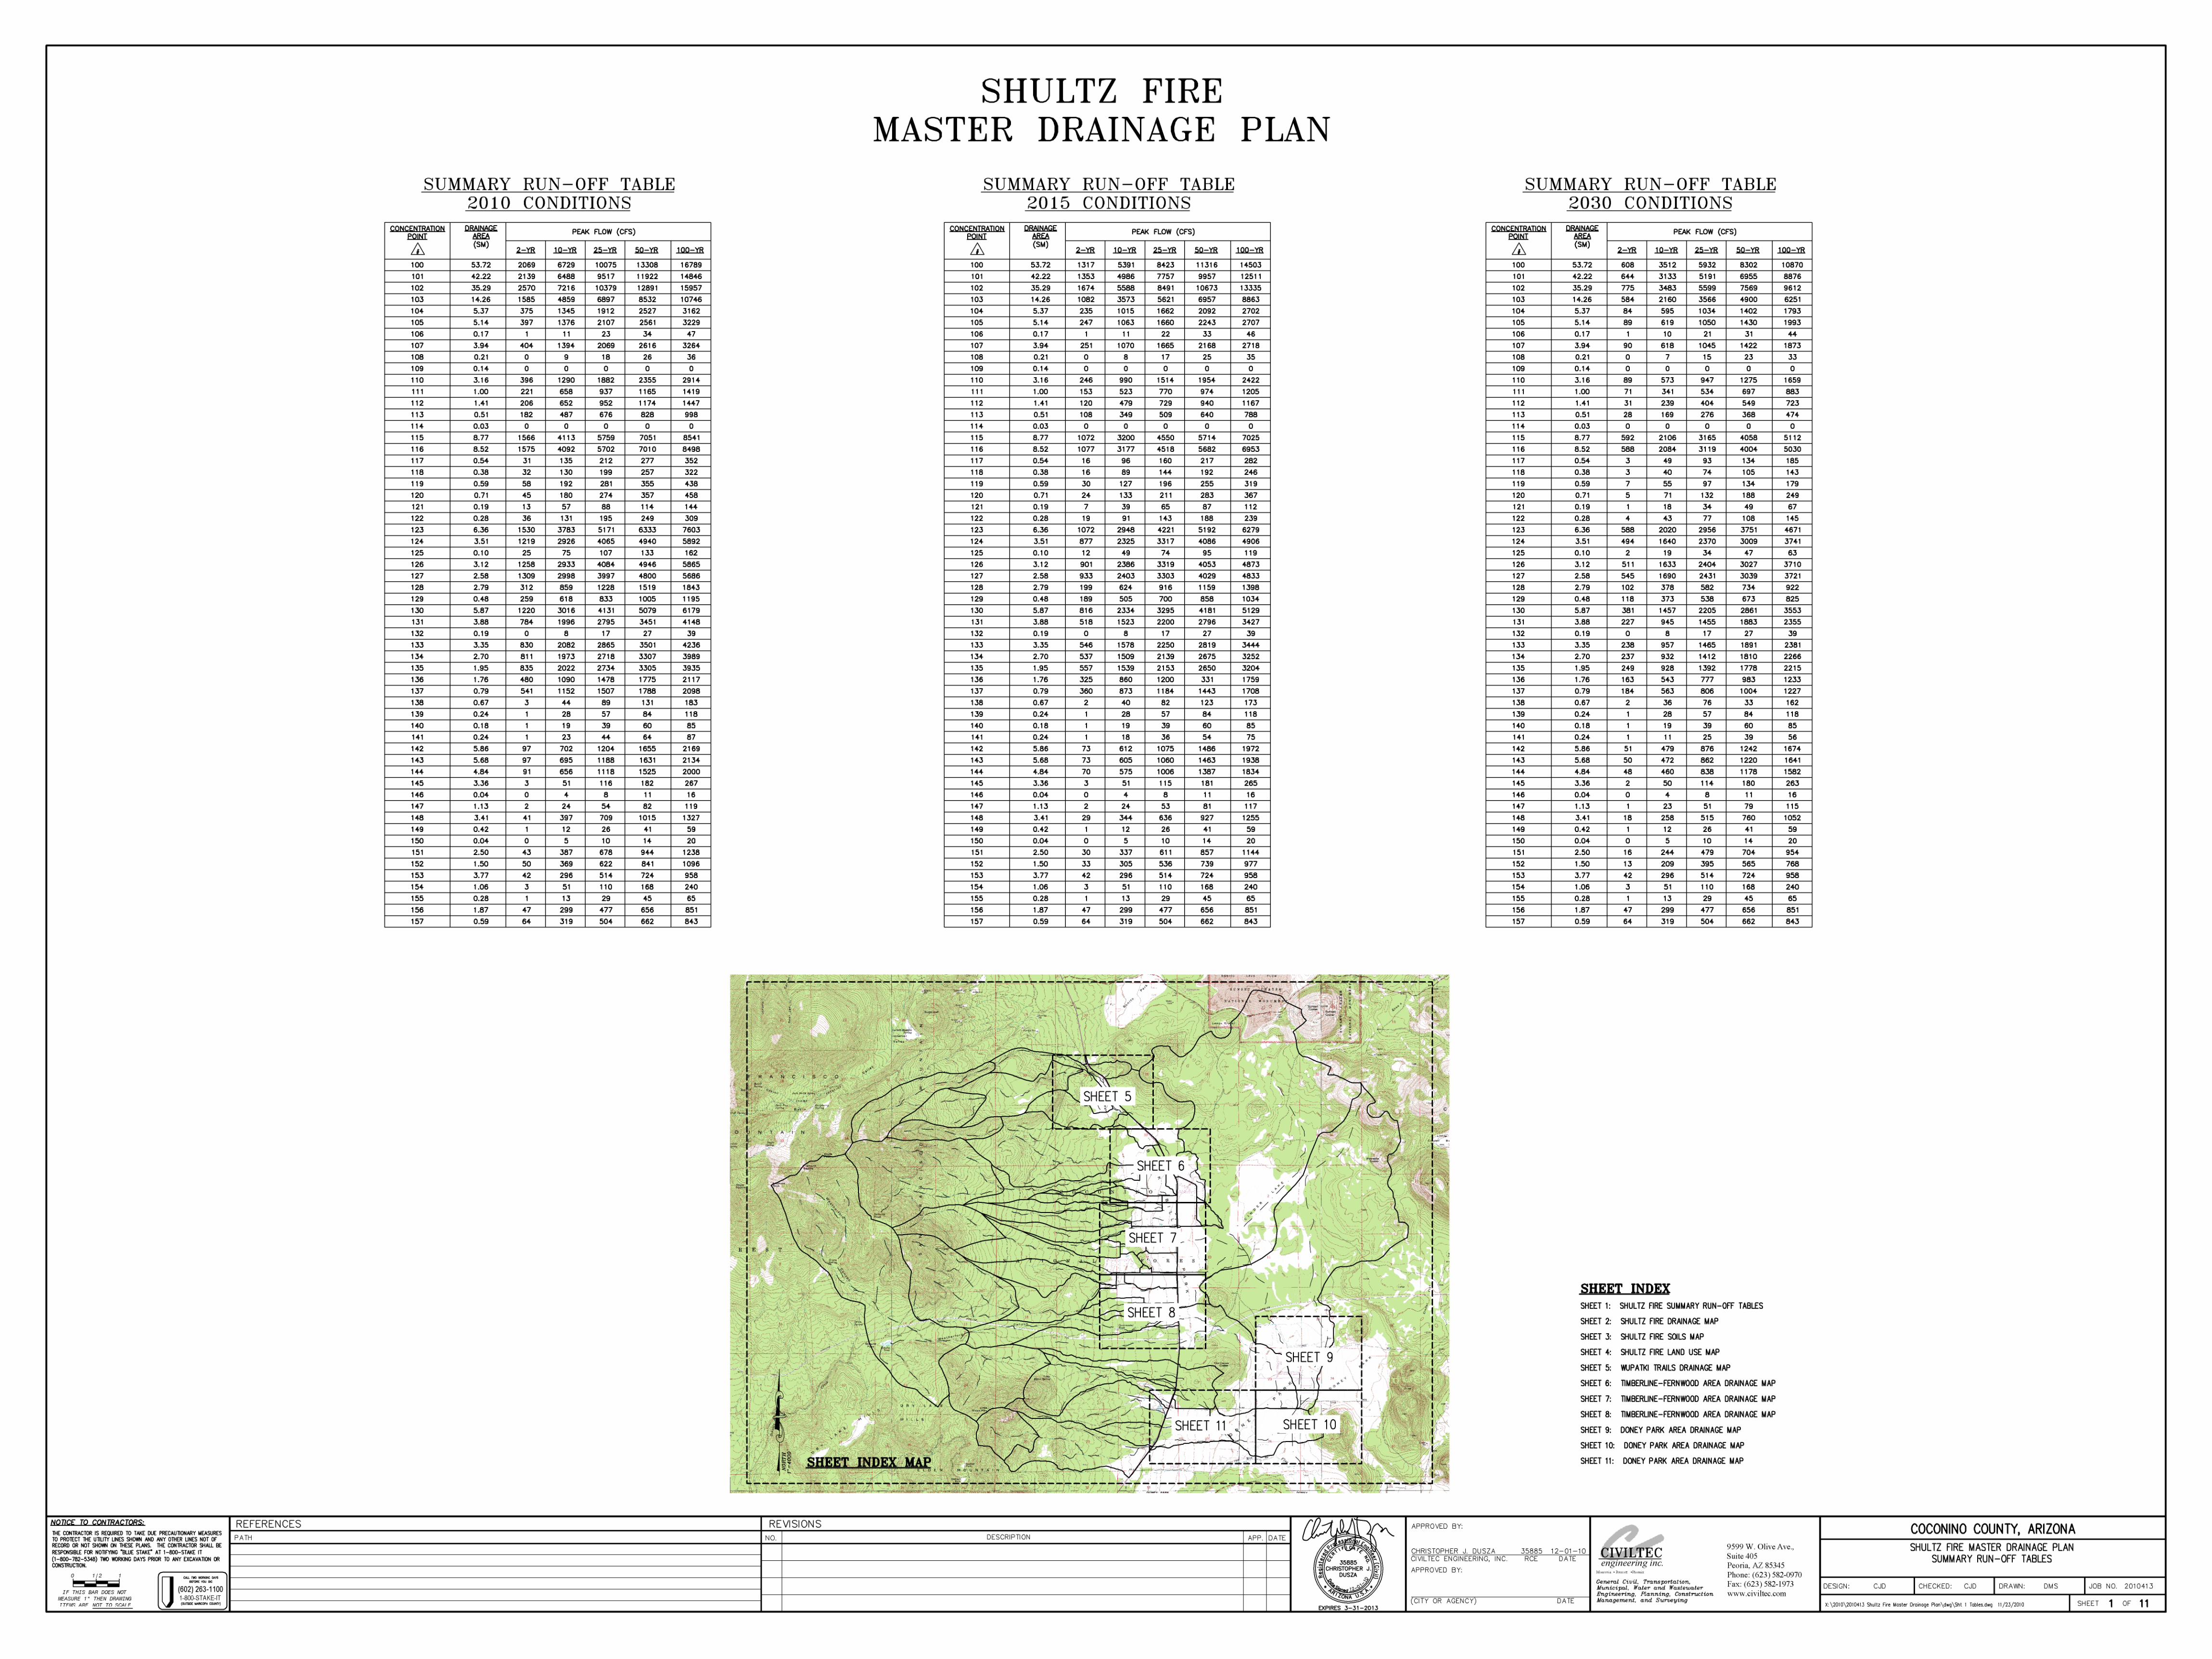
6. Hydrologic Modeling Results
The peak discharge estimates from the models are provided below.
Table 7. Hydrologic Modeling Results – Immediate Post Burn Condition (2010)
Concentration
Point Drainage
Area (sm)2 yr (cfs)
10 yr(cfs)
25 yr (cfs)
50 yr (cfs)
100 yr (cfs)
100 53.72 2,069 6,729 10,075 13,308 16,789 101 42.22 2,139 6,488 9,517 11,922 14,846 102 35.29 2,570 7,216 10,379 12,891 15,957 103 14.26 1,585 4,859 6,897 8,532 10,746 104 5.37 375 1,345 1,912 2,527 3,162 105 5.14 397 1,376 2,107 2,561 3,229 106 0.17 1 11 23 34 47 107 3.94 404 1,394 2,069 2,616 3,264 108 0.21 0 9 18 26 36 109 0.14 0 0 0 0 0 110 3.16 396 1,290 1,882 2,355 2,914 111 1.00 221 658 937 1,165 1,419 112 1.41 206 652 952 1,174 1,447 113 0.51 182 487 676 828 998 114 0.03 0 0 0 0 0 115 8.77 1,566 4,113 5,759 7,051 8,541 116 8.52 1,575 4,092 5,702 7,010 8,498 117 0.54 31 135 212 277 352 118 0.38 32 130 199 257 322 119 0.59 58 192 281 355 438 120 0.71 45 180 274 357 458 121 0.19 13 57 88 114 144 122 0.28 36 131 195 249 309 123 6.36 1,530 3,783 5,171 6,333 7,603 124 3.51 1,219 2,926 4,065 4,940 5,892 125 0.10 25 75 107 133 162 126 3.12 1,258 2,933 4,084 4,946 5,865 127 2.58 1,309 2,998 3,997 4,800 5,686 128 2.79 312 659 1,228 1,519 1,843 129 0.48 259 618 833 1,005 1,195 130 5.87 1,220 3,016 4,131 5,079 6,179 131 3.88 784 1,996 2,795 3,451 4,148 132 0.19 0 8 17 27 39

Summary Hydrologic Modeling Report – Shultz Fire Drainage Master Plan
Page 12
Concentration
Point
Drainage Area (sm)
2 yr (cfs)
10 yr(cfs)
25 yr (cfs)
50 yr (cfs)
100 yr (cfs)
133 3.35 830 2,082 2,865 3,501 4,236 134 2.70 811 1,973 2,718 3,307 3,989 135 1.95 835 2,022 2,734 3,305 3,935 136 1.76 480 1,090 1,478 1,775 2117 137 0.79 541 1,152 1,507 1,788 2,098 138 0.67 3 44 89 131 183 139 0.24 1 28 57 84 118 140 0.18 1 19 39 60 85 141 0.24 1 23 44 64 87 142 5.86 97 702 1,204 1,655 2,169 143 5.68 97 695 1,188 1,631 2,134 144 4.84 91 656 1,118 1,525 2,000 145 3.36 3 51 116 182 267 146 0.04 0 4 8 11 16 147 1.13 2 24 54 82 119 148 3.41 41 397 709 1,015 1,327 149 0.42 1 12 26 41 59 150 0.04 0 5 10 14 20 151 2.50 43 387 678 944 1,238 152 1.50 50 369 622 841 1,096 153 3.77 42 296 514 724 958 154 1.06 3 51 110 168 240 155 0.28 1 13 29 45 65 156 1.87 47 299 477 656 851 157 0.59 64 319 504 662 843

Summary Hydrologic Modeling Report – Shultz Fire Drainage Master Plan
Page 13
Table 8. Hydrologic Modeling Results – Short Term Recovery Condition (2015)
Concentration Point
Drainage Area (sm)
2 yr (cfs)
10 yr(cfs)
25 yr (cfs)
50 yr (cfs)
100 yr (cfs)
100 53.72 1,317 5,391 8,423 11,316 14,503 101 42.22 1,353 4,986 7,757 9,957 12,511 102 35.29 1,674 5,588 8,491 10,673 13,335 103 14.26 1,082 3,573 5,621 6,957 8,863 104 5.37 235 1,015 1,662 2,092 2,702 105 5.14 247 1,063 1,660 2,243 2,707 106 0.17 1 11 22 33 46 107 3.94 251 1,070 1,665 2,168 2,718 108 0.21 0 8 17 25 35 109 0.14 0 0 0 0 0 110 3.16 246 990 1,514 1,954 2,422 111 1.00 153 523 770 974 1,205 112 1.41 120 479 729 940 1,167 113 0.51 108 349 509 640 788 114 0.03 0 0 0 0 0 115 8.77 1,072 3,200 4,550 5,714 7,025 116 8.52 1,077 3,177 4,518 5,682 6,953 117 0.54 16 96 160 217 282 118 0.38 16 89 144 192 246 119 0.59 30 127 196 255 319 120 0.71 24 133 211 283 367 121 0.19 7 39 65 87 112 122 0.28 19 91 143 188 239 123 6.36 1,072 2,948 4,221 5,192 6,279 124 3.51 877 2,325 3,317 4,086 4,906 125 0.10 12 49 74 95 119 126 3.12 901 2,386 3,319 4,053 4,873 127 2.58 933 2,403 3,303 4,029 4,833 128 2.79 199 624 916 1,159 1,398 129 0.48 189 505 700 858 1,034 130 5.87 816 2,334 3,295 4,181 5129 131 3.88 518 1,523 2,200 2,796 3,427 132 0.19 0 8 17 27 39

Summary Hydrologic Modeling Report – Shultz Fire Drainage Master Plan
Page 14
Concentration Point
Drainage Area (sm)
2 yr(cfs)
10 yr(cfs)
25 yr (cfs)
50 yr(cfs)
100 yr (cfs)
133 3.35 546 1,578 2,250 2,819 3,444 134 2.70 537 1,509 2,139 2,675 3,252 135 1.95 557 1,539 2,153 2,650 3,204 136 1.76 325 860 1,200 331 1,759 137 0.79 360 873 1,184 1,443 1,708 138 0.67 2 40 82 123 173 139 0.24 1 28 57 84 118 140 0.18 1 19 39 60 85 141 0.24 1 18 36 54 75 142 5.86 73 612 1,075 1,486 1,972 143 5.68 73 605 1,060 1,463 1,938 144 4.84 70 575 1,006 1,387 1,834 145 3.36 3 51 115 181 265 146 0.04 0 4 8 11 16 147 1.13 2 24 53 81 117 148 3.41 29 344 636 927 1,255 149 0.42 1 12 26 41 59 150 0.04 0 5 10 14 20 151 2.50 30 337 611 857 1,144 152 1.50 33 305 536 739 977 153 3.77 42 296 514 724 958 154 1.06 3 51 110 168 240 155 0.28 1 13 29 45 65 156 1.87 47 299 477 656 851 157 0.59 64 319 504 662 843

Summary Hydrologic Modeling Report – Shultz Fire Drainage Master Plan
Page 15
Table 9. Hydrologic Modeling Results – Long Term Recovery Condition (2030)
Concentration Point
Drainage Area (sm)
2 yr(cfs)
10 yr(cfs)
25 yr (cfs)
50 yr(cfs)
100 yr (cfs)
100 53.72 608 3,512 5,932 8,302 10,870 101 42.22 644 3,133 5,191 6,955 8,876 102 35.29 775 3,483 5,599 7,569 9,612 103 14.26 584 2,160 3,566 4,900 6,251 104 5.37 84 595 1,034 1,402 1,793 105 5.14 89 619 1,050 1,430 1,993 106 0.17 1 10 21 31 44 107 3.94 90 618 1,045 1,422 1,873 108 0.21 0 7 15 23 33 109 0.14 0 0 0 0 0 110 3.16 89 573 947 1,275 1,659 111 1.00 71 341 534 697 883 112 1.41 31 239 404 549 723 113 0.51 28 169 276 368 474 114 0.03 0 0 0 0 0 115 8.77 592 2,106 3,165 4,058 5,112 116 8.52 588 2,084 3,119 4,004 5,030 117 0.54 3 49 93 134 185 118 0.38 3 40 74 105 143 119 0.59 7 55 97 134 179 120 0.71 5 71 132 188 249 121 0.19 1 18 34 49 67 122 0.28 4 43 77 108 145 123 6.36 588 2,020 2,956 3,751 4,671 124 3.51 494 1,640 2,370 3,009 3,741 125 0.10 2 19 34 47 63 126 3.12 511 1,633 2,404 3,027 3,710 127 2.58 545 1,690 2,431 3,039 3,721 128 2.79 102 378 582 734 922 129 0.48 118 373 538 673 825 130 5.87 381 1,457 2,205 2,861 3,553 131 3.88 227 945 1,455 1,883 2,355 132 0.19 0 8 17 27 39

Summary Hydrologic Modeling Report – Shultz Fire Drainage Master Plan
Page 16
Concentration Point
Drainage Area (sm)
2 yr(cfs)
10 yr(cfs)
25 yr (cfs)
50 yr(cfs)
100 yr (cfs)
133 3.35 238 957 1,465 1,891 2,381 134 2.70 237 932 1,412 1,810 2,266 135 1.95 249 928 1,392 1,778 2,215 136 1.76 163 543 777 983 1,233 137 0.79 184 563 806 1,004 1,227 138 0.67 2 36 76 33 162 139 0.24 1 28 57 84 118 140 0.18 1 19 39 60 85 141 0.24 1 11 25 39 56 142 5.86 51 479 876 1,242 1,674 143 5.68 50 472 862 1,220 1,641 144 4.84 48 460 838 1,178 1,582 145 3.36 2 50 114 180 263 146 0.04 0 4 8 11 16 147 1.13 1 23 51 79 115 148 3.41 18 258 515 760 1,052 149 0.42 1 12 26 41 59 150 0.04 0 5 10 14 20 151 2.50 16 244 479 701 954 152 1.50 13 209 395 565 768 153 3.77 42 296 514 724 958 154 1.06 3 51 110 168 240 155 0.28 1 13 29 45 65 156 1.87 47 299 477 656 851 157 0.59 64 319 504 662 843

Summary Hydrologic Modeling Report – Shultz Fire Drainage Master Plan
Page 17
7. Indirect Methods of Discharge Verification The estimation of peak discharges by analytic methods is based on various assumptions and estimated parameters. For ungaged watersheds, peak discharge estimates should be checked for reasonableness using indirect methods. The Highway Drainage Design Manual Hydrology by the Arizona Department of Transportation (ADOT) provides various indirect methods for peak discharge verification.
Indirect Method Number 1 – Unit Peak Discharge Curves
The curves of most interest are Curve C, Curve G, and Curve H. Curve H is a 100 year event peak discharge envelope curve for Southeastern Arizona. Curve C is a 100 year event peak discharge relation developed for Arizona. Curve G is a 100 year event peak discharge relation for Southeastern Arizona. Curves A, B, D, E, F, I, and J were developed from maximum observed flood discharges.
Figure 2. Peak Discharge Relations and Envelope Curves

Summary Hydrologic Modeling Report – Shultz Fire Drainage Master Plan
Page 18
Indirect Method Number 2 – USGS Data for Arizona The United States Geological Survey (USGS) collects streamflow data and provides statistical analysis for 138 continuous record streamflow gaging stations and 176 partial record gaging stations in Arizona. The data is analyzed using a Log-Pearson Type 3 analysis. Based on the analysis, an equation was developed for the 100 year event peak discharge; Q100 = 850 A0.54 Q100 = 100 year event peak discharge A = Drainage area (53.72 sm) Indirect Method Number 3 – Regional Regression Equations An analysis was performed of streamflow data in Arizona, Nevada, Utah, and parts of New Mexico, Colorado, Wyoming, Texas, Idaho, Oregon, and California. The analysis resulted in 16 sets of regional regression equations for the study area. Arizona has 7 regions. The study area lies near the boundary of Region 11 and 12. The Region 12 equations are most appropriate for the study area.
The equation for the 100 year event in Region 12 is; Log Q = 6.55 – 3.17 Area-0.11 – 0.454 Log Elev Area = Drainage area (53.72 sm) Elev = Mean basin elevation (7,200) divided by 1,000

Summary Hydrologic Modeling Report – Shultz Fire Drainage Master Plan
Page 19
Figure 3. Regional Regression Map

Summary Hydrologic Modeling Report – Shultz Fire Drainage Master Plan
Page 20
Table 10. Indirect Discharge Verification Results (100 yr.)
Discharge Method Concentration Point 100No. 1 Curve C 11,820 cfs No. 1 Curve G 10,210 cfs No. 1 Curve H 25,250 cfs
No. 2 7,310 cfs No. 3 (Region 12) 13,050 cfs
HEC-1 Study – Immediate Post Burn Condition (2010) 16,789 cfs HEC-1 Study – Short Term Recovery Condition (2015) 14,503 cfs HEC-1 Study – Long Term Recovery Condition (2030) 10,870 cfs
III. Hydrologic Analysis Conclusion
HEC-1 was used to analyze the post Shultz Fire 54 square mile watershed impacting Wupatki Trails, Timberline, Fernwood, and Doney Park. Three scenarios have been modeled. They are the immediate post burn condition (2010), the point where some short term recovery has occurred (2015), and the point where some longer term recovery has occurred (2030). The 2, 10, 25, 50, and 100 year 24 hour events were modeled. The modeling provides estimates for clear flow peak flow rates only. No bulking of flows due to sediment and debris is considered. The overall watershed modeling results were compared to various indirect methods of discharge verification. In general, the modeling results appear to be reasonable. The watershed is mostly HSG A and B type soils. Normally, this would result in lower peak discharges when compared to the indirect methods of discharge verification. Given the effects of the fire, higher peak flows will result in the post burn modeling. These higher peak flow rates are generally comparable to the indirect methods of discharge verification.

Summary Hydrologic Modeling Report – Shultz Fire Drainage Master Plan
Page 21
V. References
ADOT Highway Drainage Design Manual Hydrology – March 1993 US Army Corps of Engineers Hydrologic Engineering Center HEC-1 Flood Hydrograph Package User’s Manual – June 1998 The Orthoshop 2 Foot Aerial Mapping (Timberline, Fernwood), June 2003 Cooper Aerial 2 Foot Aerial Mapping (Wupatki Trails), November 2004 Sandborn 2 Foot Lidar Mapping, 2010 ADWR State Standard for Hydrologic Modeling, 2007 USGA National Map Data Seamless Server NOAA Precipitation Data Server Coconino National Forest County Terrestrial Ecosystem Survey USDA Urban Hydrology for Small Watersheds TR-55, June 1986 USFS BEAR Road Treatment Tools – Curve Numbers Methods Supplement USFS Shultz Fire Sub Basin Watershed and Severity Map, July, 2010

Summary Hydrologic Modeling Report – Shultz Fire Drainage Master Plan
Page 22
VI. Appendix


0 10.5Miles
Schultz FireSub-basin Watershed and Severity MapJuly 5, 2010
Unburned
Low
Moderate
High
Sub-basin Watersheds
6th Code HUC
Private Land
Wilderness
Schultz Fire Perimeter June 26, 2010
146
420