WIB#13: Hydrologic Reconnaissance of Bear River Basin
77
-
Upload
khangminh22 -
Category
Documents
-
view
0 -
download
0
Transcript of WIB#13: Hydrologic Reconnaissance of Bear River Basin

•
WATER INFORMATION BULLETIN NO. 13
HYDROLOGIC RECONNAISSANCE OF TIJE
BEAR RIVER BASIN IN SOUTHEASTERN IDAHO
by
N. P. Dion
Prepared by the United States Geological Survey
in Cooperation with
The Idaho Department of Reclamation
R. Keith Higginson
State Reclamation Engineer
October 1969

CONTENTS
Abstract . .
Introduction
Purpose and scope
Previous work
Well-and spring-numbering system
Use of metric units
Physical setting ....
Landforms and drainage
Climate
Water use
Ground water
Occurrence and availability
Source and movement
Interbasin leakage
Water-level fluctuations
Development potential
Relation to surface water
Surface water
Water quality
Ground water
Surface water
Springs
Summary and recommendations
Records of wells ..... .
III
Page
VII
1
1
1
4
6
6
6
7
11
14
14
18
20
21
24
25
29
34
34
39
42
46
48

CONTENTS (cont'd.)
References . . . . . . .
ILLUSTRI\TIONS
Figure 1. Index map showing area covered by this report
2. Diagram showing the well-and spring-numbering system used
in Idaho by the U. S. Geological Survey .
3. Graph showing average monthly temperature and precipitation
at selected stations
4. Graph showing precipitation-duration curves for stations
in the Bear River basin
5. Map of the Bear River basin showing average annual precip-
itation
6. Generalized geologic map of the Bear River basin and adja-
cent areas in Idaho ..
7. Map of the Bear River basin showing chemical character of
the ground water, water-level contours, and location
of selected observation wells
Page
64
3
5
9
10
12
8. Graph showing ground-water fluctuations in selected wells 23
9. Graph showing maximum effects of ground-water pumpage on
streamflow at selected distances
10. Map of the Bear River basin showing average annual stream
discharge, chemical character of the surface water, and
the location of selected springs
IV
28
'
•
ILLUSTRATIONS (cont'd.)
Page
Figure 11. Graph showing mean monthly discharge for water year 1968
at selected stations . 31
12. Graph showing long-term discharge-precipitation relation-
ship for Cottonwood Creek and Grace, Idaho . . . . . 32
13. Graph showing flow-duration curves for selected stations
in the Bear River basin
14. Graph showing suitability of ground and surface water for
irrigation . . . . . . .
TABLES
Table 1. Temperature-conversion table
2. Summary of data for hydroelectric stations and reservoirs
on the main stem of Bear River
3. Summary of geologic units and their hydrologic character
istics
33
38
8
13
15
4. Chemical analyses of ground water from selected wells 36
5. Chemical analyses of surface water from selected streams 40
6. Chemical analyses of water from selected springs 44
7. Records of wells in the Idaho part of the Bear River basin 52
V

This page is intentionally
blank

HYDROLOGIC RECO!\NAISSANCE OF THE
BEAR RIVER BASIN IN SOUTHEASTERN IDAHO
By N. P. Dion
ABSTRACT
The areal distribution of precipitation in the Bear River basin is con
trolled chiefly by elevation, and quantities range from less than 10 inches
in Bear Lake Valley to more than 45 inches on the Bear River Range. Precip
itation on the basin averages about 2.3 million acre-feet per year.
Ground water occurs in the alluvium of all the valleys, the basalt of
Soda Creek basin and Gem Valley, the Salt Lake Formation, the fractured
bedrock, and possibly in the Wasatch Formation. The basalt and the alluvium
are the most productive aquifers in the basin and are best able to withstand
additional ground-water development. Reportedly, the basalt yields as much
as 3,500 gpm (gallons per minute) and the alluvium as much as 2,500 gpm to
wells. While many wells drilled into the Salt Lake Formation are nonproductive,
those that are successful yield as much as 1,800 gpm. Because few wells have
been drilled into either the Wasatch Formation or the undifferentiated bedrock,
their yield capability is unknown.
The principal sources of recharge to the aquifers include precipitation,
spring snowmelt and runoff, seepage of irrigation 1,vater, and losses from irri
gation canals. Some additional recharge is provided by the leakage of water
from Blackfoot Reservoir in the Blackfoot River basin to the Blackfoot Lava
Field in the Bear River basin.
VII

Natural discharge from the aquifers is by ground-water flow to the
Bear River, by springs and seeps along the banks of the river, and by evapo
transpiration in large marshy tracts. Some natural discharge into the ad
joining Portneuf River basin may occur by the movement of water through a
basalt in Tenmile Pass and by a northward movement of water in the vicinity
of Soda Point.
The Bear River in Idaho is generally a gaining stream with the possible
exception of the reach between Alexander and Grace. Ground-water contours
indicate that this reach of the river is a source of recharge to the ground
water reservoir and that some of this recharge eventually returns to the
river through springs issuing from the walls of Black Canyon. The average
annual net surface-water contribution from the Idaho part of the Bear River
basin to the Bear River is approximately 409,000 acre-feet.
Ground waters in the basin are predominantly calcium and magnesium bi
carbonate in type. The surface waters of the basin are also of this chemical
type but are generally lower in dissolved solids than the ground water.
The Bear River basin contains hundreds of springs that discharge water
of several chemical types. These chemical types include calcium bicarbonate,
magnesium bicarbonate, calcium sulfate, sodium chloride, and magnesium bicar
bonate sulfate.
VIII

INTRODUCTION
The Bear River Compact, approved by Congress in 1958, established a
nine-member commission that administers the distribution of Bear River water
among the signatory States of Utah, Wyoming, and Idaho. In addition to
establishing criteria for the distribution of direct flow and stored water
for each of these States, the compact also stipulates that it is the policy
of the States to encourage additional projects for the development of the
water resources of the Bear River to the maximum beneficial use and with a
minimum of waste. To enable maximum beneficial use of the available water,
a description of the total water resources of the basin is required.
Prior to 1967, no study of the total water resources of the Bear River
basin in Idaho had been made. A comprehensive hydrologic study of the Cache
Valley part of the basin in Idaho and Utah was started in 1967 by the Utah
District, Water Resources Division, U. S. Geological Survey in cooperation
with the Utah Di vision of Water Resources. The hydro logic reconnaissance
of the Idaho part of the Bear River basin reported on herein was started in
July 1967 by the Idaho district, Water Resources Division, U. S. Geological
Survey, in cooperation with the Idaho Department of Reclamation.
The author expresses his gratitude to the residents of the Bear River
basin for their cooperation in furnishing information about their wells and
for allowing access to their property.
Purpose and Scope
The purpose of this report on the Bear River basin in Idaho is to:
(1) Describe the general distribution and availability of the basin's water
1

resources; (2) present well data obtained during an inventory of wells in
the area; (3) provide a description of the quality of the water; (4) estab
lish a base of water-related information from which future comparisons can
be made; (5) determine the effect of increased water use on the water regi
men, especially the effect of increased ground-water withdrawals on the
flow of streams; and (6) determine the types and locations of existing and
potential hydrologic problems.
The project area covers almost 2,200 square miles in all or parts of
Bannock, Bear Lake, Caribou, Franklin, and Oneida Counties in southeastern
Idaho (fig. 1). For purposes of this report, the term "Bear River basin"
refers only to that part of the basin that lies in Idaho but does not include
the Malad River drainage basin.
Previous 1\fork
The first comprehensive report on the geography, geology, hydrology,
and mineral resources of the eastern part of the Bear River basin was written
by Mansfield (1927). In that report, Mansfield described the types and oc
currence of springs in southeastern Idaho and evaluated the possibility of
leakage from Blackfoot River Reservoir. An unpublished report by Stearns
presented a detailed account of the hydrology in the Soda Springs-Gem Valley
area. (Stearns, H. T., (no date), Geology and ground-water resources of the
Soda Springs area, Idaho: U. S, Geol. Survey unpublished manuscript (Boise,
Idaho), 69 p.) Stearns described in detail the igneous geology of the area
and traced the movement of ground water through the basalt. He was the first
to suggest leakage from the channel of Bear River between Alexander and Grace.
A study by Bright (1963) of Pleistocene lakes in the western part of the Bear
2

'r
:1
. I 1-------t--' .
431 SNAKE Tw,n '
lj , r al Isl
:1 ! 1 : \
42°i_ __ j_ __ J __ _J __ -~-__...u:it/-'~42° !!7° 116° 115° 114° 113° li2° 111°
0 10 50 100 MILES
FIGURE 1. --Index map showing area covered by this report.
3

River basin discussed the occurrence and possible origin of Lake Thatcher,
which occupied the Gentile Valley region during part of the Pleistocene
Epoch.
Many parts of the area have been mapped geologically in some detail
as a result of special interests, such as the search for commercial deposits
of phosphate. More recently, geophysical methods have been used to deter
mine regional geologic relationships.
Well-and Spring-Numbering System
The numbering system used in Idaho by the U. S. Geological Survey indi
cates the location of a well or spring in the official rectangular subdivi
sions of the public lands (fig. 2). The first two segments of the number
designate the township and range. The third segment gives the section number
and is followed by three letters and a numeral, which indicate, respectively,
the quarter section, the 40-acre tract, the 10-acre tract, and the serial
number of the well or spring within the tract. Quarter sections are lettered
a, b, c, and din a counterclockwise order from the northeast quarter of each
section. Within the quarter sections, 40-acre and 10-acre tracts are lettered
in the same manner. Thus well 14S-39E-25addl is in the NE~SE~SE~ sec 25,
T. 14 S., R. 39 E., and is the first well visited in that 10-acre tract.
Physical data for the wells inventoried in the Bear River basin are given in
table 6.
In this report, springs are located only to the quarter section and are
designated by the letter "S" following the last numeral, for example: 15S-
44E-13clS.
4
'

R. 39 E SEC TtON 25
• • • 3 2
I I
I 7 • ,o "
I --- -b -- t-- - c-
•• " •• •• ,, T. I I ' 14 -1---25---;--
' I 20 21 22 23 24 $. I b ' 0
I I
29 26 i1 26 -1----+--·-d-2~<iJ0 , 'a
I C ,--d--I
; C ! d ,, 32 " 34 35 I 36
' 14S-39 E-25addl
FIGURE 2.--Diagram showing the spring- and well-numbering system used in Idaho by the U. S. Geological Survey. (Using well 14S-39E-25addl).
5

Use of Metric Units
In this report, the units that indicate concentrations of dissolved
solids and individual ions determined by chemical analysis and the temper
atures of air and water are metric units. This change from reporting in
"English uni ts" has been made as a part of a gradual change to the metric
system that is underway within the scientific community. The change is
intended to promote greater uniformity in reporting of data. Chemical data
for concentrations are reported in milligrams per liter (mg/1) rather than
in parts per million (ppm), the units used in earlier reports of the U. S,
Geological Survey. For concentrations less than 7,000 mg/1, the number
reported is about the same as for concentrations in parts per million. Air
and water temperatures are reported in degrees Celsius (°CJ
Table 1 will help to clarify the relation between degrees Fahrenheit
and degrees Celsius.
PHYSICAL SETTING
Landforms and Drainage
Bear River is in the Basin and Range and Middle Rocky islountains physi
ographic provinces and is the largest river, with respect to discharge, in
the Western Hemisphere whose water does not flow to an ocean. It enters
Idaho near Border, Wyo., and flows in a narrow valley around the northern
edge of the Bear Lake Plateau (fig. 6). At a point near Wardboro, Idaho,
water from the river is diverted through canals into Bear Lake for offstream
storage. Mansfield (1927), p. 30) postulated that the lake at one time was
much larger than it is today and that Bear River once flowed into the lake
naturally.
6
'
Between Bennington and Soda Springs, the valley of Bear River is nar
rowed by several alluvial fans that flank the Aspen and Bear River Ranges.
At Alexander, just west of Soda Point Reservoir, the river makes a sharp
turn to the south and enters Gem Valley.
Bear River crosses Gem Valley over a series of flat basalt flows. In
cutting down through the southern edge of the flows, the river has formed
a long, deep canyon known locally as Black Canyon. After emerging from
this canyon, Bear River crosses Gentile and Mound Valleys, flows through
Oneida Narrows and enters the northern end of Cache Valley. Cache Valley
was once a bay of ancient Lake Bonneville (Gilbert, 1890, pl. 12) and lake
terraces occur along the margins of the valley.
Bear River leaves Idaho near Wes ton, Idaho, and eventually flows into
Great Salt Lake in Utah. After flowing some 500 miles from its source in
the Uinta Mountains of Utah and crossing state boundaries five times, Bear
River terminates only 90 miles west of its source.
Major tributaries to the Bear River in Idaho include Thomas Fork, Mont
pelier Creek, and Georgetown Creek, which drain the Preuss and Aspen Ranges;
St. Charles Creek, Bloomington Creek, Paris Canyon Creek, Liberty Creek, and
Eightmile Creek, which drain the eastern slopes of the Bear River Range;
Soda Creek, which drains the Fivemile Meadows area; Cottonwood Creek, which
drains the Portneuf Range; Mink Creek and Cub River, which drain the western
slope of the Bear River Range; and Bear Lake, which in turn is fed by springs
and streams originating in the Bear River Range and on Bear Lake Plateau.
Climate
The climate of the Bear River basin may be characterized as "semiarid
continental" in that winters are cold, summers are hot, and precipitation
7
is scanty (fig. 3). The mean annual temperature at five climatological
stations in the basin averages 5.9°C (degrees Celsius) 43°F. Typically
the frost-free growing season lasts for about 100 days between late May
and early September.
Precipitation within the Bear River basin is distributed unevenly with
regard to both time and area. Most of the water available to the streams,
reservoirs, and aquifers in the basin is derived from winter snow. Rain
fall that occurs during the relatively short summer growing season seldom
is enough to satisfy the moisture requirements of the crops grown on the
lowlands. While precipitation is generally sufficient for dry farming of
hardy crops such as wheat and hay, irrigation is required where a wider
variety of crops are grown and higher yields obtained.
Data obtained at U. S. Weather Bureau stations at Preston, Grace, and
Montpelier show that the average monthly precipitation ranges from a high
of 1.93 inches in April to a low of 0.65 inches in July (fig. 3). As shown
in figure 4, the range in annual precipitation at these stations is from
about 8.5 inches to about 23.8 inches. This graph also shows, for example,
that annual precipitation at Montpelier equals or exceeds 18 inches only 10
percent of the time, or, on the average, only 1 year out of 10.
Table 1. TEMPERATURE-CONVERSION TABLE
For conversion of temperature in degrees Celsius (°C) to degrees Fahrenheit
(°F). Conversions are based on the equation, op= 1.8°c + 32; temperatures
in °Fare rounded to nearest degree. Underscored equivalent temperatures are
exact equivalents. For temperature conversions beyond the limits of the table,
use the equation given, and for converting from Op to 0 c use 0 c = 0.5556
8

u:, ~ +30 u:,
t;J 0
w +20
~ @ A
1:i
r-/ ....._
/ " / ' / I Approximate
/ length of frost / ifree growing
/ · season /
'-. / ---+10
" '\ 0 \::
" -10
--Preston ---- Grace - - Montpelier
2.0
1.5
1.0
0.5
FIGURE 3.--Average monthly temperature and precipitation at selected stations, (based on data from U. S. Weather Bureau for period 1947-66).
9

24
81 2 5 10 20 50 80 90 95 98 99
PERCENT OF TIME ANNUAL PRECIPITATION WAS EQUALED OR EXCEEDED
FIGURE 4.--Precipitation-duration curves for stations in the Bear River basin, (based on data from U. S. Weather Bureau for calendar years 1922-66).
10

(OF - 32). The equations say, in effect, that from the freezing point (0°C,
32°F) the temperature rises (or falls] s0 c for every rise (or fall] of 9°P.
oc Op oc Op oc Op oc Op oc Op OC Op oc Op
-20 -4 -10 14 0 32 10 50 20 68 30 86 40 104 -IT -2 :g 16 +f 34 IT 52 21 70 TI 88 41 106 -18 0 -8 18 2 36 12 54 22 72 32 90 42 108 -17 +l -7 19 3 37 13 55 23 73 33 91 43 109 -16 3 -6 21 4 39 14 57 24 75 34 93 44 111
-15 5 -5 23 5 41 15 59 25 77 35 95 45 113 -14 7 -4 25 6 43 16 6T 26 79 36 97 46 115 -13 9 -3 27 7 45 17 63 27 81 37 99 47 117 -12 10 -2 28 8 46 18 64 28 82 38 100 48 118 -11 12 -1 30 9 48 19 66 29 84 39 102 49 120
The areal distribution of precipitation (fig. 5) is controlled chiefly
by elevation and ranges from less than 10 inches in Bear Lake Valley to
more than 45 inches on the Bear River Range. The amount of precipitation
on the entire basin averages about 2.3 million acre-feet per year.
WATER USE
The principal uses of water in the Bear River basin, in order of quan-
tities used, are for hydroelectric power, irrigation, domestic, stock, and
industrial purposes.
Bear River is highly developed for hydroelectric power. Nearly all
the water downstream from llear Lake is used nonconsumpti vely at one or more
powerplants. A summary of data for reservoirs and powerplants on the main
stem of Bear River is given in tab le 2. Originally, water from Bear Lake
was used solely for downstream powerplants, but the lake now provides season-
al storage of water and river regulation for both power and irrigation needs.
Releases of stored water are closely regulated by a pumping station at the
northern end of the lake.
11

lose
·.
R
Idaho 1968
EXPLANATION
-20--
Line of equal average annual precipitation Interval 5 inches
Drainage basin boundaxy
0
Isohyets by K. H. Dyer, 1968
FIGURE 5.--Map of the Bear River basin showing average annual precipitation, (based on data from U.S. Weather Bureau for the period 1930-57).
12
s

Agricultural land is irrigated primarily with water from reservoirs,
streams, and, when needed, from privately-owned wells. A large number of
relatively small irrigation companies serve small parcels of land. Reser-
voirs built exclusively for irrigation purposes have a total active
capacity of less than 35,000 acre-feet and are inadequate to service the
approximately 150,000 irrigated acres in the basin. The quantity of water
diverted from the main stem of Bear River averages more than 250,000 acre-
feet annually,
Table 2. Summary of data for hydroelectric stations and reservoirs on the
main stem of Bear River. (In part from University of Idaho Water Resources
Research Institute, 1968, p. 211)
Reservoir or powerplant
Bear Lake
Soda Point
Grace
Cove
Oneida
Active reservoir capacity (acre-ft)
1,420,000
11,800
200
11,500
Powerplant capacity Hydraulic Generating
(cfs) (megawatts)
2,520 14.0
960 44.0
1,260 7.5
3,300 30.0
Average annual
generation (megawatt
hours)
17,400
98,730
18,020
42,790
The quantity of water used consumptively by irrigated crops is usually
much less than the total quantity applied Water used consumptively by
evaporation and plant transpiration is lost to the basin, whereas, that part
of the applied water not used consumptively percolates down to the water
table and is available for reuse.
13

The following estimate of the quantity of applied water used consump
tively by irrigated crops in Bear River basin is based on a study made by
the Idaho Water Resources Research Institute (Univ. of Idaho, Water Resources
Research Institute, 1968, p. 201). According to that study, the "consumptive
irrigation requirement" (the consumptive use minus the contribution from
rainfall) for crops grown in the basin averages about 1.10 acre-feet per acre
per year and about 150,000 acres are irrigated annually in the basin. These
estimates indicate that the total quantity of water used consumptively by
crops in the basin is about 165,000 acre-feet per year.
Domestic- and stock-water supplies in rural areas are taken from individ
ually-owned wells and, to a lesser extent, from springs in the surrounding
hills and mountains. Municipal water supplies depend heavily on springs, but
these are locally augmented by streams and high-capacity wells. The total
quantity of water used for domestic and stock purposes by the approximately
25,000 people in the basin is about 8,500 acre-feet per year. About 2,100 acre
feet per year, or 25 percent, is consumed and no longer available for reuse.
Industrial demands for water, brought about by phosphate-processing plants
near Soda Springs and food-processing plants in Cache Valley, are met through
the use of about 15 high-capacity wells. The total quantity of water used by
industry in the Bear River basin is approximately 6,900 acre-feet per year of
which it is estimated that only about 170 acre-feet per year, or 2.5 percent,
is actually consumed.
GROUND WATER
Occurrence and Availability
Ground water in the Bear River basin is contained in alluvium and basalt
of Quaternary age, the Salt Lake Formation of Pliocene (?) age, the
14

undifferentiated bedrock of Cretaceous and older age, and possibly in the
Wasatch Formation of Eocene age. (See table 3 and fig. 6). The ages
assigned to the above formations are those of Mansfield (1927, p. 49).
Although the less permeable older rocks occupy most of the surface area
in the basin, the younger, more permeable basalt and alluvium ultimately
receive a large part of the precipitation falling on the older rocks; and
they are, therefore, capable of supplying large quantities of water i:o wells.
Table 3. Summary of geologic units and their hydrologic characteristics.
Availability Adequacy as source of System Series Geologic of water water SUJ2J21Y
unit Yield Specific Domestic Industrial (gpm) capacity and Irrigation and
(gpm/ft stock municipal of drawdown)
As much Holocene 500- as
Alluvium 1,500 150 Good Good Good Quaternary As much
Pleistocene 1,000- as Basalt 3,500 3,500 Good Good Good
Pliocene(?) Salt Lake Erratic Erratic '.!:_e.E_t!_a9 ___ Formation 0-1,800 0-75 Fair Poor Poor
Eocene(?) Wasatch Formation Unknown Unknown Unknown Unknown Unknown -------Undiffer-
Pre- entiated '.!:_e.E_t!_a_ry ___ bedrock Fair Poor Poor
Alluvium of Quaternary age occupies the bottomlands of Thomas Fork, Bear
Lake, Gentile and Cache Valleys. Most wells in these valleys are only 200 to
300 feet deep and do not penetrate through the alluvium. For this reason,
the total thickness of the alluvial material is not known, but it may be as
great as several thousand feet. Commonly, the material that is penetrated
consists of alternating beds of gravel, sand, silt, and clay. Water in these
15

beds is generally under weak artesian pressure in the lower central parts
of the valleys and some wells flow at land surface. Except in the central
parts of Bear Lake Valley and Gentile Valley, where water levels are within
5 feet of land surface, the depth to water in the lowlands of the basin av
erages about 20 to 30 feet below land surface (table 6). Wells completed
in the alluvium generally yield 500-1,500 gpm (gallons per minute). An ex
ception is the western part of Cache Valley, especially between Dayton and
Oxford, where irrigation wells reportedly yield as much as 2,500 gpm. In
the eastern part of Cache Valley, the alluvium is composed of finer-grained
sediments and well yields mostly are correspondingly lower.
The olivine basalt flows interfingering with and overlying the alluvium
in Soda Creek basin and Gem Valley are the most productive aquifers in the
basin. The estimated maximum thickness of the basalt ranges from about 400
feet in Gem Valley to as much as 1,000 feet in the Blackfoot Lava Field
(Mabey and Oriel, in press) . The depth to water in the basalt averages 80 to
90 feet below land surface. Generally, the water occurs in fractures and
joints in the basalt, in rubbly zones, and in interlying cinder beds. Yields
from wells are 1,000-3,500 gpm with the larger yields generally being obtained
from wells penetrating the thicker sequences of basalt.
The Salt Lake Formation consists generally of fresh-water limestone,
tuffaceous sandstone, large amounts of rhyolite tu££ and light-colored, poorly
consolidated conglomerate. These rocks were deposited in deep valleys and
some probably blanketed the surrounding hills and mountains. Although at
least 2,500 feet of these deposits have been penetrated in Bear River basin,
their original thickness may have been greater than 12,000 feet (Hardy, 1957).
The Salt Lake Formation crops out along the margins of the major valleys and
16

probably underlies the alluvium (Williams, 1962, p. 136). Even though many
of the water wells drilled into the Salt Lake Formation have not yielded
water, drillers' logs indicate that those wells that did prove successful,
yield as much as 1,800 gpm from beds of sandstone and conglomerate. Many of
the wells reportedly drilled into the alluvium near the margins of the major
valleys and in smaller tributary valleys may have penetrated, and may be ob
taining water from, the underlying Salt Lake Formation.
The Wasatch Formation is restricted largely to the Bear Lake Plateau in
the extreme southeastern corner of Idaho and to small areas northwest of Bear
Lake (fig. 6). It is composed of red continental deposits consisting largely
of conglomerate and sandstone and lesser amounts of shale, limestone, and
tuff. The fragmental rocks within the formation are tightly cemented and it
is, therefore, relatively impermeable. However, it is possible that the for
mation contains some secondary permeability in the form of joints or fractures,
or permeable zones may exist along the contact of the relatively flat-lying
formation and the underlying folded bedrock. The thickness of the Wasatch
Formation is not known but Mansfield (1927) believed it does not exceed 1,500
feet on Bear Lake Plateau. The elevation of Bear Lake Plateau is about 7,000
feet above mean sea level and recharge to the Wasatch Formation is limited to
precipitation that falls on the plateau. The only well known to have been
drilled into the formation was on Bear Lake Plateau and reportedly penetrated
"swamp gas" at a depth of about 100 feet. It was eventually abandoned as
being unfit for stock use. Nevertheless, numerous springs occur along the
margins of the formation and at least one produces water of excellent quality
for domestic purposes. Additional drilling will be needed to evaluate the
potential of the Wasatch Formation as an aquifer.
17

The undifferentiated bedrock that makes up the major mountain masses in
the basin is composed of more than two dozen pre-Tertiary formations. The
bedrock consists mostly of carbonate rocks, quartzite, shale, and sandstone.
Permeability in the bedrock formations is due largely to secondary openings
such as fractures and joints. Some of the Paleozoic limestones have been
dissolved by water to produce solution cavaties. These give rise to innumer
able springs that provide private homes and small towns a dependable source
of water for domestic purposes. One of the springs yields as much as 200 cfs
(cubic feet per second) during periods of peak discharge (Mansfield, 1927, p.
316). However, because only a few wells have been drilled into the bedrock,
data adequate to determine its hydrologic potential are lacking.
Source and Movement
The alluvial aquifers in Bear Lake and Cache Valleys are recharged
chiefly by surface streams flowing across the alluvium near the margins of
the valleys. Some water may recharge and flow through the Salt Lake Forma
tion before entering the alluvium. Other sources of recharge to the allu
vium include direct precipitation over the aquifer, leakage from irrigation
canals, and downward percolation of applied irrigation water.
The water-level contours in figure 7 show that ground-water movement in
Bear Lake Valley is toward the Bear River. For this reason, most of the nat
ural discharge of the ground water is into the river. In the central part of
the valley where the water table is effectively at land surface, a large marshy
area known as Dingle Swamp has formed. The high rate of evapotranspiration
in the swamp results in large additional quantities of ground water being dis
charged there.
18

Drillers' logs of wells in Cache Valley indicate that the alluvium may
contain several aquifers separated by silt and clay. For this reason, the
water-level contours in figure 7 for Cache Valley probably represent a
composite pressure surface for several water-bearing strata. However, the
contours indicate that the general direction of ground-water movement is
both toward Bear River and southward into the Utah part of the valley. The
multitude of small springs and seeps along the banks of the river provides
additional evidence that the ground water discharges into Bear River.
In Gentile Valley the alluvial aquifer is recharged by surface streams
along the valley margins and from direct precipitation on the alluvium.
Ground-water movement is toward the Bear River and discharge is through hun
dreds of small springs and seeps along the banks of the river.
The principal direction of ground-water flow in Soda Creek basin is to
the southwest, past the town of Soda Springs, and then toward the Bear River
and Soda Point Reservoir. The regional water table is above the level of
Soda Point Reservoir at the eastern end and below it at the western end, sug
gesting that ground water discharges into the reservoir in its eastern part
and that ground water seeps from the reservoir in its western part.
The basalt aquifer in that part of Gem Valley within the Bear River
drainage is recharged by ground water flowing westward past Alexander, by
deep percolation of irrigation water spread on croplands, by irrigation canal
leakage, and probably by leakage out of the channel of the Bear River between
Alexander and Grace. Few perennial streams flow into Gem Valley from the
surrounding hills, therefore, natural recharge from tributaries is sporadic.
The ground-water divide in the central part of Gem Valley, west of Alexander
is inferred to be a broad gentle mound on the water table with ground water
19

flowing both northward and southward away from the divide. The location of
this divide can change if large amounts of recharge to, or discharge from,
the aquifer occur in its general vicinity. The exact location of the crest
of this mound is important in that if the crest shifts to the south, ground
water formerly flowing southward will, instead, flow northward into the
Portneuf drainage.
Interbasin Leakage
The possibility of leakage of water from the Blackfoot River basin into
the Bear River basin has been a controversial question since the construction
of Blackfoot River Reservoir in 1911 (Mans field, 19 27) Stearns, (no date)
and Umpleby, J. B., (no date), Report on leakage near the head of the Black
foot (Fort Hall) Reservoir, Idaho: U. S. Geol. Survey unpublished manuscript
(Boise, Idaho), 8 p.) The relative elevations of the reservoir (about 6,100
feet above mean sea level) and Fivemile Meadows (about 6,000 feet above mean
sea level) and the configuration of the water table in that area (fig. 7)
indicate that leakage is taking place. The basalt in the Blackfoot Lava Field
displays large structural rifts aligned generally north-south. If these rifts
extend below the water table, they could provide avenues for the movement of
large amounts of ground water from the reservoir to Fivemile Meadows.
In addition, some of the ground water in the area south of Blackfoot
River Reservoir may be moving into the Portneuf Valley through the basalt in
Tenmile Pass (see figs. 6 and 7). The elevation of the water table in the
Blackfoot Lava Field is at least 500 feet higher than the water table in
Portneuf Valley. The basalt in Tenmile Pass seems to be thick enough and may
be permeable enough to allow a significant amount of water to move through
20
it. However, much additional work must be done to determine the quantity,
if any, of ground water moving through Tenmile Pass.
Interbasin leakage of ground water also occurs in Gem Valley. One
source of recharge to the basalt aquifer in Gem Valley is ground water that
flows westward past Alexander. Water-level contours in figure 7 indicate
that after entering the valley from the east, some of the water flows north
westward into the Portneuf River basin and the remainder flows southward
toward the Bear River. The amount of water that flows into the Portneuf
drainage is not known, but has to be less than the total amount of ground
water flowing past Alexander. Assuming a coefficient of transmissivity of
1,000,000 gallons per day per foot for the basalt, a water-tab le gradient
of 100 feet per mile, and a saturated cross-sectional width of 0.5 miles,
the total ground-water flow past Alexander can be estimated very roughly at
56,000 acre-feet per year. The available water-level data do not allow a
determination of what percentage of this total flow goes into the Portneuf
River basin.
Water-Level Fluctuations
Ground-water levels in the Bear River basin fluctuate in response to
precipitation, spring runoff, application of irrigation water, and pumping.
The magnitude of these fluctuations is greatest in the alluvial aquifers and
least in the basalt aquifers.
Generally, water levels in wells in the Bear River basin that are un
affected by artificial discharge or recharge rise in the spring when the
snow melts and runoff occurs and decline gradually through the summer, fall,
and winter. Application of water for irrigation may, of course, cause water
21

levels to continue to rise into the summer and, conversely, withdrawal of
ground water for irrigation causes water levels to decline faster than they
otherwise would.
The water-level fluctuations in well 13S-44E-26badl (figs. 7 and 8) in
Bear Lake Valley are representative of ground-water conditions in the allu
vial aquifer of that region. The water level began rising in early April
1968 in response to recharge from spring snowmelt and runoff and continued
rising until mid-August owing to the application of irrigation water. Heavy
rains in August ended the need for additional water, irrigation ceased, and
the water level then began to decline. In wells not affected by irrigation,
declines began in late April following the period of spring snowmelt and peak
stream flow.
Well 8S-42E-17cabl is finished in the basalt aquifer near the springs
that form the headwaters of Soda Creek. There is no nearby irrigation, and
direct precipitation seems to play a minor role in controlling water-level
fluctuations. The water level in this well rose slightly in April in response
to spring runoff and then immediately began declining.
Well 9S-40E-13acbl is in Gem Valley just west of Alexander and is fin
ished in basalt. Its water level began rising in April in response to spring
snowmelt and runoff and continued rising through August as a result of leakage
from irrigation canals and, possibly, the channel of the Bear River between
Alexander and Grace. In August, it began its seasonal decline.
Water levels in Cache Valley are characterized by larger fluctuations
and earlier spring rises than water levels in other parts of the basin. The
water level in well 16S-40E-29cbcl began to rise in late February, peaked in
April, declined until late June, and then began rising again in response to
22

4 ri1 Si]
8 16S-40E-29cbcl t1 (Cache Valley)~,'\ l'3 ::, rn ,,~/ \
H
~ 12 g; , I \
-~ H
H '.:;!
~ 16 z
~ H
rn
20 H
e--, ~ ~ Ii, 24
13S-44E-26badl
i':i (Bear Lake Valley)
~
100 --- ~ &l ,;------- -e--, 102 rn
i:1 SS-42 -17cabl ( Soda Cr ek Valley) µ'j 0
266 -)7-- i':i e--,
11:1 268 --- rn
~ 9S-40E-13acbl >-<
270 (Gem Valley) ~ A ,-
272 &l &l &l ~
&l &l &l e--, ; &l eJ ; ~ e--, a &l
~ ; rn P'l lil 11:1 >-< rn p:j
>-< ts s: 0 ~ ~ 0 H ~ >-< ts ~
0
~ e--, 0 p:j
~ nc: >-< >-< e--, 0
S;l ri1 0 ri1 ri1 :;J :1 r:; :::, :::, 0 0 ri1 rn 0 z A ..., Ii, ..., <'1 rn 0 z A
1967 1968
FIGURE 8.--Ground-water fluctuations in selected wells. (Locations of wells shown on Figure 7).
23

the nearby application of irrigation water. After irrigation was discon
tinued in August, the water level again declined.
Development Potential
The total number of wells in use in the Bear River basin for domestic,
irrigation, and industrial purposes has increased significantly since 1950.
The trend in domestic wells has been from shallow, large-diameter dug wells
to deeper, smaller-diameter drilled wells. As the total cultivated acreage
increased in the basin, irrigation wells were drilled to supplement the tra
ditional surface-water irrigation system of canals and ditches. Local indus
tries, such as vegetable packing plants in Cache Valley and mineral processing
plants in Soda Creek basin, rely on the steady supply of water obtained from
large-capacity drilled wells.
The hydrologic system in the Bear River basin is capable of providing
increased amounts of ground water and should continue to do so, provided
that future ground-water development does not exceed the sustained yield of
the individual aquifer(s). Although the sustained yields of the aquifers
have not been determined, some general guidelines for planning purposes can
be presented.
Because of their high yields and small drawdowns when pumped, wells in
the basalt aquifers of Soda Creek basin and Gem Valley are best able to
supply additional quantities of ground water. A comparison of the water
levels measured in 1928 (Stearns and others, 1936) with present-day water
levels shown in figure 7 indicates no significant decline in the water table,
despite a large increase in ground-water withdrawals in this 40-year span.
However, some thought should be given to the quality requirements of the water
24

needed, as the basalt locally contains water high in calcium, magnesium, and
bicarbonate. This is especially true near the town of Soda Springs.
The alluvial aquifers generally do not yield as much water as the basalt
aquifers and, therefore, are less able to withstand additional development.
The alluvium in the northwestern part of Cache Valley has the greatest capa
bility for additional development within this hydrologic unit. The wells in
the alluvium of Thomas Fork Valley, Bear Lake Valley, and eastern Cache
Valley have smaller yields. Because only a few high-capacity wells have been
completed in the alluvium of other valleys in the basin, additional data to
appraise adequately, their ground-water potential are needed. Additional
ground-water development in areas previously mentioned as having high water
tables might have the beneficial effect of lowering those water tables, thus
drying up large areas of marshland and thereby reducing the loss of water to
evapotranspiration.
The large number of unsuccessful wells drilled in the Salt Lake Formation
indicate its limitation when considering it as a significant aquifer for
future development. The formation undoubtedly will continue to provide ample
water supplies locally, but until more information becomes available on the
lithology and hydrology of the formation, its potential as a dependable source
of additional water cannot be evaluated.
The Wasatch Formation and the pre-Tertiary formations generally are not
regarded as having good potential for ground-water development. An exception
may be found in pre-Tertiary carbonate rocks from which large springs issue
in the basin.
Relation to Surface Water
As discussed previously, the aquifers in the Bear River basin are gener
ally in direct hydraulic connection with the streams. The slope of the water
25

table throughout most ·Of the basin is toward the streams, and ground water is
discharged from the aquifers into the streams. A hydraulic connection also
exists where the basalt of the Blackfoot Lava Field is recharged by water
from Blackfoot River Reservoir. Between Alexander and Grace the channel of
Bear River is perched above the regional water table and direct hydraulic
connection does not exist.
In areas where hydraulic connection exists, withdrawal of ground water
affects the streamflow. Pumping of wells causes stream depletion by either
increasing the amount of water moving from nearby streams to the wells or by
decreasing the natural ground-water flow that would have dis charged into the
streams if the wells had not been pumped. Ground-water withdrawals in the
area between Alexander and Grace, where hydraulic connection is absent, do
not increase natural stream depletion in that reach of Bear River. However,
these withdrawals decrease the natural ground-water flow that discharges into
other reaches of the river, or into other streams.
The degree to which streamflow is affected is dependent on several fac
tors, including proximity of the well(s) to the stream, the ability of the
aquifers and the streambed to transmit water, and the quantity of water pumped.
It should be noted that because only a portion of the total quantity pumped
is used consumptively, some of the water withdrawn eventually returns to the
stream. Therefore, the quantity of water depleted from the stream is usually
less than the total quantity of water withdrawn from the wells.
No direct measurement of the reduction in streamflow resulting from
ground-water withdrawals has been made in the Bear River basin. However,
graphs and tables indicating the rate and volume of stream depletion both
during and after the period a nearby well is pumped were described by Jenkins
26

(1968) for a hydrologic system in which the stream and the ground water are
in equilibrium. To apply his methods, certain assumptions must be made.
They are as follows: (1) Transmissivity does not change with pumping time;
(2) the aquifer is isotropic, homogeneous, and semi-infinite in areal extent,
with a straight, fully-penetrating stream boundary; (3) water is released
instantaneously from storage; (4) the well is fully penetrating; (5) the
pumping rate is steady; and (6) the residual effects of previous pumping are
negligible. Geologic and hydrologic conditions in the Bear River basin are
such that assumptions 1, 5, and 6 are almost fully met, while assumptions 2,
3, and 4 are only partially met. Figure 9, based on Jenkins' method, is a
graph showing the percentage of the water being pumped from a well that is
coming from a stream at a selected distance after a specified period of
pumping. For example, if a well located 1 mile from a stream and finished
in an alluvial aquifer having a transmissivity of 625,000 gallons per day
per foot and a storage coefficient of 0.20 is pumped for 200 days, then at
the end of that time, 50 percent of the water being pumped is coming from
the stream. The values of transmissivity and storage coefficient used to
draw the curves on the graph are believed to be representative of the better
alluvial and basalt aquifers in the Bear River basin. It should be noted
that the values obtained from these curves represent percentages, and, there
fore, are unaffected by either the volume pumped or the rate of pumping. As
time approaches infinity, the volume of stream depletion approaches the
volume pumped.
The principal value of Jenkins' method lies in its providing a rapid,
theoretical determination of pumping effects that would be extremely diffi
cult and time-consuming to measure in the field. His method is based on
27

100
80
i
40
20
0 0
-- Basalt· tronsmissivity: 2,500,000 gallons per day per foot; ' storage coefficient= 0.10
-- -- Alluvium; tronsmissivity::: 625,000 gal Ions per day per foot; storage coefficient= 0. 20
~
-- ----~
/ /
I
/
/ /
·\e,..... ...... <"'-0 · ~ / ,,. ,,.
-- -----
-----I
I I I I I I I
I I
I I
I I
I I
I I
I
I I
I
I I I
I I I I
I
I I
I
I I
I
I I
/ / ,
/
50
I
I I
I
/ / ,.
I
/
/ /
/ /
/
/ /
/
/ /
/ /
/ ,. / ,
100
referred to in text
150 200 250 300
TIME, IN DAYS, SINCE PUMPING BEGAN
-~ i I
-i
350
FIGURE 9.--Maximum effects of ground-water pumpage on streamflow at selected distances. (Adapted from Jenkins, 1968).
28

sound hydrologic principles and provides a relatively simple way of estima
ting effects of ground-water withdrawals, even though the assumptions made
are seldom completely duplicated under natural conditions. However, the
more nearly the ideal and natural conditions match, the more nearly will the
theoretical answers match values measured in the field. The net result of
the divergence of the actual conditions in the Bear River basin from the
assumed ideal conditions would be to lessen the effects of pumping indicated
by Jenkins' method. This method, therefore, provides quantitative values
indicative of the maximum effect pumping from a wel 1 wil 1 have on streamflow,
provided the values of transmissivity and storage used are reasonably correct.
SURFACE WATER
Figure 10 shows the average annual discharges of Bear River and some of
its major tributaries as measured or extrapolated for water years 1943-67.
The discharges shown on figure 10 represent measured streamflows under the
present level of development; that is, they have not been adjusted for up
stream storage, reservoir evaporation, or irrigation diversions.
The average annual net surface-water contribution from within the Idaho
part of the Bear River basin is approximately 565 cfs, or 409,000 acre-feet.
This quantity is based on an estimate by W. N. Jibson, Bear River Commission,
Logan, Utah (written commun., 1969) and represents the difference between in
flow to the basin from Wyoming 481 (cfs) and outflow from the basin into Utah
(1,046 cfs) adjusted to the 26-year period 1943-68. Because some of the
small streams and canals Jibson used in his calculations were gaged for only
1 or 2 years, the extrapolation of these records to a 26-year period can be
expected to yield only approximate values of total inflow and outflow, and,
29

therefore, an equally approximate value of net surface-water contribution
from the basin.
The Bear River is generally a gaining stream in its course through
Idaho. There is one section of the river channel, however, that probably
is losing water--the reach between Alexander and Grace. The river channel
Between Alexander and Grace is cut in fractured basalt and is perched above
the regional water table. Ground-water contours (fig. 7) suggest that this
reach of the river is a source of recharge to the ground-water reservoir
and that some of this recharge (1) eventually returns to the river through
springs issuing from the walls of Black Canyon, where the river channel is
below the regional water table, and (2) some probably flows northwestward
into the Portneuf River basin. To determine how much, if any, water leaks
out of the channel, discharge measurements at Alexander and Grace, adjusted
for canal diversions in between, should be made and compared.
Direct runoff to the streams in the Bear River basin is derived chiefly
from snowmelt; hence, streamflow on unregulated streams is highest in the
spring and early summer and lowest in the late fall and winter (fig. 11). Be
sides these relatively short-term seasonal fluctuations, there are long-term
fluctuations in discharge as a result of variations in yearly precipitation
(fig. 12).
The effect of stream regulation is evident on the flow-duration curves
shown in figure 13. Bear River at Border is not regulated and consequently
shows a much wider range in flows than stations at Alexander and Preston,
where flow is regulated by upstream dams. Montpelier and Cottonwood Creeks
are not regulated streams and also show wide ranges in flow.
30

Bear River near Preston ----/i
@ 0 0 µ'.I Cl'.l
! fj µ'.I
---~---Bear River
"" 0 100 H p::j :::, 0
;:j ~
µ'.I 0
~ 0 Cl'.l H A
-10 / --1---- / --
Soda Creek'-...
5
I &§ I ~ ~ i :::,
0
~ ~ 8 0
8 ~ µ'.I µ'.I A ...,
"" 1967
~ ,-::i 0 H
~ ~ p:;
~ ~ ;;,.
1968
><
~
Cub - River
-.......'-... '-....
&1 8 ; Cl'.l :::,
~ 0 :::, <'1 rn
FIGURE 11. --Mean monthly discharge for water year 1968 at selected stations.
31

80 16 ~ 0
~ 60 12 Ul Ul
&l ' ~ ' p., ' 0 40 8 z
~ . H " ' ' -' z ~ ' ',-
' H ,' 0 20 ' 4 • ' z H ' /II ' ', 0 :::, ._ __ ,
' H 0 ' ' ~ ' z 0 ' 0 8 H ' H ' ' p., ' ' ' • Cumulative departure from overage ' . , H li1 -- ' V 0 annual d ischorge for Cottonwood Creek '
~ Cl I
~ -20 ' ' -4 ' ____ Cumulative departure from overage annual ' ' ' ' ' 0 precipitation at Groce. Idaho ,.,
Ul H A -40 -8
""' "" 0 LC\ 0 "" t-"SI- "SI- "" LC\ "' "' "' °' °' °' °' °' °' °' ,-l rl ..... rl rl rl rl
WATER YEAR
FIGURE 12.--Long-term discharge-precipitation relationship for Cottonwood Creek and Grace, Idaho.
32

:
~ 0 0 [i1 Ul
! ~ IS;
0 H
8 :z H
~
r:.,-4
~ 0 Ul H A
2500
Bear River at Alexander /
1000 Bear River near
Preston /
Bear River at Border /
100
101-
~ Cottonwood Creek/ ~
1~~~~~~~~~~~~~~~~~~~~~
1 2 5 10 20 50 80 90 95 98 99
PERCENT OF TIME MEAN MONTHLY DISCHARGE WAS EQUALED OR EXCEEDED
FIGURE 13.--Flow-duration curve for selected stations in the Bear River basin.
33

The yields from some of the tributary drainages in the Bear River basin
are inconsistent with the amount of precipitation the drainage area receives.
The drainage area above the gaging station on Cub River receives an average
annual precipitation of about 3 acre-feet per acre. Discharge records indi
cate, however, that the annual runoff past this same gage averages almost 5
acre-feet per acre. The occurrence of solution cavaties in carbonate rocks
along the axis of Bear River Range and numerous springs in the headwaters of
Cub River, suggests that Cub River may be receiving water from adjacent drain
age basins.
WATER QUALITY
Ground Water
The chemical analyses of ground water from selected wells in the basin
are listed in table 4. Figure 7 contains graphical representations of chem
ical analyses by means of patterns (Stiff, 1951). The patterns depict the
concentrations of several ions and afford a ready method to compare the areal
distribution of the different types of ground water. Overall, the ground
water may be classified as bicarbonate in type.
The alluvial aquifers of Bear Lake County contain calcium bicarbonate
water with relatively small quantities of dissolved solids. The dissolved
solids content of the water, which is a measure of the amount of mineral
matter in solution, ranges from 336 to 475 mg/1 for the samples analyzed. The
water temperature averages 10.6°c. (Sl°F)
The major valleys of Caribou County contain water of several types and
quality. Most of the wells are finished in basalt and yield either a magne
sium bicarbonate or calcium magnesium bicarbonate type water.
34
•.

Many of the wells near Soda Springs contain water that is high in magnesium
bicarbonate and that chemically resembles the water from carbonated springs
in the same area. The dissolved-solids content of the water from wells sam-
pled in the part of Caribou County that lies in the Bear River basin ranges
0 0 from 422 to 998 mg/1 and the water temperature averages 12.2 C. (54 F)
Ground water in the Idaho part of Cache Valley (Bannock and Franklin
Counties) is heterogeneous in its chemical character. Predominant water
types include calcium bicarbonate, calcium magnesium bicarbonate, sodium cal-
cium bicarbonate, and sodium magnesium bicarbonate. The dissolved-solids
content of the analyzed water ranges from 286 to 632 mg/1, which is higher
than water in Bear Lake County but lower than water in Caribou County. The
temperature of the water averages 13.9°c. (57°F)
In general, the ground water of the Bear River basin, with the exception
of the wells near Soda Springs that produce high bicarbonate water, is
suitable for most purposes. Generally, the water meets the drinking-water
standards established by the U. S. Public Health Service (1962) for the con-
stitutents analyzed, although the dissolved-solids content commonly exceeds
the recommended maximum of 500 mg/1. The iron content of several springs,
and possibly some wells, in the Soda Springs area also exceeds the 0.3 mg/1
concentration recommended by the above-mentioned drinking-water standards.
The water is quite hard, therefore, many domestic-well owners use water
softeners.
The ground and surface waters in the Bear River basin are classified
in figure 14 according to their suitability for irrigation. This classifi-
cation, developed by the U. S. Salinity Laboratory Staff (1954), is based on
the specific conductance and SAR (sodium-adsorption ratio) of the water.
35

C 0 "' ...
0 w k 0 • Well No. " " 'H
"~ .,., l'l -;; 0
er u <
13S-38E- 3ddal 3-26-65 QA
11S-44E- 7ccbl 7-23-68 TA 12S-43E-25daal 7-23-68 QA
"' 12S-44E-33dccl 7-23-68 QA "' 13 s-43E-16dcc 1 7-23-68 QA
13S-44E- 3bdal 7-24-56 QA
13S-44E- 3bddl 7-24-56 QA l3S-44E- 4adcl 8- 5-64 QA l3S-46E-26bcal 7-23-68 QA 14S-43E-35bbal 7-23-68 QA 14S-44E-12cccl 7-23-68 QA
8S-42E- 7bdal 7-23-68 8S-42E-l5bbcl 1-17-67 QI 8S-42E-3ladbl 7-23-68 QI 8S-42E-3ladcl 4- 6-67 QI 8S-42E-3ldabl 4- 6-67 QI
8S-42E-32bdl 3-31-67 QI 9S-40E-27dcdl 8-18-61 QI 9S-40E-29cccl 8-16-61 QI
lOS-40E- 3dddl 8-15-61 QI
Table 4.--Chemical analyses of ground water from selected wells in Bear River basin. (Chemical constituents in milligrams per liter)
Aquifer: T - Tertiary Analyses by: I - State of Idaho f! - Quaternary C - Commercial A - Alluvium G - U.S. Geological Survey I - Basalt B - U.S. Bureau of Reclamation
~ 'O M • 00 0 , 'O u ~ ~ ...
~ "' " 0~ ~ :!f ~ ~ ~ ~ ~ 0 00 0 N ~ "' " ~ ~ M 0. 00 00
0 " ~ ~ ~ " 0 " "" 0 ~ ... ... u " w VO ~ ~ z A VO ~ s 2:. s " ~ ~ " ,;;-~ 0 0 " " • w s •.< '" 0 • 'O " • " ~
" 0 00 s 00 .0 w •e ·rl w .c 0 ... • ..'l 00 k " k >< " 0. " .,., 0 " " " 4,; 0 0 k 00 0 ~ w ,...,
~ "" 'O w u ,..., - 0 w 0 k - C >< •.< " 0 0 °' ... 0 - ... .c 0 00 0 "
w 'H
' " k u
VO u >'l "' "' 0. "' "' 6 "" z 0. "' E w C- "
Bannock County
91 29 7.6 33 78 0.25 0.5 450 0.61
Bear Lake County
12 74 30 5.0 1.0 7.7 310 48 3.3 0 9 .1 0.01 350 .48 40 61 27 16 4.6 7.8 292 30 17 .1 2.8 .04 351 .48 12 91 30 10 1.0 7.8 336 74 6.7 .1 14 .02 426 .58 23 66 20 30 1.0 7.7 340 0 27 .2 . 5 .12 351 .48 1.8 71 28 7.4 310 70 3 .1 1.0 0.09 336 .46
1. 7 71 27 7.3 290 68 7 .1 1.0 .09 352 .48 3 6.4 12 106 5 . 3 . 5 360 .49
11 66 37 10 1.0 7.8 240 90 19 .1 9.1 .02 408 .55 19 67 26 17 1.9 7.9 356 12 12 .1 1. 9 .03 336 .46 15 83 34 39 2.1 7.7 352 74 40 .1 4.1 .07 475 .65
Caribou County
29 75 so 8.2 3.0 7.3 464 23 8.1 • 3 6.4 .01 422 .57 176 55 48 7.7 183 81 2.3 24 3.8 674 .92
44 38 60 48 6.9 7.6 392 147 59 1.5 9.5 .16 684 .93 32 7.5 427 68 30 27 7.3 464 84 50
16 115 44 7 .1 537 30 13 675 .92
69 43 31 6.3 7.8 375 61 37 .03 460 .63 60 54 45 5 .1 8.3 350 84 48 .07 508 .69 84 56 50 10 8.0 468 86 58 .07 619 .84
"~ ~
OU " C e 00 ". C
" w "' 0 ON •e
00 0 s w 00 " w 0 o.~ • 0 "
... k"'
C 0 'O o< >, 'O u 00 0 oo VO ,D k M 0 00 'O ~
" 0 .~ ii " 00 .cu w 0 •e
" 4,; 0 C s ... 00 ~u •C >< " 0 w >,
" u u 0 '" " ~
w " .,., k 'O k "' {?, o. E " 0 C V, ~ 0. "' <
342 I
308 551 3.4 0 .1 G 264 539 11 .4 G 352 652 5.9 . 2 G 248 576 21 .8 G 296 I
294 I 8 I
316 607 6.5 . 3 G 276 556 12 .4 G 348 765 20 . 9 G
392 718 4.4 • 2 G 670 . 8 I 466 1,010 18 1.0 G 380 800 C 420 950 C
468 900 C
764 16 . 7 B 829 21 1.0 B
1,007 19 1.0 B

Table 4 .--Chemical analyses of ground water from selected wells in Bear River basin--Continued,
w ~ ~
uu " ~ " " "' 00 "' 0
.., 0 0 " LJ "'
~ 0 u ~ UN ·•
~ " cJ "O 00 f6 8 LJ ~
~
~ ~ ~ ~ ~ ~ w 00 u " p."'
N ~ "' st ,... ~ "' '" > 00 w 0 " ·• H-< 0 "' ~ ~ w 0 u '" 0 ~ ~ "O 0 0 "O 0 Ul >,
0 ·• u "' LJ Ul ~ ~ 3 0 ·• ·o u 00 0 00 ~ .0 0 Ul ~ s z 8 "
~ w ~ 00 ~ H "' 0 m " '"4 ·• ~
" ~ " 0 w 0 u "' 00 0 00 ~ ii • 0 00
Well No. 0 LJ H 8 •S .... 0 0 "O "O 0 • ~ ;s 00 .0 u u 0 .• , u 0 • " 00 8 00 .0 LJ . .., ·• u .0 • ' 0 0 8 ·• m
0 0 '"4 u ·• 0 0 00 H "' H H • p. 0 ' rl u .., H " " u ,., u~ . .., . .., 0 0 . ..,
" " '"4 0 0 H 00 0 ~ l 00 w " 0 u 0 . ..,
" ~
I'!~ 0 ~ ~ 00 "O LJ 0 ~ ~ " u 0 H - " H HU u " . .., H "O H ru er ...,
"' ~ 0 0 "' ·• a "' ~ . .., "' 0
11' 2 w 0 '"4 0 p. 8 0 a " u ..,, Ul u Ul ~ p. "' u '" z '" "' C, m h Ul ~ '" <
Caribou County--Continued
10S-40E- 5bddl 8-11.-61 QI 58 53 47 5.1 8.1 367 76 51 0.10 500 0.68 830 22 1.1 B 10S-40E-12aabl 3-24-46 QI 70 39 7.3 64 38 0.3 492 .67 335 I 10S·40E· 14bbal 7-22-68 23 59 48 34 4.9 7.8 360 51 38 .5 12 .03 454 .62 344 760 17 . 8 G 10S-40E·24badl 8-17-61 QI 67 62 50 7.8 8.1 401 96 62 .21 598 .81 974 20 1. I B 10S-40E·36dcc l 7-22-68 QI 27 62 57 39 5.2 7.8 412 70 42 .5 13 .05 520 . 71 390 852 18 .9 G
"' •O 10S·41E· 18dcc 1 8-17-61 QI 85 34 35 4.3 7.9 352 70 42 .06 487 .66 792 18 .8 B 11S-41E·30bddl 7-22-68 28 128 78 89 3.6 7.8 520 228 98 .3 27 .15 998 1.4 640 1, L~30 23 1. 5 G
Franklin County
13S-40E-30acbl 7-19-68 QA 21 69 30 21 1. 9 7.6 326 22 30 .4 13 0 368 .so 296 625 13 . 5 G
14S-38E-22abal 3-11-68 QA 28 69 14 -21· 7 .4 279 16 19 5.1 303 .41 231 504 .6 G 14S-38E-22ccbl 7-19-68 QA 32 62 20 9.2 2.4 7.9 277 16 13 . 3 1.0 0 286 .39 236 472 7. 7 . 3 G 14S-38E-26adcl 7-16-68 QA 28 75 21 15 4.0 7.7 310 17 26 .2 4. 7 .02 340 .46 274 566 10 .4 G
14S·39E· 8adal 7-18-68 QA 34 72 33 69 3.2 7. 7 32L~ 61 85 . 7 9.8 .08 531 • 72 314 880 32 l. 7 G
14S·39E·25addl 7-22-68 QA 45 89 35 58 5.6 7. 9 496 40 30 . 5 4,0 .24 550 .75 364 866 25 1. 3 G
15S-38E· llbbcl 7-19-68 TA 31 27 54 57 7.7 7. 8 312 59 68 .8 4.1 .08 462 .63 288 779 29 1. 5 G
15S·39E·23bbbl 7-18-68 38 68 59 29 4.0 7.8 492 24 36 .5 . 5 .08 486 .66 414 831 13 .6 G
15S-39E·3labdl 7-21-68 QA 21 52 43 9.2 4.9 7. 8 356 13 12 .3 17 0 333 .45 308 564 6.0 . 2 G
15S·40E-32bbal 7-21-68 QA 37 46 37 23 5.4 7.7 304 27 29 . 5 8.8 .02 369 .50 268 591 15 . 6 G
16S-38E- 6aaal 7-16-68 TA 35 95 40 62 10 7.8 372 91 95 . 5 12 .02 632 .86 400 1,020 25 1.4 G
16S-38E-24acbl 7-16-68 QA 68 60 29 80 19 7.8 414 5.0 84 .4 .6 .47 533 .72 268 872 37 2. l G
16S·40E-l7bbbl 8-13-68 QA 53 34 18 111 8.3 7.8 352 11 81 1.3 .6 0.01 .10 486 .66 160 793 59 3.8 G
16S-40E-20cdcl 4-17-68 QA 35 45 21 -49- 7.8 295 12 36 1.7 338 .46 200 570 1.5 G

100 2 3 4 567891()00 ,--EXPLANATION
2 3 4 5000
Na 30~
281 I
26h;
Sodium-Adsorption Ratio (SAR) s f~+Mg where concentrations are expressed in williequivalents per liter
-4 > I
I
~ I
~I"' 1 24 ~@ Wells finished in alluvium and the
:x:1 : Salt Lake Formation I ! i I
: i I Ge 22r@ Wells finished in basalt
~~!II.I .. 41 I ~ 20r@Major NI ' k «1 1 , o For
tributaries excluding Thoffias and Trout Creek
:x:' !' ! .... _ i <1 I~ ~
· ©Main stem cf Bear River and Trout Creek - I er ~I~ ~ :::.CI :, 0 ..J Q N
16r- © C Thomas Fork .... .. "' - ~
~ ::, _, o: 0
"'
0.. a: 0
"' 0 .. I
'
Cl-52 12f-
~ c i 10~ C2-S2
8~ ~
C3-S3
C3-S2
~ 0 -.J
I- ~-6( ..._,___ __________
Cl- SI
L C 2- SI '
2~
o,c__ __ _L
100 250 750 2250
C4- S3 -,
~
--1 C4-S2 i
~ ""1
---1 C4-SI
C' ("l.s, SPEC I Fl C
.J' CONDUCTANCE IN MICROMHOS PER CM AT 25°C I
I 2 3 4
LOW MEDIUM HIGH !VERY HIGH
SALINITY HAZARD
FIGURE 14.--Suitability of ground and surface water for irrigation. (From U. S. Salinity Laboratory Staff, 1954).
38

As shown by this figure, almost all the wells finished in basalt produce
water that is low in sodium (Sl) but high in salinity (C3). Because of its
high salinity, this water should be used only on salt-tolerant crops and on
soils having good permeability and drainage. Approximately half the wells
finished in alluvium (including the Salt Lake Formation) yield water that
falls into the same category as the basalt wells. The other half of the al
luvial wells produces water that has only medium salinity (C2). This water
is satisfactory for most crops, provided a moderate amount of leaching takes
place in the soil.
Surface Water
The water of Bear River and its principal tributaries is primarily a bi
carbonate type with either calcium or magnesium being the predominant cation
(fig. 10). The surface water is generally lower in dissolved solids than
ground water in the same basin. As in most river basins, the concentration
of dissolved solids is proportionately greater at low flows than at high
flows because low flows have a proportionately greater ground-water contribu
tion. Chemical data for selected stations are given in table 5.
Prior to entering Bear Lake for offstream storage, Bear River contains
a calcium bicarbonate type water that is similar to most of the large tribu
taries. Water that is released from the lake has a higher magnesium concen
tration and a higher ratio of magnesium to total cations than water entering
the lake from Bear River. The increase in the total amount of magnesium is
due to the fact that Bear Lake water is higher in total dissolved solids than
the Bear River water entering it. The magnesium ions in the lake water are
concentrated by evaporation while some of the calcium ions are removed from
39

Station
Bear River at Border
Thomas Fork -State line
Thomas Fork near Border
Bear River at Harer
qainbow Inlet Canal
Montpelier Creek
St, Charles Creek
Bloomington
C
4../ ,,8 0 LJ
u 0 0 LJ -
~~ u
7-23-68
7-23-68
7-24-68
7-23-68
7-23-68
7-23-68
7-25-68
Creek 7-23-66 Bear Lake
Outlet Canal 7-23-63 Bear River at
Pescadero 5-15-68 Georgetown
Creek 5-14-68 Ei~htmile Creek 7-23-68 Bear River at
Soda Springs 7-23-68 Soda Creek 9-11-67 Bear River at
Alexander 7-22-68 Bear River be-
low Blk, Can. 7-22-63 Trout Creek 7-22-63 Bear River at
Cleveland Cottonwood
7-23-68
Creel, 7-23-68 Bear River
below Oneida 7-23-68 Mink Creek 7-23-68
0
"' u-• • .0 ~ u u . --e
p
(355)' 10
23 7.0
33 10
363 11
350 11
17 10
SC.. 4. 7
23 5 .2
918 11
121 8. 7
37 7. 1 11 5. 7
887 11 3.5 25
1,110 10
75 20 26 18
958 15
7.8 12
1,890 13 40 5.9
Bear River near Preston 12-19-67 (1,000).y 14
Battle Creek 7-22-68 .22 23
Deel) Creek Cub River
7-22-6,'l 7-23-68
2.3 15 65 4.6
~(n) = Mean daily discharge.
64
55
69
68
68
65
51
46
44
57
57 53
50 59
54
52 75
61
52
72 47
57 8(J
43 48
E 0 -e -0
32 37
13 93
25 88
32 41
32 39
0 ~
15 8.6
17 6.7
15 1.1
52 39
31 33
15 6. 3 6 .4 . 5
43 36 46 8.0
40
47 20
40
34
38 35
36
8.9 2.8
33 40 8.0 4.1
41 30 36 131
38 136 9.2 2.6
!j ·• • • • LJ 0
'" 3.0
2.4
2.6
4.0
3.5 3.2
3.5
4.9
4.3
4.4
'" 0.
7.8 316 67
7.9 224 40
8.0 272 52
7.9 312 59
7.8 324 58
7.7 221 57
7.8 248 3.2
7.9 210 4.0
8.1 336 67
8.0 258 76
7.8 220 7.6 136
7. 8 316 7 .8 400
33 4.8
60 25
7.7 320 55
8.1 342 62 8.0 348 36
7.9 344 57
7.6 190 7.0
8. 1 346 59 7.7 186 3.8
32
119
132
45
41
1. 5
2.6
1. 7
44
35
1. 5 1. 5
38 6.5
36
39 13
37
6.6
40 1. 5
0.3
.5
.3
• 7
.3
.3
.3
2.2
2.3
8.2 341 52 32 0.2 8.1 480 76 112 8.0 296 66 175 7.8 192 3.8 1.2
0.2 0.09 404 0.55 292
.1 0.02 447 .61 190
2.8 .06 508 .69 275
1.1 .01 .06 402
1.0 .02 .07 405
0 0 278
.4 0 208
.3 .01 176
.6 .01 .09 427
1.3 .11 390
. 9 1. 9 237 173 0 0
J..O .07 .07 .02
385 355 2.6 0
1.6
3.0 6.1
2.2
.08
.10
.40
.07 382
.08 418 383
.18 .09 413
.55 301
.55 301
.38 224
. 28 196
.21+ 176
.53 270
.32
.24
. 52 ,ti-8
. 52
.57
. 52
302 336
323 270
. 56 316
.l 0 188 . 26 166
1. 9 . 14 0.8 0.08
434 • 59
163 0. 22 315 150
0 ~ uu 0 • 0 LJ ~ UN 0
-0 LJ 0 • 0 u •
0 u .0 "" E ~ 0 •O U u u o -e o E ~-707
802
887
694
692
442
370
320
772
633
394 293
673 619
665
717 622
709
315
729 285
1.9 3.4
.8
.3
O. 06 393 . 53 ,30 698 .95 .05 63C .R6 .03 167 .23
310 692 348 1,15(1 262 1,] lf 158 291
21
52
41
23
22
21
21
6 l
20 5
20
20 22
20
0 0
"" LJ o. u~ 0"' . " ·o ~ . -s .s
·M .j..J
·o • 0 U ~
0.9 G
2.9 G
2.3 G
1.0 G
1.0 G
.2 G
.2 G
0 G
. S G
. s, C
.2 G 0 G
.9 G
. 2 G
.l;
.9
.9
G
G G
• 9 (;
4 .1 G
22 1.0 G
6 0.1 G
17 . 7 G 45 3. 0 G :'1 'L 7 G
3 .1 G
• ro ro 0 n ro 0

:
solution and precipitated as calcium carbonate. In shrinking from its maxi
size during the Pleistocene epoch to its present size, the water in Bear
Lake probably became even more concentrated than it is today. The diversion
of Bear River into the lake has apparently diluted the lake water and
improved its quality (L M. Waddell, oral commun., 1969). This dilution
process has probably not reached an equilibrium yet, and water in Bear Lake
may gradually change in quality for many years. After the water is released
from the lake, Bear River is diluted by the calcium bicarbonate type water
from tributaries and the percentage of magnesium in the main stem decreases.
The principal tributaries to Bear River, with the exception of Thomas
Fork and Soda Creek, contain calcium bicarbonate water with relatively small
quantities of dissolved solids. At low flows the water in Thomas Fork con
tains a fairly high concentration of sodium chloride. This salt may have
been dissolved from salt beds within the Preuss Sandstone of Jurassic age,
which crops out in the headwaters of Thomas Fork. Comparable salt beds were
considered to be the source of saline springs in the Afton, Wyo., area
(Walker, 1964, p. 168). At high flows, the percentages of sodium and chloride
ions in the water are reduced and the water changes from a sodium and chloride
type to a calcium bicarbonate type. Soda Creek, which is almost entirely
spring fed, is the only principal tributary to Bear River that contains magne
sium bicarbonate water. Most of its flow is diverted into the Soda Canal
and transported to Gem Valley where it is used to irrigate crops and water
stock.
The chemical analysis in figure 10 and table 5 labeled "Bear River below
Black Canyon" actually represents an analysis of water discharging from the
Black Canyon springs. The entire flow of Bear River is put into penstocks at
41

the head of the canyon just north of Grace and, therefore, does not flow
through the canyon. Bear River flow returns to its natural channel below
Black Canyon after having passed through a hydroelectric plant. The simi
larity between the analysis just mentioned and the analyses for Bear River
at Alexander and Bear River at Soda Springs supports the theory of leakage
from the river channel between Alexander and Grace, and return to the
channel by way of the Black Canyon springs.
There are streams in the basin, such as Deep Creek and Battle Creek in
Cache Valley, that contain water with extremely large quantities of dissolved
solids, but the discharges from these streams are so small that the overall
effect on the water quality of Bear River is insignificant.
The surface water of the Bear River basin is suitable for most purposes
and generally meets the drinking-water standards established by the U. S.
Public Heal th Service (1962) for the constituents analyzed. The chloride
content of Thomas Fork at times exceeds the recommended 250 mg/1 limit, but
this occurs only at very low flows. Figure 14 indicates that water from the
main stem of Bear River and its principal tributaries, with the exception of
Thomas Fork, is satisfactory for irrigating most crops, provided a moderate
amount of leaching takes place in the soil. The high salinity (C3) of water
from Thomas Fork limits its use for irrigation to salt-tolerant crops and
soils having good permeability and drainage.
SPRINGS
The Bear River basin contains hundreds of springs. These springs can
be classified according to the chemical types of the water they discharge,
which are calcium bicarbonate, magnesium bicarbonate, calcium sulfate,
42

sodium chloride, and magnesium bicarbonate sulfate. Chemical analyses of
water from representative springs are given in table 6. Spring locations
are shown on figure 10.
Springs having a calcium bicarbonate type water are by far the most
common and represent what might be called the "normal" springs of the basin.
Included are practically all the springs that issue from fractures and
solution openings in the bedrock hills. Also included are Big Spring (9S-
42E-18blS) and Formation Spring (8S-42E-27clS) that issue from basalt and
travertine, respectively. Springs issuing from the bedrock have water tem
peratures ranging from s 0 to 10°c, (41° to so°F) which correspond to the
mean annual air temperature.
The "soda" springs near the town of Soda Springs yield a magnesium bi
carbonate type of water. Most of these springs issue from basalt, but others
emerge from sources that are covered by extensive deposits of travertine.
Several of the larger springs, such as 8S-41E-23alS, constitute the headwaters
of Soda Creek. The bicarbonate content of these spring waters is unusually
high and carbon dioxide gas can be seen bubbling out of the water. The iron
content is also high and it generally precipitates as a rusty deposit.
Soon after the construction and filling of Blackfoot River Reservoir,
the discharge of the springs at the head of Soda Creek increased and many new
springs developed in the Fivemile Meadows area. If the increase in spring
discharge was due to reservoir leakage, the water coming from the springs
today probably is a mixture of Blackfoot River water and the type of water
originally issuing from the springs. The water temperature of these springs
ranges from 10° to 13°c.
43

Table 6 --Chemical analyses of water from selected springs in the Bear River basin
"O ID ,;;;' ID u~
" ~ > m cu z 0 "' rl "O m " 0
o,o " .,; 0 Q.,; "' µ v> ~ 0 µ u ~ mrl UN .,; u
" 2:, .., m 0 m " 9 µ ID Q ~ ~ ~ 0 .,; m ~ "O µ r:;"~ rl N ,;;;' 6
.., rl ~ "' !::, Cl ID " " .,;
Spring No. rl ID ID 0 ,;;;' ~ ID 0 2, '" 0 " 0 "O 0"' >-0 H H •M 2, µ ::'.:, ~ s " u m 0 m uo .0 u " " ::'.:, 9 c 9 " ID ;;;- H "' 0 m "~
µ~ µ~ 0 ID ID µ "0 u .c: "' m 4< "u "' '" 9 .,; .,; 0 ID "O "O ID " µ .c: u .,; s µ 0 .,;
0 HO HO " ~ 9 m ~ µ .,; .,; µ .c: "" " "" 0 " S •M m
ID~ ID '-' u .,; ID ~ " h H " " 0 ' rl u .,; H ID "µ >-ID fr fr .,; u " .,; " " 4< 0 0 H ~ 0 rl ~ ID "' u u u .,; " rl
µ rl rl "' "O µ u rl rl " µ 0 H ~ 0 h H µ ID.,; H -0 H "' " ID ID •M "' " 0 0 'a .,; " .c: rl .,; .c: 0 "' 0 ID u 0 "s ID 0 ;i. Cl f- f- "' u :,: "' 0. "' <fl u '" z 0. "' s µ " "' f-, ,n~ 0. ,n
Bear Lake County
.,. 15S-44E-13clS Aug. 1914 48.4 118 26 213 221 149 41 1,030 797 92 0.2 2.0 G ..,. Caribou County
8S-41E-23a!S 6-28-23 12.8 55 151 163 -42- 1,298 57 11 .07 .5 G
8S-41E-36d!S 10-19-63 II. I 52 69 150 161 -48- I, 293 66 9.6 1,149 1. 6 1,035 .08 .6 G
8S-42E-27c!S 7-23-68 11. 7 54 10 120 49 3.8 1. 2 7.8 560 32 3.3 0 0.4 - 0.01 502 .68 500 842 I. 7 . 1 G
8S-42E-36a!S 6-28-23 9.44 49 119 149 -20- 1,074 55 11 .04 .3 G
9S-42E- 6blS 6-28-23 10.6 51 162 168 -19- 1,281 67 12 .03 • 2 G
9S-42E-13b!S 6-28-23 13.3 55 165 62 -25- 199 537 .07 .4 G
9S-42E-18b!S 7-22-68 10.0 50 23 124 61 16 3.5 7.8 508 87 65 0.2 9.1 - 0 715 .97 560 1,030 5.8 . 3 G
Franklin County
13S-41E-7a!S 7-22-68 71.0 160 52 69 31 494 76 7.8 424 255 595 .9 3.5 - I. 5 1,830 2.5 300 2,940 73 12 G
15S-39E-8b!S 3-13-68 77 .0 171 72 154 18 -3,340- 7.1 704 26 5,050 2.6 9,180 12 460 14,900 94 68 G

In 1937, a well was drilled in the town of Soda Springs near a spring
producing a magnesium bicarbonate type water, The drill stem reportedly
penetrated a zone of high-pressure carbon dioxide gas at a depth of 315
feet, A control valve was installed and the well now has a pressure head
of about 100 feet above land surface,
The springs in Sulphur Canyon (9S-42E-13blS) contain a calcium sulphate
type water, They were described by Richards and Bridges (1911, p, 5) as
having cold water that is cloudy from the presence of free sulphur, and as
giving an acidic reaction to litmus paper, Carbon dioxide and hydrogen
sulphide gases bubble from the numerous spring vents and from the marshy
ground surrounding the springs (Mansfield, 1927, p, 319),
At least two thermal springs having a sodium chloride type water are
associated with faults, Maple Grove Hot Spring (13S-41E-7alS) lies along a
fault line at the base of the canyon wall near Narrows Plant Reservoir, The
water has a temperature of 71°c (160°F) and a chloride concentration of 595
mg/1, Spring 15S-39E-8blS is approximately 2 miles southeast of Clifton
Hill, a hill composed of bedrock and surrounded by younger alluvium, Clifton
Hill is probably bounded by faults along which the ascending spring water
moves, The water has a temperature of 77°C (171°F) and the concentration of
chloride was determined to be 5,050 mg/1, The source of the sodium chloride
in the water from these springs is not known,
According to a chemical analysis published by Mansfield (1927, p, 321),
the thermal springs near Mud Lake, 15S-44E-13clS, discharge magnesium bicar
bonate sulfate water, These springs, some of which are used to supply a
local swimming pool, lie along a major fault on the east side of Bear Lake
Valley and have water temperatures of about 49°C, (120°F)
45

SUMMARY AND RECOMMENDATIONS
The Idaho part of the Bear River basin receives an average of 2.3 mil
lion acre-feet of precipitation per year. The areal distribution of this
precipitation ranges from less than 10 inches in Bear Lake Valley to more
than 45 inches on the Bear River Range.
Ground water occurs in the alluvium of the valleys, the basalt of Soda
Creek basin and Gem Valley, the Salt Lake Formation, the fractured bedrock,
and possibly in the Wasatch Formation. The basalt and alluvium are the most
productive aquifers and are best able to support additional ground-water
development. Reported well yields are as high as 3,500 gpm from the basalt
and 2,500 gpm from the alluvium. The principal sources of recharge to the
aquifers include direct infiltration of precipitation, spring snowmelt and
runoff, seepage of irrigation water, and losses from irrigation canals.
Basalt in the Blackfoot Lava Field is recharged, in part, by leakage from
Blackfoot River Reservoir and ground water may be flowing through the basalt
in Tenmile Pass into the Portneuf River basin. Basalt in Gem Valley is re
charged, in part, by ground water flowing past Alexander. A portion of this
water flows northwestward into the Portneuf River basin.
The Bear River is generally a gaining stream in its course through Idaho,
with the possible exception of the reach between Alexander and Grace. Ground
water contours suggest that this reach of the river is a source of recharge
to the ground-water reservoir and that some of this recharge eventually returns
to the river through springs issuing from the walls of Black Canyon.
The average annual net surface-water contribution from within the Idaho
part of the basin is about 565 cfs, or 409,000 acre-feet per year.
46

:
Ground water in the study area tends to be predominantly calcium and
magnesium bicarbonate in type. The dissolved-solids content of the water
sampled from wells ranges from 286 to 998 mg/1. The ground water is suit
able for most purposes, but water from all the basalt wells and about half
the wells that tap alluvium is saline enough that it should be used to irri
gate only salt-tolerant crops grown on soils with good permeability and
drainage. The surface water of the basin is also of a bicarbonate type, but
generally is lower in dissolved solids than the ground water. In general,
the surface water is suitable for most purposes, but low flows in Thomas Fork
contain high concentrations of sodium and chloride ions, thus restricting its
agricultural use.
Hundreds of springs of various sizes and having several types of water
occur throughout the basin. Many of these springs are utilized for domestic
water supplies.
A fuller understanding of the hydrologic intricacies and interrelations
within the Bear River basin, and the hydrologic relations between the Bear,
Blackfoot, and Portneuf River basins will require that several facets of the
geology and hydrology of the area be studied in detail. Additional informa
tion on the hydrologic characteristics of the aquifers and the amounts of water
moving through them is needed. Values of transmissivity and storage coeffi
cient should be determined from controlled aquifer tests at selected sites.
Also needed is a detailed description of the aquifer(s) within the Salt Lake
Formation and a determination of whether significant aquifers exist in the
Wasatch Formation and the pre-Tertiary bedrock.
A quantitative hydrologic budget of the Bear River basin should be pre
pared. In addition to the factors normally considered in a water budget, it
47

would also be necessary to determine: (1) The quantity of water leaking into
the Bear River basin from the Blackfoot River basin; (2) the quantity of
ground water, if any, flowing through the basalt in Tenmile Pass; (3) the quan
tity of water, if any, being lost from the channel of Bear River between
Alexander and Grace; and (4) the quantity of ground and surface water, moving
from Gem Valley into the Portneuf River basin. Once the hydrologic character
istics of the aquifers and the amounts of water in each phase of the hydrologic
cycle are known, an estimate of the basin's perennial yield could be made, as
well as an appraisal of plans for future water development.
Finally, a detailed investigation should be made to determine the chemical
effects of diverting Bear River water into Bear Lake for storage. Although
Bear River water has been sampled extensively, very few samples have been taken
from the lake. This investigation should be of a continuing, long-term nature
and could be included as one phase of a comprehensive limnological study of
Bear Lake.
RECORDS OF WELLS
Table 7 presents data on representative wells inventoried in the Bear
River basin during the course of this investigation. An attempt was made to
visit all the large-capacity wells and enough of the smaller wells to obtain
an average of one well per square mile in the populated parts of the basin.
It is believed that the resulting compilation shows good geographic distri
bution and is hydrologically representative.
The data were obtained by inspection in the field, interviews with well
owners, and from drillers' reports submitted to the Idaho Department of
Reclamation.
48

:
Table 7 lana.t.ion
(Boxhead explanations are abstracted from U, S Geological Survey 11 Instructions for using the punch--card systern for the storage and retrieval of ground-water data.")
Well number: See text
Owner: Glos t recent O\\'Der at time of irrventory
Oimership: C County ?\ Corp_ or Co
~i City P Private
Use of 11ater: C Commercial P PuJJl1c Supp
H ~omestic S Stock
I Irrigation U Unused
N Industrial
Use of well: U Unused hi \Vi th draw
Specific Conductance:. 151-300 micromhos per cm at 2s 0 c
301-500 m1crorrihos per cm at 2s0c
501-1,000 m1cromhos per cm at 2s°C
1,001-2 ,000 micromhos per cm at 2s0 c
2,001-5,000 rnicromhos per cm at 2s 0 c
Log data: D Driller's 7 Had1a.t1on, ternperature, fluid-conductivity, and
J Gamma-ray driller 1 s logs
Depth of well: Depth, in feet below land-surface datum, as reported by oivner,
driller., or others, or as measured by the U S, Geological Survey,
Depth cased: Length of casingi 1n feet below land-surface datum, to the top
of the first ion ) or opening-
Diameter: Inside diameter of the \Yell J in inches; nominal inside diameter,
in inches, of the innermost casing at the surface for driller cased
wells,
49

We 11 finish: F Gravel wall, perforated or slotted
0 Open end
p Perforated or slotted casing
s Screen
w Walled or shored
X Open hole in aquifer
Method drilled: A Rotary H Hydraulic rotary
C Cable-tool V Driven
[J Dug
P Piston Lift type: C Centrifugal
J Jet S Submergible
Power: 1
2
M Multiple (turbine) T Turbine
N None
Hand 4 Diesel engine
Natural gas engine M 0-50 hp
B 20-50 hp 5 Electric motor
C 50-100 hp s 0-1 hp V
D 100-200 hp T 1-5 hp w
3 Gasoline engine u 5-15 hp
casing
15-100 hp
100-hp
Altitude of lsd: Altitude of land-surface datum, in feet, above mean sea
level. Land-surface datum is an arbitrary plane closely approximating
land surface at the time of the first measurement and used as the plane
of reference for all subsequent measurements.
Water level: Depth to water, in feet, above (+) or below land-surface datum.
Water levels given as "flow" indicate that the water level above lsd
was not measured at the time of inventory.
50

:
Date measured: Month and year of the water-level measurement.
Yield of well: Yield, in gallons per minute
Drawdown: Difference, in feet, between the static water level and the pumping
water level.
Pumping period: Length of time, in hours, well had been pumped when the indi
cated drawdown was measured.
B 15-30 minutes
C 30-45 minutes
51

Table 7. Records of wells in the Idaho Eart of the Bear River basin. Cl
'D U] 'D rl <ll ...,
rl 0 H rl rl 'D rl •rl <ll rl <ll <ll 'D ~ rl <ll 4--< <ll H
Well number Owner ,_, rl () :< <l) "' •rl rl 0 Water level :< <l)
p. " <l) u@ "' •rl H rl <ll p. .,-1 ;3:: ~ " 4--< " H
" 'D •rl p. <ll 4--< " ~ •rl<-' ,_, 0 () <ll •rl H » 'D 0 " b1)
"'4--< 4--< 4--<U " ,_, 4--< 'D 'D ,_, ::,
Depth Date 0 " H O O ·rl::l 'D ~ ~ <ll 0 H ,_, 'D 'D •rl (I) U-0 ,_, ,_, s rl ~ H ,_, <ll ·rl rl :< gr " <ll <ll "'" b1) p. p. " rl ,_, "' 4--< :< ,_, to meas- <ll " :< "' "' PO 0 (jJ <ll •rl <ll <ll (l) •rl 0 rl
water ured •rl H ::, 0 ;::> ::) U]() ..., Cl Cl g ;; ;z >:-, ..., a. < >:-, g Q,
IDAHO - BANNOCK COUNTY
13S/38E-03DDA1 Swan Lake, Idaho M P IV D 105 59 08 p C 1953 T U 4857 35 13S/38E-03DDC1 Wayne Millard p u u DJ 382 47 16 p C 1961 N 4835 27 7-67 13S/38E-04MB1 Gene Sorensen p H w J 94 30 08 p C 1962 N 4795 30 7-67 90 90 l3S/38E-08ABB1 Kay Gibbs p I IV 405 130 12 p 1950 TM 4917 46 7-67 13S/38E--10CCC1 Robert Hadley p u u 505 DJ 310 109 16 p C 1965 N 4795 FLOW 3
u, N
13S/38E-16AM1 Albert Nordick p u u 08 48 IV D 1862 N 4795 6 7-67 13S/38E-l 7DD 1 Doug Fisher p I W 390 D 232 60 14 p C 1961 TV 5040 450 75 30 13S/38E-18DAD1 Gene Sorensen P I IV 280 400 20 P C 1961 T w 5240 2500 159 13S/38E-23MA1 James Abbott P H W 910 13 48 IV D C s 4790 1 7-67 13S/38E-25BBC1 A. P. Allen p H w 770 4 N 4747 FLOW 7
13S/38E-26MD1 A. P. Allen p s IV 780 2 N 4750 +6 7-67
IDAHO - BEAR LAKE COUNTY
10S/43E-22BAD1 El Paso Nat Gas NH IV 395 600 1956 V 6140 11S/43E-08DBD1 Lee AJleman p H IV 90 40 6 p C 1948 J s 5970 l1S/43E-l2DDB1 Barte 11 Johns on P I W 535 27 6 C C T 6015 12 9-67 45 11S/43E-15CDC1 Lester Alleman P H W 22 36 w D 1915 C S 5945 8 9-67 11S/43E-21ABC1 Reed Smith p s w 300 6 C T V 5945 FLOW 250
11S/43E-27CDC1 Burt on Ludwig p H W 810 40 36 W D 1944 C S 5980 11S/44E-05CDC1 El Paso Company NU U 316 160 12 p C 1962 T V 6170 46 6-68 700 200 6 l1S/44E-07CCB1 A. M. Thompson p s w 560 D 231 63 10 p C 1965 T 5 6025 31 9-67 500 30 6
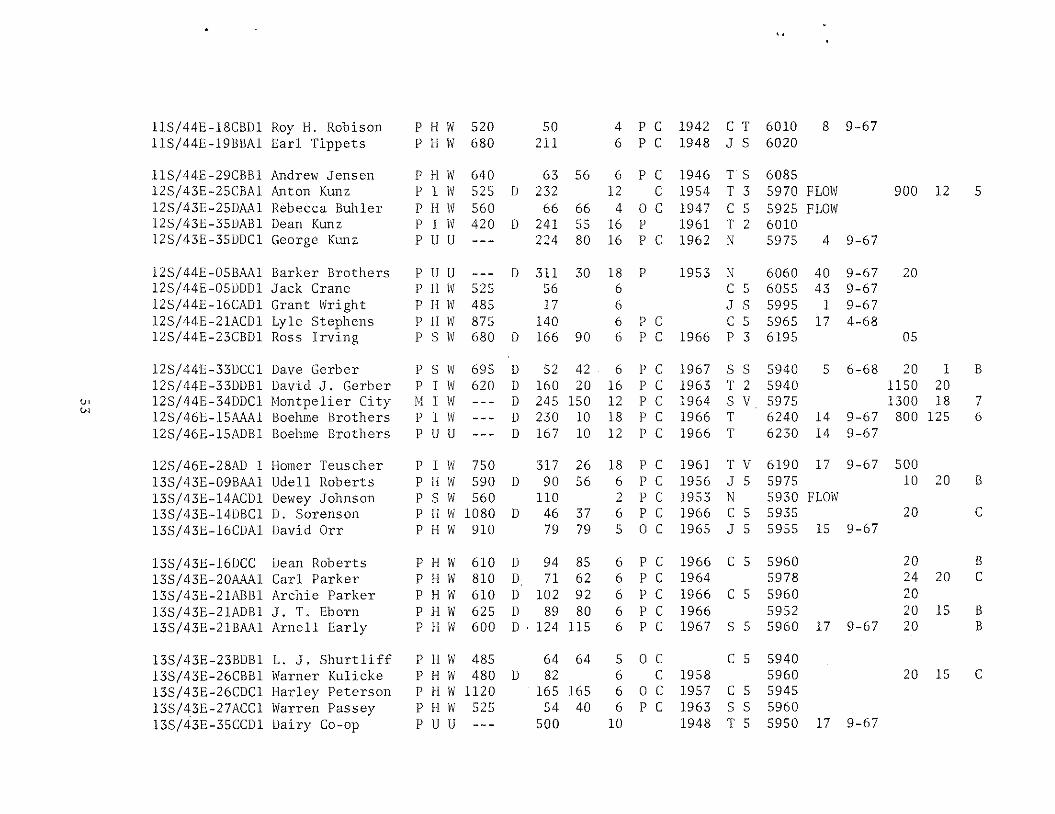
l1S/44E-l8CBD1 Roy H. Robison P H W 520 50 4 p C 1942 C T 6010 8 9-67 11S/44E-19BBA1 Earl Tippets p H W 680 211 6 p C 1948 J s 6020
l1S/44E-29CBB1 Andrew Jensen P H W 640 63 56 6 p C 1946 T S 6085 12S/43E-25CBA1 Anton Kunz P I W 525 D 232 12 C 1954 T 3 5970 FLOW 900 12 5 12S/43E-25DAA1 Rebecca Buhler p H W 560 66 66 4 0 C 1947 C 5 5925 FLOW l2S/43E-35DAB1 Dean Kunz P I W 420 D 241 55 16 p 1961 T 2 6010 12S/43E-35DDC1 George Kunz p u u 224 80 16 p C 1962 N 5975 4 9-67
12S/44E-05BAA1 Barker Brothers p u u D 311 30 18 p 1953 N 6060 40 9-67 20 l2S/44E-05DDD1 Jack Crane p H W 525 56 6 C 5 6055 43 9-67 l2S/44E-l6CAD1 Grant Wright p H W 485 17 6 J s 5995 1 9-67 l2S/44E-21ACD1 Lyle Stephens p H W 875 140 6 p C C 5 5965 17 4-68 l2S/44E-23CBD1 Ross Irving p s w 680 D 166 90 6 p C 1966 p 3 6195 05
12S/44E-33DCC1 Dave Gerber p s w 695 D 52 42 6 p C 1967 s s 5940 5 6-68 20 1 B l2S/44E-33DDB1 David J. Gerber p I W 620 D 160 20 16 p C 1963 T 2 5940 1150 20
Ln 12S/44E-34DDC1 Montpelier City M I W D 245 150 12 p C 1964 s V 5975 1300 18 7 w
12S/46E-15AAA1 Boehme Brothers P I W D 230 10 18 p C 1966 T 6240 14 9-67 800 125 6 12S/46E-15ADB1 Boehme Brothers p u u D 167 10 12 p C 1966 T 6230 14 9-67
12S/46E-28AD 1 Homer Teuscher p I W 750 317 26 18 p C 1961 TV 6190 17 9-67 500 13S/43E-09BAA1 Udell Roberts p H W 590 D 90 56 6 p C 1956 J 5 5975 10 20 B l3S/43E-l4ACD1 Dewey Johnson p s w 560 110 2 p C 1953 N 5930 FLOW 13S/ 43E-14DBC 1 D. Sorenson P H W 1080 D 46 37 6 p C 1966 C 5 5935 20 C 13S/43E-16CDA1 David Orr PH W 910 79 79 5 0 C 1965 J 5 5955 15 9-67
13S/ 43E-16lJCC Dean Roberts P H W 610 D 94 85 6 p C 1966 C 5 5960 20 B 13S/43E-20AAA1 Carl Parker P H W 810 D 71 62 6 p C 1964 5978 24 20 C 13S/43E-21ABB1 Archie Parker P H W 610 D 102 92 6 p C 1966 C 5 5960 20 13S/43E-21ADB1 J. T. Eborn PH W 625 D 89 80 6 p C 1966 5952 20 15 B 13S/43E-21BAA1 Arnell Early PH W 600 D, 124 115 6 p C 1967 s 5 5960 17 9-67 20 B
13S/43E-23BDB1 L. J. Shurtliff p H W 485 64 64 5 0 C C 5 5940 l3S/43E-26CBB1 Warner Kulicke p H W 480 D 82 6 C 1958 5960 20 15 C 13S/ 43E-26CDC1 Harley Peterson p H W 1120 165 165 6 0 C 1957 C 5 5945 13S/43E-27ACC1 Warren Passey PH W 525 54 40 6 p C 1963 s s 5960 l3S/43E-35CCD1 Dairy Co-op p u u 500 10 1948 T 5 5950 17 9-67

Table 7. Records of wells in the Idaho :eart of the Bear River basin (cont'd.)
Cl 'D VJ 'D
..-< <l) ..., rl 0
H ..-< rl 'D ..-< .,..; <l) ..-< <l) <l) 'D ..c: ..-< <l) 4..; <l) H
Well number Owner 4-' ,-; u " <l) Vl • ..; rl 0 " <l)
p.. "' <l) " Vl .,..; ,-; rl <l) Water level p.. ,,-j ~ ;3: U<ll "' 4..; "' H
" 'D ....
~ <l) 4..; " ..c: . ......, .., 0 u <l) ..... H 'D 0 " bO
U) 4..; 4..; 4..;(J "' .µ 4..; 'D 'D .µ ;:J 0 " h O O .,..;;:, 'D ..c: ..c: (l) 0 H .µ Depth Date 'D 'D .,..; <l) U'D .µ .µ s rl ..c: H .µ <l) ..... ,-; " §t' ~ " <l)
<l)C, bO p.. p.. "' ,-; .µ "' 4..; " .µ to meas- <l) "' Vl U) pO 0 <l) <l) ..... <l) <l) <l) ..... 0 rl
11red .,..; H ;:J
000 U)U el g g g ?,; 5' >-; dO... <!'. 1&ater >-; g a.
l3S/44E-02DAB1 Jnknsn & Smith P H W 725 D 75 40 8 p C 1967 S T 6055 30 12 2 13S/44E-03ACD1 Toby Michaelson P H W D 100 60 6 p C 1960 N 6005 56 6-68 13S/44E-03BDA1 Montpelier City M P W D 450 10 p T V 5975 600 36 13S/44E-03BDD1 Montpelier City M P W D 300 250 16 p C 1944 TV 5975 1300 30 13S/44E-04ADC1 Montpelier City MP W 610 D 188 12 p 1963 TV 5945 1500 9 8
l3S/44E-04CCB1 Glacus Merri 11 p H W 790 D 40 32 6 p C 1965 5930 20 12 B u, 13S/44E-07ACA1 Corniel sen p s w 32 4 C 5 5925 9 6-68 ""' 13S/44E-08BAD1 Evan Olson p H W 570 77 4 C s 5925 FLOW
13S/44E-22AAD1 Glen Hymas p H W 800 D 66 45 6 p C 5960 20 18 B l3S/44E-23BAB1 R. K. Nelson p I W 245 12 p C 1961 T 4 5990 41 9-67 450
13S/ 44E-26BAD1 Olean Parker P I W D 170 20 14 p C 1961 T B 5970 17 9-67 275 121 8 13S/ 46E-09DB 1 Norman Eschler p u u D 145 20 16 p C 1967 N 6120 5 9-67 1300 50 13S/46E-16CBC1 John Dayton P I W 720 D 157 10 18 p C 1960 T V 6105 1000 71 6 13S/46E-21CBC1 John Dayton p I w D 178 18 16 F 1961 T V 5990 500 9 4 13S/46E-22DAD1 James Saxton p I w 720 D 208 83 12 p C 1961 T 4 6140 900 30 16
13S/46E-26BCA1 Heber Boehme p I w 630 320 20 p C 1961 TV 6145 1500 14S/43E-14CBA1 George Painter p H w 570 30 30 6 0 C 1957 C S 5965 14S/43E-23DCA1 Lavell Ward p s w D 40 34 6 p C 1965 C 3 5950 0 6-68 20 12 C 14S/43E-35BBA1 Karel Thomas P H W 580 50 6 C 1953 J 5 5955 14S/ 44E-11ADD1 T. H. Spencer P H W 795 30 4 C C 5 5950
14S/44E-12CCC1 Oscar Arnell P H W 810 D 40 30 6 p C 1964 5960 20 B l4S/44E-l3ACD1 Dingle Cemetery M I W 780 D 95 47 8 p C 1960 5985 125 23 8 14S/44E-13CCD1 Cecil Quayle p u u D 73 56 6 p C 1962 N 5970 22 6-68 25

• ',
14S/ 45E-05AC 1 Wendell Kunz p I w 720 D 160 24 16 p C 1957 T D 6080 16 9-67 1800 129 14 14S/45E-11AD 1 Lee Rigby p u u 120 6 p N 6040 42 9-67
l4S/46E-10DD01 Calvin A. Price p H w D 108 100 6 p C 1967 J s 6050 2 7-68 20 10 C 15S/43E-02CAD1 o. E. Monson p H W 1000 22 20 2 s V 1950 C 5 5945 15S/43E-26DAD1 Louis T. Pugmire p H IV 625 86 86 4 0 C 1918 p 1 5935 4 9-67 15S/43E-35DDC1 N. Willis l!airup p H W 910 48 44 6 p 1959 C S 5970 13 9-67 l5S/44E-25B0Al Nebeker Bros. p I lv D 303 66 12 p C 1962 TV 5950 41 9-67
15S/46E-06CAC1 Ivan K. Rigby p I W 940 D 38 33 4 p 1964 s s 6030 8 9-67 36 C l5S/46E-06CB0l Union Pacific N H W 38 8 1958 J s 6030 8 9-67 16S/43E-020CD1 LJon Perkins p H W D 130 120 8 p C 1965 C 5 5950 FLOW 25 19 C l6S/43E-020DB1 Marj Thatcher p u u D 96 74 8 p C 1967 N 5955 27 9-67 20 12 16S/43E-27DD 1 E. F. Closner p H IV 600 D 52 44 6 p C 1967 5935 7 7-68 20 10
IDAHO - CARIBOU COUNTY
ln 07S/41E-27DDD1 Elton Sorensen P H W 345 184 6 C 1954 S T 6140 171 8-67 ln 08S/41E-01BAA1 Merle Cellan p u u 128 6 p 6 6093 94 8-67
08S/41E-02UDC1 Wendell Welling P H W 880 D 100 21 6 X C 1965 S T 6050 15 08S/41E-25B0Al Monsanto Chem N N W 1400 18 16 C T V 5995 9 8-67 08S/42E-04DCB1 Mountain Fuel N NW 710 250 20 p C 1967 T V 6145 35 8-67 3405 4 16
08S/42E-06CDC1 Charles Skinner p u u 37 6 p 1 5994 23 8-67 08S/42E-07BDA1 Al Butterfield p s w 740 54 6 J T 5993 12 8-67 08S/42E-08CBD1 Ray Gunnell p u u 425 96 6 C 1925 p 1 6080 08S/42E-09ABA1 El Paso Product N U U 38 06 N 6150 36 8-67 08S/42--09ABB1 El Paso Prod. Co. N NW D 272 50 16 p C 1965 T W 6145 2300 2 181
08S/42--15ACD1 J. R. Simplot N NW D 200 12 N 6189 7 8-67 08S/42E-15BBC1 El Paso Product N NW D 280 45 20 p C 1964 T W 6155 1500 1 08S/42E-15BBC2 J. R. Simplot N N \'I D 97 TV 6145 375 3 27 08S/42E-16AAC1 J. R. Simplot N N W D 125 15 16 p C N 6135 22 8-67 300 1 8 08S/42E-l7CAB1 Joe Torgeson p u u 119 6 X N 6096 99 8-67
08S/42E-20BCC1 Ira Ellis p u u 50 8 p 1 6017 38 8-67 08S/42--20DAB1 Cove Concrete N N W 950 125 6 C 1964 S T 6045 53 8-67

Table 7. Records of wells in the Idaho part of the Bear River basin (cont 'd.J Q
"D U) "D rl <l) ...,
rl 0 ,-. rl rl "D rl •ri <l) rl <l) <1) "D .c: rl <1) 4-J <1) ,-. .µ rl () " <1) VJ •ri rl 0 " <1) Well number Owner Cl. "' <l) " VJ •ri k rl <1) Water level Cl. •!""! ~ :::: ()"' "' 4-J "' ,-.
" "D •ri Cl. <1) 4-J " .c: •r1'J µ 0 () <l) ·ri ,-. >- "D 0 " "" VJ 4-J 4-J 4-J () "' µ 4-J "D "D µ ::, 0 " k O O •ri::, "D .c: .c: <1) 0 ,-. µ Depth Date "D "D •ri
<1) °""' µ .µ s rl .c: ,-. µ <l) •ri rl " i " <1) <1) <1)" "" Cl. Cl. "' rl µ "' 4-J " µ to meas- <1) "' ::: U) ff) = 0 (JJ <1) •ri <1) <1) <1) •ri 0 rl •ri ,-.
o:::,:::, U)() ..., Q Q Q :s: ~ ~ ..., "" < ater ured ~ Q "" 08S/42E-20DAD1 Myrtle Campbell PH W 930 80 04 C 1937 s s 6045 53 9-67 08S/42E-28CDC1 Archie Vonberg p H w D 90 6 X 1966 J T 6085 54 8-67 08S/42E-29ABA1 Tom Cellan p H w 925 1949 J T 6040 39 8-67
08S/42E-30BDD1 Wells p u u 120 C p 6005 60 9-67 08S/42E-31ADB1 Monsanto Chem N N W 960 D 250 80 18 p C 1953 MW 5987 1000 5 08S/42E-31ADC1 Monsanto Chem N N W 800 D 200 140 16 C 1951 M V 5987 1000 12
<.n 08S/42E-31DAB1 Monsanto Chem N N W 950 D 255 20 20 p C 1965 MW 5989 2000 20 °' 08S/42E-32BD 1 Kerr McGee Corp N N W 900 D 252 90 16 p C 1963 T V 6023 41 8-67 450 1
09S/39E-25BBA1 R. Christensen p I W 122 20 18 p C 1962 T C 5480 42 6-68 09S/40E-l3ACB1 Ed Kessler p u u 303 8 p 5711 265 8-67 09S/40E-19BBA1 P. Christensen p I w 1130 D 180 72 16 p 1959 T V 5505 81 4-68 09S/40E-20BDB1 P. Christensen p I w 1350 D 243 123 16 p 1963 T p 5568 141 8-67 1300 5 7 09S/40E-23CDA1 R. Christensen p I w 1200 350 20 20 p C 1966 T D 5680
09S/40E-27BBA1 Von Simonson P H W 975 208 6 s 5 5620 09S/40E-27DCD1 Lucy Gibson p H W 765 180 8 C s 5 5596 165 6-68 09S/40E-28BCB1 Ken Christensen p H W 790 I) 200 18 6 X H 1968 s s 5576 151 5-68 12 09S/40E-29CCC1 A. Christensen p H W 830 120 8 C S T 5542 116 8-67 09S/40E-31CBC1 Grant Gibson p H W 140 122 4 p C 1937 s s 5517 91 8-67
09S/40E-34AAD1 William Perry PH W 700 150 6 C PT 5580 09S/40E-35CCD1 Alex Olsen PH W 980 6 C s s 5542 109 8-67 09S/40E-36DCC1 Max Rigby P H W 1175 6 C 1966 s s 5557 48 8-67 09S/41E-02DDA1 Merri 11 Balls p u u 100 90 6 p H 1964 N 5800 41 8-67 09S/41E-03BAA1 Alton Maughn p u u 185 120 14 p C 1967 N 5900 91 8-67
•

09S/41E-07AD 1 Sam Reed p I W D 210 03 20 X C 1968 N 5735 27 6-68 300 120 6 09S/41E-07CDC1 Hadfield p u u 164 4 N 5730 132 8-67 09S/41E-07DCA1 Union Pacific N H W 940 D 152 140 6 p C 1956 5735 10 5 C 09S/41E-08CDC1 Bob Hubbard P I IV 1050 D 200 40 16 p C 1962 TV 5720 27 1300 28 6 09S/ 4 lE-08lJAC l Bob Hubbard P I W 3400 D 325 18 16 p C 1954 N 5730 10 4-68 600 50 10
09S/41E-08DAD1 Bob Hubbard p I W 1390 D 200 40 16 p C 1952 TV 5730 1300 28 7 09S/41E-08LJDC1 Bob Hubbard p u u D 255 108 16 X C N 5725 19 8-67 250 210 3 09S/41E-10ACA1 Robert Summers P H W 3600 63 6 C 1966 s 5 5740 FLOW 09S/41E-10BAA1 John Zeman p H \V 780 8 C 1966 S T 5745 27 8-67 09S/ 41E-l 1BCA1 Cedarview Club p C W 2850 35 6 0 C C T 5730 4 4-68
09S/41E-l3BBB1 Howard Hand p H W 2400 D 77 65 8 X C 1966 S T 5740 12 8-67 09S/41E-13BCC1 Bill Corder PH W 580 D 102 6 p C 1967 s s 5785 67 6-68 09S/42E-028BD1 Lynn Beus P I \V 990 350 12 p C 1937 C N 6180 FLOW 09S/42E-09CAD1 !lop kins P H W 365 215 p C 1955 S 5 5990 191 8-67 09S/42E-09DAC1 Dale Dunn p u u D 175 135 6 p C 1965 N 6050 20 12 C
U,
" 09S/42E-09lJCAl Lowe 11 Thomas p fl w 740 D 150 130 6 p C 1963 S T 6000 15 09S/42E-18l3DD1 Stanford Steel P H IV 740 D 72 68 p C 1966 S 5 5810 35 6-68 30 09S/42E-20BCB1 Harry Steele p u u 190 p 5825 9 8-67 09S/42E-22AAB1 Shyrl Barker P H W 780 275 6 C p T 6025 09S/42E-29CDD1 Ben Call P H W 460 76 6 1967 J T 5800 20 8-67
09S/42E-32DCB1 Keith Bennion p H W 470 D 175 110 6 X C 1965 S T 5910 40 8-67 l0S/39E-l2ABB1 Dave Revoir, Jr., p H W 780 100 p C 1964 S 5 5505 45 8-67 10S/39E-12DBA1 Turner Cemetery M I W 900 D 170 75 6 p C 1955 S 5 5480 54 6-68 30 38 8 10S/40E-03UDD1 Merril Hulse p ll w 1010 124 6 S 5 5513 91 8-67 10S/40E-05BDD1 Everett Smith P I W 830 D 208 90 16 p C 1959 TV 5500 1200 74 14
10S/40E-05D0Dl R. Rindlisbaker P H W 940 110 6 p s s 5510 94 8-67 10S/40E-06DCC1 !low ard Thomas P H W 1000 55 10 C 1920 S 5 5480 10S/40E-08BBA1 Marvin Smith P I W 1440 D 300 70 16 p C 1960 T V 5477 51 1-68 1680 203 24 10S/40E-11BAA1 Mrs. Wilker P H IV 1000 110 6 s s 5505 97 8-67 l0S/40E-12AAB1 Grace Vi 11 age M P W 205 180 12 p C T V 5545
10S/40E-l3ACB1 Bill Nielsen P H IV 840 187 18 6 X C 1947 S T 5525 161 8-67

Table 7. Records of wells in the Idaho part of the Bear River basin (cont'd.) a
'tJ (/) 'tJ r-< Q) ·-" r-< 0
h r-< rl 'tJ rl •rl (l) rl (l) (l) 'tJ .c: rl (l) 4-< (l) h
Well number Owner +-> rl u " (l) Vl .,.; r-< 0 " (l)
p. '" (J) " Vl .,.; h rl c)) Water level p. .,.; :,, :,, urn '" 4-< '" h
" 'tJ .,.; P", (J) 4-< " ~ 4-1 4-!
,..;+-> +-> 0 u (l) .,.; h >. 'tJ 0 :,, bi) 4-<U '" µ 4-< 'tJ 'tJ µ p 0 " h 0 0 •rlP 'tJ .c: .c: (l) 0 h +-> Depth Date 'tJ 'tJ ,,.;
(l) <Jtj µ +-> s rl .c: h +-> <l) .,.; rl @ p.
" <l) <l) "" bi) p. p. "' rl µ "' 4-: ~ +-> to meas- <l) s " Vl Vl 00 0 (l) <l) ,,.; <l) (l) <l) ·rl 0 rl •rl h p 0 ::, ::, {!)U '" a a ~ ~ ,_:, p., .,. water nred >,, a a
10S/40E-14BBA1 Dewey Mansfield P H W 740 D 225 22 6 X A 1967 s s 5505 10S/40E-15DAA1 Don T. Peterson P H W 840 D 170 12 6 C 1953 S T 54 75 149 8-67 10S/40E-16DDD1 Harold Varley P H W 1300 D 170 142 6 p C 1956 5440 10S/40E-18ACC1 R. Christensen P H W 825 62 6 C T s 5480 58 4-68
l0S/40E-22BBB1 Junior Allen P H W 1200 D 106 55 p C 1966 s s 5420 17 10S/40E-24BAD1 Warren King p H w 975 D 210 16 6 X A S T 5510
u, 10S/40E-26BAA1 Don T. Peterson p H W 1005 180 12 X C 1917 S T 5500 170 8-67 00
l0S/40E-34CAD1 Robert J. Burton p H W 1500 52 07 X C 1943 S T 5140 32 8-67 10S/40E-35BDD1 Grant Matthews P I W 860 90 18 T V 5390 66 4-68
10S/40E-35CDD1 Everett Miles PH W 1000 70 6 X C J T 5372 64 8-67 10S/40E-36DCC1 Alvin Kingsford P H W 860 150 6 P T 5410 42 8-67 10S/41E-07CDD1 John Kirby P II W 825 180 40 X C 1907 s s 5535 48 8-67 10S/41E-18DCC1 Dick Smith P I W 790 D 215 150 18 p 1961 TV 5535 2700 9 3 l0S/41E-31BCB1 E. F. Ziegler p H w 850 6 s s 5455 120 8-67
llS/ 40E-O lDBCl Floyd Toone p s w 80 12 8 X C 1937 J T 5370 74 8-67 l1S/40E-03BCB1 Dave Smith p H w 1300 105 6 C 1967 s T 5140 73 8-67 llS/40E-lOBCDl Clem Rasmussen P H W 1220 12 48 w D 1942 s T 5030 8 8-67 11S/40E-24ACC1 Jay Turner p u u 57 8 X H 1967 N 5100 39 8-67 l1S/41E-06AAB1 Don Clegg p I W 690 D 190 162 p 1964 T 5470
llS/41E-l6BDD1 \iard Harris p II w 330 930 6 C 1963 s s 5250 35 8-67 llS/41E-18ADDl J. Oldrenshaw p u u 22 w D 1965 N 5200 14 8-67 11S/41E-19DCA1 Mel Mickelson P H W 1500 22 22 8 0 1947 p s 5050 7 8-67 llS/ 41E-20Cl3Al Roger Mickelson P H W 820 C s 5080 7 8-67

11S/41E-20DDA1 Elvin Meacham P H W 440 38 6 A 1964 s s 5290 10 8-67 11S/41E-29ABD1 Harry Steele p u u 318 6 C 1958 N 5200 1 8-67 11S/41E-30BDD1 Clark Mickelson PH W 1500 65 6 C 1951 s T 5050 37 8-67
IDAHO - FRANKLIN COUNTY
l2S/40E-l2CCB1 Don Forsgren PH W 600 07 24 W D 1952 S T 4950 4 7-67 12S/40E-24AAD1 Dean Panter p u u 27 30 W D N 4925 26 7-27 12S/40E-25BAD1 Verl Neilsen PH W 30 36 W D J T 5025 12 7-67 l2S/40E-36BAD1 John Clausse PH W 320 16 24 W D J T 4875 1 7-67 12S/41E-18BBC1 Arval Alleman p H W 810 62 6 0 C 1963 J T 4975 23 4-68
13S/38E-22DDD1 B. Bosworth P H W 730 8 p 1 4862 28 7-67 l3S/38E-28DDB1 Frank Beal P I W D 218 102 14 p TV 4775 FLOW l3S/38E-33BDD1 Lavern Kendall p I w D 265 32 12 p C 1961 TV 4783 17 3-67 30 13S/39E-24DCA1 Trsrtn Cemetery p I w 55 8 C 1952 T T 5050 10 3-68 13S/39E-25DDA1 Strongarm Res. C I w D 234 35 16 p 1961 T V 4985 3 7-67
tn <D
13S/40E-30ACB1 Mack Hymas p I w 610 290 C 1963 TV 5060 27 11-67 14S/38E-04BCB1 Hyrum Ward P I W D 285 45 14 p C 1962 T U 4802 0 7-67 550 14S/38E-12BAA1 Quent Casperson P H W 800 06 w D 4754 3 7-67 14S/28E-14BDA1 Emil Tasso p I w 690 100 8 p C 1934 C T 4745 3 4-67 14S/38E-15CDC1 Lavon Porter p I w 450 200 12 p C 1937 TV 4795 21 3-68
14S/38E-15DBC1 Lavon Porter p I w 200 16 C TV 4761 7 7-67 14S/38E-15DCC1 Pas Martinez P H W 415 190 8 C 1934 J T 4778 15 7-67 14S/38E-15DCC2 Pas Martinez p I w D 217 128 10 p C 1963 T U 4778 500 12 6 14S/38E-16BBA1 Dale Ralphs p I w 315 D 190 48 16 p C 1961 TV 4835 FLOW 600 120 l4S/38E-l6BBD1 Arthur Wardell p I w 320 DJ 155 12 1963 N 4835 FLOW 200
l4S/38E-l6BDD1 Willard Gailey p I w D 300 54 16 p C 1961 T u 4840 35 4-67 1000 14S/38E-22ABA1 Lou McDermott p I w 505 DJ 200 160 12 p C 1967 N 4765 FLOW 800 40 l4S/38E-22BDB1 Dennis Ralphs p I w 500 D 180 50 16 p C 1959 T V 4797 45 7-67 1740 67 14S/38E-22BDC1 Clifton Village M P W D 202 117 12 p 1955 T V 4831 71 4-67 180 l4S/38E-22BDD1 Leonard Povey p I W 600 D 220 112 16 p C 1961 T U 4813 53 4-67 900 50 25
14S/38E-22CCB1 C. A. Mortensen p I W 465 D 350 142 12 p C 1961 T u 4893 116 7-67 460

Table 7. Records of wells in the Idaho i2art of the Bear River basin (cont'd.) 0
'CJ [/) 'CJ .-; <l) .., .-; 0
H .-; .-; 'CJ .-; •rl <!) rl <l) <l) 'CJ .i:: .-; <l) 4-; <l) H µ rl u " <l) U) •rl .-; 0 " <l)
Well number Owner P-; "' <l) " U) ·rl H ,-; <l) Water level P-; •rl :s: :;,s: uro "' 4-; "' H
" 'CJ •rl P-; <l) 4-; " .i:: •rl+-' µ 0 u <l) ·rl H >- 'CJ 0 " bO
U) 4-; 4-; 4-;U "' µ 4-; 'CJ 'CJ µ ;:l 0 " H O 0 ·rl ;:l 'CJ .i:: .i:: <l) 0 H µ Depth Date 'CJ 'CJ •rl <l) U'CJ µ µ s .-; .i:: H µ <l) .,.; ,-; " 0-,
" <l) <l) <l) " bJ) P-; P-; '" .-; µ '" 4-; "
µ to meas- <l) '" 5 :s: !fl tfl P-;O 0 <l) <l) .,.; <!) <!) <l) •rl 0 .-; .,.; h 0 ::0 ::0 [/)<l) .., 0 0 0 3: ~ >-< .., p.. < water ured >-< 0 p..
14S/38E-23CCC1 William Powell p I \\' 590 TV 4775 32 4-67 270 14S/38E-26ADC1 Jack Choules p I w 590 D 520 356 14 p C 1960 TV 4 750 1200 30 24 14S/38E-34AAD1 Kent Howell p u u 60 36 W D 1951 C T 4775 12 7-67 14S/38E-35BCC1 Clyde Call p I w 200 125 16 p C 1961 TV 4760 13 4-67
14S/39E-01BDD1 Edward Paskins p H W 680 118 85 6 p C 1957 S T 5025 47 7-67 14S/39E-06DAC1 Nyel Taylor p u u 37 10 N 4792 5 7-67
°' 14S/39E-07BBA1 E. Gregorson p s w 890 277 179 12 p 1954 N 4760 +2 3-67 380 0 14S/39E-07BBD1 E. Greg ors on p I w 750 631 130 12 p C 1955 T 5 4760 1 3-67 900
14S/39E-08ADA1 M. Hollingsworth p I w 900 D 206 30 12 p C 1961 T V 4850 104 7-67 1100
14S/39E-09BAD1 Dave Johnson p I w 1460 D 210 95 20 p 1961 TV 4885 1225 25 24 14S/39E-09BDA1 !Javid Johnson PH W 1700 70 40 6 p C 1948 J 5 4812 42 3-68 14S/39E-17AAA1 Cluff Gibson P II W 2200 44 40 6 C 1955 J T 4785 15 7-67 l4S/39E-20CDB1 Richard Ballif p u u D 170 146 12 p 1938 T 4 4750 61 7-67 270 123 5 14S/39E-25ADD1 Byron Tanner P H W 910 125 6 X C 1943 C T 4750
14S/39E-28CAB1 Allen Smith P H W 2900 35 4 C T 4760 1 7-67 14S/39E-29BDC1 Charles Nielsen P H W 1400 24 48 W D 1957 C T 4700 22 7-67 14S/39E-32AAA1 Heber Swainston P II W 1000 18 36 W D J T 4750 7 7-67 14S/39E-35DAD1 John Vaterlaus p H w 900 16 6 1942 C T 4530 8 7-67 14S/39E-36AAD1 Ariel Meek p H W 990 16 48 W D 1940 J T 4530 2 7-67
l4S/39E-36ACB1 Robt Henderson p U LI 32 8 N 4520 4 7-67 14S/39E-36CDC1 Marv Packer p H W 1100 19 36 W D 1937 p T 4534 3 7-67 14S/40E-11DDD1 G. Rasmussen P H W 640 24 24 W D J T 4900 14 7-67 l4S/40E-l8CCB1 Mrs. Robt Wells P H W 700 35 48 D 1943 C T 5020 15 7-67

l4S/40E-20BDB1 Gene Smith p u u 76
14S/40E-21AAC1 Curtis Bosen p H W 490 60 l4S/40E-30ABB1 Moss Lewis p H W 1020 D 165 50 15S/37E-36AAA1 L. Bingham P I W 160 75 l5S/38E-01CBB1 Thaye Winward P H W 680 20 15S/38E-02CCC1 Bruce Naylor p u u 110
l5S/38E-l1BBB1 Jim Naylor p u u DJ 204 70 15S/38E-11BBC1 E. 0. Bergeson P H W 760 D 245 40 15S/38E-12DBA1 John Jackson P H W 590 68 15S/38E-13BDC1 Junior Jeo p H W 800 80 15S/38E-22DDC1 G. Housley p I w 460 D 170 44
15S/38E-23AAA1 Ernest Buetler p I w 610 D 475 357 15S/38E-23BBD1 Dayton Cemetery M I w 760 D 66 27 15S/38E-24DAD1 Veldon Martin PH W 33
°' 15S/38E-25DAA1 Perth Poulson p u u 27 >-"
15S/38E-26DDC1 T. Schuaneveldt p H W 1000 16
15S/38E-31BBC1 John King p I w 540 D 155 80 15S/38E-35BBC1 Schwartz-Robins p I w 80 30 15S/38E-35BBC2 Schwartz-Rob ins p u u 86 15S/38E-36CDA1 Ward Nielsen P H W 640 20 15S/39E-04CCA1 Ivan Jorgensen P H W 1300
15S/39E-09DDD1 William Hawkes P H W 1650 14 15S/39E-11CCC1 Mark Larsen P H W 1100 25 18 15S/39E-15BDA1 George Eames P H W 890 50 15S/39E-16DAD1 A. W. Fisher p H W 790 14 15S/39E-18BCC1 Martin Blau p H W 620 85
15S/39E-20CDC1 Frank Mitchell p H W 1010 09 l5S/39E-23BBB1 Taylor P I W 800 11 15S/39E-30DCA1 Art Stevenson PH W 950 60 l5S/39E-31ABD1 D. Claire PH W 535 25 15S/39E-34CBD1 Van E. Nelson p s w 620 11
6 C 1964 N
8 C J T 6 p C 1962 S T
14 p 1960 TV 36 w [) J T 4 N
16 N 12 p C 1961 TV 6 1957 J T
24 W C 1955 J T 10 p C 1966 s u
16 p C 1962 TV 6 F C 1961 TT
36 W D 1947 C T 4 C 1962 N
w D 1954 C T
16 p C 1961 T V 10 p C 1934 C T
2 N 30 w D s 5 36 w D C T
36 D 1942 J T 36 p D 1936 p T 36 W D 1887 p T 36 W D J T
6 1948 J T
48 w D J T 42 D 1953 p T
4 p 1962 J T 48 w D 1929 C T 36 w D 1940 p 1
.. '
4655
4645 4740 5075 4745 4830
4818 4784 4735 4733 4792
4750 4780 4710 4715 4735
5060 4760 4760 4723 4495
4715 4765 4730 4715 4710
4477 4727 4710 4714 4655
61
22 53 74 10 71
52 15 36 31 19
66
25 20 6
54 2 3
13 8
7 10 5 5
69
4 1
13 7
7-67
7-67 7-67 20 4-67 2250 7 12 7-67 7-67
7-67 7-67 75 125 7-67 7-67
11-67 165 108
4-67 1000 126
7-67 7-67 7-67
3-68 1800 27 4 7-67 450 15 3-68 7-67 7-67
7-67 7-67 7-67 7-67 7-67
7-67 3-68
7-67 7-67

Table 7. Records of wells in the Idaho 1:art of the Bear River basin (cont'd.) 0
"" VJ "" ..... <l) ..., ..... 0 .... ..... ..... "" ..... •.-< " ..... " <l) "" .c ..... <l) ti.. <l) .... Well number Owner
.µ ..... u " <l) "' ..... ..... 0 Water level " <l)
p., "' <l) ,:: "' ......... ..... <l) p., •rl :::: ~ ""' "' ti.. "' .... ,:: "" ..... p., <l) ti..
~ .c ,,-<.µ .µ 0 u <l) ..... .... >. "" 0 bJJ "'ti.. ti.. 4,U "' .µ
ti.. "" "" .µ ;:l Depth Date 0 ,:: k O 0 ·.-<:::l "" .c .c <l) 0 .... .µ "" "" ..... <l) U'U .µ .µ ~ ..... .c .... .µ <D •.-< ..... ~ § ,:: <l) " ©C: bJJ p., p., ..... .µ "' ti.. "
.µ to meas- " " "' "' P.,O 0 <l) <l) ..... <D <l) " ..... 0 ..... ured
. .... .... a::,::, VJU ..., 0 0 0 ;3: ~ >-< ..., p.. .,: water >-< 0 Cl.
15S/39E-35DDD1 Hesy Beckstead PH W 800 14 W D 1927 C 5 4590 15S/40E-19CDD1 Merlin K. Larsen P H W 22 w D 1953 C T 4749 8 7-67 15S/40E-31DDD1 W. G. Reese, Jr., P I W D 217 130 8 p C 1968 TT 4685 20 24 15S/40E-32BBA1 Whtny Wtr Works M P W 600 160 125 10 p C 1960 TT 4770 FLOW 1280 15S/40E-35BAD1 H. Walter Knapp p u u 80 00 12 p C 1954 C T 4650 2 7-67
16S/37E-13BBA1 K. Frederickson P H W 730 D 101 50 12 F C 1966 J T 5250 12
°' 16S/38E-01CDA1 Eugene Tomasi PH W 1400 20 30 W D 1890 C T 4662 9 7-67 N
16S/38E-06AAA1 Richard Lemmon P I W 1090 D 109 63 10 pH 1961 TT 5005 31 7-67 200 7 4 16S/38E-08BAB1 Herb Wil Iiams P I W 700 D 157 14 10 p H 1961 TU 4940 3 3-68 450 25 8 16S/38E-08CCD1 Joseph Phillips P H W 2100 20 36 W D 1930 J 5 4945
16S/38E-11CAB1 Gene Austin P H W 1000 14 30 W D C 5 4757 9 7-67 16S/38E-14BBC1 A. J. Jensen P H W 610 47 25 6 p C 1950 J T 4795 20 16S/38E-24ACB1 Kohler-Fonnesbk P I W 850 D 548 16 C 1954 T 5 4585 57 3-68 l6S/38E-25CCB1 Mark Roylance p u u J 132 3 N 4560 31 7-67 16S/39E-03CDB1 Tom Howell p s w 485 06 36 w D J T 4595
16S/39E-07CAD1 Dean R. Bingham PH W 760 450 300 4 p H 1961 ST 4565 60 7-67 16S/39E-09CCC1 Floyd Jensen PH W D 205 00 12 p C 1954 S T 4527 4 7-67 90 16S/39E-11ADA1 Henry Egbert PS W 2500 35 48 W D 1965 J T 4535 8 7-67 16S/39E-17DDD1 Barnard Inglet P H W 1090 17 14 2 S V 1945 C T 4470 16S/39E-18CAC1 Douglas McKay p u u 7 450 229 14 p 1961 N 4570 55 10-67 1350 60
16S/39E-18CDA1 Owen Maughn P I W D 462 204 14 p 1961 TV 4550 32 7-67 1350 54 16S/39E-19DBA1 Serge Benson P H W 830 265 12 4 p C 1957 S T 4536 38 7-67 16S/39E-30CAD1 C. lJ. Butler P H W 2000 12 36 W D 1931 C 5 4526 10 7-67

•
l6S/40E-l5BDD1 Paul Woodward PH W 650 115 6 C 1961 s 5 4950 54 7-67 l6S/40E-l6ABB1 Marlow Woodward p s w 565 170 C 5 4520 FLOW
16S/40E-16CAC1 Orval Rallison p I w 440 D 80 69 6 p C 1954 5 4512 FLOW 80 l6S/40E-l7BBB1 Davis Foster P I W 760 D 180 104 12 p C 1954 T V 4548 8 2-67 400 8 3 l6S/40E-l8ABD1 Larrel Hobbs p u u J 91 09 12 p 1960 N 4556 13 7-67 16S/40E-20ACC1 W. P. Hobbs P I W 680 250 12 C 1963 T V 4480 FLOW 210 16S/40E-20CDA1 Frnkln-Cub Rivr N I W DJ 236 111 12 p C 1934 N 4475 FLOW 55
16S/40E-20CDC1 Frnkln-Cub River N U U 570 OJ 215 12 1934 4475 FLOW 160 16S/40E-20DCA1 Calif. Packing N NW D 315 187 12 p 1929 TV 4498 33 7-67 16S/40E-20DCA2 Calif. Packing N NW D 400 171 12 p 1943 T V 4498 34 7-67 332 70 3 16S/40E-21AAC1 Pioneer Irr. Co. N U U J 77 12 1948 N 4590 8 7-67 16S/40E-21CDC1 Unknown p s w 510 20 N 4500 +3 3-67
16S/40E-28DBC1 Birch Comish PH W 525 65 6 C 1960 J T 4526 4 7-67 16S/40E-29CBC1 Franklin Cemtry M U U J 82 10 p C 1950 N 4508 15 7-67
°' l6S/40E-30ABB1 Ivan Woodward P H W 520 85 8 C 1945 C T 4513 FLOW "'

REFERENCES
Bright, R. C., 1963, Pleistocene Lakes Thatcher and Bonneville, southeastern
Idaho: Univ. of Minn. (Minneapolis, Minnesota) , unpublished thesis
(Ph.D.), 143 p.
Fenneman, N. M., 1931, Physiography of Western United States: New York,
McGraw-Hill, 534 p.
Gilbert, G. K., 1890, Lake Bonneville: U.S. Geol. Survey Mon. 1, 438 p.
Hardy, C. T., ed., 1957, Geology of parts of northern central Utah and south-
eastern Idaho: Guidebook for Tenth Annual Meeting, Rocky Mtn. Sect,
Geol. Soc. America, 73 p.
Intermountain Association of Petroleum Geologists, 1953, Guide to the geology
of northern Utah and southeastern Idaho, 4th annual field conference,
1953: Salt Lake City, Utah, 143 p.
Jenkins, C. T., 1968, Techniques for computing rate and volume of stream
depletion by wells: Ground Water, v. 6, no. 2, p. 37-41.
Mabey, D. R., and Oriel, S. S., Gravity and magnetic anomalies in the Soda
Springs region, southeastern Idaho, in U. S. Geol. Survey Prof. Paper
614-D (In press).
Malde, H. E., 1968, The catastrophic Late Pleistocene Bonneville Flood in the
Snake River Plain, Idaho: U. S. Geol. Survey Prof. Paper 596, 52 p.
Mansfield, G. R., 1927, Geography, geology, and mineral resources of part of
southeastern Idaho: U. S. Geol. Survey Prof. Paper 152, 409 p.
Mcconnel, W. J., and others, 1957, Bear Lake--Its fish and fishing: Utah
State Dept. of Fish and Game, 76 p.
Oriel, S. S., and Platt, L. B., 1968, Reconnaissance geologic map of the
Preston quadrangle, southeastern Idaho: U. S. Geol. Survey open-file
map, 2 sheets.
64
. )
, . .

l •
• ..
REFERENCES (cont'd.}
Richards, R. W., and Bridges, J. H., 1911, Sulphur deposits near Soda Springs,
Idaho: U. S. Geol. Survey Bull. 470-J, 7 p.
Scott, R. C., 1955, Ground-water supply possibilities in part of Bear Lake
and Caribou Counties, Idaho: U. S. Geol. Survey open-file report, 27 p.
Stearns, H. T. , Crandal 1, Lynn, and Stewart, W. G. , 1936, Records of wells
in the Snake River Plain, southeastern Idaho: U. S. Geol. Survey Water-
Supply Paper 775, 139 p.
Stiff, H. A., Jr., 1951, The interpretation of chemical water analysis by
means of patterns: Jour. of Petroleum Tech., p. 15, Oct.
Univ. of Idaho Water Resources Research Inst., 1968, Preliminary inventory
of the water resources of Idaho: Idaho Water Resources Board, Planning
Report no. 1, 598 p.
U. S. Geological Survey, 1960, Compilation of records of surface waters of
the United States through September 1950, part 10, the Great Basin:
U. S. Geo 1. Survey Water-Supply Paper 1314, p. 43-80.
1963, Compilation of records of surface waters of the United States,
October 1950 to September 1960, part 10, the Great Basin: U. S. Geol.
Survey Water-Supply Paper 1734, p. 30-50.
U. S. Public Health Service, 1962, Drinking water standards, 1962: U. S.
Public Health Services pub. 956, 61 p.
U. S. Salinity Laboratory Staff, 1954, Diagnosis and improvement of saline
and alkali soils: U. S. Dept. Agriculture Handb. 60, 160 p.
Walker, E. !-1., 1964, Salt production in Idaho, in Mineral and water resources
of Idaho: Idaho Bur. Mines and Geol., special report, no. 1, p. 165-169.
Williams, J. S., 1962, Lake Bonneville: Geology of southern Cache Valley,
65

Utah: U. S. Geol. Survey Prof. Paper 257-C, 152 p.
Williams, J. S., Willard, A. D., and Parker, Verlyn, 1962, Recent history of
Bear Lake Valley, Utah-Idaho: Am. Jour. Sci., v. 260, no. 1, p. 24-36.
66
' i
• ..

U!i!TED STATES Dfil'ART!.lEl:T OF Tfil, !!iT:.lUOR
GEOLOCICA.. ~Ukvt:Y
i ,,
Bou lrora U S Gt o loo1co1 Sur•• t Pocottllo, 19$4; Proton, 1955, 8t1QIIO•, 19$4 ; Olld 0 tMII, 195 .. , U foh, Wyo,.. ln9,ond ldoho.
i'?..=..:a.'!Ell I", COOFERA'!.'1011 WITH THE ZTA.TE
0 l
2 I
6 I ' ,ntum is 111ean aua. level
~ontour i nterval 200 feet
10 . .. .. I
f 7 S
B£4 R t.AKE
l 9 S ('
'! " ·
~eologj ~7 ~ • • Dion, ~o~ , b'1l!e4 2n -pnrt on a co:ipJlatior. by riel
FIGURE. G --Generali.zed 9eolog1c moµ o re Bear R111er bos,n ond od1ocen1 areas in Idaho
con:...ct
• 'IL._._
l.ort• • -ro, ~ .tely locnt,•d i .o ~·' nu.."l"l'OU"!l r .,.uJ t ~ occur .i.n
t•1• uur River oru:in, c>nl.;; tl.c>:ii, =· ri:rred -.o ... l,, tL'fOrl ,r,: at.own
r ll!m.g" b!!:li n boun4'1XY tounlo.:~ !n Ce~ .~llsy wno
"'" n t~ ... l-.;rdro?o.;ic- r,,ac nwi,lu.r.; t.dopted b; tn~ !d:ilio
nrtmf!nt of Reclt..utior.

UNITED STATES DEPA.RThlEllT OF' Tm: !!ffo!U l·
GEOU)CIC,J.. StJHV'"i
Bou t,on, U. S GeoloQot ol Su,vo, Pocore llo, •954, Proton, 19 55, 8r,9IIDM, 1954; Dlld o, ..... , 1954, U rot,, Wyoml n9, and I daho.
I
.. -· ..
-~ l
.......
r, r
~
"
r I
I ~ .
... ~ J·~ I .,.
0
'
.. ..., "'1b ~\
'
'l I
\
!
.. I
r, I
e I
ltJ:D ls mnan s~~ 1~vel 1nt r int~rval ,00 feet
I
s
r.
~! )
Be AR L AKC
'4t AA .....
1{:tdro1ogy by t,. ? . !J.1.on, 1969
- 4700-- - -
Show eleva t:lon of WB1;er- level contours potentiometr ic su:rface, ?.:a.rob W\d April 1%8. Dnshed wnere approxilllate1y locat~d Jatum is me8Jl eea l evel Contour interval?.~, 501 and 100 feet
IIS - 44E 7ccol • ::eu iiel-,c ted for chemical i.na.lysb ,
Juty 1368
9 t7cobt
bst'.!rvution ·nell ::elec:l,d for h;1'drogr11ph, ( I:!!& ku.rP B) 1111d •or ~cr- l~v l cuntours
0
. 1. us !: u It t r - ·y·,:.. C : :, ~r
10::.iu u.i:;r.ol V•!<i :::ol!.d:, l:i mi.U -r.11.m:. rtor H ter
CJ i!il •:.00
CJ 'SOI 150
[Jill l'SI 1000
. at tern diUT11111
: . o'-d•
Uic --c,ar •• ~-'
Su' :'at.<1 10
r '1:lrt...?e btii.ir Qt>;.1.nd.i..r • • hn boundo.r.•1 in 1elll 'l!.lley wns d~am. on the hyrlrologie-s.reac
OUI , 1;, iopt••cl c;,· th, !d::u10 ~· ,rte,<>. t. of ,•clmr.nt n
,i,p: oxim11te loc.. Hon or the gT01111d - wal.Pr divide i n Gem ·: 1 ey , ;. ril 1 •Jt'
FIGURE 7. --Mop of the 8eor River bosin showing chemicol chorocter of the ground water, water - level contours, and location of selected observation we l ls.

UNITED STATES D.SPARTMEIIT OF THE IN't'ERIOR
GEOLOGICAL SURVEY
Bon from US G•olo9lcol Su,ny PocoJ•llo, 1954 ; Proton, 1955, 8ro9llo .. , 1954 , Ofld Ot•n, 1954, U 1011, Wyo111in9, ond I dollo.
FIGURE 10.--Mop of the Bear R ivtr basin show i ng overage
PfiE:J>AHE!) lJl COOFERATIO?l \'/ITH THE STATE
0 2 6 8
Dntum is mean sea level Contour interval 200 feet
10 1111 11 ..
BEAR LAKE
T 9 S ,,. )
EJCPLA.NA'l'ION
1000 !,00 100
A"Verage annual stream discharge, in cubic feet per second, based on period 1950-60
Pat-tern di~am
·:::::: C~T!O'.!S :l{ ! ~ :(-): :ChlorW Bi,~,,,.,, S\I.Uat1,
10 8 6 4 2 0 2 4 6 8
'.:I!..L!E,1.UIV ALE.1iTS PER LITER
.otal dissol ved sol i ds , in mill igrama ~er liter
CJ 0-2 !>0
CJ 25 1-500
C3 501-750
10
a •rPen:-rne,sur .r.g a.nd qualit y of
water :: .r.ipling sit~
15 S-39E-8bl S ... Sprill8 and number
Jlrn.inage basin boundary The bolltldar-J in Gem Valley was draim cm the hyd.rologic-areae boundo.r; adopted by the Idaho Uep,u-tment or Reclamat1on .
Hydrology by N. P . Dion , 19o9
onnuol strtom discharge, chemical character of the surface water, ond the locot1on of selected spr i ngs .