CES TVR ISPRS Hydrologic REV 6Nov13
10
Hydrologic Model with Landscape Dynamics for Drought Monitoring Vinay S 1 Bharath Setturu 1 Bharath H Aithal 1, 2 Ramachandra T V 1, 2, 3,* [email protected] [email protected] [email protected] [email protected] 1 Energy & Wetlands Research Group, Centre for Ecological Sciences [CES] 2 Centre for Sustainable Technologies (astra) 3 Centre for infrastructure, Sustainable Transportation and Urban Planning [CiSTUP] Indian Institute of Science, Bangalore, Karnataka, 560 012, India http://ces.iisc.ernet.in/energy; http://ces.iisc.ernet.in/foss Corresponding author : [email protected] Keywords: Drought, Remote Sensing, Western Ghats, Water budget Abstract: Drought refers to the deficiency in the surface or underground water over extended period of time affecting the regional economy and livelihood. Alterations in the hydrological regime at sub-basin level could be due to either natural phenomenon or due to anthropogenic activities. The current communication models the hydrologic regime considering landscape status in the central Western Ghats. Hydrological regime assessed based on water balance, gives information about the hydrological status of basin. Temporal remote sensing data with Geoinformatics aids in quantifying landscape dynamics, while hydrological state variables were based on the meteorological data. The quantification has been done at sub-basin level for select rivers in Uttara Kannada district of Karnataka. Rivers were chosen based on the level of anthropogenic activities such as dam constructions, conversion of forests to monoculture plantations, etc. Regional meteorological data such as precipitation, temperature, evaporation, etc., along with crop water requirement, domestic and livestock water requirements were used for water budget at sub basin levels. The hydrological status in different basins was expressed as function of water available to that of water demand. The analysis brings out the relationship of catchment land use dynamics with the water availability and stress. The model based on meteorological and land use parameters help in detecting the levels of water stress and linkages with land cover in the respective sub-basin. This helps the decision makers in adopting appropriate mitigation measures to overcome the water stress. INTRODUCTION Landscape refers to a portion of heterogeneous terrain with the interacting ecosystems and is characterized by its dynamics, which are governed by human activities and natural processes (Ramachandra et al., 2012a). Human induced land use and land cover (LULC) changes have been the major driver of the landscape dynamics at local levels. Understanding of landscape dynamics helps in the sustainable management of natural resources (such as water, land, etc.). Forests are degrading due to large scale anthropogenic activities involving the conversion into to agriculture fields (Lin and Wei 2008), or horticulture lands, hydro schemes etc. in turn affecting the hydrological regime (Ramachandra et al 2013, Bonella et al 2010, Lin and Wei 2008). This also has led to higher soil loss through erosion affecting the productivity and water holding capacity of the soils (Subramanian 1998), increased agricultural activities and human interference leads to higher water requirement, if not catered through other available sources leads to agriculture drought conditions. Altered and lower flows in the river are key contributors to the decline in river health and its environs manifested in ways such as increasing algal blooms, a decline in native fish numbers and increases in exotic species, and a decline of wetlands (Sahbaz Khan, 2004). To overcome such issues, it is necessary to analyse and manage the capacity of the basins to supply resources without
Transcript of CES TVR ISPRS Hydrologic REV 6Nov13

Hydrologic Model with Landscape Dynamics for Drought Monitoring
Vinay S1 Bharath Setturu1 Bharath H Aithal1, 2 Ramachandra T V1, 2, 3,*
[email protected] [email protected] [email protected] [email protected] 1Energy & Wetlands Research Group, Centre for Ecological Sciences [CES]
2Centre for Sustainable Technologies (astra) 3Centre for infrastructure, Sustainable Transportation and Urban Planning [CiSTUP]
Indian Institute of Science, Bangalore, Karnataka, 560 012, India
http://ces.iisc.ernet.in/energy; http://ces.iisc.ernet.in/foss
Corresponding author : [email protected]
Keywords: Drought, Remote Sensing, Western Ghats, Water budget
Abstract:
Drought refers to the deficiency in the surface or underground water over extended period of time affecting the regional
economy and livelihood. Alterations in the hydrological regime at sub-basin level could be due to either natural
phenomenon or due to anthropogenic activities. The current communication models the hydrologic regime considering
landscape status in the central Western Ghats. Hydrological regime assessed based on water balance, gives information
about the hydrological status of basin. Temporal remote sensing data with Geoinformatics aids in quantifying landscape
dynamics, while hydrological state variables were based on the meteorological data.
The quantification has been done at sub-basin level for select rivers in Uttara Kannada district of Karnataka. Rivers were
chosen based on the level of anthropogenic activities such as dam constructions, conversion of forests to monoculture
plantations, etc. Regional meteorological data such as precipitation, temperature, evaporation, etc., along with crop water
requirement, domestic and livestock water requirements were used for water budget at sub basin levels. The hydrological
status in different basins was expressed as function of water available to that of water demand. The analysis brings out the
relationship of catchment land use dynamics with the water availability and stress. The model based on meteorological and
land use parameters help in detecting the levels of water stress and linkages with land cover in the respective sub-basin.
This helps the decision makers in adopting appropriate mitigation measures to overcome the water stress.
INTRODUCTION
Landscape refers to a portion of heterogeneous terrain with the interacting ecosystems and is characterized by its
dynamics, which are governed by human activities and natural processes (Ramachandra et al., 2012a). Human induced land
use and land cover (LULC) changes have been the major driver of the landscape dynamics at local levels. Understanding
of landscape dynamics helps in the sustainable management of natural resources (such as water, land, etc.). Forests are
degrading due to large scale anthropogenic activities involving the conversion into to agriculture fields (Lin and Wei 2008),
or horticulture lands, hydro schemes etc. in turn affecting the hydrological regime (Ramachandra et al 2013, Bonella et al
2010, Lin and Wei 2008). This also has led to higher soil loss through erosion affecting the productivity and water holding
capacity of the soils (Subramanian 1998), increased agricultural activities and human interference leads to higher water
requirement, if not catered through other available sources leads to agriculture drought conditions. Altered and lower flows
in the river are key contributors to the decline in river health and its environs manifested in ways such as increasing algal
blooms, a decline in native fish numbers and increases in exotic species, and a decline of wetlands (Sahbaz Khan, 2004).
To overcome such issues, it is necessary to analyse and manage the capacity of the basins to supply resources without
losing its current potential through water balance studies (Subramanya 2005, Raghunath 1985) in conjunction with GIS and
remote sensing (Neil and Matthew 2012, Mallikarjuna et al 2013). Remote Sensing (Ramchandra et al 2012a, Vinay et al
2012) has advantages such as wider synoptic coverage of the earth surface with varied temporal, spatial and spectral
resolutions to monitor these changes.
Drought is a natural phenomenon that has significant adverse effect on the socio-economic, agricultural, and environmental
conditions (Nezar and Ali, 2007; Bhuiyan et a, 2006) caused due to the water deficiency either meteorologically or due to
anthropogenic activities such as excessive human activities (agriculture, horticulture etc.) due to, increasing population and
increased demand of natural resources that are exploited at a very large scale (Ramachandra and Bharath 2012,
Ramachandra et al 2012a). A drainage basin perspective is essential for understanding the upstream downstream
connectivity of water supplies, water demands, and emerging water problems. The land use information derived from
temporal remote sensing data integrated with the long term meteorological information such as rainfall (Bhat et al 2012),
temperature, etc. aid in assessing the water balance of a river basin through quantification of hydrological parameters such
as runoff, infiltration, base flow etc... The objective of the study is to model hydrological dynamics of a river basin to
monitor the water availability including drought conditions. The current work is done at sub basin level in the Sharavathi
river basin, central Western Ghats.
STUDY AREA
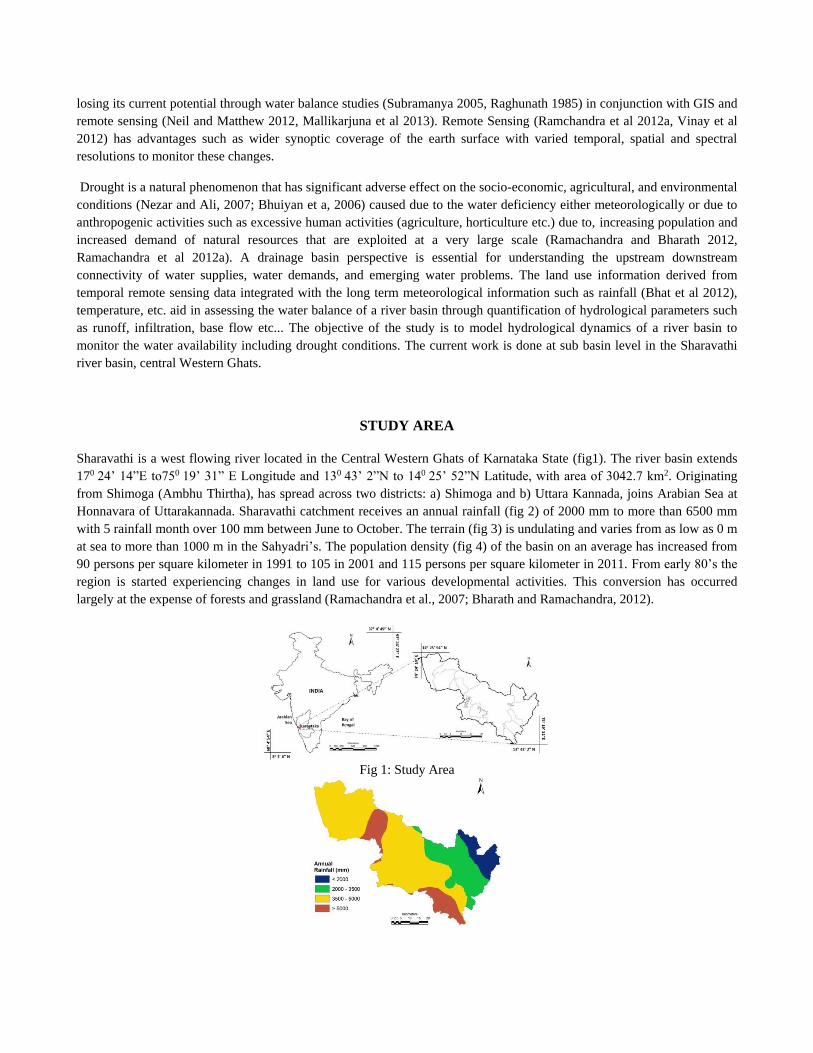
Sharavathi is a west flowing river located in the Central Western Ghats of Karnataka State (fig1). The river basin extends
170 24’ 14”E to750 19’ 31” E Longitude and 130 43’ 2”N to 140 25’ 52”N Latitude, with area of 3042.7 km2. Originating
from Shimoga (Ambhu Thirtha), has spread across two districts: a) Shimoga and b) Uttara Kannada, joins Arabian Sea at
Honnavara of Uttarakannada. Sharavathi catchment receives an annual rainfall (fig 2) of 2000 mm to more than 6500 mm
with 5 rainfall month over 100 mm between June to October. The terrain (fig 3) is undulating and varies from as low as 0 m
at sea to more than 1000 m in the Sahyadri’s. The population density (fig 4) of the basin on an average has increased from
90 persons per square kilometer in 1991 to 105 in 2001 and 115 persons per square kilometer in 2011. From early 80’s the
region is started experiencing changes in land use for various developmental activities. This conversion has occurred
largely at the expense of forests and grassland (Ramachandra et al., 2007; Bharath and Ramachandra, 2012).
Fig 1: Study Area

Fig2: Annual Rainfall Spatial distribution
Fig3: Terrain
1991 2001
2011
Fig4: Population
DATA USED
Remote sensing data IRS P6 LISS IV of 5 m resolution was used for land use classification and quantification of
hydrological parameters. Ancillary data such as topographic maps (1:50000, 1:250000), vegetation map (French institute,
1985) were used to delineate the drainage network, administrative boundaries, catchment, etc. Training data to geometric
correction and classify the remote sensing data were obtained from field using GPS (Global Positioning System) apart from
topographic maps and online remote sensing data (http://earth.google.com). Cartosat DEM of 30 m resolution was used in
addition to toposheets to derive the basin and sub-basin boundaries, drainage network. Secondary data sources such as
Census data of 2011 (http://censusindia.gov.in) was used to compute population density in each sub basin. Publications
such as ‘district at glance’ was used in addition for livestock data in sub basins. Rainfall data between 1901 and 2010 from
the Department of Statistics, Govt of Karnataka (http://des.kar.nic.in), and India Meteorological Department
(http://www.imdpune.gov.in) were used to determine the rainfall dynamics. Temperature data from WorldClim
(http://worldclim.org) was used along with land use, etc. to estimate the evapotranspiration losses. Crop calendar was used
to estimate the crop water requirement in each month.
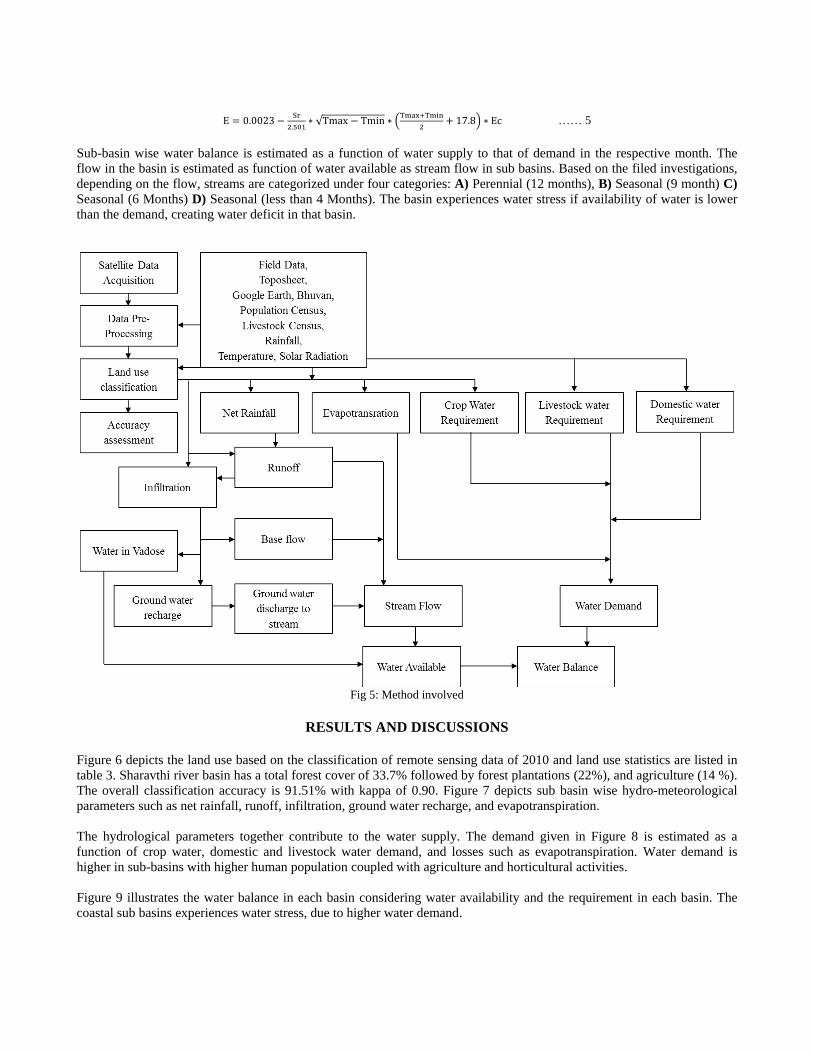
METHOD
Figure 5 outlines the procedure followed for assessing the land use and hydrologic dynamics and the analysis of drought
episodes. Remote sensing data procured from NRSC, Hyderabad (http://nrsc.gov.in) were rectified using the ground control
points (GCP’s) acquired from field using GPS and other ancillary sources (like SOI Topographic maps, etc.). River

catchment and sub-basins are delineated using topographic maps (of the Survey of India, 1:50000 scale) along with DEM.
Training data to classify remote sensing data and validate classified data were acquired from field using GPS in addition to
online resources such as Google Earth (http://earth.google.com) and Bhuvan (http:/bhuvan.nrsc.gov.in). Classification of
remote sensing data was done using the Gaussian Maximum likelihood algorithm which is proved to perform better than
other classification algorithms (Duda et al., 2002; Bharath et al., 2012; Ramachandra et al., 2013). Of the field data, 60% of
the data was used to classify and the rest 40% of the data was used for accuracy assessment of the classified database. The
classified land use data was used to estimate the water balance using the other hydro meteorological parameters such as
rainfall, temperature, solar radiation, etc. The Net rainfall based on the land use was estimated to eliminate the loss of water
due to interception of water by the vegetation during the down pour.
The net rainfall, along with the land use was used to estimate the runoff in each of the river sub basins using the rational
formula (equation 1), where R in the surface runoff, Pnet is the net rainfall in mm, C is the land use runoff coefficient and A
is the area of the catchment. The amount of water in-filtered (Inf) into the subsurface is calculated as the difference between
the Net Rainfall and Runoff, based on equation 2 for Western Ghats, where GR is the Ground water recharge, RC is the
Ground water recharge coefficient (listed in table 1), K is the rainfall coefficient. The water in-filtered flows to the stream
as either base flow (equation 3) or as ground water discharge (equation 4), where BF is the base flow, KP is the base flow
coefficient, GD is the ground water discharge into the stream, YS is the specific yield.
Based on the land use, the coefficient of base flow and ground water discharge varies in each sub-basin. Table 2 lists
coefficients of base flow and water discharge for each sub-basin based on land uses in the respective basin. All these factors
such as R, BF and GD contribute to the flow in the stream during different seasons in a year through satisfying the demands
and losses. The water available in the basin is estimated as function of flow in the stream, and other stored water sources
such as soil water/ water in vadose zone.
R = Pnet * C * A ….. 1
GR = RC * (Pnet – K) * A …. 2
BF = (Inf – GR) * KP ……… 3
GD = GR * YS …… 4
Table1: Ground water recharge coefficient
Annual Rainfall RC C
400 to 600mm 0.20 400
600 to 1000 mm 0.25 400
> 2000 mm 0.35 600
Table 2*: Baseflow and ground water discharge coefficients
Sub basins KP % YS %
Yennehole 10 15
Hurlihole 10 15
Nagodihole 10 27
Hilkunji 10 15
Sharavathi 10 15
Mavinahole 30 3
* Based on field data
The demand of water is calculated as function of evapotranspiration, crop water, household (domestic water) and livestock
water requirements. Evapotranspiration is calculated using the Hargreevs equation (equation 5) based on the average
monthly maximum and minimum temperature (Tmax, Tmin), solar radiation (Sr) and the evapotranspiration coefficient
(Ec) which varies from land use to land use. The crop coefficient was calculated for different time frames based on
individual crop water need based on various growth phases of the crop, and cropping pattern in the year based on the annual
crop calendar. The water required for livestock or for the domestic purpose varies from season to season, in case of
livestock, the water required varies on type of animal.
E = 0.0023 −Sr
2.501∗ √Tmax − Tmin ∗ (
Tmax+Tmin
2+ 17.8) ∗ Ec …… 5
Sub-basin wise water balance is estimated as a function of water supply to that of demand in the respective month. The
flow in the basin is estimated as function of water available as stream flow in sub basins. Based on the filed investigations,
depending on the flow, streams are categorized under four categories: A) Perennial (12 months), B) Seasonal (9 month) C)
Seasonal (6 Months) D) Seasonal (less than 4 Months). The basin experiences water stress if availability of water is lower
than the demand, creating water deficit in that basin.
Fig 5: Method involved
RESULTS AND DISCUSSIONS
Figure 6 depicts the land use based on the classification of remote sensing data of 2010 and land use statistics are listed in
table 3. Sharavthi river basin has a total forest cover of 33.7% followed by forest plantations (22%), and agriculture (14 %). The overall classification accuracy is 91.51% with kappa of 0.90. Figure 7 depicts sub basin wise hydro-meteorological
parameters such as net rainfall, runoff, infiltration, ground water recharge, and evapotranspiration.
The hydrological parameters together contribute to the water supply. The demand given in Figure 8 is estimated as a
function of crop water, domestic and livestock water demand, and losses such as evapotranspiration. Water demand is
higher in sub-basins with higher human population coupled with agriculture and horticultural activities.
Figure 9 illustrates the water balance in each basin considering water availability and the requirement in each basin. The
coastal sub basins experiences water stress, due to higher water demand.
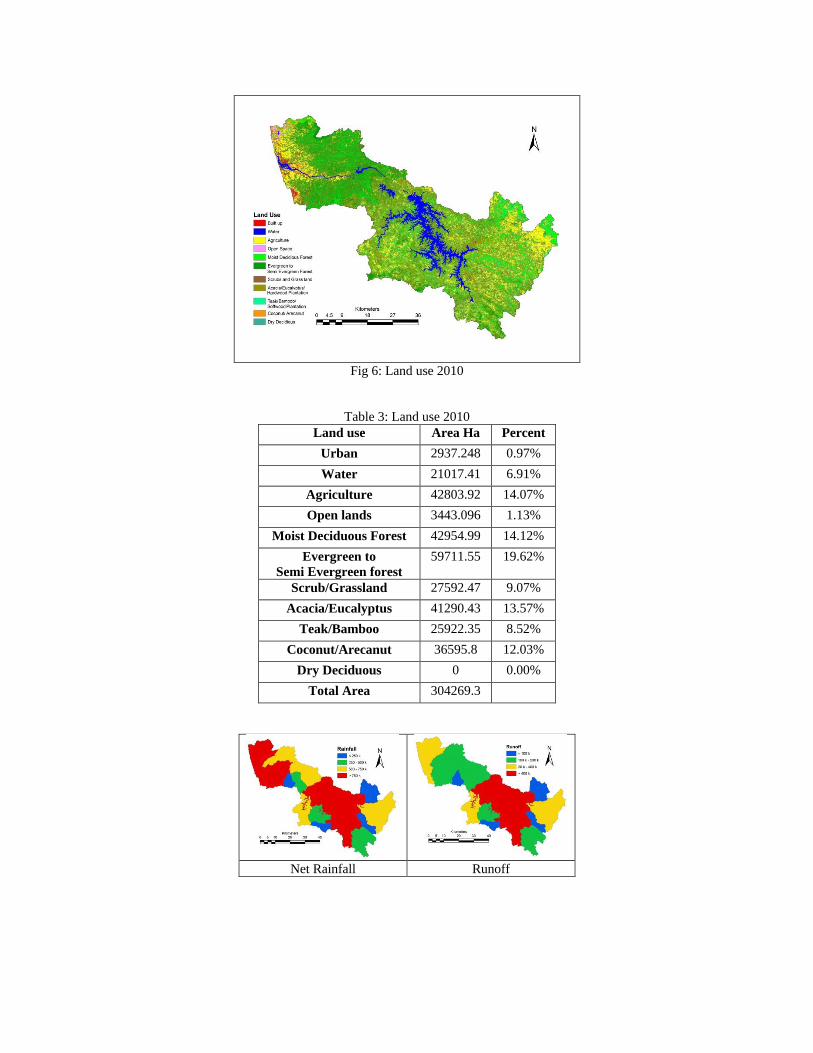
Fig 6: Land use 2010
Table 3: Land use 2010
Land use Area Ha Percent
Urban 2937.248 0.97%
Water 21017.41 6.91%
Agriculture 42803.92 14.07%
Open lands 3443.096 1.13%
Moist Deciduous Forest 42954.99 14.12%
Evergreen to
Semi Evergreen forest
59711.55 19.62%
Scrub/Grassland 27592.47 9.07%
Acacia/Eucalyptus 41290.43 13.57%
Teak/Bamboo 25922.35 8.52%
Coconut/Arecanut 36595.8 12.03%
Dry Deciduous 0 0.00%
Total Area 304269.3
Net Rainfall Runoff

Infiltration Ground water recharge
Water in Vadose Evapo-transpiration
Fig7: Hydro-meteorological parameters (all units in Million litres)
Crop water demand Domestic demand
Livestock demand Total Demand
Fig 8: Parameters contributing to the demand

Fig 9: Water Balance
Figure 10 groups the basins depending on the availability of water in streams as A, B, C or D. This also highlight the
linkages of water availability with the land use as basins with higher cover of forests with native vegetation have water
availability all 12 months or A type streams catering all demand (agriculture, domestic, horticulture and livestock), while
the basins where large scale land use changes also witness water scarcity evident from the presence of C or D type streams.
Fig 10: Flow regime
CONCLUSIONS
Water balance assessment at catchment level helps in identifying the factors playing the role in the water yield. Impending
climate change due to global warming has necessitated adoption of holistic approaches in the water resources management
to ensure sustainability. Land use dynamics and quantification of hydrological parameters using remote sensing and GIS
helps in the planning and sustainable management of natural resources. Basin wise assessment of hydrological status,
reveals that basins with dominant land cover as forests of native vegetation have streams which are perennial compared to
sub-basins with other land uses. The water balance model used in this study show that, the demand in basins with higher
agriculture and horticultural activities is higher than that of forested areas, where only water is lost through
evapotranspiration. This analysis would help in hydrologists and land use managers in identifying basins that would be
prone to water stress, and suitably plan for restoration of natural forests through afforestation, differ the cropping pattern,

avail the water resource though the aquifers to satisfy the exact demand or plan for check dams to store water considering
the topography and land use to overcome drought like conditions.
REFERENCES
1) Yong Lin and Xiaohua Wei, 2008, The impact of large-scale forest harvesting on hydrology in the Willow watershed
of Central British Columbia, Journal of Hydrology, Vol. 359, pp 141–149.
2) Ramachnadra T V, Bharath H A and Vinay S, 2013, Land use Land Cover Dynamics in a rapidly urbanizing
Landscape, SCIT journal (in press)
3) Bonella M, Purandara B K, Venkatesh B, Jagdish Krishnaswamy, Acharya H A K, Singh U V, Jayakumar R and
Chappell N, 2010, The impact of forest use and reforestation on soil hydraulic conductivity in the Western Ghats of
India: Implications for surface and sub-surface hydrology, Journal of Hydrology, Vol. 391, pp 47–62
4) Subramanian D K, 1998, A framework for conducting carrying capacity studies for Dakshina kannada district, IISc
Archive
5) Nezar Hammouri and Ali El-Naqa, 2007, Drought Assessment Using GIS and Remote Sensing in Amman-Zarqa
Basin, Jordan , Jordan Journal of Civil Engineering,Vol 1( 2), pp 142 – 152.
6) Ramachandra T V, and Bharath H A, 2012, Spatio-Temporal Pattern of Landscape Dynamics in Shimoga, Tier II City,
Karnataka State, India, International Journal of Emerging Technology and Advanced Engineering, Vol. 2(9) , pp 563-
576.
7) Ramachandra T V, Bharath H A and Sreekantha S, 2012a, Spatial Metrics based Landscape Structure and Dynamics
Assessment for an emerging Indian Megalopolis, International Journal of Advanced Research in Artificial Intelligence,
Vol. 1(1), pp 48 – 57.
8) Subramanya K, 2005, Engineering Hydrology, Tata McGraw-Hill publishing company limited, New Delhi, Second
Edition. ISBN: 0-07-462449-8
9) Raghunath H M, 1985, Hydrology, Wiley Eastern Limited, ISBN: 0-85226-746-0
10) Bhuiyan C, Singh R P, Kogan F N, 2006, Monitoring drought dynamics in the Aravalli region (India) using different
indices based on ground and remote sensing data International Journal of Applied Earth Observation and
Geoinformation, Vol 8, pp 289 – 302.
11) Sahbaz Khan, 2004. Integrating hydrology with environment, livelihood and policy issues: the Murrumbidgee model,
International Journal of Water Resources Development, 20 (3), pp 415-429.
12) Neil Sims C and Matthew Colloff J, 2012, Remote sensing of vegetation responses to flooding of a semi-arid
floodplain: Implications for monitoring ecological effects of environmental flows, Ecological Indicators, 18, 387–391
13) Mallikarjuna V, Prasad K R K, Udaya Bhaskar P and Sai Lakshmi M, 2013, Water Balance Study of Krishna Delta,
Andhra Pradesh, using GIS & RS Techniques, International Journal of Emerging Technology and Advanced
Engineering, Vol. 3(6), pp 59 – 64
14) Ramachandra T V, Bharath H A and Durgappa D S, 2012b, Insights to urban dynamics through landscape spatial
pattern analysis, International Journal of Applied Earth Observation and Geoinformation, Vol. 18, pp 329-343.
15) Vinay S, Bharath H A and Ramachandra T V, 2012, Spatio-temporal dynamics of Raichur City, LAKE 2012: National
Conference on Conservation and Management of Wetland Ecosystems 06th – 09th November 2012
16) Department of statistics, Government of Karnataka, http://des.kar.nic.in
17) Indian metrological data (IMD), Government of India, http://www.imdpune.gov.in
18) Reshma Bhat, Gouda K C, Amoghavarsha M, Lakshmikantha B P, Prabhuraj D K, 2012, Decadal Variation In The
Rainfall Characteristics over River Basins across the Western Ghats of India, Proceedings of AGU Fall Meeting 2012,
San Francisco, December 3rd - 7th 2012.
19) Census statistics, available at http://censusindia.gov.in/, accesed on 16 October 2013
20) Directorate of Census operations, Karnataka, http://censuskarnataka.gov.in
21) Uttara Kannada District at a glance, 2011-2012
22) Shimoga District at a Glance 2011 – 2012
23) World clim data, available www.worldclim.org, accessed on 16 October 2013
24) IRS P6 data, obtained from www.nrsc.gov.in
25) Ramachandra T.V., Subash Chandran M D., Gururaja K V and Sreekantha, 2007. Cumulative Environmental Impact
Assessment, Nova Science Publishers, New York.

26) Bharath Setturu, Ramachandra T V, 2012, landscape dynamics of Uttara Kannada district, In proceeding of: LAKE
2012, National Conference on Conservation and Management of Wetland Ecosystems 06th – 09th November 2012.
ACKNOWLEDGEMENTS
We are grateful to the Ministry of science and Technology, Government of India and Indian Institute of Science for the
financial and infrastructure support. NRSC Hyderabad provided IRS data.


![[mga-nvr ru]-ces-5 0](https://static.fdokumen.com/doc/165x107/631c012dd5372c006e043975/mga-nvr-ru-ces-5-0.jpg)