Hydrologic Considerations for Estimation of Storage-Capacity ...
425
U.S. Department of the Interior U.S. Geological Survey Hydrologic Considerations for Estimation of Storage-Capacity Requirements of Impounding and Side-Channel Reservoirs Used for Water Supply in Ohio Water-Resources Investigations Report 01 4256 In cooperation with the Ohio Department of Natural Resources, Division of Water
-
Upload
khangminh22 -
Category
Documents
-
view
1 -
download
0
Transcript of Hydrologic Considerations for Estimation of Storage-Capacity ...

U.S. Department of the InteriorU.S. Geological Survey
Hydrologic Considerations for Estimation ofStorage-Capacity Requirements of Impoundingand Side-Channel Reservoirs Used for WaterSupply in Ohio
Water-Resources Investigations Report 01 4256
In cooperation with theOhio Department of Natural Resources, Division of Water

U.S. Department of the InteriorU.S. Geological Survey
Water-Resources Investigations Report 01-4256
In cooperation with theOhio Department of Natural Resources,
By G.F. Koltun
Hydrologic Considerations for Estimation of Storage-Capacity Requirements of Impounding and Side-Channel Reservoirs for Water Supply in Ohio
Division of Water

U.S. DEPARTMENT OF THE INTERIORGALE A. NORTON, Secretary
U.S. GEOLOGICAL SURVEYCharles G. Groat, Director
For additional information write to:
District ChiefU.S. Geological Survey6480 Doubletree AvenueColumbus, Ohio 43229-1111
Copies of this report can be purchased from:
U.S. Geological SurveyBranch of Information ServicesBox 25286Denver, CO 80225-0286
Columbus, Ohio2001
Any use of trade, product, or firm names is for descriptive purposes only and does not constituteendorsement by the U.S. Government.

CONTENTS
Abstract ............................................................................................................................................................... 1Introduction ......................................................................................................................................................... 1
Purpose and Scope ..................................................................................................................................... 2Previous Studies ......................................................................................................................................... 2Acknowledgments ...................................................................................................................................... 2
Data and Methods ............................................................................................................................................... 2Streamflow Data ......................................................................................................................................... 2Extension of Streamflow Records .............................................................................................................. 8Low-Flow Series and Development of Low-flow Frequency Tables ......................................................... 8Storage Analyses for Impounding Reservoirs ............................................................................................ 9
Nonsequential-Mass-Curve Analysis for Impounding Reservoirs ................................................... 9Annual-Mass-Curve Analysis of Streamflow with Probability Routing .......................................... 12Evaporation Losses ........................................................................................................................... 13
.................................................................................................................................................................... 14Storage Analyses for Side-Channel Reservoirs ......................................................................................... 23
Streamflow Data for Side-Channel Reservoir Analyses ................................................................... 23Treatment of Evaporation in Side-Channel Reservoirs ..................................................................... 23Pumping Systems .............................................................................................................................. 29Modified Mass-Curve Analysis for Side-Channel Reservoirs .......................................................... 29
Summary ............................................................................................................................................................. 32Applications ........................................................................................................................................................ 33
Sample Computations for Impounding Reservoirs ........................................................................... 33Sample Computations for Side-Channel Reservoirs ......................................................................... 37
References Cited .................................................................................................................................................. 39Appendix .............................................................................................................................................................. 40
FIGURES
1. Map showing locations of streamflow-gaging stations in Ohio and climate stations used in the analyses 72. Determination of required reservoir storage capacities and critical drawdown periods from nonsequential
mass curves for Kale Creek near Pricetown, Ohio..................................................................................... 103. Maximum net evaporation as a function of duration and recurrence interval computed for the climatic
station at the Dayton International Airport................................................................................................. 224-8. Graphs showing storage required to meet demands as a function of the 7-day, 2-year low flow (7Q2)
divided by the mean annual flow (MAF) for selected recurrence intervals:4. 10-year recurrence interval, with data points plotted ......................................................................... 245. 5-year recurrence interval................................................................................................................... 256. 10-year recurrence interval................................................................................................................. 267. 20-year recurrence interval................................................................................................................. 278. 50-year recurrence interval................................................................................................................. 28
9. Graph showing relation between recurrence interval and minimum runoff for Kale Creek near Pricetown, Ohio ............................................................................................................................................................ 36
10. Graph showing relation between drainage area and storage for selected streams in extreme northeast Ohio ............................................................................................................................................................ 37
Contents I

TABLES
1. Selected characteristics of gaging stations whose data were used for the reservoir storage analyses....... 32. Example low-flow frequency table ............................................................................................................ 93. Example of nonsequential mass analysis table showing reservoir storage capacities and critical-drawdown
durations for selected draft rates and recurrence intervals......................................................................... 114. Summary of differences between required storage determined from annual-mass-curve analysis with
probability routing and nonsequential-mass-curve analysis ...................................................................... 125. National Weather Service Cooperative Station names, locations, and periods of precipitation and potential-
evapotranspiration data used in the reservoir storage analyses.................................................................. 146-12. Maximum net evaporation for:
6. Charlston, West Virginia .................................................................................................................... 157. Cincinnatti, Ohio................................................................................................................................ 168. Cleveland, Ohio ................................................................................................................................. 179. Columbus, Ohio ................................................................................................................................. 18
10. Dayton, Ohio...................................................................................................................................... 1911. Pittsburgh, Pennsylvania .................................................................................................................... 2012. Toledo, Ohio ...................................................................................................................................... 21
13. Characteristics of pump sets used in the side-channel reservoir analyses ................................................. 3014. Example table showing pump adjustment ratios for a side-channel reservoir........................................... 3115. Example of a storage-demand-frequency table for a side-channel reservoir............................................. 31
II Contents

CONVERSION FACTORS AND ABBREVIATIONS
Other abbreviations used in this report:
MAF Mean annual flowODNR Ohio Department of Natural ResourcesPET Potential evapotranspirationUSGS U. S. Geological SurveyRMSE Root-mean-square error7Q2 7-day, 2-year low flow
Multiply By To obtain
Length
inch (in.) 25.4 millimeterfoot (ft) 0.3048 meter
mile (mi) 1.609 kilometer
Area
square mile (mi2) 2.590 square kilometeracre 0.4047 hectare
Volume
cubic foot (ft3) 28.32 literacre-foot (acre-ft) 1,233 cubic meter
million gallons (Mgal) 3,785 cubic meter
Flow rate
cubic foot per second (ft3/s) 0.02832 cubic meter per secondmillion gallons per day (Mgal/d) 0.04381 cubic meter per second
Contents III

IV Contents

Hydrologic Considerations for Estimation of Storage-Capacity Requirements of Impounding and Side-Channel Reservoirs for Water Supply in OhioBy G.F. Koltun
ABSTRACT
This report provides data and methods to aid in the hydrologic design or evaluation of impounding reservoirs and side-channel reservoirs used for water supply in Ohio. Data from 117 streamflow-gaging stations throughout Ohio were analyzed by means of nonsequential-mass-curve-analysis tech-niques to develop relations between storage requirements, water demand, duration, and fre-quency. Information also is provided on minimum runoff for selected durations and frequencies. Sys-tematic record lengths for the streamflow-gaging stations ranged from about 10 to 75 years; how-ever, in many cases, additional streamflow record was synthesized.
For impounding reservoirs, families of curves are provided to facilitate the estimation of storage requirements as a function of demand and the ratio of the 7-day, 2-year low flow to the mean annual flow. Information is provided with which to evaluate separately the effects of evaporation on storage requirements.
Comparisons of storage requirements for impounding reservoirs determined by nonsequen-tial-mass-curve-analysis techniques with storage requirements determined by annual-mass-curve techniques that employ probability routing to account for carryover-storage requirements indi-cate that large differences in computed required storages can result from the two methods, particu-larly for conditions where demand cannot be met from within-year storage.
For side-channel reservoirs, tables of demand-storage-frequency information are pro-vided for a primary pump relation consisting of one variable-speed pump with a pumping capacity that ranges from 0.1 to 20 times demand. Tables of adjustment ratios are provided to facilitate deter-mination of storage requirements for 19 other pump sets consisting of assorted combinations of fixed-speed pumps or variable-speed pumps with aggregate pumping capacities smaller than or equal to the primary pump relation. The effects of evaporation on side-channel reservoir storage requirements are incorporated into the storage-requirement estimates. The effects of an instream-flow requirement equal to the 80-percent-duration flow are also incorporated into the storage-require-ment estimates.
INTRODUCTION
In 1999, an average of more than 1.5 billion gallons of water was used in Ohio every day for public water supply, with about 65 percent of the water coming from surface-water sources (Luczyk, 2000). Although total water use in Ohio did not consistently increase in the period 1996–99 (Lucyzk, 1997-2000), increases in population, concern over potential impacts of global warming, and lingering memories of the 1999 drought reinforce the need to ensure that Ohio’s water-supply demands can be met in the future.
Construction of new reservoirs is one way to meet increasing water-supply demands. Two types of reservoirs are commonly used in Ohio: impounding reservoirs and side-channel reservoirs. An impounding reservoir is an onstream reservoir that is formed by damming the stream. A side-channel reservoir is an offstream reservoir that is
Abstract 1

formed by pumping water from a stream into an impound-ment. The volume of storage (storage capacity) required for an impounding reservoir is in part a function of the draft rate (the rate at which water will be withdrawn on a daily basis) and the severity of the low-flow conditions for which the res-ervoir is designed. In addition to those characteristics that govern the required storage capacity of an impounding res-ervoir, a side-channel reservoir also is subject to constraints associated with the numbers, types, and capacities of pumps used to fill the reservoir.
Precipitation, evaporation, sedimentation, and seep-age also must be considered in the design of reservoirs. Information is presented in this report to help assess the effects of precipitation and evaporation on required reservoir capacities; however, no information is provided to assist the user with design considerations resulting from sedimentation or seepage processes.
Purpose and ScopeThis report, prepared in cooperation with the Ohio Depart-ment of Natural Resources (ODNR), Division of Water, pro-vides data and methods to aid in the hydrologic design or evaluation of impounding reservoirs and side-channel reser-voirs used for water supply in Ohio. Data from 117 stream-flow-gaging stations throughout Ohio were analyzed by means of nonsequential-mass-curve-analysis techniques to develop relations between storage requirements, water demand, duration, and frequency. Information also is pro-vided on minimum runoff for selected durations and fre-quencies. Systematic record lengths for the streamflow-gaging stations ranged from about 10 to 75 years; however, in many cases, additional streamflow record was synthe-sized.
For impounding reservoirs, families of curves are provided to facilitate the estimation of storage requirements as a function of demand and the ratio of the 7-day, 2-year low flow to the mean annual flow. Information is provided with which to evaluate separately the effects of evaporation on storage requirements. Storage requirements for impounding reservoirs determined by nonsequential-mass-curve-analysis techniques are compared to storage requirements determined by annual-mass-curve techniques that employ probability routing to account for carryover-storage requirements.
For side-channel reservoirs, tables of demand-stor-age-frequency information are provided for a primary pump relation consisting of one variable-speed pump with a pump-ing capacity that ranges from 0.1 to 20 times demand. Tables of adjustment ratios are provided to facilitate determination of storage requirements for 19 other pump sets consisting of assorted combinations of fixed-speed pumps or variable-speed pumps with aggregate pumping capacities smaller than or equal to the primary pump relation. The effects of evaporation on side-channel reservoir storage requirements are incorporated into the storage-requirement estimates. The
effects of an instream-flow requirement equal to the 80-per-cent-duration flow are also incorporated into the storage-requirement estimates. Several example computations for determining reservoir storage capacity are presented.
The information presented in this report provides a starting point for assessing required reservoir storage capac-ity. The various hydrologic design tables do not take into consideration all factors that can affect the design of a reser-voir. Consequently, users need to understand the methods and assumptions used in developing these tables.
Previous StudiesSeveral studies have addressed storage requirements associ-ated with impounding reservoirs on Ohio streams (Cross and Webber, 1950; Cross, 1963, 1965). Collectively, these stud-ies provided minimum runoff information for selected sites and durations, site-specific draft-storage-frequency rela-tions, and regionalized draft-storage-frequency curves. The draft-storage-frequency relations presented by Cross (1963) were based on data collected through September 30, 1960. No statewide analysis of storage requirements for side-chan-nel reservoirs has been prepared for Ohio; however, an anal-ysis was done for Illinois (Knapp, 1982).
AcknowledgmentsSpecial thanks are extended to Michael Schiefer and David Cashell of ODNR for their support, assistance, and guidance.
DATA AND METHODS
Many of the methods used for this study were patterned closely after methods used for studies on the hydrologic design of impounding and side-channel reservoirs in Illinois (Terstriep and others, 1982; Knapp, 1982). The present study, however, represents an original interpretation and implementation of those methods and also includes changes and enhancements to the methods used in the Illinois studies.
Streamflow DataDaily streamflow data from 117 U. S. Geological Survey (USGS) streamflow-gaging stations located throughout Ohio were used in this study (table 1; fig. 1). Drainage areas at the gaging stations ranged from 0.98 to 5,993 mi2, and streamflow record lengths ranged from about 10 to 75 years with a median record length of about 30 years. Streamflow at some of the 117 gaging stations is currently regulated; however, data used in this study were from periods without appreciable regulation or significant urban influences.
2 Hydrologic Considerations for Estimation of Storage-Capacity Requirements of Impounding and Side-Channel Reservoirs for Water Supply in Ohio

.
Table 1. Selected characteristics of streamflow-gaging stations whose data were used for the reservoir-storage analyses
Mapnumber(fig. 1)
Stationnumber Station name Latitude Longitude
Hydrologicunitcode
Drainagearea
1 03089500 Mill Creek near Berlin Center 41°00′01″ 80°58′07″ 5030103 19.1
2 03092000 Kale Creek near Pricetown 41°08′23″ 80°59′43″ 5030103 21.9
3 03092090 West Branch Mahoning River near Ravenna 41°09′41″ 81°11′50″ 5030103 21.8
4 03092500 West Branch Mahoning River near Newton Falls
41°10′18″ 81°01′16″ 5030103 96.3
5 03093000 Eagle Creek at Phalanx Station 41°15′40″ 80°57′16″ 5030103 97.6
6 03096000 Mosquito Creek at Niles 41°11′02″ 80°45′39″ 5030103 138
7 03102950 Pymatuning Creek at Kinsman 41°26′34″ 80°35′18″ 5030102 96.7
8 03109000 Lisbon Creek at Lisbon 40°46′55″ 80°45′53″ 5030101 6.19
9 03109500 Little Beaver Creek near East Liverpool 40°40′33″ 80°32′27″ 5030101 496
10 03110000 Yellow Creek near Hammondsville 40°32′16″ 80°43′31″ 5030101 147
11 03110500 Yellow Creek at Hammondsville 40°33′15″ 80°42′30″ 5030101 164
12 03111500 Short Creek near Dillonvale 40°11′36″ 80°44′04″ 5030106 123
13 03111548 Wheeling Creek below Blaine 40°04′01″ 80°48′31″ 5030106 97.7
14 03114000 Captina Creek at Armstrongs Mills 39°54′31″ 80°55′27″ 5030106 134
15 03115400 Little Muskingum River at Bloomfield 39°33′47″ 81°12′14″ 5030201 210
16 03117500 Sandy Creek at Waynesburg 40°40′21″ 81°15′36″ 5040001 253
17 03119000 Sandy Creek at Sandyville 40°38′04″ 81°22′28″ 5040001 481
18 03090500 Mahoning River below Berlin Dam near Ber-lin Center
41°02′54″ 81°00′05″ 5030103 248
19 03130500 Touby Run at Mansfield 40°45′53″ 82°32′43″ 5040002 5.44
20 03134000 Jerome Fork at Jeromeville 40°48′07″ 82°12′01″ 5040002 120
21 03136500 Kokosing River at Mount Vernon 40°24′20″ 82°30′00″ 5040003 202
22 03137000 Kokosing River at Millwood 40°23′51″ 82°17′09″ 5040003 455
23 03139000 Killbuck Creek at Killbuck 40°28′53″ 81°59′10″ 5040003 464
24 03140000 Mill Creek near Coshocton 40°21′46″ 81°51′45″ 5040003 27.2
25 03144000 Wakatomika Creek near Frazeysburg 40°07′57″ 82°08′53″ 5040004 140
26 03144500 Muskingum River at Dresden 40°07′13″ 81°59′59″ 5040004 5993
27 03146000 North Fork Licking River at Utica 40°13′41″ 82°27′06″ 5040006 116
28 03146500 Licking River near Newark 40°03′33″ 82°20′23″ 5040006 537
Data and Methods 3

29 03147000 Licking River at Toboso 40°03′26″ 82°13′12″ 5040006 672
30 03147500 Licking River below Dillon Dam near Dillon Falls
39°59′18″ 82°04′50″ 5040006 742
31 03149500 Salt Creek near Chandlersville 39°54′31″ 81°51′38″ 5040004 75.7
32 03157000 Clear Creek near Rockbridge 39°35′18″ 82°34′43″ 5030204 89.0
33 03157500 Hocking River at Enterprise 39°33′54″ 82°28′29″ 5030204 459
34 03159500 Hocking River at Athens 39°19′44″ 82°05′16″ 5030204 943
35 03159540 Shade River near Chester 39°03′49″ 81°52′55″ 5030202 156
36 03142200 Salt Fork near Cambridge 40°05′05″ 81°27′20″ 5040005 55.6
37 03228000 Scioto Big Run at Briggsdale 39°54′56″ 83°03′55″ 5060001 11.0
38 03202000 Raccoon Creek at Adamsville 38°51′32″ 82°21′43″ 5090101 585
39 03217500 Scioto River at LaRue 40°34′28″ 83°23′15″ 5060001 257
40 03218000 Little Scioto River above Marion 40°37′43″ 83°10′11″ 5060001 72.4
41 03219500 Scioto River near Prospect 40°25′10″ 83°11′50″ 5060001 567
42 03219590 Bokes Creek near Warrensburg 40°19′20″ 83°10′30″ 5060001 83.2
43 03220000 Mill Creek near Bellepoint 40°14′54″ 83°10′26″ 5060001 178
44 03223000 Olentangy River at Claridon 40°34′58″ 82°59′20″ 5060001 157
45 03224500 Whetstone Creek near Ashley 40°27′18″ 82°57′28″ 5060001 98.7
46 03225500 Olentangy River near Delaware 40°21′18″ 83°04′02″ 5060001 393
47 03226500 Olentangy River at Stratford 40°15′29″ 83°03′44″ 5060001 445
48 03228500 Big Walnut Creek at Central College 40°06′13″ 82°53′03″ 5060001 190
49 03229000 Alum Creek at Columbus 39°56′42″ 82°56′28″ 5060001 189
50 03229500 Big Walnut Creek at Rees 39°51′24″ 82°57′26″ 5060001 544
51 03230500 Big Darby Creek at Darbyville 39°42′02″ 83°06′37″ 5060001 534
52 03230800 Deer Creek at Mount Sterling 39°42′54″ 83°15′26″ 5060002 228
53 03231000 Deer Creek at Williamsport 39°35′09″ 83°07′22″ 5060002 333
54 03232000 Paint Creek near Greenfield 39°22′45″ 83°22′32″ 5060003 249
55 03232300 Rattlesnake Creek at Centerfield 39°19′44″ 83°28′32″ 5060003 209
56 03232500 Rocky Fork near Barretts Mills 39°13′06″ 83°23′08″ 5060003 140
57 03234000 Paint Creek near Bourneville 39°15′49″ 83°10′01″ 5060003 807
58 03235000 Salt Creek at Tarlton 39°33′20″ 82°46′51″ 5060002 11.5
Table 1. Selected characteristics of streamflow-gaging stations whose data were used for the reservoir-storage analyses—Continued
Mapnumber(fig. 1)
Stationnumber Station name Latitude Longitude
Hydrologicunitcode
Drainagearea
4 Hydrologic Considerations for Estimation of Storage-Capacity Requirements of Impounding and Side-Channel Reservoirs for Water Supply in Ohio

59 03236000 Salt Creek near Londonderry 39°15′22″ 82°46′12″ 5060002 286
60 03237280 Upper Twin Creek at McGaw 38°38′37″ 83°12′57″ 5090201 12.2
61 03237500 Ohio Brush Creek near West Union 38°48′13″ 83°25′16″ 5090201 387
62 03238500 White Oak Creek near Georgetown 38°51′29″ 83°55′43″ 5090201 218
63 03240000 Little Miami River near Oldtown 39°44′54″ 83°55′53″ 5090202 129
64 03240500 North Fork Massie Creek at Cedarville 39°45′25″ 83°47′25″ 5090202 28.9
65 03241000 South Fork Massie Creek near Cedarville 39°44′20″ 83°45′50″ 5090202 17.1
66 03241500 Massies Creek at Wilberforce 39°43′22″ 83°52′58″ 5090202 63.2
67 03242050 Little Miami River near Spring Valley 39°35′00″ 84°01′49″ 5090202 366
68 03242200 Anderson Fork near New Burlington 39°33′59″ 83°54′10″ 5090202 77.8
69 03242300 Caesar Creek at Harveysburg 39°30′27″ 84°00′42″ 5090202 209
70 03242500 Little Miami River near Fort Ancient 39°22′42″ 84°05′32″ 5090202 680
71 03245500 Little Miami River at Milford 39°10′17″ 84°17′53″ 5090202 1203
72 03246200 East Fork Little Miami River near Marathon 39°06′52″ 84°01′29″ 5090202 195
73 03246500 East Fork Little Miami River at Williamsburg 39°03′09″ 84°03′02″ 5090202 237
74 03247050 East Fork Little Miami River near Batavia 39°03′36″ 84°10′32″ 5090202 352
75 03247500 East Fork Little Miami River at Perintown 39°08′13″ 84°14′17″ 5090202 476
76 03260700 Bokengehalas Creek near De Graff 40°20′50″ 83°53′28″ 5080001 36.3
77 03260800 Stony Creek near De Graff 40°17′27″ 83°54′36″ 5080001 59.1
78 03264000 Greenville Creek near Bradford 40°06′08″ 84°25′48″ 5080001 193
79 03265000 Stillwater River at Pleasant Hill 40°03′28″ 84°21′22″ 5080001 503
80 03266500 Mad River at Zanesfield 40°21′01″ 83°40′28″ 5080001 7.31
81 03267000 Mad River near Urbana 40°06′27″ 83°47′57″ 5080001 162
82 03268000 Buck Creek at New Moorefield 39°59′31″ 83°42′53″ 5080001 65.3
83 03268500 Beaver Creek near Springfield 39°56′26″ 83°44′56″ 5080001 39.2
84 03270800 Wolf Creek at Trotwood 39°47′39″ 84°18′36″ 5080002 22.7
85 03271000 Wolf Creek at Dayton 39°46′00″ 84°14′10″ 5080002 68.7
86 03271800 Twin Creek near Ingomar 39°42′28″ 84°31′30″ 5080002 197
87 03272700 Sevenmile Creek at Camden 39°37′45″ 84°38′40″ 5080002 69.0
88 03272800 Sevenmile Creek at Collinsville 39°31′23″ 84°36′39″ 5080002 120
89 03273500 Fourmile Creek near Hamilton 39°27′30″ 84°32′50″ 5080002 307
Table 1. Selected characteristics of streamflow-gaging stations whose data were used for the reservoir-storage analyses—Continued
Mapnumber(fig. 1)
Stationnumber Station name Latitude Longitude
Hydrologicunitcode
Drainagearea
Data and Methods 5

90 04177000 Ottawa River at Toledo 41°39′29″ 83°37′19″ 4100001 150
91 04184500 Bean Creek at Powers 41°40′39″ 84°13′56″ 4100006 206
92 04189000 Blanchard River near Findlay 41°03′21″ 83°41′17″ 4100008 346
93 04195500 Portage River at Woodville 41°26′58″ 83°21′41″ 4100010 428
94 04196000 Sandusky River near Bucyrus 40°48′13″ 83°00′21″ 4100011 88.8
95 04196500 Sandusky River near Upper Sandusky 40°51′02″ 83°15′23″ 4100011 298
96 04197000 Sandusky River near Mexico 41°02′39″ 83°11′42″ 4100011 774
97 04197100 Honey Creek at Melmore 41°01′20″ 83°06′35″ 4100011 149
98 04197170 Rock Creek at Tiffin 41°06′49″ 83°10′06″ 4100011 34.6
99 04198000 Sandusky River near Fremont 41°18′28″ 83°09′32″ 4100011 1251
100 04199000 Huron River at Milan 41°18′06″ 82°36′25″ 4100012 371
101 04199500 Vermilion River near Vermilion 41°22′55″ 82°19′01″ 4100012 262
102 04207200 Tinkers Creek at Bedford 41°23′04″ 81°31′39″ 4110002 83.9
103 04210000 Phelps Creek near Windsor 41°30′56″ 80°56′07″ 4110004 25.6
104 04211000 Rock Creek near Rock Creek 41°39′05″ 80°50′10″ 4110004 69.2
105 04212000 Grand River near Madison 41°44′26″ 81°02′48″ 4110004 581
106 04212100 Grand River near Painesville 41°43′08″ 81°13′41″ 4110004 685
107 04212500 Ashtabula River near Ashtabula 41°51′20″ 80°45′44″ 4110003 121
108 04213000 Conneaut Creek at Conneaut 41°55′37″ 80°36′15″ 4120101 175
109 03125000 Home Creek near New Philadelphia 40°28′06″ 81°24′10″ 5040001 1.64
110 03201600 Sandy Run above Big Four Hollow Creek near Lake Hope
39°21′45″ 82°18′47″ 5090101 0.98
111 03201700 Big Four Hollow Creek near Lake Hope 39°21′48″ 82°18′51″ 5090101 1.01
112 03201800 Sandy Run near Lake Hope 39°20′01″ 82°19′56″ 5090101 4.99
113 03235500 Tar Hollow Creek at Tar Hollow State Park 39°23′22″ 82°45′03″ 5060002 1.35
114 04185000 Tiffin River at Stryker 41°30′16″ 84°25′47″ 4100006 410
115 04185440 Unnamed Tributary to Lost Creek near Farmer
41°21′42″ 84°41′28″ 4100006 4.23
116 04197020 Honey Creek near New Washington 40°57′37″ 82°47′19″ 4100011 17.0
117 04201500 Rocky River near Berea 41°24′24″ 81°53′14″ 4110001 267
Table 1. Selected characteristics of streamflow-gaging stations whose data were used for the reservoir-storage analyses—Continued
Mapnumber(fig. 1)
Stationnumber Station name Latitude Longitude
Hydrologicunitcode
Drainagearea
6 Hydrologic Considerations for Estimation of Storage-Capacity Requirements of Impounding and Side-Channel Reservoirs for Water Supply in Ohio

Figure 1. Locations of streamflow-gaging stations in Ohio and climate stations used in the analyses.
Lima
Cadiz
Kenton
Toledo
Dayton
Norwalk
Wooster
Columbus
Hillsboro
Greenville
Pittsburgh, PA
Hiram
Cincinnati Parkersburg, WV
McConneslville
Cleveland
Fort Wayne, IN
Charleston, WV
Covington, KY
85°W 84°W 83°W 82°W 81°W 80°W38
°N39
°N40
°N41
°N42
°N
EXPLANATIONStreamflow-gaging station and identification number
Potential-evapotranspiration sitePrecipitation site
Base map from U.S. Geological Surveydigital data 1:2,000,000UTM projection
1
0 10 20 30 40 50 60 MILES
0 20 40 60 KILOMETERS
91 90
93114
115
92
99101 102
106105 107
108
989796
39
95116
94 19 20
7
104
103
6
1182
53 4
8
911
10
1617
109
36
12
13
14
23
24
26
3130
25
2928
27
2221
15
35
38
34110
112
3332
58
113
59
60
61
57
56
54
55
53
5152
37
5049
48
4746
4243
4044
4541
100
62
72
7374
7571
7069
686765
646366
8382
81
8076
77
7978
84
8586
8788
89
117
111
Data and Methods 7

Extension of Streamflow RecordsDaily streamflow records from about 70 percent of the gag-ing stations were extended mathematically in time in an attempt to include as many years of streamflow data as pos-sible in each analysis. Record was extended as a function of daily streamflow data from a gaging station with long-term record (an index station) by means of a hybrid method that combines a maintenance of variance extension type 1 (move.1) estimator (Hirsch, 1982) with a duration-based estimator (Searcy, 1959).
The hybrid method of record extension was devel-oped because the move.1 estimator frequently did not pro-vide estimates of streamflow during low-flow periods that were as accurate as those provided by the duration-based estimator. Because accurate estimates of streamflow over the entire range of flow are important for some of the reservoir analyses, a method of record extension was developed in which the move.1 estimator could be used for one range of flows and the duration-based estimator for the remaining range of flows. The actual streamflow value for the index station at which the method of estimation shifted from the move.1 estimator to the duration-based estimator was based on minimizing the root-mean-square error (RMSE) between the predicted and observed flows for the concurrent period of record of the index station and the station whose record was being extended. After that streamflow value was determined for a given station pair, it was used consistently to shift between estimators for the entire streamflow time series. Typically, the move.1 estimator was used for the upper range of flows and the duration-based estimator was used for the lower range of flows; however, the method does not preclude use of a pure move.1 or duration-based estimator solution if one or the other minimizes the RMSE.
The choice of index station to use for extension was somewhat subjective but was based on two quantitative cri-teria: (1) maximizing Pearson’s coefficient of correlation between daily mean streamflows for the station whose record was being extended and concurrent daily mean streamflows at the potential index station, and (2) maximiz-ing the period of extended record. A minimum correlation coefficient of 0.80 was required for a station to be considered for use as an index station.
Low-Flow Series and Development of Low-flow Frequency TablesPartial-duration series1 of low flows (hereafter referred to as “partial low-flow series”) were determined in preparation for mass-curve analyses. For most data sets, running-average streamflows (in units of inches2) were calculated from daily
mean streamflows for durations ranging from 30 to 1,800 days (30-day increments from 30 to 360 days and 60-day increments from 360 to 1,800 days). A reduced set of dura-tions was used for analyzing data from three stations (03228000, 04210000, and 04185440) (table 1) because the record available for analysis was relatively short. Capacity-draft-frequency tables for those three stations are truncated to reflect this change.
The average low flows for each duration were sorted in ascending order, resulting in series of low flows whose chronologies were not necessarily preserved; therefore, those series are referred to as “nonsequential.” Each nonse-quential partial low-flow series was scanned, beginning with the smallest value and then stepping down in the series, to remove any larger values that had an overlapping averaging period. The resulting partial series for each duration was composed of relatively independent values (in that all values in a given series were determined for periods that did not overlap in time). Terstriep and others (1982) and the U.S. Army Corps of Engineers (1997) discuss the theoretical jus-tification for use of the nonsequential partial low-flow series.
Recurrence intervals were computed for each value in the series by application of the Weibull plotting-position for-mula (Weibull, 1939), as shown below:
, (1)
where RI is the recurrence interval3 (in years), m is the rank order (with 1 being assigned to the lowest average stream-flow), and n is the number of years (either observed or extended) of data for the station being analyzed.
After the nonsequential partial low-flow series were constructed and recurrence intervals were computed, sepa-rate polynomial equations were fit to the data for each dura-tion analyzed to develop tables of estimated low-flow runoff for selected durations and a range of recurrence intervals. The polynomial equations were fit using the base 10 loga-rithm of the minimum runoff as the dependent variable and the type 1 extreme-value variate associated with the recur-rence interval as the independent variable. The type 1 extreme-value variate was computed as shown below:
, (2)
1A partial-duration series is defined as the maximum N or more values from the N years of record, it being possible that more than one value would come from certain years (Chow, 1964).
2When streamflow (units of volume per time) is considered over a specified period of time, the resulting quantity is a volume. In this report, that volume is reported in units of equivalent inches of water spread uniformly over the drainage area.
3For low flows, the recurrence interval is the average interval, in years, between occurrences of flows less than or equal to a given magnitude.
RI n 1+( )m
-----------------=
Ze 1 1RI------–
ln– ln–=
8 Hydrologic Considerations for Estimation of Storage-Capacity Requirements of Impounding and Side-Channel Reservoirs for Water Supply in Ohio

where is the type 1 extreme-value variate, ln is the natural logarithm, and RI is the recurrence interval (in years).
Polynomial equations were fit to only those values with recurrence intervals of 5 years and greater. For a given station, equations were determined beginning with the long-est duration and then proceeding sequentially to the shortest duration. A second-order polynomial equation, with recur-rence interval as the independent variable, was fit to the data for the longest duration. The polynomial equation was then used to determine low-flow ordinates corresponding to recurrence intervals of 5, 10, 20, 25, 30, 40, 50, 60, 70, 80, 90, and 100 years. To avoid extrapolation, ordinates are reported only for recurrence intervals that lie within the bounds of the recurrence intervals assigned to the particular partial low-flow series (as determined from equation 1). Consequently, if a partial low-flow series has computed recurrence intervals that range from 5.4 to 27 years, low-flow ordinates were computed for recurrence intervals of 5.4, 10, 20, 25, and 27 years. If the computed ordinates decreased consistently (monotonically) with increasing recurrence interval, then the polynomial equation was accepted and the calculation proceeded to the next shorter duration. If the computed ordinates did not decrease mono-tonically, a third-order polynomial was fit to the data, the low-flow ordinates were recomputed, and the results were checked to ensure a monotonic decrease in flow with increasing duration. After a third-order polynomial was required for a particular duration, all shorter duration data also were fit with a third-order polynomial.
By definition, the low-flow ordinate cannot increase with decreasing duration for a given recurrence interval. As successively shorter duration partial low-flow series were
analyzed, the ordinates computed for a given recurrence interval were compared with those of the next longer dura-tion. If an increase was observed, then the value assigned for that recurrence interval was set to that of the longer duration. A sample low-flow frequency table with results for selected durations is shown in table 2.
Storage Analyses for Impounding ReservoirsConstruction of large impounding reservoirs has become less common over time, possibly because of their great expense and their potential detrimental impact on the natural aquatic environment (Collier and others, 1996). Impounding reservoirs, however, remain a viable alternative for meeting water demands in some areas. In addition, estimates of stor-age requirements may be useful for evaluating the adequacy of existing impounding reservoirs. The following three sec-tions address methods used to derive estimates of storage requirements for impounding reservoirs.
Nonsequential-Mass-Curve Analysis for Impounding Reservoirs
A conventional mass-curve analysis is done by plotting cumulative flow against time and comparing the resulting curve to a curve constructed by plotting the cumulative demand against time. A nonsequential-mass-curve analysis differs from a conventional mass-curve analysis in two important ways: (1) the mass-curve-type analysis is done on a recurrence-interval basis, and (2) the cumulative flows that are plotted are nonsequential, cumulative low flows for selected recurrence intervals and durations (as opposed to
Ze
Data and Methods 9
Table 2. Example low-flow frequency table[–, indicates a value that could not be determined because there were too few average low-flow values less than the mean stream-flow for the indicated duration]
Recurrenceinterval(years)
Extreme-value
variate
Minimum runoff (in inches) for indicated duration (in days)
180 360 540 720 1080 1440 1800
53.00 3.96 0.12 2.98 6.90 11.18 22.13 30.99 43.74
50.00 3.90 0.12 3.14 7.01 11.39 22.55 31.55 44.53
40.00 3.68 0.12 3.74 7.43 12.21 24.16 33.72 47.56
30.00 3.38 0.12 4.51 7.97 13.27 26.24 36.52 51.48
25.00 3.20 0.12 4.95 8.23 13.87 27.28 38.09 54.06
20.00 2.97 0.13 5.34 8.33 14.40 27.81 39.46 57.46
10.00 2.25 0.19 6.18 9.49 16.58 31.93 48.04 63.55
5.30 1.57 0.34 6.96 12.42 22.50 42.19 70.57 –

Figure 2. Determination of required reservoir storage capacities and critical drawdown periods from nonsequential mass curves for Kale Creek near Pricetown, Ohio.
0 200 400 600 800 1,000 1,200 1,400 1,600 1,8000
10
20
30
40
50
60
70
80
Time = 600 days
8.64 inches
Time = 1,320 days
16.28 inches
Draft rate = 80% of m
ean annual streamflow
Kale Creek near Pricetown, Ohio
CU
MU
LAT
IVE
MIN
IMU
M S
TR
EA
MF
LOW
, IN
INC
HE
S
DURATION, IN DAYS
10-year recurrence interval 50-year recurrence interval Demand curve
streamflows accumulated in chronological order). The max-imum positive difference between the ordinate of the cumu-lative demand curve and the ordinate of the nonsequential mass curve for a given recurrence interval represents the res-ervoir storage required to meet the indicated demand under low-flow conditions with the specified recurrence interval. The time abscissa at which that maximum difference occurs represents the duration of the critical drawdown period (the period of time during which the reservoir will be under draft such that a maximum reservoir capacity is required to meet demand) for the indicated demand and recurrence interval. From a practical standpoint, the critical drawdown period represents the time period required to completely empty an initially full reservoir under the specific set of inflow and demand conditions.
To help illustrate the nonsequential-mass-curve-anal-ysis technique, figure 2 shows a demand curve and nonse-quential mass curves for 10- and 50-year recurrence intervals for the gaging station on Kale Creek near Pricetown, Ohio (station 03092000). The sloped straight line represents a cumulative demand curve corresponding to a draft equal to 80 percent of the mean annual streamflow. The two nonlin-ear mass curves represent the cumulative minimum stream-flows (in inches), with 10- and 50-year recurrence intervals. The mass curves are constructed by plotting points corre-sponding to the minimum streamflows with sequentially increasing durations for a given recurrence interval (in this case, 10 or 50 years), and then connecting the points by straight lines. The reservoir capacity required to meet the indicated demand is determined by computing the difference
10 Hydrologic Considerations for Estimation of Storage-Capacity Requirements of Impounding and Side-Channel Reservoirs for Water Supply in Ohio

between the demand-curve ordinate and the nonsequential-mass-curve ordinate for all durations and then selecting the maximum positive difference. For the example shown in fig-ure 2, the maximum positive differences between the demand curve and the nonsequential mass curves were 8.64 inches and 16.28 in. for 10- and 50-year recurrence intervals, respectively. The critical drawdown periods are equal to the durations (x-axis values) corresponding to those maximum differences, which, in figure 2, are 600 days and 1,320 days for the 10- and 50-year recurrence intervals, respectively.
Nonsequential mass analyses were done numerically by means of a computer program developed by the author. Tables resulting from these analyses (appendix; table 3 is an example) list the reservoir storage (in inches) required to
meet draft rates of 0.02, 0.05, 0.10, 0.15, 0.20, 0.25, 0.30, 0.35, 0.40, 0.45, 0.50, 0.60, 0.70, 0.80, 0.90, and 1.00 times the mean annual flow with recurrence intervals of 5, 6, 8, 10, 15, 20, 25, 30, 40, 50, 60, 70, 80, 90, and 100 years. The tables also show the duration of the critical drawdown period (in days).
Terstriep and others (1982) show that the duration of the critical drawdown period does not necessarily increase monotonically with demand for a given recurrence interval. This result is dependent on the flow characteristics of the sta-tion being analyzed. For a given demand, however, the dura-tion of the critical drawdown period either increases or remains constant with increasing recurrence interval.
Data and Methods 11
Table 3. Example of nonsequential mass analysis table showing reservoir storage capacities and critical-drawdown durations for selected draft rates and recurrence intervalsRecurrence
interval(years)
Impounding reservoir storage required (in inches) and critical-drawdown duration (in days; shown in gray) for indicated draft rate (in fraction of the mean annual streamflow)
0.02 0.05 0.10 0.15 0.20 0.25 0.30 0.35 0.40 0.45 0.50 0.60 0.70 0.80 0.90 1.00
5 0.00 0.00 0.00 0.01 0.07 0.23 0.47 0.73 1.10 1.46 1.89 2.74 3.61 4.59 5.59 7.19 0 0 0 30 30 90 120 180 180 180 210 210 240 240 300 600
6 0.00 0.00 0.00 0.01 0.08 0.28 0.52 0.82 1.19 1.57 2.00 2.85 3.74 4.72 5.70 8.04 0 0 0 30 60 120 120 180 180 210 210 210 240 240 300 600
8 0.00 0.00 0.00 0.01 0.12 0.33 0.60 0.93 1.30 1.71 2.14 2.99 4.00 5.10 6.87 9.58 0 0 0 30 90 120 150 180 180 210 210 210 270 270 600 900
10 0.00 0.00 0.00 0.01 0.13 0.36 0.65 1.00 1.37 1.80 2.23 3.19 4.29 5.39 7.83 11.49 0 0 0 30 90 120 150 180 210 210 210 270 270 270 900 900
15 0.00 0.00 0.00 0.02 0.15 0.42 0.73 1.10 1.53 2.01 2.50 3.57 4.67 6.81 9.87 13.54 0 0 0 30 120 150 180 210 210 240 240 270 270 600 900 900
20 0.00 0.00 0.00 0.03 0.17 0.46 0.80 1.22 1.71 2.20 2.69 3.76 5.27 7.71 10.62 16.65 0 0 0 30 120 150 180 240 240 240 240 270 600 600 900 1740
25 0.00 0.00 0.00 0.03 0.19 0.50 0.85 1.34 1.83 2.32 2.81 3.94 5.88 8.33 12.00 18.68 0 0 0 30 120 150 240 240 240 240 240 300 600 600 1320 1740
30 0.00 0.00 0.00 0.04 0.23 0.53 0.94 1.43 1.92 2.40 2.91 4.13 6.33 8.78 13.09 20.18 0 0 0 30 150 150 240 240 240 240 300 300 600 600 1740 1740
40 0.00 0.00 0.00 0.05 0.29 0.62 1.04 1.53 2.02 2.53 3.14 4.50 6.94 9.39 15.42 22.51 0 0 0 30 150 180 240 240 240 300 300 600 600 600 1740 1740
50 0.00 0.00 0.00 0.06 0.35 0.69 1.12 1.58 2.06 2.64 3.25 4.89 7.33 10.25 17.34 24.43 0 0 0 90 150 180 210 240 240 300 300 600 600 1740 1740 1740
60 0.00 0.00 0.00 0.10 0.40 0.77 1.20 1.62 2.08 2.70 3.31 5.15 7.60 11.98 19.07 26.16 0 0 30 120 150 210 210 210 300 300 300 600 600 1740 1740 1740
70 0.00 0.00 0.01 0.15 0.46 0.84 1.26 1.69 2.12 2.71 3.32 5.34 7.78 13.59 20.68 27.77 0 0 30 150 180 210 210 210 210 300 300 600 600 1740 1740 1740
80 0.00 0.00 0.02 0.20 0.52 0.90 1.33 1.75 2.18 2.71 3.32 5.47 8.02 15.11 22.20 29.29 0 0 30 150 180 210 210 210 210 300 300 600 1740 1740 1740 1740
90 0.00 0.00 0.04 0.24 0.57 0.95 1.38 1.81 2.24 2.73 3.32 5.57 9.46 16.55 23.65 30.74 0 0 60 150 180 210 210 210 210 270 300 600 1740 1740 1740 1740
100 0.00 0.00 0.06 0.29 0.62 1.00 1.43 1.86 2.29 2.78 3.39 5.63 10.84 17.93 25.02 32.11 0 0 60 150 180 210 210 210 210 270 540 600 1740 1740 1740 1740

Annual-Mass-Curve Analysis of Streamflow with Probability Routing
Riggs and Hardison (1973) presented storage-analysis meth-ods for impounding reservoirs. They indicate that within-year storage requirements can be assessed by use of the annual-mass-curve method and that carryover storage requirements (that part of the storage requirement that spans more than 1 year) can be assessed by means of probability-routing techniques.
In 1968, a computer program called ANSTOR (Moore, 1984) was developed by the USGS to facilitate the determination of within-year storage requirements. An exe-cutable version of ANSTOR is no longer available; however, the USGS retained the ANSTOR source code, the core com-ponents of which were translated from PL1 to Fortran and used by the author to create a program to replicate its func-
tion. That program was supplemented with new code to assist with probability-routing calculations, but some man-ual calculations are still required. All of the probability-rout-ing calculations for this study were based on methods described by Riggs and Hardison (1973).
Data from 12 streamflow-gaging stations were ana-lyzed by the nonsequential-mass-curve method and by the annual-mass-curve method with probability routing to facil-itate comparison of computed storage requirements (table 4). Carryover storage requirements were determined for storage conditions that result in annual deficiency probabilities (probabilities of not being able to supply all of the demand) of 2 and 5 percent by means of methods described by Riggs and Hardison (1973).
Some generalities can be inferred from the data in table 4. For the 2-percent annual probability of deficiency
12 Hydrologic Considerations for Estimation of Storage-Capacity Requirements of Impounding and Side-Channel Reservoirs for Water Supply in Ohio
Table 4. Summary of differences between required storage determined from annual-mass-curve analysis with probability routing and nonsequential-mass-curve analysis[nd, not determined]
Stationnumber
Difference between required storage determined from annual-mass-curve analysis with probability routing and required storage determined from nonsequential-mass-curve analysis (expressed as a ratio to the mean annual flow)
for indicated draft and percent chance of deficiency
2-percent chance of annual deficiency for indicated draft, in percentage of mean annual flow
5-percent chance of annual deficiency for indicated draft, in percentage of mean annual flow
90 70 50 30 10 5 90 70 50 30 10 5
03092000 nd 0.019 0.085 0.017 0.001 0.000 0.226 0.047 -0.018 0.004 0.001 0.001
03111500 0.403 0.171 0.050 0.000 0.000 0.000 0.327 0.156 -0.020 0.009 0.000 0.000
03130500 -0.417 -0.590 -0.223 -0.005 -0.012 -0.001 -0.098 -0.125 -0.064 0.004 0.001 0.000
03139000 0.422 -0.059 -0.058 -0.013 0.001 0.000 0.437 0.059 -0.053 -0.008 0.000 0.000
03144000 0.135 -0.101 -0.108 -0.018 0.003 0.000 0.338 0.011 -0.084 -0.018 0.001 0.000
03157000 0.190 -0.139 -0.096 0.002 0.000 0.000 0.483 0.142 -0.023 0.004 0.001 0.000
03159500 0.518 -0.040 -0.119 -0.057 0.002 0.000 0.518 -0.040 -0.119 -0.057 0.002 0.000
03159540 -0.483 -0.735 -0.399 -0.116 -0.003 0.005 0.509 -0.029 -0.054 -0.003 -0.005 -0.003
04184500 -0.371 -1.922 -1.586 -0.910 -0.199 -0.010 1.096 -0.023 -0.065 -0.072 -0.004 0.000
04201500 -0.387 -0.329 -0.143 -0.073 -0.014 -0.001 0.144 0.018 -0.078 -0.022 -0.004 0.002
04207200 -2.369 -1.974 -1.182 -0.314 -0.038 -0.006 -0.053 -0.089 -0.040 0.004 0.024 0.011
04213000 -0.376 -0.180 -0.068 -0.021 -0.001 0.000 0.120 -0.099 -0.040 -0.008 0.001 0.000
Maximum 0.518 0.171 0.085 0.017 0.003 0.005 1.096 0.156 -0.018 0.009 0.024 0.011
Mean -0.249 -0.490 -0.321 -0.126 -0.022 -0.001 0.337 0.002 -0.055 -0.014 0.002 0.001
Median -0.371 -0.160 -0.114 -0.020 -0.001 0.000 0.333 -0.006 -0.054 -0.006 0.001 0.000
Minimum -2.369 -1.974 -1.586 -0.910 -0.199 -0.010 -0.098 -0.125 -0.119 -0.072 -0.005 -0.003

and drafts greater than or equal to about 30 percent of the mean annual flow, the nonsequential-mass-curve analyses generally indicated the need for more storage (as indicated by negative differences) than did the annual-mass-curve analysis with probability routing. The opposite pattern gen-erally was observed for the 5-percent annual probability of deficiency with drafts greater than or equal to about 70 per-cent of the mean annual flow.
For the data shown in table 4, the largest absolute mean difference between required storage (expressed as a ratio to the mean annual flow) determined from annual-mass-curve analyses with probability routing and required storage determined from nonsequential-mass-curve analyses was 0.490 for a draft of 70 percent of the mean annual flow and a 2-percent annual deficiency probability. The largest absolute difference between required storage determined from annual-mass-curve analyses with probability routing and required storage determined from nonsequential-mass-curve analyses (again expressed as a ratio to the mean annual flow) was 2.369 for a draft of 90 percent of the mean annual flow and a 2-percent annual deficiency probability. These results, and others shown in table 4, illustrate that large dif-ferences in computed required storage can result from the two methods, particularly when draft rates equal or exceed 30 percent of the mean annual flow.
Of the 12 streamflow-gaging stations considered in this comparison, 10 could meet draft rates of at least 20 per-cent of the mean annual flow without requiring carryover storage. Consequently, a draft rate equal to 30 percent of the mean annual flow represents a value at which carryover stor-age was necessary to meet demand for most of the stream-flow-gaging stations. This finding suggests that differences in results obtained from the annual-mass-curve analyses with probability routing and the nonsequential-mass-curve analyses are most pronounced for drafts where demand can-not be met from within-year storage.
Evaporation Losses
Evaporative losses from reservoirs can be significant and consequently should be considered in reservoir design. Data on net evaporation (the difference between evaporation and precipitation) were analyzed for seven locations in Ohio and adjacent states to provide information on potential evapora-tive losses in reservoirs. Long-term daily precipitation and potential evapotranspiration data were obtained from the Midwestern Regional Climate Center4 for use in the analyses (table 5). Potential evapotranspiration (PET), a measure of
the ability of the atmosphere to remove water from a surface through the processes of evaporation and transpiration assuming an unlimited supply of water, provides good esti-mates of evaporation from shallow lakes (Farnsworth and Thompson, 1982). The reader is cautioned that, because deep lakes can store appreciable amounts of heat, evapora-tion from deep lakes on any given day can be significantly different from the PET. The PET data were computed by the Midwestern Regional Climate Center by means of the Pen-man-Monteith formula (Monteith, 1965). The Penman-Mon-teith formula requires a considerable amount of relatively sophisticated climatic data (such as measures of solar radia-tion and windspeed) to compute PET. Because those data were not routinely collected prior to about 1948, the PET data only were available for the period 1948–99.
Daily net evaporation data were analyzed to estimate maximum net evaporation (in inches) for selected durations and recurrence intervals. The maximum net evaporation data were analyzed by methods similar to those used for the low-flow duration-frequency analyses. The main difference in method between the low-flow duration-frequency analyses and the maximum net evaporation duration-frequency anal-yses was that a different form of equation was used to fit the data. The maximum net evaporation data were fit by a growth model of the form
, (3)
where is the maximum net evaporation (in inches) for a given duration, RI is the recurrence interval (in years), and a, b, c, and d are fitted coefficients. The growth model shown in equation 3 produces an S-shaped curve that increases monotonically, approaching an asymptote. Another difference in method between the low-flow analyses and the maximum net evaporation analyses was that maxi-mum net evaporation was not forced to increase or remain constant with increasing duration for a given recurrence interval. In fact, as illustrated in figure 3 (page 22), the max-imum net evaporation data for a given recurrence interval commonly exhibit a sinusoidal pattern as a function of dura-tion with a period of about 1 year (most likely resulting from the annual climatic cycle). The results of the evaporation-duration-frequency analyses are listed in tables 6 through 12; the precipitation data-collection sites are shown on figure 1.
Negative net evaporation values in tables 6 through 12 indicate that precipitation exceeded evaporation and con-sequently could be used to supplement inflow to the impounding reservoir. A more cautious approach is to treat the negative values as zeros.
4The Midwestern Regional Climate Center is a cooperative program of the Illinois State Water Survey (Illinois Department of Natural Resources) and the National Climatic Data Center (National Oceanic and Atmospheric Administration, U.S. Depart-ment of Commerce).
Enetmaxab c RI( )d+( )
b RI( )d+( )----------------------------------=
Enetmax
Data and Methods 13

Table 5. National Weather Service Cooperative Station names, locations, and periods of precipitation and potential-evapotranspiration data used in the reservoir-storage analyses[WSO, weather service office; dates reported as year, month, day in format YYYYMMDD; PET, potential evapotranspiraton]
Cooper-ative
stationID
Station name Decimallatitude
Decimallongitude County State Dates of PET data
usedDates of precipita-
tion data used
331152 Cadiz 40.27 81.00 Harrison OH No available data 19030101-19990911
461575 Charlestown 1 38.35 81.65 Kanawha WV No available data 19260101-19740213
461570 Charleston Weather Service Fore-cast Office AP
38.37 81.60 Kanawha WV 19501201-19990912 19480101-19990908
331561 Cincinnati Abbe WSO 39.15 84.52 Hamilton OH No available data 18960101-19821231
151855 Cincinnati Northern KY Airport 39.05 84.67 Boone KY 19480717-19990912 not used
331576 Cincinnati Municipal Airport Lunke
39.10 84.42 Hamilton OH No available data 19490101-19990908
331657 Cleveland WSO 41.40 81.85 Cuyahoga OH 19480101-19990912 18960501-19990908
331786 Port Columbus International Air-port
39.98 82.87 Franklin OH 19480701-19990912 18960501-19990908
331778 Columbus Ohio State University 40.00 83.02 Franklin OH No available data 18960101-19570930
332075 Dayton International Airport 39.90 84.20 Montgomery OH 19480701-19990912 not used
332067 Dayton MCD 39.77 84.18 Montgomery OH No available data 18960101-19990731
123037 Forte Wayne International Airport 41.00 85.20 Allen IN 19480201-19990912 not used
333375 Greenville Water Plant 40.10 84.65 Darke OH No available data 18960501-19990731
333758 Hillsboro / Hillsboro 5 S 39.20 83.62 Highland OH No available data 18960501-19990908
333780 Hiram 41.32 81.15 Portage OH No available data 18960501-19990731
334189 Kenton 2 W 40.65 83.65 Portage OH No available data 18960501-19990908
334551 Lima Wastewater Treatment Plant 40.72 84.12 Allen OH No available data 19020301-19990731
336118 Norwalk Wastewater Treatment Plant
41.25 82.62 Huron OH No available data 18960501-19990908
335041 Mc Connelsville Lock 7 39.65 81.83 Morgan OH No available data 18960501-19990908
466859 Parkersburg WSO 39.27 81.57 Wood WV No available data 19260101-19990731
366992 Pittsburgh International Airport 40.35 79.93 Allegany PA 19450701-19520915 not used
366993 Pittsburgh WSO 40.50 80.22 Allegany PA 19520916-19990912 19520916-19990908
366997 Pittsburgh WSO City 40.45 80.00 Allegany PA No available data 19260101-19790930
338356 Toledo Metcalf Field 41.57 83.47 Lucas OH 19460101-19550131 19460101-19550101
338357 Toledo Express Airport (366992) 41.60 83.80 Lucas OH 19550201-19990912 19550201-19990908
339312 Wooster Exp. Station 40.78 81.93 Wayne OH No available data 18930601-19990911
14 Hydrologic Considerations for Estimation of Storage-Capacity Requirements of Impounding and Side-Channel Reservoirs for Water Supply in Ohio

Table 6. Maximum net evaporation for Charleston, West Virginia[<, less than; maximum net evaporation was computed from data obtained from the Midwestern Regional Climate Center for National Oceanic and Atmo-spheric Administration climate stations 461575 and 461570 (table 5); calculations based on period 12/01/1950–09/08/1999]
Dura-tion,
in days
Maximum net evaporation (in inches) for indicated recurrence interval (in years)
5 6 8 10 15 20 25 30 40 50 60 70 80 90 100
30 4.3 4.4 4.7 4.9 5.3 5.6 5.7 5.8 5.9 5.9 6.0 6.0 6.0 6.0 6.0
60 6.6 6.8 7.1 7.5 8.1 8.5 8.9 9.1 9.5 9.6 9.7 9.8 9.8 9.8 9.9
90 7.7 7.9 8.4 8.9 10.0 10.7 11.1 11.4 11.7 11.8 11.9 11.9 11.9 12.0 12.0
120 9.5 9.6 9.8 10.2 11.1 11.9 12.6 13.1 13.8 14.2 14.4 14.6 14.7 14.7 14.8
150 9.6 10.0 10.7 11.4 12.7 13.7 14.4 14.9 15.5 15.9 16.2 16.4 16.5 16.6 16.7
180 9.8 10.5 11.7 12.7 14.2 14.9 15.4 15.6 15.9 16.0 16.1 16.2 16.2 16.2 16.2
210 9.9 10.8 12.1 13.0 14.3 15.0 15.5 15.8 16.2 16.4 16.6 16.7 16.8 16.8 16.9
240 9.2 10.1 11.8 13.1 15.0 15.7 16.1 16.2 16.4 16.5 16.5 16.5 16.5 16.5 16.5
270 8.5 9.3 10.7 11.7 13.4 14.3 14.8 15.2 15.7 15.9 16.1 16.2 16.3 16.4 16.4
300 6.6 7.7 9.4 10.5 12.2 13.1 13.8 14.2 14.8 15.2 15.5 15.7 15.8 16.0 16.1
330 5.4 6.2 7.5 8.5 10.4 11.7 12.7 13.5 14.8 15.8 16.5 17.2 17.8 18.3 18.7
360 2.4 3.5 5.3 6.8 9.5 11.5 13.1 14.4 16.6 18.2 19.6 20.8 21.9 22.8 23.6
420 2.8 4.3 6.6 8.5 12.0 14.4 16.3 17.8 20.0 21.7 23.0 24.1 24.9 25.7 26.3
480 3.8 4.7 6.9 9.2 14.2 17.5 19.6 20.9 22.4 23.1 23.4 23.7 23.8 23.9 24.0
540 0.5 2.8 6.8 9.9 15.2 18.2 20.2 21.4 23.0 23.9 24.4 24.8 25.1 25.3 25.4
600 -0.7 0.9 4.5 8.1 15.0 19.0 21.1 22.4 23.6 24.2 24.5 24.6 24.7 24.8 24.9
660 -4.6 -1.3 3.7 7.1 12.4 15.5 17.5 18.9 20.8 22.0 22.8 23.4 23.9 24.3 24.6
720 -8.9 -5.4 -0.3 3.5 9.7 13.6 16.3 18.4 21.3 23.3 24.8 26.0 26.9 27.7 28.4
780 -9.8 -6.8 -2.1 1.6 8.3 13.0 16.6 19.5 24.0 27.5 30.3 32.6 34.6 36.3 37.8
840 -10.9 -7.6 -2.4 1.6 8.7 13.6 17.3 20.2 24.7 28.0 30.6 32.8 34.6 36.1 37.5
900 -20.7 -13.9 -4.5 1.6 10.6 15.6 18.8 21.0 23.9 25.7 27.0 28.0 28.7 29.3 29.7
960 -24.0 -16.2 -5.9 0.6 9.7 14.5 17.4 19.4 22.0 23.5 24.6 25.3 25.9 26.3 26.7
1020 -30.8 -20.7 -8.2 -0.9 8.3 12.7 15.2 16.8 18.7 19.8 20.5 20.9 21.3 21.5 21.7
1080 -38.4 -27.5 -13.9 -5.7 5.2 10.7 13.9 16.1 18.9 20.5 21.6 22.4 23.0 23.4 23.8
1140 -53.0 -35.7 -15.8 -5.0 7.5 12.8 15.6 17.3 19.1 20.1 20.7 21.1 21.3 21.5 21.7
1200 -55.3 -38.1 -17.4 -5.8 8.4 14.7 18.2 20.3 22.8 24.1 24.9 25.4 25.8 26.1 26.3
1260 -65.4 -44.7 -20.5 -7.2 8.3 14.8 18.3 20.3 22.6 23.8 24.5 25.0 25.3 25.6 25.7
1320 -76.6 -50.2 -21.5 -7.0 8.6 14.5 17.5 19.1 20.9 21.7 22.2 22.5 22.7 22.8 22.9
1380 -79.2 -53.5 -24.9 -10.1 6.2 12.6 15.9 17.8 19.8 20.8 21.4 21.7 22.0 22.1 22.3
1440 -91.5 -60.2 -27.3 -11.3 5.2 11.2 14.0 15.6 17.2 17.9 18.4 18.6 18.8 18.9 19.0
1500 <-99.9 -66.4 -29.0 -12.5 2.9 7.8 10.0 11.1 12.1 12.6 12.8 13.0 13.0 13.1 13.1
1560 <-99.9 -69.9 -31.8 -14.3 2.6 8.3 10.8 12.2 13.5 14.1 14.4 14.6 14.7 14.8 14.9
1620 <-99.9 -72.8 -34.2 -15.9 2.4 8.9 11.9 13.6 15.2 16.0 16.4 16.6 16.8 16.9 17.0
1680 -70.2 -54.6 -34.0 -21.0 -3.2 5.9 11.4 15.0 19.5 22.2 23.9 25.2 26.1 26.8 27.4
1740 <-99.9 -83.3 -41.1 -21.0 -0.9 6.2 9.5 11.3 13.0 13.8 14.3 14.6 14.7 14.8 14.9
1800 -64.5 -58.3 -45.4 -33.4 -11.4 0.8 7.5 11.5 15.6 17.5 18.5 19.1 19.5 19.8 19.9
Data and Methods 15

Table 7. Maximum net evaporation for Cincinnatti, Ohio[Maximum net evaporation was computed from data obtained from the Midwestern Regional Climate Center for National Oceanic and Atmospheric Admin-istration climate stations 331561, 151855, and 331576 (table 5); calculations based on period 07/17/1948–09/08/1999]
Dura-tion,
in days
Maximum net evaporation (in inches) for indicated recurrence interval (in years)
5 6 8 10 15 20 25 30 40 50 60 70 80 90 100
30 5.3 5.3 5.4 5.5 5.6 5.8 5.9 6.1 6.4 6.7 7.1 7.4 7.7 8.0 8.3
60 8.1 8.4 8.7 9.0 9.7 10.2 10.6 11.0 11.6 12.2 12.6 13.1 13.5 13.8 14.1
90 10.8 10.9 11.2 11.5 12.2 12.8 13.5 14.2 15.4 16.7 18.0 19.2 20.5 21.7 22.9
120 12.4 12.9 13.8 14.4 15.6 16.4 17.0 17.5 18.2 18.7 19.1 19.4 19.6 19.8 20.0
150 13.9 14.0 14.5 15.2 17.0 18.6 19.6 20.2 20.8 21.1 21.2 21.3 21.4 21.4 21.4
180 15.1 15.1 15.3 15.7 17.8 20.2 21.5 22.0 22.4 22.5 22.5 22.5 22.5 22.5 22.5
210 15.7 15.9 16.4 17.0 18.9 20.4 21.5 22.1 22.8 23.1 23.3 23.4 23.4 23.5 23.5
240 14.9 15.5 16.6 17.5 19.2 20.3 21.2 21.8 22.8 23.5 24.0 24.3 24.6 24.9 25.1
270 14.7 14.8 15.0 15.3 16.9 19.0 20.8 22.1 23.3 23.8 24.0 24.1 24.2 24.2 24.2
300 12.9 13.2 14.0 14.8 16.7 18.4 19.7 20.8 22.4 23.4 24.1 24.6 24.9 25.2 25.4
330 10.9 11.6 12.9 13.9 16.0 17.6 18.9 20.0 21.6 22.8 23.8 24.6 25.3 25.9 26.4
360 10.2 10.4 11.0 11.9 15.2 18.6 21.2 22.8 24.3 24.9 25.2 25.4 25.4 25.5 25.5
420 10.3 11.5 13.5 15.1 18.2 20.5 22.3 23.9 26.3 28.3 29.9 31.3 32.6 33.7 34.7
480 11.8 13.8 16.9 19.1 22.8 25.3 27.1 28.5 30.5 32.0 33.1 34.1 34.8 35.5 36.0
540 12.9 15.2 18.7 21.2 25.2 27.6 29.2 30.4 32.0 33.1 33.8 34.4 34.9 35.3 35.6
600 12.7 15.0 18.4 20.9 25.0 27.6 29.4 30.7 32.5 33.8 34.7 35.4 36.0 36.5 36.9
660 9.0 11.6 15.5 18.4 23.2 26.2 28.3 29.9 32.1 33.5 34.6 35.5 36.2 36.7 37.2
720 2.8 6.5 11.9 15.8 21.9 25.5 27.9 29.6 32.0 33.5 34.5 35.3 35.9 36.4 36.8
780 2.4 6.2 11.9 16.1 23.0 27.2 30.2 32.3 35.3 37.3 38.7 39.8 40.7 41.4 42.0
840 0.2 5.6 13.3 18.6 26.6 31.2 34.2 36.4 39.2 41.1 42.4 43.3 44.1 44.7 45.2
900 2.8 8.5 16.2 21.4 29.1 33.5 36.4 38.5 41.3 43.1 44.4 45.4 46.2 46.8 47.3
960 -1.0 7.0 17.0 22.9 30.5 34.0 36.1 37.4 39.0 39.8 40.4 40.8 41.1 41.3 41.5
1020 -4.4 3.4 13.3 19.3 27.2 31.1 33.4 34.9 36.7 37.7 38.4 38.9 39.3 39.5 39.8
1080 -11.9 -1.4 11.0 17.8 25.9 29.5 31.4 32.6 33.9 34.6 35.1 35.4 35.6 35.7 35.8
1140 -17.5 -6.4 7.5 15.8 26.9 32.4 35.8 38.0 40.8 42.4 43.5 44.3 44.9 45.4 45.7
1200 -26.0 -12.3 4.7 14.9 28.6 35.4 39.5 42.2 45.7 47.7 49.1 50.0 50.8 51.3 51.8
1260 -31.0 -15.7 3.5 14.9 30.3 37.9 42.5 45.6 49.4 51.7 53.3 54.3 55.2 55.8 56.3
1320 -45.7 -18.8 7.9 20.4 32.9 37.6 40.0 41.4 43.3 44.6 45.6 46.6 47.5 48.4 49.2
1380 -50.2 -22.7 4.7 17.5 30.3 35.0 37.4 38.8 40.6 41.8 42.7 43.5 44.3 45.1 45.8
1440 -55.1 -26.6 1.8 15.0 28.2 32.9 35.2 36.6 38.2 39.2 39.9 40.6 41.1 41.7 42.2
1500 -44.4 -27.7 -6.7 5.8 22.5 30.9 35.9 39.3 43.4 46.0 47.6 48.8 49.7 50.4 51.0
1560 -6.0 -2.1 5.5 12.1 24.1 31.2 35.6 38.4 41.6 43.3 44.2 44.9 45.3 45.6 45.8
1620 -4.8 -1.8 4.6 10.7 23.2 31.4 36.7 40.1 44.1 46.1 47.3 48.1 48.6 48.9 49.2
1680 -3.9 -1.7 3.6 9.7 23.2 31.8 36.7 39.5 42.3 43.4 44.0 44.3 44.5 44.7 44.7
1740 -8.0 -5.1 1.2 7.5 20.2 28.2 33.1 36.1 39.3 40.9 41.8 42.3 42.6 42.9 43.0
1800 -12.6 -10.2 -4.0 3.0 18.3 27.3 32.1 34.7 37.1 38.1 38.5 38.8 38.9 39.0 39.1
16 Hydrologic Considerations for Estimation of Storage-Capacity Requirements of Impounding and Side-Channel Reservoirs for Water Supply in Ohio

Table 8. Maximum net evaporation for Cleveland, Ohio[Maximum net evaporation was computed from data obtained from the Midwestern Regional Climate Center for National Oceanic and Atmospheric Admin-istration climate station 331657 (table 5); calculations based on period 01/01/1948–09/08/1999]
Dura-tion,
in days
Maximum net evaporation (in inches) for indicated recurrence interval (in years)
5 6 8 10 15 20 25 30 40 50 60 70 80 90 100
30 5.4 5.6 5.8 6.0 6.4 6.6 6.8 6.9 7.0 7.2 7.2 7.3 7.3 7.4 7.4
60 8.4 8.6 9.1 9.4 10.1 10.5 10.9 11.3 11.8 12.2 12.6 12.9 13.1 13.4 13.6
90 10.8 11.2 11.9 12.4 13.2 13.6 13.9 14.1 14.4 14.5 14.6 14.7 14.8 14.8 14.9
120 13.1 13.4 13.9 14.4 15.4 15.9 16.2 16.3 16.5 16.6 16.6 16.7 16.7 16.7 16.7
150 14.0 14.5 15.2 15.7 16.6 17.2 17.6 17.9 18.4 18.7 19.0 19.2 19.4 19.5 19.7
180 15.1 15.4 16.0 16.4 17.2 17.8 18.3 18.7 19.3 19.8 20.2 20.5 20.8 21.1 21.3
210 14.5 15.1 16.0 16.6 17.8 18.6 19.2 19.7 20.4 21.0 21.4 21.8 22.1 22.3 22.5
240 13.1 13.9 15.1 16.0 17.5 18.5 19.1 19.6 20.3 20.8 21.2 21.4 21.6 21.8 22.0
270 11.8 12.7 13.9 14.9 16.6 17.8 18.7 19.3 20.4 21.2 21.8 22.3 22.7 23.0 23.3
300 10.3 11.1 12.4 13.4 15.3 16.6 17.7 18.5 19.9 20.9 21.8 22.5 23.1 23.7 24.2
330 9.0 10.0 11.6 12.8 14.6 15.8 16.6 17.2 18.0 18.6 19.0 19.4 19.6 19.9 20.0
360 8.2 9.2 10.7 11.9 13.8 15.1 16.0 16.8 17.8 18.6 19.1 19.6 19.9 20.2 20.5
420 10.3 11.2 12.7 13.8 15.9 17.3 18.5 19.4 20.8 22.0 22.9 23.6 24.3 24.9 25.4
480 12.0 12.7 13.9 14.9 17.1 19.0 20.6 22.0 24.6 26.8 28.7 30.6 32.2 33.8 35.3
540 12.4 13.0 14.2 15.3 17.7 19.9 21.9 23.8 27.3 30.6 33.7 36.6 39.4 42.1 44.8
600 9.6 10.5 12.1 13.6 16.8 19.6 22.2 24.6 28.9 32.8 36.4 39.7 42.8 45.8 48.6
660 6.4 7.6 9.6 11.4 15.1 18.1 20.7 23.1 27.1 30.6 33.7 36.5 39.0 41.3 43.5
720 3.4 5.2 8.0 10.3 14.5 17.6 20.1 22.1 25.3 27.9 30.0 31.8 33.3 34.7 35.9
780 3.0 4.6 7.4 9.7 14.3 17.9 20.9 23.6 28.0 31.7 34.8 37.6 40.1 42.4 44.5
840 0.7 3.5 8.0 11.5 17.9 22.5 26.0 28.9 33.4 36.9 39.7 42.1 44.1 45.9 47.5
900 0.2 3.5 8.7 12.7 19.7 24.5 28.1 31.0 35.3 38.4 40.9 42.9 44.6 46.0 47.2
960 -4.2 0.3 6.9 11.5 19.1 23.8 27.1 29.5 32.9 35.3 37.0 38.4 39.5 40.4 41.2
1020 -4.6 -0.6 5.2 9.3 16.0 20.1 22.9 25.1 28.1 30.1 31.6 32.8 33.7 34.5 35.2
1080 -12.0 -5.3 3.1 8.3 15.3 18.8 20.9 22.3 24.0 25.0 25.7 26.2 26.5 26.8 27.0
1140 -7.2 -2.7 3.7 8.2 15.3 19.6 22.5 24.6 27.5 29.5 30.9 32.0 32.9 33.6 34.1
1200 -12.3 -5.7 3.4 9.5 18.6 23.6 26.9 29.2 32.3 34.2 35.5 36.5 37.3 37.9 38.4
1260 -25.7 -14.2 0.2 8.8 20.3 26.1 29.5 31.8 34.7 36.4 37.6 38.4 39.0 39.5 39.9
1320 -15.1 -7.3 3.2 9.9 19.5 24.6 27.8 30.0 32.8 34.6 35.8 36.7 37.3 37.8 38.3
1380 -13.4 -8.6 -1.3 4.1 13.0 18.7 22.7 25.7 29.9 32.9 35.0 36.7 38.1 39.2 40.1
1440 -17.4 -13.1 -6.2 -0.9 8.4 14.7 19.3 22.9 28.1 31.9 34.8 37.0 38.9 40.4 41.7
1500 -30.8 -21.1 -8.1 0.1 11.7 17.8 21.5 24.0 27.1 29.1 30.3 31.2 31.9 32.5 32.9
1560 -11.4 -9.3 -4.6 0.2 10.8 18.7 24.2 28.0 32.7 35.2 36.7 37.7 38.3 38.8 39.1
1620 -34.7 -24.9 -11.3 -2.2 11.7 19.6 24.9 28.6 33.7 37.1 39.5 41.3 42.7 43.9 44.9
1680 -79.3 -50.7 -19.2 -3.1 14.7 21.6 25.1 27.1 29.2 30.3 30.9 31.3 31.6 31.8 31.9
1740 -16.1 -13.8 -9.0 -4.4 5.8 13.7 19.6 24.0 29.9 33.6 36.0 37.6 38.8 39.7 40.4
1800 -31.3 -25.9 -16.8 -9.4 3.6 11.9 17.4 21.3 26.4 29.5 31.6 33.1 34.1 35.0 35.6
Data and Methods 17

Table 9. Maximum net evaporation for Columbus, Ohio[Maximum net evaporation was computed from data obtained from the Midwestern Regional Climate Center for National Oceanic and Atmospheric Admin-istration climate stations 331786 and 331778 (table 5); calculations based on period 07/01/1948–09/08/1999]
Dura-tion,
in days
Maximum net evaporation (in inches) for indicated recurrence interval (in years)
5 6 8 10 15 20 25 30 40 50 60 70 80 90 100
30 5.2 5.3 5.4 5.6 5.9 6.0 6.2 6.2 6.3 6.4 6.4 6.5 6.5 6.5 6.5
60 8.0 8.2 8.4 8.6 8.9 9.1 9.2 9.3 9.4 9.5 9.5 9.6 9.6 9.7 9.7
90 10.1 10.4 10.7 11.0 11.5 11.8 12.1 12.3 12.6 12.8 13.0 13.1 13.3 13.4 13.5
120 12.1 12.4 12.8 13.2 13.7 14.1 14.3 14.5 14.8 15.0 15.2 15.3 15.4 15.4 15.5
150 12.6 13.0 13.7 14.4 15.5 16.2 16.5 16.7 16.9 17.1 17.1 17.1 17.2 17.2 17.2
180 12.9 13.3 14.2 15.3 17.6 18.6 19.0 19.2 19.3 19.3 19.4 19.4 19.4 19.4 19.4
210 13.1 13.4 14.1 14.9 17.1 18.7 19.6 20.2 20.8 21.1 21.2 21.3 21.4 21.4 21.4
240 12.7 12.8 13.2 14.0 17.3 19.5 20.4 20.7 21.0 21.0 21.0 21.0 21.0 21.0 21.0
270 12.0 12.1 12.5 13.3 16.9 19.3 20.2 20.5 20.7 20.7 20.7 20.7 20.7 20.7 20.7
300 11.1 11.3 11.8 12.9 16.9 19.0 19.7 19.9 20.0 20.1 20.1 20.1 20.1 20.1 20.1
330 9.4 10.1 11.6 12.9 15.6 17.3 18.3 19.0 19.8 20.3 20.5 20.6 20.8 20.8 20.9
360 9.6 10.2 11.6 12.9 15.2 16.6 17.5 18.0 18.5 18.8 19.0 19.1 19.1 19.2 19.2
420 10.9 11.7 13.0 14.0 15.9 17.3 18.4 19.3 20.7 21.8 22.8 23.5 24.2 24.9 25.4
480 11.8 12.8 14.4 15.6 18.1 19.9 21.3 22.5 24.4 25.9 27.2 28.3 29.2 30.1 30.8
540 12.5 14.0 16.4 18.2 21.6 24.0 25.9 27.4 29.8 31.6 33.1 34.4 35.5 36.5 37.4
600 10.8 12.9 16.1 18.5 22.7 25.5 27.5 29.1 31.5 33.3 34.7 35.8 36.8 37.6 38.3
660 7.6 10.3 14.4 17.3 22.1 25.2 27.3 28.8 31.0 32.5 33.6 34.4 35.0 35.6 36.0
720 6.0 8.6 12.6 15.5 20.5 23.7 26.0 27.8 30.4 32.3 33.8 35.0 35.9 36.8 37.5
780 5.4 8.4 12.9 16.2 21.4 24.7 27.0 28.7 31.1 32.8 34.1 35.0 35.8 36.5 37.0
840 5.1 9.8 16.0 19.9 25.2 28.0 29.7 30.9 32.3 33.2 33.8 34.2 34.6 34.8 35.0
900 4.9 9.7 16.2 20.5 26.9 30.4 32.8 34.4 36.5 37.9 38.9 39.6 40.1 40.6 40.9
960 4.1 10.6 18.4 22.9 28.5 31.0 32.4 33.3 34.4 35.0 35.3 35.6 35.8 35.9 36.0
1020 3.6 8.9 15.7 19.9 25.7 28.6 30.4 31.5 33.0 33.9 34.5 34.9 35.2 35.5 35.7
1080 -6.5 0.6 9.5 14.9 22.0 25.4 27.4 28.7 30.3 31.2 31.8 32.2 32.5 32.7 32.9
1140 -5.8 -0.5 7.2 12.4 20.7 25.6 28.9 31.3 34.6 36.8 38.5 39.7 40.7 41.5 42.1
1200 -5.6 -0.4 7.3 12.9 22.2 28.1 32.2 35.4 40.0 43.1 45.5 47.4 48.9 50.1 51.2
1260 -5.6 0.0 8.4 14.4 24.3 30.4 34.8 38.0 42.7 45.9 48.3 50.2 51.7 53.0 54.0
1320 -6.3 -0.7 7.8 14.0 24.2 30.6 35.1 38.5 43.4 46.8 49.4 51.4 53.0 54.3 55.5
1380 -8.5 -2.8 5.7 11.9 22.3 29.0 33.7 37.3 42.6 46.2 49.0 51.1 52.9 54.4 55.6
1440 -11.9 -5.7 3.4 10.0 20.8 27.6 32.3 35.9 40.9 44.4 47.0 49.0 50.6 51.9 53.1
1500 -22.5 -13.0 0.2 9.0 22.0 29.2 33.8 37.0 41.3 43.9 45.8 47.2 48.2 49.0 49.7
1560 -13.3 -7.7 1.3 8.1 20.2 28.1 33.9 38.4 44.8 49.3 52.7 55.4 57.5 59.3 60.8
1620 -25.3 -16.5 -3.3 6.3 21.9 31.5 38.1 42.9 49.4 53.8 56.9 59.3 61.1 62.6 63.8
1680 -27.9 -18.5 -4.4 5.7 22.3 32.4 39.3 44.3 51.3 55.9 59.2 61.7 63.7 65.3 66.6
1740 -44.7 -30.8 -11.2 2.0 21.5 32.2 39.0 43.7 49.8 53.6 56.2 58.0 59.4 60.5 61.4
1800 -66.1 -46.3 -19.8 -3.1 20.1 31.9 39.0 43.8 49.7 53.1 55.4 57.1 58.3 59.2 59.9
18 Hydrologic Considerations for Estimation of Storage-Capacity Requirements of Impounding and Side-Channel Reservoirs for Water Supply in Ohio

Table 10. Maximum net evaporation for Dayton, Ohio[Maximum net evaporation was computed from data obtained from the Midwestern Regional Climate Center for National Oceanic and Atmospheric Admin-istration climate stations 332075 and 332067 (table 5); calculations based on period 07/01/1948–07/31/1999]
Dura-tion,
in days
Maximum net evaporation (in inches) for indicated recurrence interval (in years)
5 6 8 10 15 20 25 30 40 50 60 70 80 90 100
30 5.7 5.7 5.7 5.8 6.1 6.4 6.7 6.8 7.0 7.0 7.0 7.0 7.0 7.1 7.1
60 8.8 8.9 9.2 9.5 10.0 10.4 10.8 11.0 11.5 11.9 12.2 12.4 12.6 12.8 13.0
90 11.4 11.6 11.9 12.2 12.8 13.4 13.9 14.3 15.2 16.0 16.7 17.4 18.0 18.7 19.3
120 13.4 13.6 13.9 14.3 15.5 16.6 17.3 17.7 18.1 18.3 18.4 18.4 18.5 18.5 18.5
150 15.2 15.2 15.6 16.3 17.8 18.3 18.4 18.4 18.5 18.5 18.5 18.5 18.5 18.5 18.5
180 16.2 16.5 17.1 17.5 18.3 19.0 19.5 19.9 20.5 21.1 21.5 21.9 22.2 22.5 22.7
210 16.0 16.5 17.4 18.1 19.1 19.8 20.3 20.6 21.1 21.5 21.7 21.9 22.1 22.2 22.3
240 15.9 16.4 17.0 17.5 18.3 18.9 19.3 19.5 20.0 20.3 20.5 20.7 20.9 21.0 21.1
270 14.4 15.1 16.2 17.0 18.1 18.8 19.3 19.6 20.0 20.3 20.5 20.6 20.7 20.8 20.9
300 13.4 14.0 15.1 16.0 17.5 18.5 19.1 19.6 20.2 20.6 20.9 21.1 21.2 21.3 21.4
330 11.9 12.3 13.4 14.5 16.8 18.2 18.9 19.3 19.7 19.9 20.0 20.0 20.0 20.1 20.1
360 11.1 12.1 13.5 14.6 16.6 18.0 19.0 19.9 21.2 22.2 23.0 23.6 24.2 24.6 25.1
420 12.7 13.4 15.1 16.7 20.1 22.5 23.9 24.9 26.0 26.6 26.9 27.1 27.3 27.4 27.4
480 14.1 15.3 18.1 20.7 25.3 27.8 29.2 30.0 30.8 31.1 31.3 31.4 31.5 31.5 31.5
540 16.2 18.2 21.3 23.5 26.9 28.9 30.1 30.9 31.9 32.5 32.9 33.2 33.4 33.5 33.7
600 14.9 17.2 20.6 23.1 26.7 28.7 29.9 30.6 31.5 32.1 32.4 32.6 32.8 32.9 33.0
660 11.9 15.0 19.1 21.6 25.1 26.9 28.0 28.8 29.8 30.3 30.7 31.0 31.2 31.4 31.5
720 7.7 11.6 16.6 19.5 23.2 25.0 26.0 26.6 27.4 27.8 28.0 28.2 28.3 28.4 28.5
780 6.9 11.8 18.0 21.6 26.2 28.4 29.6 30.4 31.4 31.9 32.3 32.5 32.7 32.8 32.9
840 4.6 11.1 19.2 24.0 30.0 32.8 34.4 35.4 36.6 37.3 37.7 37.9 38.1 38.3 38.4
900 5.6 12.4 20.8 25.7 32.1 35.0 36.6 37.7 38.9 39.6 40.0 40.3 40.5 40.6 40.7
960 6.7 13.2 21.1 25.6 31.2 33.7 35.1 35.9 36.9 37.4 37.8 38.0 38.1 38.3 38.3
1020 4.0 10.2 17.9 22.4 28.2 30.9 32.5 33.5 34.6 35.3 35.7 36.0 36.2 36.4 36.5
1080 -0.8 4.8 12.3 17.1 23.8 27.2 29.3 30.7 32.4 33.4 34.0 34.5 34.8 35.1 35.3
1140 -8.3 1.6 13.4 20.0 27.9 31.4 33.3 34.4 35.7 36.4 36.9 37.1 37.3 37.5 37.6
1200 -7.0 2.2 14.0 21.2 30.8 35.5 38.2 39.9 42.0 43.2 44.0 44.5 44.9 45.2 45.4
1260 -11.6 0.3 14.7 22.9 33.0 37.5 40.0 41.6 43.4 44.4 45.0 45.4 45.7 45.9 46.1
1320 -24.5 -4.6 15.4 24.6 33.6 36.7 38.1 38.8 39.5 39.9 40.0 40.1 40.2 40.3 40.3
1380 -25.5 -7.0 12.2 21.5 31.0 34.5 36.1 37.0 38.0 38.4 38.6 38.8 38.9 38.9 39.0
1440 -33.5 -9.7 12.0 20.9 28.6 30.8 31.8 32.2 32.6 32.8 32.9 32.9 32.9 32.9 33.0
1500 -39.9 -15.9 8.4 19.6 30.5 34.2 35.9 36.8 37.6 38.0 38.2 38.4 38.4 38.5 38.5
1560 -15.6 -8.8 4.1 14.6 30.7 38.1 41.8 43.9 45.8 46.7 47.2 47.4 47.6 47.7 47.8
1620 -20.6 -7.0 9.9 19.9 32.7 38.8 42.3 44.6 47.3 48.9 49.9 50.6 51.1 51.5 51.8
1680 -13.3 -6.2 6.0 15.5 30.6 38.6 43.3 46.1 49.4 51.0 52.0 52.6 53.1 53.4 53.6
1740 -23.6 -12.8 2.9 13.4 28.3 35.7 40.0 42.8 46.1 47.9 49.0 49.7 50.2 50.6 50.9
1800 -20.5 -13.6 -1.3 8.6 24.9 33.8 39.0 42.2 45.8 47.7 48.8 49.4 49.9 50.2 50.5
Data and Methods 19
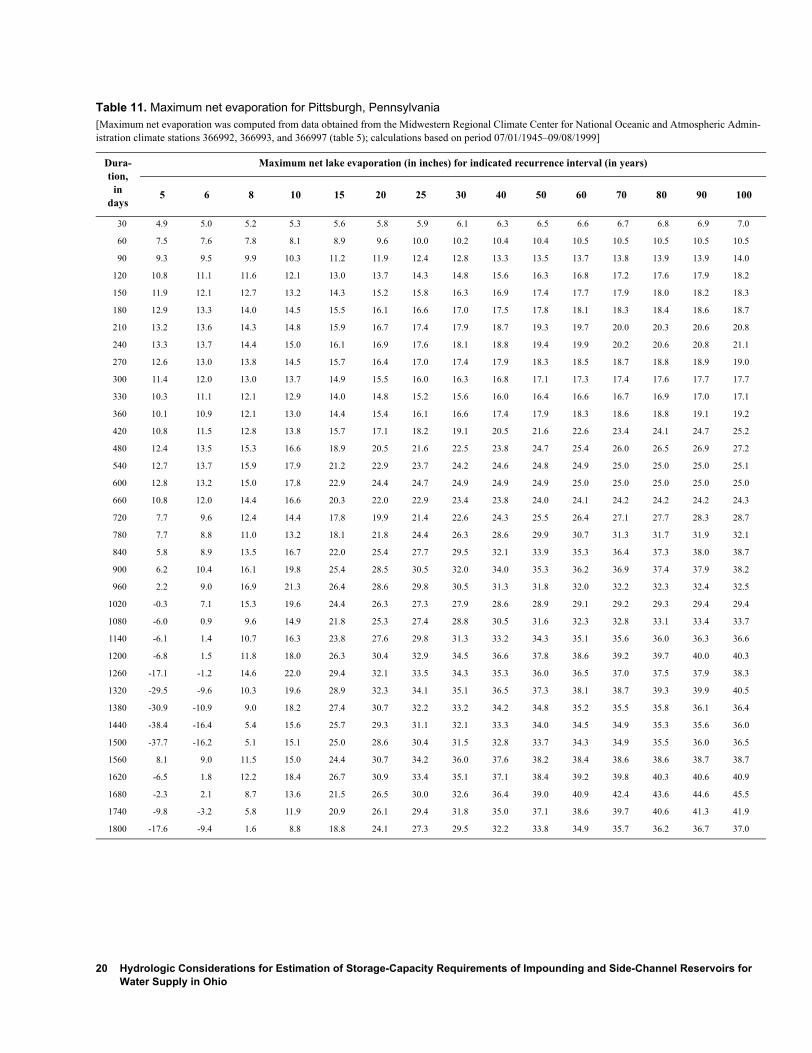
Table 11. Maximum net evaporation for Pittsburgh, Pennsylvania[Maximum net evaporation was computed from data obtained from the Midwestern Regional Climate Center for National Oceanic and Atmospheric Admin-istration climate stations 366992, 366993, and 366997 (table 5); calculations based on period 07/01/1945–09/08/1999]
Dura-tion,
in days
Maximum net lake evaporation (in inches) for indicated recurrence interval (in years)
5 6 8 10 15 20 25 30 40 50 60 70 80 90 100
30 4.9 5.0 5.2 5.3 5.6 5.8 5.9 6.1 6.3 6.5 6.6 6.7 6.8 6.9 7.0
60 7.5 7.6 7.8 8.1 8.9 9.6 10.0 10.2 10.4 10.4 10.5 10.5 10.5 10.5 10.5
90 9.3 9.5 9.9 10.3 11.2 11.9 12.4 12.8 13.3 13.5 13.7 13.8 13.9 13.9 14.0
120 10.8 11.1 11.6 12.1 13.0 13.7 14.3 14.8 15.6 16.3 16.8 17.2 17.6 17.9 18.2
150 11.9 12.1 12.7 13.2 14.3 15.2 15.8 16.3 16.9 17.4 17.7 17.9 18.0 18.2 18.3
180 12.9 13.3 14.0 14.5 15.5 16.1 16.6 17.0 17.5 17.8 18.1 18.3 18.4 18.6 18.7
210 13.2 13.6 14.3 14.8 15.9 16.7 17.4 17.9 18.7 19.3 19.7 20.0 20.3 20.6 20.8
240 13.3 13.7 14.4 15.0 16.1 16.9 17.6 18.1 18.8 19.4 19.9 20.2 20.6 20.8 21.1
270 12.6 13.0 13.8 14.5 15.7 16.4 17.0 17.4 17.9 18.3 18.5 18.7 18.8 18.9 19.0
300 11.4 12.0 13.0 13.7 14.9 15.5 16.0 16.3 16.8 17.1 17.3 17.4 17.6 17.7 17.7
330 10.3 11.1 12.1 12.9 14.0 14.8 15.2 15.6 16.0 16.4 16.6 16.7 16.9 17.0 17.1
360 10.1 10.9 12.1 13.0 14.4 15.4 16.1 16.6 17.4 17.9 18.3 18.6 18.8 19.1 19.2
420 10.8 11.5 12.8 13.8 15.7 17.1 18.2 19.1 20.5 21.6 22.6 23.4 24.1 24.7 25.2
480 12.4 13.5 15.3 16.6 18.9 20.5 21.6 22.5 23.8 24.7 25.4 26.0 26.5 26.9 27.2
540 12.7 13.7 15.9 17.9 21.2 22.9 23.7 24.2 24.6 24.8 24.9 25.0 25.0 25.0 25.1
600 12.8 13.2 15.0 17.8 22.9 24.4 24.7 24.9 24.9 24.9 25.0 25.0 25.0 25.0 25.0
660 10.8 12.0 14.4 16.6 20.3 22.0 22.9 23.4 23.8 24.0 24.1 24.2 24.2 24.2 24.3
720 7.7 9.6 12.4 14.4 17.8 19.9 21.4 22.6 24.3 25.5 26.4 27.1 27.7 28.3 28.7
780 7.7 8.8 11.0 13.2 18.1 21.8 24.4 26.3 28.6 29.9 30.7 31.3 31.7 31.9 32.1
840 5.8 8.9 13.5 16.7 22.0 25.4 27.7 29.5 32.1 33.9 35.3 36.4 37.3 38.0 38.7
900 6.2 10.4 16.1 19.8 25.4 28.5 30.5 32.0 34.0 35.3 36.2 36.9 37.4 37.9 38.2
960 2.2 9.0 16.9 21.3 26.4 28.6 29.8 30.5 31.3 31.8 32.0 32.2 32.3 32.4 32.5
1020 -0.3 7.1 15.3 19.6 24.4 26.3 27.3 27.9 28.6 28.9 29.1 29.2 29.3 29.4 29.4
1080 -6.0 0.9 9.6 14.9 21.8 25.3 27.4 28.8 30.5 31.6 32.3 32.8 33.1 33.4 33.7
1140 -6.1 1.4 10.7 16.3 23.8 27.6 29.8 31.3 33.2 34.3 35.1 35.6 36.0 36.3 36.6
1200 -6.8 1.5 11.8 18.0 26.3 30.4 32.9 34.5 36.6 37.8 38.6 39.2 39.7 40.0 40.3
1260 -17.1 -1.2 14.6 22.0 29.4 32.1 33.5 34.3 35.3 36.0 36.5 37.0 37.5 37.9 38.3
1320 -29.5 -9.6 10.3 19.6 28.9 32.3 34.1 35.1 36.5 37.3 38.1 38.7 39.3 39.9 40.5
1380 -30.9 -10.9 9.0 18.2 27.4 30.7 32.2 33.2 34.2 34.8 35.2 35.5 35.8 36.1 36.4
1440 -38.4 -16.4 5.4 15.6 25.7 29.3 31.1 32.1 33.3 34.0 34.5 34.9 35.3 35.6 36.0
1500 -37.7 -16.2 5.1 15.1 25.0 28.6 30.4 31.5 32.8 33.7 34.3 34.9 35.5 36.0 36.5
1560 8.1 9.0 11.5 15.0 24.4 30.7 34.2 36.0 37.6 38.2 38.4 38.6 38.6 38.7 38.7
1620 -6.5 1.8 12.2 18.4 26.7 30.9 33.4 35.1 37.1 38.4 39.2 39.8 40.3 40.6 40.9
1680 -2.3 2.1 8.7 13.6 21.5 26.5 30.0 32.6 36.4 39.0 40.9 42.4 43.6 44.6 45.5
1740 -9.8 -3.2 5.8 11.9 20.9 26.1 29.4 31.8 35.0 37.1 38.6 39.7 40.6 41.3 41.9
1800 -17.6 -9.4 1.6 8.8 18.8 24.1 27.3 29.5 32.2 33.8 34.9 35.7 36.2 36.7 37.0
20 Hydrologic Considerations for Estimation of Storage-Capacity Requirements of Impounding and Side-Channel Reservoirs for Water Supply in Ohio

Table 12. Maximum net evaporation for Toledo, Ohio[Maximum net evaporation was computed from data obtained from the Midwestern Regional Climate Center for National Oceanic and Atmospheric Admin-istration climate stations 338356 and 338357 (table 5); calculations based on period 01/01/1946–09/08/1999]
Dura-tion,
in days
Maximum net evaporation (in inches) for indicated recurrence interval (in years)
5 6 8 10 15 20 25 30 40 50 60 70 80 90 100
30 5.5 5.7 6.1 6.5 7.1 7.6 8.0 8.3 8.9 9.4 9.8 10.1 10.5 10.8 11.0
60 8.5 8.9 9.6 10.1 11.2 12.0 12.7 13.2 14.2 15.0 15.7 16.3 16.8 17.3 17.8
90 11.1 11.6 12.5 13.2 14.6 15.7 16.6 17.4 18.7 19.8 20.7 21.5 22.3 22.9 23.5
120 13.5 14.1 15.0 15.8 17.3 18.5 19.5 20.3 21.7 22.8 23.7 24.6 25.3 26.0 26.7
150 15.7 16.3 17.1 17.8 19.2 20.2 21.0 21.8 22.9 23.9 24.7 25.4 26.0 26.5 27.0
180 17.4 17.9 18.9 19.7 21.2 22.3 23.2 24.0 25.3 26.3 27.2 27.9 28.6 29.2 29.8
210 17.7 18.3 19.3 20.1 21.7 22.9 23.9 24.7 26.1 27.2 28.2 29.0 29.7 30.4 31.0
240 17.4 18.0 19.2 20.1 21.9 23.3 24.4 25.4 27.0 28.3 29.4 30.4 31.3 32.1 32.8
270 16.9 17.4 18.4 19.2 20.9 22.3 23.5 24.7 26.7 28.4 30.0 31.4 32.7 34.0 35.1
300 16.0 16.4 17.2 17.9 19.5 21.0 22.3 23.6 26.0 28.1 30.2 32.2 34.0 35.8 37.5
330 14.5 15.3 16.5 17.4 19.0 20.1 20.9 21.6 22.5 23.2 23.8 24.2 24.5 24.8 25.1
360 13.6 14.5 15.9 17.0 18.8 20.1 21.0 21.7 22.7 23.4 24.0 24.4 24.8 25.1 25.4
420 16.1 17.0 18.7 20.3 23.2 25.1 26.3 27.2 28.2 28.8 29.2 29.4 29.6 29.7 29.8
480 20.7 21.6 23.1 24.3 26.5 28.2 29.5 30.6 32.3 33.7 34.9 35.9 36.7 37.5 38.2
540 22.5 23.4 25.0 26.4 28.9 30.7 32.1 33.2 35.0 36.2 37.2 38.0 38.7 39.2 39.7
600 22.6 23.4 24.8 26.2 29.3 31.9 34.0 35.5 37.5 38.5 39.0 39.2 39.3 39.4 39.4
660 20.2 21.1 22.8 24.4 28.2 31.3 33.7 35.4 37.3 38.2 38.6 38.7 38.8 38.8 38.8
720 16.6 17.9 20.7 23.3 28.7 32.2 34.1 35.1 35.8 35.9 36.0 36.0 36.0 36.0 36.0
780 16.1 19.6 24.3 27.3 31.6 33.9 35.3 36.3 37.5 38.2 38.7 39.1 39.4 39.6 39.8
840 18.6 20.3 23.7 26.9 33.0 36.7 39.0 40.4 42.0 42.8 43.3 43.6 43.8 43.9 44.0
900 17.5 21.2 26.5 30.2 36.0 39.4 41.7 43.4 45.7 47.2 48.3 49.2 49.8 50.4 50.8
960 15.9 20.7 27.3 31.6 38.0 41.7 44.1 45.8 48.1 49.7 50.7 51.6 52.2 52.7 53.2
1020 13.3 18.4 25.4 30.0 36.9 40.7 43.3 45.1 47.6 49.2 50.3 51.2 51.9 52.4 52.9
1080 13.6 17.1 22.8 27.0 34.1 38.5 41.4 43.5 46.3 48.1 49.3 50.2 50.9 51.4 51.9
1140 13.4 18.2 25.2 30.0 37.1 40.9 43.2 44.8 46.8 48.0 48.7 49.3 49.7 50.0 50.2
1200 11.7 17.3 25.8 31.9 40.8 45.3 48.0 49.7 51.7 52.8 53.5 53.9 54.2 54.5 54.6
1260 16.8 20.8 28.0 33.9 43.5 48.8 51.9 53.8 56.0 57.1 57.8 58.2 58.5 58.7 58.9
1320 15.8 20.7 29.3 35.9 46.3 51.4 54.3 56.0 57.8 58.7 59.2 59.5 59.7 59.9 60.0
1380 12.4 17.6 27.1 34.4 45.2 50.2 52.7 54.1 55.5 56.1 56.4 56.6 56.7 56.8 56.9
1440 9.4 14.8 24.1 31.2 41.9 47.2 50.0 51.7 53.5 54.4 55.0 55.3 55.5 55.6 55.7
1500 10.8 15.3 23.1 29.5 40.4 46.9 51.0 53.7 57.0 58.8 59.9 60.7 61.2 61.6 61.9
1560 13.4 17.3 24.8 31.3 43.1 50.2 54.6 57.4 60.6 62.3 63.3 64.0 64.4 64.7 65.0
1620 18.4 20.1 25.3 32.1 47.6 56.1 59.9 61.8 63.2 63.7 63.9 64.0 64.1 64.1 64.1
1680 17.1 19.4 25.5 32.7 48.3 56.9 61.0 63.1 64.9 65.5 65.8 66.0 66.1 66.1 66.2
1740 10.5 15.5 24.9 32.9 46.8 54.7 59.3 62.2 65.5 67.1 68.1 68.7 69.1 69.4 69.6
1800 -0.5 7.2 20.3 30.2 45.3 52.9 57.0 59.5 62.2 63.6 64.4 64.8 65.2 65.4 65.6
Data and Methods 21

Figure 3. Maximum net evaporation as a function of duration and recurrence interval computed for the climatic station at the Dayton International Airport.
0 200 400 600 800 1,000 1,200 1,400 1,600 1,800 2,000-50
-40
-30
-20
-10
0
10
20
30
40
50
60
Recurrence Interval(years)
5 10 20 25 50
100
MA
XIM
UM
NE
T E
VA
PO
RA
TIO
N, I
N IN
CH
ES
DURATION, IN DAYS
Characteristics of Storage Requirements for Impounding ReservoirsStorage requirements computed for selected demands and recurrence intervals were examined to identify patterns that might facilitate estimation of storage requirements at sites where site-specific storage calculations have not been done. Cross (1963, 1965) related the ratio of required storage to mean annual flow volume to what was called the “7-day median index of average low flow in ratio to mean annual flow.” The 7-day median index of average low flow now is commonly called the 7-day, 2-year low flow, or 7Q2. In this study, the required storage (in inches) is related to the 7Q2 divided by the mean annual flow.
Cross (1963, 1965) developed separate relations for northeast Ohio and the remainder of the State. In this study, relations were developed for the entire State because no sep-aration appeared necessary. Families of curves correspond-
ing to selected demands were prepared for recurrence intervals of 5, 10, 20, and 50 years. Each family of curves was developed by plotting, for each site, the computed stor-age requirements (in inches) for each demand (in percent of the mean annual flow) against the ratio of the 7Q2 to the mean annual flow. A best-fit curve was then drawn through the data points by a two-step process. First, data were fitted by means of a logistic model of the form
, (4)
where S is the storage required (in inches); 7Q2 is the 7-day, 2-year low flow (in cubic feet per second); MAF is the mean annual flow (in cubic feet per second); and a, b, and c are coefficients. Then, the resulting curve was manually modi-
S a
1 b c7Q2MAF------------- –
exp+ ------------------------------------------------------------=
22 Hydrologic Considerations for Estimation of Storage-Capacity Requirements of Impounding and Side-Channel Reservoirs for Water Supply in Ohio

fied (if necessary) to ensure a logical progression of storage requirements with increasing demand and recurrence inter-val. A sample plot of the data points and the family of curves for the 10-year recurrence interval is shown in figure 4. Fig-ures 5-8 show the families of curves, without the individual data points, for recurrence intervals of 5, 10, 20, and 50 years.
Storage Analyses for Side-Channel ReservoirsIn the design of an impounding reservoir, the storage required is a function of the demand for water and the recur-rence interval associated with the design low-flow condi-tions. Unlike an impounding reservoir, which can theoretically capture all of the streamflow, side-channel res-ervoirs depend on one or more pumps to fill the reservoir. Consequently, the number, types, and capacities of the pumps in use are additional factors that must be considered in the reservoir design.
Streamflow Data for Side-Channel Reservoir Analyses
The same streamflow data that were used for the impounding reservoir analyses were also used for the side-channel reser-voir analyses. For a side-channel reservoir, however, ODNR currently recommends that the 80-percent-duration (d80) flow (or the entire flow of the stream if it is less than the 80-percent-duration flow) be maintained (Michael Schiefer, 2000, Ohio Department of Natural Resources, Division of Water, written commun.). That recommendation was adopted for this study, the impact of which was to occasion-ally limit or prohibit the computed withdrawal of water from the stream.
The d80 was determined for each stream location on the basis of streamflow data collected during the period of systematic record. For the side-channel reservoir storage cal-culations, the d80 was subtracted from each daily mean streamflow value. If the result of that subtraction was zero or negative, then inflow to the side-channel reservoir was set to zero for that day. If instead the subtraction resulted in a pos-itive flow value, then that amount of flow was considered available for withdrawal.
Treatment of Evaporation in Side-Channel Reservoirs
The same PET data used in the impounding reservoir analy-ses were used for the side-channel reservoir analyses. Rather than tabulating maximum net evaporation data (as was done for the impounding reservoir analyses), however, daily net evaporation was estimated for each individual gaging-station location, and those estimates were incorporated directly into the storage calculations.
Net evaporation data generally were computed by subtracting a representative daily precipitation value from a representative daily PET value. The selection of which pre-cipitation and PET data to use as representative of a particu-lar gaging station location was based on the physical proximity of the gaging station’s drainage area to the climate station(s) and on similarities in regional patterns of evapora-tion (Kohler and others, 1959) and mean annual precipitation (Harstine, 1991).
Precipitation data were available for several long-term National Oceanic and Atmospheric Administration (NOAA) climate stations (table 5), and some of the data included time periods that predated the computed PET val-ues. Net evaporation for periods that predated the computed PET values was estimated by subtracting the daily precipita-tion value from the long-term mean PET value computed from the available PET data for that calendar month. For example, the net evaporation for October 1, 1940, at the Day-ton climate station was determined by subtracting the precip-itation measured on that day from the mean PET determined for that station based on all October days for the period of PET data availability (1948-99).
Daily net evaporation data can be considered directly in storage calculations only if the surface area contributing direct runoff to the reservoir and the surface area of water in the reservoir are known. For a side-channel reservoir (and unlike an impounding reservoir), these two areas frequently can be considered to be approximately equal. During a reser-voir’s design phase, however, those calculations are compli-cated by the fact that neither the exact geometry of the reservoir nor the surface area of water in the reservoir are yet known.
Knapp (1982) presented an empirical equation that related storage volume to reservoir surface area for side-channel reservoirs in Illinois. That equation was tested against a sampling of surface area versus storage relations for existing side-channel reservoirs in Ohio and found to provide relatively poor estimates of surface area. Conse-quently, a new equation was developed on the basis of data from several existing side-channel reservoirs in Ohio, result-ing in generally improved estimates of reservoir surface area.
The equation developed to relate storage to surface area in side-channel reservoirs in Ohio is
, (5)
where At is the area of the water surface (in acres) at time t, Vfull is the volume of the full reservoir (in acre-feet), and Vt is the volume of the reservoir (in acre-feet) at time t. Equa-tion 5 was used in the computations to estimate the reservoir surface area under conditions of changing storage.
At 0.26Vfull0.58Vt
0.18=
Data and Methods 23

Figure 4. Storage required to meet demands as a function of the 7-day, 2-year low flow (7Q2) divided by the mean annual flow (MAF) for a 10-year recurrence interval, with data points plotted.
1 0.1 0.01 0.0010.005
0.01
0.1
1
10
50
DEM
AND
, AS
PER
CEN
TAG
E O
F M
EAN
AN
NU
AL F
LOW
(MAF
)
ST
OR
AG
E R
EQ
UIR
ED
, IN
INC
HE
S
7Q2/MAF
2
90
70
5045
35
25
15
10
5
24 Hydrologic Considerations for Estimation of Storage-Capacity Requirements of Impounding and Side-Channel Reservoirs for Water Supply in Ohio

Figure 5. Storage required to meet demands as a function of the 7-day, 2-year low flow (7Q2) divided by the mean annual flow (MAF) for a 5-year recurrence interval.
1 0.1 0.01 0.0010.005
0.01
0.1
1
10
50
DE
MA
ND
, AS
PE
RC
EN
TA
GE
OF
ME
AN
AN
NU
AL
FLO
W (
MA
F)
ST
OR
AG
E R
EQ
UIR
ED
, IN
INC
HE
S
7Q2/MAF
90
70
5045
35
25
15
10
5
2
Data and Methods 25

Figure 6. Storage required to meet demands as a function of the 7-day, 2-year low flow (7Q2) divided by the mean annual flow (MAF) for a 10-year recurrence interval.
1 0.1 0.01 0.0010.005
0.01
0.1
1
10
50
DE
MA
ND
, AS
PE
RC
EN
TA
GE
OF
ME
AN
AN
NU
AL
FLO
W (
MA
F)
ST
OR
AG
E R
EQ
UIR
ED
, IN
INC
HE
S
7Q2/MAF
2
90
70
5045
35
25
15
10
5
26 Hydrologic Considerations for Estimation of Storage-Capacity Requirements of Impounding and Side-Channel Reservoirs for Water Supply in Ohio

Figure 7. Storage required to meet demands as a function of the 7-day, 2-year low flow (7Q2) divided by the mean annual flow (MAF) for a 20-year recurrence interval.
1 0.1 0.01 0.0010.005
0.01
0.1
1
10
50
DE
MA
ND
, AS
PE
RC
EN
TA
GE
OF
ME
AN
AN
NU
AL
FLO
W (
MA
F)
S
TO
RA
GE
RE
QU
IRE
D, I
N IN
CH
ES
7Q2/MAF
90
70
5045
35
25
15
10
5
2
Data and Methods 27

Figure 8. Storage required to meet demands as a function of the 7-day, 2-year low flow (7Q2) divided by the mean annual flow (MAF) for a 50-year recurrence interval.
1 0.1 0.01 0.0010.005
0.01
0.1
1
10
50
DE
MA
ND
, AS
PE
RC
EN
TA
GE
OF
ME
AN
AN
NU
AL
FLO
W (
MA
F)
ST
OR
AG
E R
EQ
UIR
ED
, IN
INC
HE
S
7Q2/MAF
2
90
70
5045
35
25
15
10
5
28 Hydrologic Considerations for Estimation of Storage-Capacity Requirements of Impounding and Side-Channel Reservoirs for Water Supply in Ohio

An iterative procedure was used to determine the maximum storage required to meet demand plus evaporative losses. The first step in that procedure was to determine the storage required to meet the demand without consideration of evaporative losses. Next, evaporative losses were com-puted for a side-channel reservoir with a volume equal to the initial estimate. This first guess at the volume of evaporative losses was added to the initial estimate of storage to compute revised estimates of storage and surface area. The process of computing evaporative losses and revising the storage and surface area was repeated until the maximum storage volume was just large enough to meet demand plus evaporative losses.
Pumping Systems
The water budget for a side-channel reservoir can be repre-sented by the following equation:
, (6)
where is the change in storage, P is the volume of water pumped into the reservoir, D is withdrawal demand, E is the net evaporation, and L is loss due to other processes (such as seepage). The volume of water that can be pumped into the reservoir is primarily a function of the numbers and types of pumps in use; however, the maximum amount of water that can be pumped is occasionally constrained by instream-flow requirements and (or) the available storage capacity in the reservoir.
Twenty different pump sets were examined for this analysis in combination with demands equal to 0.002, 0.01, 0.02, 0.05, 0.10, 0.20, and 0.30 times the mean annual streamflow. The pump sets (table 13) represent a sampling of pump types, pump capacities, and numbers of pumps in use. Relations involving both variable-speed pumps with a vari-ety of pumping capacity ranges and assorted combinations of one to four fixed-speed pumps were tested.
The pump set that provided the largest and most flex-ible range of pump capacity (pump set 1 in table 13) was based on use of a single variable-speed pump with a pump-ing capacity that ranged from a low of 0.1 times demand to a high of 20 times demand. That pump set will be referred to as the primary pump relation. Other pump sets in table 13 may allow for pumping rates as low or as high as the primary pump relation; however, no other pump set simultaneously provides both the range and flexibility of pumping rates that the primary pump relation provides.
Each pump set results in a unique demand-storage-frequency relation. It is known in advance that, compared to the other pump sets, use of the primary pump relation results in the smallest required storage for a given demand and
design recurrence interval. Consequently, information on the storage required for the 20 pump sets can be presented as adjustment ratios to the primary pump relation (an example of which is shown in table 14), where the adjustment ratio will be greater than or equal to 1. For example, if for a given demand, use of pump set number 2 results in a maximum res-ervoir storage requirement that is 4 times that of the maxi-mum storage requirement computed for the primary pump relation, then the adjustment ratio for pump set number 2 for that demand would be 4. The storage requirements for any of the pump sets can be determined simply by multiplying its adjustment ratios by the storage requirements for the primary pump relation for the same demands.
Modified Mass-Curve Analysis for Side-Channel Reservoirs
The water-budget equation shown in equation 6 was used in modified form to compute the daily change in storage for all combinations of site, demand, and pump set. The modified form of the equation is
, (7)
where is the change in storage, P is the volume of water pumped into the reservoir, D is withdrawal demand, and E is the net evaporation. The only difference between equation 6 and equation 7 is that equation 7 does not include the term that accounts for water losses from other processes, such as seepage. A positive value of computed for a given day indicates that more water was pumped into the reservoir than was removed as a result of withdrawal and evaporation. Con-versely, a negative value of indicates that withdrawal and evaporation collectively exceeded the amount of water pumped into the reservoir on that day.
Computed daily changes in storage were accumulated over time. The reservoir capacity required to meet demand plus evaporative losses during any given climatic year5 is the maximum accumulated negative change in storage for any time period ending in that climatic year. The need for carry-over storage is indicated if the cumulative is negative at the end of the climatic year. Negative values of were per-mitted to carry over into the next climatic year; however, positive values were reset to zero on climatic-year boundaries.
S∆ P D E L+ +( )–=
S∆
5A climatic year extends from April 1 of one year to March 31 of the following year and is designated by the calendar year in which it begins.
S∆ P D E+( )–=
S∆
S∆
S∆
S∆S∆
S∆
Data and Methods 29

Table 13. Characteristics of pump sets used in the side-channel reservoir analyses[NA, not applicable]
Pumpset Pump type
Pump capacity or range of capacity (expressed as a multiple of demand) for indicated pump number
Minimumpumpage(multiple
of demand)
Maximumpumpage(multiple
ofdemand)
1 2 3 4
1 Variable speed 0.1 - 20 NA NA NA 0.1 20
2 Variable speed .1 - 2 NA NA NA .1 2
3 Variable speed .1 - 4 NA NA NA .1 4
4 Variable speed .1 - 8 NA NA NA .1 8
5 Variable speed .1 - 12 NA NA NA .1 12
6 Variable speed .1 - 16 NA NA NA .1 16
7 Fixed speed 1 1 NA NA 1 2
8 Fixed speed 1 3 NA NA 1 4
9 Fixed speed 2 2 NA NA 2 4
10 Fixed speed 3 3 NA NA 3 6
11 Fixed speed 4 4 NA NA 4 8
12 Fixed speed 1 1 1 NA 1 3
13 Fixed speed 2 2 2 NA 2 6
14 Fixed speed 3 3 3 NA 3 9
15 Fixed speed 4 4 4 NA 4 12
16 Fixed speed 5 5 5 NA 5 15
17 Fixed speed 2 2 2 2 2 8
18 Fixed speed 3 3 3 3 3 12
19 Fixed speed 4 4 4 4 4 16
20 Fixed speed 5 5 5 5 5 20
30 Hydrologic Considerations for Estimation of Storage-Capacity Requirements of Impounding and Side-Channel Reservoirs for Water Supply in Ohio

Data and Methods 31
Table 14. Example table showing pump adjustment ratios for a side-channel reservoir
Pumpset
Ratio of storage required for pump set to storage required for the primary pump relation (pump set 1) for indicated demand (in fraction of mean
annual streamflow)
0.002 0.010 0.020 0.050 0.100 0.200 0.300
1 1.00 1.00 1.00 1.00 1.00 1.00 1.00
2 1.38 1.32 1.33 2.28 4.00 11.24 15.00
3 1.12 1.10 1.05 1.00 1.08 1.67 2.61
4 1.17 1.01 1.00 1.00 1.00 1.00 1.27
5 1.01 1.01 1.00 1.00 1.00 1.00 1.10
6 1.00 1.00 1.00 1.00 1.00 1.00 1.00
7 1.40 1.55 1.65 3.71 10.22 18.79 25.77
8 1.13 1.18 1.16 1.17 1.65 3.36 10.51
9 1.12 1.19 1.19 1.41 1.90 6.21 14.11
10 1.10 1.22 1.22 1.27 1.51 3.00 9.45
11 1.04 1.24 1.20 1.30 1.27 2.30 6.87
12 1.20 1.21 1.14 1.46 2.36 8.16 14.52
13 1.07 1.16 1.18 1.22 1.33 2.08 5.34
14 1.16 1.18 1.23 1.27 1.21 1.69 3.23
15 1.08 1.22 1.20 1.30 1.27 1.53 3.05
16 1.03 1.24 1.26 1.33 1.32 1.63 2.92
17 1.17 1.13 1.16 1.22 1.14 1.60 2.82
18 1.06 1.17 1.23 1.27 1.21 1.51 2.01
19 1.07 1.19 1.20 1.31 1.29 1.37 2.13
20 1.00 1.24 1.26 1.34 1.31 1.47 1.97
Table 15. Example of a storage-demand-frequency table for a side-channel reservoir
Recurrenceinterval(years)
Normalvariate
Side-channel storage required (in demand days) for primary pump relation to meet indicated demand (in fraction of mean annual streamflow)
0.0020 0.0100 0.0200 0.0500 0.1000 0.2000 0.3000
53.00 2.078 204.22 171.85 184.52 207.10 235.82 250.89 272.18
50.00 2.054 202.30 171.27 184.04 206.67 235.15 250.71 271.56
40.00 1.960 194.79 168.99 182.18 204.98 232.54 250.02 269.13
30.00 1.834 184.70 165.92 179.68 202.71 229.02 249.09 265.88
25.00 1.751 179.69 162.80 178.46 201.21 226.79 248.38 263.53
20.00 1.645 177.74 155.93 178.06 199.31 224.18 247.26 260.05
10.00 1.282 169.41 149.07 155.11 188.32 215.76 240.17 250.33
5.00 0.841 148.32 125.02 137.04 156.33 171.16 188.68 198.46
2.04 0.024 95.90 69.70 77.29 95.04 119.65 139.38 145.51
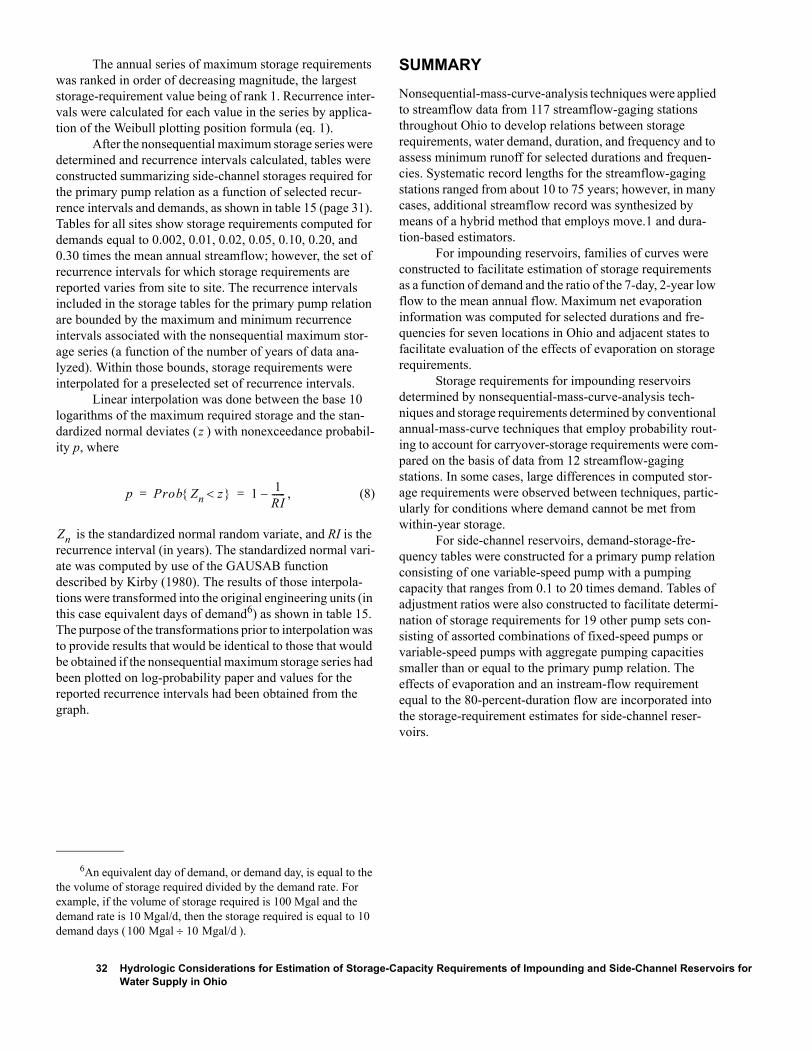
The annual series of maximum storage requirements was ranked in order of decreasing magnitude, the largest storage-requirement value being of rank 1. Recurrence inter-vals were calculated for each value in the series by applica-tion of the Weibull plotting position formula (eq. 1).
After the nonsequential maximum storage series were determined and recurrence intervals calculated, tables were constructed summarizing side-channel storages required for the primary pump relation as a function of selected recur-rence intervals and demands, as shown in table 15 (page 31). Tables for all sites show storage requirements computed for demands equal to 0.002, 0.01, 0.02, 0.05, 0.10, 0.20, and 0.30 times the mean annual streamflow; however, the set of recurrence intervals for which storage requirements are reported varies from site to site. The recurrence intervals included in the storage tables for the primary pump relation are bounded by the maximum and minimum recurrence intervals associated with the nonsequential maximum stor-age series (a function of the number of years of data ana-lyzed). Within those bounds, storage requirements were interpolated for a preselected set of recurrence intervals.
Linear interpolation was done between the base 10 logarithms of the maximum required storage and the stan-dardized normal deviates ( ) with nonexceedance probabil-ity p, where
, (8)
is the standardized normal random variate, and RI is the recurrence interval (in years). The standardized normal vari-ate was computed by use of the GAUSAB function described by Kirby (1980). The results of those interpola-tions were transformed into the original engineering units (in this case equivalent days of demand6) as shown in table 15. The purpose of the transformations prior to interpolation was to provide results that would be identical to those that would be obtained if the nonsequential maximum storage series had been plotted on log-probability paper and values for the reported recurrence intervals had been obtained from the graph.
SUMMARYNonsequential-mass-curve-analysis techniques were applied to streamflow data from 117 streamflow-gaging stations throughout Ohio to develop relations between storage requirements, water demand, duration, and frequency and to assess minimum runoff for selected durations and frequen-cies. Systematic record lengths for the streamflow-gaging stations ranged from about 10 to 75 years; however, in many cases, additional streamflow record was synthesized by means of a hybrid method that employs move.1 and dura-tion-based estimators.
For impounding reservoirs, families of curves were constructed to facilitate estimation of storage requirements as a function of demand and the ratio of the 7-day, 2-year low flow to the mean annual flow. Maximum net evaporation information was computed for selected durations and fre-quencies for seven locations in Ohio and adjacent states to facilitate evaluation of the effects of evaporation on storage requirements.
Storage requirements for impounding reservoirs determined by nonsequential-mass-curve-analysis tech-niques and storage requirements determined by conventional annual-mass-curve techniques that employ probability rout-ing to account for carryover-storage requirements were com-pared on the basis of data from 12 streamflow-gaging stations. In some cases, large differences in computed stor-age requirements were observed between techniques, partic-ularly for conditions where demand cannot be met from within-year storage.
For side-channel reservoirs, demand-storage-fre-quency tables were constructed for a primary pump relation consisting of one variable-speed pump with a pumping capacity that ranges from 0.1 to 20 times demand. Tables of adjustment ratios were also constructed to facilitate determi-nation of storage requirements for 19 other pump sets con-sisting of assorted combinations of fixed-speed pumps or variable-speed pumps with aggregate pumping capacities smaller than or equal to the primary pump relation. The effects of evaporation and an instream-flow requirement equal to the 80-percent-duration flow are incorporated into the storage-requirement estimates for side-channel reser-voirs.
6An equivalent day of demand, or demand day, is equal to the the volume of storage required divided by the demand rate. For example, if the volume of storage required is 100 Mgal and the demand rate is 10 Mgal/d, then the storage required is equal to 10 demand days ( ).
z
p Prob Zn z<{ } 1 1RI------–= =
Zn
100 Mgal 10 Mgal/d÷
32 Hydrologic Considerations for Estimation of Storage-Capacity Requirements of Impounding and Side-Channel Reservoirs for Water Supply in Ohio

APPLICATIONS
The hydrologic design of impounding reservoirs and side channel reservoirs can be complex. The following hypothetical prob-lems are presented to help illustrate some of the ways in which the tables and figures presented in this report can be used to address common design questions.
Sample Computations for Impounding Reservoirs
1. Given a reservoir site on Kale Creek near Pricetown, Ohio with a pool area of 300 acres, a storage capacity of 4,500 acre-ft, and a drainage area of 21.9 mi2, determine the net yield (without consideration of water losses other than due to evaporation) with a 5-percent annual probability of deficiency (20-year recurrence interval). (Note: If the res-ervoir is not at a site for which storage characteristics have been determined, then use the nearest site with computed storage characteristics that is expected to have similar hydrology and, ideally, similar contributing drainage area.)
a. Determine the reservoir storage capacity in inches.
b. Determine the allowable gross draft rate (gross yield) as a fraction of the mean annual flow.
The table of required storage as a function of draft rate and recurrence interval for Kale Creek near Pricetown (page 48) indicates that for a 20-year recurrence interval, a reservoir storage capacity of 3.85 in. will permit a gross draft rate of between 0.40 and 0.45 times the mean annual flow. One can determine the allowable gross draft rate (also called the gross yield) more precisely by linear interpolation in log space as a function of draft rate and reservoir storage capacity, as shown below:
c. Determine the gross yield in million gallons per day.
The descriptive information for Kale Creek near Pricetown indicates that the mean annual flow is 14.56 in.; conse-quently, the annual gross yield in inches can be determined as shown below:
The annual gross yield, in inches, can be converted to a daily flow rate, in million gallons per day, by multiplying it by 0.0476 (a units conversion factor) and by the drainage area as shown below:
Reservoir capacity 4,500 acre-ft
21.9 mi2------------------------------- 1 mi2
640 acre-------------------- 12 in.
1 ft-------------- 3.85 in.= =
draft( )log 0.45( )log 0.40( )log–4.11( )log 3.57( )log–
----------------------------------------------------- 3.85( )log 3.57( )log–( ) 0.40( )log+ 0.37052–= =
Draft antilog(-0.37052) 0.426 mean annual flow×= =
Gross yield draft 0.426 mean annual flow× 0.426 14.56× in. 6.20 in.= = = =
Gross yield 6.20 in.yr------- 0.0476 Mgal yr⋅
in. mi2 d⋅ ⋅--------------------------- 21.9 mi2×× 6.46 Mgal/d= =
Applications 33

d. Determine the duration of the critical drawdown period.
From the table of required storage as a function of draft rate and recurrence interval for Kale Creek near Pricetown, the critical-drawdown duration can been seen to be 270 days because the critical-drawdown durations for the bounding draft rates of 0.40 and 0.45 times the mean annual flow for a 20-year recurrence interval are both 270 days.
e. Determine the volume and rate of evaporation.
The nearest site with computed net evaporation data is in Cleveland. It will be assumed here that the recurrence interval for the maximum net evaporation is the same as that of the deficiency. Table 8 indicates that the maximum net evapo-ration is 17.8 in. for a recurrence interval of 20 years and a duration of 270 days. Hudson and Roberts (1955) analyzed area-capacity curves for impounding reservoirs in Illinois and determined that the mean surface area with respect to time, when draft from the reservoir was continuous and uniform, was 64.4 percent of the surface area with the water level at the spillway crest. No comparable analysis has been completed for Ohio; however, a value of 65 percent of the pool area will be used as the effective area for lake evaporation in this example. The reader is cautioned that this value may or may not be representative of conditions found in Ohio.
The volume and rate of evaporation can be estimated as shown below:
f. Determine the net yield (without consideration of water losses other than due to evaporation).
The net yield is equal to the gross yield minus evaporation, as shown below:
2. For a 2-percent annual probability of deficiency (50-year recurrence interval), estimate the amount of storage required to support a gross draft rate equal to 30 percent of the mean annual flow at a site located downstream of the streamflow-gaging station on Kale Creek near Pricetown, Ohio, with a drainage area of 29.1 mi2.
a. The table on page 48 for the streamflow-gaging station on Kale Creek near Pricetown, Ohio, indicates that for a 50-year recurrence interval, the reservoir storage capacity required to meet a draft rate equal to 0.30 times the mean annual flow is 2.75 in. The storage capacity (in inches) required at the site of interest will be assumed to be equal to that at the gaging station location because it is the same stream and the drainage area of the site of interest is reasonably similar. The stor-age capacity, in inches, can be converted to acre-feet by multiplying by the drainage area, in square miles, and units conversion factors as shown below:
Volume of evaporation = 300 acres 0.65 17.8 in.× ×12 in/ft
------------------------------------------------------------------ 289.25 acre-ft=
Rate of evaporation 289.25 acre-ft270 d
---------------------------------- 1.07 acre-ftd
----------------- 0.35 Mgal/d= = =
Net yield 6.46 0.35– 6.11 Mgal/d= =
Reservoir storage capacity 2.75 in. 1 ft12 in.-------------- 640 acre
1 mi2--------------------× 29.1 mi2×× 4 268 acre-ft,= =
34 Hydrologic Considerations for Estimation of Storage-Capacity Requirements of Impounding and Side-Channel Reservoirs for Water Supply in Ohio

3. For a hypothetical stream with a drainage area of 110 mi2 located in the vicinity of the Wheeling and Short Creek Basins, estimate the amount of storage required to support a gross draft rate equal to 40 percent of the mean annual flow with a 5-percent annual probability of deficiency (20-year recurrence interval).
a. Data are presented in the appendix for Wheeling Creek below Blaine, Ohio (station number 03111548) and for Short Creek near Dillonvale, Ohio (station number 03111500). One can examine the required storage for these two stream-flow-gaging stations to estimate the required storage for the hypothetical stream, assuming that the hypothetical stream is hydrologically similar to both Wheeling Creek and Short Creek, and given that the drainage area at the hypothetical stream site is reasonably similar to those of the two streamflow-gaging stations. The tables for Wheeling Creek and Short Creek, on pages 86 and 83, indicate that the reservoir storage capacities required to meet a draft rate of 40 percent of the mean annual flow are 1.88 in. and 1.68 in., respectively. Because the drainage area at the hypothetical stream site is roughly midway between the drainage areas of the gages on Wheeling and Short Creeks, and because there is no known reason to favor one estimate over the other, an average of the two storage capacities is used to estimate reservoir storage capacity, as shown below:
4. Estimate the minimum 720-day runoff that would not be exceeded on average once every 35 years (35-year recur-rence interval) for a site on Kale Creek near Pricetown, Ohio.
a. One can estimate the 720-day minimum runoff ( ) with a 35-year recurrence interval by determining the extreme-value variate ( ) corresponding to a 35-year recurrence interval using equation 2 as shown below:
b. Using the extreme-value variate determined above, interpolate linearly using the extreme-value variates and the loga-rithms of the minimum runoffs reported in the table on page 47 as shown below:
Reservoir storage capacity 1.88 in. 1.68 in.+2
------------------------------------------- 53.33 110 mi2×× 10,422 acre-ft= =
720ROmin35Ze
Ze 1 1RI------–
ln– ln– 1 1
35------–
ln– ln– 3.54= = =
720ROmin35( )log 12.21( )log 13.27( )log–3.68 3.38–
----------------------------------------------------------- 3.54 3.38–( ) 13.27( )log+ 1.1036= =
720ROmin35 antilog(1.1036) 12.69 in.= =
Applications 35

5. Estimate the minimum 1,260-day runoff with a 50-year recurrence interval ( ) for a site on Kale Creek near Pricetown, Ohio.
Figure 9. Relation between recurrence interval and minimum runoff for Kale Creek near Pricetown, Ohio.
a. The distance between minimum runoff ordinates for a given pair of durations can vary as a function of recurrence inter-val. Consequently, it is recommended that data from the runoff-duration-frequency table be plotted and that the type of interpolation to perform be selected after viewing the spacing characteristics of curves for adjacent duration. For exam-ple, the data for Kale Creek near Pricetown from the table on page 47 were plotted as shown above in figure 9. A dura-tion of 1,260 days lies exactly halfway between durations of 1,440 and 1,080 days. Based on the regularity in spacing between curves for duration pairs of 1,880 and 1,440 days and 1,440 and 1,080 days at a recurrence interval of 50 years, it appears that it would be appropriate to interpolate as a linear function of duration and as a logarithmic function of runoff, as shown below:
1260ROmin50
0.01
0.1
1
10
100
1005025105
MIN
IMU
M R
UN
OF
F, I
N IN
CH
ES
RECURRENCE INTERVAL, IN YEARS
Duration (days)
180 350 540 720 1,080 1,440 1,800
1260ROmin50( )log 31.55( )log 22.55( )log–1440 1080–
----------------------------------------------------------- 1260 1080–( ) 22.55( )log+ 1.4261= =
11260ROmin50 antilog(1.4261) 26.67 in.= =
36 Hydrologic Considerations for Estimation of Storage-Capacity Requirements of Impounding and Side-Channel Reservoirs for Water Supply in Ohio

Sample Computations for Side-Channel Reservoirs
1. A side-channel reservoir is planned for a site on an ungaged stream in the extreme northeast corner of Ohio. The drainage area is 100 mi2, and the estimated mean annual flow at the site is 98 ft3/s. The reservoir will be used as a water supply with an estimated withdrawal demand of 12.7 Mgal/d or about 20 percent of the mean annual flow. The side-channel storage is expected to meet the stated withdrawal demand for droughts with a 5-percent annual probability of deficiency (20-year recurrence interval). The pumping system planned for use with this reservoir will incorporate three fixed-speed pumps, each with pumping capacities of 2 times demand (pump set number 13).
Figure 10. Relation between drainage area and storage for selected streams in extreme northeast Ohio.
a. Because no gaging stations are on the stream of interest, one should review storage requirements for streams in the area to assess regional patterns in storage characteristics. One way to assess these trends is to prepare a plot of drainage area versus required storage capacity for the primary pump relation, demand, and recurrence interval of interest. Figure 10 (above) is such a plot; it shows drainage area versus storage capacity for a 20-year recurrence interval for five northeast Ohio streamflow-gaging stations (station numbers 04211000, 04212000, 04212100, 04212500, and 04213000). Data used to prepare these plots can be found in appendix tables on pages 405, 409, 412, 415, and 419. The required storage capacities corresponding to demands of 5, 10, and 20 percent of the mean annual flow have been plotted, and best-fit lines (in this case determined by means of simple linear regression) have been drawn on the plot. The storage capacity required for the stated conditions can be estimated by determining the ordinate value corresponding to the point at which the 100-mi2 drainage line intersects the regression line corresponding to a withdrawal demand of 20 percent of the mean
50 100 1,000160
170
180
190
200
210
220
230
ST
OR
GE
CA
PA
CIT
Y, I
N E
QU
IVA
LEN
T D
AY
S O
F D
EM
AN
D
DRAINAGE AREA, IN SQUARE MILES
Demand = 5% of mean annual flow Demand = 10% of mean annual flow Demand = 20% of mean annual flow
Applications 37

annual flow (as illustrated by the dark arrows on the plot). The estimated storage capacity is seen to be 210 equivalent days of demand. This value can be converted to acre-feet as shown below:
.
b. The pumping system planned for use with this reservoir is not as efficient at capturing available streamflow as is the primary pumping relation; consequently, a larger storage capacity will be required to meet demand. The required increase in storage capacity can be assessed by examining the pump adjustment ratios for the indicated pumping system and demand for nearby hydrologically similar gaging stations. The pump adjustment ratios for stations 04211000, 04212000, 04212100, 04212500, and 04213000 with pump set 13 and a demand of 20 percent of the mean annual flow are 1.57, 1.32, 1.22, 1.15, and 1.15 respectively (taken from tables shown on pages 403, 408, 412, 415, and 419). Because an exact location has not been specified for the planned side-channel reservoir in this example, the median pump adjustment ratio (1.22) will be used. An alternative approach that would lead to a more conservative (larger) esti-mate of required storage capacity would be to choose the maximum value (1.57). Using the median adjustment ratio, the required storage capacity would be
.
This estimate of required storage takes into account withdrawal demand, instream flow requirements, and net evapora-tion but does not take into account other water losses, such as seepage into the ground. Demand associated with the other water losses must be estimated, and additional storage must be provided to meet that demand. Because some of the other water losses may be a function of the storage capacity (seepage for example), an iterative procedure may be required to determine the total required storage.
210 days( ) 12.7 Mgal/d( ) 3.07 acre-ftMgal
----------------- 8 188 acre-ft,=
8 188 acre-ft,( ) 1.22( ) 10 721 acre-ft,=
38 Hydrologic Considerations for Estimation of Storage-Capacity Requirements of Impounding and Side-Channel Reservoirs for Water Supply in Ohio

REFERENCES CITEDChow, V.T., ed., 1964, Handbook of applied hydrology: New
York, McGraw-Hill, p. 9-49.Collier, M., Webb, R.H., and Schmidt, J.C., 1996, Dams and
rivers: A primer on the downstream effects of dams: U.S. Geological Survey Circular 1126, 94 p.
Cross, W.P., and Webber, E.E., 1950, Ohio stream-flow char-acteristics, Part 2, Water supply and storage require-ments: Ohio Department of Natural Resources, Division of Water, Bulletin 13, 13 p. plus unnumbered figures.
Cross, W.P., 1963, Low-flow frequencies and storage requirements: Ohio Department of Natural Resource, Division of Water, Bulletin 37, 66 p.
Cross, W.P., 1965, Low-flow frequency and storage-require-ment indices for Ohio streams: Ohio Department of Natural Resources, Division of Water, Bulletin 40, 47 p.
Farnsworth, R.K., and Thompson, E.S., 1982, Mean monthly, seasonal, and annual pan evaporation for the United States: National Oceanic and Atmospheric Administration Technical Report NWS 34, p. 3
Harstine, L.J., 1991, Hydrologic atlas for Ohio—average annual precipitation, temperature, streamflow, and water loss for 50-year period, 1931-1980: Ohio Depart-ment of Natural Resources, Division of Water, Water Inventory Report 28, 13 p., 4 pl.
Hirsch, R.M., 1982, A comparison of four streamflow record extension techniques: Water Resources Research, v. 18, no. 4, p. 1081-1088.
Hudson, H.E., Jr., and Roberts, W.J., 1955, 1952–1955 Illi-nois drought with special reference to impounding res-ervoir design: Illinois State Water Survey Bulletin 43, 52 p.
Kirby, William, 1980, Computer routines for probability dis-tributions, random numbers and related functions: U.S. Geological Survey Open-File Report 80–448, 61 p.
Knapp, Vernon, 1982, Hydrologic design of side-channel reservoirs in Illinois: Illinois State Water Survey Bulle-tin 67, 367 p.
Kohler, M.A., Nordenson, T.J., and Baker, D.R., 1959, Evap-oration maps for the United States: U.S. Department of Commerce, Weather Bureau, Technical Paper 37, 13 p., 5 pl.
Luczyk, Al [1997-2000], Ohio’s Water Withdrawal Facility Registration Program, 1996–99: Ohio Department of Natural Resources (fact sheets, published annually), 4 p.
Monteith, J.L., 1965, Evaporation and environment, in Pro-ceedings of the 19th Symposium of the Society for Experimental Biology: New York, Cambridge Univer-sity Press, p. 205–234.
Moore, L.G., 1984, Program A641(ANSTOR), in WAT-STORE user's guide: U.S. Geological Survey, sec. J of chap. 4 (Annual storage), p. 1–10.
Riggs, H.C., and Hardison, C.H., 1973, Storage analyses for water supply: U.S. Geological Survey Techniques of Water-Resources Investigations, book 4, chap. B2, 20 p.
Searcy, J.K., 1959, Flow-duration curves, in Manual of hydrology, Part 2, Low-flow techniques: U.S. Geologi-cal Survey Water-Supply Paper 1542–A, 33 p.
Terstriep, M.L., Demissie, M., Noel, D.C., and Knapp, V., 1982, Hydrologic design of impounding reservoirs in Illinois: Illinois State Water Survey Bulletin 67, 367 p.
U.S. Army Corps of Engineers, 1997, Engineering Design – Hydrologic Engineering Requirements for Reservoirs: Publication EM 1110-2-1420, p. 12-9
Weibull, W., 1939, A Statistical Theory of the Strength of Materials: Ing. Vetenskaps Akad. Handl., v. 151, pp. 1-45. (original not seen)
References Cited 39

APPENDIX
Hydrologic Design Tables
40 Hydrologic Considerations for Estimation of Storage-Capacity Requirements of Impounding and Side-Channel Reservoirs for Water Supply in Ohio

03089500 Mill Creek near Berlin Center, Ohio
Location: Latitude 41°00′01″, longitude 80°58′07″, Mahoning County, Hydrologic Unit 05030103
Drainage area, in square miles: 19.1
Station used for record extension: None
Time period of systematic or extended record analyzed: 1941-10-01 to 1971-10-04
Eighty-percent-duration streamflow, in cubic feet per second: 0.7
Mean annual streamflow, in inches: 11.85
Location of station used for precipitation data: Hiram, Ohio
Location of station used for potential evapotranspiration data: Cleveland, Ohio
[–, indicates a value that could not be determined because there were too few average low-flow values less than the mean streamflow for the indicated duration]
Recurrenceinterval(years)
Extreme-value
variate
Minimum runoff (in inches) for indicated duration (in days)
180 360 540 720 1080 1440 1800
31.00 3.42 0.22 4.29 7.09 10.97 20.71 29.52 35.75
30.00 3.38 0.22 4.29 7.10 10.97 20.77 29.80 36.66
25.00 3.20 0.22 4.32 7.14 11.00 21.09 31.33 41.75
20.00 2.97 0.23 4.35 7.20 11.03 21.48 33.23 48.00
10.00 2.25 0.26 5.20 7.70 13.49 26.53 39.37 58.66
5.17 1.54 0.29 5.65 10.08 16.96 31.54 49.48 –
Hydrologic Design Tables 41

03089500 Mill Creek near Berlin Center, Ohio—Continued
Recurrenceinterval(years)
Impounding reservoir storage required (in inches) and critical-drawdown duration (in days; shown in gray) for indicated draft rate (in fraction of the mean annual streamflow)
0.02 0.05 0.10 0.15 0.20 0.25 0.30 0.35 0.40 0.45 0.50 0.60 0.70 0.80 0.90 1.00
5 0.01 0.08 0.30 0.59 0.91 1.25 1.59 1.93 2.31 2.70 3.09 3.87 4.64 5.42 6.37 8.32 30 90 180 180 210 210 210 210 240 240 240 240 240 240 600 600
6 0.01 0.08 0.31 0.60 0.94 1.28 1.62 1.99 2.38 2.77 3.16 3.97 4.85 5.76 7.70 9.65 30 90 180 180 210 210 210 240 240 240 240 270 270 600 600 600
8 0.01 0.08 0.32 0.63 0.97 1.31 1.68 2.07 2.46 2.86 3.30 4.17 5.05 6.83 8.78 11.06 30 120 180 210 210 210 240 240 240 270 270 270 270 600 600 900
10 0.01 0.09 0.33 0.64 0.98 1.34 1.73 2.11 2.50 2.89 3.32 4.20 5.24 7.18 9.60 12.71 30 120 180 210 210 240 240 240 240 240 270 270 600 600 960 960
15 0.02 0.11 0.35 0.67 1.01 1.40 1.79 2.18 2.57 2.96 3.35 4.20 5.95 9.07 12.20 16.07 60 120 180 210 240 240 240 240 240 240 240 270 960 960 1020 1320
20 0.02 0.12 0.36 0.69 1.05 1.44 1.83 2.22 2.61 3.00 3.41 4.34 6.94 10.25 13.92 18.20 60 120 180 210 240 240 240 240 240 240 270 300 1020 1020 1320 1320
25 0.02 0.12 0.37 0.71 1.09 1.48 1.87 2.28 2.77 3.25 3.74 4.71 7.18 10.49 14.18 18.46 60 120 210 210 240 240 240 300 300 300 300 300 1020 1020 1320 1320
30 0.02 0.13 0.39 0.73 1.15 1.63 2.12 2.60 3.09 3.58 4.06 5.04 7.18 10.49 15.71 21.36 60 120 210 210 270 300 300 300 300 300 300 300 1020 1020 1740 1740
40 0.03 0.15 0.60 1.09 1.57 2.06 2.55 3.03 3.52 4.10 6.92 12.57 18.21 23.85 29.50 35.14 60 270 300 300 300 300 300 300 300 1740 1740 1740 1740 1740 1740 1740
50 0.05 0.32 0.81 1.30 1.78 2.39 5.21 8.03 10.85 13.67 16.49 22.14 27.78 33.42 39.07 44.71 270 300 300 300 300 1740 1740 1740 1740 1740 1740 1740 1740 1740 1740 1740
60 0.13 0.42 0.90 2.35 5.17 7.99 10.81 13.63 16.46 19.28 22.10 27.74 33.38 39.03 44.67 50.31 300 300 300 1740 1740 1740 1740 1740 1740 1740 1740 1740 1740 1740 1740 1740
70 0.17 0.46 2.54 5.36 8.18 11.01 13.83 16.65 19.47 22.29 25.11 30.76 36.40 42.04 47.69 53.33 300 300 1740 1740 1740 1740 1740 1740 1740 1740 1740 1740 1740 1740 1740 1740
80 0.18 1.27 4.09 6.91 9.74 12.56 15.38 18.20 21.02 23.84 26.66 32.31 37.95 43.59 49.24 54.98 300 1740 1740 1740 1740 1740 1740 1740 1740 1740 1740 1740 1740 1740 1740 1800
90 0.36 2.05 4.87 7.69 10.52 13.34 16.16 18.98 21.80 24.62 27.44 33.09 38.82 44.66 50.50 56.331740 1740 1740 1740 1740 1740 1740 1740 1740 1740 1740 1740 1800 1800 1800 1800
100 0.75 2.44 5.26 8.08 10.90 13.72 16.55 19.37 22.19 25.04 27.96 33.79 39.63 45.47 51.31 57.141740 1740 1740 1740 1740 1740 1740 1740 1740 1800 1800 1800 1800 1800 1800 1800
42 Hydrologic Considerations for Estimation of Storage-Capacity Requirements of Impounding and Side-Channel Reservoirs for Water Supply in Ohio

03089500 Mill Creek near Berlin Center, Ohio—Continued
Pumpset
Ratio of storage required for pump set to storage required for the primary pump relation (pump set 1) for indicated demand (in fraction of mean
annual streamflow)
0.002 0.010 0.020 0.050 0.100 0.200 0.300
1 1.00 1.00 1.00 1.00 1.00 1.00 1.00
2 1.14 1.13 1.17 1.62 2.95 4.97 9.20
3 1.07 1.04 1.05 1.00 1.13 1.45 2.02
4 1.01 1.01 1.00 1.00 1.00 1.00 1.07
5 1.00 1.00 1.00 1.00 1.00 1.00 1.00
6 1.00 1.00 1.00 1.00 1.00 1.00 1.00
7 1.14 1.20 1.47 2.90 5.34 12.85 16.77
8 1.07 1.11 1.24 1.17 1.71 3.02 4.80
9 1.08 1.17 1.34 1.40 1.98 4.12 8.13
10 1.03 1.24 1.29 1.31 1.62 2.56 5.00
11 1.06 1.20 1.31 1.38 1.51 2.10 4.45
12 1.09 1.09 1.26 1.43 2.21 4.19 8.36
13 1.04 1.12 1.26 1.17 1.47 1.76 3.82
14 1.00 1.15 1.26 1.28 1.42 1.43 3.10
15 1.06 1.17 1.31 1.37 1.49 1.32 2.57
16 1.08 1.21 1.34 1.42 1.61 1.34 2.36
17 1.02 1.12 1.17 1.17 1.34 1.44 2.40
18 1.00 1.13 1.26 1.26 1.41 1.32 1.69
19 1.06 1.18 1.33 1.34 1.51 1.33 1.43
20 1.08 1.21 1.34 1.44 1.59 1.35 1.38
Recurrenceinterval(years)
Normalvariate
Side-channel storage required (in demand days) for primary pump relation to meet indicated demand (in fraction of mean annual streamflow)
0.0020 0.0100 0.0200 0.0500 0.1000 0.2000 0.3000
31.00 1.849 104.99 148.95 155.29 191.76 212.04 255.81 279.22
30.00 1.834 103.57 148.02 155.02 191.38 211.66 254.52 277.62
25.00 1.751 95.52 142.77 153.52 189.21 209.52 247.23 268.55
20.00 1.645 85.28 136.08 151.60 186.45 206.79 237.95 257.02
10.00 1.282 72.56 112.14 135.95 160.02 201.05 225.21 234.61
5.00 0.841 55.76 98.09 111.32 144.16 173.01 206.26 220.40
2.07 0.040 33.00 66.25 72.10 85.42 112.33 141.59 154.63
Hydrologic Design Tables 43

03090500 Mahoning River below Berlin Dam near Berlin Center, Ohio
Location: Latitude 41°02′54″, longitude 81°00′05″, Mahoning County, Hydrologic Unit 05030103
Drainage area, in square miles: 248.
Station used for record extension: 03117500
Time period of systematic or extended record analyzed: 1930-10-01 to 1997-09-30
Percentage of estimated values in extended record: 82.1
Eighty-percent-duration streamflow, in cubic feet per second: 16.
Mean annual streamflow, in inches: 13.45
Location of station used for precipitation data: Pittsburgh, Pennsylvania
Location of station used for potential evapotranspiration data: Pittsburgh, Pennsylvania
[–, indicates a value that could not be determined because there were too few average low-flow values less than the mean stream-flow for the indicated duration]
Recurrenceinterval(years)
Extreme-value
variate
Minimum runoff (in inches) for indicated duration (in days)
180 360 540 720 1080 1440 1800
68.00 4.21 0.14 3.15 5.42 11.46 21.86 32.33 41.11
60.00 4.09 0.17 3.36 5.55 11.74 21.89 32.47 41.59
50.00 3.90 0.21 3.67 5.73 12.14 21.94 32.67 42.29
40.00 3.68 0.25 4.04 5.96 12.64 22.01 32.92 43.14
30.00 3.38 0.29 4.64 6.64 13.03 22.77 33.93 45.73
25.00 3.20 0.29 5.10 7.38 13.08 23.83 35.15 48.60
20.00 2.97 0.30 5.36 7.83 13.36 24.47 36.40 51.00
10.00 2.25 0.36 5.76 8.88 15.65 28.65 40.38 55.71
5.23 1.55 0.56 6.47 12.71 21.60 39.44 75.55 –
44 Hydrologic Considerations for Estimation of Storage-Capacity Requirements of Impounding and Side-Channel Reservoirs for Water Supply in Ohio
03090500 Mahoning River below Berlin Dam near Berlin Center, Ohio—Continued
Recurrenceinterval(years)
Impounding reservoir storage required (in inches) and critical-drawdown duration (in days; shown in gray) for indicated draft rate (in fraction of the mean annual streamflow)
0.02 0.05 0.10 0.15 0.20 0.25 0.30 0.35 0.40 0.45 0.50 0.60 0.70 0.80 0.90 1.00
5 0.00 0.04 0.23 0.49 0.77 1.07 1.40 1.74 2.13 2.53 2.98 3.99 5.10 6.20 7.31 8.41 0 60 120 150 150 180 180 210 210 240 240 300 300 300 300 300
6 0.00 0.05 0.26 0.53 0.86 1.19 1.57 1.95 2.34 2.73 3.13 4.01 5.10 6.20 7.31 9.44 0 90 120 150 180 180 210 210 210 210 240 240 300 300 300 600
8 0.00 0.06 0.30 0.62 0.96 1.35 1.74 2.12 2.51 2.90 3.34 4.23 5.20 7.20 9.41 11.62 0 120 150 180 210 210 210 210 210 240 240 240 270 600 600 600
10 0.00 0.08 0.33 0.66 1.02 1.41 1.80 2.18 2.60 3.04 3.49 4.43 5.91 8.12 10.33 13.66 30 120 180 180 210 210 210 210 240 240 240 270 600 600 600 1020
15 0.00 0.09 0.35 0.68 1.07 1.48 1.92 2.36 2.80 3.29 3.79 4.78 6.71 9.04 12.79 17.35 30 120 150 210 210 240 240 240 240 270 270 270 600 1020 1020 1740
20 0.00 0.10 0.37 0.70 1.14 1.58 2.02 2.48 2.98 3.48 3.98 4.97 7.05 9.99 13.86 19.18 30 120 150 240 240 240 240 270 270 270 270 270 660 1020 1380 1740
25 0.01 0.11 0.38 0.76 1.20 1.64 2.09 2.59 3.09 3.59 4.11 5.21 7.28 10.37 14.64 19.96 30 150 150 240 240 240 270 270 270 270 300 300 660 1020 1380 1740
30 0.01 0.12 0.40 0.79 1.24 1.68 2.16 2.66 3.18 3.73 4.28 5.39 7.44 10.58 15.03 20.47 30 150 150 240 240 240 270 270 300 300 300 300 660 960 1380 1740
40 0.01 0.14 0.42 0.83 1.28 1.72 2.27 2.82 3.37 3.93 4.48 5.58 7.68 10.81 15.58 21.54 30 150 150 240 240 270 300 300 300 300 300 300 660 960 1320 1740
50 0.01 0.16 0.46 0.85 1.29 1.80 2.35 2.91 3.46 4.01 4.56 5.88 8.03 10.98 16.55 22.96 60 150 210 240 240 300 300 300 300 300 300 540 600 1320 1740 1740
60 0.02 0.18 0.52 0.90 1.29 1.82 2.38 2.93 3.48 4.03 4.59 6.34 8.55 11.86 18.27 24.68 90 150 210 210 210 300 300 300 300 300 300 600 600 1740 1740 1740
70 0.02 0.20 0.57 0.96 1.34 1.82 2.38 2.93 3.48 4.03 4.71 6.88 9.09 13.79 20.20 26.61 90 180 210 210 210 300 300 300 300 300 540 600 600 1740 1740 1740
80 0.03 0.23 0.61 1.00 1.39 1.82 2.38 2.93 3.48 4.10 5.20 7.41 9.62 15.82 22.23 28.64 150 180 210 210 210 300 300 300 300 600 600 600 600 1740 1740 1740
90 0.05 0.26 0.65 1.03 1.42 1.82 2.38 2.93 3.51 4.61 5.72 7.92 11.48 17.89 24.29 30.70 180 210 210 210 210 300 300 300 600 600 600 600 1740 1740 1740 1740
100 0.07 0.29 0.67 1.06 1.45 1.83 2.38 2.93 3.99 5.09 6.20 8.41 13.52 19.93 26.34 32.75 180 210 210 210 210 210 300 300 600 600 600 600 1740 1740 1740 1740
Hydrologic Design Tables 45

03090500 Mahoning River below Berlin Dam near Berlin Center, Ohio—Continued
Pumpset
Ratio of storage required for pump set to storage required for the primary pump relation (pump set 1) for indicated demand (in fraction of mean
annual streamflow)
0.002 0.010 0.020 0.050 0.100 0.200 0.300
1 1.00 1.00 1.00 1.00 1.00 1.00 1.00
2 1.10 1.11 1.16 1.61 2.11 4.61 11.35
3 1.01 1.00 1.00 1.00 1.01 1.40 1.60
4 1.01 1.00 1.00 1.00 1.00 1.01 1.06
5 1.00 1.00 1.00 1.00 1.00 1.00 1.00
6 1.00 1.00 1.00 1.00 1.00 1.00 1.00
7 1.12 1.17 1.41 2.12 3.90 16.11 27.73
8 1.03 1.02 1.02 1.04 1.48 1.93 3.78
9 1.03 1.04 1.04 1.09 1.60 2.38 7.13
10 1.02 1.06 1.05 1.06 1.29 1.76 3.54
11 1.02 1.07 1.06 1.08 1.21 1.69 3.17
12 1.02 1.01 1.02 1.20 1.81 3.10 8.83
13 1.02 1.03 1.03 1.05 1.13 1.60 2.31
14 1.01 1.06 1.05 1.05 1.20 1.51 1.73
15 1.03 1.07 1.06 1.08 1.21 1.53 1.90
16 1.03 1.09 1.06 1.11 1.25 1.56 2.14
17 1.02 1.03 1.03 1.05 1.10 1.38 1.57
18 1.02 1.06 1.05 1.06 1.21 1.38 1.60
19 1.03 1.07 1.06 1.09 1.21 1.42 1.69
20 1.03 1.10 1.06 1.11 1.27 1.43 1.93
Recurrenceinterval(years)
Normalvariate
Side-channel storage required (in demand days) for primary pump relation to meet indicated demand (in fraction of mean annual streamflow)
0.0020 0.0100 0.0200 0.0500 0.1000 0.2000 0.3000
68.00 2.178 244.47 240.66 239.19 236.17 239.38 251.56 277.12
60.00 2.128 239.71 232.66 230.48 226.95 235.01 250.82 275.15
50.00 2.054 232.61 220.76 217.52 213.23 228.51 249.73 272.22
40.00 1.960 223.66 205.73 201.16 195.90 220.31 248.34 268.51
30.00 1.834 211.72 189.66 184.44 182.73 211.30 245.05 264.69
25.00 1.751 203.92 182.52 177.82 182.51 207.04 241.68 263.14
20.00 1.645 199.59 170.95 170.89 179.62 201.81 234.29 251.31
10.00 1.282 158.42 142.96 154.57 168.27 185.91 209.29 226.18
5.00 0.841 112.79 107.80 118.73 139.37 153.88 177.55 196.68
2.00 0.000 79.89 49.26 54.84 60.36 76.27 99.16 123.46
46 Hydrologic Considerations for Estimation of Storage-Capacity Requirements of Impounding and Side-Channel Reservoirs for Water Supply in Ohio

03092000 Kale Creek near Pricetown, Ohio
Location: Latitude 41°08′23″, longitude 80°59′43″, Trumbull County, Hydrologic Unit 05030103
Drainage area, in square miles: 21.9
Station used for record extension: None
Time period of systematic or extended record analyzed: 1941-05-01 to 1993-09-30
Eighty-percent-duration streamflow, in cubic feet per second: 0.6
Mean annual streamflow, in inches: 14.56
Location of station used for precipitation data: Hiram, Ohio
Location of station used for potential evapotranspiration data: Cleveland, Ohio
[–, indicates a value that could not be determined because there were too few average low-flow values less than the mean streamflow for the indicated duration]
Recurrenceinterval(years)
Extreme-value
variate
Minimum runoff (in inches) for indicated duration (in days)
180 360 540 720 1080 1440 1800
53.00 3.96 0.12 2.98 6.90 11.18 22.13 30.99 43.74
50.00 3.90 0.12 3.14 7.01 11.39 22.55 31.55 44.53
40.00 3.68 0.12 3.74 7.43 12.21 24.16 33.72 47.56
30.00 3.38 0.12 4.51 7.97 13.27 26.24 36.52 51.48
25.00 3.20 0.12 4.95 8.23 13.87 27.28 38.09 54.06
20.00 2.97 0.13 5.34 8.33 14.40 27.81 39.46 57.46
10.00 2.25 0.19 6.18 9.49 16.58 31.93 48.04 63.55
5.30 1.57 0.34 6.96 12.42 22.50 42.19 70.57 –
Hydrologic Design Tables 47

03092000 Kale Creek near Pricetown, Ohio—Continued
Recurrenceinterval(years)
Impounding reservoir storage required (in inches) and critical-drawdown duration (in days; shown in gray) for indicated draft rate (in fraction of the mean annual streamflow)
0.02 0.05 0.10 0.15 0.20 0.25 0.30 0.35 0.40 0.45 0.50 0.60 0.70 0.80 0.90 1.00
5 0.03 0.17 0.44 0.74 1.08 1.46 1.88 2.30 2.71 3.13 3.55 4.48 5.47 6.54 7.62 9.30 120 120 150 150 180 210 210 210 210 210 210 240 270 270 270 540
6 0.04 0.18 0.48 0.78 1.18 1.60 2.02 2.46 2.94 3.42 3.89 4.85 5.81 6.76 8.31 10.46 90 150 150 180 210 210 210 240 240 240 240 240 240 240 540 600
8 0.04 0.20 0.50 0.90 1.33 1.80 2.28 2.76 3.24 3.72 4.20 5.15 6.11 7.62 10.02 12.41 90 150 150 210 240 240 240 240 240 240 240 240 240 600 600 600
10 0.04 0.21 0.54 0.97 1.45 1.92 2.40 2.88 3.36 3.84 4.31 5.27 6.25 8.64 11.03 13.91 90 150 210 240 240 240 240 240 240 240 240 240 600 600 600 900
15 0.06 0.22 0.60 1.07 1.55 2.03 2.51 2.99 3.46 3.94 4.46 5.53 7.46 9.85 12.73 17.63 120 150 210 240 240 240 240 240 240 240 270 270 600 600 900 1680
20 0.06 0.23 0.63 1.11 1.59 2.06 2.54 3.04 3.57 4.11 4.65 5.73 8.04 10.43 14.81 20.38 120 180 240 240 240 240 240 270 270 270 270 270 600 600 1320 1680
25 0.07 0.24 0.65 1.12 1.60 2.08 2.60 3.13 3.67 4.21 4.75 6.02 8.44 11.15 16.41 21.68 120 180 240 240 240 240 270 270 270 270 270 600 660 1320 1320 1680
30 0.07 0.24 0.65 1.13 1.61 2.11 2.64 3.18 3.72 4.26 4.85 6.30 8.91 12.41 17.67 22.93 120 180 240 240 240 270 270 270 270 270 300 600 660 1320 1320 1320
40 0.07 0.25 0.67 1.15 1.62 2.12 2.66 3.25 3.85 4.45 5.04 6.91 9.54 14.48 19.74 25.10 120 150 240 240 240 270 270 300 300 300 300 660 660 1320 1320 1380
50 0.08 0.26 0.68 1.16 1.64 2.15 2.75 3.34 3.94 4.54 5.14 7.30 11.02 16.28 21.77 27.70 150 150 240 240 240 300 300 300 300 300 300 660 1320 1320 1380 1680
60 0.09 0.27 0.70 1.17 1.65 2.19 2.79 3.39 3.98 4.58 5.18 8.49 12.80 19.74 26.67 33.61 150 150 240 240 240 300 300 300 300 300 300 960 1380 1740 1740 1740
70 0.10 0.28 0.71 1.19 1.67 2.20 2.80 3.40 4.00 4.59 6.32 12.22 19.16 26.09 33.02 39.96 150 150 240 240 240 300 300 300 300 300 960 1740 1740 1740 1740 1740
80 0.11 0.29 0.73 1.20 1.68 2.20 2.80 3.40 4.04 7.51 10.97 17.91 24.84 31.78 38.71 45.64 150 150 240 240 240 300 300 300 1740 1740 1740 1740 1740 1740 1740 1740
90 0.11 0.29 0.74 1.22 1.70 2.20 2.80 5.41 8.88 12.35 15.82 22.75 29.68 36.62 43.55 50.49 150 150 240 240 240 300 300 1740 1740 1740 1740 1740 1740 1740 1740 1740
100 0.11 0.29 0.76 1.24 1.71 2.48 5.94 9.41 12.88 16.34 19.81 26.75 33.68 40.61 47.55 54.48 150 150 240 240 240 1740 1740 1740 1740 1740 1740 1740 1740 1740 1740 1740
48 Hydrologic Considerations for Estimation of Storage-Capacity Requirements of Impounding and Side-Channel Reservoirs for Water Supply in Ohio

03092000 Kale Creek near Pricetown, Ohio—Continued
Pumpset
Ratio of storage required for pump set to storage required for the primary pump relation (pump set 1) for indicated demand (in fraction of mean
annual streamflow)
0.002 0.010 0.020 0.050 0.100 0.200 0.300
1 1.00 1.00 1.00 1.00 1.00 1.00 1.00
2 1.38 1.32 1.33 2.28 4.00 11.24 15.00
3 1.12 1.10 1.05 1.00 1.08 1.67 2.61
4 1.17 1.01 1.00 1.00 1.00 1.00 1.27
5 1.01 1.01 1.00 1.00 1.00 1.00 1.10
6 1.00 1.00 1.00 1.00 1.00 1.00 1.00
7 1.40 1.55 1.65 3.71 10.22 18.79 25.77
8 1.13 1.18 1.16 1.17 1.65 3.36 10.51
9 1.12 1.19 1.19 1.41 1.90 6.21 14.11
10 1.10 1.22 1.22 1.27 1.51 3.00 9.45
11 1.04 1.24 1.20 1.30 1.27 2.30 6.87
12 1.20 1.21 1.14 1.46 2.36 8.16 14.52
13 1.07 1.16 1.18 1.22 1.33 2.08 5.34
14 1.16 1.18 1.23 1.27 1.21 1.69 3.23
15 1.08 1.22 1.20 1.30 1.27 1.53 3.05
16 1.03 1.24 1.26 1.33 1.32 1.63 2.92
17 1.17 1.13 1.16 1.22 1.14 1.60 2.82
18 1.06 1.17 1.23 1.27 1.21 1.51 2.01
19 1.07 1.19 1.20 1.31 1.29 1.37 2.13
20 1.00 1.24 1.26 1.34 1.31 1.47 1.97
Recurrenceinterval(years)
Normalvariate
Side-channel storage required (in demand days) for primary pump relation to meet indicated demand (in fraction of mean annual streamflow)
0.0020 0.0100 0.0200 0.0500 0.1000 0.2000 0.3000
53.00 2.078 204.22 171.85 184.52 207.10 235.82 250.89 272.18
50.00 2.054 202.30 171.27 184.04 206.67 235.15 250.71 271.56
40.00 1.960 194.79 168.99 182.18 204.98 232.54 250.02 269.13
30.00 1.834 184.70 165.92 179.68 202.71 229.02 249.09 265.88
25.00 1.751 179.69 162.80 178.46 201.21 226.79 248.38 263.53
20.00 1.645 177.74 155.93 178.06 199.31 224.18 247.26 260.05
10.00 1.282 169.41 149.07 155.11 188.32 215.76 240.17 250.33
5.00 0.841 148.32 125.02 137.04 156.33 171.16 188.68 198.46
2.04 0.024 95.90 69.70 77.29 95.04 119.65 139.38 145.51
Hydrologic Design Tables 49

03092090 West Branch Mahoning River near Ravenna, Ohio
Location: Latitude 41°09′41″, longitude 81°11′50″, Portage County, Hydrologic Unit 05030103
Drainage area, in square miles: 21.8
Station used for record extension: 03092000
Time period of systematic or extended record analyzed: 1941-05-01 to 1993-09-30
Percentage of estimated values in extended record: 46.6
Eighty-percent-duration streamflow, in cubic feet per second: 3.7
Mean annual streamflow, in inches: 16.13
Location of station used for precipitation data: Hiram, Ohio
Location of station used for potential evapotranspiration data: Cleveland, Ohio
[–, indicates a value that could not be determined because there were too few average low-flow values less than the mean stream-flow for the indicated duration]
Recurrenceinterval(years)
Extreme-value
variate
Minimum runoff (in inches) for indicated duration (in days)
180 360 540 720 1080 1440 1800
53.00 3.96 0.65 5.72 9.05 14.75 27.69 37.76 52.38
50.00 3.90 0.65 5.80 9.15 15.02 28.11 38.40 53.11
40.00 3.68 0.65 6.11 9.56 16.05 29.72 40.87 55.92
30.00 3.38 0.65 6.52 10.08 17.37 31.81 44.05 59.56
25.00 3.20 0.66 6.80 10.41 18.10 32.80 45.57 62.09
20.00 2.97 0.68 7.24 10.83 18.66 33.17 46.13 65.80
10.00 2.25 0.86 7.76 12.30 21.17 38.40 57.17 75.39
5.30 1.57 1.09 9.81 15.05 27.37 47.08 75.38 –
50 Hydrologic Considerations for Estimation of Storage-Capacity Requirements of Impounding and Side-Channel Reservoirs for Water Supply in Ohio

03092090 West Branch Mahoning River near Ravenna, Ohio—Continued
Recurrenceinterval(years)
Impounding reservoir storage required (in inches) and critical-drawdown duration (in days; shown in gray) for indicated draft rate (in fraction of the mean annual streamflow)
0.02 0.05 0.10 0.15 0.20 0.25 0.30 0.35 0.40 0.45 0.50 0.60 0.70 0.80 0.90 1.00
5 0.00 0.01 0.10 0.36 0.65 0.99 1.32 1.67 2.07 2.53 3.00 3.94 5.00 6.06 7.12 8.18 0 30 90 120 150 150 150 180 210 210 210 240 240 240 240 540
6 0.00 0.01 0.12 0.38 0.71 1.04 1.37 1.80 2.26 2.75 3.28 4.34 5.40 6.46 7.52 9.11 0 30 90 120 150 150 150 210 210 240 240 240 240 240 240 540
8 0.00 0.01 0.15 0.43 0.76 1.09 1.55 2.07 2.60 3.13 3.66 4.72 5.78 6.84 8.44 11.08 0 30 120 150 150 150 210 240 240 240 240 240 240 240 600 600
10 0.00 0.01 0.16 0.46 0.79 1.20 1.71 2.24 2.77 3.30 3.83 4.89 5.95 7.06 9.71 12.65 0 30 120 150 150 210 240 240 240 240 240 240 240 600 600 900
15 0.00 0.02 0.17 0.49 0.88 1.34 1.87 2.40 2.93 3.46 3.99 5.05 6.18 8.77 11.59 17.19 0 30 120 150 210 210 240 240 240 240 240 240 270 600 900 1320
20 0.00 0.02 0.18 0.51 0.94 1.40 1.92 2.45 2.98 3.51 4.04 5.16 7.02 9.67 14.01 19.83 0 30 120 180 210 210 240 240 240 240 240 270 600 600 1320 1320
25 0.00 0.02 0.18 0.54 0.97 1.43 1.95 2.48 3.01 3.54 4.07 5.25 7.58 10.23 15.70 21.52 0 30 120 180 210 210 240 240 240 240 240 270 600 600 1320 1320
30 0.00 0.02 0.19 0.56 0.98 1.45 1.97 2.50 3.03 3.56 4.10 5.34 7.99 11.12 16.95 22.77 0 30 120 180 210 210 240 240 240 240 270 600 600 1320 1320 1320
40 0.00 0.02 0.20 0.56 0.99 1.48 2.01 2.54 3.07 3.60 4.20 5.89 8.54 13.00 18.83 24.66 0 30 120 180 210 240 240 240 240 240 300 600 600 1320 1320 1320
50 0.00 0.03 0.21 0.56 0.99 1.52 2.05 2.58 3.11 3.68 4.34 6.27 8.98 14.50 20.33 27.34 0 30 120 180 240 240 240 240 240 300 300 600 960 1320 1320 1680
60 0.00 0.03 0.23 0.56 1.05 1.58 2.11 2.64 3.17 3.78 4.44 6.56 10.75 16.51 23.93 31.47 0 30 120 180 240 240 240 240 240 300 300 600 960 1680 1680 1740
70 0.00 0.03 0.24 0.57 1.10 1.63 2.16 2.69 3.22 3.84 4.50 8.21 13.19 20.75 28.43 36.11 0 30 120 240 240 240 240 240 240 300 300 960 1680 1740 1740 1740
80 0.00 0.03 0.25 0.63 1.16 1.69 2.22 2.75 3.28 3.88 5.55 9.93 17.62 25.30 32.98 40.66 0 30 120 240 240 240 240 240 240 300 960 1740 1740 1740 1740 1740
90 0.00 0.03 0.27 0.69 1.22 1.75 2.28 2.81 3.34 4.89 7.01 14.22 21.90 29.59 37.27 44.95 0 30 120 240 240 240 240 240 240 960 960 1740 1740 1740 1740 1740
100 0.00 0.04 0.28 0.74 1.27 1.80 2.33 2.86 4.11 6.63 10.48 18.16 25.84 33.52 41.20 48.88 0 30 120 240 240 240 240 240 960 1740 1740 1740 1740 1740 1740 1740
Hydrologic Design Tables 51

03092090 West Branch Mahoning River near Ravenna, Ohio—Continued
Pumpset
Ratio of storage required for pump set to storage required for the primary pump relation (pump set 1) for indicated demand (in fraction of mean
annual streamflow)
0.002 0.010 0.020 0.050 0.100 0.200 0.300
1 1.00 1.00 1.00 1.00 1.00 1.00 1.00
2 2.07 1.65 1.65 2.43 2.97 7.65 11.60
3 1.42 1.18 1.07 1.00 1.00 1.38 1.88
4 1.21 1.12 1.02 1.00 1.00 1.00 1.19
5 1.13 1.07 1.00 1.00 1.00 1.00 1.02
6 1.00 1.02 1.00 1.00 1.00 1.00 1.00
7 2.13 1.69 2.16 3.04 6.38 13.59 20.58
8 1.43 1.18 1.10 1.07 1.38 2.18 6.07
9 1.46 1.20 1.12 1.12 1.55 2.61 10.26
10 1.32 1.20 1.13 1.17 1.18 2.01 7.01
11 1.25 1.20 1.13 1.20 1.20 1.89 4.90
12 1.57 1.21 1.11 1.20 1.78 3.12 10.01
13 1.33 1.17 1.10 1.12 1.11 1.72 2.99
14 1.21 1.16 1.11 1.17 1.13 1.52 2.67
15 1.21 1.15 1.11 1.20 1.19 1.47 2.59
16 1.11 1.17 1.13 1.25 1.24 1.40 2.98
17 1.25 1.14 1.08 1.12 1.11 1.44 2.09
18 1.19 1.12 1.09 1.17 1.13 1.36 1.89
19 1.06 1.12 1.11 1.20 1.18 1.33 1.94
20 1.04 1.14 1.13 1.25 1.23 1.31 2.30
Recurrenceinterval(years)
Normalvariate
Side-channel storage required (in demand days) for primary pump relation to meet indicated demand (in fraction of mean annual streamflow)
0.0020 0.0100 0.0200 0.0500 0.1000 0.2000 0.3000
53.00 2.078 172.52 176.88 195.39 212.63 234.25 248.94 255.74
50.00 2.054 172.03 175.73 193.41 211.73 233.31 248.03 255.57
40.00 1.960 170.10 171.25 185.67 208.23 229.65 244.50 254.92
30.00 1.834 167.51 165.22 175.28 203.53 224.73 239.74 254.03
25.00 1.751 165.35 161.46 169.39 200.19 221.34 237.56 253.16
20.00 1.645 161.43 157.27 164.52 195.32 216.68 237.32 251.25
10.00 1.282 151.76 144.77 150.59 170.43 194.85 227.02 243.09
5.00 0.841 117.75 125.40 139.96 154.14 163.86 181.42 192.96
2.04 0.024 68.00 58.10 70.96 89.78 101.87 116.44 128.41
52 Hydrologic Considerations for Estimation of Storage-Capacity Requirements of Impounding and Side-Channel Reservoirs for Water Supply in Ohio

03092500 West Branch Mahoning River near Newton Falls, Ohio
Location: Latitude 41°10′18″, longitude 81°01′16″, Portage County, Hydrologic Unit 05030103
Drainage area, in square miles: 96.3
Station used for record extension: None
Time period of systematic or extended record analyzed: 1926-10-01 to 1981-10-02
Eighty-percent-duration streamflow, in cubic feet per second: 14.
Mean annual streamflow, in inches: 14.01
Location of station used for precipitation data: Hiram, Ohio
Location of station used for potential evapotranspiration data: Cleveland, Ohio
[–, indicates a value that could not be determined because there were too few average low-flow values less than the mean streamflow for the indicated duration]
Recurrenceinterval(years)
Extreme-value
variate
Minimum runoff (in inches) for indicated duration (in days)
180 360 540 720 1080 1440 1800
56.00 4.02 0.63 4.28 5.51 10.38 21.09 31.42 37.87
50.00 3.90 0.63 4.28 5.68 10.53 21.34 31.48 38.81
40.00 3.68 0.64 4.28 6.02 10.83 21.82 31.60 40.68
30.00 3.38 0.65 4.29 6.46 11.22 22.45 31.76 43.09
25.00 3.20 0.68 4.35 6.61 11.99 24.07 33.61 48.44
20.00 2.97 0.74 4.48 6.69 13.33 26.97 37.18 57.85
10.00 2.25 0.78 6.20 10.22 17.96 32.59 43.87 65.45
5.09 1.52 1.03 8.56 15.11 23.05 41.89 77.16 –
Hydrologic Design Tables 53

03092500 West Branch Mahoning River near Newton Falls, Ohio—Continued
Recurrenceinterval(years)
Impounding reservoir storage required (in inches) and critical-drawdown duration (in days; shown in gray) for indicated draft rate (in fraction of the mean annual streamflow)
0.02 0.05 0.10 0.15 0.20 0.25 0.30 0.35 0.40 0.45 0.50 0.60 0.70 0.80 0.90 1.00
5 0.00 0.00 0.04 0.19 0.44 0.73 1.02 1.42 1.83 2.23 2.63 3.48 4.40 5.36 6.51 7.66 0 0 60 90 150 150 180 210 210 210 210 240 240 300 300 300
6 0.00 0.00 0.05 0.22 0.47 0.77 1.13 1.53 1.93 2.38 2.84 3.76 4.68 5.64 6.73 8.33 0 0 60 120 150 180 210 210 210 240 240 240 240 270 300 600
8 0.00 0.00 0.06 0.26 0.53 0.88 1.28 1.74 2.20 2.66 3.12 4.04 5.02 6.06 8.22 10.52 0 0 60 120 180 180 240 240 240 240 240 240 270 270 600 600
10 0.00 0.00 0.07 0.28 0.58 0.95 1.41 1.87 2.33 2.79 3.25 4.19 5.22 7.39 9.69 12.87 0 0 90 120 180 240 240 240 240 240 240 270 270 600 600 1320
15 0.00 0.00 0.09 0.32 0.64 1.07 1.53 1.99 2.45 2.91 3.37 4.91 7.21 9.51 12.72 17.69 0 0 90 150 180 240 240 240 240 240 270 600 600 600 1020 1320
20 0.00 0.00 0.10 0.35 0.68 1.11 1.57 2.03 2.49 2.95 3.72 6.02 8.32 10.97 14.88 19.72 0 0 90 150 210 240 240 240 240 270 600 600 600 1020 1020 1320
25 0.00 0.00 0.11 0.37 0.71 1.13 1.59 2.05 2.51 3.22 4.37 6.67 8.97 12.17 16.08 20.87 0 0 90 150 210 240 240 240 240 600 600 600 600 1020 1020 1320
30 0.00 0.00 0.12 0.38 0.73 1.14 1.60 2.06 2.56 3.62 4.77 7.07 9.37 12.87 16.78 23.37 0 30 90 150 210 240 240 240 270 600 600 600 600 1020 1020 1740
40 0.00 0.00 0.12 0.40 0.77 1.17 1.63 2.14 2.89 4.04 5.19 7.49 9.79 14.32 21.00 27.67 0 30 90 150 210 240 240 270 600 600 600 600 600 1740 1740 1740
50 0.00 0.00 0.12 0.41 0.79 1.21 1.72 2.24 3.02 4.17 5.32 7.63 10.64 17.32 23.99 30.66 0 30 120 150 210 240 270 270 600 600 600 600 1740 1740 1740 1740
60 0.00 0.00 0.13 0.42 0.80 1.30 1.82 2.34 3.02 4.17 5.32 7.63 12.85 19.52 26.20 32.87 0 30 120 180 210 270 270 270 600 600 600 600 1740 1740 1740 1740
70 0.00 0.00 0.13 0.44 0.87 1.39 1.91 2.43 3.02 4.17 5.32 7.87 14.54 21.22 27.89 34.56 0 30 120 180 270 270 270 270 600 600 600 1740 1740 1740 1740 1740
80 0.00 0.00 0.14 0.46 0.96 1.48 2.00 2.52 3.03 4.17 5.32 9.21 15.88 22.56 29.23 35.90 0 30 120 180 270 270 270 270 270 600 600 1740 1740 1740 1740 1740
90 0.00 0.00 0.14 0.53 1.04 1.56 2.08 2.60 3.12 4.17 5.42 10.29 16.97 23.64 30.31 36.99 0 30 120 270 270 270 270 270 270 600 900 1740 1740 1740 1740 1740
100 0.00 0.00 0.16 0.60 1.12 1.64 2.16 2.67 3.19 4.38 6.10 11.19 17.86 24.53 31.21 37.88 0 30 180 270 270 270 270 270 270 900 900 1740 1740 1740 1740 1740
54 Hydrologic Considerations for Estimation of Storage-Capacity Requirements of Impounding and Side-Channel Reservoirs for Water Supply in Ohio
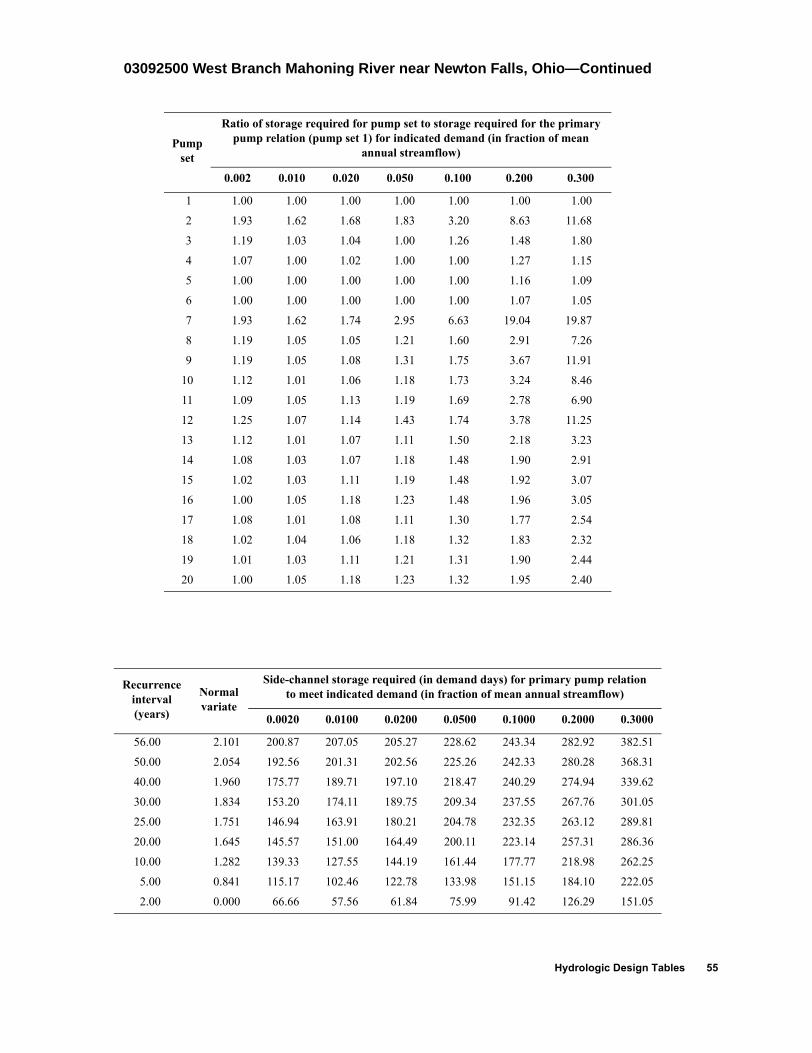
03092500 West Branch Mahoning River near Newton Falls, Ohio—Continued
Pumpset
Ratio of storage required for pump set to storage required for the primary pump relation (pump set 1) for indicated demand (in fraction of mean
annual streamflow)
0.002 0.010 0.020 0.050 0.100 0.200 0.300
1 1.00 1.00 1.00 1.00 1.00 1.00 1.00
2 1.93 1.62 1.68 1.83 3.20 8.63 11.68
3 1.19 1.03 1.04 1.00 1.26 1.48 1.80
4 1.07 1.00 1.02 1.00 1.00 1.27 1.15
5 1.00 1.00 1.00 1.00 1.00 1.16 1.09
6 1.00 1.00 1.00 1.00 1.00 1.07 1.05
7 1.93 1.62 1.74 2.95 6.63 19.04 19.87
8 1.19 1.05 1.05 1.21 1.60 2.91 7.26
9 1.19 1.05 1.08 1.31 1.75 3.67 11.91
10 1.12 1.01 1.06 1.18 1.73 3.24 8.46
11 1.09 1.05 1.13 1.19 1.69 2.78 6.90
12 1.25 1.07 1.14 1.43 1.74 3.78 11.25
13 1.12 1.01 1.07 1.11 1.50 2.18 3.23
14 1.08 1.03 1.07 1.18 1.48 1.90 2.91
15 1.02 1.03 1.11 1.19 1.48 1.92 3.07
16 1.00 1.05 1.18 1.23 1.48 1.96 3.05
17 1.08 1.01 1.08 1.11 1.30 1.77 2.54
18 1.02 1.04 1.06 1.18 1.32 1.83 2.32
19 1.01 1.03 1.11 1.21 1.31 1.90 2.44
20 1.00 1.05 1.18 1.23 1.32 1.95 2.40
Recurrenceinterval(years)
Normalvariate
Side-channel storage required (in demand days) for primary pump relation to meet indicated demand (in fraction of mean annual streamflow)
0.0020 0.0100 0.0200 0.0500 0.1000 0.2000 0.3000
56.00 2.101 200.87 207.05 205.27 228.62 243.34 282.92 382.51
50.00 2.054 192.56 201.31 202.56 225.26 242.33 280.28 368.31
40.00 1.960 175.77 189.71 197.10 218.47 240.29 274.94 339.62
30.00 1.834 153.20 174.11 189.75 209.34 237.55 267.76 301.05
25.00 1.751 146.94 163.91 180.21 204.78 232.35 263.12 289.81
20.00 1.645 145.57 151.00 164.49 200.11 223.14 257.31 286.36
10.00 1.282 139.33 127.55 144.19 161.44 177.77 218.98 262.25
5.00 0.841 115.17 102.46 122.78 133.98 151.15 184.10 222.05
2.00 0.000 66.66 57.56 61.84 75.99 91.42 126.29 151.05
Hydrologic Design Tables 55

03093000 Eagle Creek at Phalanx Station, Ohio
Location: Latitude 41°15′40″, longitude 80°57′16″, Trumbull County, Hydrologic Unit 05030103
Drainage area, in square miles: 97.6
Station used for record extension: 03090500
Time period of systematic or extended record analyzed: 1926-06-01 to 1997-09-30
Percentage of estimated values in extended record: 4.2
Eighty-percent-duration streamflow, in cubic feet per second: 19.
Mean annual streamflow, in inches: 16.11
Location of station used for precipitation data: Hiram, Ohio
Location of station used for potential evapotranspiration data: Cleveland, Ohio
[–, indicates a value that could not be determined because there were too few average low-flow values less than the mean stream-flow for the indicated duration]
Recurrenceinterval(years)
Extreme-value
variate
Minimum runoff (in inches) for indicated duration (in days)
180 360 540 720 1080 1440 1800
72.00 4.27 0.78 4.49 5.82 13.28 22.78 32.60 39.92
70.00 4.24 0.78 4.51 5.89 13.31 23.01 33.00 40.55
60.00 4.09 0.79 4.61 6.26 13.44 24.30 35.19 43.98
50.00 3.90 0.80 4.73 6.69 13.61 25.82 37.79 48.05
40.00 3.68 0.81 4.87 7.23 13.81 27.69 40.97 53.04
30.00 3.38 0.83 5.07 7.74 14.56 29.17 42.64 58.59
25.00 3.20 0.84 5.21 7.99 15.21 29.77 42.80 61.79
20.00 2.97 0.88 6.20 9.54 15.66 32.70 45.47 63.98
10.00 2.25 1.12 7.90 13.19 22.27 37.93 56.07 76.24
5.14 1.53 1.43 10.13 15.98 28.47 49.46 – –
56 Hydrologic Considerations for Estimation of Storage-Capacity Requirements of Impounding and Side-Channel Reservoirs for Water Supply in Ohio

03093000 Eagle Creek at Phalanx Station, Ohio—Continued
Recurrenceinterval(years)
Impounding reservoir storage required (in inches) and critical-drawdown duration (in days; shown in gray) for indicated draft rate (in fraction of the mean annual streamflow)
0.02 0.05 0.10 0.15 0.20 0.25 0.30 0.35 0.40 0.45 0.50 0.60 0.70 0.80 0.90 1.00
5 0.00 0.00 0.02 0.13 0.37 0.70 1.03 1.39 1.86 2.32 2.78 3.74 4.80 5.86 6.92 8.10 0 0 30 90 120 150 150 210 210 210 210 240 240 240 240 270
6 0.00 0.00 0.03 0.17 0.42 0.74 1.09 1.54 2.00 2.47 2.93 3.95 5.02 6.22 7.41 8.65 0 0 30 90 120 150 180 210 210 210 210 240 270 270 270 600
8 0.00 0.00 0.04 0.22 0.48 0.82 1.26 1.72 2.19 2.65 3.17 4.32 5.51 6.70 8.00 10.46 0 0 30 120 150 180 210 210 210 210 240 270 270 270 300 900
10 0.00 0.00 0.05 0.26 0.54 0.91 1.37 1.83 2.30 2.82 3.35 4.55 5.74 7.02 9.36 13.09 0 0 60 120 150 210 210 210 210 240 270 270 270 300 600 900
15 0.00 0.00 0.07 0.31 0.63 1.06 1.52 2.01 2.53 3.06 3.59 4.78 6.79 9.43 12.43 16.57 0 0 90 120 180 210 210 240 240 240 240 270 600 600 900 960
20 0.00 0.00 0.09 0.34 0.69 1.14 1.61 2.14 2.67 3.20 3.72 5.77 8.42 11.07 14.22 19.65 0 0 90 150 180 210 240 240 240 240 240 600 600 600 960 1380
25 0.00 0.00 0.10 0.37 0.73 1.19 1.69 2.22 2.75 3.28 4.16 6.81 9.46 12.10 15.81 21.90 0 0 90 150 180 210 240 240 240 240 600 600 600 600 1380 1380
30 0.00 0.00 0.10 0.39 0.76 1.22 1.74 2.27 2.80 3.54 4.86 7.51 10.15 12.80 17.44 23.53 0 0 90 150 180 210 240 240 240 600 600 600 600 660 1380 1380
40 0.00 0.00 0.11 0.42 0.80 1.28 1.81 2.34 3.02 4.35 5.67 8.32 10.96 13.75 19.78 27.19 0 0 90 150 210 240 240 240 600 600 600 600 600 660 1680 1680
50 0.00 0.00 0.11 0.43 0.83 1.31 1.84 2.37 3.41 4.74 6.06 8.71 11.35 16.24 23.65 31.22 0 0 90 150 210 240 240 240 600 600 600 600 600 1680 1680 1740
60 0.00 0.00 0.11 0.44 0.84 1.33 1.86 2.45 3.57 4.89 6.22 8.86 12.44 19.91 27.59 35.27 0 0 150 150 210 240 240 270 600 600 600 600 1680 1740 1740 1740
70 0.00 0.00 0.12 0.45 0.85 1.39 1.99 2.58 3.64 4.91 6.23 8.88 16.04 23.72 31.39 39.07 0 0 150 150 210 270 270 270 540 600 600 600 1740 1740 1740 1740
80 0.00 0.00 0.12 0.45 0.92 1.52 2.11 2.71 3.75 4.94 6.23 11.88 19.56 27.23 34.91 42.58 0 0 150 150 270 270 270 270 540 540 600 1740 1740 1740 1740 1740
90 0.00 0.00 0.12 0.45 1.04 1.64 2.23 2.83 3.80 4.99 7.42 15.10 22.77 30.45 38.12 45.80 0 0 150 150 270 270 270 270 540 540 1740 1740 1740 1740 1740 1740
100 0.00 0.00 0.12 0.56 1.15 1.75 2.34 2.94 3.84 6.51 10.34 18.02 25.70 33.37 41.05 48.72 0 0 150 270 270 270 270 270 480 1740 1740 1740 1740 1740 1740 1740
Hydrologic Design Tables 57

03093000 Eagle Creek at Phalanx Station, Ohio—Continued
Pumpset
Ratio of storage required for pump set to storage required for the primary pump relation (pump set 1) for indicated demand (in fraction of mean
annual streamflow)
0.002 0.010 0.020 0.050 0.100 0.200 0.300
1 1.00 1.00 1.00 1.00 1.00 1.00 1.00
2 1.92 1.77 1.81 2.04 2.81 6.32 10.66
3 1.21 1.01 1.01 1.01 1.25 1.52 1.99
4 1.06 1.02 1.00 1.00 1.00 1.21 1.13
5 1.03 1.00 1.00 1.00 1.00 1.13 1.08
6 1.01 1.00 1.00 1.00 1.00 1.06 1.04
7 1.92 1.90 1.97 2.75 4.89 17.13 19.88
8 1.21 1.05 1.05 1.24 1.58 3.05 6.97
9 1.21 1.05 1.09 1.51 1.73 3.44 11.90
10 1.13 1.04 1.12 1.20 1.66 3.26 8.28
11 1.06 1.02 1.14 1.25 1.55 3.06 6.38
12 1.34 1.23 1.30 1.52 2.09 3.29 11.00
13 1.12 1.03 1.08 1.14 1.47 2.51 2.95
14 1.04 1.01 1.13 1.16 1.51 2.30 2.84
15 1.02 1.04 1.13 1.27 1.39 2.12 2.77
16 1.03 1.04 1.18 1.25 1.66 2.20 2.84
17 1.06 1.01 1.08 1.14 1.34 1.77 2.61
18 1.03 1.02 1.15 1.18 1.38 1.84 2.50
19 1.03 1.02 1.14 1.26 1.24 1.83 2.48
20 1.02 1.06 1.17 1.25 1.55 1.95 2.59
58 Hydrologic Considerations for Estimation of Storage-Capacity Requirements of Impounding and Side-Channel Reservoirs for Water Supply in Ohio

03093000 Eagle Creek at Phalanx Station, Ohio—Continued
Recurrenceinterval(years)
Normalvariate
Side-channel storage required (in demand days) for primary pump relation to meet indicated demand (in fraction of mean annual streamflow)
0.0020 0.0100 0.0200 0.0500 0.1000 0.2000 0.3000
72.00 2.201 210.36 204.99 205.61 222.58 243.49 299.75 383.50
70.00 2.190 209.74 204.49 205.49 222.54 242.90 298.46 381.30
60.00 2.128 206.32 201.76 204.84 222.34 239.62 291.34 369.17
50.00 2.054 202.18 198.45 204.06 222.09 235.65 282.71 354.48
40.00 1.960 196.96 194.27 203.06 221.78 230.64 271.82 335.92
30.00 1.834 178.62 187.12 196.95 215.87 226.60 264.32 309.14
25.00 1.751 162.29 181.82 191.13 209.91 224.94 262.02 290.76
20.00 1.645 157.71 168.29 175.46 201.89 224.54 257.30 276.40
10.00 1.282 148.52 132.36 135.20 162.27 187.28 221.12 245.12
5.00 0.841 125.45 110.18 121.29 127.42 148.06 172.13 197.97
2.00 0.000 89.39 59.30 60.04 70.55 86.24 104.78 118.07
Hydrologic Design Tables 59

03096000 Mosquito Creek at Niles, Ohio
Location: Latitude 41°11′02″, longitude 80°45′39″, Trumbull County, Hydrologic Unit 05030103
Drainage area, in square miles: 138.
Station used for record extension: None
Time period of systematic or extended record analyzed: 1929-07-01 to 1951-09-30
Eighty-percent-duration streamflow, in cubic feet per second: 3.1
Mean annual streamflow, in inches: 11.76
Location of station used for precipitation data: Hiram, Ohio
Location of station used for potential evapotranspiration data: Cleveland, Ohio
[–, indicates a value that could not be determined because there were too few average low-flow values less than the mean stream-flow for the indicated duration]
Recurrenceinterval(years)
Extreme-value
variate
Minimum runoff (in inches) for indicated duration (in days)
180 360 540 720 1080 1440 1800
23.00 3.11 0.07 2.66 3.22 9.49 18.40 26.15 32.65
20.00 2.97 0.07 2.67 3.83 9.56 18.98 27.71 35.82
10.00 2.25 0.09 2.96 6.30 10.81 23.22 35.27 51.73
5.75 1.65 0.17 3.90 7.18 18.32 36.78 46.73 68.48
60 Hydrologic Considerations for Estimation of Storage-Capacity Requirements of Impounding and Side-Channel Reservoirs for Water Supply in Ohio

03096000 Mosquito Creek at Niles, Ohio—Continued
Recurrenceinterval(years)
Impounding reservoir storage required (in inches) and critical-drawdown duration (in days; shown in gray) for indicated draft rate (in fraction of the mean annual streamflow)
0.02 0.05 0.10 0.15 0.20 0.25 0.30 0.35 0.40 0.45 0.50 0.60 0.70 0.80 0.90 1.00
5 0.04 0.15 0.40 0.67 1.00 1.34 1.73 2.12 2.50 2.89 3.28 4.05 4.82 5.86 7.40 10.05 60 150 150 210 210 240 240 240 240 240 240 240 240 330 540 1020
6 0.05 0.15 0.43 0.77 1.11 1.45 1.78 2.14 2.52 2.91 3.30 4.15 5.43 7.36 9.29 11.46 90 150 210 210 210 210 210 240 240 240 240 270 600 600 600 1020
8 0.05 0.18 0.48 0.82 1.16 1.49 1.92 2.35 2.79 3.22 3.66 4.83 6.77 8.73 11.82 14.91 90 180 210 210 210 210 270 270 270 270 270 600 600 960 960 960
10 0.06 0.21 0.49 0.82 1.16 1.58 2.01 2.44 2.88 3.31 3.75 5.00 6.93 9.45 12.54 15.63 120 150 180 210 210 270 270 270 270 270 270 600 600 960 960 960
15 0.08 0.23 0.51 0.84 1.22 1.61 2.03 2.47 2.90 3.34 3.77 5.23 7.65 10.94 14.22 17.50 150 150 180 240 240 240 270 270 270 270 270 600 1020 1020 1020 1020
20 0.08 0.23 0.53 0.87 1.24 1.62 2.04 2.47 2.91 3.63 4.50 6.36 8.41 11.71 17.11 22.52 150 150 210 210 240 240 270 270 270 540 540 600 1020 1680 1680 1680
25 0.08 0.25 0.58 0.92 1.26 1.71 2.58 3.45 4.32 5.19 6.05 7.88 12.83 18.24 23.64 29.05 150 210 210 210 210 540 540 540 540 540 540 600 1680 1680 1680 1680
30 0.08 0.29 0.63 1.11 1.98 2.85 3.72 4.59 6.97 9.48 11.99 17.01 22.03 27.05 32.07 37.09 210 210 210 540 540 540 540 540 1560 1560 1560 1560 1560 1560 1560 1560
40 0.12 0.47 1.63 4.14 6.65 9.16 11.67 14.18 16.69 19.20 21.71 26.73 31.75 36.77 41.79 46.81 210 540 1560 1560 1560 1560 1560 1560 1560 1560 1560 1560 1560 1560 1560 1560
50 0.25 1.80 4.31 6.82 9.33 11.84 14.35 16.86 19.37 21.88 24.39 29.41 34.44 39.46 44.48 49.50 540 1560 1560 1560 1560 1560 1560 1560 1560 1560 1560 1560 1560 1560 1560 1560
60 0.41 2.38 4.89 7.40 9.91 12.42 14.93 17.44 19.95 22.46 24.97 29.99 35.22 40.82 46.42 52.021380 1560 1560 1560 1560 1560 1560 1560 1560 1560 1560 1560 1740 1740 1740 1740
70 0.76 2.49 5.00 7.51 10.02 12.53 15.04 17.55 20.13 22.93 25.73 31.33 36.93 42.53 48.13 53.731380 1560 1560 1560 1560 1560 1560 1560 1740 1740 1740 1740 1740 1740 1740 1740
80 0.87 2.51 5.02 7.53 10.04 12.70 15.50 18.30 21.10 23.90 26.70 32.30 37.90 43.50 49.10 54.701500 1560 1560 1560 1560 1740 1740 1740 1740 1740 1740 1740 1740 1740 1740 1740
90 0.93 2.51 5.02 7.65 10.45 13.25 16.05 18.85 21.65 24.45 27.25 32.85 38.45 44.05 49.65 55.251500 1560 1560 1740 1740 1740 1740 1740 1740 1740 1740 1740 1740 1740 1740 1740
100 0.95 2.51 5.16 7.96 10.76 13.56 16.36 19.16 21.96 24.76 27.56 33.16 38.76 44.36 49.98 55.771500 1560 1740 1740 1740 1740 1740 1740 1740 1740 1740 1740 1740 1740 1800 1800
Hydrologic Design Tables 61

03096000 Mosquito Creek at Niles, Ohio—Continued
Pumpset
Ratio of storage required for pump set to storage required for the primary pump relation (pump set 1) for indicated demand (in fraction of mean
annual streamflow)
0.002 0.010 0.020 0.050 0.100 0.200 0.300
1 1.00 1.00 1.00 1.00 1.00 1.00 1.00
2 1.70 1.16 1.27 1.32 2.04 3.86 5.06
3 1.01 1.00 1.02 1.00 1.00 1.22 1.27
4 1.00 1.00 1.00 1.00 1.00 1.00 1.10
5 1.00 1.00 1.00 1.00 1.00 1.00 1.04
6 1.00 1.00 1.00 1.00 1.00 1.00 1.01
7 1.71 1.29 1.50 2.15 3.46 7.38 8.54
8 1.56 1.01 1.14 1.12 1.20 1.64 2.33
9 1.55 1.02 1.21 1.13 1.39 1.77 3.07
10 1.56 1.04 1.28 1.18 1.15 1.76 2.21
11 1.58 1.07 1.29 1.18 1.20 1.86 2.01
12 1.56 1.03 1.13 1.10 1.42 2.32 3.54
13 1.01 1.02 1.21 1.14 1.10 1.61 1.66
14 1.56 1.04 1.28 1.18 1.14 1.63 1.79
15 1.58 1.06 1.29 1.18 1.21 1.71 1.99
16 1.59 1.16 1.38 1.19 1.21 1.89 2.14
17 1.01 1.02 1.21 1.14 1.10 1.50 1.59
18 1.56 1.04 1.28 1.18 1.14 1.51 1.77
19 1.58 1.06 1.29 1.18 1.21 1.63 1.96
20 1.59 1.16 1.38 1.19 1.21 1.84 2.14
Recurrenceinterval(years)
Normalvariate
Side-channel storage required (in demand days) for primary pump relation to meet indicated demand (in fraction of mean annual streamflow)
0.0020 0.0100 0.0200 0.0500 0.1000 0.2000 0.3000
23.00 1.712 143.00 186.27 182.70 215.32 226.42 236.36 283.23
20.00 1.645 142.37 185.35 181.21 210.18 222.59 234.39 277.26
10.00 1.282 128.82 165.00 159.76 183.12 201.48 223.43 251.73
5.00 0.841 85.07 119.90 123.69 139.00 163.34 190.02 225.45
2.09 0.054 42.00 66.91 63.91 91.21 100.16 132.52 149.58
62 Hydrologic Considerations for Estimation of Storage-Capacity Requirements of Impounding and Side-Channel Reservoirs for Water Supply in Ohio

03102950 Pymatuning Creek at Kinsman, Ohio
Location: Latitude 41°26′34″, longitude 80°35′18″, Trumbull County, Hydrologic Unit 05030102
Drainage area, in square miles: 96.7
Station used for record extension: 04212000
Time period of systematic or extended record analyzed: 1922-10-01 to 1994-09-30
Percentage of estimated values in extended record: 59.7
Eighty-percent-duration streamflow, in cubic feet per second: 12.
Mean annual streamflow, in inches: 17.27
Location of station used for precipitation data: Hiram, Ohio
Location of station used for potential evapotranspiration data: Cleveland, Ohio
[–, indicates a value that could not be determined because there were too few average low-flow values less than the mean streamflow for the indicated duration]
Recurrenceinterval(years)
Extreme-value
variate
Minimum runoff (in inches) for indicated duration (in days)
180 360 540 720 1080 1440 1800
73.00 4.28 0.38 6.28 10.09 16.51 30.27 43.58 57.17
70.00 4.24 0.38 6.31 10.11 16.64 30.69 44.04 57.87
60.00 4.09 0.39 6.42 10.18 17.11 32.25 45.72 60.45
50.00 3.90 0.40 6.54 10.27 17.67 34.10 47.71 63.50
40.00 3.68 0.41 6.70 10.38 18.35 36.36 50.16 67.25
30.00 3.38 0.46 7.06 11.81 20.78 37.52 51.82 69.36
25.00 3.20 0.50 7.34 13.10 22.79 37.74 52.44 69.89
20.00 2.97 0.56 7.46 13.66 24.12 38.51 54.02 72.23
10.00 2.25 0.67 9.74 14.83 25.87 41.97 61.37 83.20
5.21 1.55 1.00 10.94 17.99 29.21 49.91 77.36 –
Hydrologic Design Tables 63

03102950 Pymatuning Creek at Kinsman, Ohio—Continued
Recurrenceinterval(years)
Impounding reservoir storage required (in inches) and critical-drawdown duration (in days; shown in gray) for indicated draft rate (in fraction of the mean annual streamflow)
0.02 0.05 0.10 0.15 0.20 0.25 0.30 0.35 0.40 0.45 0.50 0.60 0.70 0.80 0.90 1.00
5 0.02 0.06 0.25 0.54 0.82 1.19 1.62 2.04 2.47 2.90 3.32 4.17 5.02 5.88 7.06 8.34 30 60 120 120 120 180 180 180 180 180 180 180 180 180 270 270
6 0.02 0.08 0.30 0.59 0.87 1.26 1.69 2.11 2.54 2.96 3.39 4.24 5.13 6.12 7.12 8.38 30 60 120 120 120 180 180 180 180 180 180 180 210 210 240 270
8 0.02 0.11 0.35 0.64 0.98 1.36 1.79 2.21 2.64 3.06 3.53 4.53 5.52 6.63 7.77 9.34 30 90 120 120 150 180 180 180 180 180 210 210 210 240 240 600
10 0.02 0.13 0.38 0.69 1.05 1.43 1.85 2.28 2.72 3.22 3.71 4.71 5.85 6.98 8.12 10.50 30 90 120 150 150 180 180 180 210 210 210 240 240 240 240 960
15 0.03 0.15 0.42 0.77 1.13 1.53 1.96 2.41 2.90 3.43 4.00 5.14 6.27 7.41 9.19 12.80 60 90 150 150 150 180 180 210 210 240 240 240 240 240 600 900
20 0.03 0.16 0.45 0.81 1.17 1.59 2.02 2.49 3.06 3.63 4.19 5.33 6.46 7.74 10.32 14.58 60 90 150 150 180 180 180 240 240 240 240 240 240 300 900 900
25 0.04 0.17 0.47 0.82 1.21 1.64 2.06 2.60 3.17 3.73 4.30 5.46 6.74 8.31 11.59 16.28 90 90 150 150 180 180 180 240 240 240 240 270 270 600 900 1380
30 0.04 0.17 0.48 0.84 1.24 1.66 2.10 2.67 3.23 3.80 4.40 5.67 6.95 8.99 12.58 17.79 90 90 150 150 180 180 240 240 240 240 270 270 270 600 900 1380
40 0.05 0.18 0.50 0.85 1.28 1.70 2.17 2.74 3.37 4.01 4.64 5.92 7.20 10.04 14.25 20.69 90 90 150 180 180 180 240 240 270 270 270 270 270 600 1260 1680
50 0.05 0.18 0.50 0.88 1.30 1.73 2.22 2.85 3.49 4.13 4.77 6.05 8.00 11.01 16.62 23.92 90 90 150 180 180 180 270 270 270 270 270 270 600 900 1320 1680
60 0.06 0.18 0.51 0.89 1.32 1.74 2.27 2.91 3.55 4.19 4.83 6.10 8.65 12.49 19.03 26.97 90 90 150 180 180 180 270 270 270 270 270 270 600 1320 1680 1680
70 0.06 0.19 0.51 0.90 1.33 1.75 2.29 2.93 3.57 4.21 4.84 6.36 9.30 14.39 21.90 29.85 90 120 150 180 180 180 270 270 270 270 270 600 960 1320 1680 1680
80 0.06 0.19 0.51 0.91 1.34 1.76 2.29 2.93 3.57 4.21 4.84 6.83 10.99 16.65 24.60 32.54 90 120 150 180 180 180 270 270 270 270 270 600 960 1680 1680 1680
90 0.06 0.20 0.51 0.92 1.34 1.77 2.29 2.93 3.57 4.21 4.84 8.02 12.73 19.18 27.13 35.07 90 120 150 180 180 180 270 270 270 270 270 960 1020 1680 1680 1680
100 0.06 0.21 0.51 0.92 1.34 1.77 2.29 2.93 3.57 4.21 4.94 9.58 14.41 21.55 29.50 37.44 90 120 150 180 180 180 270 270 270 270 960 1020 1020 1680 1680 1680
64 Hydrologic Considerations for Estimation of Storage-Capacity Requirements of Impounding and Side-Channel Reservoirs for Water Supply in Ohio

03102950 Pymatuning Creek at Kinsman, Ohio—Continued
Pumpset
Ratio of storage required for pump set to storage required for the primary pump relation (pump set 1) for indicated demand (in fraction of mean
annual streamflow)
0.002 0.010 0.020 0.050 0.100 0.200 0.300
1 1.00 1.00 1.00 1.00 1.00 1.00 1.00
2 1.63 1.24 1.10 1.06 1.10 1.91 2.76
3 1.38 1.14 1.03 1.00 1.06 1.07 1.03
4 1.19 1.00 1.00 1.00 1.00 1.02 1.00
5 1.11 1.00 1.00 1.00 1.00 1.00 1.00
6 1.00 1.00 1.00 1.00 1.00 1.00 1.00
7 1.63 1.25 1.11 1.20 1.67 3.93 15.09
8 1.39 1.15 1.06 1.15 1.25 1.29 1.94
9 1.38 1.16 1.08 1.24 1.34 1.48 2.49
10 1.28 1.10 1.16 1.32 1.37 1.57 2.59
11 1.24 1.17 1.21 1.30 1.40 1.70 2.50
12 1.46 1.20 1.08 1.16 1.26 1.48 2.57
13 1.28 1.08 1.08 1.19 1.31 1.30 1.68
14 1.14 1.10 1.16 1.26 1.30 1.31 1.92
15 1.18 1.17 1.20 1.23 1.33 1.43 2.11
16 1.08 1.19 1.28 1.28 1.38 1.52 2.54
17 1.19 1.06 1.08 1.17 1.26 1.28 1.55
18 1.16 1.10 1.16 1.20 1.24 1.32 1.75
19 1.04 1.15 1.22 1.20 1.29 1.43 1.94
20 1.08 1.18 1.27 1.26 1.35 1.52 2.41
Hydrologic Design Tables 65

3102950 Pymatuning Creek at Kinsman, Ohio—Continued
Recurrenceinterval(years)
Normalvariate
Side-channel storage required (in demand days) for primary pump relation to meet indicated demand (in fraction of mean annual streamflow)
0.0020 0.0100 0.0200 0.0500 0.1000 0.2000 0.3000
73.00 2.206 167.09 164.15 177.11 185.34 195.71 214.42 240.47
70.00 2.190 166.88 162.76 176.26 185.17 195.41 214.42 240.10
60.00 2.128 166.11 157.62 173.10 184.52 194.29 214.40 238.72
50.00 2.054 165.18 151.39 169.28 183.73 192.94 214.38 237.04
40.00 1.960 164.00 143.51 164.45 182.74 191.24 214.36 234.93
30.00 1.834 163.41 137.47 160.28 180.34 187.28 208.39 224.18
25.00 1.751 163.32 134.85 158.23 178.43 184.16 202.67 214.69
20.00 1.645 163.02 132.84 151.00 165.59 172.79 198.46 208.71
10.00 1.282 148.24 125.03 136.59 145.77 157.77 176.86 188.86
5.00 0.841 124.16 106.35 122.02 125.14 140.89 149.15 164.77
2.03 0.017 85.34 56.44 63.03 78.84 96.75 106.83 119.64
66 Hydrologic Considerations for Estimation of Storage-Capacity Requirements of Impounding and Side-Channel Reservoirs for Water Supply in Ohio

03109000 Lisbon Creek at Lisbon, Ohio
Location: Latitude 40°46′55″, longitude 80°45′53″, Columbiana County, Hydrologic Unit 05030101
Drainage area, in square miles: 6.19
Station used for record extension: 03090500
Time period of systematic or extended record analyzed: 1941-10-01 to 1971-10-04
Percentage of estimated values in extended record: 46.7
Eighty-percent-duration streamflow, in cubic feet per second: 0.4
Mean annual streamflow, in inches: 11.75
Location of station used for precipitation data: Pittsburgh, Pennsylvania
Location of station used for potential evapotranspiration data: Pittsburgh, Pennsylvania
[–, indicates a value that could not be determined because there were too few average low-flow values less than the mean streamflow for the indicated duration]
Recurrenceinterval(years)
Extreme-value
variate
Minimum runoff (in inches) for indicated duration (in days)
180 360 540 720 1080 1440 1800
31.00 3.42 0.23 4.95 7.18 11.69 20.59 30.65 37.50
30.00 3.38 0.24 4.97 7.22 11.74 20.67 30.77 38.16
25.00 3.20 0.28 5.09 7.45 12.03 21.08 31.44 41.87
20.00 2.97 0.33 5.23 7.74 12.38 21.60 32.27 46.42
10.00 2.25 0.46 5.77 8.53 14.63 28.02 38.89 55.99
5.17 1.54 0.48 6.55 10.18 17.47 30.72 57.75 –
Hydrologic Design Tables 67

03109000 Lisbon Creek at Lisbon, Ohio—Continued
Recurrenceinterval(years)
Impounding reservoir storage required (in inches) and critical-drawdown duration (in days; shown in gray) for indicated draft rate (in fraction of the mean annual streamflow)
0.02 0.05 0.10 0.15 0.20 0.25 0.30 0.35 0.40 0.45 0.50 0.60 0.70 0.80 0.90 1.00
5 0.00 0.03 0.19 0.40 0.68 0.97 1.31 1.65 1.99 2.32 2.66 3.37 4.22 5.09 5.97 7.90 0 60 120 150 180 210 210 210 210 210 210 240 270 270 600 600
6 0.00 0.04 0.19 0.42 0.68 1.00 1.34 1.68 2.02 2.35 2.70 3.47 4.27 5.14 6.66 8.59 0 60 120 150 180 210 210 210 210 210 240 240 270 270 600 600
8 0.00 0.04 0.20 0.45 0.72 1.06 1.40 1.74 2.08 2.44 2.82 3.59 4.43 5.43 7.36 9.60 30 60 150 150 210 210 210 210 210 240 240 240 270 600 600 900
10 0.00 0.05 0.22 0.46 0.77 1.11 1.45 1.79 2.13 2.52 2.90 3.71 4.58 5.79 7.84 10.88 30 60 120 150 210 210 210 210 240 240 240 270 270 600 900 960
15 0.01 0.06 0.25 0.51 0.85 1.19 1.52 1.88 2.26 2.66 3.09 3.96 4.83 7.49 10.69 15.01 30 120 120 210 210 210 210 240 240 270 270 270 270 960 1320 1380
20 0.01 0.07 0.27 0.55 0.89 1.23 1.58 1.97 2.36 2.79 3.23 4.09 5.95 9.04 12.53 16.78 30 120 150 210 210 210 240 240 270 270 270 270 960 960 1320 1320
25 0.01 0.08 0.29 0.58 0.91 1.26 1.65 2.03 2.42 2.85 3.29 4.24 6.84 9.93 13.31 17.56 30 120 180 180 210 240 240 240 270 270 270 300 960 960 1320 1320
30 0.01 0.08 0.34 0.63 0.93 1.31 1.70 2.09 2.49 2.97 3.45 4.42 7.34 10.47 14.21 19.76 30 120 180 180 240 240 240 240 300 300 300 300 960 1020 1680 1740
40 0.01 0.13 0.42 0.71 1.01 1.40 1.79 2.27 2.75 3.24 4.66 10.26 15.86 21.45 27.05 32.65 60 180 180 180 240 240 300 300 300 300 1740 1740 1740 1740 1740 1740
50 0.02 0.18 0.47 0.76 1.08 1.51 3.36 6.16 8.96 11.76 14.56 20.16 25.76 31.35 36.95 42.55 60 180 180 180 240 300 1740 1740 1740 1740 1740 1740 1740 1740 1740 1740
60 0.04 0.21 0.50 1.16 3.96 6.76 9.56 12.36 15.15 17.95 20.75 26.35 31.95 37.55 43.15 48.75 180 180 180 1740 1740 1740 1740 1740 1740 1740 1740 1740 1740 1740 1740 1740
70 0.06 0.23 1.85 4.64 7.44 10.24 13.04 15.84 18.64 21.44 24.24 29.84 35.44 41.03 46.63 52.23 180 180 1740 1740 1740 1740 1740 1740 1740 1740 1740 1740 1740 1740 1740 1740
80 0.08 0.90 3.69 6.49 9.29 12.09 14.89 17.69 20.49 23.29 26.09 31.69 37.29 42.88 48.48 54.08 180 1740 1740 1740 1740 1740 1740 1740 1740 1740 1740 1740 1740 1740 1740 1740
90 0.09 1.85 4.64 7.44 10.24 13.04 15.84 18.64 21.44 24.24 27.04 32.64 38.23 43.83 49.43 55.03 180 1740 1740 1740 1740 1740 1740 1740 1740 1740 1740 1740 1740 1740 1740 1740
100 0.09 2.32 5.12 7.92 10.72 13.52 16.32 19.12 21.92 24.72 27.52 33.11 38.71 44.34 50.14 55.93 180 1740 1740 1740 1740 1740 1740 1740 1740 1740 1740 1740 1740 1800 1800 1800
68 Hydrologic Considerations for Estimation of Storage-Capacity Requirements of Impounding and Side-Channel Reservoirs for Water Supply in Ohio

03109000 Lisbon Creek at Lisbon, Ohio—Continued
Pumpset
Ratio of storage required for pump set to storage required for the primary pump relation (pump set 1) for indicated demand (in fraction of mean
annual streamflow)
0.002 0.010 0.020 0.050 0.100 0.200 0.300
1 1.00 1.00 1.00 1.00 1.00 1.00 1.00
2 1.26 1.07 1.03 1.04 1.83 3.53 4.63
3 1.13 1.03 1.00 1.00 1.03 1.13 1.36
4 1.09 1.00 1.00 1.00 1.00 1.00 1.00
5 1.06 1.00 1.00 1.00 1.00 1.00 1.00
6 1.03 1.00 1.00 1.00 1.00 1.00 1.00
7 1.26 1.09 1.10 1.46 3.50 6.10 11.36
8 1.13 1.07 1.04 1.08 1.11 1.82 3.16
9 1.14 1.12 1.06 1.07 1.43 2.07 4.74
10 1.12 1.05 1.05 1.11 1.25 1.71 4.31
11 1.08 1.11 1.08 1.11 1.28 1.64 4.74
12 1.17 1.08 1.06 1.07 1.38 2.54 4.18
13 1.11 1.09 1.05 1.05 1.15 1.47 2.44
14 1.07 1.07 1.04 1.06 1.23 1.42 2.12
15 1.07 1.09 1.10 1.07 1.23 1.45 2.76
16 1.04 1.10 1.07 1.06 1.39 1.49 3.96
17 1.09 1.08 1.05 1.04 1.12 1.26 1.61
18 1.07 1.08 1.04 1.07 1.21 1.42 1.56
19 1.04 1.08 1.09 1.06 1.25 1.46 1.69
20 1.03 1.10 1.07 1.05 1.39 1.48 2.88
Recurrenceinterval(years)
Normalvariate
Side-channel storage required (in demand days) for primary pump relation to meet indicated demand (in fraction of mean annual streamflow)
0.0020 0.0100 0.0200 0.0500 0.1000 0.2000 0.3000
31.00 1.849 181.44 194.75 202.99 206.49 208.13 223.47 239.79
30.00 1.834 181.15 193.97 201.30 204.74 207.68 223.06 239.67
25.00 1.751 179.54 189.55 191.71 194.79 205.13 220.74 238.99
20.00 1.645 177.48 183.93 179.52 182.14 201.88 217.79 238.12
10.00 1.282 147.60 133.36 128.71 160.29 160.03 203.49 217.79
5.00 0.841 109.84 117.00 117.52 131.88 151.97 179.97 195.52
2.07 0.040 74.62 70.05 68.34 76.69 95.79 120.52 144.08
Hydrologic Design Tables 69

03109500 Little Beaver Creek near East Liverpool, Ohio
Location: Latitude 40°40′33″, longitude 80°32′27″, Columbiana County, Hydrologic Unit 05030101
Drainage area, in square miles: 496.
Station used for record extension: None
Time period of systematic or extended record analyzed: 1926-01-01 to 1997-09-30
Eighty-percent-duration streamflow, in cubic feet per second: 82.
Mean annual streamflow, in inches: 14.54
Location of station used for precipitation data: Pittsburgh, Pennsylvania
Location of station used for potential evapotranspiration data: Pittsburgh, Pennsylvania
[–, indicates a value that could not be determined because there were too few average low-flow values less than the mean stream-flow for the indicated duration]
Recurrenceinterval(years)
Extreme-value
variate
Minimum runoff (in inches) for indicated duration (in days)
180 360 540 720 1080 1440 1800
72.00 4.27 0.44 3.55 6.31 14.44 23.34 34.67 43.17
70.00 4.24 0.45 3.61 6.34 14.44 23.45 34.76 43.27
60.00 4.09 0.50 3.95 6.48 14.46 24.08 35.28 43.79
50.00 3.90 0.56 4.34 6.66 14.49 24.82 35.89 44.40
40.00 3.68 0.63 4.83 6.87 14.52 25.72 36.64 45.16
30.00 3.38 0.70 5.18 8.07 15.21 26.50 39.47 51.59
25.00 3.20 0.72 5.29 9.18 15.90 26.85 41.95 57.67
20.00 2.97 0.74 6.14 9.97 16.10 28.14 43.22 59.13
10.00 2.25 0.93 6.89 11.01 19.27 34.15 46.70 65.34
5.14 1.53 1.24 8.66 14.26 23.57 43.81 77.53 –
70 Hydrologic Considerations for Estimation of Storage-Capacity Requirements of Impounding and Side-Channel Reservoirs for Water Supply in Ohio

03109500 Little Beaver Creek near East Liverpool, Ohio—Continued
Recurrenceinterval(years)
Impounding reservoir storage required (in inches) and critical-drawdown duration (in days; shown in gray) for indicated draft rate (in fraction of the mean annual streamflow)
0.02 0.05 0.10 0.15 0.20 0.25 0.30 0.35 0.40 0.45 0.50 0.60 0.70 0.80 0.90 1.00
5 0.00 0.00 0.06 0.21 0.39 0.65 0.95 1.28 1.64 2.06 2.50 3.45 4.41 5.38 6.45 8.54 0 0 60 90 90 150 150 180 210 210 240 240 240 270 270 600
6 0.00 0.00 0.06 0.22 0.43 0.73 1.04 1.40 1.81 2.23 2.68 3.63 4.59 5.57 6.88 9.27 0 0 60 90 150 150 180 180 210 210 240 240 240 270 600 600
8 0.00 0.00 0.07 0.25 0.51 0.81 1.17 1.57 1.98 2.40 2.87 3.82 4.78 5.83 7.98 10.37 0 0 60 120 150 180 180 210 210 210 240 240 240 270 600 600
10 0.00 0.00 0.08 0.28 0.55 0.88 1.24 1.65 2.07 2.49 2.97 3.93 4.93 6.41 8.80 12.41 0 0 60 120 150 180 180 210 210 240 240 240 270 600 600 960
15 0.00 0.00 0.11 0.32 0.61 0.97 1.34 1.76 2.17 2.65 3.12 4.15 5.40 7.79 11.44 15.49 0 30 90 120 180 180 210 210 210 240 240 270 600 600 1020 1020
20 0.00 0.01 0.13 0.34 0.66 1.02 1.40 1.82 2.28 2.75 3.28 4.35 6.29 8.77 12.81 18.00 0 30 90 120 180 180 210 210 240 240 270 270 600 960 1020 1740
25 0.00 0.01 0.15 0.35 0.70 1.06 1.46 1.90 2.37 2.90 3.44 4.58 6.93 9.52 13.58 19.71 0 30 90 150 180 180 210 240 240 270 270 300 600 1020 1020 1740
30 0.00 0.01 0.16 0.38 0.74 1.10 1.52 1.99 2.50 3.03 3.59 5.03 7.42 10.01 14.15 21.03 0 30 90 180 180 210 210 240 270 270 300 600 600 1020 1620 1740
40 0.00 0.02 0.18 0.45 0.81 1.22 1.68 2.18 2.72 3.30 3.90 5.74 8.13 10.65 16.39 23.32 0 30 90 180 180 210 240 270 270 300 300 600 600 1020 1740 1740
50 0.00 0.02 0.19 0.52 0.90 1.35 1.83 2.35 2.92 3.52 4.12 6.24 8.62 11.63 18.56 25.48 0 30 90 180 210 240 240 270 300 300 300 600 600 1740 1740 1740
60 0.00 0.02 0.22 0.58 1.01 1.49 1.96 2.50 3.09 3.69 4.28 6.61 9.00 13.77 20.70 27.62 0 30 150 210 240 240 240 270 300 300 300 600 600 1740 1740 1740
70 0.00 0.02 0.26 0.66 1.12 1.60 2.08 2.63 3.22 3.82 4.52 6.90 9.29 15.88 22.80 29.73 0 60 180 210 240 240 270 300 300 300 600 600 600 1740 1740 1740
80 0.00 0.03 0.32 0.74 1.22 1.70 2.19 2.74 3.33 3.93 4.77 7.14 11.01 17.93 24.86 31.78 0 60 210 240 240 240 270 300 300 300 540 600 1680 1740 1740 1740
90 0.00 0.03 0.38 0.83 1.30 1.78 2.28 2.83 3.43 4.02 5.00 7.34 13.16 19.91 26.84 33.76 0 120 210 240 240 240 270 300 300 300 540 600 1680 1740 1740 1740
100 0.00 0.06 0.44 0.90 1.38 1.85 2.35 2.91 3.51 4.12 5.19 8.55 15.23 21.92 28.74 35.66 0 150 210 240 240 240 270 300 300 540 540 1680 1680 1680 1740 1740
Hydrologic Design Tables 71

03109500 Little Beaver Creek near East Liverpool, Ohio—Continued
Pumpset
Ratio of storage required for pump set to storage required for the primary pump relation (pump set 1) for indicated demand (in fraction of mean
annual streamflow)
0.002 0.010 0.020 0.050 0.100 0.200 0.300
1 1.00 1.00 1.00 1.00 1.00 1.00 1.00
2 1.24 1.15 1.04 1.00 1.48 2.41 6.45
3 1.09 1.06 1.00 1.00 1.00 1.00 1.18
4 1.00 1.01 1.00 1.00 1.00 1.00 1.00
5 1.00 1.00 1.00 1.00 1.00 1.00 1.00
6 1.00 1.00 1.00 1.00 1.00 1.00 1.00
7 1.24 1.17 1.07 1.40 2.10 9.48 17.88
8 1.10 1.10 1.06 1.05 1.06 1.41 2.90
9 1.10 1.11 1.08 1.08 1.10 1.73 4.11
10 1.03 1.11 1.13 1.13 1.13 1.50 3.67
11 1.00 1.14 1.15 1.12 1.19 1.59 4.09
12 1.15 1.13 1.04 1.04 1.06 1.73 3.76
13 1.04 1.08 1.08 1.07 1.09 1.30 2.23
14 1.00 1.08 1.13 1.12 1.13 1.36 2.20
15 1.00 1.14 1.15 1.12 1.18 1.50 2.80
16 1.00 1.16 1.19 1.13 1.19 1.56 3.59
17 1.00 1.06 1.08 1.07 1.09 1.19 1.69
18 1.00 1.08 1.13 1.12 1.13 1.28 1.71
19 1.00 1.14 1.16 1.12 1.18 1.47 2.16
20 1.00 1.16 1.19 1.13 1.19 1.52 2.99
72 Hydrologic Considerations for Estimation of Storage-Capacity Requirements of Impounding and Side-Channel Reservoirs for Water Supply in Ohio

03109500 Little Beaver Creek near East Liverpool, Ohio—Continued
Recurrenceinterval(years)
Normalvariate
Side-channel storage required (in demand days) for primary pump relation to meet indicated demand (in fraction of mean annual streamflow)
0.0020 0.0100 0.0200 0.0500 0.1000 0.2000 0.3000
72.00 2.201 213.53 218.97 241.30 259.72 265.65 276.41 290.81
70.00 2.190 212.92 216.70 238.89 257.78 263.88 275.11 290.15
60.00 2.128 209.54 204.20 225.60 247.06 254.11 267.93 286.50
50.00 2.054 205.46 189.05 209.49 234.06 242.27 259.22 282.08
40.00 1.960 200.29 169.92 189.15 217.66 227.33 248.23 276.51
30.00 1.834 190.42 155.94 170.04 195.20 205.85 235.64 259.00
25.00 1.751 182.80 151.08 160.49 180.22 191.15 228.14 243.71
20.00 1.645 176.20 141.13 153.56 171.64 181.76 219.95 238.89
10.00 1.282 147.52 126.61 135.81 146.80 163.62 194.00 218.19
5.00 0.841 124.74 100.30 102.44 116.07 137.22 165.69 189.55
2.00 0.000 93.27 56.21 59.64 67.15 74.20 99.30 114.67
Hydrologic Design Tables 73

03110000 Yellow Creek near Hammondsville, Ohio
Location: Latitude 40°32′16″, longitude 80°43′31″, Jefferson County, Hydrologic Unit 05030101
Drainage area, in square miles: 147.
Station used for record extension: None
Time period of systematic or extended record analyzed: 1940-11-01 to 1997-09-30
Eighty-percent-duration streamflow, in cubic feet per second: 20.
Mean annual streamflow, in inches: 14.98
Location of station used for precipitation data: Pittsburgh, Ohio
Location of station used for potential evapotranspiration data: Pittsburgh, Pennsylvania
[–, indicates a value that could not be determined because there were too few average low-flow values less than the mean stream-flow for the indicated duration]
Recurrenceinterval(years)
Extreme-value
variate
Minimum runoff (in inches) for indicated duration (in days)
180 360 540 720 1080 1440 1800
57.00 4.03 0.36 4.75 8.07 16.50 29.69 39.59 50.71
50.00 3.90 0.36 5.07 8.39 16.60 29.72 40.40 52.28
40.00 3.68 0.37 5.62 8.95 16.76 29.77 41.79 54.95
30.00 3.38 0.38 6.33 9.66 16.97 29.83 43.58 58.41
25.00 3.20 0.39 6.59 9.82 17.13 30.15 44.44 59.24
20.00 2.97 0.41 6.80 9.86 17.33 30.68 45.37 59.59
10.00 2.25 0.83 7.86 12.29 18.74 35.14 48.40 67.15
5.18 1.54 1.01 8.46 14.37 23.39 42.02 – –
74 Hydrologic Considerations for Estimation of Storage-Capacity Requirements of Impounding and Side-Channel Reservoirs for Water Supply in Ohio

03110000 Yellow Creek near Hammondsville, Ohio—Continued
Recurrenceinterval(years)
Impounding reservoir storage required (in inches) and critical-drawdown duration (in days; shown in gray) for indicated draft rate (in fraction of the mean annual streamflow)
0.02 0.05 0.10 0.15 0.20 0.25 0.30 0.35 0.40 0.45 0.50 0.60 0.70 0.80 0.90 1.00
5 0.00 0.03 0.14 0.33 0.63 0.94 1.29 1.66 2.03 2.40 2.78 3.65 4.63 5.61 6.62 8.13 0 30 90 90 150 150 180 180 180 180 210 240 240 240 300 600
6 0.00 0.03 0.15 0.33 0.63 0.94 1.29 1.66 2.03 2.40 2.78 3.66 4.65 5.63 6.70 9.17 0 30 90 90 150 150 180 180 180 180 210 240 240 240 600 600
8 0.00 0.03 0.17 0.38 0.64 0.95 1.29 1.66 2.03 2.40 2.89 3.87 4.86 5.84 8.03 10.49 0 60 90 120 150 150 180 180 180 180 240 240 240 240 600 600
10 0.00 0.04 0.19 0.42 0.70 1.01 1.38 1.75 2.14 2.63 3.13 4.11 5.10 6.39 8.85 11.40 0 60 90 120 150 180 180 180 240 240 240 240 240 600 600 660
15 0.00 0.05 0.25 0.53 0.86 1.23 1.60 2.09 2.58 3.07 3.56 4.55 5.64 7.52 9.98 16.08 0 60 120 150 180 180 180 240 240 240 240 240 270 600 600 1740
20 0.00 0.06 0.30 0.62 0.99 1.36 1.84 2.33 2.83 3.32 3.81 4.88 5.99 8.09 12.21 17.65 30 90 150 180 180 210 240 240 240 240 240 270 270 600 1320 1740
25 0.00 0.07 0.34 0.69 1.06 1.49 1.98 2.47 2.96 3.46 3.98 5.09 6.29 8.85 13.77 19.18 30 90 150 180 180 240 240 240 240 240 270 270 300 960 1320 1320
30 0.00 0.08 0.37 0.73 1.12 1.56 2.06 2.55 3.04 3.56 4.11 5.27 6.50 9.60 14.64 20.05 30 120 150 180 210 240 240 240 240 270 270 300 300 960 1320 1320
40 0.00 0.09 0.40 0.77 1.18 1.62 2.12 2.61 3.15 3.70 4.26 5.46 6.79 10.36 15.16 20.58 30 120 180 180 210 240 240 240 270 270 270 300 540 960 1320 1320
50 0.01 0.09 0.40 0.77 1.18 1.62 2.12 2.65 3.20 3.76 4.31 5.50 7.28 10.56 15.16 22.08 30 120 180 180 210 240 240 270 270 270 270 300 480 960 1320 1740
60 0.01 0.09 0.40 0.77 1.18 1.62 2.12 2.65 3.21 3.76 4.31 5.69 7.66 10.56 17.40 24.54 30 120 180 180 210 240 240 270 270 270 270 480 480 960 1740 1740
70 0.01 0.09 0.40 0.77 1.18 1.62 2.12 2.65 3.21 3.76 4.31 5.99 7.96 13.00 20.13 27.27 30 120 180 180 210 240 240 270 270 270 270 480 480 1740 1740 1740
80 0.01 0.09 0.40 0.77 1.18 1.62 2.12 2.65 3.21 3.76 4.31 6.23 8.71 15.84 22.98 30.12 30 120 180 180 210 240 240 270 270 270 270 480 1740 1740 1740 1740
90 0.01 0.09 0.40 0.77 1.18 1.62 2.12 2.65 3.21 3.76 4.46 6.43 11.56 18.69 25.83 32.97 30 120 180 180 210 240 240 270 270 270 480 480 1740 1740 1740 1740
100 0.01 0.09 0.40 0.77 1.18 1.62 2.12 2.65 3.21 3.76 4.64 7.20 14.34 21.47 28.61 35.75 30 120 180 180 210 240 240 270 270 270 480 1740 1740 1740 1740 1740
Hydrologic Design Tables 75

03110000 Yellow Creek near Hammondsville, Ohio—Continued
Pumpset
Ratio of storage required for pump set to storage required for the primary pump relation (pump set 1) for indicated demand (in fraction of mean
annual streamflow)
0.002 0.010 0.020 0.050 0.100 0.200 0.300
1 1.00 1.00 1.00 1.00 1.00 1.00 1.00
2 1.37 1.10 1.03 1.13 1.28 2.16 3.94
3 1.28 1.02 1.00 1.01 1.00 1.01 1.00
4 1.16 1.00 1.00 1.00 1.00 1.00 1.00
5 1.02 1.00 1.00 1.00 1.00 1.00 1.00
6 1.00 1.00 1.00 1.00 1.00 1.00 1.00
7 1.37 1.12 1.09 1.33 1.77 5.63 11.10
8 1.30 1.03 1.03 1.05 1.10 1.18 2.60
9 1.29 1.05 1.04 1.08 1.23 1.39 3.74
10 1.25 1.04 1.06 1.09 1.24 1.38 3.21
11 1.20 1.07 1.11 1.13 1.30 1.47 3.52
12 1.30 1.06 1.02 1.05 1.10 1.39 3.42
13 1.26 1.04 1.03 1.08 1.21 1.20 1.69
14 1.10 1.04 1.05 1.10 1.24 1.26 1.82
15 1.06 1.07 1.10 1.10 1.29 1.39 1.97
16 1.07 1.11 1.11 1.14 1.35 1.70 2.08
17 1.17 1.04 1.03 1.08 1.19 1.21 1.40
18 1.03 1.04 1.06 1.10 1.24 1.26 1.68
19 1.05 1.07 1.10 1.10 1.30 1.36 1.83
20 1.06 1.11 1.11 1.14 1.37 1.63 1.95
Recurrenceinterval(years)
Normalvariate
Side-channel storage required (in demand days) for primary pump relation to meet indicated demand (in fraction of mean annual streamflow)
0.0020 0.0100 0.0200 0.0500 0.1000 0.2000 0.3000
57.00 2.108 194.59 198.20 205.59 210.78 216.84 239.67 257.45
50.00 2.054 189.18 197.14 204.55 208.50 214.47 237.58 254.51
40.00 1.960 179.72 195.27 202.74 204.51 210.33 233.93 249.36
30.00 1.834 167.00 192.77 200.31 199.15 204.76 229.03 242.45
25.00 1.751 156.81 188.92 192.89 192.67 203.45 227.03 241.11
20.00 1.645 142.98 182.96 180.63 183.00 202.93 225.11 240.98
10.00 1.282 121.88 119.18 118.93 133.16 149.80 170.88 188.99
5.00 0.841 100.00 87.28 92.41 114.01 131.54 151.44 169.49
2.04 0.022 60.69 51.98 56.89 69.03 78.25 103.45 117.14
76 Hydrologic Considerations for Estimation of Storage-Capacity Requirements of Impounding and Side-Channel Reservoirs for Water Supply in Ohio

03110500 Yellow Creek at Hammondsville, Ohio
Location: Latitude 40°33′15″, longitude 80°42′30″, Jefferson County, Hydrologic Unit 05030101
Drainage area, in square miles: 164.
Station used for record extension: 03109500
Time period of systematic or extended record analyzed: 1926-01-01 to 1997-09-30
Percentage of estimated values in extended record: 82.7
Eighty-percent-duration streamflow, in cubic feet per second: 17.
Mean annual streamflow, in inches: 17.89
Location of station used for precipitation data: Pittsburgh, Pennsylvania
Location of station used for potential evapotranspiration data: Pittsburgh, Pennsylvania
[–, indicates a value that could not be determined because there were too few average low-flow values less than the mean streamflow for the indicated duration]
Recurrenceinterval(years)
Extreme-value
variate
Minimum runoff (in inches) for indicated duration (in days)
180 360 540 720 1080 1440 1800
72.00 4.27 0.20 3.73 9.21 17.10 29.83 44.48 54.99
70.00 4.24 0.22 3.81 9.28 17.17 29.87 44.56 55.09
60.00 4.09 0.30 4.26 9.66 17.57 30.10 45.01 55.64
50.00 3.90 0.41 4.79 10.11 18.05 30.36 45.54 56.28
40.00 3.68 0.54 5.43 10.66 18.63 30.69 46.18 57.07
30.00 3.38 0.61 6.57 11.12 19.37 31.28 48.53 63.34
25.00 3.20 0.62 7.41 11.32 19.84 31.72 50.58 69.24
20.00 2.97 0.71 7.70 11.73 20.19 33.29 51.45 70.72
10.00 2.25 0.91 8.36 12.67 22.28 42.10 56.73 79.37
5.14 1.53 1.20 10.17 16.93 28.34 53.75 93.77 –
Hydrologic Design Tables 77

03110500 Yellow Creek at Hammondsville, Ohio—Continued
Recurrenceinterval(years)
Impounding reservoir storage required (in inches) and critical-drawdown duration (in days; shown in gray) for indicated draft rate (in fraction of the mean annual streamflow)
0.02 0.05 0.10 0.15 0.20 0.25 0.30 0.35 0.40 0.45 0.50 0.60 0.70 0.80 0.90 1.00
5 0.00 0.04 0.17 0.39 0.63 1.00 1.38 1.83 2.27 2.78 3.29 4.46 5.64 6.83 8.15 10.77 30 30 90 90 150 150 180 180 180 210 210 240 240 270 270 600
6 0.00 0.05 0.19 0.41 0.76 1.13 1.55 1.99 2.48 3.00 3.54 4.72 5.89 7.16 9.31 12.25 30 30 90 120 150 150 180 180 210 210 240 240 240 270 600 600
8 0.00 0.05 0.22 0.51 0.86 1.26 1.70 2.18 2.70 3.23 3.82 5.00 6.21 8.03 10.97 13.90 30 30 120 120 150 180 180 210 210 240 240 240 270 600 600 600
10 0.01 0.05 0.25 0.54 0.89 1.32 1.77 2.29 2.80 3.39 3.97 5.15 6.43 8.92 11.86 14.91 30 30 120 120 150 180 210 210 210 240 240 240 270 600 600 1020
15 0.01 0.07 0.26 0.56 0.96 1.40 1.91 2.43 3.02 3.61 4.20 5.43 7.09 10.03 13.68 20.53 30 60 120 120 180 180 210 240 240 240 240 270 600 600 1020 1680
20 0.02 0.09 0.29 0.59 1.02 1.50 2.01 2.58 3.17 3.76 4.35 5.66 7.64 10.58 15.46 23.21 30 60 90 150 180 210 210 240 240 240 240 300 600 600 1020 1740
25 0.02 0.10 0.32 0.64 1.08 1.59 2.13 2.71 3.30 3.89 4.54 6.01 8.02 11.53 16.52 24.57 30 60 90 180 180 210 240 240 240 240 300 300 600 1020 1020 1740
30 0.02 0.11 0.33 0.71 1.17 1.68 2.24 2.83 3.42 4.06 4.79 6.26 8.31 12.27 17.39 25.52 30 90 90 180 210 210 240 240 240 300 300 300 600 1020 1620 1740
40 0.03 0.14 0.41 0.84 1.33 1.86 2.45 3.03 3.68 4.41 5.15 6.62 8.80 13.29 18.80 27.25 60 90 150 180 210 240 240 240 300 300 300 300 600 1020 1620 1740
50 0.04 0.16 0.50 0.95 1.47 2.03 2.62 3.20 3.90 4.64 5.37 6.84 9.24 14.05 20.70 29.23 60 90 180 210 210 240 240 240 300 300 300 300 600 1020 1740 1740
60 0.05 0.20 0.59 1.07 1.58 2.17 2.76 3.37 4.06 4.80 5.53 7.03 9.69 14.69 22.95 31.47 90 150 180 210 210 240 240 270 300 300 300 330 1020 1020 1740 1740
70 0.06 0.25 0.66 1.16 1.70 2.29 2.88 3.53 4.19 4.91 5.65 7.26 10.26 16.86 25.39 33.91 90 150 180 210 240 240 240 270 270 300 300 330 1020 1740 1740 1740
80 0.07 0.29 0.72 1.24 1.80 2.39 3.00 3.66 4.32 5.02 5.82 7.49 10.87 19.39 27.91 36.43 120 150 210 210 240 240 270 270 270 330 330 600 1740 1740 1740 1740
90 0.09 0.31 0.78 1.30 1.88 2.47 3.12 3.78 4.44 5.17 5.98 7.85 13.42 21.94 30.46 38.98 150 180 210 210 240 240 270 270 270 330 330 600 1740 1740 1740 1740
100 0.11 0.34 0.83 1.36 1.95 2.55 3.22 3.88 4.59 5.47 6.35 8.20 15.94 24.46 32.98 41.51 150 180 210 240 240 270 270 270 360 360 360 600 1740 1740 1740 1740
78 Hydrologic Considerations for Estimation of Storage-Capacity Requirements of Impounding and Side-Channel Reservoirs for Water Supply in Ohio

03110500 Yellow Creek at Hammondsville, Ohio—Continued
Pumpset
Ratio of storage required for pump set to storage required for the primary pump relation (pump set 1) for indicated demand (in fraction of mean
annual streamflow)
0.002 0.010 0.020 0.050 0.100 0.200 0.300
1 1.00 1.00 1.00 1.00 1.00 1.00 1.00
2 1.28 1.13 1.12 1.03 1.00 1.58 2.69
3 1.14 1.01 1.02 1.00 1.00 1.00 1.05
4 1.08 1.00 1.00 1.00 1.00 1.00 1.00
5 1.04 1.00 1.00 1.00 1.00 1.00 1.00
6 1.02 1.00 1.00 1.00 1.00 1.00 1.00
7 1.28 1.15 1.13 1.09 1.53 3.83 14.84
8 1.15 1.02 1.05 1.08 1.18 1.36 2.47
9 1.14 1.03 1.06 1.13 1.26 1.66 4.09
10 1.13 1.00 1.03 1.29 1.35 1.61 3.94
11 1.10 1.02 1.10 1.32 1.36 1.54 4.99
12 1.19 1.07 1.06 1.07 1.14 1.57 3.26
13 1.12 1.01 1.03 1.13 1.25 1.32 2.05
14 1.07 1.00 1.00 1.27 1.35 1.33 2.30
15 1.07 1.02 1.08 1.32 1.36 1.38 3.69
16 1.05 1.01 1.09 1.39 1.35 1.43 4.46
17 1.09 1.01 1.01 1.13 1.25 1.22 1.61
18 1.05 1.00 1.00 1.27 1.35 1.33 1.62
19 1.05 1.02 1.10 1.32 1.37 1.38 2.80
20 1.02 1.01 1.09 1.39 1.35 1.43 3.70
Hydrologic Design Tables 79

03110500 Yellow Creek at Hammondsville, Ohio—Continued
Recurrenceinterval(years)
Normalvariate
Side-channel storage required (in demand days) for primary pump relation to meet indicated demand (in fraction of mean annual streamflow)
0.0020 0.0100 0.0200 0.0500 0.1000 0.2000 0.3000
72.00 2.201 167.31 185.73 183.87 199.87 218.14 246.01 258.33
70.00 2.190 165.61 182.83 181.30 197.79 216.82 244.49 256.77
60.00 2.128 156.23 166.82 167.10 186.33 209.57 236.07 248.13
50.00 2.054 144.86 147.42 149.90 172.45 200.77 225.88 237.66
40.00 1.960 130.50 122.92 128.18 154.91 189.67 213.00 224.45
30.00 1.834 122.34 109.96 115.28 142.29 175.75 199.29 217.82
25.00 1.751 121.10 108.84 112.85 138.03 166.94 191.58 217.60
20.00 1.645 115.22 106.42 108.09 127.30 149.03 184.94 212.40
10.00 1.282 105.32 81.75 94.31 114.86 134.63 163.43 195.42
5.00 0.841 88.09 67.48 78.04 87.51 105.54 143.59 164.03
2.00 0.000 62.36 40.65 42.13 49.24 62.49 87.32 102.46
80 Hydrologic Considerations for Estimation of Storage-Capacity Requirements of Impounding and Side-Channel Reservoirs for Water Supply in Ohio

03111500 Short Creek near Dillonvale, Ohio
Location: Latitude 40°11′36″, longitude 80°44′04″, Jefferson County, Hydrologic Unit 05030106
Drainage area, in square miles: 123.
Station used for record extension: None
Time period of systematic or extended record analyzed: 1941-10-01 to 1997-09-30
Eighty-percent-duration streamflow, in cubic feet per second: 33.
Mean annual streamflow, in inches: 14.31
Location of station used for precipitation data: Cadiz, Ohio
Location of station used for potential evapotranspiration data: Pittsburgh, Pennsylvania
[–, indicates a value that could not be determined because there were too few average low-flow values less than the mean streamflow for the indicated duration]
Recurrenceinterval(years)
Extreme-value
variate
Minimum runoff (in inches) for indicated duration (in days)
180 360 540 720 1080 1440 1800
57.00 4.03 0.86 4.92 8.23 14.20 26.26 37.81 50.81
50.00 3.90 0.89 5.15 8.62 14.88 26.60 37.99 51.75
40.00 3.68 0.95 5.55 9.29 16.04 27.17 38.30 53.35
30.00 3.38 1.03 6.06 10.16 17.54 27.91 38.70 55.43
25.00 3.20 1.17 6.28 10.34 17.82 28.57 39.92 56.04
20.00 2.97 1.40 6.49 10.40 17.83 29.49 41.89 56.45
10.00 2.25 1.48 7.16 11.71 18.98 32.54 46.02 63.60
5.18 1.54 1.74 9.06 14.17 24.58 40.71 66.56 –
Hydrologic Design Tables 81

03111500 Short Creek near Dillonvale, Ohio—Continued
Recurrenceinterval(years)
Impounding reservoir storage required (in inches) and critical-drawdown duration (in days; shown in gray) for indicated draft rate (in fraction of the mean annual streamflow)
0.02 0.05 0.10 0.15 0.20 0.25 0.30 0.35 0.40 0.45 0.50 0.60 0.70 0.80 0.90 1.00
5 0.00 0.00 0.00 0.04 0.13 0.29 0.56 0.85 1.14 1.47 1.84 2.67 3.49 4.43 5.81 8.16 0 0 0 30 60 120 150 150 150 180 210 210 210 240 600 600
6 0.00 0.00 0.00 0.05 0.15 0.30 0.56 0.86 1.17 1.52 1.88 2.70 3.62 4.56 6.69 9.04 0 0 0 30 60 120 150 150 180 180 210 210 240 240 600 600
8 0.00 0.00 0.00 0.06 0.17 0.34 0.60 0.90 1.24 1.60 1.99 2.90 3.84 5.27 7.62 9.97 0 0 0 30 60 120 150 150 180 180 210 240 240 600 600 600
10 0.00 0.00 0.01 0.07 0.19 0.38 0.65 0.95 1.31 1.69 2.13 3.07 4.11 5.73 8.08 12.81 0 0 30 60 60 120 150 180 180 210 240 240 270 600 600 1680
15 0.00 0.00 0.02 0.09 0.23 0.47 0.77 1.10 1.51 1.95 2.42 3.38 4.44 6.27 11.40 17.98 0 0 30 60 120 150 150 210 210 240 240 270 270 600 1680 1680
20 0.00 0.00 0.03 0.11 0.29 0.56 0.85 1.26 1.68 2.15 2.62 3.56 4.60 6.55 11.40 17.98 0 0 30 60 120 150 150 210 240 240 240 240 300 600 1680 1680
25 0.00 0.00 0.03 0.12 0.33 0.62 0.96 1.37 1.82 2.29 2.76 3.70 4.70 7.37 11.70 17.98 0 0 30 60 120 150 210 210 240 240 240 240 300 960 1320 1680
30 0.00 0.00 0.04 0.13 0.38 0.67 1.04 1.46 1.93 2.40 2.87 3.81 4.87 8.00 12.51 17.98 0 0 30 120 150 150 210 240 240 240 240 240 540 960 1320 1680
40 0.00 0.00 0.04 0.17 0.44 0.76 1.16 1.62 2.09 2.56 3.03 3.97 5.59 8.89 13.78 18.96 0 0 30 120 150 180 210 240 240 240 240 240 480 960 1320 1320
50 0.00 0.00 0.04 0.19 0.51 0.86 1.26 1.73 2.20 2.67 3.14 4.57 6.45 9.71 14.88 20.06 0 0 30 150 180 180 240 240 240 240 240 480 480 1320 1320 1320
60 0.00 0.00 0.04 0.24 0.59 0.95 1.34 1.81 2.28 2.75 3.46 5.34 7.22 10.76 15.93 22.39 0 0 30 180 180 180 240 240 240 240 480 480 480 1320 1320 1740
70 0.00 0.00 0.04 0.31 0.66 1.02 1.40 1.87 2.34 3.20 4.14 6.02 8.35 13.60 20.42 27.24 0 0 30 180 180 180 240 240 240 480 480 480 840 1740 1740 1740
80 0.00 0.00 0.04 0.37 0.73 1.08 1.45 1.92 2.85 3.79 4.73 6.61 11.76 18.58 25.40 32.22 0 0 30 180 180 180 240 240 480 480 480 480 1740 1740 1740 1740
90 0.00 0.00 0.07 0.43 0.78 1.13 1.49 2.42 3.37 4.31 5.25 9.72 16.54 23.36 30.18 37.00 0 0 180 180 180 180 240 480 480 480 480 1740 1740 1740 1740 1740
100 0.00 0.00 0.12 0.47 0.82 1.18 1.94 2.88 3.82 4.76 7.30 14.12 20.94 27.76 34.58 41.39 0 0 180 180 180 180 480 480 480 480 1740 1740 1740 1740 1740 1740
82 Hydrologic Considerations for Estimation of Storage-Capacity Requirements of Impounding and Side-Channel Reservoirs for Water Supply in Ohio

03111500 Short Creek near Dillonvale, Ohio—Continued
Pumpset
Ratio of storage required for pump set to storage required for the primary pump relation (pump set 1) for indicated demand (in fraction of mean
annual streamflow)
0.002 0.010 0.020 0.050 0.100 0.200 0.300
1 1.00 1.00 1.00 1.00 1.00 1.00 1.00
2 2.22 1.81 1.65 1.67 1.93 2.32 4.75
3 1.32 1.10 1.07 1.06 1.04 1.24 1.19
4 1.22 1.07 1.06 1.00 1.00 1.00 1.04
5 1.15 1.05 1.03 1.00 1.00 1.00 1.00
6 1.07 1.02 1.01 1.00 1.00 1.00 1.00
7 2.22 1.83 1.85 2.02 2.35 7.79 11.01
8 1.32 1.12 1.11 1.11 1.15 1.83 3.25
9 1.32 1.14 1.14 1.13 1.36 2.41 5.83
10 1.27 1.10 1.11 1.14 1.20 2.09 6.92
11 1.23 1.15 1.12 1.14 1.29 2.40 9.14
12 1.39 1.17 1.16 1.13 1.32 2.23 4.60
13 1.27 1.11 1.11 1.09 1.10 1.84 2.31
14 1.20 1.08 1.09 1.10 1.13 1.90 4.01
15 1.20 1.13 1.10 1.09 1.17 2.09 7.01
16 1.15 1.11 1.10 1.14 1.21 2.92 10.04
17 1.22 1.10 1.09 1.07 1.09 1.75 2.03
18 1.16 1.06 1.07 1.06 1.12 1.85 2.58
19 1.14 1.10 1.08 1.07 1.17 2.00 5.67
20 1.09 1.08 1.10 1.14 1.21 2.82 8.95
Recurrenceinterval(years)
Normalvariate
Side-channel storage required (in demand days) for primary pump relation to meet indicated demand (in fraction of mean annual streamflow)
0.0020 0.0100 0.0200 0.0500 0.1000 0.2000 0.3000
57.00 2.108 188.92 211.85 213.34 222.55 234.58 251.21 337.46
50.00 2.054 184.62 204.26 206.95 216.15 231.08 248.68 324.16
40.00 1.960 177.10 190.99 195.76 204.94 224.96 244.24 300.89
30.00 1.834 166.99 173.15 180.73 189.88 216.73 238.28 269.62
25.00 1.751 156.52 149.82 157.75 183.41 210.34 235.40 260.56
20.00 1.645 141.35 114.50 122.15 176.87 201.75 232.25 254.71
10.00 1.282 124.44 91.85 98.47 122.56 145.39 188.80 215.02
5.00 0.841 101.37 83.17 83.80 105.98 132.63 154.96 179.92
2.04 0.022 83.43 53.37 51.47 62.77 77.85 97.44 120.04
Hydrologic Design Tables 83

03111548 Wheeling Creek below Blaine, Ohio
Location: Latitude 40°04′01″, longitude 80°48′31″, Belmont County, Hydrologic Unit 05030106
Drainage area, in square miles: 97.7
Station used for record extension: 03115000
Time period of systematic or extended record analyzed: 1941-10-01 to 1997-09-30
Percentage of estimated values in extended record: 75.3
Eighty-percent-duration streamflow, in cubic feet per second: 36.
Mean annual streamflow, in inches: 15.69
Location of station used for precipitation data: Cadiz, Ohio
Location of station used for potential evapotranspiration data: Pittsburgh, Pennsylvania
[–, indicates a value that could not be determined because there were too few average low-flow values less than the mean stream-flow for the indicated duration]
Recurrenceinterval(years)
Extreme-value
variate
Minimum runoff (in inches) for indicated duration (in days)
180 360 540 720 1080 1440 1800
57.00 4.03 0.82 5.21 9.06 15.08 28.94 41.41 55.97
50.00 3.90 0.87 5.57 9.50 15.85 29.13 41.60 56.64
40.00 3.68 0.95 6.19 10.24 17.17 29.44 41.94 57.77
30.00 3.38 1.05 7.00 11.21 18.88 29.86 42.36 59.24
25.00 3.20 1.20 7.15 11.47 19.31 30.77 43.56 60.12
20.00 2.97 1.43 7.16 11.62 19.54 32.20 45.49 61.17
10.00 2.25 1.66 7.94 12.69 21.13 36.45 50.89 64.53
5.18 1.54 1.93 9.65 14.73 25.58 43.63 73.66 –
84 Hydrologic Considerations for Estimation of Storage-Capacity Requirements of Impounding and Side-Channel Reservoirs for Water Supply in Ohio

03111548 Wheeling Creek below Blaine, Ohio—Continued
Recurrenceinterval(years)
Impounding reservoir storage required (in inches) and critical-drawdown duration (in days; shown in gray) for indicated draft rate (in fraction of the mean annual streamflow)
0.02 0.05 0.10 0.15 0.20 0.25 0.30 0.35 0.40 0.45 0.50 0.60 0.70 0.80 0.90 1.00
5 0.00 0.00 0.02 0.08 0.19 0.35 0.61 0.87 1.20 1.57 1.96 2.86 3.80 4.83 6.28 8.85 0 0 30 30 60 120 120 150 150 180 210 210 240 240 600 600
6 0.00 0.00 0.02 0.08 0.20 0.36 0.62 0.91 1.24 1.63 2.01 2.91 3.93 4.96 7.31 9.89 0 0 30 30 60 90 120 150 180 180 180 210 240 240 600 600
8 0.00 0.00 0.02 0.09 0.22 0.40 0.66 0.99 1.34 1.72 2.14 3.13 4.16 5.82 8.40 10.98 0 0 30 60 60 120 150 150 180 180 210 240 240 600 600 600
10 0.00 0.00 0.03 0.11 0.24 0.45 0.74 1.06 1.43 1.83 2.29 3.32 4.38 6.36 8.94 14.08 0 0 30 60 60 120 150 150 180 210 240 240 270 600 600 1680
15 0.00 0.00 0.04 0.14 0.31 0.56 0.88 1.22 1.68 2.13 2.65 3.68 4.78 6.98 12.97 20.19 0 0 30 60 120 120 150 210 210 240 240 240 270 600 1680 1680
20 0.00 0.00 0.05 0.16 0.38 0.67 0.99 1.43 1.88 2.37 2.89 3.92 5.01 7.29 12.97 20.19 0 0 30 60 120 150 150 210 210 240 240 240 300 600 1680 1680
25 0.00 0.00 0.05 0.18 0.44 0.75 1.12 1.57 2.03 2.55 3.06 4.10 5.16 8.15 13.05 20.19 0 0 30 120 120 150 210 210 240 240 240 240 300 960 1380 1680
30 0.00 0.00 0.06 0.22 0.48 0.81 1.23 1.68 2.17 2.69 3.20 4.23 5.26 8.88 13.59 20.19 0 0 30 120 150 150 210 210 240 240 240 240 240 960 1380 1680
40 0.00 0.00 0.06 0.27 0.57 0.95 1.37 1.85 2.37 2.88 3.40 4.43 5.91 9.93 14.80 20.59 0 0 30 120 150 180 210 240 240 240 240 240 540 960 1320 1380
50 0.00 0.00 0.06 0.31 0.68 1.06 1.47 1.99 2.50 3.02 3.54 5.01 7.08 10.70 16.13 21.89 0 0 30 150 180 180 240 240 240 240 240 480 480 960 1320 1380
60 0.00 0.00 0.06 0.38 0.77 1.16 1.58 2.09 2.61 3.12 4.12 6.18 8.36 11.97 17.53 23.71 0 0 30 180 180 180 240 240 240 240 480 480 840 840 1320 1740
70 0.00 0.00 0.07 0.46 0.84 1.23 1.65 2.17 3.08 4.11 5.14 7.20 9.93 13.54 20.45 27.92 0 0 150 180 180 180 240 240 480 480 480 480 840 840 1740 1740
80 0.00 0.00 0.13 0.52 0.91 1.29 1.89 2.92 3.95 4.98 6.01 8.07 11.39 17.48 24.96 32.44 0 0 180 180 180 180 480 480 480 480 480 480 840 1740 1740 1740
90 0.00 0.00 0.18 0.57 0.96 1.58 2.62 3.65 4.68 5.71 6.74 9.12 14.51 21.98 29.46 36.94 0 0 180 180 180 480 480 480 480 480 480 840 1740 1740 1740 1740
100 0.00 0.00 0.23 0.62 1.16 2.19 3.22 4.25 5.28 6.31 7.35 11.33 18.81 26.29 33.76 41.24 0 0 180 180 480 480 480 480 480 480 480 1740 1740 1740 1740 1740
Hydrologic Design Tables 85

03111548 Wheeling Creek below Blaine, Ohio—Continued
Pumpset
Ratio of storage required for pump set to storage required for the primary pump relation (pump set 1) for indicated demand (in fraction of mean
annual streamflow)
0.002 0.010 0.020 0.050 0.100 0.200 0.300
1 1.00 1.00 1.00 1.00 1.00 1.00 1.00
2 5.70 2.76 2.38 2.22 2.28 5.40 6.61
3 1.12 1.11 1.09 1.08 1.03 1.40 1.37
4 1.07 1.06 1.03 1.02 1.00 1.12 1.06
5 1.05 1.04 1.01 1.00 1.00 1.03 1.02
6 1.02 1.02 1.00 1.00 1.00 1.01 1.00
7 5.70 2.91 2.52 2.44 4.36 11.31 12.61
8 1.13 1.12 1.12 1.11 1.45 2.18 5.43
9 1.13 1.12 1.13 1.13 1.63 2.91 7.92
10 1.08 1.08 1.09 1.14 1.56 2.68 8.46
11 1.09 1.08 1.07 1.12 1.62 2.87 9.62
12 1.20 1.17 1.14 1.17 1.57 2.57 6.44
13 1.10 1.08 1.06 1.10 1.26 1.91 4.57
14 1.08 1.06 1.06 1.11 1.25 2.09 5.62
15 1.06 1.07 1.05 1.12 1.29 2.63 7.46
16 1.03 1.05 1.06 1.14 1.37 2.87 9.64
17 1.09 1.07 1.05 1.09 1.08 1.80 2.34
18 1.07 1.04 1.04 1.09 1.13 1.89 3.98
19 1.04 1.05 1.04 1.12 1.19 2.47 6.18
20 1.00 1.03 1.06 1.14 1.26 2.73 8.59
Recurrenceinterval(years)
Normalvariate
Side-channel storage required (in demand days) for primary pump relation to meet indicated demand (in fraction of mean annual streamflow)
0.0020 0.0100 0.0200 0.0500 0.1000 0.2000 0.3000
57.00 2.108 235.40 229.11 226.98 229.88 246.97 273.52 383.81
50.00 2.054 234.20 221.02 219.45 227.56 245.38 270.94 364.17
40.00 1.960 232.11 206.87 206.27 223.49 242.61 266.42 329.80
30.00 1.834 229.29 187.85 188.55 218.02 238.88 260.34 283.60
25.00 1.751 209.49 169.77 179.95 210.16 233.00 257.58 271.96
20.00 1.645 175.53 144.07 170.53 198.07 223.83 254.68 266.38
10.00 1.282 154.35 116.96 122.48 141.18 160.16 206.35 226.71
5.00 0.841 130.88 89.34 96.49 125.30 148.44 173.87 195.56
2.04 0.022 99.74 60.27 59.88 80.30 90.03 116.83 141.85
86 Hydrologic Considerations for Estimation of Storage-Capacity Requirements of Impounding and Side-Channel Reservoirs for Water Supply in Ohio

03114000 Captina Creek at Armstrongs Mills, Ohio
Location: Latitude 39°54′31″, longitude 80°55′27″, Belmont County, Hydrologic Unit 05030106
Drainage area, in square miles: 134.
Station used for record extension: 03111500
Time period of systematic or extended record analyzed: 1941-10-01 to 1997-09-30
Percentage of estimated values in extended record: 30.4
Eighty-percent-duration streamflow, in cubic feet per second: 13.
Mean annual streamflow, in inches: 17.03
Location of station used for precipitation data: McConnelsville, Ohio
Location of station used for potential evapotranspiration data: Pittsburgh, Pennsylvania
[–, indicates a value that could not be determined because there were too few average low-flow values less than the mean streamflow for the indicated duration]
Recurrenceinterval(years)
Extreme-value
variate
Minimum runoff (in inches) for indicated duration (in days)
180 360 540 720 1080 1440 1800
57.00 4.03 0.08 3.63 6.77 12.82 27.28 39.89 58.65
50.00 3.90 0.11 4.15 7.31 13.89 28.74 40.65 59.44
40.00 3.68 0.16 5.04 8.22 15.71 31.24 41.95 60.80
30.00 3.38 0.22 6.19 9.41 18.07 34.47 43.64 62.55
25.00 3.20 0.28 6.49 10.17 18.73 35.18 44.74 63.79
20.00 2.97 0.37 6.64 11.12 19.14 35.40 46.10 65.39
10.00 2.25 0.52 7.27 12.46 21.24 37.94 58.33 75.97
5.18 1.54 0.73 9.98 14.55 27.39 48.39 75.20 –
Hydrologic Design Tables 87

03114000 Captina Creek at Armstrongs Mills, Ohio—Continued
Recurrenceinterval(years)
Impounding reservoir storage required (in inches) and critical-drawdown duration (in days; shown in gray) for indicated draft rate (in fraction of the mean annual streamflow)
0.02 0.05 0.10 0.15 0.20 0.25 0.30 0.35 0.40 0.45 0.50 0.60 0.70 0.80 0.90 1.00
5 0.02 0.10 0.33 0.61 0.94 1.36 1.78 2.20 2.62 3.06 3.55 4.53 5.59 6.71 7.83 10.32 60 60 120 120 180 180 180 180 180 210 210 210 240 240 240 540
6 0.03 0.11 0.36 0.68 1.03 1.44 1.86 2.28 2.70 3.17 3.68 4.80 5.92 7.04 8.54 11.06 60 60 120 150 150 180 180 180 180 210 240 240 240 240 540 540
8 0.03 0.12 0.41 0.76 1.12 1.54 1.96 2.37 2.83 3.38 3.94 5.06 6.18 7.30 9.95 12.75 60 90 150 150 180 180 180 180 210 240 240 240 240 240 600 600
10 0.04 0.14 0.45 0.80 1.17 1.59 2.01 2.44 2.93 3.49 4.05 5.16 6.28 8.12 10.92 14.37 60 120 150 150 180 180 180 210 210 240 240 240 240 600 600 960
15 0.04 0.18 0.49 0.84 1.26 1.68 2.12 2.61 3.10 3.61 4.17 5.32 6.59 9.39 14.37 22.20 60 120 150 150 180 180 210 210 210 240 240 270 600 600 1680 1680
20 0.05 0.19 0.52 0.91 1.33 1.75 2.24 2.73 3.22 3.73 4.29 5.53 7.32 10.12 16.72 24.55 60 120 150 180 180 210 210 210 210 240 240 270 600 600 1680 1680
25 0.05 0.21 0.55 0.97 1.39 1.85 2.34 2.83 3.32 3.88 4.44 5.70 7.87 10.73 17.43 25.26 90 120 180 180 180 210 210 210 240 240 270 270 600 660 1680 1680
30 0.06 0.22 0.60 1.02 1.44 1.93 2.42 2.91 3.47 4.03 4.59 5.84 8.34 12.29 18.72 25.41 90 120 180 180 180 210 210 240 240 240 240 270 600 1380 1380 1680
40 0.06 0.26 0.68 1.10 1.56 2.08 2.64 3.20 3.76 4.32 4.88 6.84 9.29 14.79 21.22 27.66 120 180 180 180 210 240 240 240 240 240 240 480 540 1380 1380 1380
50 0.07 0.32 0.73 1.19 1.75 2.31 2.87 3.43 3.99 4.98 6.10 8.34 11.11 16.65 23.09 29.52 120 180 180 240 240 240 240 240 240 480 480 480 900 1380 1380 1380
60 0.10 0.35 0.79 1.35 1.91 2.47 3.03 3.93 5.05 6.17 7.29 9.91 14.03 18.77 24.92 31.08 180 180 240 240 240 240 240 480 480 480 480 840 900 1320 1320 1320
70 0.12 0.37 0.90 1.46 2.02 2.61 3.73 4.85 5.97 7.09 8.46 12.40 16.60 21.12 27.28 33.43 180 180 240 240 240 480 480 480 480 480 840 900 900 1320 1320 1320
80 0.14 0.41 0.97 1.53 2.20 3.32 4.44 5.56 6.85 8.67 10.52 14.61 18.80 23.34 29.50 35.65 180 240 240 240 480 480 480 480 780 780 840 900 900 1320 1320 1320
90 0.15 0.46 1.02 1.61 2.73 3.85 4.97 6.67 8.49 10.31 12.26 16.45 20.65 25.41 31.57 37.72 180 240 240 480 480 480 480 780 780 780 900 900 900 1320 1320 1320
100 0.16 0.50 1.06 2.02 3.14 4.33 6.15 7.97 9.78 11.69 13.79 17.99 22.18 27.32 33.48 39.63 240 240 240 480 480 780 780 780 780 900 900 900 900 1320 1320 1320
88 Hydrologic Considerations for Estimation of Storage-Capacity Requirements of Impounding and Side-Channel Reservoirs for Water Supply in Ohio

03114000 Captina Creek at Armstrongs Mills, Ohio—Continued
Pumpset
Ratio of storage required for pump set to storage required for the primary pump relation (pump set 1) for indicated demand (in fraction of mean
annual streamflow)
0.002 0.010 0.020 0.050 0.100 0.200 0.300
1 1.00 1.00 1.00 1.00 1.00 1.00 1.00
2 1.35 1.28 1.29 1.34 1.59 1.98 3.55
3 1.13 1.10 1.09 1.08 1.03 1.18 1.28
4 1.03 1.07 1.04 1.00 1.01 1.00 1.09
5 1.02 1.04 1.02 1.00 1.00 1.00 1.02
6 1.01 1.02 1.00 1.00 1.00 1.00 1.01
7 1.35 1.32 1.33 1.55 1.92 4.88 8.36
8 1.14 1.14 1.13 1.12 1.07 1.58 2.28
9 1.13 1.14 1.12 1.12 1.23 1.92 3.29
10 1.12 1.12 1.10 1.12 1.07 1.74 2.80
11 1.08 1.11 1.09 1.11 1.12 1.83 2.81
12 1.19 1.18 1.16 1.13 1.21 1.89 2.62
13 1.08 1.11 1.08 1.08 1.07 1.58 2.12
14 1.07 1.10 1.09 1.09 1.07 1.59 2.41
15 1.03 1.09 1.08 1.07 1.12 1.57 2.61
16 1.06 1.09 1.06 1.10 1.15 1.96 2.74
17 1.04 1.11 1.07 1.06 1.05 1.45 1.88
18 1.03 1.09 1.06 1.06 1.07 1.49 2.30
19 1.02 1.08 1.05 1.05 1.12 1.51 2.50
20 1.04 1.06 1.07 1.10 1.15 1.79 2.63
Recurrenceinterval(years)
Normalvariate
Side-channel storage required (in demand days) for primary pump relation to meet indicated demand (in fraction of mean annual streamflow)
0.0020 0.0100 0.0200 0.0500 0.1000 0.2000 0.3000
57.00 2.108 214.81 217.45 218.04 224.07 238.27 251.07 284.95
50.00 2.054 211.50 208.74 210.14 215.78 230.29 242.81 279.97
40.00 1.960 205.71 193.50 196.32 201.28 216.32 228.37 271.27
30.00 1.834 197.93 173.02 177.74 181.79 197.54 208.95 259.57
25.00 1.751 188.91 160.29 168.49 176.94 191.07 203.22 246.16
20.00 1.645 175.54 144.49 158.21 174.72 185.74 199.40 226.34
10.00 1.282 146.03 115.27 119.81 138.47 152.41 179.08 197.34
5.00 0.841 126.61 84.95 88.32 114.12 132.32 156.40 177.33
2.04 0.022 95.00 57.05 62.39 71.28 84.80 104.95 133.00
Hydrologic Design Tables 89
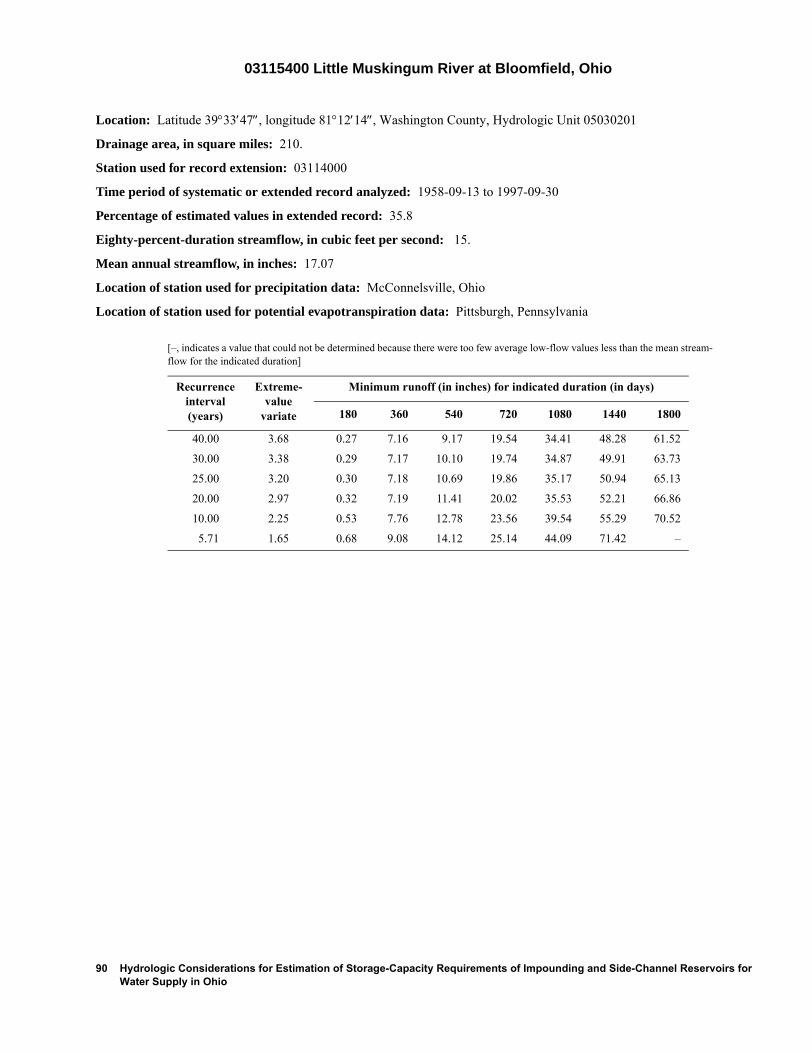
03115400 Little Muskingum River at Bloomfield, Ohio
Location: Latitude 39°33′47″, longitude 81°12′14″, Washington County, Hydrologic Unit 05030201
Drainage area, in square miles: 210.
Station used for record extension: 03114000
Time period of systematic or extended record analyzed: 1958-09-13 to 1997-09-30
Percentage of estimated values in extended record: 35.8
Eighty-percent-duration streamflow, in cubic feet per second: 15.
Mean annual streamflow, in inches: 17.07
Location of station used for precipitation data: McConnelsville, Ohio
Location of station used for potential evapotranspiration data: Pittsburgh, Pennsylvania
[–, indicates a value that could not be determined because there were too few average low-flow values less than the mean stream-flow for the indicated duration]
Recurrenceinterval(years)
Extreme-value
variate
Minimum runoff (in inches) for indicated duration (in days)
180 360 540 720 1080 1440 1800
40.00 3.68 0.27 7.16 9.17 19.54 34.41 48.28 61.52
30.00 3.38 0.29 7.17 10.10 19.74 34.87 49.91 63.73
25.00 3.20 0.30 7.18 10.69 19.86 35.17 50.94 65.13
20.00 2.97 0.32 7.19 11.41 20.02 35.53 52.21 66.86
10.00 2.25 0.53 7.76 12.78 23.56 39.54 55.29 70.52
5.71 1.65 0.68 9.08 14.12 25.14 44.09 71.42 –
90 Hydrologic Considerations for Estimation of Storage-Capacity Requirements of Impounding and Side-Channel Reservoirs for Water Supply in Ohio

03115400 Little Muskingum River at Bloomfield, Ohio—Continued
Recurrenceinterval(years)
Impounding reservoir storage required (in inches) and critical-drawdown duration (in days; shown in gray) for indicated draft rate (in fraction of the mean annual streamflow)
0.02 0.05 0.10 0.15 0.20 0.25 0.30 0.35 0.40 0.45 0.50 0.60 0.70 0.80 0.90 1.00
5 0.02 0.14 0.35 0.69 1.04 1.41 1.83 2.25 2.67 3.09 3.53 4.66 5.78 6.90 8.02 10.21 30 90 90 150 150 180 180 180 180 180 240 240 240 240 240 540
6 0.03 0.14 0.38 0.72 1.07 1.42 1.84 2.26 2.76 3.25 3.74 4.82 5.94 7.06 8.57 11.10 60 90 120 150 150 150 180 210 210 210 210 240 240 240 540 540
8 0.04 0.14 0.43 0.78 1.13 1.51 1.95 2.44 2.94 3.43 3.92 4.98 6.10 7.26 9.57 12.21 60 120 150 150 150 180 210 210 210 210 210 240 240 270 540 600
10 0.04 0.16 0.48 0.83 1.18 1.60 2.02 2.50 2.99 3.48 3.97 5.06 6.19 7.62 10.21 13.82 60 120 150 150 150 180 180 210 210 210 210 240 270 540 600 1320
15 0.05 0.19 0.54 0.90 1.32 1.74 2.16 2.58 3.01 3.50 4.00 5.12 6.35 8.55 11.35 18.59 60 150 150 180 180 180 180 180 210 210 240 240 270 600 600 1680
20 0.05 0.23 0.58 0.97 1.39 1.81 2.23 2.65 3.07 3.50 4.01 5.13 6.53 9.61 13.77 21.63 90 150 150 180 180 180 180 180 180 210 240 240 540 660 1680 1680
25 0.05 0.25 0.60 1.00 1.42 1.84 2.26 2.68 3.10 3.53 4.02 5.14 7.19 10.28 15.19 23.04 90 150 150 180 180 180 180 180 180 210 210 240 660 660 1680 1680
30 0.06 0.27 0.62 1.00 1.43 1.85 2.27 2.69 3.11 3.57 4.06 5.14 7.66 10.51 15.88 23.73 120 150 150 180 180 180 180 180 180 210 210 240 600 660 1680 1680
40 0.07 0.28 0.63 1.00 1.43 1.85 2.27 2.70 3.19 3.69 4.18 5.94 8.66 11.46 16.64 24.78 120 150 150 180 180 180 180 210 210 210 210 540 600 600 1740 1740
50 0.09 0.29 0.64 1.00 1.43 1.85 2.35 2.84 3.33 3.82 4.31 6.78 9.55 12.36 19.11 27.41 120 150 150 180 180 210 210 210 210 210 210 540 600 600 1740 1800
60 0.09 0.30 0.65 1.00 1.49 1.98 2.47 2.96 3.45 3.94 5.00 7.56 10.36 16.07 24.48 32.89 120 150 150 180 210 210 210 210 210 210 540 600 600 1800 1800 1800
70 0.10 0.30 0.65 1.10 1.59 2.08 2.57 3.06 3.55 4.41 5.68 8.29 14.07 21.66 30.08 38.49 120 150 150 210 210 210 210 210 210 540 540 600 1440 1800 1800 1800
80 0.10 0.30 0.69 1.19 1.68 2.17 2.66 3.15 3.76 5.02 6.28 12.00 18.73 27.05 35.46 43.88 120 150 210 210 210 210 210 210 540 540 540 1440 1440 1800 1800 1800
90 0.11 0.31 0.76 1.25 1.74 2.23 2.72 3.22 4.30 6.05 9.42 16.15 23.62 32.04 40.45 48.87 120 150 210 210 210 210 210 210 540 1440 1440 1440 1800 1800 1800 1800
100 0.11 0.32 0.81 1.30 1.79 2.29 2.78 3.52 6.31 9.67 13.04 19.77 28.14 36.56 44.97 53.38 120 210 210 210 210 210 210 540 1440 1440 1440 1440 1800 1800 1800 1800
Hydrologic Design Tables 91

03115400 Little Muskingum River at Bloomfield, Ohio—Continued
Pumpset
Ratio of storage required for pump set to storage required for the primary pump relation (pump set 1) for indicated demand (in fraction of mean
annual streamflow)
0.002 0.010 0.020 0.050 0.100 0.200 0.300
1 1.00 1.00 1.00 1.00 1.00 1.00 1.00
2 1.30 1.10 1.05 1.05 1.10 2.19 3.60
3 1.19 1.05 1.01 1.02 1.00 1.00 1.00
4 1.09 1.02 1.00 1.00 1.00 1.00 1.00
5 1.06 1.00 1.00 1.00 1.00 1.00 1.00
6 1.03 1.00 1.00 1.00 1.00 1.00 1.00
7 1.32 1.11 1.07 1.10 2.10 4.53 7.33
8 1.21 1.07 1.02 1.07 1.12 1.14 1.60
9 1.23 1.07 1.07 1.13 1.15 1.35 2.65
10 1.13 1.06 1.07 1.18 1.20 1.31 1.90
11 1.11 1.07 1.07 1.18 1.22 1.40 2.20
12 1.26 1.07 1.05 1.08 1.10 1.29 2.76
13 1.13 1.06 1.05 1.11 1.15 1.19 1.54
14 1.10 1.04 1.06 1.16 1.21 1.26 1.76
15 1.08 1.06 1.07 1.19 1.22 1.24 2.09
16 1.05 1.12 1.07 1.27 1.27 1.28 2.24
17 1.12 1.03 1.03 1.11 1.15 1.17 1.41
18 1.09 1.05 1.08 1.16 1.20 1.22 1.66
19 1.05 1.06 1.07 1.18 1.22 1.20 2.05
20 1.01 1.12 1.07 1.29 1.26 1.26 2.20
Recurrenceinterval(years)
Normalvariate
Side-channel storage required (in demand days) for primary pump relation to meet indicated demand (in fraction of mean annual streamflow)
0.0020 0.0100 0.0200 0.0500 0.1000 0.2000 0.3000
40.00 1.960 166.03 169.63 172.44 174.41 184.36 199.12 205.53
30.00 1.834 153.75 158.86 166.40 174.27 180.53 190.90 197.64
25.00 1.751 145.64 151.75 162.42 174.18 178.00 185.48 192.43
20.00 1.645 135.33 142.70 157.35 174.06 174.79 178.58 185.80
10.00 1.282 122.55 117.01 122.54 142.69 149.57 172.69 184.99
5.00 0.841 104.15 84.39 93.37 112.04 124.91 153.39 169.44
2.00 0.000 69.33 50.12 55.66 63.25 69.05 89.42 105.44
92 Hydrologic Considerations for Estimation of Storage-Capacity Requirements of Impounding and Side-Channel Reservoirs for Water Supply in Ohio

03117500 Sandy Creek at Waynesburg, Ohio
Location: Latitude 40°40′21″, longitude 81°15′36″, Stark County, Hydrologic Unit 05040001
Drainage area, in square miles: 253.
Station used for record extension: 03119000
Time period of systematic or extended record analyzed: 1923-10-01 to 1997-09-30
Percentage of estimated values in extended record: 20.5
Eighty-percent-duration streamflow, in cubic feet per second: 52.
Mean annual streamflow, in inches: 14.82
Location of station used for precipitation data: Wooster, Ohio
Location of station used for potential evapotranspiration data: Pittsburgh, Pennsylvania
[–, indicates a value that could not be determined because there were too few average low-flow values less than the mean streamflow for the indicated duration]
Recurrenceinterval(years)
Extreme-value
variate
Minimum runoff (in inches) for indicated duration (in days)
180 360 540 720 1080 1440 1800
75.00 4.31 0.58 4.02 7.47 14.76 27.03 37.61 46.87
70.00 4.24 0.58 4.15 7.50 14.78 27.07 37.66 46.87
60.00 4.09 0.60 4.42 7.57 14.83 27.17 37.78 46.87
50.00 3.90 0.61 4.76 7.66 14.88 27.29 37.93 46.88
40.00 3.68 0.63 5.16 7.76 14.95 27.43 38.10 46.88
30.00 3.38 0.77 5.47 8.54 15.73 28.21 39.65 52.95
25.00 3.20 0.89 5.62 9.15 16.35 28.81 40.88 57.93
20.00 2.97 0.92 6.37 9.73 17.57 29.10 42.96 58.09
10.00 2.25 1.03 7.76 11.27 18.86 33.11 48.37 66.36
5.36 1.58 1.35 8.51 14.19 24.53 43.45 77.36 –
Hydrologic Design Tables 93

03117500 Sandy Creek at Waynesburg, Ohio—Continued
Recurrenceinterval(years)
Impounding reservoir storage required (in inches) and critical-drawdown duration (in days; shown in gray) for indicated draft rate (in fraction of the mean annual streamflow)
0.02 0.05 0.10 0.15 0.20 0.25 0.30 0.35 0.40 0.45 0.50 0.60 0.70 0.80 0.90 1.00
5 0.00 0.00 0.02 0.13 0.34 0.62 0.94 1.31 1.67 2.10 2.53 3.38 4.23 5.20 6.42 7.64 0 0 30 90 120 150 180 180 210 210 210 210 210 300 300 300
6 0.00 0.00 0.02 0.15 0.38 0.67 1.01 1.38 1.78 2.21 2.63 3.48 4.41 5.39 6.42 8.84 0 0 30 90 120 150 180 180 210 210 210 210 240 240 300 600
8 0.00 0.00 0.03 0.18 0.43 0.74 1.11 1.49 1.92 2.34 2.77 3.72 4.75 5.84 8.13 10.57 0 0 60 120 150 180 180 210 210 210 210 240 270 270 600 600
10 0.00 0.00 0.04 0.20 0.48 0.80 1.17 1.58 2.01 2.43 2.92 3.94 5.04 6.74 9.17 12.27 0 0 60 120 150 180 180 210 210 210 240 270 270 600 600 960
15 0.00 0.00 0.04 0.24 0.55 0.90 1.30 1.73 2.21 2.70 3.22 4.32 5.73 8.16 11.01 15.88 0 0 60 120 150 180 210 210 240 240 270 270 600 600 960 1740
20 0.00 0.00 0.05 0.29 0.60 0.97 1.39 1.87 2.36 2.86 3.41 4.50 6.47 8.91 12.26 19.32 0 0 60 150 180 210 210 240 240 270 270 270 600 600 1740 1740
25 0.00 0.00 0.05 0.32 0.64 1.03 1.48 1.97 2.45 2.98 3.56 4.78 6.94 9.37 14.22 21.28 0 0 90 150 180 210 240 240 240 270 300 300 600 600 1740 1740
30 0.00 0.00 0.06 0.35 0.68 1.09 1.55 2.04 2.54 3.14 3.75 4.97 7.26 9.70 15.51 22.57 0 0 120 150 180 210 240 240 300 300 300 300 600 600 1740 1740
40 0.00 0.00 0.09 0.39 0.75 1.18 1.64 2.15 2.75 3.36 3.97 5.25 7.68 10.13 17.19 24.24 0 0 120 150 210 210 240 300 300 300 300 600 600 1740 1740 1740
50 0.00 0.00 0.12 0.44 0.82 1.25 1.71 2.24 2.85 3.46 4.06 5.52 7.95 11.28 18.33 25.39 0 0 150 180 210 210 240 300 300 300 300 600 600 1740 1740 1740
60 0.00 0.00 0.15 0.48 0.88 1.31 1.75 2.26 2.87 3.48 4.08 5.71 8.14 12.20 19.26 26.32 0 0 150 180 210 210 240 300 300 300 300 600 600 1740 1740 1740
70 0.00 0.00 0.18 0.52 0.93 1.36 1.79 2.27 2.87 3.48 4.08 5.85 8.29 13.02 20.08 27.14 0 0 150 180 210 210 210 240 300 300 300 600 600 1740 1740 1740
80 0.00 0.00 0.20 0.55 0.98 1.40 1.83 2.29 2.87 3.48 4.08 5.96 8.40 13.78 20.84 27.89 0 30 150 180 210 210 210 240 300 300 300 600 600 1740 1740 1740
90 0.00 0.01 0.22 0.59 1.02 1.44 1.87 2.33 2.88 3.48 4.08 6.05 8.49 14.50 21.56 28.62 0 60 150 210 210 210 210 270 270 300 300 600 600 1740 1740 1740
100 0.00 0.02 0.24 0.63 1.05 1.48 1.90 2.36 2.91 3.48 4.08 6.13 8.56 15.27 22.26 29.32 0 60 180 210 210 210 210 270 270 300 300 600 600 1680 1740 1740
94 Hydrologic Considerations for Estimation of Storage-Capacity Requirements of Impounding and Side-Channel Reservoirs for Water Supply in Ohio

03117500 Sandy Creek at Waynesburg, Ohio—Continued
Pumpset
Ratio of storage required for pump set to storage required for the primary pump relation (pump set 1) for indicated demand (in fraction of mean
annual streamflow)
0.002 0.010 0.020 0.050 0.100 0.200 0.300
1 1.00 1.00 1.00 1.00 1.00 1.00 1.00
2 1.34 1.17 1.25 1.50 1.90 3.22 7.43
3 1.04 1.01 1.01 1.00 1.01 1.26 1.48
4 1.00 1.00 1.00 1.00 1.00 1.00 1.04
5 1.00 1.00 1.00 1.00 1.00 1.00 1.00
6 1.00 1.00 1.00 1.00 1.00 1.00 1.00
7 1.35 1.21 1.36 1.83 3.06 10.77 20.18
8 1.04 1.02 1.03 1.02 1.26 1.70 2.99
9 1.05 1.03 1.03 1.05 1.43 1.89 4.09
10 1.03 1.03 1.03 1.07 1.16 1.64 3.73
11 1.01 1.05 1.06 1.11 1.19 1.59 3.90
12 1.06 1.01 1.02 1.04 1.51 2.07 3.97
13 1.02 1.02 1.03 1.04 1.13 1.47 1.99
14 1.00 1.03 1.03 1.05 1.16 1.32 2.31
15 1.01 1.04 1.05 1.10 1.19 1.46 2.67
16 1.02 1.05 1.05 1.09 1.23 1.63 3.57
17 1.00 1.03 1.03 1.04 1.12 1.24 1.61
18 1.00 1.03 1.04 1.04 1.15 1.27 1.79
19 1.01 1.03 1.04 1.08 1.19 1.41 2.23
20 1.02 1.05 1.03 1.11 1.22 1.59 3.20
Hydrologic Design Tables 95

03117500 Sandy Creek at Waynesburg, Ohio—Continued
Recurrenceinterval(years)
Normalvariate
Side-channel storage required (in demand days) for primary pump relation to meet indicated demand (in fraction of mean annual streamflow)
0.0020 0.0100 0.0200 0.0500 0.1000 0.2000 0.3000
75.00 2.217 279.68 260.85 250.94 241.69 243.05 259.45 272.86
70.00 2.190 275.70 257.04 247.64 240.14 242.49 258.26 272.85
60.00 2.128 266.68 248.39 240.14 236.63 241.23 255.56 272.84
50.00 2.054 255.75 237.91 231.05 232.38 239.69 252.28 272.83
40.00 1.960 241.94 224.67 219.58 227.01 237.75 248.15 272.81
30.00 1.834 235.87 219.72 211.91 212.09 230.55 245.23 265.93
25.00 1.751 234.20 218.84 208.30 200.81 224.93 243.80 260.12
20.00 1.645 229.27 201.65 194.39 197.47 212.85 240.95 259.67
10.00 1.282 182.93 178.61 171.63 169.51 189.27 221.29 231.54
5.00 0.841 144.99 121.57 126.38 144.66 154.24 182.87 192.82
2.03 0.017 101.80 71.20 69.96 73.52 84.86 108.25 122.11
96 Hydrologic Considerations for Estimation of Storage-Capacity Requirements of Impounding and Side-Channel Reservoirs for Water Supply in Ohio

03119000 Sandy Creek at Sandyville, Ohio
Location: Latitude 40°38′04″, longitude 81°22′28″, Tuscarawas County, Hydrologic Unit 05040001
Drainage area, in square miles: 481.
Station used for record extension: 03117500
Time period of systematic or extended record analyzed: 1923-10-01 to 1997-09-30
Percentage of estimated values in extended record: 67.6
Eighty-percent-duration streamflow, in cubic feet per second: 120.
Mean annual streamflow, in inches: 14.89
Location of station used for precipitation data: Wooster, Ohio
Location of station used for potential evapotranspiration data: Pittsburgh, Pennsylvania
[–, indicates a value that could not be determined because there were too few average low-flow values less than the mean streamflow for the indicated duration]
Recurrenceinterval(years)
Extreme-value
variate
Minimum runoff (in inches) for indicated duration (in days)
180 360 540 720 1080 1440 1800
75.00 4.31 0.99 4.61 8.12 14.79 26.43 37.09 45.59
70.00 4.24 1.01 4.75 8.15 14.96 26.74 37.44 46.09
60.00 4.09 1.06 5.06 8.23 15.36 27.44 38.22 47.20
50.00 3.90 1.11 5.43 8.31 15.82 28.26 39.14 48.52
40.00 3.68 1.18 5.88 8.42 16.39 29.27 40.27 50.14
30.00 3.38 1.29 6.22 9.58 17.39 30.63 41.98 54.38
25.00 3.20 1.37 6.39 10.51 18.07 31.50 43.11 57.47
20.00 2.97 1.43 7.11 10.74 18.42 31.63 43.51 60.90
10.00 2.25 1.58 8.37 12.47 19.86 35.32 52.82 69.24
5.36 1.58 1.81 9.31 15.20 25.79 42.78 66.07 –
Hydrologic Design Tables 97

03119000 Sandy Creek at Sandyville, Ohio—Continued
Recurrenceinterval(years)
Impounding reservoir storage required (in inches) and critical-drawdown duration (in days; shown in gray) for indicated draft rate (in fraction of the mean annual streamflow)
0.02 0.05 0.10 0.15 0.20 0.25 0.30 0.35 0.40 0.45 0.50 0.60 0.70 0.80 0.90 1.00
5 0.00 0.00 0.00 0.01 0.07 0.23 0.47 0.73 1.10 1.46 1.89 2.74 3.61 4.59 5.59 7.19 0 0 0 30 30 90 120 180 180 180 210 210 240 240 300 600
6 0.00 0.00 0.00 0.01 0.08 0.28 0.52 0.82 1.19 1.57 2.00 2.85 3.74 4.72 5.70 8.04 0 0 0 30 60 120 120 180 180 210 210 210 240 240 300 600
8 0.00 0.00 0.00 0.01 0.12 0.33 0.60 0.93 1.30 1.71 2.14 2.99 4.00 5.10 6.87 9.58 0 0 0 30 90 120 150 180 180 210 210 210 270 270 600 900
10 0.00 0.00 0.00 0.01 0.13 0.36 0.65 1.00 1.37 1.80 2.23 3.19 4.29 5.39 7.83 11.49 0 0 0 30 90 120 150 180 210 210 210 270 270 270 900 900
15 0.00 0.00 0.00 0.02 0.15 0.42 0.73 1.10 1.53 2.01 2.50 3.57 4.67 6.81 9.87 13.54 0 0 0 30 120 150 180 210 210 240 240 270 270 600 900 900
20 0.00 0.00 0.00 0.03 0.17 0.46 0.80 1.22 1.71 2.20 2.69 3.76 5.27 7.71 10.62 16.65 0 0 0 30 120 150 180 240 240 240 240 270 600 600 900 1740
25 0.00 0.00 0.00 0.03 0.19 0.50 0.85 1.34 1.83 2.32 2.81 3.94 5.88 8.33 12.00 18.68 0 0 0 30 120 150 240 240 240 240 240 300 600 600 1320 1740
30 0.00 0.00 0.00 0.04 0.23 0.53 0.94 1.43 1.92 2.40 2.91 4.13 6.33 8.78 13.09 20.18 0 0 0 30 150 150 240 240 240 240 300 300 600 600 1740 1740
40 0.00 0.00 0.00 0.05 0.29 0.62 1.04 1.53 2.02 2.53 3.14 4.50 6.94 9.39 15.42 22.51 0 0 0 30 150 180 240 240 240 300 300 600 600 600 1740 1740
50 0.00 0.00 0.00 0.06 0.35 0.69 1.12 1.58 2.06 2.64 3.25 4.89 7.33 10.25 17.34 24.43 0 0 0 90 150 180 210 240 240 300 300 600 600 1740 1740 1740
60 0.00 0.00 0.00 0.10 0.40 0.77 1.20 1.62 2.08 2.70 3.31 5.15 7.60 11.98 19.07 26.16 0 0 30 120 150 210 210 210 300 300 300 600 600 1740 1740 1740
70 0.00 0.00 0.01 0.15 0.46 0.84 1.26 1.69 2.12 2.71 3.32 5.34 7.78 13.59 20.68 27.77 0 0 30 150 180 210 210 210 210 300 300 600 600 1740 1740 1740
80 0.00 0.00 0.02 0.20 0.52 0.90 1.33 1.75 2.18 2.71 3.32 5.47 8.02 15.11 22.20 29.29 0 0 30 150 180 210 210 210 210 300 300 600 1740 1740 1740 1740
90 0.00 0.00 0.04 0.24 0.57 0.95 1.38 1.81 2.24 2.73 3.32 5.57 9.46 16.55 23.65 30.74 0 0 60 150 180 210 210 210 210 270 300 600 1740 1740 1740 1740
100 0.00 0.00 0.06 0.29 0.62 1.00 1.43 1.86 2.29 2.78 3.39 5.63 10.84 17.93 25.02 32.11 0 0 60 150 180 210 210 210 210 270 540 600 1740 1740 1740 1740
98 Hydrologic Considerations for Estimation of Storage-Capacity Requirements of Impounding and Side-Channel Reservoirs for Water Supply in Ohio
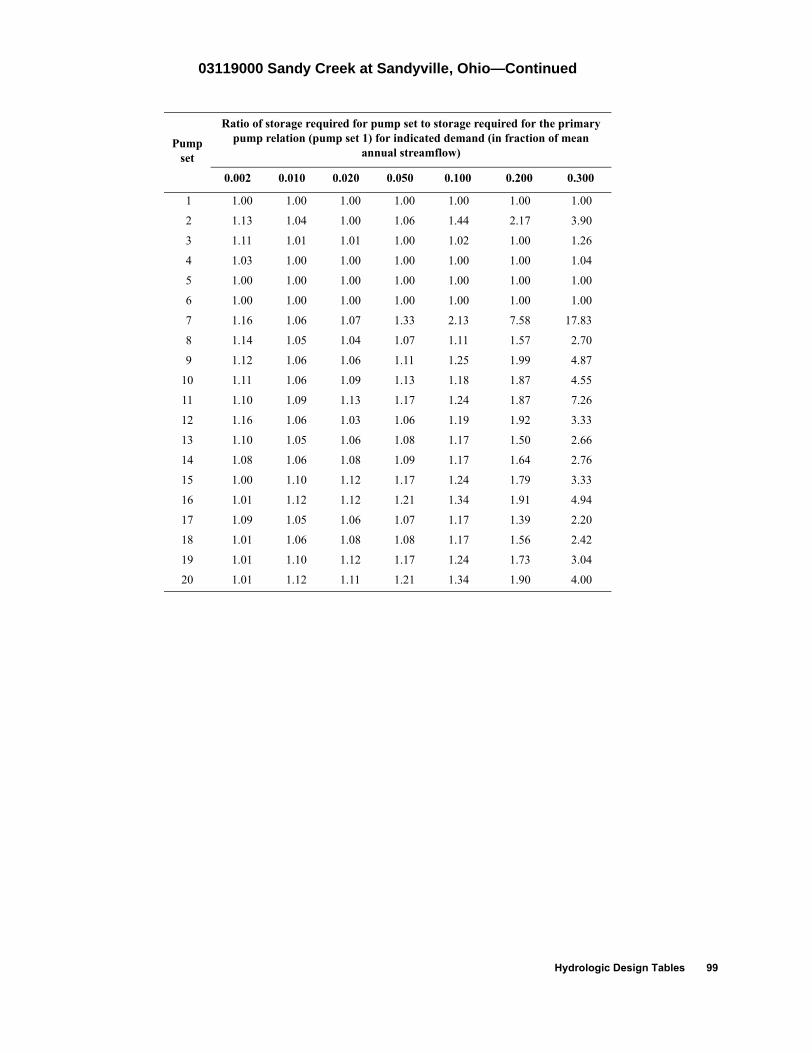
03119000 Sandy Creek at Sandyville, Ohio—Continued
Pumpset
Ratio of storage required for pump set to storage required for the primary pump relation (pump set 1) for indicated demand (in fraction of mean
annual streamflow)
0.002 0.010 0.020 0.050 0.100 0.200 0.300
1 1.00 1.00 1.00 1.00 1.00 1.00 1.00
2 1.13 1.04 1.00 1.06 1.44 2.17 3.90
3 1.11 1.01 1.01 1.00 1.02 1.00 1.26
4 1.03 1.00 1.00 1.00 1.00 1.00 1.04
5 1.00 1.00 1.00 1.00 1.00 1.00 1.00
6 1.00 1.00 1.00 1.00 1.00 1.00 1.00
7 1.16 1.06 1.07 1.33 2.13 7.58 17.83
8 1.14 1.05 1.04 1.07 1.11 1.57 2.70
9 1.12 1.06 1.06 1.11 1.25 1.99 4.87
10 1.11 1.06 1.09 1.13 1.18 1.87 4.55
11 1.10 1.09 1.13 1.17 1.24 1.87 7.26
12 1.16 1.06 1.03 1.06 1.19 1.92 3.33
13 1.10 1.05 1.06 1.08 1.17 1.50 2.66
14 1.08 1.06 1.08 1.09 1.17 1.64 2.76
15 1.00 1.10 1.12 1.17 1.24 1.79 3.33
16 1.01 1.12 1.12 1.21 1.34 1.91 4.94
17 1.09 1.05 1.06 1.07 1.17 1.39 2.20
18 1.01 1.06 1.08 1.08 1.17 1.56 2.42
19 1.01 1.10 1.12 1.17 1.24 1.73 3.04
20 1.01 1.12 1.11 1.21 1.34 1.90 4.00
Hydrologic Design Tables 99

03119000 Sandy Creek at Sandyville, Ohio—Continued
Recurrenceinterval(years)
Normalvariate
Side-channel storage required (in demand days) for primary pump relation to meet indicated demand (in fraction of mean annual streamflow)
0.0020 0.0100 0.0200 0.0500 0.1000 0.2000 0.3000
75.00 2.217 233.01 230.24 231.67 231.02 238.90 260.90 280.72
70.00 2.190 230.61 228.09 229.59 230.32 238.39 258.90 279.95
60.00 2.128 225.15 223.21 224.88 228.73 237.24 254.37 278.21
50.00 2.054 218.54 217.30 219.17 226.81 235.84 248.87 276.10
40.00 1.960 210.19 209.84 211.96 224.38 234.08 241.94 273.43
30.00 1.834 194.13 207.10 203.66 206.47 220.74 239.61 266.25
25.00 1.751 182.62 206.65 198.44 191.91 209.89 239.38 260.83
20.00 1.645 181.64 172.60 171.72 185.24 194.28 237.36 254.64
10.00 1.282 150.60 146.14 149.09 155.31 170.06 207.90 234.12
5.00 0.841 101.34 84.33 98.86 110.80 132.71 162.09 187.91
2.03 0.017 72.23 51.58 51.49 57.74 65.63 84.58 100.02
100 Hydrologic Considerations for Estimation of Storage-Capacity Requirements of Impounding and Side-Channel Reservoirs for Water Supply in Ohio

03125000 Home Creek near New Philadelphia, Ohio
Location: Latitude 40°28′06″, longitude 81°24′10″, Tuscarawas County, Hydrologic Unit 05040001
Drainage area, in square miles: 1.64
Station used for record extension: None
Time period of systematic or extended record analyzed: 1936-12-12 to 1979-12-10
Eighty-percent-duration streamflow, in cubic feet per second: 0.1
Mean annual streamflow, in inches: 10.64
Location of station used for precipitation data: Cadiz, Ohio
Location of station used for potential evapotranspiration data: Pittsburgh, Pennsylvania
[–, indicates a value that could not be determined because there were too few average low-flow values less than the mean streamflow for the indicated duration]
Recurrenceinterval(years)
Extreme-value
variate
Minimum runoff (in inches) for indicated duration (in days)
180 360 540 720 1080 1440 1800
43.00 3.75 0.06 2.39 3.86 8.73 15.73 22.62 32.75
40.00 3.68 0.07 2.57 4.13 8.87 15.84 22.81 32.87
30.00 3.38 0.10 3.30 5.23 9.44 16.28 23.58 33.35
25.00 3.20 0.11 3.77 5.92 9.81 16.57 24.07 33.66
20.00 2.97 0.13 4.21 6.57 10.35 17.86 25.56 35.11
10.00 2.25 0.16 4.74 8.27 12.48 26.12 35.52 49.01
5.38 1.58 0.25 5.30 9.68 16.47 29.29 46.34 –
Hydrologic Design Tables 101

03125000 Home Creek near New Philadelphia, Ohio—Continued
Recurrenceinterval(years)
Impounding reservoir storage required (in inches) and critical-drawdown duration (in days; shown in gray) for indicated draft rate (in fraction of the mean annual streamflow)
0.02 0.05 0.10 0.15 0.20 0.25 0.30 0.35 0.40 0.45 0.50 0.60 0.70 0.80 0.90 1.00
5 0.02 0.10 0.30 0.52 0.77 1.03 1.29 1.55 1.82 2.16 2.56 3.34 4.13 4.92 5.70 6.49 30 90 150 150 180 180 180 180 180 270 270 270 270 270 270 270
6 0.02 0.10 0.31 0.56 0.83 1.09 1.35 1.64 1.94 2.27 2.62 3.34 4.13 4.92 5.70 6.60 60 90 150 180 180 180 180 210 210 240 240 270 270 270 270 600
8 0.03 0.11 0.35 0.61 0.88 1.18 1.49 1.79 2.10 2.45 2.80 3.50 4.27 5.14 6.49 8.41 60 120 180 180 210 210 210 210 210 240 240 240 300 300 660 660
10 0.03 0.13 0.36 0.63 0.93 1.23 1.54 1.85 2.20 2.55 2.90 3.59 4.46 5.43 7.35 9.27 60 120 180 180 210 210 210 240 240 240 240 240 300 660 660 660
15 0.05 0.16 0.38 0.66 0.97 1.27 1.65 2.04 2.43 2.83 3.22 4.01 4.79 6.23 9.14 13.81 120 120 180 210 210 240 270 270 270 270 270 270 270 660 1380 1680
20 0.06 0.17 0.40 0.68 1.07 1.46 1.86 2.25 2.64 3.04 3.43 4.22 5.00 8.31 12.33 17.39 120 150 180 270 270 270 270 270 270 270 270 270 270 1380 1380 1800
25 0.06 0.18 0.41 0.78 1.17 1.56 1.96 2.35 2.74 3.14 3.53 4.32 6.47 10.32 14.31 19.52 120 150 180 270 270 270 270 270 270 270 270 270 1320 1320 1380 1800
30 0.06 0.18 0.43 0.82 1.21 1.61 2.00 2.39 2.79 3.18 3.57 4.36 7.85 11.70 15.61 20.43 120 150 180 270 270 270 270 270 270 270 270 270 1320 1320 1380 1800
40 0.06 0.19 0.46 0.82 1.22 1.61 2.00 2.40 2.79 3.29 3.99 5.55 9.30 13.15 17.05 21.07 120 180 180 270 270 270 270 270 270 480 480 900 1320 1320 1380 1380
50 0.06 0.22 0.49 0.84 1.22 1.61 2.20 2.90 3.60 4.30 5.00 6.78 9.78 13.63 17.65 21.67 120 180 210 240 270 270 480 480 480 480 480 900 1320 1380 1380 1380
60 0.07 0.23 0.53 0.87 1.48 2.18 2.88 3.58 4.27 4.97 5.67 7.78 10.39 13.82 17.78 21.80 180 180 210 240 480 480 480 480 480 480 480 840 900 1260 1380 1380
70 0.09 0.25 0.67 1.28 1.92 2.62 3.32 4.02 4.72 5.42 6.15 8.60 11.21 14.38 18.05 21.80 180 210 420 420 480 480 480 480 480 480 840 840 900 1260 1260 1380
80 0.09 0.30 0.91 1.52 2.21 2.91 3.61 4.31 5.01 5.71 6.82 9.26 11.88 14.79 18.46 22.13 180 420 420 420 480 480 480 480 480 480 840 900 900 1260 1260 1260
90 0.10 0.44 1.05 1.70 2.40 3.10 3.80 4.50 5.20 6.14 7.36 9.84 12.46 15.09 18.76 22.43 180 420 420 480 480 480 480 480 480 840 840 900 900 1260 1260 1260
100 0.14 0.51 1.13 1.83 2.53 3.23 3.93 4.63 5.38 6.60 7.82 10.34 12.96 15.58 18.98 22.79 420 420 480 480 480 480 480 480 840 840 840 900 900 900 1260 1560
102 Hydrologic Considerations for Estimation of Storage-Capacity Requirements of Impounding and Side-Channel Reservoirs for Water Supply in Ohio

03125000 Home Creek near New Philadelphia, Ohio—Continued
Pumpset
Ratio of storage required for pump set to storage required for the primary pump relation (pump set 1) for indicated demand (in fraction of mean
annual streamflow)
0.002 0.010 0.020 0.050 0.100 0.200 0.300
1 1.00 1.00 1.00 1.00 1.00 1.00 1.00
2 43.88 7.75 5.47 3.98 3.52 4.51 8.13
3 2.27 1.47 1.36 1.24 1.10 1.32 1.51
4 1.17 1.16 1.12 1.10 1.02 1.00 1.11
5 1.10 1.03 1.01 1.04 1.00 1.00 1.06
6 1.04 1.00 1.00 1.00 1.00 1.00 1.03
7 43.87 7.73 5.47 4.40 4.47 12.57 15.07
8 2.26 1.48 1.39 1.26 1.26 2.07 3.04
9 2.29 1.49 1.41 1.33 1.46 2.45 6.06
10 2.02 1.31 1.26 1.22 1.17 2.03 5.31
11 1.17 1.24 1.28 1.24 1.23 2.11 5.59
12 2.84 2.26 1.87 1.61 1.86 2.65 5.05
13 2.04 1.30 1.27 1.24 1.16 1.75 2.29
14 1.15 1.14 1.15 1.13 1.16 1.81 2.38
15 1.10 1.06 1.15 1.19 1.21 1.92 2.81
16 1.06 1.06 1.11 1.26 1.26 1.99 3.14
17 1.17 1.19 1.20 1.17 1.14 1.61 1.87
18 1.10 1.05 1.04 1.10 1.15 1.66 2.08
19 1.04 1.06 1.09 1.16 1.22 1.84 2.49
20 1.00 1.05 1.07 1.23 1.25 1.90 2.86
Recurrenceinterval(years)
Normalvariate
Side-channel storage required (in demand days) for primary pump relation to meet indicated demand (in fraction of mean annual streamflow)
0.0020 0.0100 0.0200 0.0500 0.1000 0.2000 0.3000
43.00 1.991 126.00 183.73 189.50 207.08 238.27 272.02 337.91
40.00 1.960 125.51 181.38 187.56 204.08 234.97 269.73 333.06
30.00 1.834 123.48 171.74 179.63 191.78 221.44 260.35 313.23
25.00 1.751 122.14 165.37 174.39 183.66 212.51 254.16 300.13
20.00 1.645 119.11 159.28 167.69 176.13 203.36 247.21 285.59
10.00 1.282 101.10 144.54 143.73 165.52 194.59 223.31 254.85
5.00 0.841 60.00 98.87 120.66 154.04 170.52 189.47 201.26
2.05 0.029 37.00 63.99 66.70 72.01 81.43 114.17 136.49
Hydrologic Design Tables 103

03130500 Touby Run at Mansfield, Ohio
Location: Latitude 40°45′53″, longitude 82°32′43″, Richland County, Hydrologic Unit 05040002
Drainage area, in square miles: 5.44
Station used for record extension: None
Time period of systematic or extended record analyzed: 1946-10-01 to 1978-09-30
Eighty-percent-duration streamflow, in cubic feet per second: 0.6
Mean annual streamflow, in inches: 12.78
Location of station used for precipitation data: Wooster, Ohio
Location of station used for potential evapotranspiration data: Columbus, Ohio
[–, indicates a value that could not be determined because there were too few average low-flow values less than the mean stream-flow for the indicated duration]
Recurrenceinterval(years)
Extreme-value
variate
Minimum runoff (in inches) for indicated duration (in days)
180 360 540 720 1080 1440 1800
33.00 3.48 0.49 4.55 6.64 11.47 18.84 27.53 39.71
30.00 3.38 0.50 4.72 7.15 11.75 19.81 28.77 40.82
25.00 3.20 0.52 5.05 8.13 12.28 21.68 31.16 42.95
20.00 2.97 0.54 5.45 9.33 12.93 23.98 34.09 45.57
10.00 2.25 0.63 6.46 11.16 16.74 31.66 44.20 60.42
5.50 1.61 1.21 6.91 12.59 21.32 36.77 53.31 –
104 Hydrologic Considerations for Estimation of Storage-Capacity Requirements of Impounding and Side-Channel Reservoirs for Water Supply in Ohio
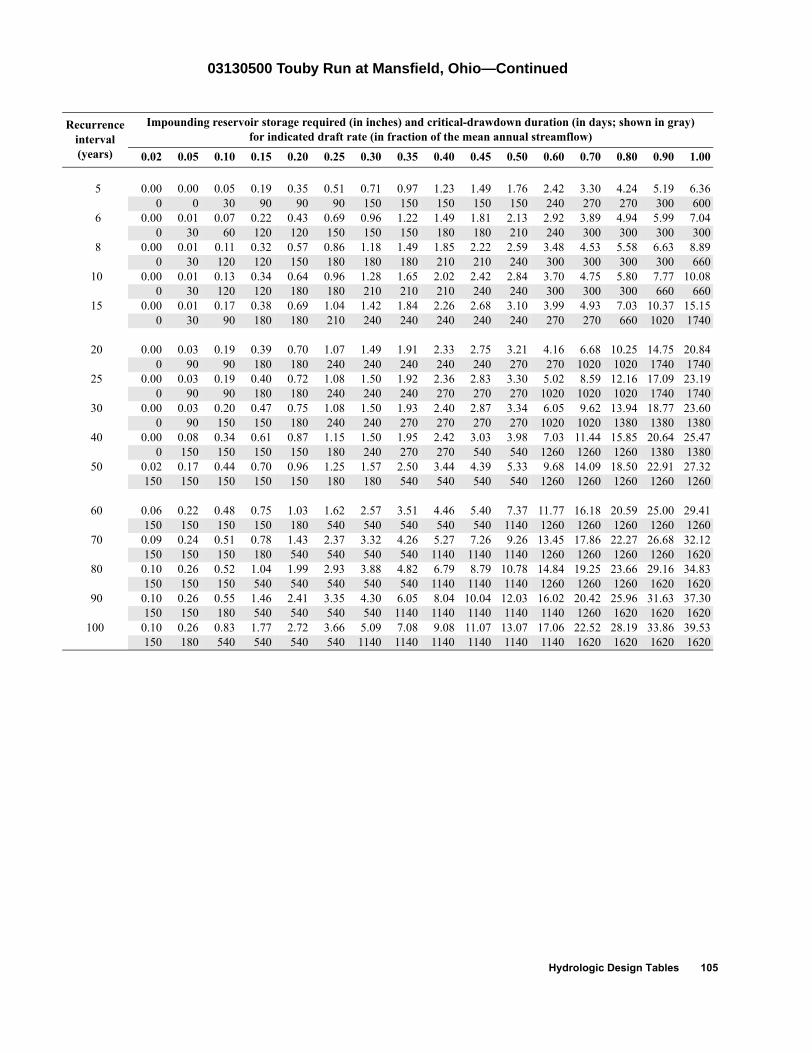
03130500 Touby Run at Mansfield, Ohio—Continued
Recurrenceinterval(years)
Impounding reservoir storage required (in inches) and critical-drawdown duration (in days; shown in gray) for indicated draft rate (in fraction of the mean annual streamflow)
0.02 0.05 0.10 0.15 0.20 0.25 0.30 0.35 0.40 0.45 0.50 0.60 0.70 0.80 0.90 1.00
5 0.00 0.00 0.05 0.19 0.35 0.51 0.71 0.97 1.23 1.49 1.76 2.42 3.30 4.24 5.19 6.36 0 0 30 90 90 90 150 150 150 150 150 240 270 270 300 600
6 0.00 0.01 0.07 0.22 0.43 0.69 0.96 1.22 1.49 1.81 2.13 2.92 3.89 4.94 5.99 7.04 0 30 60 120 120 150 150 150 180 180 210 240 300 300 300 300
8 0.00 0.01 0.11 0.32 0.57 0.86 1.18 1.49 1.85 2.22 2.59 3.48 4.53 5.58 6.63 8.89 0 30 120 120 150 180 180 180 210 210 240 300 300 300 300 660
10 0.00 0.01 0.13 0.34 0.64 0.96 1.28 1.65 2.02 2.42 2.84 3.70 4.75 5.80 7.77 10.08 0 30 120 120 180 180 210 210 210 240 240 300 300 300 660 660
15 0.00 0.01 0.17 0.38 0.69 1.04 1.42 1.84 2.26 2.68 3.10 3.99 4.93 7.03 10.37 15.15 0 30 90 180 180 210 240 240 240 240 240 270 270 660 1020 1740
20 0.00 0.03 0.19 0.39 0.70 1.07 1.49 1.91 2.33 2.75 3.21 4.16 6.68 10.25 14.75 20.84 0 90 90 180 180 240 240 240 240 240 270 270 1020 1020 1740 1740
25 0.00 0.03 0.19 0.40 0.72 1.08 1.50 1.92 2.36 2.83 3.30 5.02 8.59 12.16 17.09 23.19 0 90 90 180 180 240 240 240 270 270 270 1020 1020 1020 1740 1740
30 0.00 0.03 0.20 0.47 0.75 1.08 1.50 1.93 2.40 2.87 3.34 6.05 9.62 13.94 18.77 23.60 0 90 150 150 180 240 240 270 270 270 270 1020 1020 1380 1380 1380
40 0.00 0.08 0.34 0.61 0.87 1.15 1.50 1.95 2.42 3.03 3.98 7.03 11.44 15.85 20.64 25.47 0 150 150 150 150 180 240 270 270 540 540 1260 1260 1260 1380 1380
50 0.02 0.17 0.44 0.70 0.96 1.25 1.57 2.50 3.44 4.39 5.33 9.68 14.09 18.50 22.91 27.32 150 150 150 150 150 180 180 540 540 540 540 1260 1260 1260 1260 1260
60 0.06 0.22 0.48 0.75 1.03 1.62 2.57 3.51 4.46 5.40 7.37 11.77 16.18 20.59 25.00 29.41 150 150 150 150 180 540 540 540 540 540 1140 1260 1260 1260 1260 1260
70 0.09 0.24 0.51 0.78 1.43 2.37 3.32 4.26 5.27 7.26 9.26 13.45 17.86 22.27 26.68 32.12 150 150 150 180 540 540 540 540 1140 1140 1140 1260 1260 1260 1260 1620
80 0.10 0.26 0.52 1.04 1.99 2.93 3.88 4.82 6.79 8.79 10.78 14.84 19.25 23.66 29.16 34.83 150 150 150 540 540 540 540 540 1140 1140 1140 1260 1260 1260 1620 1620
90 0.10 0.26 0.55 1.46 2.41 3.35 4.30 6.05 8.04 10.04 12.03 16.02 20.42 25.96 31.63 37.30 150 150 180 540 540 540 540 1140 1140 1140 1140 1140 1260 1620 1620 1620
100 0.10 0.26 0.83 1.77 2.72 3.66 5.09 7.08 9.08 11.07 13.07 17.06 22.52 28.19 33.86 39.53 150 180 540 540 540 540 1140 1140 1140 1140 1140 1140 1620 1620 1620 1620
Hydrologic Design Tables 105
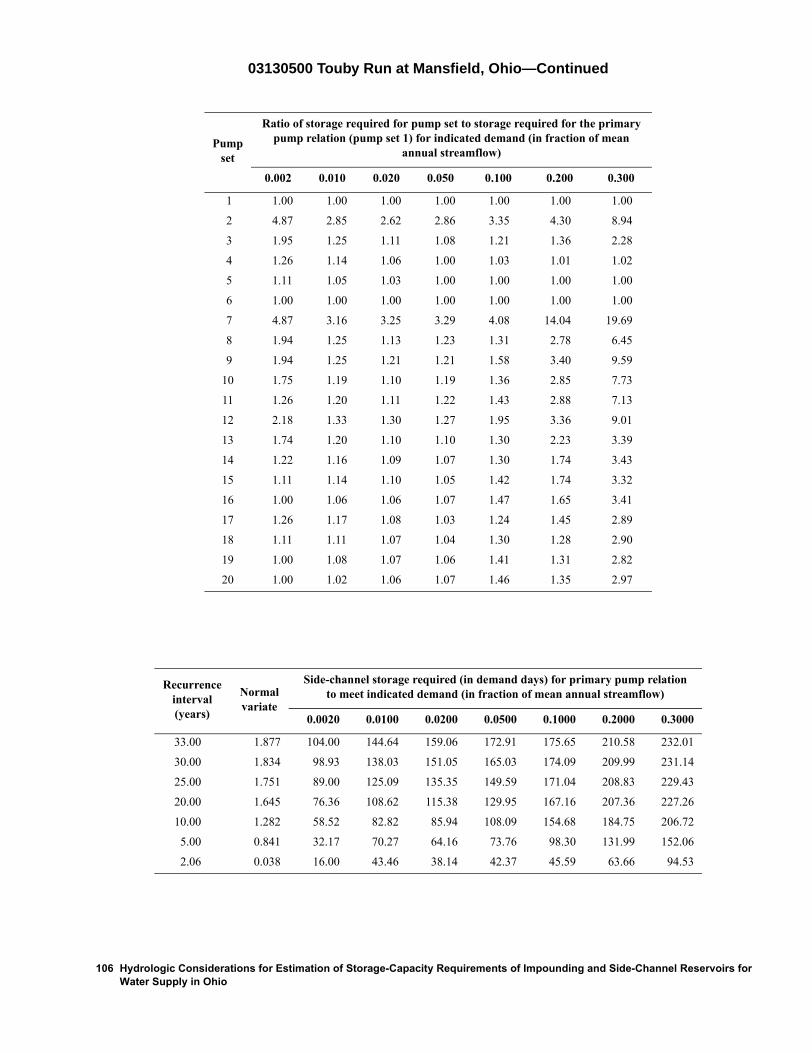
03130500 Touby Run at Mansfield, Ohio—Continued
Pumpset
Ratio of storage required for pump set to storage required for the primary pump relation (pump set 1) for indicated demand (in fraction of mean
annual streamflow)
0.002 0.010 0.020 0.050 0.100 0.200 0.300
1 1.00 1.00 1.00 1.00 1.00 1.00 1.00
2 4.87 2.85 2.62 2.86 3.35 4.30 8.94
3 1.95 1.25 1.11 1.08 1.21 1.36 2.28
4 1.26 1.14 1.06 1.00 1.03 1.01 1.02
5 1.11 1.05 1.03 1.00 1.00 1.00 1.00
6 1.00 1.00 1.00 1.00 1.00 1.00 1.00
7 4.87 3.16 3.25 3.29 4.08 14.04 19.69
8 1.94 1.25 1.13 1.23 1.31 2.78 6.45
9 1.94 1.25 1.21 1.21 1.58 3.40 9.59
10 1.75 1.19 1.10 1.19 1.36 2.85 7.73
11 1.26 1.20 1.11 1.22 1.43 2.88 7.13
12 2.18 1.33 1.30 1.27 1.95 3.36 9.01
13 1.74 1.20 1.10 1.10 1.30 2.23 3.39
14 1.22 1.16 1.09 1.07 1.30 1.74 3.43
15 1.11 1.14 1.10 1.05 1.42 1.74 3.32
16 1.00 1.06 1.06 1.07 1.47 1.65 3.41
17 1.26 1.17 1.08 1.03 1.24 1.45 2.89
18 1.11 1.11 1.07 1.04 1.30 1.28 2.90
19 1.00 1.08 1.07 1.06 1.41 1.31 2.82
20 1.00 1.02 1.06 1.07 1.46 1.35 2.97
Recurrenceinterval(years)
Normalvariate
Side-channel storage required (in demand days) for primary pump relation to meet indicated demand (in fraction of mean annual streamflow)
0.0020 0.0100 0.0200 0.0500 0.1000 0.2000 0.3000
33.00 1.877 104.00 144.64 159.06 172.91 175.65 210.58 232.01
30.00 1.834 98.93 138.03 151.05 165.03 174.09 209.99 231.14
25.00 1.751 89.00 125.09 135.35 149.59 171.04 208.83 229.43
20.00 1.645 76.36 108.62 115.38 129.95 167.16 207.36 227.26
10.00 1.282 58.52 82.82 85.94 108.09 154.68 184.75 206.72
5.00 0.841 32.17 70.27 64.16 73.76 98.30 131.99 152.06
2.06 0.038 16.00 43.46 38.14 42.37 45.59 63.66 94.53
106 Hydrologic Considerations for Estimation of Storage-Capacity Requirements of Impounding and Side-Channel Reservoirs for Water Supply in Ohio

03134000 Jerome Fork at Jeromeville, Ohio
Location: Latitude 40°48′07″, longitude 82°12′01″, Ashland County, Hydrologic Unit 05040002
Drainage area, in square miles: 120.
Station used for record extension: 03218000
Time period of systematic or extended record analyzed: 1925-10-01 to 1971-10-01
Percentage of estimated values in extended record: 47.8
Eighty-percent-duration streamflow, in cubic feet per second: 8.2
Mean annual streamflow, in inches: 11.16
Location of station used for precipitation data: Wooster, Ohio
Location of station used for potential evapotranspiration data: Pittsburgh, Pennsylvania
[–, indicates a value that could not be determined because there were too few average low-flow values less than the mean streamflow for the indicated duration]
Recurrenceinterval(years)
Extreme-value
variate
Minimum runoff (in inches) for indicated duration (in days)
180 360 540 720 1080 1440 1800
47.00 3.84 0.19 2.22 4.53 6.83 15.03 22.41 28.99
40.00 3.68 0.19 2.45 4.74 7.93 16.73 24.16 31.08
30.00 3.38 0.20 2.85 5.12 9.90 19.77 27.28 34.83
25.00 3.20 0.21 3.11 5.37 11.15 21.70 29.27 37.22
20.00 2.97 0.21 3.29 5.66 11.60 22.74 30.31 39.56
10.00 2.25 0.32 4.10 7.32 12.58 24.65 33.26 45.47
5.22 1.55 0.42 4.90 8.65 14.88 33.71 53.41 –
Hydrologic Design Tables 107

03134000 Jerome Fork at Jeromeville, Ohio—Continued
Recurrenceinterval(years)
Impounding reservoir storage required (in inches) and critical-drawdown duration (in days; shown in gray) for indicated draft rate (in fraction of the mean annual streamflow)
0.02 0.05 0.10 0.15 0.20 0.25 0.30 0.35 0.40 0.45 0.50 0.60 0.70 0.80 0.90 1.00
5 0.00 0.02 0.15 0.38 0.65 0.93 1.24 1.58 2.00 2.41 2.82 3.65 4.47 5.30 6.82 8.65 0 60 120 180 180 180 210 270 270 270 270 270 270 270 600 600
6 0.00 0.03 0.17 0.41 0.71 1.03 1.35 1.71 2.07 2.48 2.89 3.71 4.54 5.59 7.43 9.26 0 60 120 180 210 210 210 240 240 270 270 270 270 600 600 600
8 0.00 0.03 0.21 0.50 0.82 1.16 1.53 1.89 2.26 2.63 3.07 3.99 4.91 6.29 8.13 9.96 0 60 150 210 210 240 240 240 240 240 300 300 300 600 600 600
10 0.00 0.04 0.25 0.56 0.89 1.25 1.62 1.99 2.36 2.80 3.26 4.18 5.10 6.70 8.54 11.60 0 90 180 210 240 240 240 240 240 300 300 300 300 600 600 1680
15 0.00 0.07 0.32 0.63 1.00 1.37 1.73 2.14 2.56 3.02 3.48 4.40 5.51 7.35 11.05 16.19 0 150 180 210 240 240 240 270 300 300 300 300 600 600 1680 1680
20 0.00 0.09 0.35 0.69 1.05 1.43 1.84 2.26 2.67 3.11 3.57 4.49 5.99 7.82 11.81 17.13 0 150 180 240 240 270 270 270 270 300 300 300 600 600 1740 1740
25 0.00 0.10 0.37 0.72 1.09 1.50 1.91 2.32 2.74 3.16 3.61 4.57 6.40 8.24 12.78 18.09 0 150 210 240 240 270 270 270 270 300 300 600 600 600 1740 1740
30 0.00 0.10 0.38 0.74 1.13 1.54 1.95 2.37 2.78 3.19 3.64 4.95 6.79 9.39 14.01 19.33 0 150 210 240 270 270 270 270 270 270 300 600 600 1380 1740 1740
40 0.00 0.10 0.41 0.78 1.17 1.58 1.99 2.41 2.82 3.23 3.95 6.08 9.01 13.21 17.50 22.82 0 150 240 240 270 270 270 270 270 270 660 960 960 1380 1740 1740
50 0.00 0.10 0.44 0.80 1.18 1.59 2.00 2.42 3.23 4.70 6.16 9.28 12.83 17.05 22.32 27.82 0 150 240 240 270 270 270 270 960 960 960 1020 1380 1380 1800 1800
60 0.00 0.10 0.46 0.83 1.19 1.59 2.69 4.25 5.81 7.37 8.93 12.05 16.87 22.37 27.87 33.37 0 150 240 240 240 270 1020 1020 1020 1020 1020 1380 1800 1800 1800 1800
70 0.00 0.11 0.48 0.84 1.61 3.17 4.73 6.29 7.85 9.41 10.97 16.27 21.77 27.27 32.77 38.28 0 240 240 240 1020 1020 1020 1020 1020 1020 1020 1800 1800 1800 1800 1800
80 0.00 0.13 0.49 1.50 3.06 4.62 6.18 7.74 9.38 12.05 14.80 20.31 25.81 31.31 36.81 42.31 0 240 240 1020 1020 1020 1020 1020 1260 1800 1800 1800 1800 1800 1800 1800
90 0.00 0.14 0.94 2.50 4.06 5.62 7.24 9.74 12.49 15.24 17.99 23.49 29.00 34.50 40.00 45.50 0 240 1020 1020 1020 1020 1260 1800 1800 1800 1800 1800 1800 1800 1800 1800
100 0.00 0.15 1.63 3.19 4.75 6.69 9.44 12.19 14.94 17.69 20.44 25.95 31.45 36.95 42.45 47.95 0 240 1020 1020 1020 1800 1800 1800 1800 1800 1800 1800 1800 1800 1800 1800
108 Hydrologic Considerations for Estimation of Storage-Capacity Requirements of Impounding and Side-Channel Reservoirs for Water Supply in Ohio

03134000 Jerome Fork at Jeromeville, Ohio—Continued
Pumpset
Ratio of storage required for pump set to storage required for the primary pump relation (pump set 1) for indicated demand (in fraction of mean
annual streamflow)
0.002 0.010 0.020 0.050 0.100 0.200 0.300
1 1.00 1.00 1.00 1.00 1.00 1.00 1.00
2 1.26 1.45 1.53 2.21 2.68 5.94 10.01
3 1.01 1.00 1.00 1.03 1.01 1.87 2.06
4 1.00 1.00 1.00 1.00 1.00 1.11 1.41
5 1.00 1.00 1.00 1.00 1.00 1.00 1.21
6 1.00 1.00 1.00 1.00 1.00 1.00 1.09
7 1.26 1.63 2.16 3.23 4.96 15.84 19.69
8 1.01 1.06 1.08 1.17 1.68 3.09 4.69
9 1.01 1.11 1.17 1.23 1.90 3.84 8.98
10 1.00 1.15 1.18 1.26 1.72 3.23 5.06
11 1.01 1.23 1.27 1.28 1.76 3.00 4.25
12 1.01 1.04 1.12 1.31 2.21 4.14 8.76
13 1.01 1.12 1.13 1.22 1.14 2.72 3.36
14 1.00 1.16 1.16 1.26 1.25 2.50 2.62
15 1.01 1.19 1.25 1.27 1.42 2.57 2.61
16 1.01 1.21 1.27 1.32 1.43 2.54 2.55
17 1.00 1.11 1.13 1.22 1.14 2.28 2.46
18 1.00 1.16 1.16 1.25 1.19 2.26 2.38
19 1.00 1.19 1.26 1.26 1.24 2.36 2.34
20 1.01 1.21 1.27 1.29 1.30 2.34 2.34
Recurrenceinterval(years)
Normalvariate
Side-channel storage required (in demand days) for primary pump relation to meet indicated demand (in fraction of mean annual streamflow)
0.0020 0.0100 0.0200 0.0500 0.1000 0.2000 0.3000
47.00 2.029 256.01 226.47 235.20 242.88 265.75 287.16 374.25
40.00 1.960 250.97 226.46 234.28 242.78 265.69 285.60 373.61
30.00 1.834 241.63 226.45 232.59 242.61 265.59 282.72 372.41
25.00 1.751 235.47 226.44 231.47 242.49 265.51 280.81 371.62
20.00 1.645 230.39 226.06 226.52 241.77 259.33 270.53 341.59
10.00 1.282 193.62 183.84 197.17 220.29 233.81 243.21 261.82
5.00 0.841 124.18 135.92 139.00 154.02 181.76 213.63 238.87
2.04 0.027 73.67 75.40 75.71 101.54 125.97 147.91 172.71
Hydrologic Design Tables 109

03136500 Kokosing River at Mount Vernon, Ohio
Location: Latitude 40°24′20″, longitude 82°30′00″, Knox County, Hydrologic Unit 05040003
Drainage area, in square miles: 202.
Station used for record extension: 03137000
Time period of systematic or extended record analyzed: 1922-10-01 to 1997-09-30
Percentage of estimated values in extended record: 40.6
Eighty-percent-duration streamflow, in cubic feet per second: 42.
Mean annual streamflow, in inches: 15.30
Location of station used for precipitation data: Columbus, Ohio
Location of station used for potential evapotranspiration data: Columbus, Ohio
[–, indicates a value that could not be determined because there were too few average low-flow values less than the mean stream-flow for the indicated duration]
Recurrenceinterval(years)
Extreme-value
variate
Minimum runoff (in inches) for indicated duration (in days)
180 360 540 720 1080 1440 1800
76.00 4.32 0.75 3.40 6.33 11.52 22.59 33.72 44.26
70.00 4.24 0.76 3.48 6.38 11.63 23.33 34.43 44.86
60.00 4.09 0.78 3.62 6.48 11.83 24.71 35.77 46.00
50.00 3.90 0.80 3.79 6.60 12.07 26.35 37.35 47.34
40.00 3.68 0.83 4.00 6.75 12.37 28.36 39.28 48.98
30.00 3.38 0.84 4.58 6.84 13.55 29.43 42.87 50.49
25.00 3.20 0.84 4.99 7.03 14.51 30.02 45.13 51.82
20.00 2.97 0.90 5.49 9.65 17.22 32.81 45.28 60.47
10.00 2.25 1.07 6.70 11.29 20.55 37.20 51.04 69.84
5.07 1.52 1.35 9.05 14.56 25.48 49.21 – –
110 Hydrologic Considerations for Estimation of Storage-Capacity Requirements of Impounding and Side-Channel Reservoirs for Water Supply in Ohio

03136500 Kokosing River at Mount Vernon, Ohio—Continued
Recurrenceinterval(years)
Impounding reservoir storage required (in inches) and critical-drawdown duration (in days; shown in gray) for indicated draft rate (in fraction of the mean annual streamflow)
0.02 0.05 0.10 0.15 0.20 0.25 0.30 0.35 0.40 0.45 0.50 0.60 0.70 0.80 0.90 1.00
5 0.00 0.00 0.01 0.10 0.32 0.60 0.94 1.32 1.69 2.07 2.46 3.34 4.36 5.49 6.62 8.40 0 0 30 60 120 150 180 180 180 180 210 210 270 270 270 600
6 0.00 0.00 0.01 0.12 0.34 0.66 1.04 1.41 1.80 2.24 2.68 3.56 4.67 5.81 6.94 9.01 0 0 30 60 150 180 180 180 210 210 210 240 270 270 270 600
8 0.00 0.00 0.02 0.15 0.42 0.78 1.15 1.59 2.03 2.47 2.95 3.98 5.11 6.24 7.75 10.25 0 0 30 90 150 180 180 210 210 210 240 270 270 270 540 600
10 0.00 0.00 0.02 0.17 0.47 0.85 1.27 1.71 2.16 2.66 3.17 4.26 5.39 6.56 8.82 11.42 0 0 30 90 150 180 210 210 240 240 240 270 270 300 600 960
15 0.00 0.00 0.03 0.22 0.56 0.96 1.43 1.93 2.44 2.98 3.54 4.68 6.00 8.27 10.78 14.80 0 0 30 150 180 210 240 240 240 270 270 300 540 600 600 1320
20 0.00 0.00 0.03 0.26 0.61 1.06 1.56 2.07 2.63 3.20 3.77 5.02 7.11 9.54 12.06 18.41 0 0 30 150 180 240 240 270 270 270 300 300 540 600 600 1680
25 0.00 0.00 0.04 0.28 0.64 1.13 1.64 2.20 2.77 3.36 3.98 5.59 7.91 10.43 13.82 21.02 0 0 30 150 180 240 270 270 270 300 300 540 600 600 1680 1740
30 0.00 0.00 0.04 0.30 0.68 1.18 1.73 2.29 2.87 3.50 4.13 6.10 8.55 11.06 15.65 22.94 0 0 30 150 240 240 270 270 300 300 300 540 600 600 1740 1740
40 0.00 0.00 0.05 0.32 0.74 1.27 1.83 2.42 3.05 3.70 4.47 6.89 9.40 12.16 18.42 25.95 0 0 60 150 240 270 270 300 300 330 540 600 600 900 1800 1800
50 0.00 0.00 0.06 0.34 0.77 1.32 1.89 2.52 3.15 3.80 4.89 7.40 9.92 13.45 20.52 28.05 0 0 120 150 240 270 300 300 300 330 600 600 600 900 1800 1800
60 0.00 0.00 0.07 0.36 0.80 1.34 1.95 2.57 3.20 3.97 5.22 7.74 10.76 15.06 22.07 29.61 0 0 120 150 240 270 300 300 300 600 600 600 900 1320 1800 1800
70 0.00 0.00 0.08 0.37 0.82 1.35 1.97 2.60 3.23 4.18 5.44 7.96 11.98 17.45 23.30 30.84 0 0 90 180 240 270 300 300 300 600 600 960 960 1380 1800 1800
80 0.00 0.00 0.09 0.39 0.83 1.36 1.99 2.61 3.24 4.32 5.58 9.11 14.33 20.11 25.89 31.84 0 0 90 210 240 300 300 300 300 600 600 960 1380 1380 1380 1800
90 0.00 0.00 0.10 0.42 0.86 1.36 1.99 2.61 3.24 4.41 6.12 10.99 16.77 22.55 28.33 34.11 0 0 90 210 210 300 300 300 300 600 960 1380 1380 1380 1380 1380
100 0.00 0.00 0.11 0.45 0.89 1.36 1.99 2.61 3.24 5.06 7.44 13.22 19.00 24.78 30.56 36.34 0 0 90 210 210 300 300 300 300 960 1380 1380 1380 1380 1380 1380
Hydrologic Design Tables 111

03136500 Kokosing River at Mount Vernon, Ohio—Continued
Pumpset
Ratio of storage required for pump set to storage required for the primary pump relation (pump set 1) for indicated demand (in fraction of mean
annual streamflow)
0.002 0.010 0.020 0.050 0.100 0.200 0.300
1 1.00 1.00 1.00 1.00 1.00 1.00 1.00
2 1.92 1.63 1.53 1.53 1.79 3.10 5.71
3 1.13 1.23 1.11 1.01 1.00 1.26 1.37
4 1.10 1.10 1.04 1.00 1.00 1.00 1.06
5 1.00 1.04 1.01 1.00 1.00 1.00 1.03
6 1.00 1.00 1.00 1.00 1.00 1.00 1.01
7 1.93 1.75 1.74 1.90 2.29 9.05 16.47
8 1.14 1.27 1.17 1.11 1.30 1.93 4.24
9 1.14 1.28 1.18 1.13 1.43 2.14 6.65
10 1.12 1.23 1.20 1.22 1.26 2.30 6.27
11 1.13 1.22 1.21 1.23 1.20 2.42 6.60
12 1.17 1.31 1.17 1.11 1.44 2.14 5.28
13 1.13 1.20 1.15 1.11 1.14 1.68 3.34
14 1.08 1.16 1.17 1.20 1.17 2.08 3.42
15 1.01 1.17 1.18 1.24 1.19 2.27 3.86
16 1.01 1.10 1.15 1.30 1.22 2.32 4.38
17 1.11 1.16 1.13 1.09 1.15 1.54 2.17
18 1.01 1.12 1.16 1.20 1.18 1.97 2.36
19 1.00 1.13 1.19 1.25 1.20 2.17 2.58
20 1.03 1.08 1.14 1.30 1.22 2.24 3.13
112 Hydrologic Considerations for Estimation of Storage-Capacity Requirements of Impounding and Side-Channel Reservoirs for Water Supply in Ohio

03136500 Kokosing River at Mount Vernon, Ohio—Continued
Recurrenceinterval(years)
Normalvariate
Side-channel storage required (in demand days) for primary pump relation to meet indicated demand (in fraction of mean annual streamflow)
0.0020 0.0100 0.0200 0.0500 0.1000 0.2000 0.3000
76.00 2.222 252.55 221.80 245.59 279.34 302.80 322.96 389.32
70.00 2.190 251.24 221.64 242.74 276.02 299.05 319.78 384.66
60.00 2.128 248.74 221.34 237.32 269.70 291.92 313.72 375.80
50.00 2.054 245.72 220.98 230.75 262.04 283.27 306.38 365.06
40.00 1.960 241.90 220.52 222.46 252.37 272.36 297.11 351.50
30.00 1.834 230.17 217.77 216.99 233.41 250.74 289.41 339.50
25.00 1.751 221.92 214.52 213.11 220.71 236.40 284.61 332.53
20.00 1.645 218.07 191.98 191.21 214.80 232.76 272.26 325.05
10.00 1.282 170.03 150.92 159.39 178.35 218.36 239.56 273.62
5.00 0.841 144.43 119.87 129.94 139.55 158.40 182.66 200.74
2.00 0.000 95.35 65.15 66.54 81.08 95.67 118.04 136.95
Hydrologic Design Tables 113

03137000 Kokosing River at Millwood, Ohio
Location: Latitude 40°23′51″, longitude 82°17′09″, Knox County, Hydrologic Unit 05040003
Drainage area, in square miles: 455.
Station used for record extension: 03136500
Time period of systematic or extended record analyzed: 1922-10-01 to 1997-09-30
Percentage of estimated values in extended record: 30.7
Eighty-percent-duration streamflow, in cubic feet per second: 85.
Mean annual streamflow, in inches: 15.25
Location of station used for precipitation data: Columbus, Ohio
Location of station used for potential evapotranspiration data: Columbus, Ohio
[–, indicates a value that could not be determined because there were too few average low-flow values less than the mean stream-flow for the indicated duration]
Recurrenceinterval(years)
Extreme-value
variate
Minimum runoff (in inches) for indicated duration (in days)
180 360 540 720 1080 1440 1800
76.00 4.32 0.76 4.51 6.41 10.82 20.96 35.91 50.68
70.00 4.24 0.76 4.59 6.49 11.14 21.41 36.33 50.96
60.00 4.09 0.77 4.74 6.65 11.73 22.25 37.11 51.47
50.00 3.90 0.78 4.91 6.83 12.43 23.25 38.03 52.09
40.00 3.68 0.80 5.13 7.06 13.29 24.48 39.17 52.84
30.00 3.38 0.82 5.59 9.24 14.43 27.95 39.58 53.62
25.00 3.20 0.83 5.90 10.79 15.11 30.30 39.79 54.22
20.00 2.97 0.90 6.00 11.06 15.16 31.28 41.56 57.02
10.00 2.25 1.11 6.51 12.20 21.27 36.40 52.55 71.35
5.07 1.52 1.32 8.20 15.28 22.63 45.21 – –
114 Hydrologic Considerations for Estimation of Storage-Capacity Requirements of Impounding and Side-Channel Reservoirs for Water Supply in Ohio

03137000 Kokosing River at Millwood, Ohio—Continued
Recurrenceinterval(years)
Impounding reservoir storage required (in inches) and critical-drawdown duration (in days; shown in gray) for indicated draft rate (in fraction of the mean annual streamflow)
0.02 0.05 0.10 0.15 0.20 0.25 0.30 0.35 0.40 0.45 0.50 0.60 0.70 0.80 0.90 1.00
5 0.00 0.00 0.01 0.08 0.28 0.56 0.94 1.31 1.69 2.06 2.44 3.39 4.51 5.64 6.77 8.78 0 0 30 60 120 180 180 180 180 180 180 240 270 270 270 660
6 0.00 0.00 0.01 0.10 0.31 0.61 0.98 1.36 1.74 2.14 2.63 3.63 4.73 5.86 6.99 8.78 0 0 30 60 120 180 180 180 180 210 240 240 270 270 270 660
8 0.00 0.00 0.02 0.13 0.36 0.70 1.07 1.48 1.93 2.43 2.93 3.94 5.08 6.33 7.59 9.80 0 0 30 90 150 180 180 210 240 240 240 270 300 300 300 600
10 0.00 0.00 0.02 0.15 0.42 0.77 1.16 1.60 2.10 2.60 3.11 4.19 5.44 6.69 8.19 11.14 0 0 30 90 150 180 210 240 240 240 240 300 300 300 600 960
15 0.00 0.00 0.03 0.21 0.52 0.90 1.35 1.85 2.35 2.85 3.42 4.67 5.92 7.23 10.54 15.24 0 0 30 120 180 180 240 240 240 270 300 300 300 600 960 1320
20 0.00 0.00 0.04 0.26 0.60 0.98 1.48 1.98 2.51 3.08 3.68 4.93 6.18 8.55 12.73 17.85 0 0 60 150 180 210 240 240 270 270 300 300 300 660 1020 1740
25 0.00 0.00 0.04 0.30 0.65 1.06 1.56 2.10 2.66 3.23 3.85 5.10 6.97 10.08 14.34 19.98 0 0 60 150 180 240 240 270 270 300 300 300 660 1020 1020 1740
30 0.00 0.00 0.05 0.32 0.68 1.12 1.64 2.21 2.77 3.35 3.98 5.23 7.80 11.22 15.48 21.50 0 0 90 150 180 240 270 270 270 300 300 300 660 1020 1020 1680
40 0.00 0.00 0.06 0.35 0.72 1.22 1.79 2.35 2.91 3.54 4.17 6.08 8.84 12.72 16.98 23.25 0 0 90 150 180 270 270 270 300 300 300 660 660 1020 1020 1680
50 0.00 0.00 0.07 0.37 0.76 1.31 1.88 2.44 3.05 3.68 4.30 6.64 9.39 13.63 17.89 24.22 0 0 120 180 240 270 270 270 300 300 300 660 660 1020 1020 1800
60 0.00 0.00 0.07 0.37 0.81 1.37 1.94 2.53 3.16 3.78 4.41 6.91 9.95 14.21 18.47 24.58 0 0 90 180 270 270 270 300 300 300 300 660 1020 1020 1020 1800
70 0.00 0.00 0.07 0.37 0.85 1.42 1.99 2.62 3.25 3.87 4.81 7.14 10.41 14.71 19.21 25.09 0 0 90 210 270 270 300 300 300 300 540 600 960 1080 1080 1500
80 0.00 0.00 0.07 0.40 0.88 1.45 2.07 2.70 3.32 4.07 5.19 7.50 11.30 15.84 20.60 26.00 0 0 90 210 270 300 300 300 300 540 540 600 1080 1140 1140 1500
90 0.00 0.00 0.07 0.42 0.90 1.51 2.14 2.77 3.39 4.40 5.53 7.80 12.45 17.21 21.97 26.82 0 0 90 210 270 300 300 300 300 540 540 600 1140 1140 1140 1500
100 0.00 0.00 0.07 0.44 0.95 1.58 2.20 2.83 3.57 4.70 5.82 8.94 13.70 18.46 23.22 27.98 0 0 90 210 300 300 300 300 540 540 540 1140 1140 1140 1140 1140
Hydrologic Design Tables 115

03137000 Kokosing River at Millwood, Ohio—Continued
Pumpset
Ratio of storage required for pump set to storage required for the primary pump relation (pump set 1) for indicated demand (in fraction of mean
annual streamflow)
0.002 0.010 0.020 0.050 0.100 0.200 0.300
1 1.00 1.00 1.00 1.00 1.00 1.00 1.00
2 1.31 1.40 1.22 1.15 1.48 1.96 3.73
3 1.14 1.23 1.10 1.00 1.00 1.11 1.31
4 1.07 1.12 1.01 1.00 1.00 1.00 1.12
5 1.00 1.06 1.00 1.00 1.00 1.00 1.07
6 1.00 1.02 1.00 1.00 1.00 1.00 1.03
7 1.35 1.43 1.25 1.56 1.96 5.50 15.33
8 1.15 1.28 1.13 1.06 1.14 1.60 2.69
9 1.13 1.28 1.15 1.11 1.38 1.75 5.02
10 1.14 1.20 1.10 1.17 1.24 1.73 4.84
11 1.11 1.18 1.08 1.30 1.26 1.84 5.29
12 1.19 1.35 1.17 1.04 1.32 1.77 3.91
13 1.12 1.19 1.07 1.09 1.20 1.52 2.02
14 1.08 1.14 1.08 1.15 1.25 1.54 2.28
15 1.03 1.11 1.08 1.29 1.26 1.69 2.92
16 1.04 1.10 1.17 1.37 1.26 1.97 3.97
17 1.09 1.14 1.04 1.09 1.20 1.37 1.87
18 1.02 1.11 1.07 1.16 1.25 1.47 2.18
19 1.00 1.08 1.08 1.29 1.27 1.62 2.33
20 1.02 1.12 1.18 1.37 1.27 1.92 2.88
116 Hydrologic Considerations for Estimation of Storage-Capacity Requirements of Impounding and Side-Channel Reservoirs for Water Supply in Ohio

03137000 Kokosing River at Millwood, Ohio—Continued
Recurrenceinterval(years)
Normalvariate
Side-channel storage required (in demand days) for primary pump relation to meet indicated demand (in fraction of mean annual streamflow)
0.0020 0.0100 0.0200 0.0500 0.1000 0.2000 0.3000
76.00 2.222 239.50 210.08 234.37 268.18 286.38 309.28 338.97
70.00 2.190 236.55 209.58 230.50 263.02 281.52 304.47 336.79
60.00 2.128 230.94 208.63 223.14 253.20 272.28 295.31 332.64
50.00 2.054 224.13 207.48 214.21 241.29 261.08 284.21 327.61
40.00 1.960 215.54 206.02 202.94 226.26 246.94 270.20 321.27
30.00 1.834 199.61 184.78 192.47 211.24 233.11 258.01 296.38
25.00 1.751 188.35 169.28 186.01 202.67 225.06 251.08 278.78
20.00 1.645 172.05 168.85 174.65 201.82 220.45 245.29 274.20
10.00 1.282 148.93 137.52 148.24 162.61 183.78 211.20 233.81
5.00 0.841 120.60 98.69 107.86 134.36 146.38 168.85 184.03
2.00 0.000 76.54 51.02 56.06 65.68 85.26 100.33 118.03
Hydrologic Design Tables 117

03139000 Killbuck Creek at Killbuck, Ohio
Location: Latitude 40°28′53″, longitude 81°59′10″, Holmes County, Hydrologic Unit 05040003
Drainage area, in square miles: 464.
Station used for record extension: None
Time period of systematic or extended record analyzed: 1930-10-01 to 1997-09-30
Eighty-percent-duration streamflow, in cubic feet per second: 80.
Mean annual streamflow, in inches: 12.51
Location of station used for precipitation data: Cadiz, Ohio
Location of station used for potential evapotranspiration data: Pittsburgh, Pennsylvania
[–, indicates a value that could not be determined because there were too few average low-flow values less than the mean stream-flow for the indicated duration]
Recurrenceinterval(years)
Extreme-value
variate
Minimum runoff (in inches) for indicated duration (in days)
180 360 540 720 1080 1440 1800
68.00 4.21 0.54 3.72 5.61 10.24 20.51 29.74 37.86
60.00 4.09 0.55 3.83 5.78 10.40 20.61 29.79 38.59
50.00 3.90 0.58 3.98 6.02 10.64 20.75 29.86 39.64
40.00 3.68 0.60 4.17 6.31 10.94 20.93 29.94 40.94
30.00 3.38 0.66 4.45 6.92 11.16 21.27 30.02 41.95
25.00 3.20 0.73 4.64 7.50 11.17 21.57 30.05 42.03
20.00 2.97 0.82 4.81 7.84 12.13 22.83 31.44 44.30
10.00 2.25 0.95 5.34 9.48 16.31 27.70 44.63 59.46
5.23 1.55 1.09 6.55 12.14 19.50 38.36 56.38 –
118 Hydrologic Considerations for Estimation of Storage-Capacity Requirements of Impounding and Side-Channel Reservoirs for Water Supply in Ohio

03139000 Killbuck Creek at Killbuck, Ohio—Continued
Recurrenceinterval(years)
Impounding reservoir storage required (in inches) and critical-drawdown duration (in days; shown in gray) for indicated draft rate (in fraction of the mean annual streamflow)
0.02 0.05 0.10 0.15 0.20 0.25 0.30 0.35 0.40 0.45 0.50 0.60 0.70 0.80 0.90 1.00
5 0.00 0.00 0.01 0.08 0.26 0.52 0.78 1.09 1.40 1.74 2.15 2.97 3.79 4.67 5.70 6.73 0 0 30 60 150 150 180 180 180 240 240 240 240 300 300 300
6 0.00 0.00 0.02 0.09 0.27 0.52 0.78 1.09 1.42 1.81 2.22 3.04 3.86 4.82 5.84 7.39 0 0 30 60 150 150 150 180 210 240 240 240 240 300 300 600
8 0.00 0.00 0.02 0.12 0.31 0.56 0.81 1.16 1.52 1.94 2.35 3.23 4.16 5.08 6.43 8.48 0 0 30 90 120 150 180 210 240 240 240 270 270 270 600 600
10 0.00 0.00 0.02 0.14 0.34 0.59 0.88 1.24 1.63 2.04 2.49 3.42 4.34 5.27 7.26 9.89 0 0 30 90 120 150 210 210 240 240 270 270 270 270 600 840
15 0.00 0.00 0.04 0.19 0.41 0.67 1.02 1.42 1.83 2.26 2.72 3.65 4.58 6.63 9.64 13.97 0 0 60 120 150 150 210 240 240 270 270 270 600 660 960 1320
20 0.00 0.00 0.05 0.22 0.46 0.75 1.14 1.55 1.96 2.38 2.84 3.77 5.56 8.44 12.30 17.49 0 0 90 120 150 210 240 240 240 270 270 270 660 1020 1320 1740
25 0.00 0.00 0.06 0.25 0.50 0.82 1.23 1.64 2.05 2.46 2.92 4.07 6.43 9.93 14.50 20.46 0 0 90 150 180 210 240 240 240 270 270 660 1020 1020 1740 1740
30 0.00 0.00 0.07 0.27 0.55 0.88 1.29 1.70 2.11 2.53 2.99 4.58 7.38 11.01 16.38 22.34 0 0 90 150 180 210 240 240 240 270 270 660 1020 1380 1740 1740
40 0.00 0.00 0.08 0.31 0.62 0.97 1.37 1.78 2.20 2.65 3.16 5.19 8.38 12.47 18.29 24.25 0 0 90 150 180 210 240 240 240 300 300 660 1020 1380 1740 1740
50 0.00 0.00 0.08 0.35 0.68 1.04 1.42 1.83 2.28 2.80 3.48 5.54 8.72 12.96 18.81 24.77 0 0 90 180 210 210 240 240 300 300 600 600 1020 1380 1740 1740
60 0.00 0.00 0.09 0.38 0.73 1.09 1.45 1.90 2.40 2.92 3.77 5.82 8.72 12.96 18.81 24.77 0 0 150 180 210 210 210 270 300 300 600 600 960 1380 1740 1740
70 0.00 0.00 0.10 0.42 0.78 1.14 1.51 1.98 2.50 3.01 3.97 6.02 8.95 12.96 18.81 24.77 0 0 150 210 210 210 270 300 300 300 600 600 960 1380 1740 1740
80 0.00 0.00 0.11 0.46 0.82 1.18 1.58 2.06 2.58 3.09 4.12 6.17 9.10 12.96 18.81 24.77 0 0 150 210 210 210 270 300 300 300 600 600 960 1380 1740 1740
90 0.00 0.00 0.13 0.49 0.85 1.21 1.65 2.13 2.65 3.20 4.23 6.28 9.19 12.96 18.81 24.77 0 0 210 210 210 210 270 300 300 600 600 600 960 1380 1740 1740
100 0.00 0.00 0.16 0.52 0.88 1.25 1.71 2.19 2.71 3.28 4.31 6.37 9.23 12.96 18.81 24.77 0 0 210 210 210 270 270 300 300 600 600 600 960 1380 1740 1740
Hydrologic Design Tables 119

03139000 Killbuck Creek at Killbuck, Ohio—Continued
Pumpset
Ratio of storage required for pump set to storage required for the primary pump relation (pump set 1) for indicated demand (in fraction of mean
annual streamflow)
0.002 0.010 0.020 0.050 0.100 0.200 0.300
1 1.00 1.00 1.00 1.00 1.00 1.00 1.00
2 1.97 2.14 1.91 2.26 2.72 3.00 6.48
3 1.09 1.07 1.01 1.00 1.02 1.27 1.34
4 1.04 1.02 1.00 1.00 1.00 1.00 1.10
5 1.02 1.00 1.00 1.00 1.00 1.00 1.04
6 1.01 1.00 1.00 1.00 1.00 1.00 1.01
7 1.97 2.27 2.43 2.96 3.49 9.76 15.61
8 1.10 1.08 1.02 1.04 1.26 1.68 2.63
9 1.10 1.07 1.04 1.06 1.39 2.02 4.02
10 1.05 1.07 1.05 1.05 1.19 1.82 3.26
11 1.03 1.06 1.05 1.08 1.25 2.06 4.05
12 1.17 1.09 1.03 1.39 1.65 2.32 3.41
13 1.05 1.05 1.04 1.03 1.10 1.57 2.41
14 1.04 1.04 1.04 1.05 1.16 1.64 2.74
15 1.04 1.06 1.06 1.06 1.24 1.73 3.17
16 1.02 1.06 1.07 1.06 1.33 2.11 3.72
17 1.04 1.02 1.04 1.03 1.09 1.47 2.04
18 1.03 1.04 1.04 1.05 1.16 1.54 2.53
19 1.02 1.07 1.05 1.07 1.24 1.62 3.08
20 1.03 1.06 1.07 1.05 1.32 2.11 3.68
Recurrenceinterval(years)
Normalvariate
Side-channel storage required (in demand days) for primary pump relation to meet indicated demand (in fraction of mean annual streamflow)
0.0020 0.0100 0.0200 0.0500 0.1000 0.2000 0.3000
68.00 2.178 267.05 234.68 240.54 242.14 241.15 262.94 303.99
60.00 2.128 260.17 231.76 235.06 237.97 238.92 261.61 300.49
50.00 2.054 249.94 227.41 226.91 231.76 235.61 259.63 295.28
40.00 1.960 237.01 221.92 216.62 223.91 231.42 257.14 288.70
30.00 1.834 226.15 211.30 203.63 207.15 222.29 248.46 279.28
25.00 1.751 224.43 201.57 195.76 190.87 213.32 238.27 272.56
20.00 1.645 220.34 179.34 178.89 180.82 198.65 228.49 265.49
10.00 1.282 172.95 138.12 135.58 155.53 166.94 203.53 239.02
5.00 0.841 142.77 98.44 105.81 123.61 152.72 178.25 203.51
2.00 0.000 110.54 62.06 62.06 66.81 80.00 110.58 132.22
120 Hydrologic Considerations for Estimation of Storage-Capacity Requirements of Impounding and Side-Channel Reservoirs for Water Supply in Ohio

03140000 Mill Creek near Coshocton, Ohio
Location: Latitude 40°21′46″, longitude 81°51′45″, Coshocton County, Hydrologic Unit 05040003
Drainage area, in square miles: 27.2
Station used for record extension: None
Time period of systematic or extended record analyzed: 1936-11-01 to 1997-09-30
Eighty-percent-duration streamflow, in cubic feet per second: 2.2
Mean annual streamflow, in inches: 14.00
Location of station used for precipitation data: Cadiz, Ohio
Location of station used for potential evapotranspiration data: Pittsburgh, Pennsylvania
[–, indicates a value that could not be determined because there were too few average low-flow values less than the mean streamflow for the indicated duration]
Recurrenceinterval(years)
Extreme-value
variate
Minimum runoff (in inches) for indicated duration (in days)
180 360 540 720 1080 1440 1800
61.00 4.10 0.19 3.77 4.71 10.57 19.07 28.85 45.13
60.00 4.09 0.19 3.78 4.77 10.67 19.29 29.06 45.23
50.00 3.90 0.19 3.88 5.38 11.77 21.73 31.43 46.33
40.00 3.68 0.19 4.01 6.13 13.13 24.72 34.34 47.69
30.00 3.38 0.19 4.24 7.06 14.82 28.38 37.89 49.35
25.00 3.20 0.22 4.98 7.32 15.32 28.58 37.97 49.45
20.00 2.97 0.27 5.84 7.78 15.90 28.81 38.09 49.81
10.00 2.25 0.41 6.45 11.26 18.02 32.73 46.92 63.95
5.08 1.52 0.76 7.81 12.61 22.22 39.82 – –
Hydrologic Design Tables 121

03140000 Mill Creek near Coshocton, Ohio—Continued
Recurrenceinterval(years)
Impounding reservoir storage required (in inches) and critical-drawdown duration (in days; shown in gray) for indicated draft rate (in fraction of the mean annual streamflow)
0.02 0.05 0.10 0.15 0.20 0.25 0.30 0.35 0.40 0.45 0.50 0.60 0.70 0.80 0.90 1.00
5 0.01 0.06 0.22 0.49 0.78 1.07 1.35 1.69 2.04 2.43 2.88 3.80 4.72 5.64 6.56 8.31 30 60 90 150 150 150 150 180 180 210 240 240 240 240 240 540
6 0.01 0.07 0.24 0.49 0.78 1.11 1.45 1.80 2.15 2.58 3.04 3.96 4.88 5.90 6.93 8.31 30 60 120 150 150 180 180 180 210 240 240 240 240 270 270 540
8 0.01 0.08 0.28 0.55 0.89 1.24 1.58 1.93 2.39 2.86 3.38 4.42 5.45 6.49 7.52 9.55 30 60 120 180 180 180 180 210 240 270 270 270 270 270 270 900
10 0.02 0.09 0.31 0.62 0.97 1.31 1.67 2.14 2.66 3.18 3.69 4.73 5.76 6.80 8.07 11.11 30 90 120 180 180 180 240 270 270 270 270 270 270 270 600 960
15 0.02 0.12 0.38 0.73 1.07 1.50 1.99 2.51 3.03 3.54 4.06 5.10 6.13 7.63 10.85 17.29 60 120 180 180 180 240 270 270 270 270 270 270 270 600 1680 1680
20 0.03 0.14 0.43 0.78 1.18 1.64 2.15 2.67 3.18 3.70 4.22 5.25 6.53 8.83 13.20 19.64 60 120 180 180 240 240 270 270 270 270 270 270 600 600 1680 1680
25 0.04 0.16 0.46 0.80 1.26 1.72 2.23 2.75 3.26 3.78 4.30 5.37 7.38 9.68 14.20 20.87 90 120 180 180 240 240 270 270 270 270 270 300 600 600 1680 1740
30 0.04 0.17 0.48 0.84 1.30 1.76 2.28 2.79 3.31 3.83 4.35 5.70 8.00 10.30 15.06 21.73 90 150 180 210 240 240 270 270 270 270 270 600 600 600 1740 1740
40 0.05 0.19 0.50 0.89 1.33 1.80 2.32 2.83 3.35 3.87 4.43 6.57 8.87 11.91 16.97 22.97 90 150 180 210 240 270 270 270 270 270 540 600 600 1320 1320 1740
50 0.05 0.20 0.52 0.92 1.33 1.80 2.32 2.84 3.35 4.08 5.11 7.18 10.04 15.08 20.14 25.20 90 150 210 210 240 270 270 270 270 540 540 540 960 1320 1320 1320
60 0.05 0.20 0.53 0.94 1.34 1.80 2.32 2.84 3.53 4.56 5.60 8.60 13.02 18.08 23.14 28.30 90 150 210 210 210 270 270 270 540 540 540 960 1320 1320 1320 1380
70 0.05 0.20 0.54 0.94 1.35 1.80 2.32 2.86 3.89 5.42 7.14 10.71 15.77 21.04 26.33 31.62 90 150 210 210 210 270 270 540 540 900 900 1320 1320 1380 1380 1380
80 0.05 0.20 0.55 0.95 1.35 1.80 2.32 3.66 5.38 7.11 8.83 13.47 18.76 24.05 29.34 34.63 90 150 210 210 210 270 270 900 900 900 900 1380 1380 1380 1380 1380
90 0.05 0.20 0.55 0.95 1.35 1.80 3.34 5.06 6.79 8.51 10.83 16.12 21.41 26.70 31.99 37.28 90 150 210 210 210 270 900 900 900 900 1380 1380 1380 1380 1380 1380
100 0.05 0.20 0.55 0.95 1.35 2.87 4.51 6.23 7.96 10.50 13.14 18.43 23.72 29.01 34.30 39.59 90 150 210 210 210 840 900 900 900 1380 1380 1380 1380 1380 1380 1380
122 Hydrologic Considerations for Estimation of Storage-Capacity Requirements of Impounding and Side-Channel Reservoirs for Water Supply in Ohio

03140000 Mill Creek near Coshocton, Ohio—Continued
Pumpset
Ratio of storage required for pump set to storage required for the primary pump relation (pump set 1) for indicated demand (in fraction of mean
annual streamflow)
0.002 0.010 0.020 0.050 0.100 0.200 0.300
1 1.00 1.00 1.00 1.00 1.00 1.00 1.00
2 12.38 3.35 2.91 3.01 3.12 3.21 4.78
3 1.35 1.15 1.14 1.04 1.06 1.24 1.38
4 1.06 1.06 1.06 1.00 1.00 1.00 1.11
5 1.01 1.01 1.03 1.00 1.00 1.00 1.05
6 1.00 1.00 1.00 1.00 1.00 1.00 1.00
7 13.25 3.83 3.65 3.85 3.91 8.23 12.73
8 1.36 1.20 1.18 1.18 1.20 2.04 2.62
9 1.37 1.21 1.24 1.24 1.41 2.26 3.44
10 1.15 1.20 1.20 1.25 1.26 2.11 3.15
11 1.12 1.22 1.16 1.28 1.29 2.50 3.62
12 1.51 1.27 1.22 1.41 1.81 2.54 2.99
13 1.16 1.17 1.19 1.18 1.22 1.72 2.55
14 1.07 1.15 1.14 1.19 1.23 1.90 2.70
15 1.06 1.12 1.12 1.22 1.26 2.24 3.21
16 1.04 1.10 1.09 1.22 1.30 2.58 3.55
17 1.09 1.13 1.14 1.15 1.19 1.61 2.21
18 1.03 1.09 1.12 1.16 1.20 1.84 2.39
19 1.04 1.10 1.07 1.24 1.26 2.02 3.04
20 1.05 1.08 1.09 1.24 1.30 2.42 3.41
Recurrenceinterval(years)
Normalvariate
Side-channel storage required (in demand days) for primary pump relation to meet indicated demand (in fraction of mean annual streamflow)
0.0020 0.0100 0.0200 0.0500 0.1000 0.2000 0.3000
61.00 2.135 187.99 181.58 184.78 206.17 229.78 257.83 325.06
60.00 2.128 187.95 181.35 184.69 206.07 229.54 257.58 324.02
50.00 2.054 187.49 178.74 183.70 204.94 226.79 254.80 312.29
40.00 1.960 186.92 175.45 182.46 203.51 223.33 251.28 297.48
30.00 1.834 185.43 170.09 179.97 201.14 218.29 246.44 278.11
25.00 1.751 176.91 156.53 169.72 194.87 210.87 242.08 270.88
20.00 1.645 165.83 140.43 156.45 185.59 201.89 236.50 262.31
10.00 1.282 125.18 117.79 130.95 142.41 164.00 187.34 236.55
5.00 0.841 109.72 100.80 104.15 116.45 143.16 164.95 179.45
2.03 0.021 81.41 60.36 57.49 68.16 87.84 110.86 124.88
Hydrologic Design Tables 123

03142200 Salt Fork near Cambridge, Ohio
Location: Latitude 40°05′05″, longitude 81°27′20″, Guernsey County, Hydrologic Unit 05040005
Drainage area, in square miles: 55.6
Station used for record extension: 03110000
Time period of systematic or extended record analyzed: 1940-11-01 to 1997-09-30
Percentage of estimated values in extended record: 80.2
Eighty-percent-duration streamflow, in cubic feet per second: 1.2
Mean annual streamflow, in inches: 15.53
Location of station used for precipitation data: Cadiz, Ohio
Location of station used for potential evapotranspiration data: Pittsburgh, Pennsylvania
[–, indicates a value that could not be determined because there were too few average low-flow values less than the mean stream-flow for the indicated duration]
Recurrenceinterval(years)
Extreme-value
variate
Minimum runoff (in inches) for indicated duration (in days)
180 360 540 720 1080 1440 1800
57.00 4.03 0.07 3.70 6.44 15.94 27.81 39.54 52.63
50.00 3.90 0.08 3.95 6.77 15.94 28.13 40.14 53.68
40.00 3.68 0.10 4.37 7.34 15.94 28.68 41.17 55.48
30.00 3.38 0.12 4.92 8.08 15.94 29.38 42.50 57.80
25.00 3.20 0.14 5.15 8.47 16.02 29.95 43.28 58.27
20.00 2.97 0.18 5.38 8.91 16.16 30.71 44.21 58.34
10.00 2.25 0.34 6.71 10.86 18.22 33.76 47.87 73.15
5.18 1.54 0.55 7.70 13.89 23.19 41.44 61.40 –
124 Hydrologic Considerations for Estimation of Storage-Capacity Requirements of Impounding and Side-Channel Reservoirs for Water Supply in Ohio

03142200 Salt Fork near Cambridge, Ohio—Continued
Recurrenceinterval(years)
Impounding reservoir storage required (in inches) and critical-drawdown duration (in days; shown in gray) for indicated draft rate (in fraction of the mean annual streamflow)
0.02 0.05 0.10 0.15 0.20 0.25 0.30 0.35 0.40 0.45 0.50 0.60 0.70 0.80 0.90 1.00
5 0.04 0.13 0.37 0.68 1.00 1.37 1.75 2.13 2.54 3.03 3.54 4.56 5.59 6.61 7.63 9.99 60 90 120 150 150 180 180 180 210 240 240 240 240 240 240 600
6 0.04 0.15 0.38 0.68 1.04 1.43 1.81 2.19 2.58 3.03 3.54 4.56 5.59 6.61 8.35 10.90 60 90 120 150 180 180 180 180 180 240 240 240 240 240 600 600
8 0.06 0.17 0.42 0.75 1.14 1.52 1.90 2.29 2.67 3.09 3.61 4.66 5.81 7.16 9.76 12.56 90 90 150 180 180 180 180 180 180 240 240 270 270 600 660 660
10 0.06 0.18 0.47 0.82 1.20 1.59 1.97 2.35 2.82 3.33 3.84 4.95 6.10 8.13 10.93 13.74 90 120 150 180 180 180 180 180 240 240 240 270 270 660 660 660
15 0.07 0.23 0.55 0.92 1.30 1.74 2.25 2.76 3.27 3.78 4.29 5.37 7.05 9.60 12.27 18.00 90 150 150 180 180 240 240 240 240 240 240 270 600 600 660 1680
20 0.08 0.27 0.59 0.98 1.46 1.97 2.48 2.99 3.50 4.01 4.52 5.61 7.87 10.42 14.17 20.74 120 150 180 210 240 240 240 240 240 240 240 270 600 600 1380 1680
25 0.09 0.28 0.62 1.07 1.58 2.09 2.60 3.11 3.62 4.13 4.64 5.81 8.36 10.91 15.28 21.89 150 150 180 240 240 240 240 240 240 240 240 600 600 600 1380 1680
30 0.10 0.29 0.66 1.13 1.64 2.15 2.66 3.17 3.69 4.20 4.76 6.12 8.67 11.22 16.04 22.45 150 150 210 240 240 240 240 240 240 240 270 600 600 600 1320 1680
40 0.10 0.29 0.69 1.19 1.70 2.21 2.72 3.23 3.80 4.38 4.95 6.57 8.98 11.58 16.78 23.44 150 150 210 240 240 240 240 270 270 270 270 540 600 960 1320 1740
50 0.10 0.31 0.69 1.19 1.70 2.22 2.79 3.36 3.94 4.51 5.12 7.16 9.32 12.04 17.08 24.48 150 180 210 240 240 270 270 270 270 270 480 480 540 960 1740 1740
60 0.10 0.32 0.70 1.19 1.74 2.32 2.89 3.47 4.04 4.61 5.62 7.66 9.70 12.29 18.23 25.63 150 180 180 240 270 270 270 270 270 270 480 480 480 960 1740 1740
70 0.10 0.33 0.71 1.25 1.82 2.40 2.97 3.55 4.12 5.00 6.02 8.06 10.10 12.43 19.49 26.89 150 180 180 270 270 270 270 270 270 480 480 480 480 960 1740 1740
80 0.10 0.33 0.74 1.31 1.89 2.46 3.04 3.61 4.31 5.33 6.35 8.39 10.43 13.45 20.84 28.24 180 180 270 270 270 270 270 270 480 480 480 480 480 1740 1740 1740
90 0.11 0.34 0.79 1.37 1.94 2.51 3.09 3.66 4.59 5.62 6.64 8.68 10.72 14.86 22.26 29.66 180 180 270 270 270 270 270 270 480 480 480 480 480 1740 1740 1740
100 0.11 0.34 0.83 1.41 1.98 2.56 3.13 3.82 4.84 5.86 6.88 8.92 10.96 16.32 23.72 31.11 180 180 270 270 270 270 270 480 480 480 480 480 480 1740 1740 1740
Hydrologic Design Tables 125

03142200 Salt Fork near Cambridge, Ohio—Continued
Pumpset
Ratio of storage required for pump set to storage required for the primary pump relation (pump set 1) for indicated demand (in fraction of mean
annual streamflow)
0.002 0.010 0.020 0.050 0.100 0.200 0.300
1 1.00 1.00 1.00 1.00 1.00 1.00 1.00
2 1.42 1.05 1.00 1.03 1.26 1.77 5.01
3 1.22 1.01 1.00 1.00 1.02 1.00 1.00
4 1.02 1.00 1.00 1.00 1.00 1.00 1.00
5 1.00 1.00 1.00 1.00 1.00 1.00 1.00
6 1.00 1.00 1.00 1.00 1.00 1.00 1.00
7 1.46 1.12 1.07 1.33 1.96 7.27 14.38
8 1.26 1.08 1.07 1.09 1.18 1.21 2.56
9 1.25 1.11 1.08 1.18 1.35 1.47 5.12
10 1.22 1.11 1.11 1.20 1.37 1.41 3.14
11 1.28 1.15 1.13 1.32 1.41 1.77 2.50
12 1.31 1.08 1.05 1.09 1.18 1.54 4.84
13 1.16 1.11 1.08 1.14 1.33 1.23 1.54
14 1.16 1.11 1.11 1.18 1.34 1.36 1.83
15 1.19 1.15 1.10 1.27 1.41 1.65 1.86
16 1.26 1.21 1.12 1.28 1.48 1.81 1.95
17 1.11 1.11 1.08 1.11 1.32 1.23 1.49
18 1.08 1.11 1.11 1.16 1.35 1.31 1.77
19 1.15 1.15 1.12 1.26 1.43 1.58 1.77
20 1.19 1.21 1.11 1.28 1.47 1.77 1.88
Recurrenceinterval(years)
Normalvariate
Side-channel storage required (in demand days) for primary pump relation to meet indicated demand (in fraction of mean annual streamflow)
0.0020 0.0100 0.0200 0.0500 0.1000 0.2000 0.3000
57.00 2.108 160.54 188.92 198.16 202.45 212.64 246.75 266.12
50.00 2.054 158.23 186.30 193.63 198.28 211.06 245.98 264.21
40.00 1.960 154.18 181.71 185.71 190.99 208.31 244.63 260.86
30.00 1.834 148.74 175.54 175.06 181.20 204.60 242.82 256.36
25.00 1.751 143.67 168.97 169.65 175.36 195.76 231.88 247.31
20.00 1.645 136.50 159.39 163.55 168.24 181.39 213.20 232.81
10.00 1.282 102.75 116.55 119.09 133.65 154.27 176.58 197.12
5.00 0.841 75.84 77.93 82.99 108.38 127.63 150.30 170.96
2.04 0.022 49.16 46.09 46.02 67.02 80.49 100.28 122.62
126 Hydrologic Considerations for Estimation of Storage-Capacity Requirements of Impounding and Side-Channel Reservoirs for Water Supply in Ohio

03144000 Wakatomika Creek near Frazeysburg, Ohio
Location: Latitude 40°07′57″, longitude 82°08′53″, Muskingum County, Hydrologic Unit 05040004
Drainage area, in square miles: 140.
Station used for record extension: None
Time period of systematic or extended record analyzed: 1936-10-01 to 1997-09-30
Eighty-percent-duration streamflow, in cubic feet per second: 18.
Mean annual streamflow, in inches: 14.94
Location of station used for precipitation data: Columbus, Ohio
Location of station used for potential evapotranspiration data: Columbus, Ohio
[–, indicates a value that could not be determined because there were too few average low-flow values less than the mean streamflow for the indicated duration]
Recurrenceinterval(years)
Extreme-value
variate
Minimum runoff (in inches) for indicated duration (in days)
180 360 540 720 1080 1440 1800
62.00 4.12 0.36 3.77 6.22 11.28 21.26 32.19 44.90
60.00 4.09 0.36 3.80 6.34 11.49 21.71 32.68 45.34
50.00 3.90 0.37 3.99 7.01 12.63 24.21 35.42 47.77
40.00 3.68 0.37 4.22 7.82 14.04 27.28 38.78 50.75
30.00 3.38 0.39 4.59 8.87 15.86 30.83 42.75 54.45
25.00 3.20 0.42 5.17 9.48 17.01 31.03 43.41 56.00
20.00 2.97 0.47 5.90 10.24 18.25 31.48 44.19 57.90
10.00 2.25 0.60 7.03 12.16 20.18 34.93 54.62 70.76
5.17 1.54 0.98 9.15 15.06 23.34 41.31 – –
Hydrologic Design Tables 127

03144000 Wakatomika Creek near Frazeysburg, Ohio—Continued
Recurrenceinterval(years)
Impounding reservoir storage required (in inches) and critical-drawdown duration (in days; shown in gray) for indicated draft rate (in fraction of the mean annual streamflow)
0.02 0.05 0.10 0.15 0.20 0.25 0.30 0.35 0.40 0.45 0.50 0.60 0.70 0.80 0.90 1.00
5 0.00 0.01 0.10 0.27 0.51 0.82 1.19 1.55 1.92 2.29 2.66 3.49 4.34 5.37 6.47 8.05 0 30 60 90 120 180 180 180 180 180 180 210 210 270 270 600
6 0.00 0.01 0.12 0.33 0.61 0.96 1.33 1.70 2.07 2.44 2.84 3.70 4.64 5.64 6.74 9.06 0 30 90 120 150 180 180 180 180 180 210 210 240 270 270 600
8 0.00 0.02 0.16 0.42 0.76 1.13 1.50 1.86 2.24 2.67 3.13 4.11 5.09 6.14 7.74 10.20 0 30 90 150 180 180 180 180 210 210 240 240 240 270 600 600
10 0.00 0.02 0.19 0.49 0.85 1.22 1.59 1.97 2.40 2.90 3.39 4.37 5.42 6.52 8.39 11.03 0 30 120 150 180 180 180 210 240 240 240 240 270 270 600 960
15 0.00 0.03 0.26 0.60 0.97 1.33 1.77 2.26 2.75 3.27 3.82 4.92 6.03 7.13 10.68 17.55 0 60 150 180 180 180 240 240 240 270 270 270 270 270 1680 1680
20 0.00 0.04 0.29 0.65 1.02 1.45 1.94 2.50 3.05 3.60 4.15 5.26 6.41 7.66 12.14 19.01 0 60 150 180 180 240 270 270 270 270 270 270 300 600 1680 1680
25 0.00 0.05 0.31 0.68 1.07 1.59 2.14 2.70 3.25 3.80 4.35 5.50 6.73 8.33 12.43 19.30 0 90 180 180 240 270 270 270 270 270 270 300 300 660 1680 1680
30 0.00 0.06 0.33 0.70 1.17 1.72 2.27 2.83 3.38 3.93 4.49 5.72 6.95 9.10 13.08 19.71 0 90 180 180 270 270 270 270 270 270 300 300 300 660 1620 1620
40 0.00 0.06 0.36 0.77 1.32 1.87 2.42 2.97 3.54 4.15 4.76 5.99 7.82 10.98 16.63 22.27 0 90 180 270 270 270 270 270 300 300 300 300 660 1380 1380 1380
50 0.00 0.07 0.37 0.84 1.39 1.94 2.50 3.08 3.69 4.30 4.92 6.37 9.97 14.80 20.44 26.09 0 90 180 270 270 270 270 300 300 300 300 660 960 1320 1380 1380
60 0.00 0.07 0.39 0.87 1.43 1.98 2.55 3.17 3.78 4.39 5.01 8.84 13.31 18.70 24.10 29.58 0 90 210 270 270 270 300 300 300 300 900 960 1320 1320 1320 1380
70 0.00 0.07 0.41 0.90 1.44 2.00 2.61 3.22 3.84 5.47 7.35 11.44 16.84 22.23 27.63 33.03 0 90 240 240 270 300 300 300 300 900 960 1320 1320 1320 1320 1320
80 0.00 0.07 0.44 0.93 1.44 2.03 2.64 3.73 5.57 7.46 9.42 14.54 19.94 25.33 30.73 36.13 0 90 240 240 270 300 300 900 900 960 960 1320 1320 1320 1320 1320
90 0.00 0.07 0.46 0.95 1.45 2.05 3.51 5.35 7.22 9.19 11.82 17.21 22.61 28.01 33.41 39.44 0 90 240 240 240 300 900 900 960 960 1320 1320 1320 1320 1320 1680
100 0.00 0.07 0.48 0.98 1.47 3.00 4.84 6.70 8.71 11.40 14.10 19.50 24.90 30.30 36.17 43.04 0 90 240 240 240 900 900 960 1320 1320 1320 1320 1320 1320 1680 1680
128 Hydrologic Considerations for Estimation of Storage-Capacity Requirements of Impounding and Side-Channel Reservoirs for Water Supply in Ohio

03144000 Wakatomika Creek near Frazeysburg, Ohio—Continued
Pumpset
Ratio of storage required for pump set to storage required for the primary pump relation (pump set 1) for indicated demand (in fraction of mean
annual streamflow)
0.002 0.010 0.020 0.050 0.100 0.200 0.300
1 1.00 1.00 1.00 1.00 1.00 1.00 1.00
2 1.97 1.27 1.10 1.36 1.75 2.12 3.58
3 1.29 1.09 1.00 1.00 1.00 1.00 1.13
4 1.19 1.01 1.00 1.00 1.00 1.00 1.00
5 1.04 1.00 1.00 1.00 1.00 1.00 1.00
6 1.01 1.00 1.00 1.00 1.00 1.00 1.00
7 1.97 1.32 1.35 1.75 2.21 4.50 12.62
8 1.30 1.14 1.06 1.04 1.06 1.31 2.33
9 1.30 1.17 1.10 1.07 1.11 1.52 3.19
10 1.24 1.10 1.10 1.11 1.16 1.59 3.00
11 1.26 1.22 1.14 1.10 1.21 1.92 3.91
12 1.34 1.16 1.06 1.04 1.04 1.63 2.55
13 1.25 1.13 1.10 1.07 1.10 1.26 2.16
14 1.17 1.09 1.10 1.11 1.16 1.36 2.65
15 1.11 1.21 1.13 1.12 1.20 1.68 3.12
16 1.10 1.24 1.18 1.16 1.20 2.14 3.43
17 1.22 1.11 1.10 1.07 1.10 1.14 1.98
18 1.06 1.09 1.10 1.11 1.16 1.21 2.50
19 1.06 1.21 1.15 1.11 1.21 1.57 3.02
20 1.09 1.24 1.18 1.16 1.21 2.08 3.32
Recurrenceinterval(years)
Normalvariate
Side-channel storage required (in demand days) for primary pump relation to meet indicated demand (in fraction of mean annual streamflow)
0.0020 0.0100 0.0200 0.0500 0.1000 0.2000 0.3000
62.00 2.142 229.28 257.42 285.53 298.28 299.99 307.82 315.34
60.00 2.128 229.08 255.93 283.03 295.36 297.03 306.22 314.06
50.00 2.054 227.96 247.48 268.89 278.79 280.29 297.12 306.78
40.00 1.960 226.54 236.80 251.04 257.87 259.15 285.64 297.58
30.00 1.834 222.51 224.06 229.29 231.80 233.69 270.62 285.40
25.00 1.751 209.26 223.68 226.17 224.82 231.72 262.70 278.22
20.00 1.645 193.71 218.05 218.85 215.42 228.30 251.64 267.39
10.00 1.282 157.83 163.25 167.31 174.55 188.72 204.41 233.91
5.00 0.841 112.99 108.83 115.98 123.57 142.59 165.16 181.31
2.00 0.000 79.82 69.36 73.49 82.95 93.38 110.43 121.91
Hydrologic Design Tables 129
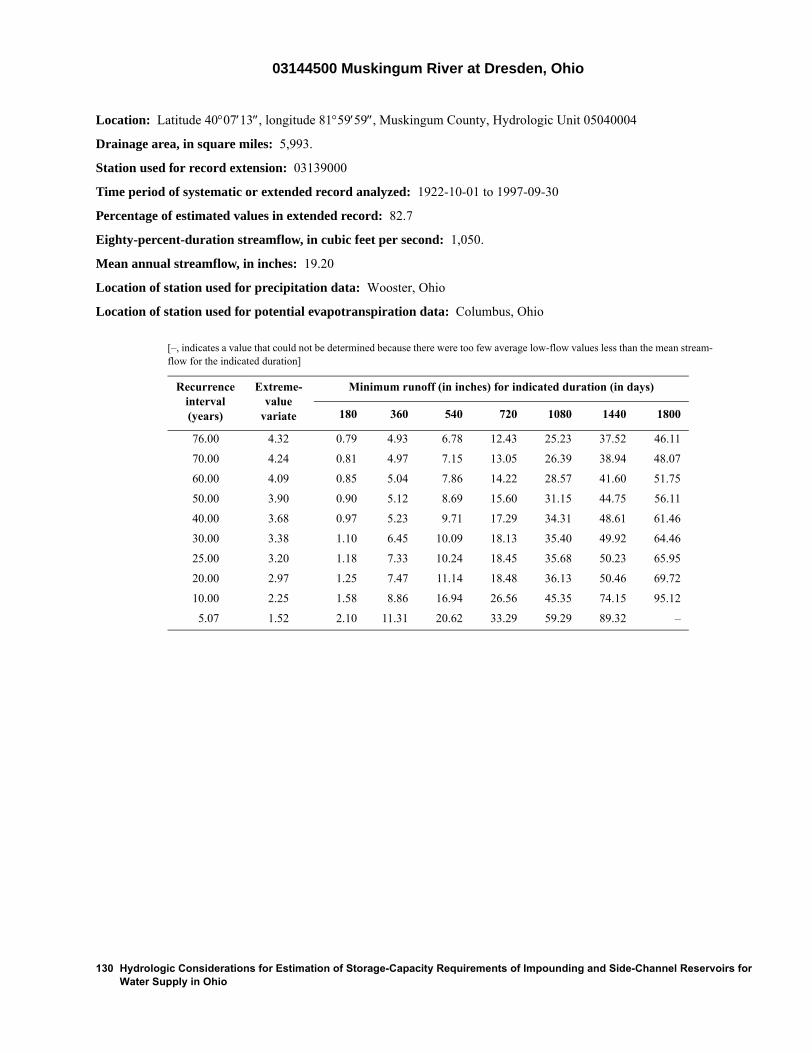
03144500 Muskingum River at Dresden, Ohio
Location: Latitude 40°07′13″, longitude 81°59′59″, Muskingum County, Hydrologic Unit 05040004
Drainage area, in square miles: 5,993.
Station used for record extension: 03139000
Time period of systematic or extended record analyzed: 1922-10-01 to 1997-09-30
Percentage of estimated values in extended record: 82.7
Eighty-percent-duration streamflow, in cubic feet per second: 1,050.
Mean annual streamflow, in inches: 19.20
Location of station used for precipitation data: Wooster, Ohio
Location of station used for potential evapotranspiration data: Columbus, Ohio
[–, indicates a value that could not be determined because there were too few average low-flow values less than the mean stream-flow for the indicated duration]
Recurrenceinterval(years)
Extreme-value
variate
Minimum runoff (in inches) for indicated duration (in days)
180 360 540 720 1080 1440 1800
76.00 4.32 0.79 4.93 6.78 12.43 25.23 37.52 46.11
70.00 4.24 0.81 4.97 7.15 13.05 26.39 38.94 48.07
60.00 4.09 0.85 5.04 7.86 14.22 28.57 41.60 51.75
50.00 3.90 0.90 5.12 8.69 15.60 31.15 44.75 56.11
40.00 3.68 0.97 5.23 9.71 17.29 34.31 48.61 61.46
30.00 3.38 1.10 6.45 10.09 18.13 35.40 49.92 64.46
25.00 3.20 1.18 7.33 10.24 18.45 35.68 50.23 65.95
20.00 2.97 1.25 7.47 11.14 18.48 36.13 50.46 69.72
10.00 2.25 1.58 8.86 16.94 26.56 45.35 74.15 95.12
5.07 1.52 2.10 11.31 20.62 33.29 59.29 89.32 –
130 Hydrologic Considerations for Estimation of Storage-Capacity Requirements of Impounding and Side-Channel Reservoirs for Water Supply in Ohio

03144500 Muskingum River at Dresden, Ohio—Continued
Recurrenceinterval(years)
Impounding reservoir storage required (in inches) and critical-drawdown duration (in days; shown in gray) for indicated draft rate (in fraction of the mean annual streamflow)
0.02 0.05 0.10 0.15 0.20 0.25 0.30 0.35 0.40 0.45 0.50 0.60 0.70 0.80 0.90 1.00
5 0.00 0.00 0.04 0.14 0.33 0.63 0.94 1.31 1.70 2.10 2.65 3.75 4.98 6.24 7.50 8.91 0 0 30 60 90 120 120 150 150 150 210 210 240 240 240 300
6 0.00 0.00 0.05 0.16 0.38 0.69 1.04 1.43 1.83 2.35 2.90 4.03 5.30 6.56 7.93 9.45 0 0 30 60 90 120 150 150 150 210 210 240 240 240 270 300
8 0.00 0.00 0.05 0.21 0.46 0.80 1.19 1.61 2.11 2.66 3.22 4.47 5.73 7.14 8.59 11.41 0 0 30 90 120 150 150 180 210 210 210 240 240 270 300 600
10 0.00 0.00 0.06 0.25 0.53 0.90 1.30 1.77 2.30 2.87 3.50 4.76 6.11 7.53 9.95 14.44 0 0 60 90 120 150 180 180 210 240 240 240 270 270 600 900
15 0.00 0.00 0.09 0.32 0.64 1.05 1.52 2.03 2.66 3.29 3.92 5.23 6.65 10.09 14.82 19.55 0 0 60 90 150 180 180 240 240 240 240 270 270 900 900 900
20 0.00 0.00 0.12 0.38 0.72 1.16 1.64 2.26 2.89 3.53 4.16 5.53 8.17 12.77 17.50 22.81 0 0 90 120 150 180 180 240 240 240 240 270 540 900 900 1740
25 0.00 0.00 0.15 0.42 0.78 1.24 1.78 2.41 3.04 3.67 4.30 6.42 9.65 14.38 19.11 27.74 0 0 90 120 150 180 240 240 240 240 270 540 900 900 900 1740
30 0.00 0.00 0.16 0.45 0.83 1.30 1.87 2.50 3.14 3.77 4.45 7.22 10.69 15.42 22.30 31.45 0 0 90 120 180 180 240 240 240 240 270 540 900 900 1740 1740
40 0.00 0.00 0.18 0.49 0.92 1.42 1.99 2.62 3.25 4.05 5.47 8.37 11.87 18.47 27.62 36.77 0 30 90 150 180 210 240 240 240 540 540 600 900 1740 1740 1740
50 0.00 0.00 0.19 0.53 0.98 1.52 2.07 2.68 3.38 4.76 6.20 9.36 13.36 22.22 31.36 40.51 0 30 120 150 180 210 210 240 270 540 600 600 1620 1740 1740 1740
60 0.00 0.00 0.20 0.57 1.05 1.60 2.16 2.78 3.84 5.39 6.97 10.12 16.20 25.06 34.30 43.77 0 30 120 150 210 210 210 270 540 600 600 600 1620 1740 1800 1800
70 0.00 0.01 0.21 0.60 1.12 1.67 2.23 2.87 4.43 6.01 7.59 10.74 18.51 27.67 37.13 46.59 0 30 120 180 210 210 210 270 600 600 600 600 1620 1800 1800 1800
80 0.00 0.01 0.23 0.64 1.18 1.74 2.29 3.37 4.95 6.52 8.10 11.91 20.62 30.09 39.55 49.01 0 30 150 180 210 210 210 600 600 600 600 1620 1800 1800 1800 1800
90 0.00 0.01 0.25 0.69 1.24 1.79 2.34 3.81 5.38 6.96 8.54 13.56 22.74 32.21 41.67 51.13 0 30 150 210 210 210 210 600 600 600 600 1620 1800 1800 1800 1800
100 0.00 0.01 0.27 0.73 1.29 1.84 2.61 4.19 5.76 7.34 8.92 15.16 24.63 34.09 43.55 53.01 0 30 150 210 210 210 600 600 600 600 600 1800 1800 1800 1800 1800
Hydrologic Design Tables 131

03144500 Muskingum River at Dresden, Ohio—Continued
Pumpset
Ratio of storage required for pump set to storage required for the primary pump relation (pump set 1) for indicated demand (in fraction of mean
annual streamflow)
0.002 0.010 0.020 0.050 0.100 0.200 0.300
1 1.00 1.00 1.00 1.00 1.00 1.00 1.00
2 1.23 1.25 1.20 1.05 1.31 1.91 1.80
3 1.03 1.10 1.15 1.02 1.00 1.29 1.06
4 1.00 1.00 1.10 1.00 1.00 1.06 1.00
5 1.00 1.00 1.05 1.00 1.00 1.00 1.00
6 1.00 1.00 1.00 1.00 1.00 1.00 1.00
7 1.23 1.31 1.26 1.34 1.84 3.20 3.45
8 1.03 1.20 1.26 1.09 1.17 1.90 1.91
9 1.04 1.21 1.28 1.12 1.44 2.31 2.62
10 1.03 1.25 1.35 1.15 1.35 2.19 2.72
11 1.04 1.27 1.35 1.18 1.45 2.33 2.95
12 1.11 1.24 1.23 1.09 1.34 2.05 2.09
13 1.03 1.16 1.24 1.11 1.20 1.92 2.04
14 1.03 1.20 1.29 1.14 1.23 2.12 2.38
15 1.04 1.18 1.28 1.18 1.29 2.33 2.71
16 1.07 1.18 1.28 1.22 1.50 2.44 3.16
17 1.02 1.14 1.22 1.11 1.19 1.86 1.75
18 1.03 1.15 1.25 1.14 1.22 2.11 2.24
19 1.04 1.12 1.25 1.18 1.29 2.33 2.60
20 1.07 1.13 1.28 1.22 1.42 2.44 3.14
132 Hydrologic Considerations for Estimation of Storage-Capacity Requirements of Impounding and Side-Channel Reservoirs for Water Supply in Ohio

03144500 Muskingum River at Dresden, Ohio—Continued
Recurrenceinterval(years)
Normalvariate
Side-channel storage required (in demand days) for primary pump relation to meet indicated demand (in fraction of mean annual streamflow)
0.0020 0.0100 0.0200 0.0500 0.1000 0.2000 0.3000
76.00 2.222 170.60 165.49 172.18 206.21 219.59 238.35 370.76
70.00 2.190 168.41 163.32 170.66 202.60 215.33 237.39 362.33
60.00 2.128 164.23 159.18 167.77 195.73 207.21 235.57 346.29
50.00 2.054 159.17 154.16 164.27 187.41 197.38 233.36 326.85
40.00 1.960 152.78 147.83 159.85 176.89 184.96 230.57 302.31
30.00 1.834 137.46 122.02 136.73 149.03 180.04 211.20 268.00
25.00 1.751 125.91 103.59 119.93 130.20 177.34 197.03 245.79
20.00 1.645 103.22 96.58 112.24 130.08 156.51 191.90 227.67
10.00 1.282 79.16 74.18 89.26 109.12 132.19 147.10 206.02
5.00 0.841 62.95 51.17 50.72 62.10 93.95 126.41 151.78
2.00 0.000 54.39 24.59 21.74 24.74 31.47 52.10 74.36
Hydrologic Design Tables 133

03146000 North Fork Licking River at Utica, Ohio
Location: Latitude 40°13′41″, longitude 82°27′06″, Licking County, Hydrologic Unit 05040006
Drainage area, in square miles: 116.
Station used for record extension: 03146500
Time period of systematic or extended record analyzed: 1939-10-01 to 1997-09-30
Percentage of estimated values in extended record: 62.0
Eighty-percent-duration streamflow, in cubic feet per second: 10.
Mean annual streamflow, in inches: 16.59
Location of station used for precipitation data: Columbus, Ohio
Location of station used for potential evapotranspiration data: Columbus, Ohio
[–, indicates a value that could not be determined because there were too few average low-flow values less than the mean stream-flow for the indicated duration]
Recurrenceinterval(years)
Extreme-value
variate
Minimum runoff (in inches) for indicated duration (in days)
180 360 540 720 1080 1440 1800
59.00 4.07 0.21 3.09 3.71 7.39 16.90 26.75 40.74
50.00 3.90 0.21 3.20 4.80 9.58 20.53 30.00 44.14
40.00 3.68 0.21 3.34 6.27 12.53 25.43 34.39 48.73
30.00 3.38 0.21 3.53 8.17 16.35 31.77 40.07 54.67
25.00 3.20 0.24 4.06 8.28 16.71 32.76 42.10 55.44
20.00 2.97 0.29 4.77 8.28 16.90 33.60 44.41 56.02
10.00 2.25 0.35 6.63 12.51 19.53 36.33 55.22 78.62
5.36 1.58 0.65 8.52 16.20 23.52 45.19 65.29 –
134 Hydrologic Considerations for Estimation of Storage-Capacity Requirements of Impounding and Side-Channel Reservoirs for Water Supply in Ohio

03146000 North Fork Licking River at Utica, Ohio—Continued
Recurrenceinterval(years)
Impounding reservoir storage required (in inches) and critical-drawdown duration (in days; shown in gray) for indicated draft rate (in fraction of the mean annual streamflow)
0.02 0.05 0.10 0.15 0.20 0.25 0.30 0.35 0.40 0.45 0.50 0.60 0.70 0.80 0.90 1.00
5 0.00 0.05 0.24 0.51 0.91 1.32 1.73 2.14 2.55 2.96 3.37 4.32 5.47 6.70 7.93 9.89 0 60 90 150 180 180 180 180 180 180 180 210 270 270 270 960
6 0.00 0.06 0.26 0.62 1.03 1.44 1.85 2.26 2.69 3.17 3.65 4.87 6.10 7.32 8.65 11.40 30 60 150 180 180 180 180 180 210 210 210 270 270 270 300 960
8 0.00 0.07 0.36 0.76 1.16 1.57 2.05 2.53 3.06 3.64 4.26 5.57 6.93 8.30 11.04 14.04 30 60 150 180 180 210 210 210 240 270 270 300 300 300 660 660
10 0.00 0.08 0.42 0.83 1.26 1.74 2.27 2.81 3.36 3.95 4.61 5.97 7.33 9.04 12.03 15.03 30 90 180 180 210 210 240 240 240 270 300 300 300 660 660 660
15 0.01 0.14 0.52 0.98 1.50 2.04 2.59 3.13 3.70 4.31 4.98 6.35 7.71 9.69 12.69 17.81 30 150 180 210 240 240 240 240 270 270 300 300 300 660 660 1680
20 0.01 0.16 0.58 1.09 1.63 2.18 2.72 3.27 3.89 4.50 5.15 6.52 8.34 10.67 15.69 23.32 30 150 210 240 240 240 240 270 270 270 300 300 480 540 1680 1680
25 0.01 0.18 0.62 1.16 1.70 2.25 2.79 3.40 4.02 4.63 5.29 7.06 9.16 11.97 19.60 27.42 60 150 210 240 240 240 240 270 270 270 300 420 480 1680 1680 1740
30 0.01 0.19 0.66 1.21 1.75 2.30 2.89 3.50 4.11 4.74 5.66 7.62 9.97 14.93 22.61 30.51 60 150 240 240 240 240 270 270 270 300 420 480 540 1680 1740 1740
40 0.01 0.20 0.71 1.26 1.81 2.42 3.04 3.65 4.32 5.30 6.48 10.03 14.37 19.49 27.00 34.91 90 180 240 240 270 270 270 270 300 480 540 900 960 1380 1740 1740
50 0.01 0.21 0.75 1.31 1.93 2.54 3.18 3.95 5.67 7.85 10.03 14.39 19.06 25.33 31.60 38.17 90 150 240 270 270 270 300 540 960 960 960 960 1380 1380 1380 1800
60 0.01 0.22 0.79 1.40 2.02 2.70 4.57 6.76 8.94 11.12 13.30 17.70 23.93 30.20 36.47 42.74 90 240 270 270 300 300 960 960 960 960 960 1320 1380 1380 1380 1380
70 0.01 0.25 0.86 1.50 2.59 4.77 6.95 9.13 11.31 13.49 15.80 21.61 27.88 34.15 40.42 46.69 90 270 270 300 960 960 960 960 960 960 1020 1380 1380 1380 1380 1380
80 0.01 0.30 0.94 2.11 4.29 6.47 8.67 10.99 13.30 16.02 18.88 24.78 31.05 37.32 43.59 49.86 90 270 300 960 960 960 1020 1020 1020 1260 1260 1380 1380 1380 1380 1380
90 0.01 0.36 1.15 3.33 5.55 7.87 10.18 12.77 15.63 18.50 21.36 27.31 33.58 39.84 46.11 52.38 90 300 960 960 1020 1020 1020 1260 1260 1260 1260 1380 1380 1380 1380 1380
100 0.03 0.43 2.02 4.30 6.62 8.94 11.76 14.63 17.49 20.35 23.21 29.31 35.58 41.85 48.12 54.39 300 300 960 1020 1020 1020 1260 1260 1260 1260 1260 1380 1380 1380 1380 1380
Hydrologic Design Tables 135

03146000 North Fork Licking River at Utica, Ohio—Continued
Pumpset
Ratio of storage required for pump set to storage required for the primary pump relation (pump set 1) for indicated demand (in fraction of mean
annual streamflow)
0.002 0.010 0.020 0.050 0.100 0.200 0.300
1 1.00 1.00 1.00 1.00 1.00 1.00 1.00
2 1.64 1.29 1.40 1.80 2.22 3.37 4.43
3 1.17 1.01 1.00 1.00 1.03 1.54 1.34
4 1.06 1.00 1.00 1.00 1.01 1.22 1.08
5 1.00 1.00 1.00 1.00 1.00 1.12 1.05
6 1.00 1.00 1.00 1.00 1.00 1.05 1.02
7 1.69 1.46 1.77 2.19 2.81 9.45 10.88
8 1.18 1.05 1.04 1.06 1.45 2.48 3.07
9 1.19 1.07 1.07 1.12 1.70 2.89 5.28
10 1.12 1.09 1.07 1.14 1.74 2.88 4.02
11 1.10 1.12 1.09 1.14 1.99 2.91 3.86
12 1.20 1.04 1.03 1.05 1.73 2.60 4.49
13 1.12 1.08 1.07 1.11 1.27 2.51 2.33
14 1.05 1.08 1.07 1.12 1.33 2.49 1.91
15 1.04 1.12 1.09 1.12 1.65 2.58 2.01
16 1.02 1.13 1.10 1.12 1.96 2.67 2.04
17 1.08 1.07 1.06 1.09 1.12 2.23 1.80
18 1.01 1.08 1.07 1.10 1.16 2.41 1.81
19 1.03 1.12 1.09 1.12 1.47 2.53 1.91
20 1.02 1.13 1.10 1.10 1.79 2.60 1.98
Recurrenceinterval(years)
Normalvariate
Side-channel storage required (in demand days) for primary pump relation to meet indicated demand (in fraction of mean annual streamflow)
0.0020 0.0100 0.0200 0.0500 0.1000 0.2000 0.3000
59.00 2.122 271.31 301.47 307.98 308.11 307.63 364.97 604.65
50.00 2.054 261.59 284.95 294.61 298.23 298.79 356.80 571.25
40.00 1.960 248.09 261.99 276.03 284.51 286.51 345.46 524.84
30.00 1.834 229.93 231.14 251.06 266.06 270.01 330.21 462.46
25.00 1.751 228.74 221.30 231.03 237.77 250.76 310.89 453.71
20.00 1.645 228.59 210.11 205.12 199.76 225.22 285.16 446.69
10.00 1.282 177.56 135.79 166.67 190.35 210.07 247.74 284.86
5.00 0.841 131.67 114.65 117.20 132.55 154.83 176.89 203.36
2.03 0.021 99.73 77.85 81.26 88.12 97.10 128.39 147.26
136 Hydrologic Considerations for Estimation of Storage-Capacity Requirements of Impounding and Side-Channel Reservoirs for Water Supply in Ohio

03146500 Licking River near Newark, Ohio
Location: Latitude 40°03′33″, longitude 82°20′23″, Licking County, Hydrologic Unit 05040006
Drainage area, in square miles: 537.
Station used for record extension: None
Time period of systematic or extended record analyzed: 1939-10-01 to 1997-09-30
Eighty-percent-duration streamflow, in cubic feet per second: 96.
Mean annual streamflow, in inches: 15.71
Location of station used for precipitation data: Columbus, Ohio
Location of station used for potential evapotranspiration data: Columbus, Ohio
[–, indicates a value that could not be determined because there were too few average low-flow values less than the mean streamflow for the indicated duration]
Recurrenceinterval(years)
Extreme-value
variate
Minimum runoff (in inches) for indicated duration (in days)
180 360 540 720 1080 1440 1800
59.00 4.07 0.61 3.93 5.04 9.46 18.74 28.13 41.97
50.00 3.90 0.63 4.10 5.87 11.08 21.86 31.18 44.90
40.00 3.68 0.65 4.32 6.98 13.28 26.08 35.31 48.86
30.00 3.38 0.68 4.61 8.43 16.11 31.53 40.65 53.99
25.00 3.20 0.69 4.74 8.84 16.55 32.14 41.63 54.41
20.00 2.97 0.70 4.88 9.30 16.92 32.54 42.53 54.58
10.00 2.25 0.94 6.20 13.47 20.28 36.76 56.00 73.35
5.36 1.58 1.20 9.04 16.07 23.90 44.45 65.12 –
Hydrologic Design Tables 137

03146500 Licking River near Newark, Ohio—Continued
Recurrenceinterval(years)
Impounding reservoir storage required (in inches) and critical-drawdown duration (in days; shown in gray) for indicated draft rate (in fraction of the mean annual streamflow)
0.02 0.05 0.10 0.15 0.20 0.25 0.30 0.35 0.40 0.45 0.50 0.60 0.70 0.80 0.90 1.00
5 0.00 0.00 0.03 0.18 0.37 0.67 1.04 1.43 1.82 2.20 2.59 3.36 4.24 5.17 6.46 7.75 0 0 30 90 90 150 180 180 180 180 180 180 210 300 300 300
6 0.00 0.00 0.04 0.18 0.41 0.77 1.15 1.54 1.93 2.32 2.72 3.62 4.75 5.99 7.28 9.03 0 0 30 90 150 180 180 180 180 180 210 210 270 300 300 660
8 0.00 0.00 0.05 0.21 0.53 0.92 1.31 1.71 2.16 2.65 3.20 4.36 5.52 6.75 8.65 11.48 0 0 60 120 180 180 180 210 210 240 270 270 270 300 660 660
10 0.00 0.00 0.06 0.26 0.63 1.02 1.45 1.95 2.46 2.98 3.50 4.65 5.81 7.09 9.72 12.55 0 0 60 150 180 180 210 240 240 240 240 270 270 300 660 660
15 0.00 0.00 0.07 0.38 0.79 1.25 1.75 2.27 2.78 3.30 3.82 4.88 6.17 8.03 10.87 16.27 0 0 60 180 210 210 240 240 240 240 240 300 300 660 660 1680
20 0.00 0.00 0.11 0.46 0.91 1.36 1.87 2.39 2.90 3.42 3.93 5.07 6.51 8.91 13.36 20.64 0 0 150 210 210 210 240 240 240 240 240 300 480 600 1680 1740
25 0.00 0.00 0.14 0.52 0.97 1.42 1.93 2.45 2.97 3.48 4.00 5.28 7.48 9.81 16.66 24.14 0 0 150 210 210 210 240 240 240 240 240 420 540 600 1740 1740
30 0.00 0.00 0.17 0.56 1.01 1.47 1.98 2.50 3.01 3.53 4.10 5.97 8.29 11.80 19.28 26.76 0 0 150 210 210 240 240 240 240 240 300 540 540 1740 1740 1740
40 0.00 0.00 0.19 0.59 1.04 1.55 2.06 2.58 3.13 3.77 4.91 7.58 11.45 16.16 23.01 30.49 0 0 150 210 210 240 240 240 300 300 540 900 900 1380 1740 1740
50 0.00 0.00 0.20 0.59 1.11 1.62 2.14 2.78 3.53 4.74 6.68 10.81 15.00 20.87 26.81 33.08 0 0 150 210 240 240 270 300 540 900 960 960 1320 1380 1380 1740
60 0.00 0.00 0.20 0.67 1.22 1.80 2.40 3.36 5.42 7.49 9.55 13.68 18.97 24.88 30.81 36.75 0 0 150 240 270 270 300 960 960 960 960 960 1320 1380 1380 1380
70 0.00 0.00 0.27 0.85 1.43 2.01 3.57 5.64 7.70 9.76 11.83 16.63 22.32 28.25 34.19 40.12 0 0 270 270 270 270 960 960 960 960 960 1320 1380 1380 1380 1380
80 0.00 0.00 0.45 1.03 1.61 3.30 5.37 7.43 9.50 11.56 14.16 19.58 25.15 31.08 37.02 42.95 0 0 270 270 270 960 960 960 960 960 1260 1260 1380 1380 1380 1380
90 0.00 0.02 0.60 1.18 2.65 4.71 6.78 8.84 11.24 13.95 16.66 22.08 27.52 33.45 39.39 45.32 0 270 270 270 960 960 960 960 1260 1260 1260 1260 1380 1380 1380 1380
100 0.00 0.13 0.71 1.69 3.76 5.82 7.97 10.54 13.25 15.96 18.67 24.09 29.51 35.44 41.37 47.31 0 270 270 960 960 960 1020 1260 1260 1260 1260 1260 1260 1380 1380 1380
138 Hydrologic Considerations for Estimation of Storage-Capacity Requirements of Impounding and Side-Channel Reservoirs for Water Supply in Ohio

03146500 Licking River near Newark, Ohio—Continued
Pumpset
Ratio of storage required for pump set to storage required for the primary pump relation (pump set 1) for indicated demand (in fraction of mean
annual streamflow)
0.002 0.010 0.020 0.050 0.100 0.200 0.300
1 1.00 1.00 1.00 1.00 1.00 1.00 1.00
2 1.73 1.30 1.36 1.72 2.13 3.21 3.67
3 1.09 1.01 1.00 1.00 1.02 1.55 1.29
4 1.00 1.00 1.00 1.00 1.00 1.18 1.06
5 1.00 1.00 1.00 1.00 1.00 1.06 1.02
6 1.00 1.00 1.00 1.00 1.00 1.00 1.00
7 1.72 1.44 1.62 2.14 2.69 8.41 8.78
8 1.10 1.04 1.05 1.04 1.28 2.58 2.46
9 1.08 1.07 1.05 1.09 1.48 2.98 3.83
10 1.02 1.08 1.08 1.12 1.48 2.98 3.26
11 1.01 1.11 1.08 1.14 1.55 3.07 3.34
12 1.14 1.04 1.03 1.02 1.62 2.75 3.56
13 1.02 1.06 1.06 1.09 1.13 2.47 1.89
14 1.02 1.07 1.08 1.11 1.15 2.62 1.97
15 1.01 1.12 1.07 1.14 1.15 2.82 2.06
16 1.03 1.14 1.09 1.11 1.54 2.91 2.35
17 1.01 1.06 1.06 1.07 1.12 2.29 1.79
18 1.02 1.07 1.08 1.10 1.13 2.55 1.90
19 1.01 1.12 1.08 1.11 1.14 2.75 2.02
20 1.01 1.12 1.09 1.09 1.41 2.85 2.18
Recurrenceinterval(years)
Normalvariate
Side-channel storage required (in demand days) for primary pump relation to meet indicated demand (in fraction of mean annual streamflow)
0.0020 0.0100 0.0200 0.0500 0.1000 0.2000 0.3000
59.00 2.122 271.82 298.97 306.44 307.63 305.97 322.19 576.64
50.00 2.054 262.71 278.52 289.09 292.98 292.94 318.29 543.37
40.00 1.960 250.06 250.12 264.98 272.63 274.84 312.87 497.14
30.00 1.834 233.06 211.94 232.58 245.28 250.50 305.58 435.01
25.00 1.751 224.94 209.63 219.72 225.03 236.67 285.88 429.03
20.00 1.645 215.01 209.59 204.44 199.01 219.36 258.95 425.87
10.00 1.282 176.23 131.17 153.18 183.12 207.31 240.04 273.80
5.00 0.841 133.88 114.62 114.97 128.77 148.66 169.14 198.99
2.03 0.021 90.00 75.83 73.07 83.84 90.36 112.48 138.26
Hydrologic Design Tables 139

03147000 Licking River at Toboso, Ohio
Location: Latitude 40°03′26″, longitude 82°13′12″, Licking County, Hydrologic Unit 05040006
Drainage area, in square miles: 672.
Station used for record extension: 03146500
Time period of systematic or extended record analyzed: 1922-10-01 to 1997-09-30
Percentage of estimated values in extended record: 48.0
Eighty-percent-duration streamflow, in cubic feet per second: 100.
Mean annual streamflow, in inches: 15.08
Location of station used for precipitation data: Columbus, Ohio
Location of station used for potential evapotranspiration data: Columbus, Ohio
[–, indicates a value that could not be determined because there were too few average low-flow values less than the mean stream-flow for the indicated duration]
Recurrenceinterval(years)
Extreme-value
variate
Minimum runoff (in inches) for indicated duration (in days)
180 360 540 720 1080 1440 1800
76.00 4.32 0.57 2.08 4.71 9.21 19.40 28.85 38.96
70.00 4.24 0.58 2.22 4.76 9.30 19.79 29.63 39.51
60.00 4.09 0.59 2.48 4.85 9.47 20.53 31.11 40.53
50.00 3.90 0.61 2.79 4.96 9.66 21.40 32.85 41.74
40.00 3.68 0.63 3.17 5.09 9.90 22.47 34.99 43.23
30.00 3.38 0.68 3.80 5.30 12.99 27.46 38.74 49.76
25.00 3.20 0.72 4.21 5.54 15.19 30.91 41.15 54.26
20.00 2.97 0.75 4.60 7.50 15.60 31.54 42.39 55.11
10.00 2.25 0.95 6.01 12.05 19.25 35.79 49.74 70.90
5.07 1.52 1.23 8.99 16.79 25.19 43.91 – –
140 Hydrologic Considerations for Estimation of Storage-Capacity Requirements of Impounding and Side-Channel Reservoirs for Water Supply in Ohio

03147000 Licking River at Toboso, Ohio—Continued
Recurrenceinterval(years)
Impounding reservoir storage required (in inches) and critical-drawdown duration (in days; shown in gray) for indicated draft rate (in fraction of the mean annual streamflow)
0.02 0.05 0.10 0.15 0.20 0.25 0.30 0.35 0.40 0.45 0.50 0.60 0.70 0.80 0.90 1.00
5 0.00 0.00 0.02 0.13 0.34 0.62 0.98 1.35 1.72 2.09 2.47 3.27 4.36 5.59 6.83 8.07 0 0 30 60 120 150 180 180 180 180 180 210 300 300 300 300
6 0.00 0.00 0.03 0.14 0.37 0.69 1.06 1.43 1.80 2.17 2.61 3.47 4.52 5.76 7.00 8.24 0 0 30 90 120 180 180 180 180 210 210 210 300 300 300 300
8 0.00 0.00 0.03 0.18 0.43 0.80 1.17 1.56 2.00 2.48 2.97 3.96 5.08 6.19 7.48 10.21 0 0 30 90 180 180 180 210 210 240 240 240 270 270 660 660
10 0.00 0.00 0.04 0.21 0.52 0.89 1.29 1.75 2.24 2.74 3.23 4.29 5.40 6.53 9.03 11.75 0 0 60 120 180 180 210 240 240 240 240 270 270 300 660 660
15 0.00 0.00 0.05 0.30 0.65 1.07 1.57 2.07 2.56 3.06 3.61 4.73 6.94 9.42 11.89 15.15 0 0 90 150 180 240 240 240 240 240 270 300 600 600 600 1260
20 0.00 0.00 0.07 0.37 0.76 1.23 1.72 2.22 2.73 3.30 4.06 6.29 8.68 11.16 13.70 20.01 0 0 90 150 210 240 240 240 270 300 540 540 600 600 900 1680
25 0.00 0.00 0.10 0.41 0.83 1.32 1.82 2.35 2.97 3.91 5.02 7.28 9.76 12.23 16.47 23.41 0 0 150 150 210 240 240 300 300 540 540 600 600 600 1680 1680
30 0.00 0.00 0.13 0.45 0.90 1.39 1.94 2.56 3.40 4.52 5.63 7.98 10.46 13.24 18.94 26.12 0 0 150 210 240 240 300 300 540 540 540 600 600 900 1740 1740
40 0.00 0.00 0.16 0.52 0.99 1.58 2.19 2.94 4.06 5.17 6.32 8.80 11.51 15.40 22.55 29.74 0 0 150 210 240 300 300 540 540 540 600 600 900 960 1740 1740
50 0.00 0.00 0.17 0.56 1.11 1.73 2.35 3.21 4.32 5.47 6.71 9.19 13.04 17.53 24.71 31.94 0 0 150 240 300 300 300 540 540 600 600 600 960 1740 1740 1800
60 0.00 0.00 0.17 0.62 1.21 1.82 2.44 3.27 4.39 5.63 6.87 10.28 14.25 19.12 26.36 33.80 0 0 150 240 300 300 300 540 600 600 600 960 960 1320 1800 1800
70 0.00 0.00 0.17 0.67 1.27 1.89 2.54 3.27 4.42 5.66 7.26 11.23 15.46 20.91 27.72 35.15 0 0 210 240 300 300 330 540 600 600 960 960 1320 1320 1800 1800
80 0.00 0.00 0.21 0.72 1.31 1.97 2.65 3.34 4.55 6.05 8.03 11.99 17.02 22.56 28.73 36.16 0 0 240 270 300 330 330 330 660 960 960 960 1320 1380 1800 1800
90 0.00 0.00 0.25 0.78 1.38 2.07 2.75 3.51 4.87 6.68 8.67 13.04 18.51 24.21 29.90 36.94 0 0 240 270 330 330 330 660 660 960 960 1260 1380 1380 1380 1800
100 0.00 0.00 0.28 0.82 1.46 2.14 2.88 3.79 5.24 7.22 9.26 14.46 19.98 25.68 31.38 37.54 0 0 240 270 330 330 360 660 960 960 1260 1260 1380 1380 1380 1800
Hydrologic Design Tables 141

03147000 Licking River at Toboso, Ohio—Continued
Pumpset
Ratio of storage required for pump set to storage required for the primary pump relation (pump set 1) for indicated demand (in fraction of mean
annual streamflow)
0.002 0.010 0.020 0.050 0.100 0.200 0.300
1 1.00 1.00 1.00 1.00 1.00 1.00 1.00
2 1.18 1.05 1.05 1.04 1.38 2.09 4.68
3 1.08 1.00 1.00 1.02 1.00 1.21 1.22
4 1.04 1.00 1.00 1.00 1.00 1.08 1.06
5 1.03 1.00 1.00 1.00 1.00 1.01 1.02
6 1.01 1.00 1.00 1.00 1.00 1.00 1.00
7 1.19 1.09 1.10 1.41 1.97 8.49 12.34
8 1.10 1.02 1.06 1.10 1.16 1.85 2.22
9 1.08 1.04 1.08 1.16 1.27 2.20 4.87
10 1.11 1.06 1.08 1.20 1.39 2.32 3.11
11 1.08 1.07 1.14 1.22 1.47 2.51 3.54
12 1.10 1.04 1.07 1.09 1.18 2.06 4.27
13 1.06 1.04 1.05 1.15 1.13 1.79 2.17
14 1.08 1.06 1.07 1.20 1.28 2.13 2.32
15 1.08 1.07 1.11 1.22 1.34 2.41 2.51
16 1.04 1.11 1.15 1.25 1.41 2.52 2.73
17 1.05 1.04 1.05 1.14 1.13 1.69 2.04
18 1.07 1.06 1.07 1.20 1.18 2.08 2.23
19 1.04 1.07 1.11 1.22 1.23 2.36 2.45
20 1.03 1.11 1.15 1.25 1.33 2.50 2.69
142 Hydrologic Considerations for Estimation of Storage-Capacity Requirements of Impounding and Side-Channel Reservoirs for Water Supply in Ohio

03147000 Licking River at Toboso, Ohio—Continued
Recurrenceinterval(years)
Normalvariate
Side-channel storage required (in demand days) for primary pump relation to meet indicated demand (in fraction of mean annual streamflow)
0.0020 0.0100 0.0200 0.0500 0.1000 0.2000 0.3000
76.00 2.222 273.38 299.50 299.58 311.74 334.83 351.66 454.74
70.00 2.190 271.69 294.18 296.58 310.53 334.54 351.65 454.15
60.00 2.128 268.49 284.05 290.87 308.23 334.00 351.62 453.02
50.00 2.054 264.60 271.77 283.95 305.45 333.34 351.58 451.66
40.00 1.960 259.69 256.27 275.21 301.93 332.51 351.54 449.93
30.00 1.834 243.13 232.10 247.74 296.38 313.95 343.00 429.79
25.00 1.751 229.11 214.77 227.94 289.13 297.33 335.72 414.73
20.00 1.645 184.25 178.28 211.23 224.44 245.48 319.17 407.09
10.00 1.282 152.46 131.03 139.21 158.43 193.40 227.55 289.90
5.00 0.841 123.75 101.13 104.25 117.51 137.52 175.64 196.60
2.00 0.000 83.58 59.54 65.54 73.12 84.54 108.79 127.68
Hydrologic Design Tables 143

03147500 Licking River below Dillon Dam near Dillon Falls, Ohio
Location: Latitude 39°59′18″, longitude 82°04′50″, Muskingum County, Hydrologic Unit 05040006
Drainage area, in square miles: 742.
Station used for record extension: 03147000
Time period of systematic or extended record analyzed: 1922-10-01 to 1961-09-30
Percentage of estimated values in extended record: 51.3
Eighty-percent-duration streamflow, in cubic feet per second: 110.
Mean annual streamflow, in inches: 13.70
Location of station used for precipitation data: McConnelsville, Ohio
Location of station used for potential evapotranspiration data: Columbus, Ohio
[–, indicates a value that could not be determined because there were too few average low-flow values less than the mean stream-flow for the indicated duration]
Recurrenceinterval(years)
Extreme-value
variate
Minimum runoff (in inches) for indicated duration (in days)
180 360 540 720 1080 1440 1800
40.00 3.68 0.58 2.14 4.84 9.46 19.97 29.57 39.37
30.00 3.38 0.65 2.65 5.02 9.88 21.18 32.14 41.51
25.00 3.20 0.70 2.98 5.13 10.15 21.95 33.77 42.87
20.00 2.97 0.75 3.38 5.27 10.48 22.90 35.78 44.55
10.00 2.25 0.88 5.27 8.16 15.98 31.84 48.10 67.53
5.71 1.65 1.11 7.26 13.88 20.22 41.55 62.39 –
144 Hydrologic Considerations for Estimation of Storage-Capacity Requirements of Impounding and Side-Channel Reservoirs for Water Supply in Ohio

03147500 Licking River below Dillon Dam near Dillon Falls, Ohio—Continued
Recurrenceinterval(years)
Impounding reservoir storage required (in inches) and critical-drawdown duration (in days; shown in gray) for indicated draft rate (in fraction of the mean annual streamflow)
0.02 0.05 0.10 0.15 0.20 0.25 0.30 0.35 0.40 0.45 0.50 0.60 0.70 0.80 0.90 1.00
5 0.00 0.00 0.02 0.17 0.35 0.58 0.84 1.15 1.49 1.90 2.35 3.33 4.45 5.58 7.67 10.15 0 0 60 90 120 120 150 180 180 240 240 300 300 300 660 660
6 0.00 0.00 0.02 0.17 0.35 0.66 0.99 1.33 1.69 2.10 2.55 3.52 4.53 5.58 7.67 10.15 0 0 60 90 120 180 180 180 210 240 240 270 270 300 660 660
8 0.00 0.00 0.02 0.17 0.47 0.80 1.14 1.53 1.93 2.35 2.80 3.76 5.06 7.09 9.11 11.24 0 0 30 90 180 180 180 210 210 240 240 270 540 540 540 600
10 0.00 0.00 0.03 0.20 0.52 0.86 1.24 1.63 2.04 2.49 2.94 4.66 6.68 8.71 10.75 13.23 0 0 30 150 180 180 210 210 240 240 240 540 540 540 600 900
15 0.00 0.00 0.04 0.29 0.57 0.94 1.37 1.82 2.30 3.31 4.33 6.39 8.64 10.89 13.62 17.95 0 0 90 150 180 210 240 240 540 540 540 600 600 600 900 1680
20 0.00 0.00 0.06 0.33 0.62 1.07 1.52 1.97 2.92 4.04 5.17 7.42 9.67 12.14 17.59 24.11 0 0 120 150 240 240 240 300 540 600 600 600 600 960 1680 1740
25 0.00 0.00 0.08 0.36 0.73 1.18 1.72 2.29 3.36 4.49 5.61 7.86 10.12 14.30 20.83 27.36 0 0 120 150 240 240 300 300 600 600 600 600 600 1740 1740 1740
30 0.00 0.00 0.09 0.38 0.83 1.37 1.93 2.54 3.49 4.62 5.74 8.00 11.08 15.44 22.18 28.93 0 0 120 240 240 300 300 330 600 600 600 600 960 1740 1800 1800
40 0.00 0.00 0.10 0.53 1.04 1.62 2.24 2.86 3.49 4.62 5.74 8.89 12.49 17.36 22.31 28.93 0 0 210 240 300 330 330 330 600 600 600 960 960 1320 1320 1800
50 0.00 0.00 0.24 0.74 1.25 1.77 2.39 3.01 3.62 4.62 6.21 10.24 15.19 20.22 25.40 30.57 0 0 270 270 270 330 330 330 330 600 960 1320 1320 1380 1380 1380
60 0.00 0.00 0.42 0.92 1.43 1.94 2.48 3.26 4.29 5.86 7.66 12.61 17.65 22.83 28.00 33.18 0 0 270 270 270 270 420 420 840 840 1320 1320 1380 1380 1380 1380
70 0.00 0.05 0.55 1.06 1.57 2.12 2.91 3.90 5.47 7.22 9.69 14.67 19.85 25.02 30.20 35.38 0 270 270 270 270 420 420 840 840 1320 1320 1380 1380 1380 1380 1380
80 0.00 0.15 0.66 1.16 1.70 2.48 3.35 4.93 6.50 8.97 11.45 16.54 21.72 26.89 32.07 37.24 0 270 270 270 420 420 840 840 840 1320 1320 1380 1380 1380 1380 1380
90 0.00 0.23 0.73 1.24 1.99 2.78 4.24 5.81 8.01 10.49 12.96 18.14 23.32 28.49 33.67 38.85 0 270 270 270 420 420 840 840 1320 1320 1380 1380 1380 1380 1380 1380
100 0.00 0.29 0.79 1.44 2.23 3.42 5.00 6.85 9.33 11.80 14.35 19.52 24.70 29.87 35.05 40.23 0 270 270 420 420 840 840 1320 1320 1320 1380 1380 1380 1380 1380 1380
Hydrologic Design Tables 145

03147500 Licking River below Dillon Dam near Dillon Falls, Ohio—Continued
Pumpset
Ratio of storage required for pump set to storage required for the primary pump relation (pump set 1) for indicated demand (in fraction of mean
annual streamflow)
0.002 0.010 0.020 0.050 0.100 0.200 0.300
1 1.00 1.00 1.00 1.00 1.00 1.00 1.00
2 1.14 1.05 1.05 1.06 1.17 1.86 2.20
3 1.08 1.00 1.00 1.03 1.00 1.02 1.14
4 1.05 1.00 1.00 1.01 1.00 1.00 1.06
5 1.03 1.00 1.00 1.00 1.00 1.00 1.03
6 1.02 1.00 1.00 1.00 1.00 1.00 1.01
7 1.15 1.09 1.09 1.11 1.79 2.83 5.75
8 1.08 1.04 1.04 1.11 1.08 1.39 2.12
9 1.11 1.04 1.06 1.16 1.14 1.65 2.63
10 1.05 1.08 1.07 1.20 1.18 1.71 2.54
11 1.08 1.09 1.09 1.25 1.23 2.07 2.65
12 1.10 1.04 1.05 1.10 1.08 1.65 2.34
13 1.06 1.04 1.06 1.15 1.14 1.48 1.93
14 1.04 1.08 1.08 1.19 1.18 1.58 2.24
15 1.06 1.09 1.09 1.25 1.20 1.98 2.53
16 1.06 1.12 1.13 1.26 1.21 2.25 2.67
17 1.05 1.04 1.06 1.14 1.14 1.42 1.84
18 1.03 1.09 1.08 1.19 1.18 1.52 2.17
19 1.04 1.09 1.09 1.25 1.20 1.96 2.42
20 1.03 1.12 1.13 1.26 1.20 2.25 2.60
Recurrenceinterval(years)
Normalvariate
Side-channel storage required (in demand days) for primary pump relation to meet indicated demand (in fraction of mean annual streamflow)
0.0020 0.0100 0.0200 0.0500 0.1000 0.2000 0.3000
40.00 1.960 274.19 298.63 299.04 302.78 329.31 347.58 385.27
30.00 1.834 267.15 264.22 262.45 297.66 328.14 347.39 384.09
25.00 1.751 262.51 241.50 238.29 294.27 327.37 347.27 383.31
20.00 1.645 256.60 212.61 207.57 289.97 326.39 347.11 382.32
10.00 1.282 167.03 122.32 140.30 175.71 192.43 230.23 319.20
5.00 0.841 131.55 104.56 104.79 123.01 151.89 179.03 221.76
2.00 0.000 90.40 61.66 62.73 75.74 91.12 115.29 127.51
146 Hydrologic Considerations for Estimation of Storage-Capacity Requirements of Impounding and Side-Channel Reservoirs for Water Supply in Ohio

03149500 Salt Creek near Chandlersville, Ohio
Location: Latitude 39°54′31″, longitude 81°51′38″, Muskingum County, Hydrologic Unit 05040004
Drainage area, in square miles: 75.7
Station used for record extension: 03144000
Time period of systematic or extended record analyzed: 1935-10-01 to 1997-09-30
Percentage of estimated values in extended record: 80.6
Eighty-percent-duration streamflow, in cubic feet per second: 5.4
Mean annual streamflow, in inches: 16.09
Location of station used for precipitation data: McConnelsville, Ohio
Location of station used for potential evapotranspiration data: Columbus, Ohio
[–, indicates a value that could not be determined because there were too few average low-flow values less than the mean streamflow for the indicated duration]
Recurrenceinterval(years)
Extreme-value
variate
Minimum runoff (in inches) for indicated duration (in days)
180 360 540 720 1080 1440 1800
63.00 4.14 0.11 3.25 5.73 10.78 21.30 33.01 46.64
60.00 4.09 0.11 3.31 5.92 11.12 22.08 33.80 47.37
50.00 3.90 0.11 3.53 6.62 12.40 25.00 36.77 50.12
40.00 3.68 0.12 3.79 7.48 13.96 28.58 40.41 53.49
30.00 3.38 0.12 4.29 8.59 16.02 32.43 44.40 57.30
25.00 3.20 0.14 5.06 9.26 17.45 32.45 44.71 58.03
20.00 2.97 0.17 5.95 10.03 18.96 32.75 45.38 59.11
10.00 2.25 0.30 6.85 12.29 21.20 40.43 58.06 75.96
5.25 1.55 0.59 9.25 15.73 24.75 46.26 – –
Hydrologic Design Tables 147

03149500 Salt Creek near Chandlersville, Ohio—Continued
Recurrenceinterval(years)
Impounding reservoir storage required (in inches) and critical-drawdown duration (in days; shown in gray) for indicated draft rate (in fraction of the mean annual streamflow)
0.02 0.05 0.10 0.15 0.20 0.25 0.30 0.35 0.40 0.45 0.50 0.60 0.70 0.80 0.90 1.00
5 0.02 0.08 0.27 0.54 0.92 1.32 1.71 2.11 2.51 2.90 3.35 4.28 5.37 6.55 7.74 8.93 30 60 120 120 180 180 180 180 180 180 210 210 270 270 270 270
6 0.02 0.09 0.33 0.64 1.03 1.42 1.82 2.22 2.61 3.07 3.53 4.57 5.62 6.75 7.94 10.34 30 90 120 150 180 180 180 180 180 210 210 240 240 270 270 600
8 0.02 0.12 0.42 0.77 1.17 1.57 1.96 2.39 2.85 3.37 3.90 4.96 6.03 7.22 9.33 11.98 30 90 150 180 180 180 180 210 210 240 240 240 270 270 600 600
10 0.03 0.15 0.48 0.86 1.26 1.65 2.08 2.57 3.10 3.63 4.16 5.24 6.43 7.62 10.22 13.22 60 120 150 180 180 180 210 240 240 240 240 270 270 270 600 960
15 0.04 0.21 0.58 0.97 1.37 1.87 2.40 2.93 3.52 4.11 4.71 5.90 7.09 8.79 12.43 19.83 90 150 180 180 210 240 240 240 270 270 270 270 270 600 1680 1680
20 0.05 0.23 0.63 1.03 1.52 2.08 2.67 3.27 3.86 4.46 5.05 6.28 7.60 9.59 15.44 22.84 90 150 180 180 240 270 270 270 270 270 270 300 300 600 1680 1680
25 0.06 0.26 0.66 1.11 1.68 2.28 2.87 3.47 4.06 4.66 5.32 6.64 7.96 10.27 16.81 24.21 90 180 180 240 270 270 270 270 270 300 300 300 300 600 1680 1680
30 0.06 0.27 0.67 1.21 1.81 2.40 3.00 3.59 4.22 4.88 5.55 6.87 8.27 11.10 17.72 25.12 120 180 180 270 270 270 270 270 300 300 300 300 600 660 1680 1680
40 0.07 0.29 0.76 1.35 1.95 2.54 3.16 3.82 4.48 5.14 5.80 7.12 9.73 13.56 19.64 26.81 120 180 270 270 270 270 300 300 300 300 300 300 660 1380 1380 1680
50 0.07 0.29 0.83 1.42 2.02 2.63 3.29 3.95 4.61 5.27 5.93 8.15 12.07 17.63 23.71 29.79 120 180 270 270 270 300 300 300 300 300 300 660 960 1380 1380 1380
60 0.07 0.31 0.87 1.46 2.06 2.70 3.36 4.02 4.68 5.34 6.89 11.12 15.87 21.68 27.50 33.51 120 210 270 270 270 300 300 300 300 300 960 960 1320 1320 1320 1380
70 0.07 0.33 0.89 1.49 2.08 2.74 3.40 4.06 5.46 7.57 9.69 13.92 19.71 25.53 31.34 37.16 120 240 270 270 270 300 300 300 960 960 960 960 1320 1320 1320 1320
80 0.07 0.35 0.90 1.50 2.10 2.76 3.56 5.65 7.77 9.88 12.00 17.27 23.08 28.90 34.71 40.53 120 240 270 270 300 300 900 960 960 960 960 1320 1320 1320 1320 1320
90 0.07 0.36 0.91 1.50 2.11 3.29 5.41 7.52 9.64 11.75 14.35 20.16 25.97 31.79 37.60 43.42 120 240 270 270 300 960 960 960 960 960 1320 1320 1320 1320 1320 1320
100 0.07 0.37 0.91 1.50 2.67 4.79 6.90 9.01 11.13 13.88 16.79 22.60 28.42 34.23 40.05 45.86 120 240 270 270 960 960 960 960 960 1320 1320 1320 1320 1320 1320 1320
148 Hydrologic Considerations for Estimation of Storage-Capacity Requirements of Impounding and Side-Channel Reservoirs for Water Supply in Ohio

03149500 Salt Creek near Chandlersville, Ohio—Continued
Pumpset
Ratio of storage required for pump set to storage required for the primary pump relation (pump set 1) for indicated demand (in fraction of mean
annual streamflow)
0.002 0.010 0.020 0.050 0.100 0.200 0.300
1 1.00 1.00 1.00 1.00 1.00 1.00 1.00
2 1.35 1.12 1.07 1.40 1.70 1.99 3.20
3 1.13 1.03 1.00 1.00 1.00 1.00 1.18
4 1.06 1.00 1.00 1.00 1.00 1.00 1.00
5 1.00 1.00 1.00 1.00 1.00 1.00 1.00
6 1.00 1.00 1.00 1.00 1.00 1.00 1.00
7 1.35 1.18 1.25 1.65 2.05 3.75 8.35
8 1.14 1.06 1.06 1.02 1.06 1.32 2.10
9 1.16 1.10 1.05 1.05 1.10 1.50 2.64
10 1.12 1.11 1.09 1.07 1.13 1.51 2.57
11 1.07 1.11 1.09 1.09 1.17 1.96 2.76
12 1.18 1.09 1.04 1.02 1.05 1.53 2.17
13 1.11 1.09 1.05 1.05 1.10 1.24 1.94
14 1.12 1.11 1.09 1.07 1.14 1.25 2.31
15 1.03 1.10 1.09 1.07 1.17 1.71 2.54
16 1.11 1.10 1.10 1.13 1.18 1.99 2.76
17 1.12 1.09 1.05 1.05 1.09 1.12 1.83
18 1.08 1.11 1.09 1.06 1.13 1.13 2.23
19 1.12 1.10 1.09 1.08 1.18 1.56 2.49
20 1.11 1.10 1.09 1.13 1.19 1.89 2.68
Recurrenceinterval(years)
Normalvariate
Side-channel storage required (in demand days) for primary pump relation to meet indicated demand (in fraction of mean annual streamflow)
0.0020 0.0100 0.0200 0.0500 0.1000 0.2000 0.3000
63.00 2.148 248.60 266.16 281.53 286.25 286.02 295.32 304.44
60.00 2.128 247.61 264.03 278.68 282.82 283.29 294.22 303.60
50.00 2.054 243.86 255.91 267.81 269.78 272.88 290.01 300.41
40.00 1.960 239.12 245.66 254.09 253.31 259.73 284.71 296.38
30.00 1.834 231.09 232.31 236.07 231.91 243.71 276.36 289.59
25.00 1.751 220.54 224.83 225.47 220.13 238.31 267.00 280.75
20.00 1.645 206.32 210.76 210.12 205.54 228.83 251.76 266.06
10.00 1.282 154.68 156.07 161.14 174.80 186.34 200.74 227.57
5.00 0.841 125.85 108.00 117.32 124.45 140.31 162.76 183.46
2.03 0.020 86.40 70.68 66.90 71.32 87.75 113.08 120.78
Hydrologic Design Tables 149

03157000 Clear Creek near Rockbridge, Ohio
Location: Latitude 39°35′18″, longitude 82°34′43″, Hocking County, Hydrologic Unit 05030204
Drainage area, in square miles: 89.0
Station used for record extension: None
Time period of systematic or extended record analyzed: 1939-10-01 to 1997-09-30
Eighty-percent-duration streamflow, in cubic feet per second: 21.
Mean annual streamflow, in inches: 13.81
Location of station used for precipitation data: McConnelsville, Ohio
Location of station used for potential evapotranspiration data: Columbus, Ohio
[–, indicates a value that could not be determined because there were too few average low-flow values less than the mean stream-flow for the indicated duration]
Recurrenceinterval(years)
Extreme-value
variate
Minimum runoff (in inches) for indicated duration (in days)
180 360 540 720 1080 1440 1800
59.00 4.07 1.06 4.02 5.77 10.35 18.72 28.25 38.43
50.00 3.90 1.06 4.27 6.55 11.51 20.24 30.93 41.51
40.00 3.68 1.06 4.62 7.60 13.07 22.28 34.55 45.66
30.00 3.38 1.06 5.06 8.96 15.09 24.93 39.24 51.04
25.00 3.20 1.10 5.71 9.20 15.64 26.95 40.64 53.18
20.00 2.97 1.17 6.55 9.42 16.22 29.47 42.18 55.66
10.00 2.25 1.40 6.73 11.69 17.83 33.10 44.92 61.31
5.36 1.58 1.63 8.14 13.19 23.25 44.29 – –
150 Hydrologic Considerations for Estimation of Storage-Capacity Requirements of Impounding and Side-Channel Reservoirs for Water Supply in Ohio

03157000 Clear Creek near Rockbridge, Ohio—Continued
Recurrenceinterval(years)
Impounding reservoir storage required (in inches) and critical-drawdown duration (in days; shown in gray) for indicated draft rate (in fraction of the mean annual streamflow)
0.02 0.05 0.10 0.15 0.20 0.25 0.30 0.35 0.40 0.45 0.50 0.60 0.70 0.80 0.90 1.00
5 0.00 0.00 0.00 0.03 0.10 0.27 0.50 0.75 1.09 1.43 1.77 2.56 3.50 4.52 5.54 7.01 0 0 0 30 60 120 120 180 180 180 180 240 270 270 270 540
6 0.00 0.00 0.00 0.03 0.11 0.30 0.52 0.81 1.15 1.49 1.84 2.71 3.61 4.53 5.60 7.64 0 0 0 30 60 120 120 180 180 180 210 240 240 270 540 540
8 0.00 0.00 0.00 0.03 0.15 0.34 0.60 0.91 1.25 1.64 2.04 2.92 3.82 4.73 6.90 10.31 0 0 0 30 90 120 150 180 180 210 210 240 240 240 900 900
10 0.00 0.00 0.00 0.03 0.18 0.39 0.67 1.00 1.36 1.75 2.15 3.06 3.97 4.94 8.18 11.58 0 0 0 30 90 150 150 180 210 210 240 240 240 600 900 900
15 0.00 0.00 0.00 0.04 0.22 0.49 0.80 1.14 1.50 1.92 2.37 3.30 4.36 5.96 9.17 13.23 0 0 0 60 120 150 180 180 210 240 240 270 300 600 900 1680
20 0.00 0.00 0.00 0.05 0.26 0.54 0.88 1.22 1.59 2.05 2.56 3.62 4.76 6.69 9.99 15.03 0 0 0 90 150 150 180 180 240 270 270 300 300 600 960 1680
25 0.00 0.00 0.00 0.05 0.29 0.59 0.93 1.27 1.72 2.23 2.74 3.86 5.08 7.43 11.06 16.47 0 0 0 90 150 180 180 180 270 270 270 300 540 960 960 1680
30 0.00 0.00 0.00 0.06 0.31 0.62 0.96 1.32 1.83 2.34 2.86 3.99 5.70 8.57 12.20 17.99 0 0 0 120 150 180 180 270 270 270 300 300 540 960 960 1680
40 0.00 0.00 0.00 0.07 0.33 0.65 0.99 1.43 1.94 2.45 2.96 4.77 7.32 10.95 15.14 21.61 0 0 0 120 150 180 180 270 270 270 270 540 960 960 1680 1740
50 0.00 0.00 0.00 0.07 0.33 0.65 0.99 1.44 1.95 2.65 3.67 6.01 9.63 13.65 19.21 25.78 0 0 0 120 150 180 180 270 270 540 540 960 960 1320 1740 1740
60 0.00 0.00 0.00 0.07 0.33 0.65 1.02 1.46 2.43 3.45 4.50 8.13 12.76 17.90 23.43 30.02 0 0 0 120 150 180 210 240 540 540 960 960 1320 1380 1740 1800
70 0.00 0.00 0.00 0.07 0.33 0.66 1.08 2.10 3.12 4.70 6.50 11.49 16.59 21.81 27.47 34.15 0 0 0 120 150 210 540 540 540 900 1320 1320 1380 1380 1740 1800
80 0.00 0.00 0.00 0.07 0.33 0.70 1.66 3.04 4.74 7.24 9.73 14.79 20.01 25.23 31.21 37.93 0 0 0 120 150 210 540 900 900 1320 1320 1380 1380 1380 1740 1800
90 0.00 0.00 0.00 0.08 0.34 1.18 2.82 4.98 7.47 9.97 12.48 17.70 22.92 28.13 34.59 41.35 0 0 0 90 210 840 900 1320 1320 1320 1380 1380 1380 1380 1740 1800
100 0.00 0.00 0.00 0.08 0.74 2.36 4.76 7.25 9.75 12.30 14.91 20.13 25.35 31.02 37.60 44.40 0 0 30 90 840 900 1320 1320 1320 1380 1380 1380 1380 1740 1740 1800
Hydrologic Design Tables 151

03157000 Clear Creek near Rockbridge, Ohio—Continued
Pumpset
Ratio of storage required for pump set to storage required for the primary pump relation (pump set 1) for indicated demand (in fraction of mean
annual streamflow)
0.002 0.010 0.020 0.050 0.100 0.200 0.300
1 1.00 1.00 1.00 1.00 1.00 1.00 1.00
2 1.56 1.53 1.44 1.65 2.13 2.45 3.57
3 1.24 1.08 1.05 1.06 1.09 1.17 1.39
4 1.02 1.00 1.00 1.00 1.03 1.06 1.08
5 1.01 1.00 1.00 1.00 1.01 1.03 1.02
6 1.03 1.00 1.00 1.00 1.00 1.01 1.01
7 1.56 1.53 1.52 2.13 3.00 5.78 7.52
8 1.25 1.10 1.08 1.15 1.57 2.18 3.49
9 1.25 1.11 1.12 1.18 1.72 2.51 5.51
10 1.21 1.10 1.09 1.16 1.79 2.84 5.59
11 1.08 1.11 1.14 1.16 1.80 2.99 6.23
12 1.28 1.12 1.11 1.21 1.68 2.17 4.20
13 1.19 1.06 1.07 1.13 1.52 2.13 3.15
14 1.01 1.07 1.08 1.13 1.59 2.51 3.43
15 1.07 1.11 1.15 1.12 1.64 2.66 4.20
16 1.07 1.14 1.16 1.15 1.90 2.80 4.73
17 1.05 1.05 1.06 1.11 1.38 1.86 2.25
18 1.07 1.04 1.09 1.11 1.48 2.27 2.49
19 1.06 1.12 1.14 1.14 1.59 2.48 3.35
20 1.02 1.14 1.16 1.15 1.80 2.68 3.88
Recurrenceinterval(years)
Normalvariate
Side-channel storage required (in demand days) for primary pump relation to meet indicated demand (in fraction of mean annual streamflow)
0.0020 0.0100 0.0200 0.0500 0.1000 0.2000 0.3000
59.00 2.122 219.85 192.05 199.03 209.92 219.82 323.83 440.00
50.00 2.054 215.33 189.74 198.98 209.50 219.06 306.70 418.59
40.00 1.960 209.06 186.53 198.90 208.91 218.00 282.90 388.84
30.00 1.834 200.62 182.22 198.81 208.13 216.58 250.91 348.85
25.00 1.751 191.51 180.66 190.52 197.97 204.64 248.54 323.07
20.00 1.645 179.47 178.83 178.94 183.85 188.06 247.89 290.37
10.00 1.282 162.65 112.05 133.09 159.03 170.23 196.38 223.36
5.00 0.841 116.73 99.65 105.20 116.70 138.05 161.38 188.86
2.03 0.021 90.69 54.24 57.90 65.94 82.34 105.06 121.89
152 Hydrologic Considerations for Estimation of Storage-Capacity Requirements of Impounding and Side-Channel Reservoirs for Water Supply in Ohio

03157500 Hocking River at Enterprise, Ohio
Location: Latitude 39°33′54″, longitude 82°28′29″, Hocking County, Hydrologic Unit 05030204
Drainage area, in square miles: 459.
Station used for record extension: None
Time period of systematic or extended record analyzed: 1931-05-01 to 1997-09-30
Eighty-percent-duration streamflow, in cubic feet per second: 80.
Mean annual streamflow, in inches: 13.97
Location of station used for precipitation data: McConnelsville, Ohio
Location of station used for potential evapotranspiration data: Columbus, Ohio
[–, indicates a value that could not be determined because there were too few average low-flow values less than the mean streamflow for the indicated duration]
Recurrenceinterval(years)
Extreme-value
variate
Minimum runoff (in inches) for indicated duration (in days)
180 360 540 720 1080 1440 1800
67.00 4.20 0.61 3.07 4.19 8.45 17.20 26.16 38.49
60.00 4.09 0.63 3.27 4.69 9.35 18.29 28.45 40.43
50.00 3.90 0.67 3.61 5.52 10.85 20.09 32.24 43.64
40.00 3.68 0.72 4.03 6.54 12.68 22.30 36.89 47.57
30.00 3.38 0.80 4.56 7.88 14.37 24.76 40.77 51.60
25.00 3.20 0.85 4.89 8.77 14.76 25.92 41.05 53.08
20.00 2.97 0.91 5.39 9.61 15.12 27.68 41.34 54.45
10.00 2.25 1.06 6.30 10.64 17.89 31.55 44.71 60.30
5.15 1.53 1.24 8.20 13.28 24.10 38.83 – –
Hydrologic Design Tables 153

03157500 Hocking River at Enterprise, Ohio—Continued
Recurrenceinterval(years)
Impounding reservoir storage required (in inches) and critical-drawdown duration (in days; shown in gray) for indicated draft rate (in fraction of the mean annual streamflow)
0.02 0.05 0.10 0.15 0.20 0.25 0.30 0.35 0.40 0.45 0.50 0.60 0.70 0.80 0.90 1.00
5 0.00 0.00 0.02 0.11 0.34 0.58 0.87 1.21 1.55 1.92 2.37 3.29 4.21 5.24 6.27 7.30 0 0 30 120 120 150 180 180 180 210 240 240 240 270 270 270
6 0.00 0.00 0.02 0.11 0.34 0.59 0.91 1.26 1.61 2.01 2.45 3.36 4.28 5.29 6.33 8.49 0 0 30 90 120 150 180 180 210 210 240 240 240 270 270 600
8 0.00 0.00 0.02 0.13 0.35 0.63 0.98 1.33 1.73 2.13 2.56 3.48 4.44 5.47 7.62 9.91 0 0 30 90 120 150 180 210 210 210 240 240 270 270 600 600
10 0.00 0.00 0.03 0.14 0.39 0.68 1.02 1.40 1.80 2.21 2.65 3.58 4.62 6.07 8.36 12.35 0 0 30 90 150 180 180 210 210 210 240 270 270 600 600 1320
15 0.00 0.00 0.03 0.19 0.46 0.76 1.12 1.52 1.92 2.39 2.91 3.94 5.06 7.11 9.61 15.09 0 0 30 120 150 180 210 210 210 270 270 270 300 600 660 1740
20 0.00 0.00 0.04 0.23 0.51 0.82 1.20 1.60 2.12 2.63 3.15 4.23 5.56 8.06 10.58 16.81 0 0 60 120 150 180 210 270 270 270 270 300 600 660 660 1740
25 0.00 0.00 0.05 0.26 0.55 0.86 1.26 1.77 2.28 2.80 3.31 4.44 6.34 8.86 11.39 17.65 0 0 60 150 150 180 210 270 270 270 270 300 660 660 660 1740
30 0.00 0.00 0.06 0.29 0.58 0.91 1.37 1.88 2.40 2.91 3.44 4.61 7.04 9.57 12.64 18.51 0 0 90 150 150 210 270 270 270 270 300 600 660 660 1020 1740
40 0.00 0.00 0.08 0.33 0.63 1.00 1.51 2.03 2.54 3.06 3.61 5.84 8.26 11.64 15.54 20.92 0 0 120 150 180 270 270 270 270 270 300 600 660 1020 1020 1740
50 0.00 0.00 0.10 0.36 0.69 1.09 1.59 2.11 2.62 3.62 4.65 6.94 10.48 14.35 18.25 24.17 0 0 120 150 180 240 270 270 270 540 540 600 960 1020 1020 1740
60 0.00 0.00 0.11 0.39 0.74 1.18 1.64 2.50 3.53 4.56 5.61 9.28 12.95 17.25 22.52 27.88 0 0 120 180 180 240 240 540 540 540 600 960 960 1380 1380 1740
70 0.00 0.00 0.12 0.44 0.79 1.25 2.25 3.28 4.31 5.91 7.75 11.42 16.03 21.30 26.58 31.86 0 0 120 180 240 240 540 540 540 960 960 960 1380 1380 1380 1380
80 0.00 0.00 0.13 0.48 0.85 1.87 2.90 4.05 5.89 7.72 9.56 14.34 19.60 24.87 30.15 35.45 0 0 180 180 240 540 540 960 960 960 960 1320 1380 1380 1380 1740
90 0.00 0.00 0.17 0.51 1.37 2.40 3.73 5.57 7.40 9.71 12.23 17.37 22.65 27.92 33.20 39.09 0 0 180 180 540 540 960 960 960 1320 1320 1380 1380 1380 1380 1800
100 0.00 0.00 0.20 0.78 1.82 3.15 4.98 7.10 9.63 12.15 14.67 19.93 25.21 30.48 35.76 42.43 0 0 180 540 540 960 960 1320 1320 1320 1320 1380 1380 1380 1380 1800
154 Hydrologic Considerations for Estimation of Storage-Capacity Requirements of Impounding and Side-Channel Reservoirs for Water Supply in Ohio

03157500 Hocking River at Enterprise, Ohio—Continued
Pumpset
Ratio of storage required for pump set to storage required for the primary pump relation (pump set 1) for indicated demand (in fraction of mean
annual streamflow)
0.002 0.010 0.020 0.050 0.100 0.200 0.300
1 1.00 1.00 1.00 1.00 1.00 1.00 1.00
2 1.53 1.51 1.50 1.77 2.12 1.77 2.56
3 1.04 1.02 1.04 1.12 1.08 1.06 1.20
4 1.02 1.00 1.00 1.03 1.01 1.00 1.03
5 1.01 1.00 1.00 1.00 1.00 1.00 1.01
6 1.00 1.00 1.00 1.00 1.00 1.00 1.00
7 1.53 1.54 1.60 2.21 2.69 3.89 6.91
8 1.05 1.04 1.10 1.20 1.50 1.73 1.88
9 1.07 1.08 1.10 1.19 1.63 2.00 3.32
10 1.05 1.06 1.08 1.21 1.77 2.14 2.95
11 1.04 1.08 1.07 1.20 1.89 2.24 3.17
12 1.14 1.11 1.14 1.29 1.57 1.81 2.66
13 1.04 1.05 1.05 1.14 1.50 1.67 2.01
14 1.03 1.05 1.05 1.16 1.65 2.01 2.11
15 1.03 1.07 1.05 1.18 1.84 2.16 2.24
16 1.03 1.08 1.04 1.15 1.89 2.35 2.38
17 1.03 1.05 1.03 1.11 1.39 1.57 1.90
18 1.03 1.05 1.04 1.15 1.59 1.97 2.00
19 1.03 1.07 1.05 1.15 1.78 2.15 2.17
20 1.05 1.08 1.04 1.13 1.89 2.34 2.34
Recurrenceinterval(years)
Normalvariate
Side-channel storage required (in demand days) for primary pump relation to meet indicated demand (in fraction of mean annual streamflow)
0.0020 0.0100 0.0200 0.0500 0.1000 0.2000 0.3000
67.00 2.172 223.42 216.95 214.21 210.31 233.23 375.34 473.83
60.00 2.128 221.18 211.55 208.21 206.14 229.96 359.66 447.96
50.00 2.054 217.39 202.44 198.08 199.09 224.44 333.19 404.28
40.00 1.960 212.61 190.94 185.30 190.20 217.48 299.77 349.15
30.00 1.834 205.62 174.67 172.77 182.09 204.14 266.08 295.56
25.00 1.751 200.43 163.08 169.34 180.71 191.22 255.46 281.42
20.00 1.645 186.07 155.41 163.59 175.15 180.93 237.33 266.86
10.00 1.282 136.71 124.94 135.72 142.67 159.05 195.83 219.20
5.00 0.841 112.02 94.95 103.65 115.85 142.66 165.99 187.15
2.03 0.019 81.56 51.81 57.40 67.86 81.61 105.83 132.42
Hydrologic Design Tables 155

03159500 Hocking River at Athens, Ohio
Location: Latitude 39°19′44″, longitude 82°05′16″, Athens County, Hydrologic Unit 05030204
Drainage area, in square miles: 943.
Station used for record extension: None
Time period of systematic or extended record analyzed: 1922-10-01 to 1997-09-30
Eighty-percent-duration streamflow, in cubic feet per second: 130.
Mean annual streamflow, in inches: 14.60
Location of station used for precipitation data: McConnelsville, Ohio
Location of station used for potential evapotranspiration data: Columbus, Ohio
[–, indicates a value that could not be determined because there were too few average low-flow values less than the mean stream-flow for the indicated duration]
Recurrenceinterval(years)
Extreme-value
variate
Minimum runoff (in inches) for indicated duration (in days)
180 360 540 720 1080 1440 1800
76.00 4.32 0.34 1.91 4.13 9.65 18.47 28.48 43.05
70.00 4.24 0.36 2.06 4.53 10.28 19.20 29.78 43.24
60.00 4.09 0.39 2.34 5.27 11.47 20.58 32.23 43.59
50.00 3.90 0.43 2.66 6.14 12.88 22.21 35.12 44.01
40.00 3.68 0.48 3.07 7.22 14.60 24.21 38.67 44.52
30.00 3.38 0.54 4.19 7.64 15.15 25.11 41.01 50.54
25.00 3.20 0.57 4.99 7.81 15.30 25.67 42.20 54.87
20.00 2.97 0.62 5.97 8.53 16.08 30.00 43.92 56.41
10.00 2.25 0.85 6.66 11.21 18.67 33.24 47.11 65.89
5.07 1.52 1.03 8.70 13.90 24.73 46.45 – –
156 Hydrologic Considerations for Estimation of Storage-Capacity Requirements of Impounding and Side-Channel Reservoirs for Water Supply in Ohio

03159500 Hocking River at Athens, Ohio—Continued
Recurrenceinterval(years)
Impounding reservoir storage required (in inches) and critical-drawdown duration (in days; shown in gray) for indicated draft rate (in fraction of the mean annual streamflow)
0.02 0.05 0.10 0.15 0.20 0.25 0.30 0.35 0.40 0.45 0.50 0.60 0.70 0.80 0.90 1.00
5 0.00 0.00 0.08 0.23 0.48 0.78 1.13 1.49 1.85 2.21 2.61 3.51 4.56 5.64 6.72 8.13 0 0 60 120 150 150 180 180 180 180 210 240 270 270 270 600
6 0.00 0.00 0.08 0.27 0.53 0.83 1.19 1.55 1.91 2.32 2.74 3.70 4.65 5.73 6.96 9.35 0 0 60 120 150 180 180 180 180 210 210 240 240 270 600 600
8 0.00 0.00 0.10 0.31 0.59 0.92 1.28 1.64 2.06 2.49 2.97 3.93 4.89 6.03 8.43 10.83 0 0 90 120 150 180 180 210 210 240 240 240 240 600 600 600
10 0.00 0.00 0.12 0.34 0.64 0.98 1.34 1.75 2.17 2.65 3.13 4.09 5.12 6.93 9.33 12.23 0 30 90 120 150 180 180 210 240 240 240 240 270 600 600 900
15 0.00 0.01 0.14 0.41 0.73 1.09 1.50 1.95 2.43 2.91 3.42 4.50 5.88 8.28 10.68 15.89 0 30 120 150 180 180 210 240 240 240 270 270 600 600 600 1740
20 0.00 0.01 0.16 0.45 0.80 1.19 1.64 2.12 2.66 3.20 3.74 4.82 6.75 9.15 12.70 19.66 0 30 120 150 180 210 240 270 270 270 270 270 600 600 1740 1740
25 0.00 0.01 0.18 0.50 0.86 1.28 1.81 2.34 2.88 3.42 3.96 5.10 7.43 9.83 14.84 21.80 0 30 150 180 180 240 270 270 270 270 270 300 600 600 1740 1740
30 0.00 0.01 0.21 0.54 0.92 1.43 1.97 2.51 3.05 3.59 4.18 5.61 8.00 10.40 16.29 23.25 0 30 150 180 210 270 270 270 270 270 300 600 600 600 1740 1740
40 0.00 0.02 0.25 0.61 1.13 1.67 2.21 2.75 3.35 3.95 4.55 6.56 8.96 11.59 18.34 25.30 0 30 150 180 270 270 270 270 300 300 300 600 600 1020 1740 1740
50 0.00 0.02 0.30 0.75 1.28 1.82 2.38 2.98 3.59 4.25 4.96 7.35 9.80 13.75 19.94 26.89 0 30 180 270 270 270 300 300 330 330 600 600 960 1020 1740 1740
60 0.00 0.02 0.34 0.85 1.39 1.93 2.53 3.17 3.83 4.58 5.66 8.03 11.80 15.70 21.36 28.32 0 60 180 270 270 270 300 330 330 540 540 600 960 1020 1740 1740
70 0.00 0.03 0.41 0.94 1.48 2.04 2.69 3.35 4.12 5.20 6.28 9.78 13.62 17.91 23.43 29.67 0 120 240 270 270 300 330 330 540 540 540 960 960 1380 1380 1740
80 0.00 0.04 0.48 1.00 1.54 2.16 2.82 3.57 4.65 5.73 7.56 11.40 15.38 20.90 26.42 31.94 0 120 240 270 270 330 330 540 540 540 960 960 1380 1380 1380 1380
90 0.00 0.06 0.53 1.05 1.60 2.26 2.95 4.03 5.15 7.07 8.99 12.83 18.12 23.64 29.15 34.67 0 120 240 270 330 330 540 540 960 960 960 960 1380 1380 1380 1380
100 0.00 0.10 0.58 1.09 1.68 2.34 3.34 4.57 6.41 8.33 10.24 15.06 20.58 26.10 31.61 37.13 0 240 240 270 330 330 540 900 960 960 960 1380 1380 1380 1380 1380
Hydrologic Design Tables 157

03159500 Hocking River at Athens, Ohio—Continued
Pumpset
Ratio of storage required for pump set to storage required for the primary pump relation (pump set 1) for indicated demand (in fraction of mean
annual streamflow)
0.002 0.010 0.020 0.050 0.100 0.200 0.300
1 1.00 1.00 1.00 1.00 1.00 1.00 1.00
2 1.03 1.00 1.00 1.00 1.35 1.79 2.50
3 1.02 1.00 1.00 1.00 1.00 1.12 1.04
4 1.01 1.00 1.00 1.00 1.00 1.03 1.01
5 1.00 1.00 1.00 1.00 1.00 1.00 1.00
6 1.00 1.00 1.00 1.00 1.00 1.00 1.00
7 1.03 1.00 1.00 1.19 1.83 4.31 7.93
8 1.02 1.01 1.01 1.03 1.09 1.43 1.77
9 1.03 1.01 1.00 1.05 1.21 1.58 2.47
10 1.02 1.02 1.04 1.10 1.23 1.77 2.10
11 1.02 1.02 1.06 1.19 1.25 1.95 2.26
12 1.03 1.00 1.01 1.02 1.17 1.63 2.06
13 1.02 1.01 1.01 1.05 1.19 1.47 1.73
14 1.02 1.03 1.04 1.10 1.23 1.59 1.89
15 1.02 1.02 1.06 1.19 1.25 1.83 2.07
16 1.03 1.02 1.07 1.22 1.35 2.19 2.26
17 1.02 1.01 1.01 1.06 1.19 1.45 1.61
18 1.02 1.03 1.04 1.10 1.23 1.57 1.87
19 1.02 1.03 1.06 1.20 1.24 1.76 2.05
20 1.03 1.02 1.07 1.22 1.32 2.14 2.23
158 Hydrologic Considerations for Estimation of Storage-Capacity Requirements of Impounding and Side-Channel Reservoirs for Water Supply in Ohio

03159500 Hocking River at Athens, Ohio—Continued
Recurrenceinterval(years)
Normalvariate
Side-channel storage required (in demand days) for primary pump relation to meet indicated demand (in fraction of mean annual streamflow)
0.0020 0.0100 0.0200 0.0500 0.1000 0.2000 0.3000
76.00 2.222 340.63 333.42 323.26 316.26 317.19 338.94 432.22
70.00 2.190 332.30 319.76 310.04 305.75 314.18 338.22 423.75
60.00 2.128 316.44 293.75 284.86 285.73 308.46 336.86 407.63
50.00 2.054 297.23 262.23 254.35 261.48 301.52 335.21 388.09
40.00 1.960 272.97 222.44 215.84 230.86 292.75 333.12 363.42
30.00 1.834 263.36 209.31 203.25 219.89 268.56 332.33 356.23
25.00 1.751 259.08 205.50 200.28 216.31 250.61 329.80 352.60
20.00 1.645 235.25 188.45 194.57 202.86 223.98 290.09 308.02
10.00 1.282 196.37 161.81 158.67 158.98 177.42 208.34 231.11
5.00 0.841 167.20 107.06 112.65 132.59 148.08 173.00 183.65
2.00 0.000 131.50 80.24 80.64 87.62 96.44 111.57 130.71
Hydrologic Design Tables 159

03159540 Shade River near Chester, Ohio
Location: Latitude 39°03′49″, longitude 81°52′55″, Meigs County, Hydrologic Unit 05030202
Drainage area, in square miles: 156.
Station used for record extension: None
Time period of systematic or extended record analyzed: 1965-06-01 to 1997-09-30
Eighty-percent-duration streamflow, in cubic feet per second: 11.
Mean annual streamflow, in inches: 15.07
Location of station used for precipitation data: Parkersburg, West Virginia
Location of station used for potential evapotranspiration data: Charleston, West Virginia
[–, indicates a value that could not be determined because there were too few average low-flow values less than the mean stream-flow for the indicated duration]
Recurrenceinterval(years)
Extreme-value
variate
Minimum runoff (in inches) for indicated duration (in days)
180 360 540 720 1080 1440 1800
33.00 3.48 0.06 3.95 4.12 10.89 21.15 34.54 47.27
30.00 3.38 0.07 4.41 4.89 12.11 22.97 36.40 49.35
25.00 3.20 0.10 5.28 6.37 14.46 26.47 39.97 53.35
20.00 2.97 0.12 6.36 8.19 17.35 30.77 44.36 58.26
10.00 2.25 0.47 7.84 11.96 21.28 35.30 51.72 71.30
5.50 1.61 0.73 8.53 13.72 23.04 38.16 63.28 –
160 Hydrologic Considerations for Estimation of Storage-Capacity Requirements of Impounding and Side-Channel Reservoirs for Water Supply in Ohio

03159540 Shade River near Chester, Ohio—Continued
Recurrenceinterval(years)
Impounding reservoir storage required (in inches) and critical-drawdown duration (in days; shown in gray) for indicated draft rate (in fraction of the mean annual streamflow)
0.02 0.05 0.10 0.15 0.20 0.25 0.30 0.35 0.40 0.45 0.50 0.60 0.70 0.80 0.90 1.00
5 0.03 0.10 0.34 0.62 0.93 1.24 1.61 1.98 2.35 2.73 3.10 3.86 4.80 5.79 6.78 10.58 60 60 120 150 150 180 180 180 180 180 180 210 240 240 240 1560
6 0.03 0.10 0.34 0.62 0.93 1.24 1.61 1.98 2.35 2.73 3.10 3.89 4.80 5.79 7.46 10.58 60 60 120 150 150 180 180 180 180 180 180 210 240 240 600 1560
8 0.03 0.10 0.34 0.62 0.93 1.25 1.62 1.99 2.40 2.83 3.26 4.13 5.00 5.86 8.26 11.78 60 60 120 150 150 180 180 180 210 210 210 210 210 210 600 960
10 0.03 0.11 0.40 0.71 1.05 1.42 1.79 2.20 2.64 3.07 3.50 4.37 5.24 6.14 8.62 12.40 60 90 150 150 180 180 180 210 210 210 210 210 210 600 600 960
15 0.05 0.24 0.55 0.92 1.29 1.70 2.14 2.57 3.01 3.50 4.00 4.99 5.98 7.54 10.02 14.39 150 150 180 180 180 210 210 210 240 240 240 240 240 600 600 1320
20 0.09 0.27 0.64 1.01 1.44 1.88 2.38 2.87 3.37 3.86 4.36 5.35 7.22 9.70 12.72 18.17 150 150 180 180 210 240 240 240 240 240 240 240 600 600 1320 1680
25 0.10 0.30 0.67 1.08 1.54 2.04 2.53 3.03 3.52 4.02 4.55 7.03 9.50 11.98 16.41 22.73 150 180 180 210 240 240 240 240 240 240 600 600 600 600 1320 1680
30 0.10 0.31 0.70 1.13 1.61 2.11 2.60 3.10 4.08 5.32 6.55 9.03 11.51 14.46 20.16 27.09 150 180 210 210 240 240 240 240 600 600 600 600 600 1320 1680 1680
40 0.10 0.31 0.74 1.17 1.93 3.17 4.41 5.65 6.88 8.12 9.36 12.55 16.76 21.10 28.03 34.97 150 180 210 210 600 600 600 600 600 600 600 1020 1020 1680 1680 1680
50 0.10 0.32 0.97 2.21 3.45 4.69 5.93 7.16 8.79 10.90 13.00 17.21 21.42 27.68 34.61 41.55 150 210 600 600 600 600 600 600 1020 1020 1020 1020 1020 1680 1680 1680
60 0.10 0.50 1.74 2.98 4.21 5.51 7.61 9.72 11.82 13.93 16.03 20.53 26.48 33.03 39.97 46.90 150 600 600 600 600 1020 1020 1020 1020 1020 1020 1440 1440 1680 1680 1680
70 0.13 0.87 2.11 3.35 5.30 7.40 9.51 11.61 13.72 15.96 18.86 24.81 30.75 37.33 44.26 51.19 600 600 600 600 1020 1020 1020 1020 1020 1260 1440 1440 1440 1680 1680 1680
80 0.31 1.06 2.30 4.37 6.48 8.58 10.69 13.04 16.01 18.98 21.95 27.89 33.84 40.76 47.69 54.62 600 600 600 1020 1020 1020 1020 1440 1440 1440 1440 1440 1440 1680 1680 1680
90 0.40 1.15 2.99 5.10 7.20 9.40 12.27 15.24 18.21 21.19 24.16 30.10 36.56 43.49 50.43 57.36 600 600 1020 1020 1020 1260 1440 1440 1440 1440 1440 1440 1680 1680 1680 1680
100 0.45 1.34 3.44 5.55 7.90 10.87 13.84 16.81 19.78 22.76 25.73 31.82 38.75 45.68 52.62 59.55 600 1020 1020 1020 1440 1440 1440 1440 1440 1440 1440 1680 1680 1680 1680 1680
Hydrologic Design Tables 161

03159540 Shade River near Chester, Ohio—Continued
Pumpset
Ratio of storage required for pump set to storage required for the primary pump relation (pump set 1) for indicated demand (in fraction of mean
annual streamflow)
0.002 0.010 0.020 0.050 0.100 0.200 0.300
1 1.00 1.00 1.00 1.00 1.00 1.00 1.00
2 1.85 1.50 1.48 1.50 1.62 1.92 1.90
3 1.16 1.02 1.01 1.00 1.03 1.59 1.34
4 1.10 1.00 1.00 1.00 1.00 1.30 1.18
5 1.05 1.00 1.00 1.00 1.00 1.09 1.08
6 1.01 1.00 1.00 1.00 1.00 1.00 1.03
7 1.85 1.53 1.52 1.59 1.85 2.99 5.60
8 1.17 1.04 1.03 1.03 1.49 2.05 1.95
9 1.16 1.05 1.04 1.05 1.67 2.36 2.52
10 1.14 1.02 1.03 1.05 1.71 2.33 2.38
11 1.13 1.04 1.06 1.06 1.84 2.32 2.28
12 1.21 1.04 1.03 1.04 1.56 2.04 2.18
13 1.13 1.02 1.03 1.03 1.37 2.17 1.90
14 1.11 1.02 1.03 1.03 1.43 2.16 1.86
15 1.06 1.04 1.06 1.06 1.59 2.12 1.86
16 1.02 1.05 1.06 1.10 1.48 2.07 1.82
17 1.10 1.01 1.03 1.02 1.18 2.06 1.71
18 1.06 1.02 1.03 1.04 1.24 2.01 1.68
19 1.04 1.03 1.06 1.06 1.37 2.00 1.66
20 1.01 1.03 1.05 1.10 1.22 1.98 1.67
Recurrenceinterval(years)
Normalvariate
Side-channel storage required (in demand days) for primary pump relation to meet indicated demand (in fraction of mean annual streamflow)
0.0020 0.0100 0.0200 0.0500 0.1000 0.2000 0.3000
33.00 1.877 215.16 225.51 224.39 225.36 225.40 239.20 335.10
30.00 1.834 213.91 219.82 219.58 221.53 222.16 235.34 325.03
25.00 1.751 211.45 208.66 210.16 214.03 215.81 227.79 305.30
20.00 1.645 208.33 194.48 198.18 204.48 207.74 218.17 280.21
10.00 1.282 126.14 104.97 111.92 130.37 141.61 165.37 177.49
5.00 0.841 97.17 94.97 92.06 100.11 117.02 144.74 161.30
2.06 0.038 62.54 46.57 45.88 55.84 74.13 95.98 115.88
162 Hydrologic Considerations for Estimation of Storage-Capacity Requirements of Impounding and Side-Channel Reservoirs for Water Supply in Ohio

03201600 Sandy Run above Big Four Hollow Creek near Lake Hope, Ohio
Location: Latitude 39°21′45″, longitude 82°18′47″, Vinton County, Hydrologic Unit 05090101
Drainage area, in square miles: 0.98
Station used for record extension: 03201700
Time period of systematic or extended record analyzed: 1957-10-01 to 1983-06-30
Percentage of estimated values in extended record: 57.3
Eighty-percent-duration streamflow, in cubic feet per second: 0.1
Mean annual streamflow, in inches: 14.65
Location of station used for precipitation data: Parkersburg, West Virginia
Location of station used for potential evapotranspiration data: Columbus, Ohio
[–, indicates a value that could not be determined because there were too few average low-flow values less than the mean streamflow for the indicated duration]
Recurrenceinterval(years)
Extreme-value
variate
Minimum runoff (in inches) for indicated duration (in days)
180 360 540 720 1080 1440 1800
26.00 3.24 0.29 4.32 6.17 16.12 30.77 42.87 58.13
25.00 3.20 0.29 4.41 6.43 16.25 30.84 42.92 58.39
20.00 2.97 0.31 4.89 7.91 16.97 31.25 43.22 59.85
10.00 2.25 0.36 6.98 11.56 18.97 32.73 48.83 65.76
5.20 1.54 0.52 8.22 12.30 21.67 39.49 54.67 –
Hydrologic Design Tables 163

03201600 Sandy Run above Big Four Hollow Creek near Lake Hope, Ohio—Continued
Recurrenceinterval(years)
Impounding reservoir storage required (in inches) and critical-drawdown duration (in days; shown in gray) for indicated draft rate (in fraction of the mean annual streamflow)
0.02 0.05 0.10 0.15 0.20 0.25 0.30 0.35 0.40 0.45 0.50 0.60 0.70 0.80 0.90 1.00
5 0.00 0.03 0.25 0.55 0.91 1.34 1.76 2.18 2.60 3.02 3.44 4.28 5.20 6.17 7.18 9.34 0 60 150 150 210 210 210 210 210 210 210 210 240 240 540 540
6 0.00 0.03 0.28 0.59 0.95 1.37 1.79 2.21 2.63 3.06 3.54 4.50 5.46 6.43 7.49 10.10 0 60 150 180 180 210 210 210 210 240 240 240 240 240 270 660
8 0.00 0.03 0.32 0.66 1.03 1.45 1.87 2.29 2.74 3.22 3.70 4.67 5.63 6.70 8.32 11.38 0 60 150 180 210 210 210 210 240 240 240 240 240 270 600 960
10 0.00 0.04 0.35 0.71 1.10 1.53 1.95 2.37 2.79 3.26 3.74 4.70 5.68 6.76 9.16 12.97 0 120 180 180 210 210 210 210 210 240 240 240 270 270 600 960
15 0.00 0.06 0.41 0.79 1.22 1.64 2.06 2.48 2.90 3.32 3.77 4.73 6.28 8.69 11.58 17.02 0 120 180 210 210 210 210 210 210 210 240 240 600 600 1260 1680
20 0.00 0.07 0.43 0.84 1.26 1.68 2.10 2.52 2.94 3.38 3.89 5.69 8.10 10.50 12.91 18.99 0 120 180 210 210 210 210 210 210 240 270 600 600 600 600 1680
25 0.00 0.07 0.43 0.85 1.27 1.69 2.11 2.62 3.16 3.70 4.89 7.29 9.70 12.11 14.51 18.99 0 150 180 210 210 210 210 270 270 270 600 600 600 600 600 1680
30 0.00 0.08 0.43 0.85 1.32 1.86 2.41 2.95 3.83 5.03 6.24 8.64 11.05 13.46 15.87 18.99 0 150 180 210 270 270 270 270 600 600 600 600 600 600 600 1680
40 0.00 0.16 0.70 1.24 1.78 2.46 3.54 4.64 5.84 7.05 8.25 10.66 13.06 15.47 17.99 25.17 0 270 270 270 270 540 540 600 600 600 600 600 600 600 1500 1800
50 0.06 0.38 0.93 1.51 2.59 3.68 4.76 5.94 7.15 8.35 9.55 11.96 14.37 19.64 26.86 34.08 270 270 270 540 540 540 540 600 600 600 600 600 600 1800 1800 1800
60 0.15 0.48 1.13 2.22 3.30 4.38 5.58 6.78 7.99 9.19 10.39 13.27 20.49 27.71 34.93 42.15 270 270 540 540 540 540 600 600 600 600 600 1800 1800 1800 1800 1800
70 0.19 0.52 1.55 2.63 3.72 4.92 6.12 7.33 8.53 9.73 12.81 20.03 27.25 34.47 41.69 48.91 270 270 540 540 600 600 600 600 600 600 1800 1800 1800 1800 1800 1800
80 0.21 0.70 1.79 2.87 4.07 5.27 6.48 7.68 11.01 14.62 18.23 25.45 32.67 39.89 47.11 54.33 270 540 540 540 600 600 600 600 1800 1800 1800 1800 1800 1800 1800 1800
90 0.21 0.85 1.93 3.10 4.30 5.51 8.03 11.64 15.25 18.86 22.47 29.69 36.91 44.13 51.35 58.57 270 540 540 600 600 600 1800 1800 1800 1800 1800 1800 1800 1800 1800 1800
100 0.29 0.94 2.05 3.26 4.46 7.68 11.29 14.91 18.52 22.13 25.74 32.96 40.18 47.40 54.62 61.84 540 540 600 600 600 1800 1800 1800 1800 1800 1800 1800 1800 1800 1800 1800
164 Hydrologic Considerations for Estimation of Storage-Capacity Requirements of Impounding and Side-Channel Reservoirs for Water Supply in Ohio

03201600 Sandy Run above Big Four Hollow Creek near Lake Hope, Ohio—Continued
Pumpset
Ratio of storage required for pump set to storage required for the primary pump relation (pump set 1) for indicated demand (in fraction of mean
annual streamflow)
0.002 0.010 0.020 0.050 0.100 0.200 0.300
1 1.00 1.00 1.00 1.00 1.00 1.00 1.00
2 1.52 1.60 1.62 1.84 2.78 4.15 6.42
3 1.12 1.01 1.00 1.02 1.04 1.22 1.31
4 1.05 1.00 1.00 1.00 1.00 1.00 1.00
5 1.00 1.00 1.00 1.00 1.00 1.00 1.00
6 1.00 1.00 1.00 1.00 1.00 1.00 1.00
7 1.52 1.64 1.71 2.67 3.91 8.14 11.48
8 1.12 1.02 1.02 1.07 1.20 1.66 3.50
9 1.12 1.02 1.03 1.08 1.28 2.32 4.93
10 1.09 1.02 1.02 1.07 1.12 1.54 3.84
11 1.04 1.03 1.02 1.09 1.17 1.59 3.19
12 1.13 1.08 1.20 1.39 1.51 2.89 4.87
13 1.08 1.02 1.01 1.04 1.09 1.34 2.51
14 1.03 1.02 1.01 1.05 1.11 1.39 1.73
15 1.00 1.01 1.01 1.08 1.17 1.42 1.78
16 1.00 1.01 1.04 1.07 1.17 1.42 1.81
17 1.05 1.01 1.00 1.03 1.09 1.21 1.58
18 1.00 1.01 1.01 1.07 1.12 1.25 1.67
19 1.00 1.02 1.02 1.08 1.18 1.28 1.73
20 1.00 1.02 1.03 1.07 1.17 1.33 1.77
Recurrenceinterval(years)
Normalvariate
Side-channel storage required (in demand days) for primary pump relation to meet indicated demand (in fraction of mean annual streamflow)
0.0020 0.0100 0.0200 0.0500 0.1000 0.2000 0.3000
26.00 1.769 263.93 244.10 237.23 230.16 235.06 247.37 261.86
25.00 1.751 262.44 242.02 235.38 229.87 234.73 246.36 260.23
20.00 1.645 253.72 229.86 224.58 228.20 232.77 240.48 250.71
10.00 1.282 218.37 195.30 196.06 204.48 207.88 219.38 227.02
5.00 0.841 156.38 132.37 138.02 160.15 171.28 189.96 203.14
2.00 0.000 100.71 60.54 68.47 79.72 98.10 113.28 136.10
Hydrologic Design Tables 165

03201700 Big Four Hollow Creek near Lake Hope, Ohio
Location: Latitude 39°21′48″, longitude 82°18′51″, Vinton County, Hydrologic Unit 05090101
Drainage area, in square miles: 1.01
Station used for record extension: 03201800
Time period of systematic or extended record analyzed: 1957-10-01 to 1983-06-30
Percentage of estimated values in extended record: 50.5
Eighty-percent-duration streamflow, in cubic feet per second: 0.1
Mean annual streamflow, in inches: 15.09
Location of station used for precipitation data: Parkersburg, West Virginia
Location of station used for potential evapotranspiration data: Columbus, Ohio
[–, indicates a value that could not be determined because there were too few average low-flow values less than the mean stream-flow for the indicated duration]
Recurrenceinterval(years)
Extreme-value
variate
Minimum runoff (in inches) for indicated duration (in days)
180 360 540 720 1080 1440 1800
26.00 3.24 0.10 4.17 5.91 16.14 29.48 44.48 59.48
25.00 3.20 0.10 4.26 6.11 16.14 29.59 44.51 59.67
20.00 2.97 0.12 4.76 7.25 16.17 30.21 44.65 60.78
10.00 2.25 0.19 6.37 10.23 17.88 31.89 45.94 64.33
5.20 1.54 0.37 8.00 12.22 24.64 40.40 60.71 80.91
166 Hydrologic Considerations for Estimation of Storage-Capacity Requirements of Impounding and Side-Channel Reservoirs for Water Supply in Ohio

03201700 Big Four Hollow Creek near Lake Hope, Ohio—Continued
Recurrenceinterval(years)
Impounding reservoir storage required (in inches) and critical-drawdown duration (in days; shown in gray) for indicated draft rate (in fraction of the mean annual streamflow)
0.02 0.05 0.10 0.15 0.20 0.25 0.30 0.35 0.40 0.45 0.50 0.60 0.70 0.80 0.90 1.00
5 0.02 0.12 0.40 0.72 1.12 1.55 1.98 2.42 2.85 3.29 3.72 4.61 5.60 6.59 7.65 9.88 60 120 150 180 210 210 210 210 210 210 210 240 240 240 540 540
6 0.03 0.12 0.43 0.78 1.17 1.60 2.04 2.47 2.90 3.38 3.87 4.86 5.86 6.85 8.88 11.42 60 150 150 180 210 210 210 210 210 240 240 240 240 240 600 660
8 0.03 0.17 0.49 0.87 1.27 1.71 2.14 2.57 3.04 3.54 4.03 5.02 6.02 7.97 10.45 13.17 60 150 180 180 210 210 210 210 240 240 240 240 240 600 600 900
10 0.03 0.19 0.55 0.92 1.35 1.79 2.22 2.65 3.09 3.57 4.07 5.06 6.10 8.23 11.57 16.65 90 150 180 180 210 210 210 210 210 240 240 240 270 600 900 1260
15 0.06 0.24 0.61 1.03 1.46 1.90 2.33 2.76 3.20 3.63 4.11 5.13 7.07 9.63 14.77 19.97 120 180 180 210 210 210 210 210 210 210 240 270 480 840 1260 1260
20 0.07 0.27 0.64 1.08 1.51 1.95 2.38 2.81 3.25 3.73 4.29 6.12 8.35 10.58 15.13 20.34 120 180 210 210 210 210 210 210 210 270 270 540 540 540 1260 1260
25 0.07 0.28 0.67 1.10 1.53 1.97 2.40 2.95 3.50 4.13 5.37 7.85 10.33 12.81 15.29 20.34 150 180 210 210 210 210 210 270 270 600 600 600 600 600 600 1260
30 0.07 0.28 0.67 1.11 1.57 2.13 2.68 3.75 4.99 6.23 7.47 9.95 12.43 14.91 17.39 20.34 150 180 210 210 270 270 270 600 600 600 600 600 600 600 600 1260
40 0.08 0.28 0.84 1.62 2.86 4.10 5.34 6.58 7.82 9.06 10.30 12.78 15.26 17.74 22.06 28.76 150 270 270 600 600 600 600 600 600 600 600 600 600 600 1620 1620
50 0.12 0.45 1.67 2.91 4.15 5.39 6.63 7.87 9.11 10.35 11.59 14.07 17.66 24.35 31.05 37.74 270 270 600 600 600 600 600 600 600 600 600 600 1620 1620 1620 1620
60 0.20 0.94 2.18 3.42 4.66 5.90 7.14 8.38 9.62 10.86 12.10 18.69 25.38 32.08 38.77 45.46 600 600 600 600 600 600 600 600 600 600 600 1620 1620 1620 1620 1620
70 0.39 1.13 2.37 3.61 4.85 6.09 7.33 8.57 11.35 14.70 18.04 24.74 31.43 38.12 44.82 51.51 600 600 600 600 600 600 600 600 1620 1620 1620 1620 1620 1620 1620 1620
80 0.46 1.20 2.44 3.68 4.92 6.16 9.16 12.50 15.85 19.20 22.54 29.24 35.93 42.63 49.32 56.01 600 600 600 600 600 600 1620 1620 1620 1620 1620 1620 1620 1620 1620 1620
90 0.48 1.23 2.47 3.71 5.71 9.06 12.41 15.75 19.10 22.45 25.79 32.49 39.18 45.88 52.57 59.26 600 600 600 600 1620 1620 1620 1620 1620 1620 1620 1620 1620 1620 1620 1620
100 0.49 1.23 2.47 4.67 8.02 11.37 14.71 18.06 21.41 24.75 28.10 34.79 41.49 48.18 54.88 61.57 600 600 600 1620 1620 1620 1620 1620 1620 1620 1620 1620 1620 1620 1620 1620
Hydrologic Design Tables 167

03201700 Big Four Hollow Creek near Lake Hope, Ohio—Continued
Pumpset
Ratio of storage required for pump set to storage required for the primary pump relation (pump set 1) for indicated demand (in fraction of mean
annual streamflow)
0.002 0.010 0.020 0.050 0.100 0.200 0.300
1 1.00 1.00 1.00 1.00 1.00 1.00 1.00
2 1.84 1.65 1.68 2.03 2.89 4.34 6.73
3 1.15 1.02 1.00 1.03 1.05 1.22 1.39
4 1.07 1.01 1.01 1.00 1.00 1.00 1.03
5 1.00 1.00 1.00 1.00 1.00 1.00 1.00
6 1.00 1.00 1.00 1.00 1.00 1.00 1.00
7 1.84 1.69 1.82 2.66 4.04 8.03 11.81
8 1.15 1.02 1.02 1.06 1.20 1.88 3.82
9 1.15 1.02 1.03 1.08 1.28 2.39 5.47
10 1.11 1.01 1.03 1.06 1.12 1.59 4.28
11 1.08 1.03 1.02 1.08 1.17 1.62 3.59
12 1.18 1.12 1.25 1.38 1.50 2.94 5.23
13 1.11 1.01 1.01 1.03 1.09 1.36 2.76
14 1.05 1.02 1.02 1.05 1.11 1.44 1.77
15 1.00 1.01 1.02 1.08 1.16 1.46 1.79
16 1.00 1.00 1.04 1.09 1.19 1.50 1.80
17 1.06 1.02 1.01 1.02 1.08 1.24 1.61
18 1.00 1.00 1.01 1.06 1.11 1.31 1.69
19 1.00 1.01 1.01 1.08 1.18 1.32 1.73
20 1.00 1.01 1.03 1.10 1.19 1.40 1.76
Recurrenceinterval(years)
Normalvariate
Side-channel storage required (in demand days) for primary pump relation to meet indicated demand (in fraction of mean annual streamflow)
0.0020 0.0100 0.0200 0.0500 0.1000 0.2000 0.3000
26.00 1.769 261.72 244.81 237.08 230.39 235.52 249.86 262.43
25.00 1.751 260.17 242.80 235.30 230.18 235.17 248.74 260.77
20.00 1.645 251.12 231.08 224.93 228.95 233.15 242.19 251.08
10.00 1.282 215.93 197.13 197.04 205.51 208.33 220.71 227.62
5.00 0.841 161.83 135.86 141.56 158.74 170.94 191.21 205.80
2.00 0.000 100.64 65.08 75.66 93.46 102.34 115.05 130.91
168 Hydrologic Considerations for Estimation of Storage-Capacity Requirements of Impounding and Side-Channel Reservoirs for Water Supply in Ohio

03201800 Sandy Run near Lake Hope, Ohio
Location: Latitude 39°20′01″, longitude 82°19′56″, Vinton County, Hydrologic Unit 05090101
Drainage area, in square miles: 4.99
Station used for record extension: 03201700
Time period of systematic or extended record analyzed: 1957-10-01 to 1983-06-30
Percentage of estimated values in extended record: 18.4
Eighty-percent-duration streamflow, in cubic feet per second: 0.2
Mean annual streamflow, in inches: 17.30
Location of station used for precipitation data: Parkersburg, West Virginia
Location of station used for potential evapotranspiration data: Columbus, Ohio
[–, indicates a value that could not be determined because there were too few average low-flow values less than the mean streamflow for the indicated duration]
Recurrenceinterval(years)
Extreme-value
variate
Minimum runoff (in inches) for indicated duration (in days)
180 360 540 720 1080 1440 1800
26.00 3.24 0.47 6.91 9.81 19.24 33.67 52.57 70.63
25.00 3.20 0.48 6.99 9.95 19.29 33.86 52.84 70.87
20.00 2.97 0.52 7.41 10.78 19.60 34.92 54.35 72.21
10.00 2.25 0.64 8.51 12.88 23.16 39.37 57.72 75.32
5.20 1.54 0.68 9.04 16.84 29.32 44.12 70.03 –
Hydrologic Design Tables 169

03201800 Sandy Run near Lake Hope, Ohio—Continued
Recurrenceinterval(years)
Impounding reservoir storage required (in inches) and critical-drawdown duration (in days; shown in gray) for indicated draft rate (in fraction of the mean annual streamflow)
0.02 0.05 0.10 0.15 0.20 0.25 0.30 0.35 0.40 0.45 0.50 0.60 0.70 0.80 0.90 1.00
5 0.01 0.09 0.30 0.63 1.04 1.46 1.89 2.31 2.74 3.17 3.62 4.61 5.61 6.60 7.60 9.04 30 90 90 150 180 180 180 180 180 180 210 210 210 210 210 600
6 0.02 0.09 0.31 0.63 1.04 1.46 1.89 2.31 2.79 3.28 3.78 4.77 5.77 6.76 8.52 11.08 30 90 90 150 180 180 180 180 210 210 210 210 210 210 540 540
8 0.02 0.10 0.31 0.64 1.04 1.46 1.93 2.43 2.93 3.42 3.92 4.92 5.91 7.71 10.43 13.55 30 60 120 150 180 180 210 210 210 210 210 210 210 540 660 660
10 0.02 0.10 0.35 0.64 1.07 1.49 1.98 2.48 2.98 3.47 3.97 4.97 5.96 7.95 10.70 14.51 30 60 120 150 180 180 210 210 210 210 210 210 210 540 660 1740
15 0.03 0.11 0.39 0.71 1.14 1.56 2.01 2.51 3.00 3.50 4.00 4.99 6.14 7.95 12.13 18.09 30 90 120 180 180 180 210 210 210 210 210 210 270 540 1020 1260
20 0.03 0.13 0.41 0.76 1.19 1.62 2.04 2.51 3.00 3.50 4.00 4.99 6.80 10.22 14.56 20.52 30 120 120 180 180 180 180 210 210 210 210 210 480 840 1260 1260
25 0.03 0.14 0.42 0.80 1.23 1.65 2.08 2.51 3.01 3.50 4.00 5.79 8.06 11.55 16.46 22.43 30 90 120 180 180 180 180 210 210 210 210 480 480 840 1260 1260
30 0.03 0.16 0.44 0.83 1.25 1.68 2.10 2.53 3.02 3.61 4.74 7.06 9.62 12.26 18.14 24.73 90 90 150 180 180 180 180 180 210 480 480 540 540 840 1260 1740
40 0.05 0.18 0.50 0.86 1.28 1.71 2.77 4.05 5.33 6.61 7.89 13.43 21.67 29.91 38.16 46.40 90 90 150 180 180 180 540 540 540 540 540 1740 1740 1740 1740 1740
50 0.07 0.19 0.55 1.19 2.47 3.75 5.24 9.36 13.48 17.61 21.73 29.97 38.21 46.45 54.70 62.94 90 90 150 540 540 540 1740 1740 1740 1740 1740 1740 1740 1740 1740 1740
60 0.07 0.23 1.19 2.67 6.79 10.91 15.04 19.16 23.28 27.40 31.52 39.76 48.00 56.25 64.49 72.73 90 150 540 1740 1740 1740 1740 1740 1740 1740 1740 1740 1740 1740 1740 1740
70 0.08 0.59 3.65 7.78 11.90 16.02 20.14 24.26 28.38 32.50 36.62 44.87 53.11 61.35 69.59 77.83 90 540 1740 1740 1740 1740 1740 1740 1740 1740 1740 1740 1740 1740 1740 1740
80 0.17 2.01 6.13 10.25 14.37 18.49 22.62 26.74 30.86 34.98 39.10 47.34 55.58 63.83 72.07 80.31 540 1740 1740 1740 1740 1740 1740 1740 1740 1740 1740 1740 1740 1740 1740 1740
90 0.69 3.16 7.29 11.41 15.53 19.65 23.77 27.89 32.01 36.13 40.25 48.50 56.99 65.51 74.04 82.561740 1740 1740 1740 1740 1740 1740 1740 1740 1740 1740 1740 1800 1800 1800 1800
100 1.22 3.69 7.81 11.93 16.05 20.18 24.30 28.42 32.65 36.91 41.17 49.70 58.23 66.75 75.28 83.801740 1740 1740 1740 1740 1740 1740 1740 1800 1800 1800 1800 1800 1800 1800 1800
170 Hydrologic Considerations for Estimation of Storage-Capacity Requirements of Impounding and Side-Channel Reservoirs for Water Supply in Ohio

03201800 Sandy Run near Lake Hope, Ohio—Continued
Pumpset
Ratio of storage required for pump set to storage required for the primary pump relation (pump set 1) for indicated demand (in fraction of mean
annual streamflow)
0.002 0.010 0.020 0.050 0.100 0.200 0.300
1 1.00 1.00 1.00 1.00 1.00 1.00 1.00
2 2.59 1.40 1.39 1.38 1.56 2.36 2.88
3 1.78 1.20 1.13 1.22 1.22 1.09 1.27
4 1.38 1.07 1.04 1.04 1.13 1.06 1.00
5 1.12 1.01 1.00 1.00 1.07 1.03 1.00
6 1.02 1.00 1.00 1.00 1.04 1.00 1.00
7 2.54 1.70 1.61 1.62 3.08 5.19 12.11
8 1.79 1.26 1.33 1.48 1.55 1.94 2.80
9 1.87 1.37 1.37 1.65 1.72 2.33 3.76
10 1.54 1.26 1.30 1.83 1.72 2.07 3.27
11 1.62 1.36 1.52 1.82 1.72 2.03 2.80
12 2.03 1.42 1.41 1.50 1.57 2.45 3.52
13 1.59 1.25 1.27 1.62 1.66 1.58 2.35
14 1.31 1.26 1.20 1.74 1.67 1.45 2.27
15 1.31 1.25 1.51 1.75 1.67 1.42 2.17
16 1.18 1.29 1.71 1.79 1.70 1.46 2.40
17 1.44 1.19 1.22 1.61 1.63 1.37 1.80
18 1.13 1.16 1.18 1.74 1.63 1.38 1.90
19 1.13 1.23 1.51 1.74 1.66 1.40 1.82
20 1.03 1.22 1.71 1.78 1.65 1.39 2.12
Recurrenceinterval(years)
Normalvariate
Side-channel storage required (in demand days) for primary pump relation to meet indicated demand (in fraction of mean annual streamflow)
0.0020 0.0100 0.0200 0.0500 0.1000 0.2000 0.3000
26.00 1.769 39.00 73.03 85.57 100.60 118.58 154.11 179.00
25.00 1.751 38.83 72.33 85.11 100.38 118.57 154.09 178.76
20.00 1.645 37.86 68.24 82.44 99.11 118.50 153.94 177.33
10.00 1.282 35.31 52.81 69.50 87.87 113.60 153.25 172.28
5.00 0.841 27.21 41.48 45.46 73.35 105.06 142.88 164.43
2.00 0.000 8.00 19.12 22.49 28.14 48.26 93.64 102.83
Hydrologic Design Tables 171

03202000 Raccoon Creek at Adamsville, Ohio
Location: Latitude 38°51′32″, longitude 82°21′43″, Gallia County, Hydrologic Unit 05090101
Drainage area, in square miles: 585.
Station used for record extension: 03159500
Time period of systematic or extended record analyzed: 1926-01-01 to 1997-09-30
Percentage of estimated values in extended record: 10.7
Eighty-percent-duration streamflow, in cubic feet per second: 49.
Mean annual streamflow, in inches: 14.88
Location of station used for precipitation data: Charleston, West Virginia
Location of station used for potential evapotranspiration data: Charleston, West Virginia
[–, indicates a value that could not be determined because there were too few average low-flow values less than the mean stream-flow for the indicated duration]
Recurrenceinterval(years)
Extreme-value
variate
Minimum runoff (in inches) for indicated duration (in days)
180 360 540 720 1080 1440 1800
72.00 4.27 0.11 1.82 5.17 12.28 22.41 35.61 47.02
70.00 4.24 0.11 1.91 5.25 12.34 22.48 35.68 47.11
60.00 4.09 0.12 2.41 5.68 12.66 22.84 36.08 47.63
50.00 3.90 0.14 2.99 6.20 13.05 23.28 36.54 48.24
40.00 3.68 0.15 3.71 6.83 13.52 23.81 37.12 48.99
30.00 3.38 0.16 4.44 7.70 14.97 25.21 39.20 50.65
25.00 3.20 0.16 4.82 8.26 16.20 26.36 41.02 51.96
20.00 2.97 0.20 5.39 8.70 16.68 27.31 41.47 53.98
10.00 2.25 0.35 6.94 10.76 18.12 34.75 47.13 66.48
5.14 1.53 0.69 8.05 12.94 24.18 46.74 73.22 –
172 Hydrologic Considerations for Estimation of Storage-Capacity Requirements of Impounding and Side-Channel Reservoirs for Water Supply in Ohio

03202000 Raccoon Creek at Adamsville, Ohio—Continued
Recurrenceinterval(years)
Impounding reservoir storage required (in inches) and critical-drawdown duration (in days; shown in gray) for indicated draft rate (in fraction of the mean annual streamflow)
0.02 0.05 0.10 0.15 0.20 0.25 0.30 0.35 0.40 0.45 0.50 0.60 0.70 0.80 0.90 1.00
5 0.01 0.08 0.31 0.58 0.88 1.19 1.54 1.97 2.40 2.83 3.26 4.11 5.05 6.03 7.01 8.79 30 60 120 150 150 150 210 210 210 210 210 210 240 240 240 540
6 0.01 0.09 0.32 0.61 0.92 1.22 1.65 2.08 2.50 2.93 3.36 4.28 5.26 6.24 7.67 9.86 30 90 120 150 150 150 210 210 210 210 210 240 240 240 540 540
8 0.01 0.11 0.37 0.67 1.01 1.38 1.80 2.23 2.66 3.09 3.56 4.54 5.52 6.69 8.93 11.38 60 90 150 150 180 180 210 210 210 210 240 240 240 540 600 600
10 0.02 0.13 0.41 0.73 1.10 1.48 1.91 2.34 2.77 3.23 3.72 4.70 5.76 7.57 10.02 14.53 60 120 150 180 180 210 210 210 210 240 240 240 270 600 600 1260
15 0.03 0.17 0.47 0.84 1.22 1.65 2.08 2.51 3.00 3.48 4.01 5.11 6.75 9.20 13.43 18.81 90 150 150 180 210 210 210 240 240 240 270 270 600 600 1320 1320
20 0.04 0.20 0.52 0.89 1.32 1.74 2.18 2.66 3.19 3.74 4.29 5.39 7.68 10.12 15.30 22.23 90 150 180 210 210 210 240 240 270 270 270 270 600 600 1320 1740
25 0.04 0.21 0.55 0.95 1.38 1.81 2.29 2.84 3.39 3.94 4.49 5.85 8.30 10.95 17.19 24.27 120 150 180 210 210 210 270 270 270 270 270 600 600 1320 1740 1740
30 0.05 0.22 0.57 0.99 1.42 1.90 2.44 2.99 3.54 4.10 4.71 6.29 8.74 11.76 18.40 25.48 120 150 180 210 210 270 270 270 270 300 300 600 600 960 1740 1740
40 0.05 0.23 0.62 1.05 1.56 2.11 2.66 3.24 3.86 4.47 5.08 6.89 9.33 13.28 19.56 26.65 120 150 210 210 270 270 270 300 300 300 300 600 600 1020 1740 1740
50 0.05 0.24 0.66 1.16 1.71 2.26 2.86 3.48 4.09 4.70 5.31 7.28 10.22 14.33 19.90 26.99 120 180 210 270 270 270 300 300 300 300 300 600 960 1020 1740 1740
60 0.05 0.25 0.72 1.26 1.81 2.41 3.02 3.63 4.24 4.89 5.57 7.55 11.12 15.08 19.95 26.99 120 210 240 270 270 300 300 300 300 330 330 600 960 1020 1680 1740
70 0.05 0.28 0.78 1.33 1.91 2.52 3.13 3.75 4.42 5.09 5.76 8.02 11.93 15.84 20.51 27.35 120 240 270 270 300 300 300 330 330 330 330 960 960 960 1680 1680
80 0.05 0.32 0.84 1.39 2.00 2.61 3.23 3.90 4.57 5.24 6.19 8.75 12.66 16.57 21.25 27.87 120 240 270 270 300 300 330 330 330 330 540 960 960 960 1380 1680
90 0.06 0.35 0.89 1.45 2.06 2.67 3.34 4.02 4.69 5.48 6.58 9.42 13.33 17.24 22.51 28.99 240 240 270 300 300 300 330 330 330 540 540 960 960 960 1380 1620
100 0.08 0.37 0.92 1.50 2.11 2.76 3.44 4.11 4.78 5.83 6.93 10.16 13.95 18.13 23.79 30.38 240 240 270 300 300 330 330 330 330 540 540 900 960 1380 1620 1620
Hydrologic Design Tables 173

03202000 Raccoon Creek at Adamsville, Ohio—Continued
Pumpset
Ratio of storage required for pump set to storage required for the primary pump relation (pump set 1) for indicated demand (in fraction of mean
annual streamflow)
0.002 0.010 0.020 0.050 0.100 0.200 0.300
1 1.00 1.00 1.00 1.00 1.00 1.00 1.00
2 1.31 1.09 1.09 1.15 1.23 1.40 2.07
3 1.16 1.02 1.00 1.00 1.00 1.00 1.04
4 1.10 1.00 1.00 1.00 1.00 1.00 1.00
5 1.06 1.00 1.00 1.00 1.00 1.00 1.00
6 1.02 1.00 1.00 1.00 1.00 1.00 1.00
7 1.32 1.13 1.16 1.28 1.48 2.71 7.29
8 1.17 1.02 1.02 1.06 1.07 1.18 1.42
9 1.17 1.04 1.03 1.09 1.13 1.29 1.71
10 1.14 1.03 1.05 1.12 1.15 1.28 1.74
11 1.12 1.05 1.10 1.14 1.17 1.31 1.86
12 1.19 1.03 1.02 1.05 1.09 1.23 1.67
13 1.14 1.03 1.03 1.09 1.13 1.12 1.39
14 1.11 1.03 1.05 1.12 1.15 1.15 1.50
15 1.08 1.05 1.10 1.14 1.18 1.21 1.64
16 1.06 1.04 1.13 1.17 1.18 1.30 2.09
17 1.11 1.03 1.03 1.09 1.13 1.12 1.34
18 1.08 1.03 1.05 1.12 1.15 1.14 1.45
19 1.04 1.05 1.10 1.14 1.19 1.17 1.65
20 1.03 1.04 1.13 1.17 1.18 1.30 2.11
174 Hydrologic Considerations for Estimation of Storage-Capacity Requirements of Impounding and Side-Channel Reservoirs for Water Supply in Ohio

03202000 Raccoon Creek at Adamsville, Ohio—Continued
Recurrenceinterval(years)
Normalvariate
Side-channel storage required (in demand days) for primary pump relation to meet indicated demand (in fraction of mean annual streamflow)
0.0020 0.0100 0.0200 0.0500 0.1000 0.2000 0.3000
72.00 2.201 253.34 280.41 282.79 285.48 294.18 309.09 317.88
70.00 2.190 252.71 278.30 280.50 283.32 291.92 306.79 316.65
60.00 2.128 249.24 266.65 267.87 271.37 279.44 294.07 309.85
50.00 2.054 245.04 252.53 252.56 256.89 264.32 278.66 301.61
40.00 1.960 239.73 234.71 233.23 238.61 245.24 259.21 291.21
30.00 1.834 232.08 218.94 223.37 225.05 231.71 247.55 275.15
25.00 1.751 226.83 211.58 222.88 220.21 227.30 245.25 263.77
20.00 1.645 220.95 208.59 208.82 212.33 223.83 243.96 260.99
10.00 1.282 175.48 175.51 177.38 174.29 182.50 209.86 229.11
5.00 0.841 138.47 130.62 138.03 146.83 148.82 174.33 184.90
2.00 0.000 88.57 72.82 71.35 80.43 94.90 123.06 132.74
Hydrologic Design Tables 175

03217500 Scioto River at Larue, Ohio
Location: Latitude 40°34′28″, longitude 83°23′15″, Marion County, Hydrologic Unit 05060001
Drainage area, in square miles: 257.
Station used for record extension: 03265000
Time period of systematic or extended record analyzed: 1922-10-01 to 1997-09-30
Percentage of estimated values in extended record: 70.7
Eighty-percent-duration streamflow, in cubic feet per second: 12.
Mean annual streamflow, in inches: 12.20
Location of station used for precipitation data: Kenton, Ohio
Location of station used for potential evapotranspiration data: Fort Wayne, Indiana
[–, indicates a value that could not be determined because there were too few average low-flow values less than the mean stream-flow for the indicated duration]
Recurrenceinterval(years)
Extreme-value
variate
Minimum runoff (in inches) for indicated duration (in days)
180 360 540 720 1080 1440 1800
76.00 4.32 0.14 1.90 3.38 6.75 14.56 22.18 29.52
70.00 4.24 0.14 1.93 3.44 7.02 15.08 22.87 30.30
60.00 4.09 0.14 1.97 3.56 7.53 16.06 24.17 31.77
50.00 3.90 0.15 2.03 3.70 8.13 17.22 25.71 33.51
40.00 3.68 0.15 2.10 3.87 8.87 18.64 27.60 35.65
30.00 3.38 0.17 2.14 4.13 9.55 19.27 28.79 36.61
25.00 3.20 0.19 2.16 4.30 9.94 19.50 29.36 36.97
20.00 2.97 0.20 2.26 4.54 10.33 19.59 29.64 37.41
10.00 2.25 0.28 3.70 5.68 11.72 24.71 41.08 54.43
5.07 1.52 0.43 5.99 11.66 18.86 37.93 – –
176 Hydrologic Considerations for Estimation of Storage-Capacity Requirements of Impounding and Side-Channel Reservoirs for Water Supply in Ohio

03217500 Scioto River at Larue, Ohio—Continued
Recurrenceinterval(years)
Impounding reservoir storage required (in inches) and critical-drawdown duration (in days; shown in gray) for indicated draft rate (in fraction of the mean annual streamflow)
0.02 0.05 0.10 0.15 0.20 0.25 0.30 0.35 0.40 0.45 0.50 0.60 0.70 0.80 0.90 1.00
5 0.00 0.04 0.22 0.46 0.76 1.06 1.36 1.69 2.05 2.40 2.75 3.45 4.21 5.15 6.15 7.15 0 90 120 180 180 180 180 210 210 210 210 210 240 300 300 300
6 0.00 0.05 0.24 0.51 0.82 1.14 1.49 1.84 2.19 2.57 2.97 3.81 4.71 5.63 7.25 9.11 30 90 150 180 180 210 210 210 210 240 240 270 270 300 540 600
8 0.00 0.06 0.28 0.59 0.94 1.29 1.68 2.08 2.50 2.95 3.40 4.30 5.71 7.52 9.46 11.46 30 90 180 210 210 210 240 240 270 270 270 270 540 540 600 600
10 0.00 0.07 0.33 0.66 1.02 1.42 1.82 2.25 2.70 3.15 3.60 4.87 6.67 8.67 10.68 12.78 30 120 180 210 240 240 240 270 270 270 270 540 540 600 600 960
15 0.00 0.09 0.39 0.75 1.15 1.55 2.00 2.45 2.90 3.37 4.08 6.08 8.08 10.09 12.57 16.70 30 150 210 240 240 240 270 270 270 300 540 600 600 600 960 1680
20 0.00 0.11 0.43 0.80 1.20 1.62 2.07 2.54 3.04 3.70 4.70 6.70 8.71 10.75 15.04 20.65 30 180 210 240 240 270 270 300 300 600 600 600 600 960 1680 1680
25 0.00 0.13 0.45 0.83 1.23 1.66 2.13 2.64 3.14 4.04 5.05 7.05 9.06 11.64 17.24 22.85 30 180 210 240 240 270 300 300 300 600 600 600 600 960 1680 1680
30 0.00 0.14 0.47 0.85 1.25 1.69 2.19 2.69 3.26 4.26 5.26 7.27 9.27 13.03 18.72 24.53 30 180 210 240 240 300 300 300 600 600 600 600 600 1680 1740 1740
40 0.01 0.15 0.49 0.88 1.28 1.75 2.25 2.75 3.51 4.51 5.52 7.52 10.30 15.00 20.81 26.62 30 180 210 240 240 300 300 300 600 600 600 600 960 1740 1740 1740
50 0.01 0.16 0.51 0.91 1.31 1.77 2.27 2.77 3.66 4.66 5.66 8.11 11.32 16.15 21.97 27.96 30 180 240 240 270 300 300 300 600 600 600 960 960 1740 1740 1800
60 0.01 0.16 0.53 0.93 1.35 1.80 2.28 2.78 3.75 4.75 5.83 9.03 12.24 17.04 23.05 29.07 30 180 240 240 270 270 300 300 600 600 960 960 960 1800 1800 1800
70 0.01 0.17 0.56 0.96 1.39 1.84 2.29 2.87 3.86 5.07 6.67 9.88 13.18 17.87 23.88 29.90 30 210 240 240 270 270 270 540 660 960 960 960 1320 1800 1800 1800
80 0.01 0.18 0.58 0.98 1.42 1.87 2.32 3.15 4.26 5.85 7.45 10.66 14.53 18.94 24.54 30.55 60 240 240 240 270 270 270 660 660 960 960 960 1320 1320 1800 1800
90 0.01 0.20 0.60 1.00 1.45 1.90 2.42 3.52 4.96 6.56 8.16 11.39 15.80 20.21 25.07 31.08 120 240 240 270 270 270 660 660 960 960 960 1320 1320 1320 1800 1800
100 0.01 0.21 0.62 1.03 1.48 1.93 2.75 4.00 5.61 7.21 8.82 12.58 16.99 21.40 25.81 31.53 120 240 240 270 270 270 660 960 960 960 960 1320 1320 1320 1320 1800
Hydrologic Design Tables 177

03217500 Scioto River at Larue, Ohio—Continued
Pumpset
Ratio of storage required for pump set to storage required for the primary pump relation (pump set 1) for indicated demand (in fraction of mean
annual streamflow)
0.002 0.010 0.020 0.050 0.100 0.200 0.300
1 1.00 1.00 1.00 1.00 1.00 1.00 1.00
2 1.26 1.18 1.37 1.62 2.15 14.60 25.85
3 1.08 1.03 1.00 1.00 1.00 1.35 1.60
4 1.05 1.00 1.00 1.00 1.00 1.11 1.18
5 1.04 1.00 1.00 1.00 1.00 1.00 1.04
6 1.01 1.00 1.00 1.00 1.00 1.00 1.01
7 1.26 1.52 1.72 2.16 14.80 49.16 52.00
8 1.10 1.06 1.09 1.10 1.35 2.86 9.67
9 1.08 1.08 1.11 1.14 1.44 3.91 20.49
10 1.12 1.09 1.18 1.16 1.37 3.27 9.30
11 1.14 1.12 1.22 1.17 1.30 2.87 6.65
12 1.11 1.07 1.06 1.17 1.50 4.29 20.32
13 1.06 1.06 1.09 1.13 1.19 2.32 3.53
14 1.10 1.08 1.16 1.16 1.12 2.33 3.19
15 1.10 1.13 1.21 1.18 1.17 2.40 3.07
16 1.08 1.11 1.20 1.20 1.20 2.46 3.09
17 1.06 1.05 1.09 1.14 1.09 2.09 2.69
18 1.07 1.08 1.15 1.16 1.10 2.09 2.43
19 1.06 1.12 1.21 1.19 1.15 2.21 2.47
20 1.08 1.10 1.20 1.19 1.20 2.32 2.59
178 Hydrologic Considerations for Estimation of Storage-Capacity Requirements of Impounding and Side-Channel Reservoirs for Water Supply in Ohio
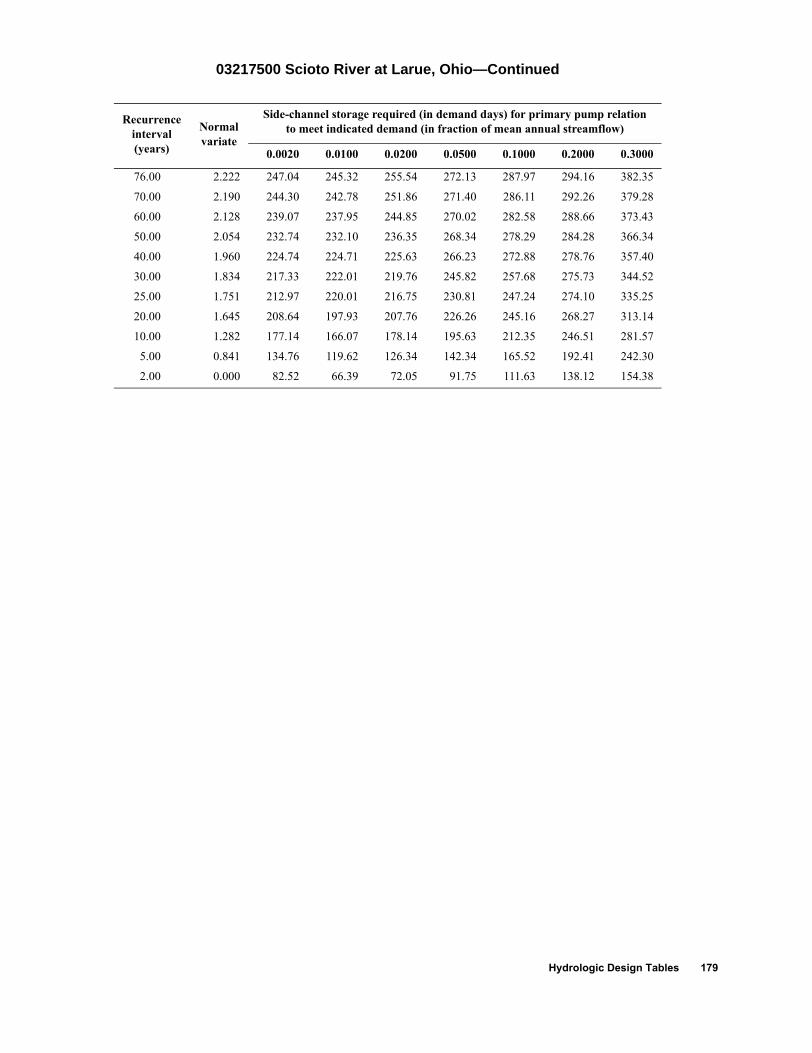
03217500 Scioto River at Larue, Ohio—Continued
Recurrenceinterval(years)
Normalvariate
Side-channel storage required (in demand days) for primary pump relation to meet indicated demand (in fraction of mean annual streamflow)
0.0020 0.0100 0.0200 0.0500 0.1000 0.2000 0.3000
76.00 2.222 247.04 245.32 255.54 272.13 287.97 294.16 382.35
70.00 2.190 244.30 242.78 251.86 271.40 286.11 292.26 379.28
60.00 2.128 239.07 237.95 244.85 270.02 282.58 288.66 373.43
50.00 2.054 232.74 232.10 236.35 268.34 278.29 284.28 366.34
40.00 1.960 224.74 224.71 225.63 266.23 272.88 278.76 357.40
30.00 1.834 217.33 222.01 219.76 245.82 257.68 275.73 344.52
25.00 1.751 212.97 220.01 216.75 230.81 247.24 274.10 335.25
20.00 1.645 208.64 197.93 207.76 226.26 245.16 268.27 313.14
10.00 1.282 177.14 166.07 178.14 195.63 212.35 246.51 281.57
5.00 0.841 134.76 119.62 126.34 142.34 165.52 192.41 242.30
2.00 0.000 82.52 66.39 72.05 91.75 111.63 138.12 154.38
Hydrologic Design Tables 179

03218000 Little Scioto River above Marion, Ohio
Location: Latitude 40°37′43″, longitude 83°10′11″, Marion County, Hydrologic Unit 05060001
Drainage area, in square miles: 72.4
Station used for record extension: 03223000
Time period of systematic or extended record analyzed: 1938-10-01 to 1997-09-30
Percentage of estimated values in extended record: 44.1
Eighty-percent-duration streamflow, in cubic feet per second: 0.6
Mean annual streamflow, in inches: 10.49
Location of station used for precipitation data: Kenton, Ohio
Location of station used for potential evapotranspiration data: Columbus, Ohio
[–, indicates a value that could not be determined because there were too few average low-flow values less than the mean stream-flow for the indicated duration]
Recurrenceinterval(years)
Extreme-value
variate
Minimum runoff (in inches) for indicated duration (in days)
180 360 540 720 1080 1440 1800
60.00 4.09 0.01 1.73 3.50 5.49 12.41 18.52 24.14
50.00 3.90 0.01 1.93 3.96 6.12 13.19 20.23 26.21
40.00 3.68 0.02 2.18 4.52 6.89 14.16 22.32 28.75
30.00 3.38 0.02 2.50 5.25 7.88 15.40 25.03 32.04
25.00 3.20 0.02 2.63 5.38 8.74 16.81 25.93 35.11
20.00 2.97 0.02 2.79 5.54 9.79 18.55 27.03 38.89
10.00 2.25 0.07 3.32 6.99 10.79 23.65 34.51 46.05
5.45 1.60 0.13 4.22 9.67 17.43 30.11 49.66 –
180 Hydrologic Considerations for Estimation of Storage-Capacity Requirements of Impounding and Side-Channel Reservoirs for Water Supply in Ohio

03218000 Little Scioto River above Marion, Ohio—Continued
Recurrenceinterval(years)
Impounding reservoir storage required (in inches) and critical-drawdown duration (in days; shown in gray) for indicated draft rate (in fraction of the mean annual streamflow)
0.02 0.05 0.10 0.15 0.20 0.25 0.30 0.35 0.40 0.45 0.50 0.60 0.70 0.80 0.90 1.00
5 0.03 0.16 0.39 0.65 0.91 1.17 1.45 1.80 2.14 2.49 2.85 3.63 4.40 5.18 5.95 6.73 90 120 180 180 180 180 240 240 240 240 270 270 270 270 270 270
6 0.04 0.16 0.39 0.65 0.91 1.20 1.51 1.85 2.19 2.54 2.90 3.67 4.45 5.22 6.04 6.97 90 120 180 180 180 210 210 240 240 240 270 270 270 270 300 600
8 0.05 0.17 0.41 0.70 1.00 1.30 1.61 1.96 2.30 2.65 3.01 3.78 4.64 5.54 7.26 8.98 120 150 180 210 210 210 240 240 240 240 270 300 300 600 600 600
10 0.06 0.18 0.45 0.75 1.05 1.35 1.70 2.04 2.39 2.73 3.13 3.99 4.85 6.41 8.13 9.85 120 150 210 210 210 240 240 240 240 240 300 300 300 600 600 600
15 0.08 0.22 0.51 0.81 1.14 1.49 1.83 2.18 2.55 2.98 3.41 4.27 5.55 7.27 9.16 12.31 150 180 210 210 240 240 240 240 300 300 300 300 600 600 660 1380
20 0.08 0.23 0.53 0.86 1.21 1.55 1.90 2.26 2.69 3.12 3.55 4.42 6.13 8.21 10.95 15.15 150 180 210 240 240 240 240 300 300 300 300 300 660 900 960 1740
25 0.08 0.24 0.55 0.90 1.24 1.59 1.93 2.35 2.78 3.21 3.64 4.79 6.95 9.70 12.57 17.54 150 210 240 240 240 240 240 300 300 300 300 660 960 960 1680 1740
30 0.08 0.25 0.57 0.92 1.26 1.61 1.98 2.40 2.83 3.27 3.70 5.35 8.11 10.87 14.59 19.46 150 210 240 240 240 240 270 300 300 300 300 960 960 960 1680 1740
40 0.09 0.26 0.60 0.94 1.29 1.66 2.05 2.47 2.90 3.33 4.32 7.08 9.83 12.71 17.58 22.58 180 210 240 240 240 270 270 300 300 300 960 960 960 1680 1740 1740
50 0.09 0.27 0.61 0.95 1.31 1.70 2.09 2.51 2.98 4.17 5.55 8.30 11.06 15.17 20.16 25.16 180 210 240 240 270 270 270 300 660 960 960 960 960 1740 1740 1740
60 0.09 0.27 0.61 0.95 1.34 1.73 2.11 2.64 3.72 5.10 6.48 9.28 13.24 17.40 22.54 27.71 180 210 240 240 270 270 270 660 960 960 960 1380 1380 1740 1800 1800
70 0.09 0.27 0.61 0.97 1.36 1.75 2.21 3.15 4.46 5.84 7.25 11.19 15.15 20.01 25.18 30.35 210 210 240 270 270 270 660 660 960 960 1020 1380 1380 1800 1800 1800
80 0.10 0.27 0.61 0.98 1.37 1.76 2.65 3.69 5.13 6.90 8.89 12.85 17.23 22.40 27.57 32.74 210 210 240 270 270 270 660 960 1020 1380 1380 1380 1800 1800 1800 1800
90 0.10 0.28 0.61 0.99 1.38 2.09 3.04 4.37 6.36 8.34 10.32 14.28 19.38 24.55 29.72 34.89 210 210 240 270 270 660 660 1380 1380 1380 1380 1380 1800 1800 1800 1800
100 0.10 0.28 0.61 1.00 1.47 2.42 3.63 5.61 7.59 9.57 11.56 16.12 21.29 26.46 31.63 36.80 210 210 270 270 660 660 1380 1380 1380 1380 1380 1800 1800 1800 1800 1800
Hydrologic Design Tables 181

03218000 Little Scioto River above Marion, Ohio—Continued
Pumpset
Ratio of storage required for pump set to storage required for the primary pump relation (pump set 1) for indicated demand (in fraction of mean
annual streamflow)
0.002 0.010 0.020 0.050 0.100 0.200 0.300
1 1.00 1.00 1.00 1.00 1.00 1.00 1.00
2 1.04 1.26 1.33 1.74 2.39 4.94 7.88
3 1.00 1.00 1.00 1.00 1.00 1.50 2.04
4 1.00 1.00 1.00 1.00 1.00 1.00 1.34
5 1.00 1.00 1.00 1.00 1.00 1.00 1.14
6 1.00 1.00 1.00 1.00 1.00 1.00 1.06
7 1.10 1.42 1.62 2.69 4.27 12.21 22.88
8 1.05 1.05 1.06 1.15 1.29 2.71 4.32
9 1.09 1.11 1.10 1.22 1.43 3.15 6.31
10 1.06 1.15 1.13 1.24 1.31 2.81 4.73
11 1.11 1.21 1.20 1.27 1.39 2.61 3.61
12 1.05 1.04 1.06 1.14 1.77 3.02 6.35
13 1.08 1.14 1.09 1.21 1.14 2.26 2.86
14 1.06 1.15 1.14 1.24 1.16 2.23 2.75
15 1.10 1.20 1.21 1.27 1.18 2.27 2.79
16 1.12 1.21 1.23 1.29 1.25 2.31 2.72
17 1.07 1.14 1.11 1.22 1.14 1.94 2.52
18 1.07 1.15 1.12 1.25 1.17 1.96 2.48
19 1.10 1.20 1.21 1.27 1.19 2.05 2.56
20 1.12 1.21 1.23 1.29 1.25 2.13 2.59
Recurrenceinterval(years)
Normalvariate
Side-channel storage required (in demand days) for primary pump relation to meet indicated demand (in fraction of mean annual streamflow)
0.0020 0.0100 0.0200 0.0500 0.1000 0.2000 0.3000
60.00 2.128 260.20 226.53 234.75 239.19 262.38 277.69 317.74
50.00 2.054 255.02 223.99 230.32 239.14 258.91 276.32 310.79
40.00 1.960 248.48 220.78 224.73 239.07 254.52 274.59 302.01
30.00 1.834 239.69 216.47 217.21 238.98 248.63 272.26 290.21
25.00 1.751 237.92 214.24 210.97 227.72 247.16 263.10 288.30
20.00 1.645 235.66 211.41 203.04 213.40 245.30 251.45 285.86
10.00 1.282 164.73 149.05 152.72 175.90 201.48 226.45 242.58
5.00 0.841 150.16 110.31 121.99 150.05 168.25 195.61 207.65
2.00 0.000 113.79 55.84 59.46 75.05 94.51 122.46 133.75
182 Hydrologic Considerations for Estimation of Storage-Capacity Requirements of Impounding and Side-Channel Reservoirs for Water Supply in Ohio

03219500 Scioto River near Prospect, Ohio
Location: Latitude 40°25′10″, longitude 83°11′50″, Delaware County, Hydrologic Unit 05060001
Drainage area, in square miles: 567.
Station used for record extension: none
Time period of systematic or extended record analyzed: 1939-10-01 to 1997-09-30
Eighty-percent-duration streamflow, in cubic feet per second: 29.
Mean annual streamflow, in inches: 11.08
Location of station used for precipitation data: Kenton, Ohio
Location of station used for potential evapotranspiration data: Columbus, Ohio
[–, indicates a value that could not be determined because there were too few average low-flow values less than the mean streamflow for the indicated duration]
Recurrenceinterval(years)
Extreme-value
variate
Minimum runoff (in inches) for indicated duration (in days)
180 360 540 720 1080 1440 1800
59.00 4.07 0.16 1.96 3.41 7.51 14.83 21.89 27.28
50.00 3.90 0.17 2.16 3.90 8.18 16.06 23.08 29.12
40.00 3.68 0.18 2.44 4.55 9.08 17.72 24.68 31.62
30.00 3.38 0.19 2.80 5.40 10.25 19.87 26.76 34.84
25.00 3.20 0.19 2.86 5.76 10.34 20.36 27.27 35.26
20.00 2.97 0.20 2.92 6.17 10.37 20.84 27.80 35.57
10.00 2.25 0.30 3.64 6.70 11.37 25.01 39.63 47.69
5.36 1.58 0.38 4.31 8.68 16.84 31.38 – –
Hydrologic Design Tables 183

03219500 Scioto River near Prospect, Ohio—Continued
Recurrenceinterval(years)
Impounding reservoir storage required (in inches) and critical-drawdown duration (in days; shown in gray) for indicated draft rate (in fraction of the mean annual streamflow)
0.02 0.05 0.10 0.15 0.20 0.25 0.30 0.35 0.40 0.45 0.50 0.60 0.70 0.80 0.90 1.00
5 0.00 0.03 0.19 0.42 0.68 0.96 1.23 1.55 1.91 2.28 2.64 3.37 4.17 4.99 6.22 7.86 0 60 150 150 180 180 180 240 240 240 240 240 270 270 540 540
6 0.00 0.03 0.22 0.46 0.73 1.00 1.31 1.67 2.04 2.40 2.76 3.56 4.38 5.26 6.56 8.48 0 60 150 180 180 180 210 240 240 240 240 270 270 300 540 660
8 0.00 0.04 0.24 0.51 0.80 1.12 1.46 1.83 2.19 2.57 2.98 3.81 4.72 5.67 7.49 9.47 0 90 150 180 210 210 240 240 240 270 270 300 300 600 600 660
10 0.00 0.04 0.27 0.55 0.87 1.19 1.56 1.92 2.31 2.72 3.13 4.03 4.94 6.32 8.14 10.14 0 90 180 210 210 240 240 240 270 270 270 300 300 600 600 660
15 0.00 0.06 0.32 0.64 0.96 1.33 1.69 2.08 2.49 2.95 3.40 4.32 5.55 7.37 9.34 14.24 0 150 210 210 240 240 240 270 300 300 300 300 600 600 900 1740
20 0.00 0.07 0.36 0.68 1.03 1.40 1.77 2.18 2.64 3.09 3.55 4.46 6.20 8.20 13.00 18.28 0 150 210 210 240 240 270 300 300 300 300 300 600 900 1740 1740
25 0.00 0.08 0.39 0.72 1.08 1.44 1.82 2.27 2.72 3.18 3.63 4.84 6.66 10.21 15.49 20.77 0 180 210 240 240 240 270 300 300 300 300 600 600 1740 1740 1740
30 0.00 0.09 0.40 0.75 1.11 1.48 1.87 2.33 2.78 3.24 3.69 5.19 7.46 11.91 17.19 22.47 30 180 210 240 240 240 300 300 300 300 300 600 900 1740 1740 1740
40 0.00 0.10 0.43 0.79 1.16 1.52 1.94 2.40 2.85 3.31 3.88 6.12 9.04 14.08 19.35 24.63 30 210 240 240 240 240 300 300 300 300 600 960 960 1740 1740 1740
50 0.00 0.11 0.46 0.82 1.18 1.55 1.98 2.44 2.89 3.47 4.45 7.36 10.61 15.37 20.65 25.93 30 210 240 240 240 240 300 300 330 540 960 960 1380 1740 1740 1740
60 0.00 0.12 0.48 0.84 1.20 1.57 2.01 2.48 2.98 3.95 5.40 8.31 11.98 16.22 21.50 26.78 30 210 240 240 240 240 300 330 330 960 960 960 1380 1680 1740 1740
70 0.00 0.13 0.49 0.85 1.22 1.58 2.05 2.55 3.25 4.71 6.17 9.08 13.08 17.27 22.24 27.36 30 240 240 240 240 240 330 330 960 960 960 960 1380 1380 1680 1740
80 0.00 0.14 0.50 0.87 1.23 1.61 2.11 2.64 3.88 5.34 6.80 9.79 13.98 18.17 22.96 28.06 30 240 240 240 240 330 330 540 960 960 960 1380 1380 1380 1680 1680
90 0.00 0.15 0.51 0.88 1.24 1.65 2.15 2.96 4.41 5.87 7.33 10.55 14.74 18.92 23.55 28.64 30 240 240 240 240 330 330 960 960 960 960 1380 1380 1380 1680 1680
100 0.00 0.16 0.52 0.88 1.25 1.69 2.19 3.41 4.87 6.32 7.78 11.20 15.39 19.57 24.04 29.14 30 240 240 240 240 330 330 960 960 960 1020 1380 1380 1380 1680 1680
184 Hydrologic Considerations for Estimation of Storage-Capacity Requirements of Impounding and Side-Channel Reservoirs for Water Supply in Ohio

03219500 Scioto River near Prospect, Ohio—Continued
Pumpset
Ratio of storage required for pump set to storage required for the primary pump relation (pump set 1) for indicated demand (in fraction of mean
annual streamflow)
0.002 0.010 0.020 0.050 0.100 0.200 0.300
1 1.00 1.00 1.00 1.00 1.00 1.00 1.00
2 1.33 1.18 1.31 1.59 2.09 5.28 10.26
3 1.11 1.00 1.00 1.00 1.00 1.25 1.77
4 1.06 1.00 1.00 1.00 1.00 1.00 1.10
5 1.02 1.00 1.00 1.00 1.00 1.00 1.02
6 1.01 1.00 1.00 1.00 1.00 1.00 1.00
7 1.34 1.36 1.54 2.16 4.99 16.58 24.67
8 1.13 1.02 1.01 1.08 1.24 2.35 4.84
9 1.13 1.01 1.04 1.08 1.47 2.78 6.68
10 1.13 1.04 1.06 1.12 1.35 2.39 4.71
11 1.13 1.05 1.05 1.15 1.30 2.27 3.58
12 1.13 1.01 1.01 1.06 1.66 3.65 7.05
13 1.10 1.01 1.03 1.08 1.15 1.93 2.58
14 1.09 1.05 1.06 1.12 1.22 1.82 2.52
15 1.12 1.05 1.05 1.16 1.30 1.87 2.52
16 1.10 1.07 1.06 1.16 1.34 1.92 2.64
17 1.08 1.01 1.03 1.08 1.15 1.59 2.26
18 1.08 1.05 1.06 1.12 1.22 1.55 2.20
19 1.11 1.05 1.05 1.17 1.28 1.66 2.33
20 1.08 1.06 1.06 1.16 1.34 1.73 2.53
Recurrenceinterval(years)
Normalvariate
Side-channel storage required (in demand days) for primary pump relation to meet indicated demand (in fraction of mean annual streamflow)
0.0020 0.0100 0.0200 0.0500 0.1000 0.2000 0.3000
59.00 2.122 269.45 273.67 268.80 266.12 278.21 297.25 337.42
50.00 2.054 269.09 271.60 266.94 264.63 275.91 291.26 332.76
40.00 1.960 268.60 268.73 264.36 262.55 272.71 282.95 326.28
30.00 1.834 267.93 264.86 260.90 259.76 268.42 271.77 317.58
25.00 1.751 256.69 249.17 249.57 250.50 257.72 268.48 303.68
20.00 1.645 241.02 227.55 234.04 237.79 243.13 264.81 284.97
10.00 1.282 180.44 173.45 174.58 180.73 204.55 232.52 258.50
5.00 0.841 157.60 143.01 146.95 161.05 171.00 199.07 227.11
2.03 0.021 102.42 82.03 85.23 88.68 114.15 139.52 156.74
Hydrologic Design Tables 185

03219590 Bokes Creek near Warrensburg, Ohio
Location: Latitude 40°19′20″, longitude 83°10′30″, Delaware County, Hydrologic Unit 05060001
Drainage area, in square miles: 83.2
Station used for record extension: 03220000
Time period of systematic or extended record analyzed: 1943-10-01 to 1997-09-30
Percentage of estimated values in extended record: 71.5
Eighty-percent-duration streamflow, in cubic feet per second: 1.3
Mean annual streamflow, in inches: 10.84
Location of station used for precipitation data: Columbus, Ohio
Location of station used for potential evapotranspiration data: Columbus, Ohio
[–, indicates a value that could not be determined because there were too few average low-flow values less than the mean stream-flow for the indicated duration]
Recurrenceinterval(years)
Extreme-value
variate
Minimum runoff (in inches) for indicated duration (in days)
180 360 540 720 1080 1440 1800
55.00 4.00 – 1.01 4.00 7.31 15.05 22.34 29.83
50.00 3.90 – 1.18 4.11 7.35 15.55 22.69 29.95
40.00 3.68 – 1.57 4.36 7.43 16.73 23.50 30.22
30.00 3.38 0.01 2.08 4.69 7.55 18.26 24.55 30.57
25.00 3.20 0.01 2.30 4.89 8.16 19.03 25.31 33.40
20.00 2.97 0.01 2.43 5.12 9.52 19.77 26.34 39.78
10.00 2.25 0.06 2.87 6.14 11.38 23.07 36.76 46.75
5.50 1.61 0.11 4.44 8.64 14.89 29.27 56.66 –
186 Hydrologic Considerations for Estimation of Storage-Capacity Requirements of Impounding and Side-Channel Reservoirs for Water Supply in Ohio

03219590 Bokes Creek near Warrensburg, Ohio—Continued
Recurrenceinterval(years)
Impounding reservoir storage required (in inches) and critical-drawdown duration (in days; shown in gray) for indicated draft rate (in fraction of the mean annual streamflow)
0.02 0.05 0.10 0.15 0.20 0.25 0.30 0.35 0.40 0.45 0.50 0.60 0.70 0.80 0.90 1.00
5 0.07 0.20 0.46 0.77 1.08 1.39 1.71 2.02 2.33 2.64 2.95 3.75 4.55 5.35 6.16 7.23 150 150 210 210 210 210 210 210 210 210 210 270 270 270 270 540
6 0.07 0.20 0.46 0.77 1.08 1.39 1.71 2.02 2.33 2.64 3.00 3.80 4.61 5.41 6.69 8.29 150 150 210 210 210 210 210 210 210 210 270 270 270 270 540 540
8 0.07 0.20 0.46 0.77 1.08 1.43 1.78 2.14 2.50 2.85 3.21 4.06 4.95 6.27 8.05 9.83 120 150 210 210 210 240 240 240 240 240 240 300 300 600 600 600
10 0.08 0.21 0.48 0.82 1.18 1.54 1.89 2.25 2.60 3.03 3.47 4.36 5.25 6.94 8.72 11.42 150 150 180 240 240 240 240 240 240 300 300 300 300 600 600 1320
15 0.09 0.25 0.56 0.92 1.27 1.63 2.04 2.48 2.93 3.37 3.82 4.71 5.75 7.70 10.83 14.75 150 210 240 240 240 240 300 300 300 300 300 300 600 660 1320 1320
20 0.10 0.28 0.60 0.96 1.32 1.74 2.18 2.63 3.09 3.58 4.07 5.05 6.38 8.54 12.20 17.14 210 210 240 240 240 300 300 300 330 330 330 330 660 1020 1320 1680
25 0.11 0.30 0.63 0.99 1.36 1.81 2.29 2.77 3.26 3.75 4.24 5.22 6.80 9.71 14.44 19.43 210 210 240 240 300 300 330 330 330 330 330 330 660 1020 1680 1680
30 0.11 0.30 0.65 1.01 1.40 1.88 2.37 2.86 3.35 3.84 4.33 5.31 7.56 10.92 15.91 20.89 210 210 240 240 300 330 330 330 330 330 330 330 1020 1680 1680 1680
40 0.12 0.32 0.68 1.04 1.44 1.92 2.41 2.90 3.39 3.88 4.37 5.85 8.84 12.64 17.46 22.64 210 240 240 270 270 330 330 330 330 330 330 960 1020 1380 1680 1800
50 0.12 0.34 0.69 1.06 1.46 1.92 2.41 2.90 3.39 3.88 4.37 6.99 10.17 14.26 18.36 23.67 240 240 240 270 270 330 330 330 330 330 330 960 1380 1380 1380 1800
60 0.13 0.35 0.70 1.07 1.47 1.92 2.41 2.90 3.43 3.97 5.14 7.99 11.62 15.65 19.75 24.21 240 240 240 270 270 330 330 360 360 360 960 960 1320 1380 1380 1800
70 0.14 0.35 0.71 1.07 1.56 2.10 2.63 3.17 3.70 4.60 6.20 9.94 13.68 17.41 21.16 25.08 240 240 240 270 360 360 360 360 360 960 1260 1260 1260 1260 1320 1320
80 0.14 0.35 0.71 1.22 1.75 2.28 2.82 3.35 4.32 6.18 8.05 11.79 15.53 19.27 23.01 26.74 240 240 240 360 360 360 360 360 1260 1260 1260 1260 1260 1260 1260 1260
90 0.14 0.35 0.81 1.34 1.88 2.41 2.95 4.07 5.94 7.80 9.67 13.41 17.15 20.89 24.63 28.36 240 240 360 360 360 360 360 1260 1260 1260 1260 1260 1260 1260 1260 1260
100 0.14 0.36 0.90 1.43 1.96 2.50 3.59 5.46 7.33 9.20 11.07 14.81 18.55 22.28 26.02 29.76 240 360 360 360 360 360 1260 1260 1260 1260 1260 1260 1260 1260 1260 1260
Hydrologic Design Tables 187

03219590 Bokes Creek near Warrensburg, Ohio—Continued
Pumpset
Ratio of storage required for pump set to storage required for the primary pump relation (pump set 1) for indicated demand (in fraction of mean
annual streamflow)
0.002 0.010 0.020 0.050 0.100 0.200 0.300
1 1.00 1.00 1.00 1.00 1.00 1.00 1.00
2 1.75 1.58 1.76 2.15 3.14 6.80 9.84
3 1.01 1.00 1.00 1.00 1.10 1.66 2.19
4 1.00 1.00 1.00 1.00 1.00 1.16 1.40
5 1.00 1.00 1.00 1.00 1.00 1.00 1.18
6 1.02 1.00 1.00 1.00 1.00 1.00 1.03
7 1.87 1.81 2.03 2.67 6.49 12.96 20.14
8 1.02 1.03 1.01 1.04 1.57 2.65 6.58
9 1.02 1.03 1.03 1.12 1.85 3.24 8.95
10 1.02 1.04 1.03 1.07 1.68 2.42 7.16
11 1.02 1.06 1.06 1.11 1.51 2.13 5.98
12 1.06 1.02 1.04 1.32 2.05 4.39 8.86
13 1.02 1.02 1.03 1.02 1.42 1.96 4.01
14 1.00 1.03 1.04 1.05 1.32 1.80 2.65
15 1.06 1.06 1.03 1.09 1.23 1.68 2.63
16 1.08 1.07 1.05 1.15 1.25 1.74 2.61
17 1.00 1.03 1.03 1.02 1.15 1.71 2.33
18 1.03 1.03 1.03 1.05 1.17 1.60 2.22
19 1.05 1.06 1.04 1.08 1.22 1.44 2.22
20 1.09 1.06 1.04 1.17 1.24 1.46 2.31
Recurrenceinterval(years)
Normalvariate
Side-channel storage required (in demand days) for primary pump relation to meet indicated demand (in fraction of mean annual streamflow)
0.0020 0.0100 0.0200 0.0500 0.1000 0.2000 0.3000
55.00 2.093 308.89 286.97 280.31 270.72 279.28 293.93 311.16
50.00 2.054 306.17 282.23 277.22 269.05 276.46 292.70 310.08
40.00 1.960 299.65 270.87 269.80 265.06 269.70 289.74 307.50
30.00 1.834 290.89 255.60 259.84 259.69 260.62 285.76 304.03
25.00 1.751 285.63 245.61 249.69 253.96 256.44 279.07 301.51
20.00 1.645 279.53 233.02 232.71 244.19 253.20 265.90 298.06
10.00 1.282 238.38 192.27 193.08 200.45 215.08 253.75 261.68
5.00 0.841 215.48 162.96 163.96 161.70 170.61 207.28 227.52
2.04 0.023 164.74 96.87 100.69 116.44 121.62 144.56 153.52
188 Hydrologic Considerations for Estimation of Storage-Capacity Requirements of Impounding and Side-Channel Reservoirs for Water Supply in Ohio

03220000 Mill Creek near Bellepoint, Ohio
Location: Latitude 40°14′54″, longitude 83°10′26″, Delaware County, Hydrologic Unit 05060001
Drainage area, in square miles: 178.
Station used for record extension: None
Time period of systematic or extended record analyzed: 1943-10-01 to 1997-09-30
Eighty-percent-duration streamflow, in cubic feet per second: 7.0
Mean annual streamflow, in inches: 12.28
Location of station used for precipitation data: Columbus, Ohio
Location of station used for potential evapotranspiration data: Columbus, Ohio
[–, indicates a value that could not be determined because there were too few average low-flow values less than the mean streamflow for the indicated duration]
Recurrenceinterval(years)
Extreme-value
variate
Minimum runoff (in inches) for indicated duration (in days)
180 360 540 720 1080 1440 1800
55.00 4.00 0.09 1.94 4.60 8.14 17.16 25.30 33.68
50.00 3.90 0.09 2.02 4.74 8.26 17.83 25.80 33.96
40.00 3.68 0.09 2.20 5.05 8.54 19.41 26.96 34.60
30.00 3.38 0.09 2.44 5.47 8.90 21.44 28.46 35.44
25.00 3.20 0.11 2.60 5.97 9.62 22.17 29.36 38.42
20.00 2.97 0.15 2.82 6.85 11.05 22.44 30.41 44.82
10.00 2.25 0.20 3.38 7.49 13.42 26.67 39.75 55.08
5.50 1.61 0.29 4.88 9.95 18.50 36.19 64.04 –
Hydrologic Design Tables 189

03220000 Mill Creek near Bellepoint, Ohio—Continued
Recurrenceinterval(years)
Impounding reservoir storage required (in inches) and critical-drawdown duration (in days; shown in gray) for indicated draft rate (in fraction of the mean annual streamflow)
0.02 0.05 0.10 0.15 0.20 0.25 0.30 0.35 0.40 0.45 0.50 0.60 0.70 0.80 0.90 1.00
5 0.01 0.09 0.34 0.68 1.04 1.39 1.74 2.10 2.45 2.80 3.16 3.87 4.78 5.69 6.59 7.52 30 120 180 210 210 210 210 210 210 210 210 270 270 270 270 540
6 0.01 0.10 0.34 0.68 1.04 1.39 1.74 2.10 2.45 2.80 3.22 4.12 5.03 5.94 6.87 8.68 30 120 180 210 210 210 210 210 210 210 270 270 270 270 540 540
8 0.02 0.11 0.37 0.68 1.04 1.40 1.80 2.21 2.61 3.03 3.54 4.55 5.56 6.56 8.39 10.40 60 120 180 210 210 240 240 240 240 300 300 300 300 300 600 600
10 0.02 0.13 0.40 0.72 1.12 1.52 1.93 2.33 2.84 3.34 3.84 4.85 5.86 7.25 9.32 11.54 60 150 180 240 240 240 240 300 300 300 300 300 300 600 660 660
15 0.03 0.16 0.45 0.84 1.25 1.65 2.11 2.61 3.12 3.62 4.13 5.14 6.29 8.51 10.81 15.20 90 150 180 240 240 240 300 300 300 300 300 300 660 660 960 1440
20 0.03 0.18 0.50 0.90 1.30 1.71 2.21 2.71 3.22 3.78 4.33 5.44 6.99 9.47 12.87 18.52 120 150 210 240 240 300 300 300 330 330 330 330 660 960 1680 1680
25 0.04 0.19 0.54 0.93 1.34 1.76 2.31 2.87 3.42 3.98 4.53 5.64 7.61 10.84 15.92 21.57 150 180 210 240 240 300 330 330 330 330 330 330 960 960 1680 1680
30 0.04 0.21 0.56 0.96 1.36 1.87 2.42 2.98 3.53 4.09 4.64 5.75 8.67 12.21 17.86 23.51 150 210 210 240 240 330 330 330 330 330 330 330 960 1680 1680 1680
40 0.05 0.23 0.60 1.00 1.41 1.96 2.52 3.07 3.63 4.18 4.74 7.01 10.24 14.16 19.90 25.95 150 210 240 240 240 330 330 330 330 330 330 960 960 1680 1800 1800
50 0.05 0.24 0.63 1.04 1.47 1.96 2.52 3.07 3.63 4.18 4.91 8.14 11.36 15.78 20.97 27.02 150 210 240 240 270 330 330 330 330 330 960 960 960 1380 1800 1800
60 0.05 0.26 0.66 1.07 1.53 1.98 2.52 3.07 3.63 4.18 5.77 9.21 13.86 18.50 23.14 27.78 150 240 240 270 270 270 330 330 330 330 960 1380 1380 1380 1380 1380
70 0.05 0.28 0.69 1.12 1.57 2.02 2.53 3.07 3.63 5.06 7.18 11.62 16.26 20.90 25.54 30.18 150 240 240 270 270 270 300 330 330 1260 1260 1380 1380 1380 1380 1380
80 0.06 0.30 0.71 1.15 1.61 2.07 2.58 3.08 5.11 7.23 9.35 13.72 18.36 23.00 27.64 32.28 240 240 240 270 270 300 300 300 1260 1260 1260 1380 1380 1380 1380 1380
90 0.08 0.32 0.73 1.18 1.64 2.12 2.80 4.85 6.97 9.09 11.21 15.55 20.19 24.83 29.47 34.11 240 240 270 270 270 300 1200 1260 1260 1260 1260 1380 1380 1380 1380 1380
100 0.09 0.33 0.75 1.21 1.66 2.41 4.43 6.45 8.56 10.68 12.79 17.13 21.77 26.41 31.05 35.69 240 240 270 270 270 1200 1200 1200 1260 1260 1260 1380 1380 1380 1380 1380
190 Hydrologic Considerations for Estimation of Storage-Capacity Requirements of Impounding and Side-Channel Reservoirs for Water Supply in Ohio

03220000 Mill Creek near Bellepoint, Ohio—Continued
Pumpset
Ratio of storage required for pump set to storage required for the primary pump relation (pump set 1) for indicated demand (in fraction of mean
annual streamflow)
0.002 0.010 0.020 0.050 0.100 0.200 0.300
1 1.00 1.00 1.00 1.00 1.00 1.00 1.00
2 1.44 1.17 1.24 1.93 3.79 8.62 14.35
3 1.14 1.00 1.00 1.00 1.24 2.00 3.02
4 1.07 1.00 1.00 1.00 1.00 1.31 1.45
5 1.06 1.00 1.00 1.00 1.00 1.03 1.23
6 1.03 1.00 1.00 1.00 1.00 1.00 1.08
7 1.46 1.27 1.71 3.39 8.70 19.27 25.63
8 1.16 1.05 1.04 1.29 1.85 4.87 9.86
9 1.15 1.06 1.05 1.39 2.31 7.18 14.26
10 1.14 1.08 1.07 1.30 1.86 3.89 9.18
11 1.11 1.11 1.08 1.26 1.82 2.70 7.39
12 1.18 1.03 1.03 1.54 2.51 7.96 14.74
13 1.12 1.06 1.06 1.12 1.75 2.47 6.43
14 1.09 1.08 1.07 1.17 1.56 2.11 4.21
15 1.09 1.12 1.09 1.22 1.44 1.94 2.72
16 1.11 1.14 1.10 1.23 1.31 1.94 2.60
17 1.09 1.06 1.06 1.11 1.53 1.86 3.23
18 1.08 1.07 1.07 1.14 1.29 1.69 2.42
19 1.08 1.12 1.08 1.19 1.23 1.64 2.28
20 1.05 1.14 1.10 1.23 1.27 1.63 2.28
Recurrenceinterval(years)
Normalvariate
Side-channel storage required (in demand days) for primary pump relation to meet indicated demand (in fraction of mean annual streamflow)
0.0020 0.0100 0.0200 0.0500 0.1000 0.2000 0.3000
55.00 2.093 248.06 265.14 267.35 265.14 283.94 301.54 322.89
50.00 2.054 247.44 261.72 265.04 263.75 280.52 298.26 320.28
40.00 1.960 245.96 253.50 259.52 260.41 272.32 290.38 314.02
30.00 1.834 243.96 242.46 252.08 255.92 261.29 279.79 305.61
25.00 1.751 238.27 232.08 238.91 243.74 251.83 274.35 300.17
20.00 1.645 226.02 215.33 212.68 217.69 237.32 269.19 293.38
10.00 1.282 178.68 167.91 173.90 192.26 213.14 250.29 267.08
5.00 0.841 150.55 137.05 149.71 161.63 174.37 207.29 232.54
2.04 0.023 114.99 79.57 84.65 106.34 117.95 145.16 163.53
Hydrologic Design Tables 191

03223000 Olentangy River at Claridon, Ohio
Location: Latitude 40°34′58″, longitude 82°59′20″, Marion County, Hydrologic Unit 05060001
Drainage area, in square miles: 157.
Station used for record extension: None
Time period of systematic or extended record analyzed: 1946-10-01 to 1997-09-30
Eighty-percent-duration streamflow, in cubic feet per second: 8.7
Mean annual streamflow, in inches: 13.67
Location of station used for precipitation data: Columbus, Ohio
Location of station used for potential evapotranspiration data: Columbus, Ohio
[–, indicates a value that could not be determined because there were too few average low-flow values less than the mean stream-flow for the indicated duration]
Recurrenceinterval(years)
Extreme-value
variate
Minimum runoff (in inches) for indicated duration (in days)
180 360 540 720 1080 1440 1800
52.00 3.94 0.13 3.44 6.82 10.47 19.61 28.70 39.39
50.00 3.90 0.13 3.46 6.86 10.59 19.86 28.93 39.50
40.00 3.68 0.15 3.57 7.07 11.27 21.31 30.22 40.14
30.00 3.38 0.16 3.71 7.34 12.15 23.18 31.89 40.97
25.00 3.20 0.17 3.81 7.56 12.66 24.53 33.35 42.57
20.00 2.97 0.20 3.95 8.10 13.04 26.93 36.91 49.39
10.00 2.25 0.28 4.84 10.33 17.30 30.93 45.31 63.29
5.20 1.54 0.41 7.22 12.94 20.88 39.83 – –
192 Hydrologic Considerations for Estimation of Storage-Capacity Requirements of Impounding and Side-Channel Reservoirs for Water Supply in Ohio

03223000 Olentangy River at Claridon, Ohio—Continued
Recurrenceinterval(years)
Impounding reservoir storage required (in inches) and critical-drawdown duration (in days; shown in gray) for indicated draft rate (in fraction of the mean annual streamflow)
0.02 0.05 0.10 0.15 0.20 0.25 0.30 0.35 0.40 0.45 0.50 0.60 0.70 0.80 0.90 1.00
5 0.01 0.07 0.34 0.62 0.93 1.27 1.60 1.94 2.28 2.69 3.14 4.04 4.94 5.84 6.78 8.34 30 120 150 150 180 180 180 180 210 240 240 240 240 240 300 600
6 0.01 0.08 0.34 0.64 0.97 1.31 1.68 2.07 2.46 2.90 3.35 4.25 5.20 6.33 7.45 9.40 30 90 150 180 180 180 210 210 210 240 240 240 300 300 300 600
8 0.02 0.09 0.36 0.69 1.05 1.44 1.84 2.23 2.68 3.12 3.59 4.60 5.72 6.84 8.45 10.70 30 90 180 180 210 210 210 210 240 240 270 270 300 300 600 600
10 0.02 0.11 0.39 0.73 1.12 1.52 1.91 2.34 2.79 3.25 3.75 4.78 5.90 7.02 9.23 11.53 60 120 180 180 210 210 210 240 240 270 270 300 300 300 600 900
15 0.02 0.15 0.45 0.80 1.19 1.60 2.05 2.50 2.95 3.40 3.86 4.90 6.03 8.09 10.38 15.03 60 150 180 210 210 240 240 240 240 240 270 300 300 600 660 1380
20 0.03 0.18 0.48 0.83 1.24 1.69 2.14 2.59 3.04 3.49 3.93 4.98 6.56 9.03 13.36 19.79 90 150 180 210 240 240 240 240 240 240 240 300 660 660 1680 1740
25 0.04 0.20 0.50 0.85 1.30 1.75 2.20 2.65 3.10 3.55 4.00 5.08 7.32 10.72 17.01 23.41 90 150 180 240 240 240 240 240 240 240 240 300 660 1680 1680 1800
30 0.04 0.21 0.51 0.90 1.35 1.80 2.25 2.70 3.15 3.60 4.10 5.41 7.88 12.90 19.19 25.74 120 150 180 240 240 240 240 240 240 240 300 660 660 1680 1680 1800
40 0.05 0.22 0.53 0.98 1.43 1.88 2.32 2.77 3.29 3.85 4.41 6.15 9.06 14.68 21.23 27.97 90 150 180 240 240 240 240 240 300 300 300 660 1020 1680 1800 1800
50 0.05 0.22 0.59 1.04 1.48 1.93 2.46 3.02 3.58 4.19 4.81 7.47 11.57 16.74 21.90 28.37 90 150 240 240 240 240 300 300 300 330 330 1020 1380 1380 1380 1800
60 0.05 0.22 0.63 1.08 1.58 2.14 2.71 3.33 3.95 4.57 5.57 9.39 13.92 19.08 24.25 29.42 90 180 240 240 300 300 330 330 330 330 1020 1020 1380 1380 1380 1380
70 0.05 0.22 0.67 1.20 1.77 2.38 3.00 3.62 4.23 5.32 7.23 11.05 16.02 21.18 26.35 31.52 90 180 240 300 300 330 330 330 330 1020 1020 1020 1380 1380 1380 1380
80 0.05 0.25 0.78 1.36 1.97 2.59 3.21 3.83 4.87 6.75 8.66 12.73 17.90 23.06 28.23 33.40 90 240 300 330 330 330 330 330 960 1020 1020 1380 1380 1380 1380 1380
90 0.06 0.32 0.89 1.50 2.12 2.74 3.36 4.29 6.09 7.98 9.89 14.41 19.58 24.75 29.91 35.08 90 300 330 330 330 330 330 960 960 1020 1020 1380 1380 1380 1380 1380
100 0.06 0.39 0.99 1.61 2.23 2.85 3.54 5.34 7.14 9.04 10.95 15.92 21.08 26.25 31.42 36.58 90 300 330 330 330 330 960 960 960 1020 1020 1380 1380 1380 1380 1380
Hydrologic Design Tables 193

03223000 Olentangy River at Claridon, Ohio—Continued
Pumpset
Ratio of storage required for pump set to storage required for the primary pump relation (pump set 1) for indicated demand (in fraction of mean
annual streamflow)
0.002 0.010 0.020 0.050 0.100 0.200 0.300
1 1.00 1.00 1.00 1.00 1.00 1.00 1.00
2 1.37 1.40 1.44 1.93 2.27 5.55 8.40
3 1.08 1.10 1.05 1.03 1.01 1.20 1.86
4 1.00 1.02 1.02 1.00 1.00 1.00 1.00
5 1.00 1.00 1.00 1.00 1.00 1.00 1.00
6 1.00 1.00 1.00 1.00 1.00 1.00 1.00
7 1.42 1.48 1.91 2.55 4.89 12.01 19.86
8 1.10 1.13 1.08 1.13 1.25 2.37 5.54
9 1.11 1.13 1.13 1.17 1.44 2.92 8.34
10 1.04 1.10 1.09 1.22 1.25 2.34 5.72
11 1.06 1.11 1.09 1.23 1.23 2.16 4.71
12 1.19 1.15 1.14 1.14 1.44 3.62 8.06
13 1.03 1.09 1.08 1.16 1.15 1.74 3.13
14 1.05 1.07 1.08 1.21 1.17 1.45 2.35
15 1.05 1.07 1.09 1.20 1.23 1.33 2.36
16 1.06 1.07 1.13 1.31 1.19 1.31 2.16
17 1.02 1.06 1.08 1.15 1.11 1.32 2.08
18 1.05 1.03 1.08 1.19 1.17 1.29 1.88
19 1.06 1.04 1.09 1.21 1.21 1.27 1.90
20 1.06 1.04 1.11 1.31 1.19 1.30 1.87
Recurrenceinterval(years)
Normalvariate
Side-channel storage required (in demand days) for primary pump relation to meet indicated demand (in fraction of mean annual streamflow)
0.0020 0.0100 0.0200 0.0500 0.1000 0.2000 0.3000
52.00 2.070 224.77 201.97 208.31 228.57 257.12 273.77 299.26
50.00 2.054 223.51 201.72 207.78 227.10 255.26 272.47 297.35
40.00 1.960 216.16 200.29 204.68 218.53 244.44 264.90 286.25
30.00 1.834 206.28 198.37 200.52 207.01 229.89 254.73 271.33
25.00 1.751 198.92 193.20 194.94 200.44 222.35 248.14 262.07
20.00 1.645 185.74 168.77 174.91 196.84 222.20 240.33 253.03
10.00 1.282 143.69 142.37 154.16 174.69 196.93 220.86 230.25
5.00 0.841 127.51 103.40 122.21 136.42 168.66 189.71 198.46
2.00 0.000 95.31 66.14 69.28 80.60 100.87 119.05 137.51
194 Hydrologic Considerations for Estimation of Storage-Capacity Requirements of Impounding and Side-Channel Reservoirs for Water Supply in Ohio

03224500 Whetstone Creek near Ashley, Ohio
Location: Latitude 40°27′18″, longitude 82°57′28″, Morrow County, Hydrologic Unit 05060001
Drainage area, in square miles: 98.7
Station used for record extension: 03136500
Time period of systematic or extended record analyzed: 1953-03-01 to 1997-09-30
Percentage of estimated values in extended record: 55.2
Eighty-percent-duration streamflow, in cubic feet per second: 6.9
Mean annual streamflow, in inches: 14.37
Location of station used for precipitation data: Columbus, Ohio
Location of station used for potential evapotranspiration data: Columbus, Ohio
[–, indicates a value that could not be determined because there were too few average low-flow values less than the mean streamflow for the indicated duration]
Recurrenceinterval(years)
Extreme-value
variate
Minimum runoff (in inches) for indicated duration (in days)
180 360 540 720 1080 1440 1800
45.00 3.80 0.17 3.21 4.36 9.01 19.11 30.09 47.05
40.00 3.68 0.17 3.32 5.00 9.79 20.51 31.15 47.08
30.00 3.38 0.18 3.60 6.58 11.72 23.95 33.76 47.16
25.00 3.20 0.19 3.77 7.59 12.94 26.13 35.42 47.21
20.00 2.97 0.21 3.90 8.61 14.37 27.95 38.77 50.10
10.00 2.25 0.38 4.97 10.01 17.05 30.49 45.47 60.27
5.62 1.63 0.58 6.55 12.44 20.38 40.09 57.75 85.76
Hydrologic Design Tables 195

03224500 Whetstone Creek near Ashley, Ohio—Continued
Recurrenceinterval(years)
Impounding reservoir storage required (in inches) and critical-drawdown duration (in days; shown in gray) for indicated draft rate (in fraction of the mean annual streamflow)
0.02 0.05 0.10 0.15 0.20 0.25 0.30 0.35 0.40 0.45 0.50 0.60 0.70 0.80 0.90 1.00
5 0.01 0.06 0.25 0.50 0.84 1.19 1.57 1.99 2.40 2.81 3.23 4.05 4.88 5.74 7.77 10.37 30 60 120 150 180 180 210 210 210 210 210 210 210 270 660 660
6 0.01 0.06 0.25 0.53 0.89 1.24 1.64 2.06 2.47 2.88 3.30 4.18 5.24 6.37 8.03 10.62 30 60 120 180 180 180 210 210 210 210 210 270 270 300 660 660
8 0.01 0.08 0.29 0.63 0.98 1.37 1.78 2.25 2.73 3.20 3.69 4.75 5.90 7.40 9.76 12.12 30 90 150 180 180 210 240 240 240 240 270 270 300 600 600 600
10 0.02 0.09 0.34 0.70 1.06 1.52 1.99 2.46 2.93 3.45 3.98 5.06 6.24 7.83 10.19 12.55 30 90 180 180 210 240 240 240 240 270 270 300 300 600 600 600
15 0.02 0.12 0.45 0.80 1.25 1.72 2.19 2.71 3.24 3.77 4.30 5.46 6.64 7.83 11.83 18.44 30 150 180 210 240 240 240 270 270 270 270 300 300 600 1680 1680
20 0.02 0.15 0.49 0.88 1.33 1.80 2.33 2.86 3.39 3.92 4.50 5.68 6.86 8.93 14.68 21.53 60 150 180 210 240 240 270 270 270 270 300 300 300 660 1740 1740
25 0.02 0.17 0.52 0.92 1.37 1.88 2.42 2.95 3.48 4.07 4.66 5.84 7.55 10.15 16.27 23.11 60 150 180 210 240 270 270 270 270 300 300 300 660 660 1740 1740
30 0.03 0.18 0.54 0.95 1.41 1.94 2.48 3.02 3.61 4.20 4.79 6.06 8.66 11.26 17.11 23.96 60 150 210 210 270 270 270 300 300 300 300 660 660 660 1740 1740
40 0.03 0.19 0.55 0.98 1.49 2.06 2.65 3.24 3.83 4.42 5.46 7.92 10.52 14.26 19.44 25.07 60 150 210 240 270 300 300 300 300 300 540 660 660 1020 1380 1440
50 0.03 0.19 0.55 1.05 1.64 2.23 2.82 3.99 5.17 6.35 7.53 9.89 13.14 17.11 22.78 28.44 60 150 210 300 300 300 300 600 600 600 600 600 900 1440 1440 1440
60 0.03 0.19 0.60 1.19 2.01 3.19 4.37 5.55 6.73 7.91 9.10 12.03 15.58 20.17 25.83 31.50 60 150 300 300 600 600 600 600 600 600 600 900 900 1440 1440 1440
70 0.04 0.19 0.72 1.87 3.05 4.23 5.41 6.59 7.77 8.95 10.46 14.00 17.55 22.90 28.57 34.23 60 150 330 600 600 600 600 600 600 600 900 900 900 1440 1440 1440
80 0.04 0.24 1.34 2.52 3.70 4.88 6.06 7.24 8.48 10.26 12.03 15.57 19.66 25.33 30.99 36.66 60 330 600 600 600 600 600 600 900 900 900 900 1440 1440 1440 1440
90 0.04 0.56 1.74 2.92 4.10 5.28 6.46 7.94 9.71 11.48 13.25 17.15 21.81 27.47 33.14 38.80 60 600 600 600 600 600 600 900 900 900 900 1080 1440 1440 1440 1440
100 0.10 0.81 1.99 3.17 4.35 5.53 7.12 8.89 10.66 12.44 14.35 18.60 23.70 29.37 35.03 40.70 600 600 600 600 600 600 900 900 900 900 1080 1080 1440 1440 1440 1440
196 Hydrologic Considerations for Estimation of Storage-Capacity Requirements of Impounding and Side-Channel Reservoirs for Water Supply in Ohio

03224500 Whetstone Creek near Ashley, Ohio—Continued
Pumpset
Ratio of storage required for pump set to storage required for the primary pump relation (pump set 1) for indicated demand (in fraction of mean
annual streamflow)
0.002 0.010 0.020 0.050 0.100 0.200 0.300
1 1.00 1.00 1.00 1.00 1.00 1.00 1.00
2 1.30 1.28 1.33 1.44 1.73 3.23 5.47
3 1.09 1.13 1.13 1.04 1.01 1.23 1.50
4 1.00 1.02 1.08 1.02 1.00 1.00 1.15
5 1.00 1.00 1.04 1.00 1.00 1.00 1.09
6 1.00 1.00 1.02 1.00 1.00 1.00 1.04
7 1.32 1.40 1.48 1.96 2.61 7.36 14.06
8 1.12 1.17 1.20 1.14 1.29 1.85 4.36
9 1.13 1.18 1.21 1.15 1.38 2.03 6.80
10 1.02 1.17 1.22 1.20 1.34 1.96 5.65
11 1.04 1.15 1.23 1.27 1.32 1.88 5.02
12 1.13 1.19 1.23 1.15 1.49 2.09 6.01
13 1.02 1.14 1.17 1.13 1.20 1.60 3.17
14 1.02 1.14 1.17 1.18 1.29 1.56 2.22
15 1.04 1.09 1.21 1.24 1.33 1.54 2.10
16 1.04 1.12 1.17 1.35 1.36 1.59 2.26
17 1.02 1.11 1.16 1.13 1.20 1.41 1.83
18 1.02 1.10 1.18 1.18 1.29 1.47 1.82
19 1.04 1.06 1.18 1.24 1.33 1.48 1.92
20 1.04 1.10 1.13 1.35 1.34 1.52 2.02
Recurrenceinterval(years)
Normalvariate
Side-channel storage required (in demand days) for primary pump relation to meet indicated demand (in fraction of mean annual streamflow)
0.0020 0.0100 0.0200 0.0500 0.1000 0.2000 0.3000
45.00 2.010 225.06 206.09 208.21 238.85 267.79 300.55 335.36
40.00 1.960 220.56 204.11 206.39 234.06 260.99 292.08 332.53
30.00 1.834 209.18 199.12 201.78 221.97 243.83 270.69 325.39
25.00 1.751 201.67 195.83 198.74 213.99 232.49 256.57 320.68
20.00 1.645 183.32 179.96 192.07 206.97 223.31 246.02 304.39
10.00 1.282 140.03 114.92 120.32 154.90 186.34 214.77 243.47
5.00 0.841 119.10 104.02 112.31 128.84 151.50 176.29 194.41
2.05 0.028 82.62 57.22 63.62 76.10 98.60 117.08 134.95
Hydrologic Design Tables 197

03225500 Olentangy River near Delaware, Ohio
Location: Latitude 40°21′18″, longitude 83°04′02″, Delaware County, Hydrologic Unit 05060001
Drainage area, in square miles: 393.
Station used for record extension: 03226500 and 03218000
Time period of systematic or extended record analyzed: 1922-10-01 to 1974-09-30
Percentage of estimated values in extended record: 63.5
Eighty-percent-duration streamflow, in cubic feet per second: 15.
Mean annual streamflow, in inches: 11.59
Location of station used for precipitation data: Columbus, Ohio
Location of station used for potential evapotranspiration data: Columbus, Ohio
[–, indicates a value that could not be determined because there were too few average low-flow values less than the mean stream-flow for the indicated duration]
Recurrenceinterval(years)
Extreme-value
variate
Minimum runoff (in inches) for indicated duration (in days)
180 360 540 720 1080 1440 1800
53.00 3.96 0.06 1.75 2.72 5.62 14.11 22.22 30.31
50.00 3.90 0.06 1.79 2.78 5.73 14.47 22.84 31.02
40.00 3.68 0.06 1.93 3.01 6.15 15.83 25.21 33.74
30.00 3.38 0.06 2.12 3.30 6.69 17.60 28.28 37.25
25.00 3.20 0.06 2.20 3.87 7.41 18.96 29.64 38.88
20.00 2.97 0.08 2.21 5.56 9.31 21.23 29.78 39.30
10.00 2.25 0.21 4.06 7.35 14.02 25.94 37.23 55.14
5.30 1.57 0.29 5.67 10.00 16.63 31.63 52.54 –
198 Hydrologic Considerations for Estimation of Storage-Capacity Requirements of Impounding and Side-Channel Reservoirs for Water Supply in Ohio

03225500 Olentangy River near Delaware, Ohio—Continued
Recurrenceinterval(years)
Impounding reservoir storage required (in inches) and critical-drawdown duration (in days; shown in gray) for indicated draft rate (in fraction of the mean annual streamflow)
0.02 0.05 0.10 0.15 0.20 0.25 0.30 0.35 0.40 0.45 0.50 0.60 0.70 0.80 0.90 1.00
5 0.02 0.09 0.30 0.57 0.89 1.22 1.55 1.89 2.22 2.60 3.03 3.89 4.75 5.60 7.07 8.97 60 120 150 180 210 210 210 210 210 270 270 270 270 270 600 600
6 0.02 0.09 0.30 0.57 0.89 1.22 1.56 1.89 2.27 2.66 3.09 3.94 4.83 5.78 7.14 9.04 60 120 150 180 210 210 210 240 240 270 270 270 300 300 600 600
8 0.02 0.09 0.33 0.62 0.96 1.31 1.69 2.07 2.45 2.87 3.33 4.28 5.23 6.19 7.65 9.56 60 120 180 210 210 240 240 240 240 270 300 300 300 300 600 600
10 0.02 0.12 0.38 0.70 1.06 1.44 1.82 2.20 2.63 3.11 3.58 4.53 5.48 6.44 8.31 11.40 60 150 180 210 240 240 240 270 270 300 300 300 300 300 600 1020
15 0.04 0.17 0.48 0.85 1.23 1.64 2.07 2.50 2.97 3.45 3.92 4.87 6.43 8.52 11.35 15.38 120 180 210 240 240 270 270 270 300 300 300 300 660 660 900 1320
20 0.05 0.21 0.55 0.93 1.35 1.78 2.21 2.67 3.14 3.62 4.09 5.94 8.05 10.90 14.07 18.26 120 180 240 240 270 270 270 300 300 300 300 660 900 900 1320 1320
25 0.06 0.23 0.59 1.00 1.43 1.85 2.29 2.77 3.25 3.84 4.89 6.98 9.60 12.46 16.11 20.29 150 210 240 270 270 270 300 300 300 660 660 660 900 900 1320 1320
30 0.07 0.24 0.61 1.04 1.47 1.89 2.36 2.84 3.50 4.55 5.59 7.81 10.66 13.52 17.69 21.88 150 210 270 270 270 270 300 300 660 660 660 900 900 900 1320 1320
40 0.07 0.25 0.64 1.07 1.50 1.97 2.45 3.30 4.35 5.39 6.44 9.11 11.96 15.90 20.09 24.28 150 210 270 270 270 300 300 660 660 660 660 900 900 1320 1320 1320
50 0.07 0.25 0.65 1.07 1.55 2.02 2.75 3.75 4.80 5.84 7.15 10.20 13.51 17.70 21.89 26.14 150 210 270 270 300 300 600 660 660 660 960 960 1320 1320 1320 1380
60 0.07 0.25 0.65 1.10 1.58 2.26 3.21 4.16 5.12 6.64 8.17 11.21 15.32 19.69 24.07 28.45 150 210 270 300 300 600 600 600 960 960 960 960 1380 1380 1380 1380
70 0.07 0.25 0.65 1.12 1.64 2.59 3.55 4.50 5.92 7.50 9.12 12.92 17.30 21.68 26.06 30.43 150 210 300 300 600 600 600 600 960 1020 1020 1380 1380 1380 1380 1380
80 0.07 0.25 0.66 1.14 1.90 2.86 3.81 5.31 6.93 8.55 10.24 14.62 19.00 23.38 27.76 32.13 150 210 300 300 600 600 600 1020 1020 1020 1380 1380 1380 1380 1380 1380
90 0.07 0.25 0.67 1.16 2.11 3.06 4.57 6.19 7.80 9.51 11.70 16.08 20.46 24.84 29.21 33.59 150 210 300 600 600 600 1020 1020 1020 1380 1380 1380 1380 1380 1380 1380
100 0.07 0.25 0.68 1.33 2.28 3.68 5.30 6.92 8.58 10.77 12.95 17.33 21.71 26.09 30.47 34.84 150 210 300 600 600 1020 1020 1020 1380 1380 1380 1380 1380 1380 1380 1380
Hydrologic Design Tables 199

03225500 Olentangy River near Delaware, Ohio—Continued
Pumpset
Ratio of storage required for pump set to storage required for the primary pump relation (pump set 1) for indicated demand (in fraction of mean
annual streamflow)
0.002 0.010 0.020 0.050 0.100 0.200 0.300
1 1.00 1.00 1.00 1.00 1.00 1.00 1.00
2 1.32 1.21 1.35 1.53 1.98 3.42 6.74
3 1.12 1.06 1.07 1.00 1.00 1.32 1.39
4 1.03 1.00 1.00 1.00 1.00 1.15 1.07
5 1.00 1.00 1.00 1.00 1.00 1.06 1.02
6 1.00 1.00 1.00 1.00 1.00 1.00 1.01
7 1.34 1.37 1.56 2.12 2.60 11.95 14.16
8 1.15 1.11 1.11 1.12 1.26 2.09 2.92
9 1.15 1.12 1.14 1.12 1.43 2.42 4.81
10 1.14 1.05 1.20 1.23 1.32 2.39 3.27
11 1.10 1.04 1.24 1.33 1.30 2.38 2.58
12 1.19 1.16 1.15 1.21 1.42 2.36 5.57
13 1.11 1.04 1.13 1.12 1.18 1.86 2.17
14 1.06 1.02 1.18 1.24 1.21 2.06 2.27
15 1.02 1.03 1.22 1.32 1.22 2.20 2.29
16 1.04 1.05 1.19 1.34 1.24 2.56 2.32
17 1.06 1.01 1.11 1.13 1.18 1.67 1.94
18 1.03 1.02 1.16 1.25 1.22 1.92 2.06
19 1.02 1.03 1.21 1.33 1.22 2.08 2.13
20 1.04 1.05 1.17 1.32 1.24 2.45 2.17
Recurrenceinterval(years)
Normalvariate
Side-channel storage required (in demand days) for primary pump relation to meet indicated demand (in fraction of mean annual streamflow)
0.0020 0.0100 0.0200 0.0500 0.1000 0.2000 0.3000
53.00 2.078 264.41 255.87 251.88 281.63 301.08 320.39 435.94
50.00 2.054 263.49 254.25 251.84 280.48 299.67 319.28 431.48
40.00 1.960 259.91 247.91 251.67 275.99 294.16 314.94 414.04
30.00 1.834 255.09 239.39 251.44 269.96 286.75 309.11 390.59
25.00 1.751 252.75 235.07 250.24 265.11 280.42 301.18 378.58
20.00 1.645 251.99 233.04 245.92 256.60 268.52 280.24 372.52
10.00 1.282 165.58 150.87 165.59 187.28 212.59 237.50 313.34
5.00 0.841 130.92 121.95 132.27 151.31 176.87 200.23 241.08
2.04 0.024 84.97 71.63 78.62 90.67 105.05 128.53 154.04
200 Hydrologic Considerations for Estimation of Storage-Capacity Requirements of Impounding and Side-Channel Reservoirs for Water Supply in Ohio

03226500 Olentangy River at Stratford, Ohio
Location: Latitude 40°15′29″, longitude 83°03′44″, Delaware County, Hydrologic Unit 05060001
Drainage area, in square miles: 445.
Station used for record extension: 03137000
Time period of systematic or extended record analyzed: 1922-10-01 to 1974-09-30
Percentage of estimated values in extended record: 78.5
Eighty-percent-duration streamflow, in cubic feet per second: 16.
Mean annual streamflow, in inches: 10.37
Location of station used for precipitation data: Columbus, Ohio
Location of station used for potential evapotranspiration data: Columbus, Ohio
[–, indicates a value that could not be determined because there were too few average low-flow values less than the mean streamflow for the indicated duration]
Recurrenceinterval(years)
Extreme-value
variate
Minimum runoff (in inches) for indicated duration (in days)
180 360 540 720 1080 1440 1800
53.00 3.96 0.05 0.96 2.34 5.44 12.50 19.65 26.78
50.00 3.90 0.05 1.00 2.36 5.49 12.86 20.17 27.04
40.00 3.68 0.05 1.14 2.44 5.67 14.23 22.15 28.06
30.00 3.38 0.06 1.33 2.55 5.91 16.00 24.72 29.36
25.00 3.20 0.06 1.48 2.65 6.52 16.89 26.00 30.81
20.00 2.97 0.07 1.74 2.90 8.46 17.33 26.67 34.19
10.00 2.25 0.15 3.75 6.63 12.29 22.85 32.56 49.56
5.30 1.57 0.28 4.96 8.96 14.69 31.24 50.80 –
Hydrologic Design Tables 201

03226500 Olentangy River at Stratford, Ohio—Continued
Recurrenceinterval(years)
Impounding reservoir storage required (in inches) and critical-drawdown duration (in days; shown in gray) for indicated draft rate (in fraction of the mean annual streamflow)
0.02 0.05 0.10 0.15 0.20 0.25 0.30 0.35 0.40 0.45 0.50 0.60 0.70 0.80 0.90 1.00
5 0.02 0.09 0.27 0.48 0.72 0.97 1.25 1.57 1.91 2.26 2.64 3.41 4.17 4.96 6.66 8.37 60 120 150 150 180 180 210 240 240 270 270 270 270 600 600 600
6 0.02 0.09 0.28 0.51 0.79 1.09 1.41 1.75 2.09 2.43 2.78 3.55 4.31 5.13 6.66 8.37 60 120 150 180 210 210 240 240 240 240 270 270 270 300 600 600
8 0.02 0.10 0.33 0.62 0.93 1.27 1.61 1.95 2.29 2.66 3.04 3.87 4.72 5.58 6.94 8.77 60 150 180 210 240 240 240 240 240 270 270 300 300 300 600 1020
10 0.02 0.12 0.38 0.69 1.03 1.37 1.72 2.08 2.46 2.87 3.30 4.15 5.00 6.29 7.99 10.50 90 150 210 240 240 240 240 270 270 300 300 300 300 600 600 1020
15 0.03 0.17 0.47 0.81 1.17 1.56 1.95 2.37 2.80 3.23 3.65 5.00 6.70 8.41 10.45 13.21 120 180 240 240 270 270 300 300 300 300 300 600 600 600 900 1320
20 0.04 0.19 0.51 0.89 1.27 1.67 2.10 2.53 2.95 3.70 4.50 6.20 7.91 9.70 12.32 17.26 150 180 240 270 270 300 300 300 300 540 600 600 600 900 1740 1740
25 0.05 0.20 0.56 0.94 1.32 1.75 2.18 2.71 3.48 4.33 5.18 6.88 8.59 10.94 14.91 20.03 150 180 270 270 300 300 300 540 540 600 600 600 600 900 1800 1800
30 0.06 0.21 0.58 0.96 1.37 1.79 2.24 3.01 3.87 4.72 5.57 7.27 9.30 11.93 16.75 21.87 150 240 270 270 300 300 540 600 600 600 600 600 900 960 1800 1800
40 0.06 0.21 0.59 0.98 1.40 1.82 2.51 3.36 4.21 5.06 5.91 8.11 10.83 13.92 18.67 23.78 150 240 270 270 300 300 600 600 600 600 600 960 960 1320 1800 1800
50 0.06 0.22 0.59 0.98 1.40 1.82 2.54 3.40 4.25 5.18 6.54 9.27 12.23 15.98 19.73 24.43 150 210 270 270 300 300 600 600 600 960 960 960 1320 1320 1320 1800
60 0.06 0.22 0.59 0.98 1.40 1.82 2.54 3.40 4.70 6.06 7.42 10.62 14.54 18.46 22.38 26.30 150 210 270 270 300 300 600 600 960 960 960 1380 1380 1380 1380 1380
70 0.06 0.23 0.59 0.98 1.40 1.82 2.66 4.08 5.53 6.99 8.95 12.87 16.79 20.71 24.63 28.55 150 210 270 270 300 300 960 1020 1020 1380 1380 1380 1380 1380 1380 1380
80 0.06 0.23 0.59 0.98 1.40 2.15 3.60 5.04 6.90 8.86 10.82 14.74 18.66 22.58 26.50 30.42 150 210 270 270 300 1020 1020 1020 1380 1380 1380 1380 1380 1380 1380 1380
90 0.06 0.24 0.59 0.98 1.50 2.94 4.52 6.48 8.44 10.40 12.36 16.27 20.19 24.11 28.03 31.95 150 210 270 270 1020 1020 1380 1380 1380 1380 1380 1380 1380 1380 1380 1380
100 0.06 0.24 0.59 0.98 2.16 3.82 5.78 7.74 9.70 11.66 13.62 17.54 21.45 25.37 29.29 33.21 210 210 270 270 1020 1380 1380 1380 1380 1380 1380 1380 1380 1380 1380 1380
202 Hydrologic Considerations for Estimation of Storage-Capacity Requirements of Impounding and Side-Channel Reservoirs for Water Supply in Ohio

03226500 Olentangy River at Stratford, Ohio—Continued
Pumpset
Ratio of storage required for pump set to storage required for the primary pump relation (pump set 1) for indicated demand (in fraction of mean
annual streamflow)
0.002 0.010 0.020 0.050 0.100 0.200 0.300
1 1.00 1.00 1.00 1.00 1.00 1.00 1.00
2 1.46 1.43 1.37 1.72 2.07 4.11 7.53
3 1.18 1.16 1.08 1.00 1.00 1.31 1.51
4 1.11 1.05 1.00 1.00 1.00 1.18 1.15
5 1.04 1.01 1.00 1.00 1.00 1.09 1.07
6 1.02 1.00 1.00 1.00 1.00 1.04 1.02
7 1.57 1.61 1.75 2.29 2.92 12.44 14.77
8 1.19 1.18 1.13 1.12 1.29 2.24 3.34
9 1.21 1.18 1.13 1.14 1.44 2.63 5.60
10 1.18 1.15 1.14 1.23 1.41 2.55 4.01
11 1.15 1.12 1.20 1.31 1.51 2.72 3.22
12 1.18 1.24 1.15 1.10 1.42 2.46 6.27
13 1.16 1.12 1.10 1.13 1.19 1.99 2.29
14 1.12 1.09 1.13 1.24 1.27 2.21 2.46
15 1.08 1.12 1.21 1.32 1.40 2.46 2.43
16 1.00 1.13 1.23 1.32 1.33 2.62 2.52
17 1.14 1.08 1.11 1.13 1.17 1.83 2.09
18 1.07 1.05 1.13 1.24 1.20 2.10 2.26
19 1.04 1.10 1.23 1.31 1.31 2.33 2.25
20 1.00 1.13 1.23 1.30 1.23 2.51 2.34
Recurrenceinterval(years)
Normalvariate
Side-channel storage required (in demand days) for primary pump relation to meet indicated demand (in fraction of mean annual streamflow)
0.0020 0.0100 0.0200 0.0500 0.1000 0.2000 0.3000
53.00 2.078 289.03 248.23 257.21 288.51 307.81 325.03 434.20
50.00 2.054 286.78 247.10 256.49 287.46 306.59 325.03 432.89
40.00 1.960 277.97 242.69 253.70 283.37 301.81 325.01 427.76
30.00 1.834 266.14 236.77 249.94 277.86 295.38 324.98 420.88
25.00 1.751 259.14 234.00 247.68 272.59 289.57 324.43 411.04
20.00 1.645 252.43 233.54 245.41 261.52 278.02 322.32 384.46
10.00 1.282 212.18 184.89 188.92 209.43 252.68 268.90 352.48
5.00 0.841 168.39 133.61 142.23 162.68 182.99 209.49 252.59
2.04 0.024 121.96 82.01 84.18 96.50 115.54 141.04 154.66
Hydrologic Design Tables 203

03228000 Scioto Big Run at Briggsdale, Ohio
Location: Latitude 39°54′56″, longitude 83°03′55″, Franklin County, Hydrologic Unit 05060001
Drainage area, in square miles: 11.0
Station used for record extension: 03268500
Time period of systematic or extended record analyzed: 1942-10-01 to 1958-09-30
Percentage of estimated values in extended record: 25.4
Eighty-percent-duration streamflow, in cubic feet per second: 0.1
Mean annual streamflow, in inches: 12.38
Location of station used for precipitation data: Columbus, Ohio
Location of station used for potential evapotranspiration data: Columbus, Ohio
[–, indicates a value that could not be determined because there were too few average low-flow values less than the mean stream-flow for the indicated duration]
Recurrenceinterval(years)
Extreme-value
variate
Minimum runoff (in inches) for indicated duration (in days)
180 360 540 720 1080 1440 1800
17.00 2.80 – 2.44 4.27 5.95 16.26 24.32 31.60
10.00 2.25 0.04 4.63 6.16 12.35 24.14 34.22 49.33
5.67 1.64 0.11 5.49 8.59 14.73 43.42 63.67 –
204 Hydrologic Considerations for Estimation of Storage-Capacity Requirements of Impounding and Side-Channel Reservoirs for Water Supply in Ohio

03228000 Scioto Big Run at Briggsdale, Ohio—Continued
Recurrenceinterval(years)
Impounding reservoir storage required (in inches) and critical-drawdown duration (in days; shown in gray) for indicated draft rate (in fraction of the mean annual streamflow)
0.02 0.05 0.10 0.15 0.20 0.25 0.30 0.35 0.40 0.45 0.50 0.60 0.70 0.80 0.90 1.00
5 0.08 0.22 0.47 0.82 1.17 1.53 1.88 2.24 2.63 3.04 3.45 4.32 5.31 6.33 7.75 9.58 120 150 150 210 210 210 210 210 240 240 240 270 300 300 540 540
6 0.08 0.23 0.50 0.85 1.21 1.56 1.92 2.27 2.65 3.06 3.46 4.48 5.50 6.63 8.46 10.29 120 150 180 210 210 210 210 210 240 240 300 300 300 540 540 540
8 0.09 0.25 0.56 0.90 1.25 1.61 1.96 2.32 2.68 3.08 3.58 4.59 5.75 7.58 9.62 11.85 150 180 180 210 210 210 210 210 210 240 300 300 540 540 660 660
10 0.10 0.28 0.59 0.93 1.28 1.64 2.00 2.37 2.78 3.18 3.62 4.66 6.76 8.99 11.23 13.68 180 180 180 210 210 210 210 240 240 240 300 540 660 660 660 1020
15 0.12 0.30 0.67 1.08 1.49 1.89 2.32 2.78 3.23 4.29 5.40 7.64 10.40 13.86 17.31 20.77 180 180 240 240 240 240 270 270 270 660 660 660 1020 1020 1020 1020
20 0.14 0.39 0.79 1.24 1.70 2.95 4.58 6.20 7.83 9.46 11.09 14.34 17.60 20.85 24.10 27.36 240 240 240 270 270 960 960 960 960 960 960 960 960 960 960 960
Hydrologic Design Tables 205

03228000 Scioto Big Run at Briggsdale, Ohio—Continued
Pumpset
Ratio of storage required for pump set to storage required for the primary pump relation (pump set 1) for indicated demand (in fraction of mean
annual streamflow)
0.002 0.010 0.020 0.050 0.100 0.200 0.300
1 1.00 1.00 1.00 1.00 1.00 1.00 1.00
2 1.74 1.51 1.56 2.09 2.83 4.03 4.70
3 1.13 1.03 1.06 1.09 1.02 1.77 2.11
4 1.06 1.01 1.01 1.04 1.00 1.00 1.42
5 1.00 1.00 1.00 1.02 1.00 1.00 1.20
6 1.00 1.00 1.00 1.00 1.00 1.00 1.07
7 1.74 1.66 2.06 3.21 4.08 7.12 7.22
8 1.13 1.05 1.10 1.12 1.56 3.17 3.34
9 1.13 1.06 1.12 1.14 1.87 3.62 3.91
10 1.12 1.05 1.07 1.12 1.50 3.43 3.47
11 1.08 1.03 1.06 1.14 1.39 3.26 3.40
12 1.15 1.07 1.12 1.15 2.10 3.66 3.96
13 1.12 1.02 1.08 1.12 1.06 2.82 2.97
14 1.04 1.02 1.02 1.10 1.07 2.56 2.90
15 1.00 1.01 1.02 1.12 1.08 2.53 2.92
16 1.01 1.01 1.00 1.12 1.09 2.65 2.85
17 1.06 1.01 1.03 1.11 1.04 2.31 2.66
18 1.00 1.02 1.02 1.09 1.07 2.27 2.61
19 1.00 1.00 1.00 1.10 1.08 2.26 2.63
20 1.01 1.01 1.00 1.12 1.08 2.45 2.62
Recurrenceinterval(years)
Normalvariate
Side-channel storage required (in demand days) for primary pump relation to meet indicated demand (in fraction of mean annual streamflow)
0.0020 0.0100 0.0200 0.0500 0.1000 0.2000 0.3000
17.00 1.565 255.77 240.62 232.21 228.22 249.81 259.29 337.08
10.00 1.282 236.51 209.32 205.00 225.19 231.07 237.08 316.39
5.00 0.841 176.97 164.15 175.36 176.90 186.42 214.73 255.79
2.12 0.074 122.07 98.02 117.73 125.67 139.80 169.51 182.97
206 Hydrologic Considerations for Estimation of Storage-Capacity Requirements of Impounding and Side-Channel Reservoirs for Water Supply in Ohio

03228500 Big Walnut Creek at Central College, Ohio
Location: Latitude 40°06′13″, longitude 82°53′03″, Franklin County, Hydrologic Unit 05060001
Drainage area, in square miles: 190.
Station used for record extension: 03229000
Time period of systematic or extended record analyzed: 1922-10-01 to 1974-09-30
Percentage of estimated values in extended record: 71.2
Eighty-percent-duration streamflow, in cubic feet per second: 5.6
Mean annual streamflow, in inches: 13.83
Location of station used for precipitation data: Columbus, Ohio
Location of station used for potential evapotranspiration data: Columbus, Ohio
[–, indicates a value that could not be determined because there were too few average low-flow values less than the mean streamflow for the indicated duration]
Recurrenceinterval(years)
Extreme-value
variate
Minimum runoff (in inches) for indicated duration (in days)
180 360 540 720 1080 1440 1800
53.00 3.96 0.06 1.73 3.49 5.95 16.72 25.98 36.21
50.00 3.90 0.06 1.74 3.61 6.12 16.98 26.70 36.93
40.00 3.68 0.08 1.75 4.07 6.77 17.96 29.45 39.67
30.00 3.38 0.09 1.78 4.67 7.61 19.24 33.01 43.22
25.00 3.20 0.10 1.97 4.93 8.80 20.79 34.97 45.12
20.00 2.97 0.11 2.68 4.94 11.97 24.64 36.57 46.54
10.00 2.25 0.23 4.37 8.26 15.59 29.46 48.27 65.55
5.30 1.57 0.39 7.24 12.75 19.68 36.78 55.81 –
Hydrologic Design Tables 207

03228500 Big Walnut Creek at Central College, Ohio—Continued
Recurrenceinterval(years)
Impounding reservoir storage required (in inches) and critical-drawdown duration (in days; shown in gray) for indicated draft rate (in fraction of the mean annual streamflow)
0.02 0.05 0.10 0.15 0.20 0.25 0.30 0.35 0.40 0.45 0.50 0.60 0.70 0.80 0.90 1.00
5 0.02 0.12 0.32 0.59 0.93 1.27 1.61 1.95 2.29 2.74 3.25 4.36 5.50 6.63 8.01 10.28 60 90 120 180 180 180 180 180 180 270 270 300 300 300 600 600
6 0.02 0.12 0.33 0.65 0.99 1.33 1.68 2.08 2.48 2.99 3.50 4.52 5.63 6.77 8.17 10.44 60 90 120 180 180 180 210 210 240 270 270 270 300 300 600 600
8 0.03 0.13 0.40 0.74 1.10 1.50 1.95 2.40 2.86 3.33 3.84 4.86 6.00 7.14 9.27 11.54 60 120 180 180 210 210 240 240 240 270 270 270 300 300 600 600
10 0.03 0.15 0.46 0.82 1.21 1.66 2.12 2.57 3.04 3.55 4.06 5.19 6.32 8.33 10.53 12.80 60 120 180 210 210 240 240 240 270 270 270 300 300 540 600 600
15 0.05 0.22 0.55 0.95 1.39 1.85 2.32 2.86 3.43 3.99 4.56 6.10 8.37 10.64 13.51 18.75 120 150 210 210 240 240 270 300 300 300 300 600 600 600 900 1680
20 0.07 0.24 0.60 1.02 1.47 1.98 2.54 3.11 3.68 4.25 5.26 7.53 10.43 13.84 17.81 22.81 150 150 210 240 240 300 300 300 300 300 600 600 900 900 1320 1320
25 0.08 0.25 0.63 1.07 1.54 2.11 2.68 3.25 3.87 5.01 6.14 9.20 12.61 16.14 21.13 26.13 150 180 210 240 300 300 300 300 600 600 600 900 900 1320 1320 1320
30 0.09 0.27 0.66 1.11 1.62 2.19 2.76 3.35 4.44 5.57 7.08 10.49 13.89 18.19 23.19 28.19 150 180 240 240 300 300 300 330 600 600 900 900 900 1320 1320 1320
40 0.09 0.28 0.71 1.17 1.68 2.25 2.82 3.93 5.07 6.53 8.24 11.64 15.18 20.18 25.17 30.17 150 180 240 240 300 300 300 600 600 900 900 900 1320 1320 1320 1320
50 0.09 0.30 0.75 1.21 1.68 2.25 3.19 4.44 5.69 6.93 8.39 12.00 15.64 20.57 25.57 31.09 150 240 240 240 300 300 660 660 660 660 900 960 960 1320 1380 1800
60 0.09 0.33 0.79 1.24 1.69 2.46 3.71 4.96 6.20 7.45 8.70 12.44 17.25 22.47 27.70 33.51 150 240 240 240 240 660 660 660 660 660 660 1020 1380 1380 1380 1740
70 0.09 0.36 0.81 1.26 1.72 2.83 4.08 5.33 6.58 7.83 9.21 13.74 18.96 24.18 30.55 37.13 150 240 240 240 240 660 660 660 660 660 1020 1380 1380 1380 1740 1740
80 0.10 0.37 0.83 1.28 1.87 3.12 4.37 5.62 6.86 8.11 9.93 15.15 20.88 27.47 34.05 40.64 240 240 240 240 660 660 660 660 660 660 1380 1380 1740 1740 1740 1740
90 0.12 0.39 0.84 1.30 2.09 3.34 4.59 5.84 7.08 8.51 11.12 17.56 24.14 30.73 37.32 43.90 240 240 240 240 660 660 660 660 660 1380 1380 1740 1740 1740 1740 1740
100 0.13 0.40 0.86 1.31 2.26 3.51 4.76 6.01 7.34 10.63 13.93 20.52 27.10 33.69 40.28 46.86 240 240 240 240 660 660 660 660 1740 1740 1740 1740 1740 1740 1740 1740
208 Hydrologic Considerations for Estimation of Storage-Capacity Requirements of Impounding and Side-Channel Reservoirs for Water Supply in Ohio

03228500 Big Walnut Creek at Central College, Ohio—Continued
Pumpset
Ratio of storage required for pump set to storage required for the primary pump relation (pump set 1) for indicated demand (in fraction of mean
annual streamflow)
0.002 0.010 0.020 0.050 0.100 0.200 0.300
1 1.00 1.00 1.00 1.00 1.00 1.00 1.00
2 1.20 1.24 1.21 1.60 2.13 3.63 7.32
3 1.06 1.03 1.02 1.00 1.00 1.36 1.53
4 1.05 1.00 1.01 1.00 1.00 1.19 1.10
5 1.03 1.00 1.00 1.00 1.00 1.08 1.05
6 1.02 1.00 1.00 1.00 1.00 1.00 1.01
7 1.24 1.37 1.55 2.19 3.01 13.66 15.91
8 1.05 1.12 1.10 1.07 1.38 2.54 4.80
9 1.05 1.15 1.12 1.12 1.61 3.01 9.35
10 1.05 1.19 1.15 1.19 1.61 2.88 5.74
11 1.03 1.18 1.20 1.30 1.67 2.96 4.29
12 1.08 1.11 1.09 1.05 1.50 2.69 8.00
13 1.05 1.14 1.11 1.11 1.37 2.31 2.57
14 1.04 1.17 1.14 1.19 1.42 2.16 2.32
15 1.02 1.16 1.20 1.29 1.48 2.27 2.23
16 1.01 1.20 1.19 1.34 1.72 2.26 2.22
17 1.05 1.13 1.10 1.10 1.28 1.87 2.08
18 1.02 1.16 1.15 1.19 1.32 2.02 2.03
19 1.02 1.14 1.20 1.28 1.38 2.06 1.99
20 1.01 1.19 1.19 1.34 1.57 2.13 1.99
Recurrenceinterval(years)
Normalvariate
Side-channel storage required (in demand days) for primary pump relation to meet indicated demand (in fraction of mean annual streamflow)
0.0020 0.0100 0.0200 0.0500 0.1000 0.2000 0.3000
53.00 2.078 243.69 226.35 240.53 256.37 263.10 296.51 419.80
50.00 2.054 243.50 224.38 237.01 254.06 263.07 295.42 418.29
40.00 1.960 242.75 216.70 223.27 245.04 262.95 291.15 412.40
30.00 1.834 241.75 206.37 204.80 232.91 262.78 285.41 404.49
25.00 1.751 237.78 201.17 196.48 226.94 259.47 281.38 389.78
20.00 1.645 223.96 198.91 196.19 224.75 246.75 275.58 345.87
10.00 1.282 172.69 136.34 139.71 180.23 209.63 247.89 291.36
5.00 0.841 120.30 89.62 105.74 123.38 142.86 196.06 226.93
2.04 0.024 83.45 46.43 50.65 71.80 92.70 118.74 136.56
Hydrologic Design Tables 209

03229000 Alum Creek at Columbus, Ohio
Location: Latitude 39°56′42″, longitude 82°56′28″, Franklin County, Hydrologic Unit 05060001
Drainage area, in square miles: 189.
Station used for record extension: 03228000
Time period of systematic or extended record analyzed: 1922-10-01 to 1974-09-30
Percentage of estimated values in extended record: 9.6
Eighty-percent-duration streamflow, in cubic feet per second: 11.
Mean annual streamflow, in inches: 12.00
Location of station used for precipitation data: Columbus, Ohio
Location of station used for potential evapotranspiration data: Columbus, Ohio
[–, indicates a value that could not be determined because there were too few average low-flow values less than the mean stream-flow for the indicated duration]
Recurrenceinterval(years)
Extreme-value
variate
Minimum runoff (in inches) for indicated duration (in days)
180 360 540 720 1080 1440 1800
53.00 3.96 0.11 1.76 3.42 5.72 15.55 23.63 32.06
50.00 3.90 0.11 1.77 3.50 5.85 15.74 24.21 32.68
40.00 3.68 0.13 1.80 3.82 6.37 16.48 26.41 35.04
30.00 3.38 0.14 1.84 4.22 7.04 17.43 29.27 38.09
25.00 3.20 0.15 1.97 4.45 8.03 18.78 30.80 39.74
20.00 2.97 0.17 2.39 4.63 10.73 22.39 31.97 41.03
10.00 2.25 0.33 3.91 7.73 13.94 25.95 42.18 57.14
5.30 1.57 0.46 6.53 11.22 17.43 31.91 48.46 –
210 Hydrologic Considerations for Estimation of Storage-Capacity Requirements of Impounding and Side-Channel Reservoirs for Water Supply in Ohio

03229000 Alum Creek at Columbus, Ohio—Continued
Recurrenceinterval(years)
Impounding reservoir storage required (in inches) and critical-drawdown duration (in days; shown in gray) for indicated draft rate (in fraction of the mean annual streamflow)
0.02 0.05 0.10 0.15 0.20 0.25 0.30 0.35 0.40 0.45 0.50 0.60 0.70 0.80 0.90 1.00
5 0.01 0.07 0.23 0.43 0.69 0.99 1.28 1.58 1.88 2.17 2.51 3.40 4.39 5.37 7.27 9.24 30 90 120 120 180 180 180 180 180 180 210 300 300 300 600 600
6 0.01 0.07 0.23 0.44 0.73 1.03 1.33 1.66 2.00 2.37 2.82 3.70 4.63 5.62 7.27 9.24 30 90 120 180 180 180 180 210 210 240 270 270 300 300 600 600
8 0.02 0.07 0.24 0.52 0.82 1.16 1.53 1.92 2.32 2.76 3.21 4.09 5.04 6.02 7.73 9.70 30 90 120 180 210 210 240 240 270 270 270 270 300 300 600 600
10 0.02 0.07 0.28 0.58 0.93 1.29 1.68 2.08 2.52 2.96 3.41 4.34 5.32 6.77 8.74 10.71 30 120 180 210 210 240 240 270 270 270 270 300 300 540 600 600
15 0.02 0.13 0.37 0.70 1.06 1.45 1.87 2.31 2.78 3.27 3.77 4.93 6.90 8.87 11.39 16.02 90 120 180 210 240 240 270 270 300 300 300 600 600 600 900 1680
20 0.04 0.15 0.42 0.76 1.13 1.53 2.00 2.50 2.99 3.48 4.25 6.22 8.78 11.73 14.69 18.71 90 120 180 210 240 270 300 300 300 300 600 600 900 900 900 1320
25 0.05 0.17 0.45 0.78 1.17 1.62 2.12 2.61 3.12 4.05 5.04 7.72 10.67 13.63 17.05 21.39 120 150 180 210 240 300 300 300 330 600 600 900 900 900 1320 1320
30 0.06 0.19 0.46 0.80 1.20 1.69 2.18 2.68 3.56 4.55 5.85 8.81 11.76 14.72 18.83 23.17 120 150 180 240 240 300 300 330 600 600 900 900 900 900 1320 1320
40 0.06 0.21 0.48 0.84 1.25 1.75 2.24 3.08 4.07 5.27 6.74 9.70 12.65 16.50 20.83 25.17 120 150 180 240 300 300 300 600 600 900 900 900 900 1320 1320 1320
50 0.07 0.22 0.48 0.88 1.27 1.75 2.29 3.38 4.46 5.54 6.74 9.88 13.03 17.34 21.68 26.31 150 150 240 240 270 300 660 660 660 660 900 960 960 1320 1320 1800
60 0.08 0.22 0.51 0.90 1.30 1.75 2.70 3.78 4.87 5.95 7.04 10.32 14.44 18.97 23.50 28.32 150 150 240 240 270 300 660 660 660 660 660 1020 1380 1380 1380 1740
70 0.08 0.23 0.53 0.92 1.32 1.90 2.99 4.07 5.15 6.24 7.67 11.49 16.02 20.55 25.57 31.28 150 150 240 240 240 660 660 660 660 660 1020 1380 1380 1380 1740 1740
80 0.08 0.23 0.55 0.94 1.34 2.11 3.19 4.28 5.36 6.53 8.28 12.81 17.34 22.74 28.46 34.17 150 150 240 240 240 660 660 660 660 1020 1380 1380 1380 1740 1740 1740
90 0.08 0.23 0.57 0.96 1.35 2.26 3.35 4.43 5.51 7.13 9.40 14.03 19.74 25.46 31.17 36.89 150 150 240 240 240 660 660 660 660 1380 1380 1740 1740 1740 1740 1740
100 0.09 0.23 0.58 0.98 1.37 2.38 3.46 4.54 5.83 8.09 10.81 16.52 22.23 27.95 33.66 39.38 150 150 240 240 240 660 660 660 1380 1380 1740 1740 1740 1740 1740 1740
Hydrologic Design Tables 211

03229000 Alum Creek at Columbus, Ohio—Continued
Pumpset
Ratio of storage required for pump set to storage required for the primary pump relation (pump set 1) for indicated demand (in fraction of mean
annual streamflow)
0.002 0.010 0.020 0.050 0.100 0.200 0.300
1 1.00 1.00 1.00 1.00 1.00 1.00 1.00
2 2.97 1.53 1.63 1.81 2.09 4.21 7.42
3 1.85 1.11 1.13 1.00 1.00 1.37 1.46
4 1.70 1.02 1.03 1.00 1.00 1.21 1.08
5 1.60 1.00 1.01 1.00 1.00 1.11 1.04
6 1.01 1.00 1.00 1.00 1.00 1.04 1.01
7 2.98 1.70 2.06 2.32 3.04 13.53 15.70
8 1.87 1.14 1.18 1.14 1.36 2.41 4.98
9 1.87 1.17 1.20 1.19 1.57 2.91 9.18
10 1.86 1.11 1.19 1.26 1.56 2.82 6.35
11 1.78 1.06 1.18 1.39 1.63 2.95 5.29
12 1.91 1.19 1.21 1.11 1.46 2.56 8.01
13 1.87 1.11 1.14 1.19 1.33 2.23 2.67
14 1.69 1.04 1.17 1.26 1.37 2.16 2.36
15 1.59 1.06 1.16 1.38 1.46 2.29 2.28
16 1.61 1.08 1.25 1.43 1.65 2.25 2.31
17 1.72 1.04 1.11 1.19 1.25 1.85 2.07
18 1.60 1.03 1.17 1.26 1.30 2.01 2.09
19 1.58 1.04 1.16 1.38 1.34 2.09 2.07
20 1.54 1.05 1.25 1.43 1.51 2.12 2.12
Recurrenceinterval(years)
Normalvariate
Side-channel storage required (in demand days) for primary pump relation to meet indicated demand (in fraction of mean annual streamflow)
0.0020 0.0100 0.0200 0.0500 0.1000 0.2000 0.3000
53.00 2.078 140.03 205.90 206.43 242.48 271.69 301.15 431.38
50.00 2.054 138.75 204.36 206.20 242.17 270.40 300.88 430.01
40.00 1.960 133.74 198.34 205.32 240.94 265.38 299.82 424.63
30.00 1.834 127.01 190.25 204.13 239.30 258.63 298.40 417.42
25.00 1.751 122.75 183.24 200.93 235.12 254.23 295.15 401.90
20.00 1.645 117.83 169.89 190.42 221.59 248.80 284.89 353.57
10.00 1.282 75.37 135.03 149.98 175.62 198.97 251.65 299.91
5.00 0.841 42.58 100.80 109.21 130.33 149.81 200.61 231.64
2.04 0.024 24.43 53.50 59.93 75.61 102.16 126.11 143.25
212 Hydrologic Considerations for Estimation of Storage-Capacity Requirements of Impounding and Side-Channel Reservoirs for Water Supply in Ohio

03229500 Big Walnut Creek at Rees, Ohio
Location: Latitude 39°51′24″, longitude 82°57′26″, Franklin County, Hydrologic Unit 05060001
Drainage area, in square miles: 544.
Station used for record extension: 03147000
Time period of systematic or extended record analyzed: 1922-10-01 to 1961-09-30
Percentage of estimated values in extended record: 21.3
Eighty-percent-duration streamflow, in cubic feet per second: 34.
Mean annual streamflow, in inches: 12.35
Location of station used for precipitation data: Columbus, Ohio
Location of station used for potential evapotranspiration data: Columbus, Ohio
[–, indicates a value that could not be determined because there were too few average low-flow values less than the mean streamflow for the indicated duration]
Recurrenceinterval(years)
Extreme-value
variate
Minimum runoff (in inches) for indicated duration (in days)
180 360 540 720 1080 1440 1800
40.00 3.68 0.25 1.52 3.66 6.64 15.56 22.81 33.40
30.00 3.38 0.26 1.79 4.03 7.15 17.80 26.68 35.67
25.00 3.20 0.27 1.97 4.26 7.47 19.22 29.14 37.11
20.00 2.97 0.28 2.18 4.55 7.87 20.97 32.17 38.89
10.00 2.25 0.33 4.26 6.62 14.26 25.31 45.03 66.43
5.71 1.65 0.52 5.44 10.86 15.24 33.50 50.69 –
Hydrologic Design Tables 213

03229500 Big Walnut Creek at Rees, Ohio—Continued
Recurrenceinterval(years)
Impounding reservoir storage required (in inches) and critical-drawdown duration (in days; shown in gray) for indicated draft rate (in fraction of the mean annual streamflow)
0.02 0.05 0.10 0.15 0.20 0.25 0.30 0.35 0.40 0.45 0.50 0.60 0.70 0.80 0.90 1.00
5 0.00 0.03 0.19 0.39 0.63 1.04 1.44 1.85 2.25 2.66 3.07 4.02 5.14 6.53 8.97 11.40 0 60 120 120 240 240 240 240 240 240 240 330 330 720 720 720
6 0.00 0.03 0.21 0.41 0.70 1.04 1.44 1.85 2.25 2.66 3.07 4.02 5.14 6.53 8.97 11.40 0 60 120 120 180 240 240 240 240 240 240 330 330 720 720 720
8 0.00 0.04 0.24 0.52 0.82 1.14 1.49 1.85 2.31 2.76 3.22 4.13 5.51 7.54 9.57 11.60 0 90 150 180 180 210 210 270 270 270 270 270 600 600 600 600
10 0.00 0.04 0.28 0.57 0.88 1.23 1.59 1.99 2.44 2.90 3.35 4.86 6.69 8.71 10.74 12.77 0 90 150 180 210 210 210 270 270 270 270 540 540 600 600 600
15 0.00 0.06 0.32 0.62 1.00 1.41 1.81 2.22 2.73 3.37 4.38 6.41 8.44 10.89 13.94 16.98 0 120 180 180 240 240 240 300 300 600 600 600 600 900 900 900
20 0.00 0.08 0.34 0.72 1.13 1.53 1.95 2.45 3.23 4.25 5.26 7.49 10.53 13.58 17.41 23.50 0 120 180 240 240 240 300 300 600 600 600 900 900 900 1800 1800
25 0.00 0.09 0.37 0.78 1.18 1.61 2.17 2.73 3.71 4.72 5.76 8.80 11.85 15.03 21.12 27.20 30 120 240 240 240 330 330 330 600 600 900 900 900 1800 1800 1800
30 0.00 0.09 0.39 0.80 1.21 1.74 2.29 2.95 3.98 5.10 6.33 9.38 12.42 16.56 22.51 28.59 30 120 240 240 240 330 330 600 660 660 900 900 900 1320 1800 1800
40 0.01 0.12 0.39 0.80 1.25 1.74 2.30 3.18 4.29 5.41 6.59 9.84 14.26 18.93 23.59 28.59 60 150 240 240 270 330 330 660 660 660 960 960 1380 1380 1380 1800
50 0.02 0.14 0.43 0.89 1.35 1.80 2.30 3.18 4.35 6.08 8.23 12.89 17.56 22.22 26.89 31.56 90 150 270 270 270 270 330 660 1020 1020 1380 1380 1380 1380 1380 1380
60 0.03 0.16 0.51 0.97 1.43 1.88 2.34 3.95 6.12 8.46 10.79 15.45 20.12 24.79 29.45 34.12 90 150 270 270 270 270 270 1020 1380 1380 1380 1380 1380 1380 1380 1380
70 0.04 0.18 0.58 1.03 1.49 1.95 3.49 5.82 8.15 10.48 12.82 17.48 22.15 26.82 31.48 36.15 90 150 270 270 270 270 1380 1380 1380 1380 1380 1380 1380 1380 1380 1380
80 0.05 0.20 0.63 1.09 1.54 2.78 5.11 7.45 9.78 12.11 14.45 19.11 23.78 28.44 33.11 37.78 90 150 270 270 270 1380 1380 1380 1380 1380 1380 1380 1380 1380 1380 1380
90 0.06 0.22 0.67 1.13 1.77 4.10 6.44 8.77 11.10 13.43 15.77 20.43 25.10 29.77 34.43 39.10 150 270 270 270 1380 1380 1380 1380 1380 1380 1380 1380 1380 1380 1380 1380
100 0.07 0.25 0.71 1.16 2.85 5.19 7.52 9.85 12.19 14.52 16.85 21.52 26.18 30.85 35.52 40.18 150 270 270 270 1380 1380 1380 1380 1380 1380 1380 1380 1380 1380 1380 1380
214 Hydrologic Considerations for Estimation of Storage-Capacity Requirements of Impounding and Side-Channel Reservoirs for Water Supply in Ohio

03229500 Big Walnut Creek at Rees, Ohio—Continued
Pumpset
Ratio of storage required for pump set to storage required for the primary pump relation (pump set 1) for indicated demand (in fraction of mean
annual streamflow)
0.002 0.010 0.020 0.050 0.100 0.200 0.300
1 1.00 1.00 1.00 1.00 1.00 1.00 1.00
2 2.16 1.13 1.09 1.49 2.00 2.53 4.58
3 1.87 1.01 1.00 1.00 1.00 1.32 1.49
4 1.70 1.00 1.00 1.00 1.00 1.13 1.08
5 1.03 1.00 1.00 1.00 1.00 1.02 1.04
6 1.00 1.00 1.00 1.00 1.00 1.00 1.02
7 2.16 1.25 1.45 2.20 2.71 7.98 10.80
8 1.90 1.06 1.10 1.18 1.33 2.36 2.63
9 1.87 1.09 1.17 1.28 1.48 2.79 5.22
10 1.83 1.16 1.33 1.36 1.46 2.65 3.35
11 1.81 1.18 1.43 1.39 1.51 2.60 2.93
12 2.00 1.04 1.07 1.17 1.46 2.62 4.56
13 1.76 1.10 1.16 1.28 1.25 2.03 2.30
14 1.81 1.16 1.33 1.36 1.33 2.04 2.29
15 1.06 1.20 1.42 1.39 1.40 2.26 2.30
16 1.06 1.33 1.51 1.45 1.43 2.40 2.58
17 1.74 1.11 1.16 1.28 1.25 1.77 2.03
18 1.75 1.17 1.33 1.36 1.33 1.88 2.06
19 1.06 1.20 1.42 1.39 1.40 2.13 2.17
20 1.06 1.33 1.51 1.45 1.43 2.28 2.49
Recurrenceinterval(years)
Normalvariate
Side-channel storage required (in demand days) for primary pump relation to meet indicated demand (in fraction of mean annual streamflow)
0.0020 0.0100 0.0200 0.0500 0.1000 0.2000 0.3000
40.00 1.960 127.76 196.70 209.89 242.93 270.46 299.75 407.00
30.00 1.834 125.40 196.46 204.12 230.13 257.09 297.50 392.04
25.00 1.751 123.84 196.30 200.31 221.67 248.26 296.02 382.16
20.00 1.645 121.86 196.10 195.46 210.92 237.03 294.13 369.60
10.00 1.282 86.86 149.21 155.93 181.11 213.65 251.65 328.98
5.00 0.841 65.81 109.23 118.62 143.35 159.43 197.63 250.40
2.00 0.000 27.37 59.36 66.49 93.92 103.22 120.90 140.32
Hydrologic Design Tables 215

03230500 Big Darby Creek at Darbyville, Ohio
Location: Latitude 39°42′02″, longitude 83°06′37″, Pickaway County, Hydrologic Unit 05060001
Drainage area, in square miles: 534.
Station used for record extension: 03147000
Time period of systematic or extended record analyzed: 1922-10-01 to 1997-09-30
Percentage of estimated values in extended record: 4.0
Eighty-percent-duration streamflow, in cubic feet per second: 41.
Mean annual streamflow, in inches: 12.04
Location of station used for precipitation data: Columbus, Ohio
Location of station used for potential evapotranspiration data: Columbus, Ohio
[–, indicates a value that could not be determined because there were too few average low-flow values less than the mean stream-flow for the indicated duration]
Recurrenceinterval(years)
Extreme-value
variate
Minimum runoff (in inches) for indicated duration (in days)
180 360 540 720 1080 1440 1800
76.00 4.32 0.18 1.13 2.29 5.63 15.40 24.02 29.81
70.00 4.24 0.18 1.14 2.46 5.83 15.80 24.44 30.31
60.00 4.09 0.18 1.15 2.78 6.20 16.54 25.22 31.24
50.00 3.90 0.18 1.16 3.15 6.64 17.42 26.16 32.34
40.00 3.68 0.18 1.18 3.61 7.18 18.50 27.30 33.70
30.00 3.38 0.18 1.74 3.78 9.08 19.26 28.95 34.75
25.00 3.20 0.18 2.19 3.86 10.39 19.65 30.11 35.54
20.00 2.97 0.20 2.78 4.31 11.08 20.15 32.77 40.03
10.00 2.25 0.37 4.09 7.30 12.97 25.49 39.84 55.84
5.07 1.52 0.56 5.86 10.78 18.90 39.14 – –
216 Hydrologic Considerations for Estimation of Storage-Capacity Requirements of Impounding and Side-Channel Reservoirs for Water Supply in Ohio

03230500 Big Darby Creek at Darbyville, Ohio—Continued
Recurrenceinterval(years)
Impounding reservoir storage required (in inches) and critical-drawdown duration (in days; shown in gray) for indicated draft rate (in fraction of the mean annual streamflow)
0.02 0.05 0.10 0.15 0.20 0.25 0.30 0.35 0.40 0.45 0.50 0.60 0.70 0.80 0.90 1.00
5 0.00 0.03 0.16 0.36 0.59 0.88 1.18 1.48 1.77 2.09 2.43 3.13 4.02 5.00 5.99 7.08 0 60 120 120 150 180 180 180 180 210 210 210 300 300 300 540
6 0.00 0.03 0.19 0.40 0.66 0.96 1.26 1.58 1.93 2.27 2.62 3.40 4.29 5.27 6.26 8.22 0 60 120 150 180 180 180 210 210 210 210 270 270 300 300 600
8 0.00 0.05 0.22 0.48 0.77 1.11 1.46 1.80 2.17 2.57 3.00 3.89 4.78 6.10 8.08 10.24 30 90 120 180 180 210 210 210 240 240 270 270 270 600 600 660
10 0.00 0.06 0.26 0.55 0.89 1.23 1.60 2.00 2.41 2.86 3.30 4.19 5.24 7.21 9.19 11.38 30 90 150 180 210 210 240 240 270 270 270 270 600 600 600 1020
15 0.01 0.08 0.35 0.69 1.08 1.47 1.91 2.35 2.80 3.24 3.73 4.89 6.85 8.83 11.36 14.71 30 120 210 210 240 240 270 270 270 270 300 540 600 600 960 1320
20 0.01 0.10 0.41 0.80 1.20 1.64 2.08 2.54 3.03 3.53 4.09 5.83 7.80 10.31 13.38 18.90 60 150 210 240 240 270 270 300 300 300 480 540 600 900 960 1740
25 0.01 0.11 0.47 0.86 1.29 1.73 2.21 2.70 3.20 3.94 4.73 6.49 8.79 11.75 16.67 22.41 60 180 240 240 270 270 300 300 300 480 480 600 900 900 1740 1740
30 0.01 0.13 0.50 0.90 1.34 1.82 2.31 2.81 3.55 4.34 5.13 7.01 9.78 13.29 19.03 24.76 60 180 240 270 270 300 300 300 480 480 480 600 900 1740 1740 1740
40 0.02 0.14 0.53 0.96 1.44 1.93 2.43 3.19 3.98 4.81 5.80 8.03 11.00 16.03 21.76 27.50 60 210 240 270 300 300 300 480 480 600 600 900 900 1740 1740 1740
50 0.02 0.14 0.54 1.00 1.49 1.99 2.59 3.39 4.38 5.37 6.36 8.69 11.65 17.29 23.02 28.76 60 240 240 300 300 300 480 600 600 600 600 900 900 1740 1740 1740
60 0.02 0.14 0.55 1.02 1.52 2.02 2.84 3.82 4.81 5.80 6.79 9.04 12.01 17.72 23.46 29.22 60 240 270 300 300 330 600 600 600 600 600 900 900 1740 1740 1800
70 0.02 0.14 0.55 1.03 1.53 2.20 3.19 4.18 5.22 6.30 7.39 9.57 12.94 17.72 23.46 29.37 60 240 270 300 330 600 600 600 660 660 660 660 1320 1740 1740 1800
80 0.02 0.14 0.55 1.03 1.57 2.49 3.58 4.67 5.75 6.84 7.93 10.10 14.12 18.47 23.46 29.37 60 240 270 330 330 660 660 660 660 660 660 660 1320 1320 1740 1800
90 0.02 0.14 0.55 1.06 1.85 2.94 4.02 5.11 6.20 7.29 8.38 10.84 15.19 19.54 23.97 29.37 60 240 270 330 660 660 660 660 660 660 660 1320 1320 1320 1380 1800
100 0.02 0.14 0.55 1.13 2.22 3.31 4.40 5.49 6.57 7.66 8.75 11.82 16.18 20.53 24.94 29.49 60 240 270 660 660 660 660 660 660 660 660 1320 1320 1320 1380 1380
Hydrologic Design Tables 217

03230500 Big Darby Creek at Darbyville, Ohio—Continued
Pumpset
Ratio of storage required for pump set to storage required for the primary pump relation (pump set 1) for indicated demand (in fraction of mean
annual streamflow)
0.002 0.010 0.020 0.050 0.100 0.200 0.300
1 1.00 1.00 1.00 1.00 1.00 1.00 1.00
2 1.43 1.36 1.40 1.37 1.42 2.44 5.54
3 1.16 1.00 1.02 1.00 1.08 1.08 1.03
4 1.04 1.00 1.00 1.00 1.00 1.03 1.01
5 1.02 1.00 1.00 1.00 1.00 1.01 1.00
6 1.00 1.00 1.00 1.00 1.00 1.00 1.00
7 1.43 1.45 1.52 1.52 2.24 8.20 12.47
8 1.16 1.04 1.08 1.09 1.39 1.32 2.43
9 1.16 1.06 1.13 1.16 1.53 1.60 4.77
10 1.10 1.04 1.14 1.20 1.58 1.58 2.83
11 1.06 1.08 1.16 1.28 1.73 1.53 2.50
12 1.09 1.06 1.09 1.21 1.44 1.46 4.68
13 1.09 1.01 1.10 1.16 1.45 1.36 1.61
14 1.05 1.02 1.13 1.21 1.49 1.46 1.70
15 1.02 1.08 1.16 1.28 1.66 1.51 1.85
16 1.01 1.13 1.23 1.29 1.85 1.52 1.86
17 1.05 1.00 1.09 1.17 1.39 1.34 1.46
18 1.03 1.01 1.13 1.21 1.44 1.45 1.59
19 1.02 1.08 1.16 1.28 1.62 1.50 1.76
20 1.00 1.11 1.23 1.29 1.81 1.52 1.80
218 Hydrologic Considerations for Estimation of Storage-Capacity Requirements of Impounding and Side-Channel Reservoirs for Water Supply in Ohio

03230500 Big Darby Creek at Darbyville, Ohio—Continued
Recurrenceinterval(years)
Normalvariate
Side-channel storage required (in demand days) for primary pump relation to meet indicated demand (in fraction of mean annual streamflow)
0.0020 0.0100 0.0200 0.0500 0.1000 0.2000 0.3000
76.00 2.222 314.55 285.13 285.92 310.99 333.83 472.15 555.85
70.00 2.190 312.80 284.29 284.47 310.44 333.01 468.62 554.52
60.00 2.128 309.46 282.69 281.70 309.40 331.44 461.89 551.98
50.00 2.054 305.41 280.76 278.35 308.14 329.53 453.74 548.91
40.00 1.960 300.31 278.31 274.12 306.55 327.13 443.45 545.03
30.00 1.834 295.78 269.74 273.01 289.55 315.82 395.96 464.89
25.00 1.751 292.62 263.13 271.98 276.99 307.16 362.05 404.78
20.00 1.645 280.54 251.29 255.79 272.91 295.23 353.30 380.77
10.00 1.282 234.61 194.95 193.00 202.30 230.25 278.30 302.54
5.00 0.841 174.58 144.57 145.70 157.54 176.13 210.25 239.78
2.00 0.000 111.48 80.82 75.58 96.79 114.90 133.20 154.90
Hydrologic Design Tables 219

03230800 Deer Creek at Mount Sterling, Ohio
Location: Latitude 39°42′54″, longitude 83°15′26″, Madison County, Hydrologic Unit 05060002
Drainage area, in square miles: 228.
Station used for record extension: 03241500
Time period of systematic or extended record analyzed: 1952-09-01 to 1997-09-30
Percentage of estimated values in extended record: 62.2
Eighty-percent-duration streamflow, in cubic feet per second: 34.
Mean annual streamflow, in inches: 13.09
Location of station used for precipitation data: Columbus, Ohio
Location of station used for potential evapotranspiration data: Columbus, Ohio
[–, indicates a value that could not be determined because there were too few average low-flow values less than the mean stream-flow for the indicated duration]
Recurrenceinterval(years)
Extreme-value
variate
Minimum runoff (in inches) for indicated duration (in days)
180 360 540 720 1080 1440 1800
46.00 3.82 0.20 1.54 2.02 5.24 14.39 26.62 39.43
40.00 3.68 0.23 2.01 3.03 6.62 16.40 28.64 41.14
30.00 3.38 0.29 2.97 5.10 9.47 20.56 32.80 44.68
25.00 3.20 0.32 3.58 6.42 11.29 23.21 35.45 46.94
20.00 2.97 0.38 3.94 7.19 12.43 24.57 37.15 49.10
10.00 2.25 0.50 5.35 8.51 15.22 28.71 38.95 54.48
5.11 1.52 0.86 6.61 12.34 18.30 37.41 – –
220 Hydrologic Considerations for Estimation of Storage-Capacity Requirements of Impounding and Side-Channel Reservoirs for Water Supply in Ohio

03230800 Deer Creek at Mount Sterling, Ohio—Continued
Recurrenceinterval(years)
Impounding reservoir storage required (in inches) and critical-drawdown duration (in days; shown in gray) for indicated draft rate (in fraction of the mean annual streamflow)
0.02 0.05 0.10 0.15 0.20 0.25 0.30 0.35 0.40 0.45 0.50 0.60 0.70 0.80 0.90 1.00
5 0.00 0.01 0.13 0.29 0.48 0.74 1.06 1.42 1.79 2.17 2.55 3.30 4.05 4.80 5.59 7.53 0 30 90 90 120 180 180 210 210 210 210 210 210 210 240 600
6 0.00 0.02 0.14 0.34 0.59 0.91 1.23 1.59 1.97 2.34 2.72 3.48 4.34 5.28 6.41 8.56 0 30 90 120 180 180 180 210 210 210 210 240 240 270 600 600
8 0.00 0.02 0.19 0.43 0.73 1.05 1.38 1.74 2.12 2.55 2.98 3.93 4.90 5.94 7.88 12.03 0 30 120 150 180 180 180 210 240 240 240 270 270 540 540 1260
10 0.00 0.03 0.21 0.47 0.79 1.12 1.44 1.84 2.27 2.70 3.15 4.11 5.08 6.53 10.08 14.59 0 60 120 180 180 180 180 240 240 240 270 270 270 540 1260 1260
15 0.00 0.04 0.24 0.54 0.86 1.19 1.56 1.99 2.42 2.85 3.28 4.25 5.80 7.95 10.94 15.24 30 90 150 180 180 180 240 240 240 240 270 270 600 600 960 1740
20 0.00 0.06 0.27 0.59 0.91 1.23 1.66 2.09 2.52 2.95 3.38 5.16 7.31 9.46 12.34 15.61 30 90 150 180 180 240 240 240 240 240 270 600 600 600 900 1740
25 0.00 0.07 0.30 0.63 0.95 1.34 1.77 2.20 2.63 3.27 4.35 6.50 8.65 10.83 14.06 17.28 30 90 180 180 180 240 240 240 240 600 600 600 600 900 900 900
30 0.00 0.08 0.34 0.66 1.03 1.46 1.89 2.32 3.34 4.42 5.49 7.64 9.79 12.53 15.75 18.98 30 90 180 180 240 240 240 240 600 600 600 600 600 900 900 900
40 0.00 0.09 0.41 0.80 1.23 1.96 2.93 4.01 5.08 6.16 7.23 9.38 12.36 15.58 18.81 24.04 30 150 180 240 240 540 600 600 600 600 600 600 900 900 900 1620
50 0.00 0.15 0.53 1.27 2.24 3.21 4.18 5.17 6.25 7.41 8.92 12.19 16.28 20.44 25.63 31.44 30 180 240 540 540 540 540 600 600 840 840 1140 1140 1260 1620 1620
60 0.01 0.22 1.04 2.01 2.97 3.94 4.91 6.53 8.57 10.61 12.66 17.09 21.61 26.38 32.18 37.99 120 210 540 540 540 540 540 1140 1140 1140 1140 1260 1260 1620 1620 1620
70 0.05 0.48 1.45 2.41 3.40 5.45 7.49 9.70 11.96 14.21 16.47 20.99 25.85 31.66 37.46 43.27 210 540 540 540 1140 1140 1140 1260 1260 1260 1260 1260 1620 1620 1620 1620
80 0.12 0.70 1.67 3.25 5.40 7.66 9.92 12.18 14.43 16.69 18.95 24.09 29.90 35.70 41.51 47.31 540 540 540 1140 1260 1260 1260 1260 1260 1260 1260 1620 1620 1620 1620 1620
90 0.24 0.82 2.39 4.65 6.91 9.17 11.42 13.68 15.94 18.38 21.29 27.09 32.90 38.70 44.51 50.31 540 540 1260 1260 1260 1260 1260 1260 1260 1620 1620 1620 1620 1620 1620 1620
100 0.31 1.03 3.29 5.54 7.80 10.06 12.32 14.77 17.67 20.57 23.47 29.28 35.09 40.89 46.70 52.50 540 1260 1260 1260 1260 1260 1260 1620 1620 1620 1620 1620 1620 1620 1620 1620
Hydrologic Design Tables 221

03230800 Deer Creek at Mount Sterling, Ohio—Continued
Pumpset
Ratio of storage required for pump set to storage required for the primary pump relation (pump set 1) for indicated demand (in fraction of mean
annual streamflow)
0.002 0.010 0.020 0.050 0.100 0.200 0.300
1 1.00 1.00 1.00 1.00 1.00 1.00 1.00
2 2.19 2.02 1.82 1.86 1.44 2.07 3.48
3 1.29 1.27 1.32 1.49 1.16 1.02 1.09
4 1.09 1.04 1.00 1.17 1.05 1.00 1.00
5 1.04 1.02 1.00 1.00 1.02 1.00 1.00
6 1.02 1.00 1.00 1.00 1.01 1.00 1.00
7 2.19 2.04 1.86 2.12 1.90 4.79 8.36
8 1.29 1.31 1.46 1.65 1.30 1.26 2.09
9 1.29 1.34 1.44 1.74 1.33 1.40 3.58
10 1.13 1.11 1.31 1.70 1.35 1.34 2.81
11 1.09 1.07 1.14 1.64 1.36 1.38 2.52
12 1.74 1.66 1.60 1.73 1.34 1.37 3.35
13 1.13 1.09 1.11 1.57 1.28 1.20 1.49
14 1.08 1.08 1.12 1.53 1.31 1.24 1.57
15 1.06 1.06 1.14 1.50 1.34 1.30 1.61
16 1.03 1.11 1.18 1.51 1.37 1.38 1.71
17 1.09 1.06 1.04 1.46 1.25 1.16 1.40
18 1.04 1.06 1.12 1.43 1.30 1.24 1.49
19 1.02 1.04 1.14 1.40 1.33 1.29 1.54
20 1.00 1.11 1.18 1.45 1.37 1.37 1.65
Recurrenceinterval(years)
Normalvariate
Side-channel storage required (in demand days) for primary pump relation to meet indicated demand (in fraction of mean annual streamflow)
0.0020 0.0100 0.0200 0.0500 0.1000 0.2000 0.3000
46.00 2.020 231.52 244.52 268.08 290.43 428.42 540.40 573.61
40.00 1.960 229.63 235.23 262.29 290.23 406.90 501.71 543.03
30.00 1.834 225.59 215.41 249.95 289.80 361.01 419.18 477.82
25.00 1.751 222.92 202.32 241.80 289.52 330.70 364.68 434.75
20.00 1.645 220.76 195.52 225.44 259.92 282.52 314.96 390.73
10.00 1.282 212.58 181.69 185.47 194.17 209.65 240.38 270.05
5.00 0.841 145.77 141.37 141.54 141.17 156.71 191.10 220.53
2.00 0.000 106.84 85.82 91.32 100.62 117.59 140.23 150.58
222 Hydrologic Considerations for Estimation of Storage-Capacity Requirements of Impounding and Side-Channel Reservoirs for Water Supply in Ohio

03231000 Deer Creek at Williamsport, Ohio
Location: Latitude 39°35′09″, longitude 83°07′22″, Pickaway County, Hydrologic Unit 05060002
Drainage area, in square miles: 333.
Station used for record extension: 03230500
Time period of systematic or extended record analyzed: 1922-10-01 to 1967-09-30
Percentage of estimated values in extended record: 28.3
Eighty-percent-duration streamflow, in cubic feet per second: 36.
Mean annual streamflow, in inches: 11.59
Location of station used for precipitation data: Columbus, Ohio
Location of station used for potential evapotranspiration data: Columbus, Ohio
[–, indicates a value that could not be determined because there were too few average low-flow values less than the mean streamflow for the indicated duration]
Recurrenceinterval(years)
Extreme-value
variate
Minimum runoff (in inches) for indicated duration (in days)
180 360 540 720 1080 1440 1800
46.00 3.82 0.18 1.33 2.83 6.68 15.90 24.22 30.39
40.00 3.68 0.18 1.33 3.02 6.80 16.73 25.86 31.88
30.00 3.38 0.18 1.34 3.41 7.04 18.45 29.23 34.97
25.00 3.20 0.18 1.35 3.66 7.19 19.55 31.38 36.93
20.00 2.97 0.20 1.72 4.06 8.36 20.56 32.78 39.22
10.00 2.25 0.26 2.74 5.49 11.89 25.68 35.31 50.36
5.11 1.52 0.41 4.83 10.62 16.47 38.78 60.56 –
Hydrologic Design Tables 223

03231000 Deer Creek at Williamsport, Ohio—Continued
Recurrenceinterval(years)
Impounding reservoir storage required (in inches) and critical-drawdown duration (in days; shown in gray) for indicated draft rate (in fraction of the mean annual streamflow)
0.02 0.05 0.10 0.15 0.20 0.25 0.30 0.35 0.40 0.45 0.50 0.60 0.70 0.80 0.90 1.00
5 0.00 0.04 0.19 0.45 0.74 1.03 1.34 1.67 2.00 2.35 2.78 3.64 4.52 5.53 7.23 9.33 0 60 120 180 180 180 210 210 210 270 270 270 300 330 660 660
6 0.00 0.04 0.23 0.50 0.79 1.13 1.46 1.79 2.13 2.53 2.95 3.81 4.67 5.53 7.23 9.33 0 90 150 180 210 210 210 210 240 270 270 270 270 300 660 660
8 0.00 0.06 0.27 0.57 0.91 1.27 1.65 2.03 2.41 2.79 3.21 4.07 5.49 7.20 9.05 10.95 30 90 150 210 210 240 240 240 240 240 270 270 540 540 600 600
10 0.00 0.07 0.30 0.63 1.00 1.38 1.76 2.15 2.53 2.95 3.38 4.79 6.51 8.22 10.12 12.02 30 120 180 210 240 240 240 240 240 270 270 540 540 540 600 600
15 0.01 0.09 0.35 0.72 1.11 1.49 1.93 2.41 2.88 3.44 4.20 5.85 7.68 9.58 11.49 16.18 30 120 180 240 240 240 300 300 300 480 480 540 600 600 600 1740
20 0.01 0.10 0.38 0.76 1.21 1.69 2.16 2.64 3.16 3.80 4.61 6.52 8.42 10.68 13.86 19.38 60 150 240 240 300 300 300 300 330 480 600 600 600 780 1740 1740
25 0.01 0.11 0.39 0.84 1.32 1.80 2.30 2.82 3.34 4.18 5.13 7.11 9.20 11.65 15.65 21.18 60 150 240 300 300 300 330 330 330 600 600 660 660 780 1740 1740
30 0.01 0.11 0.42 0.89 1.37 1.86 2.39 2.91 3.63 4.59 5.64 7.73 9.83 12.09 16.99 22.51 60 150 300 300 300 330 330 330 600 660 660 660 660 780 1740 1740
40 0.01 0.11 0.43 0.91 1.38 1.90 2.42 3.30 4.29 5.34 6.39 8.48 10.92 14.06 19.27 24.85 60 150 300 300 300 330 330 600 660 660 660 660 960 1320 1740 1800
50 0.01 0.11 0.45 0.91 1.38 1.90 2.82 3.77 4.73 5.73 6.78 9.39 13.02 17.40 22.16 27.87 60 150 240 300 300 330 600 600 600 660 660 960 1380 1380 1800 1800
60 0.01 0.11 0.47 0.91 1.38 2.25 3.21 4.16 5.11 6.45 8.64 13.02 17.40 21.78 26.16 30.93 60 210 240 300 300 600 600 600 600 1380 1380 1380 1380 1380 1380 1800
70 0.01 0.13 0.49 0.91 1.62 2.57 3.52 5.57 7.76 9.95 12.14 16.52 20.90 25.28 29.66 34.04 60 210 240 300 600 600 600 1380 1380 1380 1380 1380 1380 1380 1380 1380
80 0.01 0.15 0.52 0.93 1.88 3.85 6.04 8.23 10.42 12.61 14.80 19.18 23.56 27.94 32.57 37.52 60 210 240 600 600 1380 1380 1380 1380 1380 1380 1380 1380 1380 1560 1560
90 0.01 0.16 0.54 1.44 3.63 5.82 8.01 10.20 12.39 14.58 16.77 21.15 25.61 30.56 35.51 40.47 60 210 240 1380 1380 1380 1380 1380 1380 1380 1380 1380 1560 1560 1560 1560
100 0.01 0.18 0.69 2.88 5.07 7.26 9.45 11.64 13.83 16.02 18.21 22.95 27.90 32.85 37.80 42.75 60 240 1380 1380 1380 1380 1380 1380 1380 1380 1380 1560 1560 1560 1560 1560
224 Hydrologic Considerations for Estimation of Storage-Capacity Requirements of Impounding and Side-Channel Reservoirs for Water Supply in Ohio

03231000 Deer Creek at Williamsport, Ohio—Continued
Pumpset
Ratio of storage required for pump set to storage required for the primary pump relation (pump set 1) for indicated demand (in fraction of mean
annual streamflow)
0.002 0.010 0.020 0.050 0.100 0.200 0.300
1 1.00 1.00 1.00 1.00 1.00 1.00 1.00
2 2.35 1.77 1.51 1.64 1.99 3.88 6.37
3 1.32 1.25 1.06 1.01 1.10 1.12 1.15
4 1.12 1.10 1.03 1.00 1.00 1.06 1.05
5 1.06 1.04 1.01 1.00 1.00 1.04 1.03
6 1.00 1.02 1.00 1.00 1.00 1.02 1.01
7 2.38 1.94 1.78 2.08 3.64 8.93 11.20
8 1.33 1.28 1.13 1.06 1.42 1.55 2.67
9 1.34 1.27 1.17 1.11 1.53 1.83 4.38
10 1.25 1.28 1.19 1.14 1.56 1.79 2.83
11 1.23 1.29 1.22 1.17 1.69 1.68 2.46
12 1.38 1.31 1.12 1.21 1.45 1.94 4.84
13 1.26 1.20 1.15 1.12 1.40 1.41 1.81
14 1.15 1.23 1.17 1.14 1.46 1.50 1.83
15 1.13 1.23 1.20 1.17 1.62 1.50 1.88
16 1.06 1.28 1.26 1.21 1.79 1.60 1.95
17 1.17 1.18 1.13 1.12 1.32 1.39 1.60
18 1.08 1.18 1.17 1.13 1.41 1.46 1.67
19 1.02 1.21 1.20 1.18 1.56 1.48 1.76
20 1.01 1.27 1.26 1.23 1.77 1.56 1.86
Recurrenceinterval(years)
Normalvariate
Side-channel storage required (in demand days) for primary pump relation to meet indicated demand (in fraction of mean annual streamflow)
0.0020 0.0100 0.0200 0.0500 0.1000 0.2000 0.3000
46.00 2.020 279.50 245.07 285.96 320.21 333.43 450.62 529.93
40.00 1.960 276.16 243.47 284.73 319.88 333.33 438.33 523.48
30.00 1.834 269.03 240.07 282.10 319.19 333.11 412.11 509.73
25.00 1.751 264.32 237.82 280.37 318.73 332.97 394.80 500.64
20.00 1.645 259.42 233.17 273.38 309.79 328.70 376.02 465.98
10.00 1.282 240.59 219.78 231.03 256.75 263.13 327.61 369.22
5.00 0.841 215.76 199.29 206.38 221.75 231.07 259.41 289.88
2.00 0.000 146.97 113.91 125.55 127.94 139.97 172.39 191.06
Hydrologic Design Tables 225

03232000 Paint Creek near Greenfield, Ohio
Location: Latitude 39°22′45″, longitude 83°22′32″, Fayette County, Hydrologic Unit 05060003
Drainage area, in square miles: 249.
Station used for record extension: 03231000
Time period of systematic or extended record analyzed: 1922-10-01 to 1981-09-30
Percentage of estimated values in extended record: 27.1
Eighty-percent-duration streamflow, in cubic feet per second: 11.
Mean annual streamflow, in inches: 12.81
Location of station used for precipitation data: Hillsboro, Ohio
Location of station used for potential evapotranspiration data: Dayton, Ohio
[–, indicates a value that could not be determined because there were too few average low-flow values less than the mean stream-flow for the indicated duration]
Recurrenceinterval(years)
Extreme-value
variate
Minimum runoff (in inches) for indicated duration (in days)
180 360 540 720 1080 1440 1800
60.00 4.09 0.04 0.80 3.30 6.31 13.81 21.59 30.13
50.00 3.90 0.05 1.07 3.48 7.16 15.60 24.42 32.99
40.00 3.68 0.05 1.40 3.70 8.21 17.79 27.90 36.51
30.00 3.38 0.06 1.83 3.98 9.56 20.63 32.39 41.05
25.00 3.20 0.06 1.91 4.15 9.66 22.29 35.27 42.97
20.00 2.97 0.07 2.00 4.36 9.78 24.34 38.82 45.34
10.00 2.25 0.23 3.49 7.11 14.26 27.37 41.92 60.91
5.45 1.60 0.30 6.48 11.35 16.91 30.35 57.16 –
226 Hydrologic Considerations for Estimation of Storage-Capacity Requirements of Impounding and Side-Channel Reservoirs for Water Supply in Ohio
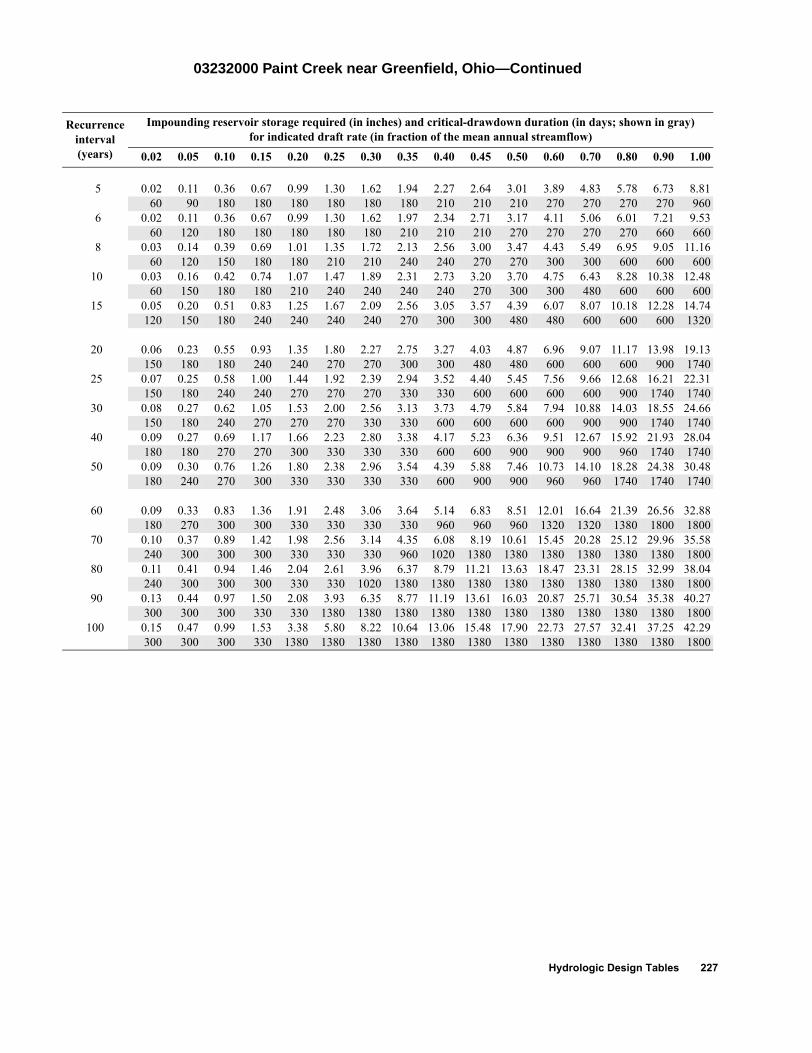
03232000 Paint Creek near Greenfield, Ohio—Continued
Recurrenceinterval(years)
Impounding reservoir storage required (in inches) and critical-drawdown duration (in days; shown in gray) for indicated draft rate (in fraction of the mean annual streamflow)
0.02 0.05 0.10 0.15 0.20 0.25 0.30 0.35 0.40 0.45 0.50 0.60 0.70 0.80 0.90 1.00
5 0.02 0.11 0.36 0.67 0.99 1.30 1.62 1.94 2.27 2.64 3.01 3.89 4.83 5.78 6.73 8.81 60 90 180 180 180 180 180 180 210 210 210 270 270 270 270 960
6 0.02 0.11 0.36 0.67 0.99 1.30 1.62 1.97 2.34 2.71 3.17 4.11 5.06 6.01 7.21 9.53 60 120 180 180 180 180 180 210 210 210 270 270 270 270 660 660
8 0.03 0.14 0.39 0.69 1.01 1.35 1.72 2.13 2.56 3.00 3.47 4.43 5.49 6.95 9.05 11.16 60 120 150 180 180 210 210 240 240 270 270 300 300 600 600 600
10 0.03 0.16 0.42 0.74 1.07 1.47 1.89 2.31 2.73 3.20 3.70 4.75 6.43 8.28 10.38 12.48 60 150 180 180 210 240 240 240 240 270 300 300 480 600 600 600
15 0.05 0.20 0.51 0.83 1.25 1.67 2.09 2.56 3.05 3.57 4.39 6.07 8.07 10.18 12.28 14.74 120 150 180 240 240 240 240 270 300 300 480 480 600 600 600 1320
20 0.06 0.23 0.55 0.93 1.35 1.80 2.27 2.75 3.27 4.03 4.87 6.96 9.07 11.17 13.98 19.13 150 180 180 240 240 270 270 300 300 480 480 600 600 600 900 1740
25 0.07 0.25 0.58 1.00 1.44 1.92 2.39 2.94 3.52 4.40 5.45 7.56 9.66 12.68 16.21 22.31 150 180 240 240 270 270 270 330 330 600 600 600 600 900 1740 1740
30 0.08 0.27 0.62 1.05 1.53 2.00 2.56 3.13 3.73 4.79 5.84 7.94 10.88 14.03 18.55 24.66 150 180 240 270 270 270 330 330 600 600 600 600 900 900 1740 1740
40 0.09 0.27 0.69 1.17 1.66 2.23 2.80 3.38 4.17 5.23 6.36 9.51 12.67 15.92 21.93 28.04 180 180 270 270 300 330 330 330 600 600 900 900 900 960 1740 1740
50 0.09 0.30 0.76 1.26 1.80 2.38 2.96 3.54 4.39 5.88 7.46 10.73 14.10 18.28 24.38 30.48 180 240 270 300 330 330 330 330 600 900 900 960 960 1740 1740 1740
60 0.09 0.33 0.83 1.36 1.91 2.48 3.06 3.64 5.14 6.83 8.51 12.01 16.64 21.39 26.56 32.88 180 270 300 300 330 330 330 330 960 960 960 1320 1320 1380 1800 1800
70 0.10 0.37 0.89 1.42 1.98 2.56 3.14 4.35 6.08 8.19 10.61 15.45 20.28 25.12 29.96 35.58 240 300 300 300 330 330 330 960 1020 1380 1380 1380 1380 1380 1380 1800
80 0.11 0.41 0.94 1.46 2.04 2.61 3.96 6.37 8.79 11.21 13.63 18.47 23.31 28.15 32.99 38.04 240 300 300 300 330 330 1020 1380 1380 1380 1380 1380 1380 1380 1380 1800
90 0.13 0.44 0.97 1.50 2.08 3.93 6.35 8.77 11.19 13.61 16.03 20.87 25.71 30.54 35.38 40.27 300 300 300 330 330 1380 1380 1380 1380 1380 1380 1380 1380 1380 1380 1800
100 0.15 0.47 0.99 1.53 3.38 5.80 8.22 10.64 13.06 15.48 17.90 22.73 27.57 32.41 37.25 42.29 300 300 300 330 1380 1380 1380 1380 1380 1380 1380 1380 1380 1380 1380 1800
Hydrologic Design Tables 227

03232000 Paint Creek near Greenfield, Ohio—Continued
Pumpset
Ratio of storage required for pump set to storage required for the primary pump relation (pump set 1) for indicated demand (in fraction of mean
annual streamflow)
0.002 0.010 0.020 0.050 0.100 0.200 0.300
1 1.00 1.00 1.00 1.00 1.00 1.00 1.00
2 1.22 1.09 1.04 1.01 1.25 1.81 2.31
3 1.18 1.07 1.02 1.00 1.00 1.06 1.40
4 1.10 1.04 1.00 1.00 1.00 1.00 1.04
5 1.04 1.02 1.00 1.00 1.00 1.00 1.00
6 1.01 1.00 1.00 1.00 1.00 1.00 1.00
7 1.22 1.11 1.07 1.20 1.82 3.26 8.00
8 1.18 1.10 1.07 1.07 1.10 1.70 2.26
9 1.18 1.10 1.11 1.11 1.22 2.01 2.83
10 1.15 1.14 1.15 1.15 1.21 1.88 2.56
11 1.11 1.17 1.16 1.23 1.23 1.81 2.59
12 1.20 1.09 1.07 1.07 1.18 1.91 2.42
13 1.14 1.08 1.11 1.11 1.16 1.42 2.25
14 1.09 1.13 1.15 1.15 1.20 1.51 2.23
15 1.07 1.15 1.14 1.23 1.23 1.62 2.41
16 1.04 1.21 1.22 1.28 1.25 1.82 2.58
17 1.10 1.06 1.10 1.12 1.16 1.23 1.99
18 1.06 1.12 1.15 1.15 1.20 1.38 2.10
19 1.03 1.12 1.14 1.23 1.23 1.57 2.31
20 1.02 1.21 1.22 1.28 1.25 1.83 2.52
Recurrenceinterval(years)
Normalvariate
Side-channel storage required (in demand days) for primary pump relation to meet indicated demand (in fraction of mean annual streamflow)
0.0020 0.0100 0.0200 0.0500 0.1000 0.2000 0.3000
60.00 2.128 264.00 277.33 292.37 312.18 321.60 338.47 350.31
50.00 2.054 262.93 271.64 281.58 303.13 319.50 337.92 349.99
40.00 1.960 261.59 264.45 267.95 291.71 316.85 337.24 349.59
30.00 1.834 259.78 254.79 249.64 276.36 313.29 336.31 349.05
25.00 1.751 246.68 241.39 239.88 263.33 295.49 317.43 343.43
20.00 1.645 230.01 224.35 227.46 246.76 272.84 293.41 336.29
10.00 1.282 193.59 190.92 185.61 202.20 217.73 243.10 269.24
5.00 0.841 155.87 147.01 144.58 145.88 179.76 188.57 221.69
2.00 0.000 92.02 72.52 70.99 87.30 104.03 123.86 141.69
228 Hydrologic Considerations for Estimation of Storage-Capacity Requirements of Impounding and Side-Channel Reservoirs for Water Supply in Ohio

03232300 Rattlesnake Creek at Centerfield, Ohio
Location: Latitude 39°19′44″, longitude 83°28′32″, Highland County, Hydrologic Unit 05060003
Drainage area, in square miles: 209.
Station used for record extension: 03232000
Time period of systematic or extended record analyzed: 1922-10-01 to 1981-10-09
Percentage of estimated values in extended record: 82.9
Eighty-percent-duration streamflow, in cubic feet per second: 23.
Mean annual streamflow, in inches: 12.89
Location of station used for precipitation data: Hillsboro, Ohio
Location of station used for potential evapotranspiration data: Dayton, Ohio
[–, indicates a value that could not be determined because there were too few average low-flow values less than the mean streamflow for the indicated duration]
Recurrenceinterval(years)
Extreme-value
variate
Minimum runoff (in inches) for indicated duration (in days)
180 360 540 720 1080 1440 1800
60.00 4.09 0.03 0.64 3.04 5.77 13.17 21.00 29.51
50.00 3.90 0.03 0.89 3.17 6.64 14.93 23.77 32.31
40.00 3.68 0.04 1.21 3.32 7.71 17.08 27.17 35.74
30.00 3.38 0.04 1.61 3.52 9.10 19.87 31.57 40.18
25.00 3.20 0.04 1.67 3.72 9.14 22.36 34.74 42.45
20.00 2.97 0.05 1.74 3.96 9.20 25.42 38.64 45.25
10.00 2.25 0.15 3.17 6.67 13.83 27.19 42.25 60.64
5.45 1.60 0.22 6.20 11.35 16.71 30.26 56.60 –
Hydrologic Design Tables 229

03232300 Rattlesnake Creek at Centerfield, Ohio—Continued
Recurrenceinterval(years)
Impounding reservoir storage required (in inches) and critical-drawdown duration (in days; shown in gray) for indicated draft rate (in fraction of the mean annual streamflow)
0.02 0.05 0.10 0.15 0.20 0.25 0.30 0.35 0.40 0.45 0.50 0.60 0.70 0.80 0.90 1.00
5 0.03 0.14 0.43 0.75 1.07 1.40 1.77 2.14 2.51 2.88 3.31 4.26 5.22 6.17 7.35 9.68 90 150 180 180 180 210 210 210 210 210 270 270 270 270 660 660
6 0.03 0.15 0.43 0.75 1.07 1.43 1.80 2.17 2.55 3.03 3.51 4.46 5.41 6.37 7.81 10.14 90 150 180 180 180 210 210 210 270 270 270 270 270 270 660 660
8 0.04 0.18 0.46 0.78 1.12 1.49 1.90 2.33 2.80 3.28 3.77 4.83 5.89 7.33 9.45 11.57 120 150 180 180 210 210 240 270 270 270 300 300 300 600 600 600
10 0.05 0.20 0.50 0.81 1.19 1.61 2.04 2.49 3.00 3.53 4.06 5.12 6.78 8.71 10.82 12.94 120 150 180 180 240 240 240 270 300 300 300 300 480 600 600 600
15 0.07 0.24 0.56 0.94 1.36 1.78 2.26 2.79 3.32 3.92 4.77 6.47 8.59 10.71 12.82 14.94 150 180 180 240 240 240 300 300 300 480 480 600 600 600 600 600
20 0.08 0.27 0.60 1.02 1.45 1.93 2.43 2.96 3.57 4.42 5.39 7.51 9.63 11.74 14.16 19.95 150 180 240 240 270 270 300 300 480 480 600 600 600 600 900 1740
25 0.09 0.28 0.66 1.08 1.55 2.03 2.60 3.18 3.88 4.94 6.00 8.12 10.23 12.98 17.35 23.49 180 180 240 240 270 270 330 330 600 600 600 600 600 900 1740 1740
30 0.10 0.29 0.69 1.15 1.63 2.17 2.76 3.34 4.26 5.32 6.38 8.50 11.27 14.44 19.88 26.02 180 180 240 270 270 330 330 330 600 600 600 600 900 900 1740 1740
40 0.10 0.32 0.77 1.25 1.81 2.39 2.97 3.62 4.68 5.73 6.88 10.05 13.23 17.16 23.30 29.44 180 240 270 270 330 330 330 600 600 600 900 900 900 1740 1740 1740
50 0.10 0.35 0.83 1.36 1.94 2.52 3.10 3.79 4.93 6.52 8.10 11.49 14.88 19.39 25.53 31.67 180 270 300 300 330 330 330 600 900 900 900 960 960 1740 1740 1740
60 0.11 0.39 0.91 1.45 2.03 2.61 3.20 4.26 5.95 7.64 9.34 12.80 17.45 22.28 27.51 33.86 240 270 300 330 330 330 330 960 960 960 960 1320 1320 1380 1800 1800
70 0.13 0.43 0.96 1.52 2.10 2.68 3.51 5.21 6.98 8.85 11.29 16.16 21.03 25.90 30.77 36.34 270 300 300 330 330 330 960 960 1020 1380 1380 1380 1380 1380 1380 1800
80 0.15 0.47 1.00 1.56 2.15 3.04 4.84 6.90 9.34 11.77 14.21 19.08 23.95 28.82 33.69 38.57 300 300 300 330 330 1020 1020 1380 1380 1380 1380 1380 1380 1380 1380 1800
90 0.17 0.49 1.02 1.60 2.40 4.34 6.77 9.21 11.64 14.08 16.51 21.38 26.25 31.12 35.99 40.86 300 300 300 330 1020 1380 1380 1380 1380 1380 1380 1380 1380 1380 1380 1380
100 0.19 0.50 1.05 1.65 3.70 6.13 8.57 11.00 13.44 15.87 18.31 23.18 28.05 32.92 37.79 42.66 300 300 330 360 1380 1380 1380 1380 1380 1380 1380 1380 1380 1380 1380 1380
230 Hydrologic Considerations for Estimation of Storage-Capacity Requirements of Impounding and Side-Channel Reservoirs for Water Supply in Ohio

03232300 Rattlesnake Creek at Centerfield, Ohio—Continued
Pumpset
Ratio of storage required for pump set to storage required for the primary pump relation (pump set 1) for indicated demand (in fraction of mean
annual streamflow)
0.002 0.010 0.020 0.050 0.100 0.200 0.300
1 1.00 1.00 1.00 1.00 1.00 1.00 1.00
2 1.76 1.59 1.63 1.71 1.95 3.29 4.98
3 1.07 1.00 1.00 1.00 1.07 1.42 1.51
4 1.04 1.00 1.00 1.00 1.00 1.01 1.09
5 1.03 1.00 1.00 1.00 1.00 1.00 1.02
6 1.01 1.00 1.00 1.00 1.00 1.00 1.00
7 1.76 1.61 1.67 1.89 2.31 6.84 8.76
8 1.07 1.00 1.00 1.03 1.23 1.97 2.44
9 1.08 1.00 1.02 1.09 1.31 2.25 3.80
10 1.04 1.02 1.06 1.07 1.13 2.08 2.35
11 1.04 1.03 1.08 1.11 1.11 1.94 2.11
12 1.09 1.00 1.04 1.15 1.54 2.21 3.88
13 1.05 1.00 1.03 1.05 1.08 1.79 1.94
14 1.03 1.02 1.05 1.07 1.09 1.68 1.89
15 1.02 1.03 1.08 1.10 1.11 1.67 1.93
16 1.01 1.03 1.11 1.11 1.11 1.86 1.99
17 1.04 1.00 1.03 1.05 1.07 1.49 1.74
18 1.03 1.02 1.05 1.08 1.09 1.55 1.77
19 1.01 1.03 1.08 1.10 1.11 1.60 1.83
20 1.00 1.03 1.11 1.11 1.11 1.84 1.92
Recurrenceinterval(years)
Normalvariate
Side-channel storage required (in demand days) for primary pump relation to meet indicated demand (in fraction of mean annual streamflow)
0.0020 0.0100 0.0200 0.0500 0.1000 0.2000 0.3000
60.00 2.128 383.20 369.77 362.52 364.75 364.67 369.67 461.00
50.00 2.054 377.70 356.33 355.81 362.80 363.76 369.28 444.69
40.00 1.960 370.75 339.36 347.34 360.34 362.61 368.78 424.11
30.00 1.834 361.41 316.55 335.96 357.04 361.06 368.11 396.44
25.00 1.751 346.76 316.13 323.62 341.66 345.33 354.68 388.15
20.00 1.645 328.12 315.59 307.92 322.09 325.31 337.59 377.60
10.00 1.282 282.55 249.64 255.70 265.75 267.26 282.57 337.81
5.00 0.841 234.11 218.05 205.42 198.91 210.98 248.04 262.53
2.00 0.000 175.17 126.26 121.77 123.49 133.10 154.85 175.75
Hydrologic Design Tables 231

03232500 Rocky Fork near Barretts Mills, Ohio
Location: Latitude 39°13′06″, longitude 83°23′08″, Highland County, Hydrologic Unit 05060003
Drainage area, in square miles: 140.
Station used for record extension: 03247500
Time period of systematic or extended record analyzed: 1925-04-01 to 1951-09-30
Percentage of estimated values in extended record: 54.7
Eighty-percent-duration streamflow, in cubic feet per second: 18.
Mean annual streamflow, in inches: 16.43
Location of station used for precipitation data: Hillsboro, Ohio
Location of station used for potential evapotranspiration data: Dayton, Ohio
[–, indicates a value that could not be determined because there were too few average low-flow values less than the mean stream-flow for the indicated duration]
Recurrenceinterval(years)
Extreme-value
variate
Minimum runoff (in inches) for indicated duration (in days)
180 360 540 720 1080 1440 1800
27.00 3.28 0.33 2.17 8.19 15.69 27.98 42.91 56.46
25.00 3.20 0.35 2.47 8.24 15.99 28.55 44.19 56.86
20.00 2.97 0.40 3.34 8.37 16.85 30.20 47.90 58.04
10.00 2.25 0.62 5.56 9.02 19.15 34.26 56.63 75.06
5.40 1.59 1.20 7.90 17.90 25.30 46.33 76.13 –
232 Hydrologic Considerations for Estimation of Storage-Capacity Requirements of Impounding and Side-Channel Reservoirs for Water Supply in Ohio

03232500 Rocky Fork near Barretts Mills, Ohio—Continued
Recurrenceinterval(years)
Impounding reservoir storage required (in inches) and critical-drawdown duration (in days; shown in gray) for indicated draft rate (in fraction of the mean annual streamflow)
0.02 0.05 0.10 0.15 0.20 0.25 0.30 0.35 0.40 0.45 0.50 0.60 0.70 0.80 0.90 1.00
5 0.00 0.03 0.16 0.36 0.61 0.94 1.28 1.62 1.96 2.31 2.71 3.52 4.61 5.96 7.31 8.78 0 30 90 90 150 150 150 150 150 180 180 180 300 300 300 330
6 0.00 0.03 0.18 0.38 0.61 0.99 1.39 1.80 2.30 2.84 3.38 4.60 5.95 7.29 9.39 12.08 0 30 90 90 150 180 180 180 240 240 240 300 300 300 600 600
8 0.00 0.04 0.20 0.46 0.87 1.29 1.76 2.33 2.93 3.54 4.15 5.84 8.27 10.88 13.58 16.28 0 60 90 180 180 210 210 270 270 270 270 540 540 600 600 600
10 0.00 0.06 0.23 0.60 1.01 1.43 1.90 2.43 3.03 3.64 4.25 6.37 8.95 11.64 14.34 17.04 0 60 90 180 180 210 210 270 270 270 270 540 600 600 600 600
15 0.01 0.08 0.36 0.76 1.16 1.58 2.05 2.52 3.03 3.64 4.25 6.37 8.95 11.64 15.85 23.95 30 60 150 180 180 210 210 210 270 270 270 540 600 600 1800 1800
20 0.01 0.08 0.43 0.83 1.25 1.72 2.19 2.90 3.65 4.39 5.13 6.62 8.95 11.99 20.08 28.18 30 150 180 180 210 210 210 330 330 330 330 330 600 1800 1800 1800
25 0.01 0.09 0.47 0.94 1.49 2.16 2.89 3.63 4.37 5.11 5.85 7.34 8.95 12.85 20.40 28.18 30 90 180 210 300 300 330 330 330 330 330 330 600 1680 1680 1800
30 0.01 0.19 0.73 1.37 2.05 2.72 3.40 4.14 4.88 5.62 6.36 8.04 10.68 16.36 23.92 31.48 30 240 240 300 300 300 300 330 330 330 330 480 900 1680 1680 1680
40 0.16 0.53 1.20 1.88 2.55 3.39 4.47 5.55 6.63 7.71 8.79 14.44 20.65 26.86 33.75 40.77 240 300 300 300 300 480 480 480 480 480 480 1380 1380 1380 1560 1560
50 0.24 0.65 1.50 2.58 3.66 4.78 5.99 8.00 11.10 14.21 17.31 23.52 29.79 36.26 43.14 50.15 300 300 480 480 480 540 540 1380 1380 1380 1380 1380 1440 1440 1560 1560
60 0.27 0.89 2.00 3.21 4.47 7.57 10.68 13.78 16.89 20.03 23.27 29.74 36.22 42.86 49.88 56.90 300 480 540 540 1380 1380 1380 1380 1380 1440 1440 1440 1440 1560 1560 1560
70 0.38 1.08 2.30 4.80 7.91 11.01 14.20 17.43 20.67 23.91 27.15 33.63 40.43 47.45 54.47 61.49 480 540 540 1380 1380 1380 1440 1440 1440 1440 1440 1440 1560 1560 1560 1560
80 0.45 1.17 3.67 6.77 9.98 13.22 16.46 19.69 22.93 26.17 29.44 36.45 43.47 50.49 57.51 64.52 540 540 1380 1380 1440 1440 1440 1440 1440 1440 1560 1560 1560 1560 1560 1560
90 0.47 1.68 4.79 8.03 11.27 14.51 17.75 20.98 24.40 27.91 31.41 38.43 45.45 52.47 59.49 66.50 540 1380 1440 1440 1440 1440 1440 1440 1560 1560 1560 1560 1560 1560 1560 1560
100 0.49 2.30 5.52 8.76 12.00 15.24 18.66 22.17 25.68 29.19 32.70 39.71 46.73 53.75 60.77 67.79 600 1380 1440 1440 1440 1440 1560 1560 1560 1560 1560 1560 1560 1560 1560 1560
Hydrologic Design Tables 233

03232500 Rocky Fork near Barretts Mills, Ohio—Continued
Pumpset
Ratio of storage required for pump set to storage required for the primary pump relation (pump set 1) for indicated demand (in fraction of mean
annual streamflow)
0.002 0.010 0.020 0.050 0.100 0.200 0.300
1 1.00 1.00 1.00 1.00 1.00 1.00 1.00
2 1.65 1.33 1.19 1.13 1.05 1.02 2.66
3 1.44 1.23 1.13 1.09 1.02 1.00 1.00
4 1.29 1.13 1.03 1.05 1.00 1.00 1.00
5 1.17 1.08 1.00 1.02 1.00 1.00 1.00
6 1.07 1.04 1.00 1.00 1.00 1.00 1.00
7 1.65 1.37 1.25 1.18 1.11 3.31 5.88
8 1.50 1.29 1.20 1.15 1.08 1.08 2.45
9 1.49 1.33 1.22 1.18 1.09 1.24 3.81
10 1.44 1.28 1.20 1.20 1.11 1.31 3.58
11 1.39 1.25 1.18 1.18 1.16 1.35 3.87
12 1.57 1.32 1.22 1.16 1.08 1.12 2.97
13 1.40 1.26 1.18 1.16 1.07 1.12 2.13
14 1.35 1.22 1.13 1.18 1.11 1.13 2.20
15 1.27 1.19 1.14 1.15 1.16 1.18 2.26
16 1.22 1.19 1.15 1.20 1.17 1.18 2.26
17 1.34 1.20 1.13 1.14 1.07 1.11 1.59
18 1.26 1.19 1.11 1.15 1.11 1.13 1.61
19 1.19 1.15 1.14 1.13 1.16 1.15 1.71
20 1.15 1.16 1.15 1.20 1.17 1.17 1.79
Recurrenceinterval(years)
Normalvariate
Side-channel storage required (in demand days) for primary pump relation to meet indicated demand (in fraction of mean annual streamflow)
0.0020 0.0100 0.0200 0.0500 0.1000 0.2000 0.3000
27.00 1.787 188.36 230.46 256.82 274.02 302.66 321.20 333.25
25.00 1.751 182.67 223.89 248.93 265.29 291.76 316.48 330.96
20.00 1.645 165.73 204.30 225.43 239.27 259.29 302.42 324.14
10.00 1.282 133.74 135.40 146.64 165.73 192.38 232.07 258.15
5.00 0.841 122.33 108.36 117.71 126.33 157.40 199.78 213.09
2.08 0.046 87.18 68.95 74.22 76.89 86.25 107.33 118.75
234 Hydrologic Considerations for Estimation of Storage-Capacity Requirements of Impounding and Side-Channel Reservoirs for Water Supply in Ohio

03234000 Paint Creek near Bourneville, Ohio
Location: Latitude 39°15′49″, longitude 83°10′01″, Ross County, Hydrologic Unit 05060003
Drainage area, in square miles: 807.
Station used for record extension: 03157500
Time period of systematic or extended record analyzed: 1923-10-01 to 1997-09-30
Percentage of estimated values in extended record: 65.2
Eighty-percent-duration streamflow, in cubic feet per second: 56.
Mean annual streamflow, in inches: 13.55
Location of station used for precipitation data: Cincinnati, Ohio
Location of station used for potential evapotranspiration data: Columbus, Ohio
[–, indicates a value that could not be determined because there were too few average low-flow values less than the mean streamflow for the indicated duration]
Recurrenceinterval(years)
Extreme-value
variate
Minimum runoff (in inches) for indicated duration (in days)
180 360 540 720 1080 1440 1800
75.00 4.31 0.17 2.07 2.68 6.36 14.11 22.37 33.76
70.00 4.24 0.18 2.17 2.98 6.93 14.80 23.68 35.02
60.00 4.09 0.21 2.39 3.66 8.21 16.36 26.62 37.85
50.00 3.90 0.24 2.65 4.46 9.72 18.19 30.10 41.20
40.00 3.68 0.28 2.97 5.44 11.58 20.45 34.37 45.31
30.00 3.38 0.31 3.18 5.76 12.19 22.09 36.42 46.97
25.00 3.20 0.32 3.27 5.80 12.24 22.90 37.08 47.36
20.00 2.97 0.33 3.80 6.12 12.91 24.64 38.53 51.06
10.00 2.25 0.49 5.04 8.83 16.24 29.17 42.18 57.58
5.36 1.58 0.65 6.91 12.13 22.82 40.13 – –
Hydrologic Design Tables 235

03234000 Paint Creek near Bourneville, Ohio—Continued
Recurrenceinterval(years)
Impounding reservoir storage required (in inches) and critical-drawdown duration (in days; shown in gray) for indicated draft rate (in fraction of the mean annual streamflow)
0.02 0.05 0.10 0.15 0.20 0.25 0.30 0.35 0.40 0.45 0.50 0.60 0.70 0.80 0.90 1.00
5 0.00 0.04 0.19 0.41 0.68 0.99 1.33 1.72 2.13 2.57 3.02 3.91 4.80 5.69 6.66 8.15 0 60 90 120 150 180 180 210 240 240 240 240 240 240 270 600
6 0.00 0.04 0.21 0.45 0.72 1.05 1.40 1.79 2.20 2.65 3.09 3.98 4.92 5.92 6.95 9.22 30 60 120 150 150 180 210 210 240 240 240 240 270 270 600 660
8 0.00 0.05 0.25 0.50 0.79 1.13 1.51 1.90 2.32 2.76 3.24 4.24 5.25 6.29 8.45 10.85 30 90 120 150 180 180 210 210 240 240 270 270 270 300 600 660
10 0.00 0.06 0.27 0.54 0.85 1.19 1.58 1.97 2.44 2.94 3.44 4.45 5.48 7.30 9.55 12.00 30 90 120 150 180 210 210 210 270 270 270 270 300 600 660 660
15 0.00 0.07 0.32 0.60 0.93 1.31 1.72 2.22 2.72 3.23 3.73 4.79 6.82 9.05 11.42 15.53 30 120 150 180 180 210 270 270 270 270 270 300 600 600 660 1320
20 0.01 0.09 0.35 0.65 0.99 1.38 1.87 2.38 2.88 3.38 3.90 5.70 7.93 10.16 13.91 18.81 30 120 150 180 210 210 270 270 270 270 300 600 600 600 1320 1320
25 0.01 0.10 0.37 0.69 1.04 1.47 1.97 2.47 2.97 3.48 4.26 6.49 8.71 11.34 16.24 21.38 30 120 150 180 210 270 270 270 270 300 600 600 600 1320 1320 1740
30 0.01 0.11 0.38 0.72 1.08 1.54 2.04 2.54 3.04 3.74 4.85 7.08 9.31 13.11 18.01 23.64 30 120 150 180 210 270 270 270 270 600 600 600 600 1320 1320 1740
40 0.01 0.12 0.42 0.75 1.14 1.63 2.13 2.63 3.56 4.60 5.71 7.94 11.30 15.68 20.58 26.77 60 120 180 180 240 270 270 270 540 600 600 600 960 1320 1320 1740
50 0.01 0.14 0.45 0.78 1.21 1.69 2.19 3.15 4.16 5.20 6.31 9.41 12.98 17.51 22.42 28.88 60 150 180 180 240 270 270 540 540 600 600 960 960 1320 1740 1740
60 0.01 0.15 0.47 0.81 1.26 1.73 2.60 3.60 4.60 5.65 7.17 10.70 14.26 18.91 23.95 30.41 60 150 180 240 240 270 540 540 540 600 900 960 960 1320 1740 1740
70 0.01 0.16 0.48 0.86 1.30 1.94 2.94 3.94 4.95 6.49 8.16 11.72 15.28 20.02 25.13 31.59 90 150 180 240 240 540 540 540 540 900 900 960 960 1320 1740 1740
80 0.02 0.16 0.50 0.89 1.34 2.22 3.22 4.22 5.62 7.29 8.99 12.55 16.16 21.05 26.17 32.53 90 150 180 240 240 540 540 540 900 900 960 960 1020 1380 1380 1740
90 0.02 0.17 0.51 0.92 1.45 2.45 3.45 4.62 6.29 7.96 9.68 13.25 16.95 21.94 27.06 33.30 90 180 180 240 540 540 540 900 900 900 960 960 1020 1380 1380 1740
100 0.02 0.18 0.52 0.95 1.64 2.64 3.64 5.19 6.86 8.53 10.28 13.85 17.63 22.70 27.82 33.95 90 180 180 240 540 540 540 900 900 900 960 1020 1020 1380 1380 1740
236 Hydrologic Considerations for Estimation of Storage-Capacity Requirements of Impounding and Side-Channel Reservoirs for Water Supply in Ohio

03234000 Paint Creek near Bourneville, Ohio—Continued
Pumpset
Ratio of storage required for pump set to storage required for the primary pump relation (pump set 1) for indicated demand (in fraction of mean
annual streamflow)
0.002 0.010 0.020 0.050 0.100 0.200 0.300
1 1.00 1.00 1.00 1.00 1.00 1.00 1.00
2 1.45 1.35 1.37 1.54 1.76 1.62 2.00
3 1.15 1.01 1.00 1.09 1.06 1.05 1.09
4 1.06 1.00 1.00 1.01 1.01 1.00 1.00
5 1.03 1.00 1.00 1.00 1.00 1.00 1.00
6 1.01 1.00 1.00 1.00 1.00 1.00 1.00
7 1.44 1.43 1.49 1.73 2.34 3.64 7.20
8 1.16 1.03 1.08 1.19 1.43 1.54 1.78
9 1.18 1.06 1.11 1.19 1.57 1.77 2.38
10 1.13 1.04 1.09 1.19 1.70 2.05 2.16
11 1.09 1.11 1.10 1.20 1.76 2.16 2.36
12 1.27 1.07 1.13 1.19 1.54 1.58 1.86
13 1.11 1.04 1.07 1.15 1.37 1.56 1.89
14 1.06 1.03 1.09 1.17 1.58 1.93 2.00
15 1.08 1.10 1.08 1.15 1.72 2.11 2.20
16 1.09 1.09 1.10 1.19 1.92 2.35 2.23
17 1.07 1.05 1.08 1.10 1.27 1.45 1.78
18 1.05 1.03 1.07 1.13 1.53 1.90 1.94
19 1.05 1.11 1.08 1.16 1.65 2.11 2.13
20 1.08 1.07 1.09 1.17 1.93 2.35 2.18
Hydrologic Design Tables 237

Recurrenceinterval(years)
Normalvariate
Side-channel storage required (in demand days) for primary pump relation to meet indicated demand (in fraction of mean annual streamflow)
0.0020 0.0100 0.0200 0.0500 0.1000 0.2000 0.3000
75.00 2.217 218.82 220.96 216.66 212.58 228.33 363.24 454.97
70.00 2.190 217.20 218.08 213.82 210.49 227.59 355.02 439.93
60.00 2.128 213.51 211.55 207.38 205.74 225.92 336.35 405.78
50.00 2.054 209.04 203.64 199.56 199.98 223.90 313.73 364.39
40.00 1.960 203.40 193.65 189.70 192.71 221.34 285.17 312.14
30.00 1.834 198.49 189.87 183.12 185.97 201.58 268.23 290.84
25.00 1.751 195.75 189.17 180.02 182.09 185.49 261.05 285.92
20.00 1.645 177.19 168.95 175.36 181.01 185.27 242.40 276.34
10.00 1.282 143.01 142.67 139.16 139.21 159.48 201.56 214.26
5.00 0.841 109.16 96.19 98.31 116.55 135.76 169.82 191.77
2.03 0.017 89.84 52.54 56.35 68.47 80.25 105.14 124.65
238 Hydrologic Considerations for Estimation of Storage-Capacity Requirements of Impounding and Side-Channel Reservoirs for Water Supply in Ohio

03235000 Salt Creek at Tarlton, Ohio
Location: Latitude 39°33′20″, longitude 82°46′51″, Pickaway County, Hydrologic Unit 05060002
Drainage area, in square miles: 11.5
Station used for record extension: 03157000
Time period of systematic or extended record analyzed: 1939-10-01 to 1997-09-30
Percentage of estimated values in extended record: 74.1
Eighty-percent-duration streamflow, in cubic feet per second: 0.3
Mean annual streamflow, in inches: 13.37
Location of station used for precipitation data: McConnelsville, Ohio
Location of station used for potential evapotranspiration data: Columbus, Ohio
[–, indicates a value that could not be determined because there were too few average low-flow values less than the mean streamflow for the indicated duration]
Recurrenceinterval(years)
Extreme-value
variate
Minimum runoff (in inches) for indicated duration (in days)
180 360 540 720 1080 1440 1800
59.00 4.07 0.09 2.42 5.35 8.29 18.27 26.45 38.58
50.00 3.90 0.10 2.56 5.40 9.03 18.40 28.44 40.37
40.00 3.68 0.12 2.75 5.46 10.02 18.57 31.12 42.78
30.00 3.38 0.15 3.00 5.54 11.30 18.80 34.60 45.90
25.00 3.20 0.17 3.51 5.98 12.05 22.00 35.63 47.59
20.00 2.97 0.19 4.19 6.57 12.95 26.32 36.75 49.64
10.00 2.25 0.32 5.22 9.77 15.38 28.97 41.17 57.97
5.36 1.58 0.53 6.18 10.79 21.34 40.30 – –
Hydrologic Design Tables 239

03235000 Salt Creek at Tarlton, Ohio—Continued
Recurrenceinterval(years)
Impounding reservoir storage required (in inches) and critical-drawdown duration (in days; shown in gray) for indicated draft rate (in fraction of the mean annual streamflow)
0.02 0.05 0.10 0.15 0.20 0.25 0.30 0.35 0.40 0.45 0.50 0.60 0.70 0.80 0.90 1.00
5 0.02 0.08 0.30 0.53 0.80 1.08 1.38 1.80 2.24 2.68 3.12 3.99 4.87 5.75 7.72 9.91 30 120 120 150 150 150 180 240 240 240 240 240 240 240 600 600
6 0.02 0.11 0.31 0.56 0.84 1.17 1.50 1.92 2.35 2.79 3.23 4.11 4.99 5.91 7.72 9.91 60 90 120 150 180 180 180 240 240 240 240 240 240 270 600 600
8 0.03 0.13 0.35 0.63 0.96 1.30 1.68 2.07 2.51 2.95 3.39 4.27 5.22 6.21 7.99 11.28 60 90 150 180 180 210 210 240 240 240 240 240 270 270 900 900
10 0.03 0.14 0.39 0.69 1.02 1.38 1.76 2.18 2.62 3.06 3.49 4.44 5.43 6.42 9.58 13.10 90 120 150 180 180 210 210 240 240 240 240 270 270 270 900 1320
15 0.05 0.18 0.45 0.77 1.10 1.46 1.89 2.33 2.79 3.28 3.77 4.76 5.91 8.72 12.02 16.89 120 120 150 180 180 210 240 240 270 270 270 270 660 900 900 1680
20 0.06 0.20 0.48 0.81 1.14 1.55 1.99 2.48 2.97 3.47 4.02 5.12 7.23 10.21 13.50 18.85 120 150 150 180 180 240 240 270 270 300 300 300 600 900 900 1680
25 0.07 0.22 0.50 0.83 1.17 1.61 2.10 2.60 3.14 3.69 4.24 5.92 8.12 11.27 14.72 20.03 120 150 180 180 240 270 270 270 300 300 300 600 600 900 960 1680
30 0.07 0.22 0.52 0.85 1.21 1.70 2.19 2.73 3.28 3.83 4.38 6.48 8.81 12.27 15.83 21.05 120 150 180 180 240 270 270 300 300 300 300 600 900 960 1020 1680
40 0.07 0.23 0.54 0.87 1.32 1.82 2.31 2.86 3.41 3.96 4.84 7.03 10.45 13.96 17.49 23.16 120 150 180 180 270 270 300 300 300 300 600 600 960 960 1020 1680
50 0.07 0.23 0.56 0.92 1.40 1.89 2.39 2.90 3.45 4.00 4.95 8.26 11.78 15.29 20.14 25.68 120 150 180 210 270 270 270 300 300 300 600 960 960 960 1380 1740
60 0.07 0.24 0.58 0.97 1.45 1.95 2.44 2.94 3.45 4.09 5.85 9.36 13.26 18.31 23.36 28.41 120 180 210 210 270 270 270 270 300 960 960 960 1380 1380 1380 1380
70 0.07 0.25 0.62 1.00 1.50 1.99 2.48 2.98 3.54 5.02 6.78 11.25 16.30 21.35 26.40 31.45 120 180 210 210 270 270 270 270 420 960 960 1380 1380 1380 1380 1380
80 0.07 0.27 0.65 1.04 1.53 2.02 2.52 3.01 4.17 6.41 8.94 13.99 19.04 24.09 29.14 34.19 120 210 210 270 270 270 270 270 720 1380 1380 1380 1380 1380 1380 1380
90 0.07 0.29 0.67 1.06 1.56 2.05 2.54 3.77 6.30 8.83 11.35 16.40 21.45 26.50 31.55 36.61 120 210 210 270 270 270 270 1380 1380 1380 1380 1380 1380 1380 1380 1380
100 0.08 0.31 0.69 1.08 1.58 2.07 3.34 5.87 8.39 10.92 13.44 18.49 23.55 28.60 33.65 38.85 210 210 210 270 270 270 1380 1380 1380 1380 1380 1380 1380 1380 1380 1740
240 Hydrologic Considerations for Estimation of Storage-Capacity Requirements of Impounding and Side-Channel Reservoirs for Water Supply in Ohio

03235000 Salt Creek at Tarlton, Ohio—Continued
Pumpset
Ratio of storage required for pump set to storage required for the primary pump relation (pump set 1) for indicated demand (in fraction of mean
annual streamflow)
0.002 0.010 0.020 0.050 0.100 0.200 0.300
1 1.00 1.00 1.00 1.00 1.00 1.00 1.00
2 2.24 1.24 1.23 1.34 1.50 3.17 6.46
3 2.05 1.15 1.07 1.02 1.04 1.04 1.22
4 1.00 1.08 1.01 1.00 1.00 1.01 1.00
5 1.00 1.05 1.00 1.00 1.00 1.00 1.00
6 1.00 1.03 1.00 1.00 1.00 1.00 1.00
7 2.23 1.32 1.46 1.60 2.25 8.89 14.29
8 2.06 1.17 1.17 1.16 1.22 1.77 5.42
9 2.06 1.18 1.21 1.23 1.28 2.21 8.68
10 1.03 1.22 1.23 1.23 1.30 2.41 7.74
11 1.01 1.19 1.31 1.24 1.37 2.39 6.46
12 2.16 1.21 1.16 1.17 1.33 2.23 7.45
13 1.03 1.20 1.20 1.16 1.24 1.40 3.83
14 1.03 1.19 1.21 1.18 1.27 1.66 3.10
15 1.01 1.17 1.31 1.22 1.38 1.76 3.12
16 1.09 1.26 1.32 1.24 1.46 1.93 3.28
17 1.01 1.17 1.17 1.14 1.23 1.28 2.51
18 1.03 1.17 1.23 1.17 1.27 1.48 2.68
19 1.01 1.14 1.31 1.21 1.38 1.69 2.78
20 1.09 1.29 1.32 1.24 1.46 1.82 2.98
Recurrenceinterval(years)
Normalvariate
Side-channel storage required (in demand days) for primary pump relation to meet indicated demand (in fraction of mean annual streamflow)
0.0020 0.0100 0.0200 0.0500 0.1000 0.2000 0.3000
59.00 2.122 112.16 161.89 174.95 199.40 211.31 239.15 259.28
50.00 2.054 110.33 160.63 174.23 196.68 208.03 234.25 257.61
40.00 1.960 107.78 158.87 173.23 192.89 203.47 227.43 255.29
30.00 1.834 104.36 156.51 171.89 187.80 197.35 218.28 252.18
25.00 1.751 100.64 155.93 169.52 184.42 191.45 214.00 238.75
20.00 1.645 95.71 155.32 166.31 180.10 183.72 208.79 220.25
10.00 1.282 65.28 97.98 109.76 135.51 155.79 187.15 205.91
5.00 0.841 39.91 74.59 91.14 112.50 125.70 148.89 181.15
2.03 0.021 22.00 42.69 49.45 60.95 76.01 100.98 114.52
Hydrologic Design Tables 241

03235500 Tar Hollow Creek at Tar Hollow State Park, Ohio
Location: Latitude 39°23′22″, longitude 82°45′03″, Ross County, Hydrologic Unit 05060002
Drainage area, in square miles: 1.35
Station used for record extension: 03236000
Time period of systematic or extended record analyzed: 1938-10-01 to 1978-09-30
Percentage of estimated values in extended record: 20.3
Eighty-percent-duration streamflow, in cubic feet per second: 0.0
Mean annual streamflow, in inches: 12.06
Location of station used for precipitation data: Hillsboro, Ohio
Location of station used for potential evapotranspiration data: Columbus, Ohio
[–, indicates a value that could not be determined because there were too few average low-flow values less than the mean stream-flow for the indicated duration]
Recurrenceinterval(years)
Extreme-value
variate
Minimum runoff (in inches) for indicated duration (in days)
180 360 540 720 1080 1440 1800
41.00 3.70 0.00 2.37 2.43 7.40 14.78 22.36 34.54
40.00 3.68 0.00 2.40 2.51 7.54 14.96 22.66 34.74
30.00 3.38 0.00 2.76 3.49 9.15 17.08 26.12 37.09
25.00 3.20 0.00 2.98 4.11 10.17 18.43 28.32 38.59
20.00 2.97 0.00 3.27 4.94 11.41 20.33 31.22 40.68
10.00 2.25 0.00 4.05 8.42 15.35 27.09 39.41 57.31
5.12 1.53 0.02 5.74 10.24 18.62 36.77 68.12 –
242 Hydrologic Considerations for Estimation of Storage-Capacity Requirements of Impounding and Side-Channel Reservoirs for Water Supply in Ohio

03235500 Tar Hollow Creek at Tar Hollow State Park, Ohio—Continued
Recurrenceinterval(years)
Impounding reservoir storage required (in inches) and critical-drawdown duration (in days; shown in gray) for indicated draft rate (in fraction of the mean annual streamflow)
0.02 0.05 0.10 0.15 0.20 0.25 0.30 0.35 0.40 0.45 0.50 0.60 0.70 0.80 0.90 1.00
5 0.10 0.27 0.56 0.86 1.16 1.55 1.95 2.34 2.74 3.14 3.53 4.33 5.12 6.00 6.89 8.18 150 180 180 180 180 240 240 240 240 240 240 240 240 270 270 540
6 0.13 0.34 0.69 1.03 1.38 1.75 2.14 2.54 2.96 3.41 3.85 4.75 5.64 6.53 7.70 9.68 210 210 210 210 210 240 240 240 270 270 270 270 270 270 600 600
8 0.14 0.35 0.69 1.06 1.48 1.93 2.37 2.82 3.26 3.71 4.15 5.05 5.94 6.83 8.72 10.70 210 210 210 240 270 270 270 270 270 270 270 270 270 270 600 600
10 0.14 0.35 0.70 1.12 1.57 2.01 2.46 2.91 3.35 3.80 4.24 5.13 6.03 6.92 8.88 11.66 210 210 240 270 270 270 270 270 270 270 270 270 270 270 600 1320
15 0.14 0.35 0.74 1.19 1.64 2.08 2.53 2.97 3.42 3.86 4.31 5.20 6.09 7.79 11.06 15.58 210 210 270 270 270 270 270 270 270 270 270 270 270 540 1320 1740
20 0.14 0.37 0.77 1.21 1.66 2.10 2.55 3.00 3.44 3.89 4.33 5.49 7.27 10.13 15.25 20.99 210 240 240 270 270 270 270 270 270 270 270 540 540 960 1740 1740
25 0.15 0.39 0.78 1.23 1.67 2.12 2.57 3.01 3.48 3.98 4.67 6.45 8.90 12.40 18.14 23.88 240 240 270 270 270 270 270 270 300 300 540 540 960 1740 1740 1740
30 0.16 0.39 0.80 1.24 1.69 2.13 2.59 3.08 3.62 4.51 5.40 7.24 10.41 13.87 19.61 25.36 240 240 270 270 270 270 300 300 540 540 540 960 960 1740 1740 1740
40 0.16 0.40 0.82 1.27 1.72 2.19 3.17 4.16 5.15 6.14 7.13 9.86 14.08 18.63 23.19 27.75 240 240 270 270 270 300 600 600 600 600 600 1020 1380 1380 1380 1380
50 0.16 0.40 0.85 1.57 2.56 3.55 4.54 5.53 6.52 7.63 9.90 14.46 19.02 23.57 28.13 32.68 240 270 270 600 600 600 600 600 600 1380 1380 1380 1380 1380 1380 1380
60 0.16 0.42 1.30 2.29 3.28 4.27 5.26 6.88 9.15 11.43 13.71 18.26 22.82 27.38 31.93 36.49 240 270 600 600 600 600 600 1380 1380 1380 1380 1380 1380 1380 1380 1380
70 0.16 0.67 1.66 2.65 3.64 5.09 7.37 9.64 11.92 14.20 16.48 21.03 25.59 30.15 34.70 39.26 270 600 600 600 600 1380 1380 1380 1380 1380 1380 1380 1380 1380 1380 1380
80 0.24 0.84 1.83 2.82 4.77 7.04 9.32 11.60 13.88 16.16 18.43 22.99 27.54 32.10 36.66 41.21 600 600 600 600 1380 1380 1380 1380 1380 1380 1380 1380 1380 1380 1380 1380
90 0.32 0.92 1.91 3.84 6.12 8.40 10.68 12.96 15.23 17.51 19.79 24.34 28.90 33.46 38.03 42.79 600 600 600 1380 1380 1380 1380 1380 1380 1380 1380 1380 1380 1380 1440 1440
100 0.36 0.96 2.50 4.78 7.05 9.33 11.61 13.89 16.17 18.44 20.72 25.28 29.87 34.63 39.38 44.13 600 600 1380 1380 1380 1380 1380 1380 1380 1380 1380 1380 1440 1440 1440 1440
Hydrologic Design Tables 243

03235500 Tar Hollow Creek at Tar Hollow State Park, Ohio—Continued
Pumpset
Ratio of storage required for pump set to storage required for the primary pump relation (pump set 1) for indicated demand (in fraction of mean
annual streamflow)
0.002 0.010 0.020 0.050 0.100 0.200 0.300
1 1.00 1.00 1.00 1.00 1.00 1.00 1.00
2 2.11 2.36 2.40 2.48 2.76 4.32 4.59
3 1.00 1.00 1.00 1.03 1.17 1.54 1.36
4 1.00 1.00 1.00 1.00 1.00 1.13 1.07
5 1.00 1.00 1.00 1.00 1.00 1.02 1.04
6 1.00 1.00 1.00 1.00 1.00 1.00 1.02
7 2.10 2.36 2.41 2.56 3.73 6.51 7.13
8 1.00 1.00 1.00 1.04 1.41 1.85 1.83
9 1.00 1.00 1.00 1.11 1.49 1.92 2.52
10 1.01 1.02 1.00 1.01 1.25 1.68 1.91
11 1.01 1.00 1.00 1.01 1.16 1.68 2.05
12 1.20 1.32 1.34 1.51 1.86 2.23 2.82
13 1.01 1.01 1.00 1.01 1.11 1.53 1.65
14 1.01 1.00 1.00 1.00 1.07 1.57 1.60
15 1.00 1.00 1.00 1.01 1.15 1.63 1.75
16 1.01 1.01 1.01 1.02 1.14 1.61 1.76
17 1.00 1.00 1.00 1.01 1.04 1.45 1.41
18 1.01 1.01 1.00 1.01 1.06 1.53 1.47
19 1.00 1.01 1.00 1.03 1.15 1.60 1.64
20 1.01 1.00 1.00 1.02 1.14 1.57 1.67
Recurrenceinterval(years)
Normalvariate
Side-channel storage required (in demand days) for primary pump relation to meet indicated demand (in fraction of mean annual streamflow)
0.0020 0.0100 0.0200 0.0500 0.1000 0.2000 0.3000
41.00 1.971 398.48 316.86 302.18 288.27 282.11 287.40 385.27
40.00 1.960 398.12 316.54 301.69 287.65 282.00 287.25 382.34
30.00 1.834 393.86 312.65 295.79 280.24 280.63 285.51 347.19
25.00 1.751 391.05 310.09 291.89 275.35 279.73 284.35 323.98
20.00 1.645 387.79 306.55 286.92 269.76 277.76 282.85 297.81
10.00 1.282 359.09 288.98 274.43 259.86 259.65 271.38 285.63
5.00 0.841 256.17 210.85 199.89 199.61 209.73 222.96 239.32
2.05 0.031 183.77 122.11 125.11 122.13 121.74 137.91 154.03
244 Hydrologic Considerations for Estimation of Storage-Capacity Requirements of Impounding and Side-Channel Reservoirs for Water Supply in Ohio

03236000 Salt Creek near Londonderry, Ohio
Location: Latitude 39°15′22″, longitude 82°46′12″, Ross County, Hydrologic Unit 05060002
Drainage area, in square miles: 286.
Station used for record extension: 03235500
Time period of systematic or extended record analyzed: 1938-10-01 to 1978-09-30
Percentage of estimated values in extended record: 70.0
Eighty-percent-duration streamflow, in cubic feet per second: 22.
Mean annual streamflow, in inches: 11.94
Location of station used for precipitation data: McConnelsville, Ohio
Location of station used for potential evapotranspiration data: Columbus, Ohio
[–, indicates a value that could not be determined because there were too few average low-flow values less than the mean streamflow for the indicated duration]
Recurrenceinterval(years)
Extreme-value
variate
Minimum runoff (in inches) for indicated duration (in days)
180 360 540 720 1080 1440 1800
41.00 3.70 0.18 2.65 2.86 7.52 14.39 21.59 32.59
40.00 3.68 0.18 2.70 3.05 7.70 14.76 22.08 32.98
30.00 3.38 0.18 3.23 5.32 9.84 19.03 27.82 37.54
25.00 3.20 0.18 3.57 6.76 11.20 21.76 31.47 40.44
20.00 2.97 0.18 4.01 8.34 12.80 24.82 35.61 44.13
10.00 2.25 0.18 5.28 8.38 15.32 26.53 39.77 55.24
5.12 1.53 0.21 6.26 10.43 20.63 39.77 54.61 –
Hydrologic Design Tables 245

03236000 Salt Creek near Londonderry, Ohio—Continued
Recurrenceinterval(years)
Impounding reservoir storage required (in inches) and critical-drawdown duration (in days; shown in gray) for indicated draft rate (in fraction of the mean annual streamflow)
0.02 0.05 0.10 0.15 0.20 0.25 0.30 0.35 0.40 0.45 0.50 0.60 0.70 0.80 0.90 1.00
5 0.00 0.09 0.38 0.68 0.97 1.27 1.56 1.93 2.32 2.71 3.10 3.89 4.67 5.46 6.24 7.10 0 180 180 180 180 180 180 240 240 240 240 240 240 240 240 300
6 0.00 0.10 0.40 0.69 1.02 1.36 1.73 2.12 2.51 2.90 3.30 4.15 5.04 5.92 6.80 8.41 0 180 180 180 210 210 240 240 240 240 240 270 270 270 270 600
8 0.00 0.13 0.47 0.81 1.16 1.51 1.95 2.39 2.83 3.27 3.72 4.60 5.48 6.36 7.84 10.84 0 210 210 210 210 240 270 270 270 270 270 270 270 270 900 960
10 0.00 0.16 0.50 0.84 1.22 1.66 2.10 2.54 2.99 3.43 3.87 4.75 5.63 6.52 8.43 11.58 0 210 210 210 270 270 270 270 270 270 270 270 270 270 900 1260
15 0.00 0.16 0.50 0.89 1.33 1.78 2.22 2.66 3.10 3.54 3.98 4.87 5.75 6.63 8.49 12.57 0 210 210 270 270 270 270 270 270 270 270 270 270 270 660 1740
20 0.00 0.16 0.53 0.92 1.36 1.80 2.25 2.69 3.13 3.57 4.01 4.90 5.88 7.79 9.94 14.56 0 210 240 270 270 270 270 270 270 270 270 300 300 660 660 1740
25 0.00 0.16 0.54 0.93 1.37 1.82 2.26 2.70 3.14 3.58 4.07 5.06 7.01 9.16 11.46 16.71 0 210 240 270 270 270 270 270 270 300 300 300 660 660 1380 1740
30 0.00 0.16 0.54 0.94 1.38 1.82 2.27 2.71 3.18 3.68 4.23 6.19 8.25 10.46 14.97 19.53 0 210 240 270 270 270 270 270 300 300 600 600 660 1380 1380 1740
40 0.00 0.16 0.55 0.96 1.41 1.85 2.59 3.57 4.55 5.54 6.52 9.12 13.48 17.99 22.50 27.01 0 210 240 270 270 270 600 600 600 600 600 1020 1380 1380 1380 1380
50 0.00 0.19 0.55 1.12 2.10 3.08 4.06 5.11 6.77 8.48 10.73 15.25 19.76 24.27 28.78 33.54 0 210 270 540 600 600 600 1020 1020 1380 1380 1380 1380 1380 1380 1680
60 0.04 0.24 1.05 1.97 2.95 4.56 6.23 8.41 10.66 12.92 15.17 19.69 24.20 28.78 34.28 39.77 210 210 540 600 600 1020 1020 1380 1380 1380 1380 1380 1380 1680 1680 1680
70 0.08 0.56 1.44 2.88 4.55 6.78 9.04 11.30 13.55 15.81 18.06 22.58 27.99 33.49 38.98 44.47 210 540 600 1020 1020 1380 1380 1380 1380 1380 1380 1380 1680 1680 1680 1680
80 0.21 0.74 2.16 4.07 6.32 8.58 10.84 13.09 15.35 17.63 20.37 25.87 31.36 36.85 42.35 47.90 540 540 1020 1380 1380 1380 1380 1380 1380 1680 1680 1680 1680 1680 1680 1740
90 0.29 1.02 2.90 5.16 7.41 9.67 11.93 14.46 17.21 19.96 22.70 28.20 33.69 39.18 44.85 50.54 540 1020 1380 1380 1380 1380 1380 1680 1680 1680 1680 1680 1680 1680 1740 1740
100 0.32 1.31 3.55 5.81 8.07 10.55 13.30 16.05 18.79 21.54 24.29 29.78 35.36 41.05 46.74 52.56 540 1020 1380 1380 1380 1680 1680 1680 1680 1680 1680 1680 1740 1740 1740 1800
246 Hydrologic Considerations for Estimation of Storage-Capacity Requirements of Impounding and Side-Channel Reservoirs for Water Supply in Ohio

03236000 Salt Creek near Londonderry, Ohio—Continued
Pumpset
Ratio of storage required for pump set to storage required for the primary pump relation (pump set 1) for indicated demand (in fraction of mean
annual streamflow)
0.002 0.010 0.020 0.050 0.100 0.200 0.300
1 1.00 1.00 1.00 1.00 1.00 1.00 1.00
2 3.13 3.12 3.05 2.96 3.29 4.95 5.17
3 1.05 1.10 1.09 1.08 1.21 1.48 1.38
4 1.03 1.00 1.00 1.00 1.00 1.13 1.06
5 1.00 1.00 1.00 1.00 1.00 1.06 1.04
6 1.00 1.00 1.00 1.00 1.00 1.03 1.02
7 3.13 3.12 3.04 2.96 3.55 6.84 7.59
8 1.05 1.10 1.09 1.09 1.48 1.83 2.57
9 1.05 1.10 1.09 1.09 1.45 2.14 4.15
10 1.00 1.01 1.00 1.01 1.38 1.93 3.04
11 1.04 1.01 1.01 1.01 1.31 1.83 3.12
12 1.52 1.60 1.56 1.58 1.81 2.18 4.03
13 1.00 1.00 1.01 1.00 1.10 1.56 1.84
14 1.00 1.01 1.00 1.00 1.12 1.63 1.92
15 1.00 1.00 1.00 1.01 1.17 1.66 1.97
16 1.04 1.01 1.00 1.03 1.18 1.75 2.03
17 1.00 1.00 1.00 1.00 1.02 1.50 1.65
18 1.04 1.00 1.00 1.01 1.08 1.60 1.72
19 1.00 1.01 1.00 1.00 1.17 1.64 1.80
20 1.00 1.01 1.00 1.03 1.17 1.71 1.90
Recurrenceinterval(years)
Normalvariate
Side-channel storage required (in demand days) for primary pump relation to meet indicated demand (in fraction of mean annual streamflow)
0.0020 0.0100 0.0200 0.0500 0.1000 0.2000 0.3000
41.00 1.971 380.09 301.26 290.62 283.08 278.67 315.30 424.06
40.00 1.960 379.11 300.66 289.91 282.55 278.62 314.30 419.94
30.00 1.834 367.39 293.52 281.40 276.18 278.02 302.34 370.49
25.00 1.751 359.65 288.81 275.79 271.97 277.62 294.44 337.83
20.00 1.645 350.53 283.46 269.45 266.73 276.31 285.48 300.98
10.00 1.282 326.02 278.54 266.90 257.61 258.49 277.05 282.38
5.00 0.841 226.10 179.20 176.26 186.97 194.14 205.56 220.05
2.05 0.031 149.35 98.13 99.08 101.24 114.53 138.23 153.67
Hydrologic Design Tables 247

03237280 Upper Twin Creek at Mcgaw, Ohio
Location: Latitude 38°38′37″, longitude 83°12′57″, Scioto County, Hydrologic Unit 05090201
Drainage area, in square miles: 12.2
Station used for record extension: None
Time period of systematic or extended record analyzed: 1963-07-01 to 1997-09-30
Eighty-percent-duration streamflow, in cubic feet per second: 0.3
Mean annual streamflow, in inches: 15.47
Location of station used for precipitation data: Charleston, West Virginia
Location of station used for potential evapotranspiration data: Charleston, West Virginia
[–, indicates a value that could not be determined because there were too few average low-flow values less than the mean stream-flow for the indicated duration]
Recurrenceinterval(years)
Extreme-value
variate
Minimum runoff (in inches) for indicated duration (in days)
180 360 540 720 1080 1440 1800
35.00 3.54 0.07 4.55 6.38 14.74 24.13 37.30 52.25
30.00 3.38 0.07 4.95 6.64 15.08 24.71 38.49 53.38
25.00 3.20 0.07 5.42 6.95 15.48 25.39 39.89 54.72
20.00 2.97 0.08 5.99 7.33 15.97 26.23 41.62 56.36
10.00 2.25 0.19 7.02 10.41 19.16 32.87 46.21 66.06
5.83 1.67 0.29 7.60 12.87 23.84 39.00 – –
248 Hydrologic Considerations for Estimation of Storage-Capacity Requirements of Impounding and Side-Channel Reservoirs for Water Supply in Ohio

03237280 Upper Twin Creek at Mcgaw, Ohio—Continued
Recurrenceinterval(years)
Impounding reservoir storage required (in inches) and critical-drawdown duration (in days; shown in gray) for indicated draft rate (in fraction of the mean annual streamflow)
0.02 0.05 0.10 0.15 0.20 0.25 0.30 0.35 0.40 0.45 0.50 0.60 0.70 0.80 0.90 1.00
5 0.04 0.19 0.51 0.89 1.27 1.65 2.03 2.52 3.03 3.54 4.05 5.06 6.08 7.10 9.06 11.60 60 120 180 180 180 180 180 240 240 240 240 240 240 240 600 600
6 0.05 0.19 0.51 0.89 1.27 1.65 2.03 2.52 3.03 3.54 4.05 5.06 6.08 7.10 9.06 11.60 90 120 180 180 180 180 210 240 240 240 240 240 240 240 600 600
8 0.06 0.22 0.53 0.90 1.28 1.70 2.14 2.59 3.03 3.54 4.05 5.06 6.08 7.22 9.76 12.72 90 150 150 180 180 210 210 210 210 240 240 240 240 600 600 900
10 0.06 0.24 0.57 0.95 1.33 1.78 2.22 2.67 3.11 3.56 4.05 5.06 6.21 8.75 11.29 15.86 90 150 180 180 180 210 210 210 210 210 240 240 600 600 600 1320
15 0.07 0.28 0.66 1.04 1.45 1.89 2.34 2.78 3.23 3.73 4.24 6.43 8.97 11.51 14.97 21.20 120 180 180 180 210 210 210 210 210 240 240 600 600 600 900 1680
20 0.08 0.31 0.69 1.07 1.51 1.96 2.40 2.85 3.34 3.96 5.23 7.77 10.31 13.14 17.46 23.00 180 180 180 180 210 210 210 210 240 600 600 600 600 1020 1020 1680
25 0.09 0.32 0.70 1.11 1.55 2.00 2.44 2.90 3.41 4.50 5.77 8.31 10.85 14.22 18.54 24.41 180 180 180 210 210 210 210 240 240 600 600 600 600 1020 1020 1680
30 0.09 0.32 0.70 1.14 1.58 2.02 2.47 2.94 3.45 4.57 5.84 8.38 10.92 14.38 19.04 26.16 180 180 180 210 210 210 210 240 240 600 600 600 600 1020 1680 1680
40 0.09 0.32 0.73 1.17 1.62 2.06 2.50 2.95 3.50 4.57 5.84 8.38 10.92 16.56 23.68 30.93 180 180 210 210 210 210 210 210 270 600 600 600 600 1680 1680 1740
50 0.09 0.32 0.75 1.19 1.64 2.08 2.56 3.13 3.70 4.57 7.32 13.47 19.82 26.18 32.53 38.88 180 180 210 210 210 210 270 270 270 600 1440 1500 1500 1500 1500 1500
60 0.09 0.32 0.76 1.21 1.65 2.14 3.01 6.06 9.11 12.29 15.46 21.82 28.17 34.52 40.88 47.23 180 180 210 210 210 270 1440 1440 1500 1500 1500 1500 1500 1500 1500 1500
70 0.09 0.33 0.77 1.22 2.58 5.63 8.74 11.92 15.09 18.27 21.44 27.80 34.15 40.50 46.86 53.21 180 210 210 210 1440 1440 1500 1500 1500 1500 1500 1500 1500 1500 1500 1500
80 0.09 0.34 0.78 3.28 6.35 9.53 12.71 15.88 19.06 22.24 25.41 31.77 38.12 44.47 50.82 57.18 180 210 210 1440 1500 1500 1500 1500 1500 1500 1500 1500 1500 1500 1500 1500
90 0.09 0.34 2.59 5.69 8.86 12.04 15.22 18.39 21.57 24.75 27.92 34.28 40.63 46.98 53.34 59.69 180 210 1440 1500 1500 1500 1500 1500 1500 1500 1500 1500 1500 1500 1500 1500
100 0.09 0.97 4.06 7.23 10.41 13.59 16.76 19.94 23.11 26.29 29.47 35.82 42.17 48.53 55.36 62.73 180 1440 1500 1500 1500 1500 1500 1500 1500 1500 1500 1500 1500 1500 1740 1740
Hydrologic Design Tables 249

03237280 Upper Twin Creek at Mcgaw, Ohio—Continued
Pumpset
Ratio of storage required for pump set to storage required for the primary pump relation (pump set 1) for indicated demand (in fraction of mean
annual streamflow)
0.002 0.010 0.020 0.050 0.100 0.200 0.300
1 1.00 1.00 1.00 1.00 1.00 1.00 1.00
2 1.35 1.31 1.33 1.40 1.47 2.46 3.62
3 1.27 1.17 1.07 1.00 1.01 1.11 1.50
4 1.21 1.09 1.04 1.00 1.00 1.00 1.11
5 1.14 1.05 1.02 1.00 1.00 1.00 1.00
6 1.06 1.03 1.00 1.00 1.00 1.00 1.00
7 1.35 1.50 1.53 1.55 2.16 4.29 7.61
8 1.28 1.22 1.10 1.08 1.09 1.69 2.39
9 1.28 1.23 1.14 1.11 1.10 1.81 3.20
10 1.26 1.20 1.16 1.14 1.13 1.93 2.62
11 1.28 1.19 1.17 1.14 1.16 1.96 2.51
12 1.31 1.24 1.13 1.08 1.07 1.68 3.34
13 1.25 1.20 1.13 1.10 1.08 1.56 2.05
14 1.25 1.17 1.14 1.14 1.11 1.66 2.04
15 1.25 1.17 1.19 1.14 1.14 1.63 2.01
16 1.20 1.16 1.17 1.17 1.19 1.54 2.37
17 1.23 1.16 1.11 1.10 1.08 1.34 1.90
18 1.20 1.15 1.14 1.14 1.10 1.42 1.89
19 1.16 1.14 1.19 1.13 1.14 1.38 1.86
20 1.09 1.13 1.17 1.17 1.19 1.43 2.12
Recurrenceinterval(years)
Normalvariate
Side-channel storage required (in demand days) for primary pump relation to meet indicated demand (in fraction of mean annual streamflow)
0.0020 0.0100 0.0200 0.0500 0.1000 0.2000 0.3000
35.00 1.903 157.20 170.04 184.48 198.34 208.52 215.30 219.85
30.00 1.834 156.41 167.09 181.62 197.35 206.50 213.63 219.41
25.00 1.751 155.44 163.50 178.14 196.15 204.03 211.60 218.88
20.00 1.645 154.20 158.93 173.71 194.63 200.89 209.01 218.20
10.00 1.282 120.00 129.35 146.50 154.89 169.63 187.14 199.67
5.00 0.841 90.29 106.46 113.99 136.25 150.58 169.33 179.71
2.06 0.036 50.38 60.78 62.46 72.22 92.50 112.17 129.91
250 Hydrologic Considerations for Estimation of Storage-Capacity Requirements of Impounding and Side-Channel Reservoirs for Water Supply in Ohio

03237500 Ohio Brush Creek near West Union, Ohio
Location: Latitude 38°48′13″, longitude 83°25′16″, Adams County, Hydrologic Unit 05090201
Drainage area, in square miles: 387.
Station used for record extension: 03247500
Time period of systematic or extended record analyzed: 1925-04-01 to 1997-09-30
Percentage of estimated values in extended record: 9.0
Eighty-percent-duration streamflow, in cubic feet per second: 16.
Mean annual streamflow, in inches: 16.18
Location of station used for precipitation data: Hillsboro, Ohio
Location of station used for potential evapotranspiration data: Covington, Kentucy
[–, indicates a value that could not be determined because there were too few average low-flow values less than the mean streamflow for the indicated duration]
Recurrenceinterval(years)
Extreme-value
variate
Minimum runoff (in inches) for indicated duration (in days)
180 360 540 720 1080 1440 1800
73.00 4.28 0.07 2.12 6.20 11.87 22.51 36.10 52.50
70.00 4.24 0.07 2.18 6.26 12.00 22.74 36.51 52.64
60.00 4.09 0.08 2.39 6.49 12.48 23.59 38.02 53.14
50.00 3.90 0.09 2.63 6.75 13.04 24.59 39.81 53.73
40.00 3.68 0.10 2.94 7.08 13.74 25.82 42.01 54.45
30.00 3.38 0.12 3.87 7.24 15.23 28.13 43.93 57.14
25.00 3.20 0.14 4.62 7.28 16.35 29.80 44.89 59.38
20.00 2.97 0.14 4.85 7.31 16.86 30.98 45.23 61.43
10.00 2.25 0.20 6.52 10.59 19.96 38.65 51.46 71.97
5.21 1.55 0.68 8.28 15.20 25.23 50.00 71.61 –
Hydrologic Design Tables 251

03237500 Ohio Brush Creek near West Union, Ohio—Continued
Recurrenceinterval(years)
Impounding reservoir storage required (in inches) and critical-drawdown duration (in days; shown in gray) for indicated draft rate (in fraction of the mean annual streamflow)
0.02 0.05 0.10 0.15 0.20 0.25 0.30 0.35 0.40 0.45 0.50 0.60 0.70 0.80 0.90 1.00
5 0.03 0.14 0.34 0.62 0.95 1.28 1.61 1.94 2.30 2.72 3.26 4.32 5.38 6.44 7.51 8.92 60 90 120 150 150 150 150 150 180 240 240 240 240 240 240 660
6 0.04 0.15 0.39 0.72 1.08 1.48 1.88 2.33 2.79 3.26 3.73 4.67 5.73 6.80 7.90 10.65 60 90 150 150 180 180 180 210 210 210 210 240 240 240 270 660
8 0.05 0.17 0.52 0.92 1.31 1.78 2.24 2.71 3.17 3.64 4.10 5.05 6.12 7.74 10.40 13.06 90 120 180 180 180 210 210 210 210 210 210 240 240 600 600 600
10 0.05 0.21 0.59 0.99 1.44 1.91 2.37 2.84 3.30 3.77 4.23 5.27 6.59 9.25 11.90 14.56 90 150 180 180 210 210 210 210 210 210 210 240 600 600 600 600
15 0.07 0.26 0.65 1.08 1.55 2.01 2.48 2.94 3.42 3.95 4.48 5.87 8.53 11.18 13.84 19.06 120 150 180 210 210 210 210 210 240 240 240 600 600 600 600 1680
20 0.08 0.28 0.66 1.11 1.58 2.04 2.51 3.04 3.57 4.13 4.73 6.79 9.45 12.11 15.41 22.86 150 150 180 210 210 210 210 240 240 270 270 600 600 600 1680 1680
25 0.09 0.29 0.67 1.13 1.59 2.08 2.61 3.14 3.74 4.34 4.93 7.32 9.97 12.63 17.53 24.98 150 150 180 210 210 240 240 270 270 270 270 600 600 600 1680 1680
30 0.10 0.30 0.68 1.14 1.62 2.15 2.70 3.30 3.89 4.49 5.09 7.64 10.30 13.04 18.82 26.26 150 150 210 210 240 240 270 270 270 270 270 600 600 900 1680 1680
40 0.11 0.31 0.70 1.20 1.73 2.33 2.92 3.52 4.12 4.72 5.44 7.98 10.64 14.66 20.15 27.59 150 150 210 240 240 270 270 270 270 270 540 600 600 960 1680 1680
50 0.11 0.31 0.75 1.29 1.88 2.48 3.08 3.68 4.28 4.94 5.62 8.12 11.78 16.03 20.65 28.20 150 150 240 270 270 270 270 270 270 300 540 600 960 960 1680 1740
60 0.12 0.32 0.80 1.40 2.00 2.59 3.25 3.92 4.58 5.25 5.91 8.57 12.82 17.07 21.35 29.04 150 150 240 270 270 270 300 300 300 300 300 960 960 960 1380 1740
70 0.12 0.32 0.88 1.48 2.14 2.81 3.47 4.14 4.80 5.46 6.19 9.38 13.63 17.89 23.09 29.74 150 180 270 270 300 300 300 300 300 300 330 960 960 960 1380 1740
80 0.12 0.35 0.96 1.63 2.29 2.96 3.62 4.29 4.95 5.67 6.40 10.04 14.30 18.81 24.79 30.90 150 240 300 300 300 300 300 300 300 330 330 960 960 1020 1380 1380
90 0.12 0.40 1.07 1.73 2.40 3.06 3.73 4.39 5.11 5.84 6.57 10.73 15.25 20.32 26.43 32.54 150 300 300 300 300 300 300 300 330 330 330 1020 1020 1380 1380 1380
100 0.12 0.48 1.14 1.81 2.47 3.14 3.80 4.52 5.25 5.98 7.07 11.59 16.11 21.89 28.00 34.11 150 300 300 300 300 300 300 330 330 330 1020 1020 1020 1380 1380 1380
252 Hydrologic Considerations for Estimation of Storage-Capacity Requirements of Impounding and Side-Channel Reservoirs for Water Supply in Ohio

03237500 Ohio Brush Creek near West Union, Ohio—Continued
Pumpset
Ratio of storage required for pump set to storage required for the primary pump relation (pump set 1) for indicated demand (in fraction of mean
annual streamflow)
0.002 0.010 0.020 0.050 0.100 0.200 0.300
1 1.00 1.00 1.00 1.00 1.00 1.00 1.00
2 1.53 1.50 1.54 1.33 1.26 1.90 6.17
3 1.03 1.03 1.18 1.13 1.04 1.07 1.27
4 1.00 1.00 1.10 1.09 1.01 1.00 1.00
5 1.00 1.00 1.05 1.05 1.00 1.00 1.00
6 1.00 1.00 1.02 1.02 1.00 1.00 1.00
7 1.54 1.58 1.64 1.43 1.52 8.11 15.92
8 1.03 1.13 1.33 1.23 1.13 1.58 3.61
9 1.02 1.16 1.41 1.27 1.18 1.90 6.93
10 1.02 1.16 1.42 1.31 1.19 1.99 4.71
11 1.00 1.22 1.42 1.32 1.18 1.95 4.00
12 1.03 1.15 1.34 1.23 1.13 1.67 6.45
13 1.00 1.08 1.37 1.25 1.17 1.50 2.23
14 1.01 1.09 1.37 1.28 1.18 1.56 2.16
15 1.01 1.13 1.37 1.29 1.18 1.57 2.25
16 1.03 1.14 1.38 1.29 1.22 1.56 2.33
17 1.01 1.02 1.34 1.23 1.15 1.26 1.99
18 1.00 1.04 1.34 1.26 1.18 1.26 1.98
19 1.01 1.10 1.34 1.25 1.18 1.28 2.07
20 1.01 1.12 1.34 1.29 1.22 1.26 2.20
Hydrologic Design Tables 253

03237500 Ohio Brush Creek near West Union, Ohio—Continued
Recurrenceinterval(years)
Normalvariate
Side-channel storage required (in demand days) for primary pump relation to meet indicated demand (in fraction of mean annual streamflow)
0.0020 0.0100 0.0200 0.0500 0.1000 0.2000 0.3000
73.00 2.206 272.78 224.02 211.86 250.80 284.60 307.51 317.32
70.00 2.190 272.77 223.72 211.76 248.86 281.29 304.24 314.75
60.00 2.128 272.74 222.60 211.38 241.64 268.99 292.12 305.23
50.00 2.054 272.69 221.25 210.92 232.89 254.09 277.42 293.68
40.00 1.960 272.64 219.55 210.33 221.85 235.27 258.87 279.11
30.00 1.834 268.68 217.26 206.78 217.06 225.98 247.31 267.15
25.00 1.751 264.88 215.76 203.59 216.93 224.67 243.70 261.55
20.00 1.645 234.05 200.47 202.29 206.80 222.70 236.23 250.51
10.00 1.282 178.86 173.77 167.10 183.38 209.41 219.84 229.02
5.00 0.841 148.51 119.92 116.55 128.45 139.97 163.33 189.54
2.03 0.017 108.34 75.84 71.00 78.26 93.97 124.46 134.53
254 Hydrologic Considerations for Estimation of Storage-Capacity Requirements of Impounding and Side-Channel Reservoirs for Water Supply in Ohio

03238500 Whiteoak Creek near Georgetown, Ohio
Location: Latitude 38°51′29″, longitude 83°55′43″, Brown County, Hydrologic Unit 05090201
Drainage area, in square miles: 218.
Station used for record extension: 03247500
Time period of systematic or extended record analyzed: 1924-10-01 to 1997-09-18
Percentage of estimated values in extended record: 5.5
Eighty-percent-duration streamflow, in cubic feet per second: 7.3
Mean annual streamflow, in inches: 16.38
Location of station used for precipitation data: Cincinnati, Ohio
Location of station used for potential evapotranspiration data: Covington, Kentucy
[–, indicates a value that could not be determined because there were too few average low-flow values less than the mean streamflow for the indicated duration]
Recurrenceinterval(years)
Extreme-value
variate
Minimum runoff (in inches) for indicated duration (in days)
180 360 540 720 1080 1440 1800
73.00 4.28 0.07 1.58 5.85 12.85 24.50 39.64 52.75
70.00 4.24 0.07 1.67 5.88 12.88 24.59 39.72 52.98
60.00 4.09 0.07 2.00 5.98 12.98 24.94 40.03 53.84
50.00 3.90 0.08 2.39 6.11 13.11 25.36 40.39 54.85
40.00 3.68 0.08 2.86 6.26 13.26 25.86 40.83 56.09
30.00 3.38 0.09 3.33 6.38 13.96 27.72 42.43 56.60
25.00 3.20 0.10 3.57 6.43 14.55 29.25 43.75 56.61
20.00 2.97 0.13 4.22 7.56 15.45 29.96 44.75 57.55
10.00 2.25 0.23 6.37 9.57 20.84 35.18 52.74 76.35
5.21 1.55 0.63 7.65 14.10 23.47 49.26 – –
Hydrologic Design Tables 255

03238500 Whiteoak Creek near Georgetown, Ohio—Continued
Recurrenceinterval(years)
Impounding reservoir storage required (in inches) and critical-drawdown duration (in days; shown in gray) for indicated draft rate (in fraction of the mean annual streamflow)
0.02 0.05 0.10 0.15 0.20 0.25 0.30 0.35 0.40 0.45 0.50 0.60 0.70 0.80 0.90 1.00
5 0.04 0.15 0.37 0.64 0.97 1.30 1.75 2.22 2.69 3.16 3.68 4.75 5.83 6.91 7.98 9.48 60 90 120 120 150 150 210 210 210 210 240 240 240 240 240 660
6 0.04 0.15 0.40 0.74 1.10 1.51 1.97 2.44 2.97 3.51 4.05 5.12 6.20 7.28 8.64 11.33 60 90 120 150 180 180 210 210 240 240 240 240 240 240 600 600
8 0.05 0.18 0.51 0.90 1.30 1.75 2.22 2.74 3.28 3.82 4.36 5.45 6.66 8.89 11.58 14.27 60 120 150 180 180 210 210 240 240 240 240 270 270 600 600 600
10 0.05 0.22 0.58 0.99 1.42 1.89 2.36 2.87 3.41 3.95 4.56 5.77 7.72 10.41 13.11 16.28 90 150 180 180 210 210 210 240 240 270 270 270 600 600 600 1320
15 0.07 0.26 0.67 1.12 1.59 2.06 2.53 3.09 3.70 4.30 4.91 6.81 9.50 12.19 14.88 20.80 120 150 180 210 210 210 210 270 270 270 270 600 600 600 600 1320
20 0.08 0.29 0.72 1.19 1.66 2.13 2.66 3.26 3.87 4.47 5.08 7.59 10.28 12.97 16.30 23.89 150 180 210 210 210 210 270 270 270 270 270 600 600 600 1320 1740
25 0.09 0.31 0.75 1.23 1.70 2.17 2.78 3.38 3.99 4.59 5.38 8.01 10.70 13.39 17.82 25.62 150 180 210 210 210 270 270 270 270 270 540 600 600 600 1740 1740
30 0.09 0.32 0.78 1.25 1.72 2.27 2.88 3.48 4.09 4.69 5.74 8.27 10.96 13.65 18.82 26.62 150 180 210 210 210 270 270 270 270 270 540 600 600 600 1740 1740
40 0.10 0.33 0.80 1.27 1.83 2.43 3.04 3.67 4.41 5.15 6.13 8.58 11.27 14.08 20.01 27.81 150 210 210 210 270 270 270 330 330 330 540 600 600 900 1740 1740
50 0.10 0.34 0.82 1.35 1.96 2.57 3.29 4.03 4.77 5.51 6.28 8.75 11.45 15.40 20.87 28.66 150 210 210 270 270 300 330 330 330 330 540 600 600 960 1680 1740
60 0.10 0.35 0.85 1.45 2.10 2.81 3.55 4.28 5.02 5.76 6.50 8.87 12.30 16.61 22.05 29.59 150 210 240 270 300 330 330 330 330 330 330 600 960 960 1680 1680
70 0.10 0.37 0.92 1.59 2.26 3.00 3.74 4.48 5.22 5.96 6.70 9.06 13.37 17.67 23.17 30.71 150 240 270 300 300 330 330 330 330 330 330 960 960 960 1680 1680
80 0.10 0.42 1.02 1.70 2.40 3.14 3.88 4.62 5.36 6.10 6.84 10.02 14.33 18.63 24.32 31.79 150 240 300 300 330 330 330 330 330 330 330 960 960 960 1620 1680
90 0.13 0.45 1.11 1.78 2.51 3.25 3.99 4.73 5.47 6.21 6.95 10.89 15.20 19.50 26.35 33.62 240 240 300 300 330 330 330 330 330 330 330 960 960 960 1620 1620
100 0.15 0.49 1.16 1.86 2.60 3.34 4.08 4.82 5.56 6.30 7.38 11.68 15.99 21.10 28.36 35.62 240 300 300 330 330 330 330 330 330 330 960 960 960 1620 1620 1620
256 Hydrologic Considerations for Estimation of Storage-Capacity Requirements of Impounding and Side-Channel Reservoirs for Water Supply in Ohio

03238500 Whiteoak Creek near Georgetown, Ohio—Continued
Pumpset
Ratio of storage required for pump set to storage required for the primary pump relation (pump set 1) for indicated demand (in fraction of mean
annual streamflow)
0.002 0.010 0.020 0.050 0.100 0.200 0.300
1 1.00 1.00 1.00 1.00 1.00 1.00 1.00
2 1.61 1.40 1.34 1.22 1.42 9.77 19.29
3 1.30 1.14 1.16 1.07 1.05 1.26 1.60
4 1.13 1.05 1.08 1.04 1.03 1.00 1.14
5 1.04 1.00 1.05 1.03 1.02 1.00 1.00
6 1.01 1.00 1.02 1.02 1.00 1.00 1.00
7 1.63 1.44 1.42 1.57 8.21 25.43 35.09
8 1.31 1.23 1.28 1.17 1.39 3.22 15.03
9 1.31 1.28 1.35 1.22 1.53 8.77 22.66
10 1.25 1.26 1.35 1.29 1.41 2.29 14.48
11 1.17 1.24 1.33 1.28 1.34 1.84 9.22
12 1.33 1.27 1.30 1.17 1.52 9.10 21.92
13 1.23 1.17 1.30 1.20 1.25 1.71 8.07
14 1.15 1.21 1.31 1.27 1.24 1.53 2.68
15 1.07 1.22 1.31 1.26 1.23 1.39 1.91
16 1.05 1.27 1.33 1.31 1.25 1.36 2.01
17 1.17 1.15 1.27 1.19 1.19 1.41 1.96
18 1.07 1.19 1.30 1.24 1.22 1.28 1.76
19 1.03 1.22 1.29 1.25 1.19 1.20 1.71
20 1.05 1.23 1.29 1.30 1.25 1.17 1.83
Hydrologic Design Tables 257
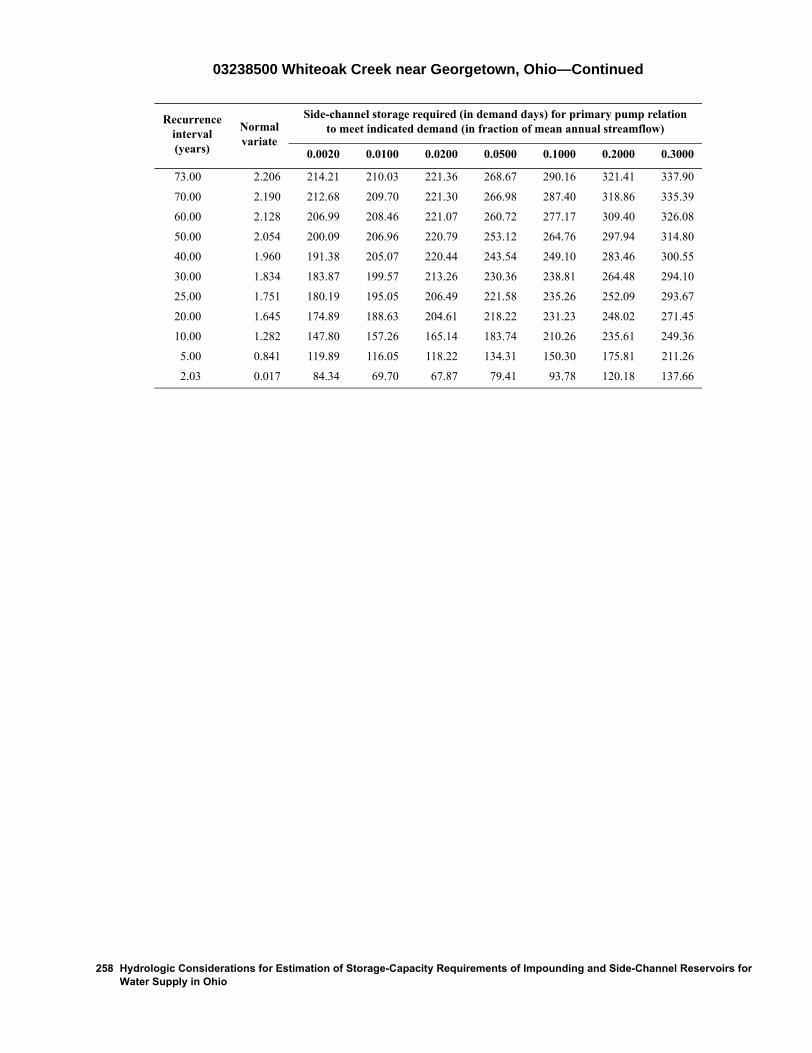
03238500 Whiteoak Creek near Georgetown, Ohio—Continued
Recurrenceinterval(years)
Normalvariate
Side-channel storage required (in demand days) for primary pump relation to meet indicated demand (in fraction of mean annual streamflow)
0.0020 0.0100 0.0200 0.0500 0.1000 0.2000 0.3000
73.00 2.206 214.21 210.03 221.36 268.67 290.16 321.41 337.90
70.00 2.190 212.68 209.70 221.30 266.98 287.40 318.86 335.39
60.00 2.128 206.99 208.46 221.07 260.72 277.17 309.40 326.08
50.00 2.054 200.09 206.96 220.79 253.12 264.76 297.94 314.80
40.00 1.960 191.38 205.07 220.44 243.54 249.10 283.46 300.55
30.00 1.834 183.87 199.57 213.26 230.36 238.81 264.48 294.10
25.00 1.751 180.19 195.05 206.49 221.58 235.26 252.09 293.67
20.00 1.645 174.89 188.63 204.61 218.22 231.23 248.02 271.45
10.00 1.282 147.80 157.26 165.14 183.74 210.26 235.61 249.36
5.00 0.841 119.89 116.05 118.22 134.31 150.30 175.81 211.26
2.03 0.017 84.34 69.70 67.87 79.41 93.78 120.18 137.66
258 Hydrologic Considerations for Estimation of Storage-Capacity Requirements of Impounding and Side-Channel Reservoirs for Water Supply in Ohio

03240000 Little Miami River near Oldtown, Ohio
Location: Latitude 39°44′54″, longitude 83°55′53″, Greene County, Hydrologic Unit 05090202
Drainage area, in square miles: 129.
Station used for record extension: None
Time period of systematic or extended record analyzed: 1952-08-01 to 1997-09-30
Eighty-percent-duration streamflow, in cubic feet per second: 25.
Mean annual streamflow, in inches: 12.74
Location of station used for precipitation data: Dayton, Ohio
Location of station used for potential evapotranspiration data: Dayton, Ohio
[–, indicates a value that could not be determined because there were too few average low-flow values less than the mean streamflow for the indicated duration]
Recurrenceinterval(years)
Extreme-value
variate
Minimum runoff (in inches) for indicated duration (in days)
180 360 540 720 1080 1440 1800
46.00 3.82 0.63 2.85 4.18 8.43 16.82 27.17 37.58
40.00 3.68 0.66 3.09 4.79 9.11 18.42 28.62 38.87
30.00 3.38 0.73 3.58 6.04 10.53 21.71 31.61 41.54
25.00 3.20 0.77 3.90 6.84 11.43 23.81 33.51 43.24
20.00 2.97 0.81 4.18 7.23 12.09 24.82 34.84 46.35
10.00 2.25 0.88 5.40 8.02 15.02 27.00 38.20 52.86
5.11 1.52 1.05 6.49 12.29 17.37 35.80 – –
Hydrologic Design Tables 259

03240000 Little Miami River near Oldtown, Ohio—Continued
Recurrenceinterval(years)
Impounding reservoir storage required (in inches) and critical-drawdown duration (in days; shown in gray) for indicated draft rate (in fraction of the mean annual streamflow)
0.02 0.05 0.10 0.15 0.20 0.25 0.30 0.35 0.40 0.45 0.50 0.60 0.70 0.80 0.90 1.00
5 0.00 0.00 0.01 0.10 0.27 0.50 0.79 1.11 1.42 1.73 2.07 2.81 3.54 4.32 5.47 7.77 0 0 30 60 120 150 180 180 180 180 210 210 210 240 660 660
6 0.00 0.00 0.02 0.12 0.30 0.56 0.87 1.18 1.50 1.82 2.18 2.91 3.73 4.57 6.34 8.64 0 0 30 60 120 150 180 180 180 210 210 210 240 240 660 660
8 0.00 0.00 0.02 0.15 0.36 0.63 0.95 1.26 1.59 1.96 2.34 3.18 4.37 6.26 8.14 12.09 0 0 60 90 150 180 180 180 210 210 240 240 540 540 900 1260
10 0.00 0.00 0.03 0.17 0.38 0.67 0.99 1.32 1.68 2.09 2.51 3.38 5.08 6.96 10.26 14.65 0 0 60 90 150 180 180 210 210 240 240 270 540 540 1260 1260
15 0.00 0.00 0.03 0.20 0.42 0.73 1.09 1.46 1.88 2.30 2.76 3.78 5.86 7.95 10.26 15.60 0 0 60 120 150 180 210 240 240 240 270 540 600 600 1260 1740
20 0.00 0.00 0.04 0.22 0.45 0.80 1.17 1.57 1.99 2.45 2.92 4.60 6.69 8.78 10.87 16.48 0 0 90 120 180 210 210 240 240 270 270 600 600 600 600 1740
25 0.00 0.00 0.04 0.23 0.49 0.85 1.22 1.64 2.09 2.56 3.17 5.27 7.36 9.45 11.66 17.34 0 0 90 120 210 210 240 240 270 270 600 600 600 600 660 1740
30 0.00 0.00 0.04 0.24 0.53 0.89 1.27 1.70 2.17 2.71 3.76 5.85 7.94 10.06 12.62 18.70 0 0 90 120 210 210 240 270 270 600 600 600 600 660 1740 1800
40 0.00 0.00 0.05 0.30 0.59 0.95 1.36 1.83 2.68 3.72 4.77 6.86 9.42 12.72 17.89 23.75 0 0 120 150 210 210 270 270 600 600 600 600 900 1200 1680 1680
50 0.00 0.00 0.10 0.36 0.65 1.00 1.88 2.82 3.76 4.80 6.32 10.35 14.74 19.14 24.43 30.29 0 0 150 150 180 210 540 540 540 840 900 1260 1260 1260 1680 1680
60 0.00 0.00 0.15 0.41 0.94 1.88 2.83 4.97 7.17 9.36 11.56 15.96 20.35 24.78 30.64 36.50 0 0 150 150 540 540 540 1260 1260 1260 1260 1260 1260 1680 1680 1680
70 0.00 0.00 0.20 0.74 2.31 4.51 6.71 8.91 11.10 13.30 15.50 19.89 24.29 30.06 35.92 41.78 0 0 150 540 1260 1260 1260 1260 1260 1260 1260 1260 1260 1680 1680 1680
80 0.00 0.00 0.48 2.67 4.87 7.07 9.27 11.46 13.66 15.86 18.05 22.57 28.43 34.29 40.15 46.01 0 0 1260 1260 1260 1260 1260 1260 1260 1260 1260 1680 1680 1680 1680 1680
90 0.00 0.01 2.06 4.26 6.46 8.66 10.85 13.05 15.25 17.44 19.98 25.84 31.69 37.55 43.41 49.27 0 150 1260 1260 1260 1260 1260 1260 1260 1260 1680 1680 1680 1680 1680 1680
100 0.00 0.83 3.02 5.22 7.42 9.61 11.81 14.01 16.58 19.51 22.44 28.30 34.16 40.02 45.88 51.73 0 1260 1260 1260 1260 1260 1260 1260 1680 1680 1680 1680 1680 1680 1680 1680
260 Hydrologic Considerations for Estimation of Storage-Capacity Requirements of Impounding and Side-Channel Reservoirs for Water Supply in Ohio
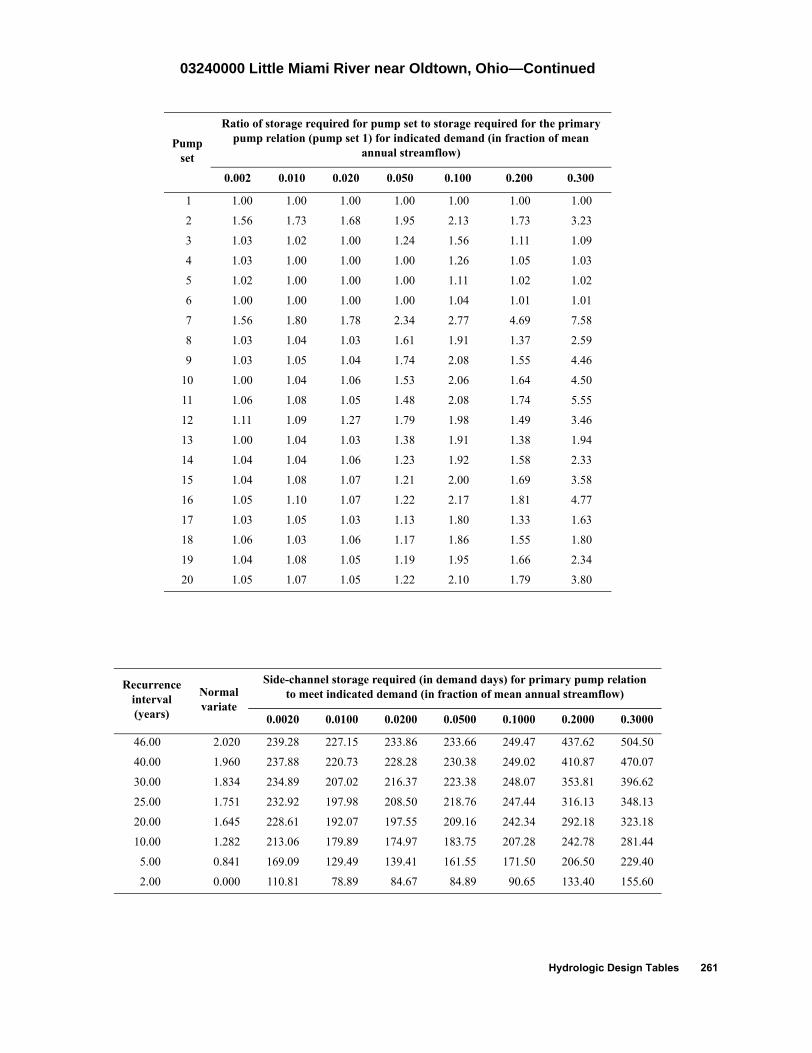
03240000 Little Miami River near Oldtown, Ohio—Continued
Pumpset
Ratio of storage required for pump set to storage required for the primary pump relation (pump set 1) for indicated demand (in fraction of mean
annual streamflow)
0.002 0.010 0.020 0.050 0.100 0.200 0.300
1 1.00 1.00 1.00 1.00 1.00 1.00 1.00
2 1.56 1.73 1.68 1.95 2.13 1.73 3.23
3 1.03 1.02 1.00 1.24 1.56 1.11 1.09
4 1.03 1.00 1.00 1.00 1.26 1.05 1.03
5 1.02 1.00 1.00 1.00 1.11 1.02 1.02
6 1.00 1.00 1.00 1.00 1.04 1.01 1.01
7 1.56 1.80 1.78 2.34 2.77 4.69 7.58
8 1.03 1.04 1.03 1.61 1.91 1.37 2.59
9 1.03 1.05 1.04 1.74 2.08 1.55 4.46
10 1.00 1.04 1.06 1.53 2.06 1.64 4.50
11 1.06 1.08 1.05 1.48 2.08 1.74 5.55
12 1.11 1.09 1.27 1.79 1.98 1.49 3.46
13 1.00 1.04 1.03 1.38 1.91 1.38 1.94
14 1.04 1.04 1.06 1.23 1.92 1.58 2.33
15 1.04 1.08 1.07 1.21 2.00 1.69 3.58
16 1.05 1.10 1.07 1.22 2.17 1.81 4.77
17 1.03 1.05 1.03 1.13 1.80 1.33 1.63
18 1.06 1.03 1.06 1.17 1.86 1.55 1.80
19 1.04 1.08 1.05 1.19 1.95 1.66 2.34
20 1.05 1.07 1.05 1.22 2.10 1.79 3.80
Recurrenceinterval(years)
Normalvariate
Side-channel storage required (in demand days) for primary pump relation to meet indicated demand (in fraction of mean annual streamflow)
0.0020 0.0100 0.0200 0.0500 0.1000 0.2000 0.3000
46.00 2.020 239.28 227.15 233.86 233.66 249.47 437.62 504.50
40.00 1.960 237.88 220.73 228.28 230.38 249.02 410.87 470.07
30.00 1.834 234.89 207.02 216.37 223.38 248.07 353.81 396.62
25.00 1.751 232.92 197.98 208.50 218.76 247.44 316.13 348.13
20.00 1.645 228.61 192.07 197.55 209.16 242.34 292.18 323.18
10.00 1.282 213.06 179.89 174.97 183.75 207.28 242.78 281.44
5.00 0.841 169.09 129.49 139.41 161.55 171.50 206.50 229.40
2.00 0.000 110.81 78.89 84.67 84.89 90.65 133.40 155.60
Hydrologic Design Tables 261

03240500 North Fork Massie Creek at Cedarville, Ohio
Location: Latitude 39°45′25″, longitude 83°47′25″, Greene County, Hydrologic Unit 05090202
Drainage area, in square miles: 28.9
Station used for record extension: 03241500
Time period of systematic or extended record analyzed: 1952-09-01 to 1997-09-30
Percentage of estimated values in extended record: 68.4
Eighty-percent-duration streamflow, in cubic feet per second: 2.5
Mean annual streamflow, in inches: 13.59
Location of station used for precipitation data: Dayton, Ohio
Location of station used for potential evapotranspiration data: Dayton, Ohio
[–, indicates a value that could not be determined because there were too few average low-flow values less than the mean stream-flow for the indicated duration]
Recurrenceinterval(years)
Extreme-value
variate
Minimum runoff (in inches) for indicated duration (in days)
180 360 540 720 1080 1440 1800
46.00 3.82 0.07 1.47 1.95 5.66 15.03 26.67 40.14
40.00 3.68 0.12 2.01 2.87 6.87 17.08 28.87 41.67
30.00 3.38 0.22 3.13 4.76 9.38 21.31 33.40 44.82
25.00 3.20 0.29 3.84 5.97 10.98 24.01 36.29 46.82
20.00 2.97 0.33 4.21 6.89 11.92 25.42 37.71 49.23
10.00 2.25 0.42 5.56 8.92 15.89 29.00 42.03 57.84
5.11 1.52 0.83 6.94 12.80 19.13 38.62 – –
262 Hydrologic Considerations for Estimation of Storage-Capacity Requirements of Impounding and Side-Channel Reservoirs for Water Supply in Ohio

03240500 North Fork Massie Creek at Cedarville, Ohio—Continued
Recurrenceinterval(years)
Impounding reservoir storage required (in inches) and critical-drawdown duration (in days; shown in gray) for indicated draft rate (in fraction of the mean annual streamflow)
0.02 0.05 0.10 0.15 0.20 0.25 0.30 0.35 0.40 0.45 0.50 0.60 0.70 0.80 0.90 1.00
5 0.01 0.04 0.18 0.35 0.57 0.79 1.11 1.50 1.89 2.28 2.67 3.55 4.45 5.34 6.23 8.29 30 30 90 90 120 120 210 210 210 210 210 240 240 240 240 600
6 0.01 0.05 0.20 0.42 0.69 1.00 1.36 1.75 2.14 2.53 2.98 3.87 4.76 5.65 6.75 9.20 30 60 90 120 150 180 210 210 210 210 240 240 240 240 660 660
8 0.02 0.08 0.26 0.54 0.87 1.20 1.54 1.91 2.32 2.76 3.21 4.13 5.13 6.23 8.21 12.90 30 60 150 150 180 180 180 210 240 240 240 270 270 300 1260 1260
10 0.02 0.09 0.30 0.59 0.92 1.26 1.59 1.96 2.40 2.85 3.29 4.24 5.31 6.92 11.21 15.89 60 60 150 180 180 180 180 210 240 240 240 270 300 540 1260 1260
15 0.03 0.11 0.32 0.63 0.96 1.30 1.63 2.07 2.51 2.96 3.41 4.31 6.29 8.52 11.21 17.12 60 90 150 180 180 180 180 240 240 240 240 300 600 600 1260 1740
20 0.03 0.13 0.35 0.67 1.00 1.34 1.76 2.21 2.65 3.10 3.55 5.76 7.99 10.22 12.46 17.58 60 90 120 180 180 180 240 240 240 240 240 600 600 600 600 1740
25 0.04 0.15 0.39 0.73 1.06 1.48 1.92 2.37 2.82 3.81 4.93 7.16 9.39 11.62 13.89 19.00 90 120 180 180 180 240 240 240 240 600 600 600 600 600 960 1800
30 0.04 0.16 0.46 0.79 1.19 1.64 2.08 2.71 3.83 4.94 6.06 8.29 10.52 12.76 15.55 20.63 90 120 180 180 240 240 240 600 600 600 600 600 600 600 840 1800
40 0.05 0.22 0.58 1.00 1.44 2.29 3.29 4.36 5.47 6.59 7.70 9.94 12.72 15.84 19.54 25.21 120 180 210 240 240 540 540 600 600 600 600 600 840 840 1200 1620
50 0.08 0.30 0.71 1.44 2.44 3.45 4.45 5.45 6.54 7.66 9.12 12.24 16.75 22.08 28.10 34.13 180 210 240 540 540 540 540 540 600 600 840 840 1260 1560 1620 1620
60 0.11 0.36 1.12 2.12 3.13 4.13 5.13 6.37 8.56 10.90 13.24 18.16 23.96 29.90 35.92 41.95 210 270 540 540 540 540 540 840 1260 1260 1260 1560 1560 1620 1620 1620
70 0.14 0.50 1.51 2.51 3.52 5.54 7.88 10.23 12.57 15.16 18.06 23.87 29.86 35.88 41.91 47.93 210 540 540 540 540 1260 1260 1260 1260 1560 1560 1560 1620 1620 1620 1620
80 0.17 0.72 1.73 3.39 5.73 8.08 10.42 13.30 16.20 19.10 22.05 28.07 34.10 40.13 46.15 52.18 270 540 540 1260 1260 1260 1260 1560 1560 1560 1620 1620 1620 1620 1620 1620
90 0.24 0.85 2.58 4.92 7.27 10.09 12.99 15.89 18.89 21.91 24.92 30.95 36.97 43.00 49.02 55.05 540 540 1260 1260 1260 1560 1560 1560 1620 1620 1620 1620 1620 1620 1620 1620
100 0.31 1.14 3.48 5.95 8.85 11.75 14.75 17.77 20.78 23.79 26.81 32.83 38.86 44.89 50.91 56.94 540 1260 1260 1560 1560 1560 1620 1620 1620 1620 1620 1620 1620 1620 1620 1620
Hydrologic Design Tables 263

03240500 North Fork Massie Creek at Cedarville, Ohio—Continued
Pumpset
Ratio of storage required for pump set to storage required for the primary pump relation (pump set 1) for indicated demand (in fraction of mean
annual streamflow)
0.002 0.010 0.020 0.050 0.100 0.200 0.300
1 1.00 1.00 1.00 1.00 1.00 1.00 1.00
2 1.51 1.64 1.64 1.68 1.50 1.20 1.79
3 1.16 1.11 1.04 1.23 1.30 1.04 1.01
4 1.09 1.05 1.01 1.00 1.12 1.00 1.00
5 1.05 1.03 1.00 1.00 1.04 1.00 1.00
6 1.02 1.01 1.00 1.00 1.01 1.00 1.00
7 1.52 1.75 1.79 1.90 1.84 2.96 5.18
8 1.16 1.11 1.09 1.61 1.61 1.21 1.30
9 1.16 1.11 1.12 1.74 1.72 1.33 1.67
10 1.13 1.09 1.13 1.68 1.72 1.32 1.49
11 1.10 1.07 1.14 1.71 1.76 1.37 1.60
12 1.18 1.14 1.31 1.69 1.63 1.30 1.62
13 1.13 1.08 1.07 1.51 1.63 1.24 1.27
14 1.08 1.05 1.10 1.45 1.63 1.31 1.36
15 1.05 1.03 1.12 1.48 1.72 1.37 1.48
16 1.04 1.05 1.16 1.34 1.75 1.41 1.63
17 1.09 1.05 1.05 1.34 1.57 1.24 1.23
18 1.05 1.05 1.08 1.28 1.60 1.31 1.33
19 1.02 1.01 1.12 1.32 1.70 1.37 1.47
20 1.00 1.05 1.16 1.28 1.73 1.41 1.60
Recurrenceinterval(years)
Normalvariate
Side-channel storage required (in demand days) for primary pump relation to meet indicated demand (in fraction of mean annual streamflow)
0.0020 0.0100 0.0200 0.0500 0.1000 0.2000 0.3000
46.00 2.020 227.23 228.80 236.16 259.89 327.66 496.89 551.40
40.00 1.960 223.44 219.76 225.41 255.03 319.11 462.81 509.40
30.00 1.834 215.37 200.46 202.49 244.66 300.86 390.13 419.80
25.00 1.751 210.04 187.72 187.35 237.81 288.81 342.13 360.64
20.00 1.645 206.68 180.24 179.27 221.80 257.69 290.46 313.41
10.00 1.282 191.48 168.64 170.79 176.29 188.43 217.53 247.24
5.00 0.841 144.87 119.46 115.82 125.21 135.46 187.85 217.52
2.00 0.000 86.89 65.62 76.11 79.62 97.43 119.55 138.74
264 Hydrologic Considerations for Estimation of Storage-Capacity Requirements of Impounding and Side-Channel Reservoirs for Water Supply in Ohio

03241000 South Fork Massie Creek near Cedarville, Ohio
Location: Latitude 39°44′20″, longitude 83°45′50″, Greene County, Hydrologic Unit 05090202
Drainage area, in square miles: 17.1
Station used for record extension: 03241500
Time period of systematic or extended record analyzed: 1952-09-01 to 1997-09-30
Percentage of estimated values in extended record: 68.4
Eighty-percent-duration streamflow, in cubic feet per second: 0.8
Mean annual streamflow, in inches: 15.89
Location of station used for precipitation data: Dayton, Ohio
Location of station used for potential evapotranspiration data: Dayton, Ohio
[–, indicates a value that could not be determined because there were too few average low-flow values less than the mean streamflow for the indicated duration]
Recurrenceinterval(years)
Extreme-value
variate
Minimum runoff (in inches) for indicated duration (in days)
180 360 540 720 1080 1440 1800
46.00 3.82 0.01 1.23 1.60 5.13 16.47 30.92 47.34
40.00 3.68 0.04 1.80 2.55 6.49 18.76 33.06 48.93
30.00 3.38 0.10 2.97 4.51 9.29 23.47 37.48 52.20
25.00 3.20 0.14 3.72 5.76 11.07 26.47 40.29 54.28
20.00 2.97 0.17 4.18 7.10 12.51 27.97 41.90 56.06
10.00 2.25 0.20 5.85 9.25 17.86 32.78 46.79 64.35
5.11 1.52 0.63 7.31 15.22 21.88 53.65 – –
Hydrologic Design Tables 265

03241000 South Fork Massie Creek near Cedarville, Ohio—Continued
Recurrenceinterval(years)
Impounding reservoir storage required (in inches) and critical-drawdown duration (in days; shown in gray) for indicated draft rate (in fraction of the mean annual streamflow)
0.02 0.05 0.10 0.15 0.20 0.25 0.30 0.35 0.40 0.45 0.50 0.60 0.70 0.80 0.90 1.00
5 0.04 0.15 0.37 0.63 0.89 1.22 1.68 2.14 2.59 3.05 3.51 4.44 5.48 6.53 7.65 10.07 60 90 120 120 120 210 210 210 210 210 210 240 240 240 270 660
6 0.04 0.15 0.37 0.73 1.12 1.51 1.94 2.40 2.85 3.31 3.83 4.90 6.07 7.25 8.63 11.29 60 90 120 180 180 180 210 210 210 240 240 270 270 270 600 660
8 0.04 0.15 0.53 0.92 1.31 1.70 2.12 2.58 3.10 3.62 4.19 5.36 6.54 8.21 11.10 16.58 60 90 180 180 180 180 210 240 240 240 270 270 270 540 1260 1260
10 0.04 0.20 0.57 0.96 1.35 1.74 2.17 2.68 3.21 3.73 4.29 5.46 6.70 9.33 14.81 20.29 60 150 180 180 180 180 210 240 240 240 270 270 540 1260 1260 1260
15 0.08 0.25 0.58 0.98 1.37 1.80 2.29 2.82 3.34 3.86 4.38 5.92 8.53 11.14 14.84 21.69 120 150 180 180 180 210 240 240 240 240 240 600 600 600 960 1740
20 0.09 0.28 0.61 1.00 1.43 1.91 2.43 2.96 3.48 4.00 5.19 7.80 10.41 13.02 15.84 22.36 120 150 180 180 210 240 240 240 240 240 600 600 600 600 960 1740
25 0.10 0.29 0.65 1.08 1.54 2.06 2.59 3.11 4.18 5.48 6.79 9.40 12.01 14.66 17.66 23.13 150 150 180 210 240 240 240 240 600 600 600 600 600 660 720 1800
30 0.11 0.31 0.71 1.17 1.68 2.20 2.87 4.17 5.48 6.78 8.09 10.70 13.31 16.18 19.79 24.46 150 150 210 210 240 240 600 600 600 600 600 600 660 720 900 1800
40 0.13 0.37 0.84 1.36 2.32 3.49 4.74 6.04 7.35 8.66 9.96 12.88 16.54 20.19 24.05 31.09 180 210 240 240 540 540 600 600 600 600 600 840 840 840 1620 1620
50 0.15 0.43 1.13 2.30 3.48 4.65 5.90 7.21 8.62 10.45 12.28 15.93 20.48 25.73 32.74 39.78 180 240 540 540 540 540 600 600 840 840 840 840 1140 1260 1620 1620
60 0.17 0.56 1.74 2.91 4.09 5.31 7.06 8.88 10.71 13.28 16.02 21.50 26.98 33.51 40.55 47.60 210 540 540 540 540 600 840 840 840 1260 1260 1260 1260 1620 1620 1620
70 0.21 0.87 2.05 3.22 4.78 6.89 9.63 12.37 15.11 17.85 20.59 26.07 32.76 39.81 46.86 53.91 270 540 540 540 840 1260 1260 1260 1260 1260 1260 1260 1620 1620 1620 1620
80 0.32 1.02 2.20 4.27 7.01 9.75 12.49 15.23 17.97 20.71 23.45 30.50 37.55 44.59 51.64 58.69 540 540 540 1260 1260 1260 1260 1260 1260 1260 1260 1620 1620 1620 1620 1620
90 0.40 1.10 3.23 5.97 8.71 11.45 14.19 16.93 19.90 23.43 26.95 34.00 41.04 48.09 55.14 62.19 540 540 1260 1260 1260 1260 1260 1260 1620 1620 1620 1620 1620 1620 1620 1620
100 0.43 1.47 4.22 6.96 9.70 12.44 15.35 18.88 22.40 25.93 29.45 36.50 43.54 50.59 57.64 64.69 540 1260 1260 1260 1260 1260 1620 1620 1620 1620 1620 1620 1620 1620 1620 1620
266 Hydrologic Considerations for Estimation of Storage-Capacity Requirements of Impounding and Side-Channel Reservoirs for Water Supply in Ohio

03241000 South Fork Massie Creek near Cedarville, Ohio—Continued
Pumpset
Ratio of storage required for pump set to storage required for the primary pump relation (pump set 1) for indicated demand (in fraction of mean
annual streamflow)
0.002 0.010 0.020 0.050 0.100 0.200 0.300
1 1.00 1.00 1.00 1.00 1.00 1.00 1.00
2 1.63 1.68 1.71 1.70 1.37 1.07 2.32
3 1.15 1.10 1.05 1.28 1.21 1.03 1.01
4 1.07 1.04 1.00 1.00 1.08 1.00 1.00
5 1.05 1.02 1.00 1.00 1.03 1.00 1.00
6 1.02 1.00 1.00 1.00 1.01 1.00 1.00
7 1.63 1.91 1.92 1.95 1.56 3.51 6.86
8 1.14 1.12 1.14 1.68 1.48 1.17 1.33
9 1.15 1.12 1.24 1.74 1.56 1.32 2.77
10 1.11 1.09 1.13 1.74 1.59 1.32 1.78
11 1.09 1.07 1.13 1.73 1.62 1.35 1.61
12 1.17 1.29 1.47 1.75 1.48 1.20 2.42
13 1.11 1.07 1.10 1.53 1.49 1.25 1.32
14 1.08 1.04 1.12 1.55 1.55 1.31 1.43
15 1.09 1.05 1.13 1.53 1.60 1.35 1.49
16 1.09 1.06 1.15 1.57 1.68 1.44 1.63
17 1.07 1.04 1.08 1.39 1.44 1.24 1.26
18 1.08 1.03 1.12 1.42 1.53 1.31 1.39
19 1.05 1.03 1.13 1.39 1.59 1.35 1.48
20 1.05 1.05 1.15 1.50 1.68 1.44 1.57
Recurrenceinterval(years)
Normalvariate
Side-channel storage required (in demand days) for primary pump relation to meet indicated demand (in fraction of mean annual streamflow)
0.0020 0.0100 0.0200 0.0500 0.1000 0.2000 0.3000
46.00 2.020 228.85 228.87 235.87 261.60 363.41 514.28 560.99
40.00 1.960 228.16 222.79 227.35 257.34 348.77 477.27 517.28
30.00 1.834 226.69 209.83 209.18 248.26 317.56 398.32 424.04
25.00 1.751 225.72 201.27 197.19 242.26 296.94 346.19 362.48
20.00 1.645 222.62 192.81 188.92 225.16 262.56 291.59 306.80
10.00 1.282 205.71 177.55 180.44 188.47 204.13 223.20 242.22
5.00 0.841 142.01 116.94 121.12 126.52 142.22 189.97 224.00
2.00 0.000 89.79 65.28 64.69 79.47 105.81 123.10 142.29
Hydrologic Design Tables 267

03241500 Massies Creek at Wilberforce, Ohio
Location: Latitude 39°43′22″, longitude 83°52′58″, Greene County, Hydrologic Unit 05090202
Drainage area, in square miles: 63.2
Station used for record extension: None
Time period of systematic or extended record analyzed: 1952-09-01 to 1997-09-30
Eighty-percent-duration streamflow, in cubic feet per second: 8.2
Mean annual streamflow, in inches: 13.85
Location of station used for precipitation data: Dayton, Ohio
Location of station used for potential evapotranspiration data: Dayton, Ohio
[–, indicates a value that could not be determined because there were too few average low-flow values less than the mean stream-flow for the indicated duration]
Recurrenceinterval(years)
Extreme-value
variate
Minimum runoff (in inches) for indicated duration (in days)
180 360 540 720 1080 1440 1800
46.00 3.82 0.19 1.70 2.22 5.88 15.26 27.77 41.15
40.00 3.68 0.23 2.25 3.14 7.12 17.39 29.92 43.00
30.00 3.38 0.30 3.39 5.04 9.67 21.79 34.35 46.81
25.00 3.20 0.35 4.12 6.25 11.29 24.59 37.18 49.24
20.00 2.97 0.41 4.46 7.25 12.39 25.97 38.86 51.16
10.00 2.25 0.55 5.69 9.15 16.41 30.12 42.46 58.51
5.11 1.52 0.96 7.17 12.81 19.03 45.80 – –
268 Hydrologic Considerations for Estimation of Storage-Capacity Requirements of Impounding and Side-Channel Reservoirs for Water Supply in Ohio

03241500 Massies Creek at Wilberforce, Ohio—Continued
Recurrenceinterval(years)
Impounding reservoir storage required (in inches) and critical-drawdown duration (in days; shown in gray) for indicated draft rate (in fraction of the mean annual streamflow)
0.02 0.05 0.10 0.15 0.20 0.25 0.30 0.35 0.40 0.45 0.50 0.60 0.70 0.80 0.90 1.00
5 0.00 0.02 0.14 0.31 0.50 0.77 1.13 1.53 1.93 2.32 2.72 3.57 4.48 5.39 6.30 8.06 0 30 90 90 120 150 210 210 210 210 210 240 240 240 240 660
6 0.00 0.02 0.15 0.36 0.63 0.93 1.28 1.68 2.08 2.48 2.91 3.82 4.73 5.68 6.77 9.06 0 30 90 120 150 180 210 210 210 210 240 240 240 270 600 900
8 0.00 0.03 0.20 0.45 0.76 1.10 1.44 1.81 2.22 2.68 3.13 4.12 5.14 6.21 8.54 13.32 0 30 120 150 180 180 180 210 240 240 240 270 270 540 1260 1260
10 0.00 0.04 0.22 0.49 0.83 1.17 1.51 1.87 2.32 2.78 3.24 4.27 5.29 6.89 11.49 16.27 0 60 120 150 180 180 180 240 240 240 270 270 270 540 1260 1260
15 0.00 0.05 0.25 0.56 0.90 1.24 1.58 2.02 2.47 2.93 3.38 4.38 6.22 8.50 11.49 16.43 30 60 150 180 180 180 180 240 240 240 240 270 600 600 1260 1740
20 0.00 0.07 0.27 0.61 0.95 1.29 1.70 2.16 2.62 3.07 3.53 5.55 7.83 10.10 12.38 17.21 30 90 150 180 180 180 240 240 240 240 240 600 600 600 600 1740
25 0.01 0.08 0.32 0.66 1.00 1.39 1.85 2.30 2.76 3.52 4.65 6.93 9.20 11.48 13.91 18.12 30 90 180 180 180 240 240 240 240 600 600 600 600 600 720 1800
30 0.01 0.09 0.36 0.70 1.08 1.53 1.99 2.44 3.54 4.67 5.81 8.09 10.36 12.68 15.79 19.77 30 90 180 180 240 240 240 240 600 600 600 600 600 660 900 1800
40 0.01 0.11 0.45 0.86 1.31 2.08 3.10 4.15 5.29 6.43 7.57 9.84 12.76 15.96 19.94 25.84 30 150 180 240 240 540 540 600 600 600 600 600 840 900 1200 1620
50 0.01 0.18 0.57 1.24 2.27 3.29 4.32 5.34 6.47 7.61 9.15 12.63 17.02 21.80 27.49 33.63 60 180 210 540 540 540 540 540 600 600 840 1140 1260 1260 1620 1620
60 0.03 0.25 0.97 1.99 3.01 4.04 5.06 6.39 8.74 11.13 13.52 18.30 23.08 28.31 34.45 40.59 150 210 540 540 540 540 540 840 1260 1260 1260 1260 1260 1620 1620 1620
70 0.07 0.38 1.41 2.43 3.46 5.70 8.09 10.48 12.87 15.25 17.64 22.42 27.79 33.93 40.07 46.22 210 540 540 540 540 1260 1260 1260 1260 1260 1260 1260 1620 1620 1620 1620
80 0.12 0.65 1.67 3.51 5.90 8.29 10.68 13.07 15.46 17.85 20.23 25.93 32.07 38.22 44.36 50.50 270 540 540 1260 1260 1260 1260 1260 1260 1260 1260 1620 1620 1620 1620 1620
90 0.18 0.80 2.68 5.07 7.46 9.84 12.23 14.62 17.01 19.87 22.95 29.09 35.23 41.38 47.52 53.66 540 540 1260 1260 1260 1260 1260 1260 1260 1620 1620 1620 1620 1620 1620 1620
100 0.27 1.20 3.58 5.97 8.36 10.75 13.14 16.01 19.08 22.15 25.22 31.37 37.51 43.65 49.80 55.94 540 1260 1260 1260 1260 1260 1260 1620 1620 1620 1620 1620 1620 1620 1620 1620
Hydrologic Design Tables 269

03241500 Massies Creek at Wilberforce, Ohio—Continued
Pumpset
Ratio of storage required for pump set to storage required for the primary pump relation (pump set 1) for indicated demand (in fraction of mean
annual streamflow)
0.002 0.010 0.020 0.050 0.100 0.200 0.300
1 1.00 1.00 1.00 1.00 1.00 1.00 1.00
2 2.30 2.04 1.92 1.80 1.39 1.20 2.28
3 1.15 1.13 1.13 1.41 1.21 1.03 1.00
4 1.08 1.04 1.01 1.00 1.07 1.00 1.00
5 1.03 1.02 1.00 1.00 1.02 1.00 1.00
6 1.01 1.00 1.00 1.00 1.01 1.00 1.00
7 2.31 2.11 1.99 1.94 1.67 3.21 6.21
8 1.16 1.17 1.35 1.66 1.43 1.18 1.36
9 1.18 1.16 1.40 1.74 1.50 1.29 2.46
10 1.14 1.13 1.12 1.66 1.51 1.31 2.19
11 1.12 1.09 1.14 1.66 1.52 1.34 2.35
12 1.41 1.59 1.61 1.75 1.45 1.26 2.14
13 1.14 1.10 1.09 1.53 1.43 1.19 1.36
14 1.08 1.06 1.10 1.47 1.47 1.28 1.51
15 1.04 1.05 1.14 1.45 1.50 1.34 1.63
16 1.04 1.04 1.18 1.48 1.61 1.43 1.69
17 1.09 1.05 1.08 1.37 1.38 1.18 1.29
18 1.03 1.04 1.10 1.33 1.45 1.28 1.44
19 1.02 1.05 1.14 1.31 1.49 1.34 1.58
20 1.02 1.03 1.18 1.41 1.61 1.43 1.65
Recurrenceinterval(years)
Normalvariate
Side-channel storage required (in demand days) for primary pump relation to meet indicated demand (in fraction of mean annual streamflow)
0.0020 0.0100 0.0200 0.0500 0.1000 0.2000 0.3000
46.00 2.020 231.30 233.73 246.73 272.12 378.25 523.72 569.05
40.00 1.960 229.58 226.22 237.44 270.05 362.56 486.49 530.39
30.00 1.834 225.90 210.21 217.62 265.64 329.08 407.07 447.94
25.00 1.751 223.47 199.63 204.53 262.72 306.98 354.62 393.49
20.00 1.645 220.76 194.27 196.08 242.79 269.94 298.99 358.68
10.00 1.282 216.25 185.78 181.75 188.46 206.11 233.38 265.25
5.00 0.841 159.08 130.93 131.93 135.27 160.42 204.46 235.17
2.00 0.000 88.80 74.55 81.43 91.35 101.32 129.05 144.15
270 Hydrologic Considerations for Estimation of Storage-Capacity Requirements of Impounding and Side-Channel Reservoirs for Water Supply in Ohio
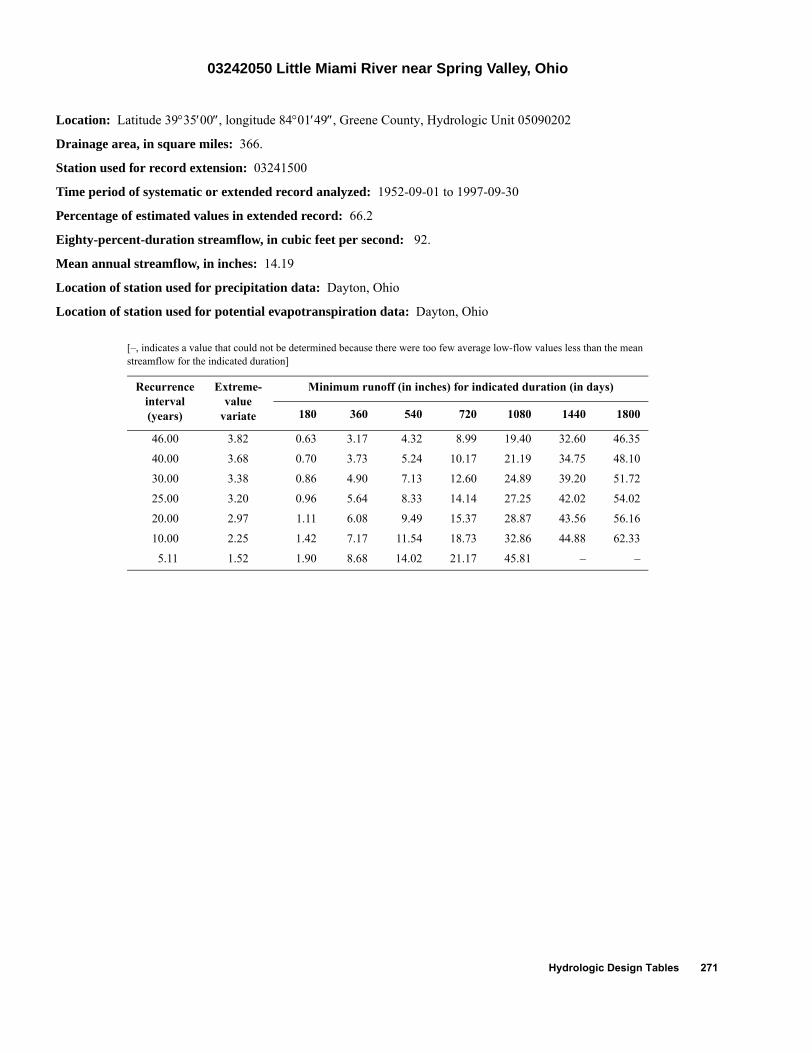
03242050 Little Miami River near Spring Valley, Ohio
Location: Latitude 39°35′00″, longitude 84°01′49″, Greene County, Hydrologic Unit 05090202
Drainage area, in square miles: 366.
Station used for record extension: 03241500
Time period of systematic or extended record analyzed: 1952-09-01 to 1997-09-30
Percentage of estimated values in extended record: 66.2
Eighty-percent-duration streamflow, in cubic feet per second: 92.
Mean annual streamflow, in inches: 14.19
Location of station used for precipitation data: Dayton, Ohio
Location of station used for potential evapotranspiration data: Dayton, Ohio
[–, indicates a value that could not be determined because there were too few average low-flow values less than the mean streamflow for the indicated duration]
Recurrenceinterval(years)
Extreme-value
variate
Minimum runoff (in inches) for indicated duration (in days)
180 360 540 720 1080 1440 1800
46.00 3.82 0.63 3.17 4.32 8.99 19.40 32.60 46.35
40.00 3.68 0.70 3.73 5.24 10.17 21.19 34.75 48.10
30.00 3.38 0.86 4.90 7.13 12.60 24.89 39.20 51.72
25.00 3.20 0.96 5.64 8.33 14.14 27.25 42.02 54.02
20.00 2.97 1.11 6.08 9.49 15.37 28.87 43.56 56.16
10.00 2.25 1.42 7.17 11.54 18.73 32.86 44.88 62.33
5.11 1.52 1.90 8.68 14.02 21.17 45.81 – –
Hydrologic Design Tables 271
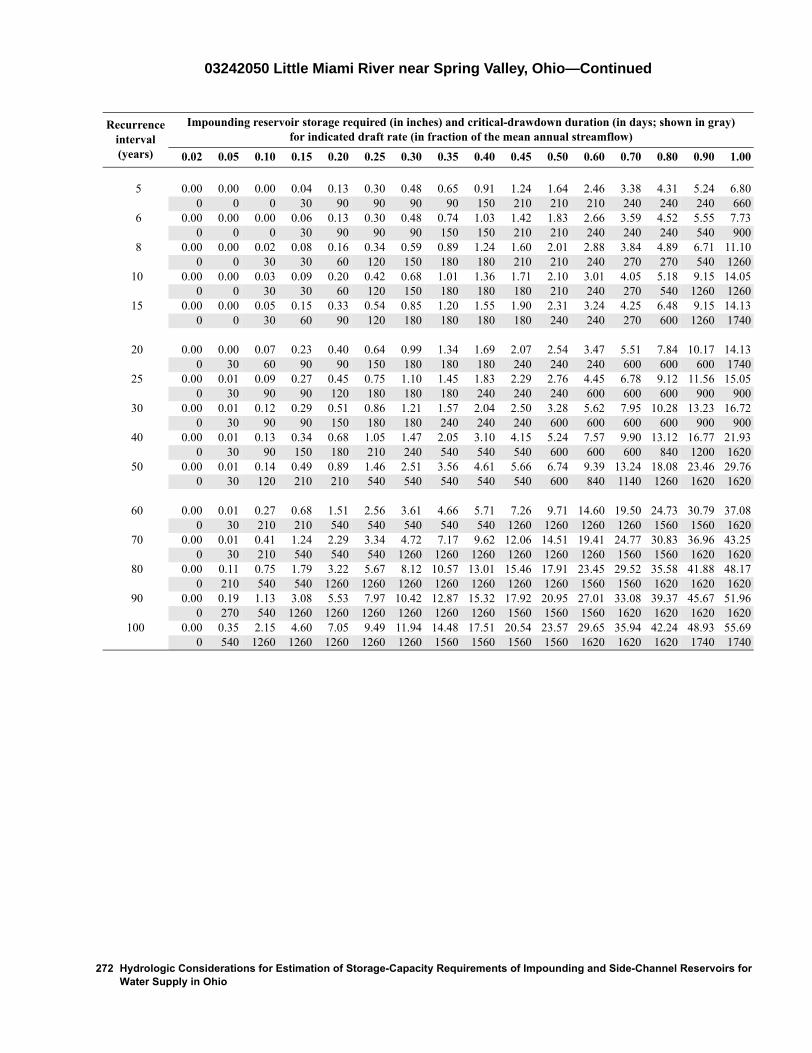
03242050 Little Miami River near Spring Valley, Ohio—Continued
Recurrenceinterval(years)
Impounding reservoir storage required (in inches) and critical-drawdown duration (in days; shown in gray) for indicated draft rate (in fraction of the mean annual streamflow)
0.02 0.05 0.10 0.15 0.20 0.25 0.30 0.35 0.40 0.45 0.50 0.60 0.70 0.80 0.90 1.00
5 0.00 0.00 0.00 0.04 0.13 0.30 0.48 0.65 0.91 1.24 1.64 2.46 3.38 4.31 5.24 6.80 0 0 0 30 90 90 90 90 150 210 210 210 240 240 240 660
6 0.00 0.00 0.00 0.06 0.13 0.30 0.48 0.74 1.03 1.42 1.83 2.66 3.59 4.52 5.55 7.73 0 0 0 30 90 90 90 150 150 210 210 240 240 240 540 900
8 0.00 0.00 0.02 0.08 0.16 0.34 0.59 0.89 1.24 1.60 2.01 2.88 3.84 4.89 6.71 11.10 0 0 30 30 60 120 150 180 180 210 210 240 270 270 540 1260
10 0.00 0.00 0.03 0.09 0.20 0.42 0.68 1.01 1.36 1.71 2.10 3.01 4.05 5.18 9.15 14.05 0 0 30 30 60 120 150 180 180 180 210 240 270 540 1260 1260
15 0.00 0.00 0.05 0.15 0.33 0.54 0.85 1.20 1.55 1.90 2.31 3.24 4.25 6.48 9.15 14.13 0 0 30 60 90 120 180 180 180 180 240 240 270 600 1260 1740
20 0.00 0.00 0.07 0.23 0.40 0.64 0.99 1.34 1.69 2.07 2.54 3.47 5.51 7.84 10.17 14.13 0 30 60 90 90 150 180 180 180 240 240 240 600 600 600 1740
25 0.00 0.01 0.09 0.27 0.45 0.75 1.10 1.45 1.83 2.29 2.76 4.45 6.78 9.12 11.56 15.05 0 30 90 90 120 180 180 180 240 240 240 600 600 600 900 900
30 0.00 0.01 0.12 0.29 0.51 0.86 1.21 1.57 2.04 2.50 3.28 5.62 7.95 10.28 13.23 16.72 0 30 90 90 150 180 180 240 240 240 600 600 600 600 900 900
40 0.00 0.01 0.13 0.34 0.68 1.05 1.47 2.05 3.10 4.15 5.24 7.57 9.90 13.12 16.77 21.93 0 30 90 150 180 210 240 540 540 540 600 600 600 840 1200 1620
50 0.00 0.01 0.14 0.49 0.89 1.46 2.51 3.56 4.61 5.66 6.74 9.39 13.24 18.08 23.46 29.76 0 30 120 210 210 540 540 540 540 540 600 840 1140 1260 1620 1620
60 0.00 0.01 0.27 0.68 1.51 2.56 3.61 4.66 5.71 7.26 9.71 14.60 19.50 24.73 30.79 37.08 0 30 210 210 540 540 540 540 540 1260 1260 1260 1260 1560 1560 1620
70 0.00 0.01 0.41 1.24 2.29 3.34 4.72 7.17 9.62 12.06 14.51 19.41 24.77 30.83 36.96 43.25 0 30 210 540 540 540 1260 1260 1260 1260 1260 1260 1560 1560 1620 1620
80 0.00 0.11 0.75 1.79 3.22 5.67 8.12 10.57 13.01 15.46 17.91 23.45 29.52 35.58 41.88 48.17 0 210 540 540 1260 1260 1260 1260 1260 1260 1260 1560 1560 1620 1620 1620
90 0.00 0.19 1.13 3.08 5.53 7.97 10.42 12.87 15.32 17.92 20.95 27.01 33.08 39.37 45.67 51.96 0 270 540 1260 1260 1260 1260 1260 1260 1560 1560 1560 1620 1620 1620 1620
100 0.00 0.35 2.15 4.60 7.05 9.49 11.94 14.48 17.51 20.54 23.57 29.65 35.94 42.24 48.93 55.69 0 540 1260 1260 1260 1260 1260 1560 1560 1560 1560 1620 1620 1620 1740 1740
272 Hydrologic Considerations for Estimation of Storage-Capacity Requirements of Impounding and Side-Channel Reservoirs for Water Supply in Ohio

03242050 Little Miami River near Spring Valley, Ohio—Continued
Pumpset
Ratio of storage required for pump set to storage required for the primary pump relation (pump set 1) for indicated demand (in fraction of mean
annual streamflow)
0.002 0.010 0.020 0.050 0.100 0.200 0.300
1 1.00 1.00 1.00 1.00 1.00 1.00 1.00
2 1.67 1.55 1.56 1.62 1.46 1.13 1.54
3 1.14 1.12 1.05 1.05 1.25 1.02 1.00
4 1.07 1.05 1.01 1.00 1.07 1.00 1.00
5 1.03 1.04 1.00 1.00 1.01 1.00 1.00
6 1.00 1.02 1.00 1.00 1.00 1.00 1.00
7 1.68 1.62 1.67 1.87 1.72 2.40 5.74
8 1.13 1.14 1.06 1.50 1.56 1.22 1.40
9 1.14 1.13 1.09 1.62 1.73 1.37 3.13
10 1.11 1.10 1.04 1.54 1.76 1.44 3.54
11 1.08 1.07 1.11 1.63 1.84 1.48 4.70
12 1.16 1.14 1.07 1.60 1.57 1.29 1.97
13 1.11 1.08 1.04 1.33 1.64 1.28 1.51
14 1.06 1.06 1.03 1.28 1.70 1.39 1.70
15 1.03 1.05 1.09 1.42 1.81 1.46 3.05
16 1.04 1.05 1.14 1.48 1.92 1.61 4.22
17 1.07 1.06 1.03 1.15 1.58 1.28 1.44
18 1.03 1.05 1.03 1.20 1.68 1.39 1.64
19 1.00 1.03 1.09 1.30 1.81 1.46 2.10
20 1.00 1.05 1.14 1.41 1.92 1.61 3.44
Recurrenceinterval(years)
Normalvariate
Side-channel storage required (in demand days) for primary pump relation to meet indicated demand (in fraction of mean annual streamflow)
0.0020 0.0100 0.0200 0.0500 0.1000 0.2000 0.3000
46.00 2.020 226.76 223.64 230.14 247.11 313.31 486.19 544.23
40.00 1.960 222.21 214.00 218.42 239.17 305.04 452.12 510.52
30.00 1.834 212.51 193.44 193.44 222.22 287.41 379.44 438.63
25.00 1.751 206.11 179.87 176.94 211.03 275.76 331.45 391.16
20.00 1.645 200.29 171.94 168.76 197.83 246.16 278.18 354.57
10.00 1.282 186.87 158.67 166.08 170.53 184.79 215.18 272.37
5.00 0.841 108.34 89.31 100.64 114.31 133.17 180.55 221.77
2.00 0.000 66.26 41.86 46.64 63.37 74.82 101.41 126.07
Hydrologic Design Tables 273

03242200 Anderson Fork near New Burlington, Ohio
Location: Latitude 39°33′59″, longitude 83°54′10″, Greene County, Hydrologic Unit 05090202
Drainage area, in square miles: 77.8
Station used for record extension: 03245500
Time period of systematic or extended record analyzed: 1925-03-11 to 1983-09-30
Percentage of estimated values in extended record: 74.0
Eighty-percent-duration streamflow, in cubic feet per second: 6.7
Mean annual streamflow, in inches: 12.50
Location of station used for precipitation data: Dayton, Ohio
Location of station used for potential evapotranspiration data: Dayton, Ohio
[–, indicates a value that could not be determined because there were too few average low-flow values less than the mean stream-flow for the indicated duration]
Recurrenceinterval(years)
Extreme-value
variate
Minimum runoff (in inches) for indicated duration (in days)
180 360 540 720 1080 1440 1800
59.00 4.07 0.04 0.65 2.10 6.08 14.90 23.82 32.45
50.00 3.90 0.04 0.83 2.16 6.55 15.73 25.33 33.95
40.00 3.68 0.05 1.06 2.24 7.18 16.85 27.36 35.97
30.00 3.38 0.05 1.37 2.34 7.99 18.30 30.00 38.59
25.00 3.20 0.07 1.43 2.82 8.15 18.44 31.22 39.39
20.00 2.97 0.09 1.50 3.45 8.29 18.51 32.66 40.27
10.00 2.25 0.13 3.10 6.50 12.39 25.73 40.93 57.44
5.36 1.58 0.26 5.51 11.24 17.18 31.17 – –
274 Hydrologic Considerations for Estimation of Storage-Capacity Requirements of Impounding and Side-Channel Reservoirs for Water Supply in Ohio

03242200 Anderson Fork near New Burlington, Ohio—Continued
Recurrenceinterval(years)
Impounding reservoir storage required (in inches) and critical-drawdown duration (in days; shown in gray) for indicated draft rate (in fraction of the mean annual streamflow)
0.02 0.05 0.10 0.15 0.20 0.25 0.30 0.35 0.40 0.45 0.50 0.60 0.70 0.80 0.90 1.00
5 0.04 0.16 0.37 0.66 0.97 1.28 1.59 1.90 2.23 2.59 2.97 3.79 4.62 5.44 6.37 7.30 90 120 120 180 180 180 180 180 210 210 240 240 240 270 270 660
6 0.05 0.17 0.40 0.71 1.02 1.32 1.65 2.01 2.37 2.74 3.15 4.06 4.98 5.90 6.83 9.06 120 120 150 180 180 180 210 210 210 240 240 270 270 270 270 660
8 0.05 0.18 0.45 0.76 1.08 1.44 1.80 2.24 2.70 3.22 3.73 4.75 5.78 7.67 9.73 11.78 120 150 180 180 210 210 210 270 270 300 300 300 300 600 600 600
10 0.06 0.19 0.48 0.80 1.16 1.57 2.06 2.57 3.09 3.60 4.11 5.29 7.34 9.39 11.44 13.50 120 150 180 210 210 270 300 300 300 300 300 600 600 600 600 600
15 0.06 0.21 0.54 0.93 1.40 1.90 2.41 2.92 3.47 4.19 5.21 7.27 9.32 11.37 13.42 17.76 120 150 210 270 270 300 300 300 330 600 600 600 600 600 600 1320
20 0.06 0.23 0.60 1.05 1.52 2.03 2.57 3.26 4.18 5.10 6.06 8.12 10.17 12.22 16.25 21.74 120 180 240 270 300 300 330 540 540 540 600 600 600 600 1320 1740
25 0.07 0.25 0.66 1.12 1.60 2.13 2.84 3.76 4.68 5.61 6.53 8.58 10.63 13.64 18.96 24.92 150 210 270 270 300 330 540 540 540 540 540 600 600 1320 1740 1740
30 0.07 0.26 0.70 1.16 1.65 2.22 3.13 4.05 4.98 5.90 6.82 8.85 11.47 14.96 20.92 26.87 150 210 270 270 300 330 540 540 540 540 540 600 900 1740 1740 1740
40 0.08 0.29 0.74 1.22 1.77 2.48 3.40 4.33 5.25 6.18 7.10 9.71 12.79 16.89 22.85 28.80 150 240 270 300 330 540 540 540 540 540 540 900 960 1740 1740 1740
50 0.08 0.30 0.77 1.28 1.85 2.55 3.48 4.40 5.33 6.25 7.40 10.48 13.65 17.72 23.33 29.29 150 270 300 330 330 540 540 540 540 540 900 900 960 1320 1740 1740
60 0.09 0.32 0.82 1.35 1.91 2.55 3.48 4.40 5.33 6.32 7.86 10.94 14.21 18.52 23.36 29.29 180 270 300 330 330 540 540 540 540 900 900 900 960 1380 1680 1740
70 0.09 0.35 0.86 1.40 1.96 2.55 3.48 4.40 5.33 6.59 8.13 11.29 15.56 20.28 25.00 29.73 180 300 300 330 330 540 540 540 540 900 900 960 1380 1380 1380 1380
80 0.10 0.38 0.89 1.44 2.01 2.57 3.48 4.40 5.33 6.74 8.28 12.42 17.14 21.86 26.58 31.30 180 300 300 330 330 330 540 540 540 900 900 1380 1380 1380 1380 1380
90 0.10 0.41 0.92 1.48 2.04 2.61 3.48 4.40 5.33 7.02 9.11 13.83 18.55 23.27 27.99 32.72 180 300 300 330 330 330 540 540 540 1020 1380 1380 1380 1380 1380 1380
100 0.12 0.43 0.94 1.51 2.07 2.64 3.48 4.40 5.76 8.01 10.37 15.10 19.82 24.54 29.26 33.98 300 300 330 330 330 330 540 540 1020 1380 1380 1380 1380 1380 1380 1380
Hydrologic Design Tables 275

03242200 Anderson Fork near New Burlington, Ohio—Continued
Pumpset
Ratio of storage required for pump set to storage required for the primary pump relation (pump set 1) for indicated demand (in fraction of mean
annual streamflow)
0.002 0.010 0.020 0.050 0.100 0.200 0.300
1 1.00 1.00 1.00 1.00 1.00 1.00 1.00
2 3.16 2.49 2.23 2.08 3.13 8.10 10.64
3 1.57 1.34 1.28 1.31 1.37 1.15 1.26
4 1.18 1.13 1.07 1.04 1.16 1.07 1.03
5 1.10 1.05 1.04 1.02 1.02 1.04 1.02
6 1.05 1.01 1.01 1.01 1.00 1.02 1.01
7 3.17 2.53 2.35 2.72 8.59 14.16 17.38
8 1.57 1.41 1.35 1.46 1.55 1.61 6.52
9 1.57 1.41 1.41 1.48 1.63 2.47 9.82
10 1.26 1.25 1.20 1.35 1.61 1.69 7.09
11 1.20 1.21 1.19 1.34 1.64 1.63 5.00
12 1.98 1.79 1.63 1.55 1.59 3.75 9.95
13 1.25 1.20 1.15 1.25 1.52 1.44 2.73
14 1.17 1.17 1.18 1.17 1.52 1.44 1.83
15 1.14 1.14 1.15 1.24 1.51 1.50 1.70
16 1.10 1.08 1.16 1.22 1.50 1.49 1.74
17 1.19 1.16 1.13 1.14 1.45 1.29 1.57
18 1.13 1.12 1.16 1.15 1.42 1.35 1.51
19 1.09 1.09 1.14 1.23 1.43 1.40 1.55
20 1.04 1.04 1.14 1.23 1.48 1.41 1.58
Recurrenceinterval(years)
Normalvariate
Side-channel storage required (in demand days) for primary pump relation to meet indicated demand (in fraction of mean annual streamflow)
0.0020 0.0100 0.0200 0.0500 0.1000 0.2000 0.3000
59.00 2.122 283.95 260.31 278.16 305.72 334.95 457.26 521.77
50.00 2.054 280.49 256.20 275.40 304.37 334.64 435.50 501.61
40.00 1.960 275.69 250.48 271.56 302.50 334.21 405.27 473.60
30.00 1.834 269.23 242.80 266.41 299.98 333.62 364.65 435.96
25.00 1.751 268.13 235.45 257.69 292.74 319.60 361.82 423.47
20.00 1.645 267.14 225.82 245.94 282.82 300.05 361.25 409.16
10.00 1.282 229.80 214.22 215.55 236.42 257.73 321.42 344.20
5.00 0.841 211.62 171.48 179.91 187.88 206.67 233.90 274.99
2.03 0.021 145.83 106.31 109.71 113.48 130.66 160.43 187.67
276 Hydrologic Considerations for Estimation of Storage-Capacity Requirements of Impounding and Side-Channel Reservoirs for Water Supply in Ohio

03242300 Caesar Creek at Harveysburg, Ohio
Location: Latitude 39°30′27″, longitude 84°00′42″, Warren County, Hydrologic Unit 05090202
Drainage area, in square miles: 209.
Station used for record extension: 03245500
Time period of systematic or extended record analyzed: 1925-03-11 to 1975-06-30
Percentage of estimated values in extended record: 70.7
Eighty-percent-duration streamflow, in cubic feet per second: 12.
Mean annual streamflow, in inches: 13.55
Location of station used for precipitation data: Dayton, Ohio
Location of station used for potential evapotranspiration data: Dayton, Ohio
[–, indicates a value that could not be determined because there were too few average low-flow values less than the mean streamflow for the indicated duration]
Recurrenceinterval(years)
Extreme-value
variate
Minimum runoff (in inches) for indicated duration (in days)
180 360 540 720 1080 1440 1800
50.00 3.90 0.06 0.95 2.73 7.62 17.84 28.15 38.19
40.00 3.68 0.06 1.25 2.90 8.33 19.01 30.39 40.28
30.00 3.38 0.07 1.63 3.11 9.25 20.53 33.29 42.97
25.00 3.20 0.07 1.88 3.25 9.83 21.49 35.13 44.69
20.00 2.97 0.12 1.94 3.92 10.00 21.73 36.59 45.49
10.00 2.25 0.20 4.07 8.13 14.06 28.32 40.10 61.92
5.56 1.62 0.27 6.71 11.13 18.90 43.70 – 81.05
Hydrologic Design Tables 277

03242300 Caesar Creek at Harveysburg, Ohio—Continued
Recurrenceinterval(years)
Impounding reservoir storage required (in inches) and critical-drawdown duration (in days; shown in gray) for indicated draft rate (in fraction of the mean annual streamflow)
0.02 0.05 0.10 0.15 0.20 0.25 0.30 0.35 0.40 0.45 0.50 0.60 0.70 0.80 0.90 1.00
5 0.02 0.15 0.43 0.77 1.10 1.43 1.79 2.18 2.57 2.96 3.35 4.13 4.94 5.83 6.72 8.23 60 120 180 180 180 180 210 210 210 210 210 210 240 240 240 660
6 0.04 0.17 0.43 0.77 1.10 1.43 1.80 2.19 2.58 2.97 3.36 4.22 5.15 6.16 7.35 9.71 120 120 180 180 180 180 210 210 210 210 210 240 270 270 600 660
8 0.05 0.18 0.46 0.77 1.11 1.49 1.88 2.31 2.81 3.32 3.82 4.88 5.99 7.99 10.21 12.44 90 150 150 180 180 210 210 270 270 270 270 300 300 600 600 600
10 0.05 0.19 0.47 0.80 1.17 1.61 2.11 2.61 3.14 3.70 4.26 5.37 7.44 9.67 11.89 14.38 90 150 150 180 210 270 270 270 300 300 300 300 600 600 600 1260
15 0.06 0.20 0.52 0.93 1.42 1.93 2.47 3.03 3.59 4.15 5.15 7.35 9.58 11.80 14.79 19.53 120 150 180 240 270 270 300 300 300 540 540 600 600 600 1260 1320
20 0.06 0.22 0.60 1.05 1.55 2.08 2.64 3.26 4.27 5.27 6.27 8.33 10.56 13.01 17.18 23.31 120 180 240 270 270 300 300 540 540 540 540 600 600 900 1320 1740
25 0.06 0.24 0.65 1.12 1.62 2.18 2.84 3.84 4.84 5.84 6.84 8.86 11.21 14.55 19.43 25.89 120 180 240 270 270 300 540 540 540 540 540 600 900 900 1740 1740
30 0.07 0.26 0.68 1.17 1.69 2.29 3.14 4.14 5.14 6.15 7.15 9.16 12.23 15.57 20.93 27.39 120 180 240 270 300 330 540 540 540 540 540 600 900 900 1740 1740
40 0.08 0.28 0.73 1.24 1.81 2.42 3.35 4.35 5.35 6.35 7.36 10.06 13.40 16.74 22.24 28.70 150 210 270 300 330 330 540 540 540 540 540 900 900 900 1740 1740
50 0.10 0.29 0.77 1.32 1.90 2.51 3.35 4.35 5.35 6.35 7.36 10.60 13.97 18.01 22.98 28.95 150 210 300 300 330 330 540 540 540 540 540 900 960 1320 1380 1680
60 0.10 0.29 0.83 1.39 1.96 2.58 3.35 4.35 5.35 6.35 7.45 11.23 15.61 20.73 25.85 30.97 150 210 300 300 330 330 540 540 540 540 900 1020 1380 1380 1380 1380
70 0.11 0.33 0.89 1.44 2.01 2.63 3.35 4.35 5.35 7.00 8.89 13.08 18.20 23.32 28.44 33.56 150 300 300 300 330 330 540 540 540 1020 1020 1380 1380 1380 1380 1380
80 0.11 0.37 0.93 1.49 2.06 2.67 3.35 4.47 6.36 8.26 10.26 15.38 20.50 25.62 30.74 35.86 150 300 300 300 330 330 540 1020 1020 1020 1380 1380 1380 1380 1380 1380
90 0.11 0.41 0.97 1.52 2.09 2.70 3.67 5.56 7.46 9.70 12.26 17.38 22.50 27.83 33.17 38.52 150 300 300 300 330 330 1020 1020 1020 1380 1380 1380 1380 1440 1440 1440
100 0.11 0.44 0.99 1.55 2.12 2.73 4.62 6.51 8.89 11.53 14.20 19.54 24.89 30.23 35.57 40.92 150 300 300 300 330 330 1020 1020 1380 1440 1440 1440 1440 1440 1440 1440
278 Hydrologic Considerations for Estimation of Storage-Capacity Requirements of Impounding and Side-Channel Reservoirs for Water Supply in Ohio

03242300 Caesar Creek at Harveysburg, Ohio—Continued
Pumpset
Ratio of storage required for pump set to storage required for the primary pump relation (pump set 1) for indicated demand (in fraction of mean
annual streamflow)
0.002 0.010 0.020 0.050 0.100 0.200 0.300
1 1.00 1.00 1.00 1.00 1.00 1.00 1.00
2 2.01 1.83 1.70 1.62 1.68 2.45 6.52
3 1.25 1.20 1.16 1.09 1.21 1.22 1.10
4 1.10 1.08 1.04 1.05 1.01 1.11 1.05
5 1.01 1.05 1.01 1.03 1.00 1.05 1.03
6 1.00 1.02 1.00 1.02 1.00 1.03 1.01
7 2.02 1.89 1.80 1.85 2.08 9.99 14.21
8 1.29 1.23 1.21 1.22 1.49 1.46 2.09
9 1.29 1.27 1.24 1.31 1.56 1.72 5.39
10 1.20 1.18 1.22 1.27 1.59 1.68 3.03
11 1.16 1.17 1.19 1.29 1.66 1.72 2.74
12 1.41 1.30 1.26 1.47 1.53 1.61 5.05
13 1.18 1.18 1.17 1.19 1.43 1.48 1.63
14 1.12 1.10 1.14 1.26 1.43 1.51 1.62
15 1.04 1.12 1.17 1.28 1.48 1.59 1.72
16 1.04 1.13 1.17 1.29 1.52 1.62 1.79
17 1.12 1.13 1.13 1.18 1.30 1.44 1.47
18 1.04 1.08 1.09 1.24 1.29 1.51 1.54
19 1.02 1.09 1.13 1.26 1.37 1.56 1.64
20 1.04 1.10 1.16 1.26 1.42 1.59 1.70
Recurrenceinterval(years)
Normalvariate
Side-channel storage required (in demand days) for primary pump relation to meet indicated demand (in fraction of mean annual streamflow)
0.0020 0.0100 0.0200 0.0500 0.1000 0.2000 0.3000
50.00 2.054 233.49 222.42 231.82 258.12 287.93 367.54 457.24
40.00 1.960 231.18 211.33 224.76 255.50 285.40 354.46 426.93
30.00 1.834 228.07 196.43 215.27 251.98 281.99 336.89 386.18
25.00 1.751 226.02 186.59 209.01 249.65 279.74 325.29 359.29
20.00 1.645 225.77 185.60 197.86 241.56 274.10 324.59 351.99
10.00 1.282 190.80 178.34 179.37 185.34 248.35 292.62 316.72
5.00 0.841 154.33 141.21 145.28 165.79 185.41 218.18 244.63
2.00 0.000 101.79 84.03 85.47 93.45 106.14 136.47 159.15
Hydrologic Design Tables 279

03242500 Little Miami River near Fort Ancient, Ohio
Location: Latitude 39°22′42″, longitude 84°05′32″, Warren County, Hydrologic Unit 05090202
Drainage area, in square miles: 680.
Station used for record extension: 03245500
Time period of systematic or extended record analyzed: 1925-03-11 to 1974-09-30
Percentage of estimated values in extended record: 75.8
Eighty-percent-duration streamflow, in cubic feet per second: 100.
Mean annual streamflow, in inches: 13.46
Location of station used for precipitation data: Dayton, Ohio
Location of station used for potential evapotranspiration data: Dayton, Ohio
[–, indicates a value that could not be determined because there were too few average low-flow values less than the mean stream-flow for the indicated duration]
Recurrenceinterval(years)
Extreme-value
variate
Minimum runoff (in inches) for indicated duration (in days)
180 360 540 720 1080 1440 1800
50.00 3.90 0.58 2.27 4.31 9.92 20.45 31.16 41.77
40.00 3.68 0.59 2.49 4.38 10.16 20.73 32.53 42.68
30.00 3.38 0.61 2.77 4.48 10.46 21.10 34.29 43.86
25.00 3.20 0.62 2.95 4.54 10.66 21.33 35.42 44.61
20.00 2.97 0.69 3.05 5.52 11.36 22.90 38.31 46.20
10.00 2.25 0.81 5.42 8.93 15.78 30.71 40.95 59.56
5.56 1.62 1.10 7.72 12.59 19.97 42.82 56.68 79.07
280 Hydrologic Considerations for Estimation of Storage-Capacity Requirements of Impounding and Side-Channel Reservoirs for Water Supply in Ohio

03242500 Little Miami River near Fort Ancient, Ohio—Continued
Recurrenceinterval(years)
Impounding reservoir storage required (in inches) and critical-drawdown duration (in days; shown in gray) for indicated draft rate (in fraction of the mean annual streamflow)
0.02 0.05 0.10 0.15 0.20 0.25 0.30 0.35 0.40 0.45 0.50 0.60 0.70 0.80 0.90 1.00
5 0.00 0.00 0.02 0.13 0.36 0.63 0.91 1.21 1.54 1.87 2.26 3.03 3.80 4.58 5.40 7.15 0 0 30 60 150 150 150 180 180 180 210 210 210 210 240 900
6 0.00 0.00 0.03 0.16 0.41 0.69 1.00 1.33 1.68 2.07 2.46 3.23 4.08 5.03 6.03 8.09 0 0 60 120 150 150 180 180 210 210 210 210 240 270 270 660
8 0.00 0.00 0.04 0.23 0.48 0.79 1.13 1.51 1.90 2.33 2.82 3.82 4.87 6.07 8.28 10.49 0 0 60 120 150 180 210 210 210 270 270 270 300 600 600 600
10 0.00 0.00 0.05 0.26 0.53 0.86 1.24 1.67 2.16 2.66 3.18 4.29 5.65 7.86 10.07 12.29 0 0 60 120 180 180 210 240 270 270 300 300 600 600 600 600
15 0.00 0.00 0.06 0.27 0.61 1.03 1.50 2.00 2.53 3.08 3.63 5.79 8.01 10.22 12.73 17.43 0 0 90 180 180 240 270 270 300 300 300 600 600 600 1260 1320
20 0.00 0.00 0.07 0.31 0.69 1.14 1.62 2.12 2.74 3.73 4.73 6.85 9.06 11.30 15.57 21.99 0 0 90 180 240 240 270 300 540 540 540 600 600 900 1740 1740
25 0.00 0.00 0.07 0.34 0.74 1.19 1.68 2.35 3.34 4.34 5.33 7.37 9.58 12.87 18.12 24.53 0 0 90 180 240 240 330 540 540 540 540 600 600 900 1740 1740
30 0.00 0.00 0.08 0.36 0.77 1.22 1.79 2.66 3.66 4.65 5.65 7.64 10.47 13.78 19.38 25.79 0 0 90 180 240 270 330 540 540 540 540 540 900 900 1740 1740
40 0.00 0.00 0.11 0.39 0.81 1.28 1.88 2.83 3.83 4.82 5.82 7.85 11.17 14.48 19.72 26.13 0 0 150 180 240 270 330 540 540 540 540 900 900 900 1740 1740
50 0.00 0.00 0.15 0.43 0.85 1.37 1.93 2.83 3.83 4.82 5.82 7.85 11.17 14.62 19.72 26.13 0 0 150 150 270 300 300 540 540 540 540 900 900 1320 1740 1740
60 0.00 0.00 0.19 0.47 0.95 1.50 2.06 2.83 3.83 4.82 5.82 7.85 11.17 16.07 21.16 26.24 0 0 150 150 300 300 300 540 540 540 540 900 900 1380 1380 1380
70 0.00 0.01 0.23 0.53 1.08 1.63 2.19 2.83 3.83 4.82 5.82 7.85 12.58 17.67 22.76 27.84 0 90 150 300 300 300 300 540 540 540 540 900 1380 1380 1380 1380
80 0.00 0.03 0.26 0.65 1.20 1.76 2.31 2.86 3.83 4.82 5.82 8.96 14.04 19.13 24.21 29.30 0 120 150 300 300 300 300 300 540 540 540 1380 1380 1380 1380 1380
90 0.00 0.06 0.29 0.77 1.32 1.87 2.43 2.98 3.83 4.82 5.82 10.29 15.37 20.46 25.55 30.63 0 120 150 300 300 300 300 300 540 540 540 1380 1380 1380 1380 1380
100 0.00 0.09 0.32 0.87 1.43 1.98 2.53 3.09 3.83 4.82 6.42 11.51 16.60 21.68 26.83 32.14 0 120 300 300 300 300 300 300 540 540 1380 1380 1380 1380 1440 1440
Hydrologic Design Tables 281

03242500 Little Miami River near Fort Ancient, Ohio—Continued
Pumpset
Ratio of storage required for pump set to storage required for the primary pump relation (pump set 1) for indicated demand (in fraction of mean
annual streamflow)
0.002 0.010 0.020 0.050 0.100 0.200 0.300
1 1.00 1.00 1.00 1.00 1.00 1.00 1.00
2 1.31 1.30 1.34 1.39 1.44 1.90 4.14
3 1.10 1.14 1.21 1.11 1.03 1.22 1.09
4 1.05 1.02 1.06 1.06 1.01 1.10 1.05
5 1.00 1.00 1.01 1.04 1.00 1.05 1.02
6 1.00 1.00 1.00 1.02 1.00 1.02 1.01
7 1.31 1.33 1.52 1.69 2.00 7.79 12.71
8 1.11 1.19 1.27 1.22 1.47 1.56 1.91
9 1.12 1.19 1.29 1.27 1.60 1.79 3.58
10 1.09 1.16 1.27 1.36 1.59 1.82 3.61
11 1.07 1.16 1.30 1.39 1.70 2.02 3.71
12 1.17 1.24 1.30 1.28 1.53 1.61 3.07
13 1.09 1.08 1.22 1.24 1.42 1.61 1.72
14 1.04 1.09 1.21 1.35 1.44 1.68 1.86
15 1.00 1.10 1.25 1.38 1.61 1.89 1.95
16 1.02 1.10 1.24 1.42 1.79 1.97 2.29
17 1.06 1.06 1.17 1.23 1.28 1.57 1.57
18 1.00 1.08 1.19 1.33 1.41 1.67 1.69
19 1.00 1.09 1.24 1.36 1.61 1.80 1.80
20 1.02 1.07 1.26 1.40 1.79 1.87 2.00
Recurrenceinterval(years)
Normalvariate
Side-channel storage required (in demand days) for primary pump relation to meet indicated demand (in fraction of mean annual streamflow)
0.0020 0.0100 0.0200 0.0500 0.1000 0.2000 0.3000
50.00 2.054 211.64 196.08 193.17 229.55 270.22 333.33 435.07
40.00 1.960 210.40 186.99 187.61 226.49 264.93 333.32 431.10
30.00 1.834 208.74 174.77 180.15 222.37 257.83 333.32 425.76
25.00 1.751 207.63 166.70 175.22 219.65 253.14 333.31 422.23
20.00 1.645 179.29 159.85 167.14 200.84 248.88 319.46 374.57
10.00 1.282 150.15 149.48 153.85 171.26 214.95 278.91 301.17
5.00 0.841 116.42 108.46 123.61 150.72 169.94 193.79 247.52
2.00 0.000 78.16 49.26 55.41 80.53 90.65 119.73 148.84
282 Hydrologic Considerations for Estimation of Storage-Capacity Requirements of Impounding and Side-Channel Reservoirs for Water Supply in Ohio

03245500 Little Miami River at Milford, Ohio
Location: Latitude 39°10′17″, longitude 84°17′53″, Clermont County, Hydrologic Unit 05090202
Drainage area, in square miles: 1,203
Station used for record extension: 03247500
Time period of systematic or extended record analyzed: 1925-03-11 to 1974-09-30
Percentage of estimated values in extended record: 4.0
Eighty-percent-duration streamflow, in cubic feet per second: 260.
Mean annual streamflow, in inches: 13.83
Location of station used for precipitation data: Cincinnati, Ohio
Location of station used for potential evapotranspiration data: Covington, Kentucky
[–, indicates a value that could not be determined because there were too few average low-flow values less than the mean streamflow for the indicated duration]
Recurrenceinterval(years)
Extreme-value
variate
Minimum runoff (in inches) for indicated duration (in days)
180 360 540 720 1080 1440 1800
50.00 3.90 0.42 1.86 4.01 9.23 19.89 30.69 41.32
40.00 3.68 0.43 2.14 4.24 9.93 20.95 32.75 43.09
30.00 3.38 0.44 2.51 4.53 10.83 22.33 35.42 45.38
25.00 3.20 0.45 2.74 4.72 11.40 23.20 37.12 46.84
20.00 2.97 0.53 2.79 5.30 11.56 23.56 39.05 47.45
10.00 2.25 0.63 5.04 9.27 15.55 30.71 41.53 60.33
5.56 1.62 0.90 7.54 12.63 20.07 38.91 59.10 81.67
Hydrologic Design Tables 283

03245500 Little Miami River at Milford, Ohio—Continued
Recurrenceinterval(years)
Impounding reservoir storage required (in inches) and critical-drawdown duration (in days; shown in gray) for indicated draft rate (in fraction of the mean annual streamflow)
0.02 0.05 0.10 0.15 0.20 0.25 0.30 0.35 0.40 0.45 0.50 0.60 0.70 0.80 0.90 1.00
5 0.00 0.00 0.08 0.25 0.53 0.82 1.16 1.53 1.92 2.32 2.72 3.51 4.31 5.11 6.02 7.40 0 0 60 120 150 180 180 210 210 210 210 210 210 240 240 660
6 0.00 0.00 0.10 0.32 0.60 0.91 1.26 1.62 2.02 2.42 2.81 3.61 4.49 5.48 6.51 8.87 0 0 90 120 150 180 180 210 210 210 210 210 240 270 270 660
8 0.00 0.00 0.14 0.38 0.68 1.02 1.36 1.76 2.16 2.60 3.11 4.13 5.27 6.84 9.11 11.39 0 30 120 150 180 180 210 210 210 270 270 300 300 600 600 600
10 0.00 0.01 0.16 0.41 0.74 1.08 1.46 1.92 2.43 2.95 3.52 4.66 6.33 8.60 10.87 13.34 0 30 120 150 180 180 210 270 270 300 300 300 600 600 600 1260
15 0.00 0.01 0.17 0.46 0.81 1.29 1.80 2.34 2.91 3.47 4.04 6.18 8.45 10.72 13.29 18.40 0 30 120 180 210 270 270 300 300 300 300 600 600 600 1260 1680
20 0.00 0.01 0.17 0.50 0.95 1.46 1.97 2.54 3.12 4.07 5.09 7.14 9.40 11.67 16.01 22.60 0 30 120 180 270 270 300 300 330 540 540 540 600 600 1740 1740
25 0.00 0.01 0.19 0.56 1.03 1.54 2.08 2.67 3.62 4.64 5.67 7.71 9.91 13.13 18.49 25.08 0 30 150 240 270 270 300 330 540 540 540 540 600 900 1740 1740
30 0.00 0.01 0.21 0.60 1.09 1.60 2.16 2.92 3.94 4.96 5.98 8.03 10.74 14.14 19.85 26.44 0 30 150 240 270 270 330 540 540 540 540 540 900 900 1740 1740
40 0.00 0.02 0.25 0.64 1.14 1.68 2.29 3.16 4.18 5.20 6.22 8.46 11.87 15.27 20.74 27.33 0 60 150 240 270 300 330 540 540 540 540 900 900 900 1740 1740
50 0.00 0.04 0.29 0.66 1.18 1.75 2.36 3.16 4.18 5.20 6.22 8.93 12.33 16.22 21.24 27.33 0 90 150 270 300 300 330 540 540 540 540 900 900 1320 1380 1740
60 0.00 0.06 0.33 0.68 1.25 1.82 2.41 3.16 4.18 5.20 6.22 9.19 13.61 18.83 24.06 29.28 0 120 150 300 300 300 330 540 540 540 540 1020 1380 1380 1380 1380
70 0.00 0.09 0.37 0.74 1.31 1.88 2.44 3.16 4.18 5.20 6.57 10.97 16.20 21.42 26.64 31.87 0 120 150 300 300 300 300 540 540 540 1020 1380 1380 1380 1380 1380
80 0.00 0.12 0.40 0.80 1.37 1.93 2.50 3.16 4.18 5.74 8.08 13.30 18.53 23.75 28.97 34.20 0 120 150 300 300 300 300 540 540 1020 1380 1380 1380 1380 1380 1380
90 0.00 0.14 0.42 0.85 1.42 1.99 2.56 3.16 4.94 7.55 10.16 15.38 20.61 25.83 31.05 36.28 120 120 150 300 300 300 300 540 1380 1380 1380 1380 1380 1380 1380 1380
100 0.02 0.16 0.44 0.90 1.47 2.04 2.61 4.16 6.78 9.39 12.00 17.22 22.45 27.67 32.89 38.12 120 150 150 300 300 300 300 1380 1380 1380 1380 1380 1380 1380 1380 1380
284 Hydrologic Considerations for Estimation of Storage-Capacity Requirements of Impounding and Side-Channel Reservoirs for Water Supply in Ohio

03245500 Little Miami River at Milford, Ohio—Continued
Pumpset
Ratio of storage required for pump set to storage required for the primary pump relation (pump set 1) for indicated demand (in fraction of mean
annual streamflow)
0.002 0.010 0.020 0.050 0.100 0.200 0.300
1 1.00 1.00 1.00 1.00 1.00 1.00 1.00
2 2.90 2.20 2.01 1.82 2.69 5.78 8.24
3 1.56 1.25 1.17 1.24 1.32 1.15 1.18
4 1.37 1.13 1.06 1.03 1.10 1.07 1.03
5 1.24 1.07 1.02 1.01 1.00 1.04 1.02
6 1.04 1.02 1.00 1.01 1.00 1.02 1.01
7 2.92 2.26 2.07 2.35 5.60 10.96 13.34
8 1.56 1.26 1.29 1.40 1.50 1.49 3.98
9 1.56 1.27 1.30 1.44 1.56 1.67 6.86
10 1.47 1.19 1.17 1.32 1.58 1.60 4.60
11 1.38 1.18 1.19 1.23 1.59 1.58 3.56
12 2.01 1.69 1.60 1.51 1.54 2.15 7.03
13 1.45 1.20 1.15 1.19 1.47 1.39 1.91
14 1.34 1.11 1.13 1.17 1.49 1.41 1.64
15 1.26 1.11 1.15 1.22 1.48 1.46 1.67
16 1.20 1.08 1.18 1.23 1.45 1.53 1.75
17 1.37 1.14 1.12 1.12 1.40 1.27 1.46
18 1.25 1.09 1.11 1.16 1.38 1.34 1.50
19 1.06 1.07 1.15 1.20 1.38 1.36 1.57
20 1.04 1.04 1.17 1.23 1.41 1.47 1.64
Recurrenceinterval(years)
Normalvariate
Side-channel storage required (in demand days) for primary pump relation to meet indicated demand (in fraction of mean annual streamflow)
0.0020 0.0100 0.0200 0.0500 0.1000 0.2000 0.3000
50.00 2.054 281.53 279.09 290.52 315.91 343.55 453.82 525.12
40.00 1.960 279.13 271.80 289.14 313.11 343.08 428.36 502.01
30.00 1.834 275.90 262.01 287.29 309.35 342.45 394.15 470.95
25.00 1.751 273.77 255.55 286.07 306.87 342.04 371.56 450.44
20.00 1.645 270.21 244.46 263.91 301.02 325.45 371.10 424.69
10.00 1.282 224.85 216.13 230.82 262.91 285.40 335.61 384.48
5.00 0.841 194.22 170.24 183.43 188.14 206.72 232.30 288.09
2.00 0.000 146.17 108.21 104.39 117.00 134.48 165.06 194.67
Hydrologic Design Tables 285

03246200 East Fork Little Miami River near Marathon, Ohio
Location: Latitude 39°06′52″, longitude 84°01′29″, Clermont County, Hydrologic Unit 05090202
Drainage area, in square miles: 195.
Station used for record extension: 03246500
Time period of systematic or extended record analyzed: 1924-10-01 to 1997-09-18
Percentage of estimated values in extended record: 79.2
Eighty-percent-duration streamflow, in cubic feet per second: 14.
Mean annual streamflow, in inches: 14.88
Location of station used for precipitation data: Hillsboro, Ohio
Location of station used for potential evapotranspiration data: Covington, Kentucy
[–, indicates a value that could not be determined because there were too few average low-flow values less than the mean stream-flow for the indicated duration]
Recurrenceinterval(years)
Extreme-value
variate
Minimum runoff (in inches) for indicated duration (in days)
180 360 540 720 1080 1440 1800
73.00 4.28 0.08 1.58 5.79 11.73 22.56 36.79 49.58
70.00 4.24 0.08 1.66 5.82 11.80 22.69 36.90 49.70
60.00 4.09 0.08 1.95 5.92 12.07 23.17 37.32 50.13
50.00 3.90 0.08 2.29 6.05 12.39 23.74 37.82 50.64
40.00 3.68 0.08 2.71 6.20 12.78 24.43 38.43 51.27
30.00 3.38 0.09 2.99 6.28 13.19 25.97 38.86 51.72
25.00 3.20 0.10 3.09 6.30 13.43 27.15 39.03 51.90
20.00 2.97 0.14 3.42 7.00 14.49 27.86 41.24 52.07
10.00 2.25 0.32 5.22 10.03 17.25 32.61 48.79 69.06
5.21 1.55 0.66 7.25 14.13 22.10 41.40 – –
286 Hydrologic Considerations for Estimation of Storage-Capacity Requirements of Impounding and Side-Channel Reservoirs for Water Supply in Ohio
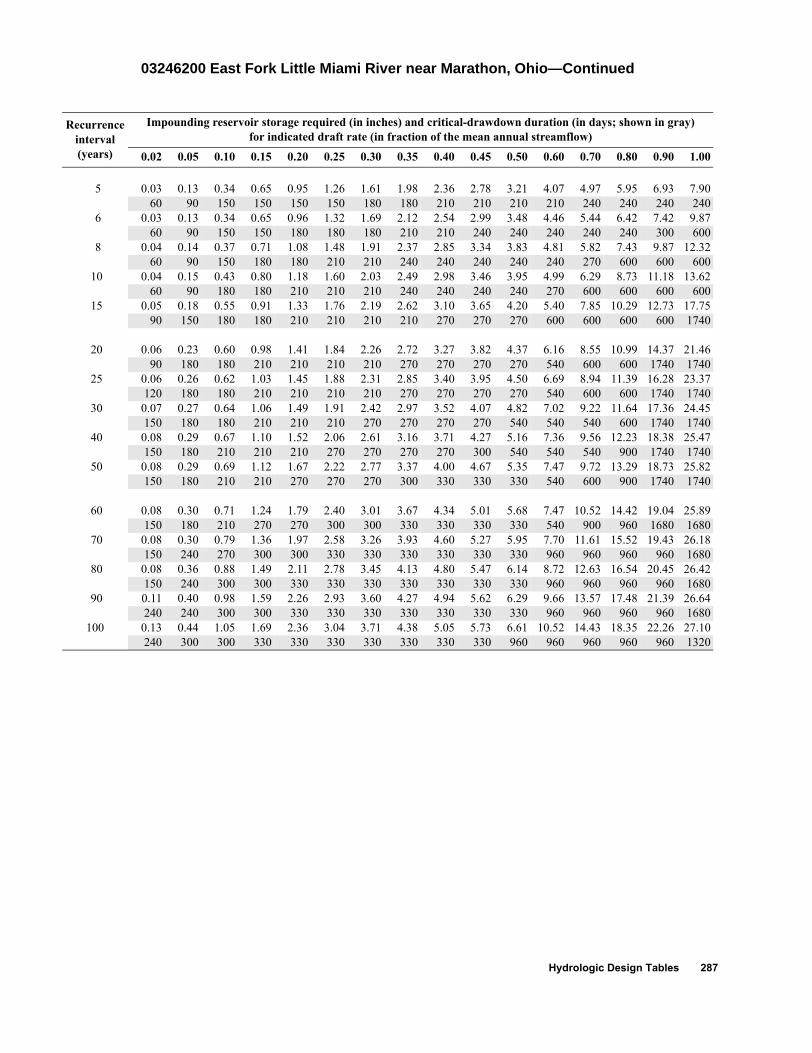
03246200 East Fork Little Miami River near Marathon, Ohio—Continued
Recurrenceinterval(years)
Impounding reservoir storage required (in inches) and critical-drawdown duration (in days; shown in gray) for indicated draft rate (in fraction of the mean annual streamflow)
0.02 0.05 0.10 0.15 0.20 0.25 0.30 0.35 0.40 0.45 0.50 0.60 0.70 0.80 0.90 1.00
5 0.03 0.13 0.34 0.65 0.95 1.26 1.61 1.98 2.36 2.78 3.21 4.07 4.97 5.95 6.93 7.90 60 90 150 150 150 150 180 180 210 210 210 210 240 240 240 240
6 0.03 0.13 0.34 0.65 0.96 1.32 1.69 2.12 2.54 2.99 3.48 4.46 5.44 6.42 7.42 9.87 60 90 150 150 180 180 180 210 210 240 240 240 240 240 300 600
8 0.04 0.14 0.37 0.71 1.08 1.48 1.91 2.37 2.85 3.34 3.83 4.81 5.82 7.43 9.87 12.32 60 90 150 180 180 210 210 240 240 240 240 240 270 600 600 600
10 0.04 0.15 0.43 0.80 1.18 1.60 2.03 2.49 2.98 3.46 3.95 4.99 6.29 8.73 11.18 13.62 60 90 180 180 210 210 210 240 240 240 240 270 600 600 600 600
15 0.05 0.18 0.55 0.91 1.33 1.76 2.19 2.62 3.10 3.65 4.20 5.40 7.85 10.29 12.73 17.75 90 150 180 180 210 210 210 210 270 270 270 600 600 600 600 1740
20 0.06 0.23 0.60 0.98 1.41 1.84 2.26 2.72 3.27 3.82 4.37 6.16 8.55 10.99 14.37 21.46 90 180 180 210 210 210 210 270 270 270 270 540 600 600 1740 1740
25 0.06 0.26 0.62 1.03 1.45 1.88 2.31 2.85 3.40 3.95 4.50 6.69 8.94 11.39 16.28 23.37 120 180 180 210 210 210 210 270 270 270 270 540 600 600 1740 1740
30 0.07 0.27 0.64 1.06 1.49 1.91 2.42 2.97 3.52 4.07 4.82 7.02 9.22 11.64 17.36 24.45 150 180 180 210 210 210 270 270 270 270 540 540 540 600 1740 1740
40 0.08 0.29 0.67 1.10 1.52 2.06 2.61 3.16 3.71 4.27 5.16 7.36 9.56 12.23 18.38 25.47 150 180 210 210 210 270 270 270 270 300 540 540 540 900 1740 1740
50 0.08 0.29 0.69 1.12 1.67 2.22 2.77 3.37 4.00 4.67 5.35 7.47 9.72 13.29 18.73 25.82 150 180 210 210 270 270 270 300 330 330 330 540 600 900 1740 1740
60 0.08 0.30 0.71 1.24 1.79 2.40 3.01 3.67 4.34 5.01 5.68 7.47 10.52 14.42 19.04 25.89 150 180 210 270 270 300 300 330 330 330 330 540 900 960 1680 1680
70 0.08 0.30 0.79 1.36 1.97 2.58 3.26 3.93 4.60 5.27 5.95 7.70 11.61 15.52 19.43 26.18 150 240 270 300 300 330 330 330 330 330 330 960 960 960 960 1680
80 0.08 0.36 0.88 1.49 2.11 2.78 3.45 4.13 4.80 5.47 6.14 8.72 12.63 16.54 20.45 26.42 150 240 300 300 330 330 330 330 330 330 330 960 960 960 960 1680
90 0.11 0.40 0.98 1.59 2.26 2.93 3.60 4.27 4.94 5.62 6.29 9.66 13.57 17.48 21.39 26.64 240 240 300 300 330 330 330 330 330 330 330 960 960 960 960 1680
100 0.13 0.44 1.05 1.69 2.36 3.04 3.71 4.38 5.05 5.73 6.61 10.52 14.43 18.35 22.26 27.10 240 300 300 330 330 330 330 330 330 330 960 960 960 960 960 1320
Hydrologic Design Tables 287

03246200 East Fork Little Miami River near Marathon, Ohio—Continued
Pumpset
Ratio of storage required for pump set to storage required for the primary pump relation (pump set 1) for indicated demand (in fraction of mean
annual streamflow)
0.002 0.010 0.020 0.050 0.100 0.200 0.300
1 1.00 1.00 1.00 1.00 1.00 1.00 1.00
2 2.00 1.51 1.41 1.47 1.79 6.02 10.41
3 1.33 1.21 1.18 1.10 1.06 1.25 1.37
4 1.16 1.07 1.10 1.06 1.04 1.01 1.11
5 1.04 1.03 1.05 1.03 1.02 1.00 1.00
6 1.00 1.01 1.02 1.02 1.01 1.00 1.00
7 1.99 1.57 1.52 1.66 4.72 12.37 18.81
8 1.35 1.23 1.23 1.14 1.33 1.59 5.99
9 1.34 1.24 1.22 1.20 1.41 2.41 9.02
10 1.22 1.20 1.23 1.20 1.25 1.65 5.96
11 1.19 1.17 1.21 1.20 1.17 1.65 3.95
12 1.41 1.28 1.23 1.25 1.48 3.29 9.42
13 1.20 1.18 1.18 1.17 1.15 1.42 2.58
14 1.23 1.15 1.20 1.18 1.17 1.31 1.90
15 1.19 1.11 1.17 1.19 1.15 1.28 1.79
16 1.02 1.10 1.18 1.21 1.13 1.21 1.84
17 1.16 1.13 1.16 1.16 1.13 1.28 1.62
18 1.09 1.10 1.16 1.17 1.14 1.14 1.63
19 1.01 1.09 1.13 1.16 1.12 1.13 1.62
20 1.03 1.08 1.13 1.19 1.13 1.14 1.66
288 Hydrologic Considerations for Estimation of Storage-Capacity Requirements of Impounding and Side-Channel Reservoirs for Water Supply in Ohio

03246200 East Fork Little Miami River near Marathon, Ohio—Continued
Recurrenceinterval(years)
Normalvariate
Side-channel storage required (in demand days) for primary pump relation to meet indicated demand (in fraction of mean annual streamflow)
0.0020 0.0100 0.0200 0.0500 0.1000 0.2000 0.3000
73.00 2.206 246.39 247.55 255.62 278.83 297.52 320.46 334.17
70.00 2.190 245.84 247.47 254.50 276.35 294.36 317.21 331.39
60.00 2.128 243.78 247.20 250.36 267.16 282.61 305.12 321.09
50.00 2.054 241.29 246.86 245.33 256.02 268.38 290.47 308.60
40.00 1.960 238.15 246.43 238.99 241.96 250.41 271.98 292.83
30.00 1.834 232.71 233.20 230.32 235.71 240.58 257.61 284.36
25.00 1.751 228.74 220.66 224.54 235.40 238.40 251.28 282.61
20.00 1.645 223.97 216.73 221.52 226.62 235.42 243.23 262.14
10.00 1.282 189.36 171.42 163.35 171.67 206.15 227.09 240.60
5.00 0.841 169.69 141.96 145.19 146.42 158.99 187.92 209.67
2.03 0.017 123.97 82.80 81.99 88.72 98.78 119.32 140.55
Hydrologic Design Tables 289

03246500 East Fork Little Miami River at Williamsburg, Ohio
Location: Latitude 39°03′09″, longitude 84°03′02″, Clermont County, Hydrologic Unit 05090202
Drainage area, in square miles: 237.
Station used for record extension: 03238500
Time period of systematic or extended record analyzed: 1924-10-01 to 1997-09-18
Percentage of estimated values in extended record: 74.5
Eighty-percent-duration streamflow, in cubic feet per second: 5.5
Mean annual streamflow, in inches: 16.33
Location of station used for precipitation data: Hillsboro, Ohio
Location of station used for potential evapotranspiration data: Covington, Kentucy
[–, indicates a value that could not be determined because there were too few average low-flow values less than the mean stream-flow for the indicated duration]
Recurrenceinterval(years)
Extreme-value
variate
Minimum runoff (in inches) for indicated duration (in days)
180 360 540 720 1080 1440 1800
73.00 4.28 0.06 1.58 5.88 12.18 23.54 38.90 53.49
70.00 4.24 0.06 1.66 5.91 12.25 23.72 39.05 53.56
60.00 4.09 0.06 1.94 6.02 12.52 24.40 39.62 53.83
50.00 3.90 0.07 2.28 6.16 12.83 25.21 40.29 54.15
40.00 3.68 0.07 2.69 6.32 13.22 26.19 41.11 54.54
30.00 3.38 0.07 2.98 6.42 13.98 28.03 41.65 55.78
25.00 3.20 0.07 3.08 6.45 14.54 29.37 41.83 56.79
20.00 2.97 0.10 3.45 7.56 15.41 29.96 44.91 57.07
10.00 2.25 0.30 5.67 10.54 18.60 35.39 53.25 75.08
5.21 1.55 0.64 7.43 14.88 23.49 48.01 – –
290 Hydrologic Considerations for Estimation of Storage-Capacity Requirements of Impounding and Side-Channel Reservoirs for Water Supply in Ohio
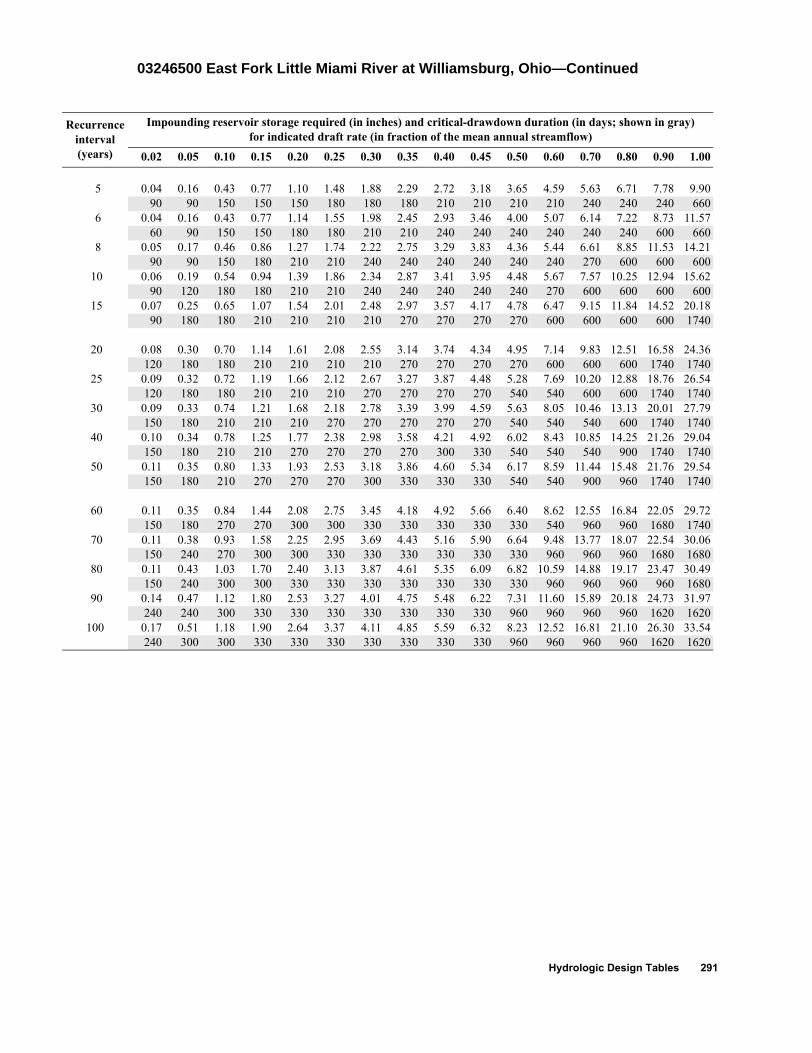
03246500 East Fork Little Miami River at Williamsburg, Ohio—Continued
Recurrenceinterval(years)
Impounding reservoir storage required (in inches) and critical-drawdown duration (in days; shown in gray) for indicated draft rate (in fraction of the mean annual streamflow)
0.02 0.05 0.10 0.15 0.20 0.25 0.30 0.35 0.40 0.45 0.50 0.60 0.70 0.80 0.90 1.00
5 0.04 0.16 0.43 0.77 1.10 1.48 1.88 2.29 2.72 3.18 3.65 4.59 5.63 6.71 7.78 9.90 90 90 150 150 150 180 180 180 210 210 210 210 240 240 240 660
6 0.04 0.16 0.43 0.77 1.14 1.55 1.98 2.45 2.93 3.46 4.00 5.07 6.14 7.22 8.73 11.57 60 90 150 150 180 180 210 210 240 240 240 240 240 240 600 660
8 0.05 0.17 0.46 0.86 1.27 1.74 2.22 2.75 3.29 3.83 4.36 5.44 6.61 8.85 11.53 14.21 90 90 150 180 210 210 240 240 240 240 240 240 270 600 600 600
10 0.06 0.19 0.54 0.94 1.39 1.86 2.34 2.87 3.41 3.95 4.48 5.67 7.57 10.25 12.94 15.62 90 120 180 180 210 210 240 240 240 240 240 270 600 600 600 600
15 0.07 0.25 0.65 1.07 1.54 2.01 2.48 2.97 3.57 4.17 4.78 6.47 9.15 11.84 14.52 20.18 90 180 180 210 210 210 210 270 270 270 270 600 600 600 600 1740
20 0.08 0.30 0.70 1.14 1.61 2.08 2.55 3.14 3.74 4.34 4.95 7.14 9.83 12.51 16.58 24.36 120 180 180 210 210 210 210 270 270 270 270 600 600 600 1740 1740
25 0.09 0.32 0.72 1.19 1.66 2.12 2.67 3.27 3.87 4.48 5.28 7.69 10.20 12.88 18.76 26.54 120 180 180 210 210 210 270 270 270 270 540 540 600 600 1740 1740
30 0.09 0.33 0.74 1.21 1.68 2.18 2.78 3.39 3.99 4.59 5.63 8.05 10.46 13.13 20.01 27.79 150 180 210 210 210 270 270 270 270 270 540 540 540 600 1740 1740
40 0.10 0.34 0.78 1.25 1.77 2.38 2.98 3.58 4.21 4.92 6.02 8.43 10.85 14.25 21.26 29.04 150 180 210 210 270 270 270 270 300 330 540 540 540 900 1740 1740
50 0.11 0.35 0.80 1.33 1.93 2.53 3.18 3.86 4.60 5.34 6.17 8.59 11.44 15.48 21.76 29.54 150 180 210 270 270 270 300 330 330 330 540 540 900 960 1740 1740
60 0.11 0.35 0.84 1.44 2.08 2.75 3.45 4.18 4.92 5.66 6.40 8.62 12.55 16.84 22.05 29.72 150 180 270 270 300 300 330 330 330 330 330 540 960 960 1680 1740
70 0.11 0.38 0.93 1.58 2.25 2.95 3.69 4.43 5.16 5.90 6.64 9.48 13.77 18.07 22.54 30.06 150 240 270 300 300 330 330 330 330 330 330 960 960 960 1680 1680
80 0.11 0.43 1.03 1.70 2.40 3.13 3.87 4.61 5.35 6.09 6.82 10.59 14.88 19.17 23.47 30.49 150 240 300 300 330 330 330 330 330 330 330 960 960 960 960 1680
90 0.14 0.47 1.12 1.80 2.53 3.27 4.01 4.75 5.48 6.22 7.31 11.60 15.89 20.18 24.73 31.97 240 240 300 330 330 330 330 330 330 330 960 960 960 960 1620 1620
100 0.17 0.51 1.18 1.90 2.64 3.37 4.11 4.85 5.59 6.32 8.23 12.52 16.81 21.10 26.30 33.54 240 300 300 330 330 330 330 330 330 330 960 960 960 960 1620 1620
Hydrologic Design Tables 291
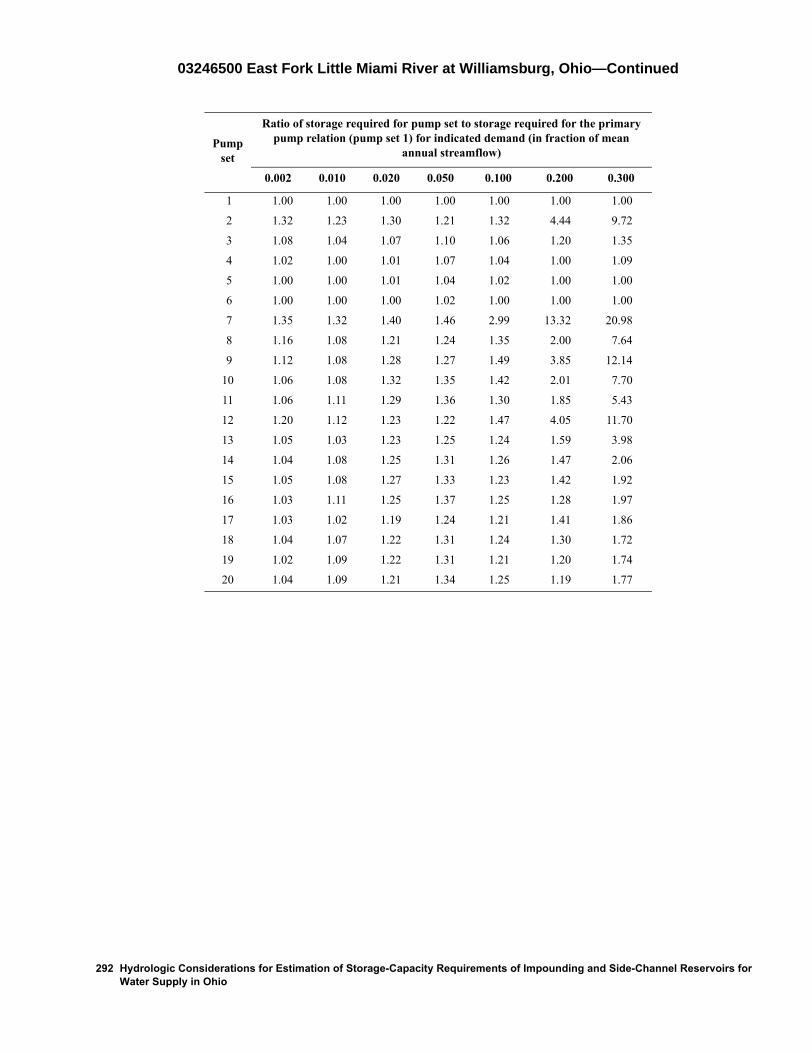
03246500 East Fork Little Miami River at Williamsburg, Ohio—Continued
Pumpset
Ratio of storage required for pump set to storage required for the primary pump relation (pump set 1) for indicated demand (in fraction of mean
annual streamflow)
0.002 0.010 0.020 0.050 0.100 0.200 0.300
1 1.00 1.00 1.00 1.00 1.00 1.00 1.00
2 1.32 1.23 1.30 1.21 1.32 4.44 9.72
3 1.08 1.04 1.07 1.10 1.06 1.20 1.35
4 1.02 1.00 1.01 1.07 1.04 1.00 1.09
5 1.00 1.00 1.01 1.04 1.02 1.00 1.00
6 1.00 1.00 1.00 1.02 1.00 1.00 1.00
7 1.35 1.32 1.40 1.46 2.99 13.32 20.98
8 1.16 1.08 1.21 1.24 1.35 2.00 7.64
9 1.12 1.08 1.28 1.27 1.49 3.85 12.14
10 1.06 1.08 1.32 1.35 1.42 2.01 7.70
11 1.06 1.11 1.29 1.36 1.30 1.85 5.43
12 1.20 1.12 1.23 1.22 1.47 4.05 11.70
13 1.05 1.03 1.23 1.25 1.24 1.59 3.98
14 1.04 1.08 1.25 1.31 1.26 1.47 2.06
15 1.05 1.08 1.27 1.33 1.23 1.42 1.92
16 1.03 1.11 1.25 1.37 1.25 1.28 1.97
17 1.03 1.02 1.19 1.24 1.21 1.41 1.86
18 1.04 1.07 1.22 1.31 1.24 1.30 1.72
19 1.02 1.09 1.22 1.31 1.21 1.20 1.74
20 1.04 1.09 1.21 1.34 1.25 1.19 1.77
292 Hydrologic Considerations for Estimation of Storage-Capacity Requirements of Impounding and Side-Channel Reservoirs for Water Supply in Ohio

03246500 East Fork Little Miami River at Williamsburg, Ohio—Continued
Recurrenceinterval(years)
Normalvariate
Side-channel storage required (in demand days) for primary pump relation to meet indicated demand (in fraction of mean annual streamflow)
0.0020 0.0100 0.0200 0.0500 0.1000 0.2000 0.3000
73.00 2.206 225.86 218.63 216.95 245.58 277.14 307.34 325.63
70.00 2.190 224.86 216.55 215.59 244.06 274.18 304.23 322.93
60.00 2.128 221.13 208.81 210.53 238.41 263.20 292.69 312.89
50.00 2.054 216.61 199.44 204.40 231.56 249.88 278.69 300.73
40.00 1.960 210.90 187.60 196.67 222.92 233.08 261.03 285.38
30.00 1.834 206.33 174.13 191.36 214.07 225.09 248.22 277.10
25.00 1.751 204.24 165.97 189.40 209.06 224.21 243.06 275.35
20.00 1.645 192.46 154.00 178.09 206.30 223.13 235.71 255.87
10.00 1.282 164.43 139.40 138.57 139.35 185.85 216.31 234.31
5.00 0.841 138.23 113.78 114.05 130.95 146.33 177.10 201.89
2.03 0.017 93.48 64.63 62.76 73.04 82.22 108.35 131.68
Hydrologic Design Tables 293

03247050 East Fork Little Miami River near Batavia, Ohio
Location: Latitude 39°03′36″, longitude 84°10′32″, Clermont County, Hydrologic Unit 05090202
Drainage area, in square miles: 352.
Station used for record extension: 03246500
Time period of systematic or extended record analyzed: 1924-10-01 to 1997-09-18
Percentage of estimated values in extended record: 84.6
Eighty-percent-duration streamflow, in cubic feet per second: 18.
Mean annual streamflow, in inches: 15.61
Location of station used for precipitation data: Hillsboro, Ohio
Location of station used for potential evapotranspiration data: Covington, Kentucy
[–, indicates a value that could not be determined because there were too few average low-flow values less than the mean stream-flow for the indicated duration]
Recurrenceinterval(years)
Extreme-value
variate
Minimum runoff (in inches) for indicated duration (in days)
180 360 540 720 1080 1440 1800
73.00 4.28 0.07 1.64 6.23 12.51 24.03 38.88 53.01
70.00 4.24 0.07 1.72 6.25 12.59 24.15 39.03 53.12
60.00 4.09 0.07 2.04 6.33 12.89 24.61 39.59 53.52
50.00 3.90 0.07 2.40 6.42 13.24 25.15 40.26 54.00
40.00 3.68 0.07 2.85 6.52 13.67 25.81 41.07 54.58
30.00 3.38 0.07 3.18 6.67 13.88 27.42 42.55 54.87
25.00 3.20 0.08 3.30 6.77 13.91 28.67 43.62 54.92
20.00 2.97 0.11 3.63 7.30 15.14 29.40 43.80 55.36
10.00 2.25 0.32 5.87 11.20 19.15 34.09 51.25 70.82
5.21 1.55 0.69 7.79 14.70 23.38 45.21 – –
294 Hydrologic Considerations for Estimation of Storage-Capacity Requirements of Impounding and Side-Channel Reservoirs for Water Supply in Ohio

03247050 East Fork Little Miami River near Batavia, Ohio—Continued
Recurrenceinterval(years)
Impounding reservoir storage required (in inches) and critical-drawdown duration (in days; shown in gray) for indicated draft rate (in fraction of the mean annual streamflow)
0.02 0.05 0.10 0.15 0.20 0.25 0.30 0.35 0.40 0.45 0.50 0.60 0.70 0.80 0.90 1.00
5 0.03 0.14 0.38 0.70 1.02 1.34 1.67 2.06 2.44 2.83 3.28 4.18 5.08 6.07 7.10 8.73 60 90 150 150 150 150 180 180 180 210 210 210 210 240 240 660
6 0.04 0.15 0.38 0.70 1.02 1.39 1.78 2.19 2.64 3.09 3.57 4.60 5.62 6.65 7.93 10.50 60 90 150 150 150 180 180 210 210 210 240 240 240 240 600 600
8 0.04 0.15 0.41 0.77 1.16 1.57 2.02 2.46 2.97 3.48 3.99 5.02 6.05 7.60 10.16 12.72 60 90 150 180 180 210 210 210 240 240 240 240 240 600 600 600
10 0.05 0.17 0.48 0.87 1.26 1.71 2.16 2.61 3.12 3.63 4.14 5.17 6.33 8.88 11.45 14.10 90 120 180 180 210 210 210 210 240 240 240 270 270 600 600 1320
15 0.06 0.21 0.60 0.98 1.43 1.88 2.33 2.78 3.24 3.82 4.39 5.55 7.99 10.55 13.12 18.05 90 180 180 180 210 210 210 210 270 270 270 270 600 600 600 1320
20 0.07 0.26 0.65 1.06 1.51 1.96 2.41 2.87 3.45 4.02 4.60 6.37 8.81 11.38 14.08 21.51 120 180 180 210 210 210 210 270 270 270 270 540 600 600 1740 1740
25 0.08 0.29 0.67 1.10 1.55 2.00 2.45 3.03 3.61 4.18 4.76 6.97 9.30 11.87 16.01 23.44 120 180 180 210 210 210 270 270 270 270 270 540 600 600 1740 1740
30 0.08 0.30 0.69 1.13 1.58 2.03 2.58 3.16 3.74 4.31 5.03 7.33 9.64 12.19 17.14 24.58 150 180 180 210 210 210 270 270 270 270 540 540 540 600 1740 1740
40 0.09 0.32 0.72 1.17 1.64 2.21 2.79 3.37 3.94 4.52 5.39 7.70 10.02 12.59 18.27 25.71 150 180 210 210 270 270 270 270 270 270 540 540 600 900 1740 1740
50 0.10 0.32 0.75 1.22 1.79 2.37 2.95 3.57 4.24 4.95 5.65 7.80 10.24 13.71 18.72 26.12 150 180 210 270 270 270 270 300 330 330 330 540 600 900 1680 1740
60 0.10 0.32 0.77 1.34 1.91 2.55 3.19 3.88 4.59 5.29 6.00 7.82 10.78 14.80 19.20 26.38 150 180 240 270 270 300 300 330 330 330 330 600 900 960 1680 1680
70 0.10 0.34 0.85 1.46 2.10 2.74 3.44 4.15 4.85 5.56 6.26 7.91 11.86 15.96 20.06 26.72 150 240 240 300 300 300 330 330 330 330 330 600 960 960 960 1680
80 0.10 0.40 0.95 1.59 2.23 2.94 3.64 4.35 5.05 5.76 6.46 8.81 12.92 17.02 21.12 26.98 150 240 300 300 300 330 330 330 330 330 330 960 960 960 960 1680
90 0.13 0.43 1.05 1.69 2.38 3.08 3.79 4.49 5.20 5.90 6.61 9.78 13.89 17.99 22.09 27.19 240 240 300 300 330 330 330 330 330 330 330 960 960 960 960 1680
100 0.15 0.47 1.11 1.78 2.49 3.19 3.90 4.60 5.31 6.01 6.72 10.67 14.78 18.88 22.98 27.71 240 300 300 330 330 330 330 330 330 330 330 960 960 960 960 1380
Hydrologic Design Tables 295

03247050 East Fork Little Miami River near Batavia, Ohio—Continued
Pumpset
Ratio of storage required for pump set to storage required for the primary pump relation (pump set 1) for indicated demand (in fraction of mean
annual streamflow)
0.002 0.010 0.020 0.050 0.100 0.200 0.300
1 1.00 1.00 1.00 1.00 1.00 1.00 1.00
2 1.67 1.41 1.36 1.31 1.45 5.00 9.60
3 1.18 1.13 1.17 1.10 1.07 1.22 1.36
4 1.03 1.02 1.09 1.07 1.05 1.01 1.08
5 1.02 1.01 1.04 1.03 1.03 1.00 1.00
6 1.01 1.00 1.02 1.02 1.01 1.00 1.00
7 1.67 1.42 1.39 1.59 3.57 12.01 19.06
8 1.23 1.20 1.27 1.15 1.33 1.56 5.76
9 1.21 1.21 1.30 1.21 1.41 2.62 8.96
10 1.24 1.18 1.29 1.24 1.28 1.64 5.14
11 1.12 1.16 1.29 1.26 1.22 1.61 3.05
12 1.28 1.24 1.27 1.20 1.48 3.12 9.35
13 1.14 1.12 1.25 1.18 1.19 1.44 2.38
14 1.04 1.10 1.22 1.21 1.20 1.32 1.77
15 1.05 1.09 1.25 1.23 1.18 1.31 1.65
16 1.03 1.09 1.24 1.24 1.18 1.20 1.68
17 1.04 1.06 1.21 1.17 1.17 1.30 1.58
18 1.04 1.07 1.19 1.21 1.18 1.15 1.56
19 1.03 1.07 1.20 1.22 1.16 1.14 1.44
20 1.03 1.05 1.19 1.23 1.18 1.16 1.50
296 Hydrologic Considerations for Estimation of Storage-Capacity Requirements of Impounding and Side-Channel Reservoirs for Water Supply in Ohio

03247050 East Fork Little Miami River near Batavia, Ohio—Continued
Recurrenceinterval(years)
Normalvariate
Side-channel storage required (in demand days) for primary pump relation to meet indicated demand (in fraction of mean annual streamflow)
0.0020 0.0100 0.0200 0.0500 0.1000 0.2000 0.3000
73.00 2.206 234.33 236.09 235.28 267.65 287.41 312.67 328.65
70.00 2.190 233.26 234.46 234.94 265.47 284.37 309.44 325.67
60.00 2.128 229.27 228.41 233.67 257.39 273.10 297.46 314.62
50.00 2.054 224.43 221.08 232.14 247.58 259.44 282.95 301.23
40.00 1.960 218.33 211.83 230.20 235.21 242.19 264.62 284.32
30.00 1.834 215.39 203.32 219.64 228.46 233.52 251.84 276.51
25.00 1.751 215.02 198.89 210.27 226.98 232.16 246.97 275.84
20.00 1.645 208.94 190.82 207.30 218.65 230.46 239.33 258.24
10.00 1.282 171.68 152.32 148.37 162.91 196.97 221.93 237.64
5.00 0.841 150.10 128.42 134.26 141.41 154.16 178.43 197.11
2.03 0.017 112.06 77.36 74.97 81.91 91.31 110.85 130.26
Hydrologic Design Tables 297

03247500 East Fork Little Miami River at Perintown, Ohio
Location: Latitude 39°08′13″, longitude 84°14′17″, Clermont County, Hydrologic Unit 05090202
Drainage area, in square miles: 476.
Station used for record extension: 03238500
Time period of systematic or extended record analyzed: 1924-10-01 to 1997-09-18
Percentage of estimated values in extended record: 66.4
Eighty-percent-duration streamflow, in cubic feet per second: 14.
Mean annual streamflow, in inches: 16.33
Location of station used for precipitation data: Hillsboro, Ohio
Location of station used for potential evapotranspiration data: Covington, Kentucy
[–, indicates a value that could not be determined because there were too few average low-flow values less than the mean stream-flow for the indicated duration]
Recurrenceinterval(years)
Extreme-value
variate
Minimum runoff (in inches) for indicated duration (in days)
180 360 540 720 1080 1440 1800
73.00 4.28 0.06 1.04 6.09 13.22 25.08 40.47 51.91
70.00 4.24 0.06 1.17 6.10 13.24 25.10 40.51 52.09
60.00 4.09 0.07 1.66 6.12 13.32 25.17 40.65 52.77
50.00 3.90 0.08 2.23 6.14 13.41 25.25 40.81 53.56
40.00 3.68 0.09 2.94 6.17 13.51 25.36 41.02 54.54
30.00 3.38 0.11 3.25 6.40 14.15 27.17 42.73 56.12
25.00 3.20 0.12 3.28 6.60 14.70 28.81 44.25 57.23
20.00 2.97 0.13 4.02 6.68 15.34 29.71 45.43 57.51
10.00 2.25 0.24 6.53 10.36 19.46 35.64 52.35 75.78
5.21 1.55 0.61 7.86 14.30 23.94 47.39 – –
298 Hydrologic Considerations for Estimation of Storage-Capacity Requirements of Impounding and Side-Channel Reservoirs for Water Supply in Ohio

03247500 East Fork Little Miami River at Perintown, Ohio—Continued
Recurrenceinterval(years)
Impounding reservoir storage required (in inches) and critical-drawdown duration (in days; shown in gray) for indicated draft rate (in fraction of the mean annual streamflow)
0.02 0.05 0.10 0.15 0.20 0.25 0.30 0.35 0.40 0.45 0.50 0.60 0.70 0.80 0.90 1.00
5 0.03 0.14 0.39 0.66 0.98 1.33 1.74 2.14 2.54 2.94 3.35 4.24 5.18 6.30 7.51 9.86 60 90 120 120 150 180 180 180 180 180 180 210 240 270 270 660
6 0.03 0.15 0.42 0.75 1.12 1.53 1.93 2.36 2.83 3.30 3.81 4.88 5.95 7.11 8.31 11.08 60 90 150 150 180 180 180 210 210 210 240 240 240 270 270 660
8 0.04 0.17 0.51 0.89 1.30 1.77 2.24 2.72 3.25 3.79 4.33 5.41 6.61 8.14 10.82 13.50 90 150 150 180 210 210 210 240 240 240 240 270 270 600 600 600
10 0.05 0.21 0.57 0.97 1.44 1.91 2.38 2.88 3.42 3.95 4.52 5.72 7.09 9.77 12.45 15.71 90 150 180 210 210 210 210 240 240 240 270 270 600 600 600 1020
15 0.06 0.25 0.64 1.10 1.57 2.04 2.51 3.07 3.67 4.27 4.88 6.66 9.35 12.03 14.71 20.69 90 150 180 210 210 210 210 270 270 270 270 600 600 600 1320 1740
20 0.07 0.27 0.68 1.15 1.62 2.09 2.65 3.26 3.86 4.46 5.10 7.79 10.47 13.15 16.56 23.66 120 180 210 210 210 210 270 270 270 270 600 600 600 600 1320 1740
25 0.07 0.29 0.71 1.18 1.65 2.19 2.79 3.40 4.00 4.60 5.74 8.42 11.10 13.78 17.50 25.02 150 180 210 210 210 270 270 270 270 270 600 600 600 600 1320 1740
30 0.08 0.30 0.74 1.21 1.70 2.30 2.91 3.51 4.11 4.82 6.11 8.80 11.48 14.16 18.11 25.83 150 180 210 210 270 270 270 270 270 540 600 600 600 600 1320 1740
40 0.08 0.32 0.78 1.28 1.88 2.49 3.09 3.78 4.51 5.25 6.46 9.14 11.83 14.51 19.27 27.04 150 180 210 270 270 270 270 330 330 330 600 600 600 600 1740 1740
50 0.08 0.34 0.81 1.41 2.02 2.70 3.43 4.17 4.91 5.65 6.52 9.21 11.89 15.55 20.51 28.29 180 210 270 270 270 330 330 330 330 330 600 600 600 960 1740 1740
60 0.09 0.36 0.91 1.54 2.24 2.98 3.71 4.45 5.19 5.93 6.66 9.21 12.18 16.47 21.94 29.72 180 210 270 300 330 330 330 330 330 330 330 600 960 960 1740 1740
70 0.10 0.41 1.02 1.70 2.44 3.17 3.91 4.65 5.39 6.12 6.89 9.21 12.98 17.27 23.53 31.31 210 240 300 330 330 330 330 330 330 330 360 600 960 960 1740 1740
80 0.14 0.46 1.13 1.84 2.58 3.31 4.05 4.79 5.53 6.32 7.12 9.40 13.69 17.98 25.23 33.01 240 240 300 330 330 330 330 330 330 360 360 960 960 960 1740 1740
90 0.17 0.53 1.20 1.94 2.68 3.41 4.15 4.89 5.70 6.50 7.31 10.04 14.33 19.22 27.00 34.77 240 300 330 330 330 330 330 360 360 360 360 960 960 1740 1740 1740
100 0.19 0.57 1.27 2.01 2.75 3.48 4.23 5.03 5.84 6.64 7.45 10.62 14.92 21.01 28.79 36.57 240 300 330 330 330 330 360 360 360 360 360 960 960 1740 1740 1740
Hydrologic Design Tables 299

03247500 East Fork Little Miami River at Perintown, Ohio—Continued
Pumpset
Ratio of storage required for pump set to storage required for the primary pump relation (pump set 1) for indicated demand (in fraction of mean
annual streamflow)
0.002 0.010 0.020 0.050 0.100 0.200 0.300
1 1.00 1.00 1.00 1.00 1.00 1.00 1.00
2 1.28 1.22 1.14 1.07 1.17 4.57 9.37
3 1.13 1.14 1.09 1.05 1.01 1.09 1.26
4 1.03 1.05 1.02 1.02 1.00 1.00 1.01
5 1.00 1.01 1.00 1.00 1.00 1.00 1.00
6 1.00 1.00 1.00 1.00 1.00 1.00 1.00
7 1.31 1.29 1.21 1.25 3.08 12.47 19.55
8 1.15 1.24 1.17 1.13 1.18 1.70 6.72
9 1.18 1.27 1.20 1.15 1.31 3.32 10.53
10 1.14 1.26 1.19 1.16 1.23 1.70 6.03
11 1.12 1.25 1.25 1.17 1.18 1.58 3.87
12 1.19 1.25 1.18 1.12 1.29 3.98 10.60
13 1.12 1.21 1.15 1.13 1.12 1.38 3.00
14 1.08 1.19 1.17 1.15 1.14 1.28 1.78
15 1.05 1.15 1.20 1.15 1.18 1.23 1.68
16 1.02 1.17 1.19 1.19 1.20 1.17 1.74
17 1.06 1.17 1.14 1.13 1.12 1.24 1.61
18 1.03 1.15 1.15 1.14 1.14 1.12 1.50
19 1.01 1.15 1.16 1.15 1.18 1.12 1.48
20 1.02 1.17 1.17 1.19 1.20 1.13 1.56
300 Hydrologic Considerations for Estimation of Storage-Capacity Requirements of Impounding and Side-Channel Reservoirs for Water Supply in Ohio

03247500 East Fork Little Miami River at Perintown, Ohio—Continued
Recurrenceinterval(years)
Normalvariate
Side-channel storage required (in demand days) for primary pump relation to meet indicated demand (in fraction of mean annual streamflow)
0.0020 0.0100 0.0200 0.0500 0.1000 0.2000 0.3000
73.00 2.206 227.32 245.36 267.38 294.56 316.30 338.46 346.76
70.00 2.190 226.20 243.24 263.93 290.57 311.44 336.45 345.90
60.00 2.128 222.06 235.38 251.10 275.73 293.40 329.00 342.71
50.00 2.054 217.04 225.85 235.55 257.76 271.54 319.97 338.83
40.00 1.960 210.70 213.82 215.92 235.07 243.94 308.57 333.95
30.00 1.834 203.74 199.29 204.64 223.52 232.20 286.18 309.23
25.00 1.751 199.62 190.18 201.74 221.61 232.09 269.27 287.43
20.00 1.645 194.43 182.34 199.12 215.38 229.77 252.51 266.93
10.00 1.282 176.34 157.30 170.29 181.33 206.93 233.10 240.67
5.00 0.841 145.08 118.53 120.55 133.41 157.33 174.65 206.86
2.03 0.017 111.35 70.60 72.36 80.97 92.59 119.86 141.51
Hydrologic Design Tables 301
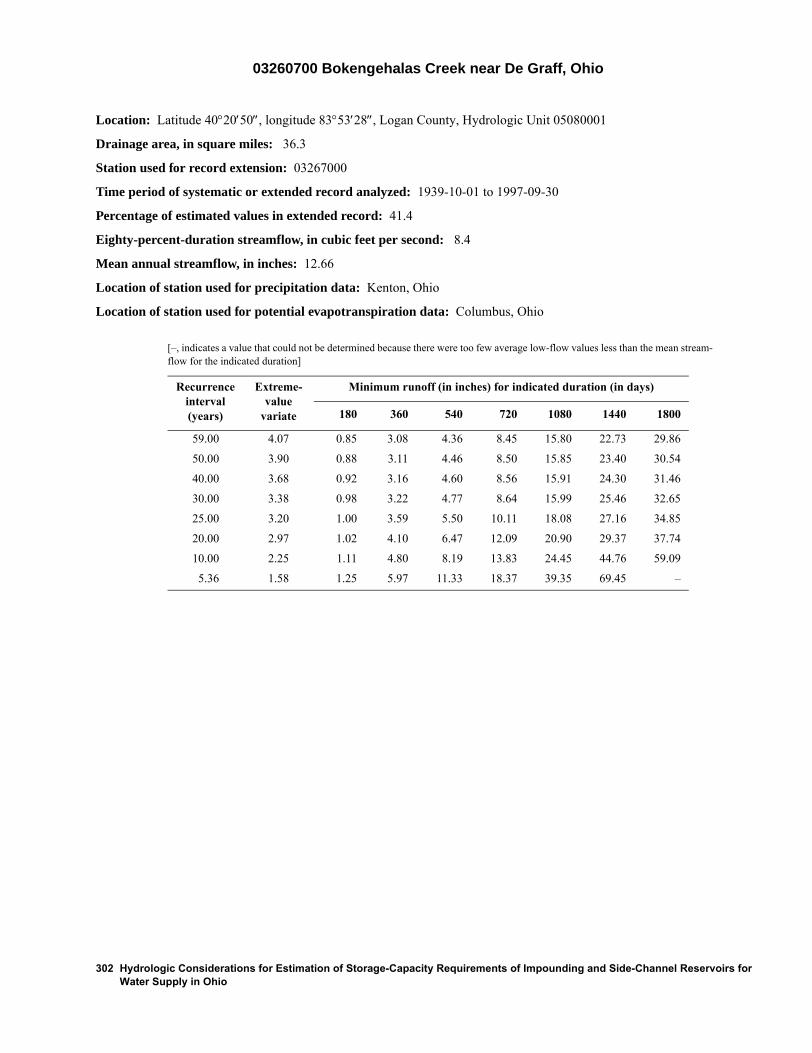
03260700 Bokengehalas Creek near De Graff, Ohio
Location: Latitude 40°20′50″, longitude 83°53′28″, Logan County, Hydrologic Unit 05080001
Drainage area, in square miles: 36.3
Station used for record extension: 03267000
Time period of systematic or extended record analyzed: 1939-10-01 to 1997-09-30
Percentage of estimated values in extended record: 41.4
Eighty-percent-duration streamflow, in cubic feet per second: 8.4
Mean annual streamflow, in inches: 12.66
Location of station used for precipitation data: Kenton, Ohio
Location of station used for potential evapotranspiration data: Columbus, Ohio
[–, indicates a value that could not be determined because there were too few average low-flow values less than the mean stream-flow for the indicated duration]
Recurrenceinterval(years)
Extreme-value
variate
Minimum runoff (in inches) for indicated duration (in days)
180 360 540 720 1080 1440 1800
59.00 4.07 0.85 3.08 4.36 8.45 15.80 22.73 29.86
50.00 3.90 0.88 3.11 4.46 8.50 15.85 23.40 30.54
40.00 3.68 0.92 3.16 4.60 8.56 15.91 24.30 31.46
30.00 3.38 0.98 3.22 4.77 8.64 15.99 25.46 32.65
25.00 3.20 1.00 3.59 5.50 10.11 18.08 27.16 34.85
20.00 2.97 1.02 4.10 6.47 12.09 20.90 29.37 37.74
10.00 2.25 1.11 4.80 8.19 13.83 24.45 44.76 59.09
5.36 1.58 1.25 5.97 11.33 18.37 39.35 69.45 –
302 Hydrologic Considerations for Estimation of Storage-Capacity Requirements of Impounding and Side-Channel Reservoirs for Water Supply in Ohio

03260700 Bokengehalas Creek near De Graff, Ohio—Continued
Recurrenceinterval(years)
Impounding reservoir storage required (in inches) and critical-drawdown duration (in days; shown in gray) for indicated draft rate (in fraction of the mean annual streamflow)
0.02 0.05 0.10 0.15 0.20 0.25 0.30 0.35 0.40 0.45 0.50 0.60 0.70 0.80 0.90 1.00
5 0.00 0.00 0.00 0.01 0.12 0.33 0.59 0.90 1.28 1.75 2.21 3.15 4.08 5.09 6.18 8.26 0 0 0 30 120 150 180 180 270 270 270 270 270 300 600 600
6 0.00 0.00 0.00 0.01 0.14 0.37 0.66 0.97 1.37 1.80 2.27 3.20 4.21 5.25 6.74 9.00 0 0 0 30 120 150 180 180 240 270 270 270 300 300 600 660
8 0.00 0.00 0.00 0.02 0.16 0.43 0.74 1.11 1.52 1.94 2.36 3.38 4.42 5.84 8.11 10.40 0 0 0 30 150 180 210 240 240 240 270 300 300 540 660 660
10 0.00 0.00 0.00 0.02 0.18 0.47 0.82 1.19 1.61 2.03 2.47 3.51 4.90 6.80 9.08 11.61 0 0 0 30 150 180 210 240 240 240 300 300 540 600 660 1020
15 0.00 0.00 0.00 0.03 0.22 0.54 0.90 1.31 1.72 2.16 2.68 4.44 6.43 8.93 13.44 18.23 0 0 0 30 150 210 210 240 240 300 300 540 600 900 1380 1380
20 0.00 0.00 0.00 0.04 0.24 0.58 0.95 1.37 1.78 2.44 3.37 5.38 7.94 12.04 16.83 22.86 0 0 0 60 150 210 240 240 240 540 540 600 900 1320 1740 1740
25 0.00 0.00 0.00 0.05 0.26 0.61 0.99 1.41 2.01 2.95 3.96 6.13 9.30 15.20 21.23 27.26 0 0 0 60 150 210 240 240 540 540 600 900 1320 1740 1740 1740
30 0.00 0.00 0.00 0.06 0.28 0.63 1.02 1.44 2.36 3.37 4.41 7.00 11.93 17.96 23.99 30.02 0 0 0 60 150 210 240 270 540 600 600 900 1740 1740 1740 1740
40 0.00 0.00 0.00 0.07 0.32 0.67 1.08 1.86 2.84 3.88 4.92 8.70 14.74 20.77 26.80 32.83 0 0 30 60 150 210 270 540 600 600 600 1740 1740 1740 1740 1740
50 0.00 0.00 0.01 0.11 0.36 0.71 1.18 2.11 3.08 4.12 5.43 9.50 15.53 21.57 27.60 33.63 0 0 30 120 150 210 540 540 600 600 900 1740 1740 1740 1740 1740
60 0.00 0.00 0.01 0.15 0.40 0.75 1.32 2.26 3.19 4.22 5.72 9.50 15.53 21.57 27.60 33.63 0 0 30 120 180 210 540 540 540 600 960 1740 1740 1740 1740 1740
70 0.00 0.00 0.02 0.19 0.43 0.80 1.40 2.34 3.27 4.23 5.87 9.50 15.53 21.57 27.60 33.63 0 0 30 120 180 270 540 540 540 900 960 1740 1740 1740 1740 1740
80 0.00 0.00 0.03 0.22 0.47 0.85 1.44 2.38 3.32 4.25 5.90 9.50 15.53 21.57 27.60 33.63 0 0 90 120 180 270 540 540 540 540 960 1740 1740 1740 1740 1740
90 0.00 0.00 0.06 0.25 0.51 0.88 1.46 2.39 3.33 4.26 5.90 9.69 15.53 21.57 27.60 33.63 0 0 90 120 210 270 540 540 540 540 960 1320 1740 1740 1740 1740
100 0.00 0.00 0.08 0.28 0.54 0.91 1.46 2.39 3.33 4.26 5.90 9.89 15.53 21.57 27.60 33.63 0 0 90 120 210 270 540 540 540 540 960 1320 1740 1740 1740 1740
Hydrologic Design Tables 303

03260700 Bokengehalas Creek near De Graff, Ohio—Continued
Pumpset
Ratio of storage required for pump set to storage required for the primary pump relation (pump set 1) for indicated demand (in fraction of mean
annual streamflow)
0.002 0.010 0.020 0.050 0.100 0.200 0.300
1 1.00 1.00 1.00 1.00 1.00 1.00 1.00
2 3.99 3.09 2.85 2.90 2.10 3.16 4.05
3 1.76 1.58 1.58 1.75 1.26 1.42 1.42
4 1.27 1.15 1.08 1.39 1.15 1.11 1.18
5 1.11 1.11 1.04 1.19 1.09 1.03 1.06
6 1.00 1.05 1.02 1.03 1.04 1.02 1.02
7 3.99 3.35 3.14 3.36 3.16 6.24 11.30
8 1.78 1.63 1.81 2.05 1.49 2.06 3.43
9 1.77 1.67 1.79 2.08 1.85 2.36 4.79
10 1.41 1.21 1.51 2.04 1.82 2.45 4.68
11 1.31 1.28 1.40 2.12 1.88 2.49 6.01
12 1.89 2.00 1.99 2.23 1.74 2.30 3.94
13 1.41 1.25 1.34 1.91 1.55 1.97 3.35
14 1.28 1.18 1.14 1.89 1.62 2.16 3.51
15 1.15 1.21 1.17 1.96 1.68 2.18 4.11
16 1.03 1.21 1.17 1.89 1.88 2.22 4.82
17 1.30 1.22 1.13 1.79 1.39 1.80 2.52
18 1.15 1.14 1.12 1.77 1.47 1.95 2.80
19 1.00 1.17 1.14 1.81 1.52 1.99 3.51
20 1.02 1.15 1.15 1.76 1.73 2.10 4.08
Recurrenceinterval(years)
Normalvariate
Side-channel storage required (in demand days) for primary pump relation to meet indicated demand (in fraction of mean annual streamflow)
0.0020 0.0100 0.0200 0.0500 0.1000 0.2000 0.3000
59.00 2.122 221.09 209.49 222.33 243.00 392.70 494.68 631.71
50.00 2.054 217.98 208.38 221.08 242.06 377.71 491.01 630.33
40.00 1.960 213.65 206.85 219.34 240.76 356.89 485.92 628.41
30.00 1.834 207.84 204.78 217.01 239.00 328.90 479.08 625.83
25.00 1.751 205.98 202.50 216.26 237.02 308.27 468.42 607.97
20.00 1.645 203.86 199.47 215.40 234.40 281.76 454.08 583.22
10.00 1.282 176.48 169.87 174.63 222.82 262.15 300.25 467.85
5.00 0.841 128.95 136.47 156.66 175.50 200.20 249.81 319.46
2.03 0.021 75.75 50.45 55.18 75.27 95.77 139.56 167.21
304 Hydrologic Considerations for Estimation of Storage-Capacity Requirements of Impounding and Side-Channel Reservoirs for Water Supply in Ohio

03260800 Stony Creek near De Graff, Ohio
Location: Latitude 40°17′27″, longitude 83°54′36″, Logan County, Hydrologic Unit 05080001
Drainage area, in square miles: 59.1
Station used for record extension: 03267000
Time period of systematic or extended record analyzed: 1939-10-01 to 1997-09-30
Percentage of estimated values in extended record: 68.9
Eighty-percent-duration streamflow, in cubic feet per second: 14.
Mean annual streamflow, in inches: 13.31
Location of station used for precipitation data: Kenton, Ohio
Location of station used for potential evapotranspiration data: Columbus, Ohio
[–, indicates a value that could not be determined because there were too few average low-flow values less than the mean streamflow for the indicated duration]
Recurrenceinterval(years)
Extreme-value
variate
Minimum runoff (in inches) for indicated duration (in days)
180 360 540 720 1080 1440 1800
59.00 4.07 0.82 3.49 4.96 9.43 17.37 24.86 32.47
50.00 3.90 0.89 3.54 5.10 9.48 17.40 25.53 33.19
40.00 3.68 0.99 3.60 5.28 9.55 17.44 26.44 34.17
30.00 3.38 1.11 3.69 5.53 9.63 17.50 27.62 35.43
25.00 3.20 1.13 4.01 6.10 10.73 19.29 27.99 36.08
20.00 2.97 1.14 4.44 6.85 12.21 21.72 28.40 36.87
10.00 2.25 1.29 4.98 8.19 14.33 27.59 44.94 60.61
5.36 1.58 1.39 6.42 11.81 18.51 39.19 72.56 –
Hydrologic Design Tables 305

03260800 Stony Creek near De Graff, Ohio—Continued
Recurrenceinterval(years)
Impounding reservoir storage required (in inches) and critical-drawdown duration (in days; shown in gray) for indicated draft rate (in fraction of the mean annual streamflow)
0.02 0.05 0.10 0.15 0.20 0.25 0.30 0.35 0.40 0.45 0.50 0.60 0.70 0.80 0.90 1.00
5 0.00 0.00 0.00 0.00 0.09 0.27 0.57 0.90 1.23 1.60 1.99 2.95 3.93 4.96 6.30 8.70 0 0 0 30 60 150 180 180 180 210 240 270 270 300 660 660
6 0.00 0.00 0.00 0.01 0.10 0.32 0.62 0.96 1.34 1.74 2.18 3.12 4.14 5.23 7.40 9.80 0 0 0 30 60 150 180 210 210 240 240 270 300 300 660 660
8 0.00 0.00 0.00 0.02 0.13 0.37 0.69 1.07 1.48 1.92 2.36 3.34 4.54 6.73 8.91 11.32 0 0 0 30 120 150 210 210 240 240 240 300 600 600 660 660
10 0.00 0.00 0.00 0.02 0.15 0.40 0.74 1.13 1.56 2.00 2.44 3.49 5.49 7.68 9.92 12.81 0 0 0 30 120 150 210 240 240 240 240 300 600 600 660 960
15 0.00 0.00 0.00 0.02 0.16 0.43 0.79 1.21 1.64 2.08 2.60 4.55 6.73 9.56 14.26 19.29 0 0 0 30 120 150 210 240 240 240 300 600 600 960 1380 1380
20 0.00 0.00 0.00 0.03 0.19 0.46 0.84 1.25 1.69 2.19 3.17 5.20 8.28 12.69 18.10 24.44 0 0 0 30 150 150 210 240 240 540 540 600 960 1380 1740 1740
25 0.00 0.00 0.00 0.03 0.22 0.50 0.88 1.30 1.76 2.62 3.60 6.17 9.71 15.89 22.24 28.58 0 0 0 30 150 180 210 240 270 540 540 960 1320 1740 1740 1740
30 0.00 0.00 0.00 0.04 0.25 0.55 0.94 1.37 1.96 2.94 3.92 7.09 12.10 18.45 24.79 31.13 0 0 0 30 150 210 210 270 540 540 540 960 1740 1740 1740 1740
40 0.00 0.00 0.00 0.06 0.32 0.68 1.07 1.57 2.41 3.40 4.72 8.28 14.62 20.96 27.30 33.65 0 0 0 60 180 210 270 270 540 540 900 1740 1740 1740 1740 1740
50 0.00 0.00 0.00 0.10 0.42 0.80 1.26 1.76 2.75 3.73 5.12 8.90 15.24 21.58 27.93 34.27 0 0 0 150 210 210 270 540 540 540 900 1740 1740 1740 1740 1740
60 0.00 0.00 0.01 0.17 0.54 0.93 1.42 2.02 3.01 4.06 5.19 8.90 15.24 21.58 27.93 34.27 0 0 30 180 210 270 270 540 540 600 900 1740 1740 1740 1740 1740
70 0.00 0.00 0.02 0.27 0.65 1.08 1.58 2.24 3.30 4.40 5.49 8.90 15.24 21.58 27.93 34.27 0 0 60 210 210 270 270 540 600 600 600 1740 1740 1740 1740 1740
80 0.00 0.00 0.03 0.37 0.75 1.22 1.71 2.51 3.60 4.70 5.79 8.90 15.24 21.58 27.93 34.27 0 0 90 210 210 270 270 600 600 600 600 1740 1740 1740 1740 1740
90 0.00 0.00 0.07 0.46 0.85 1.34 1.83 2.78 3.87 4.97 6.06 8.90 15.24 21.58 27.93 34.27 0 0 210 210 270 270 270 600 600 600 600 1740 1740 1740 1740 1740
100 0.00 0.00 0.15 0.54 0.95 1.44 1.94 3.03 4.12 5.22 6.31 8.90 15.24 21.58 27.93 34.27 0 0 210 210 270 270 600 600 600 600 600 1740 1740 1740 1740 1740
306 Hydrologic Considerations for Estimation of Storage-Capacity Requirements of Impounding and Side-Channel Reservoirs for Water Supply in Ohio
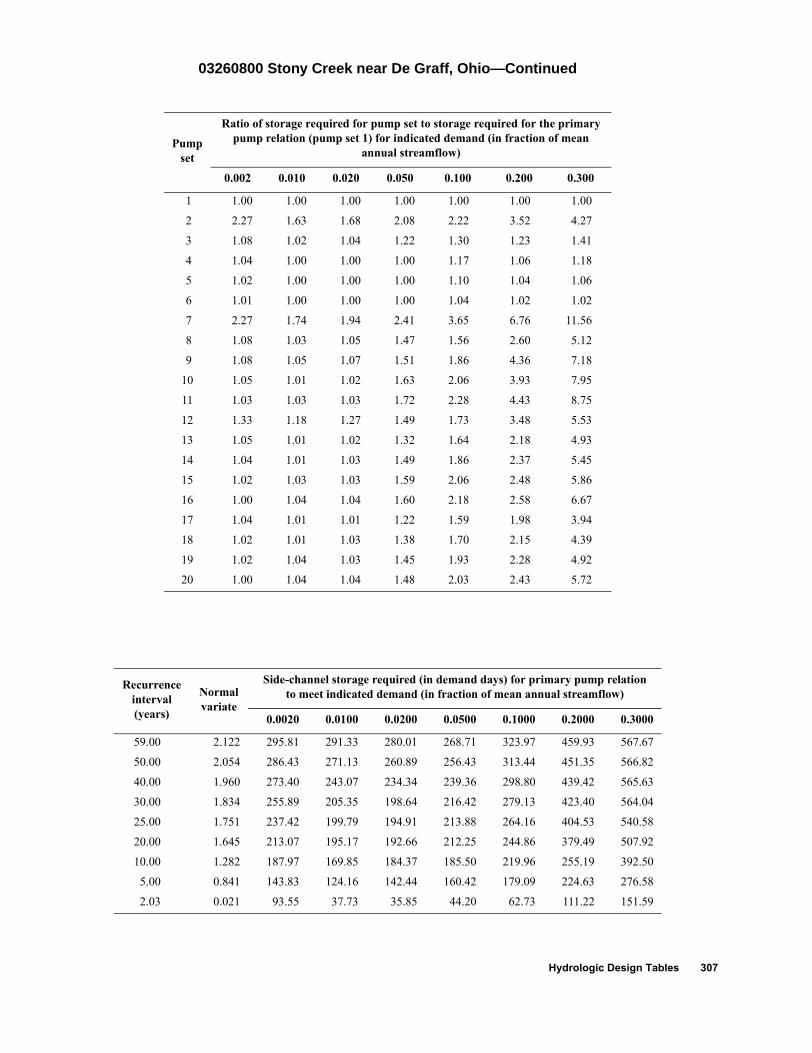
03260800 Stony Creek near De Graff, Ohio—Continued
Pumpset
Ratio of storage required for pump set to storage required for the primary pump relation (pump set 1) for indicated demand (in fraction of mean
annual streamflow)
0.002 0.010 0.020 0.050 0.100 0.200 0.300
1 1.00 1.00 1.00 1.00 1.00 1.00 1.00
2 2.27 1.63 1.68 2.08 2.22 3.52 4.27
3 1.08 1.02 1.04 1.22 1.30 1.23 1.41
4 1.04 1.00 1.00 1.00 1.17 1.06 1.18
5 1.02 1.00 1.00 1.00 1.10 1.04 1.06
6 1.01 1.00 1.00 1.00 1.04 1.02 1.02
7 2.27 1.74 1.94 2.41 3.65 6.76 11.56
8 1.08 1.03 1.05 1.47 1.56 2.60 5.12
9 1.08 1.05 1.07 1.51 1.86 4.36 7.18
10 1.05 1.01 1.02 1.63 2.06 3.93 7.95
11 1.03 1.03 1.03 1.72 2.28 4.43 8.75
12 1.33 1.18 1.27 1.49 1.73 3.48 5.53
13 1.05 1.01 1.02 1.32 1.64 2.18 4.93
14 1.04 1.01 1.03 1.49 1.86 2.37 5.45
15 1.02 1.03 1.03 1.59 2.06 2.48 5.86
16 1.00 1.04 1.04 1.60 2.18 2.58 6.67
17 1.04 1.01 1.01 1.22 1.59 1.98 3.94
18 1.02 1.01 1.03 1.38 1.70 2.15 4.39
19 1.02 1.04 1.03 1.45 1.93 2.28 4.92
20 1.00 1.04 1.04 1.48 2.03 2.43 5.72
Recurrenceinterval(years)
Normalvariate
Side-channel storage required (in demand days) for primary pump relation to meet indicated demand (in fraction of mean annual streamflow)
0.0020 0.0100 0.0200 0.0500 0.1000 0.2000 0.3000
59.00 2.122 295.81 291.33 280.01 268.71 323.97 459.93 567.67
50.00 2.054 286.43 271.13 260.89 256.43 313.44 451.35 566.82
40.00 1.960 273.40 243.07 234.34 239.36 298.80 439.42 565.63
30.00 1.834 255.89 205.35 198.64 216.42 279.13 423.40 564.04
25.00 1.751 237.42 199.79 194.91 213.88 264.16 404.53 540.58
20.00 1.645 213.07 195.17 192.66 212.25 244.86 379.49 507.92
10.00 1.282 187.97 169.85 184.37 185.50 219.96 255.19 392.50
5.00 0.841 143.83 124.16 142.44 160.42 179.09 224.63 276.58
2.03 0.021 93.55 37.73 35.85 44.20 62.73 111.22 151.59
Hydrologic Design Tables 307

03264000 Greenville Creek near Bradford, Ohio
Location: Latitude 40°06′08″, longitude 84°25′48″, Darke County, Hydrologic Unit 05080001
Drainage area, in square miles: 193.
Station used for record extension: None
Time period of systematic or extended record analyzed: 1930-10-01 to 1997-09-30
Eighty-percent-duration streamflow, in cubic feet per second: 30.
Mean annual streamflow, in inches: 12.59
Location of station used for precipitation data: Greenville, Ohio
Location of station used for potential evapotranspiration data: Columbus, Ohio
[–, indicates a value that could not be determined because there were too few average low-flow values less than the mean stream-flow for the indicated duration]
Recurrenceinterval(years)
Extreme-value
variate
Minimum runoff (in inches) for indicated duration (in days)
180 360 540 720 1080 1440 1800
68.00 4.21 0.49 1.72 4.52 7.88 15.94 31.50 40.36
60.00 4.09 0.49 1.95 4.65 8.60 16.98 31.62 40.38
50.00 3.90 0.49 2.28 4.84 9.64 18.50 31.78 40.42
40.00 3.68 0.50 2.69 5.07 10.92 20.37 31.99 40.46
30.00 3.38 0.51 3.10 5.24 11.91 21.98 32.27 40.89
25.00 3.20 0.52 3.26 5.24 11.97 22.34 32.45 41.48
20.00 2.97 0.60 3.63 5.64 12.04 22.53 32.60 42.25
10.00 2.25 0.73 4.33 7.12 13.33 28.58 42.77 57.10
5.23 1.55 0.97 6.13 11.13 18.98 40.77 – –
308 Hydrologic Considerations for Estimation of Storage-Capacity Requirements of Impounding and Side-Channel Reservoirs for Water Supply in Ohio

03264000 Greenville Creek near Bradford, Ohio—Continued
Recurrenceinterval(years)
Impounding reservoir storage required (in inches) and critical-drawdown duration (in days; shown in gray) for indicated draft rate (in fraction of the mean annual streamflow)
0.02 0.05 0.10 0.15 0.20 0.25 0.30 0.35 0.40 0.45 0.50 0.60 0.70 0.80 0.90 1.00
5 0.00 0.00 0.03 0.13 0.31 0.57 0.88 1.21 1.57 1.98 2.40 3.22 4.10 5.03 5.96 7.30 0 0 30 60 120 180 180 210 240 240 240 240 270 270 270 600
6 0.00 0.00 0.03 0.14 0.33 0.60 0.91 1.24 1.61 2.02 2.44 3.30 4.23 5.16 6.70 8.78 0 0 60 90 150 180 180 210 240 240 240 270 270 270 600 660
8 0.00 0.00 0.04 0.16 0.39 0.68 0.99 1.35 1.75 2.16 2.58 3.51 4.45 6.38 8.44 10.88 0 0 60 90 150 180 180 210 240 240 270 270 540 600 600 720
10 0.00 0.00 0.05 0.19 0.45 0.76 1.10 1.47 1.88 2.30 2.73 3.66 5.43 7.39 9.46 12.12 0 0 60 150 150 180 210 240 240 240 270 270 540 600 600 1320
15 0.00 0.00 0.06 0.29 0.58 0.94 1.32 1.73 2.14 2.56 3.00 4.82 6.68 8.75 11.88 16.43 0 0 60 150 210 210 240 240 240 240 270 540 540 600 1320 1320
20 0.00 0.00 0.09 0.34 0.70 1.06 1.48 1.89 2.30 2.72 3.57 5.43 7.38 9.58 13.17 18.40 0 0 120 180 210 240 240 240 240 240 540 540 600 900 1260 1680
25 0.00 0.00 0.11 0.41 0.77 1.17 1.58 2.00 2.41 3.00 3.93 5.79 7.83 10.37 15.07 20.86 0 0 150 210 210 240 240 240 240 540 540 540 600 900 1680 1680
30 0.00 0.00 0.13 0.46 0.82 1.24 1.65 2.06 2.49 3.23 4.16 6.08 8.15 10.94 16.57 22.36 0 0 150 210 240 240 240 240 270 540 540 600 600 900 1680 1680
40 0.00 0.00 0.14 0.50 0.90 1.32 1.73 2.18 2.64 3.51 4.44 6.51 8.68 12.16 17.95 23.74 0 30 210 210 240 240 240 270 270 540 600 600 900 1680 1680 1680
50 0.00 0.00 0.15 0.53 0.94 1.36 1.82 2.32 2.83 3.71 4.74 6.81 9.31 12.55 18.13 23.92 0 30 210 240 240 270 270 300 300 600 600 600 900 960 1680 1680
60 0.00 0.00 0.15 0.54 0.98 1.46 1.98 2.49 3.01 3.93 4.97 7.21 10.10 14.15 18.70 23.92 0 30 210 240 270 300 300 300 300 600 600 660 960 1320 1320 1680
70 0.00 0.00 0.15 0.59 1.09 1.61 2.13 2.68 3.30 4.42 5.55 7.83 11.41 15.96 20.51 25.06 0 30 210 270 300 300 300 360 360 660 660 660 1320 1320 1320 1320
80 0.00 0.01 0.19 0.70 1.22 1.74 2.31 2.93 3.83 4.97 6.11 8.67 13.21 17.76 22.31 26.86 0 30 300 300 300 300 360 360 660 660 660 1320 1320 1320 1320 1320
90 0.00 0.01 0.30 0.81 1.33 1.90 2.52 3.20 4.33 5.47 6.69 10.40 14.95 19.50 24.05 28.60 0 30 300 300 300 360 360 660 660 660 720 1320 1320 1320 1320 1320
100 0.00 0.01 0.39 0.91 1.46 2.08 2.70 3.79 5.03 6.27 7.51 12.04 16.58 21.13 25.68 30.23 0 30 300 300 360 360 360 720 720 720 720 1320 1320 1320 1320 1320
Hydrologic Design Tables 309

03264000 Greenville Creek near Bradford, Ohio—Continued
Pumpset
Ratio of storage required for pump set to storage required for the primary pump relation (pump set 1) for indicated demand (in fraction of mean
annual streamflow)
0.002 0.010 0.020 0.050 0.100 0.200 0.300
1 1.00 1.00 1.00 1.00 1.00 1.00 1.00
2 1.60 1.31 1.27 1.35 1.60 2.56 5.30
3 1.16 1.12 1.08 1.01 1.00 1.27 1.28
4 1.12 1.05 1.03 1.00 1.00 1.11 1.11
5 1.04 1.01 1.02 1.00 1.00 1.01 1.06
6 1.00 1.00 1.00 1.00 1.00 1.00 1.03
7 1.60 1.37 1.45 1.64 2.28 8.81 16.29
8 1.17 1.15 1.11 1.05 1.21 1.96 3.44
9 1.16 1.16 1.12 1.07 1.39 2.78 6.64
10 1.17 1.13 1.11 1.11 1.38 2.34 4.73
11 1.16 1.12 1.11 1.16 1.41 2.28 4.64
12 1.18 1.16 1.11 1.03 1.28 2.51 5.20
13 1.15 1.12 1.09 1.07 1.25 1.89 2.73
14 1.15 1.09 1.11 1.12 1.22 1.99 2.58
15 1.08 1.09 1.09 1.16 1.26 1.97 2.42
16 1.05 1.06 1.12 1.17 1.28 1.94 2.51
17 1.13 1.09 1.07 1.07 1.15 1.70 2.02
18 1.09 1.06 1.10 1.12 1.13 1.82 1.99
19 1.01 1.05 1.08 1.16 1.20 1.78 2.05
20 1.00 1.05 1.12 1.17 1.26 1.80 2.03
Recurrenceinterval(years)
Normalvariate
Side-channel storage required (in demand days) for primary pump relation to meet indicated demand (in fraction of mean annual streamflow)
0.0020 0.0100 0.0200 0.0500 0.1000 0.2000 0.3000
68.00 2.178 309.21 293.81 302.00 322.82 333.55 344.77 420.16
60.00 2.128 308.67 290.73 299.12 315.32 328.12 344.47 408.72
50.00 2.054 307.88 286.14 294.84 304.15 320.04 344.03 391.69
40.00 1.960 306.87 280.35 289.44 290.06 309.85 343.46 370.19
30.00 1.834 294.04 268.95 276.19 275.22 297.31 330.02 354.02
25.00 1.751 275.95 258.39 262.43 268.87 290.03 310.52 354.01
20.00 1.645 263.47 239.57 240.75 253.30 281.62 289.00 345.35
10.00 1.282 219.24 184.31 194.19 214.08 230.12 238.91 280.11
5.00 0.841 157.83 139.11 138.53 166.10 175.76 205.69 248.35
2.00 0.000 113.19 83.70 84.02 94.75 106.84 130.39 151.88
310 Hydrologic Considerations for Estimation of Storage-Capacity Requirements of Impounding and Side-Channel Reservoirs for Water Supply in Ohio

03265000 Stillwater River at Pleasant Hill, Ohio
Location: Latitude 40°03′28″, longitude 84°21′22″, Miami County, Hydrologic Unit 05080001
Drainage area, in square miles: 503.
Station used for record extension: 03264000 and 03217500
Time period of systematic or extended record analyzed: 1922-10-01 to 1997-09-30
Percentage of estimated values in extended record: 8.0
Eighty-percent-duration streamflow, in cubic feet per second: 52.
Mean annual streamflow, in inches: 12.18
Location of station used for precipitation data: Greenville, Ohio
Location of station used for potential evapotranspiration data: Columbus, Ohio
[–, indicates a value that could not be determined because there were too few average low-flow values less than the mean streamflow for the indicated duration]
Recurrenceinterval(years)
Extreme-value
variate
Minimum runoff (in inches) for indicated duration (in days)
180 360 540 720 1080 1440 1800
76.00 4.32 0.27 1.40 3.65 7.10 15.24 28.53 36.39
70.00 4.24 0.27 1.41 3.68 7.10 15.37 28.65 36.41
60.00 4.09 0.28 1.43 3.74 7.11 15.63 28.87 36.43
50.00 3.90 0.29 1.45 3.80 7.12 15.93 29.14 36.47
40.00 3.68 0.30 1.47 3.88 7.14 16.30 29.47 36.51
30.00 3.38 0.30 1.85 3.93 8.64 18.25 29.60 37.67
25.00 3.20 0.30 2.13 3.97 9.73 19.61 29.73 38.58
20.00 2.97 0.35 2.42 4.28 10.10 19.81 31.11 40.15
10.00 2.25 0.42 3.18 5.87 11.48 25.72 39.98 51.82
5.07 1.52 0.64 5.83 11.84 19.19 37.74 – –
Hydrologic Design Tables 311

03265000 Stillwater River at Pleasant Hill, Ohio—Continued
Recurrenceinterval(years)
Impounding reservoir storage required (in inches) and critical-drawdown duration (in days; shown in gray) for indicated draft rate (in fraction of the mean annual streamflow)
0.02 0.05 0.10 0.15 0.20 0.25 0.30 0.35 0.40 0.45 0.50 0.60 0.70 0.80 0.90 1.00
5 0.00 0.01 0.11 0.30 0.55 0.85 1.18 1.53 1.88 2.25 2.65 3.49 4.39 5.30 6.20 7.17 0 30 90 120 180 180 210 210 210 240 240 270 270 270 270 300
6 0.00 0.01 0.12 0.33 0.62 0.95 1.30 1.65 2.04 2.44 2.84 3.74 4.64 5.54 6.99 8.80 0 30 90 150 180 210 210 210 240 240 270 270 270 270 540 600
8 0.00 0.01 0.15 0.41 0.74 1.09 1.47 1.87 2.27 2.69 3.14 4.04 5.54 7.34 9.26 11.33 0 30 150 180 210 210 240 240 240 270 270 270 540 540 600 900
10 0.00 0.01 0.19 0.47 0.82 1.20 1.60 2.00 2.42 2.87 3.32 4.81 6.61 8.57 10.71 13.71 0 30 150 210 210 240 240 240 270 270 270 540 540 600 900 900
15 0.00 0.02 0.23 0.58 0.97 1.37 1.77 2.21 2.66 3.29 4.19 6.14 8.14 10.38 13.38 17.23 0 30 180 210 240 240 240 270 270 540 540 600 600 900 900 1320
20 0.00 0.02 0.28 0.65 1.05 1.45 1.87 2.32 2.88 3.82 4.82 6.82 8.82 11.51 14.71 18.71 0 30 210 240 240 240 270 270 540 600 600 600 600 900 960 1320
25 0.00 0.02 0.31 0.69 1.09 1.49 1.94 2.43 3.19 4.19 5.19 7.19 9.19 12.36 15.56 20.95 0 90 210 240 240 270 270 300 600 600 600 600 600 960 960 1680
30 0.00 0.03 0.33 0.72 1.12 1.54 2.01 2.52 3.40 4.40 5.40 7.40 9.72 12.93 16.91 22.52 0 90 210 240 240 270 300 300 600 600 600 600 960 960 1680 1680
40 0.00 0.03 0.35 0.75 1.15 1.63 2.13 2.63 3.60 4.60 5.60 7.60 10.43 13.63 18.63 24.23 0 120 240 240 240 300 300 300 600 600 600 600 960 960 1680 1680
50 0.00 0.04 0.36 0.76 1.19 1.69 2.19 2.70 3.65 4.65 5.65 7.85 10.85 14.06 19.31 24.92 0 120 240 240 300 300 300 330 600 600 600 660 960 960 1680 1680
60 0.00 0.05 0.36 0.76 1.24 1.74 2.24 2.76 3.65 4.75 5.85 8.05 11.14 14.34 19.42 25.09 0 120 240 240 300 300 300 330 600 660 660 660 960 960 1680 1740
70 0.00 0.06 0.36 0.77 1.27 1.77 2.27 2.81 3.79 4.89 5.99 8.20 11.35 14.81 19.42 25.13 0 120 240 300 300 300 300 360 660 660 660 660 960 1320 1680 1740
80 0.00 0.06 0.36 0.79 1.29 1.79 2.29 2.86 3.90 5.00 6.10 8.31 11.59 15.99 20.40 25.13 0 150 240 300 300 300 300 360 660 660 660 960 1320 1320 1320 1740
90 0.00 0.07 0.36 0.80 1.30 1.80 2.30 2.90 3.98 5.09 6.19 8.63 12.78 17.19 21.59 25.99 0 150 240 300 300 300 300 360 660 660 660 840 1320 1320 1320 1320
100 0.00 0.08 0.36 0.81 1.31 1.81 2.33 2.95 4.05 5.15 6.27 9.56 13.96 18.36 22.77 27.17 0 150 240 300 300 300 360 660 660 660 780 1320 1320 1320 1320 1320
312 Hydrologic Considerations for Estimation of Storage-Capacity Requirements of Impounding and Side-Channel Reservoirs for Water Supply in Ohio
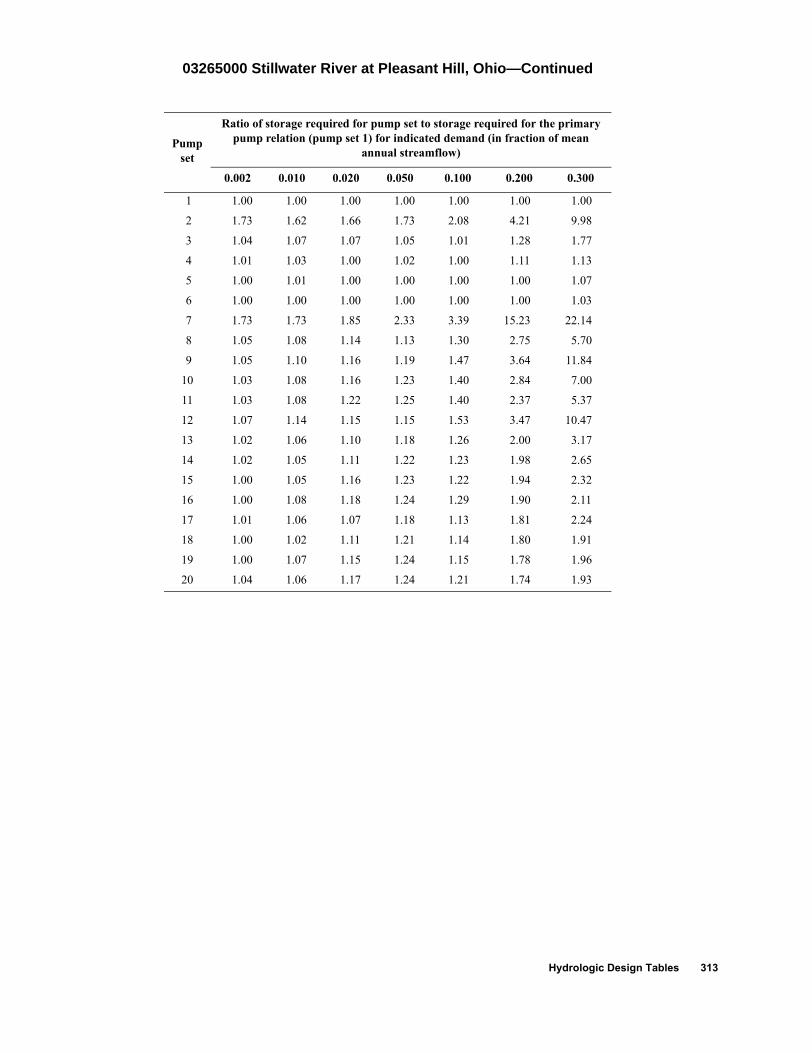
03265000 Stillwater River at Pleasant Hill, Ohio—Continued
Pumpset
Ratio of storage required for pump set to storage required for the primary pump relation (pump set 1) for indicated demand (in fraction of mean
annual streamflow)
0.002 0.010 0.020 0.050 0.100 0.200 0.300
1 1.00 1.00 1.00 1.00 1.00 1.00 1.00
2 1.73 1.62 1.66 1.73 2.08 4.21 9.98
3 1.04 1.07 1.07 1.05 1.01 1.28 1.77
4 1.01 1.03 1.00 1.02 1.00 1.11 1.13
5 1.00 1.01 1.00 1.00 1.00 1.00 1.07
6 1.00 1.00 1.00 1.00 1.00 1.00 1.03
7 1.73 1.73 1.85 2.33 3.39 15.23 22.14
8 1.05 1.08 1.14 1.13 1.30 2.75 5.70
9 1.05 1.10 1.16 1.19 1.47 3.64 11.84
10 1.03 1.08 1.16 1.23 1.40 2.84 7.00
11 1.03 1.08 1.22 1.25 1.40 2.37 5.37
12 1.07 1.14 1.15 1.15 1.53 3.47 10.47
13 1.02 1.06 1.10 1.18 1.26 2.00 3.17
14 1.02 1.05 1.11 1.22 1.23 1.98 2.65
15 1.00 1.05 1.16 1.23 1.22 1.94 2.32
16 1.00 1.08 1.18 1.24 1.29 1.90 2.11
17 1.01 1.06 1.07 1.18 1.13 1.81 2.24
18 1.00 1.02 1.11 1.21 1.14 1.80 1.91
19 1.00 1.07 1.15 1.24 1.15 1.78 1.96
20 1.04 1.06 1.17 1.24 1.21 1.74 1.93
Hydrologic Design Tables 313

03265000 Stillwater River at Pleasant Hill, Ohio—Continued
Recurrenceinterval(years)
Normalvariate
Side-channel storage required (in demand days) for primary pump relation to meet indicated demand (in fraction of mean annual streamflow)
0.0020 0.0100 0.0200 0.0500 0.1000 0.2000 0.3000
76.00 2.222 329.88 281.32 278.15 296.41 325.10 340.81 407.42
70.00 2.190 327.40 280.08 277.40 295.48 322.48 338.28 405.49
60.00 2.128 322.69 277.73 275.97 293.72 317.49 333.46 401.80
50.00 2.054 316.97 274.87 274.24 291.59 311.44 327.63 397.34
40.00 1.960 309.76 271.27 272.06 288.89 303.81 320.26 391.71
30.00 1.834 304.64 268.29 263.60 281.41 286.74 309.20 389.30
25.00 1.751 301.40 266.07 257.31 275.28 274.94 301.55 387.61
20.00 1.645 289.27 254.83 250.61 256.88 266.68 288.72 372.18
10.00 1.282 254.73 215.30 207.99 209.68 238.64 277.18 310.46
5.00 0.841 197.41 149.11 156.72 163.44 189.38 245.71 274.40
2.00 0.000 137.66 89.17 89.64 108.93 134.49 145.27 166.85
314 Hydrologic Considerations for Estimation of Storage-Capacity Requirements of Impounding and Side-Channel Reservoirs for Water Supply in Ohio

03266500 Mad River at Zanesfield, Ohio
Location: Latitude 40°21′01″, longitude 83°40′28″, Logan County, Hydrologic Unit 05080001
Drainage area, in square miles: 7.31
Station used for record extension: 03260700
Time period of systematic or extended record analyzed: 1946-10-01 to 1991-09-30
Percentage of estimated values in extended record: 26.2
Eighty-percent-duration streamflow, in cubic feet per second: 1.6
Mean annual streamflow, in inches: 14.34
Location of station used for precipitation data: Kenton, Ohio
Location of station used for potential evapotranspiration data: Dayton, Ohio
[–, indicates a value that could not be determined because there were too few average low-flow values less than the mean streamflow for the indicated duration]
Recurrenceinterval(years)
Extreme-value
variate
Minimum runoff (in inches) for indicated duration (in days)
180 360 540 720 1080 1440 1800
46.00 3.82 0.86 4.46 7.67 14.10 24.34 33.93 44.54
40.00 3.68 0.86 4.60 7.68 14.32 24.85 34.69 45.51
30.00 3.38 0.87 4.88 7.71 14.76 25.92 36.26 47.52
25.00 3.20 0.88 5.06 7.73 15.05 26.59 37.26 48.79
20.00 2.97 0.90 5.14 7.99 15.28 27.24 37.96 52.66
10.00 2.25 1.08 5.41 9.48 15.75 28.90 42.65 66.61
5.11 1.52 1.30 6.40 12.20 21.22 40.17 – –
Hydrologic Design Tables 315

03266500 Mad River at Zanesfield, Ohio—Continued
Recurrenceinterval(years)
Impounding reservoir storage required (in inches) and critical-drawdown duration (in days; shown in gray) for indicated draft rate (in fraction of the mean annual streamflow)
0.02 0.05 0.10 0.15 0.20 0.25 0.30 0.35 0.40 0.45 0.50 0.60 0.70 0.80 0.90 1.00
5 0.00 0.00 0.00 0.05 0.22 0.51 0.82 1.17 1.58 2.11 2.64 3.70 4.79 6.09 8.01 10.36 0 0 0 30 150 150 180 180 270 270 270 270 330 330 600 600
6 0.00 0.00 0.00 0.05 0.23 0.52 0.88 1.24 1.66 2.16 2.69 3.75 4.81 6.09 8.30 10.66 0 0 0 60 120 180 180 210 240 270 270 270 270 330 600 600
8 0.00 0.00 0.00 0.07 0.27 0.62 1.00 1.43 1.90 2.38 2.85 3.91 5.09 6.64 9.23 11.82 0 0 0 60 180 180 210 240 240 240 240 300 300 660 660 660
10 0.00 0.00 0.00 0.09 0.34 0.70 1.11 1.58 2.05 2.52 3.00 4.16 5.34 7.30 9.88 14.92 0 0 30 60 180 210 210 240 240 240 270 300 300 540 660 1320
15 0.00 0.00 0.01 0.13 0.46 0.87 1.30 1.77 2.24 2.76 3.35 4.53 6.36 8.48 12.97 18.39 0 0 30 90 180 210 240 240 240 270 300 300 540 540 1380 1380
20 0.00 0.00 0.01 0.19 0.54 0.95 1.40 1.88 2.41 2.96 3.55 4.81 6.93 9.05 14.13 19.55 0 0 30 150 210 210 240 270 270 300 300 540 540 540 1380 1380
25 0.00 0.00 0.01 0.22 0.58 0.99 1.46 1.99 2.52 3.08 3.66 5.09 7.21 9.63 16.23 22.83 0 0 30 150 210 210 270 270 270 300 300 540 540 1680 1680 1680
30 0.00 0.00 0.02 0.24 0.60 1.02 1.52 2.05 2.58 3.14 3.73 5.21 7.33 11.83 18.43 25.03 0 0 30 150 210 210 270 270 270 300 300 540 540 1680 1680 1680
40 0.00 0.00 0.02 0.24 0.61 1.04 1.57 2.10 2.63 3.21 3.80 5.21 7.50 13.35 19.95 26.55 0 0 30 150 210 270 270 270 270 300 300 540 900 1680 1680 1680
50 0.00 0.00 0.02 0.24 0.61 1.04 1.57 2.10 2.63 3.21 3.80 5.21 8.58 13.76 19.95 26.55 0 0 30 150 210 270 270 270 270 300 300 540 1320 1320 1680 1680
60 0.00 0.00 0.03 0.24 0.61 1.04 1.57 2.10 2.63 3.21 3.80 6.16 11.34 16.53 21.71 26.90 0 0 30 120 210 270 270 270 270 300 300 1320 1320 1320 1320 1320
70 0.00 0.00 0.03 0.24 0.61 1.04 1.57 2.10 2.63 3.21 3.80 8.95 14.14 19.32 24.50 29.69 0 0 30 120 210 270 270 270 270 300 300 1320 1320 1320 1320 1320
80 0.00 0.00 0.03 0.24 0.61 1.04 1.57 2.10 2.63 3.84 6.43 11.62 16.80 21.99 27.17 32.35 0 0 30 120 210 270 270 270 270 1320 1320 1320 1320 1320 1320 1320
90 0.00 0.00 0.03 0.24 0.61 1.04 1.57 2.10 3.71 6.30 8.89 14.07 19.26 24.44 29.62 34.81 0 0 30 120 210 270 270 270 1320 1320 1320 1320 1320 1320 1320 1320
100 0.00 0.00 0.04 0.24 0.61 1.04 1.57 3.33 5.92 8.51 11.10 16.28 21.47 26.65 31.84 37.02 0 0 30 120 210 270 270 1320 1320 1320 1320 1320 1320 1320 1320 1320
316 Hydrologic Considerations for Estimation of Storage-Capacity Requirements of Impounding and Side-Channel Reservoirs for Water Supply in Ohio

03266500 Mad River at Zanesfield, Ohio—Continued
Pumpset
Ratio of storage required for pump set to storage required for the primary pump relation (pump set 1) for indicated demand (in fraction of mean
annual streamflow)
0.002 0.010 0.020 0.050 0.100 0.200 0.300
1 1.00 1.00 1.00 1.00 1.00 1.00 1.00
2 2.05 1.56 1.57 1.79 2.26 4.52 8.15
3 1.16 1.08 1.10 1.01 1.00 1.18 2.08
4 1.00 1.05 1.02 1.00 1.00 1.00 1.14
5 1.00 1.03 1.00 1.00 1.00 1.00 1.00
6 1.00 1.01 1.00 1.00 1.00 1.00 1.00
7 2.03 1.61 1.93 2.42 3.40 12.79 26.50
8 1.17 1.16 1.21 1.08 1.16 2.50 6.53
9 1.17 1.18 1.26 1.12 1.27 3.23 10.78
10 1.03 1.27 1.26 1.14 1.15 2.64 10.40
11 1.00 1.23 1.29 1.18 1.22 2.61 12.22
12 1.27 1.15 1.22 1.09 1.53 3.09 8.62
13 1.03 1.12 1.21 1.11 1.11 1.95 5.40
14 1.00 1.22 1.22 1.13 1.16 1.61 5.19
15 1.00 1.13 1.28 1.17 1.22 1.72 6.69
16 1.00 1.08 1.29 1.16 1.25 1.77 9.73
17 1.01 1.08 1.19 1.11 1.11 1.41 3.12
18 1.00 1.15 1.21 1.15 1.16 1.46 3.27
19 1.00 1.09 1.25 1.18 1.22 1.58 3.87
20 1.00 1.07 1.27 1.17 1.25 1.74 6.46
Recurrenceinterval(years)
Normalvariate
Side-channel storage required (in demand days) for primary pump relation to meet indicated demand (in fraction of mean annual streamflow)
0.0020 0.0100 0.0200 0.0500 0.1000 0.2000 0.3000
46.00 2.020 230.29 224.42 234.85 273.26 287.26 297.77 306.83
40.00 1.960 222.72 216.28 227.67 264.24 280.45 294.72 305.29
30.00 1.834 206.57 198.93 212.36 245.01 265.91 288.20 301.99
25.00 1.751 195.91 187.47 202.24 232.32 256.31 283.90 299.82
20.00 1.645 190.85 178.15 196.97 225.22 247.86 273.67 294.33
10.00 1.282 144.56 162.56 172.21 200.59 208.99 232.68 276.59
5.00 0.841 97.19 97.86 135.06 161.97 190.45 208.41 243.79
2.00 0.000 60.26 47.33 45.24 57.23 78.70 97.93 119.32
Hydrologic Design Tables 317

03267000 Mad River near Urbana, Ohio
Location: Latitude 40°06′27″, longitude 83°47′57″, Champaign County, Hydrologic Unit 05080001
Drainage area, in square miles: 162.
Station used for record extension: None
Time period of systematic or extended record analyzed: 1939-10-01 to 1997-09-30
Eighty-percent-duration streamflow, in cubic feet per second: 65.
Mean annual streamflow, in inches: 12.61
Location of station used for precipitation data: Columbus, Ohio
Location of station used for potential evapotranspiration data: Dayton, Ohio
[–, indicates a value that could not be determined because there were too few average low-flow values less than the mean stream-flow for the indicated duration]
Recurrenceinterval(years)
Extreme-value
variate
Minimum runoff (in inches) for indicated duration (in days)
180 360 540 720 1080 1440 1800
59.00 4.07 1.29 4.81 7.01 11.84 20.29 29.31 37.30
50.00 3.90 1.41 4.86 7.22 11.94 20.43 29.39 37.43
40.00 3.68 1.58 4.92 7.50 12.08 20.63 29.49 37.60
30.00 3.38 1.80 5.00 7.87 12.26 20.88 29.62 37.82
25.00 3.20 1.81 5.09 8.26 12.48 21.46 29.93 38.45
20.00 2.97 1.82 5.21 8.75 12.77 22.23 30.33 39.28
10.00 2.25 1.93 6.07 9.69 15.93 28.52 44.31 60.13
5.36 1.58 2.22 7.22 13.10 19.97 37.97 63.81 –
318 Hydrologic Considerations for Estimation of Storage-Capacity Requirements of Impounding and Side-Channel Reservoirs for Water Supply in Ohio

03267000 Mad River near Urbana, Ohio—Continued
Recurrenceinterval(years)
Impounding reservoir storage required (in inches) and critical-drawdown duration (in days; shown in gray) for indicated draft rate (in fraction of the mean annual streamflow)
0.02 0.05 0.10 0.15 0.20 0.25 0.30 0.35 0.40 0.45 0.50 0.60 0.70 0.80 0.90 1.00
5 0.00 0.00 0.00 0.00 0.00 0.00 0.09 0.19 0.29 0.53 0.80 1.54 2.44 3.37 4.30 5.66 0 0 0 0 0 0 60 60 60 150 180 240 270 270 270 660
6 0.00 0.00 0.00 0.00 0.00 0.00 0.09 0.19 0.40 0.69 1.02 1.77 2.61 3.55 4.76 6.93 0 0 0 0 0 30 60 60 150 180 210 240 270 270 600 660
8 0.00 0.00 0.00 0.00 0.00 0.02 0.09 0.26 0.54 0.86 1.22 1.99 2.84 4.52 6.59 8.66 0 0 0 0 0 30 60 150 180 210 210 240 300 600 600 600
10 0.00 0.00 0.00 0.00 0.00 0.03 0.09 0.30 0.59 0.93 1.29 2.09 3.34 5.41 7.48 9.90 0 0 0 0 0 30 90 150 180 210 210 240 600 600 600 960
15 0.00 0.00 0.00 0.00 0.00 0.04 0.12 0.32 0.62 0.98 1.37 2.26 4.30 6.46 10.53 15.29 0 0 0 0 0 30 60 150 180 210 240 300 600 960 1380 1380
20 0.00 0.00 0.00 0.00 0.00 0.05 0.15 0.34 0.66 1.04 1.46 2.63 4.85 8.61 13.38 19.30 0 0 0 0 0 30 60 150 210 240 270 600 960 1380 1380 1740
25 0.00 0.00 0.00 0.00 0.01 0.07 0.18 0.37 0.71 1.14 1.61 2.89 5.86 10.83 16.84 22.85 0 0 0 0 30 60 60 150 240 270 270 600 960 1740 1740 1740
30 0.00 0.00 0.00 0.00 0.01 0.09 0.20 0.42 0.81 1.28 1.75 3.23 6.92 12.93 18.94 24.95 0 0 0 0 30 60 60 210 270 270 270 900 1740 1740 1740 1740
40 0.00 0.00 0.00 0.00 0.01 0.11 0.28 0.62 1.07 1.54 2.01 3.83 8.65 14.66 20.67 26.68 0 0 0 0 30 60 150 240 270 270 270 900 1740 1740 1740 1740
50 0.00 0.00 0.00 0.00 0.02 0.15 0.45 0.85 1.31 1.77 2.24 3.98 8.65 14.66 20.67 26.68 0 0 0 0 60 150 210 240 270 270 270 900 1740 1740 1740 1740
60 0.00 0.00 0.00 0.00 0.03 0.29 0.66 1.07 1.52 1.98 2.45 4.33 8.65 14.66 20.67 26.68 0 0 0 0 120 210 240 240 270 270 270 600 1740 1740 1740 1740
70 0.00 0.00 0.00 0.00 0.14 0.48 0.86 1.27 1.70 2.17 2.87 4.74 8.65 14.66 20.67 26.68 0 0 0 0 150 210 240 240 270 270 540 600 1740 1740 1740 1740
80 0.00 0.00 0.00 0.00 0.29 0.65 1.04 1.45 1.87 2.38 3.31 5.17 8.65 14.66 20.67 26.68 0 0 0 120 210 210 240 240 240 540 540 540 1740 1740 1740 1740
90 0.00 0.00 0.00 0.09 0.43 0.80 1.20 1.62 2.03 2.79 3.72 5.59 8.65 14.66 20.67 26.68 0 0 0 150 210 210 240 240 240 540 540 540 1740 1740 1740 1740
100 0.00 0.00 0.00 0.20 0.57 0.93 1.35 1.76 2.25 3.18 4.11 5.98 8.65 14.66 20.67 26.68 0 0 0 210 210 240 240 240 540 540 540 540 1740 1740 1740 1740
Hydrologic Design Tables 319

03267000 Mad River near Urbana, Ohio—Continued
Pumpset
Ratio of storage required for pump set to storage required for the primary pump relation (pump set 1) for indicated demand (in fraction of mean
annual streamflow)
0.002 0.010 0.020 0.050 0.100 0.200 0.300
1 1.00 1.00 1.00 1.00 1.00 1.00 1.00
2 28.60 2.05 2.12 2.61 4.12 5.62 5.63
3 1.28 1.12 1.18 1.36 1.36 1.55 2.48
4 1.02 1.00 1.00 1.00 1.11 1.10 1.23
5 1.00 1.00 1.00 1.00 1.06 1.03 1.05
6 1.00 1.00 1.00 1.00 1.02 1.01 1.02
7 28.59 2.21 2.49 4.39 6.97 10.29 11.64
8 1.28 1.16 1.26 1.52 1.66 4.74 6.74
9 1.29 1.18 1.30 1.64 2.00 6.36 9.73
10 1.05 1.02 1.01 1.44 1.95 6.64 13.07
11 1.02 1.02 1.03 1.52 2.11 8.37 15.96
12 1.65 1.46 1.50 1.68 2.13 5.53 7.16
13 1.05 1.00 1.01 1.35 1.56 4.02 7.07
14 1.01 1.01 1.01 1.33 1.76 4.47 10.11
15 1.00 1.02 1.05 1.39 1.94 6.22 13.64
16 1.01 1.01 1.03 1.37 2.08 7.75 17.33
17 1.02 1.00 1.01 1.23 1.45 2.53 5.98
18 1.00 1.02 1.01 1.24 1.62 3.24 8.35
19 1.00 1.01 1.04 1.32 1.83 4.90 12.38
20 1.01 1.02 1.03 1.31 1.98 6.70 16.23
Recurrenceinterval(years)
Normalvariate
Side-channel storage required (in demand days) for primary pump relation to meet indicated demand (in fraction of mean annual streamflow)
0.0020 0.0100 0.0200 0.0500 0.1000 0.2000 0.3000
59.00 2.122 360.39 354.82 341.12 328.15 382.76 498.13 746.72
50.00 2.054 344.92 329.24 320.38 318.03 373.36 497.34 738.82
40.00 1.960 323.43 293.70 291.57 303.97 360.31 496.23 727.85
30.00 1.834 294.53 245.93 252.85 285.07 342.76 494.75 713.11
25.00 1.751 286.65 239.23 248.14 268.15 327.71 484.18 704.89
20.00 1.645 278.03 233.84 244.79 246.08 308.15 469.53 694.62
10.00 1.282 233.21 216.72 213.01 232.58 250.63 353.27 664.48
5.00 0.841 197.48 159.50 165.48 181.43 207.24 258.88 499.23
2.03 0.021 111.01 58.13 64.41 86.64 106.29 142.49 254.53
320 Hydrologic Considerations for Estimation of Storage-Capacity Requirements of Impounding and Side-Channel Reservoirs for Water Supply in Ohio

03268000 Buck Creek at New Moorefield, Ohio
Location: Latitude 39°59′31″, longitude 83°42′53″, Clark County, Hydrologic Unit 05080001
Drainage area, in square miles: 65.3
Station used for record extension: 03267000
Time period of systematic or extended record analyzed: 1939-10-01 to 1997-09-30
Percentage of estimated values in extended record: 72.4
Eighty-percent-duration streamflow, in cubic feet per second: 27.
Mean annual streamflow, in inches: 13.64
Location of station used for precipitation data: Dayton, Ohio
Location of station used for potential evapotranspiration data: Dayton, Ohio
[–, indicates a value that could not be determined because there were too few average low-flow values less than the mean streamflow for the indicated duration]
Recurrenceinterval(years)
Extreme-value
variate
Minimum runoff (in inches) for indicated duration (in days)
180 360 540 720 1080 1440 1800
59.00 4.07 1.35 5.39 8.37 13.69 22.57 32.34 42.00
50.00 3.90 1.51 5.49 8.47 13.73 22.91 32.39 42.17
40.00 3.68 1.73 5.62 8.61 13.79 23.37 32.46 42.40
30.00 3.38 2.01 5.79 8.78 13.87 23.97 32.54 42.69
25.00 3.20 2.06 5.81 9.18 14.07 24.23 32.99 42.83
20.00 2.97 2.11 5.83 9.71 14.34 24.55 33.58 42.99
10.00 2.25 2.26 6.72 11.04 17.25 31.32 47.83 64.42
5.36 1.58 2.57 8.14 15.22 23.44 40.93 64.95 –
Hydrologic Design Tables 321

03268000 Buck Creek at New Moorefield, Ohio—Continued
Recurrenceinterval(years)
Impounding reservoir storage required (in inches) and critical-drawdown duration (in days; shown in gray) for indicated draft rate (in fraction of the mean annual streamflow)
0.02 0.05 0.10 0.15 0.20 0.25 0.30 0.35 0.40 0.45 0.50 0.60 0.70 0.80 0.90 1.00
5 0.00 0.00 0.00 0.00 0.00 0.00 0.05 0.17 0.28 0.39 0.73 1.55 2.47 3.50 4.62 5.74 0 0 0 0 0 0 60 60 60 180 180 240 270 300 300 300
6 0.00 0.00 0.00 0.00 0.00 0.00 0.06 0.17 0.28 0.58 0.92 1.74 2.71 3.73 4.85 7.14 0 0 0 0 0 0 30 60 120 180 180 240 270 300 300 660
8 0.00 0.00 0.00 0.00 0.00 0.02 0.08 0.18 0.44 0.74 1.11 1.92 2.93 4.63 6.87 9.28 0 0 0 0 0 30 30 90 150 180 210 270 270 600 600 660
10 0.00 0.00 0.00 0.00 0.00 0.03 0.09 0.21 0.48 0.79 1.18 2.03 3.36 5.60 7.89 10.36 0 0 0 0 0 30 30 90 150 180 210 270 600 600 660 660
15 0.00 0.00 0.00 0.00 0.00 0.05 0.13 0.24 0.50 0.84 1.23 2.18 4.37 6.61 10.19 15.30 0 0 0 0 0 30 60 60 180 210 210 270 600 600 1320 1380
20 0.00 0.00 0.00 0.00 0.01 0.06 0.17 0.28 0.55 0.89 1.34 2.52 4.76 8.44 13.99 20.49 0 0 0 0 30 30 60 60 180 240 240 600 600 1380 1740 1740
25 0.00 0.00 0.00 0.00 0.02 0.09 0.20 0.32 0.62 1.03 1.48 2.74 5.78 11.20 17.70 24.20 0 0 0 0 30 60 60 60 180 240 240 600 960 1740 1740 1740
30 0.00 0.00 0.00 0.00 0.02 0.12 0.23 0.37 0.74 1.18 1.64 2.92 6.80 13.30 19.80 26.30 0 0 0 0 30 60 60 180 240 240 270 600 1740 1740 1740 1740
40 0.00 0.00 0.00 0.00 0.03 0.14 0.25 0.60 1.05 1.50 2.00 3.49 8.23 14.73 21.23 27.73 0 0 0 0 60 60 60 240 240 240 270 960 1740 1740 1740 1740
50 0.00 0.00 0.00 0.00 0.04 0.16 0.49 0.90 1.35 1.84 2.34 3.69 8.23 14.73 21.23 27.73 0 0 0 0 60 150 210 240 240 270 270 960 1740 1740 1740 1740
60 0.00 0.00 0.00 0.00 0.08 0.37 0.76 1.18 1.65 2.15 2.66 4.00 8.23 14.73 21.23 27.73 0 0 0 0 150 210 210 240 270 270 270 600 1740 1740 1740 1740
70 0.00 0.00 0.00 0.00 0.25 0.61 1.00 1.43 1.93 2.43 2.94 4.41 8.23 14.73 21.23 27.73 0 0 0 0 150 210 210 270 270 270 270 600 1740 1740 1740 1740
80 0.00 0.00 0.00 0.12 0.43 0.82 1.21 1.67 2.18 2.68 3.19 4.81 8.23 14.73 21.23 27.73 0 0 0 150 210 210 210 270 270 270 270 600 1740 1740 1740 1740
90 0.00 0.00 0.00 0.25 0.61 1.00 1.39 1.89 2.40 2.90 3.40 5.22 8.23 14.73 21.23 27.73 0 0 0 150 210 210 210 270 270 270 270 600 1740 1740 1740 1740
100 0.00 0.00 0.08 0.37 0.76 1.15 1.58 2.08 2.59 3.09 3.59 5.61 8.23 14.73 21.23 27.73 0 0 150 210 210 210 270 270 270 270 270 600 1740 1740 1740 1740
322 Hydrologic Considerations for Estimation of Storage-Capacity Requirements of Impounding and Side-Channel Reservoirs for Water Supply in Ohio

03268000 Buck Creek at New Moorefield, Ohio—Continued
Pumpset
Ratio of storage required for pump set to storage required for the primary pump relation (pump set 1) for indicated demand (in fraction of mean
annual streamflow)
0.002 0.010 0.020 0.050 0.100 0.200 0.300
1 1.00 1.00 1.00 1.00 1.00 1.00 1.00
2 2.42 1.79 1.77 1.98 2.58 3.88 4.53
3 1.06 1.01 1.00 1.20 1.44 1.56 2.08
4 1.05 1.00 1.00 1.00 1.17 1.12 1.36
5 1.04 1.00 1.00 1.00 1.09 1.04 1.17
6 1.02 1.00 1.00 1.00 1.03 1.02 1.07
7 2.42 1.82 1.88 2.46 5.22 8.33 10.35
8 1.06 1.01 1.02 1.36 1.82 3.94 6.39
9 1.07 1.01 1.09 1.53 2.41 5.54 10.47
10 1.06 1.01 1.02 1.35 1.90 6.48 14.24
11 1.05 1.02 1.03 1.41 2.01 8.32 17.57
12 1.37 1.20 1.30 1.51 2.42 4.49 6.49
13 1.06 1.00 1.01 1.25 1.67 3.69 7.66
14 1.04 1.01 1.02 1.19 1.70 4.35 11.27
15 1.03 1.03 1.04 1.27 1.86 6.38 14.52
16 1.03 1.01 1.05 1.27 2.05 7.69 17.94
17 1.05 1.00 1.01 1.11 1.60 2.73 6.34
18 1.03 1.01 1.02 1.08 1.64 3.24 9.15
19 1.02 1.02 1.04 1.16 1.78 5.03 12.72
20 1.00 1.02 1.06 1.16 1.99 6.50 16.33
Recurrenceinterval(years)
Normalvariate
Side-channel storage required (in demand days) for primary pump relation to meet indicated demand (in fraction of mean annual streamflow)
0.0020 0.0100 0.0200 0.0500 0.1000 0.2000 0.3000
59.00 2.122 339.87 338.81 329.83 321.12 323.08 465.54 635.17
50.00 2.054 320.08 313.63 307.58 308.47 321.99 459.27 630.78
40.00 1.960 292.58 278.65 276.67 290.89 320.49 450.57 624.69
30.00 1.834 255.62 231.64 235.12 267.26 318.46 438.87 616.50
25.00 1.751 243.62 221.60 229.92 254.51 304.80 432.20 613.30
20.00 1.645 229.93 211.48 226.12 238.66 285.87 423.85 609.50
10.00 1.282 191.44 189.09 195.15 215.70 241.40 339.23 557.73
5.00 0.841 159.67 121.27 137.90 157.79 185.58 241.16 451.32
2.03 0.021 97.67 32.27 29.91 46.07 64.87 123.24 211.98
Hydrologic Design Tables 323

03268500 Beaver Creek near Springfield, Ohio
Location: Latitude 39°56′26″, longitude 83°44′56″, Clark County, Hydrologic Unit 05080001
Drainage area, in square miles: 39.2
Station used for record extension: 03268000
Time period of systematic or extended record analyzed: 1939-10-01 to 1997-09-30
Percentage of estimated values in extended record: 65.8
Eighty-percent-duration streamflow, in cubic feet per second: 9.1
Mean annual streamflow, in inches: 14.25
Location of station used for precipitation data: Columbus, Ohio
Location of station used for potential evapotranspiration data: Columbus, Ohio
[–, indicates a value that could not be determined because there were too few average low-flow values less than the mean stream-flow for the indicated duration]
Recurrenceinterval(years)
Extreme-value
variate
Minimum runoff (in inches) for indicated duration (in days)
180 360 540 720 1080 1440 1800
59.00 4.07 0.81 3.75 5.61 10.44 20.31 29.26 38.20
50.00 3.90 0.89 3.85 5.77 10.79 20.36 29.58 38.29
40.00 3.68 0.99 3.97 5.99 11.27 20.43 30.02 38.42
30.00 3.38 1.13 4.14 6.27 11.88 20.52 30.59 38.58
25.00 3.20 1.14 4.15 6.48 12.30 21.52 30.86 38.93
20.00 2.97 1.14 4.16 6.74 12.81 22.85 31.19 39.40
10.00 2.25 1.22 4.82 8.64 14.52 30.90 48.04 66.79
5.36 1.58 1.44 6.09 13.08 21.77 49.44 62.31 –
324 Hydrologic Considerations for Estimation of Storage-Capacity Requirements of Impounding and Side-Channel Reservoirs for Water Supply in Ohio

03268500 Beaver Creek near Springfield, Ohio—Continued
Recurrenceinterval(years)
Impounding reservoir storage required (in inches) and critical-drawdown duration (in days; shown in gray) for indicated draft rate (in fraction of the mean annual streamflow)
0.02 0.05 0.10 0.15 0.20 0.25 0.30 0.35 0.40 0.45 0.50 0.60 0.70 0.80 0.90 1.00
5 0.00 0.00 0.00 0.02 0.13 0.29 0.65 1.06 1.47 1.88 2.29 3.31 4.48 5.65 6.82 7.99 0 0 0 30 60 150 210 210 210 210 210 300 300 300 300 300
6 0.00 0.00 0.00 0.02 0.14 0.38 0.75 1.16 1.57 1.98 2.41 3.48 4.66 5.83 7.35 9.93 0 0 0 30 90 150 210 210 210 210 270 300 300 300 660 660
8 0.00 0.00 0.00 0.03 0.18 0.50 0.86 1.27 1.68 2.15 2.65 3.75 5.18 7.52 10.07 12.64 0 0 0 30 90 180 210 210 240 240 270 300 600 600 660 660
10 0.00 0.00 0.00 0.04 0.22 0.55 0.91 1.33 1.80 2.27 2.79 4.08 6.42 8.76 11.31 14.06 0 0 0 60 150 180 210 240 240 270 270 600 600 600 660 1020
15 0.00 0.00 0.00 0.06 0.26 0.58 1.01 1.48 1.96 2.50 3.08 5.26 7.60 10.47 14.84 20.22 0 0 0 60 150 180 240 240 270 300 300 600 600 1020 1380 1380
20 0.00 0.00 0.00 0.07 0.28 0.64 1.11 1.59 2.13 2.71 3.59 5.70 8.83 13.49 19.56 26.35 0 0 0 60 150 240 240 270 300 300 540 540 960 1380 1740 1740
25 0.00 0.00 0.00 0.08 0.30 0.72 1.18 1.71 2.29 2.94 3.99 6.59 10.28 16.83 23.62 30.52 0 0 0 60 150 240 240 270 300 540 540 900 1380 1740 1740 1800
30 0.00 0.00 0.00 0.09 0.33 0.79 1.28 1.83 2.41 3.21 4.26 7.42 12.32 19.10 25.98 33.01 0 0 0 60 150 240 270 300 300 540 540 900 1740 1740 1800 1800
40 0.00 0.00 0.00 0.10 0.46 0.94 1.47 2.02 2.61 3.55 4.79 8.30 13.91 20.70 27.71 34.74 0 0 0 150 240 270 270 300 300 540 900 900 1740 1740 1800 1800
50 0.00 0.00 0.00 0.17 0.60 1.09 1.62 2.17 2.75 3.76 5.11 8.62 13.91 20.70 27.71 34.74 0 0 0 150 240 270 270 300 300 540 900 900 1740 1740 1800 1800
60 0.00 0.00 0.00 0.27 0.72 1.23 1.75 2.29 3.04 4.21 5.38 8.62 13.91 20.70 27.71 34.74 0 0 0 210 240 270 270 300 600 600 600 900 1740 1740 1800 1800
70 0.00 0.00 0.01 0.37 0.83 1.34 1.87 2.42 3.59 4.76 5.93 8.62 13.91 20.70 27.71 34.74 0 0 120 210 240 270 270 600 600 600 600 900 1740 1740 1800 1800
80 0.00 0.00 0.08 0.46 0.93 1.45 1.97 2.94 4.11 5.28 6.45 8.79 13.91 20.70 27.71 34.74 0 0 180 240 240 270 270 600 600 600 600 600 1740 1740 1800 1800
90 0.00 0.00 0.15 0.55 1.02 1.54 2.27 3.44 4.61 5.78 6.95 9.29 13.91 20.70 27.71 34.74 0 0 180 240 240 270 600 600 600 600 600 600 1740 1740 1800 1800
100 0.00 0.00 0.22 0.63 1.10 1.62 2.73 3.90 5.07 6.24 7.41 9.75 13.91 20.70 27.71 34.74 0 0 180 240 240 270 600 600 600 600 600 600 1740 1740 1800 1800
Hydrologic Design Tables 325

03268500 Beaver Creek near Springfield, Ohio—Continued
Pumpset
Ratio of storage required for pump set to storage required for the primary pump relation (pump set 1) for indicated demand (in fraction of mean
annual streamflow)
0.002 0.010 0.020 0.050 0.100 0.200 0.300
1 1.00 1.00 1.00 1.00 1.00 1.00 1.00
2 1.70 1.52 1.62 1.82 2.56 4.79 6.12
3 1.07 1.00 1.00 1.20 1.50 1.47 1.98
4 1.05 1.00 1.00 1.00 1.07 1.13 1.19
5 1.04 1.00 1.00 1.00 1.00 1.00 1.05
6 1.02 1.00 1.00 1.00 1.00 1.00 1.02
7 1.70 1.66 1.72 2.55 5.68 9.11 11.62
8 1.07 1.03 1.07 1.47 1.78 3.46 6.19
9 1.07 1.03 1.11 1.56 1.85 4.74 8.46
10 1.06 1.04 1.04 1.34 1.80 4.37 9.50
11 1.10 1.04 1.04 1.20 1.68 4.26 10.73
12 1.07 1.25 1.34 1.62 2.21 4.57 6.97
13 1.07 1.02 1.02 1.26 1.64 2.28 5.66
14 1.05 1.04 1.03 1.10 1.54 2.41 6.42
15 1.08 1.03 1.04 1.11 1.64 2.41 7.04
16 1.06 1.06 1.06 1.15 1.71 2.53 7.54
17 1.06 1.03 1.02 1.06 1.44 1.69 4.35
18 1.04 1.04 1.04 1.08 1.50 1.80 4.95
19 1.07 1.04 1.04 1.08 1.60 1.87 5.69
20 1.04 1.06 1.05 1.14 1.70 1.94 6.12
Recurrenceinterval(years)
Normalvariate
Side-channel storage required (in demand days) for primary pump relation to meet indicated demand (in fraction of mean annual streamflow)
0.0020 0.0100 0.0200 0.0500 0.1000 0.2000 0.3000
59.00 2.122 323.71 333.26 327.52 319.35 315.63 409.48 507.77
50.00 2.054 303.32 305.68 303.34 304.85 308.28 394.44 503.12
40.00 1.960 275.00 267.37 269.74 284.69 298.08 373.54 496.67
30.00 1.834 236.92 215.86 224.58 257.61 284.36 345.45 487.99
25.00 1.751 227.07 210.65 218.52 244.63 266.51 337.49 467.93
20.00 1.645 216.48 207.66 213.83 228.75 242.71 328.71 440.61
10.00 1.282 172.49 174.12 176.42 198.49 215.99 284.75 330.44
5.00 0.841 140.96 114.78 139.71 149.13 187.92 225.85 267.34
2.03 0.021 89.99 36.11 34.57 61.09 94.65 129.47 156.23
326 Hydrologic Considerations for Estimation of Storage-Capacity Requirements of Impounding and Side-Channel Reservoirs for Water Supply in Ohio

03270800 Wolf Creek at Trotwood, Ohio
Location: Latitude 39°47′39″, longitude 84°18′36″, Montgomery County, Hydrologic Unit 05080002
Drainage area, in square miles: 22.7
Station used for record extension: 03271800
Time period of systematic or extended record analyzed: 1962-10-01 to 1997-09-30
Percentage of estimated values in extended record: 31.4
Eighty-percent-duration streamflow, in cubic feet per second: 1.6
Mean annual streamflow, in inches: 14.08
Location of station used for precipitation data: Dayton, Ohio
Location of station used for potential evapotranspiration data: Dayton, Ohio
[–, indicates a value that could not be determined because there were too few average low-flow values less than the mean streamflow for the indicated duration]
Recurrenceinterval(years)
Extreme-value
variate
Minimum runoff (in inches) for indicated duration (in days)
180 360 540 720 1080 1440 1800
36.00 3.57 0.16 2.83 6.45 13.09 22.71 33.16 47.80
30.00 3.38 0.17 2.92 6.65 13.23 23.71 34.76 49.59
25.00 3.20 0.18 3.02 6.86 13.37 24.71 36.37 51.39
20.00 2.97 0.19 3.13 7.11 13.55 25.94 38.35 53.60
10.00 2.25 0.27 4.53 7.58 14.60 28.75 44.00 62.60
5.14 1.53 0.49 5.93 12.12 24.41 41.63 – –
Hydrologic Design Tables 327

03270800 Wolf Creek at Trotwood, Ohio—Continued
Recurrenceinterval(years)
Impounding reservoir storage required (in inches) and critical-drawdown duration (in days; shown in gray) for indicated draft rate (in fraction of the mean annual streamflow)
0.02 0.05 0.10 0.15 0.20 0.25 0.30 0.35 0.40 0.45 0.50 0.60 0.70 0.80 0.90 1.00
5 0.01 0.07 0.25 0.53 0.87 1.22 1.57 1.91 2.26 2.61 3.00 3.92 4.85 5.86 6.90 8.24 30 60 120 180 180 180 180 180 180 180 210 240 240 270 270 540
6 0.01 0.08 0.30 0.64 0.98 1.33 1.75 2.21 2.67 3.14 3.60 4.53 5.47 6.51 8.57 10.65 30 90 150 180 180 180 240 240 240 240 240 240 270 270 540 540
8 0.01 0.12 0.39 0.74 1.13 1.59 2.06 2.52 2.98 3.44 3.91 4.88 6.30 8.38 10.47 12.62 60 120 150 180 210 240 240 240 240 240 240 270 540 540 540 600
10 0.02 0.15 0.44 0.80 1.21 1.64 2.10 2.57 3.03 3.49 4.00 5.04 6.95 9.03 11.29 15.43 60 120 180 210 210 240 240 240 240 240 270 270 540 540 600 1260
15 0.04 0.18 0.49 0.85 1.26 1.66 2.10 2.64 3.22 3.80 4.38 5.62 7.30 9.81 13.28 16.86 120 120 180 210 210 210 240 300 300 300 300 330 540 900 900 960
20 0.05 0.18 0.51 0.88 1.28 1.81 2.39 2.97 3.54 4.12 4.71 5.98 7.35 10.80 14.28 17.98 120 120 180 210 210 300 300 300 300 300 330 330 540 900 960 960
25 0.05 0.19 0.52 0.91 1.40 1.98 2.56 3.13 3.71 4.29 4.87 6.06 7.83 11.30 14.77 18.47 120 150 180 210 300 300 300 300 300 300 300 330 900 900 900 1620
30 0.05 0.20 0.54 0.94 1.49 2.07 2.65 3.23 3.80 4.38 4.96 6.12 8.13 11.60 15.07 20.42 120 150 210 210 300 300 300 300 300 300 300 300 900 900 900 1500
40 0.05 0.21 0.68 1.20 1.72 2.24 2.76 3.30 3.88 4.45 5.03 7.00 11.86 16.72 21.58 26.43 120 240 270 270 270 270 270 300 300 300 300 1260 1260 1260 1260 1260
50 0.08 0.36 0.85 1.37 1.89 2.41 2.93 3.45 4.86 7.29 9.72 14.58 19.44 24.29 29.15 34.01 240 240 270 270 270 270 270 270 1260 1260 1260 1260 1260 1260 1260 1260
60 0.15 0.43 0.94 1.46 1.98 3.19 5.62 8.05 10.48 12.91 15.34 20.20 25.05 29.91 34.77 39.63 240 240 270 270 270 1260 1260 1260 1260 1260 1260 1260 1260 1260 1260 1260
70 0.17 0.47 0.99 2.01 4.44 6.87 9.30 11.73 14.16 16.59 19.02 23.87 28.73 33.59 38.45 43.31 240 270 270 1260 1260 1260 1260 1260 1260 1260 1260 1260 1260 1260 1260 1260
80 0.18 0.49 1.83 4.26 6.69 9.12 11.55 13.98 16.40 18.83 21.26 26.12 30.98 35.84 40.69 46.71 270 270 1260 1260 1260 1260 1260 1260 1260 1260 1260 1260 1260 1260 1260 1800
90 0.20 0.72 3.15 5.58 8.00 10.43 12.86 15.29 17.72 20.15 22.58 27.44 32.29 37.15 43.73 50.67 270 1260 1260 1260 1260 1260 1260 1260 1260 1260 1260 1260 1260 1260 1800 1800
100 0.20 1.47 3.90 6.33 8.76 11.19 13.61 16.04 18.47 20.90 23.33 28.19 33.25 40.08 47.02 53.96 270 1260 1260 1260 1260 1260 1260 1260 1260 1260 1260 1260 1320 1800 1800 1800
328 Hydrologic Considerations for Estimation of Storage-Capacity Requirements of Impounding and Side-Channel Reservoirs for Water Supply in Ohio

03270800 Wolf Creek at Trotwood, Ohio—Continued
Pumpset
Ratio of storage required for pump set to storage required for the primary pump relation (pump set 1) for indicated demand (in fraction of mean
annual streamflow)
0.002 0.010 0.020 0.050 0.100 0.200 0.300
1 1.00 1.00 1.00 1.00 1.00 1.00 1.00
2 1.22 1.45 1.43 1.57 1.75 2.27 3.92
3 1.01 1.21 1.15 1.03 1.00 1.14 1.44
4 1.04 1.10 1.08 1.00 1.00 1.00 1.00
5 1.02 1.02 1.05 1.00 1.00 1.00 1.00
6 1.00 1.00 1.02 1.00 1.00 1.00 1.00
7 1.22 1.51 1.69 1.89 2.26 5.94 12.14
8 1.01 1.23 1.18 1.13 1.13 1.74 2.95
9 1.01 1.26 1.21 1.17 1.31 2.20 5.23
10 1.05 1.22 1.21 1.23 1.20 1.62 3.66
11 1.05 1.19 1.23 1.25 1.22 1.54 3.38
12 1.04 1.26 1.20 1.12 1.43 2.19 3.97
13 1.04 1.19 1.18 1.17 1.14 1.39 2.07
14 1.05 1.17 1.18 1.24 1.19 1.32 1.90
15 1.04 1.13 1.21 1.25 1.20 1.32 1.89
16 1.00 1.12 1.22 1.30 1.20 1.41 1.89
17 1.04 1.15 1.16 1.18 1.14 1.20 1.64
18 1.03 1.10 1.16 1.24 1.17 1.18 1.58
19 1.01 1.08 1.18 1.25 1.19 1.22 1.66
20 1.00 1.07 1.24 1.30 1.20 1.28 1.62
Recurrenceinterval(years)
Normalvariate
Side-channel storage required (in demand days) for primary pump relation to meet indicated demand (in fraction of mean annual streamflow)
0.0020 0.0100 0.0200 0.0500 0.1000 0.2000 0.3000
36.00 1.915 252.24 200.21 211.54 251.33 281.40 292.71 307.22
30.00 1.834 247.33 198.05 208.71 242.14 268.00 278.61 296.65
25.00 1.751 242.25 195.81 205.78 232.64 254.16 264.05 285.72
20.00 1.645 235.80 192.97 202.06 220.57 236.55 245.53 271.83
10.00 1.282 207.98 184.73 181.30 181.90 203.79 230.18 252.43
5.00 0.841 150.85 123.27 118.27 146.54 163.42 199.57 225.88
2.00 0.000 95.97 59.94 60.63 65.46 88.26 105.37 129.59
Hydrologic Design Tables 329
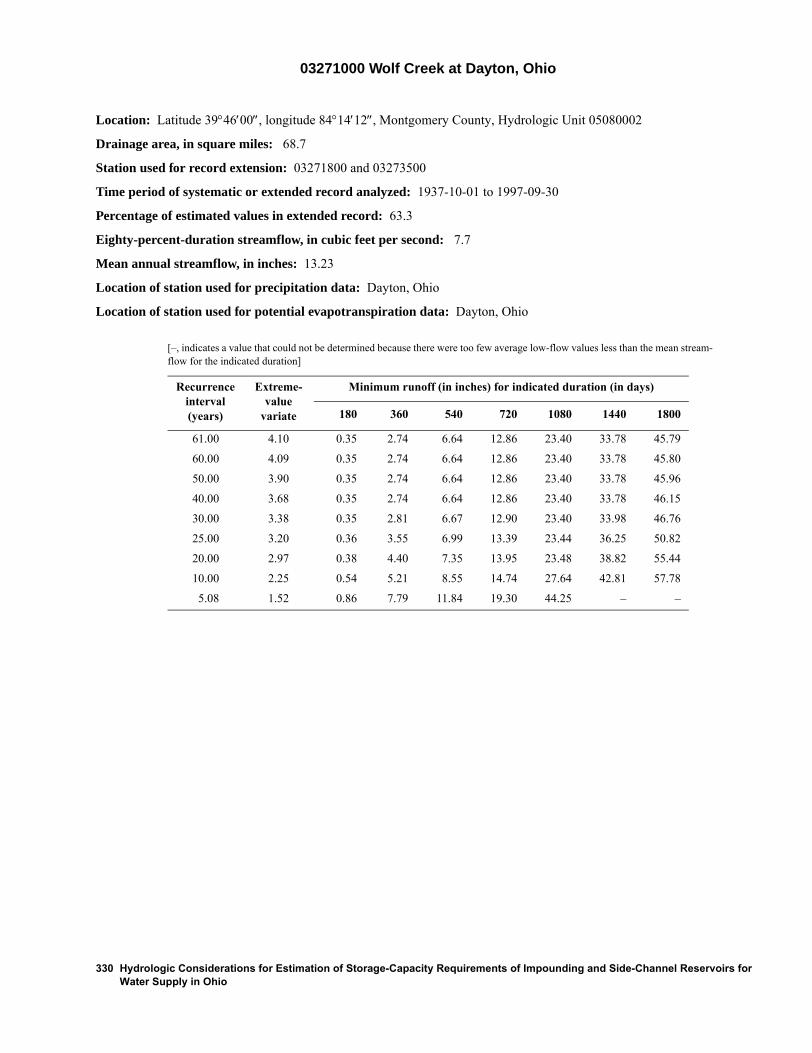
03271000 Wolf Creek at Dayton, Ohio
Location: Latitude 39°46′00″, longitude 84°14′12″, Montgomery County, Hydrologic Unit 05080002
Drainage area, in square miles: 68.7
Station used for record extension: 03271800 and 03273500
Time period of systematic or extended record analyzed: 1937-10-01 to 1997-09-30
Percentage of estimated values in extended record: 63.3
Eighty-percent-duration streamflow, in cubic feet per second: 7.7
Mean annual streamflow, in inches: 13.23
Location of station used for precipitation data: Dayton, Ohio
Location of station used for potential evapotranspiration data: Dayton, Ohio
[–, indicates a value that could not be determined because there were too few average low-flow values less than the mean stream-flow for the indicated duration]
Recurrenceinterval(years)
Extreme-value
variate
Minimum runoff (in inches) for indicated duration (in days)
180 360 540 720 1080 1440 1800
61.00 4.10 0.35 2.74 6.64 12.86 23.40 33.78 45.79
60.00 4.09 0.35 2.74 6.64 12.86 23.40 33.78 45.80
50.00 3.90 0.35 2.74 6.64 12.86 23.40 33.78 45.96
40.00 3.68 0.35 2.74 6.64 12.86 23.40 33.78 46.15
30.00 3.38 0.35 2.81 6.67 12.90 23.40 33.98 46.76
25.00 3.20 0.36 3.55 6.99 13.39 23.44 36.25 50.82
20.00 2.97 0.38 4.40 7.35 13.95 23.48 38.82 55.44
10.00 2.25 0.54 5.21 8.55 14.74 27.64 42.81 57.78
5.08 1.52 0.86 7.79 11.84 19.30 44.25 – –
330 Hydrologic Considerations for Estimation of Storage-Capacity Requirements of Impounding and Side-Channel Reservoirs for Water Supply in Ohio

03271000 Wolf Creek at Dayton, Ohio—Continued
Recurrenceinterval(years)
Impounding reservoir storage required (in inches) and critical-drawdown duration (in days; shown in gray) for indicated draft rate (in fraction of the mean annual streamflow)
0.02 0.05 0.10 0.15 0.20 0.25 0.30 0.35 0.40 0.45 0.50 0.60 0.70 0.80 0.90 1.00
5 0.00 0.01 0.11 0.22 0.39 0.69 1.03 1.41 1.79 2.17 2.55 3.36 4.33 5.31 6.29 7.71 0 30 60 60 120 180 210 210 210 210 210 270 270 270 270 540
6 0.00 0.01 0.11 0.24 0.48 0.81 1.13 1.46 1.84 2.22 2.60 3.39 4.34 5.31 6.87 8.83 0 30 60 120 150 180 180 210 210 210 210 240 270 270 540 540
8 0.00 0.01 0.12 0.35 0.64 0.96 1.29 1.62 2.02 2.46 2.89 3.76 4.63 6.26 8.27 10.44 0 30 90 150 180 180 180 210 240 240 240 240 240 540 600 600
10 0.00 0.02 0.16 0.42 0.74 1.06 1.39 1.81 2.24 2.68 3.11 3.98 5.07 7.03 9.13 11.84 0 60 120 150 180 180 210 240 240 240 240 240 540 540 600 1260
15 0.00 0.03 0.23 0.54 0.88 1.26 1.66 2.10 2.53 3.01 3.50 4.48 6.05 8.60 11.86 15.63 0 60 150 180 210 210 240 240 240 270 270 270 540 900 900 1260
20 0.00 0.04 0.28 0.62 1.00 1.38 1.84 2.33 2.87 3.42 3.96 5.05 7.06 10.32 13.58 17.26 0 60 180 210 210 210 270 270 300 300 300 300 900 900 900 1320
25 0.00 0.04 0.31 0.69 1.07 1.54 2.08 2.62 3.17 3.71 4.25 5.34 8.02 11.28 14.54 18.69 0 90 180 210 210 300 300 300 300 300 300 300 900 900 900 1320
30 0.00 0.05 0.34 0.72 1.14 1.69 2.23 2.77 3.32 3.86 4.41 5.49 8.56 11.82 15.08 19.59 0 120 210 210 300 300 300 300 300 300 300 300 900 900 900 1320
40 0.00 0.05 0.35 0.73 1.24 1.78 2.33 2.87 3.42 3.96 4.50 5.68 8.94 12.20 15.69 20.47 0 120 210 210 300 300 300 300 300 300 300 900 900 900 1320 1320
50 0.00 0.05 0.35 0.73 1.24 1.78 2.33 2.87 3.42 3.96 4.50 5.68 8.94 12.20 15.86 21.32 0 120 210 210 300 300 300 300 300 300 300 900 900 900 1320 1680
60 0.00 0.05 0.35 0.73 1.24 1.78 2.33 2.87 3.42 3.96 4.50 5.94 8.94 12.20 16.58 22.23 0 120 210 210 300 300 300 300 300 300 300 600 900 900 1560 1560
70 0.00 0.05 0.35 0.73 1.24 1.78 2.33 2.87 3.42 3.96 4.50 6.26 8.94 12.20 17.32 23.06 0 120 210 210 300 300 300 300 300 300 300 600 900 900 1560 1620
80 0.00 0.05 0.35 0.73 1.24 1.78 2.33 2.87 3.42 3.96 4.50 6.55 8.94 12.28 18.12 23.99 0 120 210 210 300 300 300 300 300 300 300 600 900 1560 1620 1620
90 0.00 0.05 0.35 0.73 1.24 1.78 2.33 2.87 3.42 3.96 4.65 6.83 9.00 13.13 19.00 24.87 0 120 210 210 300 300 300 300 300 300 600 600 600 1620 1620 1620
100 0.00 0.05 0.35 0.73 1.24 1.78 2.33 2.87 3.42 3.96 4.91 7.09 9.26 13.95 19.82 25.69 0 120 210 210 300 300 300 300 300 300 600 600 600 1620 1620 1620
Hydrologic Design Tables 331

03271000 Wolf Creek at Dayton, Ohio—Continued
Pumpset
Ratio of storage required for pump set to storage required for the primary pump relation (pump set 1) for indicated demand (in fraction of mean
annual streamflow)
0.002 0.010 0.020 0.050 0.100 0.200 0.300
1 1.00 1.00 1.00 1.00 1.00 1.00 1.00
2 1.26 1.16 1.17 1.25 1.58 2.36 9.49
3 1.08 1.06 1.04 1.00 1.00 1.10 1.67
4 1.00 1.00 1.00 1.00 1.00 1.00 1.00
5 1.00 1.00 1.00 1.00 1.00 1.00 1.00
6 1.00 1.00 1.00 1.00 1.00 1.00 1.00
7 1.27 1.24 1.31 1.63 2.51 15.42 26.03
8 1.09 1.11 1.11 1.17 1.11 2.17 7.02
9 1.10 1.12 1.12 1.18 1.41 2.62 15.64
10 1.05 1.10 1.17 1.28 1.24 2.15 12.71
11 1.03 1.10 1.17 1.32 1.26 2.02 11.01
12 1.19 1.14 1.12 1.15 1.45 2.61 11.89
13 1.02 1.07 1.11 1.19 1.20 1.69 2.75
14 1.02 1.06 1.15 1.28 1.24 1.52 2.65
15 1.02 1.07 1.17 1.30 1.25 1.59 2.75
16 1.07 1.13 1.18 1.37 1.27 1.55 2.61
17 1.00 1.02 1.07 1.19 1.19 1.32 2.25
18 1.02 1.05 1.14 1.28 1.24 1.41 2.19
19 1.02 1.07 1.19 1.30 1.25 1.46 2.23
20 1.07 1.13 1.18 1.37 1.25 1.44 2.14
Recurrenceinterval(years)
Normalvariate
Side-channel storage required (in demand days) for primary pump relation to meet indicated demand (in fraction of mean annual streamflow)
0.0020 0.0100 0.0200 0.0500 0.1000 0.2000 0.3000
61.00 2.135 246.23 226.05 227.70 249.21 280.67 302.87 315.21
60.00 2.128 246.16 225.97 227.60 248.94 280.01 302.21 314.64
50.00 2.054 245.36 225.11 226.47 245.92 272.65 294.75 308.20
40.00 1.960 244.35 224.03 225.04 242.10 263.36 285.35 300.08
30.00 1.834 242.95 222.02 222.87 236.76 251.31 272.96 289.64
25.00 1.751 241.53 214.86 218.63 231.04 248.09 267.59 287.82
20.00 1.645 238.20 206.31 212.99 223.93 243.57 260.72 285.23
10.00 1.282 185.87 153.89 148.45 159.53 180.47 204.38 244.51
5.00 0.841 134.08 98.00 104.40 117.88 138.92 167.25 195.27
2.03 0.021 92.36 66.81 62.29 76.83 88.00 119.66 135.28
332 Hydrologic Considerations for Estimation of Storage-Capacity Requirements of Impounding and Side-Channel Reservoirs for Water Supply in Ohio

03271800 Twin Creek near Ingomar, Ohio
Location: Latitude 39°42′28″, longitude 84°31′30″, Preble County, Hydrologic Unit 05080002
Drainage area, in square miles: 197.
Station used for record extension: 03223000
Time period of systematic or extended record analyzed: 1960-07-01 to 1997-09-30
Percentage of estimated values in extended record: 6.0
Eighty-percent-duration streamflow, in cubic feet per second: 17.
Mean annual streamflow, in inches: 13.88
Location of station used for precipitation data: Dayton, Ohio
Location of station used for potential evapotranspiration data: Dayton, Ohio
[–, indicates a value that could not be determined because there were too few average low-flow values less than the mean streamflow for the indicated duration]
Recurrenceinterval(years)
Extreme-value
variate
Minimum runoff (in inches) for indicated duration (in days)
180 360 540 720 1080 1440 1800
38.00 3.62 0.24 2.66 6.58 13.11 24.37 34.38 44.92
30.00 3.38 0.25 2.86 6.62 13.27 24.40 35.83 47.94
25.00 3.20 0.25 3.02 6.66 13.40 24.42 36.96 50.28
20.00 2.97 0.26 3.22 6.70 13.55 24.45 38.34 53.15
10.00 2.25 0.32 5.11 7.63 14.55 29.89 44.80 60.63
5.43 1.59 0.48 5.79 12.06 18.52 45.62 – –
Hydrologic Design Tables 333

03271800 Twin Creek near Ingomar, Ohio—Continued
Recurrenceinterval(years)
Impounding reservoir storage required (in inches) and critical-drawdown duration (in days; shown in gray) for indicated draft rate (in fraction of the mean annual streamflow)
0.02 0.05 0.10 0.15 0.20 0.25 0.30 0.35 0.40 0.45 0.50 0.60 0.70 0.80 0.90 1.00
5 0.00 0.04 0.23 0.52 0.86 1.21 1.55 1.90 2.30 2.70 3.10 3.97 5.00 6.03 7.05 8.51 0 60 120 180 180 180 180 210 210 210 210 270 270 270 270 600
6 0.00 0.05 0.29 0.60 0.94 1.28 1.63 2.01 2.41 2.82 3.27 4.19 5.17 6.19 8.44 10.72 0 60 150 180 180 180 180 210 210 240 240 240 270 270 600 600
8 0.00 0.07 0.35 0.68 1.02 1.37 1.77 2.18 2.64 3.09 3.55 4.46 6.04 8.09 10.14 12.40 30 120 150 180 180 210 210 240 240 240 240 240 540 540 540 600
10 0.00 0.09 0.37 0.71 1.07 1.47 1.87 2.31 2.76 3.22 3.68 4.78 6.83 8.88 10.93 13.12 30 120 180 180 210 210 210 240 240 240 240 540 540 540 540 900
15 0.00 0.10 0.41 0.80 1.20 1.60 2.00 2.56 3.13 3.70 4.27 5.41 7.39 9.44 12.12 16.20 30 120 180 210 210 210 210 300 300 300 300 300 540 540 900 1380
20 0.00 0.11 0.46 0.86 1.25 1.73 2.30 2.87 3.44 4.01 4.58 5.72 7.47 10.12 13.54 17.87 30 120 210 210 210 300 300 300 300 300 300 300 540 900 900 1380
25 0.00 0.11 0.48 0.88 1.30 1.87 2.44 3.01 3.58 4.15 4.72 5.86 7.63 11.06 14.48 19.40 30 120 210 210 300 300 300 300 300 300 300 300 900 900 900 1680
30 0.00 0.12 0.48 0.88 1.36 1.93 2.50 3.07 3.64 4.21 4.78 5.92 8.30 11.72 15.51 21.89 30 120 210 210 270 300 300 300 300 300 300 300 900 900 1680 1680
40 0.00 0.13 0.48 0.94 1.45 1.97 2.50 3.07 3.64 4.21 4.78 6.74 9.18 14.52 20.90 27.29 30 150 210 270 270 270 300 300 300 300 300 600 900 1680 1680 1680
50 0.00 0.15 0.51 0.98 1.50 2.01 2.52 3.07 3.70 4.84 5.98 8.26 13.49 19.88 26.26 32.65 30 150 240 270 270 270 270 300 600 600 600 600 1680 1680 1680 1680
60 0.01 0.17 0.58 1.04 1.51 2.03 2.73 3.87 5.01 6.15 7.29 12.02 18.41 24.79 31.18 37.57 90 150 240 240 270 270 600 600 600 600 600 1680 1680 1680 1680 1680
70 0.02 0.18 0.64 1.09 1.55 2.63 3.77 4.91 6.05 7.19 9.95 16.33 22.72 29.10 35.49 41.87 90 150 240 240 240 600 600 600 600 600 1680 1680 1680 1680 1680 1680
80 0.03 0.23 0.69 1.15 2.30 3.44 4.58 5.72 7.87 10.43 13.62 20.01 26.40 32.78 39.41 46.25 90 240 240 600 600 600 600 600 1140 1680 1680 1680 1680 1680 1800 1800
90 0.04 0.27 0.72 1.76 2.90 4.04 5.89 8.06 10.33 13.52 16.72 23.10 29.49 36.29 43.13 49.97 150 240 240 600 600 600 1140 1140 1680 1680 1680 1680 1680 1800 1800 1800
100 0.06 0.30 1.06 2.20 3.36 5.52 7.69 9.85 12.91 16.10 19.29 25.72 32.56 39.40 46.24 53.08 150 240 600 600 1140 1140 1140 1140 1680 1680 1680 1800 1800 1800 1800 1800
334 Hydrologic Considerations for Estimation of Storage-Capacity Requirements of Impounding and Side-Channel Reservoirs for Water Supply in Ohio

03271800 Twin Creek near Ingomar, Ohio—Continued
Pumpset
Ratio of storage required for pump set to storage required for the primary pump relation (pump set 1) for indicated demand (in fraction of mean
annual streamflow)
0.002 0.010 0.020 0.050 0.100 0.200 0.300
1 1.00 1.00 1.00 1.00 1.00 1.00 1.00
2 1.38 1.31 1.29 1.36 1.79 2.51 4.99
3 1.12 1.09 1.05 1.01 1.00 1.16 1.68
4 1.04 1.00 1.00 1.00 1.00 1.00 1.00
5 1.00 1.00 1.00 1.00 1.00 1.00 1.00
6 1.00 1.00 1.00 1.00 1.00 1.00 1.00
7 1.37 1.39 1.41 1.85 2.50 6.86 13.69
8 1.14 1.13 1.09 1.11 1.15 2.11 3.18
9 1.13 1.12 1.13 1.14 1.34 2.73 6.27
10 1.10 1.12 1.11 1.20 1.22 2.26 3.99
11 1.07 1.11 1.10 1.23 1.23 1.95 3.49
12 1.17 1.14 1.13 1.08 1.45 2.59 4.94
13 1.07 1.08 1.11 1.13 1.13 1.67 2.78
14 1.07 1.05 1.08 1.20 1.21 1.36 2.50
15 1.02 1.08 1.10 1.21 1.22 1.42 2.48
16 1.04 1.10 1.14 1.27 1.23 1.47 2.51
17 1.03 1.04 1.09 1.13 1.13 1.26 2.21
18 1.04 1.05 1.09 1.20 1.21 1.24 1.97
19 1.02 1.09 1.10 1.21 1.22 1.30 1.97
20 1.05 1.07 1.14 1.27 1.21 1.32 2.01
Recurrenceinterval(years)
Normalvariate
Side-channel storage required (in demand days) for primary pump relation to meet indicated demand (in fraction of mean annual streamflow)
0.0020 0.0100 0.0200 0.0500 0.1000 0.2000 0.3000
38.00 1.938 254.05 233.16 237.39 262.03 285.18 301.23 312.00
30.00 1.834 253.09 230.18 235.76 255.44 272.09 286.62 303.48
25.00 1.751 252.32 227.80 234.46 250.16 261.63 274.93 296.66
20.00 1.645 251.34 224.78 232.81 243.45 248.31 260.07 287.99
10.00 1.282 235.69 195.26 199.70 199.40 205.15 222.66 256.08
5.00 0.841 191.46 153.32 151.38 161.67 173.01 208.53 220.79
2.00 0.000 117.02 69.17 78.00 94.53 107.46 125.64 137.13
Hydrologic Design Tables 335

03272700 Sevenmile Creek at Camden, Ohio
Location: Latitude 39°37′45″, longitude 84°38′40″, Preble County, Hydrologic Unit 05080002
Drainage area, in square miles: 69.0
Station used for record extension: 03272800
Time period of systematic or extended record analyzed: 1960-07-01 to 1997-09-30
Percentage of estimated values in extended record: 28.0
Eighty-percent-duration streamflow, in cubic feet per second: 6.8
Mean annual streamflow, in inches: 14.71
Location of station used for precipitation data: Dayton, Ohio
Location of station used for potential evapotranspiration data: Dayton, Ohio
[–, indicates a value that could not be determined because there were too few average low-flow values less than the mean stream-flow for the indicated duration]
Recurrenceinterval(years)
Extreme-value
variate
Minimum runoff (in inches) for indicated duration (in days)
180 360 540 720 1080 1440 1800
38.00 3.62 0.13 3.36 6.90 11.46 25.45 39.15 54.32
30.00 3.38 0.19 3.59 7.57 12.73 25.68 40.66 55.66
25.00 3.20 0.24 3.76 8.08 13.72 25.86 41.84 56.71
20.00 2.97 0.30 3.98 8.71 14.93 26.08 43.28 57.98
10.00 2.25 0.42 4.96 10.30 17.41 32.53 45.57 59.65
5.43 1.59 0.52 6.94 11.25 21.49 41.24 – –
336 Hydrologic Considerations for Estimation of Storage-Capacity Requirements of Impounding and Side-Channel Reservoirs for Water Supply in Ohio

03272700 Sevenmile Creek at Camden, Ohio—Continued
Recurrenceinterval(years)
Impounding reservoir storage required (in inches) and critical-drawdown duration (in days; shown in gray) for indicated draft rate (in fraction of the mean annual streamflow)
0.02 0.05 0.10 0.15 0.20 0.25 0.30 0.35 0.40 0.45 0.50 0.60 0.70 0.80 0.90 1.00
5 0.01 0.05 0.24 0.56 0.92 1.28 1.64 2.01 2.37 2.80 3.22 4.17 5.14 6.21 8.14 10.32 30 30 150 180 180 180 180 180 210 210 210 240 240 270 540 540
6 0.01 0.05 0.25 0.61 0.97 1.33 1.70 2.12 2.54 2.97 3.44 4.45 5.54 6.63 8.45 11.10 30 60 150 180 180 180 210 210 210 210 240 270 270 270 540 1260
8 0.01 0.08 0.29 0.65 1.01 1.42 1.84 2.26 2.69 3.11 3.65 4.74 5.83 7.00 9.14 12.80 30 60 150 180 180 210 210 210 210 210 270 270 270 300 600 1260
10 0.01 0.09 0.33 0.67 1.06 1.48 1.90 2.32 2.75 3.19 3.74 4.91 6.12 7.56 10.21 13.95 60 60 150 180 210 210 210 210 210 270 270 300 300 660 660 1380
15 0.03 0.14 0.41 0.72 1.14 1.57 1.99 2.41 2.91 3.52 4.12 5.33 6.82 9.48 12.59 16.84 60 120 150 180 210 210 210 210 300 300 300 300 660 660 960 1680
20 0.04 0.17 0.46 0.80 1.22 1.65 2.07 2.58 3.19 3.79 4.40 5.60 7.75 10.40 13.84 17.74 90 120 150 210 210 210 210 300 300 300 300 300 660 660 960 1020
25 0.04 0.19 0.49 0.88 1.30 1.73 2.21 2.82 3.42 4.03 4.63 5.84 8.21 10.89 14.57 18.44 90 150 150 210 210 210 300 300 300 300 300 300 660 900 960 960
30 0.04 0.21 0.53 0.96 1.38 1.87 2.42 3.03 3.63 4.23 4.84 6.05 8.41 11.36 15.05 18.92 120 150 210 210 210 270 300 300 300 300 300 300 660 900 960 960
40 0.05 0.25 0.65 1.18 1.72 2.26 2.81 3.37 3.97 4.57 5.18 6.77 9.18 12.05 15.67 21.85 150 180 210 270 270 270 270 300 300 300 300 600 600 720 960 1680
50 0.08 0.32 0.86 1.41 1.95 2.49 3.04 3.62 4.22 4.82 5.43 7.84 10.74 13.64 19.30 26.07 180 240 270 270 270 270 270 300 300 300 300 720 720 720 1680 1680
60 0.12 0.44 0.98 1.52 2.07 2.61 3.19 3.80 4.40 5.00 6.33 9.23 12.13 17.79 25.04 32.29 240 270 270 270 270 270 300 300 300 300 720 720 720 1800 1800 1800
70 0.17 0.49 1.04 1.58 2.12 2.71 3.32 3.92 4.62 6.07 7.52 10.42 16.99 24.24 31.49 38.74 270 270 270 270 270 300 300 300 720 720 720 720 1800 1800 1800 1800
80 0.19 0.52 1.06 1.61 2.20 2.80 3.41 4.19 5.64 7.09 8.63 15.53 22.78 30.03 37.28 44.53 270 270 270 270 300 300 300 720 720 720 1500 1800 1800 1800 1800 1800
90 0.21 0.53 1.08 1.66 2.26 2.87 3.60 5.05 6.50 9.65 13.28 20.52 27.77 35.02 42.27 49.52 270 270 270 300 300 300 720 720 720 1800 1800 1800 1800 1800 1800 1800
100 0.21 0.54 1.10 1.70 2.31 2.91 4.33 6.61 10.24 13.86 17.48 24.73 31.98 39.23 46.48 53.73 270 270 300 300 300 300 720 1800 1800 1800 1800 1800 1800 1800 1800 1800
Hydrologic Design Tables 337

03272700 Sevenmile Creek at Camden, Ohio—Continued
Pumpset
Ratio of storage required for pump set to storage required for the primary pump relation (pump set 1) for indicated demand (in fraction of mean
annual streamflow)
0.002 0.010 0.020 0.050 0.100 0.200 0.300
1 1.00 1.00 1.00 1.00 1.00 1.00 1.00
2 1.68 1.36 1.34 1.28 1.56 2.15 3.66
3 1.20 1.13 1.12 1.08 1.01 1.00 1.33
4 1.03 1.02 1.07 1.03 1.00 1.00 1.00
5 1.01 1.00 1.04 1.00 1.00 1.00 1.00
6 1.00 1.00 1.02 1.00 1.00 1.00 1.00
7 1.69 1.38 1.39 1.60 2.25 5.75 12.64
8 1.20 1.17 1.15 1.19 1.09 1.56 2.49
9 1.20 1.16 1.21 1.23 1.18 1.91 4.06
10 1.11 1.13 1.18 1.31 1.18 1.54 2.57
11 1.05 1.12 1.27 1.28 1.21 1.48 2.34
12 1.25 1.20 1.20 1.16 1.33 2.04 3.10
13 1.11 1.10 1.16 1.19 1.16 1.26 1.90
14 1.02 1.06 1.17 1.28 1.19 1.15 1.73
15 1.10 1.09 1.21 1.28 1.22 1.18 1.79
16 1.09 1.04 1.22 1.30 1.19 1.22 1.94
17 1.04 1.05 1.14 1.18 1.16 1.12 1.49
18 1.03 1.03 1.15 1.28 1.19 1.15 1.60
19 1.10 1.07 1.18 1.28 1.22 1.18 1.69
20 1.08 1.04 1.20 1.30 1.19 1.18 1.86
Recurrenceinterval(years)
Normalvariate
Side-channel storage required (in demand days) for primary pump relation to meet indicated demand (in fraction of mean annual streamflow)
0.0020 0.0100 0.0200 0.0500 0.1000 0.2000 0.3000
38.00 1.938 204.93 210.94 210.65 240.54 274.48 293.29 302.09
30.00 1.834 204.79 198.60 202.18 230.06 255.60 271.24 286.90
25.00 1.751 204.68 188.72 195.40 221.68 240.51 253.59 274.74
20.00 1.645 204.54 176.17 186.78 211.03 221.31 231.16 259.29
10.00 1.282 189.78 166.13 167.90 177.17 200.52 213.16 244.77
5.00 0.841 137.48 117.60 123.66 155.09 178.23 197.54 213.05
2.00 0.000 97.39 61.93 60.12 77.62 100.35 120.89 135.62
338 Hydrologic Considerations for Estimation of Storage-Capacity Requirements of Impounding and Side-Channel Reservoirs for Water Supply in Ohio

03272800 Sevenmile Creek at Collinsville, Ohio
Location: Latitude 39°31′23″, longitude 84°36′39″, Butler County, Hydrologic Unit 05080002
Drainage area, in square miles: 120.
Station used for record extension: 03272700
Time period of systematic or extended record analyzed: 1960-07-01 to 1997-09-30
Percentage of estimated values in extended record: 67.1
Eighty-percent-duration streamflow, in cubic feet per second: 8.5
Mean annual streamflow, in inches: 13.17
Location of station used for precipitation data: Dayton, Ohio
Location of station used for potential evapotranspiration data: Dayton, Ohio
[–, indicates a value that could not be determined because there were too few average low-flow values less than the mean streamflow for the indicated duration]
Recurrenceinterval(years)
Extreme-value
variate
Minimum runoff (in inches) for indicated duration (in days)
180 360 540 720 1080 1440 1800
38.00 3.62 0.33 2.95 6.10 10.18 22.99 35.54 49.44
30.00 3.38 0.33 2.95 6.48 10.95 23.22 36.96 50.68
25.00 3.20 0.33 2.96 6.78 11.55 23.41 38.05 51.63
20.00 2.97 0.33 2.96 7.15 12.29 23.63 39.40 52.81
10.00 2.25 0.35 4.17 7.97 15.51 28.47 39.96 55.45
5.43 1.59 0.51 6.24 12.09 19.60 42.12 57.67 –
Hydrologic Design Tables 339
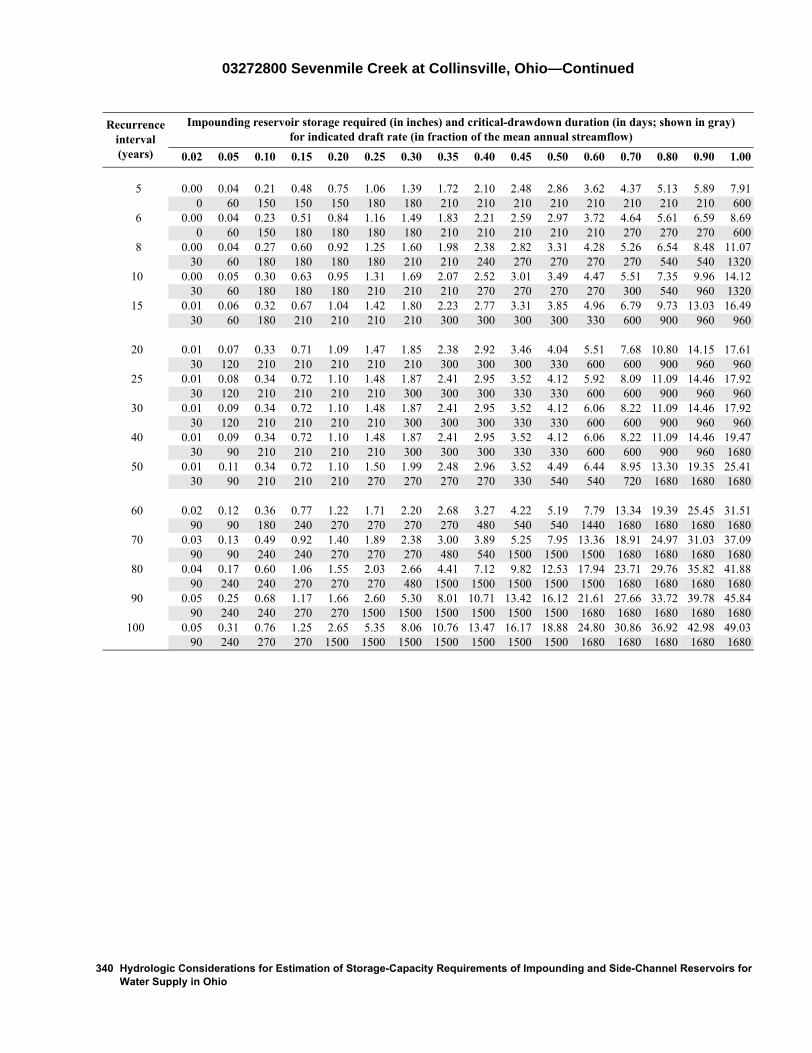
03272800 Sevenmile Creek at Collinsville, Ohio—Continued
Recurrenceinterval(years)
Impounding reservoir storage required (in inches) and critical-drawdown duration (in days; shown in gray) for indicated draft rate (in fraction of the mean annual streamflow)
0.02 0.05 0.10 0.15 0.20 0.25 0.30 0.35 0.40 0.45 0.50 0.60 0.70 0.80 0.90 1.00
5 0.00 0.04 0.21 0.48 0.75 1.06 1.39 1.72 2.10 2.48 2.86 3.62 4.37 5.13 5.89 7.91 0 60 150 150 150 180 180 210 210 210 210 210 210 210 210 600
6 0.00 0.04 0.23 0.51 0.84 1.16 1.49 1.83 2.21 2.59 2.97 3.72 4.64 5.61 6.59 8.69 0 60 150 180 180 180 180 210 210 210 210 210 270 270 270 600
8 0.00 0.04 0.27 0.60 0.92 1.25 1.60 1.98 2.38 2.82 3.31 4.28 5.26 6.54 8.48 11.07 30 60 180 180 180 180 210 210 240 270 270 270 270 540 540 1320
10 0.00 0.05 0.30 0.63 0.95 1.31 1.69 2.07 2.52 3.01 3.49 4.47 5.51 7.35 9.96 14.12 30 60 180 180 180 210 210 210 270 270 270 270 300 540 960 1320
15 0.01 0.06 0.32 0.67 1.04 1.42 1.80 2.23 2.77 3.31 3.85 4.96 6.79 9.73 13.03 16.49 30 60 180 210 210 210 210 300 300 300 300 330 600 900 960 960
20 0.01 0.07 0.33 0.71 1.09 1.47 1.85 2.38 2.92 3.46 4.04 5.51 7.68 10.80 14.15 17.61 30 120 210 210 210 210 210 300 300 300 330 600 600 900 960 960
25 0.01 0.08 0.34 0.72 1.10 1.48 1.87 2.41 2.95 3.52 4.12 5.92 8.09 11.09 14.46 17.92 30 120 210 210 210 210 300 300 300 330 330 600 600 900 960 960
30 0.01 0.09 0.34 0.72 1.10 1.48 1.87 2.41 2.95 3.52 4.12 6.06 8.22 11.09 14.46 17.92 30 120 210 210 210 210 300 300 300 330 330 600 600 900 960 960
40 0.01 0.09 0.34 0.72 1.10 1.48 1.87 2.41 2.95 3.52 4.12 6.06 8.22 11.09 14.46 19.47 30 90 210 210 210 210 300 300 300 330 330 600 600 900 960 1680
50 0.01 0.11 0.34 0.72 1.10 1.50 1.99 2.48 2.96 3.52 4.49 6.44 8.95 13.30 19.35 25.41 30 90 210 210 210 270 270 270 270 330 540 540 720 1680 1680 1680
60 0.02 0.12 0.36 0.77 1.22 1.71 2.20 2.68 3.27 4.22 5.19 7.79 13.34 19.39 25.45 31.51 90 90 180 240 270 270 270 270 480 540 540 1440 1680 1680 1680 1680
70 0.03 0.13 0.49 0.92 1.40 1.89 2.38 3.00 3.89 5.25 7.95 13.36 18.91 24.97 31.03 37.09 90 90 240 240 270 270 270 480 540 1500 1500 1500 1680 1680 1680 1680
80 0.04 0.17 0.60 1.06 1.55 2.03 2.66 4.41 7.12 9.82 12.53 17.94 23.71 29.76 35.82 41.88 90 240 240 270 270 270 480 1500 1500 1500 1500 1500 1680 1680 1680 1680
90 0.05 0.25 0.68 1.17 1.66 2.60 5.30 8.01 10.71 13.42 16.12 21.61 27.66 33.72 39.78 45.84 90 240 240 270 270 1500 1500 1500 1500 1500 1500 1680 1680 1680 1680 1680
100 0.05 0.31 0.76 1.25 2.65 5.35 8.06 10.76 13.47 16.17 18.88 24.80 30.86 36.92 42.98 49.03 90 240 270 270 1500 1500 1500 1500 1500 1500 1500 1680 1680 1680 1680 1680
340 Hydrologic Considerations for Estimation of Storage-Capacity Requirements of Impounding and Side-Channel Reservoirs for Water Supply in Ohio

03272800 Sevenmile Creek at Collinsville, Ohio—Continued
Pumpset
Ratio of storage required for pump set to storage required for the primary pump relation (pump set 1) for indicated demand (in fraction of mean
annual streamflow)
0.002 0.010 0.020 0.050 0.100 0.200 0.300
1 1.00 1.00 1.00 1.00 1.00 1.00 1.00
2 2.85 1.47 1.23 1.25 1.37 1.93 2.07
3 1.09 1.17 1.05 1.00 1.00 1.06 1.20
4 1.00 1.05 1.01 1.00 1.00 1.00 1.02
5 1.00 1.01 1.00 1.00 1.00 1.00 1.00
6 1.00 1.00 1.00 1.00 1.00 1.00 1.00
7 2.97 1.57 1.35 1.46 1.95 3.45 12.55
8 1.12 1.28 1.16 1.03 1.12 1.61 2.09
9 1.18 1.36 1.19 1.07 1.22 1.84 2.40
10 1.10 1.32 1.17 1.06 1.30 1.70 2.48
11 1.15 1.39 1.20 1.12 1.27 1.75 2.42
12 1.30 1.33 1.15 1.03 1.17 1.94 2.27
13 1.06 1.27 1.17 1.07 1.17 1.34 1.99
14 1.10 1.26 1.18 1.05 1.25 1.45 2.00
15 1.15 1.35 1.21 1.11 1.22 1.49 2.04
16 1.12 1.33 1.20 1.10 1.32 1.53 2.28
17 1.06 1.25 1.15 1.07 1.12 1.33 1.70
18 1.10 1.22 1.18 1.06 1.21 1.44 1.87
19 1.15 1.32 1.21 1.11 1.20 1.50 1.93
20 1.12 1.33 1.21 1.10 1.30 1.53 2.18
Recurrenceinterval(years)
Normalvariate
Side-channel storage required (in demand days) for primary pump relation to meet indicated demand (in fraction of mean annual streamflow)
0.0020 0.0100 0.0200 0.0500 0.1000 0.2000 0.3000
38.00 1.938 90.96 155.74 192.09 216.34 218.64 221.25 248.64
30.00 1.834 83.58 153.85 188.48 213.40 216.81 220.64 248.36
25.00 1.751 77.68 152.34 185.58 211.05 215.34 220.16 248.13
20.00 1.645 70.18 150.41 181.91 208.07 213.47 219.54 247.85
10.00 1.282 61.78 131.78 155.00 170.67 193.45 207.14 234.66
5.00 0.841 56.55 90.09 103.87 128.89 148.35 175.42 194.99
2.00 0.000 21.00 49.85 53.81 66.04 90.48 110.17 129.60
Hydrologic Design Tables 341

03273500 Fourmile Creek near Hamilton, Ohio
Location: Latitude 39°27′30″, longitude 84°32′50″, Butler County, Hydrologic Unit 05080002
Drainage area, in square miles: 307.
Station used for record extension: 03241500
Time period of systematic or extended record analyzed: 1937-10-01 to 1997-09-30
Percentage of estimated values in extended record: 61.7
Eighty-percent-duration streamflow, in cubic feet per second: 13.
Mean annual streamflow, in inches: 17.46
Location of station used for precipitation data: Dayton, Ohio
Location of station used for potential evapotranspiration data: Dayton, Ohio
[–, indicates a value that could not be determined because there were too few average low-flow values less than the mean stream-flow for the indicated duration]
Recurrenceinterval(years)
Extreme-value
variate
Minimum runoff (in inches) for indicated duration (in days)
180 360 540 720 1080 1440 1800
61.00 4.10 0.09 1.53 1.94 5.86 18.16 31.65 43.11
60.00 4.09 0.09 1.54 1.96 5.92 18.16 31.73 43.33
50.00 3.90 0.10 1.66 2.16 6.61 18.17 32.59 45.82
40.00 3.68 0.10 1.80 2.40 7.46 18.18 33.64 48.86
30.00 3.38 0.11 2.07 2.89 8.61 18.80 35.43 52.89
25.00 3.20 0.17 3.09 4.96 9.93 25.38 41.11 56.37
20.00 2.97 0.23 4.27 7.33 11.57 32.89 47.65 60.54
10.00 2.25 0.37 5.16 10.71 18.63 38.01 55.36 76.75
5.08 1.52 0.55 8.15 15.35 23.77 44.49 – –
342 Hydrologic Considerations for Estimation of Storage-Capacity Requirements of Impounding and Side-Channel Reservoirs for Water Supply in Ohio

03273500 Fourmile Creek near Hamilton, Ohio—Continued
Recurrenceinterval(years)
Impounding reservoir storage required (in inches) and critical-drawdown duration (in days; shown in gray) for indicated draft rate (in fraction of the mean annual streamflow)
0.02 0.05 0.10 0.15 0.20 0.25 0.30 0.35 0.40 0.45 0.50 0.60 0.70 0.80 0.90 1.00
5 0.01 0.14 0.43 0.79 1.22 1.65 2.11 2.62 3.17 3.74 4.32 5.46 6.72 8.01 9.30 13.28 30 120 120 180 180 180 210 210 240 240 240 240 270 270 270 900
6 0.02 0.15 0.43 0.81 1.24 1.67 2.15 2.66 3.23 3.80 4.38 5.61 6.90 8.27 9.71 13.28 30 120 120 180 180 180 210 240 240 240 240 270 270 300 300 900
8 0.02 0.16 0.46 0.86 1.29 1.73 2.23 2.79 3.36 3.94 4.56 5.92 7.35 8.79 11.21 14.37 60 120 150 180 180 210 210 240 240 240 270 300 300 300 660 660
10 0.02 0.17 0.49 0.92 1.35 1.81 2.33 2.91 3.48 4.09 4.74 6.16 7.59 10.12 13.28 18.46 60 120 150 180 180 210 240 240 240 270 270 300 300 660 660 1260
15 0.03 0.19 0.59 1.02 1.46 2.00 2.57 3.14 3.76 4.41 5.35 8.15 11.02 13.90 17.59 23.40 60 120 180 180 210 240 240 240 270 270 540 600 600 660 900 1740
20 0.04 0.23 0.65 1.08 1.59 2.16 2.73 3.53 4.82 6.16 7.59 10.46 13.33 17.08 21.38 27.11 90 150 180 180 240 240 240 540 540 600 600 600 600 900 900 1800
25 0.05 0.26 0.69 1.14 1.71 2.28 3.46 4.76 6.10 7.54 8.97 11.84 15.27 19.57 23.87 30.15 120 180 180 210 240 240 540 540 600 600 600 600 900 900 900 1620
30 0.06 0.29 0.72 1.22 1.80 2.95 4.24 5.54 6.98 8.41 9.85 12.72 16.94 21.25 25.55 32.67 120 180 180 240 240 540 540 600 600 600 600 600 900 900 900 1620
40 0.08 0.32 0.78 1.35 2.55 3.84 5.13 6.53 7.97 9.40 10.84 14.63 18.93 23.23 29.14 36.88 150 180 210 240 540 540 540 600 600 600 600 900 900 900 1620 1620
50 0.09 0.34 0.85 1.73 3.02 4.31 5.60 7.02 8.46 9.89 11.41 15.63 19.93 25.08 32.83 40.57 150 180 240 540 540 540 540 600 600 600 840 900 900 1620 1620 1620
60 0.10 0.37 0.91 1.99 3.28 4.57 5.86 7.27 8.71 10.22 12.23 16.24 21.09 29.12 37.15 45.34 150 210 240 540 540 540 540 600 600 840 840 840 1680 1680 1680 1740
70 0.11 0.39 0.98 2.14 3.44 4.73 6.02 7.39 8.84 10.75 12.76 17.64 25.67 33.70 41.79 50.11 150 210 270 540 540 540 540 600 660 840 840 1680 1680 1680 1740 1740
80 0.11 0.41 1.07 2.24 3.53 4.82 6.11 7.45 9.09 11.10 13.88 21.81 29.84 37.87 46.16 54.48 150 210 300 540 540 540 540 660 840 840 1260 1680 1680 1680 1740 1740
90 0.12 0.45 1.16 2.28 3.57 4.86 6.16 7.58 10.39 13.47 17.48 25.51 33.55 41.76 50.08 58.40 210 300 300 540 540 540 540 660 1260 1680 1680 1680 1680 1740 1740 1740
100 0.14 0.51 1.23 2.30 3.59 4.88 6.55 9.56 12.69 16.71 20.73 28.76 36.90 45.22 53.54 61.85 210 300 300 540 540 540 1260 1260 1680 1680 1680 1680 1740 1740 1740 1740
Hydrologic Design Tables 343

03273500 Fourmile Creek near Hamilton, Ohio—Continued
Pumpset
Ratio of storage required for pump set to storage required for the primary pump relation (pump set 1) for indicated demand (in fraction of mean
annual streamflow)
0.002 0.010 0.020 0.050 0.100 0.200 0.300
1 1.00 1.00 1.00 1.00 1.00 1.00 1.00
2 1.01 1.10 1.27 1.50 1.52 1.22 3.93
3 1.00 1.01 1.04 1.00 1.28 1.09 1.09
4 1.00 1.00 1.00 1.00 1.10 1.00 1.02
5 1.00 1.00 1.00 1.00 1.03 1.00 1.00
6 1.00 1.00 1.00 1.00 1.01 1.00 1.00
7 1.01 1.22 1.42 1.84 1.91 6.65 12.54
8 1.01 1.04 1.06 1.47 1.75 1.42 2.90
9 1.01 1.04 1.10 1.63 1.95 1.62 5.87
10 1.01 1.05 1.11 1.65 2.04 1.70 4.84
11 1.01 1.07 1.14 1.68 2.08 1.79 3.78
12 1.01 1.06 1.07 1.53 1.75 1.42 5.01
13 1.01 1.01 1.09 1.39 1.83 1.47 2.03
14 1.01 1.04 1.11 1.43 1.92 1.54 2.12
15 1.00 1.10 1.12 1.47 1.94 1.65 2.18
16 1.00 1.14 1.13 1.52 1.99 1.71 2.63
17 1.01 1.01 1.09 1.20 1.74 1.37 1.55
18 1.00 1.05 1.11 1.30 1.81 1.43 1.66
19 1.00 1.09 1.15 1.33 1.83 1.56 1.71
20 1.00 1.13 1.13 1.45 1.94 1.60 2.12
Recurrenceinterval(years)
Normalvariate
Side-channel storage required (in demand days) for primary pump relation to meet indicated demand (in fraction of mean annual streamflow)
0.0020 0.0100 0.0200 0.0500 0.1000 0.2000 0.3000
61.00 2.135 210.57 192.88 190.68 207.85 261.82 419.96 477.60
60.00 2.128 209.93 192.59 190.66 207.77 261.11 419.31 477.34
50.00 2.054 202.79 189.34 190.48 206.81 253.18 412.00 474.36
40.00 1.960 193.76 185.23 190.25 205.61 243.16 402.78 470.61
30.00 1.834 182.28 179.11 188.64 203.86 230.18 386.04 458.63
25.00 1.751 181.59 168.77 173.76 201.23 226.71 328.82 376.97
20.00 1.645 179.74 156.10 155.93 196.34 222.12 260.62 279.96
10.00 1.282 136.84 137.93 139.64 155.74 181.84 210.27 241.94
5.00 0.841 102.62 96.72 106.11 128.43 149.94 172.90 199.96
2.03 0.021 49.46 39.23 45.43 56.13 79.71 104.63 132.25
344 Hydrologic Considerations for Estimation of Storage-Capacity Requirements of Impounding and Side-Channel Reservoirs for Water Supply in Ohio
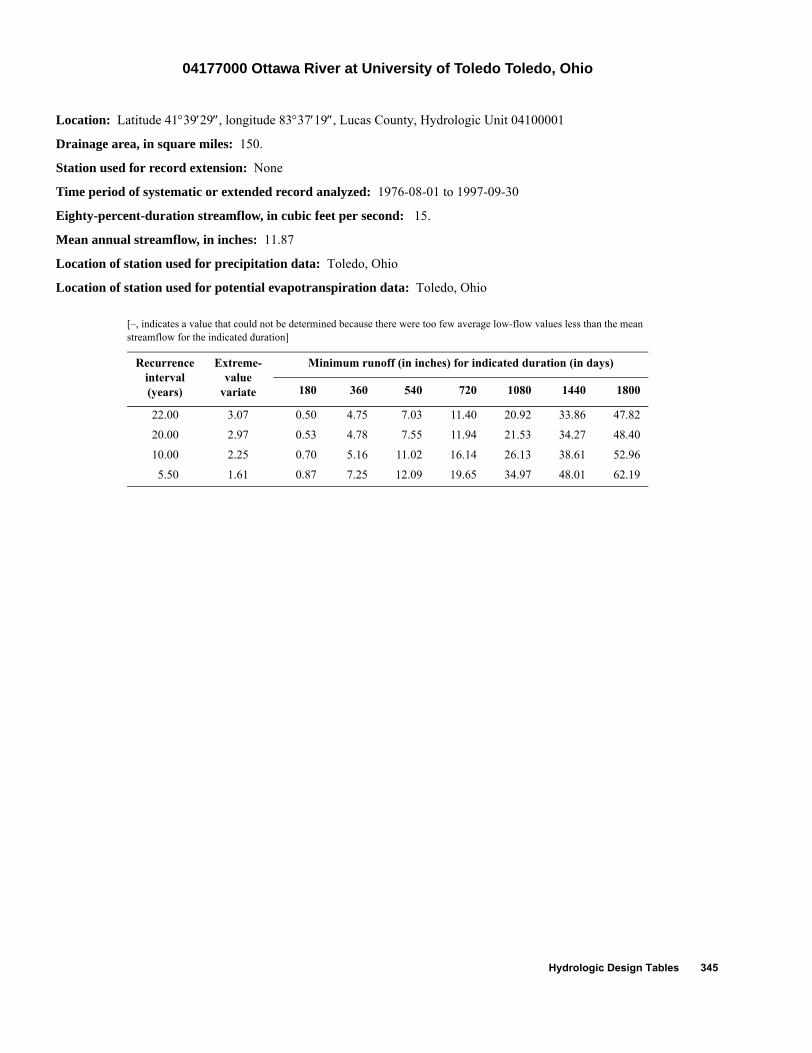
04177000 Ottawa River at University of Toledo Toledo, Ohio
Location: Latitude 41°39′29″, longitude 83°37′19″, Lucas County, Hydrologic Unit 04100001
Drainage area, in square miles: 150.
Station used for record extension: None
Time period of systematic or extended record analyzed: 1976-08-01 to 1997-09-30
Eighty-percent-duration streamflow, in cubic feet per second: 15.
Mean annual streamflow, in inches: 11.87
Location of station used for precipitation data: Toledo, Ohio
Location of station used for potential evapotranspiration data: Toledo, Ohio
[–, indicates a value that could not be determined because there were too few average low-flow values less than the mean streamflow for the indicated duration]
Recurrenceinterval(years)
Extreme-value
variate
Minimum runoff (in inches) for indicated duration (in days)
180 360 540 720 1080 1440 1800
22.00 3.07 0.50 4.75 7.03 11.40 20.92 33.86 47.82
20.00 2.97 0.53 4.78 7.55 11.94 21.53 34.27 48.40
10.00 2.25 0.70 5.16 11.02 16.14 26.13 38.61 52.96
5.50 1.61 0.87 7.25 12.09 19.65 34.97 48.01 62.19
Hydrologic Design Tables 345

04177000 Ottawa River at University of Toledo Toledo, Ohio—Continued
Recurrenceinterval(years)
Impounding reservoir storage required (in inches) and critical-drawdown duration (in days; shown in gray) for indicated draft rate (in fraction of the mean annual streamflow)
0.02 0.05 0.10 0.15 0.20 0.25 0.30 0.35 0.40 0.45 0.50 0.60 0.70 0.80 0.90 1.00
5 0.00 0.02 0.07 0.21 0.41 0.60 0.80 1.08 1.42 1.76 2.10 2.79 3.47 4.15 4.83 6.17 0 30 60 90 120 120 120 210 210 210 210 210 210 210 210 840
6 0.00 0.02 0.09 0.25 0.44 0.65 0.94 1.23 1.53 1.82 2.11 2.79 3.47 4.16 4.84 6.17 0 30 90 120 120 180 180 180 180 180 180 210 210 210 210 840
8 0.00 0.02 0.10 0.28 0.50 0.74 1.03 1.33 1.62 1.91 2.20 2.81 3.49 4.42 5.49 8.44 0 30 90 120 150 180 180 180 180 180 180 210 210 330 330 960
10 0.00 0.02 0.10 0.28 0.51 0.76 1.05 1.35 1.64 1.93 2.22 2.86 3.63 4.56 5.89 9.27 0 30 90 120 150 180 180 180 180 180 180 210 240 330 900 1140
15 0.00 0.02 0.11 0.28 0.51 0.81 1.10 1.39 1.71 2.05 2.39 3.08 4.32 6.46 9.79 14.08 0 30 90 120 150 180 180 180 210 210 210 300 660 660 1320 1320
20 0.00 0.03 0.13 0.33 0.62 0.93 1.27 1.61 1.95 2.29 2.64 3.79 5.94 8.15 12.44 16.73 30 30 90 180 180 210 210 210 210 210 210 660 660 1320 1320 1320
25 0.01 0.04 0.16 0.46 0.80 1.14 1.48 1.82 2.16 2.50 3.00 5.00 8.12 11.24 14.36 17.48 30 30 180 210 210 210 210 210 210 210 600 960 960 960 960 960
30 0.01 0.04 0.29 0.62 0.96 1.30 1.64 1.98 2.59 4.15 5.71 8.83 11.95 15.07 18.19 21.37 30 30 180 210 210 210 210 210 960 960 960 960 960 960 960 1020
40 0.02 0.16 0.48 0.82 1.69 3.25 4.81 6.37 7.93 9.49 11.05 14.17 17.36 20.67 23.98 27.30 30 180 210 210 960 960 960 960 960 960 960 960 1020 1020 1020 1020
50 0.06 0.24 1.20 2.76 4.32 5.88 7.44 9.00 10.59 12.25 13.91 17.22 20.54 23.85 27.17 30.48 180 210 960 960 960 960 960 960 1020 1020 1020 1020 1020 1020 1020 1020
60 0.10 0.78 2.34 3.90 5.46 7.12 8.78 10.44 12.09 13.75 15.41 18.72 22.04 25.35 28.67 33.11 180 960 960 960 1020 1020 1020 1020 1020 1020 1020 1020 1020 1020 1020 1800
70 0.31 1.25 2.81 4.47 6.13 7.78 9.44 11.10 12.76 14.41 16.07 19.39 22.70 26.03 31.88 37.73 960 960 1020 1020 1020 1020 1020 1020 1020 1020 1020 1020 1020 1800 1800 1800
80 0.50 1.44 3.10 4.76 6.41 8.07 9.73 11.39 13.04 14.70 16.36 19.67 24.00 29.85 35.70 41.55 960 1020 1020 1020 1020 1020 1020 1020 1020 1020 1020 1020 1800 1800 1800 1800
90 0.57 1.56 3.22 4.88 6.54 8.19 9.85 11.51 13.17 14.85 16.70 21.28 27.13 32.98 38.83 44.68 960 1020 1020 1020 1020 1020 1020 1020 1020 1140 1140 1800 1800 1800 1800 1800
100 0.62 1.62 3.27 4.93 6.59 8.25 9.92 11.77 13.63 15.48 17.98 23.83 29.68 35.53 41.38 47.221020 1020 1020 1020 1020 1020 1140 1140 1140 1140 1800 1800 1800 1800 1800 1800
346 Hydrologic Considerations for Estimation of Storage-Capacity Requirements of Impounding and Side-Channel Reservoirs for Water Supply in Ohio

04177000 Ottawa River at University of Toledo Toledo, Ohio—Continued
Pumpset
Ratio of storage required for pump set to storage required for the primary pump relation (pump set 1) for indicated demand (in fraction of mean
annual streamflow)
0.002 0.010 0.020 0.050 0.100 0.200 0.300
1 1.00 1.00 1.00 1.00 1.00 1.00 1.00
2 1.60 1.98 1.89 1.25 1.06 2.04 5.95
3 1.06 1.47 1.54 1.13 1.02 1.00 1.21
4 1.00 1.06 1.16 1.04 1.00 1.00 1.00
5 1.00 1.00 1.00 1.00 1.00 1.00 1.00
6 1.00 1.00 1.00 1.00 1.00 1.00 1.00
7 1.60 2.21 2.08 1.34 1.91 8.77 16.02
8 1.06 1.76 1.73 1.27 1.10 1.73 2.73
9 1.06 1.91 1.86 1.32 1.23 2.33 5.88
10 1.01 1.58 1.71 1.33 1.28 1.95 3.06
11 1.07 1.49 1.61 1.50 1.32 2.03 2.74
12 1.14 1.90 1.87 1.27 1.11 2.07 5.81
13 1.03 1.52 1.68 1.26 1.24 1.64 2.43
14 1.01 1.18 1.52 1.28 1.29 1.61 2.36
15 1.07 1.26 1.46 1.49 1.34 1.77 2.34
16 1.07 1.28 1.52 1.52 1.37 1.83 2.44
17 1.03 1.21 1.53 1.23 1.24 1.38 2.05
18 1.01 1.18 1.41 1.28 1.28 1.42 2.24
19 1.07 1.26 1.31 1.49 1.34 1.58 2.20
20 1.07 1.29 1.40 1.52 1.37 1.67 2.35
Recurrenceinterval(years)
Normalvariate
Side-channel storage required (in demand days) for primary pump relation to meet indicated demand (in fraction of mean annual streamflow)
0.0020 0.0100 0.0200 0.0500 0.1000 0.2000 0.3000
22.00 1.691 69.19 72.22 84.62 140.34 176.70 195.86 202.03
20.00 1.645 65.56 71.55 83.03 136.87 174.80 194.98 201.57
10.00 1.282 40.82 64.52 71.65 111.53 154.89 181.70 193.71
5.00 0.841 39.58 50.76 55.10 91.64 115.31 141.40 169.90
2.00 0.000 24.00 36.51 39.06 60.01 82.47 120.84 134.93
Hydrologic Design Tables 347

04184500 Bean Creek at Powers, Ohio
Location: Latitude 41°40′39″, longitude 84°13′56″, Fulton County, Hydrologic Unit 04100006
Drainage area, in square miles: 206.
Station used for record extension: None
Time period of systematic or extended record analyzed: 1955-01-01 to 1981-09-30
Eighty-percent-duration streamflow, in cubic feet per second: 24.
Mean annual streamflow, in inches: 10.85
Location of station used for precipitation data: Toledo, Ohio
Location of station used for potential evapotranspiration data: Toledo, Ohio
[–, indicates a value that could not be determined because there were too few average low-flow values less than the mean stream-flow for the indicated duration]
Recurrenceinterval(years)
Extreme-value
variate
Minimum runoff (in inches) for indicated duration (in days)
180 360 540 720 1080 1440 1800
27.00 3.28 0.34 1.85 2.65 5.68 11.48 19.03 28.00
25.00 3.20 0.35 2.07 3.19 6.51 12.86 20.58 30.09
20.00 2.97 0.37 2.73 4.77 8.93 16.87 25.10 36.18
10.00 2.25 0.50 4.07 8.23 13.38 25.78 37.49 49.84
5.40 1.59 0.77 5.78 8.71 16.91 29.50 – –
348 Hydrologic Considerations for Estimation of Storage-Capacity Requirements of Impounding and Side-Channel Reservoirs for Water Supply in Ohio

04184500 Bean Creek at Powers, Ohio—Continued
Recurrenceinterval(years)
Impounding reservoir storage required (in inches) and critical-drawdown duration (in days; shown in gray) for indicated draft rate (in fraction of the mean annual streamflow)
0.02 0.05 0.10 0.15 0.20 0.25 0.30 0.35 0.40 0.45 0.50 0.60 0.70 0.80 0.90 1.00
5 0.00 0.00 0.04 0.16 0.33 0.55 0.79 1.06 1.36 1.67 1.99 2.79 3.60 4.43 5.55 7.33 0 0 60 90 150 150 180 180 210 210 270 270 270 300 540 600
6 0.00 0.00 0.05 0.17 0.37 0.62 0.93 1.24 1.55 1.87 2.21 2.92 3.64 4.43 5.88 7.66 0 0 60 120 150 210 210 210 210 210 240 240 240 300 600 600
8 0.00 0.00 0.06 0.23 0.51 0.82 1.13 1.45 1.81 2.17 2.52 3.24 4.01 4.90 5.91 7.93 0 0 60 150 210 210 210 240 240 240 240 240 300 300 600 720
10 0.00 0.00 0.08 0.31 0.61 0.93 1.28 1.64 2.00 2.39 2.81 3.71 4.60 5.49 6.47 8.41 0 30 120 180 210 240 240 240 240 270 300 300 300 300 480 1260
15 0.00 0.00 0.16 0.47 0.87 1.27 1.72 2.16 2.61 3.05 3.50 4.39 5.29 6.50 9.22 12.15 0 30 150 270 270 270 300 300 300 300 300 300 330 480 960 1320
20 0.00 0.00 0.19 0.59 0.99 1.41 1.86 2.30 2.75 3.19 3.65 5.37 8.22 11.07 13.92 17.56 0 30 180 270 270 300 300 300 300 300 330 960 960 960 960 1440
25 0.00 0.01 0.19 0.59 0.99 1.41 1.86 2.40 3.41 4.84 6.26 9.11 11.96 14.82 19.04 24.03 0 60 180 270 270 300 300 600 960 960 960 960 960 960 1680 1680
30 0.00 0.01 0.19 0.59 1.24 2.13 3.31 4.82 6.34 7.85 9.36 12.39 16.11 21.10 26.08 31.07 0 60 180 270 540 600 1020 1020 1020 1020 1020 1020 1680 1680 1680 1680
40 0.00 0.13 1.05 2.57 4.08 5.60 7.11 8.63 10.99 13.49 15.98 20.97 25.96 30.95 35.94 40.93 0 540 1020 1020 1020 1020 1020 1020 1680 1680 1680 1680 1680 1680 1680 1680
50 0.11 0.88 2.39 3.91 6.02 8.52 11.01 13.51 16.00 18.50 20.99 25.98 30.97 35.96 41.00 46.34 600 1020 1020 1020 1680 1680 1680 1680 1680 1680 1680 1680 1680 1680 1800 1800
60 0.40 1.31 3.30 5.80 8.29 10.79 13.28 15.78 18.27 20.76 23.26 28.35 33.70 39.04 44.39 49.731020 1020 1680 1680 1680 1680 1680 1680 1680 1680 1680 1800 1800 1800 1800 1800
70 0.54 1.78 4.28 6.77 9.27 11.76 14.26 16.77 19.44 22.12 24.79 30.13 35.48 40.82 46.17 51.511020 1680 1680 1680 1680 1680 1680 1800 1800 1800 1800 1800 1800 1800 1800 1800
80 0.70 2.20 4.69 7.18 9.68 12.35 15.02 17.70 20.37 23.04 25.71 31.06 36.40 41.75 47.09 52.441680 1680 1680 1680 1680 1800 1800 1800 1800 1800 1800 1800 1800 1800 1800 1800
90 0.87 2.37 4.86 7.48 10.16 12.83 15.50 18.17 20.85 23.52 26.19 31.54 36.88 42.23 47.57 52.921680 1680 1680 1800 1800 1800 1800 1800 1800 1800 1800 1800 1800 1800 1800 1800
100 0.94 2.44 5.06 7.73 10.41 13.08 15.75 18.42 21.10 23.77 26.44 31.79 37.13 42.48 47.82 53.171680 1680 1800 1800 1800 1800 1800 1800 1800 1800 1800 1800 1800 1800 1800 1800
Hydrologic Design Tables 349

04184500 Bean Creek at Powers, Ohio—Continued
Pumpset
Ratio of storage required for pump set to storage required for the primary pump relation (pump set 1) for indicated demand (in fraction of mean
annual streamflow)
0.002 0.010 0.020 0.050 0.100 0.200 0.300
1 1.00 1.00 1.00 1.00 1.00 1.00 1.00
2 3.28 2.78 2.63 2.63 2.79 2.54 2.34
3 1.00 1.00 1.00 1.20 1.79 1.62 1.21
4 1.00 1.00 1.00 1.00 1.00 1.30 1.08
5 1.00 1.00 1.00 1.00 1.00 1.12 1.02
6 1.00 1.00 1.00 1.00 1.00 1.03 1.00
7 3.27 2.83 2.73 3.11 3.82 4.35 6.04
8 1.00 1.00 1.01 1.61 2.38 1.96 1.81
9 1.01 1.02 1.06 1.86 2.45 2.14 2.59
10 1.01 1.02 1.02 1.16 2.36 2.15 2.29
11 1.02 1.01 1.02 1.11 2.22 2.15 2.21
12 1.75 1.67 1.78 2.17 2.54 2.19 2.33
13 1.01 1.02 1.02 1.09 2.00 1.94 1.64
14 1.01 1.02 1.02 1.10 1.89 2.01 1.61
15 1.02 1.03 1.02 1.11 1.76 2.03 1.69
16 1.02 1.03 1.06 1.17 1.86 2.10 1.91
17 1.01 1.02 1.01 1.09 1.63 1.81 1.46
18 1.01 1.02 1.02 1.10 1.54 1.92 1.49
19 1.02 1.01 1.02 1.12 1.64 1.96 1.58
20 1.02 1.03 1.06 1.17 1.85 2.04 1.77
Recurrenceinterval(years)
Normalvariate
Side-channel storage required (in demand days) for primary pump relation to meet indicated demand (in fraction of mean annual streamflow)
0.0020 0.0100 0.0200 0.0500 0.1000 0.2000 0.3000
27.00 1.787 307.29 294.45 290.58 286.50 297.75 446.66 672.27
25.00 1.751 306.13 290.80 286.58 284.84 296.32 432.62 650.18
20.00 1.645 302.69 279.92 274.66 279.89 292.06 390.77 584.36
10.00 1.282 265.59 231.26 227.74 234.94 252.56 308.04 373.10
5.00 0.841 142.14 121.19 124.54 160.93 188.34 209.45 253.34
2.08 0.046 99.11 77.76 79.98 86.73 108.56 141.62 173.07
350 Hydrologic Considerations for Estimation of Storage-Capacity Requirements of Impounding and Side-Channel Reservoirs for Water Supply in Ohio
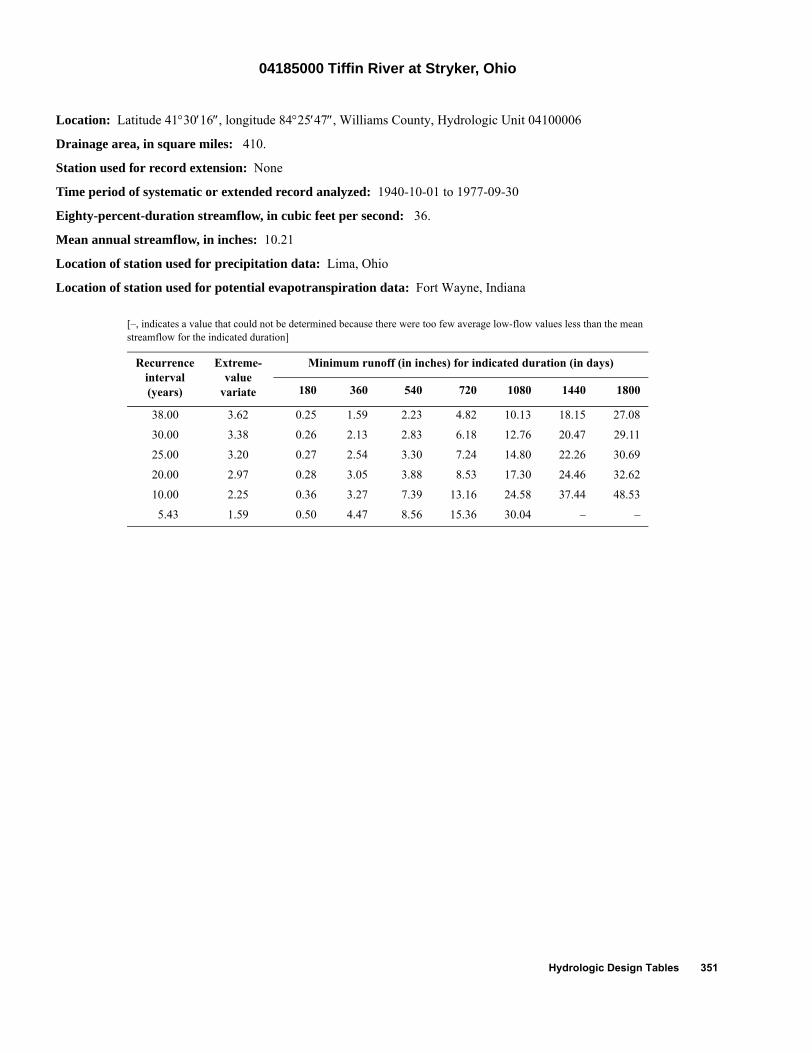
04185000 Tiffin River at Stryker, Ohio
Location: Latitude 41°30′16″, longitude 84°25′47″, Williams County, Hydrologic Unit 04100006
Drainage area, in square miles: 410.
Station used for record extension: None
Time period of systematic or extended record analyzed: 1940-10-01 to 1977-09-30
Eighty-percent-duration streamflow, in cubic feet per second: 36.
Mean annual streamflow, in inches: 10.21
Location of station used for precipitation data: Lima, Ohio
Location of station used for potential evapotranspiration data: Fort Wayne, Indiana
[–, indicates a value that could not be determined because there were too few average low-flow values less than the mean streamflow for the indicated duration]
Recurrenceinterval(years)
Extreme-value
variate
Minimum runoff (in inches) for indicated duration (in days)
180 360 540 720 1080 1440 1800
38.00 3.62 0.25 1.59 2.23 4.82 10.13 18.15 27.08
30.00 3.38 0.26 2.13 2.83 6.18 12.76 20.47 29.11
25.00 3.20 0.27 2.54 3.30 7.24 14.80 22.26 30.69
20.00 2.97 0.28 3.05 3.88 8.53 17.30 24.46 32.62
10.00 2.25 0.36 3.27 7.39 13.16 24.58 37.44 48.53
5.43 1.59 0.50 4.47 8.56 15.36 30.04 – –
Hydrologic Design Tables 351
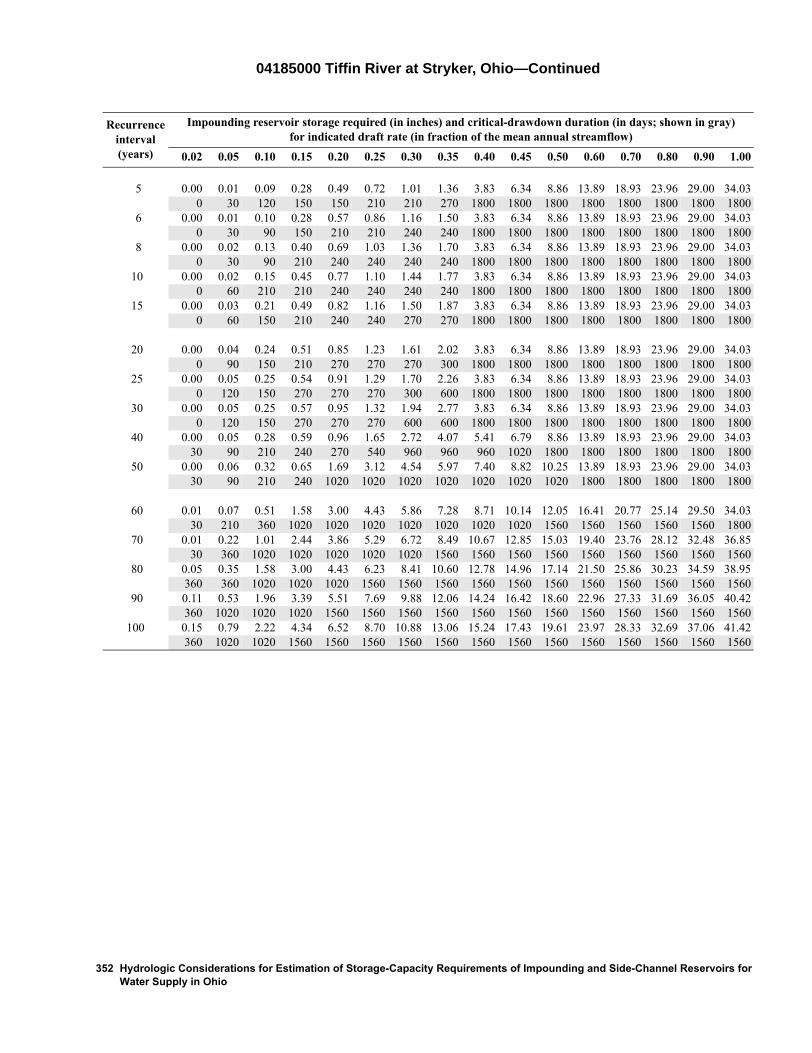
04185000 Tiffin River at Stryker, Ohio—Continued
Recurrenceinterval(years)
Impounding reservoir storage required (in inches) and critical-drawdown duration (in days; shown in gray) for indicated draft rate (in fraction of the mean annual streamflow)
0.02 0.05 0.10 0.15 0.20 0.25 0.30 0.35 0.40 0.45 0.50 0.60 0.70 0.80 0.90 1.00
5 0.00 0.01 0.09 0.28 0.49 0.72 1.01 1.36 3.83 6.34 8.86 13.89 18.93 23.96 29.00 34.03 0 30 120 150 150 210 210 270 1800 1800 1800 1800 1800 1800 1800 1800
6 0.00 0.01 0.10 0.28 0.57 0.86 1.16 1.50 3.83 6.34 8.86 13.89 18.93 23.96 29.00 34.03 0 30 90 150 210 210 240 240 1800 1800 1800 1800 1800 1800 1800 1800
8 0.00 0.02 0.13 0.40 0.69 1.03 1.36 1.70 3.83 6.34 8.86 13.89 18.93 23.96 29.00 34.03 0 30 90 210 240 240 240 240 1800 1800 1800 1800 1800 1800 1800 1800
10 0.00 0.02 0.15 0.45 0.77 1.10 1.44 1.77 3.83 6.34 8.86 13.89 18.93 23.96 29.00 34.03 0 60 210 210 240 240 240 240 1800 1800 1800 1800 1800 1800 1800 1800
15 0.00 0.03 0.21 0.49 0.82 1.16 1.50 1.87 3.83 6.34 8.86 13.89 18.93 23.96 29.00 34.03 0 60 150 210 240 240 270 270 1800 1800 1800 1800 1800 1800 1800 1800
20 0.00 0.04 0.24 0.51 0.85 1.23 1.61 2.02 3.83 6.34 8.86 13.89 18.93 23.96 29.00 34.03 0 90 150 210 270 270 270 300 1800 1800 1800 1800 1800 1800 1800 1800
25 0.00 0.05 0.25 0.54 0.91 1.29 1.70 2.26 3.83 6.34 8.86 13.89 18.93 23.96 29.00 34.03 0 120 150 270 270 270 300 600 1800 1800 1800 1800 1800 1800 1800 1800
30 0.00 0.05 0.25 0.57 0.95 1.32 1.94 2.77 3.83 6.34 8.86 13.89 18.93 23.96 29.00 34.03 0 120 150 270 270 270 600 600 1800 1800 1800 1800 1800 1800 1800 1800
40 0.00 0.05 0.28 0.59 0.96 1.65 2.72 4.07 5.41 6.79 8.86 13.89 18.93 23.96 29.00 34.03 30 90 210 240 270 540 960 960 960 1020 1800 1800 1800 1800 1800 1800
50 0.00 0.06 0.32 0.65 1.69 3.12 4.54 5.97 7.40 8.82 10.25 13.89 18.93 23.96 29.00 34.03 30 90 210 240 1020 1020 1020 1020 1020 1020 1020 1800 1800 1800 1800 1800
60 0.01 0.07 0.51 1.58 3.00 4.43 5.86 7.28 8.71 10.14 12.05 16.41 20.77 25.14 29.50 34.03 30 210 360 1020 1020 1020 1020 1020 1020 1020 1560 1560 1560 1560 1560 1800
70 0.01 0.22 1.01 2.44 3.86 5.29 6.72 8.49 10.67 12.85 15.03 19.40 23.76 28.12 32.48 36.85 30 360 1020 1020 1020 1020 1020 1560 1560 1560 1560 1560 1560 1560 1560 1560
80 0.05 0.35 1.58 3.00 4.43 6.23 8.41 10.60 12.78 14.96 17.14 21.50 25.86 30.23 34.59 38.95 360 360 1020 1020 1020 1560 1560 1560 1560 1560 1560 1560 1560 1560 1560 1560
90 0.11 0.53 1.96 3.39 5.51 7.69 9.88 12.06 14.24 16.42 18.60 22.96 27.33 31.69 36.05 40.42 360 1020 1020 1020 1560 1560 1560 1560 1560 1560 1560 1560 1560 1560 1560 1560
100 0.15 0.79 2.22 4.34 6.52 8.70 10.88 13.06 15.24 17.43 19.61 23.97 28.33 32.69 37.06 41.42 360 1020 1020 1560 1560 1560 1560 1560 1560 1560 1560 1560 1560 1560 1560 1560
352 Hydrologic Considerations for Estimation of Storage-Capacity Requirements of Impounding and Side-Channel Reservoirs for Water Supply in Ohio

04185000 Tiffin River at Stryker, Ohio—Continued
Pumpset
Ratio of storage required for pump set to storage required for the primary pump relation (pump set 1) for indicated demand (in fraction of mean
annual streamflow)
0.002 0.010 0.020 0.050 0.100 0.200 0.300
1 1.00 1.00 1.00 1.00 1.00 1.00 1.00
2 3.54 2.91 2.82 2.59 2.87 3.04 3.06
3 1.16 1.01 1.01 1.15 1.81 1.64 1.17
4 1.01 1.00 1.00 1.00 1.00 1.29 1.05
5 1.00 1.00 1.00 1.00 1.00 1.13 1.00
6 1.00 1.00 1.00 1.00 1.00 1.04 1.00
7 3.57 3.00 2.99 2.96 3.79 5.81 7.18
8 1.17 1.02 1.05 1.60 2.38 2.04 1.93
9 1.17 1.03 1.06 1.81 2.60 2.31 3.05
10 1.09 1.04 1.07 1.27 2.44 2.21 2.43
11 1.02 1.04 1.10 1.25 2.17 2.19 1.92
12 1.61 1.58 1.80 2.06 2.59 2.35 2.88
13 1.09 1.03 1.03 1.12 2.10 1.97 1.57
14 1.01 1.01 1.06 1.12 1.91 2.07 1.49
15 1.01 1.02 1.10 1.14 1.66 2.05 1.54
16 1.00 1.03 1.15 1.17 1.82 2.19 1.62
17 1.02 1.02 1.03 1.08 1.66 1.86 1.42
18 1.01 1.01 1.06 1.12 1.51 1.98 1.47
19 1.00 1.03 1.11 1.13 1.52 1.99 1.53
20 1.00 1.03 1.14 1.17 1.77 2.18 1.61
Recurrenceinterval(years)
Normalvariate
Side-channel storage required (in demand days) for primary pump relation to meet indicated demand (in fraction of mean annual streamflow)
0.0020 0.0100 0.0200 0.0500 0.1000 0.2000 0.3000
38.00 1.938 338.67 274.62 262.63 279.88 288.39 431.27 683.71
30.00 1.834 332.56 265.93 257.64 278.34 286.83 393.82 618.65
25.00 1.751 327.68 258.98 253.65 277.10 285.58 363.87 566.61
20.00 1.645 321.47 250.14 248.57 275.53 283.99 325.78 500.43
10.00 1.282 256.30 230.65 233.93 243.68 252.39 296.70 345.85
5.00 0.841 206.11 139.68 138.14 157.32 195.77 231.87 258.55
2.00 0.000 148.92 90.18 87.14 95.43 105.88 136.10 169.99
Hydrologic Design Tables 353

04185440 Unnamed Trib to Lost Cr near Farmers, Ohio
Location: Latitude 41°21′42″, longitude 84°41′28″, Defiance County, Hydrologic Unit 04100006
Drainage area, in square miles: 4.23
Station used for record extension: None
Time period of systematic or extended record analyzed: 1985-10-01 to 1997-09-30
Eighty-percent-duration streamflow, in cubic feet per second: 0.1
Mean annual streamflow, in inches: 13.87
Location of station used for precipitation data: Lima, Ohio
Location of station used for potential evapotranspiration data: Fort Wayne, Indiana
[–, indicates a value that could not be determined because there were too few average low-flow values less than the mean stream-flow for the indicated duration]
Recurrenceinterval(years)
Extreme-value
variate
Minimum runoff (in inches) for indicated duration (in days)
180 360 540 720 1080 1440 1800
13.00 2.53 0.21 3.82 6.49 9.68 20.06 36.26 49.80
10.00 2.25 0.22 4.13 8.50 13.86 24.51 40.60 57.57
6.50 1.79 0.24 4.64 11.87 20.88 31.96 47.88 70.59
354 Hydrologic Considerations for Estimation of Storage-Capacity Requirements of Impounding and Side-Channel Reservoirs for Water Supply in Ohio

04185440 Unnamed Trib to Lost Cr near Farmers, Ohio—Continued
Recurrenceinterval(years)
Impounding reservoir storage required (in inches) and critical-drawdown duration (in days; shown in gray) for indicated draft rate (in fraction of the mean annual streamflow)
0.02 0.05 0.10 0.15 0.20 0.25 0.30 0.35 0.40 0.45 0.50 0.60 0.70 0.80 0.90 1.00
5 0.04 0.15 0.46 0.80 1.14 1.49 1.83 2.17 2.51 2.85 3.19 3.88 4.80 5.83 6.85 8.51 90 120 180 180 180 180 180 180 180 180 180 180 270 270 270 600
6 0.04 0.15 0.46 0.80 1.14 1.49 1.83 2.17 2.51 2.85 3.19 3.99 5.01 6.04 7.59 9.87 90 120 180 180 180 180 180 180 180 180 180 270 270 270 600 600
8 0.05 0.17 0.46 0.80 1.14 1.49 1.83 2.17 2.56 3.01 3.47 4.41 5.98 8.48 10.99 13.49 90 150 180 180 180 180 180 180 240 240 240 300 660 660 660 660
10 0.05 0.20 0.48 0.80 1.14 1.49 1.87 2.33 2.78 3.24 3.72 5.76 8.27 10.78 13.28 15.79 90 150 150 180 180 180 240 240 240 240 300 660 660 660 660 660
15 0.07 0.24 0.59 0.99 1.39 1.79 2.18 2.58 3.89 5.26 6.62 9.36 12.09 14.82 17.56 20.29 150 150 210 210 210 210 210 210 720 720 720 720 720 720 720 720
Hydrologic Design Tables 355

04185440 Unnamed Trib to Lost Cr near Farmers, Ohio—Continued
Pumpset
Ratio of storage required for pump set to storage required for the primary pump relation (pump set 1) for indicated demand (in fraction of mean
annual streamflow)
0.002 0.010 0.020 0.050 0.100 0.200 0.300
1 1.00 1.00 1.00 1.00 1.00 1.00 1.00
2 1.22 1.08 1.09 1.67 2.04 2.63 4.88
3 1.12 1.01 1.00 1.08 1.21 1.67 1.90
4 1.09 1.00 1.00 1.01 1.04 1.09 1.49
5 1.06 1.00 1.00 1.00 1.01 1.00 1.22
6 1.03 1.00 1.00 1.00 1.00 1.00 1.04
7 1.21 1.14 1.33 2.14 2.77 6.41 8.42
8 1.12 1.06 1.08 1.19 1.81 2.17 3.24
9 1.13 1.09 1.14 1.44 2.10 2.53 5.25
10 1.12 1.09 1.08 1.34 1.64 2.21 3.15
11 1.10 1.04 1.13 1.36 1.42 2.07 3.11
12 1.16 1.09 1.12 1.52 2.12 2.54 4.99
13 1.11 1.02 1.05 1.24 1.50 2.01 2.67
14 1.10 1.03 1.04 1.31 1.29 1.81 2.21
15 1.07 1.01 1.07 1.32 1.28 1.76 2.30
16 1.06 1.00 1.08 1.36 1.30 1.75 2.26
17 1.10 1.02 1.02 1.22 1.24 1.79 2.09
18 1.06 1.01 1.02 1.29 1.27 1.56 1.90
19 1.02 1.01 1.04 1.29 1.28 1.46 1.98
20 1.00 1.00 1.04 1.28 1.30 1.49 1.96
Recurrenceinterval(years)
Normalvariate
Side-channel storage required (in demand days) for primary pump relation to meet indicated demand (in fraction of mean annual streamflow)
0.0020 0.0100 0.0200 0.0500 0.1000 0.2000 0.3000
13.00 1.426 158.85 166.56 167.25 165.08 175.10 202.70 212.99
10.00 1.282 158.22 159.68 154.63 158.54 174.43 199.25 210.42
5.00 0.841 132.25 126.92 123.82 144.25 170.84 191.84 201.45
2.17 0.096 58.19 56.05 56.79 93.32 117.97 134.46 140.19
356 Hydrologic Considerations for Estimation of Storage-Capacity Requirements of Impounding and Side-Channel Reservoirs for Water Supply in Ohio

04189000 Blanchard River near Findlay, Ohio
Location: Latitude 41°03′21″, longitude 83°41′17″, Hancock County, Hydrologic Unit 04100008
Drainage area, in square miles: 346.
Station used for record extension: None
Time period of systematic or extended record analyzed: 1940-10-01 to 1997-09-30
Eighty-percent-duration streamflow, in cubic feet per second: 18.
Mean annual streamflow, in inches: 10.37
Location of station used for precipitation data: Kenton, Ohio
Location of station used for potential evapotranspiration data: Toledo, Ohio
[–, indicates a value that could not be determined because there were too few average low-flow values less than the mean streamflow for the indicated duration]
Recurrenceinterval(years)
Extreme-value
variate
Minimum runoff (in inches) for indicated duration (in days)
180 360 540 720 1080 1440 1800
58.00 4.05 0.11 2.30 3.96 6.98 14.80 21.00 27.43
50.00 3.90 0.12 2.33 4.18 7.22 14.88 21.06 27.44
40.00 3.68 0.14 2.39 4.51 7.58 15.01 21.14 27.45
30.00 3.38 0.17 2.45 4.93 8.04 15.17 21.25 27.47
25.00 3.20 0.17 2.54 5.15 8.24 15.70 22.40 30.27
20.00 2.97 0.17 2.66 5.40 8.45 16.46 24.13 34.49
10.00 2.25 0.20 2.75 6.08 11.03 21.21 33.03 45.21
5.27 1.56 0.37 3.68 9.14 14.32 28.39 50.39 –
Hydrologic Design Tables 357

04189000 Blanchard River near Findlay, Ohio—Continued
Recurrenceinterval(years)
Impounding reservoir storage required (in inches) and critical-drawdown duration (in days; shown in gray) for indicated draft rate (in fraction of the mean annual streamflow)
0.02 0.05 0.10 0.15 0.20 0.25 0.30 0.35 0.40 0.45 0.50 0.60 0.70 0.80 0.90 1.00
5 0.00 0.04 0.17 0.38 0.59 0.90 1.24 1.58 1.97 2.35 2.73 3.50 4.27 5.03 5.80 6.87 0 60 120 150 150 240 240 270 270 270 270 270 270 270 300 660
6 0.00 0.05 0.21 0.43 0.69 0.95 1.28 1.64 2.02 2.40 2.79 3.55 4.39 5.24 6.37 8.25 0 90 150 180 180 210 240 270 270 270 270 270 300 300 660 660
8 0.00 0.06 0.26 0.52 0.79 1.09 1.39 1.70 2.08 2.49 2.92 3.77 4.62 5.95 7.71 9.58 30 120 180 180 210 210 210 270 270 300 300 300 300 600 660 660
10 0.00 0.07 0.30 0.56 0.86 1.16 1.45 1.76 2.15 2.57 3.00 3.85 4.86 6.56 8.33 10.55 30 150 180 210 210 210 210 240 300 300 300 300 600 600 660 900
15 0.00 0.09 0.33 0.63 0.93 1.23 1.53 1.88 2.22 2.62 3.05 3.90 5.44 7.15 9.96 14.19 30 150 210 210 210 210 240 240 240 300 300 300 600 720 1080 1800
20 0.01 0.10 0.36 0.66 0.96 1.28 1.62 1.96 2.30 2.71 3.18 4.11 5.77 8.63 13.41 18.53 30 150 210 210 210 240 240 240 240 330 330 330 720 1440 1800 1800
25 0.01 0.11 0.38 0.68 1.00 1.34 1.68 2.02 2.37 2.84 3.31 4.25 6.27 10.69 15.79 20.90 30 150 210 210 240 240 240 240 330 330 330 330 1380 1620 1800 1800
30 0.01 0.11 0.40 0.71 1.05 1.39 1.73 2.07 2.46 2.93 3.40 4.53 7.48 12.07 17.19 22.30 60 150 210 240 240 240 240 240 330 330 330 780 1380 1800 1800 1800
40 0.01 0.13 0.44 0.78 1.12 1.46 1.80 2.15 2.55 3.02 3.49 5.13 9.05 13.42 18.53 23.64 60 210 240 240 240 240 240 240 330 330 330 1380 1380 1800 1800 1800
50 0.01 0.15 0.49 0.83 1.17 1.51 1.85 2.19 2.59 3.06 3.62 6.34 10.01 13.93 18.90 24.02 90 210 240 240 240 240 240 240 330 330 960 960 1380 1380 1800 1800
60 0.02 0.19 0.53 0.87 1.21 1.55 1.89 2.27 2.69 3.73 5.10 7.82 10.65 14.57 18.90 24.02 120 240 240 240 240 240 240 300 300 960 960 960 1380 1380 1800 1800
70 0.02 0.21 0.55 0.89 1.23 1.57 1.97 2.39 3.69 5.06 6.42 9.14 11.87 15.02 18.94 24.02 120 240 240 240 240 240 300 300 960 960 960 960 960 1380 1380 1800
80 0.03 0.23 0.57 0.91 1.25 1.65 2.12 3.48 4.84 6.21 7.57 10.29 13.02 15.75 19.29 24.02 180 240 240 240 240 300 960 960 960 960 960 960 960 960 1320 1800
90 0.04 0.25 0.59 0.93 1.31 1.74 3.10 4.46 5.82 7.19 8.55 11.28 14.00 16.73 19.99 24.02 240 240 240 240 300 300 960 960 960 960 960 960 960 960 1320 1800
100 0.06 0.26 0.60 0.96 1.39 2.56 3.93 5.29 6.65 8.02 9.38 12.11 14.83 17.56 20.63 24.38 240 240 240 300 300 960 960 960 960 960 960 960 960 960 1320 1320
358 Hydrologic Considerations for Estimation of Storage-Capacity Requirements of Impounding and Side-Channel Reservoirs for Water Supply in Ohio

04189000 Blanchard River near Findlay, Ohio—Continued
Pumpset
Ratio of storage required for pump set to storage required for the primary pump relation (pump set 1) for indicated demand (in fraction of mean
annual streamflow)
0.002 0.010 0.020 0.050 0.100 0.200 0.300
1 1.00 1.00 1.00 1.00 1.00 1.00 1.00
2 1.34 1.50 1.51 1.91 3.88 10.68 21.97
3 1.00 1.03 1.05 1.02 1.00 1.62 2.63
4 1.00 1.00 1.01 1.00 1.00 1.00 1.18
5 1.00 1.00 1.00 1.00 1.00 1.00 1.00
6 1.00 1.00 1.00 1.00 1.00 1.00 1.00
7 1.37 1.57 1.66 3.22 9.93 31.88 43.94
8 1.00 1.08 1.11 1.06 1.50 4.28 11.02
9 1.00 1.10 1.12 1.08 1.87 6.45 21.16
10 1.00 1.10 1.14 1.12 1.41 2.88 8.97
11 1.00 1.09 1.14 1.07 1.14 2.22 7.40
12 1.02 1.09 1.11 1.18 2.30 7.29 21.66
13 1.00 1.06 1.10 1.07 1.20 2.20 5.82
14 1.00 1.07 1.10 1.08 1.11 1.79 3.48
15 1.00 1.06 1.11 1.07 1.09 1.80 2.61
16 1.03 1.08 1.11 1.12 1.13 1.76 2.73
17 1.00 1.04 1.08 1.06 1.06 1.62 2.65
18 1.00 1.07 1.10 1.08 1.10 1.47 2.34
19 1.06 1.05 1.12 1.08 1.10 1.57 2.38
20 1.00 1.08 1.07 1.11 1.13 1.54 2.56
Recurrenceinterval(years)
Normalvariate
Side-channel storage required (in demand days) for primary pump relation to meet indicated demand (in fraction of mean annual streamflow)
0.0020 0.0100 0.0200 0.0500 0.1000 0.2000 0.3000
58.00 2.115 325.99 271.86 273.41 284.45 292.77 294.60 304.03
50.00 2.054 318.78 268.77 270.64 282.15 288.76 290.39 299.02
40.00 1.960 307.63 263.98 266.35 278.60 282.57 283.87 291.26
30.00 1.834 292.63 257.55 260.59 273.83 274.24 275.12 280.83
25.00 1.751 281.78 249.88 251.83 262.01 263.38 271.44 277.69
20.00 1.645 267.71 239.15 239.30 244.51 248.05 267.37 274.76
10.00 1.282 249.42 198.20 196.19 195.88 214.15 237.38 258.20
5.00 0.841 198.43 134.11 139.93 161.43 180.03 207.55 238.42
2.00 0.000 156.59 59.54 62.08 72.71 93.91 124.66 140.36
Hydrologic Design Tables 359

04195500 Portage River at Woodville, Ohio
Location: Latitude 41°26′58″, longitude 83°21′41″, Sandusky County, Hydrologic Unit 04100010
Drainage area, in square miles: 428.
Station used for record extension: 04189000
Time period of systematic or extended record analyzed: 1955-01-01 to 1997-09-30
Percentage of estimated values in extended record: 79.5
Eighty-percent-duration streamflow, in cubic feet per second: 8.3
Mean annual streamflow, in inches: 11.44
Location of station used for precipitation data: Toledo, Ohio
Location of station used for potential evapotranspiration data: Toledo, Ohio
[–, indicates a value that could not be determined because there were too few average low-flow values less than the mean stream-flow for the indicated duration]
Recurrenceinterval(years)
Extreme-value
variate
Minimum runoff (in inches) for indicated duration (in days)
180 360 540 720 1080 1440 1800
43.00 3.75 0.13 2.50 5.15 8.53 15.51 22.19 28.70
40.00 3.68 0.13 2.52 5.21 8.55 15.70 22.94 29.89
30.00 3.38 0.14 2.61 5.47 8.64 16.45 25.93 34.62
25.00 3.20 0.14 2.66 5.63 8.69 16.92 27.84 37.63
20.00 2.97 0.14 2.72 5.85 8.89 17.44 30.11 41.04
10.00 2.25 0.22 2.94 6.71 12.08 22.99 36.12 48.71
5.38 1.58 0.32 3.78 9.97 15.07 30.07 53.38 –
360 Hydrologic Considerations for Estimation of Storage-Capacity Requirements of Impounding and Side-Channel Reservoirs for Water Supply in Ohio

04195500 Portage River at Woodville, Ohio—Continued
Recurrenceinterval(years)
Impounding reservoir storage required (in inches) and critical-drawdown duration (in days; shown in gray) for indicated draft rate (in fraction of the mean annual streamflow)
0.02 0.05 0.10 0.15 0.20 0.25 0.30 0.35 0.40 0.45 0.50 0.60 0.70 0.80 0.90 1.00
5 0.00 0.04 0.23 0.50 0.81 1.14 1.51 1.89 2.26 2.67 3.09 3.93 4.78 5.68 6.72 8.06 0 60 150 180 210 210 240 240 240 270 270 270 270 330 330 720
6 0.00 0.05 0.25 0.53 0.82 1.16 1.54 1.96 2.39 2.81 3.23 4.08 4.92 5.86 7.30 9.37 30 60 150 180 210 240 270 270 270 270 270 270 300 300 660 660
8 0.00 0.06 0.30 0.58 0.89 1.22 1.64 2.07 2.49 2.91 3.35 4.29 5.22 6.81 8.88 10.95 30 90 180 180 210 210 270 270 270 270 300 300 300 660 660 660
10 0.00 0.08 0.34 0.64 0.97 1.30 1.67 2.09 2.53 3.00 3.47 4.41 5.57 7.59 9.66 12.41 30 150 180 210 210 210 270 270 300 300 300 300 600 660 660 960
15 0.00 0.12 0.42 0.75 1.08 1.41 1.77 2.19 2.70 3.22 3.74 4.77 6.43 8.41 11.57 14.95 30 180 210 210 210 210 240 330 330 330 330 330 600 660 1080 1080
20 0.00 0.15 0.47 0.80 1.13 1.47 1.89 2.41 2.92 3.44 3.96 4.99 6.82 9.76 13.14 16.52 60 180 210 210 210 240 330 330 330 330 330 330 720 1080 1080 1080
25 0.01 0.17 0.50 0.83 1.15 1.53 2.00 2.51 3.03 3.55 4.06 5.09 7.25 10.62 14.01 17.54 60 210 210 210 210 240 330 330 330 330 330 330 720 1080 1080 1140
30 0.01 0.18 0.50 0.83 1.19 1.57 2.04 2.55 3.07 3.59 4.10 5.17 7.73 11.11 14.65 19.81 60 210 210 210 240 240 330 330 330 330 330 720 1080 1080 1140 1740
40 0.01 0.18 0.50 0.88 1.25 1.63 2.09 2.56 3.07 3.59 4.10 5.17 8.97 14.53 20.16 25.80 60 210 210 240 240 270 300 300 330 330 330 720 1740 1800 1800 1800
50 0.01 0.18 0.54 0.93 1.36 1.78 2.24 2.71 3.18 3.65 4.67 9.72 15.36 20.99 26.63 32.27 30 210 240 270 270 270 300 300 300 300 1560 1800 1800 1800 1800 1800
60 0.01 0.20 0.62 1.04 1.46 1.90 2.37 2.84 4.83 7.27 9.72 15.36 20.99 26.63 32.26 37.90 30 270 270 270 270 300 300 300 1560 1560 1800 1800 1800 1800 1800 1800
70 0.02 0.27 0.69 1.12 1.54 2.00 3.91 6.35 8.79 11.47 14.29 19.92 25.56 31.19 36.83 42.46 270 270 270 270 270 300 1560 1560 1560 1800 1800 1800 1800 1800 1800 1800
80 0.07 0.32 0.74 1.17 2.01 4.45 6.89 9.38 12.20 15.01 17.83 23.47 29.10 34.74 40.37 46.01 270 270 270 270 1560 1560 1560 1800 1800 1800 1800 1800 1800 1800 1800 1800
90 0.10 0.36 0.78 1.76 4.20 6.64 9.25 12.06 14.88 17.70 20.52 26.15 31.79 37.42 43.06 48.70 270 270 270 1560 1560 1560 1800 1800 1800 1800 1800 1800 1800 1800 1800 1800
100 0.12 0.38 0.90 3.34 5.78 8.44 11.25 14.07 16.89 19.71 22.52 28.16 33.79 39.43 45.07 50.70 270 270 1560 1560 1560 1800 1800 1800 1800 1800 1800 1800 1800 1800 1800 1800
Hydrologic Design Tables 361

04195500 Portage River at Woodville, Ohio—Continued
Pumpset
Ratio of storage required for pump set to storage required for the primary pump relation (pump set 1) for indicated demand (in fraction of mean
annual streamflow)
0.002 0.010 0.020 0.050 0.100 0.200 0.300
1 1.00 1.00 1.00 1.00 1.00 1.00 1.00
2 1.42 1.34 1.54 1.65 3.10 6.47 16.17
3 1.03 1.00 1.00 1.03 1.00 1.70 2.95
4 1.00 1.00 1.00 1.01 1.00 1.00 1.15
5 1.00 1.00 1.00 1.00 1.00 1.00 1.00
6 1.00 1.00 1.00 1.00 1.00 1.00 1.00
7 1.55 1.99 2.15 3.73 6.15 27.65 38.62
8 1.24 1.40 1.32 1.22 1.80 3.88 7.85
9 1.29 1.45 1.52 1.26 2.31 5.02 14.35
10 1.24 1.74 1.56 1.31 1.56 3.32 7.28
11 1.99 1.79 1.62 1.26 1.20 2.46 5.30
12 1.30 1.34 1.31 1.49 2.97 5.70 16.87
13 1.17 1.44 1.50 1.25 1.31 2.56 4.24
14 1.23 1.74 1.53 1.26 1.16 1.55 3.35
15 1.93 1.76 1.61 1.27 1.13 1.33 2.80
16 1.90 1.78 1.55 1.29 1.19 1.33 2.58
17 1.13 1.44 1.48 1.24 1.11 1.49 3.02
18 1.23 1.74 1.51 1.26 1.15 1.29 2.18
19 1.93 1.75 1.58 1.27 1.14 1.27 1.85
20 1.90 1.78 1.53 1.29 1.19 1.33 1.89
Recurrenceinterval(years)
Normalvariate
Side-channel storage required (in demand days) for primary pump relation to meet indicated demand (in fraction of mean annual streamflow)
0.0020 0.0100 0.0200 0.0500 0.1000 0.2000 0.3000
43.00 1.991 64.37 145.17 184.35 236.25 269.18 281.74 291.86
40.00 1.960 62.70 144.73 183.39 233.23 264.59 277.54 289.12
30.00 1.834 55.87 142.94 179.48 220.89 245.81 260.34 277.91
25.00 1.751 51.35 141.76 176.89 212.73 233.41 248.99 270.50
20.00 1.645 45.58 133.34 168.58 200.82 220.51 237.79 263.18
10.00 1.282 24.36 72.32 89.84 144.12 184.77 226.76 251.51
5.00 0.841 6.47 30.26 46.35 102.96 149.51 196.76 224.06
2.05 0.029 0.00 12.73 16.88 43.08 73.81 105.25 123.94
362 Hydrologic Considerations for Estimation of Storage-Capacity Requirements of Impounding and Side-Channel Reservoirs for Water Supply in Ohio

04196000 Sandusky River near Bucyrus, Ohio
Location: Latitude 40°48′13″, longitude 83°00′21″, Crawford County, Hydrologic Unit 04100011
Drainage area, in square miles: 88.8
Station used for record extension: 03218000
Time period of systematic or extended record analyzed: 1938-08-01 to 1981-09-30
Percentage of estimated values in extended record: 23.1
Eighty-percent-duration streamflow, in cubic feet per second: 5.4
Mean annual streamflow, in inches: 13.14
Location of station used for precipitation data: Kenton, Ohio
Location of station used for potential evapotranspiration data: Toledo, Ohio
[–, indicates a value that could not be determined because there were too few average low-flow values less than the mean streamflow for the indicated duration]
Recurrenceinterval(years)
Extreme-value
variate
Minimum runoff (in inches) for indicated duration (in days)
180 360 540 720 1080 1440 1800
44.00 3.77 0.17 2.80 5.65 8.59 19.04 28.45 36.45
40.00 3.68 0.17 2.97 5.82 9.37 19.45 29.23 37.49
30.00 3.38 0.18 3.49 6.35 11.74 20.67 31.60 40.64
25.00 3.20 0.18 3.82 6.68 13.25 21.45 33.10 42.64
20.00 2.97 0.18 4.10 7.00 14.42 23.33 35.02 44.88
10.00 2.25 0.31 4.97 9.14 14.94 28.44 43.17 59.28
5.50 1.61 0.48 5.92 11.96 19.38 36.84 – –
Hydrologic Design Tables 363
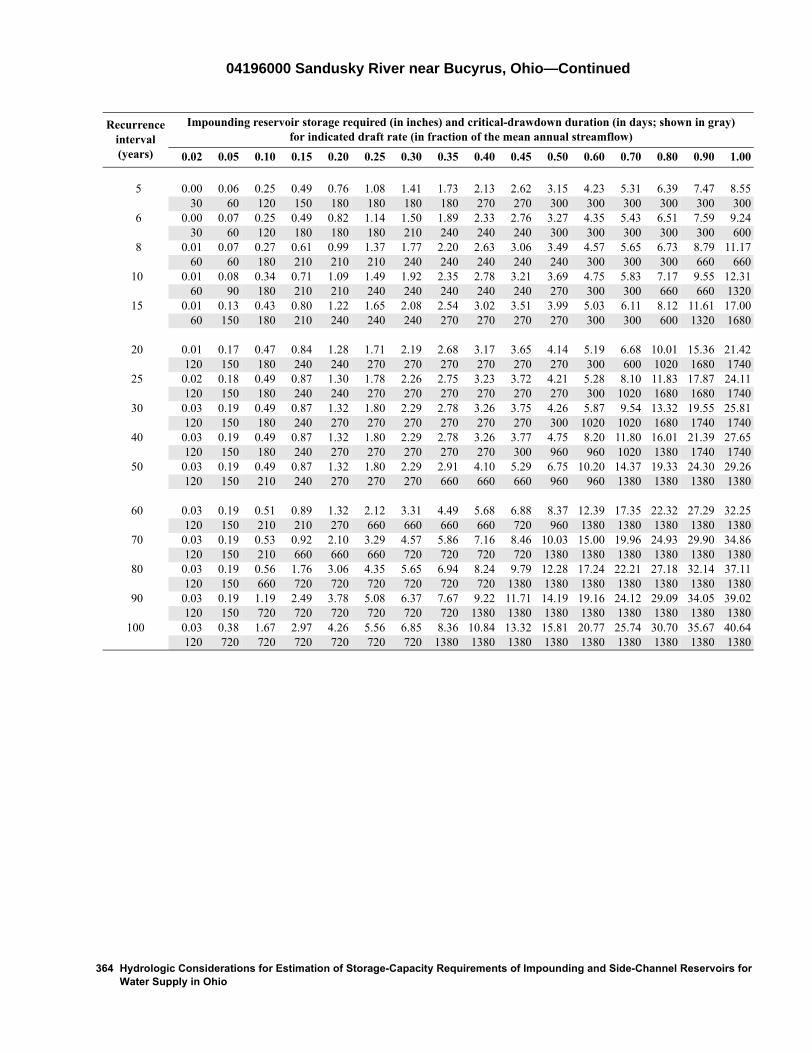
04196000 Sandusky River near Bucyrus, Ohio—Continued
Recurrenceinterval(years)
Impounding reservoir storage required (in inches) and critical-drawdown duration (in days; shown in gray) for indicated draft rate (in fraction of the mean annual streamflow)
0.02 0.05 0.10 0.15 0.20 0.25 0.30 0.35 0.40 0.45 0.50 0.60 0.70 0.80 0.90 1.00
5 0.00 0.06 0.25 0.49 0.76 1.08 1.41 1.73 2.13 2.62 3.15 4.23 5.31 6.39 7.47 8.55 30 60 120 150 180 180 180 180 270 270 300 300 300 300 300 300
6 0.00 0.07 0.25 0.49 0.82 1.14 1.50 1.89 2.33 2.76 3.27 4.35 5.43 6.51 7.59 9.24 30 60 120 180 180 180 210 240 240 240 300 300 300 300 300 600
8 0.01 0.07 0.27 0.61 0.99 1.37 1.77 2.20 2.63 3.06 3.49 4.57 5.65 6.73 8.79 11.17 60 60 180 210 210 210 240 240 240 240 240 300 300 300 660 660
10 0.01 0.08 0.34 0.71 1.09 1.49 1.92 2.35 2.78 3.21 3.69 4.75 5.83 7.17 9.55 12.31 60 90 180 210 210 240 240 240 240 240 270 300 300 660 660 1320
15 0.01 0.13 0.43 0.80 1.22 1.65 2.08 2.54 3.02 3.51 3.99 5.03 6.11 8.12 11.61 17.00 60 150 180 210 240 240 240 270 270 270 270 300 300 600 1320 1680
20 0.01 0.17 0.47 0.84 1.28 1.71 2.19 2.68 3.17 3.65 4.14 5.19 6.68 10.01 15.36 21.42 120 150 180 240 240 270 270 270 270 270 270 300 600 1020 1680 1740
25 0.02 0.18 0.49 0.87 1.30 1.78 2.26 2.75 3.23 3.72 4.21 5.28 8.10 11.83 17.87 24.11 120 150 180 240 240 270 270 270 270 270 270 300 1020 1680 1680 1740
30 0.03 0.19 0.49 0.87 1.32 1.80 2.29 2.78 3.26 3.75 4.26 5.87 9.54 13.32 19.55 25.81 120 150 180 240 270 270 270 270 270 270 300 1020 1020 1680 1740 1740
40 0.03 0.19 0.49 0.87 1.32 1.80 2.29 2.78 3.26 3.77 4.75 8.20 11.80 16.01 21.39 27.65 120 150 180 240 270 270 270 270 270 300 960 960 1020 1380 1740 1740
50 0.03 0.19 0.49 0.87 1.32 1.80 2.29 2.91 4.10 5.29 6.75 10.20 14.37 19.33 24.30 29.26 120 150 210 240 270 270 270 660 660 660 960 960 1380 1380 1380 1380
60 0.03 0.19 0.51 0.89 1.32 2.12 3.31 4.49 5.68 6.88 8.37 12.39 17.35 22.32 27.29 32.25 120 150 210 210 270 660 660 660 660 720 960 1380 1380 1380 1380 1380
70 0.03 0.19 0.53 0.92 2.10 3.29 4.57 5.86 7.16 8.46 10.03 15.00 19.96 24.93 29.90 34.86 120 150 210 660 660 660 720 720 720 720 1380 1380 1380 1380 1380 1380
80 0.03 0.19 0.56 1.76 3.06 4.35 5.65 6.94 8.24 9.79 12.28 17.24 22.21 27.18 32.14 37.11 120 150 660 720 720 720 720 720 720 1380 1380 1380 1380 1380 1380 1380
90 0.03 0.19 1.19 2.49 3.78 5.08 6.37 7.67 9.22 11.71 14.19 19.16 24.12 29.09 34.05 39.02 120 150 720 720 720 720 720 720 1380 1380 1380 1380 1380 1380 1380 1380
100 0.03 0.38 1.67 2.97 4.26 5.56 6.85 8.36 10.84 13.32 15.81 20.77 25.74 30.70 35.67 40.64 120 720 720 720 720 720 720 1380 1380 1380 1380 1380 1380 1380 1380 1380
364 Hydrologic Considerations for Estimation of Storage-Capacity Requirements of Impounding and Side-Channel Reservoirs for Water Supply in Ohio

04196000 Sandusky River near Bucyrus, Ohio—Continued
Pumpset
Ratio of storage required for pump set to storage required for the primary pump relation (pump set 1) for indicated demand (in fraction of mean
annual streamflow)
0.002 0.010 0.020 0.050 0.100 0.200 0.300
1 1.00 1.00 1.00 1.00 1.00 1.00 1.00
2 1.21 1.18 1.26 1.35 2.03 6.62 12.35
3 1.04 1.00 1.00 1.00 1.00 1.38 2.06
4 1.01 1.00 1.00 1.00 1.00 1.00 1.34
5 1.00 1.00 1.00 1.00 1.00 1.00 1.17
6 1.00 1.00 1.00 1.00 1.00 1.00 1.07
7 1.23 1.23 1.44 2.00 4.64 18.60 27.77
8 1.04 1.00 1.12 1.10 1.23 2.84 7.54
9 1.05 1.01 1.20 1.16 1.42 3.45 12.67
10 1.06 1.00 1.27 1.23 1.39 3.14 8.13
11 1.04 1.16 1.32 1.26 1.55 2.88 5.41
12 1.13 1.00 1.10 1.08 1.62 3.15 12.44
13 1.04 1.00 1.20 1.15 1.23 2.49 3.24
14 1.04 1.00 1.27 1.19 1.31 2.42 3.11
15 1.03 1.16 1.32 1.23 1.34 2.48 3.06
16 1.03 1.21 1.33 1.28 1.37 2.58 2.95
17 1.04 1.00 1.21 1.14 1.23 2.11 2.83
18 1.04 1.00 1.27 1.19 1.30 2.13 2.74
19 1.03 1.16 1.30 1.23 1.33 2.25 2.74
20 1.03 1.21 1.33 1.29 1.37 2.39 2.80
Recurrenceinterval(years)
Normalvariate
Side-channel storage required (in demand days) for primary pump relation to meet indicated demand (in fraction of mean annual streamflow)
0.0020 0.0100 0.0200 0.0500 0.1000 0.2000 0.3000
44.00 2.001 241.89 206.99 202.84 227.13 236.79 262.74 295.40
40.00 1.960 240.33 206.25 202.26 224.46 236.32 262.07 292.04
30.00 1.834 235.47 203.96 200.46 216.17 234.85 259.98 281.58
25.00 1.751 232.26 202.44 199.28 210.69 233.88 258.60 274.67
20.00 1.645 222.09 198.18 197.05 204.32 231.68 255.39 269.20
10.00 1.282 165.82 127.44 140.43 165.75 197.68 235.03 260.60
5.00 0.841 127.14 111.84 124.77 134.45 158.25 183.99 203.16
2.00 0.000 93.15 53.38 54.27 72.13 106.41 145.76 161.21
Hydrologic Design Tables 365

04196500 Sandusky River near Upper Sandusky, Ohio
Location: Latitude 40°51′02″, longitude 83°15′23″, Wyandot County, Hydrologic Unit 04100011
Drainage area, in square miles: 298.
Station used for record extension: 03223000
Time period of systematic or extended record analyzed: 1922-10-01 to 1997-09-30
Percentage of estimated values in extended record: 24.6
Eighty-percent-duration streamflow, in cubic feet per second: 14.
Mean annual streamflow, in inches: 11.38
Location of station used for precipitation data: Kenton, Ohio
Location of station used for potential evapotranspiration data: Toledo, Ohio
[–, indicates a value that could not be determined because there were too few average low-flow values less than the mean stream-flow for the indicated duration]
Recurrenceinterval(years)
Extreme-value
variate
Minimum runoff (in inches) for indicated duration (in days)
180 360 540 720 1080 1440 1800
76.00 4.32 0.12 2.65 4.43 6.98 16.09 23.21 30.79
70.00 4.24 0.12 2.68 4.60 7.21 16.16 23.35 31.11
60.00 4.09 0.13 2.75 4.91 7.63 16.28 23.62 31.71
50.00 3.90 0.13 2.82 5.28 8.14 16.43 23.94 32.42
40.00 3.68 0.14 2.92 5.74 8.76 16.62 24.33 33.29
30.00 3.38 0.16 3.11 6.15 9.64 18.88 26.29 34.34
25.00 3.20 0.17 3.24 6.42 10.20 20.50 27.68 35.03
20.00 2.97 0.18 3.35 7.03 10.47 21.06 28.27 36.36
10.00 2.25 0.24 4.01 7.97 13.45 25.86 37.93 51.63
5.07 1.52 0.34 5.23 10.95 17.72 33.62 50.69 –
366 Hydrologic Considerations for Estimation of Storage-Capacity Requirements of Impounding and Side-Channel Reservoirs for Water Supply in Ohio

04196500 Sandusky River near Upper Sandusky, Ohio—Continued
Recurrenceinterval(years)
Impounding reservoir storage required (in inches) and critical-drawdown duration (in days; shown in gray) for indicated draft rate (in fraction of the mean annual streamflow)
0.02 0.05 0.10 0.15 0.20 0.25 0.30 0.35 0.40 0.45 0.50 0.60 0.70 0.80 0.90 1.00
5 0.01 0.05 0.25 0.49 0.77 1.05 1.33 1.69 2.06 2.43 2.81 3.63 4.56 5.50 6.43 7.37 30 60 150 180 180 180 180 240 240 240 240 300 300 300 300 300
6 0.01 0.06 0.26 0.53 0.81 1.09 1.42 1.79 2.16 2.53 2.91 3.74 4.67 5.61 6.54 8.00 30 90 150 180 180 210 210 240 240 240 240 300 300 300 300 600
8 0.01 0.08 0.30 0.58 0.87 1.20 1.54 1.91 2.28 2.66 3.04 3.92 4.85 5.79 7.50 9.37 30 120 180 180 210 210 240 240 240 240 270 300 300 300 600 600
10 0.01 0.09 0.33 0.61 0.92 1.25 1.61 1.98 2.36 2.74 3.16 4.06 4.99 6.27 8.14 10.06 30 120 180 180 210 210 240 240 240 270 270 300 300 600 600 660
15 0.01 0.11 0.36 0.65 0.98 1.34 1.71 2.09 2.46 2.89 3.36 4.30 5.23 7.23 9.71 14.01 60 150 180 210 210 240 240 240 270 300 300 300 300 660 1380 1380
20 0.02 0.13 0.38 0.67 1.02 1.40 1.77 2.15 2.58 3.05 3.51 4.45 5.87 8.04 12.78 18.20 60 150 180 210 240 240 240 240 300 300 300 300 660 1380 1740 1740
25 0.02 0.14 0.40 0.69 1.06 1.44 1.81 2.22 2.68 3.15 3.62 4.56 6.38 9.87 15.29 20.71 90 150 180 240 240 240 240 300 300 300 300 330 660 1740 1740 1740
30 0.02 0.15 0.40 0.72 1.09 1.46 1.84 2.29 2.76 3.23 3.69 4.74 7.28 11.47 16.90 22.32 90 150 180 240 240 240 240 300 300 300 300 660 1020 1740 1740 1740
40 0.03 0.16 0.42 0.76 1.13 1.50 1.93 2.40 2.87 3.33 3.83 5.68 8.86 13.27 18.69 24.30 90 150 180 240 240 240 300 300 300 300 330 1020 1020 1740 1740 1800
50 0.03 0.16 0.43 0.79 1.16 1.53 2.00 2.47 2.94 3.41 3.99 6.69 9.87 14.08 19.53 25.13 90 150 210 240 240 240 300 300 300 330 660 1020 1020 1740 1800 1800
60 0.03 0.16 0.45 0.81 1.18 1.58 2.05 2.52 2.98 3.50 4.52 7.50 10.67 14.97 19.80 25.36 90 150 210 240 240 300 300 300 300 660 660 960 1380 1380 1740 1800
70 0.03 0.16 0.47 0.83 1.20 1.62 2.08 2.55 3.02 3.97 5.18 8.17 11.52 15.83 20.13 25.36 90 150 210 240 240 300 300 300 300 660 960 960 1380 1380 1380 1800
80 0.03 0.17 0.50 0.84 1.21 1.64 2.11 2.58 3.37 4.39 5.71 8.71 12.27 16.57 20.87 25.36 90 210 210 240 240 300 300 300 660 660 960 960 1380 1380 1380 1800
90 0.03 0.19 0.51 0.85 1.23 1.66 2.13 2.72 3.75 4.78 6.16 9.15 12.94 17.24 21.54 25.84 90 210 210 240 240 300 300 660 660 660 960 960 1380 1380 1380 1380
100 0.03 0.20 0.53 0.87 1.24 1.68 2.15 3.06 4.09 5.12 6.53 9.53 13.54 17.84 22.14 26.44 90 210 210 240 240 300 300 660 660 660 960 960 1380 1380 1380 1380
Hydrologic Design Tables 367

04196500 Sandusky River near Upper Sandusky, Ohio—Continued
Pumpset
Ratio of storage required for pump set to storage required for the primary pump relation (pump set 1) for indicated demand (in fraction of mean
annual streamflow)
0.002 0.010 0.020 0.050 0.100 0.200 0.300
1 1.00 1.00 1.00 1.00 1.00 1.00 1.00
2 1.86 1.37 1.46 2.09 2.66 13.84 27.27
3 1.21 1.14 1.04 1.00 1.02 1.33 2.16
4 1.04 1.08 1.01 1.00 1.00 1.00 1.22
5 1.01 1.04 1.00 1.00 1.00 1.00 1.09
6 1.00 1.02 1.00 1.00 1.00 1.00 1.02
7 1.86 1.70 1.93 2.77 11.68 45.29 62.46
8 1.23 1.22 1.10 1.07 1.28 2.69 10.80
9 1.23 1.24 1.14 1.09 1.63 3.09 22.18
10 1.14 1.24 1.14 1.19 1.38 2.89 10.88
11 1.06 1.27 1.15 1.23 1.30 2.48 4.92
12 1.26 1.21 1.11 1.09 1.83 3.84 21.76
13 1.14 1.21 1.12 1.05 1.20 2.17 3.20
14 1.05 1.21 1.13 1.16 1.24 2.20 2.86
15 1.04 1.27 1.17 1.21 1.29 1.98 2.90
16 1.07 1.26 1.15 1.25 1.31 2.24 2.85
17 1.05 1.19 1.12 1.06 1.20 1.72 2.66
18 1.04 1.21 1.13 1.15 1.24 1.84 2.48
19 1.03 1.24 1.17 1.20 1.29 1.82 2.61
20 1.07 1.22 1.14 1.23 1.31 1.98 2.71
368 Hydrologic Considerations for Estimation of Storage-Capacity Requirements of Impounding and Side-Channel Reservoirs for Water Supply in Ohio
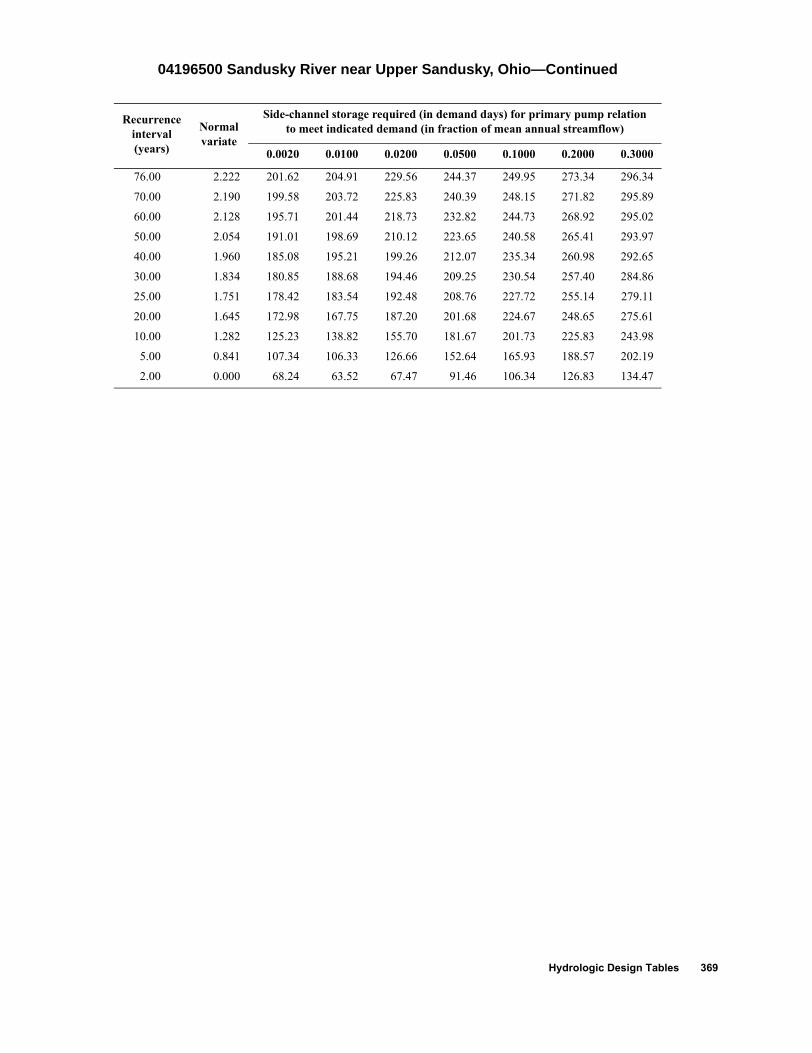
04196500 Sandusky River near Upper Sandusky, Ohio—Continued
Recurrenceinterval(years)
Normalvariate
Side-channel storage required (in demand days) for primary pump relation to meet indicated demand (in fraction of mean annual streamflow)
0.0020 0.0100 0.0200 0.0500 0.1000 0.2000 0.3000
76.00 2.222 201.62 204.91 229.56 244.37 249.95 273.34 296.34
70.00 2.190 199.58 203.72 225.83 240.39 248.15 271.82 295.89
60.00 2.128 195.71 201.44 218.73 232.82 244.73 268.92 295.02
50.00 2.054 191.01 198.69 210.12 223.65 240.58 265.41 293.97
40.00 1.960 185.08 195.21 199.26 212.07 235.34 260.98 292.65
30.00 1.834 180.85 188.68 194.46 209.25 230.54 257.40 284.86
25.00 1.751 178.42 183.54 192.48 208.76 227.72 255.14 279.11
20.00 1.645 172.98 167.75 187.20 201.68 224.67 248.65 275.61
10.00 1.282 125.23 138.82 155.70 181.67 201.73 225.83 243.98
5.00 0.841 107.34 106.33 126.66 152.64 165.93 188.57 202.19
2.00 0.000 68.24 63.52 67.47 91.46 106.34 126.83 134.47
Hydrologic Design Tables 369

04197000 Sandusky River near Mexico, Ohio
Location: Latitude 41°02′39″, longitude 83°11′42″, Seneca County, Hydrologic Unit 04100011
Drainage area, in square miles: 774.
Station used for record extension: 04198000
Time period of systematic or extended record analyzed: 1938-08-01 to 1997-09-30
Percentage of estimated values in extended record: 25.3
Eighty-percent-duration streamflow, in cubic feet per second: 39.
Mean annual streamflow, in inches: 10.96
Location of station used for precipitation data: Kenton, Ohio
Location of station used for potential evapotranspiration data: Toledo, Ohio
[–, indicates a value that could not be determined because there were too few average low-flow values less than the mean stream-flow for the indicated duration]
Recurrenceinterval(years)
Extreme-value
variate
Minimum runoff (in inches) for indicated duration (in days)
180 360 540 720 1080 1440 1800
60.00 4.09 0.18 2.44 4.06 6.43 14.63 21.65 28.00
50.00 3.90 0.18 2.54 4.28 7.33 15.37 22.79 29.59
40.00 3.68 0.18 2.67 4.55 8.43 16.28 24.18 31.54
30.00 3.38 0.18 2.83 4.90 9.85 17.46 25.98 34.06
25.00 3.20 0.21 2.89 5.00 10.15 17.95 26.27 34.25
20.00 2.97 0.24 2.96 5.13 10.51 18.55 26.62 34.48
10.00 2.25 0.28 3.86 7.26 12.18 21.74 37.53 50.15
5.45 1.60 0.36 4.79 9.47 15.99 31.27 – –
370 Hydrologic Considerations for Estimation of Storage-Capacity Requirements of Impounding and Side-Channel Reservoirs for Water Supply in Ohio

04197000 Sandusky River near Mexico, Ohio—Continued
Recurrenceinterval(years)
Impounding reservoir storage required (in inches) and critical-drawdown duration (in days; shown in gray) for indicated draft rate (in fraction of the mean annual streamflow)
0.02 0.05 0.10 0.15 0.20 0.25 0.30 0.35 0.40 0.45 0.50 0.60 0.70 0.80 0.90 1.00
5 0.00 0.03 0.20 0.44 0.71 0.98 1.25 1.54 1.90 2.26 2.62 3.40 4.21 5.02 5.83 6.70 0 90 120 180 180 180 180 240 240 240 240 270 270 270 270 300
6 0.00 0.04 0.21 0.47 0.74 1.01 1.32 1.64 2.00 2.36 2.75 3.56 4.43 5.33 6.23 7.95 0 90 150 180 180 180 210 240 240 240 270 270 300 300 300 600
8 0.00 0.04 0.24 0.51 0.81 1.13 1.44 1.76 2.12 2.53 2.97 3.87 4.77 5.91 7.71 9.61 30 90 180 180 210 210 210 240 270 270 300 300 300 600 600 660
10 0.00 0.05 0.27 0.55 0.87 1.18 1.50 1.84 2.22 2.64 3.09 3.99 4.89 6.59 8.39 10.65 30 90 180 210 210 210 210 240 270 300 300 300 300 600 600 960
15 0.00 0.06 0.30 0.60 0.92 1.24 1.60 1.96 2.34 2.75 3.18 4.08 5.46 7.26 10.26 14.04 30 120 180 210 210 240 240 240 270 270 300 300 600 600 1260 1260
20 0.00 0.08 0.32 0.62 0.94 1.30 1.66 2.02 2.40 2.81 3.21 4.34 5.96 7.87 12.40 17.62 30 150 180 210 240 240 240 240 270 270 270 540 540 1020 1740 1740
25 0.00 0.09 0.33 0.63 0.98 1.34 1.70 2.06 2.45 2.85 3.26 4.75 6.37 9.73 14.95 20.17 30 150 180 210 240 240 240 240 270 270 270 540 540 1740 1740 1740
30 0.00 0.10 0.34 0.64 1.00 1.36 1.72 2.08 2.48 2.89 3.41 5.03 7.15 11.42 16.65 21.87 60 150 180 210 240 240 240 240 270 270 540 540 1020 1740 1740 1740
40 0.01 0.11 0.35 0.67 1.03 1.39 1.75 2.13 2.55 3.00 3.75 5.84 8.90 13.50 18.72 23.94 60 150 180 240 240 240 240 270 300 300 540 1020 1020 1740 1740 1740
50 0.01 0.11 0.37 0.69 1.05 1.41 1.81 2.26 2.71 3.37 4.36 7.25 10.31 14.67 19.89 25.11 60 150 210 240 240 240 300 300 300 660 660 1020 1020 1740 1740 1740
60 0.01 0.11 0.39 0.71 1.07 1.52 1.97 2.42 3.29 4.59 6.03 8.91 11.97 16.11 20.63 26.03 60 150 210 210 300 300 300 300 660 960 960 960 1380 1380 1800 1800
70 0.01 0.11 0.41 0.75 1.20 1.65 2.10 3.19 4.63 6.07 7.51 10.39 13.52 17.66 21.80 27.18 60 150 210 300 300 300 300 960 960 960 960 960 1380 1380 1380 1800
80 0.01 0.12 0.44 0.87 1.32 1.78 3.00 4.44 5.88 7.32 8.76 11.64 14.92 19.06 23.20 28.21 60 210 210 300 300 660 960 960 960 960 960 960 1380 1380 1380 1800
90 0.01 0.14 0.52 0.97 1.42 2.59 4.03 5.47 6.91 8.35 9.79 12.67 16.19 20.33 24.47 29.13 90 210 300 300 300 960 960 960 960 960 960 960 1380 1380 1380 1800
100 0.01 0.16 0.59 1.04 2.00 3.44 4.88 6.32 7.76 9.20 10.64 13.52 17.34 21.48 25.62 29.99 90 210 300 300 960 960 960 960 960 960 960 960 1380 1380 1380 1800
Hydrologic Design Tables 371

04197000 Sandusky River near Mexico, Ohio—Continued
Pumpset
Ratio of storage required for pump set to storage required for the primary pump relation (pump set 1) for indicated demand (in fraction of mean
annual streamflow)
0.002 0.010 0.020 0.050 0.100 0.200 0.300
1 1.00 1.00 1.00 1.00 1.00 1.00 1.00
2 1.30 1.31 1.31 1.96 2.67 9.40 15.65
3 1.03 1.02 1.01 1.00 1.00 1.31 1.94
4 1.00 1.00 1.00 1.00 1.00 1.00 1.26
5 1.00 1.00 1.00 1.00 1.00 1.00 1.06
6 1.00 1.00 1.00 1.00 1.00 1.00 1.02
7 1.33 1.53 1.76 2.96 9.13 26.90 37.35
8 1.05 1.12 1.10 1.10 1.37 2.57 7.37
9 1.04 1.14 1.14 1.15 1.56 4.10 12.76
10 1.00 1.19 1.17 1.10 1.48 2.63 6.27
11 1.01 1.22 1.19 1.14 1.23 2.62 4.49
12 1.12 1.11 1.08 1.11 1.89 5.07 14.10
13 1.00 1.13 1.14 1.07 1.13 2.17 3.66
14 1.00 1.17 1.17 1.11 1.17 2.20 2.63
15 1.01 1.24 1.18 1.14 1.22 2.26 2.70
16 1.02 1.26 1.18 1.16 1.28 2.43 2.80
17 1.02 1.12 1.14 1.08 1.10 1.91 2.36
18 1.00 1.17 1.16 1.11 1.16 1.93 2.47
19 1.01 1.24 1.18 1.15 1.22 2.08 2.64
20 1.02 1.26 1.18 1.17 1.27 2.29 2.75
Recurrenceinterval(years)
Normalvariate
Side-channel storage required (in demand days) for primary pump relation to meet indicated demand (in fraction of mean annual streamflow)
0.0020 0.0100 0.0200 0.0500 0.1000 0.2000 0.3000
60.00 2.128 235.80 223.60 236.26 246.36 262.42 285.55 331.32
50.00 2.054 234.15 220.98 229.16 242.53 257.57 278.48 325.66
40.00 1.960 232.06 217.67 220.20 237.70 251.45 269.55 318.52
30.00 1.834 229.26 213.22 208.16 231.20 243.23 257.54 308.91
25.00 1.751 222.54 198.31 203.48 223.58 241.16 254.82 308.10
20.00 1.645 213.98 179.34 197.53 213.89 238.53 251.35 307.08
10.00 1.282 177.68 154.35 168.49 201.63 210.95 235.01 265.74
5.00 0.841 142.62 133.67 144.95 158.00 166.55 198.14 233.67
2.00 0.000 99.81 66.42 69.79 76.15 88.38 131.08 141.55
372 Hydrologic Considerations for Estimation of Storage-Capacity Requirements of Impounding and Side-Channel Reservoirs for Water Supply in Ohio

04197020 Honey Creek near New Washington, Ohio
Location: Latitude 40°57′37″, longitude 82°47′19″, Crawford County, Hydrologic Unit 04100011
Drainage area, in square miles: 17.0
Station used for record extension: 04196000
Time period of systematic or extended record analyzed: 1964-01-01 to 1989-10-04
Percentage of estimated values in extended record: 59.8
Eighty-percent-duration streamflow, in cubic feet per second: 0.8
Mean annual streamflow, in inches: 11.72
Location of station used for precipitation data: Norwalk, Ohio
Location of station used for potential evapotranspiration data: Toledo, Ohio
[–, indicates a value that could not be determined because there were too few average low-flow values less than the mean streamflow for the indicated duration]
Recurrenceinterval(years)
Extreme-value
variate
Minimum runoff (in inches) for indicated duration (in days)
180 360 540 720 1080 1440 1800
26.00 3.24 0.19 3.91 6.72 11.54 23.92 32.39 41.42
25.00 3.20 0.19 3.93 6.73 11.66 24.00 32.60 41.96
20.00 2.97 0.19 4.03 6.77 12.34 24.47 33.78 45.01
10.00 2.25 0.20 4.24 8.22 14.29 26.62 38.31 51.70
5.20 1.54 0.22 6.70 9.91 17.17 37.08 52.31 69.46
Hydrologic Design Tables 373

04197020 Honey Creek near New Washington, Ohio—Continued
Recurrenceinterval(years)
Impounding reservoir storage required (in inches) and critical-drawdown duration (in days; shown in gray) for indicated draft rate (in fraction of the mean annual streamflow)
0.02 0.05 0.10 0.15 0.20 0.25 0.30 0.35 0.40 0.45 0.50 0.60 0.70 0.80 0.90 1.00
5 0.02 0.12 0.36 0.64 0.93 1.22 1.51 1.80 2.09 2.38 2.67 3.24 3.89 4.75 6.21 8.14 60 120 180 180 180 180 180 180 180 180 180 180 270 270 600 600
6 0.02 0.13 0.36 0.65 0.94 1.23 1.52 1.81 2.10 2.38 2.67 3.32 4.00 4.80 6.24 8.16 90 120 180 180 180 180 180 180 180 180 180 210 210 270 600 600
8 0.03 0.15 0.37 0.66 0.95 1.24 1.53 1.82 2.14 2.48 2.82 3.49 4.26 5.17 7.10 9.30 90 120 180 180 180 180 180 180 210 210 210 210 240 600 600 900
10 0.04 0.15 0.38 0.67 0.96 1.24 1.56 1.89 2.23 2.57 2.96 3.73 4.50 6.10 8.03 10.19 120 120 180 180 180 180 210 210 210 240 240 240 240 600 600 1380
15 0.05 0.17 0.39 0.67 0.97 1.31 1.69 2.08 2.46 2.85 3.23 4.00 5.55 7.47 9.40 11.32 120 120 150 180 210 240 240 240 240 240 240 240 600 600 600 600
20 0.06 0.17 0.39 0.68 1.01 1.39 1.78 2.16 2.55 2.93 3.32 4.11 5.87 7.80 9.72 11.65 120 120 150 180 240 240 240 240 240 240 240 540 600 600 600 600
25 0.06 0.17 0.40 0.68 1.01 1.39 1.78 2.16 2.55 2.93 3.32 4.11 5.87 7.80 11.26 16.65 120 120 150 180 240 240 240 240 240 240 240 540 600 900 1680 1680
30 0.06 0.17 0.41 0.68 1.01 1.39 1.78 2.16 2.55 2.93 3.32 5.86 8.75 13.68 19.07 24.46 120 120 150 180 240 240 240 240 240 240 240 900 900 1680 1680 1680
40 0.06 0.19 0.43 0.68 1.01 1.81 3.25 4.70 6.14 8.15 10.85 16.24 21.63 27.02 32.42 37.81 120 150 150 180 240 900 900 900 900 1680 1680 1680 1680 1680 1680 1680
50 0.06 0.20 0.66 2.10 3.55 5.54 8.23 10.93 13.62 16.32 19.01 24.41 29.80 35.19 40.58 45.97 120 150 900 900 900 1680 1680 1680 1680 1680 1680 1680 1680 1680 1680 1680
60 0.07 0.59 2.03 4.37 7.07 9.77 12.46 15.16 17.85 20.55 23.24 28.64 34.03 39.42 44.81 50.20 150 900 900 1680 1680 1680 1680 1680 1680 1680 1680 1680 1680 1680 1680 1680
70 0.26 1.13 3.70 6.40 9.09 11.79 14.48 17.18 19.87 22.57 25.27 30.66 36.05 41.44 46.83 52.22 900 900 1680 1680 1680 1680 1680 1680 1680 1680 1680 1680 1680 1680 1680 1680
80 0.46 1.93 4.63 7.33 10.02 12.72 15.41 18.11 20.80 23.50 26.20 31.59 36.99 42.58 48.16 53.74 900 1680 1680 1680 1680 1680 1680 1680 1680 1680 1680 1680 1740 1740 1740 1740
90 0.74 2.35 5.05 7.74 10.44 13.14 15.83 18.53 21.22 23.99 26.78 32.37 37.95 43.54 49.12 54.711680 1680 1680 1680 1680 1680 1680 1680 1680 1740 1740 1740 1740 1740 1740 1740
100 0.92 2.54 5.24 7.93 10.63 13.34 16.14 18.93 21.72 24.51 27.30 32.89 38.47 44.11 49.88 55.661680 1680 1680 1680 1680 1740 1740 1740 1740 1740 1740 1740 1740 1800 1800 1800
374 Hydrologic Considerations for Estimation of Storage-Capacity Requirements of Impounding and Side-Channel Reservoirs for Water Supply in Ohio

04197020 Honey Creek near New Washington, Ohio—Continued
Pumpset
Ratio of storage required for pump set to storage required for the primary pump relation (pump set 1) for indicated demand (in fraction of mean
annual streamflow)
0.002 0.010 0.020 0.050 0.100 0.200 0.300
1 1.00 1.00 1.00 1.00 1.00 1.00 1.00
2 1.30 1.46 1.21 1.03 1.31 2.50 5.65
3 1.15 1.27 1.16 1.01 1.00 1.00 1.00
4 1.11 1.11 1.09 1.01 1.00 1.00 1.00
5 1.07 1.00 1.06 1.00 1.00 1.00 1.00
6 1.04 1.00 1.03 1.00 1.00 1.00 1.00
7 1.30 1.53 1.29 1.30 2.25 8.03 13.41
8 1.15 1.38 1.26 1.14 1.09 1.15 2.18
9 1.15 1.42 1.30 1.18 1.20 1.34 3.46
10 1.14 1.43 1.39 1.31 1.20 1.25 2.46
11 1.12 1.46 1.45 1.35 1.21 1.29 2.06
12 1.20 1.41 1.24 1.11 1.09 1.51 3.90
13 1.14 1.36 1.30 1.19 1.20 1.19 1.48
14 1.12 1.33 1.39 1.32 1.21 1.22 1.41
15 1.08 1.35 1.47 1.37 1.19 1.30 1.49
16 1.12 1.54 1.42 1.42 1.24 1.32 1.47
17 1.12 1.29 1.28 1.18 1.21 1.18 1.16
18 1.09 1.28 1.36 1.33 1.22 1.24 1.22
19 1.04 1.35 1.43 1.39 1.20 1.29 1.26
20 1.07 1.53 1.41 1.42 1.23 1.31 1.34
Recurrenceinterval(years)
Normalvariate
Side-channel storage required (in demand days) for primary pump relation to meet indicated demand (in fraction of mean annual streamflow)
0.0020 0.0100 0.0200 0.0500 0.1000 0.2000 0.3000
26.00 1.769 109.23 153.52 178.82 211.70 226.76 241.15 255.63
25.00 1.751 108.12 153.11 177.94 209.56 224.58 239.24 253.91
20.00 1.645 101.60 150.69 172.77 197.06 211.87 228.06 243.87
10.00 1.282 74.09 144.00 155.26 170.35 180.78 197.54 207.30
5.00 0.841 56.72 115.30 131.82 148.25 159.24 184.48 192.52
2.00 0.000 35.00 81.99 83.62 88.75 95.16 116.94 135.36
Hydrologic Design Tables 375

04197100 Honey Creek at Melmore, Ohio
Location: Latitude 41°01′20″, longitude 83°06′35″, Seneca County, Hydrologic Unit 04100011
Drainage area, in square miles: 149.
Station used for record extension: 04196500
Time period of systematic or extended record analyzed: 1922-10-01 to 1997-09-30
Percentage of estimated values in extended record: 71.1
Eighty-percent-duration streamflow, in cubic feet per second: 5.0
Mean annual streamflow, in inches: 10.95
Location of station used for precipitation data: Norwalk, Ohio
Location of station used for potential evapotranspiration data: Toledo, Ohio
[–, indicates a value that could not be determined because there were too few average low-flow values less than the mean stream-flow for the indicated duration]
Recurrenceinterval(years)
Extreme-value
variate
Minimum runoff (in inches) for indicated duration (in days)
180 360 540 720 1080 1440 1800
76.00 4.32 0.04 2.13 3.85 6.10 14.91 21.71 28.85
70.00 4.24 0.04 2.17 4.03 6.34 14.99 21.85 29.17
60.00 4.09 0.04 2.24 4.36 6.79 15.13 22.10 29.77
50.00 3.90 0.05 2.32 4.75 7.33 15.30 22.40 30.48
40.00 3.68 0.05 2.42 5.24 7.99 15.50 22.77 31.35
30.00 3.38 0.06 2.63 5.35 8.79 17.65 24.64 32.20
25.00 3.20 0.07 2.77 5.40 9.25 19.17 25.95 32.75
20.00 2.97 0.07 2.85 6.28 9.27 19.32 26.61 34.20
10.00 2.25 0.09 3.34 7.41 12.01 24.89 37.31 48.75
5.07 1.52 0.18 4.69 10.06 17.83 35.21 49.67 –
376 Hydrologic Considerations for Estimation of Storage-Capacity Requirements of Impounding and Side-Channel Reservoirs for Water Supply in Ohio

04197100 Honey Creek at Melmore, Ohio—Continued
Recurrenceinterval(years)
Impounding reservoir storage required (in inches) and critical-drawdown duration (in days; shown in gray) for indicated draft rate (in fraction of the mean annual streamflow)
0.02 0.05 0.10 0.15 0.20 0.25 0.30 0.35 0.40 0.45 0.50 0.60 0.70 0.80 0.90 1.00
5 0.03 0.13 0.36 0.63 0.90 1.24 1.60 1.96 2.32 2.68 3.04 3.77 4.58 5.48 6.38 7.28 60 150 150 180 180 240 240 240 240 240 240 270 300 300 300 300
6 0.03 0.14 0.40 0.67 0.95 1.27 1.63 1.99 2.35 2.71 3.07 3.90 4.80 5.70 6.60 7.90 90 150 180 180 210 240 240 240 240 240 240 300 300 300 300 600
8 0.03 0.16 0.43 0.71 1.02 1.34 1.69 2.05 2.41 2.81 3.26 4.16 5.06 5.96 7.64 9.48 90 180 180 210 210 210 240 240 240 300 300 300 300 300 600 660
10 0.04 0.18 0.45 0.74 1.06 1.38 1.74 2.10 2.52 2.96 3.41 4.31 5.21 6.57 8.55 10.53 120 180 180 210 210 240 240 240 300 300 300 300 300 660 660 660
15 0.05 0.19 0.47 0.78 1.11 1.47 1.83 2.27 2.72 3.17 3.62 4.52 5.72 7.70 10.08 14.20 150 180 210 210 240 240 240 300 300 300 300 300 660 660 1320 1380
20 0.06 0.20 0.49 0.81 1.17 1.53 1.93 2.38 2.83 3.28 3.75 4.74 6.25 8.68 13.29 18.50 150 180 210 240 240 240 300 300 300 300 330 330 660 1380 1740 1740
25 0.06 0.21 0.50 0.85 1.21 1.57 2.00 2.45 2.91 3.41 3.90 4.89 6.91 10.67 15.89 21.10 150 180 210 240 240 240 300 300 330 330 330 330 1020 1740 1740 1740
30 0.07 0.21 0.52 0.87 1.23 1.60 2.05 2.52 3.01 3.51 4.00 4.99 7.95 12.30 17.51 22.73 150 180 210 240 240 300 300 330 330 330 330 330 1020 1740 1740 1740
40 0.07 0.22 0.55 0.91 1.27 1.67 2.13 2.62 3.12 3.61 4.11 6.30 9.36 14.01 19.22 24.44 150 210 240 240 240 300 330 330 330 330 330 1020 1020 1740 1740 1740
50 0.07 0.23 0.57 0.93 1.29 1.72 2.18 2.67 3.17 3.66 4.25 7.20 10.26 14.65 19.87 25.08 150 210 240 240 240 300 330 330 330 330 660 1020 1020 1740 1740 1740
60 0.07 0.24 0.58 0.94 1.31 1.76 2.21 2.69 3.18 3.83 5.03 7.90 11.13 15.27 19.94 25.16 150 210 240 240 300 300 300 330 330 660 960 960 1380 1380 1740 1740
70 0.07 0.25 0.59 0.95 1.34 1.78 2.23 2.69 3.37 4.36 5.65 8.53 11.84 15.98 20.11 25.16 150 210 240 240 300 300 300 330 660 660 960 960 1380 1380 1380 1740
80 0.07 0.26 0.60 0.96 1.36 1.81 2.26 2.87 3.86 4.85 6.16 9.04 12.45 16.59 20.72 25.16 180 210 240 240 300 300 300 660 660 660 960 960 1380 1380 1380 1740
90 0.08 0.26 0.60 0.96 1.38 1.83 2.31 3.30 4.29 5.28 6.59 9.46 12.99 17.12 21.26 25.39 180 210 240 240 300 300 660 660 660 660 960 960 1380 1380 1380 1380
100 0.08 0.27 0.61 0.97 1.40 1.85 2.70 3.69 4.68 5.67 6.95 9.83 13.46 17.60 21.73 25.87 210 210 240 240 300 300 660 660 660 660 960 960 1380 1380 1380 1380
Hydrologic Design Tables 377

04197100 Honey Creek at Melmore, Ohio—Continued
Pumpset
Ratio of storage required for pump set to storage required for the primary pump relation (pump set 1) for indicated demand (in fraction of mean
annual streamflow)
0.002 0.010 0.020 0.050 0.100 0.200 0.300
1 1.00 1.00 1.00 1.00 1.00 1.00 1.00
2 2.29 1.96 1.97 2.36 6.25 19.21 32.05
3 1.12 1.06 1.02 1.02 1.11 1.61 2.14
4 1.02 1.03 1.00 1.00 1.00 1.00 1.22
5 1.03 1.01 1.00 1.00 1.00 1.00 1.07
6 1.03 1.00 1.00 1.00 1.00 1.00 1.00
7 2.40 2.13 2.23 4.09 20.38 44.91 55.77
8 1.15 1.08 1.06 1.09 1.63 2.54 11.37
9 1.14 1.11 1.06 1.23 1.79 4.12 19.75
10 1.12 1.10 1.15 1.16 1.59 2.49 6.58
11 1.06 1.10 1.17 1.18 1.45 2.10 3.51
12 1.22 1.13 1.09 1.25 2.02 9.72 24.76
13 1.09 1.08 1.06 1.13 1.36 2.11 3.05
14 1.06 1.06 1.15 1.16 1.25 1.81 2.31
15 1.05 1.09 1.17 1.22 1.27 1.72 2.35
16 1.08 1.16 1.24 1.22 1.37 1.64 2.32
17 1.04 1.06 1.05 1.14 1.12 1.66 2.27
18 1.05 1.06 1.15 1.18 1.25 1.56 2.00
19 1.08 1.09 1.17 1.19 1.27 1.59 2.17
20 1.09 1.17 1.23 1.22 1.37 1.52 2.24
378 Hydrologic Considerations for Estimation of Storage-Capacity Requirements of Impounding and Side-Channel Reservoirs for Water Supply in Ohio
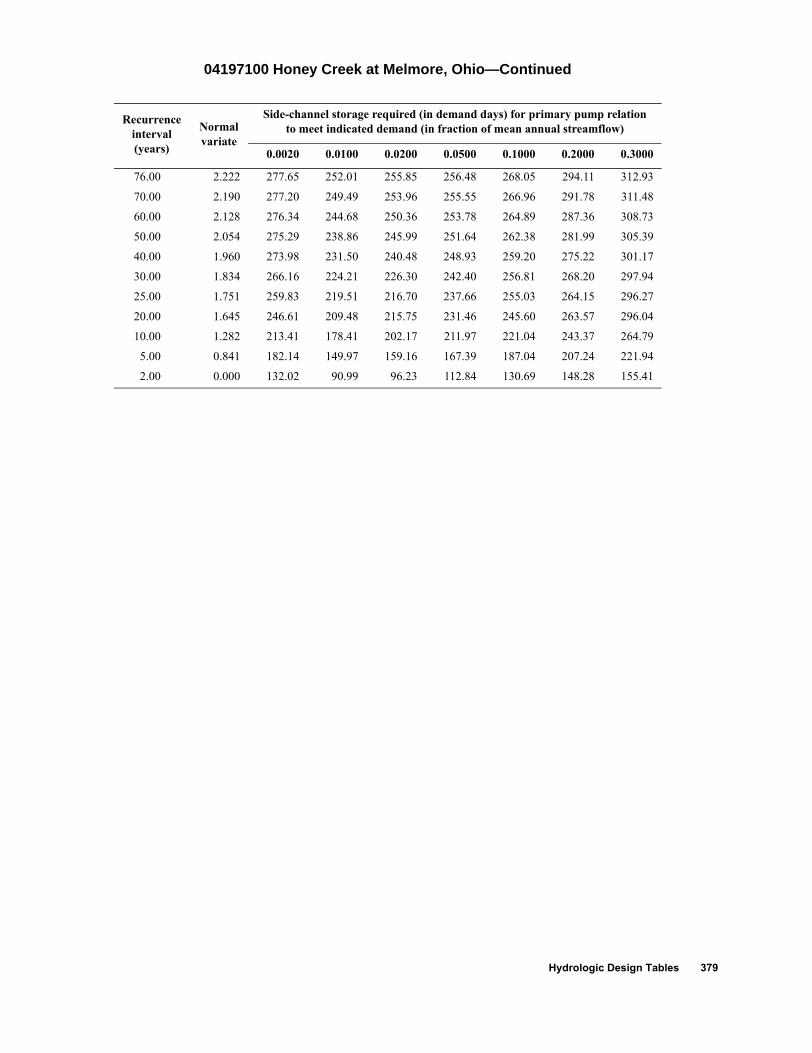
04197100 Honey Creek at Melmore, Ohio—Continued
Recurrenceinterval(years)
Normalvariate
Side-channel storage required (in demand days) for primary pump relation to meet indicated demand (in fraction of mean annual streamflow)
0.0020 0.0100 0.0200 0.0500 0.1000 0.2000 0.3000
76.00 2.222 277.65 252.01 255.85 256.48 268.05 294.11 312.93
70.00 2.190 277.20 249.49 253.96 255.55 266.96 291.78 311.48
60.00 2.128 276.34 244.68 250.36 253.78 264.89 287.36 308.73
50.00 2.054 275.29 238.86 245.99 251.64 262.38 281.99 305.39
40.00 1.960 273.98 231.50 240.48 248.93 259.20 275.22 301.17
30.00 1.834 266.16 224.21 226.30 242.40 256.81 268.20 297.94
25.00 1.751 259.83 219.51 216.70 237.66 255.03 264.15 296.27
20.00 1.645 246.61 209.48 215.75 231.46 245.60 263.57 296.04
10.00 1.282 213.41 178.41 202.17 211.97 221.04 243.37 264.79
5.00 0.841 182.14 149.97 159.16 167.39 187.04 207.24 221.94
2.00 0.000 132.02 90.99 96.23 112.84 130.69 148.28 155.41
Hydrologic Design Tables 379

04197170 Rock Creek at Tiffin, Ohio
Location: Latitude 41°06′49″, longitude 83°10′06″, Seneca County, Hydrologic Unit 04100011
Drainage area, in square miles: 34.6
Station used for record extension: 04199000
Time period of systematic or extended record analyzed: 1950-04-01 to 1997-09-30
Percentage of estimated values in extended record: 69.8
Eighty-percent-duration streamflow, in cubic feet per second: 2.2
Mean annual streamflow, in inches: 11.51
Location of station used for precipitation data: Norwalk, Ohio
Location of station used for potential evapotranspiration data: Toledo, Ohio
[–, indicates a value that could not be determined because there were too few average low-flow values less than the mean stream-flow for the indicated duration]
Recurrenceinterval(years)
Extreme-value
variate
Minimum runoff (in inches) for indicated duration (in days)
180 360 540 720 1080 1440 1800
48.00 3.86 0.19 2.15 3.87 6.49 15.18 24.39 35.07
40.00 3.68 0.20 2.21 4.30 7.13 16.22 26.33 36.87
30.00 3.38 0.21 2.29 4.97 8.16 17.87 29.41 39.73
25.00 3.20 0.22 2.35 5.40 8.80 18.92 31.36 41.54
20.00 2.97 0.24 2.36 5.72 10.56 21.38 33.98 43.64
10.00 2.25 0.31 3.10 8.59 14.48 25.98 40.60 50.19
5.33 1.57 0.59 4.22 10.03 17.13 34.59 54.16 –
380 Hydrologic Considerations for Estimation of Storage-Capacity Requirements of Impounding and Side-Channel Reservoirs for Water Supply in Ohio

04197170 Rock Creek at Tiffin, Ohio—Continued
Recurrenceinterval(years)
Impounding reservoir storage required (in inches) and critical-drawdown duration (in days; shown in gray) for indicated draft rate (in fraction of the mean annual streamflow)
0.02 0.05 0.10 0.15 0.20 0.25 0.30 0.35 0.40 0.45 0.50 0.60 0.70 0.80 0.90 1.00
5 0.00 0.03 0.16 0.35 0.59 0.83 1.06 1.38 1.76 2.14 2.52 3.34 4.19 5.04 6.04 7.97 0 60 90 150 150 150 150 240 240 240 240 270 270 270 600 660
6 0.00 0.03 0.18 0.38 0.62 0.89 1.23 1.61 1.99 2.42 2.84 3.70 4.55 5.40 6.25 7.97 0 60 120 150 150 180 240 240 270 270 270 270 270 270 270 660
8 0.00 0.04 0.21 0.44 0.74 1.09 1.48 1.90 2.33 2.76 3.18 4.03 4.88 5.74 6.77 8.66 0 60 120 180 210 240 270 270 270 270 270 270 270 270 600 600
10 0.00 0.04 0.23 0.51 0.84 1.21 1.63 2.06 2.48 2.91 3.34 4.19 5.12 6.16 7.66 9.82 0 90 180 210 210 240 270 270 270 270 270 270 330 330 600 1020
15 0.00 0.05 0.30 0.63 0.96 1.36 1.79 2.21 2.64 3.06 3.53 4.57 5.68 7.57 9.46 12.16 30 90 180 210 210 270 270 270 270 270 330 330 600 600 600 1020
20 0.01 0.06 0.34 0.67 1.00 1.41 1.84 2.27 2.70 3.22 3.74 4.90 6.79 8.68 10.58 13.74 30 150 210 210 240 270 270 270 330 330 330 600 600 600 600 1020
25 0.01 0.07 0.36 0.69 1.03 1.43 1.86 2.32 2.82 3.34 3.86 5.60 7.49 9.38 11.82 15.41 30 150 210 210 210 270 270 300 330 330 330 600 600 600 1020 1740
30 0.01 0.09 0.37 0.71 1.04 1.44 1.91 2.38 2.90 3.42 4.14 6.04 7.93 9.83 12.96 17.17 30 150 210 210 210 270 300 300 330 330 600 600 600 660 1020 1740
40 0.01 0.10 0.38 0.71 1.04 1.50 1.98 2.49 3.01 3.65 4.59 6.52 8.79 11.70 15.94 20.29 30 150 210 210 210 300 300 330 330 600 600 720 720 1020 1380 1380
50 0.01 0.11 0.38 0.71 1.06 1.53 2.05 2.57 3.09 3.94 5.07 7.34 10.33 14.68 19.03 23.38 30 150 210 210 300 300 330 330 330 720 720 720 1380 1380 1380 1380
60 0.01 0.11 0.38 0.71 1.08 1.60 2.12 2.64 3.36 4.50 5.63 8.64 12.99 17.34 21.70 26.05 30 150 210 210 330 330 330 330 720 720 720 1380 1380 1380 1380 1380
70 0.01 0.11 0.38 0.71 1.14 1.66 2.18 2.70 3.76 4.90 6.59 10.92 15.27 19.63 23.98 28.96 30 150 210 210 330 330 330 330 720 720 1320 1380 1380 1380 1380 1680
80 0.02 0.12 0.38 0.71 1.19 1.71 2.23 2.92 4.33 6.41 8.52 12.87 17.22 21.72 26.44 31.74 30 120 210 210 330 330 330 720 1320 1320 1380 1380 1380 1440 1680 1680
90 0.02 0.13 0.38 0.72 1.24 1.76 2.28 3.88 5.96 8.04 10.26 14.80 19.34 23.88 28.91 34.20 30 120 210 330 330 330 330 1320 1320 1320 1440 1440 1440 1440 1680 1680
100 0.02 0.13 0.38 0.77 1.29 1.81 3.20 5.28 7.55 9.82 12.09 16.63 21.17 25.78 31.08 36.37 120 120 210 330 330 330 1320 1440 1440 1440 1440 1440 1440 1680 1680 1680
Hydrologic Design Tables 381

04197170 Rock Creek at Tiffin, Ohio—Continued
Pumpset
Ratio of storage required for pump set to storage required for the primary pump relation (pump set 1) for indicated demand (in fraction of mean
annual streamflow)
0.002 0.010 0.020 0.050 0.100 0.200 0.300
1 1.00 1.00 1.00 1.00 1.00 1.00 1.00
2 2.41 1.55 1.15 1.00 1.18 10.95 21.89
3 2.08 1.41 1.08 1.01 1.00 1.00 1.63
4 1.75 1.23 1.00 1.00 1.00 1.00 1.01
5 1.06 1.06 1.00 1.00 1.00 1.00 1.00
6 1.00 1.00 1.00 1.00 1.00 1.00 1.00
7 2.44 1.58 1.23 1.07 4.75 29.58 38.83
8 2.08 1.45 1.19 1.12 1.08 3.85 20.17
9 2.11 1.51 1.26 1.17 1.12 12.34 29.28
10 1.94 1.47 1.31 1.17 1.25 4.77 20.94
11 1.79 1.56 1.28 1.21 1.32 2.50 15.71
12 2.24 1.51 1.19 1.12 1.05 11.29 26.54
13 1.92 1.43 1.23 1.17 1.17 1.99 13.30
14 1.69 1.39 1.28 1.18 1.24 1.89 4.56
15 1.10 1.47 1.28 1.20 1.34 1.79 3.37
16 1.08 1.54 1.39 1.21 1.36 1.91 3.58
17 1.77 1.34 1.19 1.17 1.16 1.68 3.59
18 1.10 1.32 1.26 1.18 1.24 1.57 2.71
19 1.08 1.38 1.28 1.22 1.35 1.51 2.73
20 1.08 1.50 1.39 1.21 1.36 1.62 2.95
Recurrenceinterval(years)
Normalvariate
Side-channel storage required (in demand days) for primary pump relation to meet indicated demand (in fraction of mean annual streamflow)
0.0020 0.0100 0.0200 0.0500 0.1000 0.2000 0.3000
48.00 2.037 125.02 180.44 230.58 258.86 266.13 276.59 290.74
40.00 1.960 123.02 177.59 228.37 257.79 263.86 274.59 289.18
30.00 1.834 119.74 172.92 224.74 256.03 260.15 271.32 286.61
25.00 1.751 117.58 169.84 222.34 254.87 257.69 269.16 284.92
20.00 1.645 113.21 167.72 207.06 233.95 239.25 264.58 282.35
10.00 1.282 105.92 147.96 155.51 167.70 201.21 240.52 261.87
5.00 0.841 90.57 119.92 130.74 137.74 162.73 199.33 226.49
2.00 0.000 35.73 67.01 80.27 96.36 116.39 145.81 160.06
382 Hydrologic Considerations for Estimation of Storage-Capacity Requirements of Impounding and Side-Channel Reservoirs for Water Supply in Ohio

04198000 Sandusky River near Fremont, Ohio
Location: Latitude 41°18′28″, longitude 83°09′32″, Sandusky County, Hydrologic Unit 04100011
Drainage area, in square miles: 1,251
Station used for record extension: None
Time period of systematic or extended record analyzed: 1938-08-01 to 1997-09-30
Eighty-percent-duration streamflow, in cubic feet per second: 62.
Mean annual streamflow, in inches: 11.35
Location of station used for precipitation data: Kenton, Ohio
Location of station used for potential evapotranspiration data: Toledo, Ohio
[–, indicates a value that could not be determined because there were too few average low-flow values less than the mean streamflow for the indicated duration]
Recurrenceinterval(years)
Extreme-value
variate
Minimum runoff (in inches) for indicated duration (in days)
180 360 540 720 1080 1440 1800
60.00 4.09 0.16 2.54 4.30 7.00 15.58 22.73 30.15
50.00 3.90 0.16 2.55 4.38 7.75 16.10 23.83 31.60
40.00 3.68 0.17 2.55 4.48 8.68 16.73 25.18 33.38
30.00 3.38 0.17 2.56 4.60 9.87 17.55 26.93 35.69
25.00 3.20 0.19 2.93 4.98 10.40 18.45 27.28 35.78
20.00 2.97 0.22 3.39 5.45 11.06 19.56 27.72 35.89
10.00 2.25 0.26 3.82 7.95 13.56 21.86 39.35 51.82
5.45 1.60 0.37 4.77 9.14 16.54 32.39 – –
Hydrologic Design Tables 383

04198000 Sandusky River near Fremont, Ohio—Continued
Recurrenceinterval(years)
Impounding reservoir storage required (in inches) and critical-drawdown duration (in days; shown in gray) for indicated draft rate (in fraction of the mean annual streamflow)
0.02 0.05 0.10 0.15 0.20 0.25 0.30 0.35 0.40 0.45 0.50 0.60 0.70 0.80 0.90 1.00
5 0.00 0.04 0.22 0.45 0.73 1.01 1.29 1.64 2.01 2.38 2.76 3.56 4.40 5.29 6.22 7.84 0 60 120 180 180 180 180 240 240 240 240 270 270 300 300 540
6 0.00 0.04 0.23 0.49 0.77 1.05 1.38 1.74 2.11 2.48 2.89 3.75 4.68 5.61 6.54 7.99 30 60 150 180 180 210 210 240 240 240 270 300 300 300 300 600
8 0.00 0.05 0.26 0.54 0.86 1.19 1.52 1.85 2.23 2.65 3.08 4.01 4.94 5.88 7.57 9.44 30 90 150 180 210 210 210 240 270 270 300 300 300 300 600 600
10 0.00 0.06 0.29 0.60 0.92 1.25 1.57 1.92 2.34 2.76 3.18 4.11 5.04 6.47 8.33 10.75 30 90 180 210 210 210 210 270 270 270 270 300 300 600 600 960
15 0.01 0.08 0.33 0.65 0.98 1.30 1.65 2.07 2.48 2.90 3.32 4.19 5.58 7.45 10.54 14.64 30 150 180 210 210 210 270 270 270 270 270 300 600 600 1320 1320
20 0.01 0.10 0.35 0.67 1.00 1.33 1.72 2.14 2.56 2.98 3.40 4.59 6.26 8.63 12.73 17.49 30 150 180 210 210 240 270 270 270 270 270 540 540 1320 1320 1740
25 0.01 0.11 0.37 0.68 1.01 1.37 1.78 2.20 2.62 3.04 3.48 5.16 6.84 10.04 14.98 20.39 60 150 180 210 210 240 270 270 270 270 540 540 540 1320 1740 1740
30 0.01 0.11 0.38 0.70 1.03 1.40 1.82 2.24 2.66 3.08 3.83 5.51 7.62 11.48 16.88 22.29 60 150 180 210 240 240 270 270 270 270 540 540 1020 1740 1740 1740
40 0.01 0.12 0.40 0.72 1.09 1.46 1.88 2.30 2.75 3.33 4.17 6.09 9.26 13.64 19.05 24.45 60 150 210 210 240 240 270 270 330 540 540 1020 1020 1740 1740 1740
50 0.02 0.13 0.43 0.76 1.14 1.51 1.94 2.41 2.89 3.52 4.54 7.30 10.47 14.68 20.02 25.43 60 150 210 240 240 240 300 300 330 600 660 1020 1020 1380 1740 1740
60 0.02 0.13 0.45 0.80 1.18 1.64 2.11 2.57 3.22 4.40 5.89 8.88 11.86 16.09 20.38 25.79 60 150 210 240 240 300 300 300 660 960 960 960 960 1380 1380 1800
70 0.02 0.15 0.48 0.85 1.31 1.78 2.25 2.84 4.33 5.82 7.31 10.29 13.28 17.37 21.66 26.74 90 210 210 300 300 300 300 960 960 960 960 960 960 1380 1380 1800
80 0.02 0.18 0.50 0.96 1.43 1.89 2.56 4.05 5.54 7.03 8.53 11.51 14.49 18.54 22.83 27.54 90 210 210 300 300 300 960 960 960 960 960 960 960 1380 1380 1800
90 0.02 0.20 0.59 1.05 1.52 2.10 3.59 5.08 6.57 8.06 9.55 12.53 15.51 19.61 23.90 28.25 90 210 300 300 300 960 960 960 960 960 960 960 960 1380 1380 1800
100 0.02 0.21 0.66 1.13 1.59 2.96 4.45 5.94 7.43 8.92 10.41 13.39 16.38 20.59 24.88 29.17 90 210 300 300 300 960 960 960 960 960 960 960 960 1380 1380 1380
384 Hydrologic Considerations for Estimation of Storage-Capacity Requirements of Impounding and Side-Channel Reservoirs for Water Supply in Ohio

04198000 Sandusky River near Fremont, Ohio—Continued
Pumpset
Ratio of storage required for pump set to storage required for the primary pump relation (pump set 1) for indicated demand (in fraction of mean
annual streamflow)
0.002 0.010 0.020 0.050 0.100 0.200 0.300
1 1.00 1.00 1.00 1.00 1.00 1.00 1.00
2 1.59 1.30 1.38 1.94 2.53 8.98 16.27
3 1.12 1.00 1.00 1.02 1.00 1.30 1.88
4 1.00 1.00 1.00 1.00 1.00 1.00 1.21
5 1.00 1.00 1.00 1.00 1.00 1.00 1.08
6 1.00 1.00 1.00 1.00 1.00 1.00 1.03
7 1.65 1.52 1.71 2.76 7.86 25.45 38.79
8 1.19 1.07 1.06 1.09 1.34 2.29 6.99
9 1.17 1.07 1.09 1.13 1.59 3.51 12.48
10 1.22 1.13 1.09 1.13 1.45 2.22 5.71
11 1.16 1.14 1.10 1.16 1.24 2.31 4.79
12 1.17 1.04 1.08 1.10 1.76 4.60 13.88
13 1.11 1.07 1.08 1.09 1.19 1.90 3.36
14 1.19 1.12 1.10 1.13 1.13 1.84 2.53
15 1.09 1.14 1.10 1.16 1.16 1.99 2.68
16 1.21 1.14 1.10 1.17 1.16 2.11 2.75
17 1.06 1.07 1.08 1.10 1.09 1.59 2.27
18 1.12 1.12 1.09 1.14 1.13 1.60 2.44
19 1.07 1.14 1.11 1.15 1.16 1.80 2.60
20 1.21 1.16 1.11 1.17 1.17 1.95 2.67
Recurrenceinterval(years)
Normalvariate
Side-channel storage required (in demand days) for primary pump relation to meet indicated demand (in fraction of mean annual streamflow)
0.0020 0.0100 0.0200 0.0500 0.1000 0.2000 0.3000
60.00 2.128 236.69 252.84 254.92 256.22 275.68 288.56 313.68
50.00 2.054 234.71 244.14 243.71 249.25 267.72 279.26 312.48
40.00 1.960 232.20 233.16 229.56 240.46 257.66 267.52 310.96
30.00 1.834 228.84 218.40 210.53 228.63 244.15 251.74 308.92
25.00 1.751 222.28 210.84 206.44 227.93 242.82 251.67 291.44
20.00 1.645 213.93 201.22 201.23 227.03 241.12 251.58 269.21
10.00 1.282 180.20 160.79 185.25 193.13 204.75 238.20 255.76
5.00 0.841 147.28 130.74 139.88 148.54 167.27 200.15 230.87
2.00 0.000 107.00 69.42 68.70 76.08 102.79 132.13 140.75
Hydrologic Design Tables 385

04199000 Huron River at Milan, Ohio
Location: Latitude 41°18′06″, longitude 82°36′25″, Erie County, Hydrologic Unit 04100012
Drainage area, in square miles: 371.
Station used for record extension: 04197100
Time period of systematic or extended record analyzed: 1950-04-01 to 1997-09-30
Percentage of estimated values in extended record: 12.6
Eighty-percent-duration streamflow, in cubic feet per second: 25.
Mean annual streamflow, in inches: 12.07
Location of station used for precipitation data: Norwalk, Ohio
Location of station used for potential evapotranspiration data: Cleveland, Ohio
[–, indicates a value that could not be determined because there were too few average low-flow values less than the mean stream-flow for the indicated duration]
Recurrenceinterval(years)
Extreme-value
variate
Minimum runoff (in inches) for indicated duration (in days)
180 360 540 720 1080 1440 1800
48.00 3.86 0.23 2.98 5.17 8.80 18.20 28.97 40.53
40.00 3.68 0.24 3.00 5.76 9.73 19.53 30.62 42.03
30.00 3.38 0.25 3.04 6.69 11.20 21.64 33.23 44.39
25.00 3.20 0.26 3.06 7.28 12.14 22.98 34.90 45.90
20.00 2.97 0.31 3.16 7.69 13.05 24.01 36.99 47.40
10.00 2.25 0.55 4.59 9.45 15.85 26.49 42.95 52.39
5.33 1.57 0.79 5.47 10.72 19.19 34.22 57.96 –
386 Hydrologic Considerations for Estimation of Storage-Capacity Requirements of Impounding and Side-Channel Reservoirs for Water Supply in Ohio

04199000 Huron River at Milan, Ohio—Continued
Recurrenceinterval(years)
Impounding reservoir storage required (in inches) and critical-drawdown duration (in days; shown in gray) for indicated draft rate (in fraction of the mean annual streamflow)
0.02 0.05 0.10 0.15 0.20 0.25 0.30 0.35 0.40 0.45 0.50 0.60 0.70 0.80 0.90 1.00
5 0.00 0.02 0.16 0.31 0.51 0.76 1.00 1.26 1.56 1.86 2.15 3.04 3.93 4.83 5.72 6.86 0 30 90 120 120 150 150 180 180 180 180 270 270 270 270 540
6 0.00 0.02 0.16 0.34 0.54 0.79 1.04 1.32 1.62 1.95 2.38 3.27 4.16 5.05 5.95 7.24 0 60 90 120 150 150 150 180 180 210 270 270 270 270 270 540
8 0.00 0.03 0.17 0.37 0.60 0.86 1.17 1.52 1.91 2.31 2.72 3.61 4.51 5.40 6.29 8.61 0 60 120 120 150 180 210 210 240 240 270 270 270 270 270 1020
10 0.00 0.04 0.19 0.40 0.66 1.00 1.34 1.73 2.13 2.52 2.96 3.85 4.74 5.63 6.98 10.00 0 60 120 150 180 210 210 240 240 240 270 270 270 270 600 1020
15 0.00 0.05 0.23 0.53 0.88 1.22 1.60 2.00 2.40 2.84 3.29 4.18 5.16 6.43 8.41 12.10 30 60 150 210 210 210 240 240 270 270 270 270 330 600 600 1800
20 0.00 0.05 0.30 0.63 0.98 1.32 1.71 2.11 2.55 3.00 3.45 4.46 5.55 7.35 9.34 12.74 30 60 180 210 210 210 240 270 270 270 270 330 330 600 600 1320
25 0.01 0.05 0.34 0.68 1.03 1.37 1.76 2.19 2.64 3.08 3.60 4.69 6.03 8.01 9.99 14.31 30 60 180 210 210 210 240 270 270 270 330 330 600 600 600 1320
30 0.01 0.06 0.36 0.70 1.05 1.40 1.79 2.23 2.69 3.20 3.74 4.83 6.52 8.50 11.35 15.77 30 150 180 210 210 210 270 270 300 330 330 330 600 600 1320 1380
40 0.01 0.08 0.37 0.71 1.06 1.41 1.82 2.32 2.82 3.36 3.91 5.22 7.20 9.44 13.90 18.46 30 150 180 210 210 210 300 300 330 330 330 600 600 1320 1380 1380
50 0.01 0.10 0.37 0.71 1.06 1.41 1.89 2.39 2.90 3.44 3.99 5.73 8.22 11.59 16.05 21.17 30 150 180 210 210 210 300 300 330 330 330 720 1020 1020 1380 1740
60 0.01 0.10 0.37 0.71 1.06 1.43 1.93 2.42 2.93 3.51 4.42 6.91 10.28 14.79 20.54 26.30 30 150 180 210 210 300 300 300 330 540 720 1020 1020 1740 1740 1740
70 0.02 0.10 0.37 0.71 1.06 1.44 1.94 2.44 3.06 4.14 5.40 8.77 14.01 19.76 25.51 31.26 30 150 180 210 210 300 300 300 540 720 1020 1020 1740 1740 1740 1740
80 0.02 0.11 0.37 0.71 1.06 1.45 1.94 2.55 3.73 5.35 7.04 12.75 18.50 24.25 30.01 35.96 30 150 180 210 210 300 300 540 720 1020 1020 1740 1740 1740 1800 1800
90 0.02 0.11 0.37 0.71 1.06 1.45 2.02 3.40 5.15 8.02 10.90 16.65 22.40 28.35 34.30 40.25 30 120 180 210 210 300 720 1020 1740 1740 1740 1740 1800 1800 1800 1800
100 0.02 0.12 0.37 0.71 1.06 1.45 2.93 5.57 8.45 11.32 14.20 20.09 26.03 31.98 37.93 43.88 30 120 180 210 210 300 1020 1740 1740 1740 1740 1800 1800 1800 1800 1800
Hydrologic Design Tables 387

04199000 Huron River at Milan, Ohio—Continued
Pumpset
Ratio of storage required for pump set to storage required for the primary pump relation (pump set 1) for indicated demand (in fraction of mean
annual streamflow)
0.002 0.010 0.020 0.050 0.100 0.200 0.300
1 1.00 1.00 1.00 1.00 1.00 1.00 1.00
2 1.74 1.37 1.13 1.09 1.02 2.16 11.76
3 1.39 1.29 1.09 1.03 1.00 1.00 1.03
4 1.00 1.18 1.04 1.00 1.00 1.00 1.00
5 1.00 1.12 1.00 1.00 1.00 1.00 1.00
6 1.00 1.06 1.00 1.00 1.00 1.00 1.00
7 1.75 1.44 1.25 1.18 1.55 20.41 34.30
8 1.41 1.32 1.14 1.21 1.12 1.32 3.20
9 1.44 1.40 1.25 1.26 1.15 1.71 11.89
10 1.17 1.32 1.18 1.30 1.19 1.69 4.62
11 1.14 1.37 1.23 1.35 1.29 1.62 3.28
12 1.57 1.36 1.15 1.19 1.11 1.54 10.03
13 1.12 1.33 1.15 1.24 1.16 1.31 2.13
14 1.04 1.29 1.13 1.31 1.19 1.36 2.12
15 1.03 1.31 1.17 1.33 1.28 1.44 2.21
16 1.02 1.27 1.23 1.38 1.31 1.55 2.59
17 1.04 1.31 1.12 1.22 1.16 1.31 1.81
18 1.00 1.23 1.12 1.29 1.19 1.36 1.87
19 1.01 1.26 1.17 1.32 1.28 1.46 2.04
20 1.02 1.26 1.23 1.38 1.29 1.55 2.39
Recurrenceinterval(years)
Normalvariate
Side-channel storage required (in demand days) for primary pump relation to meet indicated demand (in fraction of mean annual streamflow)
0.0020 0.0100 0.0200 0.0500 0.1000 0.2000 0.3000
48.00 2.037 109.00 135.36 170.59 194.88 225.15 240.23 255.90
40.00 1.960 106.73 135.34 166.62 194.28 221.31 237.26 253.28
30.00 1.834 103.02 135.30 160.11 193.30 215.02 232.39 248.99
25.00 1.751 100.56 135.28 155.81 192.65 210.87 229.18 246.16
20.00 1.645 93.83 133.76 148.92 186.12 203.11 224.25 243.43
10.00 1.282 83.96 128.82 135.04 143.38 159.02 208.39 234.37
5.00 0.841 70.20 102.10 104.94 117.74 137.46 162.15 182.82
2.00 0.000 24.00 53.64 68.48 77.73 99.30 112.45 135.47
388 Hydrologic Considerations for Estimation of Storage-Capacity Requirements of Impounding and Side-Channel Reservoirs for Water Supply in Ohio
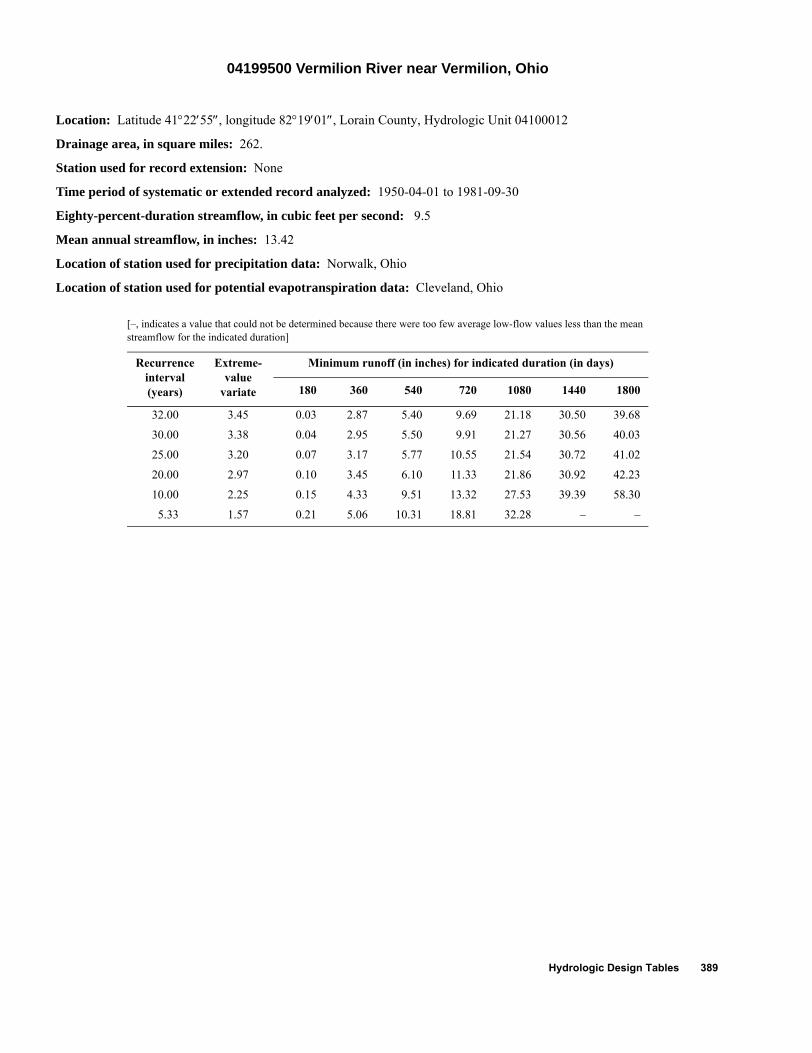
04199500 Vermilion River near Vermilion, Ohio
Location: Latitude 41°22′55″, longitude 82°19′01″, Lorain County, Hydrologic Unit 04100012
Drainage area, in square miles: 262.
Station used for record extension: None
Time period of systematic or extended record analyzed: 1950-04-01 to 1981-09-30
Eighty-percent-duration streamflow, in cubic feet per second: 9.5
Mean annual streamflow, in inches: 13.42
Location of station used for precipitation data: Norwalk, Ohio
Location of station used for potential evapotranspiration data: Cleveland, Ohio
[–, indicates a value that could not be determined because there were too few average low-flow values less than the mean streamflow for the indicated duration]
Recurrenceinterval(years)
Extreme-value
variate
Minimum runoff (in inches) for indicated duration (in days)
180 360 540 720 1080 1440 1800
32.00 3.45 0.03 2.87 5.40 9.69 21.18 30.50 39.68
30.00 3.38 0.04 2.95 5.50 9.91 21.27 30.56 40.03
25.00 3.20 0.07 3.17 5.77 10.55 21.54 30.72 41.02
20.00 2.97 0.10 3.45 6.10 11.33 21.86 30.92 42.23
10.00 2.25 0.15 4.33 9.51 13.32 27.53 39.39 58.30
5.33 1.57 0.21 5.06 10.31 18.81 32.28 – –
Hydrologic Design Tables 389

04199500 Vermilion River near Vermilion, Ohio—Continued
Recurrenceinterval(years)
Impounding reservoir storage required (in inches) and critical-drawdown duration (in days; shown in gray) for indicated draft rate (in fraction of the mean annual streamflow)
0.02 0.05 0.10 0.15 0.20 0.25 0.30 0.35 0.40 0.45 0.50 0.60 0.70 0.80 0.90 1.00
5 0.04 0.13 0.43 0.76 1.09 1.43 1.76 2.14 2.52 3.00 3.49 4.49 5.48 6.47 8.23 10.21 90 90 180 180 180 180 180 210 210 270 270 270 270 270 540 540
6 0.04 0.15 0.46 0.79 1.13 1.48 1.86 2.25 2.71 3.21 3.70 4.73 5.84 6.94 8.44 10.87 90 150 180 180 180 210 210 210 270 270 270 300 300 300 660 660
8 0.04 0.17 0.49 0.82 1.19 1.58 1.96 2.39 2.89 3.38 3.88 4.98 6.09 7.54 9.97 12.40 90 150 180 180 210 210 210 240 270 270 300 300 300 660 660 660
10 0.04 0.18 0.50 0.86 1.24 1.63 2.06 2.50 2.98 3.48 3.97 5.02 6.22 8.19 11.18 15.34 120 150 180 210 210 210 240 240 270 270 270 300 330 660 1020 1380
15 0.06 0.20 0.56 0.94 1.36 1.80 2.24 2.70 3.20 3.69 4.19 5.33 8.43 12.65 17.51 22.83 120 150 210 210 240 240 240 270 270 270 270 330 900 1320 1320 1740
20 0.07 0.24 0.62 1.04 1.48 1.93 2.43 2.92 3.42 3.92 4.42 6.88 10.59 15.22 21.50 27.90 120 210 210 240 240 270 270 270 270 270 300 900 1260 1260 1740 1740
25 0.07 0.29 0.69 1.13 1.62 2.11 2.61 3.16 3.71 4.26 4.82 7.18 10.90 16.20 22.59 28.99 150 210 240 240 270 270 270 300 300 300 300 900 1260 1740 1740 1740
30 0.09 0.32 0.76 1.26 1.81 2.36 2.91 3.46 4.01 4.56 5.63 8.06 10.90 16.20 22.59 28.99 210 210 270 300 300 300 300 300 300 300 660 660 1260 1740 1740 1740
40 0.13 0.45 1.00 1.55 2.10 2.65 3.20 4.15 5.36 6.58 7.79 10.21 12.64 17.91 23.87 29.82 210 300 300 300 300 300 300 660 660 660 660 660 660 1620 1620 1620
50 0.20 0.53 1.08 1.63 2.18 3.26 4.47 5.69 6.90 8.11 9.33 12.06 18.01 23.97 29.92 35.88 300 300 300 300 300 660 660 660 660 660 660 1620 1620 1620 1620 1620
60 0.22 0.55 1.10 1.86 3.07 4.28 5.49 6.71 7.92 9.13 11.76 17.71 23.67 29.62 35.57 41.53 300 300 300 660 660 660 660 660 660 660 1620 1620 1620 1620 1620 1620
70 0.22 0.55 1.30 2.51 3.72 4.94 6.15 7.54 10.51 13.49 16.47 22.42 28.38 34.33 40.29 46.24 300 300 660 660 660 660 660 1620 1620 1620 1620 1620 1620 1620 1620 1620
80 0.22 0.55 1.71 2.92 4.14 5.35 8.24 11.22 14.19 17.17 20.15 26.10 32.06 38.01 43.96 49.92 300 300 660 660 660 660 1620 1620 1620 1620 1620 1620 1620 1620 1620 1620
90 0.22 0.76 1.97 3.18 5.04 8.02 10.99 13.97 16.95 19.93 22.90 28.86 34.81 40.77 46.72 52.67 300 660 660 660 1620 1620 1620 1620 1620 1620 1620 1620 1620 1620 1620 1620
100 0.22 0.92 2.13 4.07 7.05 10.03 13.00 15.98 18.96 21.94 24.91 30.87 36.82 42.78 48.73 54.68 300 660 660 1620 1620 1620 1620 1620 1620 1620 1620 1620 1620 1620 1620 1620
390 Hydrologic Considerations for Estimation of Storage-Capacity Requirements of Impounding and Side-Channel Reservoirs for Water Supply in Ohio

04199500 Vermilion River near Vermilion, Ohio—Continued
Pumpset
Ratio of storage required for pump set to storage required for the primary pump relation (pump set 1) for indicated demand (in fraction of mean
annual streamflow)
0.002 0.010 0.020 0.050 0.100 0.200 0.300
1 1.00 1.00 1.00 1.00 1.00 1.00 1.00
2 1.50 1.42 1.47 1.60 2.07 6.71 9.86
3 1.00 1.00 1.00 1.01 1.00 1.10 1.62
4 1.00 1.00 1.00 1.00 1.00 1.00 1.01
5 1.00 1.00 1.00 1.00 1.00 1.00 1.00
6 1.00 1.00 1.00 1.00 1.00 1.00 1.00
7 1.51 1.49 1.59 1.93 6.51 12.92 18.78
8 1.01 1.01 1.03 1.11 1.15 2.02 6.97
9 1.01 1.02 1.11 1.16 1.22 4.24 10.16
10 1.02 1.04 1.09 1.20 1.15 1.95 6.95
11 1.01 1.06 1.14 1.23 1.17 1.55 5.63
12 1.00 1.02 1.08 1.27 1.36 5.24 9.85
13 1.01 1.02 1.06 1.16 1.12 1.34 4.05
14 1.02 1.03 1.08 1.20 1.15 1.34 2.19
15 1.01 1.06 1.14 1.22 1.17 1.42 1.89
16 1.03 1.07 1.16 1.26 1.21 1.51 1.82
17 1.01 1.01 1.06 1.16 1.12 1.23 1.82
18 1.01 1.02 1.09 1.20 1.15 1.24 1.66
19 1.01 1.06 1.14 1.22 1.18 1.31 1.74
20 1.03 1.07 1.16 1.26 1.20 1.42 1.75
Recurrenceinterval(years)
Normalvariate
Side-channel storage required (in demand days) for primary pump relation to meet indicated demand (in fraction of mean annual streamflow)
0.0020 0.0100 0.0200 0.0500 0.1000 0.2000 0.3000
32.00 1.863 297.24 285.09 277.25 290.20 313.45 325.67 331.90
30.00 1.834 289.95 276.72 269.98 283.71 306.67 318.92 326.09
25.00 1.751 268.87 252.52 248.95 264.92 287.07 299.40 309.26
20.00 1.645 242.07 221.74 222.21 241.02 262.14 274.57 287.87
10.00 1.282 203.21 173.36 181.40 203.25 221.98 239.76 251.89
5.00 0.841 157.97 138.61 147.87 164.63 187.71 204.59 224.46
2.00 0.000 102.47 80.43 82.06 100.08 117.15 129.69 149.94
Hydrologic Design Tables 391
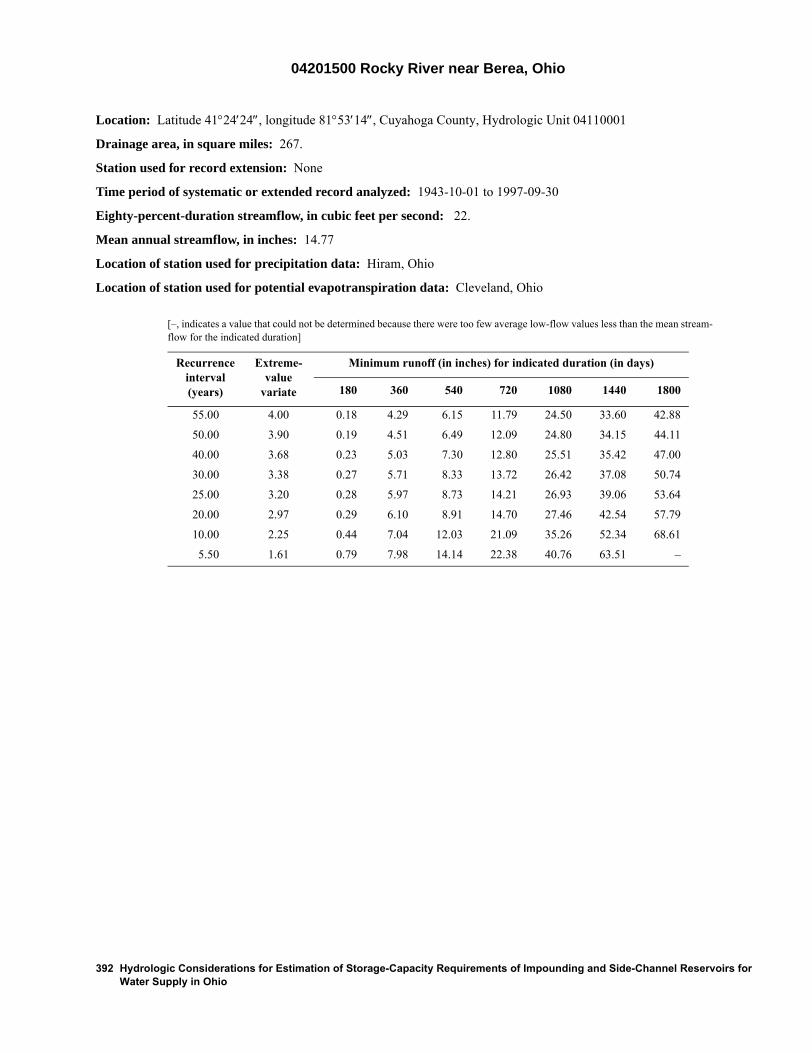
04201500 Rocky River near Berea, Ohio
Location: Latitude 41°24′24″, longitude 81°53′14″, Cuyahoga County, Hydrologic Unit 04110001
Drainage area, in square miles: 267.
Station used for record extension: None
Time period of systematic or extended record analyzed: 1943-10-01 to 1997-09-30
Eighty-percent-duration streamflow, in cubic feet per second: 22.
Mean annual streamflow, in inches: 14.77
Location of station used for precipitation data: Hiram, Ohio
Location of station used for potential evapotranspiration data: Cleveland, Ohio
[–, indicates a value that could not be determined because there were too few average low-flow values less than the mean stream-flow for the indicated duration]
Recurrenceinterval(years)
Extreme-value
variate
Minimum runoff (in inches) for indicated duration (in days)
180 360 540 720 1080 1440 1800
55.00 4.00 0.18 4.29 6.15 11.79 24.50 33.60 42.88
50.00 3.90 0.19 4.51 6.49 12.09 24.80 34.15 44.11
40.00 3.68 0.23 5.03 7.30 12.80 25.51 35.42 47.00
30.00 3.38 0.27 5.71 8.33 13.72 26.42 37.08 50.74
25.00 3.20 0.28 5.97 8.73 14.21 26.93 39.06 53.64
20.00 2.97 0.29 6.10 8.91 14.70 27.46 42.54 57.79
10.00 2.25 0.44 7.04 12.03 21.09 35.26 52.34 68.61
5.50 1.61 0.79 7.98 14.14 22.38 40.76 63.51 –
392 Hydrologic Considerations for Estimation of Storage-Capacity Requirements of Impounding and Side-Channel Reservoirs for Water Supply in Ohio

04201500 Rocky River near Berea, Ohio—Continued
Recurrenceinterval(years)
Impounding reservoir storage required (in inches) and critical-drawdown duration (in days; shown in gray) for indicated draft rate (in fraction of the mean annual streamflow)
0.02 0.05 0.10 0.15 0.20 0.25 0.30 0.35 0.40 0.45 0.50 0.60 0.70 0.80 0.90 1.00
5 0.00 0.05 0.22 0.46 0.76 1.07 1.37 1.68 2.04 2.41 2.77 3.64 4.61 5.58 6.55 7.61 30 60 90 150 150 150 150 180 180 180 180 240 240 240 240 720
6 0.01 0.06 0.24 0.52 0.83 1.13 1.49 1.85 2.25 2.68 3.14 4.11 5.08 6.05 7.02 8.36 30 60 120 150 150 150 180 180 210 210 240 240 240 240 240 600
8 0.01 0.07 0.29 0.60 0.93 1.32 1.75 2.17 2.62 3.11 3.59 4.56 5.54 6.51 7.56 9.79 30 90 150 150 180 210 210 210 240 240 240 240 240 240 270 600
10 0.01 0.08 0.33 0.64 1.06 1.49 1.91 2.36 2.84 3.33 3.81 4.79 5.76 6.73 8.35 11.80 30 90 150 180 210 210 210 240 240 240 240 240 240 240 600 900
15 0.01 0.10 0.39 0.81 1.24 1.66 2.12 2.61 3.09 3.58 4.06 5.03 6.00 8.58 12.22 15.94 30 90 210 210 210 210 240 240 240 240 240 240 240 900 900 960
20 0.01 0.11 0.46 0.88 1.31 1.75 2.23 2.72 3.20 3.69 4.17 5.14 7.20 10.84 14.64 18.62 30 150 210 210 210 240 240 240 240 240 240 240 900 900 960 1020
25 0.01 0.13 0.49 0.92 1.34 1.81 2.30 2.78 3.27 3.75 4.24 5.21 8.46 12.24 16.32 21.00 30 150 210 210 210 240 240 240 240 240 240 240 900 960 1020 1380
30 0.01 0.14 0.51 0.94 1.37 1.86 2.34 2.83 3.31 3.80 4.29 5.58 9.18 13.27 17.39 22.72 30 150 210 210 240 240 240 240 240 240 240 600 960 1020 1020 1380
40 0.01 0.16 0.53 0.96 1.44 1.92 2.41 2.89 3.44 4.05 4.66 6.79 9.98 14.11 19.76 26.80 30 150 210 210 240 240 240 240 300 300 300 600 1020 1020 1740 1740
50 0.01 0.18 0.54 1.00 1.49 2.00 2.61 3.22 3.82 4.43 5.29 7.74 10.41 15.97 23.01 30.05 60 150 210 240 240 300 300 300 300 300 600 660 660 1740 1740 1740
60 0.02 0.19 0.56 1.07 1.68 2.29 2.89 3.50 4.11 4.83 6.05 8.47 11.63 18.67 25.71 32.75 120 180 180 300 300 300 300 300 300 600 600 600 1740 1740 1740 1740
70 0.03 0.21 0.67 1.28 1.89 2.49 3.10 3.71 4.31 5.45 6.67 9.10 13.95 20.99 28.03 35.06 120 180 300 300 300 300 300 300 300 600 600 600 1740 1740 1740 1740
80 0.04 0.23 0.82 1.43 2.03 2.64 3.25 3.85 4.77 5.98 7.19 10.14 16.70 23.25 30.05 37.09 120 180 300 300 300 300 300 300 600 600 600 1620 1620 1620 1740 1740
90 0.05 0.32 0.93 1.53 2.14 2.75 3.35 4.00 5.21 6.43 7.64 12.66 19.22 25.77 32.32 38.89 120 300 300 300 300 300 300 600 600 600 600 1620 1620 1620 1620 1740
100 0.06 0.40 1.00 1.61 2.22 2.82 3.43 4.39 5.60 6.82 8.40 14.95 21.51 28.06 34.61 41.17 120 300 300 300 300 300 300 600 600 600 1620 1620 1620 1620 1620 1620
Hydrologic Design Tables 393
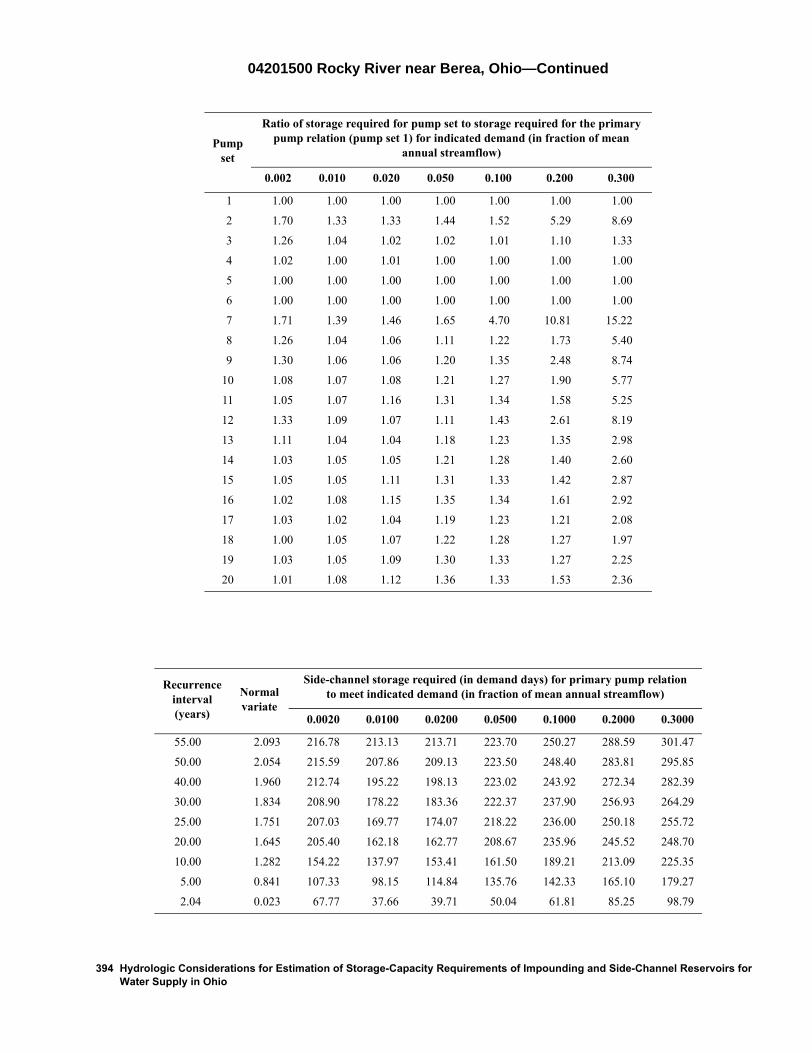
04201500 Rocky River near Berea, Ohio—Continued
Pumpset
Ratio of storage required for pump set to storage required for the primary pump relation (pump set 1) for indicated demand (in fraction of mean
annual streamflow)
0.002 0.010 0.020 0.050 0.100 0.200 0.300
1 1.00 1.00 1.00 1.00 1.00 1.00 1.00
2 1.70 1.33 1.33 1.44 1.52 5.29 8.69
3 1.26 1.04 1.02 1.02 1.01 1.10 1.33
4 1.02 1.00 1.01 1.00 1.00 1.00 1.00
5 1.00 1.00 1.00 1.00 1.00 1.00 1.00
6 1.00 1.00 1.00 1.00 1.00 1.00 1.00
7 1.71 1.39 1.46 1.65 4.70 10.81 15.22
8 1.26 1.04 1.06 1.11 1.22 1.73 5.40
9 1.30 1.06 1.06 1.20 1.35 2.48 8.74
10 1.08 1.07 1.08 1.21 1.27 1.90 5.77
11 1.05 1.07 1.16 1.31 1.34 1.58 5.25
12 1.33 1.09 1.07 1.11 1.43 2.61 8.19
13 1.11 1.04 1.04 1.18 1.23 1.35 2.98
14 1.03 1.05 1.05 1.21 1.28 1.40 2.60
15 1.05 1.05 1.11 1.31 1.33 1.42 2.87
16 1.02 1.08 1.15 1.35 1.34 1.61 2.92
17 1.03 1.02 1.04 1.19 1.23 1.21 2.08
18 1.00 1.05 1.07 1.22 1.28 1.27 1.97
19 1.03 1.05 1.09 1.30 1.33 1.27 2.25
20 1.01 1.08 1.12 1.36 1.33 1.53 2.36
Recurrenceinterval(years)
Normalvariate
Side-channel storage required (in demand days) for primary pump relation to meet indicated demand (in fraction of mean annual streamflow)
0.0020 0.0100 0.0200 0.0500 0.1000 0.2000 0.3000
55.00 2.093 216.78 213.13 213.71 223.70 250.27 288.59 301.47
50.00 2.054 215.59 207.86 209.13 223.50 248.40 283.81 295.85
40.00 1.960 212.74 195.22 198.13 223.02 243.92 272.34 282.39
30.00 1.834 208.90 178.22 183.36 222.37 237.90 256.93 264.29
25.00 1.751 207.03 169.77 174.07 218.22 236.00 250.18 255.72
20.00 1.645 205.40 162.18 162.77 208.67 235.96 245.52 248.70
10.00 1.282 154.22 137.97 153.41 161.50 189.21 213.09 225.35
5.00 0.841 107.33 98.15 114.84 135.76 142.33 165.10 179.27
2.04 0.023 67.77 37.66 39.71 50.04 61.81 85.25 98.79
394 Hydrologic Considerations for Estimation of Storage-Capacity Requirements of Impounding and Side-Channel Reservoirs for Water Supply in Ohio

04207200 Tinkers Creek at Bedford, Ohio
Location: Latitude 41°23′04″, longitude 81°31′39″, Cuyahoga County, Hydrologic Unit 04110002
Drainage area, in square miles: 83.9
Station used for record extension: None
Time period of systematic or extended record analyzed: 1962-12-01 to 1994-10-31
Eighty-percent-duration streamflow, in cubic feet per second: 28.
Mean annual streamflow, in inches: 21.71
Location of station used for precipitation data: Hiram, Ohio
Location of station used for potential evapotranspiration data: Cleveland, Ohio
[–, indicates a value that could not be determined because there were too few average low-flow values less than the mean streamflow for the indicated duration]
Recurrenceinterval(years)
Extreme-value
variate
Minimum runoff (in inches) for indicated duration (in days)
180 360 540 720 1080 1440 1800
32.00 3.45 1.09 10.19 14.27 25.00 40.82 54.65 69.33
30.00 3.38 1.10 10.37 14.55 25.24 41.50 56.41 72.20
25.00 3.20 1.13 10.88 15.36 25.94 43.44 61.41 80.33
20.00 2.97 1.16 11.51 16.35 26.79 45.82 67.55 90.32
10.00 2.25 1.79 12.98 22.21 32.01 53.45 77.62 101.08
5.33 1.57 3.03 13.42 26.40 39.95 59.63 89.84 –
Hydrologic Design Tables 395

04207200 Tinkers Creek at Bedford, Ohio—Continued
Recurrenceinterval(years)
Impounding reservoir storage required (in inches) and critical-drawdown duration (in days; shown in gray) for indicated draft rate (in fraction of the mean annual streamflow)
0.02 0.05 0.10 0.15 0.20 0.25 0.30 0.35 0.40 0.45 0.50 0.60 0.70 0.80 0.90 1.00
5 0.00 0.00 0.01 0.11 0.29 0.47 0.64 0.87 1.14 1.56 2.18 3.43 4.68 6.17 7.77 9.38 0 0 30 60 60 60 60 90 90 180 210 210 210 270 270 270
6 0.00 0.00 0.03 0.12 0.30 0.54 0.81 1.17 1.62 2.06 2.58 3.65 4.72 6.17 7.77 9.38 0 0 30 60 60 90 90 150 150 150 180 180 180 270 270 270
8 0.00 0.00 0.04 0.19 0.46 0.88 1.33 1.77 2.22 2.70 3.23 4.30 5.37 6.75 8.18 9.61 0 0 30 90 90 150 150 150 150 180 180 180 180 240 240 240
10 0.00 0.00 0.05 0.27 0.65 1.10 1.54 2.02 2.56 3.09 3.63 4.70 6.12 7.55 8.97 12.67 0 0 30 90 150 150 150 180 180 180 180 180 240 240 240 900
15 0.00 0.00 0.08 0.37 0.88 1.42 1.95 2.52 3.15 3.79 4.50 5.93 7.35 8.78 13.42 18.77 0 0 60 150 180 180 180 210 210 240 240 240 240 240 900 900
20 0.00 0.00 0.11 0.51 1.06 1.69 2.31 2.94 3.64 4.35 5.06 6.49 7.92 11.49 16.84 22.19 0 0 60 180 210 210 210 210 240 240 240 240 240 900 900 900
25 0.00 0.00 0.13 0.57 1.20 1.82 2.47 3.18 3.89 4.61 5.32 6.75 8.55 13.27 18.62 24.15 0 0 90 210 210 210 240 240 240 240 240 240 600 900 900 1320
30 0.00 0.00 0.15 0.57 1.20 1.85 2.56 3.28 3.99 4.70 5.42 6.98 9.46 14.02 23.64 33.79 0 0 90 210 210 240 240 240 240 240 240 300 600 900 1680 1740
40 0.00 0.00 0.20 0.94 1.83 2.72 3.61 4.51 5.40 6.29 10.01 20.35 30.70 41.04 51.38 61.72 0 0 90 300 300 300 300 300 300 300 1740 1740 1740 1740 1740 1740
50 0.00 0.14 1.03 1.92 2.82 3.87 9.04 14.21 19.39 24.56 29.73 40.07 50.41 60.76 71.12 81.82 0 300 300 300 300 1740 1740 1740 1740 1740 1740 1740 1740 1740 1800 1800
60 0.04 0.58 1.47 4.73 9.91 15.08 20.25 25.42 30.59 35.76 40.93 51.41 62.10 72.80 83.50 94.20 300 300 300 1740 1740 1740 1740 1740 1740 1740 1740 1800 1800 1800 1800 1800
70 0.23 0.76 5.27 10.44 15.61 20.78 25.96 31.20 36.55 41.90 47.25 57.95 68.64 79.34 90.04 100.7 300 300 1740 1740 1740 1740 1740 1800 1800 1800 1800 1800 1800 1800 1800 1800
80 0.30 2.84 8.01 13.18 18.41 23.76 29.11 34.46 39.81 45.16 50.51 61.21 71.90 82.60 93.30 104.0 300 1740 1740 1740 1800 1800 1800 1800 1800 1800 1800 1800 1800 1800 1800 1800
90 0.35 4.11 9.28 14.63 19.98 25.33 30.68 36.03 41.38 46.73 52.08 62.78 73.48 84.18 94.88 105.6 330 1740 1800 1800 1800 1800 1800 1800 1800 1800 1800 1800 1800 1800 1800 1800
100 0.51 4.69 10.03 15.38 20.73 26.08 31.43 36.78 42.13 47.48 52.83 63.53 74.23 84.92 95.62 106.31620 1740 1800 1800 1800 1800 1800 1800 1800 1800 1800 1800 1800 1800 1800 1800
396 Hydrologic Considerations for Estimation of Storage-Capacity Requirements of Impounding and Side-Channel Reservoirs for Water Supply in Ohio

04207200 Tinkers Creek at Bedford, Ohio—Continued
Pumpset
Ratio of storage required for pump set to storage required for the primary pump relation (pump set 1) for indicated demand (in fraction of mean
annual streamflow)
0.002 0.010 0.020 0.050 0.100 0.200 0.300
1 1.00 1.00 1.00 1.00 1.00 1.00 1.00
2 3.44 2.81 2.18 1.88 1.99 2.82 3.63
3 2.14 1.77 1.36 1.16 1.04 1.27 1.44
4 1.74 1.48 1.16 1.09 1.01 1.00 1.10
5 1.41 1.29 1.08 1.04 1.00 1.00 1.00
6 1.13 1.12 1.03 1.01 1.00 1.00 1.00
7 3.43 2.87 2.26 2.10 2.74 4.17 8.13
8 2.15 1.79 1.40 1.24 1.26 1.56 2.83
9 2.15 1.79 1.44 1.26 1.34 1.97 3.69
10 1.88 1.60 1.33 1.25 1.11 1.57 3.12
11 1.75 1.55 1.36 1.29 1.17 1.52 3.16
12 2.30 1.89 1.45 1.50 1.50 2.21 3.45
13 1.89 1.58 1.34 1.21 1.12 1.42 2.29
14 1.65 1.44 1.21 1.21 1.10 1.30 2.06
15 1.41 1.33 1.25 1.24 1.17 1.23 2.24
16 1.20 1.30 1.19 1.24 1.19 1.22 2.52
17 1.74 1.49 1.25 1.19 1.11 1.22 1.51
18 1.40 1.30 1.13 1.17 1.10 1.13 1.43
19 1.14 1.18 1.17 1.22 1.17 1.20 1.68
20 1.01 1.16 1.16 1.24 1.19 1.21 2.00
Recurrenceinterval(years)
Normalvariate
Side-channel storage required (in demand days) for primary pump relation to meet indicated demand (in fraction of mean annual streamflow)
0.0020 0.0100 0.0200 0.0500 0.1000 0.2000 0.3000
32.00 1.863 112.31 125.47 162.08 199.18 234.20 254.99 266.24
30.00 1.834 111.10 124.17 157.75 197.17 231.30 251.46 262.83
25.00 1.751 107.62 120.41 145.21 191.37 222.90 241.26 252.98
20.00 1.645 103.18 115.62 129.26 183.99 212.22 228.29 240.44
10.00 1.282 92.53 97.11 100.78 125.37 153.75 168.25 177.04
5.00 0.841 55.12 52.79 52.65 65.70 75.83 107.21 135.31
2.00 0.000 33.96 28.94 29.80 31.63 44.10 57.92 78.07
Hydrologic Design Tables 397

04210000 Phelps Creek near Windsor, Ohio
Location: Latitude 41°30′56″, longitude 80°56′07″, Ashtabula County, Hydrologic Unit 04110004
Drainage area, in square miles: 25.6
Station used for record extension: 04211000
Time period of systematic or extended record analyzed: 1942-04-01 to 1966-09-30
Percentage of estimated values in extended record: 29.9
Eighty-percent-duration streamflow, in cubic feet per second: 1.2
Mean annual streamflow, in inches: 17.44
Location of station used for precipitation data: Hiram, Ohio
Location of station used for potential evapotranspiration data: Cleveland, Ohio
[–, indicates a value that could not be determined because there were too few average low-flow values less than the mean stream-flow for the indicated duration]
Recurrenceinterval(years)
Extreme-value
variate
Minimum runoff (in inches) for indicated duration (in days)
180 360 540 720 1080 1440 1800
25.00 3.20 0.24 4.89 7.40 12.47 25.88 40.16 55.51
20.00 2.97 0.24 5.76 8.40 14.59 31.03 46.15 63.88
10.00 2.25 0.26 8.80 11.93 22.80 44.65 59.79 81.77
6.25 1.75 0.28 10.40 14.52 26.09 50.71 86.74 –
398 Hydrologic Considerations for Estimation of Storage-Capacity Requirements of Impounding and Side-Channel Reservoirs for Water Supply in Ohio

04210000 Phelps Creek near Windsor, Ohio—Continued
Recurrenceinterval(years)
Impounding reservoir storage required (in inches) and critical-drawdown duration (in days; shown in gray) for indicated draft rate (in fraction of the mean annual streamflow)
0.02 0.05 0.10 0.15 0.20 0.25 0.30 0.35 0.40 0.45 0.50 0.60 0.70 0.80 0.90 1.00
5 0.01 0.15 0.53 0.96 1.41 1.91 2.42 2.92 3.42 3.92 4.42 5.56 6.70 7.85 8.99 10.94 30 120 180 180 210 210 210 210 210 210 210 240 240 240 240 600
6 0.02 0.16 0.57 1.00 1.50 2.00 2.50 3.00 3.50 4.04 4.61 5.75 6.90 8.05 9.59 12.46 30 150 180 180 210 210 210 210 210 240 240 240 240 240 600 600
8 0.03 0.18 0.60 1.04 1.54 2.05 2.55 3.08 3.65 4.22 4.80 5.94 7.14 8.59 11.45 14.32 90 150 180 210 210 210 210 240 240 240 240 240 270 600 600 600
10 0.03 0.18 0.61 1.05 1.55 2.05 2.59 3.17 3.74 4.33 4.98 6.26 7.55 9.83 12.70 15.56 90 150 180 210 210 210 240 240 240 270 270 270 270 600 600 600
15 0.04 0.20 0.61 1.05 1.55 2.14 2.78 3.43 4.07 4.72 5.36 6.65 9.23 12.09 15.17 18.32 90 150 180 210 240 270 270 270 270 270 270 270 600 600 660 660
20 0.05 0.21 0.61 1.06 1.62 2.19 2.80 3.44 4.08 4.73 5.37 8.12 11.13 14.28 19.08 25.00 90 150 180 210 240 240 270 270 270 270 270 600 660 660 1020 1380
25 0.05 0.22 0.62 1.10 1.67 2.25 2.82 3.44 4.08 5.27 6.70 10.73 15.60 20.47 26.79 33.38 90 150 180 210 240 240 240 270 270 600 600 1020 1020 1020 1380 1380
Hydrologic Design Tables 399

04210000 Phelps Creek near Windsor, Ohio—Continued
Pumpset
Ratio of storage required for pump set to storage required for the primary pump relation (pump set 1) for indicated demand (in fraction of mean
annual streamflow)
0.002 0.010 0.020 0.050 0.100 0.200 0.300
1 1.00 1.00 1.00 1.00 1.00 1.00 1.00
2 1.04 1.00 1.00 1.01 1.91 4.33 8.48
3 1.01 1.00 1.00 1.00 1.00 1.32 1.81
4 1.00 1.00 1.00 1.00 1.00 1.00 1.27
5 1.00 1.00 1.00 1.00 1.00 1.00 1.15
6 1.00 1.00 1.00 1.00 1.00 1.00 1.05
7 1.10 1.04 1.05 1.78 3.10 11.26 15.75
8 1.01 1.05 1.05 1.27 1.34 2.33 3.82
9 1.02 1.07 1.21 1.31 1.71 2.75 6.92
10 1.04 1.12 1.31 1.29 1.59 2.33 3.58
11 1.07 1.17 1.35 1.33 1.46 2.14 3.48
12 1.01 1.04 1.05 1.28 1.56 3.00 7.72
13 1.02 1.07 1.20 1.30 1.27 2.00 2.78
14 1.06 1.12 1.29 1.28 1.24 1.84 2.87
15 1.07 1.17 1.33 1.32 1.31 1.94 2.84
16 1.07 1.33 1.31 1.34 1.33 1.99 2.85
17 1.04 1.07 1.17 1.29 1.18 1.76 2.40
18 1.06 1.12 1.26 1.30 1.24 1.71 2.45
19 1.05 1.17 1.30 1.32 1.30 1.81 2.54
20 1.07 1.31 1.31 1.35 1.32 1.86 2.62
Recurrenceinterval(years)
Normalvariate
Side-channel storage required (in demand days) for primary pump relation to meet indicated demand (in fraction of mean annual streamflow)
0.0020 0.0100 0.0200 0.0500 0.1000 0.2000 0.3000
25.00 1.751 176.42 182.01 183.81 188.15 212.42 228.09 244.19
20.00 1.645 174.64 171.90 175.85 187.60 210.35 227.64 243.50
10.00 1.282 170.32 148.81 157.41 185.57 201.02 222.72 236.77
5.00 0.841 149.55 129.04 147.33 172.21 190.05 199.93 222.96
2.08 0.050 92.73 90.28 101.81 116.93 128.32 146.32 160.90
400 Hydrologic Considerations for Estimation of Storage-Capacity Requirements of Impounding and Side-Channel Reservoirs for Water Supply in Ohio

04211000 Rock Creek near Rock Creek, Ohio
Location: Latitude 41°45′10″, longitude 80°48′00″, Ashtabula County, Hydrologic Unit 04110004
Drainage area, in square miles: 69.2
Station used for record extension: 04212500
Time period of systematic or extended record analyzed: 1922-10-01 to 1994-09-30
Percentage of estimated values in extended record: 66.0
Eighty-percent-duration streamflow, in cubic feet per second: 0.6
Mean annual streamflow, in inches: 15.39
Location of station used for precipitation data: Hiram, Ohio
Location of station used for potential evapotranspiration data: Cleveland, Ohio
[–, indicates a value that could not be determined because there were too few average low-flow values less than the mean streamflow for the indicated duration]
Recurrenceinterval(years)
Extreme-value
variate
Minimum runoff (in inches) for indicated duration (in days)
180 360 540 720 1080 1440 1800
73.00 4.28 0.05 3.61 6.13 10.91 22.91 34.70 47.23
70.00 4.24 0.05 3.66 6.27 11.16 23.08 34.81 47.25
60.00 4.09 0.05 3.84 6.77 12.07 23.72 35.21 47.34
50.00 3.90 0.06 4.05 7.37 13.15 24.47 35.68 47.45
40.00 3.68 0.06 4.31 8.10 14.48 25.39 36.26 47.58
30.00 3.38 0.06 4.53 8.52 15.64 26.74 40.64 56.24
25.00 3.20 0.07 4.63 8.62 16.22 27.64 44.50 64.27
20.00 2.97 0.07 5.59 8.97 16.93 28.75 47.01 65.54
10.00 2.25 0.14 7.13 11.27 20.13 35.51 52.13 69.26
5.21 1.55 0.21 8.74 15.35 25.31 44.12 68.27 –
Hydrologic Design Tables 401

04211000 Rock Creek near Rock Creek, Ohio—Continued
Recurrenceinterval(years)
Impounding reservoir storage required (in inches) and critical-drawdown duration (in days; shown in gray) for indicated draft rate (in fraction of the mean annual streamflow)
0.02 0.05 0.10 0.15 0.20 0.25 0.30 0.35 0.40 0.45 0.50 0.60 0.70 0.80 0.90 1.00
5 0.08 0.24 0.55 0.91 1.29 1.67 2.05 2.43 2.80 3.18 3.58 4.47 5.35 6.24 7.24 8.26 120 150 150 180 180 180 180 180 180 180 210 210 210 210 240 240
6 0.08 0.25 0.56 0.94 1.32 1.69 2.08 2.52 2.96 3.40 3.85 4.73 5.62 6.57 7.58 9.14 120 150 150 180 180 180 210 210 210 210 210 210 210 240 240 600
8 0.08 0.26 0.60 0.98 1.39 1.83 2.28 2.72 3.16 3.60 4.05 4.97 6.11 7.25 8.60 11.13 120 150 180 180 210 210 210 210 210 210 210 270 270 270 600 600
10 0.08 0.27 0.62 1.03 1.47 1.91 2.35 2.79 3.24 3.68 4.19 5.33 6.46 7.60 9.78 12.42 150 150 180 210 210 210 210 210 210 210 270 270 270 270 600 900
15 0.10 0.29 0.66 1.09 1.53 1.97 2.44 2.94 3.45 3.96 4.53 5.66 6.80 8.90 11.63 15.68 150 150 180 210 210 210 240 240 240 270 270 270 270 600 960 960
20 0.11 0.30 0.68 1.11 1.56 2.06 2.57 3.07 3.58 4.09 4.66 5.80 7.33 10.23 14.28 18.32 150 180 180 210 240 240 240 240 240 270 270 270 600 960 960 960
25 0.11 0.31 0.69 1.12 1.63 2.13 2.64 3.14 3.65 4.18 4.75 5.89 8.02 12.07 16.11 20.16 150 180 180 240 240 240 240 240 240 270 270 270 960 960 960 960
30 0.12 0.32 0.70 1.17 1.67 2.18 2.68 3.19 3.69 4.25 4.82 6.03 9.35 13.40 17.45 21.79 150 180 180 240 240 240 240 240 240 270 270 600 960 960 960 1680
40 0.12 0.33 0.71 1.21 1.72 2.22 2.73 3.24 3.81 4.37 4.98 7.09 11.14 15.19 19.23 25.62 150 180 240 240 240 240 240 270 270 270 300 960 960 960 960 1680
50 0.12 0.33 0.73 1.24 1.74 2.25 2.78 3.35 3.92 4.49 5.11 8.20 12.25 16.29 21.31 28.39 150 180 240 240 240 240 270 270 270 270 300 960 960 960 1680 1680
60 0.12 0.33 0.74 1.25 1.75 2.31 2.88 3.45 4.02 4.59 5.60 8.93 12.97 17.02 23.45 30.53 150 180 240 240 240 270 270 270 270 270 600 960 960 960 1680 1680
70 0.12 0.33 0.74 1.26 1.83 2.40 2.97 3.53 4.10 4.82 6.08 9.41 13.58 18.19 25.20 32.27 150 180 240 270 270 270 270 270 270 600 600 960 1020 1380 1680 1680
80 0.12 0.33 0.76 1.33 1.90 2.47 3.04 3.61 4.18 5.25 6.60 10.25 14.54 19.98 26.65 33.73 150 180 270 270 270 270 270 270 270 600 660 1020 1020 1380 1680 1680
90 0.12 0.33 0.83 1.40 1.96 2.53 3.10 3.67 4.58 5.97 7.36 11.10 16.11 21.67 27.90 34.98 150 180 270 270 270 270 270 270 660 660 660 1020 1320 1320 1680 1680
100 0.13 0.33 0.88 1.45 2.02 2.59 3.15 3.86 5.25 6.64 8.03 12.14 17.70 23.27 29.00 36.08 150 180 270 270 270 270 270 660 660 660 660 1320 1320 1320 1680 1680
402 Hydrologic Considerations for Estimation of Storage-Capacity Requirements of Impounding and Side-Channel Reservoirs for Water Supply in Ohio

04211000 Rock Creek near Rock Creek, Ohio—Continued
Pumpset
Ratio of storage required for pump set to storage required for the primary pump relation (pump set 1) for indicated demand (in fraction of mean
annual streamflow)
0.002 0.010 0.020 0.050 0.100 0.200 0.300
1 1.00 1.00 1.00 1.00 1.00 1.00 1.00
2 1.12 1.00 1.06 1.25 2.55 8.91 15.57
3 1.06 1.01 1.02 1.21 1.14 1.08 1.62
4 1.00 1.00 1.00 1.15 1.08 1.01 1.02
5 1.00 1.00 1.00 1.09 1.04 1.00 1.00
6 1.00 1.00 1.00 1.02 1.01 1.00 1.00
7 1.06 1.16 1.30 2.60 8.09 20.47 31.10
8 1.10 1.13 1.22 1.40 1.26 2.21 4.32
9 1.10 1.19 1.40 1.45 1.49 2.75 9.84
10 1.08 1.20 1.35 1.48 1.33 1.72 3.28
11 1.12 1.30 1.39 1.49 1.28 1.65 3.09
12 1.09 1.13 1.25 1.41 1.38 3.39 12.55
13 1.06 1.17 1.33 1.42 1.28 1.57 2.67
14 1.05 1.17 1.30 1.43 1.26 1.43 2.00
15 1.09 1.22 1.33 1.43 1.25 1.41 2.05
16 1.05 1.15 1.27 1.41 1.26 1.56 2.07
17 1.04 1.14 1.30 1.38 1.25 1.40 1.64
18 1.02 1.10 1.26 1.37 1.22 1.24 1.72
19 1.05 1.15 1.27 1.36 1.22 1.29 1.83
20 1.05 1.14 1.18 1.35 1.27 1.45 1.95
Hydrologic Design Tables 403

04211000 Rock Creek near Rock Creek, Ohio—Continued
Recurrenceinterval(years)
Normalvariate
Side-channel storage required (in demand days) for primary pump relation to meet indicated demand (in fraction of mean annual streamflow)
0.0020 0.0100 0.0200 0.0500 0.1000 0.2000 0.3000
73.00 2.206 225.00 200.80 196.59 195.05 227.29 266.07 278.97
70.00 2.190 224.16 199.66 195.75 194.91 226.22 263.93 276.83
60.00 2.128 221.04 195.45 192.61 194.39 222.27 255.96 268.87
50.00 2.054 217.26 190.34 188.82 193.75 217.47 246.31 259.23
40.00 1.960 212.49 183.89 184.03 192.96 211.42 234.12 247.06
30.00 1.834 209.87 173.45 181.38 192.12 206.26 225.35 241.16
25.00 1.751 209.29 166.03 180.78 191.63 203.76 221.86 240.41
20.00 1.645 206.16 163.75 178.91 189.12 200.77 221.28 234.93
10.00 1.282 186.51 157.99 162.16 178.12 193.39 213.53 224.72
5.00 0.841 160.05 127.89 130.45 147.72 171.55 183.76 197.03
2.03 0.017 114.45 71.81 78.95 91.81 117.98 133.70 141.99
404 Hydrologic Considerations for Estimation of Storage-Capacity Requirements of Impounding and Side-Channel Reservoirs for Water Supply in Ohio

04212000 Grand River near Madison, Ohio
Location: Latitude 41°44′26″, longitude 81°02′48″, Lake County, Hydrologic Unit 04110004
Drainage area, in square miles: 581.
Station used for record extension: 03102950
Time period of systematic or extended record analyzed: 1922-10-01 to 1994-09-30
Percentage of estimated values in extended record: 31.2
Eighty-percent-duration streamflow, in cubic feet per second: 21.
Mean annual streamflow, in inches: 17.48
Location of station used for precipitation data: Hiram, Ohio
Location of station used for potential evapotranspiration data: Cleveland, Ohio
[–, indicates a value that could not be determined because there were too few average low-flow values less than the mean streamflow for the indicated duration]
Recurrenceinterval(years)
Extreme-value
variate
Minimum runoff (in inches) for indicated duration (in days)
180 360 540 720 1080 1440 1800
73.00 4.28 0.21 5.55 9.00 14.76 28.30 41.40 55.08
70.00 4.24 0.21 5.55 9.02 14.92 28.84 41.95 55.84
60.00 4.09 0.21 5.55 9.09 15.49 30.83 43.98 58.63
50.00 3.90 0.21 5.55 9.17 16.18 33.18 46.39 61.94
40.00 3.68 0.21 5.55 9.28 17.02 36.07 49.34 65.99
30.00 3.38 0.25 5.88 11.11 20.50 37.54 52.06 70.20
25.00 3.20 0.28 6.18 12.78 23.42 37.80 53.47 72.57
20.00 2.97 0.32 6.23 13.03 23.89 38.83 55.49 75.11
10.00 2.25 0.35 8.94 14.24 25.97 43.19 62.16 80.25
5.21 1.55 0.73 10.63 17.84 28.05 55.69 77.26 –
Hydrologic Design Tables 405

04212000 Grand River near Madison, Ohio—Continued
Recurrenceinterval(years)
Impounding reservoir storage required (in inches) and critical-drawdown duration (in days; shown in gray) for indicated draft rate (in fraction of the mean annual streamflow)
0.02 0.05 0.10 0.15 0.20 0.25 0.30 0.35 0.40 0.45 0.50 0.60 0.70 0.80 0.90 1.00
5 0.02 0.13 0.41 0.71 1.07 1.44 1.87 2.30 2.73 3.16 3.59 4.52 5.53 6.53 7.74 9.04 30 120 120 150 150 180 180 180 180 180 180 210 210 210 270 270
6 0.02 0.14 0.43 0.77 1.18 1.61 2.04 2.47 2.90 3.33 3.79 4.80 5.80 6.82 7.97 9.12 30 120 120 150 180 180 180 180 180 180 210 210 210 240 240 240
8 0.02 0.16 0.47 0.89 1.32 1.75 2.18 2.61 3.06 3.56 4.07 5.07 6.15 7.29 8.44 10.27 60 120 150 180 180 180 180 180 210 210 210 210 240 240 240 600
10 0.02 0.17 0.52 0.95 1.38 1.81 2.24 2.69 3.19 3.69 4.20 5.33 6.48 7.63 8.91 11.25 60 120 180 180 180 180 180 210 210 210 210 240 240 240 300 600
15 0.04 0.19 0.56 0.99 1.43 1.86 2.35 2.93 3.50 4.07 4.65 5.80 7.05 8.49 10.10 13.31 90 150 180 180 180 180 240 240 240 240 240 240 300 300 600 900
20 0.04 0.21 0.58 1.01 1.44 2.00 2.57 3.15 3.72 4.30 4.89 6.18 7.55 8.99 11.31 15.21 90 150 180 180 180 240 240 240 240 240 270 270 300 300 600 900
25 0.05 0.22 0.58 1.01 1.54 2.12 2.69 3.27 3.87 4.52 5.16 6.46 7.83 9.37 12.37 16.67 90 150 180 180 240 240 240 240 270 270 270 270 300 600 900 900
30 0.05 0.23 0.59 1.04 1.61 2.18 2.76 3.39 4.04 4.68 5.33 6.62 7.99 10.14 13.56 17.87 90 150 180 240 240 240 240 270 270 270 270 270 300 600 900 900
40 0.06 0.23 0.60 1.09 1.66 2.27 2.92 3.56 4.21 4.86 5.50 6.79 8.49 11.36 15.47 21.15 90 150 180 240 240 270 270 270 270 270 270 270 600 600 900 1320
50 0.06 0.24 0.62 1.09 1.69 2.33 2.98 3.62 4.27 4.92 5.56 6.86 9.43 12.67 17.98 25.16 90 150 180 240 270 270 270 270 270 270 270 270 600 900 1320 1680
60 0.06 0.24 0.64 1.09 1.69 2.34 2.98 3.63 4.28 4.92 5.57 7.33 10.20 14.52 21.09 29.13 90 150 180 240 270 270 270 270 270 270 270 600 600 1320 1680 1680
70 0.06 0.24 0.66 1.09 1.69 2.34 2.98 3.63 4.28 4.92 5.57 7.98 11.80 17.12 24.84 32.88 90 150 180 240 270 270 270 270 270 270 270 600 960 1320 1680 1680
80 0.06 0.25 0.68 1.11 1.69 2.34 2.98 3.63 4.28 4.92 5.66 9.18 14.06 20.30 28.34 36.38 90 180 180 180 270 270 270 270 270 270 600 1020 1020 1680 1680 1680
90 0.07 0.26 0.69 1.13 1.69 2.34 2.98 3.63 4.28 4.92 6.42 11.30 16.18 23.54 31.59 39.63 90 180 180 180 270 270 270 270 270 270 1020 1020 1020 1680 1680 1680
100 0.07 0.28 0.71 1.14 1.69 2.34 2.98 3.63 4.28 5.87 8.31 13.20 18.70 26.54 34.58 42.62 90 180 180 180 270 270 270 270 270 1020 1020 1020 1620 1680 1680 1680
406 Hydrologic Considerations for Estimation of Storage-Capacity Requirements of Impounding and Side-Channel Reservoirs for Water Supply in Ohio

04212000 Grand River near Madison, Ohio—Continued
Pumpset
Ratio of storage required for pump set to storage required for the primary pump relation (pump set 1) for indicated demand (in fraction of mean
annual streamflow)
0.002 0.010 0.020 0.050 0.100 0.200 0.300
1 1.00 1.00 1.00 1.00 1.00 1.00 1.00
2 2.31 1.22 1.09 1.08 1.21 2.20 5.37
3 1.94 1.11 1.05 1.02 1.15 1.07 1.05
4 1.00 1.00 1.00 1.00 1.08 1.02 1.00
5 1.00 1.01 1.00 1.00 1.01 1.00 1.00
6 1.00 1.00 1.00 1.00 1.00 1.00 1.00
7 2.15 1.32 1.31 1.38 2.56 9.28 20.97
8 2.11 1.22 1.27 1.35 1.37 1.48 2.06
9 2.07 1.31 1.37 1.41 1.40 1.74 2.57
10 1.79 1.45 1.44 1.42 1.44 1.63 2.33
11 1.70 1.43 1.46 1.41 1.45 1.64 2.22
12 2.08 1.27 1.27 1.35 1.35 2.01 2.73
13 1.69 1.25 1.30 1.37 1.37 1.32 1.81
14 1.61 1.35 1.36 1.38 1.40 1.34 1.74
15 1.98 1.40 1.39 1.34 1.39 1.35 1.85
16 1.94 1.50 1.37 1.36 1.42 1.36 1.96
17 1.91 1.22 1.25 1.33 1.34 1.17 1.57
18 1.98 1.32 1.35 1.32 1.35 1.19 1.57
19 2.01 1.39 1.35 1.25 1.33 1.33 1.71
20 1.96 1.50 1.36 1.26 1.40 1.36 1.81
Hydrologic Design Tables 407

04212000 Grand River near Madison, Ohio—Continued
Recurrenceinterval(years)
Normalvariate
Side-channel storage required (in demand days) for primary pump relation to meet indicated demand (in fraction of mean annual streamflow)
0.0020 0.0100 0.0200 0.0500 0.1000 0.2000 0.3000
73.00 2.206 96.64 147.63 167.69 188.07 199.00 239.71 260.59
70.00 2.190 96.55 146.65 167.28 187.89 198.74 238.55 259.38
60.00 2.128 96.19 143.03 165.74 187.21 197.76 234.27 254.90
50.00 2.054 95.77 138.63 163.88 186.39 196.59 229.07 249.46
40.00 1.960 95.23 133.08 161.53 185.36 195.10 222.50 242.60
30.00 1.834 95.00 130.73 159.86 182.47 190.76 214.15 234.52
25.00 1.751 95.00 130.72 159.20 180.11 187.19 208.77 229.52
20.00 1.645 92.10 129.39 152.91 167.77 186.11 207.35 218.96
10.00 1.282 79.85 119.71 128.53 145.48 166.88 190.56 196.08
5.00 0.841 52.65 87.13 103.32 125.22 140.75 152.24 173.76
2.03 0.017 24.62 46.31 54.27 78.50 78.53 108.25 122.62
408 Hydrologic Considerations for Estimation of Storage-Capacity Requirements of Impounding and Side-Channel Reservoirs for Water Supply in Ohio

04212100 Grand River near Painesville, Ohio
Location: Latitude 41°43′08″, longitude 81°13′41″, Lake County, Hydrologic Unit 04110004
Drainage area, in square miles: 685.
Station used for record extension: 03102950
Time period of systematic or extended record analyzed: 1965-10-01 to 1997-09-30
Percentage of estimated values in extended record: 31.2
Eighty-percent-duration streamflow, in cubic feet per second: 90.
Mean annual streamflow, in inches: 19.97
Location of station used for precipitation data: Hiram, Ohio
Location of station used for potential evapotranspiration data: Cleveland, Ohio
[–, indicates a value that could not be determined because there were too few average low-flow values less than the mean streamflow for the indicated duration]
Recurrenceinterval(years)
Extreme-value
variate
Minimum runoff (in inches) for indicated duration (in days)
180 360 540 720 1080 1440 1800
33.00 3.48 0.37 8.11 14.20 27.59 43.49 60.84 76.60
30.00 3.38 0.40 8.40 14.50 27.61 43.72 61.82 77.71
25.00 3.20 0.46 8.96 15.07 27.65 44.15 63.70 79.85
20.00 2.97 0.54 9.65 15.78 27.69 44.68 66.01 82.47
10.00 2.25 0.84 11.46 17.08 30.38 49.91 69.65 92.90
5.50 1.61 1.35 12.69 20.35 32.22 56.22 75.99 –
Hydrologic Design Tables 409
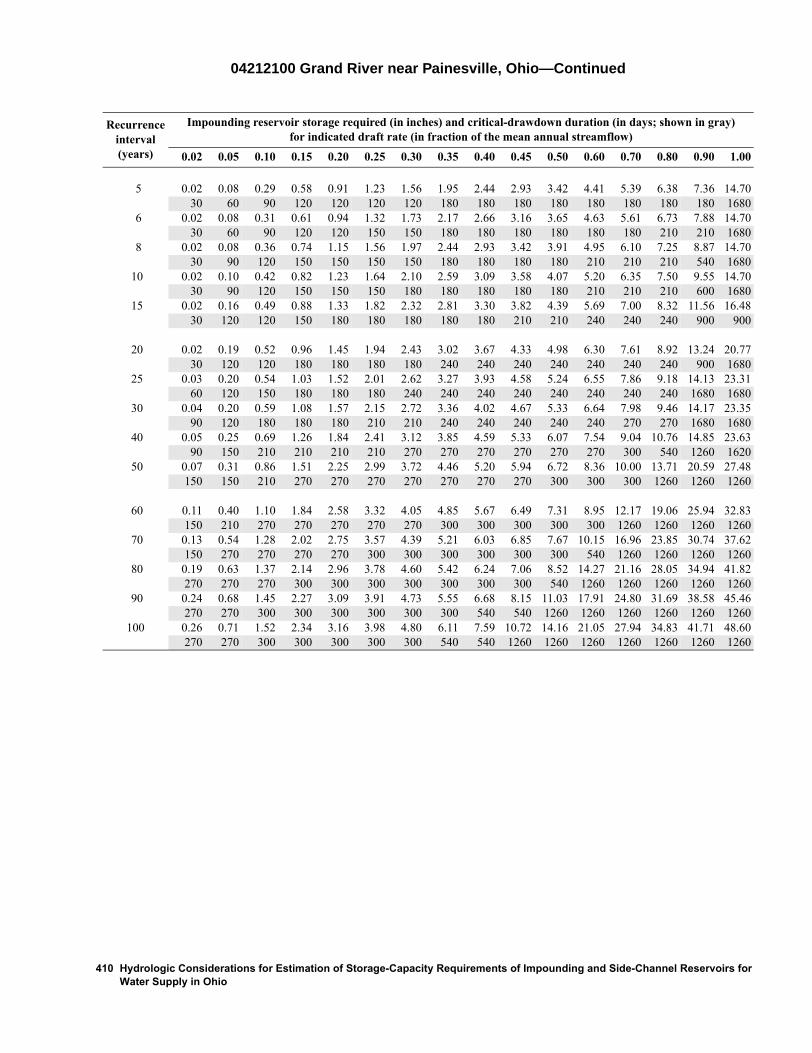
04212100 Grand River near Painesville, Ohio—Continued
Recurrenceinterval(years)
Impounding reservoir storage required (in inches) and critical-drawdown duration (in days; shown in gray) for indicated draft rate (in fraction of the mean annual streamflow)
0.02 0.05 0.10 0.15 0.20 0.25 0.30 0.35 0.40 0.45 0.50 0.60 0.70 0.80 0.90 1.00
5 0.02 0.08 0.29 0.58 0.91 1.23 1.56 1.95 2.44 2.93 3.42 4.41 5.39 6.38 7.36 14.70 30 60 90 120 120 120 120 180 180 180 180 180 180 180 180 1680
6 0.02 0.08 0.31 0.61 0.94 1.32 1.73 2.17 2.66 3.16 3.65 4.63 5.61 6.73 7.88 14.70 30 60 90 120 120 150 150 180 180 180 180 180 180 210 210 1680
8 0.02 0.08 0.36 0.74 1.15 1.56 1.97 2.44 2.93 3.42 3.91 4.95 6.10 7.25 8.87 14.70 30 90 120 150 150 150 150 180 180 180 180 210 210 210 540 1680
10 0.02 0.10 0.42 0.82 1.23 1.64 2.10 2.59 3.09 3.58 4.07 5.20 6.35 7.50 9.55 14.70 30 90 120 150 150 150 180 180 180 180 180 210 210 210 600 1680
15 0.02 0.16 0.49 0.88 1.33 1.82 2.32 2.81 3.30 3.82 4.39 5.69 7.00 8.32 11.56 16.48 30 120 120 150 180 180 180 180 180 210 210 240 240 240 900 900
20 0.02 0.19 0.52 0.96 1.45 1.94 2.43 3.02 3.67 4.33 4.98 6.30 7.61 8.92 13.24 20.77 30 120 120 180 180 180 180 240 240 240 240 240 240 240 900 1680
25 0.03 0.20 0.54 1.03 1.52 2.01 2.62 3.27 3.93 4.58 5.24 6.55 7.86 9.18 14.13 23.31 60 120 150 180 180 180 240 240 240 240 240 240 240 240 1680 1680
30 0.04 0.20 0.59 1.08 1.57 2.15 2.72 3.36 4.02 4.67 5.33 6.64 7.98 9.46 14.17 23.35 90 120 180 180 180 210 210 240 240 240 240 240 270 270 1680 1680
40 0.05 0.25 0.69 1.26 1.84 2.41 3.12 3.85 4.59 5.33 6.07 7.54 9.04 10.76 14.85 23.63 90 150 210 210 210 210 270 270 270 270 270 270 300 540 1260 1620
50 0.07 0.31 0.86 1.51 2.25 2.99 3.72 4.46 5.20 5.94 6.72 8.36 10.00 13.71 20.59 27.48 150 150 210 270 270 270 270 270 270 270 300 300 300 1260 1260 1260
60 0.11 0.40 1.10 1.84 2.58 3.32 4.05 4.85 5.67 6.49 7.31 8.95 12.17 19.06 25.94 32.83 150 210 270 270 270 270 270 300 300 300 300 300 1260 1260 1260 1260
70 0.13 0.54 1.28 2.02 2.75 3.57 4.39 5.21 6.03 6.85 7.67 10.15 16.96 23.85 30.74 37.62 150 270 270 270 270 300 300 300 300 300 300 540 1260 1260 1260 1260
80 0.19 0.63 1.37 2.14 2.96 3.78 4.60 5.42 6.24 7.06 8.52 14.27 21.16 28.05 34.94 41.82 270 270 270 300 300 300 300 300 300 300 540 1260 1260 1260 1260 1260
90 0.24 0.68 1.45 2.27 3.09 3.91 4.73 5.55 6.68 8.15 11.03 17.91 24.80 31.69 38.58 45.46 270 270 300 300 300 300 300 300 540 540 1260 1260 1260 1260 1260 1260
100 0.26 0.71 1.52 2.34 3.16 3.98 4.80 6.11 7.59 10.72 14.16 21.05 27.94 34.83 41.71 48.60 270 270 300 300 300 300 300 540 540 1260 1260 1260 1260 1260 1260 1260
410 Hydrologic Considerations for Estimation of Storage-Capacity Requirements of Impounding and Side-Channel Reservoirs for Water Supply in Ohio

04212100 Grand River near Painesville, Ohio—Continued
Pumpset
Ratio of storage required for pump set to storage required for the primary pump relation (pump set 1) for indicated demand (in fraction of mean
annual streamflow)
0.002 0.010 0.020 0.050 0.100 0.200 0.300
1 1.00 1.00 1.00 1.00 1.00 1.00 1.00
2 1.33 1.03 1.01 1.04 1.00 1.00 1.20
3 1.25 1.00 1.00 1.01 1.00 1.00 1.00
4 1.16 1.00 1.00 1.00 1.00 1.00 1.00
5 1.12 1.00 1.00 1.00 1.00 1.00 1.00
6 1.05 1.00 1.00 1.00 1.00 1.00 1.00
7 1.33 1.05 1.03 1.10 1.07 1.64 4.91
8 1.26 1.00 1.01 1.10 1.08 1.15 1.17
9 1.25 1.00 1.00 1.12 1.14 1.21 1.22
10 1.22 1.02 1.04 1.19 1.18 1.28 1.26
11 1.15 1.03 1.06 1.25 1.23 1.30 1.30
12 1.29 1.01 1.00 1.09 1.08 1.12 1.15
13 1.20 1.00 1.00 1.13 1.14 1.22 1.21
14 1.19 1.02 1.03 1.18 1.17 1.28 1.27
15 1.12 1.03 1.06 1.24 1.21 1.31 1.28
16 1.14 1.04 1.09 1.32 1.29 1.33 1.35
17 1.16 1.01 1.00 1.12 1.14 1.22 1.22
18 1.15 1.02 1.03 1.18 1.18 1.28 1.26
19 1.06 1.03 1.06 1.24 1.23 1.31 1.29
20 1.06 1.04 1.09 1.32 1.29 1.32 1.36
Recurrenceinterval(years)
Normalvariate
Side-channel storage required (in demand days) for primary pump relation to meet indicated demand (in fraction of mean annual streamflow)
0.0020 0.0100 0.0200 0.0500 0.1000 0.2000 0.3000
33.00 1.877 159.04 201.37 201.01 198.40 213.78 224.47 234.82
30.00 1.834 154.07 191.63 193.07 194.77 209.73 220.08 229.47
25.00 1.751 144.34 172.56 177.52 187.64 201.80 211.48 218.97
20.00 1.645 131.96 148.29 157.74 178.59 191.71 200.54 205.62
10.00 1.282 105.35 121.35 136.51 146.40 155.88 166.64 183.55
5.00 0.841 88.19 97.18 100.04 105.93 122.69 138.92 151.41
2.06 0.038 67.71 61.84 60.88 71.50 85.92 96.20 106.48
Hydrologic Design Tables 411

04212500 Ashtabula River near Ashtabula, Ohio
Location: Latitude 41°51′20″, longitude 80°45′44″, Ashtabula County, Hydrologic Unit 04110003
Drainage area, in square miles: 121.
Station used for record extension: 04212000
Time period of systematic or extended record analyzed: 1922-10-01 to 1994-09-30
Percentage of estimated values in extended record: 30.8
Eighty-percent-duration streamflow, in cubic feet per second: 2.6
Mean annual streamflow, in inches: 17.57
Location of station used for precipitation data: Hiram, Ohio
Location of station used for potential evapotranspiration data: Cleveland, Ohio
[–, indicates a value that could not be determined because there were too few average low-flow values less than the mean stream-flow for the indicated duration]
Recurrenceinterval(years)
Extreme-value
variate
Minimum runoff (in inches) for indicated duration (in days)
180 360 540 720 1080 1440 1800
73.00 4.28 0.16 4.66 10.09 17.89 30.26 42.54 55.02
70.00 4.24 0.16 4.66 10.10 18.01 30.42 42.79 55.34
60.00 4.09 0.17 4.66 10.14 18.47 31.00 43.72 56.51
50.00 3.90 0.17 4.66 10.19 19.02 31.68 44.82 57.89
40.00 3.68 0.18 4.66 10.25 19.69 32.52 46.17 59.59
30.00 3.38 0.18 5.30 10.75 20.02 33.00 49.57 67.47
25.00 3.20 0.18 5.90 11.19 20.08 33.12 52.22 74.17
20.00 2.97 0.21 6.94 11.26 20.56 33.57 54.45 75.69
10.00 2.25 0.25 8.45 12.83 24.34 40.74 61.05 79.24
5.21 1.55 0.35 10.02 18.06 29.45 49.29 77.88 –
412 Hydrologic Considerations for Estimation of Storage-Capacity Requirements of Impounding and Side-Channel Reservoirs for Water Supply in Ohio

04212500 Ashtabula River near Ashtabula, Ohio—Continued
Recurrenceinterval(years)
Impounding reservoir storage required (in inches) and critical-drawdown duration (in days; shown in gray) for indicated draft rate (in fraction of the mean annual streamflow)
0.02 0.05 0.10 0.15 0.20 0.25 0.30 0.35 0.40 0.45 0.50 0.60 0.70 0.80 0.90 1.00
5 0.07 0.23 0.58 0.95 1.36 1.80 2.23 2.66 3.09 3.53 3.96 4.83 5.69 6.66 7.67 8.75 90 120 150 150 180 180 180 180 180 180 180 180 180 210 210 240
6 0.07 0.24 0.60 0.96 1.40 1.83 2.26 2.69 3.13 3.56 3.99 4.97 5.98 6.99 8.00 10.13 120 120 150 180 180 180 180 180 180 180 180 210 210 210 210 600
8 0.08 0.26 0.62 1.01 1.44 1.87 2.31 2.76 3.26 3.77 4.27 5.28 6.29 7.37 9.54 12.42 120 150 150 180 180 180 180 210 210 210 210 210 210 270 600 600
10 0.09 0.27 0.63 1.03 1.47 1.90 2.40 2.90 3.41 3.91 4.42 5.43 6.65 8.03 10.68 13.63 120 150 150 180 180 180 210 210 210 210 210 210 270 540 600 960
15 0.09 0.29 0.65 1.07 1.54 2.05 2.55 3.06 3.56 4.16 4.80 6.10 7.40 9.14 12.77 17.38 120 150 150 180 210 210 210 210 210 270 270 270 270 540 960 960
20 0.09 0.30 0.66 1.09 1.60 2.10 2.63 3.21 3.86 4.51 5.16 6.46 7.76 10.26 14.88 19.50 120 150 180 180 210 210 240 270 270 270 270 270 270 960 960 960
25 0.10 0.31 0.67 1.12 1.62 2.19 2.77 3.42 4.07 4.72 5.37 6.67 7.97 11.64 16.25 20.87 120 150 180 210 210 240 270 270 270 270 270 270 270 960 960 960
30 0.10 0.32 0.68 1.13 1.70 2.28 2.90 3.55 4.20 4.85 5.50 6.80 8.10 12.60 17.22 21.84 120 150 180 210 240 240 270 270 270 270 270 270 270 960 960 960
40 0.11 0.33 0.69 1.22 1.80 2.41 3.06 3.71 4.36 5.01 5.66 6.96 9.24 13.86 18.48 25.59 150 150 180 240 240 270 270 270 270 270 270 270 960 960 960 1680
50 0.12 0.34 0.70 1.26 1.85 2.50 3.15 3.80 4.45 5.10 5.75 7.06 10.01 14.63 20.74 28.82 150 150 180 240 270 270 270 270 270 270 270 300 960 960 1680 1680
60 0.13 0.34 0.70 1.27 1.91 2.56 3.21 3.86 4.51 5.15 5.80 7.15 10.51 15.46 23.54 31.62 150 150 150 240 270 270 270 270 270 270 270 300 960 1680 1680 1680
70 0.13 0.35 0.71 1.29 1.94 2.59 3.24 3.89 4.54 5.19 5.84 7.19 10.85 17.95 26.03 34.11 150 150 150 270 270 270 270 270 270 270 270 300 960 1680 1680 1680
80 0.14 0.35 0.71 1.32 1.97 2.61 3.26 3.91 4.56 5.21 5.86 7.21 12.13 20.21 28.29 36.41 150 150 150 270 270 270 270 270 270 270 270 300 1680 1680 1680 1740
90 0.14 0.35 0.71 1.33 1.98 2.63 3.28 3.93 4.58 5.23 5.88 7.47 14.20 22.28 30.58 38.95 150 150 150 270 270 270 270 270 270 270 270 600 1680 1680 1740 1740
100 0.14 0.36 0.72 1.34 1.99 2.64 3.29 3.94 4.59 5.23 5.88 8.49 16.24 24.61 32.98 41.35 150 150 150 270 270 270 270 270 270 270 270 1320 1740 1740 1740 1740
Hydrologic Design Tables 413

04212500 Ashtabula River near Ashtabula, Ohio—Continued
Pumpset
Ratio of storage required for pump set to storage required for the primary pump relation (pump set 1) for indicated demand (in fraction of mean
annual streamflow)
0.002 0.010 0.020 0.050 0.100 0.200 0.300
1 1.00 1.00 1.00 1.00 1.00 1.00 1.00
2 1.05 1.00 1.06 1.22 1.47 2.84 8.67
3 1.03 1.00 1.02 1.15 1.16 1.04 1.01
4 1.01 1.00 1.00 1.08 1.09 1.01 1.00
5 1.00 1.00 1.00 1.02 1.06 1.00 1.00
6 1.00 1.00 1.00 1.00 1.02 1.00 1.00
7 1.06 1.15 1.25 1.41 2.74 11.81 22.36
8 1.05 1.11 1.22 1.40 1.29 1.12 2.72
9 1.06 1.17 1.25 1.40 1.31 1.90 3.72
10 1.08 1.16 1.30 1.42 1.36 1.28 2.80
11 1.09 1.16 1.31 1.38 1.35 1.16 2.76
12 1.05 1.11 1.21 1.39 1.27 2.22 4.36
13 1.04 1.14 1.18 1.36 1.29 1.15 2.03
14 1.06 1.10 1.22 1.36 1.32 1.15 1.61
15 1.09 1.09 1.23 1.32 1.31 1.16 1.56
16 1.10 1.10 1.14 1.36 1.30 1.17 1.55
17 1.03 1.08 1.14 1.32 1.26 1.14 1.37
18 1.06 1.07 1.17 1.30 1.28 1.15 1.25
19 1.09 1.09 1.15 1.28 1.30 1.16 1.19
20 1.10 1.10 1.13 1.28 1.32 1.18 1.18
414 Hydrologic Considerations for Estimation of Storage-Capacity Requirements of Impounding and Side-Channel Reservoirs for Water Supply in Ohio

Recurrenceinterval(years)
Normalvariate
Side-channel storage required (in demand days) for primary pump relation to meet indicated demand (in fraction of mean annual streamflow)
0.0020 0.0100 0.0200 0.0500 0.1000 0.2000 0.3000
73.00 2.206 205.26 198.34 193.04 190.21 212.30 251.54 267.20
70.00 2.190 204.91 197.13 192.04 189.56 211.22 250.36 265.96
60.00 2.128 203.59 192.65 188.31 187.14 207.19 245.98 261.34
50.00 2.054 202.00 187.21 183.79 184.21 202.31 240.66 255.75
40.00 1.960 199.99 180.35 178.08 180.52 196.15 233.95 248.69
30.00 1.834 193.41 169.30 172.13 176.61 192.16 219.95 232.25
25.00 1.751 187.90 161.45 168.72 174.35 190.81 209.19 219.31
20.00 1.645 180.02 157.75 163.71 172.28 189.40 204.98 216.57
10.00 1.282 152.60 146.81 155.59 160.79 174.45 192.88 201.25
5.00 0.841 142.35 124.42 135.48 147.05 165.26 181.36 184.63
2.03 0.017 97.34 68.66 71.37 92.51 107.06 125.78 134.94
Hydrologic Design Tables 415

04213000 Conneaut Creek at Conneaut, Ohio
Location: Latitude 41°55′37″, longitude 80°36′15″, Ashtabula County, Hydrologic Unit 04120101
Drainage area, in square miles: 175.
Station used for record extension: None
Time period of systematic or extended record analyzed: 1950-04-01 to 1997-09-30
Eighty-percent-duration streamflow, in cubic feet per second: 22.
Mean annual streamflow, in inches: 22.58
Location of station used for precipitation data: Hiram, Ohio
Location of station used for potential evapotranspiration data: Cleveland, Ohio
[–, indicates a value that could not be determined because there were too few average low-flow values less than the mean stream-flow for the indicated duration]
Recurrenceinterval(years)
Extreme-value
variate
Minimum runoff (in inches) for indicated duration (in days)
180 360 540 720 1080 1440 1800
48.00 3.86 0.40 10.31 14.89 24.79 40.22 56.19 75.68
40.00 3.68 0.44 10.37 15.21 25.55 42.72 59.96 79.90
30.00 3.38 0.52 10.46 15.71 26.76 46.68 65.92 86.58
25.00 3.20 0.56 10.52 16.03 27.53 49.20 69.71 90.83
20.00 2.97 0.64 10.66 16.19 28.33 49.86 73.25 93.30
10.00 2.25 0.93 12.38 17.09 32.35 54.34 78.16 105.25
5.33 1.57 1.16 14.65 23.69 38.83 67.12 94.92 –
416 Hydrologic Considerations for Estimation of Storage-Capacity Requirements of Impounding and Side-Channel Reservoirs for Water Supply in Ohio

04213000 Conneaut Creek at Conneaut, Ohio—Continued
Recurrenceinterval(years)
Impounding reservoir storage required (in inches) and critical-drawdown duration (in days; shown in gray) for indicated draft rate (in fraction of the mean annual streamflow)
0.02 0.05 0.10 0.15 0.20 0.25 0.30 0.35 0.40 0.45 0.50 0.60 0.70 0.80 0.90 1.00
5 0.00 0.06 0.32 0.69 1.15 1.62 2.15 2.71 3.26 3.82 4.38 5.49 6.60 7.90 9.39 10.87 0 60 90 150 150 150 180 180 180 180 180 180 180 240 240 240
6 0.00 0.07 0.36 0.76 1.22 1.68 2.18 2.74 3.30 3.85 4.41 5.52 6.63 7.90 9.39 10.98 30 60 120 150 150 150 180 180 180 180 180 180 180 240 240 540
8 0.00 0.10 0.44 0.84 1.30 1.77 2.29 2.84 3.40 3.96 4.51 5.63 6.82 8.12 11.02 14.36 30 90 120 150 150 150 180 180 180 180 180 180 210 210 540 540
10 0.01 0.11 0.47 0.89 1.36 1.84 2.39 2.95 3.51 4.06 4.62 5.81 7.11 9.13 12.47 15.80 30 90 120 150 150 180 180 180 180 180 180 210 210 540 540 540
15 0.01 0.13 0.50 0.97 1.48 2.04 2.59 3.15 3.71 4.36 5.01 6.31 7.61 10.35 13.69 17.38 30 120 150 150 180 180 180 180 210 210 210 210 210 540 540 600
20 0.01 0.14 0.55 1.05 1.60 2.16 2.71 3.35 4.00 4.65 5.30 6.80 8.47 10.85 14.56 20.23 30 120 150 180 180 180 180 210 210 210 210 270 270 600 600 1740
25 0.01 0.14 0.58 1.12 1.68 2.24 2.88 3.53 4.20 4.94 5.68 7.33 9.00 11.41 15.54 23.47 30 120 150 180 180 180 210 210 240 240 240 270 270 600 960 1740
30 0.01 0.15 0.62 1.18 1.73 2.35 3.00 3.67 4.41 5.15 5.94 7.61 9.28 11.81 17.62 26.61 30 120 180 180 180 210 210 240 240 240 270 270 270 600 1260 1740
40 0.01 0.18 0.68 1.24 1.85 2.50 3.14 3.80 4.55 5.29 6.08 7.75 9.42 14.90 23.06 33.34 30 150 180 180 210 210 210 240 240 240 270 270 270 1260 1620 1680
50 0.02 0.21 0.72 1.27 1.92 2.57 3.22 3.87 4.55 5.29 6.08 7.75 12.60 20.76 30.49 40.87 30 150 180 210 210 210 210 210 240 240 270 270 1320 1320 1680 1680
60 0.02 0.24 0.73 1.32 1.97 2.62 3.26 3.91 4.56 5.29 6.08 10.16 18.32 27.37 37.76 48.15 30 150 180 210 210 210 210 210 210 240 270 1320 1320 1680 1680 1680
70 0.02 0.26 0.74 1.34 1.99 2.64 3.29 3.94 4.59 5.29 7.06 15.22 23.71 34.10 44.48 54.87 30 150 180 210 210 210 210 210 210 240 1320 1320 1680 1680 1680 1680
80 0.02 0.28 0.74 1.35 2.00 2.65 3.30 3.95 4.60 7.39 11.47 19.63 29.77 40.16 50.54 60.93 30 150 150 210 210 210 210 210 210 1320 1320 1320 1680 1680 1680 1680
90 0.03 0.29 0.75 1.35 2.00 2.65 3.30 3.95 7.12 11.20 15.28 24.76 35.14 45.53 55.92 66.30 120 150 150 210 210 210 210 210 1320 1320 1320 1680 1680 1680 1680 1680
100 0.04 0.30 0.77 1.35 2.00 2.65 3.30 6.33 10.41 14.49 19.09 29.48 39.86 50.25 60.64 71.03 120 150 150 210 210 210 210 1320 1320 1320 1680 1680 1680 1680 1680 1680
Hydrologic Design Tables 417

04213000 Conneaut Creek at Conneaut, Ohio—Continued
Pumpset
Ratio of storage required for pump set to storage required for the primary pump relation (pump set 1) for indicated demand (in fraction of mean
annual streamflow)
0.002 0.010 0.020 0.050 0.100 0.200 0.300
1 1.00 1.00 1.00 1.00 1.00 1.00 1.00
2 1.43 1.02 1.00 1.00 1.00 1.85 3.87
3 1.25 1.00 1.00 1.00 1.00 1.00 1.00
4 1.18 1.00 1.00 1.00 1.00 1.00 1.00
5 1.11 1.00 1.00 1.00 1.00 1.00 1.00
6 1.04 1.00 1.00 1.00 1.00 1.00 1.00
7 1.42 1.02 1.03 1.07 1.47 5.27 11.90
8 1.26 1.01 1.03 1.08 1.08 1.08 2.18
9 1.28 1.03 1.07 1.12 1.11 1.25 3.38
10 1.20 1.04 1.13 1.15 1.14 1.19 2.61
11 1.24 1.06 1.19 1.17 1.17 1.30 2.52
12 1.34 1.01 1.01 1.07 1.07 1.29 3.00
13 1.21 1.00 1.07 1.13 1.11 1.15 1.69
14 1.17 1.05 1.14 1.16 1.15 1.20 1.56
15 1.16 1.09 1.21 1.18 1.17 1.26 1.73
16 1.08 1.12 1.27 1.19 1.18 1.30 2.03
17 1.20 1.01 1.07 1.13 1.12 1.14 1.26
18 1.13 1.08 1.16 1.17 1.14 1.21 1.37
19 1.09 1.09 1.21 1.18 1.18 1.27 1.55
20 1.08 1.12 1.28 1.19 1.18 1.28 1.91
Recurrenceinterval(years)
Normalvariate
Side-channel storage required (in demand days) for primary pump relation to meet indicated demand (in fraction of mean annual streamflow)
0.0020 0.0100 0.0200 0.0500 0.1000 0.2000 0.3000
48.00 2.037 158.17 198.73 200.03 211.88 217.93 224.31 228.16
40.00 1.960 150.67 188.63 193.76 206.82 212.45 218.11 225.06
30.00 1.834 138.38 172.08 183.48 198.52 203.46 207.94 219.98
25.00 1.751 130.27 161.15 176.69 193.04 197.52 201.23 216.62
20.00 1.645 127.11 153.48 167.03 179.82 184.32 195.86 210.39
10.00 1.282 110.42 137.98 137.89 148.98 162.32 178.71 184.25
5.00 0.841 91.30 96.07 99.31 123.42 136.80 160.60 171.77
2.00 0.000 55.79 50.67 56.15 66.62 80.54 98.59 105.30
418 Hydrologic Considerations for Estimation of Storage-Capacity Requirements of Impounding and Side-Channel Reservoirs for Water Supply in Ohio