Applying Indicators of Hydrologic Alteration to Texas Streams
6
Streamflow is a component of aquatic ecosystem health, and long-term alteration of streamflow characteristics can produce large changes in aquatic ecosystem structure and function. The physical, chemical, and biological properties of aquatic ecosys- tems are all affected by the magnitude and frequency of stream- flow. For example, the physical structure (hydrogeomorphology) of aquatic habitats is a property of the interaction between stream- flow magnitude and frequency and the physical landscape (Leopold and others, 1992). Chemical processes are affected by changes in water residence time, which is a function of stream- flow. Similarly, the structure and function of biological communi- ties associated with stream ecosystems depend in large part on the hydrologic regime (Poff and Ward, 1989, 1990; Sparks, 1992). Within-year variation in streamflow is essential to the survival, growth, and reproduction of aquatic species. Altering streamflow magnitude and frequency and within-year variability has the potential to modify critical aspects of the physical habitat (Bain and others, 1988). Documenting the degree to which streamflow has been modi- fied by the cumulative effects of water development is critical to assessing aquatic ecosystem health. The U.S. Geological Survey (USGS), in cooperation with the Texas Commission on Envi- ronmental Quality, conducted a study of the application of the Indicators of Hydrologic Alteration (IHA) methods developed by Richter and others (1996, 1997) to identify streams at risk for bio- logical impairment from the loss of streamflow-dependent habitat. This report provides a brief overview of selected IHA methods for assessing hydrologic alteration; presents examples that illustrate the application of the methods using streamflow data from a sub- set of USGS stations in the Trinity River Basin, Texas, analyzed in the study; and addresses applicability of the methods statewide. Overview of Methods The IHA methods characterize within-year variation in stream- flow on the basis of a series of hydrologic attributes (IHA statis- tics) organized into five groups (table 1). Alteration of the streamflow regime indicated by changes in these statistics pro- vides insight into temporal changes in flow-dependent habitat. If IHA statistics track variables that affect survival and reproduction of aquatic organisms, then historical patterns in the rate of change of an IHA statistic or a sudden discrete alteration in an IHA statis- tic are useful in developing restoration criteria. For this report, a subset of the IHA statistics was selected for analysis: The 11 IHA statistics from Groups 1 and 2, and two of the four statistics from Group 4 were computed from historical USGS daily mean streamflow for five continuous streamflow- gaging stations. Continuous streamflow stations were selected on the basis of length of record (20 years or longer), flow characteris- tics (perennial flow), location relative to major reservoirs, and in some cases location relative to historical biological surveys. The Group 1 statistic (mean monthly streamflow) reflects seasonal patterns in the magnitude and timing of streamflow. For this report, average monthly median streamflow—that is, the average of all the January medians over the period of record, the average of all the February medians, and so forth—rather than mean monthly streamflow was the Group 1 statistic, the rationale for which is discussed later. IHA Group 2 statistics focus on the mag- nitude and duration of annual extreme flow conditions. For each station, annual maximum and minimum 1-, 3-, 7-, 30-, and 90-day means were computed from moving averages of those attributes over the period of record. IHA Group 4 statistics measure the fre- quency of high- and low-flow pulses in the aquatic environment. Applying Indicators of Hydrologic Alteration to Texas Streams— Overview of Methods With Examples From the Trinity River Basin U.S. Department of the Interior U.S. Geological Survey USGS Fact Sheet 128–03 December 2003 In cooperation with the Texas Commission on Environmental Quality Table 1. Summary of hydrologic attributes used in the Indicators of Hydrologic Alteration and their characteristics (modified from Richter and others, 1996) [IHA, Indicators of Hydrologic Alteration; *, attribute used in this report] IHA statistics group Regime charac- teristics Hydrologic attributes Group 1: Magnitude of monthly water conditions Magnitude Timing * Mean for each calendar month (median in this application) Group 2: Magnitude and duration of annual extreme water conditions Magnitude Duration * Annual minimums of 1-day means * Annual maximums of 1-day means * Annual minimums of 3-day means * Annual maximums of 3-day means * Annual minimums of 7-day means * Annual maximums of 7-day means * Annual minimums of 30-day means * Annual maximums of 30-day means * Annual minimums of 90-day means * Annual maximums of 90-day means Group 3: Timing of annual extreme water conditions Timing Julian date of each annual 1-day maximum Julian date of each annual 1-day minimum Group 4: Frequency and duration of high- and low- flow pulses Magnitude Frequency Duration * Number of high-flow pulses each year * Number of low-flow pulses each year Mean duration of high-flow pulses in each year Mean duration of low-flow pulses in each year Group 5: Rate and frequency of water-condition changes Frequency Rate of change Means of all positive differences between consecutive daily means Means of all negative differences between consecutive daily means Number of rises Number of falls
-
Upload
independent -
Category
Documents
-
view
0 -
download
0
Transcript of Applying Indicators of Hydrologic Alteration to Texas Streams

Streamflow is a component of aquatic ecosystem health, and long-term alteration of streamflow characteristics can produce large changes in aquatic ecosystem structure and function. The physical, chemical, and biological properties of aquatic ecosys-tems are all affected by the magnitude and frequency of stream-flow. For example, the physical structure (hydrogeomorphology) of aquatic habitats is a property of the interaction between stream-flow magnitude and frequency and the physical landscape (Leopold and others, 1992). Chemical processes are affected by changes in water residence time, which is a function of stream-flow. Similarly, the structure and function of biological communi-ties associated with stream ecosystems depend in large part on the hydrologic regime (Poff and Ward, 1989, 1990; Sparks, 1992). Within-year variation in streamflow is essential to the survival, growth, and reproduction of aquatic species. Altering streamflow magnitude and frequency and within-year variability has the potential to modify critical aspects of the physical habitat (Bain and others, 1988).
Documenting the degree to which streamflow has been modi-fied by the cumulative effects of water development is critical to assessing aquatic ecosystem health. The U.S. Geological Survey (USGS), in cooperation with the Texas Commission on Envi-ronmental Quality, conducted a study of the application of the Indicators of Hydrologic Alteration (IHA) methods developed by Richter and others (1996, 1997) to identify streams at risk for bio-logical impairment from the loss of streamflow-dependent habitat. This report provides a brief overview of selected IHA methods for assessing hydrologic alteration; presents examples that illustrate the application of the methods using streamflow data from a sub-set of USGS stations in the Trinity River Basin, Texas, analyzed in the study; and addresses applicability of the methods statewide.
Overview of MethodsThe IHA methods characterize within-year variation in stream-
flow on the basis of a series of hydrologic attributes (IHA statis-tics) organized into five groups (table 1). Alteration of the streamflow regime indicated by changes in these statistics pro-vides insight into temporal changes in flow-dependent habitat. If IHA statistics track variables that affect survival and reproduction of aquatic organisms, then historical patterns in the rate of change of an IHA statistic or a sudden discrete alteration in an IHA statis-tic are useful in developing restoration criteria.
For this report, a subset of the IHA statistics was selected for analysis: The 11 IHA statistics from Groups 1 and 2, and two of the four statistics from Group 4 were computed from historical USGS daily mean streamflow for five continuous streamflow-gaging stations. Continuous streamflow stations were selected on
the basis of length of record (20 years or longer), flow characteris-tics (perennial flow), location relative to major reservoirs, and in some cases location relative to historical biological surveys. The Group 1 statistic (mean monthly streamflow) reflects seasonal patterns in the magnitude and timing of streamflow. For this report, average monthly median streamflow—that is, the average of all the January medians over the period of record, the average of all the February medians, and so forth—rather than mean monthly streamflow was the Group 1 statistic, the rationale for which is discussed later. IHA Group 2 statistics focus on the mag-nitude and duration of annual extreme flow conditions. For each station, annual maximum and minimum 1-, 3-, 7-, 30-, and 90-day means were computed from moving averages of those attributes over the period of record. IHA Group 4 statistics measure the fre-quency of high- and low-flow pulses in the aquatic environment.
Applying Indicators of Hydrologic Alteration to Texas Streams—Overview of Methods With Examples From the Trinity River Basin
U.S. Department of the InteriorU.S. Geological Survey
USGS Fact Sheet 128–03December 2003
In cooperation with the Texas Commission on Environmental Quality
Table 1. Summary of hydrologic attributes used in the Indicators of Hydrologic Alteration and their characteristics (modified from Richter and others, 1996)
[IHA, Indicators of Hydrologic Alteration; *, attribute used in this report]
IHA statisticsgroup
Regimecharac-teristics
Hydrologic attributes
Group 1: Magnitude of monthly water conditions
MagnitudeTiming
* Mean for each calendar month (medianin this application)
Group 2: Magnitude and duration of annual extreme water conditions
MagnitudeDuration
* Annual minimums of 1-day means* Annual maximums of 1-day means* Annual minimums of 3-day means* Annual maximums of 3-day means* Annual minimums of 7-day means* Annual maximums of 7-day means* Annual minimums of 30-day means* Annual maximums of 30-day means* Annual minimums of 90-day means* Annual maximums of 90-day means
Group 3: Timing of annual extreme water conditions
Timing Julian date of each annual 1-day maximumJulian date of each annual 1-day minimum
Group 4: Frequency and duration of high- and low-flow pulses
MagnitudeFrequencyDuration
* Number of high-flow pulses each year* Number of low-flow pulses each yearMean duration of high-flow pulses in each yearMean duration of low-flow pulses in each year
Group 5: Rate andfrequency of water-condition changes
FrequencyRate of
change
Means of all positive differences betweenconsecutive daily means
Means of all negative differences betweenconsecutive daily means
Number of risesNumber of falls

2
Drainage basin boundaryUSGS streamflow station
EXPLANATION
EASTF
OR
K
TRIN
ITYR
IVE
R
JOE POOLLAKE
TRINITY
CLEARFO
RK RIVER
RIVER
WEST FORK TRINITY
TRINITY
RIV
ER
ELM F ORK
TRINITY
RIVER
T R INITY08049500
08044500
0805010008062000
08065000
Dallas
95o
97o
98o
96o
33o
32o
31o
San Angelo
Dallas
TEXAS
Study area
LOCATION MAP
0 10 20 30 40 50 MILES
Digital base from U.S. Geological SurveyScale 1:2,000,000Albers equal-area projection
A pulse in this context is defined as a daily mean flow above or below selected thresholds. For each station, the two Group 4 sta-tistics were defined, respectively, as the annual number of daily mean flows greater than the 75th percentile and the annual num-ber less than the 25th percentile over the period of record.
The results of the computations are thus datasets of annual series of attributes for the respective periods of record. Statisti-cally significant changes in IHA statistics over a sufficiently long period of record indicate that hydrology has been altered. Hence, tests for significant trends in selected IHA statistics can be done; for this report, a hypothesis test for nonzero slope of regression (Helsel and Hirsch, 1992) was used on Groups 2 and 4 statistics. For stations at which flow is affected by one or more upstream reservoirs, IHA statistics can be tested for significant differences between pre- and post-impoundment flow regimes; for this report, the Kruskal-Wallis test (Helsel and Hirsch, 1992) was used on the Group 1 statistic. In terms of potential biological importance, the size of detectable changes in IHA statistics over time might be more important than whether the changes are statistically signifi-cant (Richter and others, 1996).
Application of Indicators of Hydrologic Alteration in the Trinity River Basin
The lengths of daily streamflow record for the five Trinity River Basin stations selected range from about 43 to 80 years. Flow at some stations is affected by reservoirs impounded during the respective periods of record (fig. 1), and historical biological surveys also have been conducted near some stations.
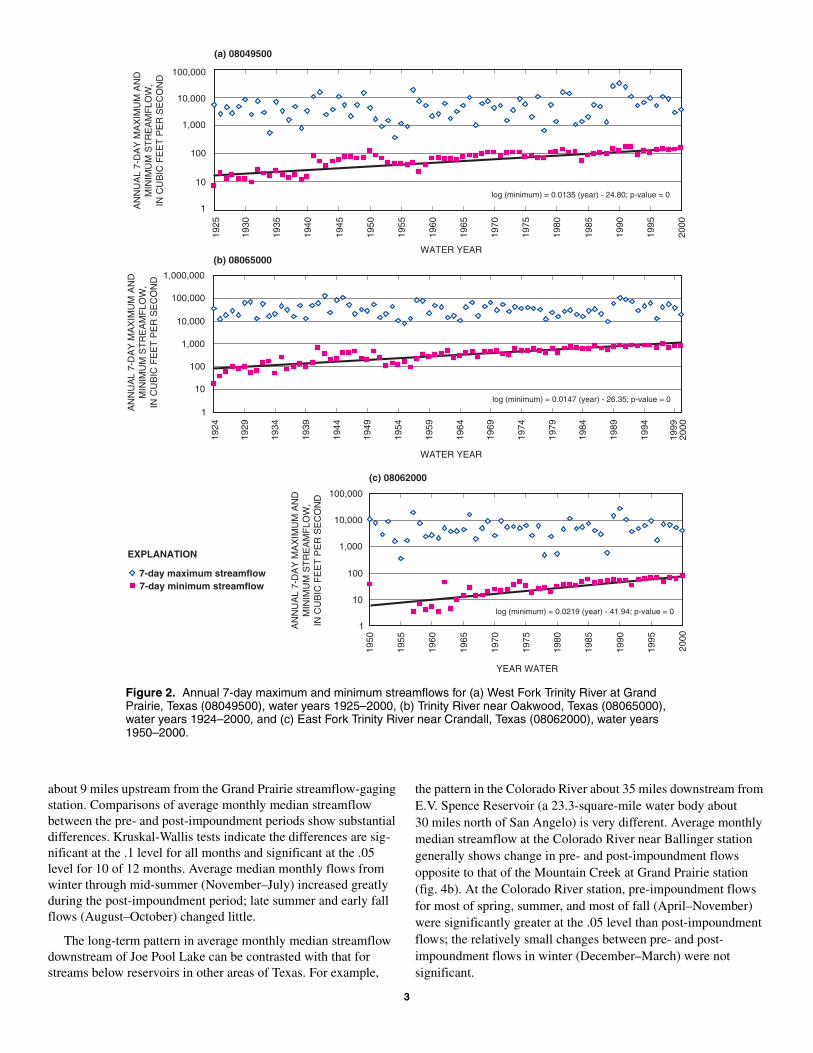
Analysis of Group 2 statistics indicates significant upward trends at the .05 level in the annual 7-day minimum flows at the
West Fork Trinity River at Grand Prairie station, at the (main stem) Trinity River near Oakwood station, and at the East Fork Trinity River near Crandall station (fig. 2). The 7-day minimums at those three stations also show long-term decreases in variabil-ity. Some magnitudes of change over time might be large enough to have biological effects. For example, the average annual 7-day minimum for the Trinity River near Oakwood for the approximate second half of the record (585 cubic feet per second for 1961–2000) is nearly three times that of the approximate first half of the record (201 cubic feet per second for 1924–61).
For the Trinity River Basin stations, IHA Group 4 statistics show significant downward trends at the .05 level in the annual frequency of low-flow pulses over the periods of record (fig. 3). For example, the average number of low-flow pulses for the West Fork Trinity River near Boyd during 1951–75 (10.6) was about twice the average number during 1976–2000 (5.24). During the periods of record, the annual frequency of high-flow pulses showed upward trends, although they generally were less than the downward trends in frequency of low-flow pulses and were not significant. An exception is the West Fork Trinity River at Grand Prairie (fig. 3c), which showed a significant upward trend in fre-quency of high-flow pulses during its 76-year period of record.
Although the IHA method “allows estimation of the magnitude of impacts but does not enable strong inferences regarding the cause” (Richter and others, 1996, p. 1,168), the only station with significant trends in frequency of both high- and low-flow pulses (West Fork Trinity River at Grand Prairie) also is the station most strongly influenced by urban development, including reservoirs. Upstream influences on this station include the Fort Worth and Arlington metropolitan areas, numerous reservoirs, and major wastewater discharges. To the extent that such development influ-ences the frequency of extreme flow events (climatic change could be a factor as well), this combined urban and reservoir effect is reflected in Group 4 statistics for main-stem Trinity River stations from the Dallas corridor downstream to the confluence with the East Fork Trinity River.
Stations where the potential effect of reservoirs on stream-flow could be isolated in space and time were identified. For this report, the Group 1 statistic average monthly median streamflow
was computed for the Mountain Creek at Grand Prairie station for the pre-impoundment period (October 1960–December
1985) and the post-impoundment period (January 1986–Sep-tember 2000) of Joe Pool Lake (fig. 4a). The rationale for
analyzing medians rather than means is that, because the median is influenced less by extreme events than the mean, an analysis of medians is the more conservative approach when the intent is to show the effect of a res-
ervoir on streamflow. Reservoirs commonly reduce the largest streamflows, thus a significant differ-
ence in pre- and post-impoundment mean flows is likely; whereas a significant pre-
and post-impoundment difference in medians is less likely and might be a truer indicator of change in central tendency of the flow regime.
Joe Pool Lake is an 11.7-square-mile reservoir on Mountain Creek Figure 1. Location of USGS streamflow-gaging stations in the Trinity River Basin, Texas.
3
YEAR WATER
WATER YEAR
1925
1930
1935
1940
1945
1950
1955
1960
1965
1970
1975
1980
1985
1990
1995
2000
1
10
100
1,000
10,000
100,000
AN
NU
AL
7-D
AY
MA
XIM
UM
AN
DM
INIM
UM
ST
RE
AM
FLO
W,
IN C
UB
IC F
EE
T P
ER
SE
CO
ND
(a) 08049500
log (minimum) = 0.0135 (year) - 24.80; p-value = 0
7-day maximum streamflow7-day minimum streamflow
EXPLANATION
1950
1955
1960
1965
1970
1975
1980
1985
1990
1995
2000
1
10
100
1,000
10,000
100,000
AN
NU
AL
7-D
AY
MA
XIM
UM
AN
DM
INIM
UM
ST
RE
AM
FLO
W,
IN C
UB
IC F
EE
T P
ER
SE
CO
ND
(c) 08062000
log (minimum) = 0.0219 (year) - 41.94; p-value = 0
WATER YEAR
1924
1929
1934
1939
1944
1949
1954
1959
1964
1969
1974
1979
1984
1989
1994
2000
1999
1
10
100
1,000
10,000
100,000
1,000,000
AN
NU
AL
7-D
AY
MA
XIM
UM
AN
DM
INIM
UM
ST
RE
AM
FLO
W,
IN C
UB
IC F
EE
T P
ER
SE
CO
ND
(b) 08065000
log (minimum) = 0.0147 (year) - 26.35; p-value = 0
about 9 miles upstream from the Grand Prairie streamflow-gaging station. Comparisons of average monthly median streamflow between the pre- and post-impoundment periods show substantial differences. Kruskal-Wallis tests indicate the differences are sig-nificant at the .1 level for all months and significant at the .05 level for 10 of 12 months. Average median monthly flows from winter through mid-summer (November–July) increased greatly during the post-impoundment period; late summer and early fall flows (August–October) changed little.
The long-term pattern in average monthly median streamflow downstream of Joe Pool Lake can be contrasted with that for streams below reservoirs in other areas of Texas. For example,
the pattern in the Colorado River about 35 miles downstream from E.V. Spence Reservoir (a 23.3-square-mile water body about 30 miles north of San Angelo) is very different. Average monthly median streamflow at the Colorado River near Ballinger station generally shows change in pre- and post-impoundment flows opposite to that of the Mountain Creek at Grand Prairie station (fig. 4b). At the Colorado River station, pre-impoundment flows for most of spring, summer, and most of fall (April–November) were significantly greater at the .05 level than post-impoundment flows; the relatively small changes between pre- and post-impoundment flows in winter (December–March) were not significant.
Figure 2. Annual 7-day maximum and minimum streamflows for (a) West Fork Trinity River at Grand Prairie, Texas (08049500), water years 1925–2000, (b) Trinity River near Oakwood, Texas (08065000), water years 1924–2000, and (c) East Fork Trinity River near Crandall, Texas (08062000), water years 1950–2000.

4
High-flow pulse—Daily mean flow greater than 75th percentileLow-flow pulse—Daily mean flow less than 25th percentile
EXPLANATION
(a) 08044500
1947
1950
1953
1956
1959
1962
1965
1968
1971
1974
1977
1980
1983
1986
1989
1992
1995
1998
WATER YEAR20
00
NU
MB
ER
OF
PU
LSE
S P
ER
YE
AR
0
5
10
15
20
25Number of high-flow pulses = 0.0543 (year) + 5.991p-value = .0881
Number of low-flow pulses = -0.1990 (year) + 22.69p-value = .0001
WATER YEAR
(b) 08065000
1924
1926
1929
1932
1935
1938
1941
1944
1947
1950
1953
1956
1959
1962
1965
1968
1971
1974
1977
1980
1983
1986
1989
1992
1995
1998
2000
0
2
4
6
8
10
12
14
16
18
NU
MB
ER
OF
PU
LSE
S P
ER
YE
AR
Number of high-flow pulses = 0.0034 (year) + 6.554p-value = .8217
Number of low-flow pulses = -0.0800 (year) + 10.85p-value = .0001
(c) 08049500
1926
1929
1932
1935
1938
1941
1944
1947
1950
1953
1956
1959
1962
1965
1968
1971
1974
1977
1980
1983
1986
1989
1992
1995
1998
WATER YEAR20
00
NU
MB
ER
OF
PU
LSE
S P
ER
YE
AR
0
5
10
15
20
25
30
35Number of high-flow pulses = 0.1387 (year) + 4.221p-value = .0001
Number of low-flow pulses = -0.1840 (year) + 19.80p-value = .0001
The frequency of low-flow pulses at the Mountain Creek station below Joe Pool Lake showed different trends between the pre- and post-impoundment periods (fig. 5). The frequency of low-flow pulses decreased 3 years after impoundment (took 3
years for the lake to fill) and remained low throughout the succeeding post-impoundment period. In contrast, the frequency of high-flow pulses remained essentially unchanged during the post-impoundment period.
Figure 3. Annual frequency of high- and low-flow pulses for (a) West Fork Trinity River near Boyd, Texas (08044500), water years 1947–2000, (b) Trinity River near Oakwood, Texas (08065000), water years 1924–2000, and (c) West Fork Trinity River at Grand Prairie, Texas (08049500), water years 1925–2000.

5
Potential for Application of Indicators of Hydrologic Alteration Statewide
The 1997 Texas Water Plan (Texas Water Development Board, 1997) acknowledges that past water development has modified aquatic communities, which in turn has affected the physical, chemical, and biological integrity of streams in Texas. Declines in
the number of observed vulnerable fish species at a regional (river
basin) level, and the fish community changes associated with
these declines, appear to be attributable primarily to habitat
modification associated with water development projects like
reservoirs (Anderson and others, 1995). IHA analysis can provide a first approximation of the relative ecological risk to aquatic
Figure 4. Average monthly median streamflow for (a) Mountain Creek at Grand Prairie, Texas (08050100), during pre- and post-impoundment of Joe Pool Lake, and (b) for comparison, Colorado River near Ballinger, Texas (08126380), during pre- and post-impoundment of E.V. Spence Reservoir.
p-value, Kruskal-Wallis test for significant difference between pre- and post-impoundment flow
Post-impoundment periodJoe Pool Lake—Jan. 1986–Sept. 2000
Pre-impoundment periodJoe Pool Lake—Oct. 1960–Dec. 1985
.0145
EXPLANATION
p-value, Kruskal-Wallis test for significant difference between pre- and post-impoundment flow
Post-impoundment periodE.V. Spence Reservoir—June 1907–Dec. 1967Pre-impoundment periodE.V. Spence Reservoir—Jan. 1969–Sept. 2000
.0933
EXPLANATION
(a) 08050100
JAN FEB MAR APR MAY JUNE JULY AUG SEPT OCT NOV DEC
MONTH
AV
ER
AG
E M
ON
TH
LY M
ED
IAN
ST
RE
AM
FLO
W,
IN C
UB
IC F
EE
T P
ER
SE
CO
ND
0
20
40
60
80
100
120
140
160
.0145
.0032
.0009
.0064 .0189 .0410
.0717
.0739
.0211
.0064
.0083
.0059
(b) 08126380
.0933.0020
.0003
0
.9123.0621.2108
.1520
.0035
.0211
.4329.5603
JAN FEB MAR APR MAY JUNE JULY AUG SEPT OCT NOV DEC
MONTH
AV
ER
AG
E M
ON
TH
LY M
ED
IAN
ST
RE
AM
FLO
W,
IN C
UB
IC F
EE
T P
ER
SE
CO
ND
0
50
100
150
200
250

6
YEAR
1960 1965 1970 1975 1980 1985 1990 1995 2000NU
MB
ER
OF
PU
LSE
S P
ER
YE
AR
0
5
10
15
20
25
30
35
40Pre-impoundment period Post-impoundment period
Mean high flow for periodMean low flow for periodHigh-flow pulse—Daily mean flow greater than 75th percentileLow-flow pulse—Daily mean flow less than 25th percentile
EXPLANATION
ecosystems from altered natural flow regimes. The systematic assessment of existing streamflow data using IHA methods could document the extent of biologically relevant hydrologic alteration in Texas streams.
—Richard L. Kiesling
References
Anderson, A.A., Hubbs, C., Winemiller, K.O., and Edwards, R.J., 1995, Texas freshwater fish assemblages following three decades of environmental change: Southwest Naturalist, v. 40, no. 3, p. 314–321.
Bain, M.B., Finn, J.T., and Brooke, H.E., 1988, Streamflow regulation and fish community structure: Ecology, v. 69, p. 382–392.
Helsel, D.R., and Hirsch, R.M., 1992, Studies in environmental science 49—Statistical methods in water resources: Amsterdam, Elsevier, 522 p.
Leopold, L.B., Wolman, M.G., and Miller, J.P., 1992, Fluvial pro-cesses in geomorphology: New York, Dover Publications, Inc., 522 p.
Poff, N.L., and Ward, J.V., 1989, Implications of streamflow vari-ability and predictability for lotic community structure—A regional analysis of streamflow patterns: Canadian Journal of Fisheries and Aquatic Sciences, v. 46, p. 1,805–1,818.
______1990, Physical habitat template of lotic systems—Recov-ery in the context of historical pattern of spatio-temporal heterogeneity: Environmental Management, v. 14, p. 629–645.
Richter, B.D., Baumgartner, J.V., Powell, Jennifer, and Braun, D.P., 1996, A method for assessing hydrologic alteration within ecosystems: Conservation Biology, v. 10, p. 1,163–1,174.
Richter, B.D., Baumgartner, J.V., Wigington, R., and Braun, D.P., 1997, How much water does a river need?: Freshwater Biology, v. 37, p. 231–249.
Sparks, R.E., 1992, Risks of altering the hydrologic regime of large rivers, in Cairns, J.B., and others, eds., Predicting ecosystem risk—Volume XX. Advances in modern environ-mental toxicology: Princeton, N.J., Princeton Scientific Publishing, p. 119–152.
Texas Water Development Board, 1997, Water for Texas—A consensus-based update to the State Water Plan—Volume 2. Technical planning appendix: Texas Water Development Board Document No. GP–6–2 [variously paged].
Any use of trade, product, or firm names is for descriptive purposes only and does not imply endorsement by the U.S. Government.
Information on hydrologic data related to this study can be obtained from:
District ChiefU.S. Geological Survey Phone: (512) 927–35008027 Exchange Dr. FAX: (512) 927–3590Austin, TX 78754–4733 World Wide Web:E-mail: [email protected] http://tx.usgs.gov/
Figure 5. Annual frequency of high- and low-flow pulses for Mountain Creek at Grand Prairie, Texas (08050100), during pre- and post-impoundment of Joe Pool Lake.