Lateral and Vertical Alteration-Mineralization Zoning in ...

Ecological Applications, 25(1), 2015, pp. 243–263� 2015 by the Ecological Society of America
Hydrologic filtering of fish life history strategies across the UnitedStates: implications for stream flow alteration
RYAN A. MCMANAMAY1,3
AND EMMANUEL A. FRIMPONG2
1Environmental Sciences Division, Oak Ridge National Laboratory, Oak Ridge, Tennessee 37831 USA2Fisheries and Wildlife Conservation, Virginia Polytechnic Institute and State University, Blacksburg, Virginia 24061 USA
Abstract. Lotic fish have developed life history strategies adapted to the natural variationin stream flow regimes. The natural timing, duration, and magnitude of flow events hascontributed to the diversity, production, and composition of fish assemblages over time.Studies evaluating the role of hydrology in structuring fish assemblages have been morecommon at the local or regional scale with very few studies conducted at the continental scale.Furthermore, quantitative linkages between natural hydrologic patterns and fish assemblagesare rarely used to make predictions of ecological consequences of hydrologic alterations. Weask two questions: (1) what is the relative role of hydrology in structuring fish assemblages atlarge scales? and (2) can relationships between fish assemblages and natural hydrology beutilized to predict fish assemblage responses to hydrologic disturbance? We developed modelsto relate fish life histories and reproductive strategies to landscape and hydrologic variablesseparately and then combined. Models were then used to predict the ecological consequencesof altered hydrology due to dam regulation. Although hydrology plays a considerable role instructuring fish assemblages, the performance of models using only hydrologic variables waslower than that of models constructed using landscape variables. Isolating the relativeimportance of hydrology in structuring fish assemblages at the continental scale is difficultsince hydrology is interrelated to many landscape factors. By applying models to dam-regulated hydrologic data, we observed some consistent predicted responses in fish life historystrategies and modes of reproduction. In agreement with existing literature, equilibriumstrategists are predicted to increase following dam regulation, whereas opportunistic andperiodic species are predicted to decrease. In addition, dam regulation favors the selection ofreproductive strategies with extended spawning seasons and preference for stable conditions.
Key words: classification frameworks; dams; ecohydrology; environmental flows; fish reproductivestrategies; fish traits; flow–ecology relationship; hydrologic alteration.
INTRODUCTION
Lotic fish have developed life history strategies
adapted to the natural variation in stream flow regimes
(Poff et al. 1997, Bunn and Arthington 2002). The
natural timing and magnitude of flooding establishes the
template on which riverine habitats are created and then
maintained (Trush et al. 2000) and provides behavioral
cues for the initiation of spawning and seasonal
migrations (Nesler et al. 1988, King et al. 1998).
Likewise, the magnitude and duration of high flows
determines the accessibility of spawning habitat (Gra-
bowski and Isely 2007) and juvenile rearing habitats for
fish (Leitman et al. 1991, Light et al. 1998), whereas the
magnitude and duration of low to moderate flows
governs the stability and suitability of feeding and
resting habitats and associated changes in stress
(Freeman and Grossman 1993, Peterson and Jennings
2007). Studies have suggested that hydrology forms the
habitat template (Schlosser 1987, 1990) or hierarchical
filter (Jackson and Harvey 1989, Tonn 1990, Poff 1997),
which organizes trade-offs among adaptive strategies
within fish populations and assemblages. The wide range
of natural flow conditions across the U.S. continent
(Poff 1996) exerts different selective pressures that shape
fish life history and reproductive strategies and result in
regionally distinct fish assemblages (Southwood 1988,
Olden and Kennard 2010, Mims and Olden 2012).
Assessments of the role of hydrology in structuring
fish assemblages has been more common at the local or
regional scale (e.g., Pyron and Lauer 2004, Knight et al.
2008) with very few studies conducted at the continental
scale (e.g., Carlisle et al. 2011). Furthermore, quantita-
tive linkages between natural hydrologic patterns and
fish assemblages are rarely used to make predictions of
ecological consequences of hydrologic alterations. If fish
assemblages vary predictably with natural variation in
hydrology at large scales, then logically, one would
presume that anthropogenic-induced changes in hydrol-
ogy may predictably influence fish assemblage compo-
sition. Thus, two questions remain to be answered: (1)
what is the role of hydrology in structuring fish
assemblages at large scales? and (2) can predictive
Manuscript received 2 February 2014; revised 19 May 2014;accepted 1 July 2014. Corresponding Editor: O. P. Jensen.
3 E-mail: [email protected]
243
relationships between fish assemblages and natural
hydrology be utilized to predict fish assemblage respons-
es to hydrologic disturbance?
Pinpointing the role of hydrology in structuring fish
assemblages is complicated because hydrology operates
at multiple temporal and spatial scales (Poff et al. 1997,
Olden et al. 2012) and is interrelated with many other
determinants of fish assemblage composition (Marsh-
Mathews and Mathews 2000). Thus, developing models
to predict how hydrology may shape regional species
pools requires accounting for other abiotic variables.
However, the hierarchical nature of how abiotic factors
filter regional species pools through selective pressures to
shape the composition of local communities is still poorly
understood (Jackson et al. 2001). Because predicting the
presence of individual species in local communities is
complicated by uncertain evolutionary processes along
phylogenetic lineages and by local abiotic controls, it is
advantageous to examine the changes in communities via
a traits lens because traits consolidate information across
many taxonomic groups into common adaptive strategies
(Frimpong and Angermeier 2009, 2010b). Species of
similar phylogenetic lineage share characteristics and
constraints through common evolutionary descent (i.e.,
phylogenetic inertia); thus, phylogeny should be account-
ed for in analyses evaluating variation in species’ life
histories with environmental variables. Traits provide a
mechanism to account for phylogeny while inferring
species’ adaptation to environmental gradients. Multiple
studies have used fish traits to determine the role of
habitat, landscape filters, and anthropogenic disturbanc-
es in shaping fish communities (Schlosser 1990, Wine-
miller and Rose 1992, Goldstein and Meador 2004,
Growns 2004, Blank et al. 2007).
With specific regard to hydrology–trait relationships,
life history groups and habitat-preference guilds have
received the most attention (Poff and Allan 1995, Pyron
and Lauer 2004, Blank et al. 2007, Tedesco et al. 2008,
Olden and Kennard 2010, Mims and Olden 2012, 2013),
with fewer applications to reproductive strategies
(Craven et al. 2010, Carlisle et al. 2011). Winemiller
and Rose (1992) originally proposed three major
endpoints (periodic, equilibrium, and opportunistic) in
the life history strategies of fish species representing a
continuum of tradeoffs among survival, growth, fecun-
dity, and parental care. The trivariate space occupied by
a fish is an indication of the selection pressures of its
environment, primarily driven by hydrologic variation
(Winemiller 2005). For example, periodic strategists
grow to large sizes, have late sexual maturation, and
have high fecundity for successfully reproducing under
suitable conditions (Winemiller 2005), all as an adapta-
tion to rivers with predictable, but seasonally fluctuat-
ing, hydrology (Tedesco et al. 2008, Mims and Olden
2012). In contrast, opportunistic species are small,
exhibit fast growth, and have early sexual maturation
(Winemiller 2005), all of which are advantageous in
occupying systems with harsh and unstable hydrology
(Olden and Kennard 2010). However, modes of
reproduction, specifically the nature of guarding behav-
ior, placement of eggs within or on substrates, the ability
to have multiple spawning bouts, and the seasonal
affiliation for spawning, are also related to natural
hydrologic variation (Balon 1975, Winemiller 2005). For
example, brood hiders bury eggs in the substrate for
protection, either from predators or high-flow distur-
bances, whereas open substratum spawners broadcast
their eggs over substrates in brief temporal windows to
avoid short-term high flows (Craven et al. 2010).
Seasonal extremities in hydrology also determine the
onset and length of spawning, as well as recruitment
periods (Bunn and Arthington 2002). While some
aspects of reproductive strategies (e.g., extent of
parental care) represent components of the life history
groups, reproductive strategies may reveal important
adaptions to hydrologic variation undetected by coarser
life history strategies.
Presumably, if relationships between natural flow and
biota exist, ecological responses to altered hydrology can
be predicted. Thus, if natural variation in stream flows is
responsible for shaping the life history strategies of fish
(Bunn and Arthington 2002) and hence, functional
diversity of communities (Poff and Allan 1995), then
alterations to natural hydrologic patterns may pose
conditions in which those resident species are maladapt-
ed, leading to a loss or replacement of species (Moyle
and Mount 2007). Although quantitative relationships
between natural hydrology and ecological patterns are
commonly used to suggest the consequences of hydro-
logic alteration (Poff and Allan 1995, Pyron and Lauer
2004), they are rarely used to make quantitative
predictions of ecological responses to hydrologic alter-
ation (McManamay et al. 2013). In contrast, ecological
responses to hydrologic alteration are typically mea-
sured empirically as correlative relationships (Poff et al.
2010, Poff and Zimmerman 2010). Indeed, much of our
understanding of the importance of natural flows to
stream ecosystems, and the need to protect them, may be
based on biotic responses to altered, rather than natural,
conditions. The limitation of relying on correlations
between altered hydrology and ecology to determine the
importance of natural flows is that altered ecological
conditions may be influenced by other factors that
accompany hydrologic alteration, such as changes in
water quality (Olden and Naiman 2010). Unless
confounding variables are accounted for in analyses,
conclusions regarding the importance of natural flows,
and the cause of ecological changes, may be spurious.
Alternatively, a proper understanding of how natural
hydrology structures ecological communities may be
required prior to predicting the ecological consequences
to uncertain future scenarios (e.g., climate change; Tonn
1990).
Our first objective was to determine the role of
hydrology in structuring continental patterns in fish
assemblages using a trait-based approach. We chose to
RYAN A. MCMANAMAY AND EMMANUEL A. FRIMPONG244 Ecological ApplicationsVol. 25, No. 1
evaluate continental patterns in fish traits because this
reflects the role of hydrology in shaping the selectivepressures influencing regional pools of species. In
addition, the continental scale provides a foundationfor assessing how major losses in natural flow variation
may induce shifts in trait frequencies among regions.Poff et al. (2007) suggested that ubiquitous damregulation, in conjunction with consistent hydrologic
responses to dam regulation, leads to a homogenizationof stream flow variation, i.e., loss in regionally distinct
hydrology. In the same issue, Moyle and Mount (2007)further proposed that the uniformity of hydrology in
river systems, species loss, and associated colonizationby habitat generalists, has led to a homogenization of
regionally distinct fish assemblages. Thus, these studiesprovided a framework for developing our second
objective, i.e., to determine whether natural hydrology-trait models can be used to predict fish trait responses to
altered hydrology. We hypothesized that if natural flowvariation plays a role in structuring continental patterns
in fish traits, then consistent losses in the uniqueness ofnatural flows may show predictable responses in fish
communities.
METHODS
Developing fish trait frequency maps
Fish trait frequency (FTF) maps characterize thefrequency or proportion of traits represented by fish
assemblages within basins (Mims et al. 2010). FTF mapsprovide a means to examine how environmental
variables, such as hydrology, structure fish assemblagesacross the landscape. However, assessing environmen-
tal-trait relationships requires accounting for phylogenysince species of similar phylogenetic lineage share
characteristics and constraints through common evolu-tionary descent (i.e., phylogenetic inertia; Felsenstein1985, Diniz-Filho et al. 1998). Controlling for phylogeny
ensures patterns in traits across the landscape areattributable to environmental variation and not con-
founded by common lineage of species pools.Geographic distributions (i.e., ranges developed from
known presences) of 865 freshwater fish species within2068 subbasins (eight-digit hydrologic catalog units
[HUC8]) were available through NatureServe (Nature-Serve 2004). Lists of all native freshwater fish species,
excluding estuarine fish, were compiled within eachHUC8. Information on species life history requirements
and reproductive strategies were accessed through theFishTraits database, which contains trait-related infor-
mation for 810 species of freshwater fish (Frimpong andAngermeier 2009). Trait information for some species
listed within NatureServe was incomplete due toinsufficient biological information, being highly endemic
and not formally described, or differences in nomencla-ture. For fish species without representative or completetrait information, we used NatureServe Explorer, Fish-
Base (Froese and Pauly 2013), and literature searches toupdate missing traits with new information or find the
closest phylogenetic relative as a substitute. The closest
phylogenetic relative was determined as the closest clade
or parental clade (subgenus), species of potential
hybridization, or species commonly misidentified as the
species of interest (in that order of preference).
We obtained traits that could be used to summarize
life history strategies or reproductive strategies. Life
history traits included maximum length, age at matura-
tion, longevity, and fecundity. Reproductive character-
istics included spawning season timing, season length,
and whether fish had more than one spawning bout.
Mode of reproduction (sensu Balon 1975), represented
as binary variables, ranged from absence of parental
care (open substratum broadcast spawning) to placing
eggs in specific substrates (brood hiders) to constructing
nests and guarding young (substrate choosers and nest
guarders) and bearing live young (bearers). Using
similar methods as Winemiller and Rose (1992), we
calculated parental care indices as indicative of the
degree of parental investment ranging from 0 to 3: 0 for
no parental care, 1 for specific placement of eggs, 2 for
guarding eggs, and 3 for bearing young. Spawning
timing was represented as the proportion of each month
(January–December) falling within each species spawn-
ing season. The sum of all monthly proportions
approximates the length of the spawning season. We
calculated spawning season timing indices by summing
the proportions falling into different seasonal windows:
winter (December–February), spring (March–May),
summer (June–August), and fall (September–Novem-
ber). Serial spawners, species having more than one
spawning bout, were represented as binary variables.
Nelson (2006) developed a family number (also avail-
able in FishTraits), which serves as a phylogenetic
position of each family relative to other families
(Frimpong and Angermeier 2009). Smaller family
numbers represent more primitive fishes. Thus, to
account for the effect of phylogenetic inertia on all
traits, we used generalized linear models to predict fish
traits from family number based on Gaussian, Poisson,
and binomial distributions as appropriate. Using pre-
dicted values, we calculated deviance residuals for all
variables to use in future analyses.
Freshwater fish life histories are represented as three
major endpoints in the continuum of trade-offs among
juvenile survival/parental care, fecundity, body size, and
longevity (Winemiller and Rose 1992). The endpoints
can be used as the basis for creating three life history
groups, which include periodic, equilibrium, and oppor-
tunistic fish species (Winemiller and Rose 1992).
Periodic species are larger-bodied fish characterized by
late maturation, high fecundity, and low parental
investment. Equilibrium species are smaller-bodied
fishes with lower fecundity, but invest more in their
progeny (i.e., provide more parental care), and hence,
have high juvenile survival. Opportunistic fishes are
typically small-bodied fish with early maturation, no
parental investment, and extended spawning seasons
January 2015 245HYDROLOGIC FILTERING OF FISH TRAITS
with multiple bouts. We hard assigned all fish species to
one of three life history groups by determining the
minimum Euclidean distance between each species
multivariate trait position (seven traits) and each life
history group’s endpoint in trait space (Mims et al. 2010,
Olden and Kennard 2010). For simplicity, we preferred
the hard classification method over the soft classification
approach, i.e., providing a distance measure from each
species multivariate position to each endpoint (Mims
and Olden 2013).
The periodic strategy endpoint represented maximum
values for total length, age at maturation, longevity, and
fecundity, and minimum values for serial spawning,
season length, and parental care. The opportunistic
strategy was characterized by maximum values for serial
spawning and season length and minimum values for all
other traits. The equilibrium endpoint had average
values for longevity, maximum values for parental care
and age at maturation, and minimum values for all other
traits. Principal components analysis (PCA) on correla-
tions among the seven traits was used to examine
whether multivariate patterns represented by the species
in our analysis resembled the three-endpoint life history
continuum presented by Winemiller and Rose (1992).
All variables were log(x þ 1) transformed, centered to
zero, and scaled to unit variance prior to analysis.
Species were plotted according to their life history group
along the first two principle components (PCs; see
Appendix A).
Trait information was summarized separately for all
fish species and only fish species preferring lotic
environments. Although lotic specialists are presumed
to be more adapted to hydrologic variation than lentic
species, fish preferring lentic environments may be lotic
dependent or influenced by hydrology. For example,
bluespotted sunfish (Enneacanthus gloriosus) inhabit
oxbows, backwaters, and wetlands in the coastal plain
of the southeastern United States, and hence, they are
typically defined as preferring lentic environments (Page
and Burr 1991). However, bluespotted sunfish are highly
dependent upon flood magnitude and duration to
inundate floodplain wetlands (Lietman et al. 1991, Light
et al. 1998). Because distinguishing the influence of
hydrology based on lotic preference is difficult, we
evaluated trait responses from all fish and only fish
preferring lotic habitats (from here on, lotic fish). For
life history traits, we summarized the proportion of
species as periodic, equilibrium, or opportunistic within
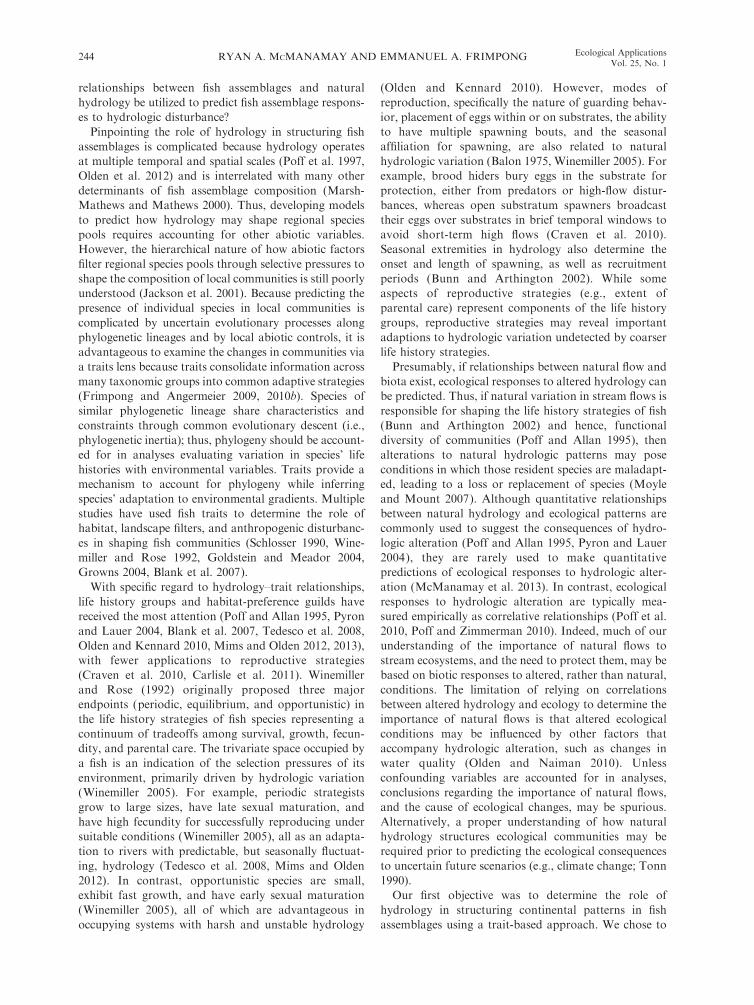
each HUC8 (e.g., Fig. 1). All other traits were
summarized as the average deviance value across all
species within each HUC8 (e.g., Fig. 1).
Assembling a hydrologic and landscape predictor data set
Our first objective was to determine the relative role of
hydrologic variation in structuring fish assemblages;
however, many nonhydrologic environmental variables
are also potentially important. In addition, hydrology is
highly interrelated with landscape variables; hence, we
constructed models predicting fish traits with hydrology
and landscape variables independently and then com-
bined. We assembled landscape predictors that summa-
rized variation in geology, topography, climate, land
cover, and primary productivity within each of 2068
HUC8 subbasins (Fig. 2). All variables and their sources
are listed in Tables 1 and 2. Justification and methods
for including landscape predictors are provided in
Appendix B. All geospatial summarization procedures
were conducted in ESRI ArcGIS 9.3.
Hydrologic variables were assembled using a three-
step procedure: (1) isolating reference-quality stream
gages across the United States (or gages with records
extending prior to disturbance), (2) calculating summary
hydrologic statistics from discharge records, and (3)
summarizing hydrologic information across HUC8
subbasins. Reference-quality U.S. Geologic Survey
(USGS) stream gages were considered streams with
little or no hydrologic disturbance in their upstream
watershed. We determined reference-quality criteria
using documented lists of reference-quality stream gages
(data available online),4 remarks within USGS annual
water data reports (ADRs), visual examination of
stream flow patterns (Vogl and Lopes 2009), and a
GIS-based hydrologic disturbance index (HDI; see
Falcone et al. [2010b]). The HDI represents the
cumulative disturbance of dam regulation, channel
modification, withdrawals, and landscape fragmentation
(Falcone et al. 2010a). Gages with HDI ,14 and with at
least a 15-year complete hydrologic record were selected
(gages with .5 days of missing values were excluded).
HDI values of 14 were well within the range found in
reference-quality gages (Falcone et al. 2010a). Based on
ADR reports, we further excluded gages with reports
mentioning regulation by dams, major diversions,
channelization, and agriculture. Visual examination of
hydrographs was used to identify apparent changes in
stream flow patterns attributable to different anthropo-
genic stressors (Vogl and Lopes 2009). Stream gages
with long hydrologic records extending prior to distur-
bance, such as dam regulation, also provide a source of
reference-quality hydrologic information. We selected
streams with pre-dam-regulation hydrologic records
using a combination of information from ADR reports,
National Inventory of Dams (NID; available online),5
information on disturbances upstream of each gage
(Falcone et al. 2010b), and historical patterns in land
and water use (McManamay et al. 2012a). We ensured
pre-dam hydrologic records were not influenced by
cumulative regulation by smaller dams and by other
disturbances, such as urbanization or water use. Our
final data sets resulted in 2618 stream gages with
reference-quality hydrology data (see McManamay et
al. [2014]).
4 http://water.usgs.gov/GIS/metadata/usgswrd/XML/gagesII_Sept2011.xml#Identification_Information
5 http://geo.usace.army.mil/pgis/f ?p¼397:12
RYAN A. MCMANAMAY AND EMMANUEL A. FRIMPONG246 Ecological ApplicationsVol. 25, No. 1
After compiling discharge records, we calculated 38
hydrologic statistics using the USGS hydrologic index
tool (HIT; see Henriksen et al. [2006]), which included
the 33 indicators of hydrologic alteration (Richter et al.
1996) and five additional variables important to
describing ecological patterns (Richter et al. 1996,
1997, Olden and Poff 2003; Table 1). All magnitude-
related hydrologic indices were divided by mean daily
flow to standardize variables to ensure patterns in
hydrology were due to spatial variation and not river
size (Kennard et al. 2010). We then created Theissen
polygons (proximity tool set) using stream gage point
locations (latitude and longitude). Hydrologic statistics
were then summarized within HUC8 subbasins based on
area-weighted averages of polygon overlap with water-
shed boundaries (Fig. 2).
Building hydrologic-trait models
Collinearity among trait frequencies, hydrologic
predictors, and landscape predictors were examined
using Spearman’s rank correlations. Predictor variables
with Spearman’s rho values .0.80 were excluded in
favor of variables that had more documented impor-
tance in predicting ecological patterns. We were
conservative in removing correlated predictor variables
from the data set because subsequent analyses were
robust against cases of multicollinearity.
In order to determine the relative contribution of
hydrology in explaining fish trait frequencies, we used
redundancy analysis (RDA) to examine partial variation
between hydrology, landscape variables, and their
combined effect. RDA provides a mechanism to
determine the amount of unique variation in multiple
response variables attributable to multiple explanatory
variables or multiple sets of explanatory variables
(McCune and Grace 2002). Partial variance was
calculated for hydrology and landscape variables using
the varpart function in the vegan package in the R
programming environment (Oksanen et al. 2013). Each
independent variable data set was conditioned upon the
other to determine unique variation attributable to
hydrologic or landscape variables. We conducted RDAs
to explain variation in reproductive strategies and life
history groups under six scenarios: predicting all fish
using all predictors, only hydrologic predictors, and only
landscape predictors, and predicting lotic fish using all
predictors, only hydrologic predictors, and only land-
scape predictors.
While RDA provides an approach to assess partial
variance, it does not provide quantitative predictions of
FIG. 1. Examples of fish trait frequency maps across the United States. Spawning seasonality is an example of a reproductivetrait/strategy whereas equilibrium, opportunistic, and periodic species are examples of life history groups.
January 2015 247HYDROLOGIC FILTERING OF FISH TRAITS
hydrology-trait relationships. Random forests were
developed in R and used to predict fish trait values
based on hydrologic and landscape predictors in the six
scenarios mentioned above. Random forests are an
improved form of exploratory learning over traditional
tree-based approaches, in that they have increased
classification accuracy and advanced approaches to
estimating variable importance (Brieman, 2001, Cutler
et al. 2007). Random forests improve accuracy by
generating a large number of classification trees
(typically 500) and then combining the predictions from
all trees. Each tree is generated from a random subset of
variables and a bootstrap subsample of the data (63% of
observations). The remaining samples (out of bag [OOB]
observations) are used in a cross-validation procedure to
calculate the percentage of variance explained (%Var),
mean-squared error (MSE), and variable importance.
Model performance was assessed using percentage of
variance explained across all six scenarios for all traits.
Combined effects (%VarCE) of hydrology and landscape
variables in random forest models were calculated using
%VarCE ¼ ð%VarHYD þ %VarLANDÞ � %VarALL ð1Þ
where HYD, LAND, and ALL refers to percentage of
variance explained by each individual data set, hydro-
logic, landscape, and the two combined, respectively.
To calculate variable importance, values of each
variable for OOB observations are randomly permuted
and then predicted using each tree. Variable impor-
tance was assessed using the proportional increase in
MSE values (IncMSE), which is calculated as the
average increase in MSE with the absence of each
predictor in randomly permuted OOB data. In order to
compare the importance of predictors across models,
we standardized IncMSE values by the maximum value
for each model to compute relative value (Rel-
IncMSE). We then calculated mean Rel-IncMSE as
averages across all-variable models to ascertain the
relative importance of hydrology vs. landscape predic-
tors in structuring patterns in traits.
Predicting fish trait responses to hydrologic alteration
The advantage of models predicting trait–natural-
hydrology relationships is that they can then be applied
to predict ecological consequences of hydrologic alter-
ation, such as that induced by dam regulation. Of the
2618 reference-quality gages used to construct hydro-
logic-trait models, 233 had at least 15 years of pre- and
post-dam-regulation information (Fig. 3; McManamay
et al. 2014). We ensured these gages had no evidence of
disturbances induced by other factors besides dam
regulation (McManamay et al. 2014). The same 38
hydrologic statistics mentioned in Methods: Assembling
a hydrologic and landscape predictor data set were
calculated for pre- and post-dam-regulation hydrologic
records. All magnitude-related variables were standard-
ized by dividing by mean daily flow. To explore the
multivariate hydrologic response of streams to dam
regulation, we conducted a principal components
analysis (PCA) on the 38 hydrologic statistics from
pre- and post-hydrologic records. We plotted the first
three significant principal components (PCs) to examine
multidimensional patterns (significance based on broken
stick method; Jackson [1993]). Combinations of vari-
ables with the highest loadings along the significant PCs
were selected by sorting loadings and then using breaks
in the distribution to select the most influential variables.
Percent changes from pre to post-dam-regulation were
visually examined using a subset of variables with
highest loadings.
Hydrologic-trait models (developed previously) were
used to predict trait responses for pre- and post-dam
regulation for four of the six scenarios mentioned
previously (only models containing hydrologic predic-
tors). To isolate the effects of hydrology, the pre- and
postvalues for the 38 hydrologic variables were changed
while landscape predictors were kept constant. Land-
scape predictors were represented by the HUC8 in which
each dam regulated gage was located. Trait-frequency
responses were represented as the percentage of changes
from predam conditions. Because negative deviance
values would result in inappropriate calculations of the
percentage of changes, we shifted all traits frequencies
on a scale .0 while keeping differences in relative
magnitudes the same. Differences between trait frequen-
cies from pre- to post-dam regulation were tested for
significance using Kruskal-Wallis tests, whereas differ-
ences for all reproductive and life history traits among
pre- and postscenarios were simultaneously tested for
significance using a permutational multivariate analysis
of variance (PMANOVA) in the vegan package in R
(Stevens and Okasanen 2012). PMANOVA is analogous
to a nonparametric MANOVA but uses distance
matrices to partition sum of squares and then calculates
pseudo F statistics following using large permutations
(we used 500).
Because geographic, hydrologic, and operational (i.e.,
dam purpose) context may structure the effects of
hydrologic alteration, we hypothesized that classifica-
tion systems may explain variation in trait-frequency
responses to dam regulation. Provinces, ecoregions, and
hydrologic classifications have been identified as impor-
tant frameworks for stratifying hydrologic analyses
(Johnson and Fecko 2008, McManamay et al. 2012a)
and fish communities (Wolock et al. 2004, Frimpong
and Angermeier 2010a). Classifying dams by their
operational purpose can also provide a template to
evaluate hydrologic and ecological responses to dam
regulation (Poff and Hart 2002). Provinces, ecoregions,
and hydrologic classes were assigned to each dam-
regulated gage based on the dominant region within
each HUC8. Using information from the NID and ADR
reports, we developed five simplified categories of
purposes hypothesized to have varying effects on
hydrology, and thus ecology: diversion, other (recrea-
tion, farm ponds), water supply, flood control (includes
RYAN A. MCMANAMAY AND EMMANUEL A. FRIMPONG248 Ecological ApplicationsVol. 25, No. 1
navigation), flood control þ water supply, hydropower,
and hydropower þ additional purposes. All classifica-
tions were compared in their ability to explain variation
in hydrologic and trait-frequency responses using
PMANOVAs for all four scenarios (for more informa-
tion, see Appendix D).
Organizing our analysis by geographic regions also
provides a method to examine whether regionally
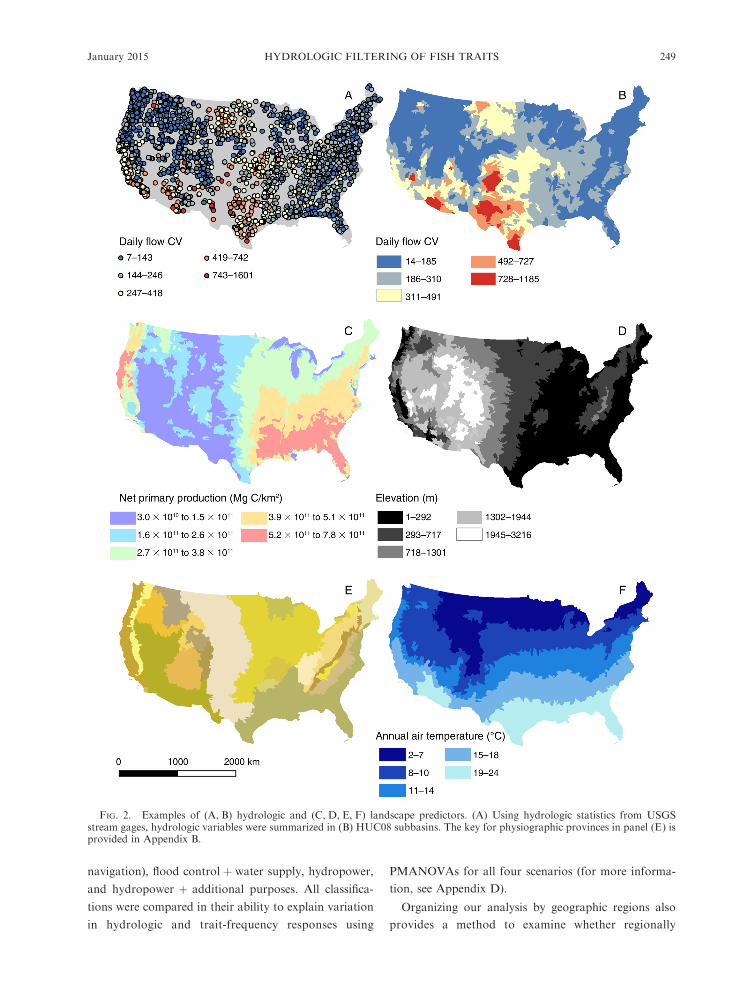
FIG. 2. Examples of (A, B) hydrologic and (C, D, E, F) landscape predictors. (A) Using hydrologic statistics from USGSstream gages, hydrologic variables were summarized in (B) HUC08 subbasins. The key for physiographic provinces in panel (E) isprovided in Appendix B.
January 2015 249HYDROLOGIC FILTERING OF FISH TRAITS

distinct hydrology and trait frequencies become less
distinct or homogenized following dam regulation, as
suggested by Poff et al. (2007) and Moyle and Mount
(2007). We used analysis of similarities (ANOSIM) in
the vegan package in R to test whether hydrology and
trait frequencies were less distinct following dam
regulation. ANOSIM tests for significant differences
by comparing rank dissimilarities between geographic
regions to within geographic regions. The ANOSIM
statistic R is calculated based on the difference in
mean ranks between groups (rB) and within groups
(rW) using R ¼ (rB � rW)/(N(N � 1)/4). R ranges from
�1 to þ1 where a value of 0 indicates complete
random grouping, values of þ1 indicate high dissim-
ilarity between groups, and values of �1 indicate high
dissimilarity within groups. We hypothesized that if
dams were homogenizing hydrology and trait frequen-
cies, dissimilarities among geographic regions would
be higher (higher R values) during pre-dam compared
to post-dam conditions. ANOSIM was used to
analyze dissimilarities in pre- and posthydrology and
pre- and posttrait frequencies among provinces,
ecoregions, and hydrologic classes for all four
scenarios.
RESULTS
Fish trait frequency maps
Overall, we assembled trait information for 850 native
freshwater fish species in the conterminous United
States. Family number was significantly related to fish
traits in all generalized linear models except those for
serial spawners and brood hiders. Using Winemiller and
Rose’s (1992) life history groups, we identified 141
species as periodic strategists, 351 as opportunistic
strategists, and 358 as equilibrium strategists. Multivar-
iate patterns in species’ life history strategies represented
the three-endpoint life history continuum presented by
Winemiller and Rose (1992; see Appendix A). Although
fish trait frequency maps suggested there was some
regionality in trait frequencies, maps also suggested
geographically separated areas shared similar values
(Fig. 1). The majority of fish were classified as lotic (757)
compared to lentic (110) species. Most trait values were
similar among lotic and lentic species; however, lentic
species had higher values for season length and nest
guarding, but lower values for substrate choosers
(Appendix A). A higher proportion of periodic species
and lower proportion of equilibrium species were
represented within lentic species compared to lotic
species.
Hydrologic and landscape predictors
Relationships were evident among landscape predic-
tors, among hydrologic predictors, and between land-
scape and hydrologic predictors (Appendix B). For
example, PMPE (mean precipitation–potential evapo-
transpiration [PET]) was positively correlated to mean
annual runoff and negatively correlated with DL18 (zero
flow days; Appendix B). Physiographic provinces
differed markedly in their ranges in mean annual runoff
values. Because of the redundancy in information,
PMPE, PET, relief, minimum and maximum precipita-
tion, percent forest land cover, and minimum and
maximum temperature were removed from the land-
scape variables. Likewise, the following hydrologic
variables were removed from the predictor data set:
DL2, DL4, DH2, DH4, and FH7 (see Table 1 for
definitions of variables).
In general, correlations among trait frequencies were
weak, especially between reproductive strategies and life
history groups (Appendix B). However, a strong positive
correlation was observed between opportunists and
serial spawners and between opportunists and summer
spawners. Winter and fall spawners were positively
correlated with each other and season length. Brood
hiders were negatively correlated with serial spawners.
Correlations between predictors and fish traits were also
observed; however, considerable unexplained variation
was evident in fish traits when examined using univariate
relationships. Brood hiders were positively correlated,
whereas nest guarders were negatively correlated with
slope. Summer spawners were positively correlated with
TABLE 1. Hydrologic predictors used in fish trait models.
Variables Description
Magnitude
MA3 daily coefficient of variation in flowMA12–MA23 mean monthly flows (January–December)MA41 mean annual runoffML17 baseflow indexMH20 annual maximum
Duration
DL1–DL5� various duration low flows (1, 3, 7, 30,90 day)
DL16 low flow durationDL18 zero-flow daysDH1–DH5� various duration high flows (1, 3, 7, 30,
90 day)DH15 High-flow duration
Frequency
FL1 low-flow frequencyFH1 high-flow frequency1FH6 high-flow frequency2FH7� high-flow frequency3
Timing
TA2 predictability in flowsTL1 day of year of annual minimum�TH1 day of year of annual maximum�
Rate of change
RA1 rise rateRA3 fall rateRA8 reversals
Note: Source is Olden and Poff (2003).� DL2, DL4, DH2, and DH4 were removed due to being
correlated with other low-flow (DL) and high-flow (DH)metrics. FH7 was removed due to being correlated with FH6.
� Day of year with 1 January¼ 1.
RYAN A. MCMANAMAY AND EMMANUEL A. FRIMPONG250 Ecological ApplicationsVol. 25, No. 1

mean temperature. Opportunists were positively corre-
lated with daily flow CV (coefficient of variation in
flow), whereas equilibrium species were negatively
correlated. Opportunists were also positively correlated
with1-day high flow and rise rate.
Hydrologic trait models
Based on the redundancy analysis, hydrologic and
landscape variables shared considerable overlap in
explaining variation in trait frequencies (Table 3;
Appendix B). Hydrologic variables explained 42% of
total variation in reproductive strategies (for all fish and
only lotic fish), slightly higher than variation attributed
to landscape variables (40–41%, adjusted R2; Table 3).
After conditioning variables, hydrology and landscape
variables explained 11% and 10%, respectively, of the
partial variance in reproductive strategies. Hydrologic
variables explained less of the total variance and partial
variance in life history groups (30–33% and 6–7%,
respectively) compared to landscape variables (37–39%and 13%, respectively). Total variance explained by
combined effects was higher than that of hydrology or
landscape variables when considered separately, but the
difference was more apparent when considering parti-
tioned variance (Table 3).
With the exception of models predicting open
substratum and fall spawner indices, random forest
models including all fish explained more variation in
traits and had lower MSE than models including only
lotic fish (Table 4). Random forests predicting winter
spawners had the highest predictive capacity, whereas
models predicting bearers had the lowest. Models
including all variables or only landscape variables
explained more variation and had lower MSE than
models including only hydrologic variables; however,
the performance of hydrologic variable models was
comparable to other models. In addition, the variance
explained by the combined effect between landscape and
hydrologic variables was high and in many cases
composed the majority of variation in fish traits (Table
4).
Variables with the highest importance in the all-
variable models excluded hydrologic predictors (Appen-
dix C). Physiographic province, mean temperature,
slope, and elevation had the highest Rel-IncMSE values.
Rel-IncMSE is the relative (or standardized) increase in
mean squared error. Among the hydrologic variables,
seven-day and one-day duration high-flows, annual
runoff, the Julian date of annual maximum, and various
monthly magnitude flows had among the highest Rel-
TABLE 2. Landscape predictors used to build fish trait models.
Variable Description Source
Geology
PHYS physiographic provinces Fenneman and Johnson (1946)BDRKPERM bedrock permeability class (1–7) Wolock et al. (2004)SAND percent sand Wolock et al. (2004)
Topography
ELEV elevation (m) Hastings et al. (1999)RELIEF� relief (maximum–minimum elevation) Hastings et al. (1999)SLOPE mean slope (%) Wolock et al. (2004)PFLATT� percentage of land that is flat (,1% slope) Wolock et al. (2004)
Climate
MEANPREC 30-year mean precipitation PRISM (2013)MINPREC� 30-year minimum precipitation PRISM (2013)MAXPREC� 30-year maximum precipitation PRISM (2013)MEANTEMP 30-year mean air temperature PRISM (2013)MINTEMP� 30-year minimum air temperature PRISM (2013)MAXTEMP� 30-year maximum air temperature PRISM (2013)PET� potential evapotranspiration Wolock et al. (2004)PMPE� MEANPREC-PET Wolock et al. (2004)
Land cover
FOREST� percent forested (41–43) MRLC (2013)DEVELOP percent developed (21–24) MRLC (2013)AGRICUL percent agriculture (81, 82) MRLC (2013)OPENH20 percent open water (11) MRLC (2013)ICESNOW percent ice and snow (12) MRLC (2013)BARREN percent barren (31) MRLC (2013)WETLAND percent wetland (90, 95) MRLC (2013)SCRUB percent scrub/shrub (51–52) MRLC (2013)GRASS percent grassland/herbaceous (71) MRLC (2013)
Other
NPP net primary production Imhoff et al. (2004)
Note: Numbers in parenthesis that follow description represent codes for different land covers from the National Land CoverDataset.
� Indicates variable was removed due to correlation with other variables.
January 2015 251HYDROLOGIC FILTERING OF FISH TRAITS

IncMSE values. Models constructed using only hydro-
logic variables displayed similar patterns in variable
importance. In contrast to the model including all
variables, models constructed with only hydrologic
variables had Rel-IncMSE values displaying more of a
gradual decline from hydrologic variables with the
highest importance to lowest importance.
Predicting fish trait responses to hydrologic alteration
The 233 stream gages with pre- and post-dam-
regulation information had widespread distribution
across the United States. According to the broken stick
method, the first five principal components were
significant and explained 77% of the total variation.
PCA consistently showed that pre-dam regulation
occupied a larger multivariate space than post-dam-
regulated records (Fig. 3). Dam regulation generally
increased baseflows, low flows, and reversals but
decreased maximum flows, high-flow frequency, and
daily flow variation (Fig. 3). Longer duration high flows
(30- and 90-day flows) tended to increase with post-dam
regulation.
When considering all-variable models for all fish,
predicted trait responses to dam regulation were not
significantly different between pre- and post-dam
scenarios for reproductive strategies (PMANOVA,
F1, 470 ¼ 0.188, P ¼ 0.862) or life history groups
(PMANOVA, F1, 470 ¼ 1.01, P ¼ 0.359). Likewise, trait
responses to dam regulation for the all-variable lotic-fish
model were not significant for reproductive strategies
(PMANOVA, F1, 470 ¼ 0.192, P ¼ 0.844) or life history
groups (PMANOVA, F1, 470 ¼ 1.242, P ¼ 0.275). For
individual traits, the majority of responses to dam
regulation were not significant with the exception of
substrate choosers displaying significant increases
(Kruskal-Wallis, P , 0.05) and bearers displaying
significant decreases for lotic fish only (Kruskal-Wallis,
P ¼ 0.05).
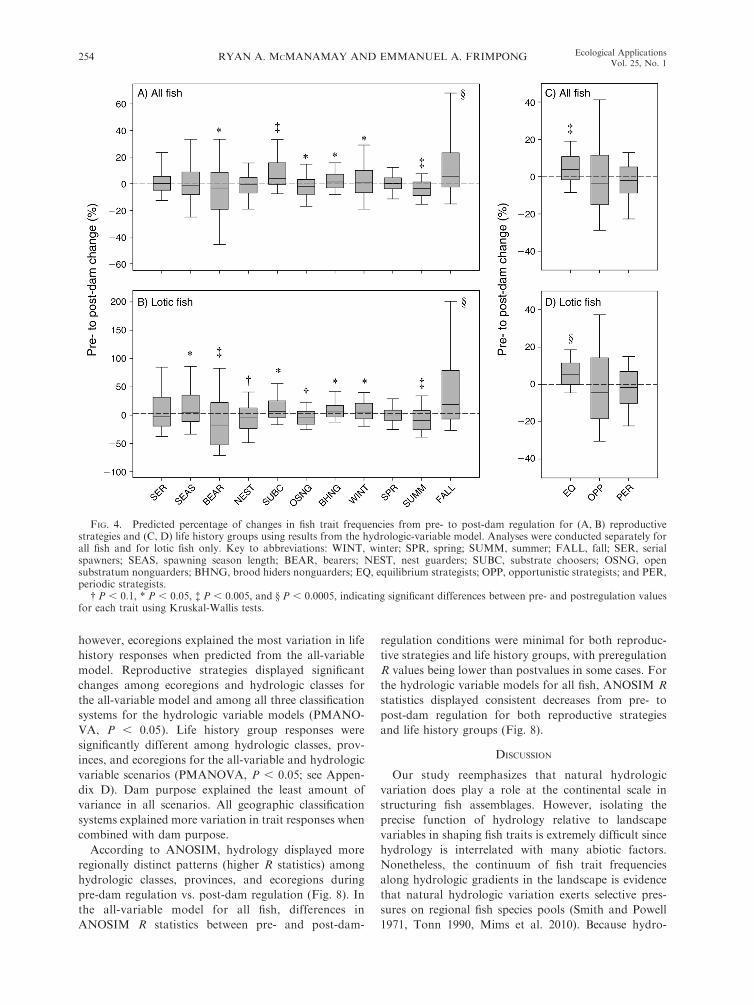
In contrast to all-variables models, models using only
hydrologic variables displayed significant changes for
all-fish and lotic-fish scenarios (PMANOVA): all fish
reproductive (F1, 470 ¼ 3.10, P ¼ 0.046), all fish life
history (F1, 470¼ 3.95, P¼ 0.030), lotic fish reproductive
(F1, 470 ¼ 3.60, P ¼ 0.036), and lotic fish life history
(F1, 470 ¼ 8.22, P ¼ 0.004; see Fig. 4). Spawning season,
substrate choosers, brood hiders, and winter/fall spawn-
ers all displayed significant increases whereas bearers,
open substratum spawners, and summer spawners all
displayed significant decreases (Kruskal-Wallis, P ,
0.05; see Fig. 4).
In all four scenarios, models predicted a slight shift
toward the equilibrium endpoint (Figs. 4, 5). Equilibri-
um strategists displayed consistent increases, whereas
periodic and opportunistic strategists displayed decreas-
es (Figs. 4, 5); however, responses were only significant
for equilibrium strategists in the hydrologic variable
FIG. 3. Ordination of USGS stream gages using their pre- and post-dam-construction hydrologic statistics in principalcomponents analysis (PCA). Scores for the first three significant PCs were plotted. Variables along each PC axis represent statisticswith the highest loadings along PCs. (B) Box plot of percentage of change in a subset of hydrologic statistics with highest loadingvalues (variable names provided in Table 1). The center line is the median value. Box edges are the 25th and 75th percentiles, andwhiskers represent the 5th and 95th percentiles.
RYAN A. MCMANAMAY AND EMMANUEL A. FRIMPONG252 Ecological ApplicationsVol. 25, No. 1

models for all fish and lotic fish (Kruskal-Wallis, P ¼0.002 and P , 0.0001, respectively). Fish assemblages
showed more variation and occupied a larger trivariate
life history space for the all-variable models compared tothe hydrologic models (Fig. 5).
Considerable geographic variation among responsessuggested that ecohydrologic responses to dam regula-
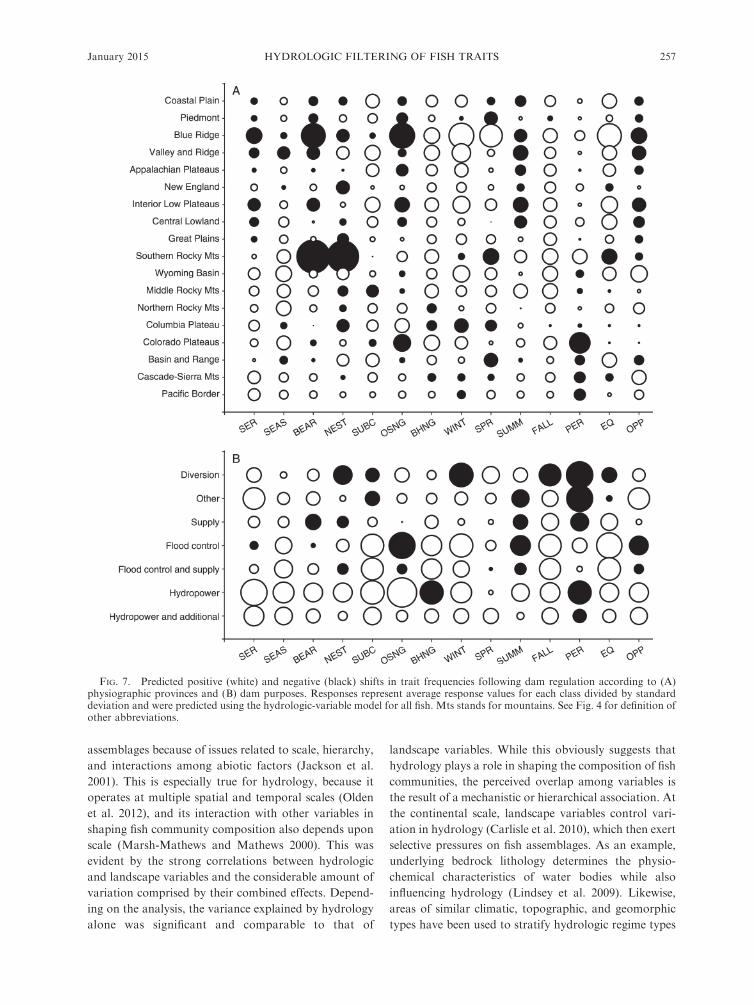
tion may be context specific (Fig. 6). For several traits,
variation in trait responses seemed to follow an east to
west pattern across physiographic provinces (Fig. 7A)and an intermittent to stable flow pattern across
hydrologic classes (Appendix D). Diversion dams, as
opposed to other dam purposes, were predicted to favor
species preferring intermittent-type environments (Fig.
7B). Hydropower and flood control dams have the
largest predicted shifts in trait frequencies (Fig. 7B).Hydrologic responses to dam regulation were only
significantly different among hydrologic classes (PMA-
NOVA, F12, 223 ¼ 2.95, P ¼ 0.020) as opposed to
provinces, ecoregions, and dam purpose (Appendix D).
In general, hydrologic classes and provinces explainedthe most variation in trait responses across all scenarios;
TABLE 3. Proportion of total variance (R2 adj.) and partial variance in fish-trait frequencies explained by hydrologic predictors,landscape predictors, and their combined effect (taken from redundancy analysis).
Response
Hydrology Landscape Combined
R2 adj. Partial variance R2 adj. Partial variance R2 adj. Partial variance
All fish
Reproductive 0.42 0.11 0.41 0.10 0.53 0.31Life history 0.33 0.07 0.39 0.13 0.46 0.13
Lotic fish
Reproductive 0.42 0.11 0.40 0.10 0.52 0.31Life history 0.30 0.06 0.37 0.13 0.43 0.24
Notes: Analyses were conducted separately for all fish and for only lotic preferring fishes and for reproductive strategies and lifehistory strategies. R2 adj. stands for the adjusted R2 value.
TABLE 4. Comparison of performance among random forest models using various subsets of predictors (all predictors, landscapeonly, or hydrology only) in predicting variation in fish trait frequencies for all fish species or only those preferring lotic habitats.
Model
All Landscape HydrologyCombined
%Var MSE %Var MSE %Var MSE %Var
All fish
Serial 62.3 0.05 61.5 0.05 55.6 0.1 54.8Season 68.3 0.29 64.2 0.33 58.1 0.4 54.0Bearer 21.3 0.01 32.3 0.01 18.5 0.01 29.6Open substratum 46.7 0.07 47.7 0.06 33.1 0.08 34.0Brood hider 65.1 0.04 63.3 0.04 56.8 0.05 54.9Winter 72.4 0.05 68.9 0.06 63.3 0.07 59.8Spring 53.9 0.04 53.1 0.04 46.0 0.05 45.1Summer 65.6 0.06 66.7 0.06 54.6 0.08 55.7Fall 58.6 0.05 58.9 0.05 47.0 0.06 47.3Substrate chooser 53.4 0.01 53.2 0.01 42.1 0.01 42.0Nest guarder 49.7 0.07 51.9 0.06 43.5 0.08 45.8Periodic 52.1 0.01 53.5 0.01 36.9 0.01 38.3Equilibrium 50.6 0.01 52.9 0.01 38.3 0.01 40.6Opportunistic 66.0 0.01 65.8 0.01 57.5 0.01 57.3
Lotic fish only
Serial 59.9 0.05 59.7 0.05 52.8 0.06 52.6Season 65.2 0.35 61.3 0.39 55.5 0.45 51.7Bearer 21.3 0.01 21.3 0.01 12.7 0.01 12.7Open substratum 47.2 0.07 47.8 0.07 34.2 0.09 34.8Brood hider 64.4 0.05 63.0 0.05 55.8 0.06 54.4Winter 72.7 0.06 69.7 0.06 63.0 0.08 60.0Spring 47.5 0.05 46.1 0.05 40.2 0.05 38.8Summer 64.3 0.06 65.0 0.06 52.4 0.08 53.1Fall 60.7 0.05 61.6 0.05 48.3 0.07 49.1Substrate chooser 48.8 0.01 49.5 0.01 36.6 0.01 37.3Nest guarder 48.3 0.07 50.1 0.07 42.0 0.08 43.8Periodic 52.1 0.01 52.1 0.01 33.8 0.01 33.8Equilibrium 50.6 0.01 50.6 0.01 37.1 0.02 37.1Opportunistic 66.0 0.01 66.0 0.01 56.1 0.01 56.1
Notes: %Var and MSE refers to the percentage of variance explained and mean squared error, respectively, in the out of bag(OOB) sample. Combined effect refers to the amount of overlapping variation explained by landscape and hydrologic predictors.Numbers in bold refer to highest percentage of variance.
January 2015 253HYDROLOGIC FILTERING OF FISH TRAITS
however, ecoregions explained the most variation in life
history responses when predicted from the all-variable
model. Reproductive strategies displayed significant
changes among ecoregions and hydrologic classes for
the all-variable model and among all three classification
systems for the hydrologic variable models (PMANO-
VA, P , 0.05). Life history group responses were
significantly different among hydrologic classes, prov-
inces, and ecoregions for the all-variable and hydrologic
variable scenarios (PMANOVA, P , 0.05; see Appen-
dix D). Dam purpose explained the least amount of
variance in all scenarios. All geographic classification
systems explained more variation in trait responses when
combined with dam purpose.
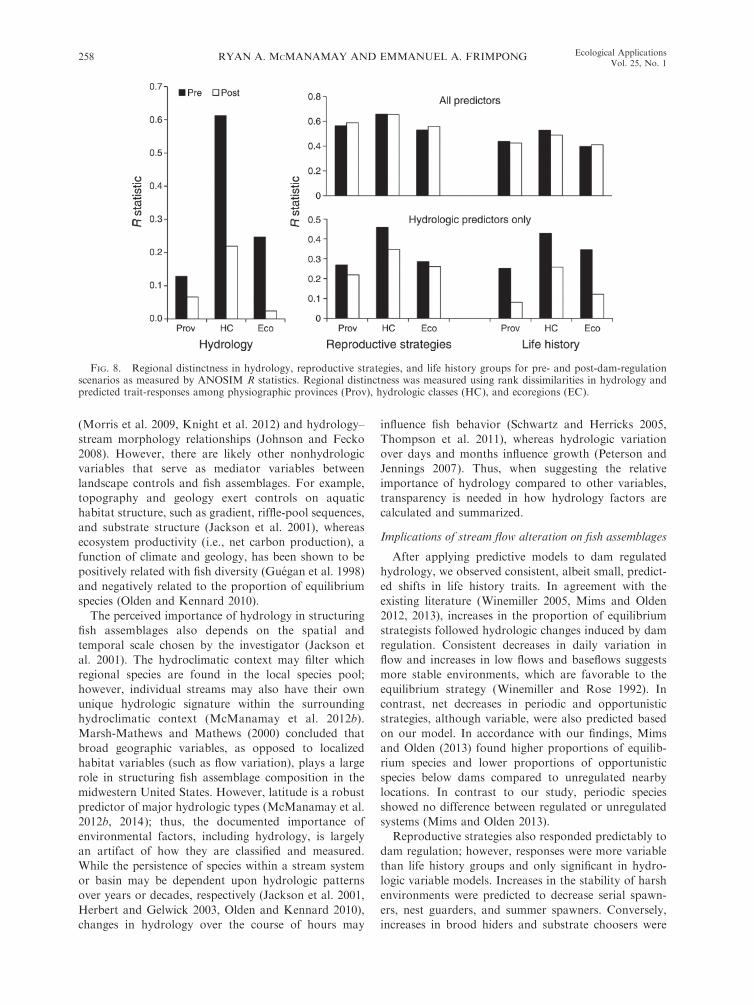
According to ANOSIM, hydrology displayed more
regionally distinct patterns (higher R statistics) among
hydrologic classes, provinces, and ecoregions during
pre-dam regulation vs. post-dam regulation (Fig. 8). In
the all-variable model for all fish, differences in
ANOSIM R statistics between pre- and post-dam-
regulation conditions were minimal for both reproduc-
tive strategies and life history groups, with preregulation
R values being lower than postvalues in some cases. For
the hydrologic variable models for all fish, ANOSIM R
statistics displayed consistent decreases from pre- to
post-dam regulation for both reproductive strategies
and life history groups (Fig. 8).
DISCUSSION
Our study reemphasizes that natural hydrologic
variation does play a role at the continental scale in
structuring fish assemblages. However, isolating the
precise function of hydrology relative to landscape
variables in shaping fish traits is extremely difficult since
hydrology is interrelated with many abiotic factors.
Nonetheless, the continuum of fish trait frequencies
along hydrologic gradients in the landscape is evidence
that natural hydrologic variation exerts selective pres-
sures on regional fish species pools (Smith and Powell
1971, Tonn 1990, Mims et al. 2010). Because hydro-
FIG. 4. Predicted percentage of changes in fish trait frequencies from pre- to post-dam regulation for (A, B) reproductivestrategies and (C, D) life history groups using results from the hydrologic-variable model. Analyses were conducted separately forall fish and for lotic fish only. Key to abbreviations: WINT, winter; SPR, spring; SUMM, summer; FALL, fall; SER, serialspawners; SEAS, spawning season length; BEAR, bearers; NEST, nest guarders; SUBC, substrate choosers; OSNG, opensubstratum nonguarders; BHNG, brood hiders nonguarders; EQ, equilibrium strategists; OPP, opportunistic strategists; and PER,periodic strategists.
� P , 0.1, * P , 0.05, � P , 0.005, and § P , 0.0005, indicating significant differences between pre- and postregulation valuesfor each trait using Kruskal-Wallis tests.
RYAN A. MCMANAMAY AND EMMANUEL A. FRIMPONG254 Ecological ApplicationsVol. 25, No. 1

climatic conditions act as a filter in shaping the local
species within basins (Jackson et al. 2001), it logically
follows that widespread and consistent reductions in
natural hydrologic variation should also exert selective
pressures that are mirrored by changes in fish trait
frequencies. Our results demonstrate that widespread
reductions in natural flow variation due to dam
regulation lead to an increased uniformity of fish life
histories and reproductive strategies across the United
States (Moyle and Mount 2007) with favored selection
of the equilibrium strategy as found by others (e.g.,
Mims and Olden 2013) and favored selection of
reproductive strategies with extended spawning seasons
and preference for stable conditions, such as brood
hiders and substrate choosers.
Hydrologic filtering of fish traits across the United States
The fact that fish life history strategies vary regionally
according to hydrologic selection pressures in not a new
concept (Smith and Powell 1971, Tonn 1990, Mims et al.
2010). Similar to other studies, we observed trends that
suggested adaptations in life histories and reproductive
strategies along hydrologic gradients (Mims et al. 2010,
Olden and Kennard 2010). According to the tri-life
history framework proposed by Winemiller and Rose
(1992), opportunistic strategists have short life spans,
low parental investment, and multiple spawning bouts a
year. Thus, opportunistic fish inhabit harsher environ-
ments with unpredictable hydrology and recolonize
rapidly following disturbances (Winemiller 2005). In
contrast, equilibrium strategists have low fecundity and
high parental investment, an artifact of inhabiting
predictable, stable perennial flows (Winemiller 2005).
In accordance with the exiting theory, we found that
opportunistic strategists increased with increasing daily
flow variation, whereas equilibrium species decreased.
Similarly, Mims and Olden (2012) found that opportu-
nistic strategists were positively related to flow variabil-
ity, whereas the opposite was true for equilibrium
strategists. Within selected basins of the United States
and Australia, Olden and Kennard (2010) observed the
same pattern with opportunistic species but not for
FIG. 5. Predicted shifts in the proportion of life history strategies from pre- to post-dam regulation using four scenarios. Fourscenarios included analyses for all fish and for lotic fish only and predicting shifts using all variables vs. hydrologic variables only.Differences in the proportion of life history groups between pre- (PRE) and postregulation (POST) were tested for significanceusing a permutational multivariate analysis of variance. See Fig. 4 for definitions of abbreviations.
January 2015 255HYDROLOGIC FILTERING OF FISH TRAITS

equilibrium species. Equilibrium strategists composed a
higher proportion of species in basins with extended wet
seasons and higher stability within the tropics of West
Africa (Tedesco et al. 2008). Periodic strategists have
adapted to seasonally fluctuating, but predictable
hydrology by growing to large sizes, having late sexual
maturation, and having high fecundity for successfully
reproducing under suitable conditions. However, these
strategies, along with low parental care, come at the
expense of low juvenile survivorship and poor adaptive
qualities to reproduce when conditions are seasonally
unpredictable. Both Tedesco et al. (2008) and Mims and
Olden (2012) reported that periodic strategists were
associated with higher flow seasonality. In contrast, we
did not observe any strong correlations for periodic
species; however, this may have been the result of having
no single hydrologic metric that summarized seasonal-
ity.
Compared to life history groups, adaptations of
reproductive strategies to hydrologic variability have
received less attention (Craven et al. 2010, Carlisle et al.
2011). Serial spawners (e.g., Cyprinella spp.) have
multiple spawning bouts within a season (Balon 1975).
As would be expected, serial spawners were positively
correlated with daily flow variation, short-duration high
flows, and rapid rise/fall rates. In contrast, brood hiders
were negatively correlated to daily flow variation and
short-duration high flows but positively correlated with
annual runoff. As the name suggests, brood hiders, such
as brook trout (Salvelinus fontinalis), deposit eggs within
the substrate but do not guard nests (Balon 1975); thus,
these species prefer stable and predictable systems that
prevent red dewatering or destruction. Although many
reproductive traits mirror their respective tri-life history
groups (e.g., serial spawners and opportunistic species),
nest guarders do not mirror the equilibrium strategies in
relation to flow. Given that nest-guarding fishes are
representative of higher parental care, we presumed that
nest guarders would be affiliated with stable environ-
ments similar to equilibrium strategists. However,
opposite to equilibrium species, nest-guarding fishes
were affiliated with unstable environments, i.e., posi-
tively correlated to short-duration high flows and daily
flow variation. Nest-guarding behavior may be advan-
tageous in unpredictable environments, since optimal
nest habitat can be selected in areas protected from
flashy high flows. We observed that many nest-guarding
fishes display a bet-hedging strategy (Cole 1954, Olden
and Kennard 2010) along the life history axis between
the equilibrium and opportunistic endpoints. Olden and
Kennard (2010) suggested Australian fishes character-
ized bet-hedging strategies by occupying a life history
space along the axis connecting the opportunistic and
periodic endpoints. When conditions are extremely
harsh and recruitment completely fails, fish possess
traits for rapid recolonization and reproduction (Olden
and Kennard 2010). In contrast, nest-guarding fish in
the United States, such as redear sunfish (Lepomis
auritus), readily take advantage of suitable hydrologic
conditions for nest construction but also may have
multiple spawning bouts if nests are destroyed (Lukas
and Orth 1993). Traits representing the timing of
spawning (e.g., winter spawners) were correlated to
many hydrologic variables that reflected high or low
seasonal magnitudes. For instance, summer spawners
were positively correlated to the number of zero-flow
days and low-flow frequencies, whereas spring spawners
were negatively associated with higher spring flows but
positively associated with higher winter flows. Bearers,
open substrate spawners, and substrate choosers were
poorly correlated with hydrologic variables; however,
substrate choosers did show negative correlations with
short-duration high flows, daily flow variation, and rise/
fall rates.
Distinguishing the role of hydrology from other variables
Many complications arise in attempting to tease apart
individual variable importance in structuring fish
FIG. 6. Geographical variation in predicted positive (whitedots) and negative (black dots) percentage of change in theproportion of life history strategies across physiographicprovinces in the United States following dam regulation.
RYAN A. MCMANAMAY AND EMMANUEL A. FRIMPONG256 Ecological ApplicationsVol. 25, No. 1
assemblages because of issues related to scale, hierarchy,
and interactions among abiotic factors (Jackson et al.
2001). This is especially true for hydrology, because it
operates at multiple spatial and temporal scales (Olden
et al. 2012), and its interaction with other variables in
shaping fish community composition also depends upon
scale (Marsh-Mathews and Mathews 2000). This was
evident by the strong correlations between hydrologic
and landscape variables and the considerable amount of
variation comprised by their combined effects. Depend-
ing on the analysis, the variance explained by hydrology
alone was significant and comparable to that of
landscape variables. While this obviously suggests that
hydrology plays a role in shaping the composition of fish
communities, the perceived overlap among variables is
the result of a mechanistic or hierarchical association. At
the continental scale, landscape variables control vari-
ation in hydrology (Carlisle et al. 2010), which then exert
selective pressures on fish assemblages. As an example,
underlying bedrock lithology determines the physio-
chemical characteristics of water bodies while also
influencing hydrology (Lindsey et al. 2009). Likewise,
areas of similar climatic, topographic, and geomorphic
types have been used to stratify hydrologic regime types
FIG. 7. Predicted positive (white) and negative (black) shifts in trait frequencies following dam regulation according to (A)physiographic provinces and (B) dam purposes. Responses represent average response values for each class divided by standarddeviation and were predicted using the hydrologic-variable model for all fish. Mts stands for mountains. See Fig. 4 for definition ofother abbreviations.
January 2015 257HYDROLOGIC FILTERING OF FISH TRAITS
(Morris et al. 2009, Knight et al. 2012) and hydrology–
stream morphology relationships (Johnson and Fecko
2008). However, there are likely other nonhydrologic
variables that serve as mediator variables between
landscape controls and fish assemblages. For example,
topography and geology exert controls on aquatic
habitat structure, such as gradient, riffle-pool sequences,
and substrate structure (Jackson et al. 2001), whereas
ecosystem productivity (i.e., net carbon production), a
function of climate and geology, has been shown to be
positively related with fish diversity (Guegan et al. 1998)
and negatively related to the proportion of equilibrium
species (Olden and Kennard 2010).
The perceived importance of hydrology in structuring
fish assemblages also depends on the spatial and
temporal scale chosen by the investigator (Jackson et
al. 2001). The hydroclimatic context may filter which
regional species are found in the local species pool;
however, individual streams may also have their own
unique hydrologic signature within the surrounding
hydroclimatic context (McManamay et al. 2012b).
Marsh-Mathews and Mathews (2000) concluded that
broad geographic variables, as opposed to localized
habitat variables (such as flow variation), plays a large
role in structuring fish assemblage composition in the
midwestern United States. However, latitude is a robust
predictor of major hydrologic types (McManamay et al.
2012b, 2014); thus, the documented importance of
environmental factors, including hydrology, is largely
an artifact of how they are classified and measured.
While the persistence of species within a stream system
or basin may be dependent upon hydrologic patterns
over years or decades, respectively (Jackson et al. 2001,
Herbert and Gelwick 2003, Olden and Kennard 2010),
changes in hydrology over the course of hours may
influence fish behavior (Schwartz and Herricks 2005,
Thompson et al. 2011), whereas hydrologic variation
over days and months influence growth (Peterson and
Jennings 2007). Thus, when suggesting the relative
importance of hydrology compared to other variables,
transparency is needed in how hydrology factors are
calculated and summarized.
Implications of stream flow alteration on fish assemblages
After applying predictive models to dam regulated
hydrology, we observed consistent, albeit small, predict-
ed shifts in life history traits. In agreement with the
existing literature (Winemiller 2005, Mims and Olden
2012, 2013), increases in the proportion of equilibrium
strategists followed hydrologic changes induced by dam
regulation. Consistent decreases in daily variation in
flow and increases in low flows and baseflows suggests
more stable environments, which are favorable to the
equilibrium strategy (Winemiller and Rose 1992). In
contrast, net decreases in periodic and opportunistic
strategies, although variable, were also predicted based
on our model. In accordance with our findings, Mims
and Olden (2013) found higher proportions of equilib-
rium species and lower proportions of opportunistic
species below dams compared to unregulated nearby
locations. In contrast to our study, periodic species
showed no difference between regulated or unregulated
systems (Mims and Olden 2013).
Reproductive strategies also responded predictably to
dam regulation; however, responses were more variable
than life history groups and only significant in hydro-
logic variable models. Increases in the stability of harsh
environments were predicted to decrease serial spawn-
ers, nest guarders, and summer spawners. Conversely,
increases in brood hiders and substrate choosers were
FIG. 8. Regional distinctness in hydrology, reproductive strategies, and life history groups for pre- and post-dam-regulationscenarios as measured by ANOSIM R statistics. Regional distinctness was measured using rank dissimilarities in hydrology andpredicted trait-responses among physiographic provinces (Prov), hydrologic classes (HC), and ecoregions (EC).
RYAN A. MCMANAMAY AND EMMANUEL A. FRIMPONG258 Ecological ApplicationsVol. 25, No. 1

predicted due to the same reasons. Predicted increases in
winter and fall spawners were unexpected given little
correlation between these traits and monthly flows.
However, increases in these traits were likely due to
decreases in high flows and decreased high-flow fre-
quencies as opposed to changes in monthly flows. In
general, dam regulation tends to stabilize seasonal
variation by moderating extremities, either through
decreasing peak flows (Fitzguh and Vogel 2011) and/or
increasing low flows (Poff et al. 2007). Given the
seasonal stabilization, predicted increases in spawning
season length make intuitive sense.
Trade-offs among the expression of various traits (i.e.,
tactics) produce suites of common life history strategies,
some of which are favored under various environmental
conditions (Southwood 1988). Adaptive strategies of fish
assemblages, measured as trait-frequencies, are an
artifact of selective pressures imposed by continental-
wide gradients in hydrologic conditions (Schlosser 1987,
1990, Jackson and Harvey 1989, Tonn 1990). Thus, if
natural hydrologic variation operates at multiple scales
to filter the regional species pool and hence, shape fish
assemblage composition (Jackson et al. 2001), then
widespread modifications to natural hydrology also
impose an environmental filter by exerting a different
suite of selective pressures, in which endemic fish are
maladapted. Dam regulation alters the existing hydro-
logic filter by removing the hydrologic uniqueness of
regionally distinct stream flows (Poff et al. 2007) and
selecting for life history strategies adapted to take
advantage of more stable and predictable environments
(Olden et al. 2006, Mims and Olden 2012). Similar to
Poff et al. (2007), we observed consistent losses in the
regional distinctness of hydrologic patterns, suggesting a
homogenization of hydrology. Based solely on hydro-
logic changes, regional dissimilarities in reproductive
strategies and life history groups were predicted to
decrease following dam regulation. However, these
predictions were observed with the all-variable model,
which suggests that the relative role of nonhydrologic
variables may be important in determining the full
ecological effects of hydrologic disturbance.
Although some generalities in hydrologic and ecolog-
ical responses to dam regulation can be inferred,
predicted shifts in life histories and reproductive
strategies were highly variable, even within similar
geographical locations (Figs. 6, 7). Hydrology displays
consistent responses to disturbance within regions (Poff
et al. 2007) or hydrologic classes (McManamay et al.
2012a); thus, it follows that ecological responses to
altered hydrology could also be organized by a similar
framework (Poff et al. 2010). Our results suggest that
hydrologic classes and provinces may provide a geo-
graphical context, whereas dam purpose may provide an
operational context to evaluate trait responses to dam
regulation. However, considerable unexplained varia-
tion in trait responses across classes suggests that
ecological responses to dam regulation is complex and
will likely require intensive model building to quantify.
Furthermore, simplified frameworks will be insufficient
for evaluating ecological responses to multifaceted
disturbances if used in isolation.
Limitations of our approach
Using large-scale hydrology-trait models to predict
ecological responses to hydrologic alteration does not
come without limitations. In order to understand how
hydrology shapes the trait characteristics of local species
pools, we summarized hydrologic variables and trait
frequencies within HUC8 watersheds as opposed to
using local stream network data. Similar to Smith and
Powell (1971) and Jackson et al. (2001), we view the
local species pool (i.e., within a basin) as an artifact of
climatic filtering of the regional species pool, where
regional species pools are a product of coarser
geographic filtering. Local communities (as opposed to
local species pool) are not only shaped by the
surrounding geographic and hydroclimatic context, but
also a multitude of other abiotic or biotic factors
operating at the local scale (Jackson et al. 2001). In
addition, using local analyses to infer continental
patterns can be problematic because sampled sites may
not be representative of the entire fish species pool.
However, for the above reasons, we urge caution in
relying on coarse models to predict the ecological effects
of hydrologic alteration at a given location. Our models
predict shifts in trait frequencies, or niche space, as
opposed to predicting species presence or absence in
local communities. Because predicting extinction and
colonization require analyses at the local community
level, an appropriate interpretation is to view shifts in
trait frequencies as changes in selection pressures. While
dams may vary in their individual hydrologic signatures,
the hydrologic effects of dams may be consistent within
a geographic region (Poff et al. 2007, McManamay et al.
2012a) and lead to continental-wide changes in trait
frequencies. Thus, the models we present may be used to
infer shifts in niche space within and among regions, but
not specific locations.
Another dispute that may arise with our approach is
using gage data from dentric stream networks to
summarize hydrologic variation within hydrologic units.
However, using local stream gage data to infer larger
scale patterns in hydroclimatic variation is a common
approach in environmental flow management (Poff et al.
2010), including summarizing discharge information
from stream gages into runoff estimates for HUC8
hydrologic units (available online)6 and creating hydro-
logic classifications, i.e., grouping streams by similarities
in stream flow (Haines et al. 1988, Burn and Arnell 1993,
Poff 1996). In addition, all magnitude-related variables
were standardized to account for differences in river size;
thus, summaries of hydrologic variation within hydro-
6 http://waterwatch.usgs.gov/index.php?id¼romap3
January 2015 259HYDROLOGIC FILTERING OF FISH TRAITS
logic units should not be influenced by differences in
flow magnitudes.
One limitation of using existing patterns in endemic
trait frequencies to predict the ecological consequences
of hydrologic alteration is that this approach does not
explicitly account for extinction and colonization
dynamics by endemic and invasive species, respectively.
Predicting trait-frequency responses strictly on the basis
of hydrologic change can isolate the effect of hydrology
independent of other factors that accompany dam
regulation, such as temperature alteration (Olden and
Naiman 2010), losses to habitat heterogeneity (Moyle
and Mount 2007), and stocking (Mims and Olden 2012).
However, the true composition of hydrologically altered
fish communities is an artifact of all of the above, as well
as extinction of fishes maladapted to the new conditions
or outcompeted by new colonists (Olden et al. 2006) and
successful invasions by nonnative species (Fausch et al.
2001, Olden et al. 2006).
Within our modeling approach, the same temporal
scale used to develop natural hydrology-trait relation-
ships was also applied to predict trait responses to dam
regulation. However, there may be a disconnection
between the temporal and spatial scales in which natural
and altered hydrology operate to influence fish assem-
blages. While species pools are an artifact of long-term
climatic filtering through natural selection (Tonn 1990),
disturbances, such as urbanization and hydropower
peaking, cause abrupt, unnatural hydrologic changes
over short temporal scales and induce conditions in
which natural fish communities are maladapted. For
example, many studies have assessed the impacts of
subdaily flow variation from hydropower peaking on
fish assemblages (for a review, see Cushman [1985]; also
see Lauters et al. [1996], Bradford [1997], Saltviet et al.
[2001]); however, very few studies have evaluated
relationships between fish and natural subdaily flow
variation (David and Closs 2002, Schwartz and Herricks
2005, Thompson et al. 2011). Thus, predicting the full
ecological consequences of these types of disturbance
may not be feasible using only natural hydrology-trait
relationships.
CONCLUSIONS
Ultimately, the relatively high predictive capacity of
hydrologic models in explaining variation in fish trait
frequencies suggests that hydrology does play a role in
shaping fish communities at the continental scale
through selective pressures. However, isolating the role
of hydrology is complicated by multiple interrelation-
ships with other geographic variables and those rela-
tionships change with scale. To avoid inconsistency in
documented results, we suggest that the spatial and
temporal scales used to isolate ecological responses to
altered hydrology should be placed within the same
spatiotemporal context of natural hydrology-trait rela-
tionships as to have a proper understanding of the role
of hydrology relative to scale. Much of the current
scientific understanding of the importance of hydrology
to river communities is based upon ecological responses
to hydrologic alteration (i.e., disturbed ecosystems; Poff
et al. 2010, Poff and Zimmerman 2010). However,
predicting ecological responses to future disturbances,
such as climate change, proves difficult when relying on
empirical relationships. While examples of ecological
consequences to drastic hydrologic alterations are more
abundant (Poff et al. 2010), little empirical evidence is
available for assessing ecological responses to small to
moderate hydrologic changes (Harvey et al. 2014). Thus,
understanding how natural hydrology structures biotic
communities in river systems provides a framework to
make future projections under a range of hydrologic
alteration scenarios.
Despite the coarse spatial resolution of our models,
we observed predicted shifts in fish life history strategies
and reproductive strategies post-dam-regulation that
were in accordance with the existing theories of fish
adaptive strategies to environmental conditions. Our
results also suggest that losses in regionally distinct
hydrologic regimes may lead to a homogenization of fish
life histories and reproductive strategies due to dam
regulation. Utilizing trait frequencies provides a theo-
retical framework for creating and testing new hypoth-
eses regarding the role of hydrology in shaping fish
communities. Because ecological responses to hydrolog-
ic alterations are likely to be highly heterogenous, we
suggest that models with the explicit purpose of isolating
hydrologic controls on ecological phenomena should
account for geographic context and interacting abiotic
and biotic confounding factors depending upon the scale
of application. In addition, more local-level analyses
that consider the multidimensional nature of hydrologic
disturbances, such as water quality, are needed for
making more accurate localized predictions. Further-
more, field studies are essential to validate hydrology–
ecology model predictions.
ACKNOWLEDGMENTS
This research was sponsored by the United States Depart-ment of Energy’s (DOE) Office of Energy Efficiency andRenewable Energy, Wind and Water Power TechnologiesProgram. This paper has been authored by an employee ofOak Ridge National Laboratory, managed by UT-Battelle,LLC, under contract DE-AC05-00OR22725þ with the U.S.Department of Energy. Accordingly, the United States Gov-ernment retains and the publisher, by accepting the article forpublication, acknowledges that the United States Governmentretains a nonexclusive, paid-up, irrevocable, worldwide licenseto publish or reproduce the published form of the manuscript,or allow others to do so, for United States Governmentpurposes. We thank two anonymous reviewers for providingcomments that improved the manuscript.
LITERATURE CITED
Balon, E. K. 1975. Reproductive guilds in fishes: a proposal anddefinition. Journal of the Fisheries Research Board ofCanada 32:821–864.
Blank, A., P. A. Tedesco, and N. Lamouroux. 2007.Relationships between life-history strategies of European
RYAN A. MCMANAMAY AND EMMANUEL A. FRIMPONG260 Ecological ApplicationsVol. 25, No. 1
freshwater fish species and their habitat preferences. Fresh-water Biology 52:843–859.
Bradford, M. J. 1997. An experimental study of stranding ofjuvenile salmonids on gravel bars and in side channels duringrapid flow decreases. Regulated Rivers: Research andManagement 13:395–401.
Bunn, S. E., and A. H. Arthington. 2002. Basic principles andecological consequences of altered flow regimes for aquaticbiodiversity. Environmental Management 30:492–507.
Burn, D. H., and N. W. Arnell. 1993. Synchronicity in globalflood responses. Journal of Hydrology 144:381–404.
Carlisle, D. M., J. Falcone, D. M. Wolock, M. R. Meador, andR. H. Norris. 2010. Predicting the natural flow regime:models for assessing hydrological alteration in streams.Rivers Research and Applications 26:118–136.
Carlisle, D. M., D. M. Wolock, and M. R. Meador. 2011.Alteration of streamflow magnitudes and potential ecologicalconsequences: a multiregional assessment. Frontiers inEcology and the Environment 9:264–270.
Cole, L. 1954. The population consequences of life historyphenomena. Quarterly Review in Biology 29:103–137.
Craven, S. W., J. T. Peterson, M. C. Freeman, T. J. Kwak, andE. Irwin. 2010. Modeling the relations between flow regimecomponents, species traits, and spawning success of fish inwarmwater streams. Environmental Management 46:181–194.
Cushman, R. M. 1985. Review of ecological effects of rapidlyvarying flows downstream from hydroelectric facilities.North American Journal of Fisheries Management 5:330–339.
Cutler, D. R., T. C. Edwards, K. H. Beard, A. Cutler, K. T.Hess, J. Gibson, and J. J. Lawler. 2007. Random forests forclassification in ecology. Ecology 88:2783–2792.
David, B. O., and G. P. Closs. 2002. Behavior of a stream-dwelling fish before, during, and after high-discharge events.Transactions of the American Fisheries Society 131:762–771.
Diniz-Filho, J. A. F., C. E. R. de Sant’Ana, and L. M. Bini.1998. An eigenvector method for estimating phylogeneticinertia. Evolution 52:1247–1262.
Falcone, J. A., D. M. Carlisle, and L. C. Weber. 2010a.Quantifying human disturbance in watersheds: variableselection and performance of a GIS-based disturbance indexfor predicting the biological condition of perennial streams.Ecological Indicators 10:264–273.
Falcone, J. A., D. M. Carlisle, D. M. Wolock, and M. R.Meador. 2010b. GAGES: a stream gage database forevaluating natural and altered flow conditions in theconterminous United States. Ecology 91:621.
Fausch, K. D., Y. Taniguchi, S. Nakano, G. D. Grossman, andC. R. Townsend. 2001. Flood disturbance regimes influencerainbow trout invasion success among five Holarctic regions.Ecological Applications 11:1438–1455.
Felsenstein, J. 1985. Phylogenies and the comparative method.American Midland Naturalist 125:1–15.
Fenneman, N. M., and D. W. Johnson. 1946. Physiographicdivisions of the conterminous US. Scale 1:7,000,000. U.S.Geological Survey Special Map Series, Reston, Virginia,USA.
Fitzhugh, T. W., and R. M. Vogel. 2011. The impact of damson flood flows in the United States. River Research andApplications 27:1192–1215.
Freeman, M. C., and G. D. Grossman. 1993. Effects of habitatavailability on dispersion of a stream cyprinid. Environmen-tal Biology of Fishes 37:121–130.
Frimpong, E. A., and P. L. Angermeier. 2009. FishTraits: adatabase of ecological and life-history traits of freshwaterfishes of the United States. Fisheries 34:487–495.
Frimpong, E. A., and P. L. Angermeier. 2010a. Comparativeutility of selected frameworks for regionalizing fish-basedbioassessments across the United States. Transactions of theAmerican Fisheries Society 139:1872–1895.
Frimpong, E. A., and P. L. Angermeier. 2010b. Trait basedapproaches in the analysis of stream fish communities. Pages109–136 in K. B. Gido and D. A. Jackson, editors.Community ecology of stream fishes: concepts, approaches,and techniques. American Fisheries Society, Symposium 73,Bethesda, Maryland, USA.
Froese, R., and D. Pauly. 2013. FishBase. www.fishbase.orgGoldstein, R. M., and M. R. Meador. 2004. Comparisons of
fish species traits from small streams to large rivers.Transactions of the American Fisheries Society 133:971–983.
Grabowski, T. B., and J. J. Isely. 2007. Effects of flowfluctuations on the spawning habitat of a riverine fish.Southeastern Naturalist 6:471–478.
Growns, I. 2004. A numerical classification of reproductiveguilds of freshwater fishes of south-eastern Australia andtheir application to river management. Fisheries Manage-ment and Ecology 11:369–377.
Guegan, J. F., S. Lek, and T. Oberdorff. 1998. Energyavailability and habitat heterogeneity predict global riverinefish diversity. Nature 391:382–384.
Haines, A. T., B. L. Findlayson, and T. A. McMahon. 1988. Aglobal classification of river regimes. Applied Geography8:255–272.
Harvey, B. C., J. L. White, R. J. Nakamoto, and S. F.Railsback. 2014. Effects of streamflow diversion on a fishpopulation: combining empirical data and individual-basedmodels in a site-specific evaluation. North American Journalof Fisheries Management 34:247–257.
Hastings, D. A., et al. 1999. The global land one-kilometer baseelevation (GLOBE) digital elevation model, Version 1.0.National Oceanic and Atmospheric Administration, Nation-al Geophysical Data Center, Washington, D.C., USA. http://www.ngdc.noaa.gov/mgg/topo/globe.html
Henriksen, J. A., J. Heasley, J. G. Kennen, and S. Nieswand.2006. Users’ manual for the hydroecological integrityassessment process software (including the New Jerseyassessment tools). U.S. Geological Survey Report 2006-1093. U.S. Geological Survey, Reston, Virginia, USA.
Herbert, M. E., and F. P. Gelwick. 2003. Spatial variation ofheadwater fish assemblages explained by hydrologic variabil-ity and upstream effects of impoundment. Copeia 2003:273–284.
Imhoff, M. L., L. Bounoua, T. Ricketts, C. Loucks, R. Harriss,and W. T. Lawrence. 2004. Global patterns in net primaryproductivity. http://sedac.ciesin.columbia.edu/es/hanpp.html
Jackson, D. A. 1993. Stopping rules in principal components-analysis—a comparison of heuristic and statistical approach-es. Ecology 74:2204–2214.
Jackson, D. A., and H. H. Harvey. 1989. Biogeographicassociations in fish assemblages: local vs. regional processes.Ecology 70:1472–1484.
Jackson, D. A., P. R. Peres-Neto, and J. D. Olden. 2001. Whatcontrols who is where in freshwater fish communities—theroles of biotic, abiotic and spatial factors. Canadian Journalof Fisheries and Aquatic Sciences 58:157–170.
Johnson, P. A., and B. J. Fecko. 2008. Regional channelgeometry equations: a statistical comparison for physio-graphic provinces in the Eastern US. River Research andApplications 24:823–834.
Kennard, M. J., S. J. Mackay, B. J. Pusey, J. D. Olden, and N.Marsh. 2010. Quantifying uncertainty in estimation ofhydrologic metrics for ecohydrological studies. River Re-search and Applications 26:137–156.
King, J. M., J. A. Cambray, and D. N. Impson. 1998. Linkedeffects of dam-released floods and water temperature onspawning of the Clanwilliam yellowfish Barbus capensis.Hydrobiologia 384:245–265.
Knight, R. R., W. S. Gain, and W. J. Wolfe. 2012. Modelingecological flow regime: an example from the Tennessee andCumberland River basins. Ecohydrology 5:613–627.
January 2015 261HYDROLOGIC FILTERING OF FISH TRAITS

Knight, R. R., M. B. Gregory, and A. K. Wales. 2008. Relatingstreamflow characteristics to specialized insectivores in theTennessee River Valley: a regional approach. Ecohydrology1:394–407.
Lauters, F., P. Lavandier, P. Lim, C. Sabaton, and A. Belaud.1996. Influence of hydropeaking on invertebrates and theirrelationship with fish feeding habitats in a Pyrenean River.Regulated Rivers: Research and Management 12:563–573.
Leitman, H. M., M. R. Darst, and J. J. Nordhaus. 1991. Fishesin the forested floodplain of the Ochlockonee River, Florida,during flood and drought conditions. Report 90-4204. U.S.Geological Survey Water-Resources Investigations, Talla-hassee, Florida, USA.
Light, H. M., M. R. Darst, and J. W. Grubbs. 1998. Aquatichabitats in relation to river flow in the Apalachicola Riverfloodplain, Florida. U.S. Geological Survey ProfessionalPaper 1594. U.S. Geological Survey, Reston, Virginia, USA.
Lindsey, B. D., M. P. Berndt, B. G. Katz, A. F. Ardis, andK. A. Skach. 2009. Factors affecting water quality in selectedcarbonate aquifers in the United States, 1993–2005. U.S.Geological Survey Scientific Investigations Report 2008-5240. U.S. Geological Survey, Reston, Virginia, USA.
Lukas, J. A., and D. J. Orth. 1993. Reproductive ecology ofredbreast sunfish Lepomis auritus in a Virginia stream.Journal of Freshwater Ecology 8:235–244.
Marsh-Mathews, E., and W. J. Mathews. 2000. Geographic,terrestrial and aquatic factors: which most influence thestructure of stream fish assemblages in the midwesternUnited States? Ecology of Freshwater Fish 9:9–21.
McCune, B., and J. Grace. 2002. Analysis of ecologicalcommunities. MjM Software, Gleneden Beach, Oregon,USA.
McManamay, R. A., M. S. Bevelhimer, and S. Kao. 2014.Updating the US hydrologic classification: an approach toclustering and stratifying ecohydrologic data. Ecohydrology7:903–926.
McManamay, R. A., D. J. Orth, and C. A. Dolloff. 2012a.Revisiting the homogenization of dammed rivers in thesoutheastern US. Journal of Hydrology 424–425:217–237.
McManamay, R. A., D. J. Orth, C. A. Dolloff, and E. A.Frimpong. 2012b. A regional classification of unregulatedstreamflows: spatial resolution and hierarchical frameworks.River Research and Applications 28:1019–1033.
McManamay, R. A., D. J. Orth, J. Kauffman, and M. D.Davis. 2013. A database and meta-analysis of ecologicalresponses to flow in the South Atlantic Region. SoutheasternNaturalist 12(Monograph 5):1–36.
Mims, M. C., and J. D. Olden. 2012. Life history theorypredicts fish assemblage response to hydrologic regimes.Ecology 93:35–45.
Mims, M. C., and J. D. Olden. 2013. Fish assemblages respondto altered flow regimes via ecological filtering of life historystrategies. Freshwater Biology 58:50–62.
Mims, M. C., J. D. Olden, Z. R. Shattuck, and N. L. Poff. 2010.Life history trait diversity of native freshwater fishes in NorthAmerica. Ecology of Freshwater Fish 19:390–400.
Morris, A. J., J. J. Donovan, and M. Strager. 2009. Geospatialanalysis of climatic and geomorphic interactions influencingstream discharge, Appalachian Mountains, USA. Environ-mental Modelling and Assessment 14:73–84.
Moyle, P. B., and J. F. Mount. 2007. Homogenous rivers,homogenous faunas. Proceedings of the National Academyof Sciences USA 104:5711–5712.
MRLC (Multi-Resolution Land Characteristics Consortium).2013. National land cover database. http://www.mrlc.gov/
NatureServe. 2004. Downloadable animal datasets. Nature-Serve Central Databases. www.natureserve.org/getData/dataSets/watershedHucs/index.jsp
Nelson, J. S. 2006. Fishes of the world. Fourth edition. Wiley,New York, New York, USA.
Nesler, T. P., R. T. Muth, and A. F. Wasowicz. 1988. Evidencefor baseline flow spikes as spawning cues for Coloradosquawfish in the Yampa River, Colorado. Transactions ofthe American Fisheries Society Symposium 5:6:8–79.
Oksanen, J., F. G. Blanchet, R. Kindt, P. Legendre, P. R.Minchin, R. B. O’Hara, G. L. Simpson, P. Solymos,M. H. H. Stevens, and H. Wagner. 2013. vegan: communityecology package. http://cran.r-project.org/web/packages/vegan/index.html
Olden, J. D., and M. J. Kennard MJ. 2010. Intercontinentalcomparison of fish life history strategies along a gradient ofhydrologic variability. Pages 109–136 in K. B. Gido andD. A. Jackson, editors. Community ecology of stream fishes:concepts, approaches, and techniques. American FisheriesSociety Symposium 73, Bethesda, Maryland, USA.
Olden, J. D., M. J. Kennard, and B. J. Pusey. 2012. Aframework for hydrologic classification with a review ofmethodologies and applications in ecohydrology. Ecohydrol-ogy 5:503–518.
Olden, J. D., and R. J. Naiman. 2010. Incorporating thermalregimes into environmental flows assessments: modifyingdam operations to restore freshwater ecosystem integrity.Freshwater Biology 55:86–107.
Olden, J. D., and N. L. Poff. 2003. Redundancy and the choiceof hydrologic indices for characterizing streamflow regimes.River Research and Applications 19:101–121.
Olden, J. D., N. L. Poff, and K. R. Bestgen. 2006. Life-historystrategies predict fish invasions and extirpations in theColorado River Basin. Ecological Monographs 76:25–40.
Page, L. M., and B. M. Burr. 1991. A field guide to freshwaterfishes of North America north of Mexico. Houghton MifflinCompany, Boston, Massachusetts, USA.
Peterson, R. C., and C. A. Jennings. 2007. Effects of riverdischarge on abundance and instantaneous growth of age-0carpsuckers in the Oconee River, Georgia, USA. RiverResearch and Applications 23:1016–1025.
Poff, N. L. 1996. A hydrogeography of unregulated streams inthe United States and an examination of scale-dependence insome hydrological descriptors. Freshwater Biology 36:71–91.
Poff, N. L. 1997. Landscape filters and species traits: towardsmechanistic understanding and in stream ecology. Journal ofthe North American Benthological Society 16:391–409.
Poff, N. L., and J. D. Allan. 1995. Functional organization ofstream fish assemblages in relation to hydrological variabil-ity. Ecology 76:606–627.
Poff, N. L., J. D. Allan, M. B. Bain, J. R. Karr, K. L.Prestegaard, B. D. Richter, R. E. Sparks, and J. C.Stromberg. 1997. The natural flow regime: a paradigm forriver conservation and restoration. BioScience 47:769–784.
Poff, N. L., and D. D. Hart. 2002. Dams vary and why itmatters. BioScience 52:659–668.
Poff, N. L., J. D. Olden, D. M. Merritt, and D. M. Pepin. 2007.Homogenization of regional river dynamics by dams andglobal biodiversity implications. Proceedings of the NationalAcademy of Sciences USA 104:5732–5737.
Poff, N. L., et al. 2010. The ecological limits of hydrologicalteration (ELOHA): a new framework for developingregional environmental flow standards. Freshwater Biology55:147–170.
Poff, N. L., and J. Z. H. Zimmerman. 2010. Ecologicalresponses to altered flow regimes: a literature review toinform the science and management of environmental flows.Freshwater Biology 55:194–205.
PRISM (PRISM Climate Group). 2013. PRISM climate data.Northwest Alliance for Computational Science and Engi-neering (NACSE). Oregon State University, Corvallis,Oregon, USA. http://www.prism.oregonstate.edu/
Pyron, M., and T. E. Lauer. 2004. Hydrologic variation andfish assemblage structure in the middle Wabash River.Hydrobiologia 525:203–213.
RYAN A. MCMANAMAY AND EMMANUEL A. FRIMPONG262 Ecological ApplicationsVol. 25, No. 1
Richter, B. D., J. V. Baumgartner, J. Powell, and D. P. Braun.1996. A method for assessing hydrologic alteration withinecosystems. Conservation Biology 10:1163–1174.
Richter, B. D., J. V. Baumgartner, R. Wigington, and D. P.Braun. 1997. How much water does a river need? FreshwaterBiology 37:231–249.
Schlosser, I. J. 1987. The role of predation in age- and size-related habitat use by stream fishes. Ecology 68:651–659.
Schlosser, I. J. 1990. Ecological variation, life history attributes,and community structure in stream fishes: implications forenvironmental management and assessment. EnvironmentalManagement 14:621–628.
Schwartz, J. S., and E. E. Herricks. 2005. Fish use of stage-specific fluvial habitats as refuge patches during a flood in alow-gradient Illinois stream. Canadian Journal of Fisheriesand Aquatic Sciences 62:1540–1552.
Smith, C. L., and C. R. Powell. 1971. The summer fishcommunities of Brier Creek, Marshall County, Oklahoma.American Museum Novitates 2458:1–30.
Southwood, T. R. E. 1988. Tactics, strategies and templets.Oikos 52:3–18.
Stevens, M. H. H., and J. Oksanen. 2012. Permutationalmultivariate analysis of variance using distance matrices.Package vegan. http://cc.oulu.fi/;jarioksa/softhelp/vegan/html/adonis.html
Tedesco, P., B. Hugueny, T. Oberdorff, H. H. Durr, S.Merigoux, and B. de Merona. 2008. River hydrologicalseasonality influences life history strategies of tropicalriverine fishes. Oecologia 156:691–702.
Thompson, L. C., S. A. Cocherell, S. N. Chun, J. J. Cech, andA. P. Klimley. 2011. Longitudinal movement of fish inresponse to a single-day flow pulse. Environmental Biologyof Fish 90:253–261.
Tonn, W. M. 1990. Climate change and fish communities: aconceptual framework. Transactions of the American Fish-eries Society 119:337–352.
Trush, W. J., S. M. McBain, and L. B. Leopold. 2000.Attributes of an alluvial river and their relation to waterpolicy and management. Proceedings of the NationalAcademy of Sciences USA 97:11858–11863.
Vogl, A. L., and V. L. Lopes. 2009. Impacts of water resourcesdevelopment on flow regimes in the Brazos River. Environ-mental Monitoring and Assessment 157:331–345.
Winemiller, K. O. 2005. Life history strategies, populationregulation, and implications for fisheries management.Canadian Journal of Fisheries and Aquatic Sciences62:872–885.
Winemiller, K. O., and K. A. Rose. 1992. Patterns of life-history diversification in North American fishes: implicationfor population regulation. Canadian Journal of Fisheries andAquatic Sciences 49:2196–2218.
Wolock, D. M., T. C. Winter, and G. McMahon. 2004.Delineation and evaluation of hydrologic landscape regionsin the United States using geographic information systemtools and multivariate statistical analyses. EnvironmentalManagement 34:S71–S88.
SUPPLEMENTAL MATERIAL
Ecological Archives
Appendices A–D are available online: http://dx.doi.org/10.1890/14-0247.1.sm
Data Availability
Data associated with this paper have been deposited in Oak Ridge National Laboratory’s National Hydropower AssetAssessment Program: http://nhaap.ornl.gov/NHAAP-GIS-Data-and-Maps
January 2015 263HYDROLOGIC FILTERING OF FISH TRAITS
Copyright © 2022 FDOKUMEN