Influence of Wetlands on Streamflow in Illinois
57
Contract Report 561 Influence of Wetlands on Streamflow in Illinois by Misganaw Demissie and Abdul Khan Office of Sediment & Wetland Studies Prepared for the Illinois Department of Conservation October 1993 Illinois State Water Survey Hydrology Division Champaign, Illinois A Division of the Illinois Department of Energy and Natural Resources
Transcript of Influence of Wetlands on Streamflow in Illinois

Contract Report 561
Influence of Wetlands on Streamflow in Illinois
by Misganaw Demissie and Abdul Khan Office of Sediment & Wetland Studies
Prepared for the Illinois Department of Conservation
October 1993
Illinois State Water Survey Hydrology Division Champaign, Illinois
A Division of the Illinois Department of Energy and Natural Resources

INFLUENCE OF WETLANDS ON STREAMFLOW IN ILLINOIS
By Misganaw Demissie and Abdul Khan
Prepared for the Illinois Department of Conservation
Illinois State Water Survey 2204 Griffith Drive
Champaign, Illinois 61820-7495
August 1993

ISSN 0733-3927
This report was printed on recycled and recyclable papers.

CONTENTS Page
Acknowledgments ii
Tables iii
Figures iv
Abstract vi
Introduction 1
Data Analysis Methodology and Study Site Selection 5 Selection of Watersheds and Gaging Stations 5 Methods and Procedures 5
Flow Synthesis 5 Peakflow and Floodflow Volume 5 Low Flow 10
Evaluation Procedure 16 Testing Method 17
Results 20 Peakflow and Floodflow Volume 20
Statewide Analysis 20 Regional Analysis 20 Seasonal Analysis... 27
Seasonal-Regional 27 Fall 35 Winter 35 Spring 35 Summer 36
Low Flow 36 Statewide Analysis 36 Regional Analysis 40 Seasonal Analysis 40
Seasonal-Regional 40 Fall 40 Winter 40 Spring 43 Summer 43
Summary and Conclusions 44
References 46
i
Review of Literature............................................................................................................3

ACKNOWLEDGMENTS
This study was accomplished as part of the regular work of the Illinois State Water Survey. The research upon which this report is based was supported in part by funds provided by the Illinois Department of Conservation (IDOC). Marvin Hubbell, IDOC project manager, provided valuable guidance and coordination. Radwan Al-Weshah, graduate research assistant at the Water Survey, and Venkat Swaminathan and Charles Kemper, students at the University of Illinois, were helpful in processing the data and preparing many of the illustrations. Becky Howard typed the camera-ready copy of the report, Gail Taylor and Eva Kingston edited it, and Linda Hascall and David Cox prepared some of the illustrations.
ii

TABLES Page
1 Information on Streamflow Gaging Stations Used in the Study 6
2 Regression Analysis Results and Percent Change for Statewide Analysis 20
3 Regional Regression Coefficients and Percent Change Values for Peakflow and Floodflow Parameters 26
4 Influence of Wetlands on Peakflow as Measured by the Percent Change in the Ratio of Peakflow to Average Precipitation Ratio (Qp/Pa) for a One Percent Change in Wetland Area 33
5 Influence of Wetlands on Peakflow as Measured by the Percent Change in the Ratio of Peakflow to Peak Precipitation (Qp/Pa) for a One Percent Change in Wetland Area 33
6 Influence of Wetlands on Peakflow as Measured by the Percent Change in the Ratio of Peakflow to Total Precipitation (Qp/Pt) for a One Percent Change in Wetland Area 34
7 Influence of Wetlands on Floodflow Volume as Measured by the Percent Change in the Ratio of Floodflow Volume to Total Precipitation (V/Pt) for a One Percent Change in Wetland Area 34
8 Regional Variability of Influence of Wetlands on Low Flow in Illinois as Measured by the Percent Change in Q 9 5 and Q 9 9 39
9 Seasonal Variability of Influence of Wetlands on Low Flow in Illinois as Measured by the Percent Change in Q 9 5 and Q 9 9 39
10 Seasonal Variability of Influence of Wetlands on Low Flow by Region in Illinois as Measured by the Percent Change in Q 9 5 and Q 9 9 42
iii

FIGURES Page
1 Locations of selected drainage basins, streamgaging stations, and precipitation stations 7
2 Frequency distribution of drainage areas of selected watersheds 8
3 Frequency distribution of wetland percentages in selected watersheds 9
4 Frequency distribution of storm values of peakflow to average precipitation ratio for three selected stations 11
5 Frequency distribution of storm values of peakflow to peak precipitation ratio for three selected stations 12
6 Frequency distribution of storm values of peakflow to total precipitation ratio for three selected stations 13
7 Frequency distribution of storm values of floodflow volume to total precipitation ratio for three selected stations 14
8 Determination of flows at different exceedance probabilities 15
9 Percent change (PC) determination from regression parameters 18
10 Relation between peakflow to average precipitation ratio and percent wetland for Illinois 21
11 Relation between peakflow to peak precipitation ratio and percent wetland for Illinois . 22
12 Relation between peakflow to total precipitation ratio and percent wetland for Illinois 23
13 Relation between floodflow volume to total precipitation ratio and percent wetland for Illinois 24
14 Regional variation of the relations between peakflow and floodflow volume parameters and percent wetland 25
15 Seasonal variation of the relations between peakflow and floodflow volume parameters and percent wetland 28
iv

FIGURES (concluded) Page
16 Regional variation of the relations between peakflow and floodflow volume parameters and percent wetland for fall 29
17 Regional variation of the relations between peakflow and floodflow volume parameters and percent wetland for winter 30
18 Regional variation of the relations between peakflow and floodflow volume parameters and percent wetland for spring 31
19 Regional variation of the relations between peakflow and floodflow volume parameters and percent wetland for summer.... 32
20 Relation between low-flow parameter, Q9 5 , and percent wetland for Illinois 37
21 Relation between low-flow parameter, Q9 9 , and percent wetland for Illinois 38
22 Seasonal variation of the relation between parameters Q 9 5 and Q 9 9 and percent wetland low flow 41
v

ABSTRACT
One of the major functions of wetlands is to store water for gradual release to surface and ground-water bodies. It is generally assumed that wetlands reduce flooding, increase low flows, and serve as recharge areas for ground water. However, there have not been systematic studies to quantify the influence of wetlands on flooding and low flows. This research was initiated to investigate the hydrologic functions of wetlands in Illinois based on available streamflow records. The research was designed to answer the more general question, "how does the presence or absence of variable size wetlands in a watershed influence streamflow?"
Streamflow records from 30 gaging stations monitoring watersheds with variable wetland areas were analyzed to assess the influence of wetlands on streamflow. The main objective of the analysis was to determine if streamflow parameters of streams draining watersheds with varying percentage of wetland areas were related to the percentage of wetlands in the watersheds. The streamflow parameters analyzed included peakflow, floodflow volume, and low flow. From the results of this analysis, in general, it can be concluded that peakflow and floodflow volume decrease, and low flows increase with increasing percentage of wetlands in the watershed. The influence of wetlands was more noticeable on peakflow and low flow than on floodflow volume. For all the gaging stations analyzed, the peakflow to average precipitation ratio decreased on the average by 3.7 percent, floodflow volume to total precipitation ratio decreased by 1.4 percent, and low flow (represented by Q95) increased by 7.9 percent for an increase of one percent wetland area in a watershed. There were, however, significant regional and seasonal differences in the rate of change.
Regionally, wetland influence was more noticeable in central and northern Illinois than in southern Illinois for both peakflow and floodflow volume. The influence of wetlands on low flow was more noticeable in southern and northern Illinois than in central Illinois, however. The peakflow to average precipitation ratio decreased by 5.9 to 7.9 percent, while floodflow volume to total precipitation ratio decreased by 4.5 and 2.3 percent in central and northern Illinois, respectively. For low flow, Q 9 5 increased by 15.9 and 15.0 percent in southern and northern Illinois, respectively.
Seasonally, for the state as a whole, wetland influence was the most prominent in fall for the peakflow to average precipitation ratio (5.7 percent decrease) and in summer for the floodflow volume to total precipitation ratio (3.1 percent decrease). For low flow, the influence of wetlands was equally noticeable in fall (8.4 percent increase in Q95) and summer (8.0 percent increase in Q95).
vi

INFLUENCE OF WETLANDS ON STREAMFLOW IN ILLINOIS
by Misganaw Demissie and Abdul Khan Office of Sediment & Wetland Studies
Illinois State Water Survey Champaign, Illinois
INTRODUCTION
The objective of this project was to assess the influence of wetland acreage on streamflow by analyzing existing streamflow records in Illinois. Analysis of streamflow records for streams with various ratios of wetlands in their watersheds may provide information on how wetlands influence the hydrology of the watershed. If streams draining watersheds with different percentages of wetland area to total drainage area have different hydrologic responses, then general relationships can be developed between percentages of wetland and streamflow parameters. These relationships can then be used to evaluate wetland functions and impacts of land-use practices that affect wetland acreage.
There are four major mechanisms by which wetlands can influence streamflows: runoff generation, flow retardation due to increased flow resistance, flood storage, and low-flow augmentation. Runoff generation is linked to wetlands' soil moisture and land-cover conditions, important parameters that greatly influence how much runoff is generated from various rainfall events. For example, if an area is already saturated from antecedent rainfall, even small amounts of precipitation can produce large surface runoff. On the other hand, if an area is dry, large amounts of precipitation may produce little or no runoff as most of the precipitation infiltrates into the ground. An area with dense vegetation will intercept more incoming rainwater and have less surface runoff than an area with little or no vegetative cover. Delayed flow from an area with dense vegetation will be greater than from an area with less vegetative cover, however.
The presence of wetland vegetation in the watershed and along drainage channels will increase flow resistance over land and in the stream channels, resulting in slow delivery of runoff from upstream to the stream channel. When a flood event occurs along a stream in a watershed with wetlands along the streambanks, the streamflow increases and eventually overflows the banks. The water then has to flow through the adjoining wetlands, which significantly increases the resistance to flow. Since wetlands typically support a large amount of vegetation, the resistance to overbank flow is greater for a
1

stream adjoining a wetland than for a stream not adjoining a wetland. As a result, a significant difference will exist between the flow characteristics of a stream adjacent to a wetland and one not adjoining a wetland.
Another major influence that wetlands exert on streamflow is the flood storage capacity they provide. Since most wetlands are located in depressions and poorly drained areas, they provide significant storage potential. By storing runoff from adjoining areas, wetlands retard or reduce the amount of runoff that reaches stream channels. Therefore depending on initial conditions, wetland areas could significantly affect the streamflow.
The presence of wetlands in a watershed may also result in low-flow augmentation in streams. In wetland areas, water stored in surficial depressions and underground is gradually released to adjoining streams during periods of low flows. This generally results in higher low-flow conditions for streams that drain areas containing wetlands.
One of the parameters that can be used to characterize and distinguish watersheds containing different areas of wetlands is the ratio of wetland area to the total drainage area of the watershed. The major objective of this study, therefore, was to investigate streamflow records in Illinois and then relate various streamflow parameters to the percentage of wetlands in the watershed. Although it is generally accepted that wetlands reduce streamflow peaks and increase low flows, this generalized concept may not always be true. The hydrologic response of wetlands may vary depending on geographic location, storm intensity and duration, and season of the year. Because of significant regional and seasonal differences in Illinois, it is important to ascertain if the influence of wetlands varies between regions and by season. This research effort has attempted to address issues related to the regional and seasonal influence of wetlands on streamflow in Illinois. However, because of the small number of gaging stations in the different regions, the regional analysis needs to include more stations in the analysis.
2

REVIEW OF LITERATURE
The role of wetlands on streamflow has been the subject of considerable debate. Past studies have served only to highlight this debate and the differing conclusions. Irwin and Whiteley (1983), Bardecki (1987), and Brunner (1988) have reviewed results from previous studies related to the influence of wetlands on streamflow.
McCubbin (1938) concluded that drainage activity had no impact on the peakflow values of the Grand River or the Thames River in Ontario, Canada. O'Kelly (1955), while investigating the influence of artificial drainage on flood hydrographs, found that the peakflow increased substantially after drainage. Prior and Hess (1961) performed flood frequency analysis for Minnesota and decided that flood magnitude was reduced with increasing percentage of marshes in the watershed. They assumed that a percentage of lakes represented the percentage of marshes in the watershed.
In a series of studies, Haan and Johnson (1968), DeBoer and Johnson (1971), and Campbell and Johnson (1975) used the Iowa State Model to examine the influence of wetland drainage on streamflow by using storm hydrograph simulations. They concluded that drainage usually increased the runoff volume irrespective of the rainfall intensity and duration. For high-intensity, short-duration rainfall, the peakflow values remain unchanged even with improved drainage, while for low-intensity, long-duration events, peakflows in general increased with increased drainage. Moore and Larson (1979), using an improved version of the Iowa State Model, called the Minnesota Model, reached essentially similar conclusions.
Burke (1968), in an investigation of two watersheds, one drained and the other undrained, found that peakflow was lower in the drained watershed than in the undrained watershed. Kloet (1971), in a similar study, reached exactly the opposite conclusion. McGill and Bennet (1971) studied the effect of drainage on runoff using a synthetic hydrograph approach and concluded that drainage resulted in an insignificant reduction in peak discharge value.
Moklyak et al. (1972) investigated a drained and an undrained watershed, and concluded that drainage decreased both annual runoff and peakflow. Eggelsmann (1972) investigated two adjoining high water table peat watersheds, one undrained and the other drained by a tile drainage system. He found that while the runoff volumes from the two watersheds were similar, peakflows from the undrained peat basin were much greater (up to three times) after a rainfall event than those from the tile-drained watershed. Bailey and Bree (1980), in a study of 12 boggy watersheds, found that flood peaks were substantially increased as a result of drainage. Novitzki (1982) studied the influence of wetlands on
3

streamflow in Wisconsin and concluded that flood peaks may be as much as 80 percent lower in basins with much lake and wetland area. Eli and Rauch (1982), in a study of two wetland watersheds in northern West Virginia, concluded that wetlands had little effect on peakflows or low flows of the studied watersheds. Skaggs and Broadhead (1982) studied the impact of drainage on runoff volume and peakflow using the model DRAINMOD. They concluded that subsurface tile drainage decreased the runoff volume and peakflow values.
Ogawa and Male (1983) studied the role of wetlands on streamflow in Massachusetts and found that peakflow increased with decreasing wetland percentage in the watershed. Demissie et al. (1983) studied the upper Kankakee and Iroquois Rivers in Illinois and Indiana. Significant wetlands were present along the upper Kankakee River and absent along the Iroquois River. They found that a 50-year flood in the Iroquois River was almost twice as great as a 50-year flood in the upper Kankakee River for the same drainage area. On the other hand, the 7-day, 10-year low flow for the upper Kankakee River was more than ten times of that in the Iroquois River for the same drainage area.
It was mentioned previously that it is generally accepted that wetlands reduce streamflow peaks and increase low flows. This function of wetlands is attributed to their ability to store floodwater during storm events for release later. However, this generalized concept may not always be true as illuminated by the review of literature of work done by researchers in the past. Depending on the extent of the wetland, its geographic location, storm intensities and durations, and seasons of the year, the influence of wetlands on streamflow may vary greatly with the region as well as the specific wetland type. As a result, it is imperative that these factors be given careful consideration when investigating the influence of wetlands on streamflow.
4

DATA ANALYSIS METHODOLOGY AND STUDY SITE SELECTION
This section outlines the basis of selecting the watersheds and streamgaging stations for analysis. The methods and procedures used are also described.
Selection of Watersheds and Gaging Stations Before analyzing streamflow records, it was necessary to exclude streams and
watersheds that are significantly affected by known natural or man-made features. For example, streams greatly influenced by large rivers and lakes like the Mississippi and Ohio Rivers and Lake Michigan were excluded from analysis. All gaging stations located downstream of dams and major discharge points were also excluded. After considering these factors, 30 gaging stations were selected: 11 in southern Illinois, 8 in central Illinois, and 11 in northern Illinois. Table 1 lists the selected watersheds and the gaging stations, and figure 1 shows their locations. The drainage areas of the selected stations ranged from 7 to 1,282 square miles. The percentages of wetlands in these watersheds varied from a minimum of 0.2 percent to a maximum of 13.7 percent. The streamflow data for these watersheds were available for periods of at least ten years from 1979 to 1988. The frequency distributions of the watershed drainage areas and wetland percentages are provided in figures 2 and 3, respectively.
Methods and Procedures Flow Synthesis
The analysis was conducted for a ten-year period from 1979 to 1988. This period was selected to closely correspond to the wetland area data that were determined from the National Wetland Inventory conducted in the early 1980s. Daily flow values for the ten-year period were obtained for each of the gaging stations. Three streamflow parameters were selected for analysis: peakflow, floodflow volume, and low flow. Daily precipitation data from a station in the watershed for the same period were also obtained to normalize the streamflow.
Peakflow and Floodflow Volume. For peakflow and floodflow volume analyses, daily streamflow data for each year were examined and several flood events were selected. The peakflow values in cubic feet per second (cfs) were divided by drainage area and converted to inches per day. The corresponding volumes of the flood were also computed, and the seasons in which the floods occurred were identified. From the daily precipitation data, the average, peak, and total precipitation values associated with the selected flood events were determined. In order to remove the influence of the variability
5

Table 1. Information on Streamflow Gaging Stations Used in the Study
Streamflow ID Drainage area Wetland Period station number Stream name (sqmi) (percent) of record
03336645 1 Middle Fork Vermilion 428.00 1.34 1979-1988 03336900 2 Salt Fork River 131.10 0.22 1960-1988 03379500 3 Little Wabash 1118.90 1.06 1915-1988 03380500 4 Skillet Fork 457.83 4.04 1929-1988 03382100 5 South Fork Saline 145.10 9.29 1966-1988 03384450 6 Lusk Creek 42.40 0.47 1969-1988 05466500 7 Edwards River 440.30 1.08 1935-1988 05469000 8 . Henderson Creek 430.30 0.82 1935-1988 05495500 9 Bear Creek 345.20 1.87 1944-1988 05532000 10 Addison Creek 22.90 0.76 1952-1988 05534500 11 North Branch Chicago 19.50 4.41 1953-1988 05536000 12 North Branch Chicago 98.10 3.52 1951-1988 05536275 13 Thorn Creek 102.90 8.64 1947-1988 05539900 14 West Branch DuPage 27.90 6.06 1961-1988 05540095 15 West Branch DuPage 92.30 7.53 1969-1988 05550500 16 Poplar Creek 35.50 7.28 1952-1988 05551700 17 Blackberry Creek 69.60 4.19 1961-1988 05568800 18 Indian Creek 62.20 0.47 1960-1988 05570370 19 Big Creek 40.70 8.43 1972-1988 05570380 20 Slug Run 7.10 13.68 1975-1988 05570910 21 Sangamon 237.70 0.80 1979-1988 05585000 22 La Moine 1281.80 2.27 1921-1988 05591200 23 Kaskaskia 468.90 0.87 1971-1988 05593520 24 Crooked Creek 251.60 5.80 1975-1988 05594450 25 Silver Creek 152.49 4.17 1967-1988 05594800 26 Silver Creek 460.75 5.64 1971-1988 05595200 27 Richland Creek 127.12 2.65 1970-1988 05595730 28 Rayse Creek 90.40 4.23 1979-1988 05597000 29 Big Muddy River 783.60 11.78 1915-1988 05597500 30 Crab Orchard 31.30 8.09 1952-1988
6

Figure 1. Locations of selected drainage basins, streamgaging stations, and precipitation stations
7

Figure 2. Frequency distribution of drainage areas of selected watersheds
8

Figure 3. Frequency distribution of wetland percentages in selected watersheds
9

in precipitation from the analysis, four ratios were then calculated for each flood event to aid in the analysis: peakflow to average precipitation ratio; peakflow to peak precipitation ratio; peakflow to total precipitation ratio; and floodflow volume to total precipitation ratio.
For each station, the mean value for each normalized parameter was computed from the data for all the flood events. The frequency distribution of the individual values (used to compute the mean values) of the four parameters for Skillet Fork, Big Creek, and Crooked Creek are shown in figures 4-7. The distributions for the other stations were similar. The mean normalized parameters so computed were plotted against the corresponding percentages of wetlands for the watershed. The independent variable was the percentage of wetlands within each watershed. These values were generated by the Illinois Natural History Survey from the Illinois component of the National Wetland Inventory.
To investigate the regional influence on the peakflow and volume ratios, the mean normalized parameters were plotted by grouping the watersheds into three regions: south, central, and north. To investigate the seasonal influence of wetlands on streamflow, parameters were grouped on the basis of the four seasons. For each station, the mean parameters for each season were then plotted against their percentages of wetlands.
Low Flow. For low-flow analysis, flow duration curves were used. The lower limb of the flow duration curve provides the means to choose a range of low-flow values for analysis. For each watershed, the corresponding flow duration curve was developed by using the daily streamflow data for the selected ten-year period. The low-flow parameters selected for analysis were the discharges at 95 and 99 percent probability of exceedance: Q 9 5 and Q9 9 , respectively. The schematics of how the low flows were determined from the flow duration curve are illustrated in figure 8. The low-flow values in cfs were divided by the drainage areas and converted to inches per day. Each low-flow parameter was then plotted against the corresponding percentage of wetlands in the watershed to determine if any relationship existed.
To investigate the regional influence on the low-flow parameters, the parameter values were plotted by grouping the watersheds into the three regions: south, central, and north. To investigate the seasonal influence of wetlands on low flow, flow duration curves were developed and low-flow parameters were computed by grouping the data on the basis of the four seasons. For each station, the low-flow parameters for each season were then plotted against their percentages of wetlands.
10
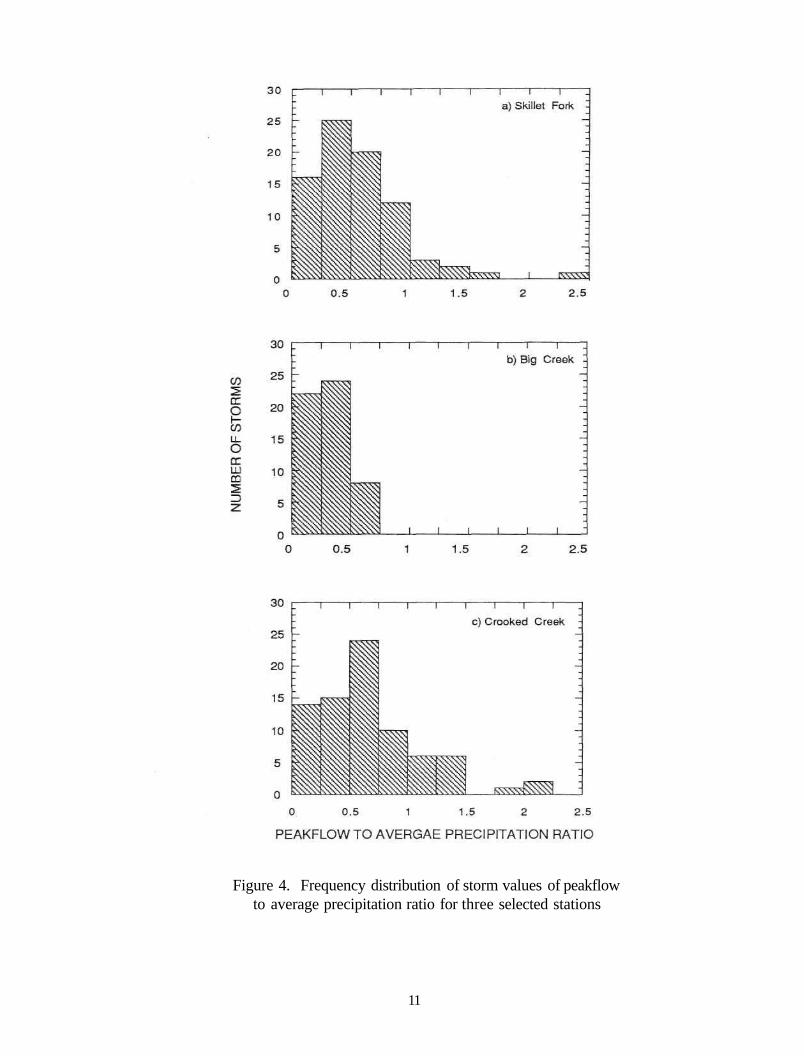
Figure 4. Frequency distribution of storm values of peakflow to average precipitation ratio for three selected stations
11

Figure 5. Frequency distribution of storm values of peakflow to peak precipitation ratio for three selected stations
12

Figure 6. Frequency distribution of storm values of peakflow to total precipitation ratio for three selected stations
13

Figure 7. Frequency distribution of storm values of floodflow volume to total precipitation ratio for three selected stations
14

Figure 8. Determination of flows at different exceedance probabilities
15

Evaluation Procedure For each flow parameter, the influence of wetlands on streamflow was studied
using the linear regression analysis method. Regression analysis is a procedure for fitting an equation to a set of data. For a given set of measurements on two or more variables, regression analysis provides a means for finding coefficients b0, b1,....,bp in the regression model of the form:
(1)
where y is the dependent variable and x1,....,xp are the independent variables. The preceding equation is a general form of the linear multivariate model in which p is the number of independent variables, xi is the ith independent variable, bi is the ith slope coefficient, and b0 is the intercept coefficient.
The values of the slopes and intercept in the above equation are computed using the principle of least squares. The principle of least squares is a process to obtain the best estimate of the coefficients and is referred to as the regression method. Regression is the tendency for the expected value on one or more jointly correlated random variables to approach more closely the mean value of its set than any other. The principle of least squares is used to regress y on xi values in equation (1). In a least-squares analysis, the error, e, or residual is defined as the difference between the predicted and measured values of the dependent variable:
(2)
where is the ith predicted value of y, yi is the ith measured value of y, and ei is the ith residual or error. The principle of least squares assumes that these errors are independent of each other and are normally distributed having a zero mean and a constant variance.
The objective function to minimize on the basis of the principle of least squares is the sum of squares of the errors, mathematically represented by:
(3)
16

where n is the sample size. The function can be minimized by taking the derivative of F with respect to each unknown coefficient, setting these derivatives equal to zero, and then solving for the unknown coefficients.
In this study, percentage of wetlands in the watershed was the only independent variable while the streamflow parameters were the dependent variables.
Testing Method The influence of wetlands on streamflow was examined by evaluating the percent
change in each of the parameters for a one percent change in wetland area. For each flow parameter, a value was selected as the limiting or threshold percent change for an increase of one percent wetland area in the watershed. If the calculated percentage change of the parameter based on the best-fit regression line exceeded this threshold value, then the influence of wetlands on the streamflow parameter was considered to be significant.
The percentage change (PC) for each parameter for an increase of one percent wetland area in the watershed is computed as follows:
(4)
where S is the slope of the best-fit regression line and yavg is the average value of the
parameter. The procedure is illustrated in figure 9. The percent change concept was selected here instead of using the slope of the
regression line to provide a meaningful interpretation of the relationship between percent wetland and other hydrologic parameters. Conceptually, PC represents by how much each parameter changes for one percent change in wetland area. We believe this concept is more understandable than providing the rate of change in the peakflow to average precipitation ratio or the floodflow volume to total precipitation ratio:
Based on the observation of the scatter plots and the regression lines of the streamflow parameters, the threshold percentage change was selected to be 0.5 percent. The significance of wetland influence on a streamflow parameter was then decided as follows:
wetland influence is significant
wetland influence is not significant (5)
(6)
17

Figure 9. Percent change (PC) determination from regression parameters
18

where PC is the calculated percentage change for an increase of one percent wetland area in the watershed and PCt is the threshold percentage change. The symbol | | implies absolute value. A positive (+) sign of the computed PC represents an increase in the parameter value and a negative (-) sign of the computed PC represents a decrease in the parameter value with increasing wetland percentage in the watershed.
19

RESULTS
The results of this study relating changes in peakflow, floodflow volume, and low flow to percent wetland change are presented in this section. The results are based on the statewide analysis (all the stations are included in one group), regional analysis (the stations are grouped into three regions), and seasonal analysis (the data are segregated for the four seasons).
Peakflow and Floodflow Volume Statewide Analysis
The results for the statewide analysis are shown in figures 10-13 and table 2. In general, the results of the analysis show that the peakflow and floodflow volume parameters decrease with increasing percentage of wetlands in the watersheds. For an increase of one percent wetland area in the watershed, the corresponding decreases are 3.7 percent for peakflow to average precipitation ratio, 2.6 percent for peakflow to peak precipitation ratio, and 3.0 percent for peakflow to total precipitation ratio. Thus among the three peakflow parameters analyzed, the peakflow to average precipitation ratio shows the most discernible relationship.
Table 2. Regression Analysis Results and Percent Change for Statewide Analysis
Regression coefficients Flow parameters Intercept Slope Percent change
Qp/Pa 0.696 -0.022 -3.7 Qp/Pp 0.369 -0.0086 -2.6 Q p /P t 0.286 -0.0075 -3.0 V/Pt 0.318 -0.0041 -1.4
The floodflow volume to total precipitation ratio decreases by 1.4 percent for an increase of one percent wetland area in the watershed (figure 13). The decrease in the floodflow volume parameter is significantly lower than for the peakflow parameters.
Regional Analysis
The results from the regional analysis are summarized in figure 14 and table 3. The relations between the three peakflow parameters and percent wetland for the three regions are compared with the relation for the statewide analysis in figures 14a-14c. The analysis indicates that all three peakflow parameters decrease with increasing percentage
20

Figure 10. Relation between peakflow to average precipitation ratio and percent wetland for Illinois
21

Figure 11. Relation between peakflow to peak precipitation ratio and percent wetland for Illinois
22

Figure 12. Relation between peakflow to total precipitation ratio and percent wetland for Illinois
23

Figure 13. Relation between floodflow volume to total precipitation ratio and percent wetland for Illinois
24

Figure 14. Regional variation of the relations between peakflow and floodflow volume parameters and percent wetland
25

of wetlands for central and northern Illinois. The peakflow to average precipitation ratio shows the most significant relationship. The percent decreases for central Illinois are 5.9, 4.9, and 5.0 percent for peakflow to average precipitation ratio, peakflow to peak precipitation ratio, and peakflow to total precipitation ratio, respectively. For northern Illinois the decreases for the three peakflow parameters are 7.9, 6.5, and 2.9 percent, respectively.
Table 3. Regional Regression Coefficients and Percent Change Values for Peakflow and Floodflow Parameters
Regression parameters Flow parameter Region Intercept Slope Percent change
Qp/Pa statewide 0.696 -2.22 -3.7 southern 0.601 0.53 0.8 central 0.673 -3.29 -5.9 northern 0.797 -4.78 -7.9
Qp/Pp statewide 0.369 -0.86 -2.6 southern 0.320 0.57 1.6 central 0.350 -1.44 -4.9 northern 0.427 -2.20 -6.5
Qp/P t statewide 0.286 -0.75 -3.0 southern 0.301 -0.51 -1.9 central 0.285 -1.20 -5.0 northern 0.271 -0.71 -2.9
V/Pt statewide 0.318 -0.41 -1.4 southern 0.355 0.00 0.0 central 0.294 -1.10 -4.5 northern 0.304 -0.70 -2.3
In southern Illinois, peakflow to average precipitation ratio and peakflow to peak precipitation ratio increase by 0.8 and 1.6 percent, respectively, while peakflow to total precipitation ratio decreases by 1.9 percent. Thus, the relationships for southern Illinois are less noticeable and contradictory than those for central and northern Illinois.
The relations between the floodflow volume parameters and percent wetland for the three regions are compared in figure 14d. The floodflow volume to total precipitation ratio decreases for central and northern Illinois by 4.5 and 2.3 percent, respectively. For
26

southern Illinois, however, the percentage of wetlands appears to have no influence on the floodflow volume ratio; it essentially remains constant irrespective of the percentage of wetlands in the watershed.
Seasonal Analysis The influence of wetlands on streamflow could depend on seasonal variation of
wetland functions and the general hydrologic cycle of precipitation, infiltration, storage, and runoff. In Illinois seasonal variations in precipitation, soil moisture and runoff are significant. Therefore it was decided to evaluate if significant differences in the influence of wetlands on streamflow could be detected based on available streamflow data. The selected flood events were grouped in the season that they occurred, and similar analyses were performed to evaluate the differences. The results are also compared to the total set of data.
The results from the seasonal analysis are summarized in figures 15-19 and tables 4-7. The seasonal analysis indicates that all three peakflow parameters decrease with increasing percentage of wetlands for all seasons. The greatest decrease is found in fall and the least during winter. The percent decreases in fall, for an increase of one percent wetland area in the watershed, are 5.7, 4.1, and 5.6 percent for peakflow to average precipitation ratio, peakflow to peak precipitation ratio, and peakflow to total precipitation ratio, respectively. The corresponding values for winter are 2.4, 1.6, and 1.4 percent. The decreases in peakflow parameters for spring and summer are very similar; for spring, the decreases are 4.0, 2.8, and 2.7 percent, respectively; and for summer, the decreases are 4.2, 3.4, and 3.4 percent, respectively. The peakflow ratios for the four seasons are compared in figures 15a-15c.
The relationships for the floodflow volume parameter are much less perceptible than those for the peakflow parameter. The decreases for floodflow volume for fall, winter, spring, and summer are 2.0, 0.0, 1.0, and 3.1 percent, respectively. Figure 15d compares the floodflow volume ratio for the four seasons.
Seasonal-Regional. Since the storm events were separated on the basis of the season in which they occurred for the seasonal analysis discussed in the preceding section, it was decided to evaluate if the general seasonal patterns vary from region to region within Illinois. In a similar fashion to that for the regional analysis, the data for the seasonal analysis were grouped into regions to assess the seasonal influence in different regions of the state. A summary of the statewide analysis is provided in the seasonal analysis discussed in the preceding section. The regional aspect of the seasonal analysis is
27

Figure 15. Seasonal variation of the relations between peakflow and floodflow volume parameters and percent wetland
28

Figure 16. Regional variation of the relations between peakflow and floodflow volume parameters and percent wetland for fall
29

Figure 17. Regional variation of the relations between peakflow and floodflow volume parameters and percent wetland for winter
30

Figure 18. Regional variation of the relations between peakflow and floodflow volume parameters and percent wetland for spring
31

Figure 19. Regional variation of the relations between peakflow and floodflow volume parameters and percent wetland for summer
32

Table 4. Influence of Wetlands on Peakflow as Measured by the Percent Change in the Ratio of Peakflow to Average Precipitation Ratio (Qp/Pa)
for a One Percent Change in Wetland Area
Annual Fall Winter Spring Summer
Illinois (statewide) -3.7 -5.7 -2.4 -4.0 -4.2
South +0.8 +1.5 -3.3 -2.9 +0.3 Central -5.9 -8.7 -4.3 -5.3 -5.9 North -7.9 -8.2 -1.9 -6.5 -6.1
Table 5. Influence of Wetlands on Peakflow as Measured by the Percent Change in the Ratio of Peakflow to Peak Precipitation (Qp/Pp)
for a One Percent Change in Wetland Area
Annual Fall Winter Spring Summer
Illinois (statewide) -2.6 -4.1 -1.6 -2.8 -3.8
South 1.6 2.7 -3.4 -2.7 +0.5 Central -4.9 -8.3 -4.0 -3.6 -6.0 North -6.5 -5.1 0.8 -4.6 -5.5
33

Table 6. Influence of Wetlands on Peakflow as Measured by the Percent Change in the Ratio of Peakflow to Total Precipitation (Qp/Pt)
for a One Percent Change in Wetland Area
Annual Fall Winter Spring Summer
Illinois (statewide) -3.0 -5.6 -1.4 -2.7 -3.4
South -1.9 2.3 -3.5 -2.2 -1.4 Central -5.0 -9.0 -3.0 -3.5 -4.4 North \ -2.9 -6.2 0.9 -3.8 -5.6
Table 7. Influence of Wetlands on Floodflow Volume as Measured by the Percent Change in the Ratio of Floodflow Volume to Total Precipitation (V/Pt)
for a One Percent Change in Wetland Area
Annual Fall Winter Spring Summer
Illinois (statewide) -1.4 -2.0 0.0 -1.0 -3.1
South 0.0 +4.4 -1.5 -0.6 +0.2 Central -4.5 -6.9 -3.0 -2.3 -6.1 North -2.3 -6.9 +3.1 -3.7 -4.1
34

presented in the following sections. The results of this analysis are provided in figures 16-19 and tables 4-7.
Fall. The results for the fall season are shown in figure 16. The results show that all the peakflow parameters decrease with increasing percentage of wetlands for both central and northern Illinois. The decreases for central Illinois are 8.7, 8.3, and 9.0 percent for peakflow to average precipitation ratio, peakflow to peak precipitation ratio, and peakflow to total precipitation ratio, respectively. The decreases for northern Illinois are 8.2, 5.1, and 6.2 percent, respectively. For southern Illinois, however, the peakflow ratios increase with increasing percentage of wetlands: the increases are 1.5, 2.7, and 2.3 percent, respectively. Among the three peakflow parameters, the most noticeable relationship is for the peakflow to average precipitation ratio. Among the three regions, the relationships for central and northern Illinois are more perceptible.
The floodflow volume parameter exhibits results similar to the peakflow parameters, where the parameter decreases in northern and central Illinois and increases in southern Illinois (figure 16c). The decreases for central and northern Illinois are 6.9 percent and the increase for southern Illinois is 4.4 percent.
Winter. The results for the winter season are summarized in figure 17. The results show that, in general, the peakflow parameters decrease with increasing percentage of wetlands in the watershed for southern and central Illinois. The decreases for southern Illinois are 3.3, 3.4, and 3.5 percent for peakflow to average precipitation ratio, peakflow to peak precipitation ratio, and peakflow to total precipitation ratio, respectively. The decreases for central Illinois are 4.3, 4.0, and 3.0 percent, respectively. For northern Illinois, only peakflow to average precipitation ratio decreases by 1.9 percent, while peakflow to peak precipitation ratio and peakflow to total precipitation ratio increase by 0.8 and 0.9 percent, respectively. Among the three peakflow parameters, the most noticeable relationship is for peakflow to average precipitation ratio. Among the three regions, the relationship for central Illinois is the most perceptible.
The floodflow volume parameter exhibits similar results to those of the peakflow parameters (figure 16d). The floodflow volume to total precipitation ratio decreases by 1.5 and 3.0 percent for southern and central Illinois, and increases by 3.1 percent for northern Illinois.
Spring. The results for the spring season are shown in figure 18. The results show that the peakflow parameters decrease with increasing percentage of wetlands for all three regions. The decreases for southern Illinois are 2.9, 2.7, and 2.2 percent for peakflow to average precipitation ratio, peakflow to peak precipitation ratio, and peakflow to total precipitation ratio, respectively, for an increase of one percent wetland
35

area in the watershed. The corresponding decreases for central Illinois are 5.3, 3.6, and 3.5 percent, and for northern Illinois they are 6.5, 4.6, and 3.8 percent. Among the three peakflow ratios, the most significant relationship is for peakflow to average precipitation ratio. Among the three regions, the relationship for northern Illinois is the most perceptible.
The floodflow volume parameter also decreases with increasing wetland percentage for all three regions (figure 18d). The decreases are 0.6, 2.3, and 3.7 percent for southern, central, and northern Illinois, respectively.
Summer. The results for the summer season are shown in figure 19. The results show that the peakflow parameters decrease with increasing percentage of wetlands in the watershed for central and northern Illinois. The decreases for central Illinois are 5.9, 6.0, and 4.4 percent for peakflow to average precipitation ratio, peakflow to peak precipitation ratio, and peakflow to total precipitation ratio, respectively, for an increase of one percent wetland area in the watershed. The corresponding decreases for northern Illinois are 6.1, 5.5, and 5.6; for southern Illinois, peakflow to average precipitation ratio is not significantly influenced by the presence of wetlands, peakflow to peak precipitation ratio increases by 0.5 percent, while peakflow to total precipitation ratio decreases by 1.4 percent. Among the three peakflow ratios, the most significant relationship is for peakflow to average precipitation ratio. Among the three regions, the relationships for central and northern Illinois are more perceptible.
Similar to the peakflow parameters, the floodflow volume parameters also decrease by 6.1 and 4.1 percent for central and northern Illinois, respectively. For southern Illinois, however, floodflow volume is not significantly affected by the percentage of wetlands in the watershed.
Low Flow Statewide Analysis
The results from the low-flow analysis for the state as a whole are shown in figures 20-21 and tables 8 and 9. The results indicate that flows at both 95 and 99 percent probability of exceedance (Q9 5 and Q99) generally increase with increasing wetland percentage in the watershed. For the whole state, the percent increases for Q 9 5 and Q 9 9
for an increase of one percent wetland area in the watershed are 7.9 and 8.4 percent, respectively. As figures 20 and 21 show, there is a wide scatter in the data points for both Q 9 5 and Q 9 9 for Illinois as a whole; however, the scatter in the data can be considerably reduced for both the low-flow parameters when they are grouped on a regional basis.
36

Figure 20. Relation between low-flow parameter, Q9 5 , and percent wetland for Illinois
37

Figure 21. Relation between low-flow parameter, Q9 9 , and percent wetland for Illinois
38

Table 8. Regional Variability of Influence of Wetlands on Low Flow in Illinois as Measured by the Percent Change in Q 9 5 and Q 9 9
Q95 Q99 (percent change) (percent change)
Illinois (statewide) +7.9 +8.4 Southern Illinois +15.9 +17.2 Central Illinois +5.5 -4.6 Northern Illinois +15.0 +18.2
Table 9. Seasonal Variability of Influence of Wetlands on Low Flow in Illinois as Measured by the Percent Change in Q 9 5 and Q 9 9
Q95 Q99 (percent change) (percent change)
Annual +7.9 +8.4 Fall +8.4 +9.2 Winter +7.6 +7.6 Spring -1.8 -2.4 Summer +8.0 +9.4
Notes: Q 9 5 = flow at 95 percent probability of exceedance Q 9 9 = flow at 99 percent probability of exceedance + = parameter value increases with increasing wetland percentage - = parameter value decreases with increasing wetland percentage
39

Regional Analysis The results from the regional analysis are also shown in figures 20-21 and table 8.
The results indicate that both low-flow parameters increase with increasing percentage of wetlands. The percent increases for Q 9 5 and Q 9 9 for southern Illinois are 15.9 and 17.2 percent, respectively. For northern Illinois, the increases are 15.0 and 18.2 percent, respectively. The influence of wetlands on low flow is significantly less in central Illinois compared to that in either southern or northern Illinois. Q 9 5 increased by 5.5 percent, while Q 9 9 decreased by 4.6 percent. Thus, based on the data analyzed, influence of wetlands on low flow is more dominant in southern and northern Illinois than in central Illinois.
Seasonal Analysis The results from the seasonal analysis are shown in figure 22 and table 9. The
seasonal analysis indicates that both Q 9 5 and Q 9 9 increase with increasing wetland percentage for fall. The percent increases in fall are 8.4 and 9.2 percent for Q9 5 and Q9 9 , respectively. The relationships are similar for winter and summer. The percent increases in winter are 7.6 percent for both Q 9 5 and Q9 9 , while the percent increases in summer are 8.0 and 9.4 percent for Q 9 5 and Q9 9 , respectively. For spring, however, Q 9 5 and Q 9 9
decrease by 1.8 and 2.4 percent, respectively. Seasonal-Regional. As mentioned previously, low-flow parameters were
computed for each season by grouping the data on the basis of the four seasons. The following sections discuss the seasonal influence for the different regions. The results of this analysis are summarized in table 10.
Fall. The results show that both Q 9 5 and Q 9 9 increase with increasing wetland percentage in the watershed for southern as well as northern Illinois. The increases for southern Illinois are 17.2 and 19.3 percent for Q 9 5 and Q9 9 , respectively. The increases for northern Illinois are 15.6 and 18.7 percent, respectively. For central Illinois, however, Q 9 5 increases by 6.4 percent, while Q 9 9 decreases by 2.8 percent. Thus the relationships for southern and northern Illinois show more influence of wetlands on low flow compared to central Illinois for fall. The rate of increase is, however, much higher for northern Illinois than that for southern Illinois.
Winter. The results show that both Q 9 5 and Q 9 9 increase with increasing wetland percentage in the watershed for all three regions: southern, central, and northern Illinois during winter. The percent increases for southern Illinois are 9.1 and 8.9 percent
40

Figure 22. Seasonal variation of the relation between parameters Q 9 5 and Q 9 9 and percent wetland low flow
41

Table 10. Seasonal Variability of Influence of Wetlands on Low Flow by Region in Illinois as Measured by the Percent Change in Q 9 5 and Q 9 9
Fall Winter Spring Summer
Q95 Q99 Q95 Q99 Q95 Q99 Q95 Q99
Illinois +8.4 +9.2 +7.6 +7.0 -1.8 -2.4 +8.0 +9.4 Southern Illinois +17.2 +19.3 +9.1 +8.9 -0.4 +5.3 +22.0 +20.9 Central Illinois +6.4 -2.8 +10.2 +5.7 -2.1 -4.2 -4.7 -8.0 Northern Illinois +15.6 +18.7 +12.9 +14.1 +3.8 +2.2 +16.2 +20.0
Notes: Q9 5= flow at 95 percent probability of exceedance Q9 9= flow at 99 percent probability of exceedance + = parameter value increases with increasing wetland percentage
= parameter value decreases with increasing wetland percentage
42
-

for Q 9 5 and Q9 9 , respectively. The percent increases for central Illinois are 10.2 and 5.7 percent, respectively. The percent increases for northern Illinois are 12.9 and 14.1 percent, respectively. Thus the relationships for all three regions in Illinois show similar influence of wetlands on low flow for winter. The rate of increase is again higher for northern Illinois than that for either southern or central Illinois.
Spring. The results show that for all three regions - southern, central, and northern Illinois - Q 9 5 as well as Q 9 9 are influenced much less by wetlands in spring than in the other seasons. For southern Illinois, Q 9 5 is not significantly influenced by wetlands in spring, while Q 9 9 shows an increase of 5.3 percent. For central Illinois, there are decreases of 2.1 and 4.2 percent for Q 9 5 and Q9 9 , respectively For northern Illinois, there are increases of 3.8 and 2.2 percent for Q 9 5 and Q9 9 , respectively.
Summer. The results show that both Q9 5 and Q 9 9 increase with increasing wetland percentage in the watershed for southern as well as northern Illinois. The increases for southern Illinois are 22.0 and 20.9 percent for Q 9 5 and Q9 9 , respectively. The increases for northern Illinois are 16.2 and 20.0 percent for Q 9 5 and Q9 9 , respectively. For central Illinois, however, Q 9 5 and Q 9 9 decrease by 4.7 and 8.0 percent, respectively. Thus the relationships for southern and northern Illinois show more influence of wetlands on low flow compared to central Illinois., The rate of increase is again much higher for northern Illinois than that for southern Illinois.
43

SUMMARY AND CONCLUSIONS
Existing streamflow records from 30 gaging stations in different geographic regions of Illinois with different percentages of wetlands in their watersheds were analyzed to assess the influence of wetlands on streamflow. The objective of the research was to determine if streamflow parameters were influenced by the percentage of wetlands in the watersheds. The streamflow parameters analyzed included three peakflow parameters (peakflow to average precipitation ratio, peakflow to peak precipitation ratio, and peakflow to total precipitation ratio), a floodflow parameter (floodflow volume to total precipitation ratio), and two low-flow parameters (flows at 95 and 99 percent exceedance probability, Q 9 5 and Q99). Because of significant regional differences in physiography and hydrology in Illinois, the data were synthesized to evaluate if there were regional patterns in the relations. The stations were grouped into three regions: northern, central, and southern Illinois. Even though the regionalization reduces the number of stations for analysis, important observations were made based on this analysis. It is also reasonable to assume that wetland functions could change with changes in the seasons because of the associated changes in climate and land cover. Therefore variability of the influence of wetlands was evaluated for the different seasons.
The major conclusions of the study follow. It should be mentioned that for the sake of brevity, the conclusions for peakflow were made on the basis of the results for peakflow to average precipitation ratio only. Even though the patterns are similar, the peakflow to average precipitation parameter showed the most consistent result among the three peakflow ratios. The conclusions for low flow were made on the basis of the results for Q 9 5 , since the total number of zero values associated with it was less than that with
Q 9 9
1. Peakflow decreases as the percentage of wetland areas increases in the watershed. For the state as a whole, including the 30 stations, the peakflow parameter decreased by an average of 3.7 percent for one percent increase in wetland area. The percent change in the peakflow parameter varied from a decrease of 8.7 percent for central Illinois to an increase of 1.5 percent in southern Illinois during the fall season. The influence of wetlands on peakflow is more pronounced in northern and central Illinois than in southern Illinois. Seasonally, wetland acreage influences peakflow more significantly in the fall than during the other seasons.
2. Floodflow volume decreases to a lesser extent as compared to peakflow, as wetland percentage increases. For the whole state, the floodflow volume parameter decreased by an average of 1.4 percent for one percent increase in wetland area. The percent
44

change in the floodflow parameter varied from a decrease of 6.9 percent for northern and central Illinois to an increase of 4.4 percent in southern Illinois during the fall season. The influence of wetland acreage on floodflow volume is more pronounced in central and northern Illinois than in southern Illinois. Seasonally, wetland acreage influences floodflow volume more during fall than during the other seasons.
3. Low flows increased with increasing wetland acreage in the watershed. For the whole state, the low-flow parameter increased by an average of 7.9 percent for one percent increase in wetland area. The percent change in the low-flow parameter varied from an increase of 22 percent in southern Illinois to a decrease of 4.7 percent in central Illinois during summer. The influence of wetland acreage on low flow is more pronounced in southern and northern Illinois than in central Illinois. Seasonally, the influence of wetland acreage on low flow is more significant during summer, fall, and winter, and less significant during spring.
Limitations of the database should be remembered in generalizing the results of this study. The first limitation is the limited database used in the regional analysis: 11 stations for southern Illinois, 8 stations for central Illinois, and 11 stations for northern Illinois. For Illinois as a whole, data were for 30 stations. Therefore, results and conclusions for the whole state may be considered more definitive.
Another weakness of the database is the skewed distribution of wetland percentages in the watersheds analyzed. Although wetland percentage ranged from 0.2 to 13.7 percent, 11 watersheds (37 percent) had percentages of wetlands less than or equal to 2 percent, 19 watersheds (63 percent) had percentages of wetlands less than or equal to 5 percent, while 28 watersheds (93 percent) had percentages of wetlands less than or equal to 10 percent. Thus, a relatively uniform distribution of wetland percentage was not available. As a result, the conclusions drawn based on the study of these watersheds should be viewed with some caution until the range of percent wetland area is expanded.
The present analysis can be improved by increasing the number of stations for each region to at least 20. This will provide a broader database for each region, and the regional and seasonal-regional conclusions will be more reliable. Attempts should also be made to select other watersheds in Illinois and from neighboring states so as to obtain a wider distribution of the percentage of wetlands in the watersheds. This will significantly improve both the scope and reliability of the conclusions from the current study.
45

REFERENCES
Bailey, A.D., and T. Bree. 1980. Effect of Improved Land Drainage of River Floodflows. Institute of Civil Engineering. Flood Studies Report - 5 Years On, London, England, pp. 95-106.
Bardecki, M.J. 1987. Cumulative Impacts of Agricultural Land Drainage on Watershed Hydrology. Proceedings of the National Wetland Symposium: Wetland Hydrology, September 16-18, Chicago, IL. Editors, Jon A. Kusler and G. Brooks, pp. 124-128.
Brunner, G.W. 1988. Comparison of Modeling Techniques for Wetland Areas. Report No. 88-4, The Hydrologic Engineering Center, USACOE, Davis, CA.
Burke, W. 1968. Drainage of Blanket Peat at Glenamony. Proceedings of the Second International Peat Congress. H.M.S.O., 2:809-817, Edinburgh, Scotland.
Campbell, K.L., and H.P. Johnson. 1975. Hydrologic Simulation of Watersheds with Artificial Drainage. Water Resources Research 11(1): 120-126.
DeBoer, D.W., and H.P. Johnson. 1971. Simulation of Runoff from Depression Characterized Watersheds. Transactions of the American Society of Agricultural Engineers 14(4):615-620.
Demissie, M., N.G. Bhowmik, and J.R. Adams. 1983. Hydrology, Hydraulics, and Sediment Transport, Kankakee and Iroquois Rivers. Illinois State Water Survey Report of Investigation 103, Champaign, IL.
Eggelsmann, R. 1972. The Water Balance of Low Land Areas in the Coastal Region of the Federal Republic of Germany. Hydrology of Marsh-Ridden Areas, UNESCO Press, Paris, France, pp. 355-367.
Eli, R.N., and H.W. Rauch. 1982. Fluvial Hydrology of Wetlands in Preston County, West Virginia. Symposium on Wetlands of the Unglaciated Appalachian Region. West Virginia University, Morgantown, WV, pp. 11-28.
Haan, C.T., and H.P. Johnson. 1968. Hydraulic Model of Runoff from Depressional Areas. Transactions of the American Society of Agricultural Engineers 11:364-367, Ames, IA.
46

Irwin, R.W., and H.R. Whiteley. 1983. Effect of Land Drainage on Streamflow. Canadian Water Resources Journal 8(2):88-103.
Kloet, L. 1971. Effects of Drainage on Runoff and Flooding within Pembina River Basins: North Dakota - Manitoba. Bureau of Sport Fisheries and Wildlife, Bismarck, ND.
McCubbin, G.A. 1938. Agricultural Drainage in Southwestern Ontario - Its Effect on Stream Discharge. Engineering Journal 21(2):66-70, Ontario, Canada.
McGill, H.N., and A.C. Bennet. 1971. Effects of Surface Drainage on Streamflow. American Society of Agricultural Engineers, Paper 71-712.
Moklyak, V.I., G.B. Kubyshkin, and G.N. Karkutsiev. 1972. The Effects of Drainage Works on Streamflow. Hydrology of Marsh-Ridden Areas, UNESCO Press, Paris, France, pp. 439-446.
Moore, I.D., and C.L. Larson. 1979. Effects of Drainage Projects on Surface Runoff from Small Depressional Watersheds in the North Central Region, Water Resources Research Center, Bulletin 99, University of Minnesota, Minneapolis.
Novitzki, R.P. 1982. Hydrology of Wisconsin's Wetlands. Information Circular 90, U.S. Geological Survey, Madison, WI.
Ogawa, H., and J.W. Male. 1983. The Flood Mitigation Potential of Inland Wetlands. Water Resources Research Center Report 138, University of Massachusetts, Amherst.
O'Kelly, J.J. 1955. The Employment of Unit Hydrographs to Determine the Flows of Irish Arterial Drainage Channels. Proceedings of the Institute of Civil Engineers 4:365-444, London, England.
Prior, C.H., and J.H. Hess. 1961. Floods in Minnesota, Magnitude and Frequency. Minnesota Department of Conservation, Division of Waters Bulletin No. 12.
Skaggs, R.W., and R.G. Broadhead. 1982. Drainage Strategies and Peak Floodflows. Summer Meeting of the American Society of Agricultural Engineers at University of Wisconsin, Madison, WI, June 27-30, 1982, Paper No. 82-2054.
47