Contents - Illinois Tollway
357
-
Upload
khangminh22 -
Category
Documents
-
view
0 -
download
0
Transcript of Contents - Illinois Tollway


Contents
Acronyms .................................................................................................................................. iExecutive Summary............................................................................................................ES-1
Purpose and Need ................................................................................................................ 1-11.1 Project Purpose..........................................................................................................1-11.2 Background ...............................................................................................................1-1
1.2.1 Regional Planning Context ................................................................................. 1-11.2.2 Project History..................................................................................................... 1-1
1.3 Project Need...............................................................................................................1-21.3.1 Population and Employment Growth ................................................................ 1-21.3.2 Existing System Performance ............................................................................. 1-41.3.3 Improve North-South Travel Capacity and Efficiency....................................... 1-41.3.4 Improve Regional and Local Travel.................................................................... 1-51.3.5 Improve Safety .................................................................................................... 1-61.3.6 Improve Modal Connections .............................................................................. 1-6
Affected Environment.......................................................................................................... 2-12.1 Socioeconomic Characteristics ..................................................................................2-1
2.1.1 Demographics..................................................................................................... 2-12.1.2 Land Use and Development Trends ................................................................... 2-52.1.3 Economic Characteristics.................................................................................... 2-72.1.4 Environmental Justice........................................................................................2-102.1.5 Public Services and Facilities .............................................................................2-112.1.6 Transportation Facilities.....................................................................................2-12
2.2 Agriculture ..............................................................................................................2-152.2.1 Locations of Agricultural Land..........................................................................2-152.2.2 Prime and Important Farmland.........................................................................2-16
2.3 Natural Resources ...................................................................................................2-172.3.1 Geological Setting ..............................................................................................2-172.3.2 Water Quality and Water Resources..................................................................2-192.3.3 Wetlands ............................................................................................................2-242.3.4 Floodplains.........................................................................................................2-292.3.5 Biological Resources...........................................................................................2-302.3.6 Special Lands......................................................................................................2-382.3.7 Visual Resources ................................................................................................2-42
2.4 Air Quality...............................................................................................................2-432.5 Noise ........................................................................................................................2-44
2.5.1 Noise Sources and Existing Conditions.............................................................2-452.5.2 Noise Criteria for Determining Impact..............................................................2-47
2.6 Cultural Resources ..................................................................................................2-472.6.1 Archaeological Resources ..................................................................................2-472.6.2 Standing Structures............................................................................................2-48
2.7 Special Waste...........................................................................................................2-49

CONTENTS
Alternatives........................................................................................................................... 3-13.1 Introduction................................................................................................................3-13.2 Background ................................................................................................................3-13.3 No-Action Alternative (Baseline) ...............................................................................3-13.4 Supporting Transportation Improvements...............................................................3-2
3.4.1 Rail and Bus Transit ............................................................................................ 3-43.4.2 Transportation Centers ....................................................................................... 3-6
3.5 Roadway Alternatives ...............................................................................................3-63.5.1 Alternatives Development Process ..................................................................... 3-63.5.2 Preliminary Roadway Concepts ......................................................................... 3-83.5.3 Preliminary Roadway Concepts Dismissed from Further Study......................3-103.5.4 Initial Roadway Alternatives .............................................................................3-103.5.5 Other Proposals Considered..............................................................................3-143.5.6 Conclusions – Initial Roadway Refinement Process..........................................3-143.5.7 Environmental Considerations..........................................................................3-15
3.6 Finalist Recommendations......................................................................................3-173.6.1 Description of the Finalist Alternatives .............................................................3-203.6.2 Supporting Improvements.................................................................................3-223.6.3 Detailed Evaluation of the Finalist Roadway Alternatives ...............................3-25
3.7 Summary .................................................................................................................3-30Environmental Consequences ............................................................................................. 4-1
4.1 Socioeconomic Impacts .............................................................................................4-14.1.1 Population and Households ................................................................................4-14.1.2 Community and Land Use Changes....................................................................4-44.1.3 Residential Relocations........................................................................................4-84.1.4 Business Relocations............................................................................................4-94.1.5 Employment.......................................................................................................4-104.1.6 Tax Revenues .....................................................................................................4-144.1.7 Environmental Justice........................................................................................4-144.1.8 Public Services and Facilities .............................................................................4-16
4.2 Agricultural Impacts ...............................................................................................4-174.2.1 No-Action Alternative (Baseline).......................................................................4-194.2.2 IL 53 Freeway/Tollway Alternative ..................................................................4-204.2.3 IL 83/US 45 with US 12 Alternative ..................................................................4-214.2.4 Summary of Agricultural Impacts .....................................................................4-22
4.3 Natural Resources ...................................................................................................4-234.3.1 Geology, Soils, and Mineral Resources..............................................................4-234.3.2 Water Quality and Water Resources..................................................................4-234.3.3 Wetlands ............................................................................................................4-264.3.4 Floodplain Encroachments ................................................................................4-374.3.5 Biological Resources...........................................................................................4-404.3.6 Threatened and Endangered Species.................................................................4-43
4.4 Air Quality...............................................................................................................4-484.4.1 No-Action Alternative (Baseline).......................................................................4-494.4.2 IL 53 Freeway/Tollway Alternative ..................................................................4-494.4.3 IL 83/US 45 with US 12 Alternative ..................................................................4-504.4.4 Summary of Air Quality Impacts.......................................................................4-50

CONTENTS
4.5 Noise ........................................................................................................................4-504.5.1 Noise Impacts.....................................................................................................4-514.5.2 Abatement..........................................................................................................4-514.5.3 Summary of Noise Impacts................................................................................4-54
4.6 Cultural Resource Impacts ......................................................................................4-554.6.1 No-Action Alternative (Baseline).......................................................................4-554.6.2 IL 53 Freeway/Tollway Alternative ..................................................................4-564.6.3 IL 83/US 45 with US 12 Alternative ..................................................................4-564.6.4 Summary of Cultural Resource Impacts............................................................4-57
4.7 Special Waste...........................................................................................................4-594.7.1 No-Action Alternative (Baseline).......................................................................4-604.7.2 IL 53 Freeway/Tollway Alternative ..................................................................4-604.7.3 IL 83/US 45 with US 12 Alternative ..................................................................4-604.7.4 Summary of Special Waste ................................................................................4-61
4.8 Section 4(f) Considerations......................................................................................4-614.8.1 Description of Potentially Involved 4(f) Resources ...........................................4-624.8.2 Potential Section 4(f) Resource Impacts.............................................................4-624.8.3 Summary of Potential Section 4(f) Resource Impacts........................................4-71
4.9 Energy......................................................................................................................4-714.10 Construction Impacts ..............................................................................................4-73
4.10.1 Construction-Related Jobs..............................................................................4-734.10.2 Erosion and Sediment Control .......................................................................4-734.10.3 Air Quality......................................................................................................4-744.10.4 Construction Noise.........................................................................................4-754.10.5 Traffic/Temporary Access .............................................................................4-754.10.6 Solid Waste.....................................................................................................4-754.10.7 Utility Services................................................................................................4-75
4.11 Secondary and Cumulative Impacts .......................................................................4-754.11.1 Approach ........................................................................................................4-754.11.2 Conclusion......................................................................................................4-86
4.12 Mitigation Concepts and Commitments.................................................................4-874.12.1 Traffic .............................................................................................................4-874.12.2 Community Impacts.......................................................................................4-874.12.3 Air Quality......................................................................................................4-874.12.4 Noise ...............................................................................................................4-874.12.5 Cultural Resources .........................................................................................4-884.12.6 Borrow and Disposal......................................................................................4-884.12.7 Water Quality and Hydrology .......................................................................4-894.12.8 Biological ........................................................................................................4-894.12.9 Wetland Mitigation ........................................................................................4-91
4.13 Permits/Certifications.............................................................................................4-924.13.1 Permits/Certifications....................................................................................4-92
4.14 Relationship of Short-Term Uses versus Long-Term Productivity.........................4-944.14.1 Short-Term......................................................................................................4-944.14.2 Long-Term......................................................................................................4-96
4.15 Irreversible and Irretrievable Commitments of Resources.....................................4-964.15.1 Land................................................................................................................4-97

CONTENTS
4.15.2 Raw Materials............................................................................................... 4-1154.15.3 Human Resources ........................................................................................ 4-1154.15.4 Economic ...................................................................................................... 4-1154.15.5 Natural.......................................................................................................... 4-115
4.16 Summary of Environmental Consequences.......................................................... 4-115Coordination......................................................................................................................... 5-1
5.1 Federal, State, and Local Agency Coordination ........................................................ 5-15.1.1 Introduction ........................................................................................................ 5-15.1.2 Resource Agency Group ..................................................................................... 5-15.1.3 Municipal Groups ............................................................................................... 5-45.1.4 Technical Advisory Group.................................................................................. 5-55.1.5 Lake County Board Joint Committees ................................................................ 5-7
5.2 The Public and Interested Groups ............................................................................. 5-85.2.1 Poll and Focus Groups........................................................................................ 5-95.2.2 Public Informational Meetings............................................................................ 5-95.2.3 Project Videos.....................................................................................................5-115.2.4 Speakers’ Bureau................................................................................................5-115.2.5 Project Office......................................................................................................5-125.2.6 Newsletters.........................................................................................................5-135.2.7 Web Site..............................................................................................................5-135.2.8 Mailing List ........................................................................................................5-14
5.3 The Effect of Coordination Activities........................................................................5-14List of Preparers.................................................................................................................... 6-1References ............................................................................................................................. 7-1
TablesS-1 Summary of Comments Regarding the IL 53 Set of Improvements ........................... ES-6S-2 IL 83/US 45 with US 12 Alternative Improvements ................................................... ES-7S-3 Travel Performance Comparison for Finalist Build Alternatives ............................... ES-8S-4 Summary of Environmental Consequences .............................................................. ES-141-1 Population and Employment Statistics for Lake County.............................................. 1-21-2 Population Statistics for the Five Suburban Counties Surrounding Cook County ...... 1-32-1 Regional Population Trends .......................................................................................... 2-22-2 Population by Township ............................................................................................... 2-32-3 Population and Household Forecasts, Lake County..................................................... 2-42-4 Age Distribution, 1990................................................................................................... 2-42-5 Land Use Summary ....................................................................................................... 2-52-6 Land Use Summary by Subarea Bound by Lake Cook Road, IL 120, US 41, and US 12 ....
............................................................................................................................................ 2-62-7 Top 10 Communities Issuing Residential Permits, 1995–1999...................................... 2-62-8 Regional Employment Trends....................................................................................... 2-72-9 Employment by Township ............................................................................................ 2-82-10 Employment by Industry............................................................................................. 2-82-11 Employment by Industry (Greater Than 1,000 Employees)........................................ 2-92-12 Racial Distribution ......................................................................................................2-112-13 Route Miles and Lane Miles in Lake County by Functional Class.............................2-13

CONTENTS
2-14 Metra Service Information..........................................................................................2-132-15 Distance to Metra Service in the Larger Study Area ..................................................2-142-16 Distance to Metra Service in the Larger Study Area ..................................................2-152-17 Existing Agricultural Land Within Lake County, 1997 ..............................................2-162-18 Summary of the Classification Systems and Comparison of the BSC and the USEPA
Classifications ............................................................................................................2-202-19 Fox River Watershed Basins.......................................................................................2-212-20 Des Plaines River Watershed Basins ..........................................................................2-222-21 Lake Michigan Watershed Basins...............................................................................2-232-22 Lake County Wetland Inventory................................................................................2-252-23 LCWI Subbasin Wetland Totals—Fox River Watershed, Lake County.....................2-272-24 LCWI Subbasin Wetland Totals—Des Plaines River Watershed, Lake County ........2-282-25 LCWI Subbasin Wetland Totals—Lake Michigan Watershed, Lake County ............2-292-26 Cover Types, Lake County .........................................................................................2-312-27 Bird Species Found In or Near Open Water and Wetlands in Lake County .............2-342-28 Number of Known, Federal and State-listed Threatened and Endangered Species by
Taxa in Lake County..................................................................................................2-352-29 Lake County Forest Preserves and Associated Nature Preserves and Natural
Areas..........................................................................................................................2-392-30 Lake County Nature Preserves–Fox River, Des Plaines River, and Lake Michigan
Watersheds.................................................................................................................2-412-31 Summary of National and State Ambient Air Quality Standards..............................2-442-32 Air Quality Monitoring Sites in the Study Area.........................................................2-452-33 Existing Air Quality in the Study Area ......................................................................2-452-34 Perceptive Noise Level Changes.................................................................................2-462-35 Estimating Existing Noise Exposure for General Assessment ...................................2-462-36 Noise Abatement Criteria Hourly Weighted Sound Level ........................................2-473-1 Road Projects in the No-Action Alternative ............................................................... 3-33-2 Transit Projects in the No-Action Alternative ............................................................ 3-43-3 Bus Service Improvements ......................................................................................... 3-63-4 Candidate Bus Improvements .................................................................................... 3-73-5 12 Preliminary Concepts............................................................................................. 3-93-6 Evaluation of Alternate IL 53 (North-South) and IL 120 (East-West) Alignments
Corridor: Impact Summary .......................................................................................3-133-7 Environmental and Societal Criteria .........................................................................3-163-8 Traffic Performance for Refined Roadway Improvement Sets .................................3-193-9 IL 83/US 45 with US 12 Alternative Improvements .................................................3-213-10 Construction and Right-of-Way Costs for the Finalist Build Alternatives................3-223-11 Priority Routes for Traffic Control Systems ..............................................................3-233-12 Local Trips .................................................................................................................3-253-13 County Maintained Routes........................................................................................3-263-14 Net Traffic Analysis Zones and Geographic Area Receiving a 5-Percent Travel Time
Saving, Compared to Baseline ...................................................................................3-273-15 Uncongested North-South Travel...............................................................................3-283-16 Percent Travel Time Savings Over the No-Action (Baseline) for Three North-South
Trips ...........................................................................................................................3-283-17 Travel Performance Summary for Finalist Build Alternatives...................................3-30

CONTENTS
4-1 Forecast Population and Household Growth for Each Alternative (includes thecontribution of supporting transportation improvements, such as rail, bus)............ 4-2
4-2 Population and Household Forecasts: No-Action Alternative (Baseline).................. 4-34-3 Population and Household Forecasts, IL 53 Freeway/Tollway Alternative Change
from No-Action Alternative (Baseline) (includes the contribution of supportingtransportation improvements, such as rail, bus)........................................................ 4-4
4-4 Population and Household Forecasts, IL 83/US 45 with US 12 Alternative Changefrom No-Action Alternative (Baseline) (includes the contribution of supportingtransportation improvements, such as rail, bus)........................................................ 4-5
4-5 Residential Relocation Summary ............................................................................... 4-94-6 Displaced Businesses, IL 53 Freeway/Tollway Alternative......................................4-104-7 Displaced Businesses, IL 83/US 45 with US 12 Alternative......................................4-114-8 Employment Forecast, No-Action Alternative (Baseline) .........................................4-124-9 Employment Forecast, IL 53 Freeway/Tollway Alternative.....................................4-134-10 Employment Forecast, IL 83/US 45 with US 12 Alternative.....................................4-134-11 Estimated Tax Loss Summary, by Alternative ..........................................................4-144-12 Socioeconomic Summary...........................................................................................4-184-13 Agricultural Areas Directly Affected by No-Action Alternative (Baseline) .............4-194-14 Crops and Market Value Affected by No-Action Alternative (Baseline)..................4-204-15 Agricultural Areas Directly Affected by IL 53 Freeway/Tollway Alternative.........4-204-16 Crops and Market Value Affected by IL 53 Freeway/Tollway Alternative .............4-214-17 Agricultural Areas Directly Affected by IL 83/US 45 with US 12 Alternative .........4-214-18 Crops and Market Value Affected by IL 83/US 45 with US 12 Alternative .............4-224-19 Summary of Agricultural Impacts.............................................................................4-224-20 Summary of Potential Water Well Impacts ...............................................................4-244-21 Potential ADID Impacts for the No-Action Alternative (Baseline) ..........................4-384-22 No-Action Alternative (Baseline) Scenario; Potential Non-ADID Wetland Impacts......4-294-23 IL 53 Freeway/Tollway ADID Impact Summary .....................................................4-304-24 IL 83/US 45 with US 12 Potential ADID Impact Summary ......................................4-324-25 IDNR Element Occurrences in or Near Wetlands within the Study Area ................4-334-26 Wetland Size Classes Used in Wetland Functional Assessment...............................4-344-27 Summary of Wetland Impacts...................................................................................4-374-28 Floodplain and Added Impervious Area Impact Summary.....................................4-394-29 INAI Sites Affected under No-Action Alternative (Baseline) ...................................4-444-30 Selected Wetlands Identified in the IL 53 Freeway/Tollway
Alternative and Listed Species Observed in Them ...................................................4-454-31 Selected Wetlands Identified in the IL 83/US 45 with US 12
Alternative and Listed Species Observed in Them ...................................................4-464-32 Affected INAI Sites under IL 83/US 45 with US 12 Alternative...............................4-474-33 Carbon Monoxide Screening Analysis at “Worst Case” Locations...........................4-494-34 Residences Within Noise Impact Zones for the No-Action Alternative (Baseline) ..4-524-35 Residences within the Noise Impact Zone for the IL 53 Freeway/Tollway
Alternative .................................................................................................................4-534-36 Residences within the Noise Impact Zone for the IL 83/US 45 with US 12
Alternative .................................................................................................................4-534-37 Residential Noise Impact Summary ..........................................................................4-544-38 Potentially Involved Archaeological Sites.................................................................4-56

CONTENTS
4-39 Potentially Involved Eligible Historic Properties......................................................4-564-40 Potentially Involved Archaeological Sites.................................................................4-574-41 Potentially Involved Eligible Historic Properties .........................................................4-574-42 Potentially Involved Archaeological Sites.................................................................4-584-43 Potentially Involved Eligible Historic Properties .........................................................4-584-44 Potentially Affected Historic and Archaeological Resources....................................4-594-45 Potentially Involved Lake County Forest Preserves .................................................4-634-46 Potentially Involved Parks.........................................................................................4-664-47 Potentially Involved Eligible Historic Properties......................................................4-674-48 Summary of Potential Forest Preserve and Local Park4 (f) Impacts for the No-Action
Alternative (Baseline).................................................................................................4-694-49 Summary of Potential Forest Preserve and Local Park 4(f) Impacts for the IL 53
Freeway/Tollway Alternative ..................................................................................4-704-50 Summary of Potential 4(f) Impacts for the IL 83/US 45 Alternative.........................4-724-51 Summary of Potential Section 4(f) Impacts ...............................................................4-734-52 Jobs Generated per Alternative .................................................................................4-734-53 Summary of Stream Crossings by Alternative ..........................................................4-744-54 Steps in Cumulative/Secondary Analysis.................................................................4-764-55 Potential Cumulative/Secondary Effects ..................................................................4-774-56 Affected Environment ...............................................................................................4-784-57 Cause-and-Effect for Resources, Ecosystems and Human Communities.................4-814-58 Percent of Lake County Lost per Alternative ............................................................4-834-59 Changing Water Quality Conditions In Des Plaines River (1988 –1995) ..................4-854-60 Wetland Compensation Ratios (IWPA).....................................................................4-924-61 Summary of Environmental Consequences ..............................................................4-995-1 Resource Agency Group Membership .......................................................................... 5-15-2 Resource Agency Group Meetings................................................................................ 5-35-3 Municipal Groups Meetings.......................................................................................... 5-45-4 Technical Advisory Group Membership....................................................................... 5-55-5 Technical Advisory Group Meetings ............................................................................ 5-65-6 Lake County Board Joint Committee Meetings............................................................. 5-75-7 Group Meeting List.......................................................................................................5-105-8 Newsletter Overview....................................................................................................5-115-9 Summary of Comments Regarding the IL 53 Set of Improvements ............................5-12
FiguresS-1 Alternative Development and Evaluation Process ................................................... ES-16S-2 GIS Database .............................................................................................................. ES-17S-3 Study Area Map ......................................................................................................... ES-18S-4 No-Action Roadway and Transit Improvements ...................................................... ES-19S-5 Finalist Alternative Components .............................................................................. ES-20S-6 Refined Finalist IL 53 Freeway/Tollway Alternative ............................................... ES-21S-7 Refined Finalist IL 83/US 45 with US 12 Alternative ............................................... ES-22S-8 Proposed Rail Improvements .................................................................................... ES-23S-9 Proposed Express Bus Service.................................................................................... ES-24S-10 Proposed Bus Service Improvements and Transportation Centers ......................... ES-25S-11 Existing and Proposed Bikeways with Major Employment Centers ....................... ES-26

CONTENTS
S-12 2020 Lake County Population .................................................................................. ES-271-1 Study Area Map ............................................................................................................. 1-91-2 Lake County Population and Employment Growth ....................................................1-101-3 Population Change 1970-1990 .......................................................................................1-111-4 Employment Change 1970-1990 ....................................................................................1-121-5 Population Change 1990-2020 .......................................................................................1-131-6 Population and Employment Growth 1990-2020 .........................................................1-141-7 Travel Patterns...............................................................................................................1-152-1 Population (1970 and 1990) by Township .....................................................................2-512-2 Minority Concentration.................................................................................................2-522-3 Sewered Area .................................................................................................................2-532-4 Roadway, Rail, Bus Routes and Airport Facilities.........................................................2-542-5 Existing Agricultural Land............................................................................................2-552-6 Select Crop Production in Illinois, 1987-1997 ................................................................2-562-7 Surficial Geology and Mineral Resource Operations....................................................2-572-8 Lake County Mineral Operation Locations...................................................................2-582-9 Generalized Column of Rock Stratigraphic Units and Aquifers in Lake County ........2-592-10 East/West Cross Section of Bedrock Underlying Lake County, Illinois.....................2-602-11 Lake County Section of the “Berg Map” Potential for Contamination of Shallow Aquifers
in Illinois ......................................................................................................................2-612-12 Major Waterways, Watersheds and Floodplains ........................................................2-622-13 LCWI Wetlands ...........................................................................................................2-632-14 High Quality ADID Sites.............................................................................................2-642-15 ADID Sites and Designated Lands ..............................................................................2-652-16 Typical Floodplain Cross Section ................................................................................2-662-17 ADID Wetlands Harboring T&E Species.....................................................................2-672-18 Listed Species Habitat..................................................................................................2-682-19 State Parks, County Forest Preserves and Selected Local Parks .................................2-692-20 Nature Preserves and Illinois Natural Area Sites........................................................2-702-21 Typical Traffic Noise Levels ........................................................................................2-712-22 Archaeological Resources............................................................................................2-722-23 CERCLIS amd LUST Sites............................................................................................2-733-1 Alternatives Development and Evaluation Process......................................................3-313-2 No-Action Roadway and Transit Improvements..........................................................3-323-3 Lake County Population Employment: No-Action Alternative ...................................3-333-4 Proposed Rail Improvements........................................................................................3-343-5 Proposed Express Bus Service.......................................................................................3-353-6 Proposed Bus Service Improvements and Transportation Centers ..............................3-363-7 Preliminary Roadway Concepts ...................................................................................3-373-8 Initial Roadway Alternatives.........................................................................................3-383-9 Typical Roadway Widths..............................................................................................3-393-10 Selected Community Bypasses ....................................................................................3-403-11 Community Bypass Evaluation Summary ..................................................................3-413-12 IL 53 Corridor Study Alternate Freeway North-South Corridors...............................3-423-13 IL 53 Corridor Study Alternate Freeway North-South Corridors...............................3-433-14 IL 53 Corridor Study Alternate Freeway East Corridors ............................................3-443-15 East-West Improvement Scenario with Baseline Trip Tables......................................3-45

CONTENTS
3-16 Travel Time Comparison 2020 RTP vs. CROSSROADS..............................................3-463-17 Refined Roadway Alternatives....................................................................................3-473-18 Environmental and Societal Impacts...........................................................................3-483-19 Refined Finalist IL 53 Freeway/Tollway Alternative..................................................3-493-20 Refined Finalist IL 83/US 45 with US 12 Alternative..................................................3-503-21 Transportation System Management Measures (1990-2005).......................................3-513-22 Project No-Action (Baseline) Alternative and Bikeways with Major Employment
Centers.........................................................................................................................3-523-23 Refined Finalist IL 53 Freeway/Tollway Alternative and Bikeways with
MajorEmployment Centers Refined Finalist IL 83/US 45 with US 12 Alternative andBikeways with Major Employment Centers ...............................................................3-53
3-24 Refined Finalist IL 83/US 45 with US 12 Alternative and Bikeways with MajorEmployment Centers...................................................................................................3-54
3-25 Change in Capacity on County Roads IL 53 Freeway/Tollway Alternative vs. No-ActionAlternative...................................................................................................................3-55
3-26 Change in Capacity on County Roads IL 83/US 45 with US 12 Alternative vs. No-ActionAlternative...................................................................................................................3-56
3-27 Travel Time Difference for Trips Destined to Kenosha, WI Area ...............................3-573-28 Travel Time Difference for Trips Originating from the Vicinity of the IL 60/I-94
Interchange..................................................................................................................3-583-29 Travel Time Difference for Trips Originating from the IL 132/I-94 (Gurnee Mills)
Area .............................................................................................................................3-593-30 Travel Time Difference for Trips Originating from the Vicinity of the Lake Cook Rd./
US 12 Intersection........................................................................................................3-604-1 2020 Lake County Population .....................................................................................4-1014-2 Population Change ......................................................................................................4-1024-3 Change in Number of Households..............................................................................4-1034-4 Population Change 1990-2020 .....................................................................................4-1044-5 Population Effects of the IL 53 Freeway/Tollway Alternative ...................................4-1054-6 Population Effects of the IL 83/US 45 with US 12 Alternative ...................................4-1064-7 No-Action Alternative .................................................................................................4-1074-8 IL 53 Freeway/Tollway Alternative............................................................................4-1084-9 IL 83/US 45 with US 12 Alternative............................................................................4-1094-10 Displacements No-Action Alternative (Baseline)......................................................4-1104-11 Displacements IL 53 Freeway/Tollway Alternative .................................................4-1114-12 Displacements IL 83/US 45 with US 12 Alternative .................................................4-1124-13 Change in Employment.............................................................................................4-1134-14 Employment Effects of IL 53 Freeway/Tollway Alternative ....................................4-1144-15 Employment Effects of IL 83/US 45 with US 12 Alternative ....................................4-1154-16 Impacted ADID Sites No-Action Alternative (Baseline) ...........................................4-1164-17 Impacted Wetlands IL 53 Freeway/Tollway Alternative .........................................4-1174-18 Impacted Wetlands IL 83/US 45 with US 12 Alternative .........................................4-1184-19 Affected Wooded Areas No-Action Alternative(Baseline) .......................................4-1194-20 Affected Wooded Areas IL 53 Freeway/Tollway Alternative..................................4-1204-21 Affected Wooded Areas IL 83/US 45 with US 12 Alternative ..................................4-1214-22 Structures with Potential National Register Eligibility – IL 53 Freeway/Tollway
Alternative.................................................................................................................4-122

CONTENTS
4-23 Structures with Potential National Register Eligibility – IL 83/US 45 with US 12Alternative.................................................................................................................4-123
4-24 CERCLIS and LUST Sites No-Action Alternative (Baseline) ....................................4-1244-25 CERCLIS and LUST Sites IL 53 Freeway/Tollway Alternative ................................4-1254-26 CERCLIS and LUST Sites IL 83/US 45 with US 12 Alternative ................................4-1264-27 Potential Section 4(f) Resources No-Action Alternative (Baseline)...........................4-1274-28 Potential Section 4(f) Resources IL 53 Freeway/Tollway Alternative ......................4-1284-29 Potential Section 4(f) Resources IL 83/US 45 with US 12 Alternative ......................4-1294-30 Project Influence Zone ...............................................................................................4-1304-31 Environmental Resources with Project Influence Zone ............................................4-131
Appendixes
A Thematic Organization of GIS DatabaseB The Socio-Economic, Land Use and Accessibility Impacts of Finalist Transportation
Alternatives in Lake County, Illinois; Prepared by The al Chalabi Group, Ltd.C State Threatened and Endangered Species Present in Lake CountyD ADID WetlandsE Summary of Wetland Impact DataF Floodplain Crossings and Compensatory and Detention Storage RequirementsG Resource Agency CorrespondenceH LCTIP Newsletter Number 3—Fall 1999I LCTIP Newsletter Number 4—Summer 2000

i
Acronyms List
ACG al Chalabi Group
ADID Advanced Identified Wetlands
ADT Average Daily Traffic
ASTM American Standard of Testing Measures
BMP Best Management Practices
BSC Biological Stream Characterization
CAA Clean Air Act
CATS Chicago Area Transportation Study
CBF Chicagoland Bicycle Federation
CERCLA Comprehensive Environmental Response, Compensation, and Liability Act
CERCLIS Comprehensive Environmental Response, Compensation, and LiabilityInformation System
CEQ Council on Environmental Quality
CFR Code of Federal Regulations
CO Carbon Monoxide
CORRACTS Corrective Action Report
COSIM Carbon Monoxide Screen for Intersection Modeling
COST Citizens Organized for Sound Transportation
CP Canadian Pacific
CRP Conservation Reserve Program
CWA Clean Water Act
dB decibels
DEIS Draft Environmental Impact Statement
EAI Expansion of the Existing Airports
EJ&E Elgin, Joliet, and Eastern
FEIS Final Environmental Impact Statement
ELPC Environmental Law and Policy Center
FEMA Federal Emergency Management Agency
FHWA Federal Highway Administration
GIS Geographic Information System
HHS Health and Human Services
HMIRS Hazardous Material Information Reporting System

ACRONYMS LIST
ii
HUD U.S. Department of Housing and Urban Development
IBI Index of Biotic Integrity
IDH Illinois Division of Highways
IDNR Illinois Department of Natural Resources
IDNR-OWR Illinois Department of Natural Resources-Office of Water Resources
IDOT Illinois Department of Transportation
IEPA Illinois Environmental Protection Agency
IESPB Illinois Endangered Species Protection Board
IHPA Illinois Historic Preservation Agency
INAI Illinois Natural Areas Inventory
INHS Illinois Natural History Survey
ISGS Illinois State Geological Survey
ISTHA Illinois State Toll Highway Authority
IWPA Interagency Wetland Policy Act
LCFPD Lake County Forest Preserve District
LCTIP Lake County Transportation Improvement Project
LCDOT Lake County Department of Transportation
LCWI Lake County Wetland Inventory
LUST Leaking Underground Storage Tanks
MBI Macroinvertebrate Biotic Index
MD Milwaukee District
MG Municipal Groups
MPO Metropolitan Planning Organization
NAAQS National Ambient Air Quality Standards
NAMS National Air Monitoring Station
NCS North Central Service
NEPA National Environmental Policy Act
NFA No Further Action
NFIP National Flood Insurance Study Program
NIPC Northeastern Illinois Planning Commission
NO2 Nitrogen Dioxide
NPC National Project Commission
NPDES National Pollutant Discharge Elimination System
NPL National Priority List
NRCS National Resource Conservation Service

ACRONYMS LIST
iii
NRHP National Register of Historic Places
NWI National Wetland Inventory
O3 Ozone
PAMS Photochemical Assessment Monitoring Site
Pb Lead
PM10 particulate matter
ppm parts per million
RAG Resource Agency Group
RCRA Recovery Act
RCRIS Recovery Information System
ROD Record of Decision
RTA Regional Transportation Authority
RTP Regional Transportation Plan
SHPO State Historic Preservation Officer
SHWS State Hazardous Waste Sites
SIP State Implementation Plan
SLAMS State/Local Monitoring System
SMC Lake County Stormwater Management Commission
SO2 Sulfur Dioxide
SOV Single-occupancy vehicle
SPMS Special Purpose Monitoring Station
SRA Strategic Regional Arterials
SWCD Soil & Water Conservation District
TAG Technical Advisory Group
TAZ Traffic Analysis Zones
TDM Travel demand management
TIP Transportation Improvement Program
TMA Transportation Management Association
TMDL total maximum daily load
TNM Traffic Noise Model
TSM Transportation system management
UP Union Pacific
USACOE US Army Corp of Engineers
USFWS US Fish and Wildlife Service
USDA-NRCS US Department of Agriculture–Natural Resources Conservation Service

ACRONYMS LIST
iv
USDOT US Department of Transportation
USEPA US Environmental Protection Agency
USGS US Geological Survey
USNPS US National Park Service
VHD Vehicle hours of delay
VMT Vehicle miles of travel
VOCs Volatile organic compounds
WDO Lake County Watershed Development Ordinance
WWTP Wastewater treatment plants

ES-1
Executive Summary
IntroductionLake County has an abundance of vibrantcommunities, growing employment centers,natural resources—and traffic congestion.According to the 2000 census, the county hasgrown to over 640,000 residents, alreadysurpassing the population forecasted for theyear 2010. The county’s rapid developmenthas outpaced its transportation infrastructure,making congestion relief the top priority ofresidents, community leaders, and electedofficials. In response, the Illinois Departmentof Transportation (IDOT) and the Illinois StateToll Highway Authority (ISTHA) formed theLake County Transportation ImprovementProject (LCTIP). The LCTIP planningprocess, which began in the spring of 1998,has four main objectives:
• Identify the major congestion problems,
• Recommend a package of improvements,
• Determine whether the IL 53 extension ispart of the comprehensive transportationsolution, and
• Provide information to Lake County andothers to assist their transportationplanning efforts.
The LCTIP process (Figure S-1) has used aninnovative approach toward the developmentof transportation improvements, taking acomprehensive look at the transportationneeds, and examining solutions that are bothbroad in type and geography. Extensive publicoutreach accompanied the technical workthroughout the planning process. The outcomefrom this process was two finalist buildalternatives that emerged from a thorough andcomprehensive alternatives evaluation. Thesealternatives have been developed at asufficient level of detail to both comparativelyevaluate their travel benefits as well as theirenvironmental effects. The environmentalanalysis contained in this document iscomprehensive in its coverage of resource
issues; however, for practical purposes, thelarge study area required the use of availableinformation provided by resource andplanning agencies. Overall, the purpose of theplanning process is to provide an analysis oftransportation alternatives at a sufficient levelof detail to assist decision-makers in theselection of a preferred alternative.
About the LCTIP DraftEnvironmental ImpactStatementThis Executive Summary provides anoverview of the transportation, environmental,and socioeconomic effects of two finalist buildalternatives being considered, as well as a No-Action Alternative (Baseline). Companion tothis Executive Summary is the DraftEnvironmental Impact Statement (DEIS). AnEnvironmental Impact Statement is preparedfor all major Federal actions that willsignificantly effect the quality of the humanenvironment, as mandated by the NationalEnvironmental Policy Act (NEPA), andconsistent with the environmental technicalguidance provided by the Federal HighwayAdministration.1 The LCTIP has the potentialfor requiring federal actions, including the useof federal funds for a portion or all of theimprovements associated with either of thefinalist build alternatives or the No-ActionAlternative (Baseline), as well as regulatorypermits for impacts on navigable waterways,and jurisdictional wetlands. Regulatoryagencies, such as the U.S. Army Corps ofEngineers, are not being requested at this timeto consider the granting of any permits. Afterselection of a preferred alternative,supplemental studies would be required, at acorridor level of detail, as part of a formalconsultation process regarding any requiredpermits. These agencies, however, are being
1 FHWA Technical Advisory T 6640.8A

EXECUTIVE SUMMARY
ES-2
asked to review this planning process and theenvironmental consequences of the proposedalternatives and provide any comments relatedto the process or the environmentalconsequences associated with the alternativesconsidered in the DEIS.
The LCTIP DEIS addresses the environmentalissues specified by the federal guidance.However, there are three aspects of theanalysis that required special approaches.
• First, separate population, employmentand travel demand forecasts weredeveloped for each project alternative.These forecasts were used to rigorouslyassess travel performance and identifypotential secondary and cumulativeimpacts.
• Second, the analysis considers thepotential for Section 4(f) (U.S.Department of Transportation Act of1966) resource involvement (publicly-owned parks, recreation areas, wildlifeand waterfowl refuges, and historic sitesof national, state, or local significance);however, this analysis does not represent aformal Section 4(f) evaluation. At thisstage of analysis, the project alternativesrepresent a preliminary concept that wouldbe subject to more detailed engineeringanalysis that could possibly avoid orminimize the effects to Section 4(f)resources. Further study is also needed toformally determine the applicability ofSection 4(f) for some sites.
• Third, the analysis of environmentaleffects is largely based on existing andavailable data provided by resource andplanning agencies. The extensivetransportation improvements required apractical approach for considering theenvironmental effects across a large studyarea. Existing data were refined with fieldreconnaissance as necessary. This datawas compiled in a GeographicalInformation System (GIS) databaseconsisting of 80 data layers (Figure S-2).
In general, the processing of an EnvironmentalImpact Statement (EIS) is carried out in two
stages. During the first stage, the DEIS isprepared and distributed for review andcomment to federal, state, and local agencieswith jurisdiction by law or special expertise,and the public. During this comment period,which lasts 45 days, a Public Hearing is held.
Following the public comment period,preparation can begin on the Final EIS. In thecase of the LCTIP, a Final EIS and formalRecord of Decision (ROD) would be preparedonce a preferred alternative is selected. TheFEIS/ROD would document the rationale forselection of the preferred alternative andprovide a foundation for the county and othersto assist their planning efforts. Beyond theFEIS/ROD, supplemental planning studies,including detailed engineering design andrefined environmental analysis, would beconducted for logical portions of the preferredalternative.
The Role of the SponsoringAgenciesThe sponsoring agencies, IDOT and ISTHA,have solicited the involvement oftransportation providers, planning agencies,elected officials, and the public through avariety of forums. The planning process hasproduced several major outcomes including:
• A comprehensive two-way dialogueregarding transportation issues at alllevels, residents, interested groups,agencies, and elected officials ,
• A comprehensive assessment of thetransportation problems and needs in LakeCounty,
• A rigorous process for developing andevaluating transportation alternativesleading to the recommendation of twofinalist build alternatives and a No-ActionAlternative (Baseline) for detailed study,and
• A foundation to Lake County and othertransportation providers for their owntransportation facility planning efforts.

EXECUTIVE SUMMARY
ES-3
The sponsoring agencies will use thecombined content of the study process and theinformation contained in the DEIS to assist intheir decision to select a preferred alternative.
Study AreaThe study area includes all of Lake County,Illinois, and portions of eastern McHenryCounty and northern Cook County(Figure S-3). Lake County is part of theChicago metropolitan region.2 The Chicagoregion, comprised of six counties (Cook,DuPage, Kane, Lake, McHenry, and Will), hasa diverse economic base. Long known for itsindustrial activity, the region also housesmany corporate headquarters, key educationaland research institutions, and the center of thenation’s transportation network, and is a majorforce in financial markets. Located 41.8 km(26 mi) from Chicago’s loop and 54.7 km(34 mi) from downtown Milwaukee, LakeCounty enjoys a strategic geographic positionas a gateway to the state and the metropolitanarea, and serves as a critical link in theinterregional transportation system. The studyarea covers roughly 1,295 km2 (500 mi2), andincludes over 70 incorporated cities andvillages.
Transportation NeedDuring the early steps of the LCTIP, a needsanalysis was conducted to evaluate the range oftransportation issues and problems for theexisting roadway and transit systems in thestudy area. This evaluation involved technicalanalyses, as well as the gathering ofinformation and experiences fromtransportation agencies, elected officials, andthe public. The transportation needs identifiedin the study area are extensive—see theLCTIP’s Transportation System PerformanceReport (January 1999) for complete details. Thefollowing are some of the major findings:
2 The regional discussion focuses on those counties inthe Northeastern Illinois Planning Commission jurisdiction.These include Cook, DuPage, Kane, Lake, McHenry, andWill counties.
• Development has outpaced transportationimprovements.
• North-south travel patterns arepredominant.
• Congestion is widespread. Currently, one-third of the roadway network is congestedduring peak travel periods.
• Nearly 90 percent of all work trips aremade by automobiles.
• Less than 5 percent of all work trips aremade by transit.
• Lake County experiences nearly1.73 million daily vehicle trips; one-halfstart and end in the county, and the otherhalf either travel into, leave from, or passthrough the county.
• Nearly 50 percent of Lake County’s railstations have insufficient parking.
During the early stage of the study, surveyswere undertaken to gather opinions ofresidents, agencies, and elected officialsconcerning the transportation issues in LakeCounty. Respondents consistently citedcongestion as the most important quality oflife issue. Respondents broadly supportedmajor highway improvements as a means torelieve congestion, followed by transit.
By 2020, congestion will encompass most ofLake County’s roadways. Even withimplementation of committed and reasonablyexpected improvements, congestion willworsen considerably by the year 2020. Majorimprovements are needed in Lake County toprevent gridlock.3 On the basis of acomprehensive and thorough assessment ofthe existing transportation needs in the county(LCTIP 1999), the LCTIP resolved to focustheir effort on major congestion problems , andin doing so, also provide a foundation fortransportation planning by other agencies. Themajor transportation needs are to:
• Improve north-south travel capacity andefficiency,
3 LCTIP No-Action Alternative (Baseline). See also theDEIS, Section 3, Alternatives.

EXECUTIVE SUMMARY
ES-4
• Improve regional and local travel,
• Improve safety, and
• Improve modal connections.
These four basic needs served as the cornerstones of the project that served to define therange of reasonable transportation alternativesconsidered in this process, as well as themeasures used to comparatively evaluate theirperformance. For more details regardingtransportation needs, refer to the DEIS,Section 1, Purpose and Need.
Alternatives Developmentand Evaluation ProcessThe LCTIP developed a wide range oftransportation alternatives based on the needsstated above. The process began with thedevelopment of a No-Action Alternative(Baseline) that identified the highway andtransit improvements likely to be constructedover the next 20 years regardless of any othermajor transportation improvements. TheBaseline includes adding travel lanes to74 miles of existing roadways and additionalrail and bus service (Figure S-4). Even with allof these improvements, congestion isestimated to double by the year 2020. For thisreason, the Baseline represents a starting pointfor developing alternatives that address themajor transportation needs in Lake County.
The alternatives development process includeda thorough examination of a wide range oftransportation improvement options,including: roadway, transit, non-motorized(pedestrian and bike), and transportationsystem management/travel demandmanagement strategies. The process wouldconclude with finalist alternatives thatincluded several components (Figure S-5).The following summarizes the major featuresof the alternatives development and evaluationprocess:
• The LCTIP conducted an extensiveevaluation of transit improvements. Thedevelopment of these improvements wasaccomplished by working directly with the
transit experts at RTA, Metra, and Pace.The improvements, totaling nearly$700 million, include expanded commuterrail service, additional stations, additionalstation parking, bus service expansion,transfer stations between rail and busservices, park-and-ride lots, and bicycleand pedestrian upgrades.
• The LCTIP developed a number ofroadway options with an innovativecomputer-aided approach, targeting themost congested routes and the mosteffective combinations of improvements.The initial range of alternatives wereestablished with the use of a transportationperformance benchmark. As a result, eachof the initial alternatives provided acomparable level of broad, systemwidetransportation benefits. In the beginning ofthe process, 12 roadway options weredeveloped, which were reduced to nine,and later reduced to seven for detailedevaluation and screening. Engineeringrefinements were added to the sevenroadway options reflecting environmentalconcerns and engineering enhancements,including interchanges, expandedintersections, feeder roads, shiftedalignments, constrained roadwayfootprints, and community bypasses.
• The seven roadway options were evaluatedin detail using transportation measures thatreflect the project’s purpose and need. Thespecific transportation measures used tocompare the roadway options were traveltime savings, traffic reduction on north-south roads, and uncongested travel onnorth-south roads. Based upon theevaluation results, the two top performerswere the IL 83/US 45 with US 12Alternative and the IL 53 Freeway/TollwayAlternative. Both options were consistentlyin the top end of each measure, leading totheir selection as finalist alternatives (seeFigures S-6 and S-7). Recommendedupgrades to the rail and bus transit systemswere also identified and will be common tothe finalist alternatives mentioned above.These alternatives, along with the No-Action Alternative (Baseline), were

EXECUTIVE SUMMARY
ES-5
examined in more detail, which is fullydocumented in the DEIS, Section 3,Alternatives, and Section 4, EnvironmentalConsequences.
• Transportation System Management(TSM) and Travel Demand Management(TDM) were considered as part of theroadway improvements. TSM strategiesare designed to make transportationfacilities function more effectively, workmore reliably, and work more safely.TDM strategies are designed to decreasevehicle demand on the roadway system byincreasing vehicle occupancy or changingthe attractiveness of competing modes oftransportation.
• Environmental resource effects wereconsidered early and throughout thealternative development and evaluationprocess. Considerable effort was made toavoid or minimize impacts during eachstage of alternative development. Theenvironmental considerations associatedwith the process have been effective atminimizing environmental impacts andunderstanding the relative magnitude ofenvironmental impact.
Public InvolvementThe LCTIP implemented an extensive publicinvolvement program designed to encouragemaximum input from agencies, transportationand planning organizations, business and civicgroups, as well as area residents. The LCTIPhas hosted or participated in nearly100 meetings, including forums withinterested groups, two major publicinformational meetings, a transportation fair,and over two dozen study group meetings. Thestudy groups consisted of representatives fromresource and regulatory agencies,transportation service providers, planningorganizations , and elected officials. The publicoutreach program also included:
• A local project office, which served as adrop-in center for interested individuals todiscuss the project or review specificplans,
• Regular newsletters that provide detailedinformation on project activities andprogress, and provide an opportunity forpublic comment (distribution of over6,000),
• A web site, which includes studyinformation, summaries of meetingminutes, reports, and an opportunity forthe public to send comments and feedbackto the project team (over 5,000 visitors),and
• Extensive media coverage.
Through this structured program, everyonewith an interest in transportation has had theopportunity to receive study information andoffer input to the study.
The LCTIP is a collective planning effort thathas garnered widespread support through itsoutreach efforts, bringing togethertransportation service providers, communities,and elected officials. The study has embraceda process that allowed for the investigation ofa broad analysis of alternative solutions,including the ideas of others. Based on inputreceived, the LCTIP considered an east-westimprovement scenario, which focused onimproving east-west arterials, alternativesolutions put forth by others, travel benefits tothe county’s roadways, and addressed publicperceptions that smaller projects, like addingturning lanes at intersections, synchronizingtraffic signals, etc., could meet Lake County’stransportation needs.
The public involvement process that has helpedto determine the need, the objectives, and thealternatives, is a measurable success. TheLCTIP process has fostered collective planningand received widespread support from a broadcross section of the public. Public support formajor improvements (particularly theIL 53 extension) has been consistently strong,with a 2:1 margin of support at PublicInformational Meeting #1, a 4:1 margin atPublic Informational Meeting #2, and a4:1 margin of support among communities andorganizations, as noted in Table S-1 (on thefollowing page). For additional detailsregarding the LCTIP public involvement

EXECUTIVE SUMMARY
ES-6
activities, refer to the DEIS, Section 5,Coordination.
Alternatives Considered inDetail
No-Action Alternative (Baseline)The alternative development process beganwith the development of a No-ActionAlternative (Baseline) consisting oftransportation improvements, operationalimprovements, and routine repairs that areanticipated to be constructed by 2020regardless of any other major improvements.The development of the No-Action Alternative(Baseline) required extensive coordinationwith the region’s transportation serviceproviders to gather information on planned oranticipated transportation improvements in thestudy area. The 1998-2002 TransportationImprovement Program (TIP), with 48 km(30 mi) of funded improvements, was thefoundation for developing the No-ActionAlternative (Baseline).4 Recognizing thatother projects would be funded beyond 2002,an additional 71 km (44 mi) of roadwayimprovements were subsequently identified—a process that also involved close coordinationwith the transportation providers. Thus, theNo-Action Alternative (Baseline) comprises atotal of 119 km (74 mi) of lane additions toexisting roadways (Figure S-4). The No-Action Alternative (Baseline) also assumesthat routine repairs and operational
4 The best and most current information at the start of theLCTIP.
improvements would continue for the existingroadway system, and transportationimprovements identified in the 2020 RegionalTransportation Plan would be in place forthose parts of the region outside the LCTIPstudy area.
In addition to the roadway improvements, theNo-Action Alternative (Baseline) wouldinclude transit improvements consisting of thefull build out of the North Central Servicecommuter rail line (52 trains per day), fivenew Metra stations, and express bus service onselected routes. For this study, the No-ActionAlternative (Baseline) is considered either astand-alone alternative, or common to theLCTIP finalist build alternatives (i.e.,IL 53 Freeway/Tollway Alternative and theIL 83/US 45 with US 12 Alternative).
IL 53 Freeway/Tollway AlternativeThe IL 53 Freeway/Tollway Alternativeconsists of the construction of a new highwayin central Lake County either as a freeway ortollway facility (Figure S-6). This alternativewould begin at the terminus of IL 53 at Lake–Cook Road and extend north for a distance of20.1 km (12.5 mi) to a point south of IL 120.There, the alternative would continue forabout 22.7 km (14.1 mi) both to the east and tothe west, partially on new alignment. Theeastern terminus would tie into the existinginterchange complex west of US 41, and thewestern terminus would be Wilson Road atIL 120. Arterial improvements would alsoextend along existing IL 120 from WilsonRoad to the intersection of IL 60 and IL 120,
TABLE S-1Summary of Comments Regarding the IL 53 Set of Improvements
Forum Support Oppose
1999 Public Informational Meeting (percent)* 56% 33%
2000 Public Informational Meeting (percent)* 79% 19%
Communities (number) 20 2
Organizations (number) 18 7
* Total percent for the 1999 and 2000 Public Informational Meetings do not add up to 100%. The remainderis associated with other alternatives presented at the meetings.
Source: Lake County Transportation Improvement Project

EXECUTIVE SUMMARY
ES-7
as well as additional lanes on I-94, from IL120 to IL 132.
Access to the IL 53 facility would be gainedon grade-separated interchanges at majorarterials. Improvements would be made toarterial highways through the interchangeinfluence area to provide for proper roadwayoperations and safety. The length ofimprovements to arterial feeder roadsgenerally extends to the nearest majorintersection.
The IL 53 Freeway/Tollway Alternative wouldbe constructed with three through lanes in eachdirection separated by a barrier median. Thetypical right-of-way width required for theroadway is 91 m (300 ft), which would includea 23 m (76 ft) pavement (11.5 m, or 38 ft ineach direction), 8.5 m (28 ft) paved median,3.7 m (12 ft) right shoulders, and grassed areaswith roadside ditches. Where necessary toavoid critical natural and community resources,refinements have been made to the typical crosssection to avoid or minimize impacts. Theserefinements included a constrained right-of-way width of 76 m (250 ft) in spot locations.
The facility would be constructed as either afreeway or tollway. Both facility types havethe same basic design elements and similaroperational characteristics, but the tollwaywould require provision of toll collectionfacilities. However, the east leg would be non-tolled. For the purposes of this study,
construction of the alternative as a freewayversus tollway facility would be a futurefunding choice if the alternative was selected.
IL 83/US 45 with US 12 AlternativeThe IL 83/US 45 with US 12 Alternativeincludes approximately 101 km (63 mi) ofimprovements on existing roads, as well asnew alignment (Figure S-7). Approximately80 percent of the improvements are onexisting facilities and 20 percent are on newalignments to bypass more concentrated areasof development. Table S-2 summarizes theroadway improvements for this alternative.
Existing intersections and interchanges alongthe widened highway corridors would beimproved to provide reasonable trafficoperations at major highway junctions. Thetypical cross section for the proposedimprovements included in the alternativewould vary based on the type of facility andproposed number of lanes. The typical right-of-way width would generally be 40 m(130 ft) for a 4-lane arterial, 49 m (160 ft) fora 6-lane arterial, and 91 m (300 ft) for an8-lane tollway. Where it is necessary to avoidcritical natural and community resources,refinements have been made to the typicalcross section to avoid or minimize impacts.These refinements included a constrainedright-of-way width, typically to 30.5 m(100 ft) for a 4-lane arterial facility, 36.6 m
TABLE S-2IL 83/US 45 with US 12 Alternative Improvements
Roadway Improvement
Hicks Road Widen from 2 to 6 lanes from IL 53 to IL 83
IL 83 Widen from 4 to 6 lanes from Hicks Rd. to US 45
Mundelein Bypass New 4-lane road from IL 60/US 45 to IL 120 bypass
I-94 Widen from 6 to 8 lanes from IL 60 to IL 132
IL 21 Widen from 4 to 6 lanes from Lake Cook Rd. to IL 60; IL 137 to I-94
Libertyville Bypass IL 60: Widen from 4 to 6 lanes from IL 21 to I-94
St. Mary’s Rd.: Widen from 2 to 4 lanes from IL 60 to IL 137
IL 137: Widen from 4 to 6 lanes from IL 21 to I-94
US 12 Widen from 4 to 6 lanes from IL 53 to IL 176
IL 120 (New Alignment) New 4-lane arterial from Alleghany Rd. to Almond Rd.

EXECUTIVE SUMMARY
ES-8
(120 ft) for a 6-lane facility, and 76 m (250 ft)for an 8-lane facility, applied in spot locations.
Supporting ImprovementsA number of modal options were consideredduring the study of transportationimprovements, including improvements to busand rail transit, TSM and TDM strategies, andbike and pedestrian facilities. An examinationof these transportation options shows that theyplay an important role in reducing single-occupancy vehicles, even though thewidespread congestion in Lake County cannotbe satisfied by these types of improvementsalone. The proposed supporting improvementsare in addition to the No-Action Alternative(Baseline) improvements, and would becommon to the roadway build alternatives(Figures S-8 through S-11). The following is asummary of the types of recommendedstrategies and services.
• Rail—Expansion of commuter railservice, signal improvements, transferstations between lines, and theconsolidation of freight service.
• Bus—Express services, shuttle services,transfer stations, and new bus routes.
• Transportation System Management—Modernization of traffic signal controlsystems that adjust themselves to optimizetraffic flow, freeway/arterial traffic flowmanagement, incident detection andresponse, system surveillance, intersectionimprovements, communication withtraffic/transit management center, andtraveler information services.
• Travel Demand Management—Increasedrideshare opportunities, improvedpedestrian and bicycle facilities, additionalpark-and-ride facilities, expanded vanpoolprograms, parking management, and transitincentives.
• Bicycle and Pedestrian—New bicycleand pedestrian facilities along the rights-of-way of improved arterial facilities withconnection to existing paths, andextensions of existing paths withconnections to employment centers andrail stations.
Travel Performance EvaluationA comparative analysis of the finalistalternatives was conducted using severaltransportation performance measures. Asummary of the analysis is shown inTable S-3, and a brief description of theanalysis follows. The results of the analysisfor the IL 53 Freeway/Tollway Alternativeand IL 83/US 45 with US 12 Alternative arerelative to the No-Action Alternative(Baseline), year 2020.
• Travel time saved for local trips was aboutthe same for both finalist buildalternatives, with the IL 53Freeway/Tollway Alternative saving about33 hours of annual travel for the averagemotorist over the No-Action Alternative(Baseline). The IL 83/US 45 with US 12Alternative would save about 34 hoursannually.
• The IL 53 Freeway/Tollway Alternativewould provide more relief to roadways
TABLE S-3Travel Performance Comparison for Finalist Build Alternatives
Regional Travel Local Travel
AlternativeGeographic
AreaSystem
ContinuityLocalTrips
CountyRoutes
North-SouthUncongested
Lane Miles Safety
IL 53 Freeway/Tollway ü* ü ü ü üIL 83/US 45 with US 12 ü
* ü Denotes the best performing Alternative for a category.

EXECUTIVE SUMMARY
ES-9
under the county’s jurisdiction comparedto the IL 83/US 45 with US 12Alternative. The IL 53 Freeway/TollwayAlternative would result in 17 fewer lanemiles of congestion over the No-ActionAlternative (Baseline), while theIL 83/US 45 with US 12 Alternativewould result in 13 additional lane miles ofcongestion over the No-Action Alternative(Baseline).
• The IL 53 Freeway/Tollway Alternativewould reduce travel times over a larger(up to 65%) geographic area, therebyimproving regional access to a greaterextent than the IL 83/US 45 with US 12Alternative.
• Comparatively, the IL 53 Freeway/Tollway Alternative would reduce theoverall system crash rate by 7 percent,while the IL 83/US 45 with US 12Alternative would reduce the crash rate byabout 1%, compared to the No-ActionAlternative (Baseline).
• The IL 53 Freeway/Tollway Alternativewould have less congestion on existingnorth-south routes than the IL 83/US 45with US 12 Alternative. The analysisindicated that when compared to the No-Action Alternative (Baseline), theIL 53 Freeway/Tollway Alternative wouldimprove conditions by 12 percent, whilethe IL 83/US 45 with US 12 Alternativewould improve conditions by 7 percent.
• Both build alternatives offer opportunitiesfor improved modal connections includingaccess to planned park-and-ride facilities,bicycle and pedestrian connections,existing and planned rail stations, andaccommodation of local and express busservice.
Environmental ImpactsThe primary impacts associated with thefinalist alternatives are residential andcommercial displacements, wetland resources,floodplains, forest preserves and parks,farmland, and cultural resources. The
population growth-inducing aspects of thebuild alternatives are minor. Regardless of thealternative, there would be less than a4 percent addition to the 2020 population withthe build alternatives; thus, 96 percent of thepopulation will be in place, regardless of therecommended alternative (Figure S-12).Efforts were made throughout the alternativesdevelopment process to minimize impacts tocritical resources. Although each of thealternatives could potentially impact Section4(f) resources (i.e., publicly owned landsincluding county forest preserve property andparks), the range of impact for any alternativewould be 8 ha (20 ac) or less. Each alternativewould also impact less than 40 ha (100 ac) ofwetlands. Impacts to cultural resource sitesthat have the potential to be eligible for theNational Register of Historic Places rangefrom less than 10 to more than 20. Residentialand commercial displacements associated witheach alternative range from less than 100 towell over 300. Additionally, displacement ofoff-street parking is substantial for one of thealternatives, and at minor levels for the others.These and other environmental impacts arediscussed in detail in Section 4 of the DEIS,Environmental Consequences. A briefdiscussion of the environmental impacts isprovided below, in addition to a summary inTable S-4 (on pages ES-14 and ES-15).
Socioeconomics• Influence on Growth—Using a
methodology endorsed by theNortheastern Illinois PlanningCommission (NIPC), the LCTIPdeveloped specific population andemployment forecasts for the No-ActionAlternative (Baseline) and buildalternatives. The analysis showed thatnearly 300,000 new residents would beadded to the county (over 1990 levels)regardless of either build alternative beingimplemented. To put the populationgrowth issue in perspective, about96 percent of Lake County’s population isexpected to occur even with the No-Action Alternative (Baseline). Therewould be less than a 4 percent difference

EXECUTIVE SUMMARY
ES-10
with the implementation of either buildalternative. The forecasts for the buildalternatives showed that the additionalpopulation would mostly concentrate inthe central and north central parts of thecounty. Overall, the growth inducingaspects of the build alternatives are minorcompared to the growth expected by theyear 2020 without major transportationimprovements (Figure S-12).
• Community and Land Use Change—Theeffects on community cohesion and thepattern of land use development would varyslightly depending on the alternative. TheNo-Action Alternative (Baseline) wouldhave no substantive effect on communityfunction or the pattern of future landdevelopment. The IL 83/US 45 with US 12Alternative would have no material effectupon community function, but wouldslightly influence development patterns inthe central and north central parts of thecounty. Lastly, the IL 53 Freeway/TollwayAlternative would introduce a physicalbarrier into the landscape that would notnecessarily disrupt community function, butwould require special design considerationsto address roadway proximity impacts.Furthermore, this alternative wouldinfluence development patterns in thecentral and north central part of the county.
• Residential and CommercialDisplacements—The displacement ofresidential and commercial structures iswidely varied depending upon the projectalternative. The No-Action Alternative(Baseline) would have the fewest numberof displacements with 90, and the IL 53Freeway/Tollway Alternative would havethe next least with 122 additionaldisplacements. The IL 83/US 45 withUS 12 Alternative would have the greatestnumber of displacements with a total of382, of which, over half are businesses.The business displacements for the buildalternatives are expected to effect3,428 employees under the IL 83/US 45with US 12 Alternative, and 178 employeesunder the IL 53 Freeway/TollwayAlternative. Numerous businesses would
also be affected by parking losses eventhough the business would remain. TheIL 83/US 45 with US 12 Alternative woulddisplace 2,514 parking spaces, whereas theIL 53 Freeway/Tollway Alternative woulddisplace 109 spaces.5
AgricultureAgriculture is a declining activity in LakeCounty with farmlands giving way todevelopment at a rapid pace. Since 1950, LakeCounty has lost 73% of its farmland. Basedupon this rapid pace of development, most ofthe developable lands in the county will beexhausted in the next 20 to 30 years. TheIL 53 Freeway/Tollway Alternative wouldhave the most direct impact upon farmlandresources with the displacement of 315 ha(780 ac). The IL 83/US 45 with US 12Alternative would have the second greatestimpact on farmlands with the displacement of91 ha (226 ac). The No-Action Alternative(Baseline) would have the least impact withthe displacement of 32 ha (80 ac) of farmland.
Natural Resources• Wetlands—Each of the project
alternatives would directly impact lessthan 40 ha (100 ac) of wetlands. TheIL 53 Freeway/Tollway Alternative wouldimpact 37.2 ha (91.7 ac) of wetlands, ofwhich, 39.3 percent are high to moderatequality wetlands. The IL 83/US 45 withUS 12 Alternative would impact 23.4 ha(57.7 ac) of wetlands, with 64.6 percenthigh to moderate quality wetlands. TheNo-Action Alternative (Baseline) woulddirectly impact 31.6 ha (78.1 ac) ofwetlands.
• Water Quality—Potential changes inground water or surface water qualitywere evaluated. The potential waterquality impact to residences relying uponwells would be greater with the IL 83/US45 with US 12 Alternative than for the
5 Parking displacements potentially have short-term andlong-term adverse affects on business revenues ;therefore, they have been considered for the buildalternatives.

EXECUTIVE SUMMARY
ES-11
others. Stream concentrations of heavymetals will remain below applicable waterquality standards for all three alternatives.Impacts from chlorides would not be aconcern for either the IL 53 Freeway/Tollway Alternative or the No-ActionAlternative (Baseline). With theIL 83/US 45 with US 12 Alternative, onewatershed would experience anexceedance of the chloride water qualitystandard. This excursion would occur in asmall area and mitigation measures orchanges in drainage patterns could reducethis impact.
• Threatened and Endangered Species—The No-Action Alternative (Baseline) andthe IL 83/US 45 with US 12 Alternativewould potentially impact three IllinoisNatural Area Inventory (INAI) sites. Themost substantive impact would occur withthe No-Action Alternative (Baseline),which would involve the Oak GroveBotanical Area, with one federal-listedplant species (Eastern Prairie FringeOrchid). The IL 53 Freeway/TollwayAlternative does not directly impact anyINAI sites. Both the IL 53 Freeway/Tollway Alternative and the IL 83/US 45with US 12 Alternative could potentiallyimpact one state -listed fish species (IowaDarter). Future work associated with thepreferred alternative would includedetailed threatened and endangeredspecies field surveys to determine thepresence of listed species.
• Floodplains —Lake County is rich inwater resources, including lakes, rivers,and streams. These numerous watercourses would be encountered to someextent by the project alternatives. TheIL 53 Freeway/Tollway Alternative wouldencroach upon 10 floodplains, whereas theIL 83/US 45 with US 12 Alternativewould encroach upon 33 floodplains. TheNo-Action Alternative (Baseline) wouldencroach upon the greatest number offloodplains with 38.
Air QualityConformity with air quality standards isassessed as part of the development of eachsuccessive Regional Transportation Plan(RTP) for Northeastern Illinois and StateTransportation Improvement Plan (TIP). Themost recent plans, the year 2020 RTP and2001-2006 TIP, which include an extension ofIL 53 in Lake County, were found to conformwith federal air quality standards. At theproject level, a micro-scale carbon monoxideanalysis was performed, which indicated thatthe No-Action Alternative (Baseline) andbuild alternatives were also compliant with airquality standards.
Traffic NoiseNoise impacts were assessed to determine therelative degree of potential noise impact forthe project alternatives. Traffic noise modelingwas performed to determine the areas ofpotential impact and the number of residentialproperties effected by traffic noise exceedingthe accepted Noise Abatement Criteria . TheNo-Action Alternative (Baseline) would havethe greatest number of potentia l impacts with1,211 residential properties, followed by theIL 53 Freeway/Tollway Alternative with417 properties, and the IL 83/US 45 withUS 12 Alternative with 273 properties.Additional studies would be required todetermine more precise impacts and thefeasibility of noise abatement measures suchas berms or walls.

EXECUTIVE SUMMARY
ES-12
Cultural ResourcesCultural resource impacts were assessed toidentify potential effects for the projectalternatives. The assessment relied upon theuse of existing and available data, and limitedfield observations and reconnaissance. The IL53 Freeway/Tollway Alternative couldpotentially impact three historic structures andfour archaeological sites. The IL 83/US 45with US 12 Alternative could potentiallyimpact six historic structures and twoarchaeological sites. The No-ActionAlternative (Baseline) could potentiallyimpact the greatest number of culturalresources with 13 historic structures and10 archaeological sites. Future analysis for thepreferred alternative would include efforts tofurther avoid or minimize possible effects,conduct field investigations fully compliantwith current practices, and identify mitigationmeasures where impact is unavoidable.
Parks and Forest PreservesThe No-Action Alternative (Baseline) andbuild alternatives would impact park andforest preserve lands (Section 4(f) properties).The No-Action Alternative (Baseline) wouldpotentially impact 14 forest preserves and8 parks (7 ha or 17 ac). The IL 83/US 45 withUS 12 Alternative would potentially impact7 forest preserves and 12 parks (8 ha or 19 ac),whereas the IL 53 Freeway/TollwayAlternative would impact 4 forest preservesand 1 park(8 ha or 20 ac). This relatively lowlevel of impact reflects efforts that have beenmade throughout the planning process to avoidor minimize impacts to these lands and othersensitive resources. Additional analysis andcoordination would be performed insubsequent phases to make formal Section 4(f)determinations and further avoid or minimizethese impacts.
Many other resource issues are thoroughlydiscussed in Section 4 of the DEIS,
6 Parking displacements potentially have short-term andlong-term adverse affects on business revenues ;therefore, they have been considered for the buildalternatives.
Environmental Consequences. Please refer tothis section for more details.
SummaryThe LCTIP has implemented a structured,rigorous technical process for developing andevaluating a broad range of transportationalternatives. State-of-the-art technical tools andinnovative techniques were used to define thetransportation problems and evaluate potentialsolutions in a study area that spans hundreds ofmiles of roadways, three counties,70 communities and approximately129,500 hectares (500 square miles) —to anequal level of detail. This effort has beensupported by extensive input from area residents,interested groups, agencies, transportationproviders and elected officials.
The avoidance or minimization of impacts toenvironmental resources was a key considerationearly and throughout the planning process. Thedifferences in impacts across the suite of initialalternatives were not distinguishing. As a result,the evaluation process focused upon travelperformance measures, which were closelylinked to the project’s purpose and need. Onthe basis of this evaluation, the IL 53 Freeway/Tollway Alternative and IL 83/US 45 withUS 12 Alternative were selected as finalists.Each finalist and the No-Action Alternative(Baseline)were then further refined, includingthe development of separate population,employment and travel demand forecasts.These forecasts were used to more rigorouslyassess the alternative’s travel performance andidentify potential secondary and cumulativeimpacts.
The LCTIP worked closely with staff at theRTA, Metra, and Pace to develop acomprehensive package of proposed transitimprovements that are common to either of theroadway finalists. Proposed rail improvementsinclude expansion of commuter rail service,signal improvements, transfer stations betweenlines, and the consolidation of freight service.Proposed improvements to bus service includeexpress services, shuttle services, transferstations, and new bus routes. Other supporting

EXECUTIVE SUMMARY
ES-13
improvements include potential upgrades tobike and pedestrian facilities, as well as traveldemand management and transportationsystem management strategies.
Through a comprehensive technical analysisand extensive public outreach, the LCTIP hasidentified a system of strategic roadway, rail,bus and TSM/TDM strategies necessary tohelp address the major congestion problemsfacing Lake County. The technical work andinput received as part of the LCTIP will beimportant factors in a decision by IDOT andISTHA regarding a preferred alternative andsubsequent planning activities.

EXECUTIVE SUMMARY
ES-14
TABLE S-4Summary of Environmental Consequences
No-Action IL 53 Freeway/Tollway IL 83/US 45 with US 12
Cost (1999 dollars) $483 million $861 million $1.095 billion
Socioeconomic Impacts
Population (2020) 796,942 27,500 more people over No-Actiona 18,000 more people over No-Actiona
Households (2020) 290,570 10,962 more households over No-Actionb 7,640 more households over No-Actionb
Employment (2020) 389,545 4,444 more jobs over No-Actionb 4,200 more jobs over No-Actionb
Community and Land Use Changes No change to communityfunction or the pattern offuture land development.
Since the early 1960’s the communitieshave considered the potential for a majornew highway in central Lake County; andtherefore have been able to plan for itspotential change to land use.
No material change in communityfunction, or pattern of future landdevelopment.
New Right-of-Wayc 195 ha (482 ac) 513 ha (1,268 ac) 248 ha (613 ac)
Residential Relocations (Additional AncillaryOutbuildings associated with ResidentialRelocations)
67 113 (45) 187 (25)
Business Relocations 23 9 195
Parking Impacts (# of displaced parkingspaces)
—d 109 (0) 2,514 (258)
Percent of Total Assessed Value Converted 0.20 0.30 0.47
Environmental Justice No disproportional impact No disproportional impact No disproportional impact
Public Services and Facilities 0 0 9
Agricultural Impacts
Direct Farmland Impacts 32 ha (80 ac) 315 ha (780 ac) 91 ha (226 ac)
Market Value of Affected Crops $21,000 $205,000 $59,300
Farm Operations Minimal effect 36 farm parcels 20 farm parcels
Natural Resources
Wetlands (all direct impacts) 32 ha (78 ac) 37 ha (92 ac) 23 ha (58 ac)
ADID Wetlands 5 ha (13 ac) 4 ha (9 ac) 2 ha (4 ac)
Class I —e 5 ha (12 ac) 1 ha (2 ac)
Class II —e 10 ha (25 ac) 14 ha (35 ac)
Class III —e 23 ha (56 ac) 8 ha (20 ac)

EXECUTIVE SUMMARY
ES-15
No-Action IL 53 Freeway/Tollway IL 83/US 45 with US 12
Floodplain Impacts 38 FIS floodplains 10 FIS 33 FIS
Longitudinal Encroachments 9 0 12
Transverse Encroachments 1 12 17
Threatened and Endangered Species 1 1 1
Water Quality Does not exceed criteria Does not exceed criteria Potentially exceeds chloride standard
Air Quality Does not exceed criteria Does not exceed criteria Does not exceed criteria
Noise 1,211 residentialstructures f
417 residential structures f 273 residential structures f
Potential Section 4(f) ResourcesCultural Resource Impacts
Historic Structures 13g 3 6
Archaeological Sites 10 4 2
Potential Forest Preserve and Local Park4(f) Impacts
7 ha (17 ac) 8 ha (20 ac) 8 ha (19 ac)
No. of Forest Preserves 14 4 7
No. of Local Parks 8 1 12
Special Waste
CERCLIS 0 0 0
LUST 20 3 34
Note: For purposes of a summary, all area values are rounded to the nearest whole number. Impacts are summarized individually for each alternative.
a Represents additional population for roadway improvements only.b Represents additional households for both roadway and transit improvements.c Includes new right-of-way requirements only—use of existing right-of-way would be associated with each alternative.d Parking displacements were not investigated for the No-Action Alternative (Baseline).e No field verification of wetlands performed for No-Action Alternative (Baseline), therefore, no qualitative assessment completed.f Structures near the proposed improvements that would exceed the noise abatement criteria for residential areas—does not include those that would be displaced.g Based on available Phase 1 preliminary engineering and environmental documentation reports .

1-1
SECTION 1
Purpose and Need
1.1 Project PurposeThe purpose of the Lake CountyTransportation Improvement Project (LCTIP)is to identify the major transportationimprovements that would help to address thekey congestion and mobility problems in thestudy area through a system of strategicroadway, rail, and bus improvements.
Since 1998, the LCTIP has conducted aprocess to identify the major transportationimprovement needs in Lake County. Theprocess has included a detailed evaluation ofthe transportation needs of the study area, anexamination of a large number of alternativesets of transportation improvements thatwould effectively address the majortransportation needs, and an evaluation of thepotential environmental and societal impactsof the finalist alternative transportationimprovements discussed in this document.Overall, the purpose of the process and thisdocument is to provide an analysis of thefinalist alternatives at a sufficient level ofdetail to assist decision-makers in the selectionof a preferred alternative for futureimplementation in Lake County.
1.2 Background
1.2.1 Regional Planning ContextThe 2020 Regional Transportation Plan (RTP)was developed through a detailed series ofland use and transportation considerations as along-range framework for transportationstrategies and decisions in northeasternIllinois. The RTP developed and evaluatedtwo regional surface transportation scenarios:a Build scenario and a No-Build scenario.Companions to the Build and No-Buildscenarios were two future regional airportscenarios: expansion of the existing airports(O’Hare and Midway) or construction of anew airport in the south suburbs
(CATS 1997b). For the LCTIP, the expansionof the existing airports scenario will be used.
The RTP No-Build scenario and itscorresponding population and employmentforecasts assumed that only the committedprojects in the 1998-2002 TransportationImprovement Program (TIP) would be inplace by 2020.1 The RTP Build scenarioassumed that all major highway and transitprojects recommended in the 2020 RTP wouldbe in place by 2020, including the extension ofIL 53 into Lake County.
The 2020 RTP set out a comprehensivestrategy for transportation improvements inthe region. This regional transportation visionestablished the platform to conduct a focusedanalysis of transportation improvements inLake County that would achieve the RTP’sregional goals and objectives.
1.2.2 Project HistoryThe need for an improved transportationsystem in Lake County has been the focus ofyears of planning and study. As early as 1962,regional plans singled out the need for animproved north-south transportation link forthe northeastern Illinois region, referred to asthe Lake-Will Expressway, a north-southcircumferential interstate route (IDH 1963). In1964, the Department of Public Works andBuildings (currently known as the IllinoisDepartment of Transportation [IDOT])rendered a route location decision to constructIL 53 (a portion of the Lake-Will Expresswayconcept) from Dundee Road in Cook Countyto Peterson Road in Lake County (20.9 km or13 mi) as a fully access-controlled facility.
In 1969, Congress enacted the NationalEnvironmental Policy Act (NEPA), resulting inthe restructuring of the Federal HighwayAdministration’s (FHWA’s) planning
1 The 1998-2002 TIP was the current TIP available whenthe No-Action (Baseline) scenario was developed.
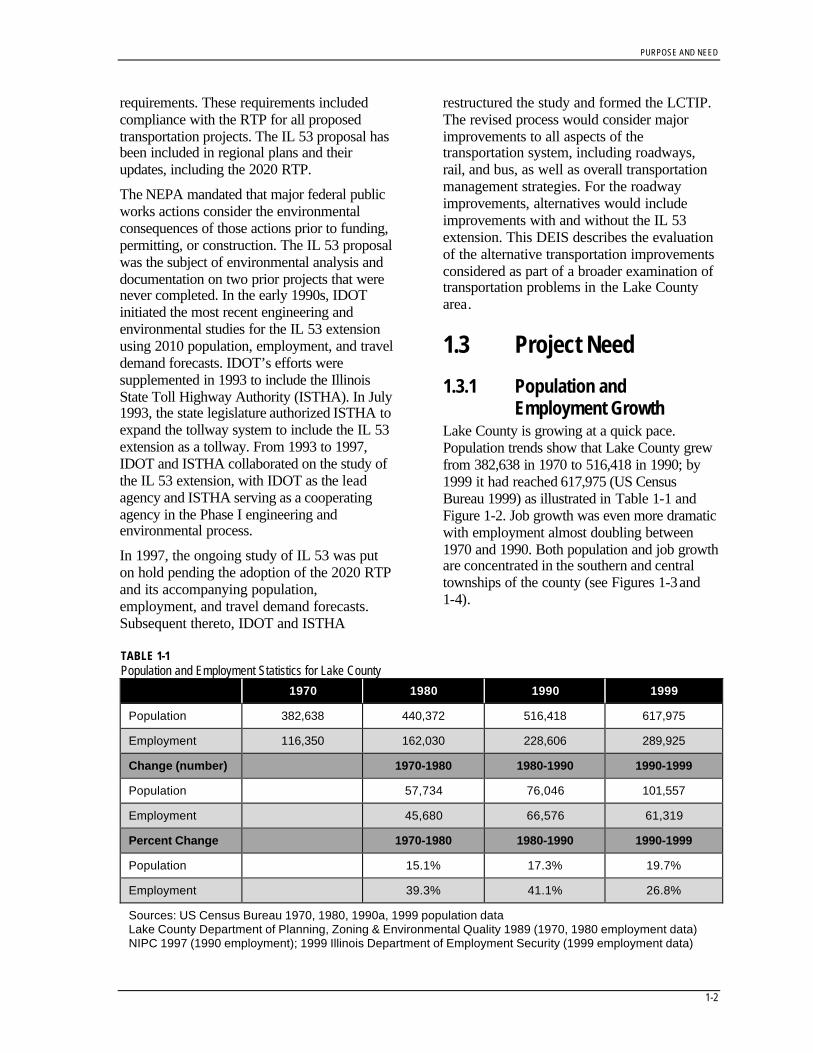
PURPOSE AND NEED
1-2
requirements. These requirements includedcompliance with the RTP for all proposedtransportation projects. The IL 53 proposal hasbeen included in regional plans and theirupdates, including the 2020 RTP.
The NEPA mandated that major federal publicworks actions consider the environmentalconsequences of those actions prior to funding,permitting, or construction. The IL 53 proposalwas the subject of environmental analysis anddocumentation on two prior projects that werenever completed. In the early 1990s, IDOTinitiated the most recent engineering andenvironmental studies for the IL 53 extensionusing 2010 population, employment, and traveldemand forecasts. IDOT’s efforts weresupplemented in 1993 to include the IllinoisState Toll Highway Authority (ISTHA). In July1993, the state legislature authorized ISTHA toexpand the tollway system to include the IL 53extension as a tollway. From 1993 to 1997,IDOT and ISTHA collaborated on the study ofthe IL 53 extension, with IDOT as the leadagency and ISTHA serving as a cooperatingagency in the Phase I engineering andenvironmental process.
In 1997, the ongoing study of IL 53 was puton hold pending the adoption of the 2020 RTPand its accompanying population,employment, and travel demand forecasts.Subsequent thereto, IDOT and ISTHA
restructured the study and formed the LCTIP.The revised process would consider majorimprovements to all aspects of thetransportation system, including roadways,rail, and bus, as well as overall transportationmanagement strategies. For the roadwayimprovements, alternatives would includeimprovements with and without the IL 53extension. This DEIS describes the evaluationof the alternative transportation improvementsconsidered as part of a broader examination oftransportation problems in the Lake Countyarea.
1.3 Project Need
1.3.1 Population andEmployment Growth
Lake County is growing at a quick pace.Population trends show that Lake County grewfrom 382,638 in 1970 to 516,418 in 1990; by1999 it had reached 617,975 (US CensusBureau 1999) as illustrated in Table 1-1 andFigure 1-2. Job growth was even more dramaticwith employment almost doubling between1970 and 1990. Both population and job growthare concentrated in the southern and centraltownships of the county (see Figures 1-3 and1-4).
TABLE 1-1Population and Employment Statistics for Lake County
1970 1980 1990 1999
Population 382,638 440,372 516,418 617,975
Employment 116,350 162,030 228,606 289,925
Change (number) 1970-1980 1980-1990 1990-1999
Population 57,734 76,046 101,557
Employment 45,680 66,576 61,319
Percent Change 1970-1980 1980-1990 1990-1999
Population 15.1% 17.3% 19.7%
Employment 39.3% 41.1% 26.8%
Sources: US Census Bureau 1970, 1980, 1990a, 1999 population dataLake County Department of Planning, Zoning & Environmental Quality 1989 (1970, 1980 employment data)NIPC 1997 (1990 employment); 1999 Illinois Department of Employment Security (1999 employment data)

PURPOSE AND NEED
1-3
Suburban growth in the Chicago metropolitanarea is similar to other urban centers across thecountry. Between 1970 and 1999, the fivesuburban counties surrounding Cook Countygrew between 60.4 and 121.3 percent (seeTable 1-2). Lake County realized an increaseof 235,337 new residents during this period,an increase of 61.5 percent. During thisperiod, Lake County had the second largestchange in actual population of any suburbancounty in the Chicago metro area.
Growth in the suburban counties is projected tocontinue into the future. The recent increase inpopulation shows that Lake County is growingat a rapid pace despite a lack of major newtransportation improvements. Populationforecasts by the Northeastern Illinois PlanningCommission (NIPC) show that an additional249,333 people will reside in Lake County by2020 (over and above 1990 population levels)without any major highway or transitimprovements (CATS 1997a). This populationgrowth is expected to be greatest in thenorthern and western portions of Lake County,where land is available for development.Regional population forecasts show thatimplementation of all the projects in the2020 RTP would add 60,530 (8 percent)additional residents to Lake County by 2020(CATS 1997a) (see Figure 1-5).
Between 1970 and 1999, employmentincreased by nearly 150 percent, or173,575 jobs. This trend is expected tocontinue with regional planning agenciesprojecting total Lake County employment tocontinue to increase from 228,606 in 1990 to
389,595 in 2020 without major transportationimprovements (see Figure 1-6). There will be160,989 new jobs in Lake County withoutprovision of transportation improvements. Theimplementation of all the projects in the 2020RTP would add an additional 4,444 jobs inLake County by 2020 (CATS 1997a). Most ofthe major employment in Lake Countycontinues to be located in the southern andeastern portions of the county.
The rate of employment growth between 1970and 1999 substantially exceeded the rate ofpopulation growth for that same period. Themigration of jobs to areas like Lake County isconsistent with manufacturing and businessinterest in locations where an abundance ofrelatively inexpensive land is available andobtainable in large parcels.
Transportation has not been, nor is expected tobe, a major driver in population growth in LakeCounty; this is supported not only by the 2020forecasts, but also by the county’s historicalgrowth patterns and geographic position in themetropolitan area. Lake County provides qualityresidential living and offers a favorable settingfor business and commerce. All of these havebeen factors in the fast-paced population growthduring the last three decades.
Overall, as population and employment haveincreased, transportation improvements havenot kept pace. Whereas population andemployment have substantially increasedbetween 1980 and 1999, less than 5 percent ofthe major roads have been improved to meetthe growing traffic demand. With the countyadding an average of 11,000 new residents per
TABLE 1-2Population Statistics for the Five Suburban Counties Surrounding Cook County
1970 1990 1999Absolute Change
1970-1999% Change1970-1999
Du Page Co. 491,882 781,666 892,547 400,665 81.5%
Kane Co. 251,005 317,471 402,622 151,617 60.4%
Lake Co. 382,638 516,418 617,975 235,337 61.5%
McHenry Co. 111,555 183,241 246,812 135,257 121.3%
Will Co. 249,498 357,313 478,392 228,894 91.7%
Source: US Census Bureau 1970, 1990, 1999

PURPOSE AND NEED
1-4
year over the past decade, the transportationsystem has not been able to provide adequateservice. Major improvements are needed toaddress the growth that is coming regardlessof transportation improvements.
1.3.2 Existing SystemPerformance
During the early steps of the LCTIP, a needsanalysis was conducted to evaluate the rangeof transportation issues and problems for theexisting roadway and transit systems in thestudy area. This evaluation involved technicalanalyses, as well as the gathering ofinformation and experiences fromtransportation agencies, elected officials, andthe public. The transportation deficienciesidentified in the study area are extensive—seethe LCTIP’s Transportation SystemPerformance Report, January 1999 forcomplete details. The following are some ofthe major findings:
• Development is fast outpacingtransportation improvements.
• North-south travel patterns arepredominant.
• Congestion is widespread. Currently, one-third of the roadway network is congestedduring peak travel periods.
• Nearly 90 percent of all work trips aremade by automobiles.
• Less than 5 percent of all work trips aremade by transit.
• Lake County experiences nearly1.73 million daily vehicle trips; half startand end in the county, and the other halfeither travel into, leave from, or passthrough the county.
• Nearly 50 percent of Lake County’s railstations have insufficient parking.
During the early stage of the study, surveyswere taken to gather opinions of residents,agencies, and elected officials concerning thetransportation issues in Lake County.Respondents consistently cited congestion asthe most important quality of life issue.
Respondents broadly supported majorhighway improvements as a means to relievecongestion, followed by transit.
By 2020, transportation deficiencies willencompass most of Lake County. Even withimplementation of committed and reasonablyexpected improvements (74 miles of roadwaycapacity improvements and North CentralService [NCS] rail expansion and upgrades),congestion will double by 2020. 2 Majorimprovements are needed in Lake County toprevent gridlock.
The LCTIP recognized that this project wouldnot be able to address all of the transportationproblems. The LCTIP resolved to focus theirefforts on the major system deficiencies, and,in doing so, also provide a foundation fortransportation planning by other agencies. Onthe basis of extensive technical studiesembodied in the Transportation SystemPerformance Report—January 1999, theLCTIP identified four transportation needs:
• Improve north-south travel capacity andefficiency
• Improve regional and local travel
• Improve safety
• Improve modal connections
The remainder of this section discusses theseneed statements. Together, the project’spurpose and need have served to shape therange of reasonable transportationimprovement alternatives presented inSection 3.
1.3.3 Improve North-South TravelCapacity and Efficiency
Lake County has widespread roadwaycongestion. The LCTIP project team performeda comprehensive technical analysis of travelpatterns (a travel desire analysis) to evaluate thedirection people are traveling within the county.Figure 1-7 clearly shows the travel desire to bepredominantly in the north-south direction.Strongly supporting this conclusion are daily 2 The LCTIP No-Action (Baseline) Alternative. See alsoSection 3, Alternatives .

PURPOSE AND NEED
1-5
travel patterns, showing that nearly half of dailytrips (about 720,000 trips) either enter or leaveLake County. The general orientation of thesetrips is to and from the south as well as to andfrom the north, wherein lie most of the majoremployment centers (largely located in thesouthern townships of Lake County and thenorthern townships of Cook County).Approximately 66 percent of Lake Countyresidents are employed within the county, while30 percent are employed to the south inneighboring Cook County (Lake CountyDepartment of Planning, Zoning, andEnvironmental Quality 1994).
Currently in the county, almost 50 percent ofthe vehicle miles of travel occur on interstateand principal arterial facilities during peaktravel periods. These roadways account foronly 26 percent of the roadway system in thecounty, and 60 percent of these primary roadsare oriented in a north-south direction.
Lake County’s geographic position as a majorentrance to the State of Illinois and theChicago metropolitan area also contributes toa high volume of north-south travel. Thethrough trip component is approximately125,000 vehicles per day, and the largestvolumes of through travel are in the easternhalf of Lake County, generally along theI-94 corridor.
Overall, travel is expected to worsenconsiderably by 2020. In the next 20 years,vehicle miles of travel are projected toincrease 40 percent, and technical analysesshow this increase would impact north-southroadways the most. An analysis of averagedaily traffic shows that 55 percent of thisgrowth would be on the north-south roadways(LCTIP 1999).
1.3.4 Improve Regional andLocal Travel
The roadway network in Lake County servesboth local and regional trips equally.Presently, the network supports nearly1.73 million trips on a daily basis. About50 percent of those trips start and end withinthe county, and the other 50 percent eitherleave, enter, or pass through the county.
Local trips (shorter distance trips) are asubstantial component of daily travel in LakeCounty, with approximately 884,000 tripsbeginning and ending in the county. About50 percent of the vehicle miles of travel in thecounty are made on 74 percent of the roadwaynetwork, comprised of minor arterial facilities,collectors, and local roads. Interim strategies,such as intersection improvements andcoordinated traffic signals, have beenimplemented at a number of locations over thepast decades; however, these spotimprovements have not been effective atkeeping pace with the continued rising levels ofcongestion.
During the past 15 years, travel has increasedon the county-maintained roadway systemmore than 230 percent (Lake County Divisionof Transportation 1998). During this sameperiod, added lane miles of improvement haveincreased less than 5 percent. The rise in localsystem travel is directly linked to populationgrowth and inefficiencies in travel on LakeCounty’s primary roadway system. Congestionon the primary routes (interstate routes andprincipal arterial facilities) has caused atypicaltravel patterns such as travelers diverting toalternate routes; often times using secondary orlocal roads not intended for longer trips. Theresult is widespread use of the local roadnetwork for commuter trips. The preponderanceof cut-through traffic was echoed in theLCTIP’s survey of people’s opinions ontransportation issues facing Lake County(LCTIP 1999). There is a need to attract longerdistance travel to the appropriate type of facility(i.e., principal arterial facilities and interstateroutes), which would assist in relieving travelcongestion on the local network.
Longer distance trips represent another majorcomponent of Lake County’s automobiletravel. Each day over 720,000 trips areentering or leaving the county, and about125,000 trips are passing through the county.Primary routes (interstates and principalarterials) represent only 26 percent of the totalroadway system in the county and carryalmost 50 percent of the vehicle miles oftravel during peak travel periods. Many of thecounty’s primary routes have reached capacity

PURPOSE AND NEED
1-6
and are experiencing severe congestion duringpeak travel periods.
1.3.5 Improve SafetyMuch of Lake County’s highway system isreflective of its past. Nearly 80 percent of theroadway network is comprised of 2-laneroadways that once served a rural/agriculturallandscape. Today, many of those sameroadways are over capacity and serve asuburban county with one of the largestpopulations in the state.
An outdated roadway system carrying trafficvolumes that far exceed its capacity is animportant contributing factor to vehicularcrashes. Based on available data (1993-1995),the total number of crashes in Lake Countyranged from 17,072 to 18,149 (IDOT 1993-1995). Slightly over 50 percent of all crashesoccur during the peak P.M. travel period. Themajority of all crashes involve propertydamage, and are followed by injury crashes.Fatal crashes account for a fraction of the totalcrashes. Data shows that the proportion ofcrashes on the primary road system has steadilyincreased with rising traffic volumes. In 1993,70 percent of all crashes occurred on theprimary roadway system. In 1995, the numberhad risen to 78 percent. While the number ofcrashes on primary roads has increased, thecrash rates (crashes per million vehicle miles oftravel) are the lowest when compared to otherfacility types. This is consistent with regional aswell as national trends that show that the lowestcrash rates occur along higher type facilities(e.g. , freeway, tollway) with more limitedaccess.
The average crash rate in Lake County for allroads is similar to other urban counties in theChicago metropolitan area. Lake County had acalculated crash rate of 3.5 per million vehiclemiles driven (IDOT 1993-1995). The county’srate is slightly higher than the annualstatewide rate of 3.0 in 1995.
National research involving the relationshipbetween automobile crashes to highway featuresconfirms that an important factor in crashoccurrence is traffic congestion. In Lake County,congestion on the primary routes is well
documented, and is spreading to the secondaryand local roadway system. This is supported bythe fact that without major transportationimprovements future travel is projected toincrease by 28 percent on minor arterialfacilities, by 50 percent on collectors, and by69 percent on local roads (LCTIP 1999). Majorimprovements are needed in order to increasecapacity, improve safety performance, andattract non-local trips to the primary system,thereby reducing the potential for crashes on thesecondary system.
There are a number of basic, well-establishedprinciples relating roadway safety to elementsof the highway, including the relationship ofroadway type and volume to congestion, therelationship of traffic congestion to crashfrequency, and differences in the safetyperformance of various roadway types. In theChicago metropolitan area and Lake County, itis apparent that the increase of crashes islinked to more vehicles traveling more milesthan before, as well as increased congestion onroadways with inherent capacity problems.Lake County’s present roadway network isattempting to manage a large volume of long-and short-distance trips to and from work,shopping, school, entertainment, and otherdestinations. This situation has contributed towidespread travel safety concerns on thecounty’s major and secondary roadwaynetworks.
A combination of factors has lead toincreasing concern for vehicular safety inLake County. The challenge in improvingtravel safety is linked to shifting automobiletravel to the appropriate types of roadwayfacilities that suit the travel and arespecifically designed to minimize conflictsbetween the local and long-distance trip.
1.3.6 Improve ModalConnections
Regional and local transportation planningagencies have continually explored ways toimprove the connectivity betweentransportation modes. In Lake County, severalexamples of better connections betweentransportation modes have occurred in recent

PURPOSE AND NEED
1-7
years, including the Lake Cook TransportationManagement Association’s (TMA) shuttle bugservice between rail stations and majoremployment centers. The TMA’s and otherefforts represent a start; however, additionalsteps to improve connections between modeswould further enhance the efficiency of eachmode and the overall transportation system.
The overwhelming use of the highway networkin both Lake County and elsewhere in theChicago metro area has come about through theevolution of a well-connected system ofroadways—a network that connects mostlocations with every other location. However,transit serves a relatively small percentage ofthe total travel in Lake County. According tothe latest census data (US Census Bureau1990a), less than 5 percent of the commutertrips in Lake County were made by rail andbus. In 1990, 3.7 percent of the work trips weremade by rail and 0.5 percent were made by bus.The transit system in Lake County (particularlyrail) has served the downtown Chicago worktrip well, but as employment and housing havesteadily increased in the suburbs, transit serviceto these varied locations is more problematic.
Research has shown that a successful transitservice must be competitive with theautomobile in terms of origin and destination.
• The origin of travel—Easily accessedwith connection from other modes
• The destination of travel—Connectingpeople to where they want to go(i.e., employment centers, activity[shopping, commercial, etc.] centers,recreational centers)
Easy access to the rail stations in Lake County iscritical for maintaining and increasing rail transitridership. The needs assessment for LakeCounty (LCTIP 1999) showed that 90 percent ofthe commuter rail patrons arrive at rail stationsby automobile. An examination of stationparking in the study area shows that 50 percenthave usage that is at capacity, but in a few shortyears this figure could grow to over 80 percent.The need for parking at rail stations willcontinue to grow (projected to be more than3,500 additional spaces by 2020), and past
experience shows that parking supply is used asquickly as it is provided. It is apparent that anample supply of parking is crucial to improvingthe transit user connection at trip origins.
Other forms of access to rail stations(i.e., park-and-ride facilities and feeder busservices) could also expand the ridershipcatchment area, thereby increasing patronage.In recent years, the bus market in Lake Countyhas shown some flexibility in the type ofservices provided. The most successful busservices have been those that connect majorjob centers with other transportation modes(i.e., rail stations). These are good examples,but much more is needed to expand thelinkage of transit between the home-to-worktrip and employment centers and majortransportation nodes (i.e., rail stations, park-and-ride , etc.).
Transit has rarely served the same role as manymodern highways by providing bi-directionalflow during the commuting period or, to someextent, throughout the day. Changes inemployment patterns, however, have beencontributing to changing commute patterns(such as suburb to suburb or Chicagodowntown to suburbs). These changing patternsof employment are causing transit providers torespond with better connections for reversecommuters. Once again, the needs assessmentfor Lake County (LCTIP 1999) identified someinherent short comings in the system thatcurrently frustrate appropriate service in thereverse direction, but these encumbrances canbe overcome with modest physicalimprovements. Combined with these physicalimprovements, the transit community agreesthat enhanced reverse commute services wouldrequire improved linkages between rail stationsand employment centers with a system offeeder/shuttle bus service.
The relationship between origins of travel andmajor employment centers in Lake County wasexamined as part of this study. The conclusionshowed that a number of these origins anddestinations are accomplished by automobileonly. The flexibility of rail service is limited, andbus transit is not configured to serve these majortravel corridors. However, the LCTIP concluded

PURPOSE AND NEED
1-8
that better connection between modes, coupledwith enhancement of existing modes(i.e., express bus service from major collectionpoints to employment/activity centers) reflectconcepts that begin to address the needs in thesecorridors by use of other mode choices.
In Lake County, some steps have been takento improve connections between the roadway,rail, bus, and other modes. However,expansion of the concepts enumerated abovewould further enhance the efficiency of eachmode and the overall transportation system.

2-1
SECTION 2
Affected Environment
The LCTIP study area is located in LakeCounty, Illinois, a part of the Chicagometropolitan region.1 The Chicago region,comprised of six counties (Cook, DuPage,Kane, Lake, McHenry, and Will), has a diverseeconomic base. Long known for its industrialactivity, the region also houses many corporateheadquarters, key educational and researchinstitutions, is the center of the nation’stransportation network, and is a major force infinancial markets. Located 41.8 km (26 mi)from Chicago’s loop and 54.7 km (34 mi) fromdowntown Milwaukee, Lake County enjoys astrategic geographic position as an entrance tothe state and the metropolitan area, and isinstrumental in any evaluation of interregionaltransportation systems. It covers roughly1,192 km2 (460 mi2), is divided into18 townships, and includes 52 incorporatedcities and villages. For this study, the Bentonand Zion townships have been combined, andthe Deerfield and West Deerfield townshipshave been combined due to their small size andproximity (Figure 2-1). Although the study areais slightly larger than Lake County, discussionsin this chapter are limited to the county for easeof comparison with values that are commonlyaggregated at the county level.
An environmental database, compiled as ageographic information system (GIS) database,was developed specifically for the project touse in considering and evaluatingenvironmental concerns. A separate technicalmemo (LCTIP 2001a) details how the databasewas developed, refined, and used for thisproject. The GIS database consists of almost80 data layers that were compiled largely fromexisting digital data obtained from variousfederal, state, and local sources and agencies(see Appendix A), including:
• IL Department of Transportation (IDOT)
1 The regional discussion focuses on those counties inNIPC’s jurisdiction. These include Cook, DuPage,Kane, Lake, McHenry, and Will counties.
• Regional Transportation Authority (RTA)
• Federal Emergency Management Agency(FEMA)
• Northeastern IL Planning Commission(NIPC)
• IL Department of Natural Resources(IDNR)
• IL State Geological Survey (ISGS)
• IL Historic Preservation Agency (IHPA)
• US Geological Survey (USGS)
• Pace Bus
• US Fish and Wildlife Service (USFWS)
• US National Park Service (USNPS)
• Lake County
• Cook County
• Chicagoland Bicycle Federation (CBF)
Data from these sources was converted into acommon coordinate system to facilitate spatialanalyses and map creation using a single base.Data was updated and validated on a limited,as-needed basis. Source agencies wereconsulted about the appropriate use of theirdata to ensure conclusions were valid based onqueries from this database.
2.1 SocioeconomicCharacteristics
2.1.1 Demographics2.1.1.1 Regional Demographic TrendsThe regional population characteristics for thesix-county Chicago metropolitan area are

AFFECTED ENVIRONMENT
2-2
TABLE 2-1Regional Population Trends
1970 1990 Change 1970–1990 % Change 1970–1990
Chicago Metropolitan Area 6,978,733 7,261,176 282,443 4.0
City of Chicago 3,369,359 2,783,726 (585,633) (17.4)
Suburban Cook Co. 2,123,010 2,321,341 198,331 9.3
DuPage Co. 491,882 781,666 289,784 58.9
Kane Co. 251,005 317,471 66,466 26.5
Lake Co. 382,638 516,418 133,780 35.0
McHenry Co. 111,555 183,241 71,686 64.3
Will Co. 249,498 357,313 107,815 43.2
Source: US Census Bureau 1970-1990
shown in Table 2-1.2 Between 1970 and 1990,the region experienced a modest increase inpopulation (an increase of 282,443 people or4 percent). Between 1970 and 1990, the Cityof Chicago lost about 585,000 residents, whilethe suburbs gained nearly 870,000 residents(US Census Bureau 1970-1990); in thesuburbs, this population increase trend isforecast to continue in the future. Lake Countyreceived the third highest influx of newresidents in the region (behind DuPage andsuburban Cook counties). During that time,Lake County’s population increased 35 percent(adding nearly 134,000 new residents). Thistrend is forecast to continue in the future,according to NIPC (Lake County Departmentof Planning, Zoning, and EnvironmentalQuality 1994).
2.1.1.2 Population and HouseholdsIn 1990, the population in Lake County was516,418, a 35 percent increase over 1970population. Table 2-2 (on the following page)
2 For this study, the 1990 census detail, which is the mostcomprehensive and detailed census data available,provides a consistent source for providing a comparison ofdemographic facts. The 2000 census data is beingreleased over a period of time extending from March 2001to 2003. As of this publication, 2000 census data is notavailable at the appropriate level of detail. 2000 censusdata, however, will be used to a limited extent, whereavailable, to update area trends.
details the population change between 1970and 1990, and the US Census Bureau 1996estimates for each township in Lake County. 3
Between 1970 and 1990, the greatest absolutepopulation increases occurred in the southernand central townships in the county,specifically Vernon, Ela, Libertyville, Warren,and Avon townships, for a combined increaseof nearly 110,000 people, or an 82 percentincrease in the county population. During thesame 20-year period, population lossesoccurred in the eastern townships of Shieldsand Deerfield-West Deerfield. Between 1990and 1996, the trend of population increasescontinued with the southern and centraltownships receiving the largest portion of newresidents. Over this period, population acrossthe county increased by 66,565 people.
Increasing population, combined withdecreasing household size, has led to anincrease in the number of households in thecounty (in 1990, the average number of persons
3 1996 US Census Bureau estimates are the mostrecent detailed data available for each township.Section 1, Purpose and Need, identified 1999 values;however, this information is only available for the entirecounty. In this section, 1996 values provide greaterinsight into location of population changes.

AFFECTED ENVIRONMENT
2-3
per household in Lake County was 2.96,compared to 3.71 in 1970). Between 1970 and1990, an estimated 71,019 new households(69 percent increase) were established in LakeCounty. Similar to population growth, thegreatest household increases occurred in thesouthern and central townships in the county.Vernon Township experienced the greatestinflux of households, adding 14,000 newhouseholds over the 20-year period. Shieldswas the only township that declined in numberof households from 1970 to 1990, declining bynearly 6,000 households , which was primarily
influenced by the closure of Fort SheridanArmy base that began in 1988. 4,5
Population growth has also spurred increasesin the housing supply in Lake County. Thesupply of housing in Lake County increased65 percent between 1970 and 1990, from110,448 to 183,283 units. About 40 percent ofnew housing units were built in Vernon,Warren, and Libertyville townships, all incentral Lake County (Lake CountyDepartment of Planning, Zoning &Environmental Quality 1994).
4 Household information is also collected as part of theDecennial Census. Household data includes informationon households, including non-family households, single-person households, female-headed families, two-parentfamilies, etc.5 The Fort Sheridan base closure was completed by1993.
TABLE 2-2Population by Township *
1970 1990 1996 Est.Change
1970–1990% Change1970–1990
Change1990–1996
% Change1990–1996
Antioch 11,639 18,046 20,466 6,407 55.0 2,420 13.4
Avon 19,953 35,989 50,433 16,036 80.4 14,444 40.1
Benton-Zion 30,866 35,590 39,393 4,724 15.3 3,803 10.7
Cuba 9,097 14,118 15,631 5,021 55.2 1,513 10.7
Deerfield-W. Deerfield 64,459 64,394 66,044 (65) (0.1) 1,650 2.6
Ela 12,208 32,433 37,161 20,225 165.7 4,728 14.6
Fremont 12,186 14,280 17,388 2,094 17.2 3,108 21.8
Grant 11,007 14,423 15,796 3,416 31.0 1,373 9.5
Lake Villa 11,593 20,764 23,273 9,171 79.1 2,509 12.1
Libertyville 25,577 42,436 47,410 16,859 65.9 4,974 11.7
Newport 2,660 3,561 4,148 901 33.9 587 16.5
Shields 55,093 43,414 39,992 (11,679) (21.2) (3,422) (7.9)
Vernon 12,835 51,141 59,421 38,306 298.4 8,280 16.2
Warren 16,291 34,785 46,169 18,494 113.5 11,384 32.7
Wauconda 10,494 12,859 16,706 2,365 22.5 3,847 29.9
Waukegan 76,680 78,185 83,552 1,505 2.0 5,367 6.9
COUNTY TOTAL 382,638 516,418 582,983 133,780 35.0 66,565 12.9
* Benton and Zion township data and Deerfield-West Deerfield township data have been combined.
Sources: US Census Bureau 1970 and 1990a, 1996, US Census estimate (US Census Bureau 1997)

AFFECTED ENVIRONMENT
2-4
Two countywide 2020 population and householdforecasts are detailed in Table 2-3. The No-Action forecast assumes a reasonable level oftransportation improvements would be madebefore 2020 (ACG 1999).6 The “2020 RTP”forecast assumes construction of alltransportation projects identified in the RTPunder the existing airport improvement scenario.
Under the No-Action Alternative (Baseline),Lake County is forecast to have about797,000 residents and 290,500 households by2020. With the No-Action transportationimprovements, Lake County’s population willincrease by 54 percent (280,500 people) from1990, and the number of households willincrease by 67 percent (116,600 households).
6 Representatives from IDOT, ISTHA, RTA, LakeCounty, Metra, and Pace identified the reasonable setof transportation improvements to be included in theproject No-Action (Baseline), including 74 route milesof arterial highway improvements, adding a secondtrack to the NCS rail line, new Metra stations, andother Metra station improvements and Pace busservice improvements (Section 3.3, No-ActionAlternative [Baseline]).
Under the RTP scenario, Lake County’spopulation is forecast to increase to826,281 residents (a 3.7 percent increase overthe No-Action forecast); the number ofhouseholds is forecast to increase to301,531 households (a 3.8 percent increaseover the No-Action forecast).
2.1.1.3 Age DistributionLake County has a younger population thanthe region, with a median age of 31.6,compared to 32.4 for the six-county Chicagoregion and 32.8 for the state. The county alsohas a higher percent of the population that isunder 18, a higher percent between 18 and 64,and a lower percent over 65 (see Table 2-4).
TABLE 2-3Population and Household Forecasts, Lake County
1990 a2020 Project
No-Action Forecast b % Change
Addition to 2020 No-ActionForecast for 2020 RTP
Forecast c, d
% Change fromNo-ActionForecast
Population 516,418 796,942 54.3% 29,339 3.7%
Households 173,966 290,569 67.0% 10,962 3.8%
a 1990 population and household data: US Census Bureaub ACG 1999c Existing Airport Improvements 2020 Build development scenario (CATS 1997a)d Population contribution of new commuter rail service on the Elgin Joliet and Eastern Railroad is 2,000
TABLE 2-4Age Distribution, 1990
Under 18 (%) 18–64 (%) 65 and older (%) Median Age
Lake County 28 64 8 31.6
Six-County Region 26 63 11 32.4
Illinois 26 62 13 32.8
Source: US Census Bureau 1990a

AFFECTED ENVIRONMENT
2-5
2.1.2 Land Use and DevelopmentTrends
Historically, Lake County’s communitiesserved as satellite cities or bedroom suburbs ofChicago, as traditional rural crossroads, or asresort towns. As the population increased,growth contributed to the transformation ofLake County communities from small towns tometropolitan suburbs. Over the past 30 years,the central and southern tier areas of LakeCounty have received the bulk of newresidents, shifting population concentrationsaway from the Lake Michigan shoreline (LakeCounty Department of Planning, Zoning &Environmental Quality 1994).
In 1990, the largest land uses in Lake Countywere residential, agricultural, and vacantland. Since 1990, a significant amount ofagricultural and vacant land has beenconverted to residential use. In 1990,agricultural plus vacant land (land
conceivably open to development) accountedfor 43 percent of the land use. By 1997, thesetwo categories represented 37 percent of totalland use. By 1997, lands devoted toresidential use had increased to 36 percent.Table 2-5 summarizes 1990 and 1997 landuses in Lake County.
A substantial part of the developed land lieswithin the area that encompasses the majorityof the proposed transportation improvementalternatives—this area is generally bound byLake Cook Road on the south, IL 120 to thenorth, US 41 to the east, and US 12 to the west(Table 2-6, on the following page). In 1990,44 percent of the lands were devoted to urbanland use; by 1997 that number had increasedto 51 percent.7 In 1990, 45 percent of the landswere agriculture or vacant lands; by 1997, thispercentage had dropped to 37 percent.Between 1990 and 1997, the amount of landsdevoted to residential uses had grown by more
7 Developed lands include residential, commercial,institutional, industrial, transportation, communication,and utilities land uses.
TABLE 2-5Land Use Summary
Land Use 1990, ha (ac) c % of
Total 1997, ha (ac) d % of
Total
Residential 37,800 (93,440) 31% 43,949 (108,638) 36%
Commercial and Services 4,401 (10,880) 4% 4,785 (11,827) 4%
Institutional 3,366 (8,320) 3% 3,381 (8,357) 3%
Industrial 4,143 (10,240) 3% 4,238 (10,476) 3%
Transportation, Communication, Utilities 2,071 (5,120) 2% 2,078 (5,137) 2%
Agriculture 28,221 (69,760) 23% 24,297 (60,060) 20%
Open Space a 11,133 (27,520) 9% 11,763 (29,076) 10%
Vacant b 24,079 (59,520) 20% 20,650 (51,044) 17%
Water 6,473 (16,000) 5% 6,666 (16,477) 5%
TOTAL 121,687 (300,800) 100% 121,687 (300,800) 100%a Open space land includes recreational uses, such as parks, forest preserves, and golf courses.b Vacant land includes forested and grassland areas, wetlands that exceed 10.1 ha (25 ac), non-residential,and other uses that are available for redevelopment.c Source: NIPC 1990 Land Use
d Source: CH2M HILL, GIS Database 1999

AFFECTED ENVIRONMENT
2-6
than 2,900 ha (7,180 ac), from 32 to38 percent of the total land area. The leastdeveloped portion of the subarea is betweenUS 45 and US 12, chiefly because of the lackof water and sewers serving the area. Growthis beginning to occur, but will remainsomewhat limited until the area is served bypublic utilities.
Another way to gauge the level ofdevelopment and land use change is to reviewbuilding permits. Between 1995 and 1999,permits were issued for nearly 22,200 unitsthroughout Lake County. Table 2-7 identifiesthe 10 communities that have issued thehighest number of residential building permits.Nine of these 10 communities are located in
TABLE 2-6Land Use Summary by Subarea Bound by Lake Cook Road, IL 120, US 41, and US 12
Land Use 1990, ha (ac) c % of
Total 1997, ha (ac) d % of
Total
Residential 14,892 (36,800) 32% 17,798 (43,980) 38%
Commercial & Services 1,700 (4,200) 4% 1,874 (4,630) 4%
Institutional 1,060 (2,620) 2% 1,125 (2,780) 3%
Industrial 2,275 (5,620) 5% 2,343 (5,790) 5%
Transportation, Communication, Utilities 595 (1,470) 1% 595 (1,470) 1%
Agriculture 11,546 (28,530) 25% 9,328 (23,050) 20%
Open Space a 3,828 (9,460) 8% 4,241 (10,480) 9%
Vacant b 9,385 (23,190) 20% 7,916 (19,560) 17%
Water 1,303 (3,220) 3% 1,364 (3,370) 3%
TOTAL 46,584 (115,110) 100% 46,584 (115,110) 100%a Open land space includes recreational uses, such as parks and golf courses.b Vacant land includes forested and grassland areas, wetlands that exceed 10.1 ha (25 ac), residential,non-residential, and other uses that are available for redevelopment.c Source: NIPC 1990d Source: CH2M HILL, 1997 aerial photography update of NIPC data
TABLE 2-7Top 10 Communities Issuing Residential Permits, 1995–1999
MunicipalityBuilding Permits
IssuedNumber of
Units MunicipalityBuilding Permits
IssuedNumber of
Units
Gurnee 1,751 2,558 Round Lake Beach 928 1,001
Waukegan 1,371 2,152 Lake Villa 916 919
Grayslake 1,478 1,551 Vernon Hills 891 911
Lindenhurst 1,004 1,384 Buffalo Grove 744 886
Mundelein 1,083 1,251 Round Lake 643 643
Source: US Census Bureau, Manufacturing and Construction Division 1990b.

AFFECTED ENVIRONMENT
2-7
the northern and north central regions of LakeCounty.
2.1.3 Economic Characteristics
2.1.3.1 EmploymentIn 1970, nearly 60 percent of the region’semployment was located in Chicago, with40 percent in the suburban areas (suburbanCook and the other five counties in theregion). By 1990, employment in Chicagorepresented only 39 percent of totalemployment in the region; the remaining61 percent were outside of Chicago. Still, asof 1990, Chicago remains the dominanteconomic force in the region with the largestshare of jobs (Table 2-8).
Lake County’s growth includes a substantialincrease in the number of jobs and itspercentage share of the region’s employment.Between 1970 and 1990, employment nearlydoubled in Lake County, from approximately116,000 to nearly 229,000 jobs. This was thesecond highest percentage increase in jobs inthe Chicago region, after DuPage County, andthe third highest in terms of absolute number,after suburban Cook and DuPage counties. In1970, 3.7 percent of the region’s jobs were inLake County; by 1990, the percentage hadincreased to 5.9 percent.
Table 2-9 (on the following page) providesadditional detail on employment trends bytownship. In 1990, Libertyville, Deerfield-
West Deerfield, Waukegan, Vernon, andShields contain nearly 70 percent of the jobsin the county. Between 1970 and 1990,employment increased for all townshipsexcept Waukegan, which waned primarily dueto the decline in heavy industry andmanufacturing. Vernon, Libertyville, Warren,Deerfield-West Deerfield, and Ela townshipsall experienced increases of greater than10,000 jobs during the 20-year period. Thesetownships account for more than 80 percent ofthe new jobs to Lake County. The pattern ofjob growth is similar to that of populationgrowth in that the greatest numerical gainsoccurred in the southern and centraltownships.
The Project No-Action forecast (ACG 2001)assumes a modest improvement to thetransportation system by 2020, and the RTPforecast (CATS 1997a) assumes constructionof all transportation projects identified in theRTP.
Under the Project No-Action forecast, by 2020Lake County is forecast to have 389,545 jobs,an increase of 70 percent (161,000 jobs) from1990. Under the RTP forecast, Lake County isforecast to have 393,641 jobs, an increase of72 percent (165,035 jobs).
2.1.3.2 IndustriesEmployment by industry classification ispresented in Table 2-10 (on the followingpage) for 1980 and 1996.
TABLE 2-8Regional Employment Trends
1970 1990 Absolute Change % Change 1970–1990
Chicago 1,864,000 1,482,381 (381,619) (20.5)
Suburban Cook 836,300 1,293,652 457,352 54.7
Du Page Co. 146,400 530,322 383,922 262.2
Kane Co. 103,300 145,205 41,905 40.6
Lake Co. 116,350 228,606 112,256 96.5
McHenry Co. 36,300 65,526 29,226 80.5
Will Co. 82,500 99,393 16,893 20.5
Source: NIPC

AFFECTED ENVIRONMENT
2-8
TABLE 2-9Employment by Township
1970 1990 Change (#) Change (%)
Antioch 2,450 4,561 2,111 86.2
Avon 4,100 8,609 4,509 110.0
Benton-Zion 4,650 6,436 1,786 38.4
Cuba 6,150 9,323 3,173 51.6
Deerfield-W. Deerfield 19,700 34,693 14,993 76.1
Ela 2,500 13,718 11,218 448.7
Fremont 1,500 3,312 1,812 120.8
Grant 1,200 3,688 2,488 207.3
Lake Villa 500 2,968 2,468 493.6
Libertyville 10,800 38,021 27,221 252.0
Newport 700 966 266 38.0
Shields 16,800 20,346 3,546 21.1
Vernon 2,300 28,028 25,728 1,118.6
Warren 3,550 17,599 14,049 395.7
Wauconda 900 4,297 3,397 377.4
Waukegan 38,450 32,041 (6,409) (16.7)
TOTAL LAKE COUNTY 116,250 228,606 112,356 96.7
1970 data: NIPC 19731990 data: NIPC 1997
TABLE 2-10Employment by Industry
1980 1996
Number % of Total Number % of Total
Agricultural Services, Forestry, Fishing 1,555 0.7 % 6,260 1.7 %
Mining 1,114 0.5 % 627 0.2 %
Construction 8,015 3.8 % 19,649 5.5 %
Manufacturing 44,442 21.2 % 56,748 15.7 %
Transportation, Communication, Public Utilities 6,207 3.0 % 10,785 3.0 %
Wholesale Trade 9,291 4.4 % 21,904 6.1 %
Retail Trade 32,996 15.7 % 58,029 16.1 %
Finance, Insurance, Real Estate 12,284 5.9 % 32,441 9.0 %
Services 41,803 19.9 % 95,614 26.5 %
Federal and Civilian Government 8,359 4.0 % 6,536 1.8 %
Military Government 24,735 11.8 % 24,700 6.9 %
State Government 1,290 0.6 % 1,573 0.4 %
Local Government 17,855 8.5 % 25,781 7.1 %
TOTAL 209,946 360,647
Source: Bureau of Economic Analysis Data; US Department of Commerce

AFFECTED ENVIRONMENT
2-9
2.1.3.3 Major EmployersAbbott Laboratories in North Chicago is thelargest private employer in Lake County, withmore than 14,000 employees. Great LakesNaval Training Center, also in North Chicago,employs 8,500 and is the second largestemployer in the county. Currently, the GreatLakes Naval Training center has expanded itsmission, which will cause a build-up inmilitary personnel over the next several years.Five hospitals employ more than 1,000 people.Lake County government is a large employer,with more than 2,500 employees. Table 2-11lists Lake County businesses with 1,000 ormore employees. There are several largeemployers and employment centers dispersed
throughout central and western Lake County.Kemper Insurance, one of the large privateemployers in Lake County (with about2,500 employees), is located on IL 22 inLong Grove. Baxter Healthcare, another largeLake County employer (with about4,000 employees), has a large manufacturingfacility on IL 120 in Round Lake.Communities in the southwest quadrant of thecounty, including Lake Zurich, Barrington,and Wauconda, all have sizeable industrial orbusiness parks. Communities in central LakeCounty, such as Mundelein, Grayslake, andRound Lake, also have industrial/businessparks containing various businesses.
TABLE 2-11Employment by Industry (Greater Than 1,000 Employees)
Company Location Number of Employees
Abbott Laboratories North Chicago 14,000
Great Lakes Naval Training Center North Chicago 8,500
Motorola Libertyville 6,000
Baxter Healthcare Deerfield and Round Lake 4,000
Six Flags Great America Gurnee 3,000 (includes seasonal employees)
Allegiance Cardinal Healthcare McGaw Park 2,700
Kemper Insurance Long Grove 2,500
Hewitt Associates Lincolnshire 2,334
Walgreen Co. Deerfield 1,800
Outboard Marine Waukegan 1,765
Cherry Electrical Products Waukegan 1,500
Creative Packaging Corporation Buffalo Grove 1,500
Highland Park Hospital Highland Park 1,350
Lake Forest Hospital Lake Forest 1,280
Victory Memorial Hospital Waukegan 1,201
Condell Medical Center Libertyville 1,179
College of Lake County Grayslake 1,170
Trustmark Insurance Co. Lake Forest 1,100
W.W. Grainger Lincolnshire 1,100
Provina St. Therese Medical Center Waukegan 1,107
Quill Corporation Lincolnshire 1,000
Source: The Book of Lists, Lake County Business Journal 1999

AFFECTED ENVIRONMENT
2-10
2.1.4 Environmental JusticeThe NEPA evaluation process includesconsideration of environmental justice toensure that low-income and minorityhouseholds and minority business enterprisesdo not suffer a disproportionate share ofadverse effects resulting from federalactions.8,9 Executive Order 12898 requiresfederal agencies to achieve environmentaljustice by identifying and addressingdisproportionately high and adverse humanhealth and environmental effects, includingthe interrelated social and economic effects oftheir programs, policies, and activities onminority populations and low-incomepopulations.
2.1.4.1 Racial, Ethnic, and SpecialGroups
According to the 1990 census, 87.4 percent ofthe county’s population is white, 6.7 percent isAfrican-American, 2.4 percent is Asian orPacific Islander, 0.3 percent is American Indian,and 3.2 percent are classified as other races.Persons of Hispanic origin account for6.3 percent of the county population. (Hispanicorigin is also counted in other categories.)Table 2-12 (on the following page) listspopulation by township and classification.
The townships of Benton-Zion, Waukegan,and Shields account for nearly 90 percent ofthe county’s African-American population.The townships with 80 percent of the regionsAsian population include Deerfield-West
8 Low-income is defined by the Department of Healthand Human Services as those residents living belowthe defined poverty guideline. For a family of three, thepoverty level is $14,630.9 FHWA Order 6640.23 defines minority as “… a personwho is: (1) Black (a person having origins in any of theblack racial groups of Africa); (2) Hispanic (a person ofMexican, Puerto Rican, Cuban, Central or SouthAmerican, or other Spanish culture or origin, regardlessof race); (3) Asian American (a person having origins inany of the original peoples of the Far East, SoutheastAsia, the Indian subcontinent, or the Pacific Islands); or(4) American Indian and Alaskan Native (a personhaving origins in any of the original people of NorthAmerica and who maintains cultural identificationthrough tribal affiliation or community recognition).”
Deerfield, Shields, Waukegan, Warren,Libertyville, and Vernon.
To accurately identify minority or low-incomepopulations in the study area, the US Department of Housing and UrbanDevelopment Community Planning software“Community 2020” was used, which was basedon the 1990 Census data . Based onenvironmental justice guidelines, each censustract within the study area was examined forracial composition and median householdincome in comparison to Lake County as awhole. Of the 97 tracts in the county, 31 havea higher percentage of minority populationsthan the county as a whole. Of those, 25 tractshave a minority population that is at least20 percent higher than the county percentage(see Figure 2-2). Of the 25 tracts, 18 are inWaukegan or North Chicago and seven are inthe bordering communities of Zion, BeachPark, Gurnee, and Park City. Highwood andMundelein have the only other pockets ofminority populations in the study area.
2.1.4.2 Income CharacteristicsMedian household income in Lake County ishigher than the State of Illinois. Six of the 18townships (Antioch, Avon, Benton-Zion [twotownships], Wauconda, and Waukegan) havelower median household incomes than thecounty median. Only Waukegan’s medianhousehold income is below the state’s median.The largest concentrations of persons livingbelow the poverty level are located inWaukegan (10.7 percent), Benton-Zion(9.2 percent), Grant (7.1 percent), and Avon(6.0 percent) townships. On the opposite endof the spectrum, nine townships have medianhousehold incomes greater than $50,000:Cuba, Deerfield-West Deerfield, Ela, Fremont,Libertyville, Newport, Shields, and Vernon.
A census tract evaluation of median familyincome was performed within the study area toidentify low-income populations, as defined bythe Department of Health and Human Services(HHS). Overall, the Lake County medianhousehold income is high. The $46,047 incomeis almost $13,000 higher than the state averageof $32,252. Since the mean household size forthe study area was determined to be

AFFECTED ENVIRONMENT
2-11
approximately three persons, the povertythreshold for the study area is $14,630. Nocensus tracts in the study area were considered tobe low-income according to the HHS guidelines.Two census tracts near North Chicago haveincomes slightly above this threshold,$14,900 and $15,404, but neither tract would beaffected by either build alternative.
2.1.5 Public Services andFacilities
Public services and facilities consist of schools,churches, cemeteries, police and firedepartments, city and township halls, hospitals,and public utilities. They are typically locatedwithin municipal boundaries and nearpopulation centers.
The public school systems in Lake County areorganized into 29 elementary school districts,10 high school districts, and six community
unit districts. There are 306 public and privateschools and 25 colleges and universities in thestudy area. Waukegan and Shields townshipshave the greatest number of schools. Theconcentration of school facilities reflects thepopulation distribution pattern.
Churches or houses of worship are scatteredthroughout the study area to serve the religiouscommunities of Lake County. Thisdistribution is consistent with the populationdensity pattern. Densely populated Waukeganhas the greatest number of churches.
The 66 cemeteries in Lake County aredistributed throughout all townships. Avon,Vernon, and Waukegan each have six, while theremaining townships each have two to fourcemeteries.
Within Lake County, there are 27 firedepartments and 36 police departmentsserving local communities. Several
TABLE 2-12Racial Distribution
TownshipTotal
Population WhiteAfrican-
American
AmericanIndian, Eskimo
or Aleut
Asian orPacificIslander
OtherRace
HispanicOrigin *
Antioch 17,887 99.1 0.1 0.3 0.2 0.3 1.0
Avon 36,073 94.1 0.5 0.3 1.2 3.8 10.5
Benton-Zion 35,579 82.3 13.8 0.3 1.6 2.0 4.8
Cuba 14,192 98.3 0.4 0 1.1 0.2 1.2
Deerfield-W. Deerfield 64,314 94.1 1.8 0 2.6 1.5 4.5
Ela 32,432 97.0 0.8 0 1.8 0.4 2.1
Fremont 14,385 95.6 0.7 0 1.9 1.8 4.8
Grant 14,637 97.9 0.0 0.3 0.5 1.3 2.7
Lake Villa 20,741 97.8 0.9 0.3 0.7 0.4 1.8
Libertyville 42,444 93.0 0.8 0.1 3.7 2.3 6.0
Newport 3,557 98.3 0.0 0.4 0.6 0.6 1.8
Shields 43,479 76.7 17.3 0.5 3.6 1.9 4.1
Vernon 51,074 92.6 1.3 0.1 4.5 1.6 3.6
Warren 34,644 92.2 2.9 0.5 3.2 1.2 3.8
Wauconda 12,808 97.6 0.1 0.3 0.5 1.5 4.2
Waukegan 78,172 61.3 23.4 0.5 2.5 12.3 22.6
LAKE COUNTY TOTAL 516,418 87.4 6.7 0.3 2.4 3.2 6.3
* Rows do not total 100 percent because persons of Hispanic origin are also counted in other categories.Source: US Census Bureau 1990a

AFFECTED ENVIRONMENT
2-12
communities share fire-fighting services, andthe Lake County Sheriff’s Departmentprovides coverage for unincorporated areas.
The 11 hospitals in Lake County are located inseven of the 16 townships. Shields andWaukegan townships both have threehospitals , while Avon, Benton, Cuba,Deerfield, and Libertyville townships eachhave one hospital.
Public utilities include facilities fordistributing energy, such as electricity andnatural gas, as well as water supplies andwastewater treatment plants (WWTP).Drinking water in Lake County is primarilyobtained from Lake Michigan and serves 80percent of households. Nineteen municipalWWTPs serve the wastewater needs of LakeCounty. Wastewater treatment is provided byregional treatment plants, the North ShoreSanitary District, or septic systems. Thesesystems are dependent upon populationdistribution and area infrastructuredevelopment. In general, the WWTPs areassociated with the population centers withinLake County, except in the west-central andnorthern portions. According to the LakeCounty Health Department, EnvironmentalHealth Division, 15 to 20 percent(30,000 residents) are on private septic systems.Figure 2-3 depicts the sewered areas of LakeCounty.
There are six electric substations and83 high-voltage power transmission lines(142 km, or 88 mi, total length) located in thestudy area. Warren Township has the most,with 15 lines. A power transmission linecorridor traverses the study area north-souththrough Wheeling, Vernon, Libertyville,Warren, and Newport townships. Anotherpower transmission line corridor extends east-west across the study area through Algonquin,Nunda, Wauconda, Fremont, Avon,Libertyville, Warren, and Waukegantownships (LCTIP 1999).
2.1.6 Transportation FacilitiesThe major regional transportation systems ofLake County include an established roadwaysystem, passenger and freight rail, water
transportation, and airports. Bicycle routes andpedestrian paths are available transportationalternatives. Metra and Pace provide publictransportation service in Lake County; bothare operating divisions of RTA. Figure 2-4shows these facilities within Lake County.
2.1.6.1 Existing RoadwaysThe roadway network in the study areaevolved from early trails and pre-automobileroutes that followed natural topography andcontours. Barriers, such as the Des PlainesRiver and the railroads , have also influencedthe development of the existing roadwaynetwork. The existing roadway network eastof the Tri-State Tollway corresponds to a moretraditional, well-defined grid system.However, west of the Tri-State Tollway, thenetwork is less orderly; it is made up of acombination of east-west, north-south, anddiagonal routes. In this area, there is less routecontinuity with sporadic spacing of roadways.Many routes have relatively short lengths. Byvirtue of the nature of the roadway network,west of the Tri-State Tollway, travel tends tobe more circuitous with limited travel routechoices.
With travel mobility as their primary purpose,fully or partially access-controlled facilities runalong the east (I-94 and US 41) side of LakeCounty. A barrier wall or open median separatesthe opposing traffic lanes of these facilities. I-94is a 6-lane facility, and US 41 is a 4-lane facility.
Principal arterials generally run for longdistances and provide for mobility while alsoproviding local access. Principal arterials in theeastern part of Lake County are both 2 and4-lane roads. With a few exceptions, principalarterials in the central and western parts of thecounty are 2-lane roads (See the TransportationSystem Performance Report). Table 2-13 (onthe following page) lists roadway functionalclasses. About 50 percent of all travel milesoccur on freeways and principal arterials, whichmake up 26 percent of the total route miles.
The Chicago metropolitan region is one of thelargest hubs for intermodal shipments in thenation. Local rail-to-highway freight transfersserve the entire Midwest. I-94 is a major

AFFECTED ENVIRONMENT
2-13
north-south cargo movement corridor throughLake County.
2.1.6.2 Existing Rail NetworkChicago is one of the largest rail hubs in theMidwest. Similar to roadways, a distinctive radialrail network is evident; part of the rail networkpasses through Lake County, with several raillines appearing as “spokes” on the Chicago hubof yards and freight terminals (Figure 2-4). Theserailroads are the Union Pacific (UP) North andNorthwest Lines, the Wisconsin Central (NorthCentral Service [NCS]) Line, the MilwaukeeDistrict (MD) North Line, the Canadian Pacific(CP) Line, and the UP Freight Line. The Elgin,Joliet, and Eastern (EJ&E) is a circumferentialbelt line, running through many middle and outersuburbs. The rail lines in the study area are usedby freight trains, and most are used for commuterrail.
Three Metra commuter rail lines operate inLake County: the UP North Line, the MDNorth Line, and the NCS. Table 2-14 showsthe service levels provided by Metra during1997 on the three lines. The UP NorthwestLine serves neighboring communities to thesouth and west but has no stations within LakeCounty. Table 2-14 shows that most daily tripson Metra occur during the peak 2-hour travelperiods in the direction of Chicago commutertravel (southbound in the morning andnorthbound in the evening). In 1996, 10percent of the residents in the larger study area(all of Lake County and portions of easternMcHenry and northern Cook counties) werewithin 0.8 km (0.5 mi) of a Metra station andover 30 percent of the residents were within1.6 km (1 mi) (Table 2-15, on the followingpage).10 Overall, rail transit is used in LakeCounty for approximately 3.7 percent of allwork trips.
10 All of Lake County and portions of eastern McHenryand northern Cook counties.
TABLE 2-13Route Miles and Lane Miles in Lake County by Functional Class
Functional Class Route Miles % of Route Miles Lane Miles % of Lane Miles
Freeway/Tollway 36.3 3.4% 203.0 7.5%
Principal Arterial 243.0 22.4% 716.0 26.5%
Minor Arterial 329.2 30.4% 808.9 29.9%
Collector 310.7 28.7% 646.4 23.9%
Local * 163.7 15.1% 331.6 12.3%
ALL CLASSES 1,082.9 100.0% 2,705.8 100%
* CATS network only includes a portion of local roads (e.g., the network does not include local roads within asubdivision)Source: CATS 1998
TABLE 2-14Metra Service Information
Rail Line
No. ofLake Co.Stations
WeekdayLake Co.
Boardings
No. ofWeekday
Trains
Ridership in PeakPeriod/Direction (% of
Total Riders)WeekendService
UP North 12 4,640 56 66 Y
MD North 9 5,080 58 76 Y
NCS 8 1,565 10 97 N

AFFECTED ENVIRONMENT
2-14
The study area is well served by rail transit.Despite figures that show transit is serving asmaller portion of total work trips than20 years ago, between 1987 and 1997 actualcommuter rail ridership grew approximately30 percent in the Lake County, no doubtreflecting both increased service andpopulation growth. Furthermore, with thegrowth of employment in the study area,reverse commutes have grown 32 percent(approximately 3,517 total trips on an averageweekday) since 1991.
Amtrak has routes that run from Chicago toMilwaukee and destinations further north andwest. The Amtrak route in the study area usesthe Metra MD North Line and CP Line tracks.There are no station stops within Lake County;the nearest stop to the study area is inGlenview, approximately 9.7 km (6 mi) southof Lake County.
2.1.6.3 Other Modes of TransportationBus and Related Services. Pace is the RTA’ssuburban bus division, providing a combinationof fixed-route, dial-a-ride, and paratransitservice. Connecting fixed-route bus services areprovided at 29 of the 46 Metra rail stations inthe larger study area.11 Thirteen stations haveonly one route providing service and 16 stations
11 All of Lake County and portions of eastern McHenryand northern Cook counties. Also includes Metraservice to Kenosha, WI in southern Kenosha County.
have two or more routes. Of the stations served,access by bus ranges from 2.5 to 5.8 percent.Pace also operates smaller buses called “ShuttleBugs” to serve the large employment areaalong the Lake Cook Corridor. The averageweekday ridership for the Pace system wasabout 13,000 in 1998, with about 38 percent onWaukegan routes. In 1996, more than half ofthe residents in the larger study area (all ofLake County and portions of eastern McHenryand northern Cook counties) lived within 0.8km (0.5 mi) of a Pace route (Table 2-16, on thefollowing page). Overall, bus transit is used inLake County for about 0.5 percent of all worktrips.
Air Transportation. Two general aviationairports, Waukegan Regional Airport andCampbell Airport, serve Lake County. TheWaukegan Regional Airport in WaukeganTownship is a designated reliever for O’HareAirport. Campbell Airport is a privately-ownedgeneral aviation airport located in AvonTownship, near the Village of Round LakePark. Outside Lake County, Chicago’s O’Hareand Midway and Milwaukee’s GeneralMitchell airports all serve commercial airtravelers throughout the Chicago region andLake County. Palwaukee, Waukegan (in LakeCounty), and DuPage County airports focus on
TABLE 2-15
Distance to Metra Service in the Larger Study Areaa
Population
Distance from Transit 1990 1996 2020 b
Within 0.8 km (0.5 mi) of Metra 71,57410%
82,59510%
84,7488%
Within 1.6 km (1 mi) of Metra 218,45930%
251,77731%
267,12027%
Within 8 km (5 mi) of Metra 696,12697%
790,70097%
967,13396%
a The larger study area includes all of Lake County and adjacent portions of McHenry and Cook counties.b Existing Airport 2020 RTP No-Build development scenario.Source: NIPC

AFFECTED ENVIRONMENT
2-15
corporate flights. Campbell Airport, in centralLake County, serves only private planes.
Pedestrian and Non-Motorized Facilities. LakeCounty has 933 km (580 mi) of existing on-roadbicycle routes, and over 113 km (70 mi) of off-road bicycle trails and paths (CBF 1999). Anadditional 402 km (250 mi) are proposed forimplementation by municipality and countygovernments.
2.2 AgricultureAccording to the Illinois AgriculturalStatistics Annual Summary 2000, Illinois isrich with agricultural resources and isrecognized as a world supplier of food. Illinoisis a strong agricultural resource because of itsfertile soil and favorable climate. In 1999,Illinois ranked second among all states in theproduction of corn and soybeans. Otheragricultural resources in Illinois that are not asprominent include wheat, sorghum, hay,livestock, and dairy production.
When comparing all Illinois counties, La SalleCounty is ranked first among all Illinoiscounties with 1,581 farms, while Lake Countyranked 91 out of 102 with 335 farms.
Lake County is not a large producer of eithercorn or soybean crops. In fact, Lake Countyranks 94 in corn crop production and 97 insoybean crop production. Illinois counties thatlead in the production of corn includedMcLean (51,278,500 bushels), Iroquois(48,654,000 bushels) and Champaign(44,986,000 bushels). Lake County producedonly 1,440,600 bushels of corn in 1999.
Illinois counties that lead in theproduction of soybeans included McLean(16,105,000 bushels), Iroquois(14,435,400 bushels), and Champaign(13,525,200 bushels). Comparably, LakeCounty produced only 176,000 bushels ofsoybeans. Ultimately, Lake County is not amajor contributor to the production of anyagricultural resource.
2.2.1 Locations of AgriculturalLand
Existing agricultural land locations in LakeCounty are shown in Figure 2-5. The highestconcentrations of land under current agriculturaluse are in the north-central, northwest, and westportions of Lake County. Table 2-17 (on thefollowing page) provides a breakdown ofexisting agricultural land areas by township inLake County. Townships along Lake Michiganhave very little agricultural land. Overall, 20percent of Lake County’s land area was inagricultural use in 1997.
Farmland in Lake County has been rapidlyreplaced by suburban housing development.Statewide, the land area devoted to farming hasbeen reduced by 11.7 percent in the past 47years. The land area devoted to farming in LakeCounty has declined in every agricultural censussince 1950 (Illinois Department of Agriculture1999). Lake County lost about 71 percent of itsfarmland, or six times the percentage loststatewide. In 1950, 70,011 ha (173,000 ac) weredevoted to farmland; the number dropped to24,306 ha (60,061 ac) in 1997 (US CensusBureau 1950, LCTIP 1999). The average farm
TABLE 2-16Distance to Metra Service in the Larger Study Areaa
Population
Distance from Transit 1990 1996 2020 b
Within 0.8 km (0.5 mi) of Pace 415,23358%
468,63157%
499,48950%
a The larger study area includes all of Lake County and adjacent portions of McHenry and Cook counties.b Existing Airport 2020 RTP No-Build development scenario.Source: NIPC

AFFECTED ENVIRONMENT
2-16
size in Lake County in 1997 was 62 ha (152 ac).Figure 2-6 provides information on cropproduction. The total market value of LakeCounty agricultural products sold in 1997 was$35,637,000. Crop sales accounted for92 percent of Lake County agricultural cashreceipts in 1997; livestock made up theremaining 8 percent. Smaller specialty farmsalso exist in Lake County, with landscapenurseries and apple orchards being the mostcommon.
2.2.2 Prime and ImportantFarmland
The US Department of Agriculture–NaturalResources Conservation Service (USDA-NRCS) has divided farmland into fourcategories to describe aspects of resource value:prime farmland, unique farmland other thanprime, farmland of statewide importance, andfarmland of local importance. Based on reviewof representative soil maps of parts of Lake
County that are in agricultural production,approximately 85 percent of the land areas areclassified as prime farmland, with most of theremainder being important farmland.
The prime farmland is land that has the bestcombination of physical and chemicalcharacteristics for producing food, feed, forage,fiber, and oilseed crops. It may exist as cropland,pastureland, rangeland, forestland, or other landnot designated in urbanized areas or in bodies ofwater. Prime farmland produces the highestyields when treated and managed according toacceptable farming methods. In addition, theUSDA-NRCS has identified farmland other thanprime that is of statewide importance because ofits value in the production of food, feed, forage,and oilseed crops. These areas are designated as“important farmland.”
TABLE 2-17Existing Agricultural Land Within Lake County, 1997
TownshipAgricultural Land Area,
ha (ac)Total Land Area,
ha (ac)Portion of Land In
Agriculture
Antioch 2,647 (6,542) 10,850 (26,811) 24.4%
Avon 1,578 (3,900) 6,175 (15,258) 25.6%
Benton-Zion 848 (2,095) 6,058 (14,970) 14.0%
Cuba 688 (1,700) 6,283 (15,525) 11.0%
Deerfield-W. Deerfield 174 (429) 7,728 (19,096) 2.3%
Ela 1,638 (4,048) 9,299 (22,977) 17.6%
Fremont 3,526 (8,713) 9,277 (22,923) 38.0%
Grant 894 (2,209) 5,963 (14,735) 15.0%
Lake Villa 1,709 (4,223) 6,731 (16,633) 25.4%
Libertyville 1,328 (3,281) 9,458 (23,372) 14.0%
Newport 4,105 (10,143) 8,714 (21,532) 47.1%
Shields 184 (455) 4,603 (11,374) 4.0%
Vernon 594 (1,467) 9,413 (23,259) 6.3%
Warren 1,705 (4,212) 9,506 (23,489) 17.9%
Wauconda 2,663 (6,581) 6,263 (15,475) 42.5%
Waukegan 25 (63) 5,505 (13,604) 0.5%
TOTALS FOR LAKE COUNTY 24,306 (60,061) 121,826 (301,033) 20.0%
Source: CH2M HILL 1997 aerial photography update of NIPC data

AFFECTED ENVIRONMENT
2-17
2.3 Natural Resources2.3.1 Geological Setting2.3.1.1 Surficial Geology and
TopographyWith the retreat of the glacial system, thicklayers of glacially deposited soil (glacial“drift”) covered most of Lake County. Thedrift was mostly in the form of relatively highnorth-south oriented end moraines separatedby low ground moraines. The soil of thisundulating topography of ridges and lowlandsconsisted of glacial drift with lenses of clay,silt, sand, gravel, and scattered humic andwood deposits. A diverse vegetative coverformed throughout the area. A savanna ofprairie grass and burr oak formed on the ridgesof the end moraine. As the terrain descendedto the ground moraine, prairies covered thelandscape. Scattered throughout this prairiebetween the ridges were lakes and wetlands.In some locations where drainage ways hadformed between the ridges, woodedfloodplains were established. The major near-surface moraines and morainic systemsinclude the Valparaiso System(undifferentiated), the Tinley Moraine, and theLake Border Morainic System and associatedground moraine (Willman 1971).
Within the moraine systems, sand and graveldeposits were left by glacier meltwater, rivers,streams, and outwash plains. These sand andgravel aquifers are associated with the DesPlaines River Valley and the hills and ridgesof western Lake County. Deposits also appearin the vicinity of Channel Lake and LakeMoraine in northwestern Lake County.Figures 2-7 and 2-8 depict the location ofthese sand and gravel deposits.
Sediments deposited in the deep water ofancient glacial lakes are another defined groupof geologic materials in Lake County. Theselake sediments consist of silt, sand, gravel, andclay deposits. Sediments were deposited in aquiet water environment and contain well-bedded silt, thin beds of clay (which has givenway to a large wetland region), and lenses ofsand and gravel along the former beaches.
Extreme north central and southwestern LakeCounty contains extinct lakebeds of theEquality Formation. A 1.6 km (1 mi) wideband of Equality Formation lake sediment lies3.2 km (2 mi) inland from Lake Michigan.
The glaciers shaped the western half of LakeCounty. The rough topography of the kame andkettle landscape contains additional ridges(eskers), knobs, and terraces. Drainage on thesesurfaces is poor and abundant peat deposits haveformed. The deposits continue through theTinley Moraine region where the presence oflakes nearly ceases.
To the east in Lake County, the Des PlainesRiver and tributary valleys dissect the LakeBorder Morainic System and parts of the TinleyMoraine. The river has developed a sandyfloodplain along which numerous outwashterraces can be found. Outwash terraces consistof sediments deposited anciently by streams andrivers that flowed out of the rapidly meltingglacial ice. East of the Des Plaines River valley,the terrain flattens and gently descends into LakeMichigan.
The highest elevation in Lake County is GanderMountain (northwest Lake County) and thelowest elevation is southeast near the DesPlaines River and Cook County borders.
The soils in Lake County fall into twotaxonomic soil categories: mollisols andalfisols. Mollisols are organic rich soils, whilealfisols are a clay rich brown to gray-brownsoils. Compressed clays, undisturbed byactivity, exhibit good engineering properties.
2.3.1.2 Bedrock and Structural GeologyLake County is situated on the northeastern flankof the gently sloping Kankakee Arch, where thesurface bedrock formation dips easterly at 1.8 to2.8 m/km (10 to 15 ft/mi) (Woller and Gibb1976). Paleozoic in origin, the Kankakee Arch islinked to the Wisconsin Arch to the northwest andthe Cincinnati Arch to the southeast. Bedrockformations are not naturally exposed in LakeCounty as it was covered by glacial drift 27 to92 m (90 to 300 ft) thick during the most recentWisconsin glacial episode. Figure 2-9 shows acomplete columnar section of the bedrock unitspresent in Lake County.

AFFECTED ENVIRONMENT
2-18
The upper or “surface” bedrock in LakeCounty consists of sedimentary rocks such asdolomite and shale. In a small area of westernLake County, the Silurian dolomite has erodedand underlying rock from the Ordovician ageMaquoketa Group is exposed. These rocksvary in thickness from less than a fewcentimeters in western Lake County to morethan 61 m (200 ft) in southeastern LakeCounty. The shallow dolomite produces waterin varying quantities depending on thepresence of water-bearing sands in theoverlying drift. The shallow dolomite aquiferis separated from deeper aquifers by the shalesof the Maquoketa Group, which range inthickness from 30.5 m (100 ft) in the south to76 m (250 ft) in the west-central area and arenot considered a water source (Woller andGibb 1976). Below the shale is the Cambrian-Ordovician aquifer, a group of hydrologicallyconnected rocks. Figure 2-10 shows thethickness and slope of bedrock strata fromIsland Lake to Lake Bluff (Woller and Gibb1976). The bedrock is intact below the surfaceweathered zone, can support significant loads,and provides a suitable base for mostconstruction projects, including bridgefoundations and highway piers.
The nearest known fault to Lake County is theSandwich fault, located about 80 km (50 mi)southwest of the county. The fault is about 193km (120 mi) long, running from Ogle to Willcounties. Seismic activity in Lake County is aslow as it is in most of Illinois except for thesouthern extremities of the state. Other naturalland use hazards in the county are floodingand wetlands, which are discussed later in thisdocument.
2.3.1.3 Mineral ResourcesAs of 1992, Lake County ranked 39 in Illinoisout of 102 counties based on total value ofminerals extracted, processed, andmanufactured (Samson and Masters 1992), withsand, gravel, and peat the top mineralsextracted. There are no quarries in LakeCounty. Figures 2-7 and 2-8 depict thedistribution of these operations in Lake County.As a result of its glacial history, Lake Countycontains many locations for the commercial
mining of sand and gravel. There are twogeologic features associated with these miningoperations: the Henry Formation along theDes Plaines River Valley, and the hills andridges (kames and eskers) west of the DesPlaines River in west-central Lake County. InIllinois and in Lake County, valley trains andoutwash plains are the primary source ofconstruction sand and gravel. As of 1992, ninesand and gravel pit locations under sixownerships were active. Lake Countyproduces sand and gravel of all classes. Sandand gravel units mined include Henry, Wasco,Mackinaw, Batavia, and Wedron.
Peat, a dark brown to black residuum ofdecaying marsh plants, is harvested primarilyfor horticultural and agricultural purposes, butis occasionally sold in bulk for earthwormcultivation. As of 1992, two of the fourcompanies in Illinois producing peatcommercially were in Lake County. DahlEnterprises and Roots Peat Farm harvest threetypes of peat (reed sedge, moss, and peathumus) under the broad classification ofGrayslake Peat (Samson and Masters 1992).The Volo bog area of Lake County is atextbook example of a peat forming marshenvironment.
2.3.1.4 Groundwater ResourcesThere are four aquifer systems in northeasternIllinois (NIPC 1976). The aquifers are sandand gravel deposits in glacial drift, shallowdolomite limestone formations, Cambrian-Ordovician or deep sandstone aquifer, and theMt. Simon aquifer. In Lake County, the glacialdrift ranges in thickness from 27 m (90 ft) inthe southeastern region to more than 91 m(300 ft) in the west-central region. Accordingto the United States Environmental ProtectionAgency (USEPA) web site(http://www.epa.gov/ogwdw/swp/sumssa.html), as of February 1, 2001, there are no solesource aquifers in Illinois.
The ISGS also publishes a map titled Potentialfor Contamination of Shallow Aquifers fromLand Burial of Municipal Wastes (Berg et al.1984). The map (Figure 2-11) indicates thatLake County is considered to have a relativelylow potential for aquifer contamination; up to

AFFECTED ENVIRONMENT
2-19
15 m (50 ft) of silty clay materials occur insurficial deposits. Exceptions to this geology inLake County are the Des Plaines River channel,the northern half of the county along LakeMichigan shoreline, and the area adjacent to theChain O’ Lakes. These areas of sand and graveldeposits all have higher potential for aquifercontamination than the rest of the county.
As of 1990, 19 percent of the homes in LakeCounty used well water for their water supply(Lake County Framework Plan, Lake CountyDepartment of Planning, Zoning &Environmental Quality 1994). The19,600 private water supply wells in LakeCounty typically withdraw from the shallowglacial drift aquifer or the shallow dolomiteaquifer system. The two shallow aquifers areboth recharged by precipitation (Hughes et al.1966). The primary threat to the shallowaquifer systems is associated with watershedcontamination due to runoff from urbanization(Lake County Department of Planning, Zoning& Environmental Quality 1994).
The public and community supply wells inLake County typically range from 15 to 457 m(50 to 1,500 ft). The shallow wells are set insand and gravel, the mid-range wells are set inSilurian dolomite, and the deep wells are set inthe Cambrian-Ordovician aquifer (Woller andGibb 1976). In 1976, there were 199 publicwells in Lake County (Woller and Gibb 1976).Currently, there are 115 community supplywells and 24 municipal supply wells(CH2M HILL, GIS Database 1999). Onlyabout 8,000 homes are supplied by publicsupply wells in Lake County; 4,000 are in theWildwood and Vernon Hills service areas andthe rest are scattered throughout Lake County(Lake County Department of Planning, Zoning& Environmental Quality 1994).
2.3.2 Water Quality and WaterResources
2.3.2.1 Surface Water ResourcesThe three watersheds in the study area includethe Fox River, Des Plaines River, and LakeMichigan. These watersheds parallel each otherand run in a north to south direction.
Figure 2-12 shows all three watersheds.Information from the Illinois EnvironmentalProtection Agency (IEPA), Illinois NaturalHistory Survey (INHS), and IllinoisDepartment of Natural Resources (IDNR)provided a characterization of these threewatersheds.
In Illinois, General Use Water QualityStandards (Title 35, Subtitle C, Part 302,Subpart A) protect waters of the state (streamsand rivers) for indigenous aquatic life,agricultural use, primary and secondary use,and institutional use. All water quality datawere compared to the General Use WaterQuality Standards.
Stream quality is assessed using both thechemical and physical data along withbiological data. The predominant streamquality indicator used in the IEPA and IDNR’sBiological Stream Characterization (BSC)(Bertrand 1996) is the Index of Biotic Integrity(IBI), an index for describing the health orintegrity of the fish community.
The IEPA annually assesses the streams forfish consumption and overall, aquatic life,swimming, drinking water supply, andsecondary contact uses. Table 2-18 (on thefollowing page) summarizes the classificationsystems and gives a comparison of the BSCand the USEPA classifications.
Fox River Watershed. The Fox Riveroriginates in Wisconsin on the west side ofMilwaukee and flows southwest beforeentering Illinois at the northwest corner ofLake County. It flows generally south beforemerging with the Illinois River in Ottawa. TheFox River is 185 km (115 mi) long from thestate border to the confluence with the IllinoisRiver. The Upper Fox River Watershed issituated in Lake, McHenry, Cook, Kane, andDuPage counties.
The segment of the Upper Fox River fromAlgonquin to the Wilmot Dam in Wisconsinis listed as a candidate for the National Wildand Scenic Rivers, and therefore isconsidered a Class 1 stream in this area. Thelength in river miles from the Wisconsin-Illinois state border to just south of Elgin (the

AFFECTED ENVIRONMENT
2-20
beginning of the Lower Fox River) is 74 km(46 mi).
The study area for the project includes 53 km(33 mi) of the Upper Fox River and 694 km2
(268 mi2) of watershed. Table 2-19 (on thefollowing page) lists the 16 subbasins in theFox River study area and presents physicalcharacteristics and biological classifications.
Water quality data was obtained from FoxRiver AWQMN stations DT 35, DT 22, andDT 06 and Nippersink Creek AWQMN stationDTK 04. Comparison of the water quality dataobtained from IEPA (1996 and 1998) to theGeneral Use Water Quality Standardsindicates there have been no violations of thestandards with the exception of fecal coliformand dissolved oxygen (USEPA 1999).Segments of the Fox River from Flint Creek toMcHenry Dam and Ferson to Poplar Creek arelisted on the Section 303(d) list of waterquality impaired streams.
Stream uses within the watershed range fromfull support (Nippersink Creek, Upper reachesof the Fox River, and Poplar Creek) to partialsupport (a segment of the lower Fox River andCotton Creek). Nutrient and ammonia loadswere attributed to less than full supportassessment (IEPA 2000b). There are no state
listed species expected to be in any of thestreams within the Fox River Watershedportion of the study area. No individual livemussels have been collected in the study areawithin 50 years.
There are roughly 52 km2 (20 mi2) of lakecoverage in the Fox River Watershed. CedarLake has been identified as a biologicallysignificant waterbody due to the observationof four threatened fish species in this lake,including the state threatened Iowa darter(Etheostoma exile) (Page et al. 1991). Otherwater bodies in the study area include CrossLake, Deep Lake, East Loon Lake, West LoonLake, Bangs Lake, Sullivan Lake, WoosterLake, Lily Lake, Turner Lake, Round Lake,and Grays Lake.
Des Plaines River Watershed. The DesPlaines River originates in Wisconsin, south ofUnion Grove. The river enters Illinois in thenortheast corner of Lake County and flows souththrough Lake and Cook counties. The DesPlaines merges with the Kankakee River nearChannahon, Illinois (Will County) to form theIllinois River. The entire Des Plaines RiverWatershed covers 345,874 ha (854,669 ac) inLake, Cook, DuPage, and Will counties. Fromthe Wisconsin-Illinois border to the junctionwith the Kankakee River, the river is 176.9 km
TABLE 2-18Summary of the Classification Systems and Comparison of the BSC and the USEPA Classifications
USEPA ClassificationGeneral
DescriptionIEPA/IDOC Biological Stream
Characterization IBI Result a MBI Result b
Full Support Good Unique Aquatic Resource (Class A) 51–60 <5.0
Full Support Good Highly Valued Resource (Class B) 41–50 5.0–5.9
Partial Support (Minor) Fair Moderate Aquatic Resource (Class C) 31–40 6.0–7.5
Partial Support (Moderate) Fair Limited Aquatic Resource (Class D) 21–30 7.6–8.9
Non-Support Poor Restricted Aquatic Resource (Class E) <20 >8.9
a Index of Biotic Integrity (IBI) evaluates stream quality at the community level using 12 metrics encompassing trophiccomposition, abundance and condition of the fish community.b Macroinvertebrate Biotic Index (MBI) evaluates stream quality and is calculated using the numerical rating of eachtaxon developed by the IEPA (1989). The formula for the index is:
MBI = Σ(niti)N
Where ni = number of individuals in each taxon iti = tolerance value for taxon iN = number of individuals

AFFECTED ENVIRONMENT
2-21
(109.9 mi). The study area includes 62 km(38 mi) of the Des Plaines River and 616 km2
(238 mi2) of watershed.
Included in the Des Plaines River system isthe West Fork North Branch Chicago River(West Fork), the Middle Fork North BranchChicago River (Middle Fork), and the SkokieRiver. The North Branch Chicago Riveroriginates east of Libertyville as the MiddleFork. This stream flows south through Lakeand Cook counties before merging with theSkokie River in Northfield. The Skokie Riveroriginates near North Chicago in Lake County
and subsequently merges with the West Forknear Morton Grove. The river at this pointthen becomes the North Branch ChicagoRiver.
The Des Plaines River is predominantly poolsand glides with stream widths from 18 m(60 ft) in Lake County to 183 m (600 ft) inWill County. The river bottom is mainlybedrock covered with sand and gravel. About31 km (20 mi) of the river have beenchanneled in Lake and Cook counties (Page etal. 1991).
TABLE 2-19Fox River Watershed Basins
Drainage BasinStreams
within Basin
DrainageArea,
km2 (mi2)
TotalStream,km (mi)
Stream,km (mi)
FlowCharacteristics
BSCAquatic
ResourceClass
IEPA a Use
Assessment
Nippersink Creek Nippersink Creek 56.56 (21.84) 63.2 (39.3) 15.0 (9.3) Perennial Highly Valued Full Support
Upper Fox River Fox River 86.7 (33.49) 185 (115) 36.2(22.5)
Perennial Moderate toHighly Valued
Full Support
Sequoit Creek Sequoit Creek 39.5 (15.25) 12.1 (7.5) 12.1 (7.5) Perennial Limited Not Rated
Dutch Creek Dutch Creek 17.38 (6.71) 6.6 (4.1) 3.2 (2.0) Intermittent andPerennial
Moderate Not Rated
Lower Fox River -1
Fox River 100.65 (38.86) 185 (115) 18.3(11.4)
Perennial Moderate Full Support
Fish Lake Drain Fish Lake Drain 22.14 (8.55) 4.0 (2.5) 4.0 (2.5) Perennial Not Rated Not Rated
Squaw Creek Squaw CreekEagle Creek
98.67 (38.10) 24.6 (15.3)2.1 (1.3)
24.6(15.3)
2.1 (1.3)
PerennialPerennial
Highly Valued Not RatedFull Support
Boone Creek Boone Creek 2.62 (1.01) 21.9 (13.6) 1.6 (1.0) Perennial Highly Valued Full Support
Mutton Creek Mutton CreekCotton Creek
34.58 (13.35) 6.3 (3.9)4.2 (2.6)
6.3 (3.9)4.2 (2.6)
PerennialPerennial
Moderate Not RatedPS b
Sleepy HollowCreek
Sleepy HollowCreek
7.8 (3.01) 12.9 (8.0) 5.3 (3.3) Perennial Limited Not Rated
Lower Fox River -2
Fox River 69.9 (26.99) 185 (115) 20.4(12.7)
Perennial Moderate Full Support
Slocum Lake Drain Slocum LakeDrain
29.03 (11.21) NA NA Perennial Not Rated Not Rated
Tower Lake Drain Tower Lake Drain 19.04 (7.35) NA NA Perennial Not Rated Not Rated
Flint Creek Flint Creek 90.47 (34.93) 22.5 (14.0) 22.5(14.0)
Perennial Limited Full Support
Spring Creek Spring Creek 16.37 (6.32) 20.8 (12.9) 7.4 (4.6) Perennial Not Rated Not Rated
Poplar Creek Poplar Creek 1.89 (0.73) 28.3 (17.6) 28.3(17.6)
Perennial Moderate Full Support
a Source: IEPA 2000bb PS/Min I=Partial Support/Minor Impairment

AFFECTED ENVIRONMENT
2-22
There are 16 basins within the Des PlainesRiver Watershed. Table 2-20 summarizes thephysical characteristics and biological ratingof the basins.
Comparison of the water quality data for heavymetal and chlorides that are obtained from twostations (G07 and G08) on the Des Plaines River(1994 through 1998) to the General Use WaterQuality Standards indicates that there have beenno water quality violations (IEPA 1999).According to the IEPA General Water Use
Quality Standards, stream impairment is due tomunicipal point sources, habitat alterations,salinity, storm sewers, urban runoff, and nutrientloadings. The stream uses range from fullsupport to partial support. The followingstreams appear on the IEPA’s Section 303(d)list of water quality impaired waterbodies: SaltCreek, Des Plaines River, and the North BranchChicago River. The water quality impairment isprimarily attributed to nutrients, siltation, andorganic enrichment (USEPA 1999).
TABLE 2-20Des Plaines River Watershed Basins
DrainageBasin
Streams withinBasin
DrainageArea, km2
(mi2)
TotalStream, km
(mi)Stream,km (mi)
FlowCharacteristics
BSCAquatic
ResourceClass
IEPA UseAssessment a
North Mill Creek North Mill CreekHastings Creek
55.9 (21.6) 28.2 (17.5)NA
20.3 (12.6)NA
Perennial Limited Not RatedPS b
Upper DesPlaines R.
Upper Des PlainesR.
137 (53.0) 176.0 (109.0) 36.0 (22.4) Perennial HighlyValued toLimited
PS b
NewportDrainage Ditch
Newport DrainageDitch
21.8 (8.4) NA NA Intermittent andPerennial
Not Rated Not Rated
Mill Creek Mill CreekAvon-Fremont Ditch
79.8 (30.8) 18.7 (11.6)8.2 (5.1)
18.7 (11.6)8.2 (5.1)
PerennialPerennial
Moderate Full SupportNot Rated
Bull Creek Bull Creek 31.9 (12.3) 11.9 (7.4) 11.9 (7.4) Perennial Limited Full Support
Indian Creek Indian Creek 97.4 (37.6) 22.5 (14.0) 22.5 (14.0) Perennial Moderate PS b
Lower DesPlaines R.
Lower Des PlainesR.
59.3 (22.9) 176 (109.0) 25.4 (15.8) Perennial Limited PS b
Buffalo Creek Buffalo Creek 55.9 (21.6) 17.5 (10.9) 17.5 (10.9) Perennial Not Rated PS b
Aptakisic Creek Aptakisic Creek 17.1 (6.6) 5.1 (3.2) 5.1 (3.2) Perennial Not Rated Not Rated
Salt Creek Salt Creek 11.4 (4.4) 73.9 (45.9) 1.8 (1.1) Perennial Moderate PS b
Arlington HeightsBr. Salt Creek
Arlington Heights Br.Salt Creek
21.5 (8.3) 9.7 (6.0) 3.5 (2.2) Perennial Not Rated Not Rated
McDonald Creek McDonald Creek 11.9 (4.6) 14.3 (8.9) 7.4 (4.6) Intermittent Limited Not Rated
WheelingDrainage Ditch
Wheeling DrainageDitch
15.3 (5.9) 5.5 (3.4) 5.5 (3.4) Perennial Not Rated Not Rated
West Fork West Fork NorthBranch Chicago
River
23.3 (9.0) 28.5 (17.7) 13.7 (8.5) Perennial Limited Non-Support
Middle Fork Middle Fork NorthBranch Chicago
River
50.5 (19.5) 125.0 (77.7) 21.7 (13.5) Perennial Limited PS b
Skokie River Skokie River 56.2 (21.7) 38.5 (23.9) 27.2 (16.9) Perennial Limited PS b
a Source: IEPA 2000bb PS=Partial Support

AFFECTED ENVIRONMENT
2-23
The Des Plaines River, Mill Creek, Bull Creek,and an unnamed tributary (located north ofLibertyville) have been classified as Class Istreams by IDOT and IDNR (IDOT/IDNR1995). The Des Plaines River is a candidate forthe national Wild and Scenic Rivers list for thesegments from Wheeling to Libertyville andfrom Libertyville to near the Wisconsin stateline.
The state threatened Iowa darter occurs in twounnamed tributaries of the Des Plaines Riverin east-central Lake County. Seven statethreatened and state endangered musselspecies are known from the Des Plaines Riversystem; however, all are outside Lake County.
The Chicago River Watershed is included inthe Des Plaines River basin and is comprisedof three basins: the West Fork North BranchChicago River (West Fork), Middle ForkNorth Branch Chicago River (Middle Fork),and the Skokie River. These rivers generallyflow through developed areas and flow intothe Chicago Sanitary and Ship Canal.
Water quality data was obtained for onestation on the Middle Fork for the period of1994 to 1998. Comparison of the data to theGeneral Use Water Quality Standardsindicated that the total chloride levelsexceeded the water quality standard
(500 mg/L) in 1994 and 1997. The remainingparameters obtained were within thestandards.
The West Fork, Middle Fork, and SkokieRiver are classified as either partial support ornon-support use. They are not classified asClass I streams, nor as candidates for the listof National Wild and Scenic Rivers. Therehave been no records of populations ofthreatened or endangered fish or mussels inthese streams. The IEPA assessment of thesestreams indicated that stream impairment wasattributed to nutrients, habitat alterations,chlorine, siltation, organic enrichment,pathogens, flow, and salinity.
Lake Michigan Watershed. The LakeMichigan Watershed consists of severalwaterways along the shoreline with outlets intoLake Michigan. The USGS river mileagesurvey lists seven streams in Lake County. Theshoreline in Lake County is about 39 km (24mi) long with the watershed ranging from 1.6to 6.4 km (1 to 4 mi) wide. The drainage area inthe study area for the Lake MichiganWatershed is 137 km2 (53 mi2).
The Lake Michigan Watershed consists of fivesubbasins, each of which has outlets to LakeMichigan. Table 2-21 presents the drainageareas and flow characteristics of the basins.
TABLE 2-21Lake Michigan Watershed Basins
DrainageBasin
Streamswithin Basin
DrainageArea, km2
(mi2 )
TotalStream,km (mi)
Stream,km (mi)
FlowCharacteristics
BSCAquatic
ResourceClass
IEPA UseAssessment a
Kellogg Creek Kellogg Creek 22.74 (8.78) 7.39 (4.59) 7.39 (4.59) Perennial Not Rated Not Rated
15.85 (9.85) 15.85 (9.85) Perennial Not Rated Not RatedDead River Dead River
Bull Creek
47.92 (18.5)
8.72 (5.45) 8.72 (5.45) Perennial Not Rated Not Rated
Waukegan River Waukegan River 30.46 (11.76) 11.93 (7.41) 11.93 (7.41) Intermittent andPerennial
Not Rated PS b
Pettibone Creek Pettibone Creek 10.77 (4.16) 4.41 (2.74) 4.41 (2.74) Perennial Not Rated PS b
Bluff/Ravine 12 UnnamedStreams
25.41 (9.81) Varies Varies Perennial Not Rated Not Rated
a Source: IEPA 2000bb PS= Partial Support

AFFECTED ENVIRONMENT
2-24
There is no water quality data readily availablefor any of the streams in the Lake MichiganWatershed to compare to the General UseWater Quality Standards. None of the streamsappear on either the Class I stream list or theNational Wild and Scenic Rivers candidatelist. The Waukegan River is included on theIEPA’s Section 303(d) list of water qualityimpaired streams. Priority organics and metalsare the primary cause of the water qualityimpairment.
2.3.3 WetlandsWetlands are associated with lakes, streams,and their associated floodplains as well asisolated depressions. Within the study area,the relief is generally gently sloping, withpoorly defined drainage patterns. Many of thedrainageways end in depressions and marshes.The 1987 Corps of Engineers WetlandDelineation Manual (hereafter, The Manual)defines a wetland as “those areas that areinundated or saturated by surface orgroundwater at a frequency and durationsufficient to support, and that under normalcircumstances do support, a prevalence ofvegetation typically adapted for life insaturated soil conditions.” In Illinois, thedefinition of wetlands as defined by theInteragency Wetland Policy Act (IWPA), issimilar to the federal definition, with theexception that it specifically states that thereneeds to be a predominance of hydric soilspresent. All wetlands meeting these threecriteria would be considered jurisdictionalareas under state law for all projects usingstate or state pass-through funding. The IWPAdefinition includes restored or createdwetlands for mitigation that do not currentlymeet the parameters stated.
For the purposes of complying with theSection 404 program, the federal governmentendorses the use of two separate delineationmanuals, the 1987 Corps of EngineersWetlands Delineation Manual and theDepartment of Agriculture’s National FoodSecurity Act Manual (third edition). A 1994Federal Memorandum of Agreement betweenthe Department of Defense, the Department ofInterior, the USEPA, and the Department of
Agriculture defines situations to which thesetwo manuals may be applied. It requires theuse of the 1987 Corps of Engineers WetlandDelineation Manual (with current US ArmyCorps of Engineers’ regulatory guidance) byall federal resource agencies on non-agricultural land for Section 404 purposes.When determinations or delineations are madeon agricultural lands for Section 404 purposes,the National Food Security Act Manual mustbe used.
The Lake County Wetland Inventory (LCWI),including the Advanced Identified Wetlands(ADID) program and the National WetlandInventory (NWI), provide information forsummarizing the wetlands in Lake County andwas the primary source of wetland data forthis study. Natural Resource ConversationService (NRCS) Wetland Maps were not usedfor this study. After a preferred alternative isselected, the NRCS maps will be used duringthe formal delineation process.
The LCWI database is locally derived and isconsidered more locally accurate than theNWI. The LCWI classifies wetlands in LakeCounty under seven categories: artificialwetlands, converted wetlands, two categoriesof farmed wetlands, prior converted, urbanconverted, and wetlands. The LCWI definesthe ‘wetlands’ category as being those areasthat are relatively undisturbed as a result ofagriculture or development and includeswetlands identified as ADID.
Wetland resources in Lake County wereassessed on a watershed level due to the sizeof the study area. The three primarywatersheds in Lake County are the Fox River,Des Plaines River including the North Branchof the Chicago River, and Lake Michigan.The Fox River and Des Plaines Riverwatersheds account for approximately95 percent of the LCWI identified wetlandacreage in Lake County. Much of this total ispart of the Chain O’ Lakes (see Figure 2-13).Table 2-22 (on the following page) illustratesLake County wetland types and acreage bywatershed. Areas categorized by LCWI as‘wetlands’ constitute 97, 94, and 94 percent,respectively, of all the LCWI wetlands in the

AFFECTED ENVIRONMENT
2-25
Fox River, Des Plaines River, and LakeMichigan watersheds. The other six types ofwetlands account for a small percentage oftotal wetlands mapped by the LCWI in thecounty.
The total wetland acreage for Lake Countymapped by the LCWI as shown in Table 2-22includes large expanses of open water,including the Chain O’ Lakes. By definition,some of these open water bodies would bedefined as open water habitat and others asriverine rather than as wetlands. To better assesswetland resources in the county that meet thecriteria for wetlands, as defined by The Manualand the IWPA, it was necessary to remove theareas that are considered open water such aslakes and rivers from these totals. Open waterlakes, ponds, and rivers are “waters of the U.S.”and, as such, are still regulated by the US ArmyCorps of Engineers. Mitigation of impacts to the“water” is assessed in a case-by-case basis. Inaddition, for this assessment, the totals for the sixLCWI categories; artificial wetlands, convertedwetlands, both farmed wetlands, prior convertedand urban converted were removed from thetotal. Total wetland resources as mapped by
LCWI are approximately 18,500 ha (45,700 ac),not including open water. Much of the openwater area removed from this total is associatedwith the Chain O’ Lakes. The NWI indicatesthat there are approximately 13,390 ha(33,087 ac) of wetlands in Lake County(Suloway and Hubbell 1994). The LCTIP hasresolved to use the LCWI data for the remainderof this study. The rationale for this decision isrelated to the greater care and accuracy of theLCWI information.
There are 203 ADID wetlands in Lake County,totaling about 10,000 ha (25,000 ac). TheADID wetland program is a USEPA initiativedeveloped to shorten permit processing time.Also, it provides some predictability to theSection 404 regulatory program, by providinginformation to assist local governments inzoning, permitting, and land acquisitiondecisions. This was a cooperative effort withthe USEPA, US Army Corps of Engineers,USFWS, IDNR, NIPC, and variousdepartments and agencies within LakeCounty. The Lake County ADID inventorywas adopted on January 20, 1993 (NIPC1992). The ADID wetlands were considered
TABLE 2-22Lake County Wetland Inventory
Wetland TypeFox River Watershed,
ha (ac) aDes Plaines River
Watershed, ha (ac)Lake Michigan
Watershed, ha (ac)
Artificial Wetlands 40 (99) 43 (106) 9 (22)
Converted Wetlands 40 (99) 9 (22) —
Farmed Wetlands 163 (403) 179 (442) 6 (15)
Farmed Wetlands b 40 (99) 94 (232) 2 (5)
Prior Converted 15 (37) 9 (22) —
Urban Converted 81 (200) 283 (699) 121 (299)
Wetlands 11,940 (29,504) 9,996 (24,701) 2,347 (5,800)
Total 12,319 (30,441) 10,613 (26,224) 2,485 (6,141)
Non Wetland c 970 (2,397) 526 (1,300) 40 (99)
a Rounded to the nearest whole number
b Similar to farmed wetlands except that they do not qualify for regulation under Swampbuster because not
enough crop damage from flooding and inundation occurs.c Areas that were considered non-jurisdictional wetlands by LCWI yet were mapped as wetlands in the NWI.Source: Lake County Wetland Inventory (LCWI) 1990

AFFECTED ENVIRONMENT
2-26
unsuitable for the discharge of dredge or fillmaterial. As a result, the US Army Corps ofEngineers has exerted discretionary authorityover these wetlands, and any proposedimpacts to these wetlands are not eligible fornationwide permitting.
Both the LCWI and the NWI use wetlandassessment methodologies largely based onremote sensing methods. Such methods areuseful for rough assessment over large areas;however, field-based assessments are alwaysmore accurate on an individual wetland sitelevel. Because of limited information onindividual wetlands at a countywide level ofassessment, the only available qualitativeassessment conducted on wetlands at thisscale is the ADID study. The ADID studyincluded a general assessment of quality andfunctions of the wetland resources in LakeCounty. Wetlands identified as ADIDgenerally embrace three qualities: habitatdiversity, stormwater storage, and waterquality mitigation. The Lake County ADIDinventory characterized the qualities of eachADID wetland, and the LCTIP furtherassessed the ADID study and identified thehighest quality wetlands, which are shown inFigure 2-14. Following the selection of thepreferred alternative, impacted ADIDwetlands would be verified with a field-based, multi-functional wetland assessment.
Because a qualitative assessment of wetlandresources in Lake County is limited to theADID program, only a general assessment ofimportant wetland resources in the countywas performed. Of the 203 wetlandsclassified as ADID wetlands, more than130 were considered to have high functionalvalues for wildlife habitat and high qualityplant communities. Additionally, ADIDwetlands have also been identified as habitatsfor threatened and endangered species ofplants and wildlife. Based on originaldeterminations, over 60 ADID wetlands wereidentified as having threatened or endangeredspecies present.
A review of the ADID locations in LakeCounty show that a majority of these sites arelocated along streams, lakes or within protected
lands such as forest preserves, nature preserves,and Illinois Natural Area Inventory (INAI)sites. Figure 2-15 shows the relationship ofADID wetlands and these protected sites. Thisfigure also shows general concentrations ofthese ADID wetlands. The two largestcomplexes are within Illinois Beach State Parknear Zion and the Chain O’ Lakes State Park inthe northwestern part of the county. Othersmaller concentrations of ADID wetlands canbe identified; these areas are broken out bywatershed.
Additionally, several non-ADID wetlandslocated throughout the county may be affordedthe same protection as a high quality wetland.These sites may have been smaller than the2 ha (5 ac) area limitation for inclusion aspotential ADID. Additionally, some of thesewetlands are afforded higher protection basedon their proximity to forest preserves, naturepreserves, INAI sites, or other public lands.Approximately 682 wetlands, totalingapproximately 1,783 ha (4,406 ac) of non-ADID wetlands, are located within designatedlands and could be considered higher qualitywetlands. These wetlands are summarized inthe watershed discussions.
2.3.3.1 Fox River WatershedThe LCWI reports over 12,200 ha (30,000 ac)of all wetland types are within the Lake Countyportion of this watershed (Table 2-23, on thefollowing page). According to the GISdatabase, 107 ADID wetlands (48 percent) arein the Fox River Watershed in Lake County.Total ADID acreage in the Fox RiverWatershed in Lake County is 5,550 ha(13,714 ac), or roughly 44 percent of the LCWIwetland acreage in the watershed (Figure 2-13).
There are six large ADID wetland complexeswithin this watershed. The largest ADIDcomplexes are the Chain O’ Lakes State Park,which includes the Grass Lake WetlandComplex, north, east, and west of Grass Lake;along Squaw Creek, south of Long Lake nearthe Village of Round Lake; along the TowerLake Drain from Tower Lake to the Fox Riverand Grassy Lake, near North Barrington; theLoon Lake complex, extending to Deer Lake

AFFECTED ENVIRONMENT
2-27
into the Des Plaines River Watershed; VoloBog area south of the Chain O’ Lakes; and theWauconda area, extending southwest towardsthe Tower Lakes complex. As Figure 2-15shows, most of these ADID wetlandcomplexes are associated with forestpreserves, nature preserves, INAI sites, andstate parks. In general, the relationshipbetween these wetland complexes and theprotected sites indicates that these wetlandsare relatively high quality.
Within this watershed, there are approximately174 non-ADID wetlands totaling 292 ha(723 ac) located within protected areas. Manyof these are located in three forest preservesites: Cuba Marsh, Lakewood, and thenorthern half of Grant Woods.
2.3.3.2 Des Plaines River WatershedThe LCWI reports over 11,400 ha (27,000 ac)of all wetland types are within the Lake Countyportion of the Des Plaines River Watershed(Table 2-24, on the following page). Accordingto the GIS database, 102 ADID wetlands
(45 percent) are in the Des Plaines RiverWatershed in Lake County. Total ADIDacreage in the Des Plaines River Watershed inLake County is 2,553 ha (6,311 ac), orapproximately 24 percent of the LCWI wetlandacreage in the watershed (Figure 2-13).
There are seven large ADID wetlandcomplexes within this watershed. The largestADID complexes in this watershed are LoonLake/Deer Lake complex that extends into theFox River Watershed; the Fourth LakeFen/Rollins Savanna complex; the Des PlainesRiver Trails/Wadsworth Prairie complex nearWadsworth; the Middle Fork Savannacomplex near Lake Forest; Site 15 ForestPreserve complex, along the Middle Fork ofthe North Branch of the Chicago River nearGreen Oaks; Grainger Woods Forest Preservecomplex near Vernon Hills; and RyersonWoods complex near Riverwoods. Figure 2-15shows that most of these ADID wetlandcomplexes are associated with forest preserve,nature preserves, and INAI sites. In general,the relationship between these wetland
TABLE 2-23LCWI Subbasin Wetland Totals—Fox River Watershed, Lake County
Drainage Basin Streams within BasinTotal Wetland,
ha (ac) a
% ofCounty
WetlandsADID
WetlandsADID,
ha (ac) a
Upper Fox River Fox River 4,700 (11,614) 20 15 2,100 (5,189)
Sequoit Creek Sequoit Creek 1,200 (2,965) 4 14 890 (2,199)
Fish Lake Drain Fish Lake Drain 560 (1,384) 2 9 240 (593)
Squaw Creek Squaw Creek; Seavey Ditch;Eagle Creek
1,900 (4,695) 7 27 600 (1,483)
Lower Fox River Fox River 230 (568) 0.9 6 120 (297)
Mutton Creek Mutton Creek; Cotton Creek 560 (1,384) 2 8 240 (593)
Slocum Lake Drain Slocum Lake Drain 800 (1,977) 3 7 360 (890)
Tower Lake Drain Tower Lake Drain 840 (2,076) 3 5 600 (1,483)
Flint Creek Flint Creek 1,450 (3,583) 5 14 320 (791)
Nippersink NA NA 2 80 (198)
TOTAL 12,240 (30,246) 46.9 107 b 5,550(13,716)
a Rounded to nearest whole numberb Some ADID wetlands overlap watershed boundaries inflating the total number of ADID wetlandsSource: CH2M HILL, GIS Database 1999

AFFECTED ENVIRONMENT
2-28
complexes and the protected sites indicatesthat these wetlands are of relatively highquality. All but nine of the Lake County ForestPreserve sites in this watershed contain ADIDwetland complexes. About eight ADIDwetlands are located in nature preserves orINAI sites in this watershed.
In addition, the ADID designation has beenapplied to segments of stream systems in thiswatershed that would include adjacentwetlands. These streams include Mill Creek,Bull Creek, Indian Creek, and Buffalo Creek.
Within this watershed, there are approximately456 non-ADID wetlands totaling 1,360 ha(3,361 ac), located within protected areas.Many of these wetlands are located in eightforest preserve sites; four sites are locatedalong the Des Plaines River and include
Wright Woods/Half Day, Gurnee Woods,Wetlands Project, and Van Patten Woods.Two of the forest preserve sites are along theNorth Branch of the Chicago River: PrairieWolf Slough and Middle Fork Savanna. Theremaining two sites include the WaukeganSavanna and the Rollins Savanna.
2.3.3.3 Lake Michigan WatershedThe LCWI reports over 3,100 ha (7,660 ac) ofall wetland types are within the Lake MichiganWatershed (Table 2-25, on the following page).According to the GIS database, 14 ADIDwetlands (6 percent) are in the Lake MichiganWatershed in Lake County. Total ADIDacreage in this watershed in Lake County is1,770 ha (4,374 ac), or roughly 57 percent ofthe LCWI wetland acreage in the watershed(Figure 2-13).
TABLE 2-24LCWI Subbasin Wetland Totals—Des Plaines River Watershed, Lake County
Drainage Basin Streams within Basin
TotalWetland,ha (ac) a
% ofCounty
WetlandsADID
WetlandsADID,ha (ac)
North Mill Creek North Mill Creek; HastingsCreek
1,000 (2,471) 4 12 490(1,211)
Mill Creek Mill Creek Avon-Fremont Ditch 1,500 (3,707) 6 15 570(1,409)
Newport DrainageDitch
Newport Drainage Ditch 240 (593) 1 3 40 (99)
Upper Des PlainesRiver
Upper Des Plaines River 2,900 (7,166) 10 15 360 (890)
Bull Creek Bull Creek 450 (1,112) 2 6 120 (297)
Indian Creek Indian Creek 1,300 (3,212) 5 13 360 (297)
Lower Des PlainesRiver
Lower Des Plaines River 1,100 (2,718) 4 12 200 (494)
Buffalo Creek and 66 Buffalo Creek 500 (1,236) 2 3 80 (198)
Aptakisic Creek Aptakisic Creek 200 (494) 0.7 0 0 (0)
Skokie River Skokie River 650 (1,606) 2 4 120 (297)
Middle Fork Middle Fork North BranchChicago River
1,100 (2,718) 4 16 200 (494)
West Fork West Fork North BranchChicago River
200 (494) 0.8 3 13 (32)
TOTAL 11,140(27,527)
41.5 102 b 2,553(6,311)
a Rounded to nearest whole numberb Some ADID wetlands overlap watershed boundaries inflating the total number of ADID wetlandsSource: CH2M HILL, GIS Database 1999

AFFECTED ENVIRONMENT
2-29
There is only one large ADID wetlandcomplex within this watershed. The IllinoisBeach State Park/Spring Bluff Forest Preserveare identified as ADID sites. This ADIDcomplex extends from the Wisconsin state lineto Waukegan Harbor, with minimalinterruptions for areas like the Zion NuclearPower Plant. The ADID wetlands extend southpast the boundaries of the state park andcoincide with the boundaries of designatedINAI sites. Only two other ADID wetlands arelocated in this watershed. Figure 2-15illustrates the location of ADID wetlands inthe study area and the Lake MichiganWatershed.
Within this watershed, there are approximately50 non-ADID wetlands totaling 130 ha(322 ac) located within protected areas. Manyof these wetlands are located in three forestpreserve sites: Spring Bluff along LakeMichigan, Lyons Woods, and Greenbelt.
2.3.4 FloodplainsAbout 21,185 ha (52,350 ac) in Lake Countyare designated as floodplains, representing17.4 percent of the land area (LCTIP 1999).Floodplains are defined as those flood proneareas that have been identified as part of theNational Flood Insurance Study Program(NFIP) and are depicted on the FederalEmergency Management Agency (FEMA)maps. The floodplain areas, watershedboundaries, and major waterways within the
Fox River, Des Plaines River, and LakeMichigan watersheds are shown in Figure 2-12.FEMA has established the 1-percent annualchance (or 100-year) flood as the nationalstandard for floodplain management purposes.The FEMA maps depict floodplains forwaterways with tributary areas of at least2.6 km2 (1 mi2), or 260 ha (640 ac).
In addition to the floodplain boundaries, somewaterways have identified floodways. Thefloodway is that portion of the floodplain thatmust be kept free of encroachment so that the100-year flood can be carried withoutsubstantial increases in flood heights.Regulatory floodways are located in42 municipalities as well as unincorporatedareas of Lake County (FEMA 1994). Therelationship between the floodway, floodwayfringe, and floodplain is graphically depictedon the waterway cross section in Figure 2-16.
The Lake County Stormwater ManagementCommission (SMC) regulates development inadditional floodplains based on the requirementsof the Lake County Watershed DevelopmentOrdinance (WDO). Per the WDO criteria,floodplains include any flood prone area with atributary area of at least 40 ha (100 ac) (ratherthan 260 ha or 640 ac) and any area of grounddepression capable of storing 0.75 ac-ft of waterduring the 100-year flood event.
The function and role of floodplains aredescribed in the Model Floodplain Ordinancedeveloped by NIPC and the IDNR-Office of
TABLE 2-25LCWI Subbasin Wetland Totals—Lake Michigan Watershed, Lake County
Drainage Basin Streams within BasinTotal
Wetland a
% of CountyWetlands
ADIDWetlands ADID
Kellogg Creek Kellogg Creek 650 (1,606) 2 3 500 (1,236)
Dead River Dead River, Bull Creek 1,600 (3,954) 6 4 1,250 (3,089)
Waukegan River Waukegan River 650 (1,606) 2 3 12 (30)
Pettibone Creek Pettibone Creek 40 (99) 0.2 0 0 (0)
Bluff/ Ravine 12 unnamed streams 160 (395) 0.6 4 8 (20)
TOTAL 3,100 (7,660) 10.8 14 b 1,770 (4,375)
a Rounded to nearest whole numberb Some ADID wetlands overlap watershed boundaries inflating the total number of ADID wetlandsSource: CH2M HILL, GIS Database 1999

AFFECTED ENVIRONMENT
2-30
Water Resources. The ordinance states that:
“Floodplains and their associatedstream, wetland, and shoreline areasare among the State’s greatest assets,because of multiple benefits related toenvironmental quality, natural resourcemanagement, and recreationalopportunity. Floodplains are generallybest able to provide these benefits ifkept in a natural condition. Alterationsof floodplains have resulted inincreased flood and storm waterhazards, reduced water quality, loss ofhabitat and recreational opportunitiesand poor aesthetics withincommunities. Wherever possible, thenatural characteristics of floodplainsand their associated water bodiesshould be preserved.”
The western-most part of the county drains tothe Fox River. The Fox River Watershedcomprises 43,055 ha (106,390 ac), or35 percent of Lake County. The far easternportion drains to Lake Michigan. The LakeMichigan Watershed comprises 13,731 ha(33,930 ac), or 11 percent of Lake County.Between these two watersheds are the DesPlaines River and Chicago River watersheds,which remain separate within Lake County, butjoin together downstream in Cook County; theyare included together as part of the Des PlainesRiver Watershed for purposes of this analysis.This combined Des Plaines River Watershedcomprises 65,070 ha (160,790 ac), or 54 percentof the total area of Lake County (LCTIP 1999).
There are 47 tributaries in the Fox RiverWatershed, most having associated floodplains.The Chain O’ Lakes is an essential naturalfeature covering much of the land area. Olderhomes line the shores of numerous lakes.However, direct development in the floodplainis now infrequent, occurring mostly in isolatedareas within the unincorporated areas. Of the43,055 ha (106,390 ac) in this watershed,11,210 ha (27,700 ac), or 26 percent of the area,are within floodplains. This is, by far, thehighest concentration of floodplains within thecounty, and is primarily attributed to the ChainO’ Lakes. Land uses within this watershed
include agriculture (22.5 percent), vacant andopen space (28.1 percent), and water(10.8 percent). The remaining land area iscurrently developed (39.6 percent). Of the11,210 ha (27,700 ac) of floodplain area,14.8 percent is currently developed(LCTIP 1999).
The Des Plaines River Watershed has44 tributaries, most having associatedfloodplains. Over 40 percent of the Des PlainesRiver floodplain has been set aside as forestpreserve and is protected from development. Ofthe 65,070 ha (160,790 ac) in this watershed,8,470 ha (20,930 ac), or 13.0 percent of thearea, are within floodplains. Land uses withinthis watershed include agriculture(21.5 percent), vacant and open space(25.9 percent), and water (2.9 percent). Theremaining land area is developed(49.7 percent). Of the 8,470 ha (20,930 ac) offloodplain area, 22.1 percent is developed(LCTIP 1999).
The Lake Michigan Watershed has12 tributaries. Of the 13,731 ha (33,930 ac) inthis watershed, 1,505 ha (3,720 ac), or11.0 percent of the area, are withinfloodplains. Land uses within this watershedinclude agriculture (4.4 percent), vacant andopen space (24.8 percent), and water(1.1 percent). The remaining land area iscurrently developed (69.7 percent). This is, byfar, the most developed section of LakeCounty. Of the 1,505 ha (3,720 ac) offloodplain area, 19.9 percent is currentlydeveloped (LCTIP 1999).
2.3.5 Biological ResourcesThe Illinois Natural Heritage Database, thefederal lists for threatened and endangeredspecies, and IDNR land cover type mappingwere reviewed regarding biological resourceswithin the study area. The review of biologicalresources was based solely on documentaryand records research; it involved no fieldwork.
2.3.5.1 Vegetation and Cover TypesIDNR categorizes 14 vegetative cover types inLake County. Table 2-26 (on the followingpage) summarizes the total acreage and

AFFECTED ENVIRONMENT
2-31
percent of the total acres in Lake County foreach cover type. A database compiled byINHS indicates that there are over1,440 species of plants recorded for LakeCounty (Iverson 1999).
Approximately 42 percent of the total cover inLake County is considered developed land,including low, medium, and high-densitydevelopment, along with urban grasslands. Bothhigh and medium density developments contain alarge amount of impervious area, which provideslimited cover, foraging, and resting areas forwildlife. Only small amounts of impervious areasare present for low-density designations, whichprovide greater amounts of foraging and coverhabitat. Low-density areas are generallyconsidered to be covered by grassland, shrubland,and woodlands. Other dominant cover typesinclude closed canopy deciduous forest(14 percent), row crops (13 percent), and ruralgrassland (12 percent). Grasslands are divided
into two groups: urban and rural. Urban grasslandincludes parks, residential lawns, golf courses,cemeteries, and other open space, both privateand public. Rural grassland is defined aspastureland, grassland adjacent to waterways,vegetated buffer strips, and Conservation ReserveProgram (CRP) land. The CRP is a federalprogram that removes farmland from activeagricultural production.
The most important cover types for wildlife arethe forested lands (20 percent), rural grasslands(12 percent), and wetlands (11 percent), whichinclude deep marsh, shallow marsh, shallowwater wetlands, and forested wetlands.
Based on the IDNR classification, 11 percent ofthe county is comprised of open water andwetland communities. This combination of covertypes provides important habitat for many speciesof plants and wildlife, and it harbors many of thethreatened or endangered species of birds in thecounty. Section 2.3.3, Wetlands, illustrates the
TABLE 2-26Cover Types, Lake County
Cover Types ha (ac) in Lake County % in Lake County
High Density Development 5,402 (13,348) 4.5
Medium Density Development 13,176 (32,558) 10.9
Low Density Development 11,032 (27,261) 9.1
Rural Grassland 14,025 (34,657) 11.6
Urban Grassland 20,593 (50,887) 17.0
Row Crop 15,902 (39,294) 13.1
Deciduous Forest–Open Canopy 6,961 (17,200) 5.7
Deciduous Forest–Closed Canopy 17,161 (42,406) 14.2
Orchards and Nurseries 448 (1,108) 0.4
Open Water 3,457 (8,542) 2.9
Deep Marsh 3,671 (9,070) 3.0
Shallow Marsh 3,643 (9,001) 3.0
Shallow Water Wetlands 3,920 (8,945) 3.0
Forested Wetlands 2,114 (5,224) 1.7
TOTAL 121,505 (299,501) 100
Source: Lumen 1996

AFFECTED ENVIRONMENT
2-32
general distribution of wetland habitats across thecounty by watershed.
There are few remaining areas of native tallgrassprairie and oak savannas within Lake County.The larger remnant prairie and savannacommunities are generally protected and arefound within the forest preserve district holdings.A review of the nature preserves list for LakeCounty shows seven large prairie communities inLake County. These include:
• Gavin Bog and Prairie• Highmoor Park Nature Preserve• Hibernia Nature Preserve• Illinois Beach State Park (Nature
Preserve)• Lyons Prairie and Marsh Nature Preserve• Skokie River Nature Preserve• Wadsworth Prairie Nature Preserve
All the sites listed are protected as either forestpreserve or Nature Preserve sites. Additionalknown prairie sites, not listed above, are theBuffalo Grove Prairie located on private landnorth of Lake Cook Road near the WisconsinCentral Railroad tracks and the North ShorePrairie located along Sheridan Road in LakeBluff. The Buffalo Grove Prairie is owned by autility company, thus no special protected statushas been secured for this particular site. TheNorth Shore Prairie is being managed by theLake Forest Open Lands Association (Taft1997c). Section 2.3.6, Special Lands, details thetypes of plant communities found within theindividual forest preserves including prairie andsavanna communities. Most remaining standsof native prairie are not located within forestpreserves. Other areas may contain scatteredremnants of individual plant species or smallgroupings of prairie plants. These are mostlyscattered, small in size, and generally occurwithin protected rights-of-way, including utilityor railroad corridors. As prairies and savannashave no special protection status, unless theycoincide with wetlands or nature preserves,they have historically been developed foragricultural or urban development purposes.
Forest resources within the study area arescattered throughout the entire county. Largecontiguous stands of woods are generally located
along the existing waterways primarily along theDes Plaines River. Historically, forests and woodswere confined to the areas along the major riversdue to the existence of the native prairiecommunities that once dominated Lake County.The conversion of prairies to agricultural landsprevented the expansion of forested areasthroughout the county. Original climax forest inLake County is believed to be oak-hickory.
Other unique forested communities include thedry mesic to mesic forest seep communitieslocated in the ravines adjacent to Lake Michigan,primarily in the Lake Forest area north of FortSheridan. These areas have been identified aspost-Pleistocene glaciation refuges for remnantplant communities (Taft 1997a, 1997c).
The remaining large tracts of forest resources inthe study area are generally found along thesmaller waterways, including Buffalo Creek,Indian Creek, Bull Creek, Mill Creek, and in thesouthwest corner of Lake County between LakeZurich, Tower Lakes, and Barrington. A reviewof aerial photography shows that many of theforested areas identified by IDNR are residentialdevelopments that retained large amounts offorested areas within the development.
Other forested areas in Lake County wouldgenerally be considered urban or suburbanforests, which include trees planted within citiesand villages, along with residences that are builtin heavily wooded areas.
The least productive cover types for providinghabitat for wildlife would include orchards andnurseries, row crops, and high and mediumdensity developments. Wildlife may use theseareas to some extent for foraging, but there is littleopportunity for nesting or cover for most species.Wildlife species and vegetation communities inthese areas are limited to those that are highlytolerant to disturbance.
2.3.5.2 Wildlife
The study area contains a variety of wildlifehabitats. The most important cover types forwildlife are the forested lands, ruralgrasslands, and wetlands. The ongoingdevelopment within the county has somewhatlimited the distribution of wildlife to these

AFFECTED ENVIRONMENT
2-33
three cover types. Many of these areas arefound within stream and river corridors, forestpreserve district holdings, and the more ruralareas in the western half of the county. Largeforest preserve holdings , such asIndependence Grove, MacArthur Woods,Ryerson Woods, and Lakewood, provide largeareas of habitat within the central portion ofthe county. Of these four large preserves, allbut Lakewood are located within the DesPlaines River “greenway” that extends north–south, almost the entire length of the county.Lakewood, located near Wauconda, isrelatively isolated. Additional large areas ofwildlife habitat are found within two stateparks located within Lake County. Theseinclude Chain O’ Lakes State Park and IllinoisBeach State Park along Lake Michigan.
With the exception of the Des Plaines Rivercorridor and the Chain O’ Lakes region, mostof the areas of prime wildlife habitat arescattered throughout the county. The lack ofprotected corridors linking these habitat areascreates a wildlife island effect. While this islandeffect is not as important for birds and largemammal species, this can inhibit movement ofother forms of wildlife throughout the county.The lack of protected corridors also increasesthe potential for human/wildlife interactionsuch as collisions with vehicles and wildlifedamage to residential landscaping. Figure 2-15illustrates the location of forest and naturepreserves within the county, along with ADIDwetland habitats. This figure also shows a lackof habitat continuity along an east-westdirection. Without using farms, streamcorridors, wetlands or developed areas, there islittle opportunity for east-west wildlifemovement in Lake County.
Figure 2-15 also shows the lack of continuousnorth-south greenway or wildlife corridorsoutside of the Des Plaines River corridor.Although more open lands are present in thewestern half of the county, wildlife migratingnorth–south, west of the Des Plaines Rivercorridor, must also use limited streamcorridors and wetland complexes whereavailable, along with farmland, and developedareas for movement.
The developed areas of the county willprovide minimal habitat for wildlife. The typesof wildlife found within the urban/suburbanareas are species that are tolerant ofdisturbance and human activities. Thisincludes a variety of bird and mammalspecies.
Birds. The Lake County Forest PreserveDistrict (LCFPD) reports that 293 bird speciesare known to occur in Lake County. Of thisnumber, 125 species are known to nest in LakeCounty. LCFPD also indicates an additional18 species are believed to nest in the county.A full list of all birds known to occur in LakeCounty is provided in Appendix C. Of thenesting species, there are ten birds of prey,seven game birds, seven herons, seven speciesof waterfowl, two rails, five shorebirds, twogulls, and three terns, as well as woodpeckersand songbirds. Two heron colonies orrookeries are known to be present, with thepotential for more colonies to be presentwithin the county. A heron colony was notednear Indian Creek (Amundsen and Enstrom1996) and at Almond Marsh. Both of theseareas coincide with ADID wetlanddesignations.
All habitat and cover types may be used by birdsfor foraging, nesting, or breeding. Although it isnot generally regarded as bird habitat, even high-density developed land is used by manysongbirds, gulls, and doves for forage, rest, andbreeding activities. Many of the bird speciesidentified in Lake County are commonly foundin or near open water and wetlands. In addition,many of the songbirds (passerines or perchingbirds), of which 76 species breed within thestudy area, commonly use water systems fordaily feeding and resting activities. Table 2-27(on the following page) lists the birds that are,for the most part, directly associated with openwater and wetlands. In general, these species aremore dependent on less disturbed areas thatretain some natural features and can be used, tosome extent, as indicators of habitat quality.Exceptions to this are Canadian geese andmallards, which are fully adapted to humanactivities and have proliferated in humanpresence.

AFFECTED ENVIRONMENT
2-34
Mammals. The LCFPD lists 42 species ofmammals known to occur in Lake County. Afull list of mammals known to inhabit LakeCounty is found in Appendix C. While thesespecies have been noted to occur in the forestpreserve holdings, the listing is indicative ofthe types of mammals that inhabit the countyas a whole. All of the mammal species listedare terrestrial, with the exception of beaver(Castor canadensis) and muskrat (Onatriazibethicus). Mink (Mustela visons), which isboth aquatic and terrestrial, is also known tooccur. The list of species includes eightspecies of bats, two species of fox, fivespecies of squirrels, and two species ofweasels. Most Illinois furbearers have beenreported in Lake County, along with 21 rodentspecies. White-tailed deer (Odocoileusvirginianus) and coyote (Canis latrans) are theonly large mammals known to occur in LakeCounty.
Species considered by LCFPD to be rare inLake County include Pygmy shrew (Sorexhoyi), Franklin’s ground squirrel(Spermophilus franklinii), prairie vole(Microtus ochragaster), woodland vole(Microtus pinetorum), and the badger(Taxidea taxus). The gray fox (Urocyoncinereoargentus) is the only speciesconsidered uncommon. The species that areconsidered rare or uncommon generally preferlarger, relatively undisturbed areas for habitat.Seventeen percent of mammal species in LakeCounty are considered rare, with 80 percentconsidered abundant or common. Abundantand common species can be found in a varietyof habitats and are generally tolerant ofdevelopment and human activities. The forestpreserve sites and the rural western portions ofthe county appear to provide the majority ofthe necessary habitat requirements for thesemammal species.
TABLE 2-27Bird Species Found In or Near Open Water and Wetlands in Lake County
Common Scientific Common Scientific
Pied-billed grebe* Podilymbus podiceps Mute swan Cygnus olor
American bittern* Botaurus lentiginosus Wood duck Aix sponsa
Least bittern* Ixobrychus exilis Mallard Anas platyrhynchos
Great blue heron Ardea herodias Blue-winged teal Anas discors
Great egret Casmerodius albus egretta Hooded merganser Lophodytes cucullatus
Green-backed heron Butorides virescens King rail* Rallus elegans
Black-crowned night heron* Nycticorax nycticorax Virginia rail Rallus limicola
Yellow-crowned night heron* Nyctanassa violacea Sora Porzana carolina
Canada Goose Branta canadensis Common moorhen* Gallinula chloropus
Ring-billed gull Larus delawarensis American coot Fulica americana
Herring Gull Larus argentatus Sandhill crane* Grus canadensis
Common tern Sterna hirundo Killdeer Charadrius vociferus
Forster’s tern* Sterna forsteri Spotted sandpiper Actitis macularia
Black tern* Chlidonias niger Upland plover* Bartramia longicauda
Belted Kingfisher Megaceryle alcyon Common snipe Capella gallinago
Woodcock Philohela minor
* State or federal-listed threatened or endangered species

AFFECTED ENVIRONMENT
2-35
Reptiles and Amphibians. According to theLCFPD, 19 species of reptiles, seven of whichare turtles and 12 are snakes, and 15 species ofamphibians are known to occur in LakeCounty. The INHS indicates that up to36 species of reptiles and amphibians(19 reptiles and 17 amphibians) could inhabitLake County based on range maps (Phillips1995). Species considered rare or uncommonby LCFPD in Lake County include the Spinysoftshell turtle (Trionyx spiniferus), Easternhognose snake (Heterodon platirhinos),smooth green snake (Opreodrys vernalis), andthe red-bellied snake (Storeriaoccipitonaculata). The remaining species ofreptiles are considered common or locallycommon.
The LCFPD lists 15 species of amphibians asoccurring in Lake County. Five of the speciesare newts or salamanders, including the mudpuppy (Necturus maculosus) that inhabitsLake Michigan. Two species of toads andeight species of frogs also occur. There is noinformation provided by the LCFPD on theabundance of any amphibian species. Watersystems including wetlands, streams, rivers,and lakes are important habitats for bothreptiles and amphibians. The full list ofreptiles and amphibians as documented by theLCFPD is provided in Appendix C.
Fish. The LCFPD lists 89 species of fish asoccurring in Lake County. Of these, 21 speciesare found only in Lake Michigan and are notwithin the project study area. Other fish speciesknown in Lake County include 22 minnowsand carp, four suckers, six catfish andbullheads, two true basses, 10 sunfish, and10 perch and darter species. Additionalinformation on fishes is provided in Section
2.3.2, Water Quality and Water Resources. Afull list of known species within Lake County isprovided in Appendix C.
2.3.5.3 Threatened and EndangeredSpecies
Federal-listed Species. According toinformation provided by the USFWS and theUSFWS North Central Region “Red Book, ”there are only two federal-listed plant species,the Eastern prairie fringed orchid/prairiewhite-fringed orchid (Platanthera leucophaea)and Pitcher’s thistle/dune thistle (Cirsiumpitcheri), occurring in Lake County. Twofederal-listed bird species, the piping plover(Charadrius melodus) and the interior leasttern (Sterna antillarum), are listed asoccurring in Lake County. Both plant speciesare federal threatened, whereas both birdspecies are federal endangered. The Karnerblue butterfly, (Lycaeides melissa samuelis—federal and state endangered) is also know tooccur within the county. The USFWSindicates that the Karner Blue butterfly may beextirpated from the county. Lake County is notknown to harbor any identified federal-listedmammals, reptiles, or amphibians. No federalthreatened or endangered fish are known tooccur within Lake County. Table 2-28 lists thenumber of known federal-listed threatened andendangered species by taxa. Appendix C listsall federal threatened and endangered speciesand their associated habitat.
State-listed Species. The list of Illinoisthreatened and endangered species wasreviewed to determine the amount of listedspecies known to occur within Lake County.Table 2-28 lists the known state-listedthreatened and endangered species by taxa.Appendix C lists the state threatened or
TABLE 2-28Number of Known, Federal and State-listed Threatened and Endangered Species by Taxa in Lake County *
Plants Insects Fish Amphibians Reptiles Birds Mammals Mollusks
Number of Federal-listed T&E Species 2 1 0 0 0 2 0 0
Number of State-listed T&E Species 127 4 9 1 4 26 0 1
* Number of known breeding speciesSource: Herkert 1994, 1999

AFFECTED ENVIRONMENT
2-36
endangered species known to occur in LakeCounty.
• Plants—There are 127 state threatenedand endangered plant species known tooccur within Lake County. Twenty-six ofthe plant species are state threatened and101 are considered state endangered. Ofthe state-listed plant species, 33 aregenerally found along the Lake Michiganshoreline or similar sandy habitats.Approximately 43 listed species aregenerally found in bogs or fens andapproximately 22 of the species aregenerally found in prairie habitats. Theremaining species inhabited varioushabitats such as dolomite bluffs, forestsand flatwoods, and other wetlandcommunities.
• Insects—The Illinois Endangered SpeciesProtection Board identifies four listedspecies of insects as occurring in LakeCounty. Three of the insect species arestate endangered, including the KarnerBlue butterfly, and one species is statethreatened. Three of the insect species arebutterflies and one is a leafhopper.
• Fish—The Illinois Endangered SpeciesProtection Board identifies nine listedspecies of fishes as occurring in LakeCounty. Four of the species are specific toLake Michigan and would not beconsidered within the study area. Thegreater redhorse (Moxostomavalenciennesi—state endangered) isbelieved to be extirpated. The pugnoseshiner (Notropis anogenus— stateendangered), blacknose shiner (Notropisheterolepis—state endangered), blackchinshiner (Notropis heterodon—statethreatened), tend to inhabit well-vegetatedglacial lakes and clean streams. The IowaDarter (Etheostoma exile) has beenrecently identified at a few sites in LakeCounty. The species have been observednear the IL 120/IL 21 interchange withinan unnamed tributary to the Des PlainesRiver, in Bull Creek north of Libertyville,within two unnamed tributaries to the DesPlaines River between Libertyville and IL
120, within various lakes, and near DilleyRoad in Mill Creek (Taylor and Wetzel1999). The banded killifish (Fundulusdiaphanus) is also found in clean glaciallakes that are vegetated.
• Amphibians—The Illinois EndangeredSpecies Protection Board identifies onlyone listed species of amphibian asoccurring in Lake County: the four-toedsalamander (Hemidactylium scutatum—threatened). This species’ habitatrequirement is boggy woodland ponds,sphagnum areas adjacent to woodlands,and springfed headwaters of woodlandstreams.
• Reptiles—The Illinois EndangeredSpecies Protection Board identifies fourlisted species of reptiles as occurring inLake County. Two of the reptile speciesare snakes: the eastern massasaugarattlesnake (Sistrurus catenatus-endangered) and the Kirtland’s snake(Clonophis kirtlandi – threatened). TheIllinois mud turtle (Kinosternonflavescens) is listed as endangered. TheBlanding’s turtle (Emydoidea blandingii)has recently been listed as statethreatened. Kirtland’s snake prefers wetmeadows, open swamp-forests, and wetvacant urban areas. The Massasaugarattlesnake prefers wet prairies, bogs andswamps, and rarely dry woodlands. Themud turtle is generally found near pondsin sand prairie areas. Blanding’s turtlesprefer marshes, prairie wetlands, sedgemeadows, and shallow vegetated portionsof lakes.
• Birds —The Illinois Endangered SpeciesProtection Board identifies 26 listedspecies of birds as occurring in LakeCounty. Seven of the bird species areidentified as threatened in Illinois. Theremaining 19 species are identified asendangered. Appendix C lists the birdspecies identified as threatened orendangered species within Lake County.
• Mollusks—The Illinois EndangeredSpecies Protection Board identifies onelisted mussel species, the spike mussel

AFFECTED ENVIRONMENT
2-37
(Elliptio dilatata ), as state threatened. Thismussel is found in small or large streamswith mud or gravel substrates.
Based on habitat considerations of the statelisted species (Herkert 1991, 1994), a generalassessment of species distribution wascompiled to determine important areas for thesespecies. Eight categories of habitat werederived from the habitat requirements of boththreatened and endangered plant and wildlifespecies. The habitat categories are:
• Prairies/Grasslands• Lake Michigan• Bogs/Fens/Special wetland habitats• Forest/Flatwoods• Savannas• General wetlands• Streams• Other
For each species, the habitat requirementswere reviewed. Based on this general review,nearly two-thirds of the listed species presentwithin Lake County use less common covertypes for habitat. These cover types includebogs/fens/special wetland habitats, LakeMichigan, prairies/grasslands, and savannas.For example, ADID wetlands harboringthreatened and endangered species are shownin Figure 2-17. Cover types more common toLake County such as forest/flatwoods, generalwetlands, streams, and others (which includesa variety of habitats including urban areas)provided habitats for approximately one-thirdof the listed species in the county.
Listed species found near Lake Michigan weremost likely located within the protected areasof Illinois Beach State Park or near FortSheridan, which contains much of theremaining undisturbed dune and interdunalhabitats in the county as well as intermittentravine communities. Many of the bog and fencommunities are located in the northern andwestern half of the county in areas closer tothe Fox River/Chain O’ Lakes. This wouldinclude areas such as Volo Bog and TowerLakes Fen, among others. While prairiecommunities are scattered across the county,
many of the remnants are located within forestpreserves or other protected sites.
Although savanna remnants are not asnumerous as prairies, these features havegenerally been protected in preserves such asthe Rollins Savanna Forest Preserve. Otherknown savanna sites include the Bull CreekSavanna and the Flint Creek Savanna. TheFlint Creek Savanna was identified south of IL22 and west of Lake Zurich (Amundsen1998a). The Bull Creek Savanna is part of thenature preserve complex near Casey andAlmond Roads (IDOT 1995).
The remaining habitat groups including theforests, general wetlands, stream, and othersare located relatively uniform across thecounty. These areas are more likely to beaffected by proposed transportationimprovements.
The presence of threatened and endangeredspecies of plants and wildlife generallycoincide with areas designated as either naturepreserves or INAI sites (Figure 2-18). Alsoshown in Figure 2-18 are seven clusters of sitesthat would potentially harbor endangeredspecies. These include the Illinois Beach StatePark, Antioch/Lake Villa area, Chain O’ LakesState Park, Volo Bog area, Wauconda area,Tower Lakes/Fox River area, and the DesPlaines River corridor.
The LCFPD indicates that ten forest preservesites each contain six or more species. Theseare listed below with their closest associateddesignated lands cluster:
• Lakewood/Wauconda Bog—22 species,Wauconda Area
• Grant Woods—17 species, Volo Bog Area
• Ryerson Woods— Nine species, DesPlaines River Area
• Spring Bluff —Nine species, IllinoisBeach State Park
• Fort Sheridan—Seven species, LakeMichigan
• MacArthur Woods—Seven species, DesPlaines River

AFFECTED ENVIRONMENT
2-38
• Sun Lake—Seven species, Antioch/LakeVilla Region
• Cuba Marsh—Six species, WaucondaArea
• McDonald Woods—Six species, east ofLake Villa Area
• Wadsworth Prairie—Six species, DesPlaines River Area
Additional studies conducted by INHS forvarious transportation projects enhance existingdata on listed species. This includes limitedpotential habitat for plants in ravinecommunities along Lake Michigan (Taft1997a); red-shouldered hawk surveys nearMiller Road (Amundsen 1995); studiesconducted along Old Rand Road in Waucondanear the Wauconda bog complex (Hill, INHS2000); botanical surveys, which identified fourlisted plant species at a potential wetlandmitigation site near US 41 and IL 137 (Taft1996); and numerous surveys conducted alongIL 22 for IDOT improvements (Amundsen andEnstrom 1996, Amundsen 1995, 1998a, 1998b,1998c, and Taft 1997b). Additional INHSstudies were conducted along the former FAP342 right-of-way during previous ly proposedroad improvement projects. These studiesshowed marginal habitat for seven listed birdspecies, with overall disturbed plantcommunities.
2.3.6 Special Lands
2.3.6.1 Protected LandsLake County contains numerous properties inthe public domain that are managed andprotected for their special resources. Thecounty contains 41 forest preserves, two stateparks, numerous local parks, 21 naturepreserves, and 57 INAI sites (Figures 2-19 and2-20). These areas provide open space andhabitat for different types of plants and wildlife,including common species and threatened andendangered species that rely on this habitat forsurvival. Forest preserves and parks alsoprovide recreational activities. However, naturepreserves and natural areas are usually notdeveloped for public access because they
contain sensitive habitats or unique flora andfauna. Some nature preserves and natural areasare privately owned and public access isprohibited. In cases where public forestpreserves incorporate a nature preserve ornatural area, access is limited or restricted towell-defined trails.
2.3.6.2 Forest PreservesOf the 41 LCFPD sites, 18 sites occupyapproximately 4,613 ha (11,400 ac) and areused for active recreation with trails and anarray of activities. The remaining 23 forestpreserve sites open to the public have noestablished recreational facilities, which total anadditional 3,313 ha (8,187 ac). Total forestpreserve lands account for approximately7 percent of the total land area in Lake County.LCFPD sites are distributed among 12 of the16 townships.
LCFPD provides trails for hiking, bicycling,cross-country skiing, horseback riding, andsnowmobiling. All of the 18 forest preservesites are used for recreational activities, andprovide the same habitat for wildlife. Tworegional trails managed by the LCFPD includethe Des Plaines River Trail North and the DesPlaines River Trail South, which parallel theDes Plaines River through Lake County. Thenorthern trail is about 17.7 km (11 mi) and thesouthern trail about 19.3 km (12 mi). Thereare plans to continue the two sections until theentire 53.1 km (33 mi) trail from the state linesouth to Cook County is complete.
The forest preserve system is described inaccordance with its relationship to threewatersheds in the study area, including theFox River, Des Plaines River, and LakeMichigan watersheds. Figure 2-19 highlightsthe location of the forest preserve sites in thewatersheds. There are approximately nineforest preserves, 19 nature preserves, and26 INAI sites near the Fox River in LakeCounty. These areas account for almost half ofthe nature preserves and a third of the INAIsites within Lake County.
Five of the nine LCFPD sites have no servicesor facilities. Table 2-29 (on the following twopages) summarizes the size, function, and

AFFECTED ENVIRONMENT
2-39
TABLE 2-29Lake County Forest Preserves and Associated Nature Preserves and Natural Areas
Name of Forest Preserve Approximate Size, ha (ac) Function a Nature Preserve / Natural AreaFox River WatershedCuba Marsh b 316 (781) c R None
Deer Lake-Red Wing Slough 16 (40) U NoneFox River Forest Preserve d 123 (304) c B, R, S Lyons Prairie & Marsh and Farm Trails North
Gander Mountain 116 (287) b U None
Grant Woods f 394 (974) c E, R, S Gavin Bog and Prairie
Grassy Lake 234 (578) e U Tower Lakes Fen and Wagner Fen
Lakewood g 835 (2,063) A, B, R, S Wauconda Bog
Sunlake 215 (531) U NoneWest Loop Greenway No Data U NoneDes Plaines River WatershedAlmond Marsh 124 (306) e U Almond Marsh and Oak Openings
Bannockburn 32 (79) e U None
Berkeley Prairie 7 (17) U NoneBrae Lock Golf Course 65 (161) c B, N, S None
Buffalo Creek h 160 (395) c R, S None
Countryside Golf Course 200 (494) B, S NoneDes Plaines River Trail 1,341(3,314) e U Wadsworth Prairie
Duck Farm 142 (351) c S None
Fourth Lake Fen 92 (227) c U None
Grainger Woods i 104 (257) c H, S Lloyd’s Woods
Gurnee Woods 210 (519) U NoneIndependence Grove 448 (1,107) c U None
Lake Bluff 34 (84) U Skokie RiverMacArthur Woods 255 (630) e U MacArthur Woods
McDonald Woods j 123 (304) c R None
Middle Fork Savannah 208 (514) U NoneOld School 154 (381) c U None
Prairie Wolf Slough 174 (430) c R, S None
River Hill 90 (222) e U None
Rollins Savannah k 495 (1,223) c S None
Ryerson Woods l 223 (551) c B, N, S Edward l. Ryerson
Site 15 31 (77) e U None
Van Patten Woods 393 (971) c R, S None
Wadsworth Prairie 487 (1,203) U Wadsworth PrairieWaukegan Savannah 279 (689) e U None
Wilmont 57 (141) e U None
Wright Woods/Half Day Woods m 81 (200) c R, S None

AFFECTED ENVIRONMENT
2-40
identifies threatened and endangered speciesin these areas.
There are 27 LCFPD sites within the Des PlainesRiver system from the Wisconsin border to theCook County border. Where actual forestpreserves are not present, the sites are mostlylinked by trails along the river (Table 2-17).There are 10 nature preserves in the watershed.Of those, four are along the Des Plaines Riverand four are near the Skokie River.
There are four full forest preserves and onepartial preserve, Spring Bluff, within the studyarea of the Lake Michigan Watershed. Thereare three dedicated nature preserves in thewatershed, all of which are associated withIllinois Beach State Park. Table 2-17summarizes the characteristics of the fiveforest preserves in the Lake MichiganWatershed. Two golf courses account for morethan 200 ha (500 ac) of preserve holdings.
2.3.6.3 ParksIn addition to the Lake County forest preservesystem, local and state park districts providerecreational opportunities, including picnicsites, playgrounds, and activities, such asbiking, golfing, hiking, and canoeing, as wellas passive recreation. There are numerous parkdistricts in the study area, which are primarilymunicipal or township level districts.Figure 2-19 shows the location of the two stateparks: Illinois Beach State Park and the ChainO’ Lakes State Park. Combined, the parksdraw an average of 3.5 million visitorsannually.
2.3.6.4 Illinois Nature PreservesIDNR defines a nature preserve is “an area ofland or water in public or private ownershipthat is formally dedicated, pursuant to theterms of the law, to being maintained in itsnatural condition.” A major objective of the
TABLE 2-29 CONTINUEDLake County Forest Preserves and Associated Nature Preserves and Natural Areas
Name of Forest Preserve Approximate Size, ha (ac) Function a Nature Preserve / Natural AreaLake Michigan WatershedGreenbelt 226 (559) c R, S None
Fort Sheridan Golf Course 105 (105) c S None
Lyons Woods n 107 (264) c R None
Spring Bluff 94 (232) U Spring BluffThunderhawk Golf Course 98 (242) c B, S None
Note: Unless otherwise noted, no data on threatened and endangered species was available to documentpresencea A = Archives/ Historical Exhibits, B = Banquet/Meeting Facilities, E = Educational Activities, H = Horse Stablesand Lessons, N = Nature Center, R= Recreational Opportunities, S = Sports, U= Undevelopedb Cuba Marsh has 2 rare plant species, 3 state-listed endangered birds, and 1 county-listed endangered plantc Data obtained from Lake County Forest Preserve District, Map and Guide of Lake County Forest Preserve andTrail Maps, October 1998.d Fox River Forest Preserve has a bird rookerye Data obtained from CH2M HILL, GIS Database 1999f Grant Woods has 1 county-listed threatened plant and the only existing Kentucky Coffee Tree stand in LakeCountyg Lakewood has 17 state-listed endangered plants or animals, and has a bat colony and breeding habitat forbirdsh Buffalo Creek Nature Preserve contains important bird habitatsi Has 1 state-listed endangered plantj Has 4 state-listed endangered animalsk Has 2 state-listed endangered animalsl Has 1 state-listed endangered plant, 2 county-listed endangered animals, 4 rare animal species and a highquality floodplain forestm Has 1 state-listed endangered plant and has extensive oak and maple woodlandsn Lyons Woods has 3 rare bird species, 2 rare plant species, and large stands of oaks

AFFECTED ENVIRONMENT
2-41
nature preserve system is the preservation ofadequate samples of all the significant naturalfeatures of the state, including threatened andendangered species. Natural features includegeological and physiographic formations,soils, streams, lakes, and aquatic and terrestrialcommunities of plants and animals.
The Illinois nature preserve system consists of291 preserves containing 15,751 ha(38,922 ac). In Lake County, there are27 Illinois nature preserves totaling 1,893.8 ha(4,679.4 ac), or over 9 percent of Illinois’nature preserves (see Table 2-30). Thesepreserves are distributed among 13 of LakeCounty’s 16 townships (Figure 2-20). Their
TABLE 2-30Lake County Nature Preserves a – Fox River, Des Plaines River, and Lake Michigan Watersheds
Types of Habitat Present
Name of Nature Preserve Watershed a Size ha (ac) c
Fen
Gra
ssla
ndM
eado
w
Lake
Mic
higa
nBe
ach
Ope
n W
ater
Prai
rie
Sava
nnah
Sedg
eM
eado
w
Wet
land
Woo
dlan
d
Barrington Bog F 16.6 (41.0) X X
Cedar Lake Bog F 11.1 (27.4) X X
Farm Trails North F 8.0 (19.8) X X
Gavin Lake Bog and Prairie F 42.5 (105.0) X X X
Lyons Prairie and Marsh F 105.0 (259.5) X X
Pistakee/Brandenburg Bog F 140 (346) X X
Tower Lakes Fen F 30 (74)
Turner Lake F 38.4 (94.9) X X X X X
Volo Bog State Natural Area F 324.0 (800.6) X X X X
Wagner Fen F 40.5 (100) X X X
Wauconda Bog F 27.1 (67.0) X X
Almond Marsh DP 44.5 (110.0) X X X X X
Eastern Prairie Fringed Orchid DP 1.5 (3.7) X
Edward L. Ryerson DP 113.0 (279.2) X
Florsheim Park (Lincolnshire) DP 31.6 (78) X X X
Highmoor Park DP 4.2 (10.5) X X X X
Liberty Prairie DP 19.0 (47.0) X X X
Lloyd’s Woods DP 42.5 (105.0) X X X
MacArthur Woods DP 180.5 (446.0) X
Oak Openings DP 6.5 (16.1) X X X X X
Reed-Turner Woods DP 13.4 (33.1) X X X
Wadsworth Prairie DP 71.2 (175.9) X X
Hybernia LM 10.9 (26.9) X X X
Illinois Beach LM 335.5 (829.0) X X X X X
North Dunes LM 80.9 (199.9) X X X
Skokie River LM 40.4 (99.8) X X X
Spring Bluff LM 115.0 (284.1) X X X X
TOTAL 1,893.8 (4,679.4)
a F= Fox River, DP = Des Plaines River, LM = Lake Michiganb All these nature preserves contain at least one threatened or endangered plant or animal. Additionally, theyall contain many uncommon or rare plant or animal species.c Data obtained from the Illinois Nature Preserves Commission, 7/31/00 and Personal CommunicationsFebruary, 2001.

AFFECTED ENVIRONMENT
2-42
locations do not display an obvious pattern ofdistribution. Cuba and Libertyville townshipscontain the largest concentrations with threeeach.
LCFPD manages 764 ha (1,886 ac) of theIllinois nature preserves in the county; IDNRmanages 830 ha (2,050 ac); and park districts,conservation groups, and private entities hold theremaining 300 ha (741 ac). Table 2-30summarizes the watershed, acreage, and habitatof nature preserves for Lake County. Thesenature preserves are primarily located in or nearforest preserves or state parks. Most of the naturepreserves are located in western Lake County.The nature preserves contain a variety of habitattypes from wetlands to prairies to woodlands.
2.3.6.5 Illinois Natural AreasAs stated in the Natural Areas PreservationAct, “natural area” is defined as “an area ofland in public or private ownership which, inthe opinion of the Commission, either retainsor has recovered to a substantial degree itsoriginal natural or primeval character, thoughit need not be completely undisturbed, or hasfloral, faunal, ecological, geological orarchaeological features of scientific,educational, scenic or esthetic interest.” TheseINAI sites are usually associated with a natureor forest preserve. Within the study area, thereare 57 INAI sites (Figure 2-20). The naturalareas in Lake County are distributed among16 townships. Most of the natural areas arelocated in western Lake County. There are28 INAI sites within the Fox River Watershed,21 in Des Plaines River system, and eight inthe Lake Michigan Watershed.
2.3.7 Visual ResourcesLake County is diverse in its natural andhuman environment and exhibits a variety ofvisual characteristics. The visual quality ofLake County can be characterized by twoterms: vividness and intactness.
• Vividness—A memorable visualimpression
• Intactness—Having a measure ofnaturalness
The shoreline area along Lake Michigan isdotted by mature communities that have agood balance between development and thenatural resources of the area. This areaprovides strong relationships betweenlandform and water, and the urban areas showstrong identity in terms of their sense ofcommunity, architectural style, and sense ofplace. Amongst the patchwork of shorelinecommunities is the Illinois Beach State Park,and is located along the northern shore of thecounty. This sizeable piece of property isreasonably intact with extensive forested andwetland areas.
West of I-94 are natural resources, includinglakes, wetlands, rivers, and streams. Remnantsof the natural setting have been preserved bythe LCFPD, the state, and other open spaceentities. Overall, the natural setting in this areahas been altered by widespread suburbandevelopment. The northern parts of this areahave topographic relief and landform thatprovide additional visual interest. Low densitydevelopment in the northern parts of thecounty with natural features and topographicrelief all combine to form an interestingpattern of countryside visual images that areintact.
The visual character in the central and southernpart of the county is flat to slightly hilly terrainand is mostly in residential and agriculturaluses. The steeper terrain occurs along the edgesof major drainage ways. The terrain is brokenup by urban uses in the many suburbancommunities and clusters of residences andsubdivisions in unincorporated areas. There aresmall patches to extensive areas of woodlands,wetlands, grasslands, and other natural featuresthroughout the area. Several older farmsteadsand estates are visible at various locations. Thisarea generally lacks the topographic relief ascompared to the northern and western parts ofthe county. Waterforms are present throughoutthe area, but not to the extent as found in thenorthwestern area (Chain O’ Lakes) and to theeast with the Lake Michigan shoreline.Variations in pattern, color, and texture ofvegetation are less diverse than other parts ofthe county. The vividness of the area, asdefined by topography, waterform, and

AFFECTED ENVIRONMENT
2-43
vegetation is considered low to moderate. Themost intact resources are the Fox and DesPlaines River corridors, which are also thelocations of most of the county’s forestpreserves.
There are several prominent urban centers incentral and southern Lake County, such asLibertyville, Long Grove, Lake Zurich, andGrayslake, that provide a sense of community,architectural style, and sense of place. Theseurban settings create a coherence andcomposition that creates integrity in visualquality. Overall, the study area has beenheavily altered by human development.Residential subdivisions, commercialdevelopment, industrial development, and avariety of supporting infrastructure havealtered the natural landscape. Over the years, arather extensive system of forest preserves andother permanent public land trusts haveretained some of the natural conditions of thearea. The combination of a moderate level ofurban development and the amount of publiclands results in a low to medium degree ofintactness in the area.
2.4 Air QualityThe study area is located within the Chicagometropolitan area. This area is in violation ofthe National Ambient Air Quality Standard(NAAQS) for the pollutant ozone. The area isclassified as a “Severe” ozone non-attainmentarea and it includes the counties of Cook,DuPage, Kane, Lake, McHenry, and Will, AuxSable and Goose Lake townships in GrundyCounty, and Oswego Township in KendallCounty. Due to the non-attainment status ofthe area, the State of Illinois has developed aState Implementation Plan (SIP) identifyingprograms intended to reduce ozone precursoremissions. A “Severe” classification meansthat the region must implement specificprograms to attain air quality standards by theyear 2007.
A complete listing of the NAAQS are shownin Table 2-31 (on the following page). Theprimary standards are established at levels thatare intended to protect the public health.
Secondary standards are required to protectthe public welfare from any known oranticipated adverse effects of a pollutant.
Ozone is a colorless gas with a pungent odorand is associated with smog or haze conditions.Ozone is not directly emitted into theatmosphere but is formed when precursoremissions, hydrocarbons, oxides of nitrogen,and carbon monoxide react in the presence ofsunlight. Because of these complexrelationships and the regional nature of ozone,estimating and controlling ozone formationrequires factoring all hydrocarbon, oxides ofnitrogen, and carbon monoxide emissionswithin the region and thus, the impact on ozoneconcentrations from individual projects orfacilities cannot be observed in the immediatestudy area.
In addition to the SIP requirements,metropolitan planning organizations (MPO)are required to undertake conformitydeterminations on metropolitan transportationplans and transportation improvementprograms before they are adopted, approved,or accepted. Section 176 (c)(4) of the CleanAir Act Amendments of 1990 requires thattransportation plans, programs, and projectsthat are funded or approved under Title 23U.S.C. must be determined to conform withstate or federal air implementation plans.Conformity to an implementation plan isdefined in the Clean Air Act as conformity toan implementation plan’s purpose ofeliminating or reducing the severity andnumber of violations of the NAAQS andachieving expeditious attainment of suchstandards. The implementing regulations fordetermining conformity of transportationprojects are found in 40 CFR Part 93, “Criteriaand Procedures for Determining Conformity toState or Federal Implementation Plans ofTransportation Plans, Programs and ProjectsFunded or Approved under Title 23 U.S.C. orthe Federal Transit Act.” Highway or transitprojects that are funded or approved by theFHWA or the Federal Transit Administration(FTA) must also be included in a conformingplan before they are approved or funded byIDOT or the Metropolitan PlanningOrganization (MPO).
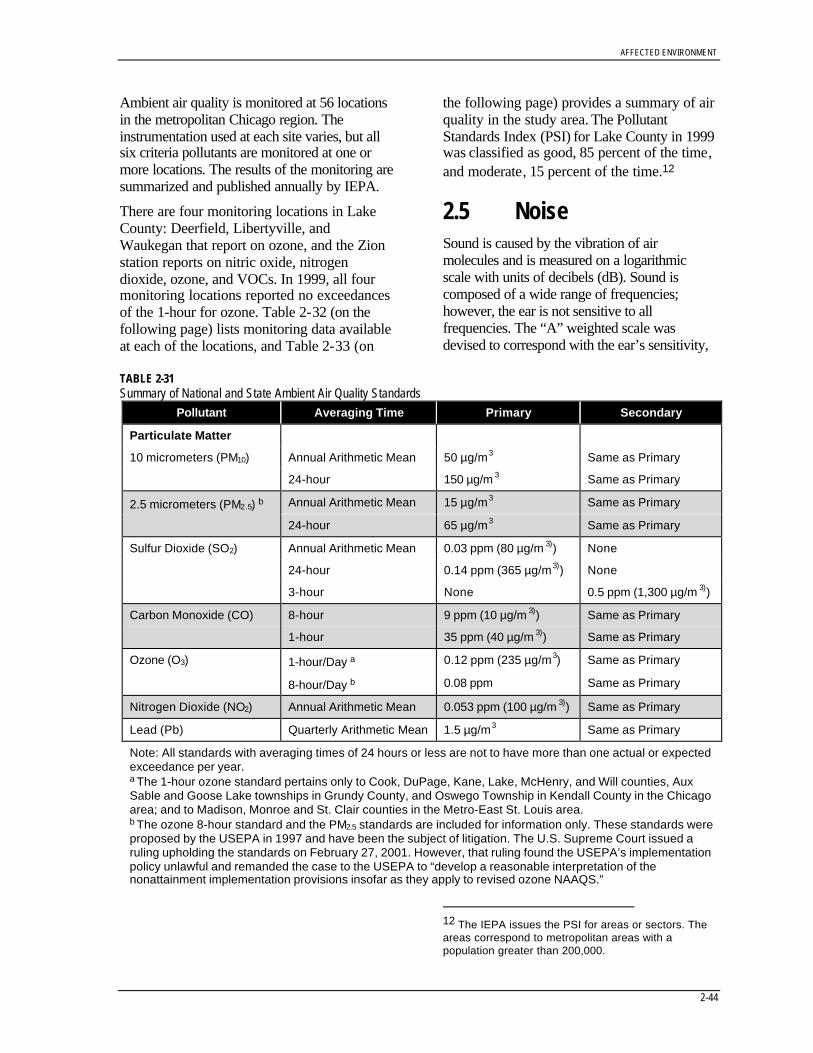
AFFECTED ENVIRONMENT
2-44
Ambient air quality is monitored at 56 locationsin the metropolitan Chicago region. Theinstrumentation used at each site varies, but allsix criteria pollutants are monitored at one ormore locations. The results of the monitoring aresummarized and published annually by IEPA.
There are four monitoring locations in LakeCounty: Deerfield, Libertyville, andWaukegan that report on ozone, and the Zionstation reports on nitric oxide, nitrogendioxide, ozone, and VOCs. In 1999, all fourmonitoring locations reported no exceedancesof the 1-hour for ozone. Table 2-32 (on thefollowing page) lists monitoring data availableat each of the locations, and Table 2-33 (on
the following page) provides a summary of airquality in the study area. The PollutantStandards Index (PSI) for Lake County in 1999was classified as good, 85 percent of the time,and moderate, 15 percent of the time.12
2.5 NoiseSound is caused by the vibration of airmolecules and is measured on a logarithmicscale with units of decibels (dB). Sound iscomposed of a wide range of frequencies;however, the ear is not sensitive to allfrequencies. The “A” weighted scale wasdevised to correspond with the ear’s sensitivity,
12 The IEPA issues the PSI for areas or sectors. Theareas correspond to metropolitan areas with apopulation greater than 200,000.
TABLE 2-31Summary of National and State Ambient Air Quality Standards
Pollutant Averaging Time Primary Secondary
Particulate Matter
10 micrometers (PM10) Annual Arithmetic Mean 50 µg/m3 Same as Primary
24-hour 150 µg/m 3 Same as Primary
2.5 micrometers (PM2.5) b Annual Arithmetic Mean 15 µg/m3 Same as Primary
24-hour 65 µg/m3 Same as Primary
Sulfur Dioxide (SO2) Annual Arithmetic Mean 0.03 ppm (80 µg/m 3)) None
24-hour 0.14 ppm (365 µg/m3)) None
3-hour None 0.5 ppm (1,300 µg/m 3))
Carbon Monoxide (CO) 8-hour 9 ppm (10 µg/m 3)) Same as Primary
1-hour 35 ppm (40 µg/m 3)) Same as Primary
Ozone (O3) 1-hour/Day a 0.12 ppm (235 µg/m3) Same as Primary
8-hour/Day b 0.08 ppm Same as Primary
Nitrogen Dioxide (NO2) Annual Arithmetic Mean 0.053 ppm (100 µg/m 3)) Same as Primary
Lead (Pb) Quarterly Arithmetic Mean 1.5 µg/m3 Same as Primary
Note: All standards with averaging times of 24 hours or less are not to have more than one actual or expectedexceedance per year.a The 1-hour ozone standard pertains only to Cook, DuPage, Kane, Lake, McHenry, and Will counties, AuxSable and Goose Lake townships in Grundy County, and Oswego Township in Kendall County in the Chicagoarea; and to Madison, Monroe and St. Clair counties in the Metro-East St. Louis area.b The ozone 8-hour standard and the PM2.5 standards are included for information only. These standards wereproposed by the USEPA in 1997 and have been the subject of litigation. The U.S. Supreme Court issued aruling upholding the standards on February 27, 2001. However, that ruling found the USEPA’s implementationpolicy unlawful and remanded the case to the USEPA to “develop a reasonable interpretation of thenonattainment implementation provisions insofar as they apply to revised ozone NAAQS.”

AFFECTED ENVIRONMENT
2-45
and sound levels are measured as dBA on thisscale. Highway agencies use a 1-hour equivalentsound level, Leq(h), as a descriptor of noiselevels. Studies show that a change of 3 dBA is abarely perceivable change in noise. Table 2-34(one the following page) indicates that anincrease of 10 dBA will be perceived as beingtwice/half as loud.
2.5.1 Noise Sources and ExistingConditions
Highway noise from cars is associated with theinteraction of tire treads on the pavement. Heavytruck noise consists of engine noise, engineexhaust noise, and tire noise. As an example,truck engine noise alone usually falls in therange of 75 to 85 dBA (at 15.25 m, or 50 ft, from
the source); engine exhaust noise (at 15.25 m, or50 ft) usually falls in the range of 90 to 100 dBAwithout mufflers or in the range of 80 to 90 dBAwith a good muffler system; and finally, tirenoise falls within the range of 75 to 90 dBA(USDOT 1993).
The height of the noise source also contributes tothe noise level. For example, the average heightof a truck is about 3 m (10 ft), and the truckexhaust stack can range from 2.4 to 3.7 m (8 to12 ft) high. Therefore, the relative height of thetruck noise source requires higher noise barriersfor effective mitigation, especially when truckscomprise a significant source of the noise.
Noise levels vary with land uses and populationdensity. Urban settings with higher densities
TABLE 2-33Existing Air Quality in the Study Area
Pollutant Name Status (1999)
PM10 No sites exceeded the primary annual standard for PM10.
Ozone There were no exceedances of the 1-hour standard in the Chicago area.
Sulfur Dioxide There were no exceedances of the 24-hour primary standard or the annual primarystandard recorded in Illinois.
Nitrogen Dioxide There have been no violations of the annual primary since 1980 in Illinois.
Lead There were no violations of the quarterly primary standard recorded in the region.
CarbonMonoxide
There were no exceedances of either the 1-hour primary standard or the 8-hour primarystandard in the region.
Source: IEPA 2000a
TABLE 2-32Air Quality Monitoring Sites in the Study Area
Monitoring Location Owner/Operator Air Monitor Network Pollutant Measured
Deerfield IEPA NAMS Ozone
Libertyville IEPA SLAMS, SPMS Ozone
Waukegan IEPA NAMS, SPMS Ozone
Zion IEPA PAMS Ozone, Nitric Oxide, NO2, VOC
SLAMS – State/Local Monitoring StationPAMS – Photochemical Assessment Monitoring SiteSO2 – Sulfur DioxideNAMS – National Air Monitoring StationSPMS – Special Purpose Monitoring StationNO2 – Nitrogen DioxideVOC – Volatile Organic Compound

AFFECTED ENVIRONMENT
2-46
have higher noise levels. Newport Township innorthern Lake County has the lowest populationdensity (2,486 people per km2, or 960 people permi2). The highest population density(24,864 people per km2, or 9,600 people permi2) occurs in the more urban WaukeganTownship. Figure 2-21 defines typical noiselevels according to population density.Table 2-35 gives the estimated existing noiseexposure for general assessment.
The LCTIP also defined traffic related noiseconditions in the study area by developing aset of typical traffic noise level conditions forrepresentative roadway types includingfreeway/tollways, arterial roadways, and otherlocal roads. Typical traffic noise levelsgenerated from these roadway types are shownin Figure 2-21. For each roadway type, trafficnoise levels are shown for a high and lowtraffic volume at distances ranging from about15.2 m (50 ft) to 152 m (500 ft) from the edgeof the roadway. This data shows how distance,traffic volume, and speed affect noise levels inareas near the roadway. Generally, at distanceswithin 97.5 m (320 ft) from a freeway/tollway,
noise levels begin to exceed accepted noisecriteria for residential units. That distance isabout 36.5 m (120 ft) for arterial facilities andabout 18.3 m (60 ft) for local roads.
The method for developing the information inFigure 2-21 employed the use of the TrafficNoise Model (TNM), an approved FHWAmodel for conducting highway noise analysis.Based on defined roadway conditions(i.e., traffic volume, traffic mix, and trafficspeed), the TNM look-up tables were used todetermine the typical noise levels at variousdistances for the representative roadways. Thetraffic inputs were characterized as:
• A typical peak hour traffic range derivedfrom the LCTIP travel demand model.
• A traffic mix defined as 95 percentautomobiles, 3 percent heavy trucks, and2 percent medium trucks for each roadwaytype.
• Travel speed for each roadway typeconsisted of 60 mph forfreeways/tollways, 45 mph for arterialfacilities, and 35 mph for local roads.
TABLE 2-34Perceptive Noise Level Changes
Sound Level Change Relative Loudness
±3 dBA Barely perceptible change
±5 dBA Readily perceptible change
±10 dBA Twice/half as loud or quiet
TABLE 2-35Estimating Existing Noise Exposure for General Assessment
Population Density (people/mi2) Leq Day Leq Evening Leq Night
1–100 35 30 25
100–300 40 35 30
300–1,000 45 40 35
1,000–3,000 50 45 40
3,000–10,000 55 50 45
10,000–30,000 60 55 50
Over 30,000 65 60 55
Source: FTA 1995

AFFECTED ENVIRONMENT
2-47
2.5.2 Noise Criteria forDetermining Impact
The FHWA Title 23 Code of FederalRegulations (23 CFR 772) has developedguidelines, noise abatement criteria (NAC), toassess potential noise impacts. This criterionconsiders appropriate noise levels based uponland use activity. For example, the noiseabatement criterion for a residence is 67 dBA.A traffic noise impact occurs when noiselevels approach or exceed the NAC for thedefined land use activity, or if a substantialincrease in predicted noise level occurs eventhough the applicable NAC has not beenreached. Table 2-36 describes the noiseabatement criteria for varying activities.
2.6 Cultural ResourcesThe cultural resources for this study wereassessed using existing and available data andlimited field investigation for standing
structures along the build alternatives. Thisassessment was intended to identify potentialcultural resources likely to be involved, and toinform resource agencies and others of thepotential involvement. Pursuant to the NationalHistoric Preservation Act of 1966, as amended,it is fully recognized that further definition ofthe impacts and coordination with responsiblejurisdiction agencies is necessary to determinethe level of impact, if any, and appropriatemitigation in future phases of work.
2.6.1 Archaeological ResourcesA review of previous archaeological resourceinvestigations and known archaeological sites inLake County was conducted to address thelocation, character, and significance ofarchaeological resources to provide generalinformation about those resources which may bepotentially significant. The review was basedsolely on records research and involved nosystematic fieldwork.
TABLE 2-36Noise Abatement Criteria Hourly Weighted Sound Level
ActivityCategory Leq(h)*, dBA Description of Activity Category
A 57 (Exterior)Lands on which serenity and quiet are of extraordinary significance and serve animportant public need and where the preservation of those qualities is essential ifthe area is to continue to serve its intended purpose.
B 67 (Exterior) Picnic areas, recreation areas, playgrounds, active sports areas, parks, residences,motels, hotels, schools, churches, libraries, and hospitals.
C 72 (Exterior) Developed lands, properties, or activities not included in Categories A or B above.
D — Undeveloped lands.
E 52 (Interior) Residences, motels, hotels, public meeting rooms, schools, churches, libraries,hospitals, and auditoriums.
* Leq (h): The hourly value of Leq. Leq is the equivalent steady-state sound level, which in a stated period of timecontains the same acoustical energy as the time-varying sound level during the same time period. When measuringor predicting noise levels, a receptor is assumed to be at ear height, located 1.5 m (5 ft) above the ground surface.
Use of interior noise levels shall be limited to situations where exterior noise levels are not applicable (i.e., wherethere are no exterior activities to be affected by traffic noise, or where exterior activities are far from or physicallyshielded from the roadway in a manner that prevents an impact on exterior activities).
Note: NAC are noise impact thresholds for considering abatement. (Abatement must be considered whenpredicted traffic noise levels for the design year approach [i.e., are within 1 dB] or exceed the noise abatementcriteria, or when the predicted traffic noise levels are substantially higher [i.e., are more than 14 dB] greater thanthe existing noise level.) The NAC are not attenuation design criteria or targets. The goal of noise abatementmeasures is to achieve a substantial reduction in future noise levels. The reductions may or may not result infuture noise levels at or below the NAC.
Source: IDOT 2000a

AFFECTED ENVIRONMENT
2-48
Western and central Lake County is a kame andkettle environment. Recent studies indicate thatthis environment may contain some of theoldest evidence of human occupation in theUpper Midwest and North America. Theassociated stone tool producing industryrepresents a unique and important developmentin populating the New World. Large gameanimals predominated the resources sought bysmall, mobile hunting parties. Before this time,the advance of the Wisconsinan ice sheet madethe region inhospitable to human occupation.
Because of rapid development over the last 10years, large parts of the county have beeninvestigated for archaeological resources. Thebackground literature review revealed that 624previously recorded archaeological sites are inLake County. Roughly 77 percent of thearchaeological sites are prehistoric , 22 percentare historic, and 1 percent are multicomponent,consisting of both prehistoric and historicaffiliations.13, 14, 15 Thirty mounds, graves,burials, or cemeteries are included in thesepercentages.
Areas containing high probability forarchaeological finds include elevated topographynear large bodies of water, beach terracessurrounding relict and existing lakes, terracesalong the major river ways, uplands at the headsof tributaries, and along old Native Americantrails or plank roads (see Figure 2-22). Theseareas were identified using the Illinois StateMuseum model, which is GIS-based. The DesPlaines River at Half Day Road is the location ofa historic and prehistoric Native Americanvillage. The pattern of major Native Americansites continues in a southern direction ending inthe Portage Site, located outside of the study areain a Cook County forest preserve. In general, the
13 Prehistoric: Evidence of human occupationbeginning as far back as 13,000 B.P. (before present)to as recently as 300 B.P. (before present).14 Historic: Evidence of human occupation beginningin the 1600s to the present. Note, there is a gray areaof overlap between prehistoric and historic. This grayarea is precontact and postcontact.15 Multi-component: Evidence of human occupationthat consists of cultural material from prehistoric andhistoric peoples. It also can span over several timeperiods within the prehistoric or historic time frames.
number of significant sites per acre decreases inthe area bounded by Lake Cook Road, US 41, IL120, and US 12 (this is the area that encompassesthe majority of the proposed transportationimprovement alternatives). A review of thebackground literature reveals that there is a totalof 168 known archaeological sites within the areabounded by Lake Cook Road, US 41, IL 120, andUS 12. Roughly, 57 percent of the archaeologicalsites are prehistoric, 39 percent are historic, and 4percent are multi-component consisting of bothprehistoric and historic affiliations.
2.6.2 Standing StructuresSettlement in Lake County began in 1834 whenDaniel Wright constructed a log cabin by theIndian village of Half Day, which was located inthe Vernon Township. The next year, a smallwave of pioneers constructed several mills andfarms along the Des Plaines River and itstributaries. Settlement also occurred along theLake Michigan shoreline and the Fox RiverValley.
The 1840s were a period of rapid growth forLake County. Most residents engaged in farmingin the inland townships. Small agriculturalsupport centers emerged at crossroads or millsites to provide the farmers with market accessand necessary goods and services. Many of thesehamlets declined or virtually disappeared whenthey were bypassed by railroads, although theywere often replaced by new communities thatemerged around a railroad station. Chicago’sgrowth spilled into Lake County during the1860s, when Walter S. Gurnee acquired 405 ha(1,000 ac) near the small lakeside community ofPort Clinton, divided it into lots, and marketedthe tracts to Chicago’s wealthy, naming hisdevelopment Highland Park. Boasting anexcellent rail connection with downtownChicago, Highland Park was incorporated as acity in 1867. Suburbanization continued movesnorth along the Chicago & NorthWestern railline during the late 1800s, consuming largesections of the townships of Deerfield andShields.
Scenic lakes are scattered throughout LakeCounty’s northwestern quadrant. Known as theChain O’ Lakes region, this area consists of a

AFFECTED ENVIRONMENT
2-49
series of lakes connected by the Fox River. Sometime after the Civil War, railroads began totransport sportsmen to the region in order to fishand hunt waterfowl. As additional railroadspenetrated the area from Chicago, a number oflakeside resorts opened to provide a summerescape for city dwellers. Lake County’s resortindustry thrived until the advent of the automobilechanged vacationing habits, forcing many resortowners to subdivide their land and promotesummer cottage developments during the 1920s.
Following World War II, Lake Countyexperienced tremendous growth. By 1950, thetownships of Benton, Fremont, Grant, LakeVilla, and Wauconda doubled in population,while the Township of Avon witnessed a 300-percent increase. Villages and cities annexedsubstantial sections of land; however, suchgrowth could not be accommodated withinexisting communities. As a result, a largenumber of new municipalities organized untila 1969 law created more stringentincorporation standards. Currently, all or partsof 52 incorporated municipalities exist withinLake County.
IHPA files, National Register of Historic Places(NRHP) listings, IDOT’s historic structuresdatabase, local historical societies, and otherlocal organizations were referenced to providegeneral information about potentiallysignificant historic structures. Many of theinventoried resources were catalogued in the1970s, so it is possible that some of thestructures are no longer standing.
More than 80 percent of the potentiallysignificant historic structures in Lake County arelocated along the lakeshore communities, east ofI-94. However, major clusters of the surveyedbuildings, west of I-94, can be found in Antioch,Barrington, Fox Lake, Grayslake, Lincolnshire,Lake Villa, Lake Zurich, Libertyville, LongGrove, Mundelein, and Wauconda. Within thecounty, there are seven NRHP historic districtsand 55 individual NRHP structures, 85 percentof which are in the lakeshore communities eastof I-94. The only communities containingseveral NRHP sites within the area bounded byLake Cook Road, US 41, IL 120, and US 12 (thearea most likely to be affected by transportation
improvements) are Libertyville with fourstructures and Barrington with one historicdistrict and one individual structure. There are97 IHPA/landmark sites within the county.16
About half are located in the lakeshorecommunities (east of I-94) and half throughoutthe rest of the county. The IHPA 1974-1977survey identified 1,977 properties in LakeCounty, 80 percent of which were in thecommunities east of I-94.17 IDOT’s compiledinventory identified another 422 potentialhistoric structures, 80 percent of which arelocated east of I-94.18 Finally, the IHPA historicsite files had information on 27 potential siteswest of I-94 (files were not reviewed forcommunities east of I-94 as no proposedroadway improvements exist in those areas).19
2.7 Special WasteFive regulated substance site classificationshave been identified within Lake County thatcould be potentially involved with the projectimprovements:
• Leaking Underground Storage Tanks(LUSTs)—These records contain aninventory of leaking underground tankincidents.
16 The “IHPA 1975 County Landmark Survey”included those properties in the county that IHPAsurveyors thought had countywide historicalsignificance. It is important to understand that theseare not county-designated sites.17 The “1974–1977 Sprague Survey” focused primarilyon historic resources found in incorporatedcommunities, although occasional rural propertieswere noted.18 IDOT District 1 compiled an “Inventory of HistoricStructures: Lake County” during the 1990s, byrequesting information from local organizationsregarding all potential sites (including NRHP, NRHD,etc). Although the District 1 compilation is not acomprehensive listing of all historic structures in thecounty, many of the properties it identified were alsonoted in other various collections reviewed. However,some structures recorded in this listing were notobserved elsewhere. This total reports properties onlyidentified in the District’s catalog, not those that werecounted in another survey.19 The “IHPA Historic Site Files” are a collection offolders in which miscellaneous material about varioushistoric properties had been collected over the years.

AFFECTED ENVIRONMENT
2-50
• Comprehensive EnvironmentalResponse, Compensation, and LiabilityInformation System (CERCLIS)—Thesites that have been reported to theUSEPA by states, municipalities, andprivate sources, pursuant to Section 103 ofthe CERCLA. CERCLIS contains sitesthat are on the National Priority List(NPL) and those under consideration forinclusion on the NPL.
• National Priority List (NPL)—Alsoknown as Superfund, this database is asubset of CERCLIS and identifies sites forpriority cleanup under the Superfundprogram.
• State Hazardous Waste Sites (SHWS)—These records parallel the State of Illinoisto CERCLIS. They may also be a part ofthe federal CERCLIS list.
• Corrective Action Report(CORRACTS)—This is a list of handlerswith Resource Conservation and RecoveryAct Corrective Action Activity. This reportshows corrective action core events that haveoccurred for every handler that has hadcorrective action activity.
A preliminary check of Lake County specialwaste sites was performed in 1998 by adatabase search service. Both federal and Stateof Illinois records were searched, but no fieldreviews or testing were performed.
About 750 LUST sites are identified within theLake County (Figure 2-23). The concentration ofLUST sites in the far eastern portion of thecounty, east of I-94, is substantially higher thanin most other areas. Approximately half of thesites are located east of I-94, within less thanone-quarter of Lake County. These sites arerelatively evenly distributed, with a slightlyhigher concentration in the vicinity ofWaukegan. West of I-94, noticeableconcentrations of LUST sites can be identified inLake Zurich, Barrington, and Libertyville, withadditional sites distributed throughout thecounty. According to the data records, mostLUST sites are associated with gas stations and
vehicle maintenance facilities, which tend to belocated along major arterial roadways.20
Nineteen CERCLIS sites are identified withinLake County: 11 in North Chicago andWaukegan, three near Grayslake, two inWauconda, and one each in Lake Forest andAntioch. Five NPL sites are included in theCERCLIS list. Three of these are in Waukegan,within 0.8 km (0.5 mi) of Lake Michigan, andthe other two sites are in Antioch andWauconda. Twelve SHWS are identified withinLake County; some designated sites are also onthe CERCLIS list. As with the CERCLIS sites,most (eight) are in North Chicago andWaukegan. The remaining four are located inLake Forest, Deerfield, Wauconda, andAntioch. There are 21 CORRACTS sitesidentified within Lake County. Sixteen of thesites are east of I-94. Ten of the eastern sites arelocated between Waukegan and Lake Bluff.The remaining five CORRACTS sites are inBarrington, Mundelein, Hainesville, RoundLake, and Fox Lake.
20 IDOT has performed property site assessments forover a decade. IDOT’s data shows that a databasecheck/search only discovers about 50 percent of the USTlocations in a study area, the other 50 percent arediscovered by a site visit and interviews with residents. Ofthat 50 percent, 30 to 50 percent are unreported LUSTs.

3-1
SECTION 3
Alternatives
3.1 IntroductionThis section describes the project alternativesand the processes used to develop, evaluate,screen, and refine them. The material in thissection is structured to provide anunderstanding of the process that began withthe consideration of many alternatives, throughthe selection and evaluation of two finalistbuild roadway alternatives and a package ofsupporting transit, TSM, TDM, and bike andpedestrian improvements that are common toboth. Figure 3-1 illustrates the overallalternatives development and evaluationprocess. A comprehensive discussion of theoverall process is documented in theAlternatives Development and EvaluationReport (LCTIP 2000a).
This section begins with a discussion of howthe alternatives development process gotstarted, including a description of the No-Action Alternative (Baseline). This discussionis followed by a description of therecommended transit improvements and adiscussion of the process for developing,screening, and evaluating the roadwayalternatives and their supporting improvements(in addition to transit), including TSM, TDM,and bike and pedestrian facilities. This sectionconcludes with a comparative evaluation oftransportation performance factors for thefinalist roadway build alternatives.
3.2 BackgroundThe alternatives development process beganwith a comprehensive review of the existingtransportation system Transportation SystemPerformance Report (LCTIP 1999). The reviewidentified growth characteristics, travel patterns,trip characteristics, and the relative severity ofthe congestion problems. The principalconclusion drawn from this analysis was thatcongestion was expected to affect most of Lake
County’s roadways by 2020. The LCTIPrecognized that this project would not be able toaddress all of the transportation problems, andresolved to focus on the major systemdeficiencies in the county and provide afoundation for future transportation planning byother agencies.
The transportation alternatives for this projectare a combination of roadway, bus, rail, andother transportation strategies. Initially, thevarious modes were evaluated or consideredseparately and then combined toward the end ofthe process to create complete alternatives. TheLCTIP alternatives development processemployed a rigorous approach for developingand evaluating the roadway alternatives. Theprocess used a state-of-the-art computer-aidedapproach, supported by regionally endorsedtravel, population, and employment informationprovided by the Chicago Area TransportationStudy (CATS) and NIPC. The computer-aidedapproach used task-specific software packages(TP+ and VIPER) to perform the necessarywork.1 These packages were selected because oftheir advanced features such as large-systemcapability, graphical interface, and use by anumber of major metropolitan planningorganizations in the United States.
3.3 No-Action Alternative(Baseline)
The alternatives development processcommenced with the development of a No-Action Alternative (Baseline), consisting oftransportation improvements that areanticipated to be constructed by 2020regardless of the recommendations made by
1 TP+ and VIPER Software are companion softwarepackages. Released in 1997, it has powerfulcomputational features for matrix operations, multi-modalnetwork representation and assignments processes,combined with flexible file formats, graphical analysis, andpresentation tools.

ALTERNATIVES
3-2
the LCTIP. The development of the No-ActionAlternative (Baseline) required extensivecoordination with the region’s transportationservice providers to gather information onfunded or anticipated transportationimprovements in the study area. The 1998-2002 Transportation Improvement Program(TIP), with 48 km (30 mi) of fundedimprovements, was the foundation fordeveloping the No-Action Alternative(Baseline).2 Recognizing that additionalprojects would be funded beyond 2002, anadditional 71 km (44 mi) of existing roadimprovement projects were identified throughcoordination with transportation providers,bringing the total to 119 km (74 mi) of laneadditions to existing roadways. In addition,routine repairs and operational improvementswould continue for the existing roadwaysystem. The No-Action Alternative (Baseline)also assumes that the transportationimprovements identified in the 2020 RTPBuild would be in place for those parts of theregion outside the LCTIP study area.
In addition to the roadway improvements, theNo-Action Alternative (Baseline) includestransit improvements consisting of the fullbuild out of the NCS commuter rail line(52 commuter trains per day), five new Metrastations , and express bus service on selectedcorridors.3 The transportation improvementsfor the No-Action Alternative (Baseline) areshown in Figure 3-2, and listed in Table 3-1(on the following page) and Table 3-2 (onpage 3-4). For this study, the No-ActionAlternative (Baseline) is considered either astand-alone alternative or common to theroadway (Build) Alternatives.
A population and employment forecast wasdeveloped by the project team for the No-
2 The latest TIP was released in November of 2000,however the 1998-2002 TIP was the best availableinformation at the time the No-Action Alternative(Baseline) was developed. The Baseline projects haveremained consistent with subsequent TIPs; they have alsoprovided funding for several of the identified projects,bringing the total to nearly 50 miles of committedimprovements.3 Three stations are located in Lake County; two othersare located within the transit ridership influence area ofthe study area.
Action Alternative (Baseline). Themethodology for the No-Action populationand employment forecast (year 2020) wasendorsed by the NIPC and is documented in adetailed report prepared by the project team(ACG 2001, Appendix B). The methodologyassigns mobility and accessibility factors toareas based on the availability oftransportation facilities. Improvements intransportation facilities could enhanceaccessibility, having the potential to effect thefuture population and employment in aspecific area. The No-Action forecast is basedupon the differences in accessibility andmobility that would be provided by the No-Action improvements compared to the CATS2020 RTP Build scenario (CATS 1998). Theanalysis results indicate that the No-Actionimprovements would increase population inLake County by 31,000 new residents andemployment would remain essentiallyunchanged (Figure 3-3).
Travel forecasts for 2020 were then developedby CATS for the No-Action Alternative(Baseline) based on the population andemployment. These travel forecasts were usedas a platform for developing and evaluatingthe initial alternatives.
3.4 SupportingTransportationImprovements
A number of modal options were consideredduring the study of transportationimprovements, including improvements to busand rail transit, TSM and TDM strategies, andbike and pedestrian facilities. An examinationof these transportation options shows that theyplay an important role in reducing single-occupancy vehicles. The widespreadcongestion in Lake County, however, cannotbe satisfied by these types of improvementsalone. Presently, work trips by transit andpedestrian/bike account for less than 10percent of all trips. The application of TSMand TDM strategies are benefiting travelefficiency, but on a very limited basis. Thescale of population and employment growth in

ALTERNATIVES
3-3
Lake County over the next 20 years isconsiderable , and based upon commutingcharacteristics, transit and system managementpractices by themselves are not capable of
satisfying the projected transportation needsforeseen in Lake County. Despite the need formajor transportation investment in thecounty’s roadway system, these other
TABLE 3-1Road Projects in the No-Action Alternative
Road Improvements Limits Comments
US 45 Add lanes Washington St. to IL 176 1998–2002 TIP
I-94 Add lanes Lake Cook Rd. to IL 22 1998–2002 TIP
Add on ramp At Lake Cook Rd. (NB) 1998–2002 TIP
Pulaski Rd. New extension O’Plaine Rd. to IL 43 1998–2002 TIP
Midlothian Rd. New extension Peterson Rd. to Harris Rd. 1998–2002 TIP
Weiland Rd. New extension Aptakisic Rd. to Prairie Rd. 1998–2002 TIP
MLK Dr. Add lanes US 41 to Hillcrest Ave. 1998–2002 TIP
Add lanes and resurface Hillcrest Ave. to IL 131 1998–2002 TIP
Bradley Rd. New extension IL 176 to IL 43 1998–2002 TIP
Buffalo Grove Rd. Add lanes IL 83 to IL 22 1998–2002 TIP
Peterson Rd. Add lanes IL 60 to IL 83 1998–2002 TIP
New alignment/ add lanes IL 83 to Midlothian Rd. 1998–2002 TIP
Add lanes Midlothian Rd. to US 45 1998–2002 TIP
Hunt Club Rd. Add lanes IL 120 to Washington St. (A22) 1998–2002 TIP
Rollins Rd. New extension US 45 to IL 132 1998–2002 TIP
Butterfield Rd. Add lanes Allanson Rd. to US 45 1998–2002 TIP
Sunset Ave. Add lanes Delany Rd. to IL 131 1998–2002 TIP
Quentin Rd. Add lanes Lake Cook Rd. to Baldwin Rd. 1998–2002 TIP
Lake Cook Rd. Add lanes Weiland Rd. to I-94 1998–2002 TIP
IL 22 Add lanes US 41 to IL 83 2001–2005 TIP
Add lanes IL 83 to Quentin Rd. Identified by IDOT
Add lanes (new alignmentbypass around Lake Zurich)
Quentin Rd. to US 14 2001–2005 TIP
IL 21 Add lanes IL 120 to Washington Street 2001-2005 TIP
Add lanes IL 120 to IL 137 Identified by IDOT
IL 83/IL 60 Add lanes IL 176 to EJ&E Identified by IDOT
I-94 Add lanes IL 22 to IL 60 Identified by ISTHA
Rollins Rd. Add lanes IL 83 to US 45 Identified by LCDOT
Butterfield Rd. Add lanes IL 176 to IL 137 Identified by LCDOT
Busch Rd. Add lanes IL 83 to Weiland Rd. Identified by LCDOT
Quentin Rd. Add lanes Lake Cook Rd. to IL 22 Identified by LCDOT
Washington St. Add lanes Lake Street to I-94 Identified by LCDOT
Add on/off ramps Full access control interchange at I-94 Identified by LCDOT

ALTERNATIVES
3-4
transportation improvements have animportant role in the total transportationsolution for Lake County. The proposedimprovements described below for rail andbus transit are the product of considerablestudy and would supplement or be common tothe roadway build alternatives. Othersupporting improvements (TSM, TDM, bike,and pedestrian) will be described in Section3.6.2, Supporting Improvements, inconjunction with the roadway buildalternatives.
3.4.1 Rail and Bus TransitThe LCTIP identified the following objectivesto guide the development of the transitimprovements:
• Include transit as part of the solution.
• Improve access to and distribution fromthe fixed route system.
• Maintain and, if possible, increasetransit’s market share.
The process of forming candidate transitimprovements began with a comprehensiveinventory of the existing facilities, services,
and usage (LCTIP 1999). This review wasfollowed by an analysis of the trends andcapacity of the existing system, then a reviewof the plans, proposals, other studies, andforecasts generated by the various planningagencies and transit system operators in thestudy area. Future population and employmentwere used to identify potential transitimprovements beyond those in current agencyplans. LCTIP developed the initial range oftransit improvements to be considered. Fromthis point, the initial proposals were refined,demand/ridership projections were developed,and cost estimates were prepared. A detaileddiscussion of this process is documented in theAlternatives Development and EvaluationReport (LCTIP 2000a).
3.4.1.1 RailA number of candidate rail serviceimprovements were identified from existingplans, pending proposals, and input provided bythe transit agencies. The final railimprovements that emerged from the study ofthese proposals are shown on Figure 3-4, andare listed below:
TABLE 3-2Transit Projects in the No-Action Alternative
Project Improvements Comments
Metra
North Central Service Double track. Includes parking enhancements at all stations inthe project study area.
Identified by Metra
Express Service Union Pacific Northwest Line/McHenry Extension fromBarrington to Chicago
Identified by Metra
Station Improvements Prairie Crossing near Harris Rd.North Glenview (northern Cook County)
Great Lakes Naval StationPingree Rd. (eastern McHenry County)
Grayslake
Combination of 1998-2002 TIP andidentified by Metra
Pace
New Route Lakehurst to Lake Cook Rd. (Specific route not identified atthis time)
1998-2002 TIP
Transportation Centers Waukegan Transportation Center
Gurnee Mills Transportation Center
Identified by Pace
Shuttle Services UP North Braeside to Lake Cook employment centersNorth Glenview to I-294 employment centers (Specific routesnot yet identified)
Identified by Pace

ALTERNATIVES
3-5
• New commuter rail service on the EJ&ERailroad between Spaulding (nearHoffman Estates) and Waukegan. Eightstations are recommended fordevelopment on this proposed line:Waukegan, North Chicago, Roundout,Leithton, Lake Zurich, Barrington, PrairieStone, and Spaulding. These locationswere selected for their proximity toresidential areas, employment centers, andtransfer capabilities to Metra’s other radialcommuter lines.
• Improved service on the MD North line byadding central train control and passingtracks from Roundout to Fox Lake. Install aturnback at Roundout to improve thereliability of commuter train and the levelof service, particularly for the reversecommuter.
• Relocate freight traffic from the MDNorth line and consolidate it on the UPFreight line.
• Add 5,500 parking spaces to currentcommuter rail stations.
• Construct new stations at the junctions ofall rail lines.
• Several rail service extensions areundergoing studies by other agencies andcould be incorporated into LCTIP’salternatives as they are completed. Theseproposals include extending the SkokieSwift service (Chicago Transit Authorityyellow line) to Deerfield Road inHighland Park; extending the MD Northline commuter service from Roundout toWadsworth; and extending the MD Northline commuter service from Fox Lake toRichmond.
The total estimated cost of these improvements,excluding the ongoing study of the Skokie,Wadsworth, and McHenry extension, is$375 million (1999 dollars). The NCS upgrade,included in the No-Action Alternative(Baseline), is estimated to cost an additional$310 million (1999 dollars). These transitproposals would be common to each roadwayalternative.
3.4.1.2 BusThe LCTIP proposes a combination of busservices to enhance service and ridership thatare consistent with long-range plans andregional and local service providers. The busimprovements would be comprised of expressbus service in select corridors, improved trunkline bus service in five travel corridors,specialty bus services (e.g., shuttle servicesbetween rail stations and major employmentcampuses), and improved local service. Thecomplete list of these bus improvements ispresented in Table 3-3 (on the followingpage), and further details can be found in theAlternatives Development and EvaluationReport (LCTIP 2000a).
The express bus service would be provided forup to 10 routes over the planning period (year2020); see Figure 3-5. This service wouldprovide reasonably rapid bus transportationbetween major origins and destinations with alimited number of stops.
The LCTIP analyzed travel patterns in thecounty to identify corridors with high volumesof auto trips between specific origins anddestinations. The LCTIP concluded that fivetravel corridors in the county have a highvolume of home to work trips that wouldbenefit from an efficient trunkline bus service;these corridors are described in Table 3-4 (onpage 3-7) and shown in Figure 3-6. Frequentbus headways would be provided along eachof these corridors, ranging from 15 to 30minute intervals for Corridors 1 through 4.Along Corridor 5, a bus rapid transit servicewith 16 station locations is recommended.Total ridership for the five bus corridors isanticipated to be 6,000 to 10,000 passengersper day.
Other shuttle services would include a busshuttle service between the Vernon HillsStation (North Central Service) and CorporateWoods on IL 60.4 A similar service waspioneered by the Lake Cook TMA along LakeCook Road. The service provided a mix of 4 A similar service has been implemented anddiscontinued by Pace. LCTIP recommends that service beimplemented when the NCS is upgraded to the full buildout (52 trains per day).

ALTERNATIVES
3-6
scheduled and demand-responsive bus servicefor employers along the corridor. In January2001, funding was granted for a shuttle busservice to operate from the North Glenview(Techny) Metra Station. Additionally, anexisting local bus service was considered andseveral routes were identified for increasedservice frequency (see Table 3-4).
The estimated cost of the bus serviceimprovements is estimated to be over$75 million. Approximately 85 percent of thiscost would be related to a bus rapid transitservice along Lake Cook Road.
3.4.2 Transportation CentersAnother component of the overalltransportation improvements is transportationcenters. This component would addopportunities for bus-to-bus and bus-to-railtransfers, as well as improved automobileconnections at five key locations: Round Lake,Libertyville, Palatine, Highland Park, and FoxRiver Grove (Figure 3-6). Transportationtransfer centers are important to theintegration of modal transportation servicewith enhancements to auto access, passengerdrop-off, bus-to-bus interconnections, and
bus-to-rail interconnections.
Each location would include bus stands, bikeand pedestrian access, bike storage, and real timedisplays of service information. Timedcoordination of bus schedules is alsorecommended to allow easy transfer to railservices as well as between bus routes at thetransportation centers.
3.5 RoadwayAlternatives
3.5.1 Alternatives DevelopmentProcess
The LCTIP applied a rigorous and highlystructured process to the development ofroadway alternatives, as documented in theAlternatives Development and EvaluationReport (LCTIP 2000a). The process followedthese guiding principles:
• The roadway alternatives would includeimprovements constrained by neitherlocation nor orientation (i.e., east-west ornorth-south).
TABLE 3-3Bus Service Improvements
Improvements
Corridor 1—Winthrop Harbor-Waukegan Corridor
Corridor 2—Waukegan-Round Lake Corridor
Corridor 3—Gurnee-Libertyville-Buffalo Grove Corridor
Corridor 4—Highland Park to Fox River Grove Corridor
Corridor 5—Bus Rapid Transit in Lake Cook Corridor
Shuttle Services—Vernon Hills Station-NCS to Corporate Woods
Express Bus Service—Gurnee to Lake Cook Road, via I-94
Express Bus Service—Grayslake to Rolling Meadows via IL-53 EXT
Express Bus Service—Lake Cook Rd to I-190 via I-294
Express Bus Service—Waukegan to Grayslake via IL-120
Express Bus Service—Express bus service on two routes. (Elgin/ Hoffman Estates/Buffalo Grove)(Hawthorn/Long Grove/Libertyville)
Express Bus Service—Express bus service on four routes (East Dundee/ Algonquin/Crystal Lake)(Evanston/Glenview) (Libertyville/Ft Sheridan-Vernon Hills) (Northbrook/Glenview)
Local Service—Increased service frequency on Routes 234, 563, 565, 690, 723, 806
Local Service—Increased service frequency on Route 571

ALTERNATIVES
3-7
• The roadway alternatives could differ inthe type and extent of improvement, butwould provide systemwide travel benefitsapproaching the goals of the endorsed2020 RTP.
Early in the roadway alternative developmentprocess, the LCTIP established that theNo-Action Alternative (Baseline) wouldrepresent the foundation or initial buildingblock for the roadway alternatives. The LCTIPconcluded that the No-Action Alternative(Baseline) with its 119 km (74 mi) ofimprovements to existing roadways was a goodstarting point, but by itself would notsuccessfully address future congestion in LakeCounty—projected to double by the year 2020under the No-Action Alternative (Baseline)(LCTIP 1999). The roadway alternativesdescribed in the following discussion gobeyond the No-Action Alternative (Baseline) tobegin to address the projected travel needs ofthe county.
Another early step in the roadway alternativedevelopment process was to establish abenchmark or point of reference fordeveloping the initial range of roadwayalternatives. The 2020 RTP was selected asthe benchmark because it represented aregional endorsed level of transportationimprovement and performance for the area.The transportation improvements representedin the 2020 RTP were quantified as areawidetravel performance measures by the projectteam, and were used as a benchmark todetermine when a specific set of roadwayimprovements achieved the objective, therebyqualifying as an alternative.
The LCTIP developed the initial alternatives(LCTIP 2000a) using broad travel performancemeasures that described both the efficiency andeffectiveness of each alternative over the entiretransportation system. These measures includeddelay per vehicle miles of travel, averagenetwork speed, and weighted congested vehiclehours of travel. Later in the process, when the
TABLE 3-4Candidate Bus Improvements
Corridor Description
1 Winthrop Harbor-Waukegan Corridor
Originates near the Wisconsin state line and operates with alternating service onGreen Bay Rd. and Lewis Ave. to the Waukegan Transportation Center. The routeextends southward from the transportation center into central Waukegan and NorthChicago; a branch service continues west from the Gurnee Transportation Center onWashington St to the Gurnee Mills Shopping Center and major employers.
2 Waukegan-RoundLake Corridor
From the Waukegan Transportation Center, route runs west to the Lake Villa railstation, then on Fairfield Rd., south to Rollins Rd., east on Rollins to Cedar Lake Rd.,then south on Cedar Lake Rd. to the Round Lake rail station, continuingsoutheasterly on Nippersink Rd. and IL 134 to IL 120, the Grayslake rail station, andthen east on IL 120 to the Waukegan Transportation Center. Service would operatein both directions on this loop route pattern.
3 Gurnee-Libertyville-Buffalo Grove Corridor
From the route end at the Gurnee/Wadsworth Transportation Center, serviceproceeds on Washington St. to O’Plaine Rd., south to Buckley Rd. (IL 137), thenwest to Milwaukee Ave and the Libertyville rail station. From the rail station, the bustrunkline continues south on IL 21 to IL 60, proceeds west on IL 60 to Butterfield Rd,then south on Butterfield Rd to US 45, the Vernon Hills rail station, continuing toMilwaukee Ave. (IL 21) and south to Deerfield Rd., the Buffalo Grove TransportationCenter/rail station, and terminating at Lake Cook Rd. and Weiland Rd.
4 Highland Park-FoxRiver Grove Corridor
Service begins at the UP North Line Highland Park rail station, proceeds northerly onGreen Bay Rd. then west on Half Day Rd. (IL 22) to US 45 and the Prairie ViewStation on the MD North Line, then west on Port Clinton Rd. and south on IL 83 toreturn to Half Day Rd./Lake Zurich Rd. and on to the Fox River Grove Station on theUP Northwest Line.
5 Bus Rapid Transit inLake Cook Corridorfrom the lakefront toPalatine Station
Begins at the Highland Park Metra rail station on the UP North Line, uses US 41 toreach Lake Cook Rd. and then continues west with a detour to the Buffalo GroveMetra station on the MD North Line. Using Hicks Rd., it cuts south to terminate atPalatine Station on the UP Northwest Line.

ALTERNATIVES
3-8
initial alternatives had been screened andrefined, a separate set of performancemeasures, specifically related to the purposeand need (Section 1), were used to evaluatethem.
Following the completion of the early steps,the process adapted the use of the LCTIPtravel demand model to the development ofthe preliminary roadway concepts. Themodeling process was used to developpreliminary roadway concepts starting fromone of five “starting point” improvements thatincluded I-94, US 12, IL 83/US 45, IL 120(existing and new alignment), and the IL 53extension. These starting points were selectedbecause they are regional in character,embrace the most prevalent congestion in thecounty, and exhibit continuity through thestudy area. Further, these starting points wouldallow the LCTIP to develop roadwayalternatives with a broad geographic range.Using this step by step computer-aidedapproach, the most congested routes weretargeted to develop groups of roadwayimprovements that approached or met theperformance benchmark.
Another aspect of the roadway alternativesdevelopment process was the use ofenvironmental resources information. Thecompilation of this data in the early stages ofthe process provided the LCTIP with themajor environmental resource issues thatcould be considered during the initial stages ofalternatives development. The environmentalresource data for the very large study area wasmanaged with the use of a GIS databasecontaining over 80 data layers (see AppendixA). The LCTIP GIS database containsinformation related to water resources,wetlands, vegetative cover, population,employment, land use, and protected lands toname a few. The initial output from thedatabase was a set of maps denoting the keyenvironmental resources or constraints thatwere considered in the development of theroadway alternatives.
Public involvement was also an important partof the alternatives development process. Earlyin the process, input was sought through
several forums to define the transportationproblems in Lake County. These include:
• Focus group sessions with area residents,which concluded that development isoutpacing infrastructure, and that roadwayimprovements should be the priority,followed by transit.
• A Transportation Fair and Workshophosted by the LCTIP, which broughttogether elected officials andtransportation providers who were askedto rate the effectiveness of varioussolutions; roadways were rated thehighest, followed by transit and otherstrategies.
• Meetings and review with establishedstudy groups (e.g., the Technical AdvisoryGroup, Municipal Groups, and theResource Agency Group) that producedseveral transportation objectives,including the development of alternativesthat would attract travel to the appropriateroadways, alternatives that provide wouldsufficient capacity on the major roadways,and alternatives that would provideimproved transit services.
For a complete discussion of the agencycoordination and public involvement thatoccurred during this study, refer to Section 5,Coordination.
3.5.2 Preliminary RoadwayConcepts
The initial alternatives development processproduced 12 preliminary roadway concepts(Figure 3-7). For each of the preliminaryconcepts, the No-Action Alternative (Baseline) isa common feature. Table 3-5 (on the followingpage) provides a description of the 12 preliminaryconcepts. Each preliminary concept was reviewedby the project team to refine the physicalconfiguration (i.e., logical extensions of theimprovement limits), and determine if anyconcepts should be dismissed from furtherevaluation. Those concepts that were dismissedfrom further consideration are discussed inSection 3.5.3, Preliminary Roadway ConceptsDismissed from Further Study.

ALTERNATIVES
3-9
TABLE 3-512 Preliminary Concepts
ConceptRoute Miles ofImprovement Description
I-94 Starting Point—IL 60to IL 132
63 The starting point improvement included added travel lanes on I-94 from IL 60 to IL 132.Additional roadway improvements include added travel lanes on I-94 from IL 132 to theWisconsin state line, and along US 12, IL 83/US 45, and IL 60 (Figure 3-7, map 1 of 12).
I-94 Starting Point—IL 60to Wisconsin State Line
80.9 The starting point improvement for this concept included added travel lanes on I-94 from IL60 to the Wisconsin state line. Additional roadway improvements include added travellanes are on IL 83/US 45, IL 60, US 12, and US 41 (map 2 of 12).
82.7 A second concept was produced from the I-94 (IL 60 to Wisconsin state line) starting point.Additional roadway improvements for this concept include added travel lanes on IL 83/US45, IL 60, IL 120 (partially on new alignment), and US 41 (map 3 of 12).
IL 83/US 45 StartingPoint— Lake Cook Roadto IL 120
63 The starting point for this concept represents improvements to IL 83/US 45. Additionalroadway improvements for the concept would include added travel lanes on IL 21, I-94 andUS 12 (map 4 of 12).
62 A second concept with the IL 83/US 45 starting point was produced consisting of additionaltravel lanes IL 21, I-94 and IL 120 (on partial new alignment) (map 5 of 12).
IL 53 Starting Point 27 This concept consists of a 6-lane freeway extension of IL 53 northward from Lake CookRoad to a 4/6-lane bypass of the Grayslake area generally following the existing IL 120corridor. These improvements would mostly be on a new alignment (map 6 of 12).*
27 A second concept would consist of a 6-lane tollway extension of IL 53 northward fromLake Cook Road to a 4/6 lane bypass of the Grayslake area generally following the IL 120corridor. These improvements would mostly be on new alignment. The eastern leg along IL120 would be non-tolled. (map 7 of 12).*
40 A third concept would consist of a 6-lane arterial extension of IL 53 northward from LakeCook Road to a 4/6 lane bypass of the Grayslake area generally following the IL 120corridor. This concept would also include added travel lanes on I-94 (map 8 of 12).
IL 120 Starting Point–Wilson Road to I-94(existing or newalignment)
84.6 The starting point improvement for this concept includes added travel lanes on existing IL120. Additional improvements for this concept include added travel lanes on US 12, IL83/US 45, I-94, and US 41 (map 9 of 12).
56 The starting point improvement for this concept would be a new 6-lane arterial partially onnew alignment. Additional improvements for this concept include added travel lanes on IL83/US 45, I-94, and IL 60 (map 10 of 12).
US 12 Starting Point– IL53 to IL 120
53 The starting point improvement for this concept would include added travel lanes on US12. Additional improvements for this concept include added travel lanes on IL 120 (onpartial new alignment), I-94, and IL 60 (map 11 of 12).
25.9 The starting point improvement for this concept would involve added travel lanes and theconversion of US 12 to an expressway. Interchanges would be constructed at all majorintersections and frontage roads would be added to manage local access. This conceptwould include added travel lanes on I-94 (map 12 of 12).
* Interchange access at Lake Cook Road, IL 22, Midlothian Road, Peterson Road, Wilson Road, Fairfield Road, Alleghany Road, US45, Hunt Club Road, IL 21, I-94, O’Plaine Road

ALTERNATIVES
3-10
3.5.3 Preliminary RoadwayConcepts Dismissed fromFurther Study
3.5.3.1 I-94 Starting Point (IL 60 toWisconsin State Line)
After careful examination of the preliminaryconcepts, two I-94 concepts were eliminatedfrom further consideration (Maps 2 and 3 of12, Figure 3-7). These concepts were bothdeveloped from the I-94 starting point withimprovements from IL 60 to the Wisconsinstate line (Figure 3-7). The principal reasonfor their elimination was their havingsubstantially more route miles ofimprovements than other concepts, whileproviding travel performance within the samebandwidth as the other preliminary concepts.The other key reason for their elimination wasthese concepts having similarities to the otherconcepts (i.e., improvements to the sameroutes). For example, in Figure 3-7, the I-94concept [map 1 of 12] and the IL 120 concept[map 10 of 12] offer many of the sameimprovements with less route miles (in thisexample over 20 fewer route miles ofimprovement) needed to achieve similarperformance. The project team concluded thatthere was no reasonable justification forretaining concepts that were redundant.
3.5.3.2 US 12 ExpresswayThe US 12 as an expressway concept was alsodismissed from further consideration(Figure 3-7, Map 12 of 12). Although somepartial access control could be added to anexisting roadway, the practicality of acomplete upgrade to an expressway along theexisting alignment was consideredinappropriate by the LCTIP. Upgrades of thismagnitude are rarely pursued in the suburbanmetropolitan area because of the severeimpacts to adjacent properties. Additionally,consideration of an expressway along US 12(while not considering this type ofimprovement for other arterial facilities) wasdeemed to be inconsistent by the LCTIP.Therefore, it was concluded that a roadwayconcept with US 12 as an expressway wasneither reasonable nor consistent with the
treatment of other arterial routes, and shouldbe dismissed from further consideration.
3.5.4 Initial Roadway AlternativesThe nine concepts that emerged from thepreliminary roadway evaluation were carriedforward in the process for furtherconsideration. These roadway concepts wererefined to include added engineering detail,resolution of route continuity and logicaltermini issues, and avoidance or minimizationof environmental impacts based upon existingand available data. The process involved staffworkshops and field checks to verifyconditions and information at criticallocations. Each alternative was criticallyreviewed to identify and implement alignmentshifts, constrain right-of-way footprints,and/or community bypasses to avoid orminimize substantive environmental or socialimpacts. Key roadway intersections were alsoreviewed and upgraded as necessary to includegrade-separated interchanges at somelocations; roads crossing or connecting themajor improvements were upgraded inaccordance with IDOT and ISTHA standardpractices. Figure 3-8 shows the nine initialroadway alternatives.
The process of refining the initial roadwayalternatives included the application of typicalcross sections to each of the alternatives. Thetypical sections assumed lane, median, andright-of-way widths for each type of roadwayimprovement being considered (Figure 3-9).The right-of-way widths of the cross sectionwere designed to generally satisfy LakeCounty’s stringent stormwater managementstandards, provide flexibility in gradingrequirements, and accommodate bicycle andpedestrian facilities. These typical crosssections were applied to the LCTIP GISdatabase to assess potential social andenvironmental impacts. None of the naturalresource impacts were considered to be “fatalflaws,” serious enough to prohibit theconstruction of any alternative. Displacementimpacts were also reviewed, with fivelocations being identified as having substantialimpact to residential and commercial areas.These locations are IL 21 in Libertyville,

ALTERNATIVES
3-11
US 45 in Mundelein, IL 60 near DiamondLake, US 12 in Palatine, and IL 120 inGrayslake. Each area was the subject offurther study and refinement to avoid asubstantial community disruption (seeCommunity Bypass Evaluation below).
The LCTIP presented the nine initial roadwayalternatives and preliminary transitimprovements at a series of public forums,including the established study groups and aseries of Public Informational Meetings. Anoverwhelming majority of participants agreedthat major transportation improvements areneeded in one form or another in the study area.
3.5.4.1 Community Bypass EvaluationOne of the most important steps in therefinement process was the analysis ofcommunity bypass options in five locations:
• IL 21 in Libertyville• US 45 in Mundelein• IL 60 near Diamond Lake• US 12 in Palatine• IL 120 in Grayslake
The initial assessment revealed that majorroadway improvements on the existing roads inthese areas would result in a substantialdisplacement impact; for additional details referto the Alternatives Development andEvaluation Report (LCTIP 2000a). For theinitial roadway alternatives that would affectthese areas, the LCTIP examined options forimproving travel in these corridors whileminimizing residential and commercialdisplacements. Community bypasses werestudied at each location, and bypasses wererecommended at four of the five locations. Theanalysis showed that a bypass of US 12 inPalatine was not necessary. The following is asummary of the analysis and recommendations:
• Libertyville—Bypass options weredeveloped to the west using IL 60,Butterfield Road and IL 137, and to theeast using IL 60, St. Mary’s Road, andIL 137. The east bypass is recommendedbecause it would have one-third to one-half fewer displacements as compared tothe other options.
• Mundelein—Bypass options weredeveloped to the east using IL 60,Butterfield Road, and IL 137, and to thewest using IL 83, or using portions ofIL 83 and the IL 53 extension corridor. Awest bypass using the IL 53 corridor isrecommended because it would have one-third to one-half the number ofdisplacements as compared to the otheroptions.
• Diamond Lake Area—A bypass optionwas developed using a portion of the IL 53corridor, and is recommended because itwould have one-third fewer displacementsthan the “through route” option.
• Grayslake—A bypass option wasdeveloped on new alignment to the southof existing IL 120, from Wilson Road toAlmond Road. The bypass option wasselected because it would displace half asmany homes as the “through route”option.
Figure 3-10 shows the bypasses consideredand routes selected at each location, andFigure 3-11 is a summary of the bypassevaluation. The selection of a Grayslakebypass resulted in the elimination of oneroadway alternative—the IL 120 on existingalignment option (Figure 3-8, map 7 of 9),which was developed with improvements toexisting IL 120. The remaining alternativesthat include IL 120 defined the improvementas a bypass; therefore, these alternatives wereretained for further analysis. The selectedbypasses were then incorporated into theremaining roadway alternatives as appropriate.
3.5.4.2 IL 53 Freeway/TollwayRefinements
The refinement process for the initialalternatives included further examination ofthe IL 53 roadway alternatives. This analysisof the IL 53 freeway and IL 53 tollway optionslead to a decision to combine these optionsinto one alternative: the IL 53Freeway/Tollway Alternative. Two factorsprovided the necessary justification tocombine the options: their identical footprints(roadway cross section, interchange locations,

ALTERNATIVES
3-12
length, etc.), and their nearly identicalsystemwide travel performance. Three travelperformance measures were considered:
• Vehicle hours of delay during the peaktravel period in the year 2020.
• Average systemwide speed during thepeak travel period in the year 2020.
• Weighted percent congested travel duringthe peak travel period in the year 2020.
For the three performance measuresconsidered, vehicle hours of delay(VHD/MVMT), average speed (VMT/VHT),and weighted percent congested (VHT), thepercent differences are 2.5 percent, 1 percent,and 1 percent, respectively. The differencesbetween these performance measures aremarginal. As such, the IL 53 Freeway/Tollwayoptions were combined, and will be referencedin the following sections as one alternative.
Other refinement consideration of the IL 53Alternative included an analysis of thealignment. In prior work, a recorded centerlinewas established and refined, which will bereferred to as the “current” alignment. Thisearlier work included efforts to avoid criticalhabitat; however, some encroachments wouldnonetheless occur to ADID wetlands and 4(f)properties (i.e., Leo Leathers Park inMundelein and Almond Marsh Forest Preservein Grayslake). The LCTIP revisited theseimpact issues by examining the feasibility ofalternate alignments that may avoid impact tothese resources and others. This approach isconsistent with efforts to refine the arterialbased alternatives. The analysis assumed thefollowing:
• The north-south study corridor isgenerally defined as an 8 km (5 mi) bandwidth. The Lakewood Forest Preserveestablished the boundary to the west, andIL 83 was established as the easternboundary. The boundary on the south isLake Cook Road, and the boundary on thenorth is IL 120.
• The east-west study corridor is boundedby existing IL 120 to the north, the current
alignment to the south, IL 137 to the west,and Almond Road to the east.
• The south terminal at Lake Cook Roadand the east termini along IL 120 (nearAlmond Road) are fixed due todevelopment and environmentalconstraints.
• Each alternate alignment was analyzed asa fully access-controlled route, with a 70-mph design speed, 91 m (300 ft) right-of-way width, and potential interchanges at3.2 to 8 km (2 to 5 mi) spacing.
• Impacts were assessed for the mainlineimprovement only.
The LCTIP compiled environmental resourcedata and aerial base mapping to begin theprocess of identifying potential alignments.Environmental resources were mapped on theaerial base mapping (1997) and includedADID and non-ADID wetlands, lakes, naturepreserves, natural areas, forest preserves, andcemeteries. The mapped environmental dataallowed the LCTIP to develop a number ofalignments that would avoid or minimizeimpact to the known resources (Figures 3-12,3-13, and 3-14). Additional refinements to thealignments were performed following fieldchecks to locate recent residential andcommercial development, or other informationnot shown on the aerial photography.
Following the development of the alternatealignments, travel performance for thealternatives was compared to the performancebenchmark described earlier in the roadwayalternative development process. Theassessment results indicated that all of thealignments would meet the performancebenchmark and should be further analyzed interms of societal and environmental impacts.
A summary of the environmental and societalimpacts for the alternate alignments for the IL53 Alternative are presented in Table 3-6 (onthe following page) for the current alignmentand the best alternate—BCE, and provides adetailed comparison of all the alternatealignments considered.

ALTERNATIVES
3-13
North-South Corridor. A total of nine newalignments were identified, with eight of thembeing to the west of the current IL 53alignment. The alignment to the east (“KK”)was eliminated due to its relatively largernumber of displacements (88 versus 17)compared to the current alignment.
The western alternate alignments arecomprised of three basic segments, with twodistinct alignments within each segment. Thefirst segment, between Lake Cook Road andIL 22, has alignments that avoid the BuffaloCreek ADID wetland (“A”) or relatively denseresidential development (“B”). The secondsegment, from IL 22 to Schwerman Road,offers two options (“C” and “D”). The thirdsegment provides two options for connectingto the east-west leg of the IL 53 proposal (“E”and “F”) while avoiding an 81-ha (200-ac)wetland mitigation site.
When comparing the various alignmentcombinations, ADID wetland impacts rangedfrom 0.0 to 0.8 ha (0.0 to 2.0 ac), as comparedto 2.6 ha (6.4 ac) along the current alignment.Impacts to non-ADID wetlands ranged from15.8 to 19 ha (39 to 47 ac), as compared to11.3 ha (28 ac) along the current alignment.Total displacements ranged from 42 to 109,compared to 24 along the current alignment.The best overall western alignment wasidentified as “BCE.” As summarized below,alignment “BCE” would have 50 percenthigher impacts to non-ADID wetlands and75 percent more commercial and residentialdisplacements when compared to the currentalignment. Alignment BCE, however, would
have slightly less impacts to ADID wetlandsand 4(f) properties when compared to thecurrent alignment.
East-West Corridor. Alternate alignments forthe East-West Corridor included an alignmentalong existing IL 120 from Atkinson Road toAlmond Road. This alignment would impactslightly less acreage than the currentalignment in terms of parks (1 versus 1.8 ha,or 2.5 versus 4.5 ac), forest preserves(0.85 versus 1.9 ha, or 2.1 versus 4.6 ac), andnon ADID wetlands (5.3 versus 6.2 ha, or13.2 versus 15.3 ac). However, this alignmentwould result in a higher number of residentialand commercial displacements (almost threetimes greater). Overall, the alternate alignmentwould not appreciably reduce impacts to keyresources, while resulting in a threefoldincrease in the number of displacements.Additionally, this alternate would eliminate asubstantial amount of business parking at theUS 45/IL 120 intersection.
In summary, the alternate alignments wouldnot provide any improvement in the overalltravel performance. The effects of thealternates vary compared to the currentalignment. The total impacts to wetlands areless for the current alignment than thealternates. The alternate alignments wouldhave less impact to forest preserve and parkproperties; however, the current alignmentonly impacts these resources slightly more.The alternate alignments have far greaterimpacts to residences and businesses, rangingfrom 2 to 3 times more than the currentalignment. Based on less overall wetland
TABLE 3-6Evaluation of Alternate IL 53 (North-South) and IL 120 (East-West) Alignments Corridor: Impact Summary
CorridorADID Wetlands
ha (ac)
Non-ADIDWetlands
ha (ac)
ForestPreserves/Parks
ha (ac) Displacements
ImprovementLengthkm (mi)
North-South Corridor
Current 2.6 (6.4) 11.5 (28.5) 0/1.26 (0/3.1) 24 19.8 (12.3 )
BCE 0.8 (2.0) 17.3 (42.7) 0/0 (0/0) 42 22.5 (14.0)
East-West Corridor
Current 0.2 (0.6) 6.2 (15.3) 1.9/1.8 (4.6/4.5) 6
“HH” 0.2 (0.6) 5.3 (13.2) 0.8/1.0 (2.1/2.5) 17

ALTERNATIVES
3-14
impacts and substantially less displacement ofresidential and commercial structures, thisanalysis concluded that none of the alternatealignments was superior to the currentalignments for the north-south and east-westimprovements in terms of transportationperformance or environmental effects. On thebasis of this analysis, the current IL 53Freeway/Tollway centerline will be retainedfor further study and refinement.
3.5.5 Other ProposalsConsidered
During the development of the roadwayalternatives, the LCTIP considered two otherproposals. One of the proposals, the East-Westcase study, was developed by the LCTIP andresponded to a perception that the majordirection of travel in the county is east andwest. The other proposal, Crossroads, wassubmitted by interest groups. The following isa summary of the LCTIP’s findings withregard to each proposal. A detailed review iscontained in the Alternatives Development andEvaluation Report (LCTIP 2000a).
3.5.5.1 East-West Case StudyEarly in the process of defining transportationproblems in Lake County, some peopleexpressed the opinion that east-west roads aremore congested than north-south roadways.The LCTIP and other transportation providersin the area recognize that there are east-westtravel needs in Lake County, and through acollaborative process identified more than64 km (40 mi) of east-west roadwayimprovements as part of the No-ActionAlternative (Baseline).
In response to comments, however, the LCTIPdeveloped and tested an “east-west”improvement scenario with an additional80 route miles of improvements (Figure 3-15).The performance of this scenario, whilehaving considerably more route miles ofimprovements, was worse than any of theother LCTIP roadway alternatives, achievingonly 78 percent of the performancebenchmark. These results are consistent withan analysis of travel patterns, which shows
that north-south travel is predominant and thesystem lacks sufficient north-south capacity.Based on these findings, an East-WestImprovement was dismissed from any furtherconsideration.
3.5.5.2 CrossroadsThe Environmental Law and Policy Center(ELPC) and Citizens Organized for SoundTransportation (COST) have proposed limitedroadway improvements and the addition ofsome rail service as the solution for LakeCounty’s transportation needs in a documenttitled Crossroads: Smart TransportationOptions for Lake County. They suggest thatimplementing these improvements would leadto greater congestion relief when compared tothe endorsed 2020 RTP.
The LCTIP analyzed the Crossroads proposalwith the appropriate 2020 population andemployment forecast and compared it to theregionally endorsed 2020 RTP. The RTPimproves travel times by about 10 percent on145 km (90 mi) of major roadways, whereasthe Crossroads proposal improves travel timesby the same margin on only 14.5 km (9 mi) ofmajor roadways (Figure 3-16). As such, theCrossroads proposal is not as effective inreducing congestion levels and accommodatingLake County’s future growth. For a detailedreview of the Crossroads proposal refer to areport titled Review of the Crossroads Proposal(LCTIP 2000b).
3.5.6 Conclusions – InitialRoadway RefinementProcess
The initial roadway alternatives weresubjected to numerous refinements, analyses,and considerations. The process consideredengineering requirements,environmental/societal impacts, as well aspublic perception (i.e., East-West Case Study).The results of this comprehensive processconcluded that seven roadway alternativeswould be carried forward for further study.The alternatives with their refinements areshown in Figure 3-17.

ALTERNATIVES
3-15
3.5.7 EnvironmentalConsiderations
The roadway alternatives development processinvolved numerous refinements andadjustments that would avoid or minimizeimpact to environmental and societalresources. Despite these efforts, however,implementation of any alternative would stillaffect environmental and societal resources tosome degree. This section discusses thefindings of an assessment of environmentalfactors for the seven remaining roadwayalternatives. The effects of transitimprovements were not considered as part ofthis assessment because these improvementswould be common to all roadway alternativesand would provide no distinguishing measureof effect.
At the outset, the LCTIP recognized that thetransportation problems in the county wouldrequire broad alternatives, covering manymiles of roadway improvements. From anenvironmental perspective, this project alsoincluded developing an approach foridentifying, measuring, and analyzing impactsat an equivalent level of detail. In response,the LCTIP developed a GIS databasecontaining more than 80 differentenvironmental data layers. The databaseprimarily used existing and available data withsome refinements based on reconnaissancelevel field surveys. The use and accuracy ofavailable data were considered acceptable tothe state and federal resource agenciesinvolved in the project. (See Table 5-1,Coordination for a List of ParticipatingFederal and State Agencies.)
In the early stages of the project, the GISdatabase was valuable in the development ofthe initial transportation improvement sets.Sensitive environmental areas were carefullyresearched, mapped, and coordinated withstate and federal agencies. During thedevelopment of the roadway options, thisinformation helped the alternativesdevelopment process avoid areas that wouldlikely preclude the implementation of anyimprovement. During the latter stages ofdevelopment, alternatives were refined to a
greater level of environmental information tofurther avoid or minimize resource impacts.Thus, from the beginning of the processthrough the latter stages of alternativesdevelopment, the environmental resourceissues have been carefully considered.
The environmental and societal effects for10 factors were assessed for the roadwayalternatives. A description of each factor and adescription of the criteria for measuringimpact are presented in Table 3-7 (on thefollowing page). The estimated impacts foreach roadway alternative are shown inFigure 3-18.
The emphasis placed upon avoiding andminimizing impacts during the alternativesdevelopment step is evident in the comparisonof impacts for the seven roadway alternatives.For the key resources, including forestpreserves, local parks, and wetlands, thedegree of impact across the seven roadwayalternatives was not substantially different.Putting the park impacts into perspective, therange of impact is from 1.2 to 2.8 ha (3 to7 ac) depending on the roadway alternative. Adifference of 1.6 ha (4 ac) across the suite ofalternatives when compared to 6,070 ha(15,000 ac) of local parks in Lake Countyrepresents an impact difference of less than0.03 percent. The number of individual parksites affected ranges from one to four,depending on the improvement set. A largernumber of affected sites would require greatercoordination with responsible resourceagencies. Similarly, the range of impact forforest preserves is 1.2 to 6.5 ha (3 to 16 ac),and the number of individual sites affectedranges from two to seven. Considering thatLake County has 8,498 ha (21,000 ac) offorest preserve—a number that is growingannually—the range of impact for the roadwayalternatives is less than 0.06 percent. Wetlandimpacts yield a similar comparison. Thecombined (ADID/non-ADID) range ofwetland impact is 32 to 42 ha (79 to 104 ac),with a difference of 10 ha (25 ac) across theseven roadway alternatives. With over18,500 ha (45,700 ac) of wetlands in LakeCounty, the difference of 10 ha (25 ac)

ALTERNATIVES
3-16
represents an impact of about 0.06 percent(see Figure 3-18).
A qualitative assessment of the resourceimpacts also revealed only minor differencesbetween the roadway alternatives. Most of theforest preserve impacts are fringe impacts (noimpact to an individual parcel is greater than2 percent of the total land area) that would not
impair the use or function of these designateduses. Wetlands designated as ADID representa highly regulated resource, and in most casesrequire considerable coordination withresource agencies concerning their impact andmitigation. Efforts were made to avoid ADIDwetlands where practicable; however, theimpact numbers show that no option would
TABLE 3-7Environmental and Societal Criteria
Criteria Definition
Wetlands (ADID) Impacts to ADID wetlands are measured by summing the hectares within the proposedright-of-way of the proposed improvement. A companion measure in this category iscalculating the number of encroachments upon wetlands (multiple encroachments on thesame property count as one site).
Wetlands (Non-ADID) This measure is the sum of non-ADID wetlands directly impacted by the roadwayimprovements. The measure sums both hectares and the number of individual wetlandencroachments.
Designated Lands These lands include forest preserves, parks, nature preserves, and INAI sites, amongothers. All of these lands are highly regulated and generally protected under the USDepartment of Transportation Act of 1966. This measure is a sum of both the total acres ofdesignated land impact, as well as the number of individual property encroachments(multiple encroachments on the same property count as one site).
Designated Lands withT&E
This is a measure of only those designated lands that also have a threatened and/orendangered species associated with the impacted area. The measure is expressed inhectares of impact.
Cultural Sites Cultural resources are highly regulated by NEPA, and therefore represent a resource thatis typically considered for highway improvement projects. This measure is an indication ofthe number of sites on known resources—those that have been identified throughprevious works. Each site represents a potential agency coordination effort that would berequired to address the potential impact.
Acres of AgriculturalLands (with 0.8 km, or0.5 mi, ofimprovement)
Agricultural lands are afforded limited protection through state and federal laws; however, they arerecognized as a finite resource. Urban expansion is continually cited as a major reason for theconversion of agricultural lands to other uses. The argument is often applied to roadwayimprovements. This measure is an indication of the amount of agricultural land within 0.8 km (0.5mi) that might be at risk to development because of secondary roadway effects (i.e., improvedmobility and access).
Multiple ResourceImpacts
This is a composite measure where multiple resources occur in the same impacted area,(i.e., wetlands and designated lands). This measure is a quality measure indicatingproperty impacts with more than one resource. The measure is expressed as acres of landwith multiple resources directly impacted.
Total Sites (wetland,designated lands,archeological sites)
This measure is the sum of all individual property sites for the named resources. Thismeasure is an indication of the special resource impact that would require extensivecoordination with resource agencies.
Displacements A measure of the residential, commercial, and other structures that would be potentiallydisplaced from construction of a roadway improvement set. The total displacementsinclude structures within the proposed right-of-way and in close proximity (4.6 m, or 15 ft).
Undeveloped Landswithin 0.8 km, or 0.5mi, of Improvement
The notion that highways contribute to growth and development is always present.Therefore, this consideration was designed to examine the underlying issue of urbangrowth that is commonly perceived as being associated with improved mobility andaccess. The measure is not designed to predict the rate or time at which land may beconverted, but to serve as a symbol/representation for land along the major roadwayimprovements that may be improved.

ALTERNATIVES
3-17
completely avoid ADID wetland resources.Thus, this highly regarded resource did notserve to distinguish between the improvementsets. An examination of potential impacts tothreatened and endangered species alsoshowed that each of the alternatives wouldimpact this highly regarded resource categoryto a similar degree.
The residential and commercial displacementsof each roadway alternative were alsoconsidered. Residential, commercial, and“other” buildings (garages, utility structures,etc.) within the proposed right-of-way ornearby (within 4.6 m or 15 ft) were identifiedas displacements. The number ofdisplacements, summarized in Figure 3-18,range from 101 to 246 across the suite ofroadway alternatives. Given the broad studyarea, the study team concluded thatdisplacements should not be a reason todismiss an alternative at this stage.
In summary, environmental resources wereconsidered early and throughout thealternatives development and evaluationprocess, to an equal level of detail, and over alarge study area. Considerable effort was madeto avoid or minimize impacts during eachstage of alternative development. The LCTIPand involved resource agencies agreed that forthis type of study it was appropriate to useexisting and available data and werecomfortable with its limitations. From both aquantitative and qualitative perspective, theenvironmental impacts were determined to besimilar. The process did not result in anyroadway alternative differentiating itself whenenvironmental issues were compared in acomprehensive manner relative to one another.
3.6 FinalistRecommendations
Following the development and refinement ofalternatives, the LCTIP began a process ofcomparative evaluation of the seven remainingroadway alternatives, which would lead to therecommendation of finalist alternatives forinclusion in the DEIS. Guided by the project’sfundamental transportation needs listed in
Section 1, Purpose and Need, the LCTIP usedevaluation factors that provide the bestmeasure of transportation performance—measures that assess the inherenttransportation capabilities of the roadwayimprovements. The remainder of this sectiondescribes the results of the comparativeevaluation for the seven roadway alternatives.
The ability of a project to meet the identifiedtransportation needs is the basic measure bywhich transportation projects are evaluatedand judged. The evaluation factors used tocompare roadway alternatives were developedto represent aspects that satisfy those needs.The evaluation process employs a rigoroustechnical analysis, using the project’s traveldemand model (with the regionally endorsedpopulation, employment, and travel forecastsas base data) to generate measures that allowperformance comparisons of the alternatives.The evaluation factors developed for theanalysis were based on two needs: improvelocal and regional travel and improve north-south travel. Together they provide the mostdiscriminating comparison of the sevenroadway alternatives. Improving modalconnections was not used as an evaluationfactor at this stage because it is not adiscriminating factor. All alternatives,however, will be structured to enhance modalconnections. Safety was also not used at thisstage, although each alternative is anticipatedto generally improve safety performance. Agreater level of detail is needed to definitivelyevaluate safety, which will be conducted forthe finalists.
The evaluation factors embrace improvingtravel efficiency with the use of measures thatcompare travel-time savings and improvingnorth-south travel with measures that show thechange in congestion and in traffic volume onnorth-south routes. The specific measures usedto compare and evaluate the roadwayalternatives at this stage of the study aredescribed below.
• Travel Efficiency (Cumulative TravelTimes)—Transportation effectiveness wasa measure of how well a roadwayalternative would improve travel

ALTERNATIVES
3-18
efficiency within a geographical area thatincluded Lake County, portions ofnorthern Cook County, and easternMcHenry County. The measure wasdetermined by aggregating travel times forall trips that started and ended within theaforementioned geographical area.
• Uncongested Lane Miles—This measureindicates the total lane miles that would beuncongested (defined as Level of ServiceA, B, or C) for the various roadwayalternatives. It is an indicator of how wellan alternative reduces the congestedtravel.
• Change in Traffic Volume—Thismeasure reflects the effect of the variousroadway alternatives on the volume oftraffic on existing roadways. It also servesas a proxy for traffic intrusion inneighborhoods and communities. Trafficremoved from local roads helps relieve orminimize cut-through traffic onneighborhood and local roads, which is animportant issue among study arearesidents. The measure is expressed as thenumber of roadway route miles with anincrease or a decrease of at least3,500 vehicles per day compared to theLCTIP baseline traffic volumes. Thismeasure was summarized for north-southtravel.
These three evaluation factors were applied tothe seven roadway alternatives. The results ofthe evaluation are summarized in Table 3-7.An overview of the evaluation results isprovided below, followed by individualdiscussions of each roadway alternative.
The cumulative travel time savings analysis(Table 3-7) shows that the hours of travelsaved for all trips in the typical P.M . peaktravel period (year 2020) ranges from62,700 to 83,400 hours of travel. The traveltime savings is the difference between the No-Action Alternative (Baseline) and eachroadway alternative—the greater the percentdifference the greater the travel savings. Theanalysis showed that the IL 53Freeway/Tollway Alternative would providethe best overall travel time improvement
(19 percent) compared to the No-ActionAlternative (Baseline). The least improvementwould be provided by either the IL120 Bypass Alternative or the US 12Alternative, with a savings of 14 percent overthe No-Action Alternative (Baseline).
The uncongested travel measure is anindication of the percent of the north-southroadways in 2020 that would be operating atfree-flowing conditions in the P.M. peakperiod. Depending on the option, between33 and 41 percent of the network (lane miles)would be operating congestion-free. The IL 53Freeway/Tollway Alternative would providethe greatest amount of congestion-free travel,and the US 12 Alternative would provide theleast.
The volume difference measure shows howthe roadway alternatives would affect travelon the existing roadway network. A beneficialeffect of the alternatives would be a reductionof traffic volume on existing roads, whichwould be an indication of reduced cut-throughtraffic and attraction of trips to majorfacilities. This measure examines thereduction in traffic on the existing roadnetwork for north-south segments, which isalso related to the goal of reducing north-southtravel congestion. The measure shown inTable 3-8 (on the following page) is simplythe number of route miles on which dailytraffic volumes would be reduced by 3,500vehicles or more in 2020 as compared to theNo-Action Alternative (Baseline). The IL 53Freeway/Tollway Alternative provides thegreatest reduction in traffic on existing north-south routes; the US 12 Alternative providedthe least.
• IL 53 Freeway/Tollway—The IL 53Freeway/Tollway Alternative was the topperformer for all three performancemeasures, providing over 83,400 hours oftravel time savings for the 2020 P.M . peakperiod and 125 routes miles of trafficrelief on north-south routes as comparedto the No-Action Alternative (Baseline).In addition, the IL 53 Freeway/TollwayAlternative had 41 percent of the north-south lane miles uncongested in the P.M.

ALTERNATIVES
3-19
peak period, which is the highest whencompared to the other alternatives.
• IL 83/US 45 with US 12—The travelperformance for the IL 83/US 45 with US12 Alternative was the second best overallperformer. The IL 83/US 45 with US 12Alternative scored second in travel timesavings with 75,100 hours for the2020 P.M . peak period. In terms ofrelieving traffic on north-south roadways,IL 83/US 45 with US 12 Alternativescored second with 88 route miles. IL83/US 45 with US 12 Alternative tied forthird with two other alternatives, withroughly 38 percent of the north-south lanemiles uncongested in the P.M . peak period.
• IL 53 Arterial—The travel performancefor the IL 53 Arterial Alternative variedby performance measure. The IL 53Arterial Alternative scored fourth in travel
time savings, with 70,200 hours for the2020 P.M . peak period. In terms ofrelieving traffic on existing north-southroadways, the IL 53 Arterial Alternativescored third with 83 route miles. Thisalternative scored second with 39 percentof the north-south lane miles uncongestedin the P.M. peak period.
• IL 83/US 45 with IL 120—The travelperformance for the IL 83/US 45 with IL120 Alternative also varied byperformance measure. This alternativescored third in travel time savings with71,400 hours for the 2020 P.M. peakperiod. In terms of relieving traffic onnorth-south roadways, the IL 83/US 45with IL 120 Alternative scored fourth with68 route miles. This alternative tied forthird with two other alternatives, with38 percent of the north-south lane milesuncongested in the P.M. peak period.
TABLE 3-8Traffic Performance for Refined Roadway Improvement Sets
Travel Time Savings aTraffic Relief on
North-South Roads bUncongested North-SouthLane Miles LOS A,B,C c,d
Alternativee
Peak PeriodHours of Travel
Time Saved% Improvementover No-Action Score Miles Score Percent Score Score
I-94 65,900 15% 3 67.9 3 38% 5 11
IL 83/US 45with US 12
75,100 17% 6 88.12 6 38% 5 17
IL 83/US 45(with IL 120)
71,400 16% 5 68.28 4 38% 5 14
IL 53 Freeway/Tollway
83,400 19% 7 124.57 7 41% 7 21
IL 53 Arterial 70,200 16% 4 82.8 5 39% 6 15
IL 120 Bypass 64,000 14% 2 65.64 2 37% 2 6
US 12 62,700 14% 1 61.47 1 33% 1 3
a Travel Times Savings: This is a measure of the improvement in travel times for all trips that begin and end inLake, northern Cook, and/or eastern McHenry counties. As an example, a 15-percent improvement wouldsave about 10 minutes for a 1-hour trip during the afternoon rush hour, year 2020.b Traffic Relief on North-South Roads: This is a measure of the total miles of existing north-south roads thatwould carry at least 3,500 fewer vehicles each day, year 2020.c Uncongested North-South Travel: This is a measure of the percentage of north-south roads that would beuncongested during the afternoon rush hour, year 2020.d A difference of 8 percent represents approximately 100 lane miles.e LCTIP No-Action (Baseline) trip table

ALTERNATIVES
3-20
• I-94—The travel performance for the I-94Alternative varied by performancemeasure. This alternative scored fifth intravel time saving, providing 65,900 hoursfor the 2020 P.M. peak period. In terms ofrelieving traffic on north-south roadways,the I-94 Alternative scored fifth with67.9 route miles. This alternative tied forthird with two alternatives, with 38 percentof the north-south lane miles uncongestedin the P.M. peak period.
• IL 120 Bypass—The IL 120 BypassAlternative was consistently placed sixthamongst the alternatives, with64,000 hours of travel time savings for the2020 P.M . peak period, and 66 route milesof traffic relief on north-south roadwayscompared to the No-Action Alternative(Baseline). Roughly, 37 percent of thenorth-south lane miles were uncongestedin the P.M. peak period.
• US 12—The US 12 Alternativeconsistently performed the worst, with62,700 hours of travel time savings for the2020 P.M . peak period and 61 route milesof traffic relief on north-south roadwayswhen compared to the No-ActionAlternative (Baseline). Roughly, 33 percentof the north-south lane miles would beuncongested in the P.M. peak period.
Based on the data in Table 3-8, a compositescore was determined for each roadwayalternative representing an overall score of thethree travel performance measures. Thecomposite was developed by assigning a scoreof 1 through 7 in order of performance foreach alternative for each measure, with 7 thebest and 1 the worst. Based on the compositescores, the two alternatives selected were IL53 Freeway/Tollway and IL 83/US 45 withUS 12 alternatives (see Figures 3-19 and3-20).
For each travel performance measure, the IL53 Freeway/Tollway Alternative was the topperformer. The travel performance for the IL83/US 45 with US 12 Alternative scored eithersecond or third for each performance measure.No other roadway alternative consistentlyscored as high for each performance measure.
The US 12 Alternative was consistently theworst performing option, with 20,700 hoursless travel time saving, over 50 percent fewerroute miles of traffic relief, and 100 fewer lanemiles of uncongested travel compared to theIL 53 Freeway/Tollway Alternative. Given thecentral premise of the evaluation process—toselect alternatives that best met thetransportation need—the IL 53Freeway/Tollway and IL 83/US 45 with US 12alternatives were selected as the finalistalternatives.
3.6.1 Description of the FinalistAlternatives
There are two finalist (Build) alternatives: IL53 Freeway/Tollway and IL 83/US 45 withUS 12. The No-Action Alternative (Baseline)will also be carried forward in the evaluation.The two build alternatives are comprised ofthe roadway improvements and the supportingtransportation improvements described earlierin this section. The selection of the finalistalternatives was followed by anotherrefinement step that would add moreengineering detail. The added engineeringdetail included better definition of feeder roadand intersection/interchange improvements,and additional improvements to eachalternative. For the IL 53 Freeway/TollwayAlternative, improvements to I-94 andO’Plaine Road were added to better facilitatetravel near a major system terminus, and forthe IL 83/US 45 with US 12 Alternativeimprovements to IL 60 and IL 120 wereadded. During this refinement step, additionalenvironmental information was collected,allowing the LCTIP to make furtheradjustments and shifts to roadway alignmentsthat would lessen environmental and societalimpacts. A general description of the finalistroadway alternatives and supportingimprovements is provided below and includesthe refinements described above.
3.6.1.1 IL 53 Freeway/TollwayAlternative
The IL 53 Freeway/Tollway Alternativeconsists of the construction of a new highwayin central Lake County either as a freeway or

ALTERNATIVES
3-21
tollway facility (see Figure 3-19). The IL 53Freeway/Tollway Alternative would begin atthe terminus of IL 53 at Lake Cook Road andextend northerly for a distance of 21 km(13 mi) to a point south of IL 120. Thealternative would continue for about 22.5 km(14 mi) both to the east and to the west. Theeastern terminus would tie into the existinginterchange complex at US 41, and thewestern terminus would be Wilson Road, witharterial improvements extending alongexisting IL 120 from Wilson Road to theintersection of IL 60 and IL 120. Additionallanes are proposed on I-94 from IL 120 to IL132.
Access to the IL 53 facility would be gainedon grade-separated interchanges at majorarterials. These include: Lake Cook Road, IL22, Midlothian Road, Peterson Road,Alleghany Road, US 45, IL 21, I-94, O’PlaineRoad, Hunt Club Road, Wilson Road, andFairfield Road. Improvements would be madeto arterial highways through the interchangeinfluence area to provide for proper roadwayoperations and safety. The length ofimprovements to arterial feeder roadsgenerally extends to the nearest majorintersection.
The IL 53 Freeway/Tollway Alternative wouldbe constructed with three through lanes ineach direction separated by a barrier median.The west leg would be four lanes. The typicalright-of-way width required for the roadway is
91 m (300 ft), including a 23-m (76-ft)pavement (11.5 m or 38 ft in each direction),8.5-m (28-ft) paved median, 3.7-m (12-ft)right shoulders, and grassed areas withroadside ditches. Where necessary to avoidcritical natural and community resources,refinements were made to the typical crosssection. These refinements included areduction in right-of-way width to 76 m(250 ft).
The facility would be constructed as either afreeway or tollway. Both facility types havethe same basic design elements and similaroperational characteristics, but the tollwaywould require provision of toll collectionfacilities. The east leg would be non-tolled ineither case. For the purposes of this study,construction of the alternative as a freewayversus tollway facility would be a futurefunding choice, depending on the alternativeselected.
3.6.1.2 IL 83/US 45 with US 12Alternative
The IL83/US 45 with US 12 Alternativeincludes approximately 101 km (63 mi) ofimprovements on existing roads, as well asnew alignment. Approximately 80 percent ofthe improvements are on existing facilities and20 percent are on new alignment to bypassestablished communities (see Figure 3-20).Table 3-9 summarizes the type ofimprovement proposed for each roadway.
TABLE 3-9IL 83/US 45 with US 12 Alternative Improvements
Roadway Improvement
Hicks Road Widen from 2 to 6 lanes from IL 53 to IL 83
IL 83 Widen from 4 to 6 lanes from Hicks Rd. to US 45
Mundelein Bypass New 4-lane road from IL 60/US 45 to IL 120 bypass
I-94 Widen from 6 to 8 lanes from IL 60 to IL 132
IL 21 Widen from 4 to 6 lanes from Lake Cook Rd. to IL 60; IL 137 to I-94
Libertyville Bypass IL 60: Widen from 4 to 6 lanes from IL 21 to I-94St. Mary’s Rd.: Widen from 2 to 4 lanes from IL 60 to IL 137
IL 137: Widen from 4 to 6 lanes from IL 21 to I-94
US 12 Widen from 4 to 6 lanes from IL 53 to IL 176
IL 120 (New Alignment) New 4-lane arterial from Alleghany Rd. to Almond Rd.

ALTERNATIVES
3-22
Existing intersections and interchanges alongthe widened highway corridors would beimproved to provide adequate trafficoperations at major highway junctions. Thetypical cross section for the proposedimprovements included in the alternativewould vary based on the type of facility andproposed number of lanes. The typical right-of-way width would generally be 40 m(130 ft) for a 4-lane arterial, 49 m (160 ft) fora 6-lane arterial, and 91 m (300 ft) for an8-lane tollway. Where necessary to avoidcritical natural and community resources,refinements have been made to the typicalcross section to avoid or minimize impacts.These refinements included a reduction inright-of-way width, typically to 30.5 m(100 ft) for a 4-lane arterial facility, 36.6 m(120 ft) for a 6-lane facility, and 76.2 m(250 feet) for an 8-lane tollway. Refer to theAlternatives Development and EvaluationReport (LCTIP 2000a) for more details.Typical cross sections are shown in Figure 3-9.
3.6.1.3 Construction and Right-of-WayCosts
The LCTIP developed an estimate of projectcosts for the roadway alternatives based on arigorous analysis. The cost estimates areidentified in 1999 dollars and include bothconstruction and right-of-way estimates. Theconstruction costs estimates typically assumefull roadway reconstruction and are based onmajor cost items such as grading, pavement,drainage, and bridges and retaining walls. Theunit costs for the major construction cost itemsrelied upon current IDOT project experience.The right-of-way estimates included both landand structure acquisition. Standard costs forland cost and structure costs were developed
by township using Lake County tax assessordatabase and other available information suchas the Price Pulse data. The project team used1999 data to establish a common base forcomparing the roadway improvement sets. SeeTable 3-10.
3.6.2 Supporting Improvements
3.6.2.1 TransitAs outlined in Section 3.4.1, Rail and BusTransit, a comprehensive package of rail andbus improvements are recommended.
3.6.2.2 Transportation SystemManagement
TSM strategies were fully considered as part ofthe transportation improvements. TSMapplications are designed to make thetransportation facilities function moreeffectively, work more reliably, and operatemore safely. These strategies encompassimprovements such as modernized traffic signalcontrol systems that adjust themselves tooptimize traffic flow, freeway traffic flowmanagement, incident detection and response,system surveillance, intersection improvements,and traveler information services. In LakeCounty, TSM strategies have been widelydeployed and represent the predominant type ofimprovement over the last decade. Since 1990,nearly 200 TSM projects have beenimplemented and about 70 more are plannedfrom 2001–2005 (Figure 3-21). Among theexisting and planned TSM improvements inLake County are numerous intersectionupgrades, inter-jurisdictional signal systemscoordination, enhanced safety applications forhighway-rail crossings, I-PASS on the tollwaysystem, transit signal priority and arterial
TABLE 3-10Construction and Right-of-Way Costs for the Finalist Build Alternatives (in 1999 dollars)
Construction ROW Total
No-Action (Baseline) $ 414,000,000 $ 69,000,000 $ 483,000,000
IL 53 Freeway/Tollway $ 674,000,000 $ 187,000,000 $ 861,000,000
IL 83/US 45 with US 12 $ 735,000,000 $ 360,000,000 $ 1,095,000,000

ALTERNATIVES
3-23
incident management, and variable messagesigns.
The LCTIP proposes three types of TSMimprovements: arterial traffic control systems,transit service management systems, andcontinuance of the existing programs. Thearterial roadways in the county are animportant element of the overall transportationsystem; therefore, particular attention in theTSM strategy has been given to arterial trafficsignal control systems to improve traffic flow.This strategy recommends the deployment ofan arterial system management strategy for themajor routes (Table 3-11) that consistentlydisplay the most congestion and delay. Asshown in Table 3-11, the priority routes wouldvary depending upon the build alternativeselected.
The arterial strategy would consist of electronicarterial surveillance, signal systeminterconnects and communication with a trafficmanagement center to manage traffic controland transit priority, variable message signs,incident detection and management, andhighway advisory radio. It is recommended thata high-volume corridor in the county (i.e., LakeCook Road) be selected as a testbed for thiscombination of technology. A consortium ofCATS, Cook County, Lake County, andNorthwestern University has funding to study
and implement traffic surveillance and controlsystems in this Lake Cook corridor. Followingan appropriate test period, deployment could beadvanced to the other priority corridors.
Other features of the TSM strategy includetransit management systems. A travel advisoryinformation system would be deployed atMetra stations and parking lots to provideparking availability status and capacity, trainschedules, etc. Advanced technology wouldalso be deployed at rail-highway crossings toincrease safety. Bus transit managementsystems would include automatic vehiclelocation, passenger and fare reporting, routeand schedule tracking, voice and datacommunication between vehicles and themanagement center, and signal priority tofacilitate transit vehicle flow.
TSM strategies are viewed as acomplementary component of the overalltransportation improvements in Lake County.TSM initiatives and strategies are needed andwould support other transportationimprovements in the county, but the scale ofthe projected population and employmentgrowth cannot be addressed by these strategiesalone. Experience has shown that despite thefairly aggressive TSM programs deployed inthe last decade, roadway congestion has faroutpaced these measures. Therefore, a major
TABLE 3-11Priority Routes for Traffic Control Systems
IL 53 Freeway/Tollway Alternative IL 83/US 45 with US 12 Alternative
I-94 (Tollway) I-94 (Tollway)
IL 53 Freeway/Tollway IL 120
IL 60 IL 60
IL 22 IL 22
IL 83 US 12
US 12 IL 83
US 41 US 41
IL 120 (existing) Weiland Road
Weiland Road Old McHenry’s Road
Martin Luther King Jr. Blvd. Long Grove Road
Washington Street St. Mary’s Road
Butterfield Road IL 21

ALTERNATIVES
3-24
investment in transportation infrastructure isnecessary to accommodate the travel demandgenerated by future population growth.
3.6.2.3 Travel Demand ManagementTDM strategies represent another componentof the LCTIP transportation alternatives. TDMstrategies are designed to decrease vehicledemand on the roadway system by increasingvehicle occupancy or changing theattractiveness of competing modes. Currently,there are a number of TDM activities beingapplied in Lake County, including rideshareprograms, employer activities, and publiceducation programs. CATS, as part of the 2020RTP, endorsed six TDM strategies: rideshare,improved pedestrian and bicycle facilities,park-and-ride facilities, expanded vanpoolprograms, parking management, and transitincentives. Each of these strategies is applicableto Lake County, and when implemented theycould reduce traffic volumes by about 1 percent(LCTIP 1999) on the roadways in the county.Although the overall reduction appears small,TDM measures materially contribute toincreasing the number of travel options forcommuters.
The LCTIP examined the use of park-and-ridefacilities in connection with the buildalternatives. Park-and-ride facilities areessentially parking lots at strategic locationsthat allow people to drop off or leave their cars,and transfer to a bus system, carpool, vanpool,or even a commuter train if a rail station isnearby. In many parts of the United States,these facilities have enjoyed considerablesuccess. In Lake County, two park-and-ridefacilities exist at the Buffalo Grove and Gurneetransportation centers. A third park-and-ridefacility is planned at a proposed transportationcenter in Waukegan. The LCTIP recommendsadditional park-and-ride facilities at the fiveproposed transportation centers that providebus-to-bus and bus-to-rail transfer capabilities:Highland Park, Libertyville, Round Lake,Palatine, and Fox River Grove. Additionally, tofacilitate carpooling and vanpooling on abroader geographic area, park-and-ridefacilities are proposed at major interchanges orintersections where strategic regional arterials
(SRAs) intersect, including major interchangesalong I-94 and the proposed IL 53Freeway/Tollway Alternative. Details and mapsshowing the locations of these facilities for thebuild alternative are included in Transit andTransportation Management Strategies for theLake County Transportation ImprovementProject (LCTIP 2001b). See Figures 3-22, 23,and 24.
Bicycle and pedestrian improvements havebeen considered as a complementary set ofenhancements for the finalist buildalternatives. These improvements arestructured to mesh with existing and plannedroutes where appropriate. The improvementsare described as potential opportunities thatwould require further consideration andanalysis for the selected build alternative. TheIL 53 Freeway/Tollway Alternative providesan opportunity for a linear shared path alongits length with connections to existing bikepaths via local roads such as IL 60 and IL 21(Des Plaines River Trail) and IL 176 (RobertMcClory Path). Direct connections to a linearbicycle/pedestrian path along the IL 53Freeway/Tollway Alternative would bepossible with extensions of existing paths,particularly between IL 120 and the proposedDes Plaines River Trail extension. Similarly,direct connections would be likely at severalemployment centers and rail stations such asthe Grayslake and Prairie Crossing NCS railstations , and Kemper Insurance, Motorola,and Baxter Health Care. The IL 83/US 45 withUS 12 Alternative would also provideopportunities for new bicycle and pedestrianfacilities along the rights-of-way of improvedarterial facilities with direct connection to twoexisting bicycle paths: the Des Plaines RiverTrail and the Robert McClory Path.Additionally, indirect connections to theSkokie Valley Trail and the Green Bay Trailare possible. This alternative would providenumerous opportunities for connections to railstations and employment centers. Furtherdetails and maps showing the alternatives inrelation to existing bicycle/pedestrian pathsand employment centers are contained in atechnical memorandum titled Transit andTransportation Management Strategies for the

ALTERNATIVES
3-25
Lake County Transportation ImprovementProject (LCTIP 2001b) (see Figures 3-22, 23,and 24).
3.6.3 Detailed Evaluation of theFinalist RoadwayAlternatives
The final step in the process is a comparativeevaluation of the two finalist build alternatives(IL 53 Freeway/Tollway and IL 83/US 45 withUS 12 Alternatives). Each alternative wasrigorously compared to the project Purposeand Need, which includes:
• Improving local and regional travel
• Improving north-south travel capacity andefficiency
• Improving safety
• Improving modal connections 5
The comparative evaluation of the finalistbuild alternatives was based onalternative-specific population andemployment forecasts developed for eachalternative (ACG 1999, CATS 1997a, ACG2000). These forecasts were subsequently usedby CATS to develop a travel forecast for eachof the finalist alternatives. The travelperformance for each alternative was then re-evaluated using these refined alternative-specific travel forecasts. The re-evaluationprovided new travel performance metrics foreach alternative based on travel forecasts thatare unique to each alternative, including theNo-Action Alternative (Baseline). Thefollowing is a summary of the Purpose andNeed measures used to compare thealternatives.
5 It should be noted that “improve modal connections” isnot performance based, but a qualitative measure.
3.6.3.1 Improve Local and RegionalTravel
Local Travel. Improvements to local travelwere measured using “cumulative travel timesavings.” Travel time savings were derivedfrom calculating the total travel time for alltrips in the year 2020 and compared to the No-Action Alternative (Baseline). As shown inTable 3-12, each build alternative would saveapproximately 19 million hours of annual travelover the No-Action Alternative (Baseline) in2020. This represents an 8-percent travel timesavings over the No-Action Alternative(Baseline).
Early public involvement activities identifiedthe rapid rise in travel along secondary roadsas a primary concern of Lake Countyresidents. Lake County officials requested thatthe LCTIP consider the effect the finalistroadway alternatives would have on futureimprovement needs along the county-maintained system. The LCTIP used criteriaestablished by the Lake County Division ofTransportation (LCDOT) to assess the needfor additional capacity along county-maintained roadways. Traffic volumes greaterthan 15,000 ADT for 2-lane roads andvolumes greater than 30,000 along 4-laneroads were considered as over capacity(i.e., requiring additional lanes). Table 3-13(on the following page) summarizes the totallane miles that would exceed LCDOT’scapacity threshold for 2- and 4-lane roads forthe No-Action (Baseline), IL 53Freeway/Tollway, and IL 83/US 45 with US12 alternatives.
The IL 53 Freeway/Tollway Alternative wouldhave a net reduction of 17 lane miles on 2- and
TABLE 3-12Local Trips
Alternative
Total AnnualSavings(hours)
PercentImprovement over
Baseline
AnnualSavings/Motorist
(hours)
AnnualSavings/Motorist
($)a
IL 53 Freeway/Tollway 18,700,000 8.3% 33.0 hours $1584
IL 83/US 45 with US 12 19,100,000 8.5% 33.8 hours $1622
a Based upon 48.00 hours for composite vehicle operating costs, Year 2020.
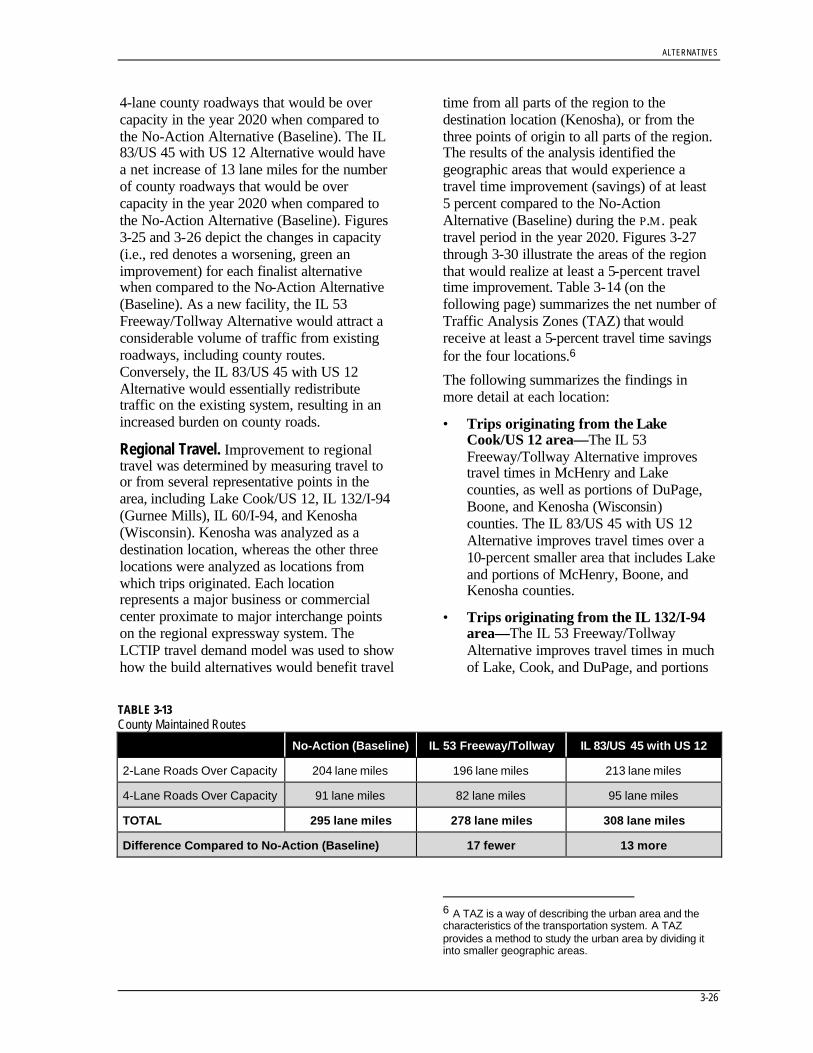
ALTERNATIVES
3-26
4-lane county roadways that would be overcapacity in the year 2020 when compared tothe No-Action Alternative (Baseline). The IL83/US 45 with US 12 Alternative would havea net increase of 13 lane miles for the numberof county roadways that would be overcapacity in the year 2020 when compared tothe No-Action Alternative (Baseline). Figures3-25 and 3-26 depict the changes in capacity(i.e., red denotes a worsening, green animprovement) for each finalist alternativewhen compared to the No-Action Alternative(Baseline). As a new facility, the IL 53Freeway/Tollway Alternative would attract aconsiderable volume of traffic from existingroadways, including county routes.Conversely, the IL 83/US 45 with US 12Alternative would essentially redistributetraffic on the existing system, resulting in anincreased burden on county roads.
Regional Travel. Improvement to regionaltravel was determined by measuring travel toor from several representative points in thearea, including Lake Cook/US 12, IL 132/I-94(Gurnee Mills), IL 60/I-94, and Kenosha(Wisconsin). Kenosha was analyzed as adestination location, whereas the other threelocations were analyzed as locations fromwhich trips originated. Each locationrepresents a major business or commercialcenter proximate to major interchange pointson the regional expressway system. TheLCTIP travel demand model was used to showhow the build alternatives would benefit travel
time from all parts of the region to thedestination location (Kenosha), or from thethree points of origin to all parts of the region.The results of the analysis identified thegeographic areas that would experience atravel time improvement (savings) of at least5 percent compared to the No-ActionAlternative (Baseline) during the P.M . peaktravel period in the year 2020. Figures 3-27through 3-30 illustrate the areas of the regionthat would realize at least a 5-percent traveltime improvement. Table 3-14 (on thefollowing page) summarizes the net number ofTraffic Analysis Zones (TAZ) that wouldreceive at least a 5-percent travel time savingsfor the four locations.6
The following summarizes the findings inmore detail at each location:
• Trips originating from the LakeCook/US 12 area—The IL 53Freeway/Tollway Alternative improvestravel times in McHenry and Lakecounties, as well as portions of DuPage,Boone, and Kenosha (Wisconsin)counties. The IL 83/US 45 with US 12Alternative improves travel times over a10-percent smaller area that includes Lakeand portions of McHenry, Boone, andKenosha counties.
• Trips originating from the IL 132/I-94area—The IL 53 Freeway/TollwayAlternative improves travel times in muchof Lake, Cook, and DuPage, and portions
6 A TAZ is a way of describing the urban area and thecharacteristics of the transportation system. A TAZprovides a method to study the urban area by dividing itinto smaller geographic areas.
TABLE 3-13County Maintained Routes
No-Action (Baseline) IL 53 Freeway/Tollway IL 83/US 45 with US 12
2-Lane Roads Over Capacity 204 lane miles 196 lane miles 213 lane miles
4-Lane Roads Over Capacity 91 lane miles 82 lane miles 95 lane miles
TOTAL 295 lane miles 278 lane miles 308 lane miles
Difference Compared to No-Action (Baseline) 17 fewer 13 more

ALTERNATIVES
3-27
of McHenry and Will counties. The IL83/US 45 with US 12 Alternative wouldimprove travel times over a 65-percentsmaller area in Lake and northern Cookcounties.
• Trips originating from the IL 60/I-94area—The IL 53 Freeway/TollwayAlternative improves travel times in muchof Lake, all of McHenry, and portions ofDuPage, Kane, Boone, and Kenoshacounties. The IL 83/US 45 with US 12Alternative would improve travel times ina similar area to the IL 53Freeway/Tollway Alternative; however, itwould worsen travel times in ageographical area of about the same size(i.e., DuPage, Will and southern Cookcounties). This worsening over a sizeablearea is due to maintaining I-94 as the onlyprincipal north-south route through thecounty, whereas the IL 53Freeway/Tollway Alternative betterdistributes traffic to the regional systemvia the existing I-94 and the proposed IL53 facility.
• Trips destined for Kenosha Countyarea—The IL 53 Freeway/TollwayAlternative improves travel times insouthern Lake and northern Cook countiesand along the I-355 corridor in DuPageCounty. The IL 83/US 45 with US 12Alternative would improve travel over a19-percent smaller area in southern Lakeand northern Cook counties, and along theI-94 corridor in eastern Cook County.
The analysis demonstrates that the IL 53Freeway/Tollway Alternative generallyimproves regional travel to a greater extentthan the IL 83/US 45 with US 12 Alternative.This is primarily due to the IL 53 alternativecreating a more balanced regional network,and therefore a more balanced distribution ofregional travel.
Regional System Continuity. The analysis ofregional travel also considered how eachalternative would improve continuity in theregional expressway system.• The IL 83/US 45 with US 12 Alternative
would improve travel flows along I-94,which presently carries a considerableportion of the 125,000 trips passingthrough Lake County. This alternativeimproves a major link in the existingexpressway system; however, it providesno substantive remedy for continuitytravel issues along the region’sexpressway system.
• The IL 53 Freeway/Tollway Alternativewould more effectively address severaltravel continuity issues in the region,including extending the terminus of IL 53at Lake Cook Road to a logical systemconnection with I-94 near Gurnee. Thecurrent terminus of IL 53 at Lake CookRoad requires all traffic (90,000 per day)to exit the expressway and use existingarterials to reach destinations throughoutLake County. The extension of IL 53would complete a link in the regional
TABLE 3-14Net Traffic Analysis Zones and Geographic Area Receiving a 5-Percent Travel Time Saving, Compared to Baseline
Lake Cook/US 12 IL 132/I-94 IL 60/I-94 Kenosha
TAZs 309 1,316 525 470IL 53 Freeway/Tollway
Area km2
mi24,2171,628
5,4442,102
4,4811,730
1,987767
TAZs 199 590 (567) * 547IL 83/US 45 withUS 12
Area km2
mi23,7971,466
1,893731
329127
1,619625
* ( ) Denotes a negative difference of more TAZs with an increase in travel time.

ALTERNATIVES
3-28
expressway system that would accomplishseveral objectives:
− Elimination of the unconventionalterminus of IL 53 at Lake Cook Roadthat results in severe trafficcongestion.
− Provision of a logical systemconnection, and more direct access fortravelers destined for locations incentral Lake, western Cook, andDuPage and Will counties.
− Provision of a north-south link thatresponds to a specific travel demandneed, as well as providing systemredundancy to better manage regionaland peak hour travel.
3.6.3.2 Improve North-South TravelCapacity and Efficiency
Systemwide. The need to improve north-south travel capacity and efficiency ismeasured as the number of uncongested north-south lane miles in Lake County. The numberof “uncongested” lane miles for each buildalternative was determined by identifyingthose routes with a Level of Service A, B, or Cduring the P.M. peak travel period in the year2020. The results of the analysis indicate thatthe IL 53 Freeway/Tollway Alternative would
result in nearly 70 more uncongested lanemiles, and improve conditions by 12 percent,while the IL 83/US 45 with US 12 Alternativewould result in about 40 more uncongestedlane miles, and improve conditions by7 percent when compared to the No-ActionAlternative (Baseline) as summarized inTable 3-15.
Select Trips. The LCTIP also examined theeffects of the alternatives on several north-south trips in the County. This analysisexamined a western, central, and easternnorth-south trips. The western trip wasrepresented by a trip from Barrington to Volo(see Table 3-16). For this trip, the IL 53Freeway/Tollway Alternative would provide a14-percent travel time improvement over theNo-Action Alternative (Baseline), while theIL 83/US 45 with US 12 Alternative wouldprovide an 11-percent improvement. Thecentral trip extended from Schaumburg toGrayslake. The IL 53 Freeway/TollwayAlternative would provide a sizable traveltime improvement over the No-ActionAlternative (Baseline) of 17 percent, while theIL 83/US 45 with US 12 Alternative wouldprovide a 9-percent improvement. Theanalysis of the eastern trip, extending fromDeerfield to Waukegan, showed differentresults. In this case, the IL 83/US 45Alternative with US 12 would provide a
TABLE 3-15Uncongested North-South Travel
Alternative Uncongested Lane Miles% Improvement Over No-Action
Alternative (Baseline)
No Action (Baseline) 530 —
IL 53 Freeway/Tollway 596 12 %
IL 83/US 45 with US 12 568 7 %
TABLE 3-16Percent Travel Time Savings Over the No-Action (Baseline) for Three North-South Trips
Barrington to VoloSchaumburg to
Grayslake Deerfield to Waukegan
IL 53 Freeway/Tollway 14% 17% 13%
IL 83/US 45 with US 12 11% 9% 24%

ALTERNATIVES
3-29
24 percent improvement in travel time overthe No-Action Alternative (Baseline)compared to a 13-percent improvement for theIL 53 Freeway/Tollway Alternative. Thetravel time savings ranges from 9 to24 percent with either alternative improvingtravel in each case. The IL 53Freeway/Tollway Alternative provides greaterbenefits to the western and central parts of thecounty than does the IL 83/US 45 with US 12Alternative. In eastern Lake County, the IL83/US 45 with US 12 Alternative improvestravel more, due to a concentration of roadwayimprovements along the IL 21 corridor andI-94.
3.6.3.3 Improve SafetyThe LCTIP developed a quantitative approachfor comparing the safety performance of theNo-Action (Baseline) and the buildalternatives (LCTIP 2000c). The safetyassessment was based upon past research offactors that influence crash rates(i.e., congestion, facility type, and accessconsiderations) and current crash trends inLake County. The crash rate factors werecombined with specific roadway data(i.e., geometrics and traffic volumes) topredict the number and types of crashes forvarious roadway types. Using the assembleddata, the analysis estimated the expected crashrate for the project alternatives. The findingsinclude:
• Despite an 8-percent higher VMT than theNo-Action Alternative (Baseline), the IL53 Freeway/Tollway Alternative isexpected to reduce the overall crash rateby 7 percent.
• Despite a 5-percent higher VMT than the No-Action Alternative (Baseline), theIL 83/US 45 with US 12 Alternative isexpected to reduce the crash rate by1 percent.
• The LCTIP safety assessment is intendedto be a relative comparison, rather than anabsolute prediction of accident experience.The results indicate that the IL 53Freeway/Tollway Alternative is attractingmore travel to safer facilities, and is
expected to have an overall crash rate thatis better than other alternatives.
3.6.3.4 Improve Modal ConnectionsBoth build alternatives have the capacity forimproving modal connections. Eachalternative would provide opportunities forimproving modal connections at the originsand destinations of modal travel.Recommendations that would improve modalconnections are:
• Improved parking at existing rail stationsto accommodate the additional rail patronsthat access the station by automobile.
• Transportation centers that provideimproved automobile access, andimproved linkages for bus-to-bus and bus-to-rail transfers.
• Improved bus service that providesenhanced service to rail stations, improvedservice between rail stations andemployment centers, and improvedservice to other major transportationfacilities (i.e., O’Hare InternationalAirport).
• Improved information messaging at keylocations (i.e., transportation centers) thatconvey information on transit schedulesand mode transfers and traffic signalpreemption giving priority to buses.
• Park-and-ride facilities at strategiclocations that allow people to drop offtheir cars and transfer to a bus system,carpool, vanpool, or even a commutertrain if nearby.
• Improved connection between existingand planned bicycle and pedestrian paths.
In summary, the IL 53 Freeway/TollwayAlternative would offer several opportunitiesalong each of its corridors for improved modalconnections. A new highway (IL 53Freeway/Tollway Alternative) offers strategiclocations (interchange locations) for park-and-ride facilities that represent natural collectionpoints for carpooling, vanpooling,express/trunkline bus services, and shuttle busservices to major employers. The IL 53

ALTERNATIVES
3-30
Freeway/Tollway Alternative would alsoprovide an opportunity for a newbicycle/pedestrian path along the facility withconnections to existing paths via local roads.
The IL 83/US 45 with US 12 Alternativewould offer a number of opportunities forimproved modal connections, such asimproved connection between existing andplanned bicycle and pedestrian paths, linkagesto existing and planned rail stations andtransportation centers, and for accommodationof bus routes.
3.7 SummaryThe LCTIP has implemented a structured,rigorous technical process for developing andevaluating a broad range of transportationalternatives. State-of-the art technical toolsand innovative techniques were used to definethe transportation problems and evaluatepotential solutions in a study area that spanshundreds of miles of roadways, three counties,70 communities and 500 square miles—to anequal level of detail. This effort has beensupported by extensive input from arearesidents, interested groups, agencies,transportation providers and elected officials.
The avoidance or minimization of impacts toenvironmental resources was a keyconsideration early and throughout theplanning process. The differences in impactsacross the suite of initial alternatives were notdistinguishing. As a result, the evaluationprocess focused upon travel performancemeasures, which were closely linked to theproject’s purpose and need. On the basis ofthis evaluation, the IL 53 Freeway/Tollway
Alternative and IL 83/US 45 with US 12alternative were selected as finalists. Thefinalists were then further refined, includingthe development of separate population,employment and travel demand forecasts foreach finalist and the No-Action Alternative(Baseline). These forecasts were used to morerigorously assess the alternative’s travelperformance, which are summarized in Table3-17. In addition to the roadway elements, acomprehensive package of supportingimprovements was developed, includingupgrades to rail and bus service, bike andpedestrian facilities, as well as travel demandmanagement and transportation systemmanagement strategies.
The environmental and societal impacts of thefinalist build alternatives and the No-ActionAlternative (Baseline) are comparativelyevaluated in Section 4, EnvironmentalConsequences, and a complete summary of theenvironmental consequences associated withthe alternatives is provided at the end of thesection.
TABLE 3-17Travel Performance Summary for Finalist Build Alternatives
Regional Local
AlternativeGeographic
AreaSystem
ContinuityLocalTrips
CountyRoutes
North-SouthUncongested Lane Miles Safety
IL 53 Freeway/Tollway ü ü ü ü üIL 83/US 45 with US 12 üA “ü” denotes the best performance by category.

4-1
SECTION 4
Environmental Consequences
This section describes the beneficial andadverse social, economic, and environmentaleffects of the project alternatives andmitigation measures that would minimizeharm. The information herein is intended toallow the reader to compare the environmentaland socioeconomic effects of the projectalternatives, including the No-ActionAlternative (Baseline), the IL 53Freeway/Tollway Alternative, and theIL 83/US 45 with US 12 Alternative.
The assessment of environmentalconsequences presented is based on the latestrefinements to the project alternatives. Thefinalist alternatives were developed at aconceptual level of detail using typical cross-sectional templates (Section 3, Alternatives).This detail is sufficient to compare the relativeenvironmental consequences of alternatives.Future phases of work for the preferredalternative would include the necessarydetailed engineering to support construction ofthe facility. During these phases, detailedenvironmental analyses would be performed.It is also anticipated that further considerationwould be given to avoiding and minimizingthe environmental consequences discussed inthis section.
The resource evaluations in this section reliedupon existing and available data, as well as dataderived from field reconnaissance for the areasaffected by the alternatives. Field verificationand enhancement of existing data wereundertaken for selected resources (e.g., wetlands,park boundaries, cultural resources, buildings) inan effort to refine data obtained from resourceagencies. Field verification of data, however,was not conducted for improvements under theNo-Action Alternative (Baseline). The No-Action Alternative (Baseline) is common to bothbuild alternatives, and so the effort required togather the additional detail would not aid in thedifferentiation of the environmentalconsequences between build alternatives. Theevaluation of the No-Action Alternative
(Baseline) addresses all the resource issues butrelies on existing and available data only.
The environmental consequences arepresented individually for each alternative(roadway improvements only). Theenvironmental effects of the supportingtransportation improvements (e.g., transit,transportation centers) are not considered inthis evaluation. Such improvements would becommon to the build alternatives, so theywould provide no distinguishing measure ofeffect for the alternatives under consideration.
4.1 SocioeconomicImpacts
4.1.1 Population and HouseholdsThe LCTIP took considerable steps to definethe impacts of transportation improvements onfuture population and employment growth.The methodology used for this analysis wasendorsed by the Northeastern Illinois PlanningCommission (NIPC). These populationforecasts show that Lake County is growingdespite a lack of major transportationimprovements; 280,000 more people areestimated to be in Lake County by 2020 underthe No-Action scenario.
Each project alternative would result inslightly different population and householdforecasts in 2020. Table 4-1 (on the followingpage) illustrates the population and householdchange associated with each alternative,including implementation of the supportingtransportation improvements (i.e., rail andbus). There is not a wide range of difference inthe forecast population or number ofhouseholds between the three alternatives—less than a 4 percent difference in population(3.7 percent for the IL 53 Freeway/TollwayAlternative, and 2.5 percent for theIL 83/US 45 with US 12 Alternative), and lessthan 4 percent difference in the number of

ENVIRONMENTAL CONSEQUENCES
4-2
households (3.8 percent for the IL 53Freeway/Tollway Alternative, and 2.6 percentfor the IL 83/US 45 with US 12 Alternative).
Taking a closer look at the population changeassociated with just the roadwayimprovements of each alternative, the IL 53Freeway/Tollway Alternative wouldcontribute 3.4 percent overall (27,500residents), and the IL 83/US 45 with US 12Alternative would contribute 2.2 percentoverall (18,000 residents; see Figure 4-1). Allthe forecasts show major population growth inthe central and western parts of the county.Further breakdown of these forecasts bytownship for each alternative is providedbelow and in Figure 4-2. Figure 4-3 illustratesthe change in number of households (bytownship) for each alternative.
4.1.1.1 No-Action Alternative (Baseline)Under the No-Action Alternative (Baseline),2020 population is forecast to increase by54 percent over the 1990 population of516,418 to 796,942 (ACG 1999); 2020households are forecast to increase 67 percentover 1990 households of 173,966 to
290,570 (ACG 1999). Ten townships wouldexperience an increase of more than 75 percentin the number of new residents and households(Fremont, Lake Villa, Wauconda, Antioch,Newport, Warren, Grant, Avon, and Cubatownships), predominantly in western andcentral Lake County. The forecast growthextends well-established trends in the centraland western parts of the county. Growth can beattributed to a number of factors, includingcommunity desires for population andeconomic growth, available land, reasonableland prices, and aesthetic factors (Table 4-2, onthe following page). Figure 4-4 illustrates thechange in population from 1990 to 2020 byNIPC analysis zone.
4.1.1.2 IL 53 Freeway/TollwayAlternative
Under the IL 53 Freeway/Tollway Alternative,2020 population in Lake County wouldincrease by 29,339,1 or 3.7 percent over the No-Action Alternative (Baseline) (from 796,942 to826,281); number of households wouldincrease by 10,962, or 3.8 percent (from290,570 to 301,532). The greatest populationand household increases from 1990 levels
1Includes the population effect of both the roadway andtransit (EJ&E) improvements.
TABLE 4-1Forecast Population and Household Growth for Each Alternative(includes contribution of supporting transportation improvements, such as rail, bus)
Population Households
Alternative 2020 Forecast % Change 2020 Forecast % Change
No-Action 796,942 — 290,570 —
IL 53 Freeway/Tollway 29,339 a 3.7 10,962 b 3.8
IL 53 Freeway/Tollway (roadway improvements only) 27,500 3.4 — —
IL 83/US 45 with US 12 19,968 a 2.5 7,639 b 2.6
IL 83/US 45 with US 12 (roadway improvements only) 18,000 2.2 — —
a Projected population increase from No-Action Alternative (Baseline). The population increase attributed to theroadway improvements is 27,500 for the IL 53 Freeway/Tollway Alternative and 18,000 for IL 83/US 45 withUS 12 Alternative. The remainder—2,000 people—is attributed to Elgin, Joliet, and Eastern commuter railimprovement.b Projected household increase from the No-Action Alternative (Baseline).Source: ACG 1999; CATS 1997a; ACG 2000

ENVIRONMENTAL CONSEQUENCES
4-3
generally would occur in the same townships asthe No-Action Alternative (Baseline)(Table 4-3, on the following page). Looking atthe change between this alternative and No-Action, additional population growth wouldoccur in the central townships of Fremont andWarren, and Shields Township along thenorthern shore under this alternative. FremontTownship would experience 14.7 percent of theadditional growth, Warren Township11.2 percent, and Shields Township10.7 percent. Figure 4-5 illustrates the 2020population effects of the IL 53
Freeway/Tollway Alternative by NIPC analysiszones.
4.1.1.3 IL 83/US 45 with US 12Alternative
Under the IL 83/US 45 with US 12Alternative, 2020 population is forecast toincrease by an additional 19,968,2 or2.5 percent over the No-Action Alternative(Baseline) (from 796,942 to 816,910);households are forecast to increase 2.6 percentover the No-Action Alternative (Baseline)(from 290,570 to 298,209). The greatest
2Includes the population effect of both roadway andtransit (EJ&E) improvements.
TABLE 4-2Population and Household Forecasts: No-Action Alternative (Baseline)
Population Households
Township1990
Census2020
ForecastChange
from 1990 % Change1990
Census2020
ForecastChange
from 1990 % Change
Antioch 18,046 37,571 19,525 108.2 6,846 14,961 8,115 118.5
Avon 35,989 65,780 29,791 82.8 11,846 24,103 12,257 103.5
Benton-Zion 35,590 49,427 13,837 38.9 11,888 17,578 5,690 47.9
Cuba 14,118 24,690 10,572 74.9 5,128 9,681 4,553 88.8
Deerfield-W. Deerfield 64,394 73,270 8,876 13.8 22,315 27,801 5,486 24.6
Ela 32,433 47,491 15,058 46.4 10,161 16,031 5,870 57.8
Fremont 14,280 43,069 28,789 201.6 4,699 15,599 10,900 232.0
Grant 14,423 26,388 11,965 83.0 5,465 10,687 5,222 95.6
Lake Villa 20,764 48,482 27,718 133.5 6,818 17,482 10,664 156.4
Libertyville 42,436 61,721 19,285 45.4 14,874 23,409 8,535 57.4
Newport 3,561 7,320 3,759 105.6 1,169 2,605 1,436 122.8
Shields 43,414 60,134 16,720 38.5 9,930 13,480 3,550 35.8
Vernon 51,141 68,087 16,946 33.1 17,571 25,459 7,888 44.9
Warren 34,785 71,030 36,245 104.2 13,049 28,715 15,666 120.1
Wauconda 12,859 27,474 14,615 113.7 4,610 10,821 6,211 134.7
Waukegan 78,185 85,008 6,823 8.7 27,597 32,160 4,563 16.5
Total 516,418 796,942 280,524 54.3 173,966 290,570 116,604 67.0
Sources: NIPC 1990; ACG 1999 (Note: Township values are rounded)

ENVIRONMENTAL CONSEQUENCES
4-4
population and household increases from1990 levels generally would occur in the sametownships as the No-Action Alternative(Baseline) (Table 4-4, on the following page).Looking at the change between this alternativeand the No-Action Alternative (Baseline),additional population growth would occur inthe central townships of Warren and Fremont,and Newport Township to the north. WarrenTownship would experience 11.8 percent ofthe additional growth, Fremont Township6.1 percent, and Newport Township5.7 percent. Figure 4-6 illustrates thepopulation effects of the IL 83/US 45 withUS 12 Alternative by NIPC analysis zones.
4.1.2 Community and Land UseChanges
Carefully planned roadway improvements canfoster beneficial results, such as making thecommunity more cohesive and serving futuregrowth and planning policies. Lack ofplanning for roadway improvements can bringundesirable effects to a community, includingfracturing community cohesion. Thediscussion below describes the potentialeffects of each alternative on communitycohesion and developable lands.
4.1.2.1 No-Action Alternative (Baseline)Under the No-Action Alternative (Baseline),improvements would traverse 30 communitieswithin Lake County (Figure 4-7). Generally,
TABLE 4-3Population and Household Forecasts, IL 53 Freeway/Tollway Alternative Change from No-Action Alternative (Baseline)(includes contribution of supporting transportation improvements such as rail, bus)
Population Households
Township1990
Census2020
ForecastChange from
No-Action%
Change1990
Census2020
ForecastChange from
No-Action%
Change
Antioch 18,046 39,007 1,436 3.8 6,846 15,682 721 4.8
Avon 35,989 68,108 2,328 3.5 11,846 25,232 1,129 4.7
Benton-Zion 35,590 51,587 2,160 4.4 11,888 18,479 901 5.1
Cuba 14,118 22,413 (2,277) (9.2) 5,128 8,750 (931) (9.6)
Deerfield-W. Deerfield 64,394 74,038 768 1.0 22,315 27,956 155 0.6
Ela 32,433 45,133 (2,358) (5.0) 10,161 15,255 (775) (4.8)
Fremont 14,280 49,418 6,350 14.7 4,699 18,018 2,419 15.5
Grant 14,423 26,543 155 0.6 5,465 10,912 225 2.1
Lake Villa 20,764 50,648 2,166 4.5 6,818 18,303 821 4.7
Libertyville 42,436 61,969 247 0.4 14,874 23,775 366 1.6
Newport 3,561 7,736 416 5.7 1,169 2,792 187 7.2
Shields 43,414 66,553 6,419 10.7 9,930 14,495 1,015 7.5
Vernon 51,141 69,059 972 1.4 17,571 25,824 365 1.4
Warren 34,785 78,986 7,956 11.2 13,049 32,325 3,611 12.6
Wauconda 12,859 27,636 162 0.6 4,610 10,891 70 0.6
Waukegan 78,185 87,446 2,438 2.9 27,597 32,844 684 2.1
Total 516,418 826,281 29,339 3.7 173,966 301,532 10,962 3.8
Sources: NIPC 1990; CATS 1997a (Note: Township values are rounded)

ENVIRONMENTAL CONSEQUENCES
4-5
the No-Action Alternative (Baseline) maintainsthe present roadway network and would notaffect community or neighborhood function.The existing roadway network would continueto define the circulation path for entering,leaving, and traveling within the communities.The edge of the roadway improvements wouldencroach on adjacent properties and in somecases would result in building displacement.The displacements would be scatteredthroughout the county; therefore, no substantivechange in the character of community buildingstock would occur. Road widening typicallywould maintain property access, but barriermedians would be installed as part of manyroadway improvements, requiring access to beconsolidated for some properties. For largercombined driveways and cross streets, a break
in the median would be provided to allow left-turn access.
The relation of transportation improvements toland use has been the topic of countlessresearch studies over the years. To determinehow this alternative may influence land usedecisions, the availability of developable lands(primarily agricultural lands) within 0.8 km(0.5 mi) of the improvements was used as anindicator of the potential for shifting growth.Properties directly adjacent to the proposedimprovements are already 62 percentdeveloped, but 2,580 ha (6,375 ac) of landwithin 0.8 km (0.5 mi) of the improvementsare undeveloped and potentially vulnerable todevelopment. Development in the vicinity ofthe No-Action Alternative (Baseline) isoccurring at a rapid pace. In the last 4 years,
TABLE 4-4Population and Household Forecasts, IL 83/US 45 with US 12 Alternative Change from No-Action Alternative (Baseline)(includes contribution of supporting transportation improvements, such as rail, bus)
Population Households
Township1990
Census2020
ForecastChange from
No-Action%
Change1990
Census2020
ForecastChange from
No-Action%
Change
Antioch 18,046 38,073 502 1.3 6,846 15,165 204 1.4
Avon 35,989 66,907 1,127 1.7 11,846 24,563 460 1.9
Benton-Zion 35,590 50,930 1,503 3.0 11,888 18,121 542 3.1
Cuba 14,118 24,653 (37) (0.2) 5,128 9,666 (15) (0.2)
Deerfield-W. Deerfield 64,394 73,207 (63) (0.1) 22,315 27,792 (9) 0.0
Ela 32,433 47,858 366 0.8 10,161 16,153 122 0.8
Fremont 14,280 45,702 2,634 6.1 4,699 16,560 962 6.2
Grant 14,423 26,447 60 0.2 5,465 10,743 56 0.5
Lake Villa 20,764 49,200 719 1.5 6,818 17,749 267 1.5
Libertyville 42,436 61,982 261 0.4 14,874 23,603 195 0.8
Newport 3,561 7,738 4187 5.7 1,169 2,755 150 5.8
Shields 43,414 62,051 1,918 3.2 9,930 13,925 445 3.3
Vernon 51,141 68,840 753 1.1 17,571 25,761 303 1.2
Warren 34,785 79,403 8,373 11.8 13,049 32,126 3,411 11.9
Wauconda 12,859 27,474 0 0.0 4,610 10,821 0 0.0
Waukegan 78,185 86,444 1,436 1.7 27,597 32,705 554 1.7
Total 516,418 816,910 19,968 2.5 173,966 298,209 7,640 2.6
Source: NIPC 1990; ACG 2000 (Note: Township values are rounded)

ENVIRONMENTAL CONSEQUENCES
4-6
344 ha (850 ac) of vacant land have beenconverted to development, representing a lossof about 1.4 percent of undeveloped land nearthe alternative improvements. Developmentpatterns also show that 99 percent of theundeveloped land in the No-Action influencezone is already bounded by development ofmore than 50 percent. This strongly suggeststhat most of the open lands near the No-ActionAlternative (Baseline) are vulnerable todevelopment for various reasons, includingtransportation improvements, and would not besustainable over the long term withoutrestrictive land use policies or outrightpurchase of development rights.
4.1.2.2 IL 53 Freeway/TollwayAlternative
This alternative would traverse15 communities (Figure 4-8). The proposal toextend IL 53 north and upgrade IL 120 hasbeen part of the region’s long-rangetransportation plan since 1960; therefore,many communities nearby have had theopportunity to consider and plan forcompatible land uses adjacent to the proposedfacility. The proposed alignment avoidscommunity centers that have an establishedsense of place and character. Most of thealignment runs through areas characterized aslarge lot residential development, particularlythe north-south segment of the alternative. Thealignment generally skirts establishedsubdivisions; however, in one case thealignment bisects several developments in theMundelein area. The right-of-way for thecorridor was purchased prior to the full buildout of these subdivisions, which has preservedand delineated the roadway footprint.Nonetheless, perceived loss of neighborhoodcohesion is likely if the roadway isconstructed.
A major transportation facility, such as theIL 53 Freeway/Tollway Alternative, representsa major new element for some communities incentral Lake County. New highway facilitiesalways raise the question of fit. In cases whereproperties are already developed adjacent tothe proposed improvement, facility designconsiderations could be developed to protect
these areas from typical highway relatedconcerns (i.e., noise and visual concerns).Design considerations could include noisebarriers, landscaping, landscape berms, bufferareas, and roadway lighting sensitive toadjacent land uses. In cases where adjacentlands are undeveloped, additional care shouldbe exercised in planning and zoning to providefor land use patterns that best coincide with amajor transportation facility. This couldinclude locating the most traffic intensive usesnear the corridor or at interchange locations,while the suburban land uses would extendaway from the corridor. With well-managedland use policy and plans, this alternativecould advantageously address existingdevelopment with sensitive design andaccommodate growth with qualitydevelopment.
About 35 percent of the land directly adjacentto the IL 53 Freeway/Tollway Alternative isdeveloped. Within 0.8 km (0.5 mi) of theseimprovements, there are 2,469 ha (6,100 ac) ofundeveloped land. About 10 percent of theselands are bounded by development by lessthan 50 percent and have the potential to besustained as open land over the long term. TheIL 53 Freeway/Tollway Alternative iscompletely within municipal planningboundaries. Similar to the No-ActionAlternative (Baseline), the remaining openlands would be vulnerable to development forvarious reasons other than transportation andwould not be sustainable in the future withoutrestrictive land use policies or outrightpurchase of development rights.
Another impact commonly associated with anew highway is the establishment of newborders that tend to define community orneighborhood edges. The perception of abarrier, however, would not alter travelpatterns on state, county, and town roadswithin the communities. The circulationpatterns on the roadway system would bevirtually unchanged for vehicles, bicycles,pedestrians, emergency services, and schoolbus routes. Major crossing routes would beserved with an interchange, and secondaryroutes would cross over or under the newfacility. Therefore, the existing roadway

ENVIRONMENTAL CONSEQUENCES
4-7
connectivity would still be present under thisalternative. In some instances, a few minorroads would be terminated to through travel atthe new roadway. Some minor inconveniencesin access would occur at the neighborhoodlevel, but in all cases the amount of adversetravel would be insignificant. Crossing roadimprovements are planned at all the majorinterchange locations. These improvementsmay alter access to businesses and homes nearthe interchange, permitting right-in and right-out turning movements only.
Changes in accessibility can cause advantagesand disadvantages. Advantages are conferred toparcels of land near interchanges, which “createunique accessibility and exposure advantages”for sites at interchanges (Downs 1969). TheIL 53 Freeway/ Tollway Alternative would bedesigned as an access-controlled facility withinterchanges at major crossing roads. Areasnear planned interchanges would become morevaluable for development because of improvedaccess and visibility (Downs 1969). Thisalternative would include 12 new interchanges,including Lake-Cook Road, IL 22, MidlothianRoad, Peterson Road, US 45, Hunt Club Road,Milwaukee Avenue, I-94, O’Plaine Road,Alleghany Road, Fairfield Road, and WilsonRoad. In each case, local municipalities havezoning that applies to the interchange locations.The predominant zoned land use is residential,which reflects current land use policy.
4.1.2.3 IL 83/US 45 with US 12Alternative
This alternative would be routed through21 communities (Figure 4-9). Theimprovements would be on both existing andnew alignment. The improvements followingexisting routes typically would have a 6-lanecross-section that would require considerabledisplacement of residential and commercialstructures. The existing character of thesecorridors can be expected to change withgreater build-out of development or differentland uses than already exists.
The IL 83/US 45 with US 12 Alternativewould cause only minor changes to propertyaccess along the improved routes. Over
70 percent of the improved routes would be onexisting roadways, and current property accesswould be generally provided with somemodifications including consolidating ingressand egress in areas of concentrateddevelopment and at intersections. Most majorroadway intersections would be at-gradeintersections with the exception of a newinterchange at IL 83 and IL 22. Intersectionswould be upgraded to accommodate highvolume turning movements. To maintainefficient traffic movement and operations atthe intersections, access control to nearbyproperties would be required consisting oflimiting the number of ingress and egresspoints, and limiting turning movements toright-in and right-out.
The IL 83/US 45 with US 12 Alternative has2,019 ha (4,990 ac) of undeveloped landwithin 0.8 km (0.5 mi) of the improvements.Because this alternative largely involvesimprovements to existing facilities there is asubstantial amount of existing development(about 56 percent) directly adjacent to theproposed improvements. Similarly, most ofthe developable lands (97 percent) within0.8 km (0.5 mi) of the improvements arealready surrounded by development, andwould be vulnerable to future development fora variety of reasons. It would be unlikely thatthese open lands would be sustainable withoutaggressive land use policies or outrightpurchase of development rights.
Bypasses were incorporated along US 45,IL 21, IL 60, and IL 120 to avoid communityimpacts to downtown Mundelein, downtownLibertyville, through the Diamond Lake area (aresidential area), and through a commercialcorridor in Grayslake. In all four of theselocations, through-town improvements weredetermined to be unfeasible because of thedisruption and change in character to the areasthat widening would cause. Bypasses wereselected that minimized displacements, whileproviding additional capacity to the system andhelping to relieve congestion on parallelexisting routes. The Mundelein bypass wouldshare the same alignment as the IL 53Freeway/Tollway Alternative north of IL 60.This area is characterized by large scattered

ENVIRONMENTAL CONSEQUENCES
4-8
subdivisions, some of which would betraversed by the bypass. Other subdivisionsnorth of this point would be traversed by thefacility causing proximity impacts. Asubdivision near the intersection of DiamondLake Road and IL 83 would also be traversedby the Mundelein bypass, requiring thedisplacement of many residences. Theproximity of the facility to the neighborhoodwould cause impacts that would be addressedwith facility design considerations. Anotherbypass is proposed around the downtown centerof Libertyville and would be routed alongSt. Mary’s road. The proposal includeswidening St. Mary’s road to a 4-lane facility(currently 2 lanes). This roadway improvementwould encroach upon adjacent properties and ina few cases would require buildingdisplacements. The extent of the improvements,however, would not materially alter theexpansive front yards characteristic of mostresidences. The presence of a wider roadwayfootprint in this area would result in theroadway being a more prominent feature in theneighborhood landscape, but neighborhoodcohesion would be unaffected—the presence ofa wider road would not change the functionalinteractions that occur in the corridor. A bypassof Grayslake would traverse severalsubdivisions that were laid out in recognition ofa future roadway.
4.1.3 Residential Relocations
4.1.3.1 No-Action Alternative (Baseline)Sixty-seven residences would be displacedunder the No-Action Alternative (Baseline)(Figure 4-10). Based on the 2020 No-ActionAlternative (Baseline) forecast, averagehousehold size of 2.74 in Lake County(derived from the No-Action Alternative(Baseline) 2020 population and householdforecasts), 184 residents would be relocated.
4.1.3.2 IL 53 Freeway/TollwayAlternative
One hundred thirteen residences and45 ancillary buildings (garages, sheds, etc.)would be displaced as a result of the IL 53Freeway/Tollway Alternative (Figure 4-11).
Of the residences affected, 85 buildings wouldbe single-family homes and 28 units would bein multi-family structures. Most of themulti-family impact occurs at Bourbon SquareTownhouses, located near IL 53, south ofLake-Cook Road in Palatine.
Most of the residences to be displaced wouldbe owner-occupied, as 74 percent of allhousing in the study area is owner-occupied.There is no shortage of replacement housingacross various price ranges in the study area,as evidenced by the residential developmentthat is occurring throughout the area. Based onthe 2020 IL 53 Freeway/Tollway Alternativeforecast, average household size of2.74 (derived from the IL 53 Freeway/TollwayAlternative 2020 population and householdforecasts), 310 residents would be relocated.
Acquisition, relocation activities, and benefitswould comply with provisions of the UniformRelocation Assistance and Real PropertyAcquisition Policies Act of 1970, as amended,and both the Illinois Department ofTransportation (IDOT) Land AcquisitionProcedures Manual, or the Illinois State TollHighway Authority (ISTHA) Guidelines forthe Reimbursement of Costs Incurred in theDisplacement of Residences and Businesses.Relocation resources are available to allrelocatees without discrimination.
4.1.3.3 IL 83/US 45 with US 12Alternative
One hundred eighty-seven residences and25 ancillary buildings (garages, sheds, etc.)would be displaced as a result of theIL 83/US 45 with US 12 Alternative(Figure 4-12). Of the residences affected,114 buildings would be single-family homes and73 units would be in multi-family structures.Most of the multi-family units are along US 12,south of Lake-Cook Road in Palatine.Complexes that would be affected include TurtleCreek Apartments, Port of Call Apartments,Kingsbrooke Townhomes, and Bourbon Square.
Under this alternative, about half of thedisplaced residences would be rental units andhalf owner-occupied housing. There is noshortage of replacement housing of either

ENVIRONMENTAL CONSEQUENCES
4-9
rental or owner-occupied units across variousprice ranges in the study area, as evidenced bythe residential development occurringthroughout the county. Based on the 2020IL 83/US 45 with US 12 Alternative forecast,average household size of 2.74 in LakeCounty (derived from the IL 83/US 45 withUS 12 Alternative 2020 population andhousehold forecasts), 512 residents would berelocated under this alternative.
Acquisition, relocation activities, and benefitswould comply with provisions of the UniformRelocation Assistance and Real PropertyAcquisition Policies Act of 1970, as amended,and the IDOT Land Acquisition ProceduresManual or the ISTHA Guidelines for theReimbursement of Costs Incurred in theDisplacement of Residences and Businesses.Relocation resources are available to allrelocatees without discrimination.
Table 4-5 summarizes the anticipatedresidences and ancillary buildings (garages,sheds, etc.) that would be displaced as a resulteach alternative.
4.1.4 Business Relocations
4.1.4.1 No-Action Alternative (Baseline)The No-Action Alternative (Baseline) woulddisplace 23 businesses (Figure 4-10).3
4.1.4.2 IL 53 Freeway/TollwayAlternative
The IL 53 Freeway/Tollway Alternative woulddisplace nine businesses (Figure 4-11). These
3No-Action Alternative (Baseline) business displacementswere not field verified as for the build alternatives,therefore no additional information is available on these23 businesses.
businesses include a mix of commercial, retailand recreational sites (Table 4-6, on thefollowing page). Roughly 178 employees areassociated with the displaced businesses,based on business type. Right-of-way wouldalso be required from an additional32 businesses for this alternative. Although109 parking spaces would be affected from6 of the 32 businesses, representing 21 percentof the total parking spaces available at thosebusinesses, there would be replacementparking available on the property or inimmediately adjacent areas. Therefore withreplacement parking the net impact to parkingwould be zero.
Certain types of businesses are more sensitiveto roadway location than others. Retailbusinesses and those dependent on accessibilityand high visibility are more directly affected bytheir physical proximity to a roadway. Someretail businesses are likely to develop nearinterchanges to serve travelers. Others mayrelocate to interchange areas from other areas inthe county. This is often interpreted as growth,but in many instances it amounts only to aredistribution of facilities.
The IL 53 extension provides improved accessand mobility to the area that, combined withthe appropriate utility infrastructure, couldattract business development. The IL 53Freeway/Tollway Alternative could also causesome minor changes in access for businesseslocated near cross road improvements. Medianbarriers and improved intersections wouldrestrict access, possibly requiring right-in,
TABLE 4-5Residential Relocation Summary
No-ActionIL 53
Freeway/TollwayIL 83/US 45with US 12
Residential Relocations (Additional Ancillary Outbuildingsassociated with Residential Relocations)
67 113 (45) 187 (25)

ENVIRONMENTAL CONSEQUENCES
4-10
right-out access in some locations.
4.1.4.3 IL 83/US 45 with US 12Alternative
The IL 83/US 45 with US 12 Alternativewould displace 113 commercial buildingscontaining 195 businesses (Figure 4-12). Thebusinesses include a mix of retail (restaurants,hardware stores, and gas stations), commercialoffice, and industrial (Table 4-7, on thefollowing page). Roughly 3,428 employeesassociated with the displaced businesses,based on business type.
Although buildings would not be impacted,right-of-way would also be required from anadditional 152 businesses along the alignment.Approximately 2,514 parking spaces would beimpacted at those businesses. This parkingrepresents 71 percent of the total parkingspaces available at those businesses. Most ofthis parking could be replaced on the propertyor in immediately adjacent areas. Only 258, or7.3 percent of the total spaces would bedisplaced.
Other impacts to businesses both adjacent toand near the proposed improvements couldinclude changes in access to property. Exceptfor improvements to I-94, the IL 83/US 45with US 12 improvements would result inupgraded arterial facilities (as opposed to afreeway or tollway facility). Barrier medians
are assumed along all arterials to be improved,whether 4-lane or 6-lane. Access would beconsolidated where possible. For large,combined driveways and cross streets, a breakin the median generally would be provided toallow for left-turn access. However, mostindividual parcels could not be given a medianbreak and would be limited to right-in, right-out access. U-turns would need to beaccommodated at many intersections, resultingin adverse travel for property owners andbusiness patrons.
4.1.5 EmploymentFigure 4-13 compares the employmentincreases for the No-Action Alternative(Baseline), IL 53 Freeway/Tollway, andIL 83/US 45 with US 12 Alternatives.
4.1.5.1 No-Action Alternative (Baseline)Under the No-Action Alternative (Baseline),employment is forecast to grow by160,939 between 1990 and 2020, or 70 percent(Table 4-8, on page 4-12). The greatestemployment growth, in terms of increase inthe total number of employees, is expected tooccur in Vernon, Warren, and Libertyvilletownships (in central Lake County) as well asin Deerfield and West Deerfield townships,
TABLE 4-6Displaced Businesses, IL 53 Freeway/Tollway Alternative
Road
Number ofDisplaced Structures by Business
TypeEstimated Number of Employees Associated
with the Displaced Businessa
IL 120 1 equestrian stable 9
IL 120 1 nursery 17
IL 120 1 school bus service 38
IL 120 1 golf driving range 9
IL 53 (feeder) 1 auto sales 21
IL 53 2 retail sale 50
IL 53 2 nurseries 34
Total 9 178
aSource: Trip Generation Manual (6th ed.), Institute of Transportation Engineers 1997.

ENVIRONMENTAL CONSEQUENCES
4-11
TABLE 4-7Displaced Businesses, IL 83/US 45 with US 12 Alternative
RoadNumber of Displaced Structures
by Business TypeEstimated Number of Employees
Associated with the Displaced Business*
2 retail sales 50IL 120 (both mainline andfeeder road impacts) 1 gas station 5
1 strip mall 50
1 nursery 17
1 school bus service 38
1 church 11
8 restaurants 200IL 21 (both mainline andfeeder road impacts) 2 banks 32
3 commercial offices 519
2 hotels 24
10 retail sales 250
1 corner grocery store 10
2 medical offices 78
6 gas stations 30
1 fast food restaurant 20
2 recreation/cultural center office 18
2 strip malls 100
5 restaurants 125IL 83/US 45 (both mainlineand feeder road impacts) 2 banks 32
2 commercial offices 346
1 hotels 12
8 retail sales 200
1 corner grocery store 10
2 medical offices 78
5 gas stations 25
2 auto repair 10
5 fast food restaurant 100
1 nursery 17
1 auto sales 21
2 strip malls 100
2 building materials/storage 28
6 restaurants 150US 12 (both mainline andfeeder road impacts) 2 commercial offices 346
1 hotels 12
3 retail sales 75
5 gas stations 25
3 auto repair 15
1 auto sales 21
4 strip malls 200
1 entertainment 14
2 building materials/storage 14
Total 113 3,428
*Source: Trip Generation Manual (6th ed.), Institute of Transportation Engineers 1997

ENVIRONMENTAL CONSEQUENCES
4-12
located southeast Lake County. Thesetownships enjoy good access to I-94 and havebeen where the majority of employers havelocated over the past 30 years. In terms ofgreatest percent increase, Fremont township isforecast to increase by 386 percent (anadditional 12,784 employees).
4.1.5.2 IL 53 Freeway/TollwayAlternative
Under the IL 53 Freeway/Tollway Alternative,total employment in Lake County wouldincrease to 393,989, an increase of165,383 over 1990 levels. This is an increase of4,444 jobs over the No-Action Alternative(Baseline) (Table 4-9, on the following page).The pattern of new job growth from 1990conditions is similar to that under the No-Action Alternative (Baseline); Vernon, Warren,Libertyville and Deerfield/West Deerfieldtownships would see the greatest number ofnew jobs. Looking at the percent change
between this alternative and the No-ActionAlternative (Baseline), this alternative wouldprovide additional employment growth in thesouthern townships of Vernon and Ela, andFremont township in central Lake County.Vernon township would experience 5.3 percentadditional growth, and Fremont and Elatownships would experience 4.5 percent.Figure -14 illustrates the employment effects ofthe IL 53 Freeway/Tollway Alternative byNIPC analysis zones.
4.1.5.3 IL 83/US 45 with US 12Alternative
Under the IL 83/US 45 with US 12Alternative, there would be 393,746 jobs inLake County in 2020, an increase of165,040 jobs over 1990 levels (Table 4-10, onthe following page). This represents anincrease of 4,201 jobs over the No-ActionAlternative (Baseline). The pattern of wherenew job growth would occur from
TABLE 4-8Employment Forecast, No-Action Alternative (Baseline)
Township 1990 2020 Forecast Change from 1990 % Change
Antioch 4,561 8,826 4,265 93.5
Avon 8,609 17,354 8,745 101.6
Benton-Zion 6,436 10,721 4,285 66.6
Cuba 9,323 11,224 1,901 20.4
Deerfield-W. Deerfield 34,693 49,946 15,253 44.0
Ela 13,718 24,496 10,778 78.6
Fremont 3,312 16,096 12,784 386.0
Grant 3,688 4,847 1,159 31.4
Lake Villa 2,968 7,622 4,654 156.8
Libertyville 38,021 56,498 18,477 48.6
Newport 966 2,924 1,958 202.7
Shields 20,346 24,250 3,904 19.2
Vernon 28,028 65,924 37,896 135.2
Warren 17,599 42,647 25,048 142.3
Wauconda 4,297 8,974 4,677 108.9
Waukegan 32,041 37,196 5,155 16.1
Total 228,606 389,545 160,939 70.4
Sources: NIPC 1990; ACG 1999 (Note: Township values are rounded)

ENVIRONMENTAL CONSEQUENCES
4-13
TABLE 4-9Employment Forecast, IL 53 Freeway/Tollway Alternative
Township 1990 Population 2020 Forecast Change from No-Action Alternative % Change
Antioch 4,561 8,395 (431) (4.9)
Avon 8,609 17,557 203 1.2
Benton-Zion 6,436 10,918 196 1.8
Cuba 9,323 11,606 382 3.4
Deerfield-W. Deerfield 34,693 49,990 44 0.1
Ela 13,718 25,596 1,100 4.5
Fremont 3,312 16,826 730 4.5
Grant 3,688 5,015 169 3.5
Lake Villa 2,968 7,534 (89) (1.2)
Libertyville 38,021 55,661 (837) (1.5)
Newport 966 2,927 3 0.1
Shields 20,346 24,173 (77) (0.3)
Vernon 28,028 69,406 3,482 5.3
Warren 17,599 41,975 (672) (1.6)
Wauconda 4,297 9,181 207 2.3
Waukegan 32,041 37,229 33 0.1
Total 228,606 393,989 4,444 1.1
Sources: NIPC 1990; CATS 1997a (Note: Township values are rounded)
TABLE 4-10Employment Forecast, IL 83/US 45 with US 12 Alternative
Township 1990 Population 2020 Forecast Change from No-Action Alternative % Change
Antioch 4,561 8,718 (108) (1.2)
Avon 8,609 17,362 8 0.0
Benton-Zion 6,436 10,850 128 1.2
Cuba 9,323 11,574 350 3.1
Deerfield-W. Deerfield 34,693 49,946 0 0.0
Ela 13,718 25,271 775 3.2
Fremont 3,312 16,398 303 1.9
Grant 3,688 4,907 61 1.3
Lake Villa 2,968 7,576 (47) (0.6)
Libertyville 38,021 57,721 1,222 2.2
Newport 966 2,924 0 0.0
Shields 20,346 24,489 239 1.0
Vernon 28,028 66,309 385 0.6
Warren 17,599 43,467 820 1.9
Wauconda 4,297 9,039 65 0.7
Waukegan 32,041 37,196 0 0.0
Total 228,606 393,746 4,200 1.1
Sources: NIPC 1990; ACG 2000 (Note: Township values are rounded)

ENVIRONMENTAL CONSEQUENCES
4-14
1990 conditions is similar to that under theNo-Action Alternative (Baseline). Vernon,Libertyville, Warren, and Deerfield/WestDeerfield townships would see the greatestnumber of new jobs. Looking at the percentchange between this alternative and the No-Action Alternative (Baseline), this alternativewould provide additional employment growthin the southern townships of Ela and Cuba. ElaTownship would experience 3.2 percentadditional growth, and Cuba township wouldexperience 3.1 percent. Figure 4-15 illustratesthe employment effects of the IL 83/US 45with US 12 Alternative by NIPC analysiszones.
4.1.6 Tax RevenuesA short-term tax revenue loss in the regionwill result from converting taxable land into anontaxable transportation use. To evaluate taxlosses, information was obtained from theLake County Tax Assessor’s office. Values ofthe taxable properties to be acquired for right-of-way were estimated and separated intocommercial and residential when possible dueto different tax rates. This assessment includedthe value of land and improvements to theland (i.e., structures on the property).
Table 4-11 summarizes the results of thisanalysis.
The tax loss analysis shows that annualassessed value losses are estimated to be0.20 percent for the No-Action Alternative(Baseline), 0.30 percent for the IL 53Freeway/Tollway Alternative, and0.47 percent for the IL 83/US 45 withUS 12 Alternative. The potential loss for anyalternative would be less than 0.50 percent, soit is likely that no taxing district would suffer a
loss greater than 10 percent of its current taxbase.
New development resulting from improvedaccessibility provided by the project may beadded to the tax rolls. This could result in anincrease in assessed valuation because of thenew development and an overall increase intotal taxes collected. In addition, an increase intax revenues may result from an increase inproperty values due to the improvedaccessibility provided by either buildalternative.
4.1.7 Environmental Justice4.1.7.1 Racial, Ethnic, and Low-Income
GroupsThis section describes the potential fordisproportionate impacts to low-income andminority populations that could occur with theproject alternatives. The assessment included atechnical analyses to determine potentialeffects and the use of public involvementactivities that included all residents andpopulation groups in the study process. It didnot exclude any person based on income, race,color, religion, national origin, sex, age, orhandicap. For each alternative, the influencearea is defined by the census tracts borderingthe proposed improvements. Adisproportionate impact to these populationsexists when they bear more than their “fairshare.” Compared to the general population, itwas determined that there would be nodisproportionate impact to low-incomepopulations (in accordance with Health andHuman Services Poverty Guidelines) orminority populations within the influence areaof the alternatives.
TABLE 4-11Estimated Tax Loss Summary, by Alternative
AlternativeAssessed Value in 1998
(Lake County)Portion Convertedto Nontaxable Use
Percent of Total AssessedValue Converted
No-Action $16.1 billion $32.2 million 0.20
IL 53 Freeway/Tollway $16.1 billion $48.2 million 0.30
IL 83/US 45 with US 12 $16.1 billion $76.1 million 0.47

ENVIRONMENTAL CONSEQUENCES
4-15
No-Action Alternative (Baseline).The detailed analysis of the project influencearea for the No-Action Alternative (Baseline)showed no disproportionate impact to low-income and minority populations. The analysisshowed that the median household income inthe influence area was $57,000 or 25 percentgreater than the countywide median householdincome ($46,047). Additionally, theexamination of minority populations showedthat only 8 percent of the population in theinfluence area is minority, well below thecountywide average of 12.6 percent.
Further analysis show isolated areas ofminority populations in Gurnee/Waukegan,Mundelein/Vernon Hills and Buffalo Grove.The census information shows that at theblock group level, the potential exists fordirect impact to minority populations in theGurnee/ Waukegan area near Martin LutherKing Road and IL 131, in the Mundelein/Vernon Hills area near Butterfield Road andIL 60, and near Lake-Cook Road and US 45.Any displacement to residential or businesseswould be small.
IL 53 Freeway/Tollway Alternative.The detailed analysis of the project influencearea for the IL 53 Freeway/TollwayAlternative showed no disproportionateimpact to low-income and minoritypopulations. The analysis showed that themedian household income in the influencearea was $49,279 or 7 percent greater than thecountywide median household income($46,047). Additionally, the examination ofminority populations showed that only6 percent of the population in the influencearea is minority, well below the countyaverage of 12.6 percent.
Further analysis of this alternative showedisolated areas of minority populations inGurnee/Waukegan. Taking a closer at thecensus information, at the block group level,there would be the potential for direct impactto minority populations in the Gurnee/Waukegan area near IL 120 and O’PlaineRoad. Any displacement to residential orbusinesses would be small.
IL 83/US 45 with US 12 Alternative.The detailed analysis of the project influencearea for the IL 83/US 45 with US 12Alternative showed no disproportionateimpact to low-income and minoritypopulations. The analysis showed that themedian household income in the influencearea was $58,374 or 27 percent greater thanthe countywide median household income($46,047). Additionally, the examination ofminority populations showed that only6 percent of the population in the influencearea is minority, well below the countywideaverage of 12.6 percent.
Further analysis show isolated areas ofminority populations in Mundelein/VernonHills. The census information at the blockgroup level shows the potential exists fordirect impact to minority populations in theMundelein/Vernon Hills area near IL 60 andIL 83, and IL 60 and US 45. Any displacementto residential or businesses would be small.
4.1.7.2 Summary of EnvironmentalJustice
An assessment of environmental justice alsoincludes considerations of other factors suchas environmental health effects of air andnoise pollution upon low-income and minoritypopulations. The air quality analysis(Section 4.4, Air Quality) showed that none ofthe project alternatives would causeexceedances of national ambient air qualitystandard for carbon monoxide. The noiseanalysis (Section 4.5, Noise) showed that, forall alternatives near the minority populationsdiscussed above, the potential exists for noisevolumes either approaching or exceeding theNoise Abatement Criteria (NAC) forresidential areas. Noise abatement measures atthose locations and others will be consideredin the analysis of the preferred alternative.
In summary, no disproportionately high oradverse impacts on minority and low-incomepopulations would result from any alternative.

ENVIRONMENTAL CONSEQUENCES
4-16
4.1.8 Public Services andFacilities
4.1.8.1 No-Action Alternative (Baseline)The No-Action Alternative (Baseline) wouldnot affect municipal or public facilities inLake County, nor would it provide distinctopportunities for facility enhancements.
4.1.8.2 IL 53 Freeway/TollwayAlternative
The IL 53 Freeway/Tollway Alternative wouldhave minimal affect upon public servicefacilities. The Church of the Nazarene wouldlose about 2 percent of its parking with thisalternative. The church is located inMundelein on the east side of the proposedIL 53 alignment and on the south side ofIL 176 (Maple Street). Sufficient parkingwould remain for typical church activities.Other facilities, such as wastewater treatmentplants, schools, municipal buildings, andhospitals, would not be affected.
The alternatives would provide numerousopportunities for new bicycle travel. Inclusionof a new bicycle/pedestrian path along theproposed improvements would provide directand indirect connections to existing pathsincluding the Robert McClory Path and theDes Plaines River Trail. Potential connectionsbetween a new bicycle/pedestrian path wouldbe considered for rail stations and employmentcenters. Candidate facilities near the projectalternative are Grayslake and PrairieCrossing/Libertyville rail stations, andbusiness centers such as Kemper Insurance,Motorola, and Baxter Healthcare. Thepromotion of nonmotorized travel for worktrips would improve traffic operations to aminor degree.
4.1.8.3 IL 83/US 45 withUS 12 Alternative
This alternative would affect nine publicfacilities. As many as five buildings may bedisplaced by this alternative, and fouradditional facilities would lose some parkingarea as a result of the proposed improvements.
The Lord of Glory Church is located west ofAlleghany Road on the south side of IL 120and serves the community of Grayslake.Widening of IL 120 would require removal ofthe facility. The church would need to berelocated within the area.
A building associated with the GraingerWoods Forest Preserve near Mettawa wouldlikely be displaced. The building is located onthe east side of St. Mary’s Road south ofIL 60. The building is associated with a publicstable operation. Loss of the building wouldrequire consultation and coordination with theLake County Forest Preserve under Section4(f) requirements (Section 4.8, Section 4(f)Considerations).
Two IDOT buildings would be displaced. Themaintenance yard on the south side of US 12east of Ela Road in Lake Zurich would losefrontage as well as at least one building (shed).The IDOT maintenance facility on the eastside of US 45 near the IL 60 intersection inMundelein would be displaced as a result ofintersection improvements.
The David Adler Cultural Center at 1700 N.Milwaukee in Libertyville, south of IL 137 onthe east side of IL 21, would be displaced. Thefacility provides music lessons and art classesto the community.
Four public facilities would lose some parkingas a result of the improvements for thisalternative. The Congregation Beth JudeaSchool, located north of Hilltop Road on theeast side of IL 83 in Long Grove, would lose10 percent of its parking area. The LakeCounty Juvenile Justice Center on the east sideof IL 21 north of Woodbine Court in VernonHills would lose about 5 percent of itsavailable parking to the right-of-way neededfor the proposed improvements. The AdlerPark School would lose 4 percent of itsparking, and the Church of the Nazarenewould lose a few parking spaces.
This alternative offers the potential forenhancements to nonmotorized travel. Theplanned cross section for the arterialimprovements include sufficient right-of-wayfor bicycle and pedestrian paths. The addition

ENVIRONMENTAL CONSEQUENCES
4-17
of paths along the planned improvementswould provide direct and indirect connectionwith four major trail systems: Des PlainesRiver Trail, Robert McClory Path, the SkokieValley Trail, and the Green Bay Trail.Improved connections to other activity nodesalso would be possible, including rail stationsand employment centers. Direct connectionsto rail stations on the North Central Linewould include Buffalo Grove, Prairie View,Vernon Hills, and Libertyville. Thesenonmotorized improvements would relievetraffic operation to a minor degree.
4.1.8.4 Summary of SocioeconomicImpacts
Population forecasts show that Lake County isgrowing substantially without majortransportation improvements. Under the No-Action Alternative (Baseline), 280,000 peoplewould be estimated to be added to Lake Countyby 2020, mostly in the central and western partsof the county. The IL 53 Freeway/TollwayAlternative would bring an additional27,500 residents to the county over the No-Action Alternative (Baseline).4 These additionalresidents are anticipated to locate mostly in thecentral part of the county (Figures 4-2 and 4-4).The IL 83/US 45 with US 12 Alternative wouldbring an additional 18,000 residents over the No-Action Alternative (Baseline). This growthwould occur in the same general areas as withIL 53 Freeway/Tollway Alternative (Figures 4-2and 4-5), predominantly in the central part of thecounty.
The migration of jobs to areas like Lake Countyis consistent with manufacturing and businessinterest in locations where an abundance ofland is available, obtainable in large parcels,and relatively inexpensive. Similar to theforecast population growth, regional planningagencies estimate Lake County’s employmentto continue to increase, mostly in the southernand central parts of the county (Figure 4-13).By 2020, under the No-Action Alternative(Baseline), Lake County is forecast to have
4The Elgin, Joliet and Eastern Railroad improved isanticipated to increase population by an additional 2,000residents for both the IL 53 Freeway/Tollway Alternativeand the IL 83/US 45 with US 12 Alternative.
390,000 jobs. This means that, with no majortransportation improvements, Lake County’semployment will increase by 70 percent(161,000 jobs) over 1990 levels. With both theIL 83/US 45 with US 12 and IL 53Freeway/Tollway Alternatives, Lake County isanticipated to have 394,000 jobs—a 72 percentincrease over 1990 (between 4,200 and4,400 additional jobs over the No-ActionAlternative (Baseline)).
The analysis of minority or low-incomepopulations for the project alternatives showthat no environmental justice issue exists, andthus no further analysis or mitigation isrequired. The public involvement activities forthis process included all residents andpopulation groups in the study area, and didnot exclude any persons based on income,race, color, religion, national origin, sex, age,or handicap.
All alternatives would require relocations, withIL 83/US 45 with US 12 having the greatestwith 195 business and 187 residences(Table 4-12, on the following page). LakeCounty has a full complement of housing andbusiness stock. In 1990, the overall vacancyrate for residential housing in Lake County was51 percent (Lake County Department ofPlanning, Zoning & Environmental Quality1994). The IL 83/US 45 with US 12 Alternativewould displace nine public services andfacilities, and the No-Action Alternative(Baseline) and IL 53 Freeway/TollwayAlternatives would affect none. Conversion ofland to public roadway would remove taxableproperty from the tax roles. Table 4-12 lists theestimated assessed value lost for eachalternative.
4.2 Agricultural ImpactsThis section highlights the major agriculturaleffects that could occur from theimplementation of the project alternativesincluding farmland losses, impacts to specialstatus farmland or farms, farm productionlosses, and impacts to farm operations.
Coordination with the Illinois Department ofAgriculture was conducted to determine

ENVIRONMENTAL CONSEQUENCES
4-18
potential effects to prime farmlands, as well asspecial farmland types such as farmland oflocal importance, farmland protected under theIllinois Farmland Preservation Act, andCentennial Farms. Coordination with theNatural Resource Conservation Service(NRCS) is required only for agriculturalimpacts that occur outside the “official”planning area for incorporated municipalities(2.4 km or 1.5 mi), and for agriculturalimpacts that are expected to be greater than1.2 ha per 1.6 km (3.0 ac per 1 mi).
Factors that may adversely affect theefficiency of farming operations include thefollowing:
• Severed Farm Operation—Occurs whena new highway/roadway separates one ormore parcels from others within a unit,often resulting in adverse travel for thefarm operators.
• Severed Parcel—Unit of land severeddiagonally or laterally by a new highway.
• Farmer Adverse Travel—Length ofadditional travel that a farm operator orowner must undertake to get to fields or
roads. Often caused by severance of afarm unit.
• Landlocked Parcel—Parcel created bythe taking of right-of-way for roadconstruction such that it is not accessibleby road or easement after construction.
• Farm Displacement—Farmhouses andother buildings may need to be displacedto accommodate the newhighway/roadway.
Farmland impacts were determined using theland use data from the LCTIP GIS database.The land use data were provided by NIPC(1990) and updated using 1997 aerialphotography. Further updates wereconsidered, using the State Cropland Layers(USDA 1999–2000). A comparison of the1997 and 2000 data showed only minordifferences; therefore, the 1997 update wasused for this analysis. The assessment ofprime farmland used 1993 soil data compiledby the Natural Resources ConservationService (USDA). An assessment of effects oneroded soils was also conducted using the1993 soil data. The results of this assessmentare contained in Section 4.3.1, Geology, Soils,
TABLE 4-12Socioeconomic Summary
No-ActionIL 53
Freeway/TollwayIL 83/US 45with US 12
Population 2020 Forecast 796,942 29,339 19,968
(Contribution of Roadway Improvements Only to BuildAlternative Forecasts)*
— 27,500 18,000
Households 2020 Forecast 290,570 10,962 7,640
Employment 2020 Forecast 389,545 4,444 4,200
Residential Relocations (Additional Ancillary Outbuildingsassociated with Residential Relocations)
67 113 (45) 187 (25)
Business Relocations 23 9 195
Number of Employees NA 178 3,428
Parking Impacts (# of displaced parking spaces) NA 109 (0) 2,514 (258)
Public Facility Relocations 0 0 9
Percent of Total Assessed Value Converted to Non-Taxable Use 0.20 0.30 0.47
*The remainder—about 2,000 people—is attributed to Elgin, Joliet and Eastern commuter rail improvement.

ENVIRONMENTAL CONSEQUENCES
4-19
and Mineral Resources. The prime farmlandand eroded soil impacts discussed above wereassessed for the build alternatives only.
The potential for the project alternatives toinfluence growth and development is oftenreferred to as a secondary impact stemmingfrom infrastructure improvements. As newdevelopment expands to vacant lands withinthe county, farmlands most often areimpacted. Although better transportation is notthe predominant reason for advancingdevelopment in Lake County, it does have arole in some development decisions. Ananalysis of secondary impacts to farmlands isincluded in Section 4.11, Secondary andCumulative Impacts.
4.2.1 No-Action Alternative(Baseline)
4.2.1.1 Direct Farmland ImpactsAbout 32 ha (80 ac) of agricultural land inLake County would be directly affected by theNo-Action Alternative (Baseline). Table 4-13provides a breakdown of agricultural impactsby roadway improvement for the No-ActionAlternative (Baseline). Roughly 85 percent ofthe affected farmland is “prime”; the balance isclassified as “important.” More than half of theaffected farm parcels would involve smallimpacts of less than 0.4 ha (1 ac). Over90 percent of the farmland impacts areassociated with the proposed improvements toIL 21, Peterson Road, Rollins Road, Bradley
Road, Midlothian Road, and WashingtonStreet. Compared to the total availablefarmland in the county, the No-ActionAlternative (Baseline) would affect less than0.1 percent of those lands. The affectedfarmland for this alternative would be entirelywithin a municipal planning boundary andaverage less than 0.28 ha per project km(1.1 ac per mi). Therefore, NRCS coordinationand submittal of form AD-1006 would not berequired.
A review of the Illinois Department ofAgriculture records show that there are nineCentennial Farms within Lake County. The No-Action Alternative (Baseline) would impactland from two Centennial Farms: the LodeskyFarm located on Washington Street and theCasey Farm located on IL 21. The LodeskyFarm has been in the family for over 150 years,and the present size of the farm is about 40 ha(100 ac). The No-Action improvements alongWashington Street would requireapproximately 0.5 ha (1.3 ac) from the Lodeskyproperty. The Casey Farm located inLibertyville is currently about 12 ha (30 ac) insize. The improvement to IL 21 in this locationwould require approximately 0.8 ha (2 ac) fromthe farm.
4.2.1.2 Farm Production LossesThe displaced farmland for the No-ActionAlternative (Baseline) would result in an annualcrop production loss of approximately $21,000.Table 4-14 (on the following page) provides a
TABLE 4-13Agricultural Areas Directly Affected by No-Action Alternative (Baseline)
RouteApproximate Agricultural
Land Directly Affected RouteApproximate Agricultural
Land Directly Affected
Buffalo Grove Road 0.16 ha 0.4 ac Lake-Cook Road 0.36 ha 0.9 ac
Busch Parkway 0.4 ha 1.0 ac Bradley Road 4.3 ha 10.6 ac
Butterfield Road 0.2 ha 0.5 ac Midlothian Road 2.75 ha 6.8 ac
Hunt Club Road 0.24 ha 0.6 ac Casmir Pulaski Drive 0.24 ha 0.6 ac
I-94 0.24 ha 0.6 ac Peterson Road 3.7 ha 9.2 ac
IL 21 7.4 ha 18.2 ac Quentin Road 0.12 ha 0.3 ac
IL 22 2.3 ha 5.8 ac Rollins Road 4.1 ha 10.0 ac
IL 60 0.04 ha 0.1 ac US 45 2.4 ha 6.0 ac
Washington Street 3.4 ha 8.5 ac Total 32.4 ha 80.1 ac

ENVIRONMENTAL CONSEQUENCES
4-20
breakdown of the amount of farmland affectedby this alternative and the resulting farmproduction loss. The primary crops are corn(70 percent), soybeans (22 percent), wheat(6 percent), and other specialty farms (2 percent)such as landscape nurseries and apple orchards.
4.2.1.3 Farm OperationsThe No-Action Alternative (Baseline) wouldhave minimal effect on farm operations.Generally, the roadway improvements followexisting rights-of-way; therefore, farmseverance and disrupted access to fields areminimized by the use of existing rights-of-way. The actual impacts to farms, parcels,building displacement, and uneconomicalremnants were not calculated for the No-Action Alternative (Baseline). The use ofmedians with multi-lane improvements wouldcause some adverse travel of about 1.6 km(1 mi) or less.
4.2.2 IL 53 Freeway/TollwayAlternative
4.2.2.1 Direct Farmland ImpactsApproximately 316 ha (780 ac) of agriculturalland in Lake County would be directly affected
by the IL 53 Freeway/Tollway Alternative.Table 4-15 summarizes the farmland impactsfor this alternative. The impact to farmlands isassociated directly with improvements locatedprimarily on new alignment. The data showsthat the impacts would be distributed evenlyacross the two major roadway improvements.Similar to the other alternatives, the IL 53Freeway/Tollway Alternative would affectmostly prime farmlands (about 77 percent), thebalance being classified as important. Overall,this alternative would directly affect 1.3 percentof the county’s available farmland. Based on anIllinois Department of Agriculture recordssearch, the IL 53 Freeway/ Tollway Alternativewould not affect any special status farmlands(i.e., Centennial Farms) (TY Lin Bascor 2000).
This alternative affects approximately 7 ha perproject kilometer (29 ac per mile). Whereas allof the affected farmlands for this alternativeare located within a municipal planning area,the NRCS would have no requirements forcoordination. Therefore, NRCS coordinationand submission of form AD-1006 would notbe required.
4.2.2.2 Farm Production LossesApproximately 315 ha per kilometer (780 ac)
TABLE 4-14Crops and Market Value Affected by No-Action Alternative (Baseline)Agricultural Lands in Productiona 15,800 ha (39,100 ac)
Affected Agricultural Lands 32.4 ha (80.1 ac)
Total Market Value (2000)a, b $10,293,000
Market Value of Affected Landsc $21,000aSource: Illinois Department of Agriculture 2001
bIncludes all crops and livestock, as well as specialty crops such as
landscape nurseries, apple orchards, etc.cPer 0.4 ha (1 acre) loss is $260.00
TABLE 4-15Agricultural Areas Directly Affected by IL 53 Freeway/Tollway Alternative
RouteApproximate Agricultural Land
Directly Affected
IL 120 147.5 ha (364.6 ac)
IL 53 167.9 ha (415.0 ac)
Total 315.4 ha (779.6 ac)

ENVIRONMENTAL CONSEQUENCES
4-21
of productive farmland would be lost with theIL 53 Freeway/Tollway Alternative. Thisrepresents an annual production loss ofapproximately $205,000. Table 4-16 providesa breakdown of the amount of land affected bythe improvements and resulting farmproduction loss.
4.2.2.3 Farm OperationsThe IL 53 Freeway/Tollway Alternative wouldsever about 36 farm parcels, potentiallyaffecting farm operations with landlockedparcels, adverse travel, and angular shapes.This alternative would displace 12 farmresidences and 31 farm outbuildings. Over80 percent of the displaced are located alongthe east-west improvement paralleling IL 120.
4.2.3 IL 83/US 45 with US 12Alternative
4.2.3.1 Direct Farmland ImpactsApproximately 91 ha (226 ac) of farmland inLake County would be directly affected by theIL 83/US 45 with US 12 Alternative.Table 4-17 provides a detailed breakdown ofthe farmland impacts for this alternative.Similar to the other alternatives, theIL 83/US 45 with US 12 Alternative wouldimpact farmlands that are mostly classified asprime (about 82 percent), and remainingaffected farmlands are classified as important.The data shows (Table 4-17) that twoimprovements account for over 80 percent ofthe farmland impact from this alternative.Overall, this alternative would directly impact
TABLE 4-16Crops and Market Value Affected by IL 53 Freeway/Tollway Alternative
Agricultural Lands in Productiona 15,800 ha (39,100 ac)
Affected Agricultural Lands 315.4 ha (779.6 ac)
Total Market Value (2000)a, b $10,293,000
Market Value of Affected Landsc $205,000aSource: Illinois Department of Agriculture 2001
bIncludes all crops and livestock, as well as specialty crops
such as landscape nurseries, apple orchards, etc.cPer 0.4 ha (1 acre) loss is $260.00
TABLE 4-17Agricultural Areas Directly Affected by IL 83/US 45 with US 12 Alternative
RouteApproximate Agricultural Land Directly
Affected
I-94 2.3 ha (5.6 ac)
IL 120 21.9 ha (54.0 ac)
IL 21 10.8 ha (26.8 ac)
IL 60 1.7 ha (4.2 ac)
IL 83/US 45 54.1 ha (133.7 ac)
US 12 0.65 ha (1.6 ac)
Total 91.4 ha (225.9 ac)

ENVIRONMENTAL CONSEQUENCES
4-22
about 0.5 percent of the county’s availablefarmlands.
This alternative would have an averagefarmland impact of 0.9 ha per projectkilometer (3.6 ac per mile). The affectedfarmlands would all be within a municipalplanning area; therefore, NRCS coordinationand form AD-1006 would not be required.
Illinois Department of Agriculture recordsshow that the IL 83/US 45 with US 12Alternative would potentially impact landfrom one Centennial Farm (IDOA 2000). Theimprovement on IL 21 would require about0.4 ha (1 ac) of right-of-way from the CaseyFarm in Libertyville. The farm has been in theCasey family for over 130 years and thecurrent size is about 12 ha (30 ac).
4.2.3.2 Farm Production LossesApproximately 91 ha (226 ac) of productivefarmland would be lost with the IL 83/US 45with US 12 Alternative. This represents an
annual production loss of about $59,300.Table 4-18 summarizes the amount of landaffected by the improvements and resultingfarm production loss.
4.2.3.3 Farm OperationsSince most of the improvements are alongexisting right-of-way, operational impacts areexpected to be moderate. About 20 parcelswould be severed diagonally or laterally,potentially affecting farm operations withlandlocked parcels, adverse travel, and angularshapes. This alternative would displace threeresidences and seven outbuildings. Alldisplacements would occur along IL 21.
4.2.4 Summary of AgriculturalImpacts
Table 4-19 summarizes the breakdown of theagricultural impacts by alternative.
TABLE 4-18Crops and Market Value Affected by IL 83/US 45 with US 12 Alternative
Agricultural Lands in Productiona 15,800 ha (39,100 ac)
Affected Agricultural Lands 91.4 ha (225.9 ac)
Total Market Value (2000)a, b $10,293,000
Market Value of Affected Farmlandc $59,300aSource: Illinois Department of Agriculture 2001
bIncludes all crops and livestock, as well as specialty crops such
as landscape nurseries, apple orchards, etc.cPer 0.4 ha (1 acre) loss is $260.00
TABLE 4-19Summary of Agricultural Impacts
Type of ImpactNo-Action Alternative
(Baseline)IL 53 Freeway/Tollway
AlternativeIL 83/US 45 with US 12
Alternative
Ha (ac) of Impact 32 ha(80 ac)
315 ha(780 ac)
91 ha(226 ac)
Annual Crop Losses $21,000 $205,000 $59,300
Annual Acreage Losses $260 $260 $260
Parcels Affected or Severed NA 36 20
Centennial Farms 9 0 1
% Impact of Prime/Important 85 / 15 77 / 23 82 / 18
Farm Buildings Displaced NA 43 10

ENVIRONMENTAL CONSEQUENCES
4-23
4.3 Natural Resources
4.3.1 Geology, Soils, and MineralResources
The project alternatives are not expected toaffect bedrock. Some impact to surface geologyand topography would be expected duringconstruction, including excavating, grading, andfilling over the near-surface deposits. Theseeffects would include changes to surface soils inthe construction zone that would increase soilcompaction and effectively decrease hydraulicconductivity. Construction would also decreasethe erosion resistance of soils with the removalof vegetation. Erosion resistance will bemitigated during construction and thenrestored through appropriate revegetation andgrading.
The erosion potential of soils for the buildalternatives were evaluated using the NRCS1993 soils data. Soil associations along theimprovements for each alternative wereidentified and the erosion potential determinedfrom tables contained within the soil survey.
Two soil associations are found in the IL 53Freeway/Tollway Alternative—the Elliot-Markham and Morley-Markham-Houghton.The Markham, Morley, Nappannee,Montmorenci, Zurich, and Saylesville soils inthese associations are moderately to stronglysloping. The soils consist primarily of siltloams. These eroded soils exist along18 percent or 8 km (5 mi) of the 43.5 km(27 mi) of improvements. Additional soils inthese series, although not noted as eroded,pose an erosion hazard. Specific locations ofsoils with higher erosion hazards would beidentified to mitigate erosion during and afterconstruction. The other soils in theassociations are gently sloping to level andpose limited erosion hazard.
The same two soil associations are also foundin the IL 83/US 45 with US 12 Alternative.Additional soil associations found in thisalternative including the Montmorenci,Corwin-Odell, Zurich-Grays-Wauconda, andNappanee-Montgomery. The Miami,Montmorenci, Wauconda, Saylesville, and
Zurich soils are all silt loams that aremoderately to steeply sloping. The soils allhave high erosion potential. The eroded soilsexist along 17 percent or 15.3 km (9.5 mi) of101.4 (63 mi) of improvements. Additionalsoils in these series, although not noted aseroded, pose an erosion hazard. Specificlocations of soils with higher erosion hazardswould be identified to mitigate erosion duringand after construction. The other soils in theassociations are gently sloping to level andpose limited erosion hazard.
No operating mineral/material resourcebusinesses would be affected by the projectalternatives. A nonoperational sand and graveloperation lies near the intersection of IL 21and IL 120, and project alternatives couldaffect this resource. The site’s proximity toplanned roadway improvements could causethe site to be reactivated and also provide alow-cost source of needed sand and gravelresources. Overall the project could increaseshort-term demand and sales for theseproducts within Lake County during theconstruction phase. Consequently, thisresource could be depleted. Upon completionof construction, demand and sales would beexpected to return to previous levels.
4.3.2 Water Quality and WaterResources
4.3.2.1 Groundwater Resource ImpactsThis analysis focuses upon potential effects ofthe project alternatives to municipal andprivate water supplies. According to theUSEPA web site (as of February 1, 2001),there are no sole source aquifers as defined bysection 1424(E) of the Safe Drinking WaterAct in Illinois. No measurable change to theavailable groundwater supply is expected forany of the project alternatives; the additionalimpervious area associated with the projectalternatives would represent a small reductionin recharge area that will be mitigated bystormwater retention/detention basins.
Although roadways are not considered asource for groundwater contamination, thoseitems that are sources are required to be at

ENVIRONMENTAL CONSEQUENCES
4-24
least 61 meters (200 ft) away from a wellhead, the distance used as a surrogate forimpact evaluation. The well location from allof the listed databases is only accurate to aquarter-quarter section. Therefore the well canbe located anywhere within a 40 acre tract.Wells within 61 m (200 ft) of the proposedproject alternatives were identified and areshown in Table 4-20. The well locationinformation was assembled using the ISGSdatabase, the LCTIP GIS database, the IEPAdatabase, and reports from the Illinois StateWater Survey (ISWS) to pinpoint the locationof residential well systems. The IL 83/US 45with US 12 Alternative has more homesassociated with private wells within 61 m(200 ft) of the proposed improvements thanthe other alternatives. There are no municipalwells within 122 m (400 ft) used for municipalwells for the build alternatives, and only twomunicipal wells for the No-Action Alternative(Baseline). The wells are either used regularlyas a water supply or standby supply forcommunities that purchase surface water fortheir customers.
Municipal and private wells near the proposedproject alternatives were identified as having apotential risk for contamination from roadwayrunoff. The potential for contaminatinggroundwater supply wells is dependent uponwell construction, proximity to potentialsources, and geological conditions. TheIllinois Groundwater Protection Act providesguidelines and regulations pertaining toprotective setbacks from groundwater wells.Consistent with these guidelines andregulations, communities in the study areahave established either 61 or 122 m (200 or400 ft) setback zones for potentialcontamination sources that could affect thequality of groundwater wells. Geologic
conditions also represent an important factorthat can either prohibit or permit the transferof contaminants. Wells founded in rockformations usually are more restrictive to thetransfer of surface contaminants than wellsfounded in sand and gravel formations, suchas in west central Lake County.
Groundwater quality for municipal wells is notlikely to be affected measurably by any of theproject alternatives. One municipal wellwithin 122 m (400 ft) of the No-ActionAlternative (Baseline) is finished in the driftmaterial. The IEPA database indicates thiswell has few limitations, or in other words, haslow susceptibility to surface contaminationbased upon the composition of the surficialgeology. The other well is finished in dolomiteor a limestone formation that minimizes thetransfer of surface contaminants. None of theproject alternatives are located withinwellhead protection areas identified by theIEPA (1998). Private wells are associated withresidential subdivisions or individualproperties and typically are finished in glacialdrift (sand and gravel) at depths of 30.5 m(100 ft) or less. Shallow wells within 61 m(200 ft), of the roadway improvements that areimproperly cased or hydraulically connectedto the highway drainage system couldexperience increased levels of roadway runoffcontaminants. Roadway improvements nearshallow wells would use best managementpractices (BMPs) to avoid well interference.
All the project alternatives have severalgroundwater wells near them. This assessmentprovides a general measure of the potential forgroundwater contamination from roadwayrunoff. Presumably, the risk for wellcontamination is greater for those alternativeswith the largest number of wells near the
TABLE 4-20Summary of Potential Water Well Impacts
AlternativePrivateWells
Municipal SystemsUsing Wells
No-Action 220 2
IL 53 Freeway/Tollway 247 0
IL 83/US 45 with US 12 783 0

ENVIRONMENTAL CONSEQUENCES
4-25
proposed improvements (i.e., the IL 83/US 45with US 12 Alternative). Further investigationsare required during future phases of work forthe preferred alternative to define moreaccurately the potential risk of wellcontamination.
Other areas of potential concern relate togroundwater discharge points associated withsensitive wetland areas, such as fens. Changesin groundwater elevation or quality couldaffect these sensitive resources. These types ofassessments would be made during futurephases of work for the preferred alternativeand would require further definition of theroadway design and the use of groundwatermodels to properly assess the effects to suchresources.
4.3.2.2 Surface Water ImpactsLong-term surface water impacts could resultfrom the operation of the project alternatives.Pollutants, such as solids, heavy metals (lead,zinc, and copper), and oil and grease,accumulate on roadway surfaces and adjoiningrights-of-way as a result of motor vehicleoperations on the roadway. Additionally,deicing chemicals and nutrients fromfertilizers commonly are found in roadwayrunoff. The concentrations of these pollutantsin roadway runoff are highly variable and areaffected by numerous factors, such as trafficcharacteristics (volume and speed), climate,maintenance practices, and adjacent land uses.
Roadway runoff may affect the quality ofreceiving waters with a temporary increase inpollutant loading during storms or with achronic accumulation of heavy metals. Thedegree of pollutant loading from roadwayrunoff is linked directly to the amount ofroadway traffic. Research has shown that thewater quality from roadway runoff is notproblematic for roadways with an AverageDaily Traffic (ADT) volume of 30,000 vehiclesper day or less (Young 1996). Under theseconditions, potential impacts are generallyshort-term, localized acute loadings with atemporary degradation of water quality withfew, if any, chronic effects.
Deicing salt is applied seasonally to controlsnow and ice. Deicing salt provides publicmobility and safety by rapidly and reliablyimproving hazardous road conditions in winter.Salt moves through the environment as runoff,splash, and spray. Studies indicate that 60 to80 percent of the salt runs into surface water,15 to 35 percent occurs as splash, and up to3 percent occurs as spray (Frost et al. 1981;Diment et al. 1973; Lipka and Aulenbach 1976;and Sucoff 1975).
Changes in chloride and heavy metalsconcentrations as a result of roadwayoperations were compared to the General Usewater quality standards. The average andmaximum concentrations in each stream wereestimated utilizing methods developed by theU.S. Geological Survey (Driver and Tasker1990 and Frost et al. 1981) and the FederalHighway Administration (FHWA; Driscoll etal. 1990a, 1990b, 1990c).
No-Action Alternative (Baseline). There are 11subwatersheds associated with the No-ActionAlternative (Baseline): nine in the Des PlainesRiver Watershed and two in the Fox RiverWatershed. Tables 2-19 and Table 2-20present the physical and biologicalcharacteristics of these streams.
Pollutant concentrations and habitatmodifications have affected the water quality ofthe streams in these watersheds. According tothe IEPA, water quality is good in Mill Creek,Bull Creek, and Flint Creek, whereas in theremaining streams in the study area it is fair topoor, or unrated. The Des Plaines River is aSection 303(d) water quality impaired stream.
Future stream concentrations of copper, leadand zinc for 11 subwatersheds would satisfyapplicable General Use water quality standards.The analysis shows that the maximum chlorideconcentrations expected with the No-ActionAlternative (Baseline) would be compliant withthe General Use standards.
IL 53 Freeway/Tollway Alternative. There areseven subwatersheds in IL 53Freeway/Tollway Alternative: five in the DesPlaines River Watershed and two in the FoxRiver Watershed. Many of these streams are
ENVIRONMENTAL CONSEQUENCES
4-26
the same as for the No-Action Alternative(Baseline). Tables 2-19 and 2-20 summarizethe physical and biological characteristics ofthese streams. Water quality in Mill Creek andBull Creek is good, but fair to poor (orunrated) in the remaining streams. Pollutantconcentrations and habitat modifications haveprevented the remaining streams, including theDes Plaines River—a Section 303(d) waterquality impaired stream—from providing fullaquatic support.
Analysis of the pollutant loading for sevensubwatersheds affected by the IL 53Freeway/Tollway Alternative showed onlysmall incremental changes in heavy metalconcentrations. All stream concentrations forzinc, copper, and lead are less than theapplicable General Use standards. Theanalysis showed that the average andmaximum chloride concentrations wouldremain below the General Use standards forall subwatersheds affected by this alternative.Chloride concentrations in the Bull Creek andMill Creek watersheds were estimated to bethe highest. Even the maximum values,however, would be compliant with the GeneralUse standard.
IL 83/US 45 with US 12 Alternative. There are11 subwatersheds associated with thisalternative: 7 in the Des Plaines RiverWatershed and 4 in the Fox River Watershed.The only highly valued aquatic resource isassociated with Squaw Creek. Water qualityfor Mill, Bull, and Flint creeks is rated goodby IEPA, but other streams in the study areaare fair to poor. The Des Plaines River is theonly water quality impaired Section 303(d)stream in the study area.
Analysis of the pollutant loading for the11 subwatersheds affected by the IL 83/US 45with US 12 Alternative showed only smallincremental changes in heavy metalconcentrations. All stream concentrations forzinc, copper, and lead are below the applicableGeneral Use and water quality standards.Chloride concentrations are not expected toincrease to levels exceeding the General Usestandards in any of the subwatersheds, exceptfor Aptakisic Creek. The average chloride
concentration is not expected to exceed thewater quality standard; however, themaximum predicted chloride level may exceedthe 500 mg/L standard for chloride.Exceedances would occur in a small area ofthe watershed, and mitigation measures orchanges in drainage patterns could reduce theimpact.
4.3.2.3 Summary of Water QualityImpacts
Potential changes in groundwater or surfacewater quality as a result of roadway operationwere evaluated. The potential impact onresidences that rely on wells would be greatestwith the IL 83/US 45 with US 12 Alternative.Two municipal wells are closer to the No-Action Alternative (Baseline), but the geologyassociated with those wells should minimizeany potential impact.
Stream concentrations of heavy metals willincrease, but they will remain compliant withapplicable water quality standards for all threescenarios. BMPs incorporated into the projectwould further reduce these concentrations.
The chloride concentrations in the tributariesfor the various project alternatives are expectedto increase, but such increases would notviolate the General Uses standards in mostwatershed areas. Impacts from chlorides wouldnot be a concern for either the IL 53Freeway/Tollway or No-Action Alternative(Baseline). With the IL 83/US 45 with US 12Alternative, a small part of Aptakisic Creekwould experience an exceedance of the chloridestandard. Studies of salt effects on aquaticbiota, including acute and chronic toxicity,indicate that salt does not have significantdeleterious impacts on aquatic biota in large orflowing bodies of water where dilution occursquickly (Jones and Jeffrey 1992). Peakconcentrations in small streams can be reducedby using detention basins.
4.3.3 WetlandsThis wetland impacts discussion addresses directimpacts for the project alternatives. Availablewetland mapping and the latest aerialphotography were combined with field

ENVIRONMENTAL CONSEQUENCES
4-27
reconnaissance to confirm the presence ofwetland resources in the study area. Wetlandresources in Lake County were obtained fromthe LCWI and incorporated into an overallGIS database. The verification procedure waslimited to the areas adjacent to the proposedand existing right-of-way for the two buildalternatives. Field observations were used tonote adjacent land use, general wetland type,and overall quality based upon dominantvegetation. 5 The potential wetland impacts forthe alternatives describe the extent of thewetland area impacted, the effect on wetlandfunction, and the status of the remnant wetlandfollowing implementation (i.e., for bisectedwetlands).
The first order of assessment utilized the GISdatabase, which incorporated data from theLCWI, including ADID wetlands. All threealternatives were reviewed to determinepotential impacts to both ADID designatedand non-ADID wetlands for each corridor.These data are reported in the first part of thissection.
The information supplied by the LCWI andADID lacked the information necessary todetermine wetland quality. The second orderof assessment provided a qualitativeassessment of wetlands, both ADID and non-ADID based on information gathered duringthe field verifications. As no field verificationswere conducted for the No-Action Alternative,the qualitative assessment is limited to the twobuild alternatives. However, environmentaldocuments for programmed improvementswhich have completed phase one of theenvironmental document for the No-ActionAlternative (Baseline) were reviewed for thewetland impacts.
The qualitative functional assessment assignedquality rankings to each of the wetlandsidentified in the field. As a result, anassessment of qualitative impacts for the twobuild alternatives could be compiled. This
5 Each wetland identified in the field was assigned aunique value, prefaced by the route designate (i.e., 45-1=Wetland #1, US 45). The wetlands were numberedsequentially as they were encountered in the field.
qualitative impact assessment is presented inthe second part of this section.
Formal delineations would be conductedduring future phases of work for the preferredalternative to determine exact size, functions,vegetation communities, and qualitativeassessments of wetlands within the proposedright-of-way.
4.3.3.1 ADID/Non-ADID WetlandImpacts
No-Action Alternative (Baseline)The No-Action Alternative (Baseline) wouldpotentially impact approximately 31.6 ha(78.1 ac) of both ADID and non-ADIDwetlands (CH2M HILL 1999; GIS database).The estimated loss of wetland resources isbased upon the proposed right-of-wayrequirements for all individual projectscomprising the No-Action Alternative(Baseline).
ADID Wetlands. The No-Action Alternative(Baseline) would potentially impactapproximately 5.3 ha (12.9 ac) of ADIDwetlands.6 The proposed improvements to LakeCook Road, Pulaski Road and IL 22 wouldhave the largest impact to ADID wetlands.Combined, these three improvements accountfor approximately 75 percent of the ADIDwetland impacts for the No-Action Alternative(Baseline). See Figure 4-16. The ADID impactsresulting from this alternative total 0.09 percentof the total ADID wetland acreage in LakeCounty (203 total ADID wetlands totaling5,585 ha (13,800 ac) in Lake County).Table 4-21 (on the following page) summarizesthe ADID impacts for each roadwayimprovement under the No-Action Alternative(Baseline).
Non-ADID Wetlands. The No-ActionAlternative (Baseline) would potentially impactapproximately 26.5 ha (65.2 ac) of non-ADID
6 Wetland impacts for the No-Action Alternative (Baseline)were estimated using typical project right-of-way widthsfor the proposed improvements. No field verifications wereconducted in connection with the No-Actionimprovements, therefore, the total number of wetlandsand wetland acreage impact is an estimate based on thebest available data.

ENVIRONMENTAL CONSEQUENCES
4-28
TABLE 4-21Potential ADID Impacts for the No-Action Alternative (Baseline)
RoadwaySegment
ADIDDescription
ADID Sizeha (ac)
Potential ADIDImpact ha (ac) % Impacted
ADID Functions Identified byLake County ADID Study Impacts
• Shoreline/Bank Stabilization Minimal• Sediment/ Toxicant Trapping Minimal
ButterfieldRoad
ADID 113 37.6 (92.9) 0.3 (0.8) 0.8
• Nutrient Removal Minimal
• Threatened & EndangeredSpecies Habitat
Minimal
• Sediment-toxicant retention Minimal• Stormwater storage Minimal
ADID 94LibertyPrairie
55.4 (137.0) < 0.01 --
• High Quality Plant Community Minimal
• High quality stream Minimal• Stormwater storage Minimal
ADID 96Tributary toBull Creek
6.4 (15.9) 0.15 (0.4) 2.3
• Sediment-Toxicant Retention Minimal
• Threatened & EndangeredSpecies Habitat
Loss ofHabitat
• Stormwater storage Loss ofstoragecapability
IL 21
ADID 106Bull Creek
0.6 (1.6) 0.4 (0.9) 66.7
• Sediment/toxicant retention Loss ofRetention
ADID 168 2.3 (5.6) 0.02 (0.05) 0.8 • High Quality Wildlife Habitat Minimal Lossof habitat
ADID 169 17.2 (42.4) 0.9 (2.1) 5.2 • Presence of T&E PlantSpecies
Potential lossof supportinghabitat
• Threatened & EndangeredSpecies Habitat
Minimal
• Shoreline-bank stabilization Minimal• Sediment-toxicant retention Minimal
ADID 170Reed-TurnerNaturePreserve a
87.9 (217.3) 0.6 (1.4) 0.6
• Nutrient removal and transport Minimal• Shoreline/Bank Stabilization Minimal• Sediment/ Toxicant Trapping Minimal
ADID 173Flint Creek
54.3 (134.1) 0.06 (0.2) 0.11
• Nutrient Removal Minimal• Presence of T&E Plant
SpeciesMinimal Lossof Habitat
• Stormwater Storage Minimal
IL 22
ADID 175 30.8 (76.1) 0.6 (1.4) 1.9
• Sediment/ Toxicant Trapping Minimal
• High Quality Plant Community Loss ofHabitat
• Stormwater Storage Loss ofstorage
Lake CookRoad
ADID 187 3.8 (9.5) 0.8 (1.9) 21.1
• Sediment/ Toxicant Trapping Loss ofretention
• High Quality Plant Community Minimal lossof Habitat
PulaskiRoad
ADID 91 49.4 (122.0) 1.1 (2.7) 2.2
• Sediment/toxicant retention Minimalretention loss
• Presence of T&E PlantSpecies
Minimal
• INAI Site Minimal
• High Quality Plant Community Minimal• Shoreline/Bank Stabilization Minimal• Sediment/ Toxicant Trapping Minimal
ADID 44FourthLake/ MillCreekComplex
313.9(775.7)
0.4 (1.0) 0.13
• Nutrient Removal Minimal• High Quality Plant Community Minimal• Stormwater Storage Minimal
RollinsRoad
ADID 61RollinsSavanna
5.7 (14.2) 0.01(0.03) 0.17
• Sediment/ Toxicant Trapping Minimal
TOTAL 665.3(1,644.3)
5.3 (12.9) 0.8
a Identified as the Reed Turner Nature Preserve ADID site. Nature Preserve not impacted.

ENVIRONMENTAL CONSEQUENCES
4-29
wetlands based on the LCWI. Table 4-22summarizes the potential impacts for eachroadway improvement for the No-ActionAlternative (Baseline).
Most of the potentially impacted non-ADIDwetlands are located in the Des Plaines RiverWatershed. Only wetland impacts associatedwith improvements along the western portionsof IL 22 and Peterson Road are located in theFox River Watershed. Field reconnaissancewas not conducted for wetlands under thisalternative; therefore, no assessment ofquality, size, and function for these wetlands isavailable. Based on available data, wetlandimpacts are concentrated along four of theproposed improvements. The proposedimprovements to IL 22, I-94, Buffalo GroveRoad and US 45 would have the potential toimpact about 18.4 ha (45.5 ac) of wetlands,totaling approximately 70 percent of allwetland impacts for this alternative.
IL 53 Freeway/Tollway AlternativeThe IL 53 Freeway/Tollway Alternative wouldpotentially impact 118 wetland sites totalingapproximately 37.1 ha (91.8 ac). Figure 4-17shows the location of ADID and non-ADIDwetlands potentially impacted by thisalternative. The estimated potential direct lossof these wetland resources is based upon theright-of-way requirements for the IL 53Freeway/Tollway Alternative. Detaileddiscussions of ADID and non-ADID impactsfollow.
ADID Wetlands. Five ADID wetlands totalingapproximately 3.5 ha (8.6 ac) (CH2M HILL1999; GIS database) within the Des PlainesRiver Watershed would potentially be directlyimpacted by the IL 53 Freeway/TollwayAlternative. These ADID wetlands aregenerally located in the north-south segmentof the alternative with one ADID wetlandalong the east-west segment (IL 120). TheADID wetland impacts from this alternativewould total less than 0.06 percent of the totalADID wetland acreage in the county(presently there are 203 designated ADIDwetlands in the county totaling 5,585 ha(13,800 ac)). The IL 53 Freeway/TollwayAlternative would transversely cross twoADID wetland/stream complexes. TheseADID wetland resources are ADID number170 (Wetland Number 53-19) and ADIDNumber 143 (Wetland Numbers 53-43, 53-67,83-19, and 83-40). Because both of theseADID complexes are linear, the IL 53alignment would bridge these locations toavoid fragmentation, thereby minimizingimpacts in these areas to shading and limitedfilling. Bridging these areas would avoidimpacts to natural stream flow and habitatcontinuity that could occur with an at-gradefacility. Table 4-23 (on the following page)summarizes the potential direct impacts toADID wetlands for the IL 53 Alternative.Appendix D shows the comparison of ADIDwetland impacts for the three alternatives, andgives a detailed description of the ADID
TABLE 4-22No-Action Alternative (Baseline) Scenario; Potential Non-ADID Wetland Impacts
Roadway Segment Potential Wetland Impacts Roadway Segment Potential Wetland Impacts
Buffalo Grove Road 2.4 ha (5.9 ac) Martin Luther King Road 0.3 ha (0. 7 ac)
Busch Parkway 0.6 ha (1.4 ac) Bradley Road (new) 1.5 ha (3.7 ac)
Butterfield Road 0.2 ha (0.6 ac) Midlothian Road (new) 0.1 ha (0.1 ac)
Hunt Club Road 0.3 ha (0.7 ac) Pulaski Road (new) 0.1 ha (0.2 ac)
I-94 5.1 ha (12.6 ac) Peterson Road 0.3 ha (0.7 ac)
IL 21 0.6 ha (1.4 ac) Quentin Road 1.2 ha (3.0 ac)
IL 22 9.2 ha (22.7 ac) Rollins Road 0.8 ha (2 ac)
IL 60 0.4 ha (1.1 ac) US 45 1.7 ha (4.3 ac)
Lake-Cook Road 0.5 ha (1.2 ac) Washington Street 1.2 ha (2.9 ac)
TOTAL 26.4 ha (65.2 ac)
CH2M HILL 1999, LCTIP GIS Database.

ENVIRONMENTAL CONSEQUENCES
4-30
wetlands and their potential impacts fromconstruction.
In addition to direct impacts caused by filling oralteration, minimal functional loss of wetlandresources is anticipated. Table 4-23 summarizesthe potential impacts to wetland functions fromthis alternative. All five ADID wetlandsimpacted by this alternative would incurminimal loss of wildlife habitat. Additionalfunctional impacts such as shoreline
stabilization, sediment/toxicant trapping, andnutrient removal are considered to arise to alesser extent. ADID wetland 180 would loseapproximately 3 percent of its overall size. Thiscontributes to slightly higher levels offunctional impact, and to loss of habitat inparticular.
Non-ADID Wetlands. The 113 non-ADIDwetlands potentially impacted by the IL 53Alternative total approximately 34 ha (83.2 ac)
TABLE 4-23IL 53 Freeway/Tollway ADID Impact Summary a
Route ADID DescriptionADID Size
ha (Ac)
PotentialADID
Impactha (Ac)
%Impacted
ADID Functions Identified byLake County ADID Study
Impacts toFunctions
CommunityType
• Threatened & EndangeredSpecies Habitat
Some Loss ofHabitat
• Shoreline-bank stabilization Some loss of bankstabilization
IL 53 ADID 143Indian Creek/KildeerCreekLCTIP Nos. 53-43, 53-67, 83-19, 83-40
63.0 (155.6) 0.7 (1.6) 1.1
• Sediment/toxicant retention Some Loss ofsediment /toxicantretention
SedgeMeadow
EmergentMarsh
IL 53 ADID 169LCTIP 53-21, 53-22
42.4(104.8)
0.3 (0.62) 0.7 • Threatened & Endangered SpeciesHabitat
Minimal Loss ofHabitat
SedgeMeadow
• Threatened & Endangered SpeciesHabitat
Minimal Loss ofHabitat
• Shoreline-bank stabilization Minimal
• Sediment-toxicant retention Minimal
IL 53 ADID 170Reed-Turner NaturePreserve b
LCTIP 53-19
87.8 (217.0) 0.2 (0.5) 0.2
• Nutrient removal and transport Minimal
SedgeMeadow
• Threatened & Endangered SpeciesHabitat
Some Loss ofHabitat
• Shoreline-bank stabilization Some Loss of bankstabilization
• Sediment-toxicant retention Some Loss ofsediment /toxicantretention
IL 53 ADID 180Buffalo CreekComplexLCTIP Nos. 53-7,53-8, 53-11
63.5 (157.0) 2.2 (5.4) 3.5
• Nutrient removal and transport Some Loss ofnutrientremoval/transport
SedgeMeadow
Emergentmarsh
• Threatened & Endangered SpeciesHabitat
Minimal Loss ofHabitat
• Shoreline-bank stabilization Minimal
IL 120 ADID 200LCTIP 120-4
7.4 (18.3) 0.1 (0.3) 1.4
• Sediment/toxicant retention Minimal
Deep Marsh
Total 264.1(652.7)
3.5 (8.4) 1.3
a Lake County ADID Studyb Identified as the Reed Turner Nature Preserve ADID site. Nature Preserve not impacted.

ENVIRONMENTAL CONSEQUENCES
4-31
(CH2M HILL 1999; GIS database). Thesewetlands are a mixture of open marsh,emergent, or forested wetlands. A majority ofthe wetlands identified within this alternativewere located along the existing IL 53 right-of-way. A more detailed assessment of wetlandimpacts is presented in Section 4.3.3.2.
IL 83/US 45 with US 12 AlternativeThe IL 83/US 45 with US 12 Alternativewould impact 196 wetland sites with apotential direct impact to approximately23.4 ha (57.7 ac) of wetlands (CH2M HILL1999; GIS database). Figure 4-18 shows thelocation of ADID and non-ADID wetlandspotentially impacted by this alternative.
ADID Wetlands. Thirteen ADID wetland sites,all within the Des Plaines River Watershed,would potentially be impacted by thisalternative, totaling approximately 1.7 ha(4.2 ac) or less than 0.03 percent of the totalADID wetland acreage in Lake County, 5,585 ha(13,800 ac). Table 4-24 (on the following page)summarizes the potential impacts to ADIDwetlands within this alternative. These ADIDwetlands are generally scattered uniformly alongmost of the improvements comprising thisalternative. Though this alternative includesmostly widening of existing roadways, manyADID impacts are located along roadway edges.Therefore, ADID wetland impacts tend to besmall in size and do not include bisection.Appendix D gives a detailed description of theADID wetlands and their impacts from thisalternative.
In addition to potential direct impacts causedby filling or alteration, minimal functional lossof wetland resources is anticipated. Table 4-24summarizes the potential impacts to wetlandfunctions from this alternative. A majority ofthe ADID wetlands would have very minimalimpacts to functional capacity. Of thefunctions listed in Table 4-24, mitigationwould be most difficult for habitat losses.
A majority of the potential ADID wetlandimpacts occur along the I-94 and IL 83improvements for this alternative. These twoimprovements account for 1.2 ha (2.9 ac) orover 60 percent of ADID wetland impacts.
Non-ADID Wetlands. The 183 non-ADIDwetlands potentially impacted by theIL 83/US 45 with US 12 Alternative total21.6 ha (53.5 ac) (CH2M HILL 1999; GISdatabase). These wetlands are a mixture ofopen marsh, emergent, or forested wetlands. Amore detailed assessment of wetland impactsis presented in Section 4.3.3.2.
4.3.3.2 Wetland Functional AssessmentMethodology
A wetland functional assessment wasdeveloped for the study, drawing fromestablished methods and adapted to becompatible with available data, and theplanning level field reconnaissance. Theassessment was performed for the wetlandswithin the study area for both buildalternatives based on data collected in the fieldand from several published sources. Theassessment employed a scoring system thatassigned points to a wetland based on thevalue of specific overall functions. Points wereassigned per wetland function and added toderive the total score per wetland. The valueor weighting (scores assigned) for a givenwetland function is based in part onestablished requirements for mitigatingimpacts to wetlands expressing thesefunctions. The scores were then divided intothree classes; Class I being the most functional(highest quality) wetlands and Class III beingthe least functional (low-quality) wetlands.7The range of wetland scores within the studyarea was 1 – 28.5. Categorization of wetlandquality classes is as follows:
• Class I: The top third of wetland scores(20 – 28.5),
• Class II: The middle third of wetlandscores (11 - 19),
• Class III: The lower third of wetlandscores (1 – 10).
7 The methodology was developed by CH2M HILL, basedon Minnesota Interagency Wetlands Group. MinnesotaRoutine Assessment Method for Evaluating WetlandFunctions – Version 2.0. 1996.

ENVIRONMENTAL CONSEQUENCES
4-32
TABLE 4-24IL 83/US 45 with US 12 Potential ADID Impact Summary a
RouteADID
DescriptionADID Size
ha (ac)Potential
ADID Impact %
ImpactedADID Functions Identified by
Lake County ADID StudyImpacts toFunctions
CommunityType
• High Quality PlantCommunity
Minimal HabitatLoss
I-94 ADID 91LCTIP 94-11
49.6 (122.5) 0.3 (0.7) 0.6
• Sediment/toxicant retention Minimal
Cattail MarshSedgeMeadow
• Threatened & EndangeredSpecies Habitat
Minimal HabitatLoss
• Sediment-toxicant retention Minimal• Stormwater storage Minimal
IL 21 ADID 94 LibertyPrairieLCTIP 21-28
55.4 (137.0) 0.02 (0.04) 0.03
• High Quality Plant Community Minimal
Wet Prairie
IL 21 ADID 96 Tributaryto Bull CreekLCTIP 21-18
6.5 (15.9) 0.1 (0.2) 1.5 • High quality stream Minimal HabitatLoss
Streamcomplex
• Stormwater storage Minimal• Sediment-Toxicant Retention Minimal• High Quality Wildlife Habitat Minimal Habitat
LossI-94 ADID 99
Headwaters ofthe Middle Fork,North BranchChicago RiverLCTIP 94-10
3.4 (8.6) 0.01 (0.03) 0.3
• Sediment-toxicant retention Minimal sediment/toxicant retention
Loss
Emergentcattail marsh
• Threatened & EndangeredSpecies Habitat
Some Loss ofHabitat
• Stormwater storage Minimal
IL 21 ADID 106Bull Creek LCTIPNos. 21-17, 21-28
1.6 (3.9) 0.1 (0.2) 6.25
• Sediment/toxicant retention Minimal
StreamComplex
• Threatened & EndangeredSpecies Habitat
Some Loss ofHabitat
I-94 ADID 108LCTIP 94-9
11.7 (28.9) 0.4 (1.0) 3.5
• Sediment/toxicant retention Minimal
SedgeMeadowWet mesicPrairie
• High Quality Plant Community Minimal HabitatLoss
I-94 ADID 128LCTIP 94-5
48.3 (119.4) 0.04 (0.1) 0.08
• Sediment-toxicant retention Minimal
SedgeMeadow
• Threatened & EndangeredSpecies Habitat
Minimal HabitatLoss
• Shoreline-bank stabilization Minimal
IL 83 ADID 143IndianCreek/KilldeerCreekLCTIP Nos. 83-19,83-40
63.0 (155.6) 0.2 (0.6) 0.3
• Sediment/toxicant retention Minimal
SedgeMeadowEmergentMarsh
• Shoreline-bank stabilization MinimalIL 83 ADID 151LCTIP 83-27
39.4 (97.4) 0.2 (0.4) 0.5• Sediment-toxicant retention Minimal
WetlandStreamComplex
• Shoreline-bank stabilization MinimalIL 83 ADID 158Indian CreekLCTIP 83-11
58.6 (144.8) 0.01 (0.03) 0.02• Sediment/toxicant retention Minimal
StreamComplex
• Shoreline-bank stabilization Minimal• Sediment/toxicant retention Minimal
US 12 ADID 183LCTIP 12-4
36.7 (90.6) 0.3 (0.6) 0.8
• Nutrient removal and transport Minimal
Buffalo Creek
• High Quality Plant Community Minimal• Sediment/toxicant retention Minimal
IL 60 ADID 198MacArthur WoodsLCTIP 60-11,STM-27
14.8 (36.67) 0.1 (0.2) 0.68
• Stormwater storage Minimal
NorthernFlatwoods
• Threatened & EndangeredSpecies Habitat
Minimal HabitatLoss
• Shoreline-bank stabilization Minimal
IL 120 ADID 200LCTIP 120-4
7.4 (18.3) 0.1 (0.2) 1.4
• Sediment/toxicant retention Minimal
Deep Marsh
TOTAL 396.4 (979) 1.9 (4.3) 0.5aLake County ADID Study

ENVIRONMENTAL CONSEQUENCES
4-33
The four wetland functions used in the processare described below.
Presence of federal-listed and/or state-listed species. Wetland reconnaissancefieldwork performed for the LCTIP was notintended to assess presence of federal- orstate-listed species. Rather data for federal andstate threatened and endangered species weregleaned from published literature sources suchas Biological Surveys (various) performed bythe Illinois Natural History Survey (INHS),Illinois Department of Conservation (IDOC –now IDNR) Technical Report No. 1:Northeastern Illinois Wetland Survey forEndangered and Threatened Birds; ASummary of Field Data: 1980-1989, andcorrespondence from the Illinois Departmentof Natural Resources Natural Heritage(database search dated July 6, 2000).
Based on the IDNR database search(July 6, 2000), element occurrences within thestudy area are summarized in Table 4-25.Review of other published sources did notreveal any element occurrences within thestudy area that were not reported by the IDNRdatabase search.
Wetlands known to provide refuge for anyfederally or state listed species were assigned5.5 points and those wetlands not known toprovide refuge for any listed species wereassigned 0 points. Points assigned for thisfunction are intended to mirror statewidemitigation requirements, e.g. 5.5:1, forimpacted wetlands that harbor listed species.Mitigation requirements for a given resourcegenerally reflect how a wetland function isvalued.
Wildlife habitat. Wildlife habitat was assessedby assigning one point per vegetative strataobserved during wetland determinations, andassigning a wetland size class (0-8) to eachwetland potentially affected. Strataconsiderations included herbaceous,shrub/sapling, tree, vines, and submergents. Ifdominant trees were dead, they were includedas valuable habitat for wildlife species.
The presence of a larger number of strata anda larger wetland size are attributes thatincrease ecological niches available towildlife. Based on coordination with the USArmy Corps of Engineers (USACOE), it wasdetermined that although overall wetland sizeis important, small to moderate size wetlands
TABLE 4-25IDNR Element Occurrences in or Near Wetlands within the Study Area
Element Occurrence Adjacent to Wetland # a, b
Yellow-headed Blackbird 120-5, 120-23
Crawford's sedge 120-23
Sandhill crane 120-5, 53-7, 53-8
Pied-billed grebe 120-5, 53-43
Least bittern 120-5
Iowa darter 120-342g, 21-19
Oak Grove Botanical Area (INAI) 94-12
Eastern prairie fringed orchid 137-3, 94-11, 94-13
Mountain blue-eyed grass 12-4
±7 threatened and endangered species 120-6, 60-4, 60-9, STM-26, STM-27, STM-28, 21-1
Heron rookery 53-43
a 5.5 points were assigned to these wetlands in the wetland functional assessmentb Wetland numbers were assigned to wetlands identified during field verification.

ENVIRONMENTAL CONSEQUENCES
4-34
in a disturbed environment serve variousfunctions. As a result, the scoring of wetlandsize does not distinguish differences forwetlands over 20 hectares (50 acres) in size,and attempts to reflect the true value ofsmaller wetlands in an urbanized area. For thismethodology, it is assumed that wetlands ofall sizes greater than 20 hectares (50 acres)provide similar levels of ecological function.Size classes are described in Table 4-26.
Floristic diversity. Lists of dominantvegetation were developed during wetlandfield verifications for each wetland within thestudy area of the two build alternatives. Plantspecies lists were only intended forapproximation of the wetland boundary and donot comprise a complete floristic list. The useof the Floristic Quality Assessment (FQA)method as developed by Wilhelm et al. (1994)is inappropriate to assess cursory species lists.A FQA would be developed after the selectionof a preferred alternative.
For purposes of this study, floristic diversitywas assessed by counting the number of livingdominant plant species and subtracting allinvasive plants, mowed turf grass, and rowcrop plants. Filamentous algae, prevalent insome wetlands within the study area, was notincluded in the calculation of the floristicdiversity index. Plant species considered asinvasive observed during fieldwork includepurple loosestrife (Lythrum salicaria ), reedcanarygrass (Phalaris arundinacea), giantreed (Phragmites australis), garlic mustard(Alliaria petiolata ), common buckthorn(Rhamnus cathartica), common burdock(Arctium minus), smooth brome(Bromus inermis), corn (Zea mays),honeysuckle (Lonicera spp.), and Canadathistle (Cirsium arvense). Invasive dominantswere subtracted from calculation of floristic
diversity because they are detriments tofloristic diversity. It should be noted that allplants, invasive or not, were included incalculation of the strata class (see WildlifeHabitat function of wetlands) because wildlifewould use invasive plant species to someextent for cover and food sources.
Recreation (Generally Passive)/EducationPotential. Wetlands in or adjacent to speciallydesignated lands are generally highly valuedresources. For purposes of this study, speciallydesignated lands include forest preserves,Illinois Natural Areas Inventory (INAI) sites,and Illinois Nature Preserves. Varying pointswere assigned to wetlands based on theiradjacency to these different speciallydesignated lands categories as follows:
• Wetlands adjacent to or within IllinoisNature Preserves were assigned 10 points.
• Wetlands adjacent to or within INAI siteswere assigned 5.5 points.
• Wetlands adjacent to or within forestpreserves were assigned 1 point.
• Wetlands not adjacent to or within anyspecially designated lands were assigned0 points.
Point assignments for wetlands near or indifferent classifications of specially designatedlands generally mirror mitigation requirementsfor impacts to these important wetlands.
Not all wetland functions were individuallyassessed for this study. Functions, such asfood chain support and uniqueness, were notassessed. The food chain support function istoo complex to be assessed based on the levelof detail on the information available for thisstudy. Unique wetlands, such as bogs, fens(northern peatlands), seeps or springs were not
TABLE 4-26Wetland Size Classes Used in Wetland Functional Assessment
Size Class 0 1 2 3 4 5 6 7 8
Hectare range 0–0.1
0.1 - 0.2 0.2 - 0.4 0.4 - 0.8 0.8 -2.0
2.0 - 4.0 4.0 –8.0
8.0 - 20 >20
Acre range 0–0.25
0.25–0.49
0.50 –0.99
1.0–1.99 2.0 –4.9
5.0 –9.9
10–19.9 20–49.9 >50

ENVIRONMENTAL CONSEQUENCES
4-35
identified for each alternative during the fieldverification exercise. Therefore thesefunctions were not assessed.
Similarly, functions such as aquatic habitat,sediment/toxicant trapping, andfloodwater/stormwater attenuation were notconsidered individually due to the complexnature of these functions compared to the dataavailable for this study. These last threefunctions were considered during theweighting process for wetland sizeclassification as they generally would beconsidered a function of wetland size. Largerand more diverse wetland complexes generallyprovide these functions better than wetlandcomplexes of smaller size.
4.3.3.3 General Functional WetlandAssessment
The wetland impacts were assessed for thebuild alternatives using the wetland functionalassessment methodology. Wetlands potentiallyimpacted by the No-Action Alternative werenot field-verified; therefore, the wetlandfunctional assessment methodology could notbe applied. The impacts for the buildalternatives are summarized below.
The IL 53 Freeway/Tollway Alternative wouldaffect a total of 37.1 hectares (91.8 acres) ofwetlands. Roughly 12.5 percent, 4.7 ha(11.5 ac) are Class I (high quality) wetlands,26.8 percent, 10.0 ha (24.6 ac) are Class IIwetlands, and 60.7 percent, 22.5 ha (55.7 ac)of the total wetland impacts are Class IIIwetlands.
The IL 53 Freeway/Tollway Alternative wouldaffect 118 individual wetlands. Of the affectedwetlands, 12 field verified wetlands(representing 5 ADID complexes) aredesignated as ADID. Of the 12 field verifiedwetlands, wetlands 53-7, 53-11 and 53-43 areClass I, wetlands 53-8, 53-19, 53-21, 53-22,53-67, 83-19, and 83-40 are Class II, andwetland 120-4 is Class III. Affected wetlandsalong the IL 53 Freeway/Tollway Alternativeidentified as Class I that are not designated asADID include wetlands 120-5 and 120-6.
The IL 83/US 45 with US 12 Alternativewould affect 23.4 hectares (57.7 acres) of
wetlands. With respect to the wetlandfunctional assessment methodology used forthis project, 3.8 percent, 0.9 ha (2.2 ac) areClass I wetlands, 60.8 percent, 14.3 ha(35.1 ac) are Class II, and 35.4 percent, 8.3 ha(20.4 ac) are Class III.
The IL 83/US 45 with US 12 Alternativewould affect a total of 196 individualwetlands. Of those, 21 field verified wetlands(representing 13 ADID complexes) aredesignated in part as ADID. Of the 21 fieldverified (ADID designated) wetlands,wetlands STM-27, 94-10, and 94-11 are ClassI wetlands, wetlands 12-4, 21-18, 21-28,83-11, 83-19, 83-27, 83-40, 94-5, and 94-9 areClass II, and wetlands 21-17, 60-11, and 120-4are Class III. Affected wetlands along theIL 83/US 45 with US 12 Alternative identifiedas Class I (high quality) that are notdesignated as ADID include wetlandsSTM-26, STM-28, 21-1, 60-1, 60-5, 60-9, and120-6.
Wetland Functional Assessment-IL 53Freeway/Tollway AlternativeThe results of the wetland functionalassessment were also summarized for themajor watershed within the project area. Thepurpose of this summary is to gain someperspective on both the amount and quality ofwetlands affected that may lead regulatoryagencies to more effective mitigation of thewetland impacts. Again, information issummarized for the two build alternativesonly. Tables E-4 through E-6 in Appendix E,summarize wetland impact data for the IL 53Freeway/Tollway Alternative, analyzed withrespect to watershed, roadway segment, andwetland quality class (per field-based wetlandfunctional assessment methodology).
Fox River Watershed. Roughly 5.3 hectares(13.1 acres) of wetland impacts would occuralong parts of the IL 53 Freeway/TollwayAlternative that lie within the Fox RiverWatershed. Of those impacts, 46 percent areClass II wetlands, and 54 percent are Class IIIwetlands. All Fox River Watershed wetlandsare located along IL 120. There are no Class Iwetlands located within this watershed.

ENVIRONMENTAL CONSEQUENCES
4-36
Des Plaines River Watershed. Roughly31.8 hectares (78.7 acres) of wetlands wouldbe affected along parts of the IL 53Freeway/Tollway Alternative that lie withinthe Des Plaines River Watershed. Of thoseimpacts, 14.6 percent are Class I wetlands,23.6 percent are Class II wetlands, and61.8 percent are Class III wetlands.
Approximately half of the Class I impacts arelocated along the eastern half of IL 120 nearthe Almond Marsh complex. Most of theremaining Class I impacts are located near theIndian Creek complex.
Lake Michigan Watershed. There are nowetland impacts proposed for portions of theIL 53 Freeway/Tollway Alternative that liewithin the Lake Michigan Watershed.
Wetland Functional Assessment-IL 83/US 45 with US 12 AlternativeFox River Watershed. Approximately0.4 hectare (1.1 acres) of wetland impactswould occur along parts of the IL 83/US 45with US 12 Alternative that lie within the FoxRiver Watershed. Of the total wetlandimpacts, 8 percent are to Class II wetlands and92 percent are Class III wetlands. There are noClass I wetlands located in this watershed forthis alternative.
Tables E-1 through E-3 in Appendix E,summarize wetland impact data for theIL 83/US 45 with US 12 Alternative, analyzedwith respect to watershed, roadway segment,and Wetland Quality Class (per field-basedwetland functional assessment methodology).
Des Plaines River Watershed. Roughly22.9 hectare (56.6 acre) of wetland impactswould occur along the part of the IL 83/US 45with US 12 Alternative that lie within the DesPlaines River Watershed. Of those, 3.9 percentare Class I wetlands, 61.9 percent are Class IIwetlands, and 34.2 percent are Class IIIwetlands. Impacts to Class I wetlands for thisalternative are distributed relatively evenlyamong St. Mary’s Road, IL 120, IL 21, IL 60and Interstate 94.
Lake Michigan Watershed. There are noproposed impacts to wetlands along portions
of the IL 83/US 45 with US 12 Alternativethat lie within the Lake Michigan Watershed.
4.3.3.4 SummaryAll project alternatives would have unavoidablewetland impacts. The IL 53 Freeway/TollwayAlternative would have the largest area ofoverall wetland impacts. Based on the field-verified wetland functional assessmentmethodology, the IL 53 Freeway/TollwayAlternative would have a higher proportion ofhigh quality wetlands (Class I) impacted,however, fewer impacts to moderate quality(Class II) wetlands than the IL 83/US 45 withUS 12 Alternative. Combining the high andmoderate quality wetlands, the IL 83/US 45with US 12 Alternative would impact a higherpercentage and larger amount of these wetlandsthan the IL 53 Freeway/Tollway Alternative.Almost two-thirds of the wetlands impacted forthe IL 53 Freeway/Tollway Alternative areconsidered low quality (Class III) wetlands,whereas only approximately one-third of thewetlands impacted as a result of theIL 83/US 45 with US 12 Alternative areconsidered Class III wetlands. The area ofwetland impact for any of the alternatives is anissue that would be the subject of greaterexamination for the preferred alternative.Continued efforts would be made to avoid orminimize the impact with further projectrefinements.
From a countywide perspective, the impacts towetlands are relatively small. Compared to thetotal wetlands in Lake County (18,500 ha, or45,700 ac) the alternatives impact from0.17 percent for the No-Action Alternative(Baseline) to 0.20 percent for the IL 53Freeway/Tollway Alternative, of the totalwetlands identified by the LCWI. Table 4-27(on the following page) summarizes impactsto wetlands per alternative, including asummary of qualitative assessment peralternative and per watershed.
Impacts would also occur to wetlands fromroadway operations after construction. Thisincludes stormwater runoff from roadwaysthat carries typical roadway pollutants intoadjacent water bodies or wetlands. Otherimpacts occur from roadway deicing

ENVIRONMENTAL CONSEQUENCES
4-37
procedures, which introduce sodium chlorideinto the surrounding areas. The introduction ofroadway pollutants including sodium chloridecan affect vegetation in proximity to theroadway. Impacts of this nature would not beas substantive for improvements alongexisting roadways, since these areas arealready subject to operational impacts.
For new roadways, the introduction ofroadway pollutants can be more substantivethan for improvements to existing roadways.This is a result of introducing roadwaypollutants to areas that previously receivedlimited impacts from roadways. This wouldpresent more impacts to areas along the IL 53corridor. It should be noted that some roadwaypollutants are already entering these areasfrom cross-streets and local roads adjacent tothe existing right-of-way. Different measurescan be taken to reduce roadway operationimpacts such as alternative deicing materials,routing of stormwater runoff throughvegetated swales or sediment basins or by theuse of barriers, which could include pollutanttolerant vegetation or other structuralelements. Detailed mitigation measures wouldbe designed specifically for the preferred
alternative. Additional information onroadway runoff impacts is included in Section4.3.2, Water Quality and Water Resources.
Commonly, regulatory agencies also considerthe effects of the direct impacts on portions ofimpacted wetlands outside the project right-of-way. The consideration of impact to the entirewetland attempts to evaluate the overallimpact to wetland functions. A finaldetermination of wetland impacts would befully addressed after selection of a preferredalternative, completion of formal wetlanddelineations, and coordination with US ArmyCorps of Engineers, US Fish and WildlifeService, US Environmental ProtectionAgency, Illinois Department of NaturalResources, and the Lake County StormwaterManagement Commission.
4.3.4 Floodplain EncroachmentsPotential floodplain encroachments wereidentified by examining Flood InsuranceStudy (FIS) maps published by FederalEmergency Management Association(FEMA). Guidance from the Lake CountyStormwater Management Commission (SMC)was applied in determining storage
TABLE 4-27Summary of Wetland Impacts
No-Action(Baseline)
IL 53 Freeway/Tollway IL 83/US 45 with US 12
Total Wetland Impacts 31.6 ha (78.1 ac) 37.1 ha (91.8 ac) 23.4 ha (57.7 ac)
ADID Impacts 5.3 ha (12.9 ac) 3.5 ha (8.6 ac) 1.9 ha (4.3 ac)
Non-ADID Impacts 26.5 ha (65.1 ac) 33.6 ha (83.2 ac) 21.6 ha (53.5 ac)
Percent ofimpacts
Size Percent ofimpacts
Size
Class I --a 12.5 4.7 ha(11.5 ac)
3.8 0.9 ha(2.2 ac)
Class II --a 26.8 10.0 ha(24.6 ac)
60.8 14.3 ha(35.1 ac)
Class III --a 60.7 22.5 ha(55.7 ac)
35.4 8.3 ha(20.4 ac)
Fox River Watershed --a 5.3 ha (13.1 ac) 0.4 ha (1.1 ac)
Des Plaines Watershed --a 31.8 ha (78.7ac) 22.9 ha (56.6 ac)
a No qualitative assessment conducted for No-Action Alternative (Baseline)

ENVIRONMENTAL CONSEQUENCES
4-38
requirements for both floodplainencroachments and added impervious areasassociated with the alternatives. FIS floodplainlocations were identified directly from themaps. Potential encroachments on SMCfloodplains would be determined in futurephases of work for the preferred alternative.
The following subsections discuss thepotential floodplain encroachments and otherdrainage concerns for each alternative,including potential mitigation measures.Tables describing floodplain encroachments,added impervious areas, storage requirements,and potential storage locations within eachdrainage reach are shown in Appendix F.Transverse (crossing) and longitudinal (edge)encroachments are differentiated, sincelongitudinal encroachments often result inmore complex floodplain effects and greaterreduction in conveyance. Longitudinalencroachments typically involve more fill,based on a longer zone of impact.Longitudinal impacts are generally consideredto be more avoidable than transverseencroachments, based on the potential fordesign modifications.
Mitigation of floodplain encroachments isrequired in Lake County through provision ofdetention and compensatory storage in the areaof impact (Lake County StormwaterManagement Commission, Lake CountyWatershed Development Ordinance, amendedAugust 10, 1999). Compensatory storage is avolume of storage within or adjacent to aregulatory floodway or floodplain used tobalance the loss of natural flood storagecapacity within the floodplain. Detentionstorage is a volume of storage used to maintainstormwater release rates at or below levels afterthe addition of relatively impervious areas.
4.3.4.1 No-Action Alternative (Baseline)The roadway improvements included in the No-Action Alternative (Baseline) pass throughthree major watersheds: the Fox RiverWatershed, the Des Plaines River Watershed,and the Chicago River Watershed.Subwatersheds involved in these areas includeFlint Creek, Buffalo Creek, Aptakisic Creek,Lower Des Plaines River, Indian Creek, Bull
Creek, Mill Creek, Upper Des Plaines River,Squaw Creek, Middle Fork, Skokie River, andWest Fork.
The No-Action Alternative (Baseline) wouldinvolve 38 FIS floodplains, with a total of6.9 ha (17.0 ac) of encroachment. Of these38 locations, 28 would involve the extensionof existing culverts or bridges at transversecrossing locations where roadway wideningwould occur. Encroachment at these locationswould be 3.9 ha (9.6 ac). One transverseinvolvement would occur where a roadwaywould be constructed along a new alignment.This would occur along the Bradley Roadextension, and would have an encroachmentarea of 0.53 ha (1.3 ac). Finally, ninelongitudinal encroachments would occur, all atlocations where roadways would be widened,with a total area of 2.5 ha (6.1 ac). Designalternates to avoid or minimize longitudinalimpacts would need to be investigated beforeimplementation.
In addition to floodplain effects, the combinedroadway improvements for the No-ActionAlternative (Baseline) would add 135 ha(333.0 ac) of impervious area. Based onfloodplain encroachments and imperviousareas, the No-Action Alternative (Baseline)would require 8.3 ha (20.5 ac) of compensatorystorage and 14.3 ha (35.3 ac) of detentionstorage. A preliminary concept for locations ofdetention and compensatory storage is providedin Appendix F. The required storage could beprovided near the areas of encroachment.
4.3.4.2 IL 53 Freeway/TollwayAlternative
The IL 53 Freeway/Tollway Alternativepasses through two major watershed areas: theFox River Watershed and the Des PlainesRiver Watershed. Subwatersheds involved inthese areas include Fish Lake Drain, SquawCreek, Mill Creek, Bull Creek, Buffalo Creek,Indian Creek, and the Upper Des PlainesRiver.
This alternative encroaches on 10 FISfloodplains with a total area of 13.0 ha(32.1 ac). All would involve transverseencroachments along the 6-lane roadway to be

ENVIRONMENTAL CONSEQUENCES
4-39
constructed on new alignment. Nolongitudinal encroachments are identified. TheIL 53 Freeway/Tollway Alternative wouldalso involve approximately 182 ha (449.0 ac)of additional impervious area. Based on theseeffects, the IL 53 Freeway/TollwayAlternative would require 15.6 ha (38.5 ac) ofcompensatory storage and 18.7 ha (46.3 ac) ofdetention storage. A preliminary concept forlocations of detention and compensatorystorage is provided in Appendix F. Therequired storage could be provided near theareas of encroachment.
4.3.4.3 IL 83/US 45 with US 12Alternative
The IL 83/US 45 with US 12 Alternativepasses through three major watershed areas: theFox River Watershed, the Des Plaines RiverWatershed, and the Chicago River Watershed.Subwatersheds involved in these areas includes:Slocum Lake Drain, Tower Lake Drain, FlintCreek, Buffalo Creek, Aptakisic Creek, LowerDes Plaines River, Indian Creek, Bull Creek,Mill Creek, Upper Des Plaines River, SquawCreek, and Middle Fork.
This alternative encroaches on 33 FISfloodplains with a total area of 5.9 ha(14.6 ac). Seventeen of those locations wouldinvolve extending culverts or bridges attransverse crossing locations where roadwaywidening would be required. The totalencroachment at these locations would be3.7 ha (9.2 ac). Another four encroachmentswould occur at transverse crossing locations,where roadway would be constructed alongnew alignment. These would occur along thesection of IL 83/US 45 north of IL 60
(Mundelein Bypass), and have an impact areaof 0.3 ha (0.8 ac). Finally, 12 longitudinalencroachments would occur, all at locationswhere roadways would be widened, with atotal encroachment area of 1.8 ha (4.5 ac).Design alternates to avoid or minimizelongitudinal impacts would need to beinvestigated should this become the preferredalternative. Placing widening on the sideopposite the floodplain should be investigatedas an option. This alternative also wouldinvolve 163.0 ha (403.0 ac) of additionalimpervious area. Based upon the floodplainencroachments and added impervious area forthis alternative, 7.1 ha (17.5 ac) ofcompensatory storage and 17.1 ha (42.3 ac) ofdetention storage would be required. Apreliminary concept for locations of detentionand compensatory storage is provided inAppendix F. The required storage could beprovided near the areas of encroachment.
4.3.4.4 Summary of FloodplainEncroachments
The number of floodplain encroachments andthe added impervious area varies with eachalternative. Generally, the regulatoryrequirements for compensatory storage andstormwater detention could be satisfied foreach alternative near the area of impact(concept plans in Appendix F). Actualcompliance with these requirements would bedetermined by detailed hydraulic analysisduring future phases of work. Table 4-28summarizes the encroachments and addedimpervious area for each alternative.
TABLE 4-28Floodplain and Added Impervious Area Impact Summary
No-Action IL 53 Freeway/Tollway IL 83/US 45 with US 12
FIS Encroachments (Amount and Area) 38 encroachments 6.9 ha (17.0 ac)
10 encroachments13.0 ha (32.1 ac)
33 encroachments5.9 ha (14.6 ac)
Potential Longitudinal Encroachments 9 0 12
Added Impervious Area 135 ha (333 ac) 182 ha (449 ac) 163 ha (403 ac)
Compensatory Storage 8.3 ha (20.5 ac) 15.6 ha (38.5 ac) 7.1 ha (17.5 ac)
Detention Storage 14.3 ha (35.3 ac) 18.7 ha (46.3 ac) 17.1 ha (42.3 ac)

ENVIRONMENTAL CONSEQUENCES
4-40
4.3.5 Biological ResourcesThe project alternatives generally woulddisplace vegetation and wildlife habitat in therights-of-way of the improvements. The pavedarea of the rights-of-way would completelydisplace existing habitat; however, the covertype outside the edge of pavement to the right-of-way line would be converted to grassymedians and grass with intermittent landscapeplantings of trees and shrubs. The new grassyareas can be planted with native prairievegetation, which reduces maintenance costsand provides a more natural cover type thanturf grasses. The direct habitat conversion ofcover type and habitat would cause some lossof wildlife habitat that serves as cover forbreeding, foraging, and resting. For newroadway alignments, there would be somehabitat fragmentation, and disruption ofcorridors for wildlife movement.
In general, most of the native cover types in thestudy area already are substantially altered, andwildlife is limited primarily to species that havesuccessfully adapted to urban, suburban, oragricultural development. Overall, the project-related impacts to native cover types andwildlife resources would be minimal. Impactsto wildlife within the project-area could involvesmall population reductions of speciesassociated with existing and available habitat.Many of the improvements would upgradeexisting roadways (i.e., the No-ActionAlternative (Baseline) and IL 83/US 45 withUS 12 Alternative) and would have a minimaleffect upon wildlife species that have alreadyadapted to roadway edges. In some cases,however, species that rely upon higher qualityhabitat such as wetlands, natural areas, or largewood lots would be affected. Such species arediscussed below.
4.3.5.1 No-Action Alternative (Baseline)Natural habitat bordering the No-Actionimprovements have limited potential becauseof extensive development and periodicmaintenance (Figure 4-19). Roadwayimprovements in this area would haveminimal impact on the limited wildliferesources in the area.
Vegetation and Cover Types. Most of theproposed improvements involved with thisalternative are associated with existingroadways. As a result, most of the cover typeconversions and the fragmentation of largeforested tracts would be minimal. Most covertypes affected by this alternative are urbangrasslands, closed canopy deciduous forest,row crops, and open canopy deciduous forest.The greatest potential impact would be relatedto the proposed Pulaski Road extension, whichwould bisect the Oak Grove Botanical AreaIllinois Natural Area Inventory Site. Thiswould introduce roadway edges to a largecontiguous habitat area, potentially limitingnorth-south wildlife movement in this naturalarea, decreasing wildlife populations intolerantof roadway edges, and increasing the potentialnumber of collisions between wildlife andvehicles. Although the endangered prairiewhite fringed orchid has been observed in theOak Grove site, based on informationprovided by IDNR, the proposed Pulaski Roadextension may not be located near specificknown populations of that species. Beforeconstruction, the agency sponsoring theproject would conduct detailed surveys todetermine the potential for affecting that plantspecies.
Wildlife. Birds and most mammals are mobile;therefore the direct loss of habitat from thisalternative would not be as critical as it wouldbe to other species. Typically, these specieswould seek out other areas to forage, breed,and rest. Their mobility, however, exposesthem collisions with vehicles as they attemptto cross roadways that have been widened, orby the addition of new roadways to areas notpreviously served. Losses to actual speciesgroups should be minimal. Most reptiles andamphibians that occur in Lake County are lessmobile, and so they upon the immediatehabitat where they live. Additionally, speciesthat depend upon wetland habitat could, tosome extent, be affected by the No-ActionAlternative (Baseline). This alternative wouldaffect 27 ha (65 ac) of wetlands, manyadjacent to existing roadways. Species thatoccur in these locations generally are adaptedor are more tolerant to the existing conditions.

ENVIRONMENTAL CONSEQUENCES
4-41
It is expected that the overall effect to thesespecies would be minimal.
Forest preserves, nature preserves, INAI sites,and other large tract forested areas provideimportant protected habitat. Any impact tothese resources are considered important froma wildlife standpoint. Critical areas of impactexist along Rollins Road, IL 21, IL 22, PulaskiRoad, and US 45.
4.3.5.2 IL 53 Freeway/TollwayAlternative
The IL 53 Freeway/Tollway Alternative wouldbe located mostly on new alignment. Thisalternative avoids most of the county’s criticalhabitat areas located in forest preserves, naturepreserves, INAI sites, and large forested tracts(Figure 4-20).
Vegetation and Cover Types. Most of thecover type impacts would occur to row crops,urban grasslands, and closed and open canopydeciduous forests. The IL 53 Freeway/TollwayAlternative would affect 15 wooded areasgreater than 4 ha (10 ac). Six wooded areascould experience fringe impacts, five could losetrees from their edges, and four could sufferfragmentation of overall habitat. The greatestimpacts to deciduous forests would occur southof Long Grove Road at Hicks Road, near thecrossing of IL 22, Indian Creek Road, and southof IL 176. The improvements to IL 120 wouldfurther affect forested areas east of Grayslakeand US 45 near Almond Marsh (Figure 4-20).Fragmentation of these areas could adverselyaffect wildlife populations that require largeundisturbed wooded tracts and favor species thatare more adaptive to edge environments.Competition for reduced habitat in theselocations could likely cause some reduction inpopulation for some birds and mammals.
Wildlife. The IL 53 Freeway/TollwayAlternative would be an access-controlledfacility with a wide cross section, representinga potential barrier for both north-south andeast-west wildlife movements. North-southmovement is already limited by IL 120 (theeast-west segment of this alternative). Theeast-west improvement planned for thisalternative would impose additional barrier
effects with access control fencing, medianbarriers, etc.
This alternative would not affect any majorgreenways or stream complexes in the county.The proposed east-west segment would crossthe Des Plaines River and its natural greenwayat the current IL 120 crossing, therebyminimizing the effects of a new crossing. Asstreams provide natural greenways andcorridors for wildlife movement, the bridgingof these features provides some limitedcorridors of accessibility for wildlife.Although there would be some avenues ofaccess for reptiles, amphibians, and mammals,there would be limited impacts due to habitatfragmentation, isolation, and increasedvehicle/wildlife collisions. There would besome loss of bird nesting and foraging areasdue to the conversion of the undeveloped landwithin the proposed right-of-way to highwayuses.
The proposed IL 53 Freeway/TollwayAlternative would directly affect the habitatand wildlife populations in the area reservedas right-of-way for the IL 53 Freeway/TollwayAlternative. The protected corridor hasbecome a haven for wildlife escaping thecontinual development of their habitat in areasnear the proposed roadway. The conversion ofthis protected corridor to highway would forcewildlife that use the area to move to otherlocations. This could cause the protected openspace near this alternative, consisting of forestpreserves, nature preserves, natural areas, andwetland complexes, to experience increases inwildlife densities as well as some overallreduction in wildlife population.
4.3.5.3 IL 83/US 45 with US 12Alternative
Similar to the No-Action Alternative(Baseline), the IL 83/US 45 with US 12Alternative would improve mostly existingroadways; therefore, impacts to birds,mammals, reptiles, and amphibians would beminimal (Figure 4-21).
Vegetation and Cover Types. Most cover typeimpacts would occur to urban grasslands, rowcrops, closed canopy deciduous forests, rural

ENVIRONMENTAL CONSEQUENCES
4-42
grasslands, and open canopy deciduous forests.The impact to large woodlots is comparable tothat for the IL 53 Freeway/Tollway Alternative(Figure 4-20). The IL 83/US 45 with US 12Alternative would affect 13 wooded areas over4 ha (10 ac) in size. Of the 13 wooded areas,10 could experience fringe impacts, 2 couldaffect existing edges, and 1 could havefragmentation of habitat. Fragmentation ofwooded habitat is not considered significantfor this alternative. As stated, most impacts towoodlots for this alternative would affectexisting edges. Only one large deciduous tractalong the bypass section west of Mundeleincould experience fragmentation.
Wildlife. Since much of this alignment consistsof improvements to existing roadways, speciesliving adjacent to those roadways generally aretolerant of this condition. Roadway wideningcould increase the chances for vehiclecollisions with wildlife and increase the barriereffect for less mobile terrestrial species such asreptiles and amphibians. The potential forincreased roadkill for this and the otheralternatives is not expected to degrade thepopulations of wildlife species occurring in thearea. This alternative consists primarily ofroadway improvements and is therefore lesslikely to fragment and isolate habitat. TheMundelein bypass would be on new alignmentand would use part of the IL 53Freeway/Tollway alignment. There is thepotential for limited fragmentation and isolationalong this short segment of new roadway.
This alternative would have a little effect onforest preserves, natural areas, and naturepreserve resources (less than 2 ha or 5 ac);therefore, no major impacts are anticipated forthese important habitat resource areas. Therewould be no additional crossings of thegreenway along the Des Plaines River from thisalternative. Improvements are proposed forthree roadways that cross the Des Plaines Riverand the greenway. These improvements arealong Interstate 94, IL 60, and IL 137. Theseproposed improvements would have littleadditional impact to area wildlife because I-94is an access-controlled highway, and IL 60 andIL 137 are 4-lane highways.
This alternative would affect the least amountof wetlands compared to other alternatives,reducing potential impacts to wildlife that usewetlands for forage and cover.
4.3.5.4 Summary of BiologicalResource Impacts
Both build alternatives avoid major impacts tothe most important wildlife habitat in the studyarea (forest preserves, nature preserves, andnatural areas). Generally, the No-ActionAlternative (Baseline) would have minimalimpact to biological resources, except for animpact to the Oak Grove Botanical Area withthe construction of the Pulaski Roadextension.
The IL 83/US 45 with US 12 Alternative wouldhave a slightly less impact than the No-Actionand the IL 53 Freeway/Tollway alternatives.The IL 83/US 45 with US 12 Alternativeaffects areas already disrupted by urbandevelopment, including roadways. Therefore,improvements to roadways could have limitedeffect on wildlife resources, compared to newroads on new alignments. Impacts arecomparable for the two build alternatives inareas that share common alignments (e.g. theMundelein bypass).
The IL 53 Freeway/Tollway Alternative couldhave slightly greater impacts, particularly inthe north-south direction. The right-of-way formuch of this alternative has been reserved formany years and over time has developed into acorridor for wildlife in a developing area. Thisalternative would replace the habitat providedby the protected corridor causing displacementof wildlife populations, along with thepotential for habitat fragmentation andisolation. The species in this area generally aretolerant of development and would beexpected to compete well in other locations ifforced to relocate. However, increased wildlifedensity and competition for available habitatin neighboring areas could cause a smallreduction in the overall population.

ENVIRONMENTAL CONSEQUENCES
4-43
4.3.6 Threatened andEndangered Species
According to information supplied by theIllinois Department of Natural Resources(IDNR 2000), the project alternatives are nearseveral recorded occurrences of threatened orendangered species. The accuracy of availabledata, however, does not allow a determinationof specific impact to these resources. When apreferred alternative is chosen, additionalstudies would be conducted to determinepotential presence and impacts to threatenedand endangered species. These could includefloristic, avian, mammalian, herpetological,fish, insect, mollusk, and other surveys.
Generally, bird species represent most of thelisted species identified for the study area(IDNR 2000). No threatened or endangeredmammal species have been identified in thearea. To some degree, each project alternativewould reduce potential foraging areas;however, there is abundant habitat in the areato sustain these populations. The specifichabitat impacts for each alternative arediscussed below.
4.3.6.1 No-Action Alternative (Baseline)Federal-Listed Species. Improvements underthe No-Action Alternative (Baseline) for thePulaski Road extension could affect the OakGrove Botanical Area INAI site, which harborsthe eastern prairie fringed orchid (Platantheraleucophaea, a federal and state threatened plantspecies). The eastern prairie fringed orchid isscattered throughout the site, and isolating thespecies in the north remnant of the site mayaffect its continued existence. Based on thegeneral locations shown by IDNR (2000), itappears that actual roadway alignment would notdirectly affect the species. Studies conductednear IL 22 also indicated the presence ofeastern prairie fringed orchid (Taft 1997b) inseveral locations. The best availableinformation shows that known sites would notbe affected; however, detailed surveys would berequired to confirm the presence or absence ofthe species within the Pulaski Road and IL 22project rights-of–way.
State-Listed Species. Based oncorrespondence from IDNR (2000), severalstate-listed species occur in the area of No-Action Alternative (Baseline) improvements.They are the pied-billed grebe (Podilymbuspodiceps; state threatened), yellow-headedblackbird (Xanthocephalus xanthocephalus;state endangered), queen-of-the-prairie(Filipendula rubra; state endangered), prettysedge (Carex woodii; state threatened), andseaside crowfoot (Ranunculus cymbalaria;state endangered).
Avian studies by INHS along IL 22 fromUS 41 to IL 83 (FAP 337) revealed marginalsuitable habitat for the pied billed grebe(Podilymbus podiceps; state threatened). Inthis study, no state-listed species wereobserved nor was direct evidence of breedingobserved. It was determined that there issuitable habitat for five state-listed birdspecies near the alternative, but there was noevidence of their breeding. These birds are theAmerican bittern (Botaurus lentiginosus; stateendangered), least bittern (Ixobrychus exilis;state endangered), Bewick’s wren(Thryomanes bewickii; state endangered),loggerhead shrike (Lanius ludovicianus; statethreatened) and Henslow’s sparrow(Ammodramus henslowii; state endangered).One bird species, the sharp-shinned hawk(Accipiter striatus) for which there is marginalsuitable habitat within the study area(Amundsen and Enstrom 1996), is no longer astate-listed species. Proposed improvements tothis roadway may affect suitable foragingareas, but it was determined that there is nosuitable breeding area for these birds withinthe project limits. Therefore there would be noimpacts to these species (IDOT 2000b).
Avian studies by the INHS (Amundsen andEnstrom 1996) recorded an observance of theAmerican bittern along IL 22 between US 14to Quentin Road (FAP 341). Breeding habitatfor three other species of birds was assessedwithin the vicinity of this section of IL 22.These included the sandhill crane (Gruscanadensis; state threatened), red-shoulderedhawk (Buteo lineatus; state threatened), andgreat egret (Ardea alba; formerly statethreatened). Amundsen and Enstrom (1996)

ENVIRONMENTAL CONSEQUENCES
4-44
observed great egrets foraging within thestudy area, although they were not observed tobe breeding. The red-shouldered hawk wasobserved north of IL 22 in 1994 betweenKelsey Road and US 14, though directevidence of breeding was not observed. Theproposed improvements to this roadway wouldnot affect breeding but may minimally affectmarginal foraging areas for these bird species.
The seaside crowfoot (Ranunculus cymbalaria;state endangered) was identified near theformer Deerfield Road Toll Plaza (ISTHA1997). Fifty-five delineated colonies wereobserved in roadside ditches between DeerfieldRoad and Duffy Lane on both sides of theTollway. The ISTHA developed a mitigationplan as compensation for potential impacts tothese plant populations to meet therequirements of the IDNR.
Fish surveys conducted by the INHS haveconfirmed the presence of the Iowa darter(Etheostoma exile; state endangered) inseveral stream crossings along IL 21 nearIL 120. These stream reaches would beaffected by the No-Action Alternative(Baseline). Commitments to minimize andmitigate for potential impacts are:
• Use of bottomless box culverts to avoiddisturbing streambeds.
• Locating bridge abutments outside thebank/shoreline to avoid streambeddisturbance.
• No in-stream work to occur duringspawning of Iowa darter (April to May).
• No earthwork or land-clearing near waterbodies harboring this species duringspawning.
• Rigorous enforcement of erosion controlmeasures near the tributary harboring thisspecies.
• Limiting earthwork and vegetationremoval to the area of proposedimprovements.
• Coordinating final plans with the IDNRprior to construction commencing for finalclearance of threatened and endangeredspecies issues.
Nature Preserves and INAI Sites. The No-Action Alternative (Baseline) would notimpact designated nature preserves(CH2M HILL, GIS Database 1999). Thisalternative, however, could potentially affectthree designated INAI sites totaling 1.25 ha(3.1 ac; Table 4-29). The greatest impact toINAI sites would occur at the Oak GroveBotanical Area INAI Site. Improvements inthis area would isolate a small portion of thedesignated site, leaving a small remnant northof the new Pulaski Road extension.
4.3.6.2 IL 53 Freeway/TollwayAlternative
Federal-Listed Species. Based on informationprovided by the USFWS (February 2001), thereare two locations of federally endangeredprairie white fringed orchid near thisalternative. This plant has been identified eastof the proposed interchange with Illinois Route22. Based on the proposed alignment, there willbe no direct impacts to this plant. USFWS hasalso indicated the presence of this plant speciesnear the interchange of IL 120 with I-94. Theexact location of the plant relative to theexisting and proposed roadway has not beenprovided, therefore, potential impacts to thisplant cannot be ascertained. Detailed botanicalsurveys will be conducted in this area if thisalternative is selected.
State-Listed Species. Based on a databasesearch by IDNR (2000), several state-listedspecies are known to occur near the IL 53Freeway/Tollway Alternative. State-listed bird
TABLE 4-29INAI Sites Affected under No-Action Alternative (Baseline)
INAI Site Roadway Improvement Potential Impact Total INAI Site Size
Oak Grove Botanical Area Pulaski Road 1.1 ha (2.7 ac) 21.0 ha (52 ac)
Buffalo Grove Prairie Lake-Cook Road 0.1 ha (0.1 ac) 3.8 ha (9.3 ac)
Almond Marsh US 45 0.1 ha (0.3 ac) 98.0 ha (242.3 ac)

ENVIRONMENTAL CONSEQUENCES
4-45
species include the yellow-headed blackbird(state endangered), sandhill crane (statethreatened), pied-billed grebe (state threatened),least bittern (state threatened), and heronrookery (treated here as a protected elementoccurrence). There is the potential to impactforaging areas for these birds. One state-listedplant species, Crawford’s sedge (Carexcrawfordii; state endangered) is known to occurnear the IL 53 Freeway/Tollway Alternative.Based on IDNR (2000), two other state-listedbird species are known to occur within 1.6 km(1 mi) of the IL 53 Freeway/TollwayAlternative; the common moorhen (Gallinulachloropus; state threatened) and the black tern(Chlidonias niger; state endangered). Directimpacts to these species are not anticipated, butthey could move their nesting areas over time.No direct impacts are expected to these bird orplant species from the IL 53 Freeway/TollwayAlternative.
Approximate element occurrence locationsand correspondence provided by IDNR (2000)show several listed species to be in or nearwetlands identified within the IL 53Freeway/Tollway Alternative. Based onIDNR, Table 4-30 summarizes selectedwetlands identified in the IL 53Freeway/Tollway Alternative and the listedspecies (including a Heron rookery) that havebeen observed in them.
One species of fish, the Iowa darter(Etheostoma exile; state endangered), was
identified within a tributary of the Des PlainesRiver in the IL 120/IL 21 interchange. TheIDOT has taken into consideration protectiveactions for this fish species as part of proposedimprovements to IL 21 under the No-ActionAlternative (Baseline). Commitments similar tothose made for the proposed IL 21improvements would be implemented if thisalternative is selected. No other knownlocations of the Iowa darter would be directlyaffected by this alternative.
Though Blanding’s turtle (Emydoideablandingii; state threatened) is known to occurwithin 1.6 km (1 mi) of the IL 53Freeway/Tollway Alternative (IDNR 2000) noimpact to this species is expected from proposedroadway improvements. It is possible thatseveral wetlands within the study area may besuitable habitat for this species (Phillips 1995).
Nature Preserves and INAI Sites. There arefive designated Illinois nature preserves orINAI sites within 1.6 km (1 mi) of the IL 53Freeway/Tollway Alternative. None of thesesites would be directly or indirectly affectedby this alternative.
4.3.6.3 IL 83/US 45 with US 12Alternative
Based on information provided by IDNR(2000) and the USFWS (2001), several state-listed species and one federally-listed speciesare known to occur in the vicinity of theproposed IL 83/US 45 with US 12 Alternative.
TABLE 4-30Selected Wetlands Identified in the IL 53 Freeway/Tollway Alternative and Listed Species Observed in Them
Element Occurrence Adjacent to or in Wetland #
Yellow-headed blackbird 120-23, 120-5
Crawford’s sedge 120-23
Sandhill crane 120-5
Pied-billed grebe 120-5, 53-43
Least bittern 120-5
Iowa darter 120-342g
Oak Grove Botanical Area (INAI) 94-12
±4 threatened and endangered species 120-6
Heron rookery 53-43

ENVIRONMENTAL CONSEQUENCES
4-46
Federal-listed Species. Based oncorrespondence provided from USFWS(2001), the federally-listed plant species, theeastern prairie fringed orchid (Platantheraleucophaea - Federally threatened, stateendangered), is known to occur at severallocations along the IL 83/US 45 with US 12Alternative.
IDNR (2000) has provided additionalinformation on the potential location of thisorchid species. Proposed improvements toInterstate 94 in the vicinity of the Oak GroveBotanical Area INAI site would partiallyimpact wetlands numbered 94-11, 94-13, and137-3. The eastern prairie fringed orchid isknown to occur in close proximity to thesewetlands, though not within the right-of-way ofthe proposed road way improvements. Theproposed improvements to Interstate 94 wouldbe within the existing right-of-way, thereforeno direct impacts to this species are anticipated.
USFWS has identified areas along the east sideof Interstate 94, north and south of the OakGrove Botanical Area INAI site that harbor theprairie white fringed orchid. Proposedimprovements to Interstate 94 in this locationwill be within the existing right-of-way.Therefore no direct impacts to this plant speciesis anticipated at these locations.
USFWS identified one other location, south ofIL 22 along IL 83 as harboring the prairie whitefringed orchid. The exact location of the plantrelative to the proposed improvements has notbeen provided. Therefore potential impacts tothis plant at this location cannot be ascertained.Detailed botanical surveys will be conducted inthis area if this alternative is selected.
State-Listed Species. Based oncorrespondence by IDNR (2000), severalstate-listed species are known to occur in closeproximity to improvements associated with theIL 83/US 45 with US 12 Alternative.Table 4-31 summarizes listed species knownto occur in or adjacent to wetlands identifiedwithin the IL 83/US 45 with US 12Alternative.
Six species of birds were identified within1.6 km (1 mi) of the proposed improvements(IDNR 2000): yellow-headed blackbird (stateendangered), pied-billed grebe (statethreatened), least bittern (state threatened),sandhill crane (state threatened), and red-shouldered hawk (state threatened); and eightspecies of plants: mountain blue-eyed grass(Sisyrinchium montanum; state endangered),pretty sedge (Carex woodii; state endangered),Crawford’s sedge (Carex crawfordii; statethreatened), and marsh speedwell (Veronicascutellata ; state threatened). Other plantspecies were identified for the naturepreserves and INAI sites within 1.6 km (1 mi)of this alternative, including dog violet (Violaconspersa, state threatened), heart-leavedplantain (Plantago cordata; state endangered),ill-scented trillium (Trillium erectum; stateendangered), purple-fringed orchid(Platanthera psycodes; state endangered), andthe northern cranebill (Geranium bicknelli;state endangered). No direct impacts areexpected to these bird or plant species fromthe IL 83/US 45 with US 12 Alternative.
Due to similarities in the alignments for theIL 83/US 45 with US 12 Alternative and theIL 53 Freeway/Tollway Alternative along120 near the Almond Marsh site, potential
TABLE 4-31Selected Wetlands Identified in the IL 83/US 45 with US 12 Alternative and Listed Species Observed in Them
Element Occurrence Adjacent to Wetland #
Sandhill crane 53-8, 53-7
Iowa darter 21-19
Oak Grove Botanical Area (INAI) 94-12
Eastern prairie fringed orchid 137-3, 94-11, 94-13
Mountain blue-eyed grass 12-4
±7 threatened and endangered species 60-9, 60-4, STM-26, STM-27, STM-28, 21-1
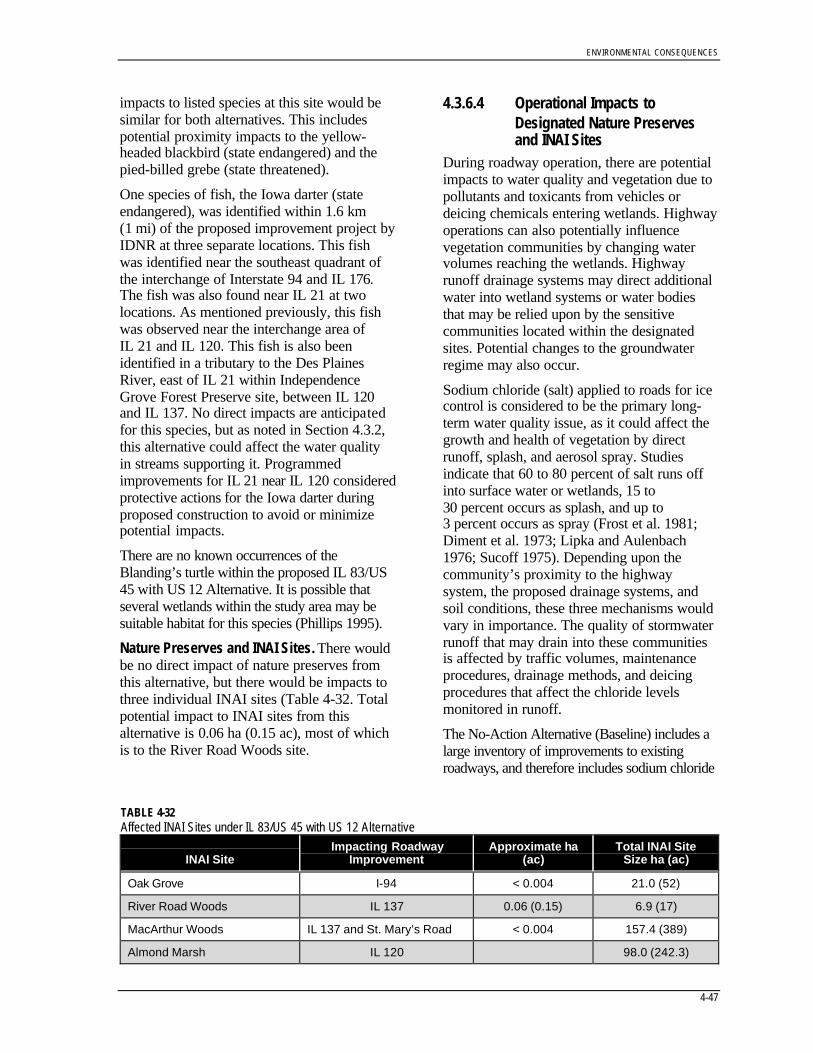
ENVIRONMENTAL CONSEQUENCES
4-47
impacts to listed species at this site would besimilar for both alternatives. This includespotential proximity impacts to the yellow-headed blackbird (state endangered) and thepied-billed grebe (state threatened).
One species of fish, the Iowa darter (stateendangered), was identified within 1.6 km(1 mi) of the proposed improvement project byIDNR at three separate locations. This fishwas identified near the southeast quadrant ofthe interchange of Interstate 94 and IL 176.The fish was also found near IL 21 at twolocations. As mentioned previously, this fishwas observed near the interchange area ofIL 21 and IL 120. This fish is also beenidentified in a tributary to the Des PlainesRiver, east of IL 21 within IndependenceGrove Forest Preserve site, between IL 120and IL 137. No direct impacts are anticipatedfor this species, but as noted in Section 4.3.2,this alternative could affect the water qualityin streams supporting it. Programmedimprovements for IL 21 near IL 120 consideredprotective actions for the Iowa darter duringproposed construction to avoid or minimizepotential impacts.
There are no known occurrences of theBlanding’s turtle within the proposed IL 83/US45 with US 12 Alternative. It is possible thatseveral wetlands within the study area may besuitable habitat for this species (Phillips 1995).
Nature Preserves and INAI Sites. There wouldbe no direct impact of nature preserves fromthis alternative, but there would be impacts tothree individual INAI sites (Table 4-32. Totalpotential impact to INAI sites from thisalternative is 0.06 ha (0.15 ac), most of whichis to the River Road Woods site.
4.3.6.4 Operational Impacts toDesignated Nature Preservesand INAI Sites
During roadway operation, there are potentialimpacts to water quality and vegetation due topollutants and toxicants from vehicles ordeicing chemicals entering wetlands. Highwayoperations can also potentially influencevegetation communities by changing watervolumes reaching the wetlands. Highwayrunoff drainage systems may direct additionalwater into wetland systems or water bodiesthat may be relied upon by the sensitivecommunities located within the designatedsites. Potential changes to the groundwaterregime may also occur.
Sodium chloride (salt) applied to roads for icecontrol is considered to be the primary long-term water quality issue, as it could affect thegrowth and health of vegetation by directrunoff, splash, and aerosol spray. Studiesindicate that 60 to 80 percent of salt runs offinto surface water or wetlands, 15 to30 percent occurs as splash, and up to3 percent occurs as spray (Frost et al. 1981;Diment et al. 1973; Lipka and Aulenbach1976; Sucoff 1975). Depending upon thecommunity’s proximity to the highwaysystem, the proposed drainage systems, andsoil conditions, these three mechanisms wouldvary in importance. The quality of stormwaterrunoff that may drain into these communitiesis affected by traffic volumes, maintenanceprocedures, drainage methods, and deicingprocedures that affect the chloride levelsmonitored in runoff.
The No-Action Alternative (Baseline) includes alarge inventory of improvements to existingroadways, and therefore includes sodium chloride
TABLE 4-32Affected INAI Sites under IL 83/US 45 with US 12 Alternative
INAI SiteImpacting Roadway
ImprovementApproximate ha
(ac)Total INAI Site
Size ha (ac)
Oak Grove I-94 < 0.004 21.0 (52)
River Road Woods IL 137 0.06 (0.15) 6.9 (17)
MacArthur Woods IL 137 and St. Mary’s Road < 0.004 157.4 (389)
Almond Marsh IL 120 98.0 (242.3)

ENVIRONMENTAL CONSEQUENCES
4-48
dispersion from deicing materials. The area ofmost concern is the Oak Grove Botanical Area,which would be subject to additional sodiumchloride dispersion from the proposed extensionof Pulaski Road. The new roadway would bisectthe northern half of the site and would increasethe area subject to sodium chloride. Two otherINAI sites affected by the project that would besubject to additional sodium chloride dispersioninclude the Buffalo Grove Prairie and the AlmondMarsh.
The IL 83/US 45 with US 12 Alternativeincludes numerous existing roadwayimprovements and therefore includesdispersion of sodium chloride from deicingmaterials. There would be some additionalimpacts from sodium chloride from addedimprovements along these routes. The areas ofmost concern are MacArthur Woods NaturePreserve, River Road Woods INAI Site,Ascension Sedge Meadow INAI Site, OakGrove Botanical Area INAI site, parts of theAlmond Marsh Nature Forest Preserve, partsof the Edward Ryerson Nature Preserve, LongGrove INAI site, Reed-Turner NaturePreserve, and parts of the Round Lake MarshINAI site.
The IL 53 Freeway/Tollway Alternative wouldintroduce sodium chloride dispersion to areasthat currently receive little or no splash orspray. The Almond Marsh Forest Preserve andADID high quality wetlands adjacent to thealignment would be the most importantresources potentially affected by sodiumchloride under this alternative.
4.3.6.5 Summary of Impacts toThreatened and EndangeredSpecies
Two alternatives (No-Action and IL 83/US 45with US 12) would affect three INAI sites.The most substantive impact would occurunder the No-Action Alternative (Baseline),which would involve the Oak Grove BotanicalArea (INAI site), with one federal-listed plantspecies. The IL 53 Freeway/TollwayAlternative would not affect any INAI sites.
Both the IL 53 Freeway/Tollway Alternativeand the IL 83/US 45 with US 12 Alternative
could affect one state-listed fish species (Iowadarter). Mitigation strategies for protecting thespecies are discussed in Section 4.3.6.1, No-Action Alternative (Baseline) State-listedSpecies. Based on correspondence with IDNR(2000) and USFWS (2001) , the projectalternatives would have no other direct impacton threatened and endangered species.
Future work associated with the preferredalternative would include detailed threatenedand endangered species field surveys todetermine presence or absence, and therequired consultation with the IDNR and theU.S. Fish and Wildlife Service.
4.4 Air QualityChicago Area Transportation Study isresponsible for analyzing regional air qualityconformity. The endorsed 2020 RTP includesan extension of IL 53 in Lake County as partof the plan. The 2020 RTP calls out specificfreeway/expressway and other major facilityimprovements; however, it includes onlyplaceholder values for arterial improvements.Neither build alternative is included in the TIPfor fiscal years 2001–2006. The 2020 RTP andthe TIP were found to conform by the FHWAand the Federal Transit Administration (FTA)on November 2, 2000. These findings were inaccordance with the USEPA regulationsentitled Criteria and Procedure forDetermining Conformity to State or FederalImplementation Plans of TransportationPlans, Programs, and Projects Funded orApproved Under Title 23 USC or the FederalTransit Act (40 C.F.R. Part 93). Future airquality analysis would require therecommended alternative to be assessed, aspart of a package of regional improvements,for air quality conformity with the appropriatefuture TIP.
In addition to the SIP requirements,metropolitan planning organizations (MPO)are required to undertake conformitydeterminations on metropolitan transportationplans and transportation improvementprograms before they are adopted, approved,or accepted. Section 176(c)(4) of the Clean

ENVIRONMENTAL CONSEQUENCES
4-49
Air Amendments of 1990 requires thattransportation plans, programs, and projectswhich are funded or approved underTitle 23 U.S.C. must be determined toconform to state or federal air implementationplans. Conformity to an implementation planis defined in the Clean Air Act as conformityto an implementation plan’s purpose ofeliminating or reducing the severity andnumber of violations of the NAAQS andachieving expeditious attainment of suchstandards. The implementing regulations fordetermining conformity of transportationprojects are found in 40 C.F.R. Part 93,Criteria and Procedures for DeterminingConformity to State or FederalImplementation Plans of TransportationPlans, Programs, and Projects Funded orApproved under Title 23 U.S.C. or the FederalTransit Act. Highway or transit projects whichare funded or approved by the FHWA or theFTA must also be included in a conformingplan before they are approved or funded by theDOT or an MPO.
In addition to the conformity analysis, amicro-scale carbon monoxide air qualityanalysis was also performed for the projectalternatives. This analysis employed the use ofthe Illinois Carbon Monoxide Screen forIntersection Modeling (COSIM).8 The detailedanalysis of local carbon monoxide levelsfocused on potential violations or excursions
8 A modeling program used to calculate the carbonmonoxide concentrations, based on intersectiongeometry, user inputs, and worst-case assumptions.
of the 8-hour carbon monoxide standard.Experience has shown that the 8-hour carbonmonoxide standard is more critical than the1-hour carbon monoxide standard. Theanalysis results were based on severalassumed conditions, including 2020 trafficconditions at the “worst case” intersections foreach project alternative. The selection of the“worst case” locations was guided byintersections with the highest peak trafficvolumes and nearby receptors sensitive to airquality (schools, homes, nursing homes, etc).
4.4.1 No-Action Alternative(Baseline)
The COSIM analysis evaluated the worst caselocation for the No-Action Alternative(Baseline) (Table 4-33). At this location, the8-hour carbon monoxide level was estimatedto be below the NAAQS of 9.0 parts permillion (ppm).
4.4.2 IL 53 Freeway/TollwayAlternative
The intersection of IL 53 and Lake-CookRoad, representing the worst case condition,was evaluated for the IL 53 Freeway/TollwayAlternative. The 8-hour carbon monoxideconcentration for a sensitive receptor near thisintersection was 6.6 ppm during the peaktravel period in 2020 (Table 4-33).
TABLE 4-33Carbon Monoxide Screening Analysis at “Worst Case” Locations
Alternative 8-hour Carbon Monoxide (ppm)
No-Action
Washington /O’Plaine Road 8.7
IL 53 Freeway/Tollway
IL 53/Lake-Cook Road 6.6
IL 83/US 45 with US 12
US 12/Lake-Cook Road 6.4

ENVIRONMENTAL CONSEQUENCES
4-50
The tollway option for this alternative couldproduce air quality conditions at toll plazalocations; therefore, an air quality analysis fora plaza location was also conducted. Thisanalysis required a detailed evaluation usingUSEPA’s air quality modeling softwareconsisting of CAL3QHC and Mobile 5a. Thepotential air quality effects of a toll plaza for2000 were evaluated assuming that the plazawould be equipped with manual lanes only, andstopped traffic at all lanes of the plaza. Theplaza arrangement was configured to reflect a“worst case” scenario for this analysis. Thecarbon monoxide concentration estimated forthe plaza condition would be 4.0 ppm for the8-hour carbon monoxide standard. This levelis well below the NAAQS of 9.0 ppm.
4.4.3 IL 83/US 45 withUS 12 Alternative
The air quality analysis for the IL 83/US 45with US 12 Alternative was conducted for theintersection of US 12 and Lake-Cook Road.The COSIM screening results show that carbonmonoxide would not be exceeded for theNAAQS standard at either location(Table 4-33).
4.4.4 Summary of Air QualityImpacts
Overall, the results of the air quality analysisshow that all of the project alternatives wouldbe below the 8-hour NAAQS for carbonmonoxide of 9.0 ppm.
4.5 NoiseThe potential effects of the traffic noise fromthe project alternatives are described below.The analysis was guided by the FHWApolicies and procedures, 23 C.F.R. 772, theIDOT Noise Analysis Policy datedApril 3, 2000, and the ISTHA Traffic NoiseStudy and Abatement Policy. However, for thistype of study, an exhaustive analysis would bepremature without additional detailedengineering of the proposed improvements. Thisassessment is intended to provide a relativemeasure of the potential affects of the
alternatives under consideration. A detailednoise assessment would occur during futurephases of work for the preferred alternative.
The noise assessment was guided by anobjective to determine the relative degree ofpotential noise impact across the range ofproject alternatives. To quantify the objective,the number of residential structures that haveidentified exterior activity that could beaffected by noise (experience traffic noiselevels that approach or exceed the FHWANoise Abatement Criteria (i.e., 67 dBA)) werequantified.
The IDOT policy defines noise impactsoccurring when design-year traffic noise levelsapproach or exceed the NAC, with approachdefined as 66 dBA for the residential NAC of67 dBA, or when design-year traffic noiselevels are at a substantial increase overexisting traffic generated noise levels, definedas an increase greater than 14 dBA.
The ISTHA policy states that once a site hasbeen studied, traffic noise abatement should beconsidered if the exterior traffic generated noiselevels at the site are at or above 67 dBA Leq (h),and that the proposed abatement at the site willachieve a minimum 5 dBA reduction in trafficgenerated noise levels. Reasonable efforts shallbe made to achieve reductions of 8 dBA.
The approach for this analysis required thatnoise impact zones be defined for theimprovements in each alternative (i.e., thedistance from the edge of roadway that theNAC would be approached or exceeded). Thenoise impact zones were determined with theuse of the Traffic Noise Model (TNM).9 Themodeling step defined typical traffic noiselevels for various roadway types representedin the project alternatives. Based on thedefined roadway conditions (i.e., future 2020traffic volume, traffic mix, and traffic speed,at ground elevation), the TNM look-up tableswere used to determine the typical noise levelsat various distances from the representativeroadways.
9TNM is the approved noise model for conductinghighway noise analysis by the Federal HighwayAdministration.

ENVIRONMENTAL CONSEQUENCES
4-51
Based on these typical noise level calculations,the NAC is approached or exceeded at adistance within 18 m (60 ft) for local/collectorroads, within 36 m (120 ft) for arterial roads,and within 98 m (320 ft) for freeways/tollwaysfrom the edge of pavement. These noiseimpact zones were applied to theimprovements for the project alternatives todetermine the potential number of residentialareas with exterior activity that could beaffected by noise levels greater than 66 dBA.Other sensitive receptors, such as hospitals,schools, churches, and special land uses, mayoccur in the noise impact zones, however,were not specifically identified. The noiseeffects for the alternatives described below donot include the use of noise abatementmeasures. It should be assumed that the use ofsuch measures, which will be examined andevaluated for the preferred alternative, willsubstantially reduce the number of affectedresidential areas with exterior activity. For thisanalysis, it is not practical to develop adetailed noise abatement strategy for such anextensive study area. This analysis does,however, indicate the comparative scale ofanticipated traffic noise impacts among theproject alternatives.
4.5.1 Noise Impacts
4.5.1.1 No-Action Alternative (Baseline)In residential areas along the No-ActionAlternative (Baseline), 1,211 properties haveidentified exterior activities that could beaffected by noise levels approaching orexceeding the NAC (Table 4-34, on thefollowing page). More than 1,100 of thestructures would be associated with arterialimprovements, whereas 100 of the structureswould be affected by improvements alongI-94. The number of potentially affectedproperties includes both single family andmulti-family structures and is based onexisting development. The largestconcentrations of affected properties are alongIL 22, IL 60, Buffalo Grove Road, ButterfieldRoad, and Washington Street. Developmentmay increase along any of these routes, so thenumbers are subject to change.
4.5.1.2 IL 53 Freeway/TollwayAlternative
In residential areas along the IL 53Freeway/Tollway Alternative, 417 propertieswould be affected with noise levelsapproaching or exceeding the NAC(Table 4-35, on page 4-53). The largestconcentration of affected residential areaswould be located along the north-southalignment in the vicinity of Hawley Street andIL 176. The number of potentially affectedresidential areas includes both single-familyand multi-family residences. Similar to otheralternatives, an increase in development is apossibility along any of these routes; therefore,this number may be subject to change in thefuture.
4.5.1.3 IL 83/US 45 withUS 12 Alternative
In residential areas along the IL 83/US 45 withUS 12 Alternative, approximately273 properties would be affected with noiselevels approaching or exceeding the NAC(Table 4-36, on page 4-53). About 50 percentof the potentially affected residential areas arelocated on IL 83, IL 21, and US 12. Theseresidential areas include both single-family andmulti-family residences. An increase indevelopment is a possibility along any of theseroutes; therefore, this number is subject tochange.
4.5.2 AbatementThis section outlines general noise abatementpractices applied to roadway projects. A moredetailed analysis, based on the alternativeselected, would be conducted to determine theappropriate abatement measures, theirfeasibility and reasonableness, and theirlocations during future phases of work.
A number of structural and nonstructuralabatement measures are available and havebeen proven through use in a variety ofsituations to reduce the traffic noise impacts.Examples of noise abatement measure aredescribed below and may serve as possiblemethods to reduce project related noise.

ENVIRONMENTAL CONSEQUENCES
4-52
Noise walls are commonly applied in urban andsuburban areas and are capable of achieving a5 dBA noise level reduction or more when tallenough to break the line of sight from the noisesource to the receiver. For a design goal of8 dBA minimum reduction, barrier heightsmust be taller; in practice, barriers 3.7 to 5.5 m(12 to 18 ft) in height are generally common.The reasonableness of a barrier is determinedby such factors as potential sound levelreduction, cost, aesthetics of the area, views ofaffected residents, and additionalenvironmental issues created.
Studies indicate that a change of 3 dBA is abarely perceivable change in the noise volumeheard. A change of 5 dBA is readilyperceived, and an increase/reduction of
10 dBA is perceived as being twice/half asloud.
Sound levels naturally attenuate due todistance. In other words, as the receiver ofnoise is moved away from the noise source,the noise level would decrease. Generally,sound from moving traffic noise sources willbe reduced 3 to 5 dBA with each doubling ofdistance. For instance, if the traffic noise levelis 60 dBA at 15 m (50 ft) from the roadway, itwill be 55 to 57 dBA at 30 m (100 ft)[15 m × 2 {50 ft × 2}] from the roadway. Thereduction is dependent upon the type of
TABLE 4-34Residences Within Noise Impact Zones for the No-Action Alternative (Baseline)
RoadwayResidences within
Noise Impacts Zone*
Bradley Road between IL 176 and Atkinson Avenue 0
Martin Luther King Drive between IL 41 and IL 131 38
Pulaski Road between IL 43 and O’Plaine Road 22
Sunset Avenue between Delaney Road and Greenbay Road 0
Rollins Road between IL 83 and US 45 7
IL 22 between US 14 and US 41 347
IL 21 between IL 137 and IL 120 11
Buffalo Grove Road between IL 22 and IL 83 95
Busch Road between IL 83 and Weiland Road 54
I-94 between Deerfield Road and IL 22 100
Weiland Road between Long Grove Road and Prairie Road 8
Lake-Cook Road between IL 83 and I-94 52
Butterfield Road between US 45 and Allanson Road; IL 176 and IL 137 105
IL 60 between Lake Road and IL 176 135
US 45 between IL 176 and Washington Street 50
Peterson Road between IL 60 and US 45 8
Hunt Club Road between Washington Street and IL 120 36
Midlothian Road at intersection with IL 60 0
Washington Street between Lake Street and I-94 143
Total 1,211
*Excludes residences that would be displaced by the improvement.

ENVIRONMENTAL CONSEQUENCES
4-53
TABLE 4-35Residences within the Noise Impact Zone for the IL 53 Freeway/Tollway Alternative
Roadway Residences within Noise Impacts Zone
IL 83 at intersection with New IL 53 36
Midlothian Road at intersection with New IL 53 46
Indian Creek Drive at intersection with New IL 53 9
Gilmer Road at intersection with New IL 53 1
New IL 53 between Old McHenry Road and Cuba Road 23
New IL 53 to 1 mile north of Cuba Road 1
New IL 53 between IL 83 and Hawley Street 67
New IL 53 between Hawley Street and IL 176 33
New IL 53 between IL 176 and Winchester Road 68
Fish Lake Road between IL 60 and IL 120 2
New IL 120 between Bacon Road and Alleghany Road 2
New IL 120 between IL 21/IL 137 and US 45 17
US 45 at intersection with New IL 120 20
IL 120 between US 45 and Almond Road 35
IL 120 between Almond Road and Hunt Club Road 7
IL 120 between Hunt Club Road and Milwaukee Road/IL 21 34
IL 120 between O’Plaine Road and IL 43 16
Total 417
*Excludes residences that would be displaced by the improvements
TABLE 4-36Residences within the Noise Impact Zone for the IL 83/US 45 with US 12 Alternative
Roadway Residences within Noise Impact Zone*
IL 83 between IL 53 and IL 120 47
Midlothian Road between Gilmer Road and Hawley Street 9
IL 120 between IL 83 and Almond Road 29
Alleghany Road between IL 120 and Peterson Road 5
Long Grove Road/IL 53 between IL 53 and IL 83 20
Rockland Road/IL 176 at the proposed intersection of the bypass 12
IL 21 between Lake-Cook Road and IL 60 43
St. Mary’s Road between IL 60 and IL 137 31
IL 137 between IL 21 and I-94 28
US 12 between IL 53 and IL 176 47
Hicks Road between Lake-Cook Road and Long Grove Road 2
Total 273
*Excludes the residences that would be displaced by the improvements

ENVIRONMENTAL CONSEQUENCES
4-54
ground cover. Soft surfaces such as grass willattenuate noise more than harder surfaces suchas pavement.
Certain conditions, including openings for sidestreets, driveways, and other accesses such assidewalks, stream crossings, recreational trails,and the presence of industrial and commercialdevelopment, are not conducive to the use oftraffic noise abatement barriers. Frequentbreaks or openings in a traffic noise abatementstructure created by the conditions describedabove substantially reduce and compromisethe effectiveness, feasibility, andreasonableness of traffic noise abatement.These conditions are typical of theIL 83/US 45 with US 12 Alternative, whichlimits potential implementation of abatementmeasures.
Other measures to reduce traffic noise includetraffic management measures, comprehensiveland-use planning and zoning in developingareas, and shifting the roadway location (noisesource) vertically and/or horizontally. Trafficmanagement measures can also be applied tolimit motor vehicle type, travel speed, trafficvolume, and/or time of operation. Thesemeasures and practices are most common onlocal streets and access within and aroundresidential, commercial, and industrial landuses, and are rarely applied to higher types ofroadways. Changes to the roadways’horizontal and vertical alignments generallyinvolve locating the roadway a sufficientdistance from noise-sensitive areas. Theseshifts are normally optimized as standardpractice to the extent feasible in the layout of aroadway design for the environs involved.This type of abatement is usually onlyconsidered and realistically available for aroadway being placed on a new alignment. Inareas where the roadway would be belowgrade, noise levels would be lower and noise
abatement may not be necessary. This type ofabatement is generally considered with aroadway improvement on a new alignment,although for a new highway, noise abatementoptions are more flexible and can beincorporated in the planning process. The mostefficient and overall effective traffic noiseabatement is accomplished through integratedand comprehensive land use planning andzoning through local communities andmunicipal jurisdictions.
4.5.3 Summary of Noise ImpactsNoise impacts for the project alternatives varywidely. The No-Action Alternative (Baseline)with its many kilometers of arterialimprovements would have the greatest noiseimpact on nearby residential structures(Table 4-37). Over 1,200 residential structuresfor this alternative would potentially exceed theNAC for residential properties. For the IL 53Freeway/ Tollway Alternative over400 residences would be affected and for theIL 83/US 45 with US 12 Alternative over270 residences would be affected. The noiseimpacts have been estimated without noiseabatement measures, which would most likelybe implemented at feasible locations for thepreferred alternative to reduce the effects oftraffic noise.
A number of structural and nonstructuralabatement measures are available and havebeen proven through use in a variety ofsituations to reduce the traffic noise impacts,such as noise walls, traffic managementmeasures, responsible comprehensive land-useplanning and zoning in developing areas, andshifting the roadway location (noise source)vertically and/or horizontally. The uses of thesemeasures, however, are affected by existingconditions such as closely spaced side streets ordriveways along the route designated for
TABLE 4-37Residential Noise Impact Summary
Alternative Potential Residential Structures Affected
No-Action 1,211
IL 53 Freeway/Tollway 417
IL 83/US 45 with US 12 273

ENVIRONMENTAL CONSEQUENCES
4-55
improvement. For these reasons, the feasibilityfor incorporating noise abatement measuresalong the improvements for IL 83/US 45 withUS 12 Alternative is more difficult toaccomplish. The IL 53 Freeway/TollwayAlternative, however, offers the potential forconsiderations of a number of abatementoptions (walls, depressed roadway sections,landscaping, etc.).
4.6 Cultural ResourceImpacts
The potential effects of the project alternativesupon cultural resources are described in thissection.10 The potential environmentalconsequences related to the projectalternatives were determined with the use ofexisting and available data and limited fieldreconnaissance. Overall, the assessment ofcultural resource impacts is intended toprovide a relative measure of the potentialeffects of the alternatives under consideration.
Numerous archaeological and structuralresources are located throughout the county.For each alternative, however, only a smallnumber of structures are likely to have thepotential to be eligible for the NRHP. TheState Historic Preservation Office (SHPO) hasnot rendered any opinion regarding thepotential eligibility of the structures describedbelow.
For this type of study, SHPO has agreed that afeasibility or preliminary assessment isappropriate, which provides an awareness ofpotential cultural resource effects. They haveadvised, however, that an extensive surveyinvestigation and determination of eligibilitywould occur during future phases of work for thepreferred alternative. Thus, activities such as thepreparation of eligibility forms typicallysubmitted to the SHPO for a determination ofpotential historic or archaeological sites will bepart of next phase of analysis for the preferredalternative. 10Due to the sensitive nature of historic andarchaeological resources, figures depicting the locationsof these sites have not been created for this section of thedocument.
During the assessment of cultural resources,an evaluation model was developed to predictthe potential for archaeological resources inthe study area based on known site locationsand soil types. The model output suggests thatthere is high potential for undiscoveredarchaeological resources in a number oflocations throughout the county.
4.6.1 No-Action Alternative(Baseline)
As indicated in Section 2, a review of culturalresource records showed that numerous historicsites and structures are present throughout thecounty. There are 10 recorded archaeologicalsites within or near the existing or proposedright-of-way for the No-Action Alternative(Baseline) (Table 4-38, on the following page).These sites would require field verificationshould they be affected by this alternative. Twoof these sites are known to be Native Americanburial sites; however, their precise location andinvolvement by the No-Action Alternative(Baseline) needs to be confirmed during futuresteps of this project.
For the No-Action Alternative (Baseline),historic properties have only been identifiedwhere Phase 1 preliminary engineering anddetailed environmental studies have beenadvanced and potential impacts identified.Given the expansiveness of the alternative, itwas not practicable to assess other potentialhistoric impacts. Based on availableengineering and environmental documents,there are 13 historic sites that could potentiallybe affected by this alternative. One of thesestructures, the St. Sava Monastery, is on theNRHP. Four residences, which are part of alarger historic district, may be eligible for theNRHP. There are six other locally importantsites, and two county landmarks that couldpotentially be affected by this alternative. Forboth historic and archaeological resourcespotentially affected by this alternative, furtherroadway refinements are expected in futurephases of work which may avoid or reduceinvolvement or impact to these resources(Table 4-39, on the following page).

ENVIRONMENTAL CONSEQUENCES
4-56
4.6.2 IL 53 Freeway/TollwayAlternative
Four recorded archaeological sites are locatedwithin the existing or proposed right-of-way(Table 4-40, on the following page). These sitesinclude a historic farmstead, two prehistoricsites of unknown cultural affiliation, and anabandoned historic cemetery. A reconnaissancesurvey confirmed the presence of the cemeteryand noted its neglected condition. For bothhistoric and archaeological resourcespotentially affected by this alternative, furtherroadway refinements are expected in futurephases of work which may avoid or reduceinvolvement or impact to these resources.
Of the historic sites reviewed along theproposed roadway improvements for the IL 53Freeway/Tollway Alternative, three structureswere found which have the potential to beeligible for inclusion on the NRHP(Figure 4-22, and Table 4-41, on the followingpage). These structures, which may be subjectto Section 106, are all farmhouses with barns.Based on the current concept, the IL 53Freeway/Tollway Alternative would directlyimpact all three of these structures.
4.6.3 IL 83/US 45 withUS 12 Alternative
Two recorded archaeological sites are locatedwithin the existing or proposed right-of-way of
TABLE 4-38Potentially Involved Archaeological Sites
Type of Site General Affiliation
Habitation and Commercial Historic
Habitation and Commercial Historic
Habitation and Commercial Historic
Burial, camp Prehistoric
Burial Prehistoric
Commercial Historic
Unknown Historic
Habitation Historic
Habitation and commercial Historic
Habitation Historic
Due to the sensitivity of potential archaeological sites, location and other distinguishing information are notdisclosed.
TABLE 4-39Potentially Involved Eligible Historic Properties
Property Location Description
Monastery IL 21 between IL 137 andWashington St.
St. Sava Monastery (on NRHP): 0.04 ha (0.1 ac) of a temporaryconstruction easement
Farms IL 21 between IL 137 andWashington St.
0.4 ha (1 ac) from two county designated landmarks:Stonehenge Farm and a Centennial Farm
Local Sites IL 22 between US 14 andQuentin Rd
6 sites of local historic importance; however, none of the siteswould be affected if the bypass alternative were selected
HistoricDistrict
IL 22 between IL 83 and US 41 Stone Gate Circle Historic District: a retaining wall would beconstructed on the property line of 4 houses.
Only historic sites identified as part of other Phase 1 project have been identified for the No-Action Alternative(Baseline).

ENVIRONMENTAL CONSEQUENCES
4-57
this alternative (Table 4-42, on the followingpage). These sites would require evaluation ifthey should be affected by this alternative. Bothsites are prehistoric archaeological sites, withone dating from 8,000 BC to 800 AD. Theother is a Native American burial mound datingfrom as early as 2,500 BC to as recent as800 AD. These sites have not been confirmedto still be in existence. For both historic andarchaeological resources potentially effected bythis alternative, further roadway refinementswould be expected in future phases of workwhich may reduce involvement or impact tothese resources.
Of the historic sites reviewed, one structurealong the proposed roadway improvements forthe IL 83/US 45 with US 12 Alternative islisted on the NRHP, the David Adler CulturalCenter. In addition, five structures were foundthat have the potential to be eligible forinclusion on the NRHP (Figure 4-23). These
additional structures, which may be subject toSection 106, are a horse stable, two residences,one residence with a barn, and one residencewith one set of building entrance piers. All ofthese structures would be directly affected bythe IL 83/US 45 with US 12 improvements(Table 4-43, on the following page).
4.6.4 Summary of CulturalResource Impacts
The assessment of potential historical andarchaeological impacts relied upon the use ofexisting and available data only, and onlylimited field observations and reconnaissance.The assessment included neither extensivefield investigation, nor determination ofeligibility for sites with potential historic orarchaeological value. The scope of theanalysis, however, was considered appropriatefor a preliminary cultural resource assessmentof the study area, the wide range of
TABLE 4-40Potentially Involved Archaeological Sites
Type of Site General Affiliation
Burial, camp Prehistoric
Cemetery Historic
Farmstead Historic
Camp Prehistoric
Due to the sensitivity of potential archaeological sites, location and other distinguishing information is notdisclosed.
TABLE 4-41Potentially Involved Eligible Historic Properties
Property Location Description
Residence House with barn nearthe intersection ofIL 83 and IL 137
House: 1.5 story; clapboarded; gable-front main block with cornicereturns; gabled ell; asphalt roof; historic front porch with bands of tallwindows that feature six-pane transoms. Contemporary barn: gambrelroof with a hay hood; shed roof dormer with a 6-over-6, double-hungsash window; vertical board siding; 4-pane garage doors.
Residence House with barn nearthe intersection ofI-94 and IL 120
House: 2-story; gabled (T-plan); clapboarded; 2-over-2 and 6-over-6,double-hung, wood sash windows; molded window hoods; 1-story, wrap-around porch on ell. Contemporary garage: asphalt, gable roof; 6-over-6,double-hung, wood sash windows; multiple hinged, 4-pane doors.
Residence House with shed andbarn near theintersection of HicksRoad and LongGrove Road
House: 2-story; clapboarded; multiple additions; asphalt roof; 6-over-1,double-hung, wood sash windows predominate; historic, clapboardedutility shed and garage; gambrel roof barn and 1-story, stuccoedoutbuilding on the other side of the fence may have been historicallyassociated with this property.

ENVIRONMENTAL CONSEQUENCES
4-58
alternatives considered, and the concept stageof engineering detail, with the understandingthat future engineering steps would furtherminimize or eliminate effect to theseresources. The resource agencies involved inthe study, including the IHPA, have concurred
that this level of detail is appropriate for ananalysis of feasible alternatives.
Throughout this study, efforts to avoid orminimize impacts to important environmentaland social resources, including historical andarchaeological resources, have taken place.These efforts have included reduced roadwayfootprints in spot locations and roadwayalignment shifts. For example, some of themajor shifts included the use of communitybypasses to avoid important communityresources. Future steps for the preferredalternative will include further efforts to avoidor minimize possible effects, fieldinvestigations fully compliant with the currentpractices, and identification of mitigationmeasures where impact is unavoidable.
TABLE 4-42Potentially Involved Archaeological Sites
Type of Site General Affiliation
Mound Unknown
Burial, camp Prehistoric
Due to the sensitivity of potential archaeologicalsites, location and other distinguishinginformation is not disclosed.
TABLE 4-43Potentially Involved Eligible Historic Properties
Property Location Description
ForestPreserveOffice(GraingerWoods)
Forest Preserve officenear the intersection ofSt. Mary’s Road andIL 60
Forest Preserve office: 2-story; decorative half-timbered upperstory; stuccoed; asphalt gambrel roof; brick foundation abovegrade; multi-pane windows; brick window sills; associated historicstuccoed stables and modern stables.
Residence House near theintersection of St. Mary’sRoad and IL 176
House: Tudor Revival style; 1.5-story; half-timbered; stuccoed; woodshingle, steeply-pitched, side-gable roof; wood sash bay windows;modern casement windows; brick window sills; exterior chimneycomposed of a cut-stone, irregular-coursed lower-half and brick upper-half; unsympathetic, 1-story, shed-roof rear addition; modern, detachedgarage.
CulturalCenter (DavidAdler)
Listed on the NationalRegister of HistoricPlaces, located near theintersection of IL 21 andIL 137
Center: large, linear complex of attached buildings; cross-gablemain block; stuccoed; wood shingle roof; 6-over-6, double-hung,wood sash windows predominate; fanlight over street-facingentrance on the main block; multiple chimneys; corner tower.
Residenceand EntrancePiers
House near theintersection of I-94 andIL 60
House: 2.5-story; wood shingle, gable roof; vinyl-siding; arched andmulti-pane windows; 2 corbeled chimneys. Stables: 1-story with1.5-story, gable-front blocks; east end appears to have beenconverted into a residence. Two sets of wood entrance piers
Residence House near theintersection of HicksRoad and Long GroveRoad
House: 2-story; clapboarded; multiple additions; asphalt roof; 6-over-1, double-hung, wood sash windows predominate; historic,clapboarded utility shed and garage; gambrel roof barn and 1-story,stuccoed outbuilding on the other side of the fence may have beenhistorically associated with this property.
Residence House near theintersection of Hick Roadand Old Hicks Road
House: Queen Anne style; 2-story with a 1.5 story rear wing; gable-front, wood shingle roof; gableboard with spindlework; brickfoundation; wood clapboards; alternating fishscale and cove woodshingles in the peak of the gable; 1-over-1, double-hung, woodsash windows with ornamental hoods; 1-story porch withspindlework on the east facade of the wing.

ENVIRONMENTAL CONSEQUENCES
4-59
Agency coordination would occur during thisphase including federal agencies, SHPO,Tribal Historic Preservation Officers, Indiantribes, local governments, and other publicparties.
Table 4-44 summarizes the potentiallyaffected historic and archaeological resources.
4.7 Special WasteA special waste database search wasconducted to identify known or potentialcontamination from regulated substanceswithin the proposed corridors for projectalternatives. The existence of special waste inthe study area was reviewed to identify currentand historical activities on or near the roadwayimprovements. The information contained inthis document relied upon reasonablyascertainable site information provided byothers. A search was conducted of standardfederal, state, and local environmentaldatabases. The following is a partial list of theprincipal databases searched to identifygenerator and transporters of hazardouswastes; hazardous waste treatment, storage,and disposal facilities; and sites where releasesof hazardous materials have been reported:
• USEPA Comprehensive EnvironmentalResponse, Compensation, and LiabilityInformation System (CERCLIS) list ofsites either proposed for or on the NationalPriorities List (NPL), and sites in thescreening and assessment phase forpossible inclusion on the NPL (last update4/00)
• USEPA NPL of uncontrolled orabandoned hazardous waste sitesidentified for priority remedial action (lastupdate 6/00)
• USEPA Resource Conservation andRecovery Information System (RCRIS)list of sites that generate, transport, store,treat, or dispose of hazardous waste (lastupdate 6/00)
• USEPA database of ResourceConservation and Recovery Act (RCRA)facilities undergoing corrective action(CORRACTS) because there was a releaseof hazardous waste or constituents into theenvironment from a RCRA facility (lastupdate 4/00)
• U. S. Department of Transportation(USDOT) Hazardous MaterialsInformation Reporting System (HMIRS)lists hazardous material spill incidents(last update 6/99)
• Illinois Environmental Protection Agency(IEPA) State Hazardous Waste Sites(SHWS) lists sites that may or may not belisted on the CERCLIS list (last update1/00)
• IEPA Available Disposal for Solid Wastein Illinois (LF) lists solid waste disposalfacilities or landfills in Illinois (last update5/00)
• IEPA database of Leaking UndergroundStorage Tank (LUST) sites with reportedLUST incidents (last update 7/00)
A site reconnaissance also was performed,consisting of a windshield survey to verify site
TABLE 4-44Potentially Affected Historic and Archaeological Resources
AlternativeHistoric
StructuresArchaeological
Sites
No-Action Alternative(Baseline)
13* 10
IL 53 Freeway/Tollway 3 4
IL 83/US 45 with US 12 6 2
*Based on available Phase 1 preliminary engineeringand environmental documentation reports.

ENVIRONMENTAL CONSEQUENCES
4-60
locations from the database. Otherinvestigations consisting of sampling,monitoring, analytical, geotechnical, and siteowner interviews were not conducted. Thedatabase search concluded that eachalternative could encounter uncontrolledspecial waste sites, above ground storagetanks, or LUSTs.
A broad risk assessment was applied to eachproject alternative based upon the types ofsites encountered. The ranking guidelineswere based primarily on the environmentaldatabase and records review. This rankingsystem ranges from 1, indicating a propertywith a high potential forcontamination/cleanup costs, to 3, indicatingno evidence of releases.
• Rank 1—High Risk: Sites identified asrequiring rigorous remediation(i.e., RCRIS-TSD, State Hazardous Wastesite, CERCLIS, CORRACTS, RAATS)
• Rank 2—Moderate Risk: LUST sitesexcept those with a No Further Action(NFA) designation by IEPA.
• Rank 3—Low Risk: Sites using hazardousmaterials but having no indication ofreleases from those materials.
4.7.1 No-Action Alternative(Baseline)
The No-Action Alternative (Baseline) wouldnot directly affect any CERCLIS sites. TwoCERCLIS sites are within 1.6 km (1 mi) ofimprovements (Figure 4-24). Grayslake Gelatinis 1.6 km (1 mi) south of Washington Street inGrayslake. Peterson Sand and Gravel is 0.8 km(0.5 mi) east of the intersection of IL 21 andIL 137. (This site however was purchased bythe Lake County Forest Preserve in the late1980’s and subsequently cleaned up.) Thepotential for this alternative to encounter anycontaminants from either site is low. TwentyLUST sites are within the proposed right-of-way for the No-Action Alternative (Baseline)improvements, and 27 LUST sites immediatelyoutside the proposed right-of-way for thisalternative’s improvements. The potential riskfor this alternative related to the LUST sites is
moderate. It is anticipated that some or many ofthese sites have releases that would affect theright-of-way and would require cleanup.
4.7.2 IL 53 Freeway/TollwayAlternative
The IL 53 Freeway/Tollway Alternative wouldnot directly affect any CERCLIS sites. Theinventory of known sites shows that six sites(Figure 4-25) would be within 1.6 km (1 mi)of the improvements for the IL 53Freeway/Tollway Alternative, including theARF Landfill (now Waste ManagementCountryside Landfill), Skokie Valley Asphalt(now Curran Contracting), Grayslake Gelatin,and EDCO/S&S Landfill, all in Grayslake.Near the south end of proposed improvements,the Arlington Heights Landfill and LennonWallpaper (Cook County) are also within1.6 km (1 mi) of the proposed improvements.The potential for this alternative to encounterany contaminants from these sites is low. Theproposed IL 53 Freeway/Tollway Alternativeis mainly on new alignment; therefore, thisalternative would encounter few LUST sites, ifany, along the mainline improvement.However, three LUST sites may be affectedalong feeder road improvements for thisalternative. Overall, the potential riskassociated with this alternative related to theLUST sites would be low.
4.7.3 IL 83/US 45 withUS 12 Alternative
The IL 83/US 45 with US 12 Alternative mayrequire a permanent easement from one listedCERCLIS site. The site, Peterson Sand andGravel, was purchased by the Lake CountyForest Preserve in the early 1980s andsubsequently cleaned up. Other known siteswithin 1.6 km (1 mi) of improvements for thisalternative include the ARF Landfill (nowWaste Management Countryside Landfill),Skokie Valley Asphalt (now CurranContracting), Grayslake Gelatin, andEDCO/S&S Landfill, all in Grayslake; andLakeland Estates in Wauconda, within 0.8 km(0.5 mi) northeast of the IL 59 and US 12interchange. At the south end of IL 53, in Cook

ENVIRONMENTAL CONSEQUENCES
4-61
County, the Arlington Heights Landfill andLennon Wallpaper are within 1.6 km (1 mi) ofthe project alternative (Figure 4-26). None ofthe CERCLIS-listed sites would pose a risk forthis alternative. Thirty-four LUST sites arewithin the proposed rights-of-way for theseimprovements. Fourteen other sites areimmediately outside the right-of-way for theimprovements. Based on the guidelinesestablished above, the risk associated with thisalternative related to the LUST sites would bemoderate. It is anticipated that some or many ofthese sites have releases that would affect theright-of-way and would require cleanup.
4.7.4 Summary of Special WasteThe three alternatives would have differentaffects upon special waste sites. None woulddirectly involve any CERCLIS sites. Thealternatives would principally affect LUSTsites. The IL 83/US 45 with US 12 Alternativecould involve 34 sites and the No-ActionAlternative (Baseline) 20; the IL 53Freeway/Tollway Alternative would havethree encroachments. In cases where a sitecannot be avoided, further investigationswould be conducted for the preferredalternative to determine the extent, and theareas of contamination would be managed anddisposed of in accordance with Federal andState laws and regulations and in a mannerthat would protect human health and theenvironment.
4.8 Section 4(f)Considerations
The Section 4(f) analysis identified thepotential impact to protected resources; that is,of publicly-owned public parks, recreationareas, wildlife and waterfowl refuges, andhistoric sites of national, state, or localsignificance. This assessment is intended toidentify Section 4(f) resources likely to beinvolved, and to inform resource agencies andothers of the potential involvement. It is fullyrecognized that further definition of the impactsand coordination with responsible jurisdictionagencies is necessary to determine the level of
impact, if any, and appropriate mitigation infuture phases of work for the preferredalternative. This section describes potentialSection 4(f) impacts identified based uponavailable data and field reconnaissanceappropriate for this level of analysis; however,future refinements could modify or eliminatethe effects upon these resources. Throughfuture stages of engineering analysis andrefinement, this potential impact will be betterunderstood and subsequently coordinatedfurther with the responsible jurisdictionagencies.
As discussed in Section 3, Alternatives, theLCTIP alternatives development processconsidered environmental and societalresources throughout the study. Considerableefforts were made to avoid and/or minimizeimpacts to these resources, including Section4(f) resources. These efforts resulted in lessthan 0.03 percent of impacts to parks in LakeCounty (across the range of alternativesconsidered--1.2 to 2.8 ha [3 to 7 ac] of parklandimpacts), and less than 0.06 percent of impactsto forest preserve land in Lake County (acrossthe range of alternatives considered—1.2 to6.5 ha [3 to 16 ac]). Although, these effortssucceeded in minimizing resource impacts,each of the alternatives would have someimpact on Section 4(f) resources. Further, giventhe large area covered by the alternatives, thedifferences between alternative impacts werenot considered distinguishable . Therefore, atthis stage of development and level ofengineering detail it was not possible to dismissalternatives because of a Section 4(f)involvement. As a result, alternatives dismissedearlier in the process may need to be revisitedas part of future studies.
Formal Section (4) designation and evaluationwill be the subject of future studies, toconclusively identify the nature and extent ofany Section 4(f) impact. Thus, activities such asthe preparation of eligibility forms typicallysubmitted to the SHPO for a determination ofpotential historic or archaeological sites will bepart of next phase of analysis.
In this section standing structures, forestpreserve and local park impacts that may

ENVIRONMENTAL CONSEQUENCES
4-62
require Section 4(f) coordination areidentified. Standing structures are alsodiscussed in Section 4.6, Cultural ResourceImpacts. At this point no state or federalrecreation lands and wildlife refuges impactshave been identified.
4.8.1 Description of PotentiallyInvolved 4(f) Resources
Section 4(f) resources that may be involvedinclude county forest preserve lands, localparks, and standing structures. In Lake Countythese resources are abundant, with more than8,090 ha (20,000 ac) of forest preserve, over6,070 ha (15,000 ac) of local parks, andnumerous standing historical structures. Afterthree successive rounds of engineeringrefinements to avoid impacts to theseresources, some sites may still be involved.Following is a description of the potentiallyinvolved Section 4(f) resources.
Nineteen Lake County forest preserves areidentified as Section 4(f) properties that liewithin the No-Action Alternative (Baseline) orbuild alternatives. Table 4-45 (on pages 4-63through 4-65) lists the properties, theiramenities, and uses. Eighteen local municipalparks have been identified as Section 4(f)resources that lie within the No-ActionAlternative (Baseline) or build alternatives.Table 4-46 (on page 4-66) lists the properties,their amenities, recreational uses, and operatingentities. Twenty-two eligible historic propertiesare identified as Section 4(f) properties thatmay lie within the No-Action Alternative(Baseline) or build alternatives. Eligibility isbased on whether a site is included on oreligible for inclusion on the NRHP. Thepotentially involved properties are described inTable 4-47 (on page 4-67 and 4-68). However,for the No-Action Alternative (Baseline)projects, historic properties have been identifiedonly where Phase 1 preliminary engineeringand detailed environmental studies have beenadvanced and potential impacts identified.Given the expansiveness of the alternatives, itwas not practicable to assess whether therewere other potentially eligible historic sites forthe No-Action Alternative (Baseline). Asagreed to by the IHPA, cultural resources will
be evaluated in greater detail under thepreferred alternative to determine eligibility forinclusion in the NRHP.
4.8.2 Potential Section 4(f)Resource Impacts
4.8.2.1 No-Action Alternative (Baseline)The No-Action Alternative (Baseline) couldpotentially affect 22 Section 4(f) forestpreserve and local park properties throughoutLake County (Table 4-48, on page 4-69, andFigure 4-27). Generally, encroachment ofthese properties would be less than 1 percentof the total land area. However, there are twoexceptions: both the Bannockburn ForestPreserve and Heather Ridge Golf Coursewould have larger area uses of 2.1 percent and20.4 percent, respectively.
Most of the impacts are minor, requiring smallamounts of land, most developed facilities andrecreational use areas associated with theSection 4(f) properties would not be involved.Most of the impacts would affect the edges ofthe properties and would have little influenceon developed facilities or natural resources.There are several exceptions, however,including potential impacts to recreationaltrails at Rollins Savanna, Deer Grove, andPrairie Wolf Forest Preserve; wetlandinvolvement at Site 15; potential impacts tospecial habitat at Rollins Savanna; andpotential impact to golf course operations atHeather Ridge.
The No-Action Alternative (Baseline) couldpotentially impact 14 LCFPD properties andeight local parks, with an estimated total lossof 6.9 ha (17.14 ac), representing less than1 percent of the total area associated with theaffected properties. Overall, the potentialimpacts to individual sites are small; however,one site potentially has an impact greater than1 percent of the total land area for the site(Table 4-48).

ENVIRONMENTAL CONSEQUENCES
4-63
TABLE 4-45Potentially Involved Lake County Forest Preserves
Parcel Location Size Description of Lake County Forest Preserves
Almond Marsh South of IL 120 and east of US 45,along an unnamed tributary to the DesPlaines River
124 ha(306 ac)
The site incorporates an INAI site of the same name and two nature preservesidentified as Almond Marsh and Oak Openings. A third nature preserve is 1.2 km (0.75mi) south (Liberty Prairie Nature Preserve). No developed facilities are present.
River Hill North of IL 120, east of IL 21, immediatelysouth of Gurnee Woods
90 ha(224 ac)
This preserve is bisected by the Des Plaines River. There are no nature preserves orINAI sites associated with this preserve, nor any developed facilities.
Buffalo CreekForestPreserve
North of Lake-Cook Road, betweenArlington Heights Road and IL 53
160 ha(416 ac)
Includes tall-grass prairie with some small wetlands and Buffalo Creek. A wide rangeof birds, such as bobolinks, meadowlarks, and pheasants, occupy this preserve, andthe state endangered Cormorant has been recorded at this site. Activities and facilitiesat Buffalo Creek include trails, picnic facilities, parking, and fishing. There are nonature preserves or INAI sites. Parts of this site were purchased with OSLAD funds. Ifit is determined that there would be impact this portion of the site as a part of futureanalysis, there would need to be coordination with IDNR similar to the coordinationprocedures for Section 6(f) properties.
CountrysideGolf Course
West of US 45/IL 60 and both north andsouth of Hawley Road in Mundelein
200 ha(494 ac)
Amenities include the golf course, banquet facilities, pro shop, driving range, parking,restrooms, and concessions.
Wright Woods South to IL 22 from Grainger Woods onthe north and its western boundary ofIL 21
132 ha(327 ac)
Includes a rich oak and maple woodland. Pretty sedge (Carex woodii), a state-listedendangered species, is found at this site. Activities include fishing and facilities includetrails, parking, restrooms, and picnic and playground areas. A trail extends south 1.6 km(1 mi) to Ryerson Woods and is not contiguous to the Des Plaines River. The DesPlaines River bisects most of this site.
GraingerWoods
Southeastern Lake County nearMettawa, south of MacArthur Woods
104 ha(257 ac)
The purple-fringed orchid (Habenaria peramoena) is a federal (threatened) and state-listed endangered species found in this forest preserve. Activities and facilities arelimited to equestrian lessons and boarding. The 43 ha (105 ac) Lloyd’s Woods NaturePreserve is between the Grainger Woods and Wright Woods/Half Day Forest preserveon the south. A majority of the Grainger Woods Site is roughly 0.8 km (0.5 mi) east ofthe Des Plaines River, but a narrow belt of land extends along the river connecting thissite to MacArthur Woods and Wright Woods.
Half DayWoods
East of Wright Woods 81 ha(201 ac)
This preserve consists of oaks and stands of native prairie. Activities include fishingand ice-skating. Facilities at this preserve include trails, picnic and playground areas,and an athletic field. This site extends over the watershed divide into the ChicagoRiver basin. There are no nature preserves or INAI sites associated with either WrightWoods or Half-Day Woods.

ENVIRONMENTAL CONSEQUENCES
4-64
TABLE 4-45 CONTINUEDPotentially Involved Lake County Forest Preserves
Parcel Location Size Description of Lake County Forest Preserves
MacArthurWoods ForestPreserve
South of the EJ&E Railroad on the eastside of the Des Plaines River and northof IL 60
207 ha(511 ac)
Includes a dedicated nature preserve located in the eastern portion of the woods. Thesouthern portion of this site extends along the river to Grainger and Wright Woods.This site incorporates both a nature preserve and an INAI site of the same name. Nodeveloped facilities are present.
IndependenceGrove
South of River Hill, immediately north ofIL 137
448 ha(1,106 ac)
Currently under development in central Lake County along the Des Plaines River. TheLCFPD headquarters are located at Independence Grove, and amenities include a dogexercise area and trails. This site includes a wetland restoration site east of IL 21. Thereare no nature preserves adjacent to this site, but the 19 ha (47 ac) Liberty Prairie NaturePreserve is located roughly 0.8 ha (0.5 mi) west of Independence Grove. The St. FrancisBoys Camp and the River Road Woods INAI sites are located within the boundaries of thisforest preserve site, east of the Des Plaines River.
WilmontWoods ForestPreserve
South of IL 137 and east of IL 21 57 ha(142 ac)
There are multiple-use trails within the site. This site is located at the confluence ofMeadow Haven Creek, Tributary Number 1, and the Des Plaines River.
Old SchoolForestPreserve
Near Libertyville in south-central LakeCounty, south of IL 176. The westernboundary is St. Mary’s Road and theeastern boundary is I-94. A portion ofthe site extends west of St. Mary’sRoad to the Des Plaines River
200 ha(494 ac)
Includes oak woodlands and small prairies. This land was acquired in parcels between1974 and 1976. This was the first forest preserve in Illinois to combine native prairierestoration with recreational facilities. Wildlife includes bluebirds, fox, and owls. Activitiesinclude trails, fishing, picnic and playground facilities, parking, restroom facilities,sledding, and sports fields. This preserve is connected by trails north of IL 176 toIndependence Grove and Wilmont to the north (1.6 km [1 mi]) and via a greenbelt alongthe EJ&E railroad to MacArthur Woods, roughly 0.8 hectare (0.5 mile) south. There is a0.3 ha (0.75 mi) section of the river between Old School and MacArthur Woods thatdoes not contain forest preserves or trails, disrupting the continuous greenbelt to theWisconsin border along the river. There are no nature preserves or INAI sites.
BannockburnForest Parcel
2.4 km (1.5 mi) east of Ryerson Woodsand 1.6 km (1mi) southwest of PrairieWolf Forest Preserve
32 ha(79 ac)
Bannockburn Forest Preserve is a small isolated preserve. A portion of the East Forkof the Chicago River runs through this site. There are no nature preserves or INAIsites associated with this preserve, nor developed facilities.
Prairie WolfForestPreserve
Along IL 60 about 1.6 km (1 mi) east ofI-94.
175 ha(431 ac)
Prairie Wolf is a new development that includes a wetland restoration site. Activities includebiking, skiing, and hiking trails. This site extends nearly 3.2 km (2 mi) along the Middle Fork. Acomplex of small nature preserves and INAI sites are located 0.8 km (0.5 mi) east of thisforest preserve. The nature preserves are Highmoor Park and Hybernia. The INAI sites areknown as the Hybernia-Highmoor Prairie.
Des PlainesRiver Trail
South of IL 173 along the Des PlainesRiver.
1,342 ha(3,314 ac)
Incorporates parts of the Wadsworth Prairie Nature Preserve and the WadsworthPrairie and Savanna INAI sites. No developed facilities are present at the site.

ENVIRONMENTAL CONSEQUENCES
4-65
TABLE 4-45 CONTINUEDPotentially Involved Lake County Forest Preserves
Parcel Location Size Description of Lake County Forest Preserves
Site 15 Along the Middle Fork of the NorthBranch of the Chicago River, south ofIL 137
31 ha(77 ac)
This site is at the south end of an extensive ADID wetland area that extends northalong the Middle Fork. There are no nature preserves near this site, but three smallINAI sites are associated with Site 15, including two separate sites known as the OakGrove White Fringed Orchid Site North, and the Oak Grove White Fringed Orchid Site.These INAI sites lie immediately adjacent to the Union Pacific Railroad tracks. Nodeveloped facilities are present at this site.
RyersonWoods
Situated on the east side of the DesPlaines River and extends from south ofDuffy Lane to the Cook County Line
223 ha(550 ac)
Land was donated to the Lake County Forest Preserve beginning in 1966. Several rarespecies are found in Ryerson Woods including the spotted salamander (Ambystomamaculatum), blue-spotted salamander (Ambystoma sp.), and wood frog (Rana sylvatica);state threatened or endangered species eastern massasauga rattlesnake (Sistruruscatenatus), red-shouldered hawk (Buteo lineatus), veery (Catharus fuscescens), and thepurple-fringed orchid are also present. This nature preserve houses a rare northernflatwoods forest and has most of the high quality floodplain forest that remains innortheastern Illinois. Activities and facilities include a visitor/nature center, banquetfacilities, and trails. Approximately 113 ha (279 ac) are dedicated Illinois nature preservesof the same name. The Edward Ryerson Conservation INAI site is incorporated partiallywithin the boundaries of this forest preserve site and the Hermann’s Woods INAI sites is0.16 km (0.1 mi) east of Ryerson Woods Forest Preserve. Ryerson Woods forms a lineargreenbelt along the Des Plaines River for almost 42 km (26 mi).
Deer GroveForestPreserve
Between Ela and Hicks Roads and northof Dundee Road in Cook County
729 ha(1,800 ac)
This forest preserve has bicycle and equestrian trails, walking paths, and picnicshelters. This forest preserve can be accessed from either Dundee or Quentin Road.
RollinsSavanna
Immediately west of US 45 and ThirdLake, south of Rollins Road in centralLake County
496 ha(1,224 ac)
State-listed endangered species found at this site include such fish as the Iowa darter(Etheostoma exile) and the Sandhill crane (Grus canadensis). Activities are limited tosnowmobile trails. There are no nature preserves or INAI sites associated with theRollins Savanna. This is the southernmost portion of a 16 km (10 mi) crescent of openlands and lakes, with few interruptions, that extends west and north to the Red WingSlough INAI site near the Wisconsin state line.
Brae Loch GolfCourse
Along the west side of US 45 betweenWashington Street and IL 120 in theVillage of Grayslake
65 ha(161 ac)
The Brae Loch Golf Course offers banquet facilities and gift shop.
Source: Lake County Forest Preserve District 2000

ENVIRONMENTAL CONSEQUENCES
Page 4-66
TABLE 4-46Potentially Involved Parks
Jurisdiction Description of Local Municipal Parks
Mundelein Park District Leo Leathers Park is a 13 ha (32 ac) facility located south of IL 176, between IL 83 and US 45. Access to this facility is off of a localstreet at the south end of the property. The park offers a variety of recreational amenities, including a lake and a trail system.
Lake Zurich Park District Sparrow Ridge Park, a 1.2 ha (3 ac) facility, is located on the west side of Rand Road (US 12) south of Old Rand Road. The parkcontains a playground and a retention basin. The area near Rand Road is fenced and wooded.Paulus Park is a 17 ha (42 ac) facility located on the east side of Rand Road (US 12), north of IL 22. Paulus Park offers a wide varietyof activities including swimming, picnicking, sledding, and skating.
Village of Long Grove Open Space A is 0.78 ha (0.94 ac) and is located on the east side of IL 83 and north of Gilmer Road along Indian Creek.Open Space B is 10.1 ha (24.89 ac) and is located on the west side of IL 83 and north of Gilmer Road.Open Space C is 5.26 ha (13 ac) and is located on the south side of Hicks Road at Old McHenry Road. There is no vehicular accessto this site. The only amenity is a trail.Open Space D is 14 ha (34 ac) and is located on the west side of IL 83, south of IL 22. The only amenity is a trail.
Long Grove Park District Oak Hills Park is located at the southeast corner of IL 83 and IL 22. There are currently no amenities or facilities at this 23.47 ha (58ac) site. This park is a 10-year prairie restoration project and a future trail is planned.
Vernon Hills Park District Royal Oaks Park is a 2 ha (5 ac) facility located on the east side of IL 83, south of US 45. There are no amenities or facilities at thislocation.
Village of Vernon Hills Vernon Hills A Conservation area is 0.95 ha (2.38 ac) and is located on the east side of IL 83 south of IL 60.Vernon Hills B Conservation area is 2.4 ha (6 ac) and is located on the east side of IL 83 south of IL 60 and north of VHAConservation.
Libertyville TownshipOpen Space District.
This property is located on the west side of St. Mary’s Road, south of IL 137. It is a 19.42 ha (48 ac) site with an established trailsystem that connects to adjacent residential areas.
Other Local Park Uses The Chevy Chase Golf Course is a 51.39 ha (127 ac) course located on the west side of IL 21, just north of Lake-Cook Road, inWheeling. Facilities include public golf, a driving range, concessions, restrooms, and banquet facilities.Heather Ridge Golf Course is 2.5 ha (6.29 ac) and is located on the west side of IL 21 north of IL 120.The Lake County Fairgrounds is 36.1 ha (89.02 ac) and is located west of US 45 between IL 120 and Central Avenue in the Village ofGrayslake.Lafferty Park is a 6.2 ha (40.0 ac) park in the Village of North Barrington, Ela Township.Knox Park is a 4.9 ha (12.1 ac) park in the Village of North Barrington, Ela Township.A conservancy area, of unknown size, is located on the northwest corner of Gardner Road and IL 22 in North Barrington.
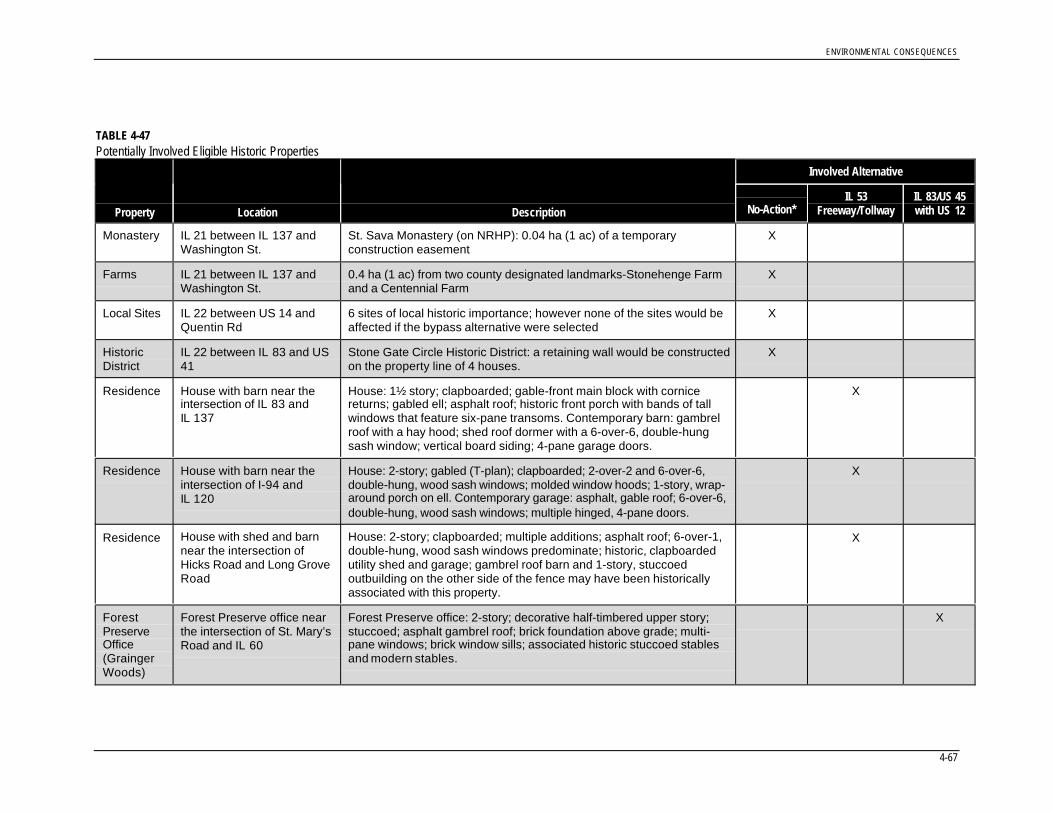
ENVIRONMENTAL CONSEQUENCES
4-67
TABLE 4-47Potentially Involved Eligible Historic Properties
Involved Alternative
Property Location Description No-Action*IL 53
Freeway/TollwayIL 83/US 45with US 12
Monastery IL 21 between IL 137 andWashington St.
St. Sava Monastery (on NRHP): 0.04 ha (1 ac) of a temporaryconstruction easement
X
Farms IL 21 between IL 137 andWashington St.
0.4 ha (1 ac) from two county designated landmarks-Stonehenge Farmand a Centennial Farm
X
Local Sites IL 22 between US 14 andQuentin Rd
6 sites of local historic importance; however none of the sites would beaffected if the bypass alternative were selected
X
HistoricDistrict
IL 22 between IL 83 and US41
Stone Gate Circle Historic District: a retaining wall would be constructedon the property line of 4 houses.
X
Residence House with barn near theintersection of IL 83 andIL 137
House: 1½ story; clapboarded; gable-front main block with cornicereturns; gabled ell; asphalt roof; historic front porch with bands of tallwindows that feature six-pane transoms. Contemporary barn: gambrelroof with a hay hood; shed roof dormer with a 6-over-6, double-hungsash window; vertical board siding; 4-pane garage doors.
X
Residence House with barn near theintersection of I-94 andIL 120
House: 2-story; gabled (T-plan); clapboarded; 2-over-2 and 6-over-6,double-hung, wood sash windows; molded window hoods; 1-story, wrap-around porch on ell. Contemporary garage: asphalt, gable roof; 6-over-6,double-hung, wood sash windows; multiple hinged, 4-pane doors.
X
Residence House with shed and barnnear the intersection ofHicks Road and Long GroveRoad
House: 2-story; clapboarded; multiple additions; asphalt roof; 6-over-1,double-hung, wood sash windows predominate; historic, clapboardedutility shed and garage; gambrel roof barn and 1-story, stuccoedoutbuilding on the other side of the fence may have been historicallyassociated with this property.
X
ForestPreserveOffice(GraingerWoods)
Forest Preserve office nearthe intersection of St. Mary’sRoad and IL 60
Forest Preserve office: 2-story; decorative half-timbered upper story;stuccoed; asphalt gambrel roof; brick foundation above grade; multi-pane windows; brick window sills; associated historic stuccoed stablesand modern stables.
X

ENVIRONMENTAL CONSEQUENCES
4-68
TABLE 4-47 CONTINUEDPotentially Involved Eligible Historic Properties
Involved Alternative
Property Location Description No-Action*IL 53
Freeway/TollwayIL 83/US 45with US 12
Residence House near the intersectionof St. Mary’s Road andIL 176
House: Tudor Revival style; 1½-story; half-timbered; stuccoed; woodshingle, steeply-pitched, side-gable roof; wood sash bay windows; moderncasement windows; brick window sills; exterior chimney composed of a cut-stone, irregular-coursed lower-half and brick upper-half; unsympathetic, 1-story, shed-roof rear addition; modern, detached garage.
X
CulturalCenter(DavidAdler)
Listed on the NationalRegister of Historic Places,located near the intersectionof IL 21 and IL 137
Center: large, linear complex of attached buildings; cross-gable mainblock; stuccoed; wood shingle roof; 6-over-6, double-hung, wood sashwindows predominate; fanlight over street-facing entrance on the mainblock; multiple chimneys; corner tower.
X
ResidenceandEntrancePiers
House near the intersectionof I-94 and IL 60
House: 2½-story; wood shingle, gable roof; vinyl-siding; arched andmulti-pane windows; 2 corbeled chimneys. Stables: 1-story with 1½-story, gable-front blocks; east end appears to have been converted intoa residence. Two sets of wood entrance piers.
X
Residence House near the intersectionof Hicks Road and LongGrove Road
House: 2-story; clapboarded; multiple additions; asphalt roof; 6-over-1,double-hung, wood sash windows predominate; historic, clapboardedutility shed and garage; gambrel roof barn and 1-story, stuccoedoutbuilding on the other side of the fence may have been historicallyassociated with this property.
X
Residence House near the intersectionof Hick Road and Old HicksRoad
House: Queen Anne style; 2-story with a 1½-story rear wing; gable-front, wood shingle roof; gableboard with spindlework; brick foundation;wood clapboards; alternating fishscale and cove wood shingles in thepeak of the gable; 1-over-1, double-hung, wood sash windows withornamental hoods; 1-story porch with spindlework on the east facade ofthe wing.
X
*Only historic sites identified as part of other Phase 1 project have been identified for the No-Action Alternative (Baseline).

ENVIRONMENTAL CONSEQUENCES
4-69
TABLE 4-48Summary of Potential Forest Preserve and Local Park 4(f) Impacts for the No-Action Alternative (Baseline) a
Property Owner Total ha (ac) Affected ha (ac) % Affected Potential Use
BannockburnForest Preserve
LCFPD 31.8 (79) 0.67 (1.66) 2.11 No recreational facilities
Grainger Woods LCFPD 104 (257) 0.02 (0.06) 0.02 Minimal impact
IndependenceGrove
LCFPD 448 (1,106) 0.77 (1.9) 0.16 LCFPD headquarters; dog exercisearea, trails unaffected
Prairie Wolf ForestPreserve
LCFPD 175 (431) 0.93 (2.29) 0.53 Potential biking, hiking, skiing uses
Ryerson Woods LCFPD 222.5 (550) 0.11 (0.26) 0.05 Uses at edge of property only
Wright Woods LCFPD 132 (327) 0.13 (0.33) 0.10 Uses to southern perimeter
Countryside GolfCourse
LCFPD 200 (494) 0.15 (0.38) 0.08 No anticipated uses to golf coursefacility
Des Plaines RiverTrail
LCFPD 1,342 (3,314) 0.26 (0.64) 0.02 Uses to southern edge; part ofparkland along river
Ryerson Woods LCFPD 313 (772) 0.39 (0.96) 0.12 Uses at edge of property only
Site 15 LCFPD 31 (77) 0.05 (0.12) 0.19 Site contains ADID wetlands and INAIsites
Deer Grove LCFPD 729 (1,800) 1.4 (3.48) 0.20 Potential impact to bike trail
Rollins Savanna LCFPD 496 (1,224) 0.44 (1.10) 0.09 Presence of State-listed species,snowmobile trail
Brae Loch GolfCourse
LCFPD 65 (161) 0.46 (1.13) 0.71 No anticipated uses to golf coursefacility
Half Day Woods LCFPD 81.3 (201) 0.31 (0.77) 0.38 No recreational uses would beinvolved.
Paulus Park Lake Zurich PD 17 (42) 0.09 (0.22) 0.53 No facilities located in the affected parkwill be affected.
Lafferty Park Village of NorthBarrington
5.5 (13.6) 0.054 (0.13) 0.98 No facilities located in the affected parkwill be affected.
Knox Park Village of NorthBarrington
4.9 (12.1) 0.017 (0.04) 0.35 Temporary construction easement. Nofacilities located in the affected parkwill be affected
Conservation Area Village of NorthBarrington
Unknown 0.003 (0.007) Unknown No facilities located in the affected parkwill be affected
Heather Ridge BGolf Course
Gurnee 2.5 (6.3) 0.51 (1.27) 20.4 Potentially golf course and operationsuses
Open Space B Village of LongGrove
7.3 (18) 0.065 (0.16) 0.89 No recreational would be involved
Oak Hills Park Long Grove ParkDistrict
24.3 (60) 0.076 (0.19) 0.30 Currently no recreational facilities; trailplanned
Lake CountyFairgrounds
Lake County 36 (89) 0.016 (0.04) 0.04 Uses to eastern edge of property
Total Area 4,468.1 (11,034) 6.9 (17.7)
a See Table 4-47 for a summary of potentially eligible historic structures

ENVIRONMENTAL CONSEQUENCES
4-70
The No-Action Alternative (Baseline) mayinvolve 13 historic sites within the existing orproposed right-of-way (Table 4-48 andFigure 4-27). One site, the St. Sava Monasterywhich is listed on the National Register ofHistoric Places, could potentially be affectedby a temporary construction easement (0.04 haor 0.1 ac). A subdivision, comprised of12 Lustron homes has been found to have thepotential to be eligible for the NRHP as ahistoric district. Four of these residences maybe potentially affected; a retaining wall wouldbe constructed on the property line of theseresidences. The other structures include twocounty designated landmark farms and sixlocally important sites.
4.8.2.2 IL 53 Freeway/TollwayAlternative
The potential forest preserve and local parkSection 4(f) resource impacts associated withthe IL 53 Freeway/Tollway Alternative aresummarized in Table 4-49 and Figure 4-28.Roughly 8.0 ha (20.1 ac) may be required forroadway improvements under this alternativefrom four LCFPD properties and one localpark. Overall, the IL 53 Freeway/TollwayAlternative could affect 0.15 percent of thetotal land area represented by the involvedsites.
The percentage of land area required from theforest preserve and local park propertieswould be relatively small compared to thetotal land areas. Most impacts to forestpreserve properties would be fringe impacts,which would not affect developed facilities orrecreational areas. Under the IL 53Freeway/Tollway Alternative, Leo LeathersPark would be divided. Alternative centerlinesfor Leo Leathers Park and Almond Marshwere analyzed to identify avoidance options.The analysis resulted in higher wetland usesand displacements, so the current alignmentwas determined to be most practical (seeSection 3). Direct impacts to the park includea small pond, a bike/pedestrian trail, and somenatural vegetation, and so the resource wouldbe bridged. Overall, potential impacts toindividual sites are small, but there are foursites for which uses are greater than 1 percentof the total site land area (Table 4-49).Three historic structures were found to havethe potential to be eligible for inclusion on theNRHP. These structures are all farmhouseswith barns (Table 4-47 and Figure 4-28).
4.8.2.3 IL 83/US 45 withUS 12 Alternative
Potential impacts to existing forest preservesand parks that could result from theIL 83/US 45 with US 12 Alternative are
TABLE 4-49Summary of Potential Forest Preserve and Local Park 4(f) Impacts for the IL 53 Freeway/Tollway Alternative
Property Owner Total ha (ac)Affectedha (ac)
%Affected Potential Use
Almond Marsh LCFPD 124 (306) 2.0 (5.0) 1.6 No recreational facilities
River Hill LCFPD 90 (224) 2.6 (6.6) 2.9 Part of parkland corridor
Buffalo Creek Forest Preserve LCFPD 160 (416) 0.6 (1.6) 0.4 Currently agriculture*
Countryside Golf Course LCFPD 200 (494) 1.4 (3.5) 0.7 Golf facilities
Leo Leathers Park MundeleinPark District
13 (32) 1.4 (3.4) 10.8 Passive recreation
Total Area 587 ha (1,472 ac) 8.0 ha (20.1 ac)
Note: See Table 4-46 for a summary of potentially eligible historic structures*Parts of this site were purchased with OSLAD funds. If it is determined that there would be impact this portionof the site as a part of future analysis, there would need to be coordination with IDNR similar to the coordinationprocedures for Section 6(f) properties.Source: CH2M HILL 1999.

ENVIRONMENTAL CONSEQUENCES
4-71
detailed in this section. There could be sevenLCFPD properties and twelve local parks withan estimated total loss of 7.47 ha (18.51 ac)that could be potentially involved with thisalternative (Table 4-50, on the following page,and Figure 4-29). Generally, the potentialimpacts to individual sites are small; however,there are seven sites for which uses are greaterthan 1 percent of the total land area for the site(Table 4-50). For Leo Leathers Park andAlmond Marsh, an analysis of alternativecenterlines and bypass options was performedto identify avoidance options. The analysisresulted in higher wetland uses anddisplacements; thus the current alignment wasdetermined to be most practical (seeSection 3). Most of the impacts would befringe uses with minimal effect on developedfacilities or recreational areas. Many of theimpacts represent losses of natural vegetation,although none of these losses affect special orrare habitat. Impacts upon 10 sites could havesome effect on trail facilities and/or access.Generally, these would be minor and could bemitigated.
One building, the David Adler CulturalCenter, is on the NRHP. Five other structures,including a residence with one set of buildingentrance piers, were found which arepotentially eligible for inclusion on the NRHP.See Table 4-47.
4.8.3 Summary of PotentialSection 4(f) ResourceImpacts
Potential Section 4(f) resource impacts couldoccur with each of the alternatives. A summaryof the potential Section 4(f) property uses foreach alternative is in Table 4-51 (on page 4-73).
The IL 83/US 45 with US 12 Alternativecould potentially affect the most forestpreserves and local parks with a greater than1 percent loss, and historic properties.Comparatively, for all alternatives, the totalimpacts to Section 4(f) resources is smallcompared to the total area dedicated to forestpreserves, parks, and cultural resources inLake County. It is expected that futurecoordination, minimization and mitigation
activities associated with the preferredalternative could result in a further reductionof these impacts.
4.9 EnergyHighway improvement projects can bothconsume and conserve fossil fuels.Consumption would occur as a result of bothconstruction and operation of the projectalternatives. Conservation would occur as aresult of improved efficiency for travel.
Construction of the project alternatives wouldrequire the consumption of energy forprocessing construction materials,construction activities, and the long-termmaintenance of 119.1 route km (74.0 mi) forthe No-Action Alternative (Baseline),42.7 route km (26.5 mi) for the IL 53Freeway/Tollway Alternative, and100.8 route km (62.7 mi) for the IL 83/US 45with US 12 Alternative. Energy consumptionby vehicles in the area may increase duringconstruction due to possible traffic delays.
Construction of both build alternatives wouldreduce future traffic congestion and vehicularstopping and slowing conditions. Additionalbenefits would be realized from increasedcapacity and smoother riding surfaces. Thiswould result in less direct and indirect vehicularoperational energy consumption for the buildalternatives than for the No-Action Alternative(Baseline). In the long term, post-constructionoperational energy efficiencies should offsetconstruction and maintenance energyrequirements and result in a net savings inenergy usage.
Both build alternatives include provisions forimproved bicycling and walking conditions,thereby encouraging travel by thesenonmotorized, nonenergy-consuming modesof transportation. Additional nonmotorized,energy-efficient travel improvements,common to both project alternatives, consist ofvarious recommended bus and railimprovements throughout the study area.

ENVIRONMENTAL CONSEQUENCES
4-72
TABLE 4-50Summary of Potential 4(f) Impacts for the IL 83/US 45 Alternative
Property Owner Total ha (ac)Affectedha (ac)
%Affected Potential Use
Almond Marsh LCFPD 124 (306)a 1 (2.4) 0.8 Vegetation uses
Countryside GolfCourse
LCFPD 200 (494) 0.05 (0.2) 0.03 Potential impact to trail andvegetation
MacArthur LCFPD 207 (511) a 0.15 (0.37) 0.07 River access and trail uses
IndependenceGrove
LCFPD 448 (1,106) a 0.71 (1.76) 0.16 River access and trail uses
Old School ForestPreserve
LCFPD 200 (494) a 0.11 (0.27) 0.06 Access to facility, trail and
underpass uses
Wilmont ForestPreserve
LCFPD 57 (142) a 0.23 (0.58) 0.4 Potential uses to Des Plaines
River Trail and vegetation
WrightWoods/Half Day
LCFPD 132 (327) b 1.13 (2.8) 0.86 Potential uses to trail and
vegetation
Sparrow RidgePark
Lake Zurich PD 1.2 (3) 0.016(0.04)
1.38 Impact to landscape buffer
Paulus Park Lake Zurich PD 17 (42) 0.09 (0.22) 0.53 No recreational uses
Leo Leathers Park Mundelein PD 13 (32) 0.84 (2.09) 6.46 Passive recreation
Open Space A Long Grove 0.78 (0.94) 0.38 (0.94) 48.7 No recreational uses
Open Space C Long Grove 5.26 (13) 0.5 (1.23) 9.5 Access, trail, and vegetationuses
Open Space D Long Grove 14 (34) 0.14 (0.34) 1.0 Access, trail, and vegetationuses
Oak Hills Park Long GrovePark District
23.47 (58) 1.57 (3.87) 6.7 Impact to open space andvegetation; no impact torestoration area
Royal Oaks Park Vernon HillsPark District
2 (5) 0.02 (0.05) 1.0 Vegetation uses
Chevy Chase GolfCourse
Wheeling 51.39 (127) 0.12 (0.31) 0.23 Access and parking uses
LibertyvilleTownship OpenSpace
Village ofLibertyville
19.42 (48) 0.18 (0.45) 0.9 Trail, access, and vegetationuses
VHA Conservation Village ofVernon Hills
0.95 (2.38) 0.093(0.23)
9.8 Impact along edge
VHB Conservation Village ofVernon Hills
2.4 (6) 0.14 (0.36) 5.8 Impact at edges
Total Area 1,518.9 ha (3,751.3 ac) 7.5 ha (18.5 ac)
Note: See Table 4-47 for a summary of potentially involved eligible historic propertiesaCH2M HILL 1999 - GIS DatabasebLake Count Forest Preserve District 2000

ENVIRONMENTAL CONSEQUENCES
4-73
4.10 Construction ImpactsConstruction impacts are generally of shortduration and end shortly after projectcompletion. The expected short-termconstruction impacts associated with the No-Action and build alternatives are identifiedbelow.
4.10.1 Construction-Related JobsTable 4-52 lists the jobs generated peralternative, based on construction costs and anFHWA multiplier of 9.75 jobs per milliondollars of construction. Project expenditureswould also generate indirect and directemployment opportunities in industries thatsupply materials and overhead items to theproject. Estimates of additional project related-work generated are based on theU.S. Department of Labor multiplier of 12.7 jobsper million dollars of construction.
4.10.2 Erosion and SedimentControl
Typical construction activities associated withbridges, culverts, and roadway approachesinvolve grading, filling, and excavation. Theseactivities increase the erosion potential due tothe reduction in vegetative cover andincreased impervious areas resulting fromsoils disturbance by heavy equipment.Placement of structures in streams mayincrease turbidity (suspended solids) andsedimentation and temporarily alterdownstream hydraulics and substrateconditions.
Covering of natural substrate is the potentialresult of increased sedimentation duringconstruction, thereby affecting necessaryhabitat conditions for some species of fish,mussels, or macroinvertebrates. Impactmagnitude would vary according to site-
TABLE 4-51Summary of Potential Section 4(f) Impacts
No-Action
IL 53Freeway/Tollway
IL 83/US 45with US 12
Number of Forest Preserves 14 4 7
Number of Local Parks 8 1 9
Total ha of Forest Preserve and Local Parks Involved (ac) 6.9 (17.1) 8.0 (20.1) 7.5 (18.5)
Number of Properties with Greater than 1 percent Loss of Area 2 3 9
Number of Historic Properties* 13 3 6
*Based on available Phase 1 preliminary engineering and environmental documentation reports.
TABLE 4-52Jobs Generated per Alternative
No-Action IL 53 Freeway/Tollway IL 83/US 45 with US 12
Jobs Generateda 3,300 6,600 7,200
Additional Project-Related Jobs Generatedb 4,300 8,600 9,300
Estimated Construction Costs c $338 million $674 million $735 million
aThis estimate is based on a construction costs and a FHWA multiplier of 9.75 jobs per million dollars ofconstructionbThis estimate is based on U.S. Department of Labor multiplier of 12.7 jobs per million dollars of constructioncConstruction cost only (1999 dollars)

ENVIRONMENTAL CONSEQUENCES
4-74
specific conditions, such as the type ofcrossing structure and stream substrate.
Erosion control measures would beimplemented throughout the study area, inparticular at stream crossings for the preferredalternative in accordance with IDOT policy asstated in IDOT Joint Design/ConstructionProcedure Memorandum on Erosion andSediment Control. An erosion control planmust be prepared as part of the contractdocuments. These measures would minimizesoil loss and subsequent sedimentation.Table 4-53 summarizes the stream crossingsfor each alternative. The magnitude of erosioncontrol measures is commensurate with thenumber of stream crossings.
Each alternative would result in thedisturbance of 0.4 or more ha (1 or more ac) oftotal land area. Accordingly, each is subject tothe requirement for a NPDES permit forstormwater discharges from the constructionsite. This is discussed under Section 4-13,Permits/Certifications.
Areas of special concern where erosion andsediment control are needed would be
identified in a detailed analysis of thepreferred alternative.
4.10.3 Air QualityThe primary effect from construction upon airquality would be fugitive dust (particulate)from soil exposed to wind and traffic. Thequantity of fugitive dust would varydepending on the construction location, extentof activity, silt content, soil moisture,temperature, and wind speed. Constructionactivities would generate fugitive dust thatmay be bothersome in nearby areas. However,the contribution of any of the alternatives tothe total suspended particulates in thesurrounding area would be small and of shortduration. Generally, the overall impacts ofeach alternative would be similar.
During construction, blowing dust from areascleared or excavated for access or constructionpurposes can be minimized by applying waterto unpaved road surfaces. The effectiveness ofwatering for fugitive dust control depends onthe frequency of application. It is estimatedthat watering an entire area twice daily would
TABLE 4-53Summary of Stream Crossings by Alternative
Watershed Subwatershed No-Action IL 53 Freeway/Tollway IL 83/US 45 with US 12
Des Plaines River Buffalo Creek 4 2 2
Bull Creek 6 1 2
Aptakisic Creek 3 — 1
Indian Creek 8 5 8
Mill Creek 5 1 1
Middle Fork 2 — 3
Upper Des Plaines 8 4 5
Lower Des Plaines 3 — 5
West Fork 3 — —
Arlington Heights Branch 2 — —
Fox River Flint Creek 3 — 1
Fish Lake Drain — 1 —
Slocum Lake Drain — — 1
Squaw Creek — 1 —
Tower Lake Drain — — 1
Total 47 15 30

ENVIRONMENTAL CONSEQUENCES
4-75
reduce dust emissions by as much as50 percent. These measures would beemployed as needed during construction of thepreferred alternative.
4.10.4 Construction NoiseTrucks and machinery used for constructionproduce noise that may affect some land usesand activities during the construction period.Individuals inhabiting the homes along theproposed improvements would at some timeexperience perceptible construction noise fromimplementation of the project. IDOT’sStandard Specifications for Road and BridgeConstruction as Article 107.35, adoptedJanuary 1, 1997, contains mitigation measuresto minimize or eliminate the effects ofconstruction noise on receptors.
4.10.5 Traffic/Temporary AccessAccess to all properties would be maintained bystaged construction temporary access roads orother appropriate means. Traffic may bestopped for short periods, temporarilyinconveniencing motorists while constructionequipment is moved on or across the highway.Emergency service routes and access foremergency vehicles would be maintained.
Road construction activities involve laneclosures and detours. These activities interruptnormal traffic flow, and generally impedetravel in the vicinity of road construction.Construction on existing roadways wouldcause greater traffic delay than construction onnew alignments. Therefore, the IL 53Freeway/Tollway Alternative would have lesstraffic delay associated with construction thanthe other project alternatives.
4.10.6 Solid WasteIn accordance with state and federal regulations,the contractor would dispose of grass, shrubs,trees, old pavement, miscellaneous debris, andother sold wastes generated during construction.
4.10.7 Utility ServicesConstruction activities would be coordinatedwith public utilities to avoid potential conflictsand minimize planned interruptions of service.
When service interruptions are unavoidable,every effort would be made to limit theirduration.
4.11 Secondary andCumulative Impacts
4.11.1 ApproachPotential secondary and cumulative impactsare described in this section. These terms aredefined as follows:
• Secondary effects are indirect impacts“caused by an action and are later in timeor further removed in distance but are stillreasonably foreseeable”(40 C.F.R 1508.8).
• Cumulative effects are “impacts whichresult from the incremental consequencesof an action when added to other past andreasonably foreseeable future actions”(40 C.F.R 1508.7).
In 1997, the Council on EnvironmentalQuality (CEQ) developed an 11-step approachto evaluate cumulative effects (see Table 4-54,on the following page). Steps 1 through4 address scoping, which sets the boundariesfor the analysis by narrowing the focus tomeaningful issues and the sustainability ofaffected resources. Steps 5 through 7 describethe affected environment (resources,ecosystems, and human communities) in termsof the stresses it experiences and its responseto change, capacity to withstand stresses,regulatory thresholds and baseline condition.Steps 8 through 11 determine theenvironmental consequences. The last foursteps include cause-and-effect relationships,magnitude, significance, and measures toavoid, minimize, mitigate, monitor, andmanage consequences. As noted, this analysishas determined that the secondary andcumulative effects of the project alternativeswould be limited and controllable throughmitigation and monitoring.
A review of the project impacts concluded thatseven resource areas would potentially resultin secondary and cumulative impacts (Step 1),

ENVIRONMENTAL CONSEQUENCES
4-76
which are summarized in Table 4-55 (on thefollowing page).
The geographic extent of this analysis (Step 2)is shown in Figure 4-30, which captures thearea of population growth attributed to thebuild alternatives. The additional populationgrowth attributed to the build alternativeswould be 18,000 for the IL 83 with US 12Alternative, and 27,500 for the IL 53Freeway/Tollway Alternative (see Section4.1.1 for more detail). These increases aresmall compared to the 280,000 additionalpeople projected to come to Lake County by2020, with the No-Action Alternative(Baseline).
The time period for this analysis is 1990 through2020 (Step 3). This period included the periods1990 to 2000 and 2001 to 2020. From 1990 to2000, Lake County was characteristic of manysuburban areas, with an outward shift in growthfrom established communities. Shorelinecommunities experienced slower growth ordecline, while the central part experienced greatergrowth. During the 1990s, population growth anddevelopment was concentrated in the central partof the county and advanced into the western part.
The latter part of the analysis period will seegrowth most pronounced in the western andnorth-central parts of the county. This periodextends through the regional projection in theNIPC Land Use Plan (2020).
Other actions (Step 4) may cause secondaryand cumulative effects on the resources,ecosystems, and human communities withinthe project corridor. These actions are underconstruction or are reasonably foreseeable,given their stage of planning and development.The impacts of these actions must beconsidered along with those of the finalistalternatives.
Substantial development in Lake County isexpected to continue regardless of whethermajor transportation improvements areimplemented. Most of the communities in thecounty are providing for new commercial andresidential growth at a rapid pace. Expansionof these types of land uses typifies thereasonably foreseeable actions in the county,beyond the proposals presented in thisdocument for major transportationimprovements. Other specific actionsidentified within the project influence zone are
TABLE 4-54Steps in Cumulative/Secondary Analysis
Environmental ImpactAssessment Component Analysis Steps
Scoping 1. Identify the significant cumulative effects issues associated with the proposedaction, and define the assessment goals.
2. Establish the geographic scope for the analysis.
3. Establish the time period for the analysis.
4. Identify other actions affecting the resources, ecosystems, and humancommunities of concern.
Describing the AffectedEnvironment
5. Characterize the resources, ecosystems, and human communities identified inscoping in terms of their response to change and capacity to withstand stresses.
6. Characterize the stresses affecting these resources , ecosystems, and humancommunities and their relation to regulatory thresholds.
7. Define a baseline condition for the resources, ecosystems and humancommunities.
Determining theEnvironmentalConsequences
8. Identify important cause-and-effect relationships between human activities andresources, ecosystems, and human communities.
9. Determine the magnitude and significance of cumulative effects.
10.Modify or add alternatives to avoid, minimize or mitigate significant cumulativeeffects.
11.Monitor the cumulative effects of the selected alternative and adapt management.

ENVIRONMENTAL CONSEQUENCES
4-77
the expansion of Motorola facilities in DeerPark, the Great Lakes Naval Training Centerin North Chicago, and the proposed UniversityCenter in Grayslake. No other substantiveactions have been identified within the projectinfluence zone.
The affected environment analyses (Steps 5-7)characterizes the existing key resources,ecosystems and human communities in termsof their response to change; stresses imposedon them; their capacity to withstand thesestresses; the pertinent regulations, standardsand development plans that establishthresholds (levels of stress beyond which the
desired condition degrades); and their currentstatus (baseline condition). This information issummarized in Table 4-56 (on the pages 4-78and 4-79). Four critical resources arediscussed in further detail to provide aperspective of the existing conditions.
Wetlands. Currently, there are over45,000 acres of wetlands in the county.Historically, the loss of wetlands wasassociated with agriculture. Today, the loss ofwetlands is attributed to urban development.Regulatory requirements have effectivelyprovided for the replacement of lost wetlands,slowing the loss of total wetland acres.
TABLE 4-55Potential Cumulative/Secondary Effects
Resources/Eco-systems/HumanCommunities
Potentially Important fromCumulative/Secondary Effects Perspective
Land Use a. Relations hip between land use andtransportation
b. Agricultural land conversion
c. Socioeconomicd. Public services: medical, fire, police,
educational, places of worship, cemeteries
a. Facilitate already establish growth trends
b. Farm and farmland lossc. Population and employment growth,
changing community cohesion, buildingdisplacements
d. Overburdened services
WaterResources
a. Wetlands
b. Floodplainsc. Ground and surface water quality
a. Degradation or loss (erosion, filling),potential for more flooding, loss of biologicalresources
b. Degradation or loss (erosion, filling),potential for more flooding
c. Sedimentation; contamination frompollutants such as salt spray from deicingchemicals; altered hydrology, potentialimpact to designated water uses
Air Quality a. Exceedance of standards for carbonmonoxide and other air pollutants
b. Long-range transport of air pollutants
c. Conformity with State Implementation Plan
a.–c. Degradation of regional air quality; long-term human health effects.
Noise Traffic-generated noise levels Increases in traffic noise over existing conditionsor noise abatement criteria
CulturalResources
Historic structures and archaeological sites Loss of resources or proximity effects
SocioculturalResources
Demographics – impacts to racial, ethnic andspecial groups
Environmental justice – disproportionate impactto minority and low income groups.
BiologicalResources
a. Flora and fauna diversityb. Habitat fragmentationc. Threatened and endangered speciesd. Intrusion into designated lands (e.g.,
nature preserves, forest preserves)
e. Tree loss during construction
a.–e.Degradation of habitats and plant andanimal populations; impacts fromconstruction and ongoing operation

ENVIRONMENTAL CONSEQUENCES
4-78
TABLE 4-56Affected Environment
ResourceResponse to
Change StressesCapacity to withstand
Stresses Regulatory Thresholds Baseline ConditionLand Use Increase in
development,consumerservices, andpublic services.Increase inInfrastructuredemand (road,rail, bus, etc.).Utility.
Waterresources, airquality, noisepollution,habitatreduction.
Regulations andstandards are used tominimize adverseeffects. Developmentstandards can requirecompensatory storageand natural drainagemeasures to mitigateeffects of newdevelopment.
County and municipalzoning and land planningordinance; Lake CountySMC and IDNR.
Suburban developmentwidespread and rapidlyexpanding. Manymunicipalities have ambitiousgrowth plans. Rural/lowdensity suburban giving wayto suburban/urban character.
AgriculturalLandConversion
Loss of primefarmland soils
Advancingdevelopment
Improving agriculturalpreservation initiativesand ordinances.Strengthen open spaceacquisition funds.
USDA Soil andConservation Service;Illinois Department ofAgriculture; county landmanagement plans
Existing farmland is 20% ofthe county area, anddiminishing at a rate of 3%per year.
Socio-economic
Increase inpopulation andemployment
Development isoutpacinginfrastructure.Decrease inmobility,increase intravel times andland density
Municipal providersresponding to near termneeds on a prioritybasis recognizing fiscalconstraints Municipalplanners encouraginginfill growth, sensiblegrowth initiatives, andgrowth neartransportation.
Long range infrastructureplanning provided byIDOT, ISTHA, county,and others, to improvetransportation service
96% of the 2020 populationwill occur regardless of majortransportation improvements
PublicServices
Increase indemand for andaccess toeducation, healthcare, fire andpolice services,and transit
Increase inpopulation anddevelopment,whichincreasesdemand onservice.
An expanded tax baseand increased revenueswould help offset thecosts of the increase invarious services toexpandingcommunities.
State, county, andmunicipality governmentprovide the delivery ofservices, operation andlong-term maintenance.
The study area is respondingto growing demands on basicpublic services, however,trends show that populationgrowth is outpacing neededinfrastructure improvements.
Floodplains Loss of floodplains NewDevelopmentand associatedinfrastructureimprovements
The Lake County SMC,IDNR (OWR), andUSACOE have ampleregulatory authority tocontrol encroachmentupon floodways andfloodplains, and providecompensatory storageas required.
Cognizant resourceagencies enforce a policyof no net loss of floodstorage through a permitreview process.
Regulatory requirementshave stabilized or slightlyimproved flooding in thearea.
Wetlands Direct impacts:loss of wetlandsIndirect impacts:hydrology issues
Continuedgrowth anddevelopment
Mitigation for wetlandsis stabilizing the loss ofwetland acreage.
IDNR, USACOE, andUSFWS enforce a no netloss of resources forprojects subject tofederal and statejurisdiction.
45,700 acres of wetlands inLake County. Losses havebeen stabilized by mitigationrequirements.

ENVIRONMENTAL CONSEQUENCES
4-79
TABLE 4-56 CONTINUEDAffected Environment
ResourceResponse to
Change StressesCapacity to withstand
Stresses Regulatory Thresholds Baseline ConditionWaterQuality
Increase inchlorideconcentrations instreams. Increasein erosion andsediment fromother development(road, comm.,utility, etc.)
Newdevelopment,salt spray,stormwaterrunoff, andconstructionand operationof roadwayimprovements
The use of BMPs for allproject developmentwould minimizepollutant and sedimentconcentration in runoff.New development plansmust incorporatenatural drainagemeasures as well asdetention basinsdesigned to reducerunoff and pollutantloads.
All streams fall under theGeneral Use WaterQuality Standards. IEPAprovides water qualitycertification underSection 401 of the CleanWater Act, which ismandatory for all projectsrequiring Section 404permits. Safe DrinkingWater Act protectsmunicipal water sourcesfrom contamination.
Stream quality has beensteadily improving over thepast 15 years. SMC,USACOE, USEPA, LCFPD,and SWCD programs havebeen improving water quality.
Air Quality Increase in airpollution
Increase intraffic volumesand congestion
Transportationimprovements wouldreduce congestion andtravel time, therebyhelping compliance withstandards. Newtechnology producingcleaner fuels, and moreefficient cars.
National and StateAmbient Air QualityStandards, IEPAConstruction andOperating Permits
Existing conditions show noexceedance days forparticulate, sulfur dioxide,nitrogen dioxide, lead,carbon monoxide, nitricoxide, or VOCs, with theexception of ozone.Heightened publicawareness has lead to ozoneaction days, transitexpansion, and non-motorized vehicle initiatives.
Noise Increase in noisepollution
Increase intraffic volumesand new noisesources
Noise protectionmeasures would beimplemented accordingto IDOT/ISTHA policies.
Refer to Section 2.5,Noise
Refer to Section 2.5, Noise,and Figure 2-21.
CulturalResources
Preservation ofhistoric andarchaeologicalresources
Increase indevelopmentandtransportationimprovements
Design considerationsthat would modify thefacility, therebyminimizing or avoidingresource impact.Established programsproviding awarenessand protection:
− IL Main St.Program
− Localdesignations
− Statewideinventories
− Contextsensitivedesign
Historic andarchaeological resourcesreviewed with the ISHPOin accordance with therequirements of 36 C.F.R800.4; Section 106 of theNatural HistoricPreservation Act;Local/Countypreservation ordinances
Potentially eligible historicaland archaeologicalresources are located in thestudy area and near eachproject alternative.
ThreatenedandEndangeredSpecies
Impacts tohabitats harboringspecial status planand animalspecies
Increase indevelopmentandtransportationimprovements
Design considerationsthat would modify thefacility, therebyminimizing or avoidingresource impact.Streams/rivers wouldnot be impeded therebyallowing wildlifemovement along thesewaterway corridors.
USFWS (under Section 7of the FederalEndangered SpeciesAct), INDR (under theIllinois EndangeredSpecies Protection Act),IDOT, ISTHA, and Illinois
Bird species represent themajority of listed species inthe study area. Urbantolerant species aredominant throughout theCounty, and speciesintolerant to urban conditionsare concentrated in protectedareas.

ENVIRONMENTAL CONSEQUENCES
4-80
Threatened and Endangered Species. Listedspecies and special habitat are improving inprotected areas (i.e. nature preserves, forestpreserves, etc) of the county. Since the early1980’s appearance of listed species hasincreased slightly in these critical habitatareas. Advancing development, however, hasdegraded foraging areas, and fragmentedhabitat, causing an overall reduction inavailable habitat. These conditions haveresulted in concentrations of listed species inthe protected land areas.
Water Quality. Since the early 1990’s, waterquality in the county’s rivers and streams hasbeen improving. For example, the Des PlainesRiver has shown advancements from lowquality to moderate quality. These trends arelinked to improved stormwater managementpractices, and improvements in municipalwastewater treatment. These trends haveoccurred despite rapid developmentthroughout the county.
Agriculture. About 20 percent of the county isdesignated for agricultural use. Thedevelopment in Lake County has beenconsuming farmland at a rapid rate. Since,1950, Lake County farmland has decreased by71%. In the last decade, the county’spopulation has increased by 25%, while farmacreage has declined by 25%, or 20,000 acres(Lake County Department of Planning, Zoning& Environmental Quality 1994). Neither thecounty nor municipalities have aggressivefarmland protection initiatives to slow thistrend.
The cause-and-effect relationships (Step 8)between the key resources, ecosystems andhuman communities and the various stressfactors identified for the project alternativesare summarized in Table 4-57 (on thefollowing page). The table indicates theresponse of a given resource to a change in itsenvironment.
The magnitude and significance of negativesecondary and cumulative effects (Step 9) ofthe project on the resources in the influencezone are expected to be limited andcontrollable. Efforts have been made to avoidand minimize impacts, and measures would be
implemented to mitigate the loss of resource.The magnitude of effect is discussed forseveral resource areas under the headings of,“Potential Socioeconomic/Land Use Effects”and “Natural Resource Effects”.
Potential Socioeconomic/Land Use Effects.Population and employment have beenincreasing rapidly in Lake County for the last3 decades, despite the absence of majortransportation improvements. Various factorsare propelling this growth; therefore, thecontinued pace of growth is expected to occurfor sometime regardless of whethertransportation improvements are made.
Population and employment forecasts for 2020are only slightly higher for the buildalternatives than for the No-Action Alternative(Baseline). As described in Sections 2 and 4,regional population forecasts show that withNo-Action Alternative (Baseline), LakeCounty’s population would increase by54 percent between 1990 and 2020. With thebuild alternatives, Lake County’s 2020population is forecast to be 3 to 4 percent morethan the forecast for the 2020 No-ActionAlternative (Baseline). Generally, most of thepopulation difference for the build alternativesover the No-Action Alternative (Baseline)would be localized in the central and northcentral parts of the county.
Although major transportation improvementswould have a small growth impact upon LakeCounty, these improvements would have someinfluence on the location of growth, and tosome extent, the type of development thatwould occur. The potential effects of theproject alternatives upon the extent andlocation of this growth are described below.
Under the No-Action Alternative (Baseline),population and employment growth wouldoccur in a manner similar to that of the pastthree decades. The forecasted population forthe No-Action Alternative (Baseline) showsthe largest increases in future growth wouldexpand to the west and north central parts ofthe county—consistent with patterns that haveoccurred for the past decade and are currentlyobserved today (Figure 4-4). The No-ActionAlternative (Baseline), however, rather than

ENVIRONMENTAL CONSEQUENCES
4-81
keeping pace with growth, would result in alower level of transportation service in thecounty. Over time, this alternative would beunable to serve the needs of this growth, andquality of life factors would likely deterioratewith the area becoming less desirable forresidents and business owners alike.Ultimately, increased congestion anddecreased accessibility would reach a point ofinconvenience and intolerance that would
eventually affect development investment andpotentially contract the tax base.
Under the IL 53 Freeway/Tollway Alternative,about 60 percent of the additional population(27,500 in the year 2020) would locateprimarily in central Lake County (Fremont,Warren, and Shields townships) (Figure 4-5).The added mobility and access provided bythis alternative would result in growthconcentrations to these areas. However,
TABLE 4-57Cause-and-Effect for Resources, Ecosystems and Human Communities
Resource Cause of Change Potential Effect of Change
Land Use Growth, accompanied by newtransportation, residential,commercial, industrial andservice-oriented development
Loss of prime farmland soils.Loss of open land.Shift from rural/suburban to suburban/urban.Increased traffic, congestion and travel times.Increase in infrastructure demand (bus, rail, water, sewer).
WaterResources
New development, with increasedimpervious surface areaStormwater runoff duringconstruction and operationStream channel erosionSalt spray and other nonpointsource pollutionHuman access
Degradation of surface and groundwater.More rapid, higher discharge runoff pattern.Over draught of groundwater.Impaired groundwater recharge rates.Wetland degradation, fragmentation and loss.Disturbance of hydrology.Diminished flood control capacity.Sediment delivery and pollutant loading.Deterioration of recreational water bodies Litter and refusedeposits.
Air Quality Highway construction, trafficvolumes, and congestion
Increased air pollution from vehicle emissions.
Noise Traffic, human access Increased noise levels throughout the area.
CulturalResources
Right-of-way acquisitionStreambank erosionLand leveling and constructionVandalism
Cultural site degradation.Fragmentation of historic districts.Development pressure.
Socio-culturalResources
Right-of-way acquisitionPublic services
Environmental justice implications for minority and low-income groups residing in higher-density neighborhoodsinside the corridor.Disruption of community mobility.Loss of neighborhoods or community character.Traffic noise.
BiologicalResources
Highway constructionUrban development
Habitat fragmentation and loss outside of protected areassuch as nature preserves, natural areas and parks.Impacts to state and federally-listed species known toexist within the Project Corridor.Loss of biological diversity; introduction of pest species.Degradation of sensitive ecosystems.Detrimental effects on food chains.

ENVIRONMENTAL CONSEQUENCES
4-82
despite the influence of IL 53Freeway/Tollway Alternative, this influencezone will experience tremendous growthregardless of transportation improvements.The 1990 population in this influence zonewas 100,000, and will increase to200,000 without transportation improvements.Less than 20,000 new residents are beingadded by IL 53 improvements in the area ofgreatest growth. See Figure 4-5.
Lastly, under the IL 83/US 45 with US 12Alternative, 2020 population is forecast toincrease about 18,000 over the No-ActionAlternative (Baseline). The townships thatwould experience the greatest increase ingrowth would be Warren and Fremont in thecentral part of Lake County, and NewportTownship in the northern part of the county(Figure 4-6). Regardless of the transportationscenario, most of the buildable land in the studyarea would likely be developed during the next20 years. However, despite the influence of theIL 83/US 45 with US 12 Alternative, thisinfluence zone will experience tremendousgrowth regardless of transportationimprovements. The 1990 population in theIL 83/US 45’s influence zone was 80,000, andwill increase to 150,000 without transportationimprovements. About 10,000 new residentsare being added by the IL 83/US 45improvements in the area of greatest growth(Figure 4-6).
Based on the population forecasts,transportation plays a small role in the futuregrowth of the county—the build alternativeswould increase population by only 3 to4 percent over the No-Action Alternative(Baseline) by the year 2020. Sincetransportation and utility infrastructureimprovements are already well established inLake County, there are other factors that playa larger role in the rate and patterns ofdevelopment in Lake County, including thequality low-density residential living,available and affordable land, a favorableenvironment for business and commerce, andlocal land use planning.
The concept of major transportationimprovements in Lake County is consistent
with regional plans. The current long-rangetransportation plan for northeastern Illinois,2020 Regional Transportation Plan,recommended major transportationimprovements, subject to detailed feasibilitystudies; its predecessor, the2010 Transportation System Plan, adopted in1989, also included major transportationimprovements in Lake County as an importantelement in the regional transportation system.
There are over 50 municipalities in LakeCounty, and each municipality controls landuse decisions in its jurisdiction. Over theyears, considerable land use planning hastaken place on local, county, and regionallevels. Many communities have ambitiousplans, whereas other communities showconstraint. The regional and county planningefforts, as well as some local communityplans, have addressed transportation needs andissues in the county and identify majortransportation improvements.
The local plans in Lake County promotecontiguous and urbanized growth throughoutthe southern two-thirds of the county. Morethan 75 percent of the area surrounding theproject alternatives is planned for developmentby 2020. The remaining 25 percent of the areawould be preserved in open space, with someremaining undeveloped lands. The factorsaffecting growth in Lake County are alreadywell entrenched. Regardless of thetransportation alternative selected for thecounty, the growth pattern is expected to besimilar (Section 4.1.1, Population andHouseholds). Land management in the countyis controlled at the local level, not by statetransportation agencies. Municipalgovernments have the jurisdictional control toprovide for orderly development at acceptablelevels, and fully recognize that realization oftheir planning goals requires the support ofinfrastructure such as transportation.Currently, Lake County and others are makingadvances toward updating their planning tools.The county is updating their land use planwith an emphasis on concentrating growth inareas with mature infrastructures.Additionally, the county is updating theirtransportation plan through a coordinated

ENVIRONMENTAL CONSEQUENCES
4-83
effort with the LCTIP and other transportationproviders. Examples of new development thatinfill mature areas are regularly occurring, aswell as new development that balanceshousing and environmental resources.
The project alternatives would affect localcommunities in different ways. Based on thediscussion presented above, the localmunicipality has a considerable number oftools at its disposal to address the potentialaffects of a transportation improvement withinits boundaries. One of the most effective toolscould be the creation of a project specificcorridor planning council. The corridorplanning council would comprise affectedcommunities along a project. Thesecommunities would be engaged in a process ofdeveloping land use and design guidelines thatwould address the potential effects of a majorhighway improvement. Through thismechanism and others, the affectedcommunities would be able to appropriatelyplan for the integration of a majortransportation facility in their communities.
Potential Natural Resources EffectsDevelopment in Lake County, whether it betransportation improvements or commercialand residential development would havesecondary and cumulative effects upon thecounty’s natural resources (i.e., wetlands,water resources, biological resources, andagriculture).
Wetlands. The secondary and cumulativeeffects of the project alternatives upon wetlandresources examined past, current, and possiblefuture conditions.
Suloway and Hubbell (1994) estimated thatover 90 percent of Illinois’s original3,237,500 ha (8 million ac) of wetlands havebeen destroyed by human modification. Once,wetlands covered more than 23 percent of
Illinois. Currently, wetlands and deepwaterhabitats now make up only 4.9 percent ofIllinois land. Wetland degradation in Illinoisand Lake County was historically associatedwith agriculture; however, recent degradationin Lake County is attributed to urbandevelopment.
The Lake County Forest Preserve has estimatedthat there are slightly more than 18,500 ha(45,700 ac) of wetlands in the county (LCWI). Itis estimated that 5 percent of these wetland areasare considered “pristine,” (i.e., undisturbed byhuman activity (Dreher 1992)). Many of theundisturbed, pristine wetlands have beenclassified in Lake County as ADID.
Biologically, losses of non-ADID wetlands areeffectively managed through mitigation. ForADID wetlands, their qualities make itdifficult to reproduce these conditions withmitigation. Therefore, there is always specialcare to avoid or minimize loss of theseresources. The alternative developmentprocess for the project alternatives tookspecial care to avoid and minimize losses toall wetlands, especially ADID wetlands.However, as the numbers in Table 4-58indicate, some loss of ADID wetlands areexpected for all the project alternatives.Certainly, future steps of project developmentcould further minimize these effects, but thelosses shown above represent the bestavailable information.
The percent of wetland loss for each of theproject alternatives represent a small fractionof the total LCWI wetland acreage for thecounty—Table 4-58. From a countywideperspective, it is anticipated that the cumulativeloss of wetland acreage (developmentactivities) in the county will slow in the future.More aggressive wetland regulations nowrequire higher mitigation ratios. Under theprotection granted to wetlands (Section 404 of
TABLE 4-58Percent of Lake County Lost per Alternative
Alternative LCWI Total ADID Wetlands Total
No-Action 0.17% 0.09%
IL 53 Freeway/Tollway 0.21% 0.06%
IL 83/US 45 with US 12 0.13% 0.03%

ENVIRONMENTAL CONSEQUENCES
4-84
the CWA), new mitigation guidelines requirewetland losses greater than 0.1 ha (0.25 ac) tobe replaced at a ratio of 1.5 to 1 or greater(depending on the type and quality of wetlandaffected the mitigation ratios may be higher).Thus, in some cases more wetlands are beingcreated than destroyed by an individual project.Additionally, in-kind replacement has beenelevated as an objective, which lessens thepotential for changing wetland composition inthe county. These mitigation requirements areapplicable to both private and public projects.The Illinois Interagency Wetland Policy Act of1989 (applicable to state or state fundedprojects) also provides protection to wetlandsand requires mitigation for all wetland impactsregardless of size. Overall, this legislation hasbeen effective for mitigating the loss ofwetlands from public or large private projects,which has helped to slow total wetland lossacross the county. The Lake County SMCrepresents another level of oversight that couldhelp maintain the survivability of wetlands. TheSMC has developed a county wetlandprotection ordinance that would fill potentialgaps in State and Federal regulations. Extensivecoordination and reviews would be initiatedwith SMC staff for State sponsored projectsthat are carried forward in the planning process.
Lake County has been a leader in the stateregarding wetland protection with the adoptionof the Lake County ADID Program. Thisprogram attempts to identify wetlands of thehighest quality to avoid impacts to thesewetlands. The program, developedcooperatively with the USEPA, NIPC, theLake County SMC, and regulated by theU.S. Army Corps of Engineers, mandates thatdevelopers review options to developingwetlands. If impacts are unavoidable to highquality wetland resources, then highermitigation ratios are established to offset totalacreage and wetland function losses.
Land management is another mechanism thatcan minimize the potential conversion ofspecial resources. Examples are conservationcommunities that preserve natural featuresincluding farmlands, wetlands, streams andforests. Already existing forest preserves, stateparks and natural areas provide long term
protection to special resources within theirboundaries. In 1998, Lake County voterspassed a referendum authorizing theexpenditure of $80 million for land purchasesto be added to the forest preserve system.
The combination of these practices applied tothe wetland losses from the projectalternatives, as well as to secondary effects ofurban development would effectively slow therate of wetland loss in the county, and theoverall the cumulative effect. The currenttrends show that these regulations havestabilized the loss of wetlands. The long-termviability of wetland resources will besustained with rigorous mitigation resulting inan increase in larger wetland complexes (viawetland banks), and a decrease in smallercomplexes.
Biological Resources. The most importantvegetative cover types for wildlife are theforested lands (20 percent of county landarea), rural grasslands (12 percent), andwetlands (11 percent), which includes deepmarsh, shallow marsh, shallow waterwetlands, and forested wetlands. These covertypes provide critical habitat for several nativecommunities in Lake County includingprairies, forests, flatwoods, savannas, and ingeneral wetlands. These communities harbormany of the threatened and endangeredspecies in the county.
Forest habitat in Illinois now occupies lessthan 20 percent of the original presettlementconditions. Within Lake County, a majority oflarge tracts of wooded areas lie within theboundaries of the Lake County ForestPreserve District or within the three State Parkunits. Some of these areas support largecontiguous tracts of forest habitat along themajor stream systems in the county (i.e., alongthe Des Plaines River), most of which areowned and managed by the Lake CountyForest Preserve District. The remaining largetracts of wooded lands are generally located inthe less densely developed areas of the county,within the remaining agricultural areas, oralong streams and creeks. In the urbanizingpart of the county, forested habitat is being

ENVIRONMENTAL CONSEQUENCES
4-85
regularly displaced by development leavingsmall islands of wooded habitat.
Land development is the single largest factorin the disappearance of biological resources.Figure 4-31 shows the critical resources thatreside in the project influence zone. East of theDes Plaines River, high quality habitatgenerally is protected by forest preserve andnature preserve properties. The critical habitatwest of the Des Plaines River is less protected,and therefore subject to removal andfragmentation by land development.Resources remaining in this area would beisolated from other habitat areas, and overtime, this fragmentation would reduce theirhabitat function and value.
Cumulatively, the project alternatives andadvancing development would fragmenthabitat west of the Des Plaines River resultingin an environment dominated by urbantolerant species. Less tolerant species wouldconcentrate in protected areas. Establishing asystem of connected greenway corridors willhelp promote the sustainability of theseresources.
Water Quality. Development patternshistorically have affected the water quality ofstreams by increased stormwater runoff andwastewater discharges. For example, the waterquality of the Des Plaines River has beendistressed by pollutants from urban andsuburban areas. In 1972, the main stem of theDes Plaines River was designated as severelyimpaired for half its length within LakeCounty and moderately impaired for theremaining segment. Water quality violationsoccurred throughout the Des Plaines Riverfrom 1978 through 1983 for dissolved oxygen,ammonia, total dissolved solids, copper, lead,and chlorides. Over the last 10 years, however,
water quality in the entire Des Plaines Riversystem has markedly improved, even withsharp increases in population growth.
Table 4-59 summarizes the changing waterquality conditions for the Des Plaines Riverfor IEPA’s aquatic support classifications.Between 1988 and 1990 over 60 percent of themain stem (Lake, Cook, and Will counties)was classified Partial Support, ModerateImpairment with 13 percent considered Non-Support. In Lake County, roughly 16 km (10mi) were rated as Full Support and theremaining 39 km (24 mi) Partial Support withhalf moderate and half minor impairment.
The water quality improved in 1994–1995, with80 percent of the Des Plaines River classified asPartial Support with only minor impairment. Theonly Full Support segment occurred in LakeCounty. The IEPA Illinois Water Quality Report2000 indicates 50 percent of the Des PlainesRiver stem in Lake County is now Full Support,showing further advancements in water quality.
This trend is linked to improved stormwatermanagement, as well as improved wastewatertreatment. Development in Lake County issubject to the stormwater managementregulation administered by the SMC. TheSMC would review a system of compensatorystorage and detention to abate the effects ofuncontrolled stormwater runoff for the project.The range of state and local regulations arecontrolling the effects of development uponwater resources. Properly applied, waterquality throughout the influence area couldimprove, even with more growth.
Agriculture. In 1997, agricultural lands inLake County comprised about 20 percent(about 26,306 ha, or 60,060 ac) of the county’stotal land area (121,687 ha, or 300,800 ac). In
TABLE 4-59Changing Water Quality Conditions In Des Plaines River (1988–1995)
Year Full Support (Aquatic) Partial Support Minor Partial Support Moderate Non-Support
1988–1989 9.5% 15.6% 61.6% 13.3%
1990–1991 9.5% 15.6% 61.6% 13.3%
1992–1993 3% 59% 22% 15.6%
1994–1995 3% 80% 17% 0%

ENVIRONMENTAL CONSEQUENCES
4-86
recent decades, farmland in Lake County hasdeclined with advancing development.Improving transportation mobility and accesscould affect development decisions near theproject alternatives causing a further reductionin farmlands. The project alternatives wouldeach displace agricultural lands in varyingamounts:
• No-Action Alternative (Baseline) wouldrequire 32 ha (80 ac) of farmland.
• IL 53 Freeway/Tollway Alternative wouldrequire 316 ha (780 ac) of farmland.
• IL 83/US 45 with US 12 Alternativewould require 91 ha (226 ac) of farmland.
Clearly, a high percentage of the availableland for development in Lake County isagriculture that over time will be displaced byadvancing development. Estimates of thecurrent pace of development show that, evenwithout major transportation improvement,lands available for development would bebuilt-out within the next 20 to 30 years. Landdevelopment is the single biggest factor in thedisplacement of farmland resources in thecounty. With most of the farmlands within theplanning and growth boundaries of the50 municipalities within the county, thesustainability of this resource will be difficultto maintain in the face of advancingdevelopment. Development activitiesthroughout the county frequently requirewetland mitigation. Farmlands are commonlyused as mitigation sites.
The cumulative effect of mitigation, similar todevelopment, is resulting in less farmland. Thepreservation of farmland can be sustained onlywith stringent land use policy, outrightpurchase for open space preservation, orpurchase of development rights. The LakeCounty Forest Preserve District obtained thesupport of Lake County voters to fund moniesfor additional land purchases in Lake County.Farmlands contiguous to existing forestpreserves or possessing some high qualityhabitat would be targets for acquisition. Theseactions combined with others would havesome impact on farmland retention.
The right-of-way requirements for the projectalternatives comprise commercial/industrial,residential, agricultural, parks/forest preserves,and open lands. When the alternatives weredeveloped, several environmental issues wereconsidered that influenced the location of theimprovement (Step 10). Among theenvironmental constraints analyzed were thepotential for involvement with Section 4(f)land, avoiding and minimizing the filling ofwetlands and floodplains, and avoidingimpacts to Section 106 properties eligible forinclusion in the National Register of HistoricPlaces. Other factors affecting the location ofimprovements were housing and businessdisplacements, severance of prime farmlands,and community interests. The alternativesdevelopment process was based on thephilosophy of avoidance first, minimizationsecond and mitigation last. Refer to Section4.12, Mitigation Concepts and Commitments,for a discussion of the proposals and conceptsfor the mitigation of resource losses ormanaging short-term and long-term socialeffects.
Monitoring programs for various effects in theinfluence zone will be developed for thepreferred alternative (Step 11).
4.11.2 ConclusionTo conclude, the study area is undergoingrapid population and employment growth.This growth is estimated to continue to year2020. County and municipal governmentswithin the influence zone have planned for thisgrowth and have adopted land use plans for80 percent of the area. The remaining landsare protected park and preservation lands.
The project alternatives combined with otherlocal development efforts would act toaccommodate growth and development, eitherpresent or planned, within the influence zone.The portion of future growth attributable to theproject alternatives is low, amounting to about3 percent of population within the study areain the year 2020. In addition, a number ofregulatory mechanisms are already in place tooffset or moderate the adverse effects of socialand economic growth. Also, the magnitude of

ENVIRONMENTAL CONSEQUENCES
4-87
secondary and cumulative impacts for thefinalist alternatives are not substantive, andthus would require mitigation commensuratewith this relatively low level of impact. Theissue of secondary and cumulative impactswill also be examined in further detail for thepreferred alternative as part of supplementalstudies.
4.12 Mitigation Conceptsand Commitments
Mitigative measures are provided tocompensate for acknowledged impacts. Thefollowing are proposals and concepts for themitigation of resource losses or managingshort-term and long-term social effects.
4.12.1 TrafficA traffic management plan would be requiredduring the construction period. The purpose ofthe plan would be to maintain traffic flow andreliable access to residences, businesses,community facilities and services, and localroads during construction. The No-Action andIL 83/US 45 with US 12 alternatives wouldrequire considerably more traffic managementbecause of their focus on improvements toexisting roadways. The IL 53Freeway/Tollway Alternative would be largelyon new alignment; therefore, management oftraffic would be required only at roadcrossings or in instances where the newimprovement would follow existing roadwaysfor short distances. There would becoordination with fire, police, and emergencyservices to minimize delays and responsetimes during construction.
4.12.2 Community ImpactsCommunity impact mitigation would consistof maintaining or enhancing connectivity,updating land use plans that reconsider landuses along improved routes, and roadwaydesign considerations for developed andundeveloped areas. The following effortscould be made:
• Maintain existing circulation patterns forvehicular, bicycle and pedestrianmovements. Look for opportunities toexpand transit, bicycle, and pedestrianmovement across or along plannedroadway improvements.
• Encourage local municipalities toreexamine land use plans and zoningadjacent to planned improvements todetermine future uses most compatiblewith a high volume roadway environment.Another approach to address related landuse issues would be the creation of acorridor planning council comprisingaffected communities along the project.The council would be engaged in theprocess of developing land use and designguidelines that would address the potentialeffects of a major highway improvement.
• Include roadway design considerations,such as noise barriers, landscaping,landscape berms, buffer areas, androadway lighting sensitive to adjacent landuses, with the improvements to minimizecommunity impacts.
4.12.3 Air QualityConstruction would be required to complywith applicable state and local air qualityregulations. The regulation would apply atleast to fugitive dust control and open burningof construction debris.
4.12.4 NoiseAll construction equipment would be requiredto have mufflers constructed in accordancewith the manufacturer’s specifications.Mufflers and exhausts must be maintained ingood working order. Daily operating hours forconstruction would coincide with theconstruction schedule needs, unless otherwisespecified.
Noise abatement measures for reducing trafficnoise levels to residential and other propertieswould be subjected to consideration forreasonableness and feasibility, and follow theguidance provide by the FHWA policies andprocedures, 23 C.F.R. 772, the IDOT Noise

ENVIRONMENTAL CONSEQUENCES
4-88
Analysis Policy dated April 3, 2000, and theISTHA Traffic Noise Study and AbatementPolicy. Initially, depending on the alternativeselected for implementation, specific analyseswould be conducted to determine the futurenoise levels for properties that approach orexceed the FHWA NAC or are predicted tosubstantially exceed existing noise levels.Traffic impacts would occur when:
• Design-year traffic noise levels exceed theNAC
• Design-year noise levels are within 1 dBAof the NAC
• Design-year traffic noise levels are morethan 14 dBA above traffic-generated noiselevels
Following the determination of impact, a noiseabatement analysis would be conducted at alllocations determined to have a traffic noiseimpact. Noise abatement would be tested ateach location for reasonableness andfeasibility. The feasibility criteria would beconsidered as a reduction in sound level of atleast 8 dBA, and reasonableness at thereceptor would generally be defined as beingcost-effective.
Other measures to reduce traffic noiseincluding traffic management measures andshifting the roadway location would beexamined on a case-by-case basis.
4.12.5 Cultural ResourcesEach project alternative could affect culturalresources of historical or archeological value.During the study, the LCTIP coordinated withthe IHPA to discuss the level of study andobtain available information for knownresources. The agencies concurred that futurework would be required to define culturalresource effects accurately and to appropriatemitigation for the preferred alternative. Theadditional steps would include the following:
• Coordinate with federal agencies, IHPA,local historic societies, Indian tribes, andother public agencies concerning culturalresources.
• Conduct comprehensive fieldinvestigations to identify and locatepotentially eligible properties(archeological sites and historicstructures), both known and unrecorded.
• Employ detailed roadway designconsiderations that would avoid orminimize impacts to cultural resources.
• Prepare eligibility documentation foraffected sites and structures with historicalvalue, and submit it to SHPO for adetermination.
• Determine whether eligible sites complywith agency consultation anddocumentation requirements
• Develop mitigate measures for sites thatare unavoidably affected.
4.12.6 Borrow and DisposalThe requirements for borrow and the amountof unused excavated material have not beendetermined. These quantities would beaddressed after the preferred alternative isselected. The amount and location of borrowcannot be ascertained until preliminaryengineering drawings have been developed,and typically during design and construction.Borrow sites would be identified, and a siteplan would be prepared including anexcavation plan, haul route plan, and end useplan. Appropriate environmental studieswould be conducted for the selected borrowareas including an evaluation of theenvironmental features of the sites and theirpotential environmental effects.
To the extent possible, cut materials with theproper engineering properties would be usedfor fill. The contractor would dispose ofunusable excavated material in accordancewith state and local regulations and otherspecial provisions to ensure protection ofwetlands and waterways. All waste anddemolition material from the project wouldalso be disposed of in accordance with theapplicable regulation.

ENVIRONMENTAL CONSEQUENCES
4-89
4.12.7 Water Quality andHydrology
Proper erosion control measures would beemployed to minimize erosion andsedimentation for any project alternative.These measures are a condition of the Section404 Permits, prescribed in design andconstruction guidance by IDOT and ISTHA,and should be coordinated with the local Soil& Water Conservation District (SWCD).Erosion control devices would be installedbefore commencing construction that couldcause erosion. Temporary or permanenterosion control measures to be used wouldinclude such measures as silt fencing,sediment basins, detention basins, interceptorditches, seeding and sodden, rip-rap onexposed banks, erosion mats and mulching.Disturbance of stream vegetation would bekept to a minimum. Construction activitiesnear special or sensitive streams would beconducted during low or normal flow periodsif necessary.
Stream crossings and structure sizing wouldbe performed in accordance with state andfederal guidelines regarding floodplainencroachment and hydraulic capacity. All newstructures would comply with theseguidelines. Drainage systems, includingditches and farm drain tiles, would bemaintained and restored in a manner thatwould not impound water. Compensatorystorage and stormwater detention facilitieswould be considered in the design of thefacilities and would be reviewed by the LakeCounty Stormwater ManagementCommission. The requirements for bothcompensatory storage and detention areenumerated in Section 4.3.3, Wetlands. Aconceptual plan for satisfying theserequirements is presented in Appendix D.
Other stormwater management practices,known as BMPs, may be needed to mitigatepotential water quality impacts. In addition todetention facilities, other BMPs, such asvegetated strips, would be evaluated tominimize transport of sediment and heavymetals. Deicing management practices, suchas anti-icing and additives, can also minimize
salt application quantities. Further evaluationof these practices would be included in futurework on the preferred alternative.
Accidental spills of hazardous materials andwastes during construction or operation of thefacility would require special responsemeasures. These occurrences would behandled in accordance with local governmentresponse procedures. The first responsetypically is through the fire department andemergency service personnel to ensure publicsafety and to prevent harm to the environment.Depending on the nature of the spill, IDNRand IEPA would be notified to provideadditional instructions regarding cleanup.Refueling or maintenance of constructionequipment would not be allowed within30.5 m (100 ft) of wetlands or water bodies toavoid other accidental spills.
4.12.8 Biological
4.12.8.1 Upland Forest and Prairie LossMitigation of upland prairie and forested areasshould comply with guidelines established bythe IDOT for habitat replacement. For effectedupland prairies, mitigation efforts wouldinclude:
• Reestablishing in-kind upland prairies,with an emphasis on replacementoccurring in wetland buffer zones
• Relocating the topsoil and seed bank,reseeding in kind, and transplanting sodand individual plants
• Planting native prairie vegetation withinroadside right-of-way
Tree replacement would be in accordance withIDOT’s Tree Removal and ReplacementPolicy. Guidelines for tree and vegetationreplacement include:
• Replacing losses of forest habitatassociated with large wooded tracts (4 ha[10 ac] or more)
− Replacing existing native hardwoods
− Replacing adventive species withnative hardwoods

ENVIRONMENTAL CONSEQUENCES
4-90
− Replacing indigenous understory
• Replacing losses for other tree andvegetation material
− Replacing scattered landscapematerial in accordance with IDOT’sGuidelines for Use of LandscapeItems
− Replacing trees and vegetation onSection 4(f) lands to be coordinatedwith the agency having jurisdictionover the subject property
An attempt would be made to minimize andmitigate impacts to wildlife. For large parts ofboth the No-Action Alternative (Baseline) andthe IL 83/US 45 with US 12 Alternative, theproposed improvements are primarily toexisting roadways. These roadways are, forthe most part, limited barriers to wildlifemovement.
As streams provide avenues of wildlifemovement, bridges or open bottom culvertscan be installed where practical to provideadditional corridors of movement for smallerwildlife.
Roadside barriers, such as fences and jerseywalls, may restrict wildlife from enteringroadways. They can also trap wildlife thatenter the roadway, allowing no avenue ofescape. In areas where large numbers ofwildlife are present, such as forest preserves,fencing and other barriers will be limited toareas necessary for public safety. For projectsegments that are new roadways or newalignments, features to facilitate wildlifemovement and reduce vehicle/wildlifecollisions will be incorporated into the planswhere possible.
Larger stream crossings in the IL 53Freeway/Tollway Alternative will be bridgedalong with parts of the floodway. Thesestream corridors will remain open for wildlifemovement.
For sensitive wildlife areas, such as forestpreserves, prairie remnants, and ADID andgeneral wetlands, large box culverts can beinstalled where practical to serve as avenuesfor wildlife movement. The placement of
culverts would be most critical for areas wherea wildlife habitat area is bisected by newroadways. Culverts combined with low barrierwalls along the roadway will provide a safermeans of crossing the roadway.
Short barrier walls in sensitive areas would bedesigned mainly to restrict the movement ofsmall animals, including reptiles, amphibians,and smaller mammals. The walls would notlimit the movement of larger mammals inorder to prevent them from being trappedwithin the roadway. IDOT is proposing snakebarriers as a mitigative option for proposedimprovements to Willow Road in CookCounty to mitigate impacts to Massasaugarattlesnakes that may result from roadwayoperations (IDOT 1999). Similar deviceswould be included where practical.
These features would be most critical in areasthat may harbor threatened or endangeredspecies near the roadways.
Threatened and Endangered Species. Allalternatives could affect the Iowa darter fishspecies near the interchanges of IL 21 andIL 120. IDOT has already committed toproviding mitigative measures forprogrammed proposed improvements to IL 21.Such measures would be incorporated into theplans for the selected preferred alternative.Section 4.3.6.1 provides specific details of thismitigation plan.
The ISTHA has developed a mitigation plan,coordinated through IDNR, for potentialimpacts to the endangered seaside crowfootplant found near the former Deerfield TollPlaza. Proposed improvements to I-94proposed must recognize the potentialpresence of the plant. If encountered, amitigation plan will be developed similar tothe plan that met requirements of IDNR forthe Deerfield Toll Plaza area.
Detailed surveys of fauna and flora would beconducted after the selection of a preferredalternative. If threatened or endangeredspecies are encountered that have not yet beenrecorded, a plan would be developed to avoidaffecting the identified species. If avoidance isimpractical, a mitigation plan would be

ENVIRONMENTAL CONSEQUENCES
4-91
developed, and coordinated with either theU.S. Fish & Wildlife Service or the IDNRthrough the formal consultation process.
Plans for staged construction may beincorporated into the final plans for theselected alternative to minimize disruption ofbreeding seasons for sensitive species.
4.12.9 Wetland MitigationThe overall concept for wetland mitigationwould incorporate avoidance andminimization, establishing wetlandcompensation objectives, applying establishedratios for compensation commensurate withproposed impacted wetlands, identifyinglocations for wetland compensation sites, andadopting plans for long-term monitoring andmaintenance of replacement wetlands. Eachaction is described below.
4.12.9.1 Avoidance and MinimizationThe first step of the process would focus onfurther efforts to avoid and minimize effects towetland resources. The LCTIP has rigorouslyapplied such practice to wetland resourcesduring the development of alternatives.Recognizing the conceptual engineering detailof the project alternatives, further efforts canbe made in future phases of work for thepreferred alternative to avoid and minimizeadditional wetland effects. Avoidance andminimization can be accomplished in thefollowing ways:
• Alignment shifts of roadways
• Narrower roadway cross-section with theuse of:
− Narrower center median− Narrower shoulder− Retaining walls− Steeper roadway embankments− Enclosed drainage systems
• Bridging critical wetland resources
Avoiding or minimizing disruption to wetlandresources may be constrained by other criticalresources or local issues. In some cases, whena choice must be made between wetlands andother critical resources, some resources or
project issues may be afforded priority overwetland loss. Examples include:
• Avoidance of public recreational landsprotected under Section 4(f)
• Avoidance of nature preserves
• Avoidance of threatened or endangeredspecies
• A disproportionate amount of residentialand business relocations
• Maintenance of minimum safetyrequirements
4.12.9.2 Wetland CompensationObjectives
The objectives for mitigation would beestablished jointly by the project’s sponsoringagencies and resource agencies with attentionto the following major issues:
• Type
− In-kind replacement− Functional replacement
• Ratio for replacement• Location for replacement
Ratios For Compensation. Wetlandcompensation ratios have been established bythe State of Illinois in the Interagency WetlandPolicy Act (IWPA) for all state-fundedprojects. These established ratios are generallymore stringent than those established by theU.S. Army Corps of Engineers (Table 4-60, onthe following page). The highest mitigationratio of 5.5:1 would apply for the following:
• Alteration of wetlands that contain state orfederally-listed threatened or endangeredspecies
• Wetlands that contain essential habitat forstate or federally-listed species
• Presence of an INAI site
• A mean C value of 4.0 or more (Swinkand Wilhelm 1994)
• Individual wetlands with a Floristic QualityIndex (Swink and Wilhelm 1994) of 20 ormore

ENVIRONMENTAL CONSEQUENCES
4-92
The compensation ratios shown in Table 4-60represents the current compensation guidelinesrequired for wetland impacts in Illinois by theIWPA; however, Lake County has institutedthe USEPA’s ADID wetland program.Compensation ratios for ADID wetlandswould be developed with the regulatoryagencies on a case-by-case basis.
Location of Wetland Mitigation. The locationof the compensation sites would bedetermined following agreement on wetlandreplacement ratio and other mitigationobjectives. Appropriate environment studieswould be conducted for the selected mitigationsite including an evaluation of theenvironmental features of the site andpotential effects. The environmental studieswould include historic/archaeological surveys,biological surveys, and potential forthreatened and endangered species.Preferences for mitigation are as follows:
• Onsite—within 1.6 km (1 mi) of theproject
− One overall compensation site
− Multiple large to medium sites
− Participation in ongoing wetland creationprograms (i.e., Lake County ForestPreserve)
− Scattered sites (small) in proximity towetland impacts
− Restoration and enhancement ofexisting wetlands
− Acquisition/land protection
• Offsite, within basin—areas greater than1.6 km (1 mi)
• Offsite, out of basin—compensation notprovided within the watershed of affectedwetlands.
4.13 Permits/Certifications
4.13.1 Permits/CertificationsRegulatory permits are required under anyproject alternative selected. Regulatoryagencies, such as the U.S. Army Corps ofEngineers, are not being requested to considerthe granting of 404 permits or other permits atthis time. Supplemental studies would berequired, at a corridor level of detail, as part offormal consultations regarding permits. Suchstudies would include formal wetlanddelineation, biological surveys, and surveys ofthreatened and endangered species for theselected alternative. The agencies are beingasked to review the planning process and theenvironmental consequences of the projectalternatives and to render any commentsgermane to the process or the environmentalconsequences associated with the finalistalternatives. Issuance of permits by theagencies would require detailed engineeringfor the preferred alternative. This study doesnot include the development of the detailedengineering plan for any alternatives.Therefore, submittal of permit applications toall pertinent regulatory agencies would notoccur until after the selection of a preferredalternative and the development of finalengineering plans. Avoidance and
TABLE 4-60Wetland Compensation Ratios (IWPA)
Degree of Adverse Impact Onsite Offsite Out-of-Basin
Minimal Alteration 1.0:1a / 1.5:1b 1.5:1 2.0:1
Significant Alteration 1.5:1 2.0:1 3.0:1
Destruction 2.5:1 4.0:1 5.5:1
aThis ratio applies to all other types of wetland vegetation, substrate, or wetland typeexcept those wetlands that have woody vegetation, subject to Corps approval.bThis ratio applies if the vegetation of the affected wetland is woody.

ENVIRONMENTAL CONSEQUENCES
4-93
minimization strategies required under permitconditions would be developed at that time.Permits could include:
• Section 404 (individual permit) of theCWA from U.S. Army Corps of Engineers
• Section 401 (CWA) Water QualityCertification from the IEPA
• Section 10 of the Rivers and Harbors Act of1899 from U.S. Army Corps of Engineersand the U.S. Coast Guard
• NPDES permit from the IEPA
• Illinois Department of Natural Resources–Office of Water Resources (IDNR-OWR)permits for impacts to regulatoryfloodways and stream crossings
• IHPA approval under Section 106 of theNational Historic Preservation Act (1966)
• Coordination with McHenry Soil & WaterConservation District (SWCD) for soilerosion and sediment control
• Coordination with Lake County SMC forproject compensatory storage, stormwaterdetention, and wetland mitigation (Thiswould be applicable only to projectsimplemented by local agencies under theNo-Action Alternative (Baseline). Stateprojects under the No-Action Alternative(Baseline) would coordinate with localagencies but are not required to meet theguidelines of the Lake County SMC.)
Each project alternative would involve waterbodies and wetlands. The discharge of dredgeor fill materials into waters of the U.S.,including jurisdictional wetlands, would besubject to requirements of Section 404. Thepermitting process for the build alternativeswould vary depending on their implementationas either a single project or a phased project.Assuming either build alternative isimplemented as a single project, an IndividualPermit would most likely be required from theU.S. Army Corps of Engineers ChicagoDistrict for all wetland effects associated withthe project. Should the build alternatives bephased or implemented over time as severalprojects, the likely regulatory scenario would
be an Individual Permit for each separateproject. It is assumed that the No-ActionAlternative (Baseline) would be implementedby various entities as individual projectsovertime and that separate Individual Permitswould be required for each project involvingwetlands as they are implemented under theNo-Action Alternative (Baseline). For someprojects, however, wetland effects may beminimal, and would qualify for the RegionalPermit Program within the Chicago District.
The Section 404 permit is contingent uponreceipt of a 401 Water Quality Certificationfrom the IEPA. IEPA provides water qualitycertification pursuant to Section 401 of theCWA. Each of the project alternatives wouldbe subject to the requirements of Section 401Water Quality Certification.
A recent cooperative agreement between theCorps of Engineers and the local SWCDsrequires a detailed review of erosion andsediment control in conjunction with Section404 permitting. In Lake County, a compliancereview would be conducted by the McHenryCounty SWCD. Each project alternativewould be required to prepare and submit a SoilErosion and Sediment Control Plan for reviewand approval during the Section 404permitting phase. The recommendationsprovided in the Soil Erosion and SedimentControl Plan would require implementationand periodic inspection.
Each project alternative would disturb morethan 0.4 ha (1 ac) of land area. Accordingly,they are subject to the requirements of anNPDES permit for stormwater dischargesfrom the construction site. Permit coveragewould be obtained either under the USEPAgeneral permit for stormwater discharges fromconstruction site activities, or under anindividual NPDES permit. Requirementsapplicable to such a permit would be followed,including preparation of a stormwaterpollution prevention plan. Such a plan wouldidentify potential sources of pollution that mayreasonably describe and ensure theimplementation of practices that would beused to reduce the pollutants in discharges

ENVIRONMENTAL CONSEQUENCES
4-94
associated with construction site activity andto assure compliance with terms of the permit.
The OWR issues permits for work withinregulatory floodways and for the crossing ofstreams with more than 259 ha (640 ac) ofdrainage area. Each project alternative wouldrequire issuance of this permit. Theinvolvement of stream floodways andfloodplains for each alternative as describedunder Section 4.3.3, Wetlands.
The Corps of Engineers defines the DesPlaines River as navigable throughout itscourse (Public Notice, April 22, 1983). Eachproject alternative would improve crossings ofthe Des Plaines River. Under Section 10 of theRiver and Harbors Act of 1899, any crossingof a navigable water body requires Section 10Permits from the Corps of Engineers. Underthe Section 10 Permit, a review by theU.S. Coast Guard is required. All threealternatives would require Section 10 permitsin conjunction with Section 404 permits issuedby the Corps.
The NRCS reviews projects involving farmlandsto determine if farmed wetlands would beaffected. Each project alternative would beassessed to determine the presence of farmedwetlands. The NRCS would coordinate with theCorps of Engineers regarding the issuance ofSection 404 permits if farmed wetlands areaffected by any project alternatives.
The SMC administers stormwater controlsthroughout the county. The SMC criteriawould be applicable to projects implementedby local county, township, or municipalagencies under the No-Action Alternative(Baseline). Although an SMC permit wouldnot be required for State sponsored projectsunder the No-Action (Baseline) and FinalistAlternatives, extensive coordination andreviews would take place with SMC staff foralternatives carried forward.
4.14 Relationship ofShort-Term Usesversus Long-TermProductivity
This section examines the short-term costs andlong-term gains for the project alternatives.The short-term costs of land, human capital,financial, and energy resources would berealized as long-term benefits to the travelingpublic. The long-term benefits would includeimprovements in travel time, regional travel,traffic congestion, and safety.
4.14.1 Short-TermThe project alternatives have varying short-term costs, with the build alternativesrequiring a greater commitment of resourcesthan the No-Action Alternative (Baseline).Overall, the IL 83/US 45 with US 12Alternative would require the greaterinvestment of resources.
Land would be removed under the projectalternatives as follows: 482 ha11 (195 ac)under the No-Action Alternative (Baseline),513.1 ha (1,268 ac) under the IL 53Freeway/Tollway Alternative, and 248.1 ha(613 ac) under the IL 83/US 45 with US 12Alternative from (Section 4.1.2, Communityand Land Use Changes).
Roadway improvements can divide existingland use patterns, bring a community moretightly together, or guide future communitygrowth and development. Carefully plannedimprovements can foster beneficial results,such as making the community more cohesiveand serving future growth and planningpolicies. Lack of planning, however, can haveundesirable results, such as fracturingcommunity cohesion. The discussion belowdescribes the potential effects of eachalternative on community cohesion.
11New right-of-way required.

ENVIRONMENTAL CONSEQUENCES
4-95
4.14.1.1 No-Action Alternative (Baseline)Improvements under the No-ActionAlternative (Baseline) would traverse30 communities within Lake County.Generally, the alternative maintains thepresent roadway network and would have aminimal change on community function. Theroadway network would continue to definecirculation patterns for entering, leaving, andtraveling within the communities. The edge ofthe roadway improvements would encroach onadjacent properties and, in some cases,displace buildings. The number ofdisplacements would be small enough that thecharacter of community building stock wouldnot change. Road widening typically wouldmaintain property access, but barrier medianswould be installed as part of many roadwayimprovements, requiring access to beconsolidated for some properties. Mostindividual parcels would not get a medianbreak and would be limited to right-in, right-out access. For some land use types and crossstreets, a break in the median generally wouldbe provided to allow left-turn access. In someinstances, construction of a wider roadwaycould become a physical barrier, when it maynot have been before upgrading. In such cases,the roadway becomes more of a barrier tobicycle or pedestrian movement.
4.14.1.2 IL 53 Freeway/TollwayAlternative
This alternative would traverse15 communities. The proposal to extend IL 53north and upgrade IL 120 has been part of theregion’s long-range transportation plan since1960; therefore, many communities in thevicinity of this alternative have had theopportunity to consider and plan forcompatible land uses adjacent to the proposedfacility. In cases where properties are alreadydeveloped adjacent to the proposedimprovement, facility design considerationscould be developed to reasonably protect theseareas from typical highway related concerns(i.e., noise and visual concerns). These designconsiderations could include noise barriers,landscaping, landscape berms, buffer areas,roadway lighting sensitive to adjacent land
uses, etc. In cases where that land isundeveloped, additional care in planning andzoning should be exercised to provide for landuse patterns that best fit the presence of amajor transportation facility. This couldinclude locating the most traffic intensive usesnear the corridor or at interchange locations,while the suburban land uses would extendaway from the corridor. With well-managedland use policy and plans, this alternativecould have the distinct advantage ofaccommodating growth with qualitydevelopment.
A major transportation facility, such as theIL 53 Freeway/Tollway Alternative, representsa new land use element for the communities incentral Lake County. The scale of the facilityby itself establishes new borders in thecommunity that tend to define community orneighborhood edges. The perception of abarrier, however, would not alter travelpatterns within the community. The circulationpattern that exists on the local roadway systemtoday would be maintained (crossing over orunder the new facility) for vehicles, bicyclesand pedestrians, as well as emergency servicesand school bus routes. Therefore, the roadwayconnectivity that exists in the communitiestoday would continue to be present with thisalternative. Major projects such as the IL 53Freeway/Tollway Alternative also presentopportunities for enhancing nonmotorizedmovement, which tend to reduce the barriereffect. These enhancements could includeshared bicycle and pedestrian paths along andacross the facility with direct and indirectaccess to existing paths and community nodes.
4.14.1.3 IL 83/US 45 with US 12Alternative
This alternative would traverse21 communities, and improvements wouldoccur on both existing and new alignments.Improvements on existing routes typicallywould have a 6-lane cross-section that woulddisplace residential and commercial structures.
Bypasses were incorporated along routesUS 45, IL 21, IL 60, and IL 120 to avoidcommunity impacts in downtown Mundelein

ENVIRONMENTAL CONSEQUENCES
4-96
and Libertyville, through the Diamond Lakearea (a residential area), and through acommercial corridor in Grayslake. In all fourlocations, through-town improvements wouldbe unacceptable because of the disruption andchange in character that widening wouldcause. Bypasses were selected to minimizedisplacements and community disruptionwhile providing additional capacity to thesystem and helping to relieve congestion onparallel existing routes.
In terms of construction related jobs, theproject alternative would generate 3,300 jobswith the No-Action Alternative (Baseline),6,600 jobs with the IL 53 Freeway/TollwayAlternative, and 7,200 jobs with theIL 83/US 45 with US 12 Alternative(Section 4.10, Construction Impacts). It wouldcost $338 million12 to construct the No-ActionAlternative (Baseline), $674 million toconstruct the IL 53 Freeway/TollwayAlternative, and $735 million to construct theIL 83/US 45 with US 12 Alternative. Theseproject expenditures would induce additionalemployment in the county and the region fromwage and salary respending.
Energy would be consumed during theconstruction of the proposed improvementsand by motorist during the construction period(i.e., construction delay). The number ofproposed improvements and the time requiredfor completion would have a correspondingaffect on the fossil fuels consumed. Theenergy consumed would generally beproportional to the number of lane miles ofimprovement associated with each alternative.Accordingly, the IL 83/US 45 with US 12Alternative would require more energyconsumption for construction than the otheralternatives.
4.14.2 Long-TermThe alternatives provide long-term travelbenefits. The No-Action Alternative(Baseline) would double congestion over thenext 20 years, resulting in travel delays andassociated cost. The build alternatives, 12Construction cost only; does not include right-of-waycost.
however, would reduce travel times, traveldelay, and overall transportation costs (Section3.6.2, Detailed Evaluation of the FinalistRoadway Alternatives). Both build alternativeswould provide substantial travel time savingsover the No-Action Alternative (Baseline).
The IL 53 Freeway/Tollway Alternativeannually would save 18.7 million hours intravel time over the No-Action Alternative(Baseline), and the IL 83/US 45 with US 12Alternative 19.1 million hours of travel time.The IL 53 Freeway/Tollway Alternative wouldprovide greater regional travel benefits thanboth the IL 83/US 45 with US 12 Alternativeand the No-Action Alternative (Baseline) interms of providing improved travel time to agreater regional area. The IL 53Freeway/Tollway Alternative would alsoprovide an additional link in the regionalhighway system, thereby accommodatingmore direct travel, as well as redistributingtraffic from other congested segments of thesystem.
The IL 53 Freeway/Tollway Alternative wouldprovide 596 lane miles of uncongested north-south travel, 66 more lane miles than the No-Action Alternative (Baseline). The IL 83/US45 with US 12 Alternative would provide568 lane miles of uncongested north-southtravel, 38 more lane miles than the No-ActionAlternative (Baseline).
Compared to the No-Action Alternative(Baseline), the IL 53 Freeway/TollwayAlternative would improve safety by 7 percentgreater safety, the IL 83/US 45 with US 12Alternative by roughly 1 percent.
4.15 Irreversible andIrretrievableCommitments ofResources
The proposed project alternatives wouldrequire a commitment of natural, physical,human, and fiscal resources that wouldconstitute an irretrievable and irreversible loss.

ENVIRONMENTAL CONSEQUENCES
4-97
A discussion of those commitments isprovided below.
4.15.1 LandLand acquired to construct the project would bean irreversible commitment during the time theland is used as a highway. Right-of-wayrequirements would convert land fromresidential, agricultural, commercial, and naturalenvironmental resource uses. The commitmentof land would be 195 ha (482 ac) for the No-Action Alternative (Baseline), 613 ha (248 ac)for the IL 83/US 45 with US 12 Alternative, and513 ha (1,268 ac) for the IL 53 Freeway/TollwayAlternative. The direct use of land would be lostto future development, residential, commercial,or open space. The growth inducing effects ofthe project alternatives upon land use within thestudy area is subject to speculation. Factors otherthan improved access weigh heavily in thegrowth trend for Lake County (Section 4.1.2,Community and Land Use Changes).
4.15.2 Raw MaterialsConsiderable amounts of fossil fuel, labor, andhighway construction materials, such as steel,cement, aggregate, and asphalt material,would be required. In addition, considerablelabor and natural resources are used infabricating and preparing constructionmaterials. Those resources generally areirretrievable, but their use would not have asubstantial adverse effect on continuedavailability. Of these resources, theIL 83/US 45 with US 12 Alternative wouldrequire the largest commitment, followed bythe IL 53 Freeway/Tollway and No-ActionAlternative (Baseline)s.
4.15.3 Human ResourcesHuman energy would also be an irretrievablecommitment of resources to the design andconstruction of the project alternatives.Human effort, expressed as person-hours orperson-years of labor, can be categorized as:
• Engineering effort for design andconstruction
• Construction effort
• Effort expended to maintain and operatethe preferred alternative after completion
4.15.4 EconomicConstruction of a build alternative wouldinvolve irretrievable federal, state, and localfunding. Although the fiscal commitments arelarge, they reflect the commitment to improvetravel not only in Lake County but also in theChicago Metro area. The No-ActionAlternative (Baseline) would cost $483 millionto construct, the IL 53 Freeway/TollwayAlternative $861 million, and the IL 83/US 45with US 12 Alternative $1.095 billion (in 1999dollars) minus right-of-way costs. Landconverted from private to public use woulddisplace local tax revenue.
4.15.5 NaturalThe effort made throughout the LCTIP processto avoid and minimize impact to naturalresources resulted in relatively low levels ofimpact to natural resources, considering therather sizeable improvements proposed. Thealternatives would, however, affect naturalresources to a varying extent including:wetlands, parks/forest preserves, threatened andendangered species land, cultural sites,agricultural land, and undeveloped land. SeeTable 4-61 (on pages 4-99 and 4-100) for asummary.
The basis for committing resources is foundedon the concept that residents in the study area,region, and state would benefit from theimproved capacity and safety that would resultfrom the proposed improvements. The benefitssuch as reduced commuting times, improvedaccess to businesses and community servicesand increased safety are expected to outweighthe commitment of resources in the long term.
4.16 Summary ofEnvironmentalConsequences
Table 4-61 summarizes the environmentaleffects of the No-Action Alternative(Baseline) and the two build alternatives.

ENVIRONMENTAL CONSEQUENCES
4-98
These effects would be minimized as much aspossible with the use of appropriate designtechniques and considerations, constructionmethods, and mitigation measures asdiscussed in this document and companiontechnical reports.

ENVIRONMENTAL CONSEQUENCES
4-99
TABLE 4-61Summary of Environmental Consequences
No-Action IL 53 Freeway/Tollway IL 83/US 45 with US 12
Cost (1999 dollars) $483 million $861 million $1.095 billion
Socioeconomic Impacts
Population (2020) 796,942 27,500 more people over No-Actiona 18,000 more people over No-Actiona
Households (2020) 290,570 10,962 more households over No-Actionb 7,640 more households over No-Actionb
Employment (2020) 389,545 4,444 more jobs over No-Actionb 4,200 more jobs over No-Actionb
Community and Land Use Changes No change to communityfunction, or the pattern offuture land development.
Since the early 1960’s the communitieshave considered the potential for a majornew highway in central Lake County; andtherefore have been able to plan for itspotential change to land use.
No material change in communityfunction, or pattern of future landdevelopment.
New Right-of-Wayc 195 ha (482 ac) 513 ha (1,268 ac) 248 ha (613 ac)
Residential Relocations (Additional AncillaryOutbuildings associated with ResidentialRelocations)
67 113 (45) 187 (25)
Business Relocations 23 9 195
Parking Impacts (# of displaced parkingspaces)
—d 109 (0) 2,514 (258)
Percent of Total Assessed Value Converted 0.20 0.30 0.47
Environmental Justice No disproportional impact No disproportional impact No disproportional impact
Public Services and Facilities 0 0 9
Agricultural Impacts
Direct Farmland Impacts 32 ha (80 ac) 315 ha (780 ac) 91 ha (226 ac)
Market Value of Affected Crops $21,000 $205,000 $59,300
Farm Operations Minimal effect 36 farm parcels 20 farm parcels
Natural Resources
Wetlands (all direct impacts) 32 ha (78 ac) 37 ha (92 ac) 23 ha (58 ac)
ADID Wetlands 5 ha (13 ac) 4 ha (9 ac) 2 ha (4 ac)
Class I —e 5 ha (12 ac) 1 ha (2 ac)
Class II —e 10 ha (25 ac) 14 ha (35 ac)

ENVIRONMENTAL CONSEQUENCES
4-100
TABLE 4-61 CONTINUEDSummary of Environmental Consequences
No-Action IL 53 Freeway/Tollway IL 83/US 45 with US 12
Class III —e 23 ha (56 ac) 8 ha (20 ac)
Floodplain Impacts 38 FIS floodplains 10 FIS 33 FIS
Longitudinal Encroachments 9 0 12
Transverse Encroachments 1 12 17
Threatened and Endangered Species 1 1 1
Water Quality Does not exceed criteria Does not exceed criteria Potentially exceeds chloride standard
Air Quality Does not exceed criteria Does not exceed criteria Does not exceed criteria
Noise 1,211 residentialstructures f
417 residential structures f 273 residential structures f
Potential Section 4(f) ResourcesCultural Resource Impacts
Historic Structures 13g 3 6
Archaeological Sites 10 4 2
Potential Forest Preserve and Local Park4(f) Impacts (area)
7 ha (17 ac) 8 ha (20 ac) 8 ha (19 ac)
Potential Forest Preserve and Local Park4(f) Impacts (number of properties)
22 5 19
Special Waste
CERCLIS 0 0 0
LUST 20 3 34
Note: For purposes of a summary, all area values are rounded to the nearest whole number. Impacts are summarized individually for each alternative.a Represents additional population for roadway improvements only.b Represents additional households for both roadway and transit improvements.c Includes new right-of-way requirements only—use of existing right-of-way would be associated with each alternative.d Parking displacements were not investigated for the No-Action Alternative (Baseline).e No field verification of wetlands performed for No-Action Alternative (Baseline), therefore, no qualitative assessment completed.f Structures near the proposed improvements that would exceed the noise abatement criteria for residential areas—does not include those that would be displaced.g Based on available Phase 1 preliminary engineering and environmental documentation reports.

5-1
SECTION 5
Coordination
Since the initiation of the study in spring 1998,the LCTIP has met with representatives fromfederal and state resource agencies, county andlocal officials, transportation service agencies,business and civic groups, and local residents.Through a structured coordination andcommunication program designed toencourage maximum input, everyone with aninterest in transportation has gatheredinformation and offered input to the study.The LCTIP’s program has been tailored tothree primary audiences: agency and electedofficials, interested groups, and the public.
This study has been designed to encouragemaximum input from government,transportation, and planning organizations, aswell as the public. This section provides asummary of the agency coordination andpublic involvement that has occurred duringthe preparation of the DEIS.
5.1 Federal, State, and LocalAgency Coordination
5.1.1 IntroductionAt the beginning of the study, groups wereestablished with various agencies and electedofficials to inform them of study activities,encourage meaningful dialog, and receivefeedback on major study issues. Establishedgroups include the Resource Agency Group(RAG), Municipal Groups (MGs), TechnicalAdvisory Group (TAG), and the Lake County
Board Joint Committee. These groups haveprovided input to the process, includingperceptions on transportation needs/issues,assistance with obtaining data, study approach,and study output review. Following is anoverview of the four groups and their role in thestudy.
5.1.2 Resource Agency GroupThe RAG, comprised of state and federalresource and regulatory agencies involved inthe NEPA process, included representativesfrom the agencies listed in Table 5-1.
The role of the RAG was to:
• Communicate issues, concerns, andregulatory requirements associated withresources in the study area
• Review technical aspects of the study
• Review and provide input in developingevaluation factors, criteria, and otherperformance measures to be used inalternative development and screening
• Serve as a communication link to and fromthe representative agencies and the group
• Attend meetings regularly and shareagency information
It was recognized from an environmentalperspective that this study would require adifferent approach for identifying, measuring,and analyzing impacts. The RAG has beeninstrumental in assisting the study team in
TABLE 5-1Resource Agency Group Membership
• US Environmental Protection Agency (USEPA)*• US Fish and Wildlife Service (USFWS)• US Army Corp of Engineers (USACOE)• USDA Natural Resources Conservation Service
(NRCS)• Illinois Nature Preserves Commission (INPC)
• Illinois Department of Agriculture (IDOA)• Illinois Department of Natural Resources (IDNR)*• Illinois Historic Preservation Agency (IHPA)• US Department of Housing and Urban
Development (USHUD)
* Two agencies that serve on this group, USEPA and IDNR, also served on the TAG.
COORDINATION
5-2
developing a reasonable approach forconsidering environmental concerns over thelarge study area (which is in excess of1,295 km2, or 500 mi2). The recommendedapproach involved developing anenvironmental database, compiled as a GISdatabase. Through group exercises, membersreviewed environmental data, provided input,and agreed that the use and accuracy ofavailable data is acceptable for this study.The RAG, through group exercises, alsoparticipated in refining the objectivesdeveloped by the TAG by examining how theobjectives relate to the Purpose and Need.
The RAG contributed to the alternativesdevelopment process and agreed that the initialsets of roadway and transit improvementsrepresented a reasonable range of alternativesfor consideration.
The group met nine times in a group forum todiscuss analysis methodology, resource issues,and regulatory issues (see Table 5-2, on thefollowing page). Minutes from these meetingsare included in the study record, and included inthe Public Involvement and CoordinationSummary Report.
Correspondence with resource agencies isincluded in Appendix G. Correspondence earlyin the study process involved data sharing fromexisting agency databases and identification ofresource issues to be addressed in theenvironmental documentation. Correspondencelater in the study process included input from theUSFWS addressing the presence of federallythreatened and endangered species in the vicinityof the finalist alternatives.
The purpose of the individual meetings withIDNR, IDOA, USEPA, USACOE, USFWS, andUSHUD prior to release of the DEIS was todiscuss the approaches and revisions to some ofthe study methodologies based on their area ofexpertise and interest. Overall the resourceagencies were satisfied with the overall processand the level of detail used in the analysis. TheIDNR agreed with the study approach and morespecifically agreed with the functional wetlandassessment methodology applied to the impactedwetlands in the study area.
The USEPA was supportive of the LCTIP’splanning process, and suggested that it be usedon other projects. Regarding the FinalistAlternatives, the USEPA noted their agency’semphasis on wetland impacts, while alsoacknowledging the trade-offs associated withimpacts to other resources. The USEPA alsoconcurred with the LCTIP’s wetland assessmentmethodology.
The IDOA requested that additional informationbe included in the agricultural analysis,including: (1) a more definitive assessment ofprime and important farmland impacts for thebuild alternatives; (2) the use of the most recentsatellite imagery; (3) an assessment of thenumber of farm operation impacts, and (4) anassessment of the number of uneconomic farmremnants created by the alternatives. Based onthe suitability of the analysis for this type ofstudy, the analyses identified in points 1 and 2were incorporated into the study and the resultsare reflected in this DEIS. Points 3 and 4 wouldbe addressed as part of future analyses for thepreferred alternative.
The USACOE agreed with the overall processand agreed in concept with the wetlandassessment methodology. Based on meetingdialog the USACOE suggested that a fieldreview with USACOE and LCTIP staff beconducted to verify the methodology and scoringsystem applied in the assessment. Following thefield review the USACOE suggested tworefinements to the assessment: eliminate ClassIV wetlands, and modify the scoring system toacknowledge the value of smaller wetland sites.Both of these suggestions were implemented andthe results of the revised assessmentmethodology are included in this DEIS.
The USFWS indicated agreement with thewetland methodology however, expressed someconcern for the flood attenuation scores. Furtherdiscussion of this issue led to concurrence withthe process by USFWS for a macro levelanalysis.
The USHUD stated that their primary issue isgrowth patterns in the region. Specifically theywill be examining the growth impacts associatedwith each alternative. Overall they have
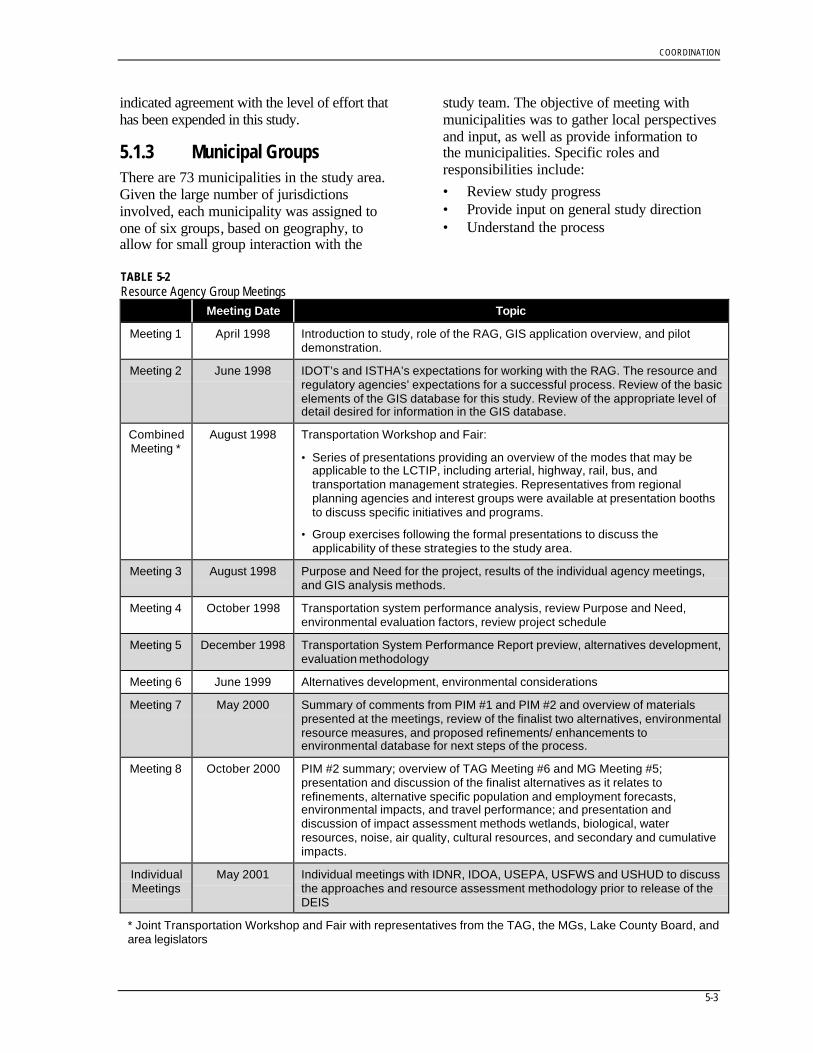
COORDINATION
5-3
indicated agreement with the level of effort thathas been expended in this study.
5.1.3 Municipal GroupsThere are 73 municipalities in the study area.Given the large number of jurisdictionsinvolved, each municipality was assigned toone of six groups, based on geography, toallow for small group interaction with the
study team. The objective of meeting withmunicipalities was to gather local perspectivesand input, as well as provide information tothe municipalities. Specific roles andresponsibilities include:• Review study progress• Provide input on general study direction• Understand the process
TABLE 5-2Resource Agency Group Meetings
Meeting Date Topic
Meeting 1 April 1998 Introduction to study, role of the RAG, GIS application overview, and pilotdemonstration.
Meeting 2 June 1998 IDOT’s and ISTHA’s expectations for working with the RAG. The resource andregulatory agencies’ expectations for a successful process. Review of the basicelements of the GIS database for this study. Review of the appropriate level ofdetail desired for information in the GIS database.
CombinedMeeting *
August 1998 Transportation Workshop and Fair:
• Series of presentations providing an overview of the modes that may beapplicable to the LCTIP, including arterial, highway, rail, bus, andtransportation management strategies. Representatives from regionalplanning agencies and interest groups were available at presentation boothsto discuss specific initiatives and programs.
• Group exercises following the formal presentations to discuss theapplicability of these strategies to the study area.
Meeting 3 August 1998 Purpose and Need for the project, results of the individual agency meetings,and GIS analysis methods.
Meeting 4 October 1998 Transportation system performance analysis, review Purpose and Need,environmental evaluation factors, review project schedule
Meeting 5 December 1998 Transportation System Performance Report preview, alternatives development,evaluation methodology
Meeting 6 June 1999 Alternatives development, environmental considerations
Meeting 7 May 2000 Summary of comments from PIM #1 and PIM #2 and overview of materialspresented at the meetings, review of the finalist two alternatives, environmentalresource measures, and proposed refinements/ enhancements toenvironmental database for next steps of the process.
Meeting 8 October 2000 PIM #2 summary; overview of TAG Meeting #6 and MG Meeting #5;presentation and discussion of the finalist alternatives as it relates torefinements, alternative specific population and employment forecasts,environmental impacts, and travel performance; and presentation anddiscussion of impact assessment methods wetlands, biological, waterresources, noise, air quality, cultural resources, and secondary and cumulativeimpacts.
IndividualMeetings
May 2001 Individual meetings with IDNR, IDOA, USEPA, USFWS and USHUD to discussthe approaches and resource assessment methodology prior to release of theDEIS
* Joint Transportation Workshop and Fair with representatives from the TAG, the MGs, Lake County Board, andarea legislators

COORDINATION
5-4
• Participate at public events• Identify need for local or community
meetings
The MGs contributed to the study team’sunderstanding of local transportation issues,increasing the sensitivity to local issues thatcan be addressed as part of a larger study. Thetechnical analyses completed by the studyteam, such as the Transportation SystemPerformance Report, were supported by theperceptions and insights shared by localofficials at these meetings. The group helpedthe study establish a broad base at the locallevel. As the group members communicatedstudy findings and issues to their constituents,they often identified opportunities for furtherLCTIP interaction via the speakers’ bureauevents.
The group convened six times to discuss thetransportation issues facing the study area, theresults of technical analyses, and alternativeconcepts (see Table 5-3). Minutes from eachmeeting are included in the study record, andincluded in the Public Involvement and
Coordination Summary Report. All meetingswere open to the public and public input andcomments were solicited at the end of eachmeeting.
5.1.4 Technical Advisory GroupThe TAG consists of representatives fromtransportation service providers, resourceagencies, local government, and regionalplanning agencies. These representatives arelisted in Table 5-4 (on the following page).
The TAG provided input on technical issuesrelating to transportation needs andalternatives development and evaluation.Specific roles and responsibilities included:
• Review the progress of the study andprovide input to the study team ontechnical approaches, technical input, andoutput from the study
• Serve as a communication link to and fromthe representative communities andagencies
• Serve as a visible part of the study byattending study events (such as public
TABLE 5-3Municipal Groups Meetings
Meeting Date Topic
Meeting 1 May/June1998
Introduction to study and role of the MG. Group exercise to identifytransportation issues facing the study area.
CombinedMeeting*
August 1998 Transportation Workshop and Fair:
• Series of presentations providing an overview of the modes that may beapplicable the LCTIP, including arterial, highway, rail, bus, andtransportation management strategies. Representatives from regionalplanning agencies and interest groups were available at presentation boothsto discuss specific initiatives and programs.
• Group exercise following the formal presentations to discuss the applicabilityof these strategies to the study area.
Meeting 2 January 1999 Findings of the Transportation System Performance Report.
Meeting 3 July 1999 Presentation of the initial roadway and transit improvements, includingtransportation performance and potential impact data. (Meeting prior to PIM #1)
Meeting 4 May 2000 Presentation of the roadway refinement process, transportation performancemeasures, and recommended finalist improvements. (Meeting prior to PIM #2)
Meeting 5 October 2000 Refinements to finalist transit enhancements and roadway alternativesincluding a discussion of the refinement process, transportation performancedata, and potential impacts.
* Joint Transportation Workshop and Fair with representatives from the TAG, the RAG, Lake County Board,and area legislators

COORDINATION
5-5
meetings) and identifying local meetingneeds
This group provided a forum for the studyteam to present and discuss technicalprocesses. For example, early in the study, theTAG assisted the study team in establishing anumber of study objectives fromtransportation issues identified at other publicand group meetings. Working through a groupworkshop, the representatives identified thefollowing objectives:
• Road Network
− Attract travel to the appropriatefunctional facilities
− Provide sufficient capacity on majorcorridors
− Reduce network congestion
• Public Transportation
− Determine appropriate level of transitthat can be achieved
− Improve transit connections to finaldestinations
• Environmental
− Protect and preserve importantenvironmental and societal resources
• Other
− Focus improvements to support localeconomic development objectives andland use preferences
− Consider regional travel needs
The TAG representatives from the varioustransportation service providers were alsoinstrumental in working with the LCTIP toidentify projects that would be built regardlessof the recommendations made by the LCTIP(creating the No-Action Alternative[Baseline]). The group was supportive of anopen examination of alternatives, regardless ofjurisdiction. This lead to a wide examinationof alternatives in terms of both geography andmode (i.e., road, rail, and bus).
The group met seven times during the study.Table 5-5 (on the following page) summarizesthe topics discussed at these meetings. Minutesfrom each of these meetings are included in thestudy record, and included in the PublicInvolvement and Coordination SummaryReport. All meetings were open to the publicand public input and comments were solicited atthe end of each meeting.
5.1.5 Lake County Board JointCommittees
The LCTIP met with the Lake County BoardJoint Committees (Planning, Building &Zoning and Public Works & Transportation)seven times during the study. The LakeCounty Board Joint Committees identifiedimproving transportation as one of their toppriorities. They adopted a resolution in supportof this process and provided a forum for theLCTIP and other interested groups to discusstransportation issues and study findings. At the
TABLE 5-4Technical Advisory Group Membership
• Illinois Department of Transportation• Illinois State Toll Highway Authority• Chicago Area Transportation Study• Northeastern Illinois Planning Commission• Regional Transportation Authority• Metra• Pace• Illinois DNR (ex-officio member)*• USEPA (ex-officio member)*• FHWA (ex-officio member)• Lake County Division of Transportation
• Lake County Department of Planning and Development• Cook County Highway Department• McHenry County Highway Department• Kenosha County Division of Highways• Federal Transit Administration• Municipal Group #1 Representatives (2)• Municipal Group #2 Representative• Municipal Group #3 Representative• Municipal Group #4 Representative• Municipal Group #5 Representative• Municipal Group #6 Representative
* The USEPA represents the federal resource agencies and the IDNR represents state resource agencies.

COORDINATION
5-6
beginning of the study, this group helped theLCTIP define the transportation issues facingthe county. As the study progressed the LCTIPmet with elected officials to share informationat key study milestones and to solicit input.The Lake County Board Joint Committeessupported the study process and suggestedanalyses for further examination. For example,one examination included how thetransportation proposals would influence thecounty road system. In response, the LCTIPdid an extensive analysis of the changes to thecounty route system.
The Transportation System PerformanceReport, Alternatives Development andEvaluation Report, and this DEIS will serve asa foundation for future transportation planningin the county. Table 5-6 (on the followingpage) provides an overview of the specific
topics discussed at each meeting. Meetingminutes are included in the study record, andincluded in the Public Involvement andCoordination Summary Report.
5.2 The Public andInterested Groups
Opportunities for public involvement includeda community-based working office inMundelein, an interactive web site, and a widevariety of forums for public comment,including focus groups, PIMs, speakers’bureaus, and agency and elected officialmeetings. Up-to-date study information wasprovided in regular newsletters and on thestudy web site. The study team employed abroad range of activities to maximize the
TABLE 5-5Technical Advisory Group Meetings
Meeting Date Topic
Meeting 1 June 1998 Introduction to study and role of the TAG. Group exercise to identifytransportation issues facing the study area.
CombinedMeeting *
August 1998 Transportation Workshop and Fair:
• Series of presentations providing an overview of the modes that may beapplicable to the LCTIP, including arterial, highway, rail, bus, andtransportation management strategies. Representatives from regionalplanning agencies and interest groups were available at display booths todiscuss specific initiatives and programs.
• Group exercise following the formal presentations to discuss the applicabilityof these strategies to the study area.
Meeting 2 October 1998 Overview of the “Technical Tools” that will be employed on this study including:GIS, travel demand forecasting, and regional growth scenarios. Presentationincluded an overview of the perceived transportation issues in the study area aswell as a workshop to assist in the development of project objectives.
Meeting 3 January 1999 Transportation System Performance Report findings; project No-Action (orBaseline) Improvements; overview of the alternatives development &alternatives evaluation process
Meeting 4 June 1999 Purpose and Need for the study; alternatives development process; Preliminaryroadway and transit improvements
Meeting 5 May 2000 Roadway refinement process; performance measures; finalist roadway & transitimprovements
Meeting 6 October 2000 Finalist transit enhancements; finalist roadway alternatives including discussionof refinements, impacts, and performance
* Joint Transportation Workshop and Fair with representatives from the RAG, the MGs, Lake County Board,and area legislators.

COORDINATION
5-7
participation of groups and individuals in theplanning process.
5.2.1 Poll and Focus GroupsDuring the early months of this study, surveyswere conducted by the study team to gauge theperception of the transportation system user inthe study area and to acquire input on thetransportation issues of the study area. Publicinput was first gained through a series of fourfocus groups conducted in March 1998. Theprimary objective of this exercise was toidentify perceived problems and potentialsolutions regarding transportation in the studyarea. The results were used to identify theissues of importance from the participants’perspective that could be further explored. Thefocus groups were comprised of people whocommuted by automobile or publictransportation, those who commuted short aswell as long distances to work, and those whodid not commute to work. The participantsreflected a variety of commuting patterns andopinions.
The overall perception of the participants wasthat the transportation problems of LakeCounty were rapidly worsening. Participantsfelt that improving the transportation systemshould be a top priority for the county. Themost frequently cited issue was roadimprovement, followed by train and bussystem improvements. See the TransportationSystem Performance Report, Appendix A.
The focus group exercise was followed by anextensive countywide survey. Between Apriland May 1998, 500 random telephoneinterviews were conducted with licenseddrivers in Lake County. The surveyrespondents were comprised of automobileand transit commuters, as well as people whowalked or car/van pooled.1
The phone survey results are included in theTransportation System Performance Report,Appendix B. The majority of respondentsidentified congestion on main roads, atintersections, and in residential areas as themost important transportation issue in Lake
1 The size of the survey is statistically valid, with a marginof error ±5 percent.
TABLE 5-6Lake County Board Joint Committee Meetings
Meeting Date Topic
Meeting 1 May 1998 Introduction to study and process, define transportation issues.
CombinedMeeting *
August 1998 Transportation Workshop and Fair:
• Series of presentations providing an overview of the modes that may beapplicable the LCTIP, including arterial, highway, rail, bus, andtransportation management strategies. Representatives from regionalplanning agencies and interest groups were available at presentationbooths to discuss specific initiatives and programs.
• Group exercise following the formal presentations to discuss theapplicability of these strategies to the study area.
Meeting 2 January 1999 Findings from the Transportation System Performance Report.
Meeting 3 May 1999 Population and employment forecasts, alternatives development andevaluation process; Crossroads review.
Meeting 4 August 1999 Initial component improvements for roadway, transit, and traffic management(Prior PIM #1).
Meeting 5 May 2000 Refinements and evaluation to finalists.
Meeting 6 November 2000 Refinements to finalist alternatives. Response to the county’s request for dataon the effect the LCTIP alternatives would have on county roads and growthdistribution.
* Joint Transportation Workshop and Fair with representatives from the TAG, the RAG, the MGs, and arealegislators

COORDINATION
5-8
County. The need for improvements to majornorth-south and east-west routes was acommon response. Public transportationregistered less concern by the public.
When asked to rate possible transportationsolutions, 75 percent of respondents indicatedthat road improvements should be planned inadvance of development. Additionally ,respondents indicated a strong interest insolutions that would improve the roadnetwork, including intersection improvements,road widening, new highways, and trafficsignal coordination. The poll and focus groupinformation, coupled with input from theagency and elected officials and technicalanalyses, provided the basis for developingalternative solutions.
5.2.2 Public InformationalMeetings
Two rounds of public meetings were heldduring the study process. For each round,meetings were held in multiple locationsthroughout the study area for the convenienceof participants. The meetings were announcedthrough study newsletters, advertisements inlocal newspapers, news releases, andinvitation letters to interestedindividuals/groups on the study mailing list.
The public meetings were conducted in anopen-house format, with personnel from theLCTIP, their consultants, IDOT, ISTHA,PACE, Metra, RTA, and CATS present toanswer questions and receive comments aboutthe study. A Public Hearing will be held afterrelease of this DEIS for public review andcomment. The hearing will also be held indifferent locations in the study area, andconducted in an open-house format.
5.2.2.1 Public Informational Meeting #1In August 1999, the LCTIP presented theinitial roadway, rail, and bus improvements.More than 800 people attended the events toreview the proposed improvements, askquestions, and provide input. In addition to thestrong turnout at the meetings, nearly 600written and oral comments were received.
The overwhelming majority of participantsagreed that major transportation improvementsare needed in one form or another. Followingis a summary of the major recurring commentsand questions.
• A majority of commenters supportedmajor transportation improvements; by amargin of 2:1, commenters supported theIL 53 set of improvements
• Commenters expressed a high degree offrustration with existing traffic congestionand a desire for road improvements to bebuilt as soon as possible
• Many were concerned with the failure of roadimprovements to keep pace withdevelopment
• Many believed growth would happenregardless of road improvements
• Some wanted to know if more can begotten from the existing transportationsystem (e.g., traffic signal coordination,road underpass/overpass at railroadcrossings, and additional turning lanes atintersections)
• Others wanted to know if IL 53 wouldcause development and growth
• Some supported improving existing roadsand seeing what happens
• Some were interested in providingimprovements for alternative types oftransportation (transit, bicycles, andpedestrians)
• Some asked if the quality ofenvironmental resources is beingconsidered when assessing impacts
Newsletter No. 3 (Fall 1999), located inAppendix H, provides a summary of staffresponses to these comments and questions. Afull summary of the meeting is available in theproject file, including responses to individualcomments received at the meeting.
5.2.2.2 Public Informational Meeting #2The second round of public meetings was heldin May 2000. Nearly 4,000 comments were

COORDINATION
5-9
received at the meetings, which underscoresthe strong support that has evolved for thisplanning process. Following is a summary ofthe comments gathered at the event.
• The majority of comments centered on theIL 53 set of improvements; by a margin of4:1, people expressed their support for theextension of IL 53
• Some wanted to know what is being doneto improve existing roads
• Some asked if the finalist alternativeswould cause more growth
• Some asked if improving existing roadswould have fewer impacts
Newsletter No. 4 (Summer 2000), located inAppendix I, provides a summary of staffresponses to these comments and questions. Afull summary of the meeting is available in theproject file, including responses to individualcomments received at the meeting.
5.2.3 Project VideosThree videos were developed during the study.The first video was an introductory videodescribing the project. The second and thirdvideos were prepared for the first and secondpublic meetings. These videos provided anoverview of the progress and accomplishmentsof the project to date, as well as introduced thematerials presented at the meetings. A copy ofeach video was distributed to all electedofficials in the study area, and was included inthe project record. The videos were alsoshown on local cable television in severalcommunities.
5.2.4 Speakers’ Bureau A speakers’ bureau was established as a forumto speak with interested groups and the mediaabout the study. The speakers’ bureauincluded:
• A presentation (slide show) that wasupdated throughout the study
• Study-related materials for distribution
• Study team staff to respond to questions
This type of venue served multiple purposes,including elevating the awareness of this studyand its progress, ability to meet withorganizations on short notice, anddemonstrating the LCTIP’s interest inreceiving input.
Through this forum, the study teamparticipated in approximately 60 meetings.Table 5-7 (on the following page) summarizesthe groups that were involved in these events.Summaries of each meeting are included in thestudy record, and included in the PublicInvolvement and Coordination SummaryReport.
5.2.5 Project Office A project office established in Lake County inMundelein is staffed by a management teamconsisting of the project managers and anadministrative assistant. The office serves as acentral location for public outreach, includingphone inquiries, small group meetings, andpress conferences, and as a drop-in center forinterested individuals to visit and discuss thestudy or review specific materials. The officereceived over 1,000 visitors/phone inquiriesduring the study.
5.2.6 NewslettersFive study newsletters were distributedthroughout the development of the DEIS. Thenewsletters describe important studyinformation and provide opportunities forpublic input. For example, the first two studynewsletters that were distributed includedpostage paid comment forms. The newsletterswere distributed by mail and posted to thestudy web site. Table 5-8 (on page 5-11)provides an overview of each newsletter.
In addition to the newsletters, two studybrochures were developed and distributed. Thefirst brochure provided an introduction andoverview of the study and planning process.The second brochure provided a detaileddescription of the alternatives developmentand evaluation process. The first brochure wasdistributed at early group meetings and theTransportation Workshop and Fair. Thesecond brochure was posted to the study web

COORDINATION
5-10
site, mailed to group members and electedofficials, and available as a handout at thePIMs.
5.2.7 Web SiteA study web site,http://www.lakecountytip.com, was establishedas another means of disseminating informationabout the study. The site, updated regularly,was promoted via study newsletters and othermeans. Initially, the site contained generalstudy information, including an introduction to
the study, study organization, and schedule. Italso contained a form-based inquiry/feedbackpage. As the study progressed, the followinginformation was posted on the site:
• Study group meeting summaries• PIM summaries• Newsletters• Frequently asked questions and answers• Study findings and reports, including:
− Transportation System PerformanceReport
TABLE 5-7Group Meeting List
American Society of CivilEngineers
Lake Cook TMA Lincolnshire Rotary
Antioch Lions Club Lake County and DuPage CountyChapter of APWA
Lindenhurst Village Board
Antioch Rotary Lake County Chamber ofCommerce
Long Grove Rotary
Barrington Area Council ofGovernments
Lake County Farm Bureau McHenry EDC
Barrington Lions Club Lake County Municipal League Mundelein High School
Buffalo Grove Chamber ofCommerce
Lake County Partners Mundelein, Vernon Hills,Libertyville Kiwanis
Citizens to Protect Quality of LifeThrough Better Transportation
Lake Forest City Council Mundelein Village Board
Deerfield, Bannockburn,Riverwoods Chamber ofCommerce
Lake Forest Hospital Northern IL Business PAC
Deerfield Senior’s Men Club Lake Forest, Lake Bluff KiwanisClub
Northwest Municipal Conference
Grayslake AARP Lake Forest, Lake Bluff Lions Club Power Breakfast
Grayslake Chamber of Commerce Lake Zurich Rotary Rotary of Mundelein, Vernon Hills
Grayslake Chapter of AmericanBusiness Women’s Association
Lake Zurich Revitalization Project Stevenson High School
Greater Lincolnshire Chamber ofCommerce
Lake Zurich Village Board Transportation forum sponsored bythe League of Women Voters
Gurnee Breakfast Exchange Libertyville Junior Women’s Club Vernon Hills, Grayslake, Gurnee,and Kildeer Village Boards
Highland Park Good MorningRotary
Libertyville Kiwanis Club Wauconda Rotary
Highland Park Kiwanis Club Libertyville, Mundelein, VernonHills Chamber of Commerce
Waukegan Rotary
Highland Park Lions Club Libertyville Noon Rotary Zion Benton Kiwanis Club
Kiwanis Club of Gurnee Libertyville Sunrise Rotary Zion Chamber of CommerceZion Exchange Club

COORDINATION
5-11
− Initial, refined, and finalistalternatives
− Transit improvements
− Alternatives Development andEvaluation Report
− Draft Environmental ImpactStatement
• Links to other web sites:
− IDOT, http://www.dot.state.il.us
− ISTHA,http://www.illinoistollway.com
The study web site was accessed by nearly5,000 users, and approximately 300 commentswere received by the form-basedinquiry/feedback page.
5.2.8 Mailing ListA mailing list of over 3,500 names wasmaintained and updated regularly throughoutthe course of the study. The list includedinterested individuals, representatives ofinterest groups, state, county, and local electedofficials, and appropriate agency personnel.The mailing list was used to generate labelsfor newsletter mailings and letters for morespecific mailings, such as meeting invitations.
5.3 The Effect ofCoordinationActivities
Providing information and receiving feedbackhas been a foundation element of the studyprocess. Through a structured program thathas provided numerous opportunities forinput, the LCTIP has been able to obtain thebroadest participation at all levels: the public,interested groups, agencies, and electedofficials.
Using a multitude of communication tools, thepublic has had numerous avenues to getinvolved. With nearly 100 meetings—including interested groups, two major publicmeetings, a transportation fair, numerous TAGand MG meetings, newsletters, web site, andmedia—the people in Lake County have had achance to hear and be heard. Through anunprecedented outreach program, the LCTIPhas gained a thorough understanding of thetransportation issues facing Lake County andarea residents have also become bettereducated about transportation. Residents citecongestion as their primary quality of lifeissue, and place an emphasis on improving theroadway system, followed by transit. Peoplerecognize that the rapid rise in population hascontributed greatly to the transportation crisisLake County faces. Continued growth in thecounty will only worsen the transportationproblems facing the county if no majorimprovements are implemented.
TABLE 5-8Newsletter OverviewNewsletter No. When Distributed Topics
1 Fall 1998 Introduction to studyPublic involvement avenuesTransportation issues
2 Spring 1999 Transportation system performance findingsNo-Action (Baseline) network & forecastsAlternative development and evaluation process
3 Fall 1999 – Following PIM # 1 Presentation of initial alternatives and impactsCrossroads reviewPublic comments/responses
4 Summer 2000 – FollowingPIM # 2
Finalist roadway and transit improvementsPublic comments/responses
5 Summer 2001 DEIS release, key findings, Public Hearing invitation

COORDINATION
5-12
The LCTIP is a collective planning effort thathas garnered widespread support, bringingtogether transportation service providers,communities, and elected officials. The studyhas embraced a process that allowed for theinvestigation of a broad analysis of alternativesolutions, including the ideas of others. Basedon input received, the LCTIP considered aneast-west improvement scenario, whichfocused on improving east-west arterials (seeSection 3, Alternatives). The LCTIPconsidered alternative solutions put forth byinterest groups (Section 3, Crossroads Plan)and perceptions that smaller scale projects,such as adding turning lanes at intersections,synchronizing traffic signals, etc., could meetLake County’s transportation needs. Inaddition, the LCTIP analyzed the effects of thefinalists on the roadways maintained by thecounty.
Early perceptions that new highways wouldcause massive growth were another importantconsideration of the LCTIP. Through arigorous analysis using methodologiesendorsed by NIPC, the LCTIP was able toisolate the growth impacts of the projectNo-Action (Baseline), transit , and finalistroadway alternatives. It was clear from theanalysis that the impact of transportation ongrowth in Lake County is minimal. Theanalysis reinforced the realization that factorsother than transportation are driving LakeCounty’s rapid growth and that transportationimprovements are needed to keep the countyout of gridlock.
The thousands of comments received duringthis study have emphasized a frustration withgrowing congestion and the need for majorimprovements. The LCTIP has focused thetransportation discussion on the majorproblems and potential solutions. The centralpremise has been to provide ampleopportunities for every person that has aninterest in transportation to voice theiropinions so that the best decision can be made.
The public involvement process that helpeddetermine the need, the objectives, and thealternatives is a measurable success. Supportfor major improvements, in particular the IL53 extension, has been clearly expressed byLake County residents, business groups,communities, and elected officials. Thousandsof individuals and numerous communities,business groups, and elected officials haveexpressed their support, citing its superiortransportation benefits, cost effectiveness,minimal impact to existing homes andbusinesses, and/or minimal disruption duringconstruction as compared to other alternatives.Table 5-9 summarizes the comments that werereceived at various public forums during thestudy.
TABLE 5-9Summary of Comments Regarding the IL 53 Set of Improvements
Forum Support Oppose
1999 Public Informational Meeting* 56% 33%
2000 Public Informational Meeting* 79% 19%
Communities (number) 20 2
Organizations (number) 18 7
* Total percent for the 1999 and 2000 Public Informational Meetings do not add to 100 percent. Theremainder is associated with other alternatives presented.
Source: LCTIP

6-1
SECTION 6
List of Preparers
Name Area of Expertise Degree and Years of Experience
Federal Highway Administration
Jon-Paul Kohler FHWA Review B.S., Civil Engineering1984 To Present
Don Keith Right-of-Way Expertise B.S., Mathematics and Meteorology1972 To Present
Illinois Department of Transportation
IDOT Central Office, Office of the Chief Counsel
Rich Christopher General Content and Oversight J.D.B.A., English1980 To Present
IDOT District 1, Bureau of Programming
Peter E. Harmet, P.E. Project Manager B.S., Civil Engineering1986 To Present
David A. Niemann Environmental Studies, NaturalResource Coordination, Analysis andReview, Hazardous Waste
Ph.D., BotanyM.S., BotanyB.S., Ornamental Horticulture1988 To Present
Pat Pechnick, P.E. General Content and Oversight B.S., Civil Engineering1983 To Present
IDOT Central Office, Bureau of Design and Environment
Kathleen Ames General Content and Impact Review M.S., Environmental EngineeringB.A., Biology1974 To Present
Michael Bruns Noise Analysis Review B.S., Thermal and Environmental Engineering1973 To Present
Susan Dees Natural Resources Coordination,Analysis, and Review
B.S., Zoology1991 To Present
Peter J. Frantz, P.E. General Content and Oversight B.S., Civil Engineering1966 To Present
Amy Spies Karhliker Water Quality and Wetland ResourcesCoordination, and Section 404 PermitReview
B.A., Anthropology1997 To Present
Richard Nowack Natural Resources Coordination,Analysis, and Review
B.S., Biology1976 To Present
Charles Perino Water Quality and Wetland ResourcesCoordination, Analysis, and Review
Ph.D., Plant TaxonomyM.S., Plant TaxonomyB.S., Geology1973 To Present
George B. Rose Natural Resources Coordination,Analysis, and Review
Ph.D., EcologyM.S., ZoologyB.A., Zoology1970 To Present

LIST OF PREPARERS
6-2
Name Area of Expertise Degree and Years of Experience
John L. Rowley Agriculture Coordination, Analysis, andReview
B.S., Agriculture Education1959 To Present
Barbara H. Stevens Socioeconomic Impact Analysis andReview
M.A., Economics1980 To Present
John A. Walthall Archaeological Coordination, Analysis,and Review
Ph.D., ArchaeologyM.A., AnthropologyB.A., Anthropology1967 To Present
John R. Washburn Special Waste, Geology, andHydrogeology Analysis and Review
M.A., Environmental ScienceB.A., GeologyB.S., Geology1969 To Present
Walt Zyznieuski Air Quality Coordination, Analysis, andReview
M.A., Environmental Studies1981 To Present
IDOT Central Office, Office of Planning and Programming
Carla Berroyer General Content and Oversight B.S., Liberal Arts1976 To Present
Randy Blankenhorn General Content and Oversight B.S., Business Administration1984 To Present
Illinois State Toll Highway Authority
Clarita R. Lao, P.E. General Content and Oversight Graduate Studies, Public AdministrationB.S., Civil Engineering1977 To Present
Cynthia Ortiz-Buchanan
Environmental Justice, SocioeconomicReview
B.A., Environmental Studies, Urban Studies,and Geography1996 To Present
Christopher Snyder,P.E.
Project Engineer B.S., Civil Engineering1987 To Present
Rocco Zucchero Environmental Planner, EnvironmentalResources
M.U.P., Urban PlanningB.S., Environmental Studies1992 To Present
CH2M HILL—Prime Contractor
Larry Martin Environmental Lead B.A., Urban PlanningInterdisciplinary Engineering Studies1970 To Present
Jill Kramer, AICP Environmental Planner M.U.P., Urban PlanningB.S., Political Economy of Natural Resources1990 To Present
Christine Norrick, AICP Environmental Planner M.U.P., Urban PlanningB.A., Urban Planning1985 To Present
Jim Miller, P.E. Transportation Engineer M.S., Civil EngineeringB.S., Civil EngineeringB.S., Physics1994 To Present
Libby Braband Environmental Planner Graduate Studies, Urban Planning and PolicyB.S., Public and Environmental Affairs1995 To Present

LIST OF PREPARERS
6-3
Name Area of Expertise Degree and Years of Experience
Kim Kolody Transportation Engineer M.S., Civil EngineeringB.S., Civil Engineering1997 To Present
Jim Schmidt, P.E. Transportation Engineer M.S., Civil EngineeringB.S., Civil Engineering1953 To Present
Jeff Barnett Transportation Engineer/GIS M.S., Civil EngineeringB.S., Civil Engineering1997 To Present
Jason Cole Transportation/Environmental Planner B.S., Civil Engineering1999 To Present
T. Y. Lin BASCOR—Subcontractor
John McCormick, P.E. Transportation/Environmental Planner M.S., Civil EngineeringB.S., Civil Engineering1985 To Present
Joel Marhoul, P.E. Transportation/Environmental Planner B.S., Civil EngineeringB.A., Political Science1996 To Present
Jackie Stevenson, P.E. Transportation/Environmental Planner B.S., Civil Engineering1988 To Present
Amalia M. Baymundo Transportation/Environmental Planner B.S., Civil Engineering1999 To Present
Huff and Huff—Subcontractor
Linda Huff, P.E. Environmental Scientist M.S., Chemical EngineeringM.B.A., Econometrics1976 To Present
James Novak Environmental Scientist B.S., Environmental Studies1989 To Present
Erica Spolar Transportation Engineer B.S., Civil Engineering1993 To Present
Sean LaDieu, P.E. Civil Engineering B.S., Civil Engineering1993 To Present
Amy Moon Environmental Scientist M.S., Biology1996 To Present
Cindee Walsh Natural Resources B.S., Landscape Architecture1986 To Present
Scott Bretcha Natural Resources B.S., Biology2000 To Present
Vlecides-Schroeder Associates—Subcontractor
Joanne Schroeder Transit Planner Graduate Studies, Urban and RegionalPlanningB.A., French1968 To Present
Beata Walsh Transit Planner M.A., Policy PlanningB.A.1973 To Present
Virginia Morin Transit Analysis B.A.1975 To Present

LIST OF PREPARERS
6-4
Name Area of Expertise Degree and Years of Experience
Thomas Donalek Transit Research and Analysis Graduate Studies, ArchitectureB.A., Architecture1996 To Present
ARI—Subcontractor
Karen Poulson Archaeology M.A., AnthropologyB.A., Anthropology1986 To Present
David Keene Archaeology Ph.D., AnthropologyM.A., PhilosophyB.S., Anthropology1981 To Present
Heritage Research—Subcontractor
Michael McQuillen Archaeological History and HistoricPreservation
M.S., Historic Preservation1998 To Present
John Vogel Archaeological History and HistoricPreservation
Ph.D., American History1980 To Present
Land Design Collaborative—Subcontractor
James Gamble Visual Assessment B.A., Landscape Architecture1987 To Present
Robert Zolomij Visual Assessment M.A., Landscape ArchitectureB.S., Landscape Architecture1986 To Present
Telford Consulting—Subcontractor
Michael Goode Mass Transit Project Development andImplementation
M.B.A.B.S., Civil Engineering1971 To Present
Consoer Townsend Envirodyne—ISTHA General Engineering Consultant
William M. Barbel Environmental Documentation 1965 To Present
Brian J. Smith Environmental Documentation M.S., Geography and PlanningB.S., Wildlife and Fisheries Sciences1983 To Present
al Chalabi Group—IDOT Consultant
Suhail al Chalabi Population and Employment Forecasts M.Sc., Ekistics (Planning)B.A., Architecture1983 To Present

7-1
SECTION 7
References
Act 830: Interagency Wetland Policy Act of 1989. Illinois Conservation Law. J & B Gould. 1993.
al Chalabi Group, Ltd. Letter to CH2M HILL. February 10, 1999.
———. The Socio-Economic, Land Use and Accessibility Impacts of Finalist TransportationAlternatives in Lake County, Illinois. 2001.
———. Letter to CH2M HILL. January 6, 2000.
Amundsen, Steven B. Letter to Rich Nowack. August 2, 1995.
———. Bird Survey FAP 341 (IL 22). U.S. 14 to Quentin Road. Memorandum to Rich Nowack.August 26, 1998a.
———. Letter to Rich Nowack. August 29, 1998b.
———. Response to email questions. Memorandum to Rich Nowack. December 7, 1998c.
Amundsen, Steven B., and David A. Enstrom. A Census of the Avifauna of the FAP 342 ProjectAreas, Including Addenda. January 2, 1996.
Berg, R.C., et al. Potential for Contamination of Shallow Aquifers in Illinois. Illinois State GeologicalSurvey Circular 532. 1984.
Bertrand, W. A., et al. Biological Stream Characterization Biological Assessment of Illinois StreamQuality Through 1993. IEPA/Bow/96-05E. November 1996.
Bureau of Design and Environment. Bureau of Design and Environment Manual. IDOT. 1999.
The Business Journal. “The 1999 Book of Lists—Lake County.” Shaw Business Publications. 1999.
CH2M HILL. GIS Database. 1999.
———. Public Involvement and Coordination Summary Report. April 2001.
Chicago Area Transportation Study (CATS). 2010 Transportation System Development Plan. 1989.
———. 2020 Regional Transportation Plan: Transportation Improvement Program for NortheasternIllinois, FY 1998-2002. Appendix A: Conformity Analysis Documentation. November 1997a.
———. Destination 2020: 2020 Regional Transportation Plan. November 1997b.
———. Destination 2020: 2020 Regional Transportation Plan (RTP). August 1998.
———. Chicagoland Bicycle Map. 3rd Edition. 1999.
Criteria and Procedure for Determining Conformity to State or Federal Implementation Plans ofTransportation Plans, Programs, and Projects Funded or Approved Under Title 23 USC. or theFederal Transit Act (40 CFR Part 93).
Department of Agriculture. National Food Security Act Manual. 3rd Edition. 1985.
Department of Defense, Department of Interior, Environmental Protection Agency and theDepartment of Agriculture. 1994 Federal Memorandum of Agreement. 1994.
Diment, W.H., et al. Some Effects of Deicing Salts in Irondequoit Bay and Its Drainage Basin .Highway Research Board. No. 425, pp. 23–34. 1973.

REFERENCES
7-2
Downs, Anthony. How Land Value Impacts if Transportation Arteries Affect New York CityDevelopment. Presented at Transportation of New Towns and Communities Workshop. Washington,D.C. December 16, 1969.
Dreher, Dennis, et al. Lake County Advanced Identification (ADID) Study, Final Report. NortheasternIllinois Planning Commission. 1992.
Driscoll, E.D., et al. Pollutant Loadings and Impacts from Highway Stormwater Runoff. Volume 1.Design Procedure. Federal Highway Administration. Report No. FHWA/RD-88/006. 1990a.
———. Pollutant Loadings and Impacts from Highway Stormwater Runoff. Volume 2. User’s Guidefor Interactive Computer Implementation of Design Procedure. Federal Highway Administration.Report No. FHWA/RD-88/007. 1990b.
———. Pollutant Loadings and Impacts from Highway Stormwater Runoff. Volume 3. AnalyticalInvestigation and Research Report. Federal Highway Administration. Report No. FHWA/RD-88/008.1990c.
Driver, Nancy E., and Gary D. Tasker. Techniques for Estimation of Storm-Runoff Loads, Volumes,and Selected Constituent Concentrations in Urban Watersheds in the United States. USGS Water-Supply Paper 2363. 1990.
Environmental Data Resources, Inc. Lake County Transportation Improvement Project Study AreaReport. September 8, 1998.
Environmental Laboratory. 1987 Corps of Engineers Wetland Delineation Manual. Report Y-87-1.U.S. Army Engineers Waterways Experiment Station. Vicksburg, Mississippi. 1987.
Federal Emergency Management Agency. Flood Insurance Study (FIS), Lake County, Illinois.September 26, 1994.
Federal Transit Administration. Transit Noise and Vibration Impact Assessment. Harris Miller Miller& Hanson, Inc. 1995.
Frost, L.R., et al. Hydrogeological Effects of Highway Deicing Chemicals in Massachusetts. UnitedStates Geological Survey. Open File Report 81-209. 1981.
Herkert, James R., ed. Endangered and Threatened Species of Illinois: Status and Distribution,Volume 1—Plants. Illinois Endangered Species Protection Board. Springfield, Illinois. 1991.
———. Endangered and Threatened Species of Illinois: Status and Distribution, Volume 2—Animals. Illinois Endangered Species Protection Board. Springfield, Illinois. 1992.
———. Endangered and Threatened Species of Illinois: Status and Distribution, Volume 3—1994Changes to the Illinois List of Endangered Species. Illinois Endangered Species Protection Board.Springfield, Illinois. 1994.
———. Checklist for Endangered and Threatened Animals and Plants in Illinois. Illinois EndangeredSpecies Protection Board. 1999.
Hill, Steven R. Botanical Survey FAN 0233 (Old Rand Road). Memorandum to Rich Nowack.July 3, 2000.
Hughes, G.M., et al. Bedrock Aquifers of Northeastern Illinois. ISGS Circular. 1966.
Illinois Department of Agriculture. Illinois Agricultural Statistics Annual Summary 1998. IllinoisAgricultural Statistics Service. Springfield, Illinois. January 1999.
———. Illinois Agricultural Statistics Annual Summary 2000. Illinois Agricultural Statistics Service.Springfield, Illinois. January 2001.

REFERENCES
7-3
Illinois Department of Natural Resources. Technical Report No. 1: Northeastern Illinois WetlandSurvey for Endangered and Threatened Birds; A Summary of Field Data: 1980–1989. 1991.
Illinois Department of Natural Resources (Hamer, Steve). Letter to Christopher C. Snyder. LakeCounty Transportation Improvement Project. July 6, 2000.
Illinois Department of Transportation. Accident Statistics by Roadtype and Functional Class1993-1995. Division of Traffic Safety, Statistics Unit. 1993–1995.
———. Section 4(f) Evaluation. U.S. Route 45 (FAP 344). 1995.
———. Standard Specifications for Road and Bridge Construction. January 1, 1997.
———. Environmental Assessment and Programmatic Section 4(f) Evaluation. Willow Road (FAP305). 1999.
———. IDOT BDE Procedure Memorandum. Number 18-00, Subject: Procedures for HighwayProject Noise Analysis, April 3, 2000a.
———. Draft Environmental Assessment and Section 4(f) Evaluation. Illinois Route 22 (FAP 337).2000b.
———. IDOT Joint Design/Construction Procedure Memorandum on Erosion and SedimentControl. April 14, 2000c.
Illinois Department of Transportation and Illinois Department of Natural Resources. NaturalResource Review and Coordination Agreement between IDNR and IDOT. June 1995.
Illinois Division of Highways. Public Hearing Transcript: Federal Aid Route 61. April 1963.
Illinois Environmental Protection Agency. Illinois Water Quality Report 1994-1995. IEPA Bureau ofWater. Springfield, Illinois. 1996.
———. Illinois Water Quality Report 1998 Update. IEPA Bureau of Water. Springfield, Illinois.1998.
———. Database printout. 1999.
———. Air Quality Index: Illinois Annual Air Quality Report 1999. Bureau of Air. Springfield,Illinois. June 2000a.
———. Illinois Water Quality Report 2000. IEPA Bureau of Water. Springfield, Illinois. 2000b.
Illinois Historic Landmarks Survey. Inventory of Historic Landmarks in Lake County: Interim Report.April 1975.
Illinois Historic Preservation Agency. Sprague Survey. 1974-1977.
———. County Landmark Survey. 1975.
Illinois Nature Preserves Commission. List of Illinois Nature Preserves. July 31, 2000.
Illinois State Toll Highway Authority. Mitigation Plan: For Proposed Impacts to Seaside CrowfootTri-State Tollway – Plaza 25 (Deerfield) Reconstruction, Projects CIP-90-450B and CIP-90-450C.January 16, 1997.
Institute of Transportation Engineers. Trip Generation, 6 th Edition. Volume 2 of 3. 1997.
Iverson, L.R., et al. Illinois Plant Information Network. Database athttp://www.fs.fed.us/ne/delaware/ilpin.html. Illinois Natural History and USDA Forest Service. 1999.
Jones, P.H., and B.A. Jeffrey. “Environmental Impact of Road Salting.” Chemical Deicers and theEnvironment. Frank M. D’Itri, ed. Boca Raton, Florida: Lewis Publishers. 1992.

REFERENCES
7-4
Kay, Rich. Personal communication. Illinois Department of Employment Security. November 2000.
Lake County Department of Planning, Zoning & Environmental Quality. Census Plus (Population,Housing and More). Waukegan, Illinois. 1989.
———. Lake County, Illinois Framework Plan. Waukegan, Illinois. 1994.
Lake County Division of Transportation. 1998–2002 Proposed Highway ImprovementProgram. 1998.
Lake County Forest Preserve District. Map Guide of Lake County Forest Preserve and Trail Maps.Libertyville, Illinois. October 2000.
Lake County Stormwater Management Commission. Lake County Watershed DevelopmentOrdinance. August 1999.
Lake County Transportation Improvement Project. Transportation System Performance Report.CH2M HILL. January 1999.
———. Alternatives Development and Evaluation (Initial Alternatives) Report. CH2M HILL.November 2000a.
———. Review of Crossroads Proposal. CH2M HILL. November 2000b.
———. Safety Performance Analysis for the Finalists LCTIP Alternatives. CH2M HILL. November2000c.
———. Geographical Information System (GIS) Technical Documentation. February 2001a.
———. Transit and Transportation Management Strategies for the Lake County TransportationImprovement Project. CH2M HILL. 2001b.
Lake County Wetland Inventory. U.S. Natural Resources Conservation Services. County ofLake. 1990.
Lipka, G. S., and D. B. Aulenbach. “The Effect of Highway Deicing Salt on Chloride Budgets atLake George, New York.” Proceedings of the 31st Purdue University Industrial Waste Conference.Lafayette, Indiana. 1976.
Lumen, D., et al. Critical Trends Assessment Land Cover Database of Illinois, 1991–1995.Champaign, Illinois : Illinois Department of Natural Resources. 1996.
Minnesota Interagency Wetlands Group. Minnesota Routine Assessment Method for EvaluatingWetland Functions—Version 2.0. 1996.
Northeastern Illinois Planning Commission (NIPC). Population Data. 1970.
———. NIPC Bulletin No. 5. April 1973.
———. Groundwater Quality. 1976.
———. Population Data. 1980.
———. Population Data. 1990.
———. Strategic Plan for Land Resource Management. June 1992.
———. Population, Household and Employment Forecasts by Townships as Endorsed by theNortheastern Illinois Planning Commission. November 6, 1997.
Page, L. M., et al. Biologically Significant Illinois Streams: An Evaluation of the Streams of IllinoisBased on Aquatic Biodiversity. Illinois Natural History Survey. September 1991.
REFERENCES
7-5
Phillips, Christopher A. A Limited Survey of the Amphibians and Reptiles of the FAP 342 (extensionof IL Route 53) Project Area, Lake County, Illinois. Center for Biodiversity Technical Report.Champaign, Illinois : Illinois Natural History Survey. December 1995.
Resource Systems Group, Inc. Crossroads: Smart Transportation Options for Lake County.Environmental Law and Policy Center. June 1999.
Samson, Irma E., and John M. Masters. Directory of Illinois Mineral Producers 1992. Urbana:Authority of State of Illinois. 1992.
Sucoff, E. The Flow of Deicing Salt into the Atmosphere. USEPA Report EPA-600/2-76-105. Urbana,Illinois : Illinois State Water Survey. 1975.
Suloway, Liane and Marvin Hubbell. Wetland Resources of Illinois, An Analysis and Atlas. Urbana,Illinois: Illinois Natural History Survey. Special Publication 15. July 1994.
Swink, F. A., and G. Wilhelm. Plants of the Chicago Region. 4th Edition. Indianapolis: IndianaAcademy of Science. 1994.
Taft, John B. Noteworthy Vegetation within the FAP 342 Highway Corridor in Lake County, Illinoiswith Emphasis on Threatened and Endangered Plant Species and Natural Areas. November 25, 1991.
———. Noteworthy Vegetation of the Proposed FAP 342 Highway Corridor in Lake County, Illinoiswith Emphasis on Threatened and Endangered Plant Species and Natural Areas. January 27, 1992.
———. Noteworthy Vegetation within the FAP 342 (IL Route 53) IDOT Project Area with emphasison Threatened and Endangered Plant Species and Natural Areas. November 15, 1995.
———. Floristic Survey and Assessment of the Illinois Department of Transportation North Chicago(U.S. Route 41/ Illinois Route 137) Wetland Mitigation Site (Excess Parcel) in Lake County.December 27, 1996.
———. Botanical Resources within the FAU 2747 (Sheridan Road). Report to the IllinoisDepartment of Transportation. November 25, 1997a.
———. Botanical Survey of the Proposed FAP 337 (IL Route 22). Survey to Rich Nowack.November 1997b.
———. Botanical Survey of the Proposed FAU 2747 (Sheridan Road). Survey to Rich Nowack.December 1997c.
Taylor, Christopher A., and Mark J. Wetzel. Fish Survey TR 3668 (Grandwood Drive) bridge overMill Creek. Memorandum to Christopher A. Taylor and Rich Nowack. October 9, 1997.
———. Iowa Darter Spawning Survey. FAU 2677 (Dilley’s Road) bridge over Mill Creek.Memorandum to William T. Sunley and Rich Nowack. May 28, 1999.
TY Lin Bascor. Telephone conversation with Illinois Department of Agriculture. November 3, 2000.
U.S. Census Bureau. Agricultural Census Data. 1950.
———. Characteristics of Population, Households, and Employment. 1970.
———. Population Data. 1980.
———. Characteristics of Population, Households, and Employment. 1990a.
———. Manufacturing and Construction Division. 1990b.
———. Means of Transportation to Work. 1990c.

REFERENCES
7-6
———. Lake County Census and Population Estimated April 1, 1990 Census to July 1, 1996.Estimates by County and Township Parts. Digital Release. November 1997.
———. Population Estimate. 1999.
U.S. Department of Agriculture. USDA Published Estimates Database Outline. www.usda.gov/nass.February 16, 1999.
———. Cropland Data Layer: Illinois 1999–2000. 2001.
U.S. Department of Commerce. Bureau of Economics Analysis Data. 1999.
U.S. Department of Transportation. FHWA – FAPG 23 C.F.R. 772, Procedures for Abatement ofHighway Traffic Noise and Construction Noise. Federal Aid Policy Guide. October 16, 1977.
———. “Highway Traffic Noise Sources.” In Highway Noise Analysis Seminar, Proceedings of aSeminar on Traffic Noise Analysis. (Louisville , Kentucky: University of Louisville, 1993) p. 10, 12–23. April 1993.
U.S. Environmental Protection Agency. “Decision to Approach the State of Illinois 1998 303(d).” InList Under the Clean Water Act. August 18, 1999.
———. www.epa.gov/ogwdw/swp/sumssa.html. February 1, 2001.
U.S. Fish and Wildlife Service (Kramer, Karla). Letter to Rocco J. Zucchero. Lake CountyTransportation Improvement Project. February 26, 2001.
Willman, H. B. Summary of the Geology of the Chicago Area. Urbana, Illinois: Illinois StateGeological Survey. 1971.
Woller, Dorothy M., and James P. Gibb. Public Water Supplies in Illinois. Illinois State WaterSurvey. Bulletin 60-2. 1976.
Young, G. Kenneth, et al. Evaluation and Management of Highway Runoff Water Quality. FederalHighway Administration. Washington, DC. June 1996.

A-1
APPENDIX A
Thematic Organization of GIS Database
Layer Name Source Description Scale Date
AIRPORT USGS / LCTIP Airports from USGS ModalTransport layer
1:24000 January 1999
BIKE95 NIPC NIPC Bike paths 1:24000 August 1995
CBF CBF CBF recommended and cautionarybicycle routes
Unknown 1998*
IDOTROADS IDOT IDOT Road Inventory (IRIS)Database
1:100000 Unknown
IDOT Signals Lake County Signalized intersections by IDOT Unknown August 2000
LCDOT Signals Lake County Signalized intersections by LakeCounty DOT
Unknown August 2000
METRARAIL RTA Metra commuter rail lines Unknown 1998*
PACEB Pace Bus Updated Pace Bus Routes 1999 Unknown 1999
PACEBUS-CL Pace Bus Pace Bus Routes Unknown 1997
RD USGS USGS Roads 1:24000 and varies 1998*
RR USGS USGS Railroads 1:24000 and varies 1998*
STATIONS RTA Metra commuter rail stations Unknown 1998*
TRA
NS
PO
RTA
TIO
N
* Date compiled or obtained from source

A-2
Layer Name Source Description Scale Date
ADID Lake County ADID Wetlands in Lake County Unknown 1992
AADID LCTIP Master ADID wetlands within 500 ft of proposedimproved routes adjusted to aerial photography base
Unknown 2000
AQMB300 IGIS CD-ROM Major bedrock aquifers within 300 ft of ground surface 1:500000 1986
AQMB500 IGIS CD-ROM Major bedrock aquifers within 500 ft of ground surface 1:500000 1985
AQMBG500 IGIS CD-ROM Major bedrock aquifers at depths greater than 500 ftbelow ground surface
1:500000 1985
AQMSG IGIS CD-ROM Major sand and gravel acquifers 1:500000 1985
AWETFINAL LCTIP Field verified wetlands proximate to the two finalistalternatives
Unknown 2000
BASINS Lake County SMC /LCTIP
Watersheds and sub-basins Unknown 1998
BSC-LINE; BSC-POLY
IDNR IDNR Biological Streams Characterization Unknown 1993
CTYHYD Lake County Lake County Hydric Soils Unknown Unknown
ENV_CONSTR LCTIP Areas identified by the LCTIP as potentially high-impact Unknown 1999
ENV_PHOTO LCTIP Points identifying location of photographs Unknown 1999
FEMA FEMA CD-ROM FEMA Q3 Flood data 1:24000 1996
GAUGESTN IEPA / LCTIP Water qulity gauging stations Unknown Unknown
LAKES USGS Lakes from USGS Hydrological features layer 1:24000 1998*
LANDCOV IDNR IDNR Land Cover Unknown 1996
LCWI Lake County Lake County Wetlands Inventory (LCWI) Unknown 1992
ALCWI LCTIP LCWI wetlands within 500 ft of proposed improvedroutes adjusted to aerial photography base
Unknown 2000
MCHWET NIPC ADID Sites in McHenry County Unknown 1998
NWIWETLAND US FWS National Wetlands Inventory (NWI) Unknown Unknown
STREAMS USGS Streams from USGS Hydrological features layer 1:24000 1998*
STREAMS-POLY USGS Streams from USGS Hydrological features layer 1:24000 1998*
TANDE IDNR IDNR Threatened and Endangered (T&E) Species Unknown 1998*
TOXIC EDR EDR Hazardous Waste sites Unknown 1998*
WELLS IGIS CD-ROM IDNR Wells Unknown 1995
WELLSPLS IDNR IDNR Wells plus additional attribute data for public wells Unknown 1995/1999
EN
VIR
ON
ME
NT
AL
* Date compiled or obtained from source

A-3
Layer Name Source Description Scale Date
FIN_LOCPRK LCTIP Local Parks proximate to the teofinalist alternatives
Unknown 2000
FORPRES Lake County
Cook County
McHenry County/ LCTIP
Lake and Cook County ForestPreserves and McHenry CountyConservation Districts (digitized bythe LCTIP)
Unknown 1998*
NATAREA98 IDNR Illinois Natural Areas Inventory Sites 1:24000 1998
NATPRES IDNR Nature Preserves 1:24000 1998
PARKS3 NIPC NIPC Greenways Plan Parks Unknown 1990
STPARK IGIS CD-ROM State Parks 1:24000 1992
TRAILS3 NIPC NIPC Greenways Plan Parks Unknown 1990
DE
SIG
NA
TE
D L
AN
DS
* Date compiled or obtained from source

A-4
Layer Name Source Description Scale Date
ARCHMOD Illnois State Museum Archaeological predictive model 1:500000 1994
ARCHSITES IHPA Archaeological sites Unknown 2000
ASTRUCTURES LCTIP Structure outlines for buildings proximate to the twofinalist alternatives
Unknown 2000
CEMETERY USGS / LCTIP Cemeteries from USGS manmade features layer, IDNRand other sources
Unknown 1998*
ACEMETERY LCTIP Cemeteries within 500 ft of proposed improved routesadjusted to aerial photography base
Unknown 1999
CHURCH-POLY USGS / LCTIP Churches – polygons from USGS manmade featureslayer
1:24000 1998*
CHURCH-PT USGS / LCTIP Churches – points from USGS manmade features layer 1:24000 1998*
EMPLOYER Lake County / LCTIP Lake County Employer database – 70% matchgeocode
Unknown 1998*
GOLF USGS / LCTIP Golf courses from USGS manmade features layer andother sources
1:24000 1999
HISTDIST,HISTSITE
NPS / LCTIP National Register of Historic Places - sites and districts Unknown Unknown
HOSPITAL USGS / LCTIP Hospitals – polygons 1:24000 1998*
LANDUSE NIPC / LCTIP 1990 NIPC Landuse (updated to 1997 from Aerialphotography)
1:24000 1997
QPLSS-CL NIPC NIPC quarter-section boundaries Unknown 1995
QPLSS-AGG LCTIP Aggregated NIPC quarter-sections (to rough 9-sq mileareas) for exhibits
Unknown Unknown
PNAORDNB20.DAT Al Chalabi Group Project No Action No-Build Scenario 2020 Populationand Employment figures by quarter-section
Unknown Unknown
ORD20.DAT NIPC INFO FILE – Fall 1997 release of the O’Hare No-BuildScenario forecast 2020 Population and Employmentfigures by quarter-section
Unknown Unknown
ORD96.DAT NIPC INFO FILE – Fall 1997 release of the O’Hare No-BuildScenario 1996 Population and Employment figures byquarter-section
Unknown Unknown
ORD90.DAT NIPC INFO FILE – Fall 1997 release of the O’Hare No-BuildScenario 1990 Population and Employment figures byquarter-section
Unknown Unknown
QSPOPEMP.DAT NIPC CATS Conformity Analysis 2020 population forecasts Unknown Unknown
SCHOOL-POLY USGS / LCTIP Schools – polygons from USGS manmade featureslayer
1:24000 1998*
SCHOOL-PT USGS / LCTIP Schools – points from USGS manmade features layer 1:24000 1998*
SO
CIO
EC
ON
OM
IC
* Date compiled or obtained from source

A-5
Layer Name Source Description Scale Date
BD USGS USGS Boundary features 1:24000 1998*
COUNTY IGIS CD-ROM County Boundaries Unknown Unknown
HP USGS USGS Elevation Contours 1:24000 1998*
MS USGS USGS Manmade features 1:24000 1998*
MS-PT USGS USGS Manmade features – points 1:24000 1998*
MUNIC Lake County / IGIS CD-ROM Municipal Boundaries Unknown 1996
ORTHO CH2M HILL; Walker andAssociates
Orthodigitally rectified aerialphotography covering the studyarea
1:400 1997
PLSS IGIS CD-ROM Public Land Survey System sectionboundaries
1:24000 1998*
PLSS_TSHIPS IGIS CD-ROM / LCTIP Public Land Survey Systemtownship boundaries
1:24000 1998*
QUADS IGIS CD-ROM USGS 7.5’ quad boundaries Unknown 1992
SAB LCTIP Study Area Boundary Unknown 1998*
SC USGS USGS Surface Cover 1:24000 1998*
TWNSHIPS Lake County / LCTIP Political Townships Unknown 1999
UTIL USGS / LCTIP Power Lines Unknown Unknown
BA
SE
MA
PP
ING
* Date compiled or obtained from source
1) IDOT = Illinois Department of Transportation
2) IGIS CD-ROM = Illinois Geographic Information System CD-ROM (IL Department of Natural Resources)
3) USGS = U.S. Geological Survey
4) LCTIP = Lake County Transportation Improvement Project
5) IHPA = Illinois Historic Preservation Agency
6) NIPC = Northeastern Illinois Planning Commission
7) EDR = Environmental Data Resources, Inc.
8) CBF = Chicagoland Bicycle Federation
9) RTA = Regional Transportation Authority
10) ESRI = Environmental Systems Research Institute, Inc.
11) Lake County SMC = Lake County Stormwater Management Commission

The Socio-Economic,Land Use and Accessibility
Impacts ofFinalist Transportation Alternatives
in Lake County, Illinois
Prepared for theIllinois Department of Transportation
and theIllinois State Toll Highway Authority
August 24, 2001
ACG The al Chalabi Group, Ltd.

Table of Contents
I. Introduction - The Assignment Page 1
II. The NIPC/CATS Regional Transportation PlanningProcess and Forecasts Page 5
A. Historical Background Page 5
B. Theoretical Underpinning of the DRAM/EMPAL and Combined Models Page 5
C. The NIPC Socio-Economic Forecasts Page 6
III. Methodology for Disaggregating the RTP SystemImpacts to Impacts of Individual Projects Page 9
A. Overview Page 9
B. Population and Employment Impacts of the RTP System Page 10
C. Determining the Development Impacts on Population and Employment Distribution of the Individual Transportation Projects in Lake County (IL-53 Extension Alternative) Page 12
1. Collective Impacts of RTP with IL-53 Extension Alternative Page 12
2. Population Impacts of Rail Projects Page 13
3. Population Impacts of Highway Projects Page 20
4. Balancing of Increases by Mode Page 23
5. Employment Impacts of Rail and Highway Page 24

Table of Contents(continued)
D. Determining the Development Impacts on Population and Employment Distribution of Individual Projects in Lake County (IL-83/US 45 with US 12 Alternative)
Page 25
1. Collective Impacts of RTP with IL-83/US 45 with US 12 Alternative Page 25
2. Description of the Methodology Used in Comparing Impacts of RTP vs. IL-83/US 45 with US 12 Alternative Page 26
3. Net Impacts Due to IL-83/US 45 with US 12 Alternative Improvements Page 27
4. Net Impacts of the Two Finalist Alternatives Page 27
IV. Summary of Findings Page 28
A. Summary Tables of Impacts Page 28
B. Study Corroboration Page 29
C. Consistency with NIPC Forecasts Page 30
D. Study Conclusions Page 31
1. The IL-53 Extension Alternative Page 31
2. The IL-83/US 45 with US 12 Alternative Page 31
3. Overall Impacts Page 31
Appendix

List of Tables
Table 1 - Impacts of 2020 Regional Transportation Plan ProjectsPopulation and Employment Forecasts Lake County,Illinois Page 8
Table 2 - Changes in Accessibility Due to All RTP Projectsand IL-53 Extension Alone From Selected Zones inLake County to Zone 18 Chicago CBD Page 14
Table 3 - Percent of Accessibility Improvement Due to IL-53Extension Summary and Weighted Average AllChicago Central Area Zones to Lake County Page 15
Table 4 - Percent of Accessibility Improvements Due toIL-53 Extension Summary and Weighted AverageNorth Central Stations (Central Area to O’Hare)to Lake County Page 16
Table 5 - Net Socio-Economic Impacts (1990 - 2020) ofFinalist Alternatives in Lake County Page 27
Table 6 - Impacts of 2020 Regional Transportation Plan ProjectsNet Population and Employment by Project, Includingthe IL-53 Extension Alternative (Net Lake CountyImpacts, Only) Page 28
Table 7 - Impacts of 2020 Regional Transportation Plan ProjectsNet Population and Employment by Project, IncludingIL-83/US 45 with US 12 (Net Lake County Impacts,Only) Page 29

List of Exhibits(all exhibits, except 1 and 2, follow complete text)
Exhibit 1 - Proposed Transportation ImprovementsIL-53 Extension Alternative Page 3
Exhibit 2 - Proposed Transportation Improvements:IL-83/US 45 with US 12 Alternative Page 4
Exhibit 3 - NIPC Population Forecasts 1990 - 2020 Without RTPProjects - Existing Airports
Exhibit 4 - NIPC Population Forecasts 1990 - 2020 With All RTPProjects - Existing Airports
Exhibit 5 - NIPC Population Forecasts 1990 - 2020 DifferencesBetween RTP and No-RTP
Exhibit 6 - NIPC Employment Forecasts 1990 - 2020 DifferencesBetween RTP and No-RTP
Exhibit 7 - 1990 - 1995 Household Change(Source: Northeastern Illinois Planning Commission)
Exhibit 8 - Lake County 1991 - 1997 Employment Change(Source: Where Workers Work, Summary Report 1972-1997)
Exhibit 9 - Impact of IL-53 Extension on Changes in Accessibility forNIPC Zone 421
Exhibit 10 - Impact of IL-53 Extension on Changes in Accessibility forNIPC Zone 419
Exhibit 11 - Impact of IL-53 Extension on Changes in Accessibility forNIPC Zone 401
Exhibit 12 - Impact of IL-53 Extension on Changes in Accessibility forNIPC Zone 431
Exhibit 13 - Impact of IL-53 Extension on Changes in Accessibility forNIPC Zone 104
Exhibit 14 - Impact of All RTP Projects on Changes in Accessibilityfor NIPC Zone 419
Exhibit 15 - Impact of All RTP Projects on Changes in Accessibilityfor NIPC Zone 401

List of Exhibits(continued)
Exhibit 16 - Impact of All RTP Projects on Changes in Accessibilityfor NIPC Zone 431
Exhibit 17 - Population Impacts - Lake County’s RTP Transit Projects
Exhibit 18 - Population Impacts - Lake County’s RTP HighwayProjects
Exhibit 19 - Employment Impacts - Lake County’s RTP TransitProjects
Exhibit 20 - Employment Impacts - Lake County’s RTP HighwayProjects
Exhibit 21 - Population Impact of IL-53 Extension Alternative
Exhibit 22 - Population Impacts of IL-83/US 45 with US 12Alternative
Exhibit 23 - Employment Impact of IL-53 Extension Alternative
Exhibit 24 - Employment Impacts of IL-83/US 45 with US 12Alternative

The Socio-Economic, Land Use and Accessibility Impacts of Finalist
Transportation Alternatives in Lake County
I. Introduction - The Assignment The Illinois State Toll Highway Authority (ISTHA) and the Illinois Department of Transportation (IDOT) are undertaking, jointly, a study of transportation problems and their potential solutions in Lake County. Two finalist transportation improvements have been identified. One key component of this study is the quantification of the impacts on development in Lake County of these two finalist alternatives, which are:
• The IL-53 Extension Alternative • The IL-83/US 45 with US 12 Alternative
In support of this study, IDOT commissioned The al Chalabi Group, Ltd. (ACG) to prepare a set of socio-economic, accessibility and land use forecasts that were to be used to generate the transportation forecasts and the evaluation measures of the finalist alternatives. The study recognizes that these socio-economic, accessibility and land use forecasts, themselves, are influenced both by the proposed transportation improvements and the time that those improvements are put into place. The assignment required ACG to determine the impact of each of the major transportation improvements in the Study Area proposed by the October 1997 adopted 2020 Regional Transportation Plan (RTP). Once the socio-economic impact of each project was identified, it was possible to sum these project impacts for alternatives. The first task of the analysis was to generate a set of socio-economic forecasts for a “baseline” transportation alternative (i.e. the “No Action” Alternative). The No Action (Baseline) Alternative assumes that all RTP projects outside the study area, except those listed below, will be built according to the RTP schedule. It also assumes the implementation of most, but not all, of the RTP projects proposed for Lake and Eastern McHenry Counties, including improvements to 74 miles of existing arterials. The specific RTP projects that are not included in the No Action (Baseline) Alternative are:
• The IL-53 Extension. • The circumferential rail transit service along the existing EJ & E
right-of-way. • The extension of the improved rail service of the current Metra-
Milwaukee North Line beyond its existing terminus at Fox Lake near the McHenry County Line. The RTP recommended extending this line into the Town of Richmond in McHenry County.
1

The impacts of the two finalist alternatives were then to be measured, separately and independently, against this No Action (Baseline) Alternative. This analysis required the development of three sets of socio-economic forecasts:
• No Action (Baseline) Alternative • IL-53 Extension Alternative • IL-83/US45 with US12 Alternative
Exhibit 1 shows the projects included in the IL-53 Extension Alternative. Exhibit 2 shows the projects of the IL-83/US 45 with US 12 Alternative. The methodology for this impact analysis is described in the following chapter of this report. This report is a summary of several analyses, the first of which was presented in the report, The Socio-Economic and Land Use Impacts of 2020 Regional Transportation Plan (RTP) Projects in Lake County, published in May 1999.
2


II. The NIPC/CATS Regional Transportation Planning Process and Forecasts
A. Historical Background The 2020 Regional Transportation Plan (RTP), adopted in October 1997, represents the eighth comprehensive transportation plan for the Chicago region. The first such plan was prepared in the early 1960's with a 1980 planning horizon. Each planning cycle introduced methodological improvements which attempted to better replicate actual individual and societal behavior given varying transportation proposals. The 2020 planning process incorporated an important improvement; it internalized the interrelationship between socio-economic forecasts and the resultant transportation plan. Prior to the 2020 planning cycle, NIPC had generated its socio-economic forecasts using as input:
• The Commission’s adopted development policies and plans, including the prior adopted RTP.
• The extent of existing development (land use and infrastructure)
and availability of developable land.
• The prevailing social and economic market conditions in the Chicago region and its component sub-areas.
The Chicago Area Transportation Study (CATS) used the NIPC socio-economic forecasts to evaluate alternative transportation plans and to recommend a plan for adoption. The adopted transportation plan then became one of the inputs used by NIPC to generate the next cycle of its socio-economic forecasts. The 2020 Regional Transportation Plan cycle integrated these two processes. It started with an initial set of socio-economic forecasts which were used to generate alternative transportation improvements which, in turn, generated the socio-economic forecasts that would result if the proposed improvements were implemented. Determining the interrelationships between transportation improvements and urban development has been made possible by the adaptation, by NIPC, of the DRAM/EMPAL forecasting model and the availability, at CATS, of a sketch (quick-responding) transportation model, the Combined Model. B. Theoretical Underpinning of the DRAM/EMPAL and Combined Models The theoretical construct of the DRAM/EMPAL Model is that accessibility influences locational decision which, in turn, influences accessibility. In selecting a
5

location for an activity (e.g. industrial plant, office building, residence), the decision-maker considers the accessibility of the various potential sites to concentrations of various activities (e.g. labor force, job concentrations, schools, recreational activities). This fact is general knowledge to every market analyst, real estate broker and developer; and is used in conducting their day-to-day business. It also is understood that improving the access of developable or redevelopable sites increases the development potential of those sites. The access measures provided to NIPC, for use in its DRAM/EMPAL model, are generated by CATS using the “Combined Model.” The Combined Model, as reflected in its name, combines the trip distribution, modal split and highway assignment steps into a single process. Its measure of impedance is a composite cost of travel by both transit and highway. This is an important distinction. For several reasons, primary among which is the substantial degree to which transit is used in this region, the modal split is influenced, significantly, by the contribution of transit as well as highways to this combined impedance. This impedance is the only variable, among the many DRAM/EMPAL variables, which changed when examining the impact of the Regional Transportation Plan, in general, and the proposed IL-53 Extension Alternative or IL-83/US 45 with US 12 Alternative, in particular, on socio-economic forecasts. All other variables, such as: existing development by type, existing infrastructure (highways, transit, sewerage, utilities, etc.), available developable land, redevelopment potential, density, local plans, etc., are assumed to remain constant. Both highway and transit facilities are contributors to regional development. In regard to the model outputs, if the transit or highway does not improve accessibility (reduce impedance) to an area, that area will not attract development as a result of the highway or transit improvement. However, it also is true that, if the transit or highway does not improve accessibility, the Combined Model (or any other transportation model) will not assign significant ridership to that proposed transit or vehicles to the proposed highway. C. The NIPC Socio-Economic Forecasts The NIPC socio-economic forecasts, generated in the Spring of 1997, developed two ground transportation improvement alternatives. The first set assumed no transportation improvements beyond those already committed by 1996, henceforth referred to as the No-RTP alternative. The second set assumed the implementation of all the ground transportation improvements recommended in the 2020 RTP, henceforth the RTP alternative. It should be noted that the arterial improvements in the RTP alternative were general and not specific to exact location. The specific arterial improvements as included in the No Action (baseline) were detailed with the participation of County and local officials using the guidelines set forth in the RTP. In addition, the RTP
6

included a circumferential commuter rail (EJE) which is not included in the No Action (baseline) alternative. With the exceptions noted above, the only remaining difference between the RTP and No Action (baseline) alternatives is the IL-53 Extension. During the development of the RTP, the issue of meeting the future aviation needs of the Chicago region was unresolved; it remains unresolved to this date. Accordingly, two airport development scenarios were evaluated:
• Accommodating all the forecasted 2020 enplanements (82.3 million) at the two existing airports, O’Hare and Midway. (The Existing Airports Scenario).
• Accommodating the 82.3 million enplanements at O’Hare, Midway
and a new, supplemental South Suburban Airport. (The South Suburban Airport Scenario).
A total of four alternative forecasts were prepared by NIPC. Table 1, following, shows 1990 and 2020 Lake County population and employment, and differences in population and employment growth between the RTP and No-RTP for each of the two airport scenarios. Because of its proximity to O’Hare, Lake County would experience slightly more growth in both population and employment (approximately 6 and 5 percent, respectively) under the Existing Airport Scenario than under the South Suburban Airport Scenario. This was the alternative used throughout this analysis.
7

No-RTP RTP Alternative
Table 1 Impacts of 2020 Regional Transportation Plan Projects
Population and Employment Forecasts Lake County, Illinois
Alternative
Differences
(RTP minus No-RTP) 1990 Statistics Population 516,401 N/A N/A Employment 228,606 N/A N/A 2020 Existing Airports Population 772,411 832,884 60,473 Employment 389,528 393,989 4,461 2020 South Suburban Airport Population 749,306 806,194 56,888 Employment 351,346 355,600 4,254 1990-2020 Existing Airports Population 256,010 316,483 60,473 Employment 160,922 165,383 4,461 1990-2020 South Suburban Airport Population 232,905 289,793 56,888 Employment 122,740 126,994 4,254 Note: As part of its 2000 update and revision of regional socio-economic forecasts, NIPC lowered its 2020 population forecasts for Lake County and increased its 2020 employment forecasts (by approximately 26,000 and 33,000, respectively). The advanced stage of ACG’s analysis precludes use of these revisions. However, the changes, particularly in regard to differences between RTP and No-RTP Alternatives, are relatively insignificant; the differences are 336 persons and 1,415 jobs fewer.
8

III. Methodology for Disaggregating the RTP System Impacts to Impacts of Individual Projects
A. Overview The NIPC/CATS forecasts, generated in the Spring through the Fall of 1997, provided the controls for all the forecasts prepared by ACG. The NIPC/CATS forecasts, and associated data, are quite extensive and voluminous and cover a wide spectrum of activities:
• The NIPC population and employment forecasts for the RTP and No-RTP networks by each of NIPC’s 317 planning zones (usually 9 square miles) as well as CATS subzones (usually a quarter square mile).
• Change in highway work-trip interchange tables between RTP vs. No-RTP alternatives and transit boardings and alightings.
• Change in impedances, as generated by the CATS Combined Model, resulting from the addition or subtraction of individual or groups of transportation projects.
The NIPC/CATS forecasts provided the collective impacts of all RTP projects. At the initiation of the Lake County Transportation Improvement Project the DRAM/EMPAL model was not tested for evaluating impacts of individual projects. It was not practical to wait for the completion of the necessary research by NIPC to allow for the application of the DRAM/EMPAL to specific projects. The socio-economic forecasts constitute the first step of generating the transportation data necessary for alternative analysis. Accordingly, iterative estimates were undertaken to generate the socio-economic impacts from the extensive NIPC and CATS regional data. And, to ensure that the resultant project-specific impacts and forecasts were consistent with the NIPC methodologies, policies and guidelines, several intermediate presentations were made to Commission staff. Upon completion of the forecasts by ACG, they were presented to the NIPC Planning Committee. Following this presentation, NIPC concluded, “(I)t is our staff judgment that the method ACG used to allocate the forecasts among projects is a reasonable one and that the results are consistent with the Commission’s endorsed forecasts”. The full NIPC letter is included in the Appendix. The ACG methodology can best be described as a rigorous accounting system, with many logical constraints, that:
9
• Balances increases in the attractiveness of an area for development with decreases in other areas and balances the sum total of net changes, by zone, with the NIPC control totals.
• Relates changes in travel impedances to changes in the development potential of planning zones.
• Balances commuter rail boardings and/or highway work-trips with connections between jobs and labor force.
• Balances the subtotal of the impacts of specific projects with the impacts of the RTP system, both on a region-wide basis and by NIPC planning zone.
Two specific methods were used in allocating the full impact of all the RTP projects, as forecasted by NIPC, to each of the specific transportation projects. The first method pairs areas which would experience more growth with those of lesser growth and links these pairings to changes in accessibility caused by individual projects. Accessibility differentials are presented as a 317 by 317 matrix (NIPC planning zones). Two sets of such accessibility matrices were available: the first, presented differences between building the full RTP and no RTP projects; the second, presented the impact of the IL-53 Extension, alone. The accessibility impacts of other projects, collectively or individually, are deduced from these two sets. The second method recognizes that the changes in accessibility, due to a specific project, impact not only development but also the level of utilization of these projects. Transit and highway projects which improve accessibility attract riders and drivers, respectively. Changes in the points of origin and destination of work trips, under various transportation alternatives, reflect the socio-economic changes due to transportation improvements. B. Population and Employment Impacts of the RTP System Exhibits 3 and 4 show the NIPC-generated population change, 1990 - 2020, by NIPC planning zone, assuming No-RTP and RTP, respectively. Under both alternatives, the NIPC forecasts show that most of the growth does occur in the region’s core (i.e. the City of Chicago inner communities) or its outer rings. The intermediate rings (i.e. the City of Chicago edge communities and the inner suburbs), especially the fully-developed suburbs around O’Hare, experience no significant growth and, in many cases, show a decline in population. Some of this lack of residential growth can be attributed to the scarcity of developable land and the ability of commercial and office development to outbid other uses. However, a portion of the outward dispersal of population also can be attributed to the proposed transportation improvements. Exhibit 5 shows the difference in the NIPC 2020 population forecast, by NIPC planning zones, between the RTP and No-RTP alternatives. It is evident from this map that the implementation of the highway and transit projects of the RTP would
10

facilitate the growth of population, outward, predominately toward the northern, northwestern and western parts of the region. According to NIPC, the City of Chicago (especially its central core) as well as most of Cook and DuPage Counties, attract fewer persons under the RTP than under the No-RTP. Balancing this, most of Lake and eastern McHenry and Kane Counties would attract more people under the RTP. Shown on Exhibit 5 are the major RTP projects in Lake County and eastern McHenry County. These projects include: the extension of IL-53, widening of I-94, double-tracking of the North Central Service (NCS) and UP Northwest rail service improvement. All have impacts on the urban development of Lake County. Arterial improvements are not shown as they are too dispersed. However, these arterials, collectively, also impact development; and such impacts need to be, and are, estimated in this analysis. Overall, the implementation of the RTP would cause a shift in forecasts of approximately 124,000 persons from the blue areas (losses) to the brown areas (gains) in Exhibit 5. Lake County would be the recipient of approximately one half of the gains. Exhibit 6 shows the difference in the NIPC 2020 employment forecasts. The pattern in this exhibit is the opposite of the population shifts. The implementation of the RTP would cause the greater centralization of employment. Employment growth in outer McHenry, Central Will and Southwestern Cook would be less under the RTP scenario. This lesser growth would be balanced by greater growth in the Chicago Central Area, the vicinity of O’Hare and South-central Lake County. Approximately 58,000 forecasted jobs would be shifted from the blue areas (less) of Exhibit 6 to its brown areas (more). The net impact of job shifts in Lake County is smaller and forecasted to be an additional employment of 4,461. The concentration of jobs at points accessible by transit or highway allows people to reside farther out, along these transportation facilities. The NIPC DRAM/EMPAL model recognizes this relationship. The NIPC forecasts, concluding that implementation of the RTP would result in further dispersion of population and greater concentration of jobs, is a geographic manifestation of this relationship. Both transit and highway projects are contributors to this phenomenon. Exhibits 7 and 8 show the residential (household) and non-residential (employment) changes that have taken place recently in the region and study area, respectively. The source of the former data is NIPC/Census; the source of the latter is the Illinois Department of Employment Security. Exhibit 6 shows that Lake County has grown by 21,763 households between 1990 and 1995. This growth was slightly higher than that forecast by NIPC for the same period. Much of this growth is in the central part of the county. Subsequent 2000 Census data shows the 1990-2000 growth for Lake County population at 127,938, indicating a continuous growth at an even higher rate. Exhibit 7 shows employment change in Lake County, between 1991 and 1997, with a growth of 48,218 jobs. Employment growth is one and a half times that forecasted by NIPC for the same period. These recent
11

developments reinforce the basic findings of the NIPC forecasts that Lake County will experience substantial growth in population and employment whether or not the IL-53 Extension is built. C. Determining the Development Impacts on Population and
Employment Distribution of the Individual Transportation Projects in Lake County (IL-53 Extension Alternative)
1. Collective Impacts of RTP with IL-53 Extension Alternative The preceding section showed the collective impacts of the entire RTP system on the development of Northeastern Illinois. The collective impacts of all the RTP projects (both highway and transit) on Lake County are:
• 60,473 more persons by 2020 • 4,461 more jobs by 2020
These additional persons and jobs in Lake County have been predicted by the NIPC DRAM/EMPAL model because the RTP improves the accessibility of Lake County to the rest of the region, especially to the areas with high concentrations of jobs. This 60,473 added persons represents an 11.7 percent growth of the population, 1990 to 2020. Added jobs represent a 2.7 percent employment growth in Lake County, 1990-2020. NIPC has determined that the 2020 forecasts for the six-county region, as a whole, would remain the same whether or not the RTP projects were implemented. Accordingly, the additional population and employment forecasts in Lake County due to the RTP Build, must be balanced with lower forecasts elsewhere in the region. Also, it should be noted, that the implementation of the RTP system would cause forecast shifts within Lake County, itself. The impact of each individual transportation project on urban development (i.e. population, households, jobs, etc.) for a specific area is proportional to that project’s ability to improve the accessibility of that area to various parts of the region. This is the basic theoretical construct of NIPC’s DRAM/EMPAL model. Accessibility is measured in terms of impedance - a combined measure of travel time and cost. The DRAM/EMPAL model also is sensitive to the timing of the transportation improvements. Projects which are completed early in the planning period would have more of an impact on development, in 2020, than projects which would not be completed until later in the planning period. Areas opened to development early have a longer period over which to mature and expand. As stated earlier, ACG relied completely on the data input and output of the NIPC DRAM/EMPAL and the related CATS transportation models for disaggregating the RTP system-wide impacts into the impacts of individual projects.
12

The RTP impact of 60,500 persons had been attributed, by some, solely to the proposed IL-53 Extension Alternative. This, clearly, is not supported by the facts. The following summary of the disaggregating analysis shows that transit projects contribute approximately 23,000; IL-53 Extension, 27,500; and other highway improvements, 10,000 persons. In its letter of 11/30/98, NIPC concludes that these disaggregations are reasonable. In its letter of 5/10/99, NIPC reconfirms that its forecasted RTP impacts of 60,473 represent the impact of all transportation projects, not the impact of the IL-53 Extension, alone. Copies of these letters are included in the Appendix. 2. Population Impacts of Rail Projects a. Method I - Changes in Accessibility As stated earlier, two separate methods were used to estimate the impacts of rail improvements on the population forecasts. The first method examined the changes in accessibility due to transit improvements as compared to highway improvements. The NIPC DRAM/EMPAL model forecasted that the implementation of the RTP would cause zones in the Central Area of the City of Chicago, which are within four miles of Union Station, to have 27,226 fewer people than if the No-RTP scenario is implemented. The implication of this finding is that this represents people who would have lived closer to the job concentration of the Chicago Central Area if there were no RTP improvements. Conversely, the RTP projects would allow these persons to live farther out (predominantly in Lake, McHenry and Kane Counties) and commute to the jobs in the Chicago Central Area. The forecast of fewer persons for the Chicago Central Area is not due to fewer jobs there. Actually, the number of jobs in the above-cited zones (within four miles of Union Station) would be 4,740 higher under the RTP. The sole reason why the population in this area would be lower is the improved accessibility. The remaining questions are: whether this improvement in accessibility between the Chicago Central Area and outer zones in Lake, McHenry and Kane Counties is due to transit or highway improvements; and what percent of the change in population can be specifically assigned to Lake County. Before proceeding with answering these questions, it should be noted that the areas adjacent to the North Central Rail Stations - from the limits of the Central Area to O’Hare - exhibit some of the same characteristics as the Chicago Central Area. Within the six zones adjacent to the stations along this rail between the Central Area and O’Hare Airport, there would be 7,603 fewer persons and 8,570 more jobs under the RTP scenario. The population of Lake County would be experiencing a gain of 60,473 under the RTP scenario. This gain represents approximately one-half the shifts of population resulting from the implementation of the RTP. Actually, of the 20 NIPC zones with the greatest gain under the RTP scenario, 14 of them are located within Lake County. ACG mapped and analyzed the changes in accessibility from each of the Lake County zones due to:
13

• implementation of all RTP projects (RTP impedances minus No RTP impedances)
• implementation of the IL-53 Extension, alone.
This analysis, as described in the following text and tables, revealed that very little of the change in accessibility from Lake County to the Chicago Central Area or the zones adjacent to stations on the North Central Service could be attributed to the IL-53 Extension. This is accomplished in a three-step process. Table 2 shows the changes in impedances (from the combined model) to one of 13 zones in the Chicago Loop (Zone 18), under each of the two transportation scenarios, for each of the 14 Lake County Zones with the greatest population gains.
Table 2 Changes in Accessibility Due to All RTP Projects
and IL-53 Extension Alone From Selected Zones in Lake County to
Zone 18 in the Chicago CBD
Changes in Accessibility
Lake County
Zone
Population Gain Due
to RTP
Due to All
RTP Projects
Due to
IL-53 Extension
% Due to
IL-53 Extension 416 6,363 2.04 0.02 1% 423 5,498 3.91 0.05 1% 429 5,166 0.48 0.13 27% 411 3,904 2.75 0.01 0% 412 3,022 2.60 0.04 2% 405 2,839 2.21 0.04 2% 420 2,812 2.26 0.08 4% 417 2,510 1.19 0.48 40% 431 2,347 2.98 0.04 1% 403 2,312 1.93 0.04 2% 401 1,972 1.52 0.04 3% 404 1,935 2.10 0.06 3% 410 1,926 2.15 0.06 3% 407 1,782 0.93 0.16 17%
Total 44,388 2.15 0.08 4%
14
The above-described process was repeated for each of the 13 Central Area Zones. Table 3 shows the average share of improvement in accessibility that can be

attributed to the IL-53 Extension, from each of the 13 Central Area Zones; this calculated share is shown in the third column. This table also shows that population which would shift out of each zone if the RTP is implemented. Using these population shifts for each zone and the calculated shift due to the IL-53 Extension, the IL-53 Extension share is estimated to account for 20 percent of the improvement in accessibility between the Central Area and Lake County. With only one minor exception, (add lanes to I-94) addressed later, there are no other major highway improvements that can claim a share of the improvement in accessibility between these Lake County Zones and the Chicago Central Area. Consequently, rail must be responsible for a maximum of 80 percent of the growth that would shift from the Chicago Central Area to Lake County.
Table 3 Percent of Accessibility Improvement
Due to IL-53 Extension Summary and Weighted Average
All Chicago Central Area Zones to Lake County
Central Area Zone
Population Shift Out Due to RTP
% Due to IL-53 Extension
Population Shift Due to IL-53 Ext.
5 845 6% 51 12 1,590 20% 318 13 5,750 24% 1,380 14 1,844 22% 405 15 2,263 13% 294 16 3,569 23% 821 17 994 7% 70 18 3,026 4% 121 19 1,632 16% 261 20 1,597 28% 447 21 1,269 33% 419 22 828 38% 315 23 2,019 22% 444
Total 27,226 20% 5,346
Lake County zones are the recipient of most of the benefit of commuter rail transit improvements. However, Eastern McHenry County will benefit from the upgrade of UP Northwest service to the town of McHenry; and South Cook County will benefit from the South Suburban Commuter Rail corridor to Crete. Allocating the shifts in population from the Chicago Central Area, due to transit improvements, to the three sub-areas on the basis of the sumproduct of the
15

population gain (due to the RTP projects in each sub-area and the forecasted transit ridership for each proposed commuter service) yields the following:
• Lake County - 75 % of Central Area shift due to transit • McHenry County - 20 % of shift due to transit • South Cook County - 5 % of shift due to transit
Using the above-cited relationships and the shifts calculated earlier, the population that would shift out of the Chicago Central Area into Lake County due to the implementation of the commuter rail improvements is calculated as follows:
• Total population shifting out of Chicago Central Area = 27,226 • Population shift to Lake County due to rail improvements = .8 * .75 * 27,226 = 16,336
The zones along the North Central Rail Stations from the Central Area limits to O’Hare are another concentration of population which, due to this rail improvement, would move into Lake County. Table 4 shows the average share of improvement in accessibility that can be attributed to the IL-53 Extension. On average, the IL-53 Extension accounts for 15 percent of the improvements in accessibility between these zones and Lake County.
Table 4 Percent of Accessibility Improvements
Due to IL-53 Extension Summary and Weighted Average
North Central Stations (Central Area to O’Hare) to Lake County
North Central Zones
Population Shift Out Due to RTP
% Due to IL-53 Extension
9 2,092 19% 10 1,452 17% 11 1,405 18%
139 756 10% 141 499 8% 142 1,399 10%
Total 7,603 15%
16
No other outer County would improve its accessibility to the area as a result of the North Central double-tracking. However, there is a highway improvement project, other than the IL-53 Extension, which may improve accessibility between Lake County zones and the O’Hare vicinity. This project is the addition of one lane, in each direction, along the I-94, on the three-mile stretch from IL-22 to IL-60. There are no specific data on improvement in accessibility to the O’Hare Area due to

this add-lane project. However, this impact cannot exceed half the impact of the IL-53 Extension. Accordingly, the shift in population from the zones adjacent to North Central Stations to Lake County Zones can be calculated as follows:
Total population shift = 7,603
Population shift due to IL-53 Extension = .15 * 7,603 = 1,140
Population shift due to I-94 add lanes = 1,140/2 = 570
Population shift due to North Central Rail = 7,603 - 1,140 - 570 = 5,893
The I-94 add-lanes may have an impact on improving accessibility between the Chicago Central Area and eastern Lake County. However, the impact, if any, is very limited and is compensated for by not considering any shifts in population to Lake County from zones adjacent to UP Northwest Stations in Chicago (outside the Central Area) or Northwest Cook. All these shifts were assigned to the highway improvements. In conclusion, the population shift to Lake County, due to the two major transit projects (North Central Rail and the UP Northwest) using the changes in accessibility method, is: 16,336 + 5,893 or 22,229 Similar calculations are used to estimate the shifts in population due to the EJ&E Circumferential Rail. The project would allow residents to live in Lake County and work in Northwest Cook or Western DuPage Counties. This improvement in access is forecasted to shift 2,000 persons from Western DuPage and Northwestern Will to Lake County. In many ways, the impact of this project is similar to that of the IL-53 Extension, although at a much smaller scale. b. Method II - Changes in Rail Boardings The improvement in accessibility due to the commuter rail improvements is reflected in the increase in the commuter rail boardings, as forecasted by Metra. The increase in commuter rail ridership was very significant for the two major transit projects considered: double-tracking the North Central Service; and improving the service on the McHenry (North) branch of the UP Northwest Line. The morning boardings, at the stations in Lake County, of the expanded North Central Service are forecasted to increase by more than 6,000 daily riders above the Metra study “baseline” forecast. The Metra study baseline forecasts reflect 2020
17

socio-economic activities (RTP scenario) while maintaining the existing level of service. It should be noted that the 2020 baseline ridership is higher than existing (1996) ridership. Another 3,500 residents of Lake County, above the Metra study baseline forecasts, are forecasted to ride the improved UP Northwest Line. These large numbers of riders (above the baseline) would not have been attracted to the rail system and, to the rail corridor, itself, if the rail had not improved the accessibility of the area. For comparison, ridership statistics show that only 9,572 Lake County workers commuted to work by rail in 1990. The additional 9,500 daily morning riders (6,000 NC + 3,500 UP) from Lake County represent a doubling of rail riders over that of 1990. Their ability to live in Lake County and work in downtown Chicago, or in the vicinity of O’Hare, has been made both possible and desirable by the transit improvements. The population impact of the rail depends on whether one or more household members use the train for the trip to work. Assuming that each of these daily commuters represents one household, and recognizing that the NIPC-forecasted 2020 average household size for Lake County is 2.76, the maximum total population attracted to Lake County due to the improved commuter service would be 26,220. The minimum population impact can be derived by assuming that all workers in the household (estimated at 1.72) use the rail for work trips; this minimum population would be 15,244. The implications of the minimum level: if one worker in a household uses commuter rail, all other workers in the household would commute by rail. As will be presented later, the double tracking of the North Central Service and the McHenry extension of the UP Northwest would cause the export of 6,600 jobs and the import of income. The imported income would, in turn, generate 2,600 local service jobs. Assuming that 50 percent of the holders of these jobs would chose to live in Lake County (1990 average of Lake County residents who worked there), and assuming 1.72 jobs per household, the secondary impact of the projects is:
• Households attracted to fill 50 percent of service jobs = 2,600 * .5/1.72
• Population of above households = 756 * 2.76 = 2,086
Accordingly, the range of total population shifting to Lake County, as calculated by the boarding method, is:
• Minimum = 15,244 + 2,086 = 17,330 • Maximum = 26,220 + 2,086 = 28,306 • Mid-Point = — — = 22,818
The above-cited findings corroborate recent research and challenge a
18

commonly-held assumption that the introduction of new or expansion of existing rail service merely changes the mode of travel. Even with the use of traditional transportation models, it has been demonstrated that added transit causes:
• Changes in the trip distribution by assigning more trips to the Central Area.
• Through modal split models, a portion of the added trips select the rail as the predominant mode.
Theoretically, new rail service improves the image of its corridor as being more accessible to the jobs and arterial activities of the Central Area. The changed image attracts more persons to the rail corridor than would actually use the rail. Research and forecasts undertaken for and by Metra and other Chicago Area rail providers document this observation. The history of the Chicago region and its developments along railroad lines is another documentation of this fact. Railroads, as well as highways, disperse population allowing them to live farther from their jobs. c. Reconciliation of Rail Impacts The above two procedures provided a first estimate of the impacts of transit projects on shifting the distribution of population forecasts within the Chicago Region. Once the initial impacts of the highway projects were determined (as described in the following section), a comprehensive balancing process was undertaken. This is the process described earlier as “a rigorous accounting system”. The impact of every project on each of the 317 NIPC Planning zones was identified; every increase in population in a given zone was matched with decreases in one or more zones. The increases and decreases had to be explained by the explicit or implied changes in accessibility generated by the specific project. In some cases, the matching of increases and decreases for any one project involved more than two zones or areas, but included a chain reaction. The end product of this process includes the following net population impacts on Lake County.
• North Central Service Improvements + 12,500 • UP Northwest/McHenry Extension + 8,500 • Milwaukee District-North Line 0 • EJ&E Circumferential + 2,000
The final sum of the North Central and UP Northwest impacts is 21,000, slightly lower than the 22,229 impact generated by the accessibility method and the 22,818 mid-point of the range generated by the boarding method. However, it is higher than the 17,330 minimum forecast generated by the boarding method.
19

3. Population Impacts of Highway Projects The process of estimating the impact of highway projects on population was not different than that used for transit. The origin-destination method, comparable to the transit boarding method, was more complex; therefore, lesser emphasis was placed on it. The origins and destinations of specific highway users are more diffused and more difficult to trace. The IL-53 Extension was the primary focus of the analysis; the impact of this project on improving accessibility for Lake County extended far beyond the County borders into Northwest and West Cook, DuPage, and Northern Will Counties. The impact of the arterial improvements are more localized to areas within Lake County and adjacent areas in Northwest Cook and eastern McHenry Counties. A more-graphic method for presenting the impact analysis process also was used. The maps, following, illustrate the logical steps used to determine the impact of the IL-53 Extension on the shifts in population forecasts. The data used to prepare the following accessibility maps are the same as those used for the rail analysis. As an overview, the IL-53 Extension concentrates jobs in proximity to its exits, in a manner similar to the concentration of jobs around the commuter rail stations. DuPage County, due to its central location within the regional highway network, acts in a very similar manner to the Chicago Central Area in its role as the focus of the rail system. Accordingly, most of the increases in forecasted population to Lake County caused by the IL-53 Extension are balanced by decreases in the forecasted populations of DuPage County, West and Northwest Cook and Northern Will Counties. As presented in the transit analysis, the IL-53 Extension causes shifts in population from the Central Area to Lake County; but these shifts are not as significant as those described earlier. Exhibits 9, 10, 11, 12 and 13 show the change in accessibility for four zones in Lake County and one zone in North Cook County due to the implementation of the IL-53 Extension Alternative. The following conclusions can be drawn from these maps.
• Exhibit 9: the IL-53 Extension Alternative would significantly improve the access from North Central Lake County (NIPC Zone 421 - at the northern end of the north-south leg of the extension) to the zones along I-355, especially those in Central DuPage County. Access also will be improved to Will County and the zones along the Eisenhower Expressway. To a lesser extent, access improvements also will occur to South Cook County and a band along the existing IL-53 in North Cook County. This zone will not experience a loss in accessibility to any part of the region, although improvements in accessibility to most of Lake, McHenry and Kane Counties, the
20

North Shore communities and the northern parts of the City of Chicago (including the Central Business District) would be minimal.
• Exhibit 10: This exhibit examines improvement in accessibility for the Lakefront zone closest to the northeastern terminus of the IL-53 Extension (NIPC Zone 419). Again, the greatest improvement in accessibility occurs to the zones in Northern Cook and Central DuPage, along IL-53 Extension and I-355. Improvement in accessibility to zones in Will County, along I-55 and the proposed I-355 South, also would occur as a result of building the IL-53 Extension Alternative. From this Lakefront zone, accessibility to Northern Lake or McHenry Counties is not improved significantly.
• Exhibit 11: This exhibit examines accessibility for the northwestern-most zone in Lake County (NIPC Zone 401) to the rest of the region. The greatest improvements in accessibility occur to zones along the Tri-State (I-294) Tollroad and between the Tollroad and I-355. Accessibility to several nearby zones actually deteriorates due to the congestion resulting from nearby development. Accessibility from this zone to Central Chicago and the zones east of O’Hare does not improve significantly. Recognizing that this zone does attract more development under the RTP alternative and recognizing the proximity of this zone to the expanded and improved North Central (transit) Service, it is apparent that those who are attracted to live here and work in the Loop do so because of the improved rail service.
• Exhibit 12: This exhibit shows changes in accessibility from a zone in the southwestern corner of Lake County (NIPC Zone 431) to the rest of the region. For this zone, the IL-53 Extension brings a mixture of modest changes. The IL-53 Extension improves, moderately, access to the Northwest Tollroad - Kennedy and I-290 (Eisenhower) and, via these expressways, to the Dan Ryan and Edens Expressways; accordingly, access to the inner zones adjacent to these highways is improved. Access to the Chicago Central Area is unchanged. Access to DuPage and Western Will Counties deteriorates.
• Exhibit 13: This exhibit shows changes in accessibility from a zone in North Cook County near the northern terminus of I-355 (NIPC Zone 104). Accessibility from this zone to DuPage, Will and almost all other zones in the region deteriorates. This deterioration is due to the additional traffic on I-355, due to the IL-53 Extension.
The previous five exhibits graphically illustrate the impacts of the IL-53
21

Extension Alternative on the accessibility in five separate NIPC Zones to the six-county region. Exhibits 14, 15 and 16 illustrate the impacts of all RTP projects on the accessibility of three of these NIPC Zones. Comparison of the two sets of exhibits (14, 15, and 16 vs. their IL-53 Extension Alternative counterparts, 10, 11, and 12) provides examples of how these accessibility maps were used to separate the impacts of the IL-53 Extension from those of other projects.
• Exhibit 14: This exhibit examines improvements in accessibility of the Lakefront Zone closest to the northeastern terminus of the IL-53 Extension (NIPC Zone 419 - comparable to Exhibit 10). This exhibit clearly illustrates that there will be improved access from this zone to most of the region. Access will double along two separate corridors: one, along the Lakefront; and the second, along I-355 and its proposed extension. As seen earlier, in Exhibit 10, the impact of the IL-53 Extension on improvement in access to the Lakefront zones is limited to the second corridor (I-355). Accordingly, the improvement in accessibility for Zone 419 to the Lakefront zones must be due to other RTP projects, including those outside Lake County. Zone 419 is forecasted by NIPC to attract 718 persons more under the RTP than under the No RTP alternative. Other than the EJE, there are no transit improvements proposed in close proximity to Zone 419; thus, none of the 718 additional persons can be balanced, via transit, with decreases in the Chicago Central Area Population. There are two major highway projects impacting this zone: the IL-53 Extension; and the add lane to I-94 at the South end of Lake County. The proximity and magnitude of the IL-53 Extension necessitated assigning almost all the 718 additional population to this project, balanced by decreases in DuPage/Northwest Cook. A very small fraction of the additional population was allocated to the impact of the EJE and the add lanes, balanced by decreases in North Cook and along the EJE in DuPage and Will Counties. The same line of reasoning was used for the two zones south of 419, with the exception of gradually increasing the impact of the add lane and EJE as the distances to those projects were reduced.
• Exhibit 15: This exhibit examines improvements in accessibility for the northwesternmost zone in Lake County (NIPC Zone 401 - comparable to Exhibit 11). Here, we can see that the full RTP increases access from Zone 401 to all but one zone in the region. Of special interest is the improvement in accessibility to the O’Hare Airport area and the Central Area of Chicago. It is clear from Exhibit 11 that the IL-53 Extension Alternative does not improve access to these areas; but it does improve the access to Eastern DuPage, Western and Southwestern and South Cook. It is evident, from these two illustrations, that it is the improved rail access that
22

permits residents to live in this zone and work in the job concentrations in the Central Area and around O’Hare, whereas the IL-53 Extension allows people to move to this zone and work in DuPage County. There are no excess jobs in the Cook County zones which experienced improvement in accessibility to Zone 401. NIPC forecasted that Zone 401 would receive 848 additional persons under the RTP alternative. Two thirds of this increase was attributed to the IL-53 Extension and balanced against increases in DuPage County; the balance was attributed to North Central Rail and balanced against decreases in the Central Area and O’Hare.
• Exhibit 16: This exhibit describes the impacts of all RTP projects on this southwesternmost zone in Lake County (NIPC Zone 431 - comparable to Exhibit 12). Implementation of the full RTP provides major increases to all but one NIPC Zone. Access is doubled to the City of Chicago, to South Cook, Central and Eastern Will Counties. Again, as in NIPC Zone 401, it is quite clear that it is improved rail service that doubles this access, particularly to the City of Chicago and its Central Area. Comparing this exhibit to Exhibit 12 shows the relatively small impact of the IL-53 Extension Alternative compared with the extensive impact of the full RTP, especially that of rail improvements on the North Branch of the UP Northwest and the EJE circumferential rail. NIPC forecasted 2,347 additional persons for this zone under the RTP alternative. Almost all these persons are attributed to the improvement in rail accessibility to the Chicago Central Area.
4. Balancing of Increases by Mode The processes and analyses described above provided, initially, an order of magnitude forecast by major transportation facility. The detailed forecast was achieved following the linking of increases and decreases of population, by planning zone; and by positing a logical explanation for the attribution of part or all of the zonal change to any of the proposed transportation or transit projects. The balancing of the population increases and decreases, by zone, while maintaining work trip interchanges, by mode, on the basis of the NIPC/CATS forecasts limits possible solutions to a very few. It must be pointed out that we are observing net improvements and deteriorations of the transportation network 20 years into the future (25 from the forecast period), and their impacts on a population that is growing and always in flux. More than 50 percent of the households in Lake County change housing location every 5 years; and, nationally, persons change jobs every 5 years. Consequently, a 25-year forecast period can affect the job and residence location decisions of nearly the entire County population. Therefore, the growth of transit
23

users in Lake County can be assumed to be due to the location and accessibility of the area rather than a switch from highway to rail by existing residents. Exhibit 17 shows the population shifts resulting from the implementation of the transit projects in Lake County and adjacent townships. There are considerable impacts of proposed improvements in rail on the areas currently un- or underdeveloped in the northwest portion of the County because such proposed rail would serve this area so well. Exhibit 18 shows the population shifts resulting from the implementation of the highway projects. It should be noted that while the IL-53 Extension Alternative increases population along its corridor, much of this development already has occurred, especially since 1990. A summary table, Table 3, in the “Summary of Findings” chapter presents the overall net impact of each major RTP project, including the IL-53 Extension Alternative, on population changes in Lake County. It has been determined that the population increase of 60,500 (difference between RTP and No-RTP alternatives) is attributable, to each mode, as follows:
• Rail (including EJE Circumferential) – 23,000 • IL-53 Extension Alternative – 27,500 • Other Highway Improvements – 10,000
5. Employment Impacts of Rail and Highway The process for estimating the impact of the Lake County RTP projects on net employment change in Lake County, as well as the distribution of these changes by NIPC zone, is not significantly different than the process described for determining the population impacts. For rail transit projects, each morning boarding in Lake County represents an exported job. It is assumed that the destination of the exported job is in the general vicinity of the alighting station. The points of origin of the additional morning boardings (above transit baseline), by zone, and morning alightings determine the job shifts occurring as a result of the transit enhancements. The NIPC/CATS data, as modified by Metra for the Major Investment Study (MIS) for the North Central Service, provided this information. It should be noted that the MIS is based on the 2020 RTP. Exhibit 19 shows the distributional changes occurring as a result of implementing the transit projects. Exhibit 20 shows the distributional changes occurring as a result of implementing the highway projects. In generating this last Exhibit, the origins and destinations of highway-oriented work trips were taken from O/D trip tables from the 2020 RTP. The O/D trip tables were analyzed in the same manner as the transit boardings and alightings, described earlier. Exhibits 17 and 18, presented earlier, illustrate the very different impacts of these two modes on employment/residence relationships. Rail transit allows an individual to live a considerable distance from his/her place of employment.
24

Because rail in the Chicago region is long-standing, mature, and responsive to regional needs, it is well used; because it was put in place long ago, many towns, neighborhoods, and work places grew up alongside it. Because it is radial and focused on the Chicago Central Area, it provides excellent access to that central employment district. Because of its considerable job impacts, O’Hare Airport also was connected to the rail network. Consequently, rail access from Lake County is long-distance and focused on the Chicago Central Area and O’Hare. It is a net exporter of jobs. Improved highway access in Lake County, on the other hand, tends to encourage the development of nearby employment centers within the county. It allows small businesses, entrepreneurs and business executives to locate their work places close to their residences. For this reason, highway improvements in a suburban residential area tend to encourage the proximate development of employment (generally office) clusters. It tends to be a net importer of jobs, although this is a fairly recent phenomenon. Extensive suburbanization, improved telecommunication, growth of small and entrepreneurial businesses and greater numbers of cars per household have freed work place developments from traditional central areas and regional centers. Employment impacts, by major mode, are shown on Tables 6, presented later in the “Summary of Findings”. In conclusion, rail development, in general, tends to further concentrate jobs in the Chicago Central Area and along the existing concentration of jobs near O’Hare Airport. The IL-53 Extension, on the other hand, disperses employment and attracts job concentrations to its vicinity. Overall, there is a net increase of 4,450 jobs in Lake County as a result of all the RTP projects. The highway projects are responsible for an increase of 8,200 jobs in Lake County, whereas the rail projects are responsible for a net decrease of 3,750 jobs. D. Determining the Development Impacts on Population and
Employment Distribution of Individual Projects in Lake County (IL83/US 45 with US 12 Alternative)
1. Collective Impacts of RTP with IL83/US 45 with US 12 Alternative Subsequent to the development of the “Disaggregation Methodology” for the proposed IL-53 Extension Alternative, a second alternative, the IL-83/US 45 with US 12 Alternative, was submitted for similar analysis. Under this methodology, the collective impacts of all the RTP projects, (excluding IL-53 Extension) with the IL-83/US 45 with US 12 Alternative on Lake County are:
• 51,000 more persons by 2020
• 4,211 more jobs by 2020
25

For the IL-83/US 45 with US 12 Alternative, ACG employed the same philosophy and similar methodologies to determine both highway and transit usage. Both impacts are derived independently, using established origin and destination data (both historical and forecast). For transit, both the point of origin and volume of ridership are well-defined by station boardings. For highways, the methodology is similar, but employs a more-general origin/destination data set. Work-oriented trip tables, using interchange tables among zones rather than stations, are the data source. Forecasts for both highway and transit impacts were done independently and simultaneously. Exhibits 21 and 22 show the population impacts attributed to building vs. not-building the IL-53 Extension and IL-83/US 45 with US 12 alternatives. 2. Description of the Methodology Used in Comparing Impacts of RTP
vs. IL-83/US 45 with US 12 Alternative The Chicago Area Transportation Study (CATS) used the May 1999 socio-economic forecasts generated by ACG as inputs in its regional transportation planning model and provided the Project consultants (CH2MHill) with the No Action (Baseline) trip tables. CH2MHill used this data to develop and evaluate a full range of alternatives for Lake County. Two finalist alternatives were selected for further analysis and ACG was asked to generate the population and employment impacts of the IL-83/US 45 with US 12 Alternative. This alternative, consisted of the No Action (baseline) improvements plus:
• Add-lanes to IL-83, US 12, IL 21, with bypasses of Mundelein and
Libertyville. • Add-lanes to I-94 from IL-60 to IL-132.
CH2MHill provided ACG with congested peak time of travel for the above alternative from the centroid of each NIPC planning Zone (DRAM/EMPAL Zones of DEZ) to each other DEZ (a matrix 317 by 317). From these matrices, a weighted average accessibility measure for each zone for each alternative was developed. Zones that experienced no change in the weighted average are assumed to attract the same population/households and employment. Zones which would experience a decline in accessibility (i.e. increase in travel time) would attract fewer households or jobs; the reverse also is true. The relationship between population/employment and accessibility is assumed to be proportional, assuming all other factors to be constant.
26

3. Net Impacts Due to IL-83/US 45 with US 12 Alternative Improvements Exhibits 23 and 24 show the employment, respectively, due to the improvements implied in the IL-53 Extension and IL-83/US 45 with US 12 Alternatives. These implications, although somewhat different than those shown in Exhibits 21 and 22, are not clearly obvious from comparing these two sets of maps. There are three zones in Lake County which would experience a slightly slower growth in population if the IL-83/US 45 with US 12 Alternative were built rather than if it is not built and no additional arterial improvements are undertaken. Increased population growth would occur in the central and northeastern portion of the County. There are four zones in Lake County which would experience a smaller employment growth under the IL-83/US 45 with US 12 Alternative rather than under the No Action (baseline) Alternative. These zones are in the northwest portion of the County. Most zones in the south and central portion of the County would experience employment growth under the IL-83/US 45 with US 12 Alternative. 4. Net Impacts of the Two Finalist Alternatives The following table (Table 5) shows the net impacts of the two Finalist Alternatives on changes in population and employment growth in Lake County. Table 7, in the following chapter, shows the detailed impacts of transit and highway projects under the IL-83/US 45 with US 12 Alternative.
Table 5 Net Socio-Economic Impacts (1990 - 2020) of Finalist Alternatives in Lake County
Population Employment
IL-53 Extension Alternative 27,500 4,200
IL-83/US 45 with US 12 Alternative
18,000 3,950
27

IV. Summary of Findings A. Summary Tables of Impacts Table 6 presents the impacts of each of Lake County’s proposed transportation projects on net population and employment change within Lake County. As noted earlier, the net changes for each project in Lake County are balanced by an equal and opposite change elsewhere in Northeastern Illinois. The combined impacts of IL-53 Extension and synergistic interacting projects are highlighted.
Table 6 Impacts of 2020 Regional Transportation Plan Projects
Net Population and Employment by Project Including the IL-53 Extension Alternative
(Net Lake County Impacts, Only)
Transit Projects Population Employment North Central Service Improvements +12,500 ┐
-4,000 UP Northwest/McHenry Extension +8,500 ┘ Milwaukee District - North Line 0 0 EJE Circumferential +2,000 +250 Sub-Total +23,000 -3,750 Highway Projects Tri-State (I-94) Add Lanes and IL 22 Improvements East of I-94
+5,500 +4,000
IL 22 Improvements West of I-94 and Other Arterials South of IL 176
+3,000 0
Arterial Improvements North of IL 176
+1,500 0
IL-53 Extension Alternative +23,000 ┐ +4,200 ┐ Synergistic Effects of Projects Interacting with IL-53 Extension Alternative
+4,500
27,500 ┘
0
4,200 ┘
Sub-Total +37,500 +8,200 Total (Sum of above) +60,500 +4,450 Independent NIPC Total +60,473 +4,461
28

Table 7 presents the impacts of each of Lake County’s proposed transportation projects on net population and employment change within Lake County. In this case, the IL-83/US 45 with US 12 Alternative is substituted for the IL-53 Extension Alternative. The impacts of this alternative are highlighted.
Table 7 Impacts of 2020 Regional Transportation Plan Projects
Net Population and Employment by Project Including the IL-83/US 45 with US 12 Alternative
(Net Lake County Impacts, Only)
Transit Projects Population Employment North Central Service Improvements +12,500 ┐
-4,000 UP Northwest/McHenry Extension +8,500 ┘ Milwaukee District - North Line 0 0 EJE Circumferential +2,000 +250 Sub-Total +23,000 -3,750 Highway Projects Tri-State (I-94) Add Lanes and IL-22 Improvements East of I-94
+5,500 +4,000
IL-22 Improvements West of I-94 and Other Arterials South of IL-176
+3,000 0
Arterial Improvements North of IL-176 +1,500 0 IL-83/US 45 with US 12 Alternative 18,000 3,950 Sub-Total 25,300 7,950 Total (Sum of above) +51,000 +4,200
B. Study Corroboration The changes shown in the preceding tables are net changes. Several projects both export and import activities. For example, the two major railroad projects (double tracking of the North Central Service and the McHenry extension of the UP Northwest Line) increase service tremendously and export 6,600 jobs from the County; they allow residents to work in the Central Chicago Area and at O’Hare, among other places. But, they also cause the creation of 2,600 jobs within the County to service the increased population (retail, community facilities, service, etc.). This results in a net impact of minus 4,000 jobs. Two sets of detailed tables, showing the increases and decreases in population and employment, by NIPC planning zone, caused by each of the projects shown in Table 6 and Table 7 were prepared and became the basis for the more-detailed forecasts.
29

The first set of detailed tables presented the net population and employment changes that must be subtracted from the RTP alternative to generate the IL- 53 Extension Alternative forecasts. In this set, there are 32 and 20 zones that would experience decreases in population and employment, respectively, if the Project Baseline alternative network were used instead of the RTP network. Balancing these decreases, 65 and 17 zones would experience increases in population and employment, respectively. The number of zones in Northeastern Illinois which would experience no change in population and/or employment is 208. Most of these latter zones are located in the southern half of the region and in western Kane and McHenry Counties. The second set of detailed tables presented the net changes that must be added to the No-RTP network to generate the impacts of the Project Baseline network. In this set, 39 and 21 planning zones would experience increases in population and employment, respectively; also, 40 and 36 planning zones would experience decreases, respectively. Of the total 317 planning zones, 218 would not experience any changes. The socio-economic forecasts associated with the Project Baseline network are the same whether they are derived by subtraction from the RTP alternative or addition to the No-RTP alternative. Consequently, the two methodologies corroborate one another. C. Consistency with NIPC Forecasts Following the completion of the above forecasts, by the 317 NIPC planning zones, representatives from IDOT and the consultants formally presented their findings to NIPC, and its Planning Committee for its review and comment. NIPC, in a letter dated November 30, 1998 (attached as an appendix), acknowledged the consultations and concurrence that had taken place between its staff and ACG. NIPC concluded its letter by stating:
“It is our staff judgement that the method ACG used to allocate the forecasts among projects is a reasonable one and that the results are consistent with the Commission’s endorsed forecasts.”
Following the NIPC review and comments, ACG disaggregate the planning zone forecasts to each of the more than 18,000 CATS subzones. During this process of disaggregation, ACG also generated the detailed corollary data required as input to the CATS trip generation model. In generating this detailed set of data, ACG used as its guideline the NIPC disaggregation of the planning zonal data. Two sets of disaggregate data, one assuming the expansion of existing airports and the second assuming the development of the Chicago Third Airport in the South Suburbs, were prepared and submitted to CATS.
30

D. Study Conclusions 1. The IL-53 Extension Alternative The major conclusion of the foregoing study is that the proposed IL-53 Extension, alone, is responsible for a population increase of 23,000 persons in Lake County between 1990 and 2020. With its synergistic impacts of 4,500, the proposed IL-53 Extension contributes 27,500 persons. It is also a net importer of jobs to Lake County, providing approximately 4,200 of the 8,200 job growth difference between RTP and No RTP. Other highway projects identified as part of the No Action (Baseline) contribute 10,000 persons and the remaining 4,000 job increases. Transit projects contribute 23,000 persons of the population increase in Lake County. Transit projects, however, are a net exporter of jobs. By helping retain jobs in the Chicago Central Area and around O’Hare, they contribute a net loss of 3,750 in job growth to Lake County. The total impact of all projects in the IL-53 Extension Alternative is 60,500 persons and 4,450 jobs. 2. The IL-83/US 45 with US 12 Alternative The IL-83/US 45 with US 12 improvement adds 18,000 persons and 3,950 jobs. The transit projects, under this alternative, would contribute the same number of persons (23,000), as does the No Action (Baseline) Alternative. As in the IL-53 Alternative, the Transit Projects export 3,750 jobs. Highway projects contribute 10,000 persons and 4,000 jobs. The total impact of all projects in the IL-83/US 45 with US 12 Alternative is 51,000 persons and 4,200 jobs. 3. Overall Impacts The overall impact on population growth in Lake County of either finalist alternative remains relatively small. Lake County is expected to grow from its 1990 population of 516,400 to 772,411 without any of the RTP projects in place and to 832,884, with all RTP projects in place. The contributions, of either the IL-53 Extension or the IL-83/US 45 with US 12 improvements, alone, are even smaller; they are 5.3 percent and 3.5 percent, respectively, of the 1990 population; and they are 3.6 and 2.3 percent of the 2020 No-RTP forecast population. The impact on job growth, in both instances, is negligible.
31
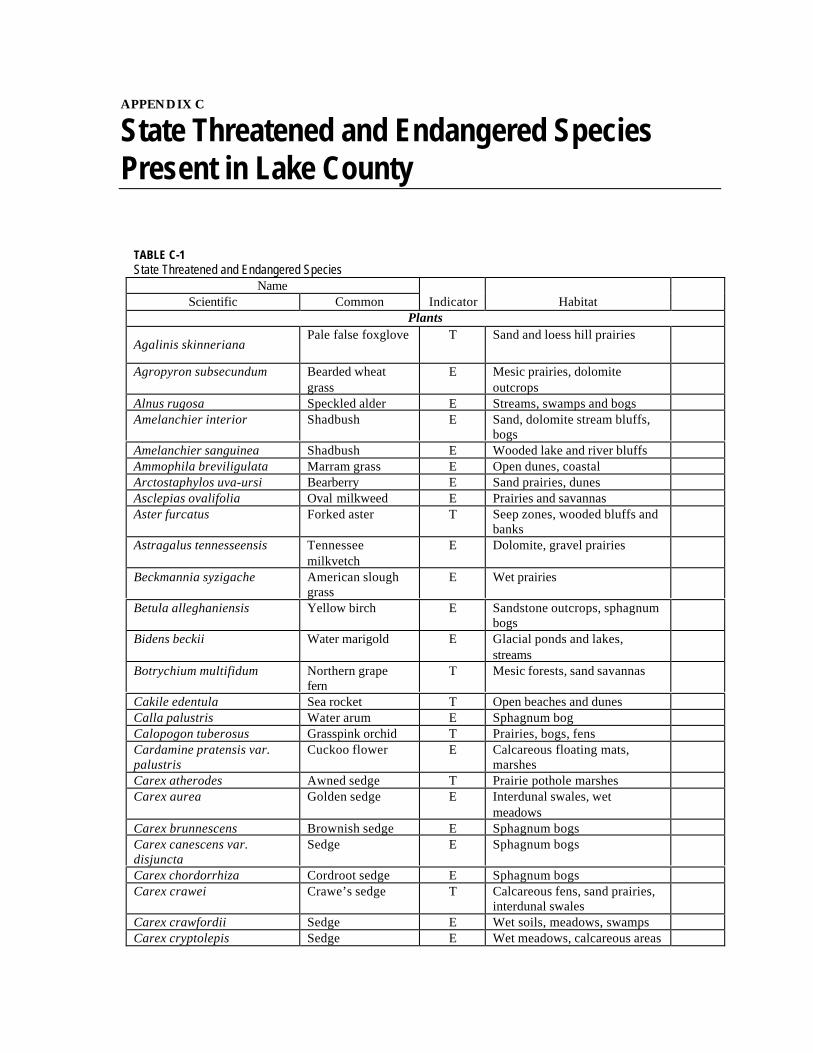
APPENDIX C
State Threatened and Endangered SpeciesPresent in Lake County
TABLE C-1State Threatened and Endangered Species
NameScientific Common Indicator Habitat
Plants
Agalinis skinnerianaPale false foxglove T Sand and loess hill prairies
Agropyron subsecundum Bearded wheatgrass
E Mesic prairies, dolomiteoutcrops
Alnus rugosa Speckled alder E Streams, swamps and bogsAmelanchier interior Shadbush E Sand, dolomite stream bluffs,
bogsAmelanchier sanguinea Shadbush E Wooded lake and river bluffsAmmophila breviligulata Marram grass E Open dunes, coastalArctostaphylos uva-ursi Bearberry E Sand prairies, dunesAsclepias ovalifolia Oval milkweed E Prairies and savannasAster furcatus Forked aster T Seep zones, wooded bluffs and
banksAstragalus tennesseensis Tennessee
milkvetchE Dolomite, gravel prairies
Beckmannia syzigache American sloughgrass
E Wet prairies
Betula alleghaniensis Yellow birch E Sandstone outcrops, sphagnumbogs
Bidens beckii Water marigold E Glacial ponds and lakes,streams
Botrychium multifidum Northern grapefern
T Mesic forests, sand savannas
Cakile edentula Sea rocket T Open beaches and dunesCalla palustris Water arum E Sphagnum bogCalopogon tuberosus Grasspink orchid T Prairies, bogs, fensCardamine pratensis var.palustris
Cuckoo flower E Calcareous floating mats,marshes
Carex atherodes Awned sedge T Prairie pothole marshesCarex aurea Golden sedge E Interdunal swales, wet
meadowsCarex brunnescens Brownish sedge E Sphagnum bogsCarex canescens var.disjuncta
Sedge E Sphagnum bogs
Carex chordorrhiza Cordroot sedge E Sphagnum bogsCarex crawei Crawe’s sedge T Calcareous fens, sand prairies,
interdunal swalesCarex crawfordii Sedge E Wet soils, meadows, swampsCarex cryptolepis Sedge E Wet meadows, calcareous areas

APPENDIX C— STATE THREATENED AND ENDANGERED SPECIES PRESENT IN LAKE COUNTY
C-2
Carex disperma Shortleaf sedge E Forested bogsCarex garberi Elk sedge E Calcareous beach ridges and
swalesCarex lucorum Sedge E Dry openings, oak pine
woodlandsCarex oligosperma Few-seeded sedge E Sphagnum bogsCarex rostrata Beaked sedge E Northern peatlands and lake
shoresCarex tonsa Shaved sedge E Sand deposits along rivers and
lakesCarex trisperma Three-seeded sedge E Acid bogsCarex tuckermanii Tuckerman’s sedge E Flatwoods, wet-mesic forestsCarex viridula Little green sedge E Dune swales, spring runs, marl
flatsCarex woodii Pretty sedge E Mesic calcareous forestsCastilleja sessiliflora Downy yellow
painted cupE Gravel and sand prairies
Ceanothus ovatus Redroot E Sand prairies and savannasChamaedaphne calyculata Leatherleaf T Sphagnum bogsChamaesyce polygonifolia Seaside spurge E Beach and foredunesChimaphila umbellata Pipsissewa E Dry-mesic upland sand forestsCircaea alpina Small enchanter’s
nightshadeE Dolomite ravines and bluffs
Cirsium hillii Hill’s thistle T Dry, open prairiesCirsium pitcheri Dune, Pitcher’s
thistleT Dunes and beaches
Comptonia peregina Sweet fern E Acid sand prairies and savannasCornus canadensis Bunchberry E Forested bogsCypripedium acaule Pink Lady’s slipper E Forested bogs and fensCypripedium calceolus var.parviflorum
Small yellowLady’s slipper
E Forested, graminoid fens, mesicsand or silt loam prairies
Cypripedium candidum White Lady’sslipper
E Wet mesic prairies and fens
Cypripedium reginae Showy Lady’sslipper
E Prairies, forests, barrens, bogs,fens
Drosera rotundifolia Round leavedsundew
E Sphagnum bogs, wet peaty sand
Eleocharis olivacea Capitate spikerush E Dune swaleEleocharis pauciflora Few flowered
spikerushE Fens, calcareous dune swales
Eleocharis rostellata Beaked spikerush T Calcareous seeps, graminoidfens
Epilobium strictum Downy willowherb
T Calcareous bogs, fens, seeps
Equisetum scirpoides Dwarf scouringrush
E Bluffs, ravines slopes
Eriophorum virginicum Rusty cotton grass E Acid bogsEriophorum viridi-carinatum Tall cotton grass E Wet sand prairiesGalium labradoricum Bog bedstraw T Bogs, fens, sedge meadowsGaultheria procumbens Wintergreen E Acid soils, forests and bogsGeranium bicknellii Northern cranesbill E Woodland openings, rock
outcropsGlyceria borealis Northern
mannagrassE Bogs, marshes, ponds, stream
banks

APPENDIX C— STATE THREATENED AND ENDANGERED SPECIES PRESENT IN LAKE COUNTY
C-3
Hypericum kalmianum Kalm’s St. John’swort
E Mesic sand prairies, interdunalswales
Juncus alpinus Richardson’s rush E Fens, wet sand prairies,interdunal swales
Juniperus communis Ground juniper T Dunes, glacial bluffs, ravinesJuniperus horizontalis Trailing juniper E Sand dunesLactuca ludoviciana Western wild
lettuceE Dry, mesic prairies
Larix laricina Tamarack T Bogs and forested fensLathyrus maritimus Beach pea E Gravel coasts and shoresLathyrus ochroleucus Pale vetchling T Upland savannas and ravinesLechea intermedia Pinweed E Dry, sterile sandy soilsOenothera perennis Small sundrops E Sand, gravel prairies, dry
prairie slopesOrobanche fasciculata Broomrape E Dry sand prairies, alluvial
floodplainsOryzopsis racemosa Rice grass T Calcareous mesic forest slopesPanicum boreale Northern Panic
grassE Sand prairies and savannas
Panicum columbiaum Hemlock Panicgrass
E Sandstone outcrops anddeposits
Pinus banksiana Jack pine E Sand ridgesPinus resinosa Red pine E Dry-mesic sand forestsPlantago cordata Heart-leaved
plantainE Sand or gravel bars
Platanthera flava var.herbiola
Tubercled orchid T Floodplain forests and swamps
Platanthera clavellata Wood orchid E Mesic sand prairies and thicketsPlatanthera leucophaea Prairie white-
fringed orchidE Mesic to wet prairies
Platanthera psycodes Purple-fringedorchid
E Flatwood openings and sandprairies
Poa alsodes Grove bluegrass E Wooded bluffs and ravinesPoa languida Weak bluegrass E Mesic upland forestsPogonia ophioglossoides Snake mouth E Wet sand prairie, Sphagnum
bogs, fensPolygonatum pubescens Downy Solomon’s
sealT Bluff ravines and mesic forests
Populus balsamifera Balsam poplar E Bluffs, sand dunes, bogmargins, mesic prairies
Potamogeton gramineus Grass leavedpondweed
E N/A
Potamogeton praelongus White stemmedpondweed
E Glacial lakes
Potamogeton robbinsii Fern pondweed E Glacial lakesPotamogeton strictifolius Stiff pondweed E Calcareous lakes and pondsRanunculus cymbalaria Seaside Crowfoot E Saline, brackish shoresRhamnus alnifolia Alder buckthorn E Calcareous bogs, sand prairies,
fensRhynchospora alba Beaked rush T Fens, bogs, interdunal swalesRibes hirtellum Northern
gooseberryE Northern bogs, swamp forests
Rorippa islandica subsp.Hispida
Hairy marshyellow cress
E Marshes, disturbed wetlands

APPENDIX C— STATE THREATENED AND ENDANGERED SPECIES PRESENT IN LAKE COUNTY
C-4
Rubus odoratus Purple-Floweringraspberry
E Forest clearings, roadsides,fencerows
Rubus pubescens Dwarf raspberry T Mesic ravine forests, bogs,fens, flatwoods
Salix serissima Autumn willow E Bogs, marshes, peaty areasSalix syrticola Dune willow E Sand dunesSambucus pubens Red-berried alder T Rocky forest slopes and bogsSarracenia purpurea Pitcher plant E Bogs, fens, calcareous matsScheuchzeria palustris Arrowgrass E Bogs and sedge matsScirpus cespitosus Tufted bulrush E Graminoid fensShepherdia canadensis Buffaloberry E Beach ridges, shoresSisyrinchium montanum Mountain blue-
eyed grassE Mesic prairies
Sorbus americana Americanmountain ash
E Rocky woods and bogs
Sparganium chlorocarpum Green-fruitedburreed
E Muddy, peaty shores, shallowwater
Spiranthes lucida Yellow-lippedLady’s tresses
E Calcareous habitats
Thuja occidentalis Arbor vitae T Glacial till bluffs, side ravines,fens
Tofieldia glutinosa False Asphodel T Wetlands, fens, interdunalswales
Tomanthera auriculata Ear-leavedfoxglove
T Disturbed prairies and savannas
Triadenum virginicum Marsh St. John’swort
E Peaty sand prairies
Trientalis borealis Star flower T Bogs, sand forests, ravinebluffs
Triglochin maritima Common bogarrowgrass
E Fens and interdunal swales
Triglochin palustris Slender bogarrowgrass
E Spring runs in fens, interdunalswales
Trillium erectum Ill-scented trillium E Mesic forestsUtricularia cornuta Horned
bladderwortE Bogs, wet peaty sands, fens
Utricularia intermedia Flat-leavedbladderwort
E Bogs, fens, interdunal swales
Utricularia minor Small bladderwort E Bogs, floating mats, fens,interdunal swales
Vaccinium corymbosum Highbushblueberry
E Wet acid sand prairies, bogs
Vaccinium macrocarpon Large cranberry E Acid bogsVaccinium oxycoccos Small cranberry E Sphagnum bogsVeronica scutellata Marsh speedwell T Marshes, graminoid fens,
wetlandsViola conspersa Dog violet T Mesic forest and flatwoodsViola incognita Hairy white violet E Flatwoods, forested fens, mesic
forestsBirds
Accipiter cooperii Cooper’s hawk E Mature deciduous forestsAmmodramus henslowii Henslow’s sparrow T Prairies and fieldsAsio flammeus Short-eared owl E Prairies, marshes, savannas,
dunes

APPENDIX C— STATE THREATENED AND ENDANGERED SPECIES PRESENT IN LAKE COUNTY
C-5
Asio otus Long-eared owl E Dense pine, mixed coniferdeciduous
Bartramia longicauda Upland sandpiper E Prairies and pasturelandBotaurus lentiginosus American bittern E Freshwater marshes and shoresButeo lineatus Red shouldered
hawkE Riparian forests, wooded
swampsCerthia americana Brown Creeper T Deciduous, mixed woodlands,
floodplain forestsCharadrius melodus Piping plover E Sand dunes and shoresChlidonias niger Black tern E Freshwater marshes, ponds,
lakesCoturnicops noveboracensis Yellow rail E Marshes, wet prairies, sedge
meadowsEuphagus cyanocephalus Brewer’s blackbird T Prairie and grasslandsGallinula chloropus Common moorhen T Fresh water marshes, streams,
lakesGrus canadensis Sandhill crane E Large undisturbed fresh water
marshes and prairie pondsIxobrychus exilis Least bittern E Fresh water lakes and marshesLanius ludovicianus Loggerhead shrike T Open Agricultural areas,
grasslands.Nyctanassus violacea Yellow-crowned
night heronT Marshes, swamps, lakes,
lagoons. Nest in trees nearwater
Nycticorax nycticorax Black-crownednight heron
E Rookeries, bottomland forests
Phalaropus tricolor Wilson’s phalarope E Prairie potholes, marshes, riversPodilympus podiceps Pied-billed grebe E Well vegetated lakes,ponds,
marshesRallus elegans King rail T Fresh water marshesSpizella pallida Clay colored
sparrowE Freshwater marshes, aquatic
vegetationSterna antillarum Least tern E Shallow depressions, sandy
islandsSterna forsteri Forster’s tern E Freshwater sites, marshes on
lakesSterna hirundo Common tern E Sand or pebble beaches on
islandsXanthocephalusxanthocephalus
Yellow-headedblackbird
E Dense cattail marshes, openwater.
ReptilesClonophis kirtlandii Kirtland’s snake T Wet meadows, open swamp
forestsEmydoidea blandingii Blanding’s turtle T N/AKinosternon flavescens Illinois mud turtle E Undisturbed sand areas, with
pondsSistrurus catenatus Eastern
massasaugaE Wet prairies, bogs, swamps, dry
woodsAmphibians
Hemidactylium scutatum Four-toedsalamander
T Boggy woodland ponds,sphagnum
InsectsHesperia ottoe Skipper E Sand, loess hill prairiesIncisalia (Callophrys) polios Hoary Elfin E Sunny glades, barrens, dunes,

APPENDIX C— STATE THREATENED AND ENDANGERED SPECIES PRESENT IN LAKE COUNTY
C-6
butterfly forest edgesLycaeides melissa samuelis Karner blue
butterflyE Beaches, with lupine
Paraphlepsius lupalus Leafhopper E Sand dunesMussels
Elliptio dilatataSpike T Small to large streams, lakes,
mud or gravel substrates
FishesAcipenser fulvescens Lake sturgeon T Large lakes and riversCatostomus catostomus Longnose sucker T Clear, cold deepwater lakes and
streamsCoregonus artedi Cisco T Lake MichiganCoregonus clupeaformis Lake whitefish T Great LakesEtheostoma exile Iowa darter E Clear, well vegetated lakes,
streamsFundulus diaphanus Banded killifish T Clear glacial lakesNotropis anogenus Pugnose shiner E Clear heavily vegetated lakesNotropis heterodon Blackchin shiner T Clear, well vegetated lakesNotropis heterolepis Blacknose shiner E Clear vegetated lakes and pools

APPENDIX D
ADID Wetlands
TABLE D-1ADID Wetland Impacts Per Alternative
ADID Number No-Action Ha (Ac) IL 53 Freeway/Tollway Ha (Ac) IL 83/US 45 with US 12 Ha (Ac)
44 0.40 (1.00) — —
61 0.01 (0.03) — —
91 1.1 (2.72) — 0.28 (0.70)
94 >0.01 — 0.02 (0.04)
96 0.15 (0.37) — 0.06 (0.16)
99 — — 0.01 (0.03)
106 0.37 (0.92) — 0.06 (0.15)
108 — — 0.40 (1.02)
113 0.32 (0.79) — —
128 — — 0.04 (0.11)
143 — 0.66 (1.63) 0.24 (0.59)
151 — — 0.17 (0.42)
158 — — 0.01 (0.03)
168 0.02 (0.05) — —
169 0.86 (2.13) 0.25 (0.62) —
170 0.57 (1.42) 0.2 (0.51) —
173 0.06 (0.15) — —
175 0.55 (1.36) — —
180 — 2.2 (5.4) —
183 — — 0.25 (0.63)
187 0.78 (1.94) — —
198 — — 0.07 (0.17)
200 — 0.13 (0.33) 0.08 (0.18)
TOTAL 5.2 (12.9) 3.46 (8.55) 1.7 (4.2)
D.1 IL 53 Corridor—Des Plaines River Watershed
D.1.1 ADID Wetland 143—Indian Creek/Kildeer CreekThis wetland is described by the Lake County ADID study as a stream community thatcontains a sedge meadow and an emergent marsh dominated by bur reed (Sparganium ) and

APPENDIX D—ADID WETLANDS
D-2
arrowhead (Sagittaria ). This wetland harbors threatened or endangered species of plants andis considered a high quality stream. Other functions performed by this wetland areshoreline/bank stabilization and sediment toxicant retention. The total wetland size in thevicinity of the project is 63.0 ha (155.6 ac), but extends for long distances outside the studyarea. Approximately 81.3 ha (201 ac) of the large wetland complex are considered ADID.
Due to its configuration relative to the proposed roadway, this wetland is impacted in fourseparate areas. These were identified in the field as 53-43, 53-67, 83-19 and 83-40. Wetlandsegments 53-43 and 53-67 were assessed as being a high to moderate quality ripariancomplex with depressional areas. Segments 83-19 and 83-40 were assessed as being lowquality stream and adjacent depressional areas during the field verification. Approximately0.28 ha (0.69 ac) of 53-43, 0.02 ha (0.04 ac) of 53-67, 0.20 ha (0.50 ac) of 83-19, and 0.16 ha (0.40ac) of 83-40 would be impacted, totaling 0.66 ha (1.63 ac) or less than 0.9-percent of ADIDwetland 180. The proposed impacts are the result of mainline roadway construction andfrontage road construction.
While there is no overall functional loss to this wetland, there is minimal impact to functionsas a result of the proposed project. As portions of this wetland harbors endangered plantspecies and high quality plant communities, additional consultation with the IllinoisDepartment of Natural Resources would need to be conducted to determine the potentialfor impacting both the plant species and the habitat that the ADID wetland provides.Additional minimization and avoidance strategies may need to be developed duringsusequent planning and design work to reduce or avoid the proposed impacts to this ADIDsite from this alternate.
D.1.2 ADID Wetland 169The Lake County ADID Study identifies this wetland as a sedge meadow. The wetlandharbors threatened or endangered species of plants. No other functions were identified forthis wetland by the ADID study. The wetland in the vicinity of the project size is 1.4 ha (3.4ac) but extends beyond the proposed project area. Approximately 17.2 ha (42.4 ac) of thislarge complex are considered ADID. Due to its configuration relative to the proposedroadway, this wetland is impacted in two separate areas. These were identified in the fieldas 53-21 and 53-22. Wetland segment 53-21 was assessed as being a high quality open waterdepressional wetland and segment 53-22 was considered to be a low quality depressionalarea during the field verification. Approximately 0.11 ha (0.26 ac) of 53-21, and 0.15 ha(0.36 ac) of 53-22 would be impacted, totaling 0.25 ha (0.62 ac) or 1.5 percent of the totalwetland area of ADID wetland 169. The proposed impacts are the result of mainlineroadway construction and adjacent frontage roads.
While there is no overall functional loss to this wetland, there is minimal impact to functionsas a result of the proposed project. As portions of this wetland harbor endangered plantspecies and high quality plant communities, additional consultation with the IllinoisDepartment of Natural Resources would need to be conducted to determine the potentialfor impacting both the plant species and the habitat that the ADID wetland provides.Additional minimization and avoidance strategies may need to be developed duringsubsequent planning and design work to reduce or avoid the proposed impacts to thisADID site from this alternate.

APPENDIX D—ADID WETLANDS
D-3
D.1.2 ADID Wetland 170—Reed-Turner Nature PreserveThis wetland contains a sedge meadow. Only a portion of this wetland is included withinthe Nature Preserve confines. This wetland harbors threatened or endangered species ofplants and contains a high quality plant community. Other functions performed by thiswetland are shoreline/bank stabilization, sediment toxicant retention and nutrient removaland transport. The total wetland size within the study vicinity is 38.7 ha (95.6 ac) andextends outside the proposed project. Approximately 87.8 ha (217 ac) of the total wetlandarea are considered ADID. The project would directly impact approximately 0.2 ha (0.51 ac)of this wetland. The wetland in the vicinity of the proposed roadway (53-19) wascharacterized as open water/stream channel of moderate quality during the fieldverification. The impacts are the result of the mainline roadway construction and frontageroads construction. Total impacts to this ADID wetland from this alternate are less than0.24-percent. As a result, no loss of wetland functions is anticipated.
D.1.3 ADID Wetland 180—Buffalo Creek ComplexThe complex contains a sedge meadow and emergent marsh areas. This wetland harborsthreatened or endangered species of plants and contains a high quality plant community.Other functions performed by this wetland are shoreline/bank stabilization, sedimenttoxicant retention and nutrient removal and transport. The total wetland size is 79.4 ha(196.3 ac), of which 63.5 ha (157 ac) are considered ADID. Due to its configuration relative tothe proposed roadway, this wetland is impacted in three separate areas. These wereidentified in the field as 53-7, 53-8, and 53-11. The wetland segments were assessed as beinga high to moderate quality stream complex during the field verification. Approximately 0.22ha (0.54 ac) of 53-7, 0.36 ha (0.9 ac) of 53-8, and 1.6 ha (4.0 ac) of 53-11 would be impacted,totaling 2.2 ha (5.4 ac) of ADID wetland 180. This represents less than 2.8-percent of the totalwetland area. The proposed impacts are the result of mainline roadway construction andgrade separation of the channel.
While there is no overall functional loss to this wetland, there is minimal impact to functionsas a result of the proposed project. As portions of this wetland harbors endangered plantspecies and high quality plant communities, additional consultation with the IllinoisDepartment of Natural Resources would need to be conducted to determine the potential forimpacting both the plant species and the habitat that the ADID wetland provides. Additionalminimization and avoidance strategies may need to be developed during subsequentplanning and design work to reduce or avoid the proposed impacts to this ADID site fromthis alternate.
D.2 IL 120 Corridor—Des Plaines River Watershed
D.2.1 ADID Wetland 200This wetland is described by the Lake County ADID study as deep marsh dominated bycattails. This wetland harbors several species of State threatened or endangered species ofbirds. Other functions performed by this wetland are sediment toxicant trapping andstormwater storage. The total wetland size is 7.4 ha (18.3 ac) of which 7.0 ha (17.4 ac) areconsidered ADID. The project would directly impact approximately 0.13 ha (0.33 ac) of this

APPENDIX D—ADID WETLANDS
D-4
wetland. The wetland in the vicinity of the proposed roadway (120-4) was characterized aspredominantly a cattail marsh of low quality during the field verification. The impacts areas a result of the construction of the mainline roadway and associated grading andembankments. The loss of 0.13 ha (0.33 ac) results in less than 1.9-percent of the totalwetland. As a result, minimal impacts to the functions of this wetland are anticipated.
D.3 IL 83 Corridor—Des Plaines River Watershed
D.3.1 ADID Wetland 143—Indian Creek/Killdeer CreekDue to its configuration relative to the proposed roadway, this wetland is impacted in twoseparate areas. These were identified in the field as 83-19 and 83-40. These areas wereassessed as being low quality stream and adjacent depressional areas during the fieldverification. Approximately 0.08 ha (0.19 ac) of 83-19 and 0.16 ha (0.40 ac) of 83-40 would beimpacted, totaling 0.24 ha (0.59 ac) or less than 0.3-percent of ADID wetland 143. Theproposed impacts are the result of mainline roadway construction and frontage roadconstruction. While there is no overall functional loss to this wetland, there is minimalimpact to functions as a result of the proposed project. As portions of this wetland harborsendangered plant species and high quality plant communities, additional consultation withthe IDNR would need to be conducted to determine the potential for impacting both theplant species and the habitat that the ADID wetland provides. Additional minimization andavoidance strategies may need to be developed during subsequent planning and designwork to reduce or avoid the proposed impacts to this ADID site from this alternate.
D.3.2 ADID Wetland 151This wetland is described by the Lake County ADID study as a wetland and streamcomplex associated with Indian Creek. This portion of Indian Creek still retains a highdegree of natural character and has not been altered to any significant degree. The primaryfunctions of this wetland are shoreline bank stabilization and sediment/ toxicant retention.The description of this wetland was verified during the field screening that was conducted.The total wetland size in the vicinity of the project is 38.0 ha (94.0 ac), but extends for longdistances outside the study area. Approximately 39.4 ha (97.4 ac) of the entire wetlandcomplex are considered ADID. The proposed project would unavoidably impactapproximately 0.17 ha (0.42 ac) of this ADID wetland. The wetland in the vicinity of theproposed roadway (83-27) was characterized as a depressional community of low qualityduring the field verification. The impacts are as a result of the construction of the mainlineroadway and associated embankment. This alternative would impact approximately 0.4-percent of this ADID wetland in the vicinity of the project. As a result of this minimalimpact level, no loss of wetland function would occur.
D.3.3 ADID Wetland 158 (Wetland 83-11)This wetland is described by the Lake County ADID study as Indian Creek, which is astream and wetland complex that maintains a high degree of natural character and isrelatively undisturbed. The primary functions of this wetland are shoreline bankstabilization and sediment/ toxicant retention. The description of this wetland was verifiedduring the field screening. The total wetland size in the vicinity of the project is 28.9 ha (71.5

APPENDIX D—ADID WETLANDS
D-5
ac), but extends for long distances outside the study area. Approximately 23.7 ha (58.6 ac) ofthe large wetland complex are considered ADID. The proposed project would unavoidablyimpact approximately 0.01 ha (0.03 ac) of this ADID wetland. The wetland in the vicinity ofthe proposed roadway was characterized as forested depression and stream communityduring the field verification. The impacts are as a result of the construction of the mainlineroadway and associated embankment. The impacts to this wetland are less than 0.04-percentof the total wetland in the vicinity of the project alone. As a result of the small amount ofproposed impacts, no loss of wetland function would occur.
D.4 US 12 Corridor
D.4.1 ADID Wetland 183The Lake County ADID Study does not describe this wetland in detail. The wetland is locatedin the Buffalo Creek Watershed. The primary functions of this wetland are stormwaterstorage, shoreline bank stabilization and nutrient removal/transport (partial). The totalwetland size in the vicinity of the project is 36.7 ha (90.6 ac), but extends for long distancesoutside the study area. Approximately 9.0 ha (22.2 ac) of the large wetland complex areconsidered ADID. The proposed project would unavoidably impact approximately 0.25 ha(0.63 ac) of this ADID wetland. The wetland in the vicinity of the proposed roadway (12-4)was characterized as an open water pond with adjacent emergent community during the fieldverification. The impacts are as a result of the construction of proposed frontage roads. Thisalternative impacts approximately 0.7-percent of the wetland in the vicinity of the project. Asa result of this minimal impact, no loss of wetland function would occur.
D.5 IL 120
D.5.1 ADID Wetland 200ADID Wetland 200 is described in the IL 53 Freeway/Tollway Alternative discussion above.The project would directly impact approximately 0.08 ha (0.18 ac) of this wetland at thisparticular location (120-4). The description of this wetland was verified during the fieldscreening that was conducted. The wetland in the vicinity of the proposed roadway wascharacterized as a depressional, cattail marsh of low quality during the field verification.The impacts in this location are as a result of the construction of the mainline roadway. Lessthan one percent of this wetland would be impacted by the proposed alternative. As aresult, no loss of wetland functions is anticipated.
D.6 IL 21 Corridor
D.6.1 ADID Wetland 94—Liberty PrairieThis complex includes a wet prairie dominated by switch grass (Panicum virgatum ), blue jointgrass (Calamagrostris canadensis) and prairie cordgrass (Spartina pectinata), a graminoid fendominated by grass of Parnassus (Parnassia glauca), Riddell’s Goldenrod (Solidago riddellii) andbottle brush sedge (Carex lurida) and a sedge meadow dominated by spotted Joe pye weed(Eupatorium maculatum) smash skullcap (Scutellaria sp.) marsh vetchling (Lathyrus palustris)

APPENDIX D—ADID WETLANDS
D-6
and tufted loosestrife (Lysimachia thyrsiflora). The primary functions of this wetland arestormwater storage and sediment/ toxicant retention. The biological values sited include thepresence of state threatened or endangered plant species, an overall high quality plantcommunity and is a designated INAI Site. The total wetland size is 2 ha (5 ac) in the vicinity ofthe project, but extends for long distances outside the study area. Approximately 55.4 ha(137.0 ac) of the overall wetland complex are considered ADID. The proposed project wouldunavoidably impact approximately 0.02 ha (0.04 ac) of this ADID wetland. The wetland in thevicinity of the proposed roadway (21-28) was characterized as an open water channel withadjacent forested wetlands during the field verification. The impacts are as a result of theconstruction of the mainline roadway and associated embankment.
The proposed impacts to ADID wetland 94 are less than 0.03-percent of the total wetlandcomplex. This ADID wetland consists of high quality natural areas within a larger ADIDwetland complex. While impacts to wetland functions would be considered minimal,additional minimization and avoidance measures should be developed during theengineering phase to reduce impacts to high quality areas. The habitat function that thiswetland provides cannot be easily mitigated and therefore additional measures may berequired to minimize functional impacts.
D.6.2 ADID Wetland 96—Tributary to Bull CreekThis wetland is described by the Lake County ADID study as a tributary to Bull Creek,which is part of a stream and wetland complex that includes Oak Openings Natural Area(ADID Site 88) and ADID Sites 93 and 95. The primary functions of this wetland arestormwater storage and sediment/ toxicant retention and is valued as a high quality streamcomplex. The description of this wetland was verified during the field screening that wasconducted. The total wetland size in the vicinity of the project is 2.4 ha (5.9 ac), but extendsfor long distances outside the study area. Approximately 6.45 ha (15.9 ac) of the overallwetland complex are considered ADID. The proposed project would unavoidably impactapproximately 0.06 ha (0.16 ac) of this ADID wetland. The wetland in the vicinity of theproposed roadway (21-18) was characterized as an open water channel with adjacentforested wetlands during the field verification. The impacts are as a result of theconstruction of the mainline roadway and associated embankment.
The approximate impacts to this ADID wetland are one percent of the total ADID area. ThisADID wetland consists of high quality natural areas within a larger ADID wetland complex.While impacts to wetland functions would be considered minimal, additional minimizationand avoidance measures should be developed during the engineering phase to reduceimpacts to high quality areas. The habitat function that this wetland provides cannot be easilymitigated and therefore additional measures may be required to minimize functional impacts.
D.6.3 ADID Wetland 106—Bull CreekThis wetland is described by the Lake County ADID study as a stream complex thatincludes areas of state endangered fish species. The primary functions of this wetland arestormwater storage and sediment/toxicant retention. The description of this wetland wasverified during the field screening that was conducted. The total wetland size in the vicinityof the project is 0.22 ha (0.55 ac), but extends for long distances outside the study area.Approximately 0.65 ha (1.61 ac) of the overall wetland complex are considered ADID. Due

APPENDIX D—ADID WETLANDS
D-7
to its configuration relative to the proposed roadway, this wetland is impacted in twoseparate areas. These were identified in the field as 21-17 and 21-28. These areas wereassessed as partially a channelized stream and open water stream with minimal adjacentdepressional wetlands.
Approximately 0.01 ha (0.02 ac) of 31-17 and 0.05 ha (0.13 ac) of 21-28 would be impacted,totaling 0.06 ha (0.15 ac) or roughly 9-percent of the ADID portion of this wetland complex, buta much lower percentage of the total wetland complex. While overall there is no functional lossto this wetland, there is minimal impact to the ADID portion of the wetland. As this wetlandharbors an endangered fish species, additional consultation with the Illinois Department ofNatural Resources would need to be conducted to determine the potential for impacting boththe fish species and the habitat the ADID wetland provides. Additional minimization andavoidance strategies may need to be developed during subsequent planning and design work toreduce or avoid the proposed impacts to this ADID site from this alternate. The proposedimpacts are the result of mainline roadway construction and associated embankment.
D.7 IL 60 Corridor and St. Mary’s Road Corridor
D.7.1 ADID Wetland 198—MacArthur WoodsThis wetland complex is described as a northern flatwoods dominated by Swamp white oak(Quercus bicolor) and American elm (Ulmus americana ), a floodplain forest dominated bysilver maple (Acer saccharinum) and cottonwoods (Populus deltoides), and a shrub swampdominated by buttonbush (Cephalanthus occidentalis) and red osier dogwood (Cornusstolonifera). The primary functions of this wetland are stormwater storage andsediment/toxicant retention and is valued as a high quality plant community. Thedescription of this wetland was verified during the field screening that was conducted. Thetotal wetland size in the vicinity of the project is 0.1 ha (0.26 ac), but extends for longdistances outside the study area. Approximately 14.8 ha (36.57 ac) of the overall wetlandcomplex are considered ADID. Due to its configuration relative to the proposed roadway,this wetland is impacted in two separate areas. These were identified in the field as 60-11and STM-27. Wetland segments 60-11 and STM-27 were assessed as being a low qualitydepressional area during the field verification. Approximately 0.06 ha (0.15 ac) of 60-11 and0.008 ha (0.02 ac) of STM-27 would be impacted, totaling 0.06 ha (0.16 ac) or approximately0.4-percent of ADID wetland 198. The proposed impacts are the result of mainline roadwayconstruction and associated embankment.
This minimal impact would not cause a loss of function for this wetland. However, thisADID wetland consists of high quality natural areas within a larger ADID wetland complex.While impacts to wetland functions would be considered minimal, additional minimizationand avoidance measures should be developed during the engineering phase to reduceimpacts to high quality areas. The habitat function that this wetland provides cannot beeasily mitigated and therefore additional measures may be required to minimize functionalimpacts.

APPENDIX D—ADID WETLANDS
D-8
D.8 I-94 Corridor
D.8.1 ADID Wetland 91This wetland is described by the Lake County ADID study as a cattail marsh and sedgemeadow. This wetland is also in the Middle Fork of the Chicago River watershed. Theprimary functions of this wetland are sediment/toxicant retention and is valued as highquality, diverse plant community. Open water portions of this area provides waterfowlhabitat. The description of this wetland was verified during the field screening that wasconducted. The total wetland size in the vicinity of the project is 49.6 ha (122.5 ac), all ofwhich is considered ADID wetland. The proposed project would unavoidably impactapproximately 0.28 ha (0.7 ac) of this ADID wetland. The wetland in the vicinity of theproposed roadway (94-11) was characterized as a moderate quality forested wetland duringthe field verification. The impacts are as a result of the construction of the mainline roadwayand associated embankment.
The impacts to this wetland as a result of this alternative are approximately 0.6-percent ofthe ADID wetland within the vicinity of the project. This minimal impact would not cause aloss of function for this wetland. This ADID wetland also consists of high quality naturalareas within a larger ADID wetland complex. While impacts to wetland functions would beconsidered minimal, additional minimization and avoidance measures should be developedduring the engineering phase to reduce impacts to high quality areas. The habitat functionthat this wetland provides cannot be easily mitigated and therefore additional measuresmay be required to minimize functional impacts.
D.8.2 ADID Wetland 99—Headwaters of the Middle Fork of the North Branch ofthe Chicago River
This wetland consists primarily of an emergent cattail marsh. ADID sites 97 and 98 are partof this large complex. The primary functions of this wetland are sediment/toxicant retentionand is valued as high quality wildlife habitat with an abundance of potential nesting areasfor birds. The description of this wetland was verified during the field screening that wasconducted. The total wetland size in the vicinity of the project is 3.37 ha (8.32 ac), butextends for long distances outside the study area. Approximately 3.46 ha (8.56 ac) of theoverall wetland complex are considered ADID. The proposed project would unavoidablyimpact approximately 0.01 ha (0.03 ac) of this ADID wetland. The wetland in the vicinity ofthe proposed roadway (94-10) was characterized as a moderate quality forested wetlandduring the field verification. The impacts are as a result of the construction of the mainlineroadway and associated embankment.
The impacts to this wetland as a result of this alternative are approximately 0.3-percent ofthe ADID wetland within the vicinity of the project. This minimal impact would not cause aloss of function for this wetland. However, this ADID wetland consists of high qualitynatural areas within a larger ADID wetland complex. While impacts to wetland functionswould be considered minimal, additional minimization and avoidance measures should bedeveloped during the engineering phase to reduce impacts to high quality areas. The habitatfunction that this wetland provides cannot be easily mitigated and therefore additionalmeasures may be required to minimize functional impacts.

APPENDIX D—ADID WETLANDS
D-9
D.8.3 ADID Wetland 108—Oak GroveThis wetland consists of a sedge meadow and wet mesic prairie communities within theMiddle Fork of the Chicago River watershed. The primary functions of this wetland aresediment/toxicant retention. This wetland is a designated Illinois Natural Areas Inventorysite and contains state threatened or endangered plant species. The description of thiswetland was verified during the field screening that was conducted. The total wetland sizein the vicinity of the project is 9.6 ha (23.6 ac). Approximately 11.7 ha (28.9 ac) of the overallwetland complex are considered ADID. The proposed project would unavoidably impactapproximately 0.4 ha (1.02 ac) of this ADID wetland. The wetland in the vicinity of theproposed roadway (94-9) was characterized as a moderate quality forested wetland duringthe field verification. The impacts are as a result of the construction of the mainline roadwayand associated embankment.
The impacts to this wetland as a result of this alternative are approximately 3.5-percent ofthe ADID wetland within the vicinity of the project. This ADID wetland consists of highquality natural areas within a larger ADID wetland complex. While impacts to wetlandfunctions would be considered minimal, additional minimization and avoidance measuresshould be developed during the engineering phase to reduce impacts to high quality areas.The habitat function that this wetland provides cannot be easily mitigated and thereforeadditional measures may be required to minimize functional impacts.
D.8.4 ADID Wetland 128This wetland is described by the Lake County ADID study as a sedge meadow dominatedby lake sedge (Carex lacustris) and tussock sedge (Carex stricta) and wet prairie dominatedby prairie cordgrass (Spartina pectinata) and big bluestem (Andropogon gerardii). This wetlandis also in the Middle Fork of the Chicago River watershed and is part of a complex thatincludes ADID wetlands 128 through 135 and 145, which includes the Middle Fork Savanna.The primary functions of this wetland are sediment/toxicant retention and is valued as highquality, diverse plant community. The description of this wetland was verified during thefield screening that was conducted. The total wetland size in the vicinity of the project is 42ha (103.7 ac). Approximately 48.3 ha (119.4 ac) of the overall wetland complex areconsidered ADID. The proposed project would unavoidably impact approximately 0.04 ha(0.11 ac) of this ADID wetland. The wetland in the vicinity of the proposed roadway (94-5)was characterized as a moderate quality forested wetland and cattail marsh during the fieldverification. The impacts are as a result of the construction of the mainline roadway andassociated embankment.
The impacts to this wetland as a result of this alternative are approximately 0.09-percent ofthe ADID wetland within the vicinity of the project. This minimal impact would not cause aloss of function for this wetland. This ADID wetland also consists of high quality naturalareas within a larger ADID wetland complex. While impacts to wetland functions would beconsidered minimal, additional minimization and avoidance measures should be developedduring the engineering phase to reduce impacts to high quality areas. The habitat functionthat this wetland provides cannot be easily mitigated and therefore additional measuresmay be required to minimize functional impacts.

APPENDIX E
Summary of Wetland Impact Data
TABLE E-1Wetland Impacts by Quality Class along the IL 83/US 45 with US 12 Alternative within the Fox River Watershed
Wetland Quality Class Impacts
I (High Quality) II III
Road ha ac ha ac ha ac Total ha (ac)
SMR 0 0 0 0 0 0 0 (0)
US 12 0 0 0 0 0.14 0.34 0.14 (0.34)
Rt 120 0 0 0.04 0.09 0.4 0.99 0.44 (1.08)
Rt 83 0 0 0 0 0 0 0(0)
Rt 176 0 0 0 0 0 0 0(0)
Rt 53 0 0 0 0 0 0 0(0)
Rt 21 0 0 0 0 0 0 0(0)
OPR 0 0 0 0 0 0 0(0)
I94 0 0 0 0 0 0 0(0)
Rt 137 0 0 0 0 0 0 0(0)
Rt 60 0 0 0 0 0 0 0(0)
US 45 0 0 0 0 0 0 0(0)
Total 0 0 0.04 0.09 0.54 1.33 0.58 (1.42)

APPENDIX E – SUMMARY OF WETLAND IMPACT DATA BROKEN DOWN BY ALTERNATIVE, ROADWAY SEGMENT, WATERSHED, AND WETLAND QUALITY CLASS
E-2
TABLE E-2Wetland Impacts by Quality Class along the IL 83/US 45 with US 12 Alternative within the Des Plaines River Watershed
Wetland Quality Class Impacts
I (High Quality) II III
Road ha ac ha ac ha ac Total ha (ac)
SMR 0.07 0.17 0.87 2.16 0.55 1.35 1.49 (3.68)
US 12 0 0 0.53 1.32 0.65 1.61 1.18 (2.93)
Rt 120 0.12 0.3 1.34 3.31 2.48 6.14 3.94 (9.75)
Rt 83 0 0 4.39 10.84 2.25 5.56 6.64 (16.4)
Rt 176 0 0 0 0 0.11 0.26 0.11 (0.26)
Rt 53 0 0 1.06 2.61 0.95 2.35 2.01 (4.96)
Rt 21 0.16 0.39 0.39 0.97 0.43 1.07 0.98 (2.43)
OPR 0 0 0 0 0 0 0 (0)
I94 0.3 0.73 5.36 13.25 0.3 0.74 5.96 (14.72)
Rt 137 0 0 0.21 0.53 0.01 0.02 0.22 (0.55)
Rt 60 0.23 0.57 <0.01 <0.01 0.20 0.49 0.43 (1.06)
US 45 0 0 0.01 0.02 <0.01 <0.01 0.01 (0.02)
Total 0.88 2.16 14.16 35.01 7.98 19.59 23.02 (56.76)

APPENDIX E – SUMMARY OF WETLAND IMPACT DATA BROKEN DOWN BY ALTERNATIVE, ROADWAY SEGMENT, WATERSHED, AND WETLAND QUALITY CLASS
E-3
TABLE E-3Wetland Impacts by Quality Class along the IL 83/US 45 with US 12 Alternative within the Lake Michigan Watershed
Wetland Quality Class Impacts
I (High Quality) II III
Road ha ac ha ac ha ac Total ha (ac)
SMR 0 0 0 0 0 0 0 (0)
US 12 0 0 0 0 0 0 0 (0)
Rt 120 0 0 0 0 0 0 0 (0)
Rt 83 0 0 0 0 0 0 0 (0)
Rt 176 0 0 0 0 0 0 0 (0)
Rt 53 0 0 0 0 0 0 0 (0)
Rt 21 0 0 0 0 0 0 0 (0)
OPR 0 0 0 0 0 0 0 (0)
I94 0 0 0 0 0 0 0 (0)
Rt 137 0 0 0 0 0 0 0 (0)
Rt 60 0 0 0 0 0 0 0 (0)
US 45 0 0 0 0 0 0 0 (0)
Total 0 0 0 0 0 0 0 (0)

APPENDIX E – SUMMARY OF WETLAND IMPACT DATA BROKEN DOWN BY ALTERNATIVE, ROADWAY SEGMENT, WATERSHED, AND WETLAND QUALITY CLASS
E-4
TABLE E-4Wetland Impacts by Quality Class along the IL 53 Freeway/Tollway Alternative within the Fox River Watershed
Wetland Quality Class Impacts
I (High Quality) II III
Road ha ac ha Ac ha ac Total ha (ac)
US 12 0 0 0 0 0 0 0 (0)
Rt 120 0 0 2.44 6.02 2.93 7.25 5.37 (13.27)
Rt 83 0 0 0 0 0 0 0 (0)
Rt 176 0 0 0 0 0 0 0 (0)
Rt 53 0 0 0 0 0 0 0 (0)
Rt 21 0 0 0 0 0 0 0 (0)
OPR 0 0 0 0 0 0 0 (0)
I94 0 0 0 0 0 0 0 (0)
US 45 0 0 0 0 0 0 0 (0)
Total 0 0 2.44 6.02 2.93 7.25 5.37 (13.27)
TABLE E-5Wetland Impacts by Quality Class along the IL 53 Freeway/Tollway Alternative within the Des Plaines River Watershed
Wetland Quality Class Impacts
I (High Quality) II III
Road ha ac ha ac ha ac Totalha (ac)
US 12 0 0 0.04 0.11 0.03 0.07 0.07 (0.18)
Rt 120 2.39 5.9 0 0 9.11 22.52 11.50 (28.42)
Rt 83 0 0 2.1 5.2 1.2 3.02 3.30 (8.22)
Rt 176 0 0 0 0 0 0 0 (0)
Rt 53 2.25 5.6 4.4 10.92 6.68 16.52 13.33 (33.04)
Rt 21 0 0 0 0 0 0 0 (0)
OPR 0 0 0 0 0 0 0 (0)
I94 0 0 0.97 2.39 2.4 6.01 3.37 (8.4)
US 45 0 0 0 0 0 0 0 (0)
Total 4.64 11.5 7.51 18.62 19.42 48.14 31.57 (78.26)

APPENDIX E – SUMMARY OF WETLAND IMPACT DATA BROKEN DOWN BY ALTERNATIVE, ROADWAY SEGMENT, WATERSHED, AND WETLAND QUALITY CLASS
E-5
TABLE E-6Wetland Impacts by Quality Class along the IL 53 Freeway/Tollway Alternative within the Lake Michigan Watershed
Wetland Quality Class Impacts
I (High Quality) II III
Road ha ac ha ac ha ac Totalha (ac)
US 12 0 0 0 0 0 0 0 (0)
Rt 120 0 0 0 0 0 0 0 (0)
Rt 83 0 0 0 0 0 0 0 (0)
Rt 176 0 0 0 0 0 0 0 (0)
Rt 53 0 0 0 0 0 0 0 (0)
Rt 21 0 0 0 0 0 0 0 (0)
OPR 0 0 0 0 0 0 0 (0)
I94 0 0 0 0 0 0 0 (0)
US 45 0 0 0 0 0 0 0 (0)
Total 0 0 0 0 0 0 0 (0)

APPENDIX F
Floodplain Crossings and Compensatory andDetention Storage Requirements
TABLE F-1Floodplain Crossings, No-Action Alternative (Baseline)
Watershed/Subwatershed Floodplain Crossing Location/Description
CrossingLength (ft)
ImprovementWidtha (ft)
CrossingType
Quentin Road Improvement, Des Plaines River Watershed
1. Buffalo Creek South Fork Tributary B to Buffalo Creek north ofUS 12 in the Village of Kildeer.
150 36 Transverse
2. Buffalo Creek South Fork Tributary B to Buffalo Creek south ofEast Cuba Road in the Village of Kildeer.
250 36 Transverse
3. Buffalo Creek Buffalo Creek north of East Cuba Road in theVillage of Kildeer.
50 36 Transverse
Lake-Cook Road Improvement, Des Plaines River Watershed
4. Lower DesPlaines River
Des Plaines River floodplain west of IL 21/US 45in unincorporated Lake County.
400 30 Transverse
5.Lower DesPlaines River
Des Plaines River east of IL 21/US 45 inunincorporated Lake County.
700 30 Transverse
I-94 Improvement, Chicago River Watershed
6.West Fork West Fork North Branch Chicago River south ofDuffy Lane in the Village of Bannockburn.
2,000 24 Longitudinal
7.West Fork West Fork North Branch Chicago River south ofIL 22 in the Village of Bannockburn.
2,750 12 Longitudinal
8.West Fork West Fork North Branch Chicago River north of IL22 in the Village of Lincolnshire, the City of LakeForest, and unincorporated Lake County.
5,750 24 Longitudinal
IL 22 (Half Day Road) Improvement, Fox River Watershed
9.Flint Creek Flint Creek east of Kelsey Road in the Village ofLake Barrington.
150 42 Transverse
10.Flint Creek East Tributary Flint Creek floodplain east ofKelsey Road in the Village of Lake Barrington.
200 42 Transverse
11.Flint Creek Honey Lake Drain east of IL 59 in the Village ofNorth Barrington.
150 42 Transverse
IL 22 (Half Day Road) Improvement, Des Plaines River Watershed
12.Indian Creek South Branch Indian Creek east of Quentin Roadin the Village of Kildeer.
200 21 Longitudinal

APPENDIX F— FLOODPLAIN CROSSINGS AND COMPENSATORY AND DETENTION STORAGE REQUIREMENTS
F-2
TABLE F-1Floodplain Crossings, No-Action Alternative (Baseline)
Watershed/Subwatershed Floodplain Crossing Location/Description
CrossingLength (ft)
ImprovementWidtha (ft)
CrossingType
13.Indian Creek South Branch Indian Creek floodplain east ofQuentin Road in the Village of Kildeer.
200 21 Longitudinal
14.Indian Creek Indian Creek east of Krueger Road in the Villageof Kildeer.
700 42 Transverse
15.Indian Creek Tributary to South Branch Indian Creek east ofOld McHenry Road in the Village of Long Grove.
450 42 Transverse
16.Indian Creek South Branch Indian Creek east of IL 83 in theVillage of Long Grove.
250 42 Transverse
17.Indian Creek South Branch Indian Creek floodplain east ofIL 83 in the Village of Long Grove.
300 24 Transverse
18.Indian Creek Indian Creek east of IL 21 in the Village ofLincolnshire.
1,150 42 Transverse
19.Indian Creek Indian Creek floodplain east of IL 21 in the Villageof Lincolnshire.
600 42 Transverse
20.Lower DesPlaines River
Des Plaines River east of IL 21 in the Village ofLincolnshire.
1,650 42 Transverse
IL 22 (Half Day Road) Improvement, Chicago River Watershed
21.West Fork West Fork North Branch Chicago River west ofI-94 in the Village of Lincolnshire.
200 42 Transverse
Buffalo Grove Road Improvement, Des Plaines River Watershed
22.AptakisicCreek
Aptakisic Creek south of Aptakisic Road inunincorporated Lake County.
900 24 Transverse
Busch Road Improvement, Des Plaines River Watershed
23.AptakisicCreek
Aptakisic Creek west of Weiland Road in theVillage of Buffalo Grove.
150 12 Transverse
IL 83/60 Improvement, Des Plaines River Watershed
24.Indian Creek Diamond Lake floodplain south of MidlothianRoad in unincorporated Lake County.
100 30 Transverse
Butterfield Road Improvement, Des Plaines River Watershed
25.Bull Creek Bull Creek floodplain north of IL 176 in the Villageof Libertyville.
350 36 Longitudinal
26.Bull Creek Bull Creek north of IL 176 in the Village of Libertyville. 200 36 Transverse
Peterson Road Improvement, Fox River Watershed
27.Squaw Creek Squaw Creek north of IL 60 in the Village ofRound Lake Park.
600 21 Longitudinal

APPENDIX F— FLOODPLAIN CROSSINGS AND COMPENSATORY AND DETENTION STORAGE REQUIREMENTS
F-3
TABLE F-1Floodplain Crossings, No-Action Alternative (Baseline)
Watershed/Subwatershed Floodplain Crossing Location/Description
CrossingLength (ft)
ImprovementWidtha (ft)
CrossingType
IL 21 Improvement, Des Plaines River Watershed
28.Bull Creek Bull Creek north of IL 137 in unincorporated LakeCounty.
350 24 Transverse
29.Upper DesPlaines River
Belvidere Road Tributary south of US Route 120in the Village of Gurnee.
200 24 Transverse
30.Upper DesPlaines River
Warren Cemetery Tributary south of I-94 in theVillage of Gurnee.
300 24 Transverse
Washington Street Improvement, Des Plaines River Watershed
31.Mill Creek Mill Creek floodplain at IL 83 in unincorporatedLake County.
200 24 Longitudinal
32.Mill Creek Mill Creek floodplain east of Atkinson Road in theVillage of Grayslake.
750 12 Longitudinal
33.Mill Creek Mill Creek west of US 45 in the Village ofGrayslake.
400 24 Transverse
Bradley Road Improvement, Chicago River Watershed
34.Middle Fork Middle Fork North Branch Chicago River east of I-94 in unincorporated Lake County.
1,300 44 Transverse
Martin Luther King Drive (22nd Street) Improvement, Chicago River Watershed
35.Skokie River Skokie River floodplain east of US 41 in the Cityof North Chicago.
800 36 Transverse
Rollins Road Improvement, Des Plaines River Watershed
36.Mill Creek Mill Creek east of Drury Road in unincorporatedLake County.
600 24 Transverse
37.Mill Creek Mill Creek and associated floodplain east of US45 in the Village of Gurnee.
200 24 Transverse
38.Mill Creek Mill Creek and associated floodplain south ofIL 132 in the Village of Gurnee.
200 60 Transverse
a The improvement width is equal to the proposed roadway width minus the existing roadway width.

APPENDIX F— FLOODPLAIN CROSSINGS AND COMPENSATORY AND DETENTION STORAGE REQUIREMENTS
F-4
TABLE F-2Additional Impervious Area, No-Action Alternative (Baseline)
Mainline Routes of BaselineImprovements
ExistingPaved Area (ft2)
ProposedPaved Area (ft2)
Additional ImperviousArea (ft2)
Lake-Cook Road 1,299,000 1,948,000 649,000
IL 22 2,572,000 7,074,000 4,502,000
I-94 1,178,000 1,964,000 786,000
Quentin Road 817,000 1,682,000 865,000
Busch Road 165,000 247,000 82,000
Buffalo Grove Road 304,000 608,000 304,000
Weiland Road NA a 253,000 253,000
IL 60/IL 83 608,000 1,115,000 507,000
Butterfield Road 494,000 1,236,000 742,000
US 45 760,000 2,281,000 1,521,000
Peterson Road 482,000 1,366,000 884,000
Midlothian Road NA a 256,000 256,000
IL 21 1,090,000 1,635,000 545,000
Bradley Road NA a 302,000 302,000
Martin Luther King Drive 178,000 444,000 266,000
Washington Street 1,046,000 1,743,000 697,000
Hunt Club Road 203,000 507,000 304,000
Casmir Pulaski Road NA a 232,000 232,000
Rollins Road 589,000 1,188,000 599,000
Sunset Avenue 139,000 348,000 209,000
TOTAL ADDITIONAL IMPERVIOUS AREA 14,505,000 ft2 (333.0 ac)
a These improvements are along new alignment so these is no existing paved area.

APPENDIX F— FLOODPLAIN CROSSINGS AND COMPENSATORY AND DETENTION STORAGE REQUIREMENTS
F-5
TABLE F-3Compensatory and Detention Storage Requirements, No-Action Alternative (Baseline)
Watershed/Subwatershed
Roadway ImprovementLength (mi)
Compensatory StorageRequired (ac)
Detention StorageRequired (ac)
Fox River Watershed
Squaw Creek 0.93 0.3 0.4
Flint Creek 7.00 2.0 3.2
Des Plaines River Watershed
Buffalo Creek 6.60 1.9 3.0
Bull Creek 8.78 2.5 4.0
Indian Creek 13.13 3.7 5.9
Mill Creek 10.43 2.9 4.7
Upper Des Plaines River 8.91 2.5 4.0
Lower Des Plaines River 3.89 1.1 1.8
Aptakisic Creek 5.50 1.5 2.5
Chicago River Watershed
Skokie River 1.40 0.4 0.6
Middle Fork 4.64 1.3 2.1
West Fork 6.94 1.9 3.1
TOTAL 78.15 22.0 35.3

APPENDIX F— FLOODPLAIN CROSSINGS AND COMPENSATORY AND DETENTION STORAGE REQUIREMENTS
F-6
TABLE F-4Storage Requirements Per Reach, No-Action Alternative (Baseline)
ReachNumber/Location
RoadwayImprovementLength (mi)
CompensatoryStorage
Required (ac)
DetentionStorage
Required (ac)Opportunities/Constraints
for Providing Storage
1 3.10 0.9 1.4 Potential storage site along IL 22 west of Barrington Rd.
2 2.20 0.6 1.0 Potential storage site along IL 22 east of Barrington Rd.
3 1.70 0.5 0.8 Potential storage site along IL 22 east of Lake Zurich atBuesching Rd.
4 2.60 0.7 1.2 Potential storage site along IL 22 west of Quentin Rdand along Quentin south of IL 22.
5 2.00 0.6 0.9 Potential storage site near Buffalo Creek at Quentin Rdand north of US 12.
6 2.40 0.7 1.1 Potential storage site near Buffalo Creek Tributary south ofLake-Cook Rd and north of Lake-Cook Rd east of QuentinRd.
7 3.50 1.0 1.6 Potential storage sites along IL 22 east of Krueger Rdand east of IL 83.
8 3.00 0.8 1.4 Potential storage site along Butterfield Rd south ofAptakisic Rd.
9 2.70 0.8 1.2 Potential storage site near Aptakisic Creek south ofBusch Rd.
10 3.70 1.0 1.7 Potential storage sites along IL 22 east of IL 21 near theDes Plaines River.
11 3.00 0.8 1.4 Potential storage site along IL 22 east of I-94.
12 2.80 0.8 1.3 Potential storage sites along I-94 south of IL 60.
13 3.40 1.0 1.5 Potential storage site along I-94 south of IL 22 near theWest Fork North Branch Chicago River.
14 2.10 0.6 1.0 Potential storage site along Lake-Cook Rd east of IL 21near the Des Plaines River.
15 2.00 0.6 0.9 Potential storage site along Lake-Cook Rd west of IL 21.
16 2.00 0.6 0.9 Potential storage site along Butterfield Rd north of IL 60.
17 3.20 0.9 1.4 Potential storage site along IL 60/83 south of IL 176 andnear Diamond Lake.
18 2.50 0.7 1.1 Potential storage site along Peterson Rd at Alleghany Rd.
19 2.40 0.7 1.1 Potential storage site along the Midlothian Rd extensionwest of Harris Rd.
20 2.20 0.6 1.0 Potential storage site along US 45 south of Peterson Rd.
21 1.90 0.5 0.9 Potential storage site east of Butterfield Rd near ButlerLake.
22 2.30 0.6 1.0 Potential storage site along US 45 south of IL 120.

APPENDIX F— FLOODPLAIN CROSSINGS AND COMPENSATORY AND DETENTION STORAGE REQUIREMENTS
F-7
TABLE F-4Storage Requirements Per Reach, No-Action Alternative (Baseline)
ReachNumber/Location
RoadwayImprovementLength (mi)
CompensatoryStorage
Required (ac)
DetentionStorage
Required (ac)Opportunities/Constraints
for Providing Storage
23 4.40 1.2 2.0 Potential storage sites along Washington St near ThirdLake, and along US Route 45 near Gages Lake.
24 4.20 1.2 1.9 Potential storage sites south of Washington St west of I-94.
25 4.30 1.2 1.9 Potential storage site along IL 21 south of IL 120 nearthe Des Plaines River.
26 1.30 0.4 0.6 Potential storage site north of Bradley Rd near I-94.
27 1.40 0.4 0.6 Potential storage site along Martin Luther King Driveeast of IL 43.
28 1.00 0.3 0.5 Potential storage site along Casmir Pulaski Rd east of IL 43.
29 1.10 0.3 0.5 Potential storage site along Sunset Ave east of US 41.
30 3.75 1.1 1.7 Potential storage site along Rollins Rd east of IL 83near Fourth Lake.
TOTAL 78.15 22.0 35.5

APPENDIX F— FLOODPLAIN CROSSINGS AND COMPENSATORY AND DETENTION STORAGE REQUIREMENTS
F-8
TABLE F-5Floodplain Crossings, IL 53 Freeway/Tollway Alternative
Watershed/Subwatershed Floodplain Crossing Location/Description
CrossingLength (ft)
ImprovementWidth a (ft)
CrossingType
Proposed IL 53 Mainline, Des Plaines River Watershed
1. Buffalo Creek Buffalo Creek south of Cuba Road in the Villageof Long Grove.
350 168 Transverse
2. Indian Creek South Branch of Indian Creek floodplain east of aprivate road south of IL 22 in the Village ofKildeer.
150 168 Transverse
3. Indian Creek South Branch of Indian Creek floodplain at aprivate road south of IL 22 in the Village ofKildeer.
150 168 Transverse
4. Indian Creek Forest Lake Drain south of Gilmer Road inunincorporated Lake County.
900 168 Transverse
5. Indian Creek Indian Creek north of Gilmer Road inunincorporated Lake County.
750 168 Transverse
6. Indian Creek SMC floodplain area south of Indian Creek Roadin the Village of Long Grove.
50 168 Transverse
7. Indian Creek Seavey Drainage Ditch south of IL 176 in theVillage of Mundelein.
100 168 Transverse
8. Bull Creek Bull Creek south of proposed Peterson Roadinterchange in unincorporated Lake County.
50 168 Transverse
Proposed IL 120 Mainline, Fox River Watershed
9. Squaw Creek SMC floodplain area west of the proposedFairfield Road interchange in unincorporated LakeCounty.
600 168 Transverse
10. Squaw Creek Squaw Creek west of the proposed AlleghanyRoad interchange in the Village of Hainesville andunincorporated Lake County.
4,550 168 Transverse
Proposed IL 120 Mainline, Des Plaines River Watershed
11. Mill Creek Mill Creek east of the proposed Alleghany Roadinterchange in the Village of Grays Lake.
200 168 Transverse
12. Mill Creek Mill Creek floodplain east of the proposedAlleghany Road interchange in the Village ofGrays Lake.
50 168 Transverse
a The improvement width of the typical cross section is assumed to be 168 feet, as depicted on Table F–2.

APPENDIX F— FLOODPLAIN CROSSINGS AND COMPENSATORY AND DETENTION STORAGE REQUIREMENTS
F-9
TABLE F-6Historic Flooding Locations, IL 53 Freeway/Tollway Alternative—Proposed IL 53 Mainline, Des Plaines River Watershed
Watershed/Subwatershed Floodplain Crossing Location Flooding History
ImprovementDescription
Buffalo Creek Buffalo Creek located southof Cuba Road.
In the Village of Long Grove, BuffaloCreek flooded in 1957 and reached anelevation of 722 feet at McHenry Road.
Proposed IL 53mainline, 6-laneimprovement.
Indian Creek South Branch Indian Creeklocated east of a private roadsouth of IL 22.
In the Village of Kildeer, South BranchIndian Creek flooded in March 1960 andApril 1965.
Proposed IL 53mainline, 6-laneimprovement.
Indian Creek South Branch Indian Creeklocated at a private roadsouth of IL 22.
In the Village of Kildeer, South BranchIndian Creek flooded in March 1960 andApril 1965.
Proposed IL 53mainline, 6-laneimprovement.
TABLE F-7Additional Impervious Area, IL 53 Freeway/Tollway Alternative
Mainline Routes andAssociated Feeder Roads
ExistingPaved Area (ft2)
ProposedPaved Area (ft2)
Additional ImperviousArea (ft2)
IL 120 Existing Mainline 1,906,000 4,103,000 2,197,000
IL 120 Proposed Mainline NA a 4,383,000 4,383,000
IL 120 Feeder Roads 398,000 941,000 543,000
IL 120 Interchanges 240,000 1,562,000 1,322,000
IL 53 Proposed Mainline NA a 9,472,000 9,472,000
IL 53 Feeder Roads 380,000 934,000 554,000
IL 53 Interchanges 160,000 888,000 728,000
TOTAL ADDITIONAL IMPERVIOUS AREA 19,199,000 (440.7 ac)
a These improvements are along new alignment so these is no existing paved area.
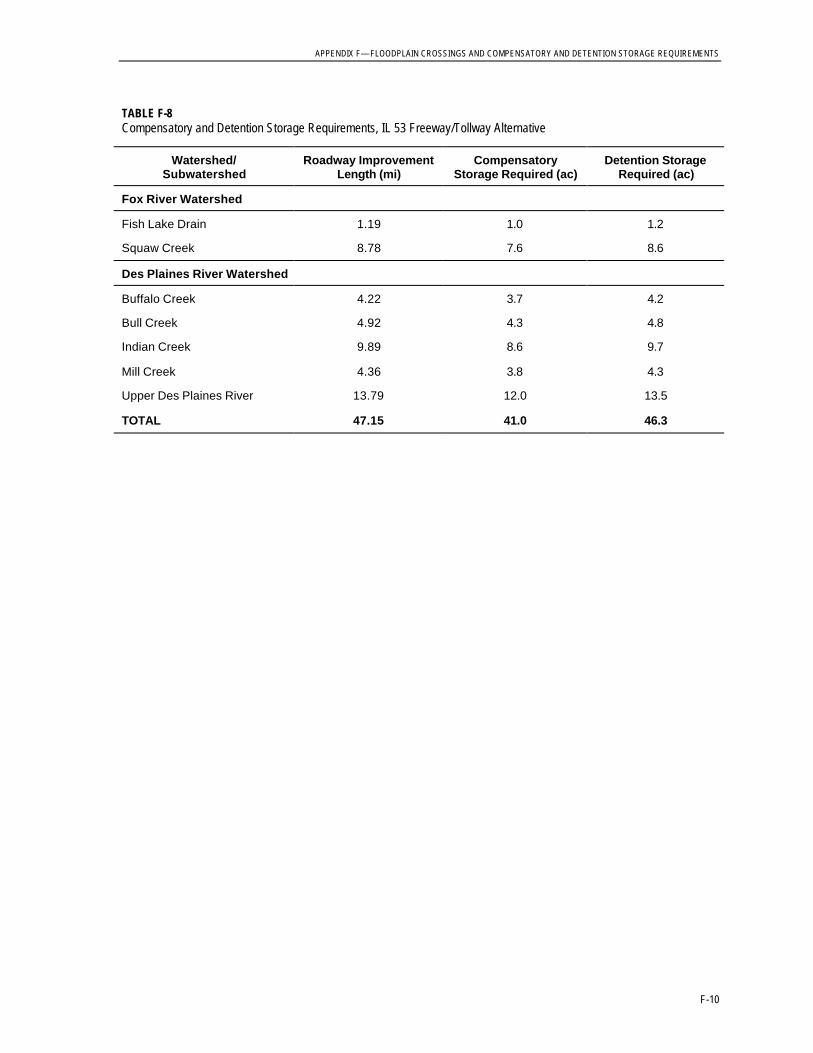
APPENDIX F— FLOODPLAIN CROSSINGS AND COMPENSATORY AND DETENTION STORAGE REQUIREMENTS
F-10
TABLE F-8Compensatory and Detention Storage Requirements, IL 53 Freeway/Tollway Alternative
Watershed/Subwatershed
Roadway ImprovementLength (mi)
CompensatoryStorage Required (ac)
Detention StorageRequired (ac)
Fox River Watershed
Fish Lake Drain 1.19 1.0 1.2
Squaw Creek 8.78 7.6 8.6
Des Plaines River Watershed
Buffalo Creek 4.22 3.7 4.2
Bull Creek 4.92 4.3 4.8
Indian Creek 9.89 8.6 9.7
Mill Creek 4.36 3.8 4.3
Upper Des Plaines River 13.79 12.0 13.5
TOTAL 47.15 41.0 46.3

APPENDIX F— FLOODPLAIN CROSSINGS AND COMPENSATORY AND DETENTION STORAGE REQUIREMENTS
F-11
TABLE F-9Storage Requirements Per Reach, IL 53 Freeway/Tollway Alternative
ReachNumber/
Location a
RoadwayImprovementLength (mi)
CompensatoryStorage
Required (ac)
DetentionStorage
Required (ac)Opportunities/Constraints
for Providing Storage
1 1.19 1.0 1.2 Potential storage site along IL 120 east of US 12.
2 4.75 4.1 4.7 Potential storage site along IL 120 east of Fairfield Rd.
3 4.03 3.5 4.0 Potential storage site south of IL 120 near SquawCreek.
4 4.36 3.8 4.3 Potential storage site south along IL 120 at Alleghany Rd.
5 9.41 8.2 9.2 Potential storage site along IL 120 east of IL 21 at theDes Plaines River.
6 4.38 3.8 4.3 Potential storage sites along IL 120 west of WaukeganRoad, and along I-94 south of IL 21.
7 4.92 4.3 4.8 Potential storage sites along IL 53 east of IL 83 andsouth of IL 176.
8 6.18 5.4 6.1 Potential storage site along IL 53 north of Gilmer Rd.
9 4.22 3.7 4.1 Potential storage sites along IL 53 north of DundeeRd/IL 68 and north of Lake-Cook Rd.
10 3.71 3.2 3.6 Potential storage site along IL 53 south of IL 22.
TOTAL 47.15 41.0 46.3
a Reaches 1, 2, 5 and 6 include improvements to IL 120; Reaches 3, 4, 7, 8, 9, and 10 include improvements toIL 53.

APPENDIX F— FLOODPLAIN CROSSINGS AND COMPENSATORY AND DETENTION STORAGE REQUIREMENTS
F-12
TABLE F-10Floodplain Crossings, IL 83/US 45 with US 12 Alternative
Watershed/Subwatershed Floodplain Crossing Location/Description
CrossingLength (ft)
ImprovementWidtha (ft) Crossing Type
IL 83/US 45 Mainline, Des Plaines River Watershed
1. Buffalo Creek Buffalo Creek west of IL 83 in the Village of LongGrove.
350 48 Transverse
2. Indian Creek South Branch of Indian Creek at Oak Grove Roadsouth of IL 22 in the Village of Long Grove.
250 10 Transverse
3. Indian Creek Indian Creek north of Gilmer Road inunincorporated Lake County.
2,500 40 Transverse
4. Indian Creek Diamond Lake Drain south of US 45 in theVillages of Long Grove and Vernon Hills.
150 40 Transverse
5. Indian Creek Seavey Drainage Ditch south of IL 176 in theVillage of Mundelein.
100 88 Transverse
6. Bull Creek Bull Creek south of the proposed Peterson Roadinterchange in unincorporated Lake County.
50 88 Transverse
IL 83/US 45 Feeder Roads, Des Plaines River Watershed
7. Indian Creek IL 60 – Diamond Lake Drain east of US 45 in theVillage of Mundelein.
100 40 Transverse
8. Indian Creek Midlothian Road – Indian Creek west of IL 83 inthe Village of Long Grove and unincorporatedLake County.
50 24 Transverse
IL 83/US 45 Interchanges, Des Plaines River Watershed
9. Indian Creek Des Plaines River floodplain northwest of proposedIL 83/IL 22 interchange in the Village of Long Grove.
250 32 Longitudinal
IL 21 Mainline, Des Plaines River Watershed
10. AptakisicCreek
Aptakisic Creek south of Deerfield Road inunincorporated Lake County.
200 16 Transverse
11. Lower DesPlaines River
Des Plaines River floodplain at Deerfield Road inthe Village of Buffalo Grove and unincorporatedLake County.
850 16 Longitudinal
12. Lower DesPlaines River
Des Plaines River floodplain north of DeerfieldRoad in the Village of Buffalo Grove andunincorporated Lake County.
2,100 16 Longitudinal
13. Indian Creek Des Plaines River floodplain south of IL 22 in theVillage of Lincolnshire.
450 16 Longitudinal
14. Indian Creek Indian Creek south of IL 22 in the Village ofLincolnshire.
150 16 Transverse
15. Lower DesPlaines River
Des Plaines River floodplain north of IL 22 in theVillage of Vernon Hills.
100 8 Longitudinal
16. Lower DesPlaines River
IL 60 – Des Plaines River floodplain east of IL 21in the Village of Vernon Hills and unincorporatedLake County.
1,850 40 Transverse

APPENDIX F— FLOODPLAIN CROSSINGS AND COMPENSATORY AND DETENTION STORAGE REQUIREMENTS
F-13
TABLE F-10Floodplain Crossings, IL 83/US 45 with US 12 Alternative
Watershed/Subwatershed Floodplain Crossing Location/Description
CrossingLength (ft)
ImprovementWidtha (ft) Crossing Type
17. Lower DesPlaines River
St. Mary’s Road – Unnamed creek floodplainnorth of IL 60 in unincorporated Lake County.
300 48 Transverse
18. Upper DesPlaines River
IL 137 – Des Plaines River east of IL 21 inunincorporated Lake County.
1,850 40 Transverse
19. Upper DesPlaines River
IL 137 – Tributary No. 1 east of IL 21 inunincorporated Lake County.
750 40 Transverse
20. Upper DesPlaines River
IL 137 – Tributary No. 1 floodplain west of St.Mary’s Road in unincorporated Lake County.
700 20 Longitudinal
21. Bull Creek Bull Creek north of IL 137 in unincorporated LakeCounty.
350 40 Transverse
22. Upper DesPlaines River
Belvidere Road Tributary south of US Route 120in the Village of Gurnee.
200 48 Transverse
23. Upper DesPlaines River
Warren Cemetery Tributary south of I-94 in theVillage of Gurnee.
300 48 Transverse
24. Upper DesPlaines River
Des Plaines River floodplain south of IL 132 in theVillage of Gurnee.
100 20 Longitudinal
IL 21 Feeder Roads, Des Plaines River Watershed
25. Indian Creek IL 60 – Seavey Drainage Ditch floodplain west ofIL 21 in the Village of Vernon Hills.
300 24 Transverse
26. Indian Creek IL 60 – Seavey Drainage Ditch floodplain west ofIL 21 in the Village of Vernon Hills.
2,200 12 Longitudinal
27. Indian Creek US Route 45 – Indian Creek floodplain west of IL21 in the Village of Vernon Hills.
250 12 Longitudinal
I-94 Mainline, Chicago River Watershed
28. Middle Fork Middle Fork North Branch of the Chicago Riverfloodplain south of IL 137 in unincorporated LakeCounty.
6,550 12 Longitudinal
29. Middle Fork Middle Fork North Branch of the Chicago Riverfloodplain north of IL 137 in unincorporated LakeCounty.
50 12 Longitudinal
30. Upper DesPlaines River
Des Plaines River east of IL 21 in unincorporatedLake County.
1,150 24 Transverse
31. Upper DesPlaines River
Warren Cemetery Tributary floodplain north of IL21 in unincorporated Lake County.
450 12 Longitudinal
a The improvement width is equal to the proposed roadway width minus the existing roadway width.

APPENDIX F— FLOODPLAIN CROSSINGS AND COMPENSATORY AND DETENTION STORAGE REQUIREMENTS
F-14
TABLE F-11Historic Flooding Locations, IL 83/US 45 with US 12 Alternative
Watershed/Subwatershed Floodplain Crossing Location Flooding History
ImprovementDescription
IL 83/US 45 Mainline, Des Plaines River Watershed
Buffalo Creek Buffalo Creek flood-plainlocated west of IL 83.
In the Village of Long Grove, Buffalo Creekreached an elevation of 722 feet atMcHenry Road in 1957.
Proposed IL 83/US45 mainline, 6-laneimprovement.
Indian Creek South Branch Indian Creeklocated south of IL 22.
In the Village of Long Grove, South BranchIndian Creek reached an elevation of 697feet near IL 83 in 1960.
Proposed IL 83/US45 mainline, 6-laneimprovement.
Indian Creek Indian Creek located north ofGilmer Road.
In areas of unincorporated Lake County,Indian Creek reached an elevation of 808feet in March 1960 and 805.2 feet in April1965.
Proposed IL 83/US45 mainline, 6-laneimprovement.
IL 83/US 45 Feeder Roads, Des Plaines River Watershed
Indian Creek Indian Creek located west ofIL 83.
In the Village of Long Grove, Indian Creekreached an elevation of 700 feet at IL 83 in1960.
Proposed MidlothianRoad/IL 63 4-laneimprovement.
IL 21 Mainline, Des Plaines River Watershed
Lower DesPlaines River
Des Plaines River located atDeerfield Road.
In the Village of Riverwoods, the Des PlainesRiver flooded in the following years: 1938,1948, 1950, 1960, and 1970.
Proposed IL 21mainline, 6-laneimprovement.
Lower DesPlaines River
Des Plaines River locatednorth of Deerfield Road.
In the Village of Riverwoods, the Des PlainesRiver flooded in the following years: 1938,1948, 1950, 1960, and 1970.
Proposed IL 21mainline, 6-laneimprovement.
Indian Creek Des Plaines River locatedsouth of IL 22.
In the Village of Lincolnshire, the DesPlaines River flooded on the followingdates: July 1938, March 1948, April 1950,April 1960, March 1962, June 1970, andMarch 1976.
Proposed IL 21mainline, 6-laneimprovement.
Indian Creek Indian Creek located south ofIL 22.
In the Village of Lincolnshire, Indian Creekreached an elevation of 697 feet in July1957.
Proposed IL 21mainline, 6-laneimprovement.
Lower DesPlaines River
Des Plaines River locatedeast of IL 21.
In areas of unincorporated Lake County, theDes Plaines River reached an elevation of650.2 feet in 1938, 647.5 feet in 1950, and649.8 feet in 1960.
Proposed Town LineRoad/IL 60, 6-laneimprovement.
Upper DesPlaines River
Des Plaines River locatedsouth of IL 132.
In the Village of Gurnee, the Des Plaines Riverreached an elevation of 661.9 feet in 1938,660.9 feet in 1960, and 660.14 feet in 1976.
Proposed IL 21mainline, 6-laneimprovement.
IL 21 Feeder Roads, Des Plaines River Watershed
Indian Creek Seavey Drainage Ditchlocated west of IL 21.
In the Village of Vernon Hills, SeaveyDrainage Ditch flooded in July 1957, to anelevation of 684.5 feet at Town Line Road,and in April 1960.
Proposed Town LineRoad/IL 60, 6-laneimprovement.
I-94 Mainline, Chicago River Watershed
Upper DesPlaines River
Des Plaines River locatedeast of IL 21.
In areas of unincorporated Lake County, theDes Plaines River reached an elevation of664.8 feet in 1960 and 664.0 feet in 1962.
Proposed I-94mainline, 8-laneimprovement.

APPENDIX F— FLOODPLAIN CROSSINGS AND COMPENSATORY AND DETENTION STORAGE REQUIREMENTS
F-15
TABLE F-12Additional Impervious Area, IL 83/US 45 with US 12 Alternate
Mainline Routes andAssociated Feeder Roads
ExistingPaved Area (ft2)
ProposedPaved Area (ft2)
Additional ImperviousArea (ft2)
US 12 Mainline 3,492,000 5,949,000 2,457,000
US 12 Feeder Roads 192,000 288,000 96,000
IL 21 Mainline 5,274,000 9,831,000 4,557,000
IL 21 Feeder Roads 408,000 595,000 187,000
IL 83/US 45 Mainline 2,649,000 9,307,000 6,658,000
IL 83/US 45 Feeder Roads 450,000 955,000 505,000
IL 83/IL 22 Interchange NA a 512,000 512,000
IL 120 Mainline 972,000 2,061,000 1,089,000
IL 120 Feeder Roads 131,000 270,000 139,000
I-94 Mainline 4,003,000 5,338,000 1,335,000
I-94 Feeder Roads 48,000 72,000 24,000
TOTAL ADDITIONAL IMPERVIOUS AREA 17,559,000 (403.1 ac)
a These improvements are along new alignment so these is no existing paved area.

APPENDIX F— FLOODPLAIN CROSSINGS AND COMPENSATORY AND DETENTION STORAGE REQUIREMENTS
F-16
TABLE F-13Compensatory and Detention Storage Requirements, IL 83/US 45 with US 12 Alternative
Watershed/Subwatershed
Distance(mi)
CompensatoryStorage Required (ac)
Detention StorageRequired (ac)
Fox River Watershed
Flint Creek 4.40 1.2 2.7
Slocum Lake Drain 2.00 0.5 1.2
Squaw Creek 1.00 0.3 0.6
Tower Lake Drain 2.00 0.5 1.2
Des Plaines River Watershed
Buffalo Creek 10.78 2.8 6.6
Bull Creek 2.88 0.8 1.8
Indian Creek 8.57 2.2 5.2
Mill Creek 5.99 1.6 3.6
Lower Des Plaines River 10.62 2.8 6.4
Upper Des Plaines River 13.91 3.6 8.4
Chicago River Watershed
Middle Fork 7.65 2.0 4.6
TOTAL 69.80 18.3 42.3
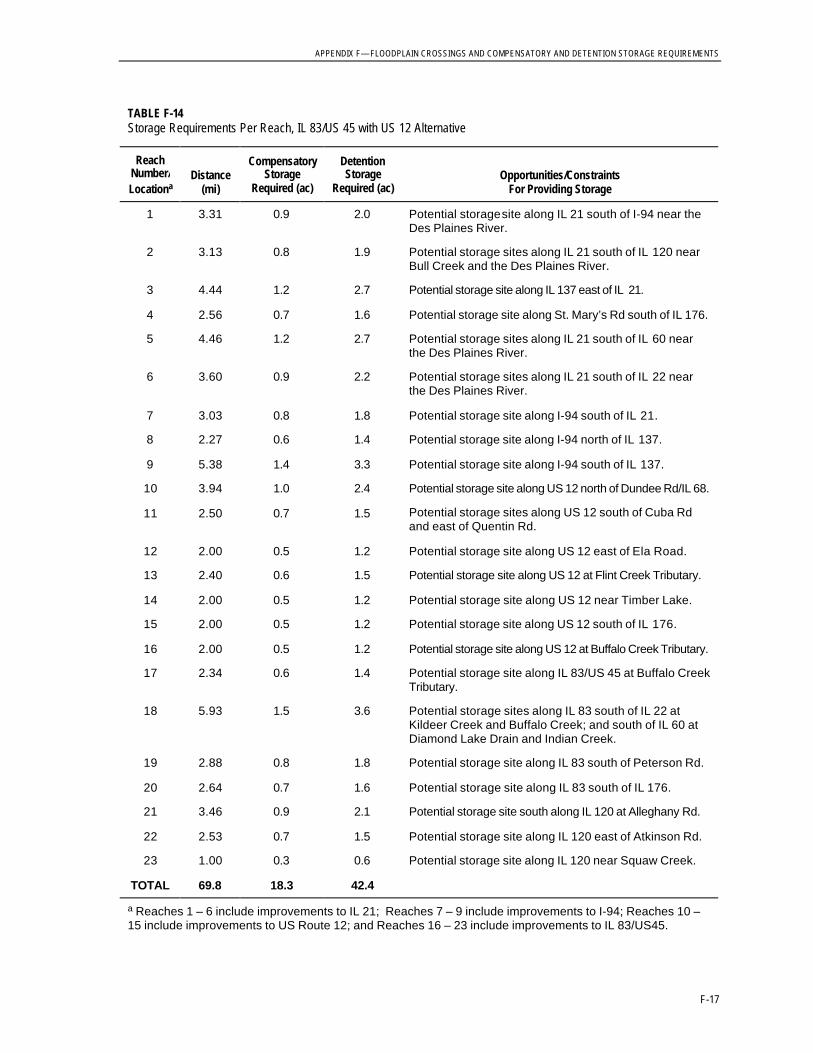
APPENDIX F— FLOODPLAIN CROSSINGS AND COMPENSATORY AND DETENTION STORAGE REQUIREMENTS
F-17
TABLE F-14Storage Requirements Per Reach, IL 83/US 45 with US 12 Alternative
ReachNumber/Locationa
Distance(mi)
CompensatoryStorage
Required (ac)
DetentionStorage
Required (ac)Opportunities/Constraints
For Providing Storage
1 3.31 0.9 2.0 Potential storage site along IL 21 south of I-94 near theDes Plaines River.
2 3.13 0.8 1.9 Potential storage sites along IL 21 south of IL 120 nearBull Creek and the Des Plaines River.
3 4.44 1.2 2.7 Potential storage site along IL 137 east of IL 21.
4 2.56 0.7 1.6 Potential storage site along St. Mary’s Rd south of IL 176.
5 4.46 1.2 2.7 Potential storage sites along IL 21 south of IL 60 nearthe Des Plaines River.
6 3.60 0.9 2.2 Potential storage sites along IL 21 south of IL 22 nearthe Des Plaines River.
7 3.03 0.8 1.8 Potential storage site along I-94 south of IL 21.
8 2.27 0.6 1.4 Potential storage site along I-94 north of IL 137.
9 5.38 1.4 3.3 Potential storage site along I-94 south of IL 137.
10 3.94 1.0 2.4 Potential storage site along US 12 north of Dundee Rd/IL 68.
11 2.50 0.7 1.5 Potential storage sites along US 12 south of Cuba Rdand east of Quentin Rd.
12 2.00 0.5 1.2 Potential storage site along US 12 east of Ela Road.
13 2.40 0.6 1.5 Potential storage site along US 12 at Flint Creek Tributary.
14 2.00 0.5 1.2 Potential storage site along US 12 near Timber Lake.
15 2.00 0.5 1.2 Potential storage site along US 12 south of IL 176.
16 2.00 0.5 1.2 Potential storage site along US 12 at Buffalo Creek Tributary.
17 2.34 0.6 1.4 Potential storage site along IL 83/US 45 at Buffalo CreekTributary.
18 5.93 1.5 3.6 Potential storage sites along IL 83 south of IL 22 atKildeer Creek and Buffalo Creek; and south of IL 60 atDiamond Lake Drain and Indian Creek.
19 2.88 0.8 1.8 Potential storage site along IL 83 south of Peterson Rd.
20 2.64 0.7 1.6 Potential storage site along IL 83 south of IL 176.
21 3.46 0.9 2.1 Potential storage site south along IL 120 at Alleghany Rd.
22 2.53 0.7 1.5 Potential storage site along IL 120 east of Atkinson Rd.
23 1.00 0.3 0.6 Potential storage site along IL 120 near Squaw Creek.
TOTAL 69.8 18.3 42.4
a Reaches 1 – 6 include improvements to IL 21; Reaches 7 – 9 include improvements to I-94; Reaches 10 –15 include improvements to US Route 12; and Reaches 16 – 23 include improvements to IL 83/US45.


Lake CountyTRANSPORTATION
IMPROVEMENT
P r o j e c t NEWSVOLUME 1 NUMBER 3 FALL 1999
NEWSN E W SNEWS
Lake CountyTRANSPORTATION
IMPROVEMENT
P r o j e c t
The Lake County
Transportation
Improvement Project
(LCTIP) is jointly sponsored
by the Illinois Department of
Transportation and the Illinois
State Toll Highway Authority.
IN THIS ISSUE:
◗ LCTIP Develops
Wide Range of
Potential Solutions
◗ What’s The Next
Step in The Process?
◗ Other Proposals
◗ Public Meeting #1
Questions and
Comments
PUBLISHED BY:
The Lake County Transportation Improvement Project (LCTIP) has achieved another
project milestone—development of the initial roadway and transit improvements. The
nine roadway improvement packages and the set of rail and bus improvements establish
the range of upgrades to be considered by the LCTIP for evaluation. These improve-
ments were developed based on a comprehensive evaluation of the transportation needs
in Lake County conducted earlier this year.
The LCTIP worked closely with Metra, Pace and RTA staff to develop transit proposals
that represent reasonable projects for Lake County (see Figures 1-3). The types of
improvements identified for consideration for the rail system include commuter rail
service expansions, signal improvements, and consolidation of freight service.
Improvements for bus service include express services and corridors for additional service.
The proposals also include improvements that provide better links between modes. These
improvements represent opportunities to enhance transit as part of an overall solution.
LCTIP DEVELOPS WIDE RANGE
OF POTENTIAL SOLUTIONS
FIGURE 2. POTENTIAL EXPRESS
SERVICES AND TRANSFER CENTERS
FIGURE 3. CORRIDORS FOR ADDITIONAL
BUS SERVICE
FIGURE 1. POTENTIAL RAIL
IMPROVEMENTS
REMINDER:Our Baseline Improve-ments include improvements expectedto be built by 2020.Already, 46 miles (ofthe total 74 miles) of expected roadwayimprovements areeither under construc-tion or funded in thenext 5 years.
POTENTIAL RAIL IMPROVEMENTS LEGEND
Signal Improvements
Consolidation of Freight Service
New Commuter Rail Services
Rail Line TransfersXBaseline Improvements
Express Services
Baseline Improvements
POTENTIAL EXPRESS SERVICES AND
TRANSFER CENTERS LEGEND
Transfer Centers
...continued on page 4
LC Nwslter-fall_FINAL.qxd 12/3/99 12:47 PM Page 1

VOLUME 1 NUMBER 3 FALL 1999
MAP LEGEND FOR ROAD IMPROVEMENTS Proposed Improvements Baseline Improvements Bypass Consideration
FIGURE 9. IL 53 SET OF IMPROVEMENTS (ARTERIAL)FIGURE 8. IL 53 SET OF IMPROVEMENTS (TOLLWAY)
FIGURE 7. IL 53 SET OF IMPROVEMENTS (FREEWAY)
FIGURE 4. I-94 SET OF IMPROVEMENTS FIGURE 5. IL 83/US 45 SET OF IMPROVEMENTS
(WITH US 12)
FIGURE 6. IL 83/US 45 SET OF IMPROVEMENTS
(WITH IL 120 BYPASS)
LC Nwslter-fall_FINAL.qxd 12/3/99 12:47 PM Page 2
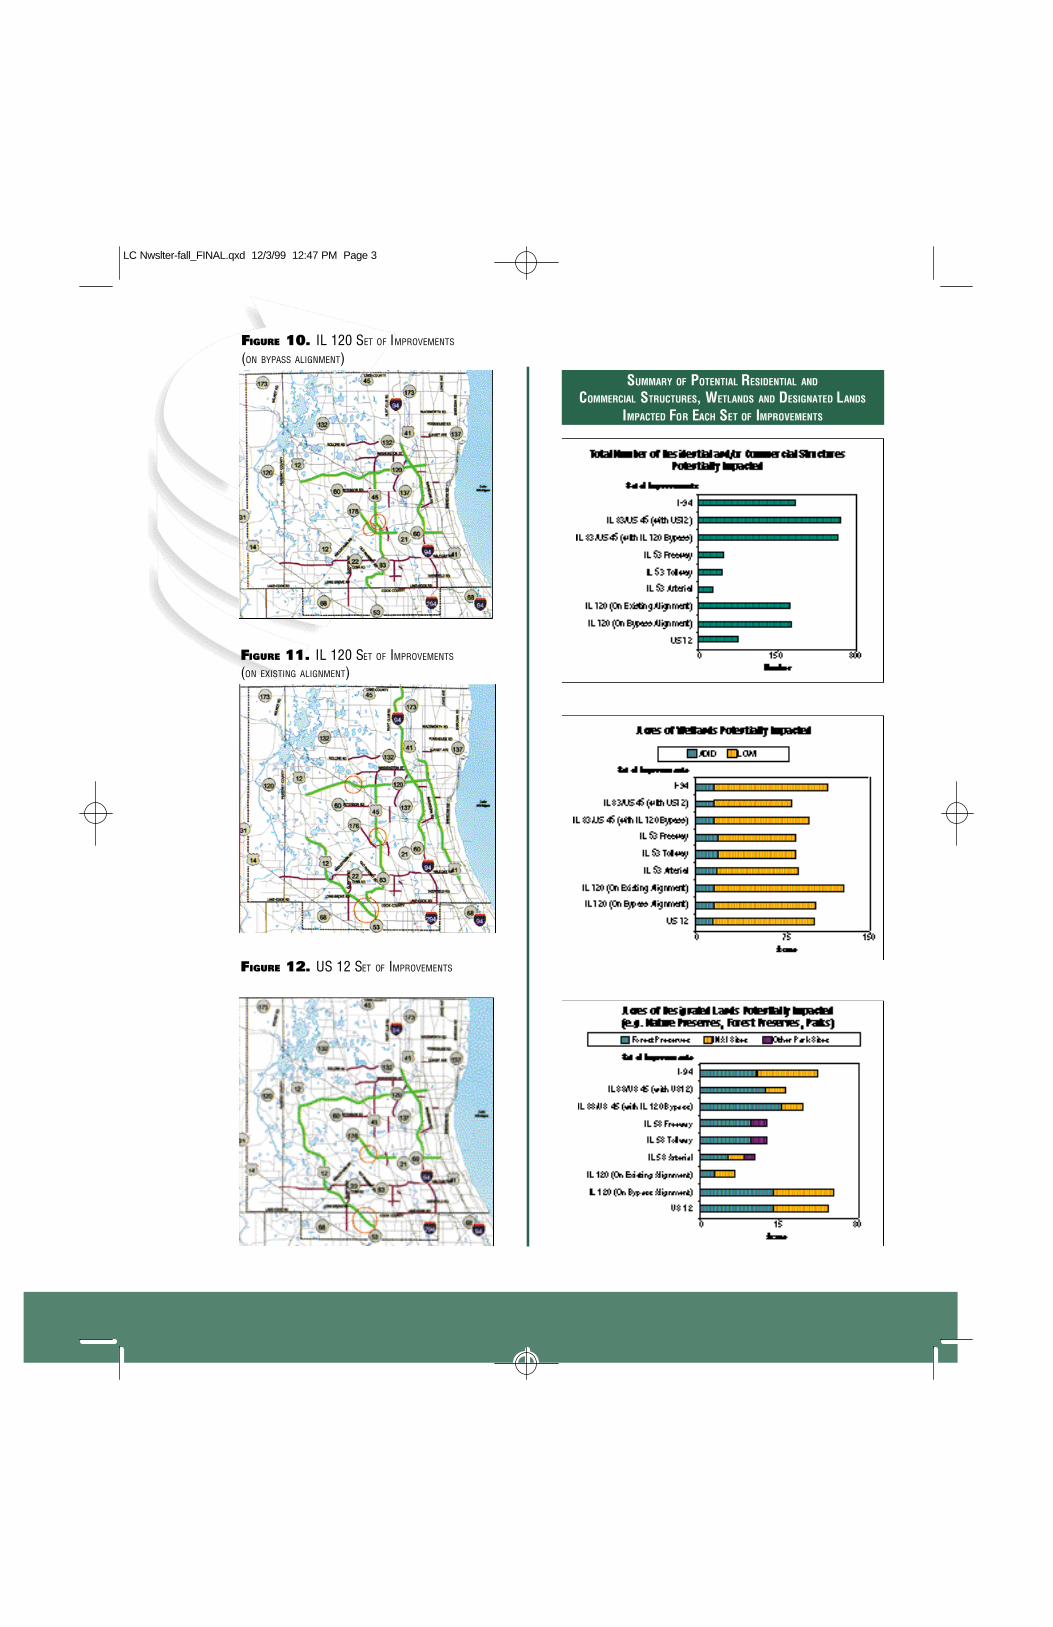
FIGURE 12. US 12 SET OF IMPROVEMENTS
FIGURE 11. IL 120 SET OF IMPROVEMENTS
(ON EXISTING ALIGNMENT)
FIGURE 10. IL 120 SET OF IMPROVEMENTS
(ON BYPASS ALIGNMENT)
SUMMARY OF POTENTIAL RESIDENTIAL AND
COMMERCIAL STRUCTURES, WETLANDS AND DESIGNATED LANDS
IMPACTED FOR EACH SET OF IMPROVEMENTS
FALL, 1999 VOLUME 1 NUMBER 3
LC Nwslter-fall_FINAL.qxd 12/3/99 12:47 PM Page 3

VOLUME 1 NUMBER 3 FALL 1999
Our roadway proposals are in addition to the
Baseline Improvements. Doing just the
Baseline Improvements is not enough, given
existing congestion levels and the projected
quarter million new residents in Lake County
by 2020. We can’t solve all the problems, so
we focused on the worst congestion and the
most effective combinations using a struc-
tured, computer-aided approach. Our nine
roadway improvement sets are shown in
Figures 4-12.
In August we presented these proposals in a
series of public informational meetings held
throughout Lake County. More than 800
people attended the events to review the
proposed improvements, ask questions, and
provide input. The overwhelming majority
of participants agreed that major transporta-
tion improvements are needed in one form or
another. The comments received have been
reviewed and will assist us in identifying and
addressing issues and concerns as we move
into the next phase of the process—refining
and combining the roadway, rail, and bus
improvements to form complete alternatives
and then evaluating the alternatives.
LCTIP DEVELOPS WIDE
RANGE OF POTENTIAL
SOLUTIONS (CONTINUED FROM PAGE 1)
WHAT’S THE NEXT STEP IN
THE PROCESS?Through each successive stage of development, the alterna-
tives will be increasingly refined and detailed. In the next step
of the process, we will further develop the alternatives by:
• Identifying interchange locations
• Refining roadway footprints to avoid or minimize impacts
• Refining roadway and rail alignments and bus routes
• Identifying the feeder road system needed to support themajor road improvements
Then we will analyze and compare the alternatives using
transportation, environmental, societal, and financial
evaluation criteria. Our findings will be summarized and
presented in another series of public informational meetings
for review and comment. We will continue to work with the
public and others as we have throughout the project.
N E X T S T E P S
Develop InitialImprovementsfor Roadway,Rail, and Bus
Needs Analysis
Refine, Combine, and EvaluateAlternatives
Final Alternatives
Recommendation
W INTER 1998
SUMMER 1999
W INTER 1999
SUMMER 2000
FALL 2000
Public Informational Meeting #2
Public Hearing
Public Informational Meeting #1
We are here
LC Nwslter-fall_FINAL.qxd 12/3/99 12:47 PM Page 4

FALL, 1999 VOLUME 1 NUMBER 3
OTHER PROPOSALS...CROSSROADSThe Environmental Law and Policy Center (ELPC) and Citizens Organized for Sound Transportation(COST) have proposed limited existing roadwayimprovements and the addition of some rail service asthe solution for Lake County’s transportation needs ina document titled Crossroads: Smart TransportationOptions for Lake County. They claim that implementingthese improvements would lead to greater congestionrelief when compared to the endorsed RegionalTransportation Plan (RTP).* Their analysis misused the2020 population forecasts, resulting in inaccurate conclusions.
Using state-of-the-art techniques, we correctly analyzedthe Crossroads proposal and compared it to the region-ally endorsed 2020 transportation plan. We found thatthe 2020 transportation plan improves travel times byabout 10% on 100 miles of major roadways, whereasthe Crossroads proposal improves travel times by thesame margin on only 8 miles of major roadways (seeFigure 13). The Crossroads proposal is not as effectivein reducing congestion levels and accommodating Lake County’s future growth.
*Regional Transportation Plan includes 21 major projects throughout northeasternIllinois, including the extension of Illinois Route 53 in Lake County.
Some people have expressed the opinion that east-westroads are more congested and should be improved. TheLake County Transportation Improvement Project andother transportation providers in the area recognize thatthere are east-west travel needs in Lake County, andthrough a collaborative process identified more than 40miles of east-west roadway improvements as part of the“Baseline Improvements.” Improvements to Lake CookRoad, Illinois Route 22, Peterson Road, WashingtonStreet, and Rollins Road are included in the Baseline.These improvements are being proposed regardless of the recommendations made by this project.
In response to comments, we developed and tested an“east-west” improvement scenario (see Figure 14). Thisscenario performed worse than any of our roadwayimprovement sets, achieving only 78% of our goal.
These results should not be surprising. An analysis ofexisting travel patterns shows that north-south travel ispredominant and the system lacks sufficient north-southcapacity. In developing our alternatives, we targeted theworst congested roadways and most efficient combinations
of improvements. All have a mix of north-south and east-west improvements.
WHAT HAPPENS IF WE IMPROVE ONLY EAST-WEST ROADS?
FIGURE 14. EAST-WEST ROADWAY IMPROVEMENT SCENARIO
Baseline Improvements
Added East-West Improvements
RTP Approximately 10% or Greater Travel Time Savings Compared to Crossroads.
Crossroads Approximately 10% or Greater Travel TimeSavings Compared to RTP.
FIGURE 13. TRAVEL TIME COMPARISON 2020 RTP VS CROSSROADS
LC Nwslter-fall_FINAL.qxd 12/3/99 12:47 PM Page 5

VOLUME 1 NUMBER 3 FALL 1999
Q UESTIONS AND COMMENTSIn addition to the strong turnout at the public informational meetings held this August, we receivednearly 600 written and oral comments. In response to your input, we provide the following responsesto the major recurring comments and questions.
A MAJORITY OF COMMENTERS SUPPORT MAJOR
TRANSPORTATION IMPROVEMENTS.
The Lake County Transportation ImprovementProject has identified a wide range of transporta-tion improvement options to address the majortransportation problems in Lake County. At thepublic informational meetings, nine different setsof roadway improvements as well as rail and busimprovements were presented. We receivedapproximately 450 comments specifically aboutthe roadway improvements. The following tablesummarizes how participants at the public infor-mational meetings felt about the proposed sets ofroadway improvements.
Set of Roadway Improvements Percent
Support I-94 set of improvements 2%
Oppose I-94 set of improvements 0%
Support IL 83 / US 45 set of improvements 2%
Oppose IL 83 / US 45 set of improvements 1%
Support IL 53 set of improvements 56%
Oppose IL 53 set of improvements 33%
Support IL 120 set of improvements 1%
Oppose IL 120 set of improvements 0%
Support US 12 set of improvements 4%
Oppose US 12 set of improvements 1%
Do nothing (Baseline) 0%
Total 100%
THERE IS A HIGH DEGREE OF FRUSTRATION WITH
EXISTING TRAFFIC CONGESTION. COMMENTERS WANT
ROAD IMPROVEMENTS TO BE BUILT NOW.
We received many comments expressing concernabout the time required for the highway develop-ment process. These studies are necessary to provide us with the technical basis to make goodtransportation decisions. Our intent with this project is to move through the process as efficiently as possible and have an answer to whatshould be done by the fall of 2000. As for imple-menting road improvements, projects to widen 46miles of existing roads are ongoing or funded forconstruction in the next 5 years.
MANY WERE CONCERNED WITH THE FAILURE OF ROAD
IMPROVEMENTS TO KEEP PACE WITH DEVELOPMENT.
Population and employment have increased rap-idly over the last decade. During this same period,less than 5% of the major roads were improved.With the county adding 11,000 new residents peryear, transportation has not been able to keeppace. Studies to address congestion are ongoing.In total, 74 miles of improvements to existingroads are anticipated by 2020 (LCTIP BaselineImprovements). These include improvements toIL Route 22, Lake Cook Rd., Pulaski Rd., MartinLuther King Dr., Midlothian Rd., Weiland Rd.,Butterfield Rd., I-94, Sunset Ave., Bradley Rd.,Buffalo Grove Rd., US 45, Peterson Rd., HuntClub Rd., Rollins Rd., and Quentin Rd.Recommendations of the LCTIP would be inaddition to these improvements.
MANY BELIEVE GROWTH WILL HAPPEN REGARDLESS OF
ROAD IMPROVEMENTS.
Census data show that Lake County is growingdespite a lack of major transportation improve-ments. Forecasts show that an additional 250,000people will move to Lake County by 2020,
LC Nwslter-fall_FINAL.qxd 12/3/99 12:47 PM Page 6

FALL, 1999 VOLUME 1 NUMBER 3
Q UESTIONS AND COMMENTS (CONTINUED)
regardless of transportation improvements. Using a
rigorous analysis, the population impact of any of
the LCTIP alternatives would be less than 4% over-
all. The belief that Lake County will grow anyway
is fostered by its historical growth patterns and
geographic position in the metropolitan area.
Transportation has not been, nor is it expected to
be, the major driver of population growth in
Lake County.
GET MORE OUT OF THE EXISTING TRANSPORTATION
SYSTEM (I.E., TRAFFIC SIGNAL COORDINATION, ROAD
UNDERPASS/OVERPASS AT RAILROAD CROSSINGS, AND
ADDITIONAL TURNING LANES AT INTERSECTIONS).
We are considering transportation management
strategies like traffic signal coordination as part of
this project. It is important to note, however, that
these types of strategies typically have limited
impacts in terms of reducing overall traffic volumes,
usually around 1 percent, and thus do not eliminate
the need for major transportation improvements.
WOULD IL 53 CAUSE DEVELOPMENT AND GROWTH?
Transportation is a minor factor. Between 1980 and
1995 Lake County’s population increased by 29%,
or 132,000 residents. Over this same period, less
than 5% of the roads were improved. Lake County’s
population is forecast to increase to 800,000 by the
year 2020. The extension of IL 53 or other LCTIP
alternatives would contribute less than 4% to popula-
tion in the year 2020.
Local jurisdictions are responsible and have control
over land use decisions. The provision of sewer and
water infrastructure, and zoning, allow for develop-
ment. We do our best to keep pace with these land
use decisions and try to consider future growth.
IMPROVE EXISTING ROADS AND SEE WHAT HAPPENS.
Whether it’s improvements to existing roads or new
highways or both, it is obvious that as Lake County
continues to add population (projected quarter
million increase by 2020), the need for major
improvements becomes increasingly evident. Lake
County can ill afford to take a “see what happens”
approach. It is important that the right solution be
pursued now, that best accommodates Lake
County’s future growth and transportation needs.
PROVIDE IMPROVEMENTS FOR ALTERNATIVE
TYPES OF TRANSPORTATION (TRANSIT, BICYCLES, AND PEDESTRIANS).
We are taking a serious look at bus and rail
improvements. The alternatives will include a com-
bination of road improvements as well as transit
components. The transit components will focus on
enhancing services and increasing the number of
people using transit to meet their travel needs. The
rail and bus strategies under consideration include
rail extensions of existing Metra service, rail station
parking enhancements, and bus service expansion.
Although we are evaluating major improvements to
the transit network, currently nearly 90% of all
work trips are made by automobile, whereas less
than 5% are made by transit. Major improvements
to the roads, which complement transit services, are
necessary to meet Lake County’s transportation needs.
ARE YOU CONSIDERING THE QUALITY OF ENVIRONMENTAL
RESOURCES WHEN ASSESSING IMPACTS?
Yes, we will undertake a rigorous evaluation
of the environmental impacts of the improvements
in the next step of our process, when we begin to
refine the improvements to avoid or minimize
impacts to resources. We will evaluate the alterna-
tives, using environmental, societal, financial, and
transportation measures. Our evaluation will
involve qualitative as well as quantitative values.
LC Nwslter-fall_FINAL.qxd 12/3/99 12:47 PM Page 7

N THIS ISSUE:
◗ Initial Roadway and Transit Improvements
◗ Other Proposals
◗ Public Meeting #1 Questions and Comments
VOLUME 1 NUMBER 3 FALL, 1999
I
Lake CountyTRANSPORTATION
IMPROVEMENT
P r o j e c t
Lake CountyTRANSPORTATION
IMPROVEMENT
P r o j e c t
LC Nwslter-fall_FINAL.qxd 12/3/99 12:47 PM Page 8

LLaakkee CCoouunnttyyTRANSPORTATION
IIMMPPRROOVVEEMMEENNTT
P r o j e c t NNEEWWSSVOLUME 1 NUMBER 4 SUMMER 2000
NEWSNE W SNNEEWWSS
LLaakkee CCoouunnttyyTRANSPORTATION
IIMMPPRROOVVEEMMEENNTT
P r o j e c t
The Lake County Transportation Improvement Project (LCTIP) has narrowed the field of transportation improvements. They include:
•Two finalist roadway alternatives: IL 53 (Freeway/Tollway) and IL 83/US 45 (with US 12) sets of improvements (see Figures 1-2), and
•Transit improvements consisting of commuter rail and bus service upgrades (see Figures 3-4), which will be common to both roadwayalternatives.
The finalist roadway alternatives were selected from an initial set of nine alternatives that were developed in the summer of 1999,
using state-of-the-art technical tools and extensive public involvement. The alternatives were developed to address the most heavily
traveled corridors and respond to Lake County’s top priority-congestion relief.
LCTIP NARROWS RANGE OF SOLUTIONS
MIDLOT
HIAN R
D
YORKHOUSE RD
LONG GROVE RDLAKE-COOK RD
QUEN
TIN
RD
COOK COUNTYLAKE-COOK RD
OLD McHENRY RD
SHER
IDAN
RDPETERSON RD
CUBA RD
HALF DAY RD
SUNSET AVE
WASHINGTON ST
McHE
NRY C
OUNT
Y
ROLLINS RD
WILM
OT RD
SHER
IDAN
RD
WADSWORTH RDHUNT
CLU
B RD
WAUKEGAN RD
LEWI
S AVELAKE COUNTY
DEERFIELD RD
#
# #
#
LakeMichigan
45
132
137
176
173173
132137
68
12
41
4183
12
22
14
120
45
21
60
53
60
120
94
294 94
94
31
FIGURE 1. IL 53 (FREEWAY/TOLLWAY) SET OF IMPROVEMENTS
MIDLOT
HIAN R
D
YORKHOUSE RD
LONG GROVE RDLAKE-COOK RD
QUEN
TIN
RD
COOK COUNTYLAKE-COOK RD
OLD McHENRY RD
SHER
IDAN
RDPETERSON RD
CUBA RD
HALF DAY RD
SUNSET AVE
WASHINGTON ST
McHE
NRY C
OUNT
Y
ROLLINS RD
WILM
OT RD
SHER
IDAN
RD
WADSWORTH RDHUNT
CLU
B RD
WAUKEGAN RD
LEWI
S AVELAKE COUNTY
DEERFIELD RD
#
# #
#
LakeMichigan
45
132
137
176
173173
132137
68
12
41
4183
12
22
14
120
45
21
60
53
60
120
94
294 94
94
31
FIGURE 2. IL 83/US 45 (WITH US 12) SET OF IMPROVEMENTS
Route ImprovementIL53 NEW 6-LANE FREEWAY/TOLLWAYIL120 WIDEN FROM 2 TO 4-LANES/4 TO 6-LANES
(IL120 BYPASS) NEW 4/6-LANE FREEWAY/TOLLWAY
Route ImprovementIL 83 WIDEN FROM 4 TO 6-LANES
(IL60/US45 BYPASS) NEW 4-LANE ARTERIALI-94 WIDEN FROM 6 TO 8-LANESIL21 WIDEN FROM 4 TO 6-LANES
(IL60) WIDEN FROM 4 TO 6-LANES(ST. MARY’S ROAD) WIDEN FROM 2 TO 4-LANES(IL137) WIDEN FROM 4 TO 6-LANES
US12 WIDEN FROM 4 TO 6-LANESIL120 (NEW ALIGNMENT) NEW 4-LANE ARTERIAL
LEGEND FOR
ROAD IMPROVEMENTS
Proposed Improvement
Baseline Improvement

VOLUME 1 NUMBER 4 SUMMER 2000
#
#
##
##
##
##
#
##
#
# ##
###
# ###
##
##
#
#
#
#
#
#
#
#
#
##
MIDLOT
HIAN R
D
YORKHOUSE RD
LONG GROVE RDLAKE-COOK RD
QUEN
TIN
RD
COOK COUNTYLAKE-COOK RD
OLD McHENRY RD
SHER
IDAN
RDPETERSON RD
CUBA RD
HALF DAY RD
SUNSET AVE
WASHINGTON ST
McHE
NRY C
OUNT
Y
ROLLINS RD
WILM
OT RD
SHER
IDAN
RD
WADSWORTH RDHUNT
CLU
B RD
WAUKEGAN RD
LEWI
S AVELAKE COUNTY
DEERFIELD RD
#
# #
#
LakeMichigan
45
132
137
176
173173
132137
68
12
41
4183
12
22
14
120
45
21
60
53
60
120
94
294 94
94
31
X
X
X XX
FIGURE 3. POTENTIAL RAIL IMPROVEMENTS
POTENTIAL RAIL IMPROVEMENTS LEGEND
Signal ImprovementsConsolidation of Freight ServiceCandidate Commuter Rail Service (EJ&E)
Add Track (NCS)
#
#
##
##
##
##
#
##
#
# ##
###
# ###
##
##
#
#
#
#
#
#
#
#
#
##
MIDLOT
HIAN R
D
YORKHOUSE RD
LONG GROVE RDLAKE-COOK RD
QUEN
TIN
RD
COOK COUNTYLAKE-COOK RD
OLD McHENRY RD
SHER
IDAN
RDPETERSON RD
CUBA RD
HALF DAY RD
SUNSET AVE
WASHINGTON ST
McHE
NRY C
OUNT
Y
ROLLINS RD
WILM
OT RD
SHER
IDAN
RD
WADSWORTH RDHUNT
CLU
B RD
WAUKEGAN RD
LEWI
S AVELAKE COUNTY
DEERFIELD RD
#
# #
#
LakeMichigan
45
132
137
176
173173
132137
68
12
41
4183
12
22
14
120
45
21
60
53
60
120
94
294 94
94
31
FIGURE 4. POTENTIAL BUS ROUTES AND TRANSPORTATION CENTERS
Parking Capacity ImprovementsFeasibility Study
County BoundaryStudy Area BoundaryALL FIGURES:
Transfer StationsX
Refinements
After the initial nine alternatives were developed, refinements were made to avoid or minimize impacts and add detail. One
of the key refinements was the consideration of bypass routes in Libertyville, Mundelein, and Grayslake. The LCTIP investi-
gated ways to improve the badly congested IL 21, US 45, and IL 120 corridors that would minimize impacts to homes and
businesses. For IL 21 in Libertyville, a bypass to the east was selected using IL 60, St. Mary’s Road and IL 137; for US 45 in
Mundelein, a bypass to the west was selected using the IL 53 extension corridor, and for IL 120 in Grayslake, a bypass to the
south was selected.
Alternatives Evaluation
After the refinements were complete, the alternatives were then evaluated on the basis of how each would reduce congestion,
reduce traffic on local streets and improve travel times. The IL 53 (Freeway/Tollway) and IL 83/US 45 (with US 12) sets of
improvements were the top two alternatives in terms of transportation benefits.
What Are the Next Steps?During the summer and fall, the finalist alternatives will be further refined to add engineering and environmental detail, andthen evaluated. The LCTIP’s technical work and public input will be summarized in a draft Environmental Impact Statement,which will be followed by a Public Hearing.

SPRING 2000 VOLUME 1 NUMBER 4SUMMER 2000 VOLUME 1 NUMBER 4
Public Involvement
Public involvement is an important part of the LCTIP, with input being sought through our project office in Mundelein, our
Web Site (www.lakecountytip.com), presentations to nearly 100 organizations and communities, project newsletters, advisory
groups, and public informational meetings. Participation and support for this planning process has been strong, as evidenced
by the nearly 4,000 comments received at our May 2000 public informational meetings. The following summarizes the major
themes from that event.
A MAJORITY OF COMMENTERS SUPPORT THE
IL 53 SET OF IMPROVEMENTS.
The majority of comments centered on the IL 53 set of
improvements. By a margin of 4:1, people expressed their
support for the extension of IL 53.
Set of Roadway Improvements Percent
Support IL 53 Freeway/Tollway 79%
Oppose IL 53 Freeway/Tollway 19%
Support IL 83/US 45 (with US 12) Less than 1%
Oppose IL 83/US 45 (with US 12) 1.5%
WHAT IS BEING DONE TO IMPROVE
EXISTING ROADS?
Based on input from transportation providers, the LCTIP
identified those improvements anticipated to be built regard-
less of the outcome of our study (see Figure 5). These include
improvements to IL 22, Lake Cook Road, Pulaski Road,
Martin Luther King Drive, Midlothian Road, Weiland Road,
Butterfield Road, I-94, Sunset Avenue, Bradley Road, Buffalo
Grove Road, US 45, Peterson Road, Hunt Club Road,
Rollins Road, Quentin Road, IL 21, and IL 83/IL 60. Over
half of these improvements are funded for construction in
the next five years. Other projects, such as intersection
improvements and signal synchronization, will also continue
regardless of our study. With all these improvements in place,
congestion will double by 2020. Additional improvements
are needed to keep Lake County out of gridlock.
WOULD THE FINALIST ALTERNATIVES ONLY CAUSE
MORE GROWTH?
The LCTIP roadway options would add less than 4% to
Lake County’s total 2020 population. The most important
issue is the other 96% that will be here regardless. The
County’s population has jumped from 516,000 in 1990 to
nearly 620,000 today, and is expected to be around 800,000
by the year 2020 regardless of any major roadway improve-
ments. Congestion is widespread already, and major
improvements to the highway system are needed just to keep
the County out of gridlock.
WOULD IMPROVING EXISTING ROADS HAVE
FEWER IMPACTS?
Not necessarily. The LCTIP has implemented measures to
avoid or minimize impacts for all alternatives and found that
the impacts were comparable. The potential impacts
associated with improving existing roads is well known as
evidenced by bypasses being considered as part of other
studies in Lake Zurich, Barrington, and Millburn.
FIGURE 5. PROJECT BASELINE
SUMMER 2000 VOLUME 1 NUMBER 4
MIDLOTHIAN
RD
YORKHOUSE RD
LONG GROVE RDLAKE-COOK RD
QUEN
TIN R
D
COOK COUNTYLAKE-COOK RD
OLD McHENRY RD
SHER
IDAN
RDPETERSON RD
CUBA RD
HALF DAY RD
SUNSET AVE
WASHINGTON ST
McHE
NRY
COUN
TY
ROLLINS RD
WILM
O T RD
SHER
IDAN
RD
WADSWORTH RD
HUNT
C LUB
RD
W AUKEGA N RD
LEWI
S AVELAKE COUNTY
DEERFIELD RD
#
# #
#
LakeMichigan
45
132
137
176
173173
132137
68
12
41
4183
12
22
14
120
45
21
60
53
60
120
94
294 94
94
31
SUMMER 2000 VOLUME 1 NUMBER 4

VOLUME 1 NUMBER 4 SPRING 2000
N THIS ISSUE:
◗ Finalist Roadway and Transit Recommendations
◗ Spring 2000 Public Meeting Summary
◗ Next Steps
VOLUME 1 NUMBER 4 SUMMER 2000
PRSRT STDU.S.POSTAGE
PAIDPERMIT NO.437MUNDELEIN,IL
FORFURTHERINFORMATION
Please contact/visit the project office.
LAKECOUNTYTRANSPORTATION
IMPROVEMENTPROJECT
25663 Hillview Court, Mundelein, IL 60060(located in Midlothian Center)
847.438.3442
Hours: 8:00 am to 4:00 pm Monday-Friday
I���������
������ ���
��������� �������
�� ���
������������
����� ������
��
����
��
����������
LLaakkee CCoouunnttyyTRANSPORTATION
IIMMPPRROOVVEEMMEENNTT
P r o j e c t
LLaakkee CCoouunnttyyTRANSPORTATION
IIMMPPRROOVVEEMMEENNTT
P r o j e c t .. .. .... .. ..
.. .. .... .. .. addressing Lake County’s gridlockaddressing Lake County’s gridlock