Illinois River (Peoria Area)
455
Pecatonica River Total Maximum Daily Load and Load Reduction Strategies Stage 2 Report 1021 North Grand Avenue East P.O. Box 19276 Springfield, Illinois 62794-9276 Report Prepared by: Tetra Tech 413 Wacouta Street, Suite 435 Saint Paul, MN 55101 and Tetra Tech EMI 1 South Wacker Drive Chicago, IL 60606 October 2, 2015
-
Upload
khangminh22 -
Category
Documents
-
view
0 -
download
0
Transcript of Illinois River (Peoria Area)

Pecatonica River Total Maximum Daily Load and Load Reduction Strategies
Stage 2 Report
1021 North Grand Avenue East P.O. Box 19276 Springfield, Illinois 62794-9276
Report Prepared by:
Tetra Tech 413 Wacouta Street, Suite 435 Saint Paul, MN 55101 and Tetra Tech EMI 1 South Wacker Drive Chicago, IL 60606
October 2, 2015
Pecatonica River Stage 2 Report October 2, 2015
-ii-
Contents
1. Introduction .................................................................................................................................... 1
2. Data Collection and Monitoring .................................................................................................... 3 2.1 Monitoring Locations ................................................................................................................... 3 2.2 Approach ...................................................................................................................................... 6
2.2.1 Surface Water ..................................................................................................................... 6 2.2.2 Groundwater ....................................................................................................................... 7
2.3 Deviations from Monitoring Plan ................................................................................................. 7
3. Data Results ................................................................................................................................... 7
4. Ammonia Source Assessment ................................................................................................... 10
5. Conclusions and Recommendations for Stage 3 ..................................................................... 11
Appendix A. Quality Assurance Project Plan......................................................................................... 12
Appendix B. Lab Reports ......................................................................................................................... 13

Pecatonica River Stage 2 Report October 2, 2015
-iii-
Figures
Figure 1-1. Watershed locations ................................................................................................................... 2 Figure 2-1. Winneshiek Creek sampling sites............................................................................................... 4 Figure 2-2. Spring Branch sampling sites ..................................................................................................... 5
Tables
Table 2-1. Monitoring site locations ............................................................................................................. 3 Table 2-2. Monitoring sites and dates of data collection .............................................................................. 6 Table 3-1. Sample Results from Winneshiek Creek ..................................................................................... 8 Table 3-2. Sample Results from Spring Branch ........................................................................................... 8 Table 3-3. Field Measurements from Winneshiek Creek ............................................................................. 9 Table 3-4. Field Measurements from Spring Branch .................................................................................... 9 Table 3-5. Field Observations from Spring Branch .................................................................................... 10

Pecatonica River Stage 2 Report October 2, 2015
-1-
1. Introduction
This report documents the monitoring and assessment completed for Stage 2 of the Pecatonica River
watershed total maximum daily load (TMDL) and load reduction strategies (LRS) study. The monitoring
included field data collection and laboratory assessment of water quality parameters in the Winneshiek
Creek watershed and Spring Branch watershed (Figure 1-1). Stage 2 monitoring, along with the existing
monitoring data presented and assessed in the Stage 1 report, will support the development of TMDLs
and LRSs in the Pecatonica River watershed.

Pecatonica River Stage 2 Report October 2, 2015
-2-
Figure 1-1. Watershed locations

Pecatonica River Stage 2 Report October 2, 2015
-3-
2. Data Collection and Monitoring
2.1 Monitoring Locations
Surface samples were collected from one site in the Winneshiek Creek watershed (Figure 2-1) and three
sites in the Spring Branch watershed (Figure 2-2). Monitoring was completed in accordance with the
Quality Assurance Project Plan (QAPP) “Water Quality Sampling for Total Maximum Daily Loads for
Pecatonica River Watershed, Winneshiek Creek and Spring Branch” (Appendix A). Locations of all
monitoring sites were measured with a handheld GPS device with sub-meter accuracy (Table 2-1).
Tetra Tech made an in-field adjustment to the location of sampling point SB-01 during the December
2014 sampling event. Upon arriving to the site, Tetra Tech determined that there were no accessible roads
within approximately 1 mile of the location chosen for SB-01 in the approved QAPP. Tetra Tech’s field
team consulted with project management, and selected a new location for SB-01 that was closer to an
accessible road, while remaining downstream of most observable discharges to Spring Branch. The
updated location of SB-01 was collected with a sub-meter accuracy handheld GPS device, which was
used in subsequent sampling events to ensure consistency in sampling locations. See Figure 2-2 and Table
2-1 for a depiction of the updated location of SB-01.
Table 2-1. Monitoring site locations
Water Body
IEPA Station Code
Sampling Site
Latitude* Longitude* Description
Winneshiek Creek
(PWL-01)
PWL-01
WC-01 42.306203 -89.514405
Approximately 215 feet upstream of Fawver Road and 1.3 river miles upstream of confluence with Pecatonica River
Spring Branch (PWNC)
PWNC-01 SB-01 42.242854 -89.795896 Approximately 2,500 feet upstream from the confluence with Yellow Creek
PWNC-03 SB-02 42.238077 -89.828829
375 feet upstream of Spring Branch split on the southern tributary (split occurs approximately 930 feet along the creek upstream from the bridge crossing at IL-73)
PWNCA-
01 SB-03 42.238921 -89.829000
240 feet upstream of Spring Branch split on the northern tributary (split occurs approximately 930 feet along the creek upstream from the bridge crossing at IL-73)
PWNC-02 SB-04 42.242022 -89.803758 At the edge of Spring Branch on the downstream side of the Loran Road Bridge
*Latitude and longitude are reported using North American Datum of 1983 (NAD83)

Pecatonica River Stage 2 Report October 2, 2015
-4-
Figure 2-1. Winneshiek Creek sampling sites

Pecatonica River Stage 2 Report October 2, 2015
-5-
Figure 2-2. Spring Branch sampling sites

Pecatonica River Stage 2 Report October 2, 2015
-6-
2.2 Approach
At the sampling site on Winneshiek Creek, field measurements were made for the following water quality
parameters: temperature, dissolved oxygen (DO), pH, and conductivity (Table 2-2). Flow information
including depth, velocity, and stream geometry were also measured. Water samples were collected for
laboratory analysis for concentrations of total phosphorus (TP) and total suspended solids (TSS).
At each sampling site along Spring Branch, field measurements were made for the following water
quality parameters: temperature, DO, pH, and conductivity. Flow information including depth, velocity,
and stream geometry was also measured. Water samples were collected for laboratory analysis for
concentrations of total Kjeldahl nitrogen (TKN), total ammonia (T-ammonia), and total nitrite (NO2) plus
nitrate (NO3). Only the sample collected at the most downstream sampling location (SB-01) was analyzed
for total phosphorus. Field samples were collected in the streams between 0 and 1 foot below the water
surface. Water samples were preserved with sulfuric acid when appropriate, stored on ice, and delivered
to the laboratory, STAT, for filtration and analysis.
Table 2-2. Monitoring sites and dates of data collection
DO – Dissolved oxygen T-ammonia – Total ammonia TP – Total phosphorus NO2 + NO3 – nitrite plus nitrate-nitrogen TSS – Total suspended solids TKN – Total Kjeldahl nitrogen
2.2.1 Surface Water
Stream sampling procedures occurred at the center of the stream and followed SOP No. 009, Section 2.1,
“Surface Water Sampling by Submerging Sample Container” (see Appendix A). Stream samples were
collected from 0 and 1 foot below the water surface. A composite sample was collected of water from the
left bank, right bank, and center of the stream.
Stream measurement procedures were conducted in a standardized fashion. Velocity measurements were
taken at multiple points along the cross-section of the stream, at a depth of 0.6 multiplied by total depth.
Stream geometry measurements were collected at all significant geometric features, and were measured
using the water surface as a reference elevation. The samples and measurements were collected on
December 11, 2014; March 24, 2015; and April 17, 2015.
In Spring Branch, channel substrate, percent cloud cover, percent shading, and coarse streamside
vegetative summary were observed at the surface to help evaluate the streambed material composition.
Stream shading observations were recorded at each specific sampling location, and general observations
on stream shading were made while traveling between sampling locations. Percent shading was
determined through field observations, and confirmed by taking a photo of the stream and estimating the
amount of shade on the water.
Water Body (Segment)
Sampling Site
Matrix Field Parameters Laboratory Parameter
Monitoring Dates
Winneshiek Creek (PWL-01)
WC-01 Water Temperature, DO, pH, conductivity,
flow TP, TSS
12/11/2014, 3/24/2015, 4/17/2015
Spring Branch (PWNC)
SB-01 SB-02 SB-03
Water Temperature, pH, conductivity, DO,
flow
TKN, T-ammonia, Total NO2 + NO3, TP (TP at SB-01 only)
12/11/2014, 3/24/2015, 4/17/2015

Pecatonica River Stage 2 Report October 2, 2015
-7-
2.2.2 Groundwater
Tetra Tech attempted to collect a groundwater sample from sampling location SB-04 within the Spring
Branch watershed during two sampling events. During the first sampling event (December 11, 2014),
Tetra Tech attempted to install a temporary piezometer at sampling location SB-04. Specifically, Tetra
Tech used a hand auger to create a boring to a depth of approximately 3 feet below ground surface (bgs).
This boring was located adjacent to Spring Branch, and reached a depth of approximately 2 feet below the
water surface of Spring Branch. Tetra Tech installed a 1-inch diameter PVC piezometer, screened at the
bottom foot (2–3 feet bgs), and installed sand around the boring to promote flow and filtration of
groundwater. After completing this installation, Tetra Tech attempted to allow water to collect in the
piezometer, but this process was hindered by slow recharge rates. Tetra Tech attempted to allow the
piezometer to recharge with groundwater for approximately one hour, with no significant accumulation of
water. Tetra Tech utilized a hand auger to create an additional boring adjacent to the temporary
piezometer to observe the soil profile. This boring was completed to a depth of approximately 5 feet bgs.
Tetra Tech encountered topsoil from approximately 0 – 2 feet bgs, and a dense clay layer from 2 – 5 feet
bgs. Due to the slow piezometer recharge rate and observation of clay to 5 feet bgs, this groundwater
sampling attempt was abandoned.
During the second sampling event (March 24, 2015), Tetra Tech again attempted to install a temporary
piezometer at sampling location SB-04. On this occasion, Tetra Tech used a 2-inch diameter steel
piezometer screen, a total of 3.5 feet in length and screened along the entire length. Tetra Tech installed
this piezometer screen to a depth of approximately 3 feet bgs at a location immediately adjacent to Spring
Branch. Tetra Tech attempted to allow the piezometer to recharge with groundwater, allowing
approximately 1.25 hours of recharge time with no accumulation of groundwater. Due to this slow
recharge rate, this groundwater sampling attempt was abandoned.
During the third sampling event (April 17, 2015), Tetra Tech did not observe any seeps or springs in the
Spring Branch watershed. Tetra Tech did not attempt to install a temporary piezometer during the third
sampling event, due to the slow recharge rates and preponderance of clay observed in the subsurface
during previous sampling events.
2.3 Deviations from Monitoring Plan
See Section 2.2 for a discussion of deviation from the approved monitoring plan due to difficulty
collecting groundwater samples. The location of sample SB-01 was also adjusted in the field based on
field conditions. Specifically, the location for SB-01 depicted in the monitoring plan was not reasonably
accessible (over 1 mile from any parking location). The location of SB-01 was adjusted as needed, and
the new location for SB-01 was determined.
3. Data Results
All samples collected for laboratory analysis were analyzed by STAT Analysis of Chicago, Illinois.
Analytical results were provided in Level II data packages, consisting of a basic laboratory report and an
electronic data deliverable (EDD) format spreadsheet. Tetra Tech performed Level II data validation of
all analytical results. The data validation report is provided in Appendix B.
Surface water samples collected at sampling location WC-01 in the Winneshiek Creek watershed were
analyzed for total suspended solids and total phosphorus. The results of these analyses are presented
below in Table 3-1.

Pecatonica River Stage 2 Report October 2, 2015
-8-
Table 3-1. Sample Results from Winneshiek Creek
Sample Number Date Collected
Total Suspended Solids (mg/L)
Phosphorus (mg/L)
WC-01 12/11/2014 < 7.5 K 0.10
WC-01-FD 12/11/2014 < 7.5 K NA
WC-01 3/24/2015 10 0.17
WC-01 4/17/2015 < 7.5 K 0.41
WC-01-FD 4/17/2015 < 7.5 K NA Notes: FD “FD” appended to Sample Number indicates that the specified sample is a field duplicate sample K The reported result is greater than the actual concentration of the analyte in the sample. The
reported result is the minimum practical quantitation limit of the analysis NA Not analyzed
All sample results may be used, as qualified, for any purposes.
Surface water samples were collected at sampling locations SB-01, SB-02, and SB-03 in the Spring
Branch watershed. Samples collected at SB-02 and SB-03 were analyzed for total ammonia, nitrate-
nitrite, and TKN. Samples collected at SB-01 were analyzed for total ammonia, nitrate-nitrite, TKN, and
total phosphorus. The results of these analyses are presented below in Table 3-2.
Table 3-2. Sample Results from Spring Branch
Sample Number Date Collected
Nitrogen, Ammonia (mg/L)
Nitrogen, Nitrate-Nitrite (mg/L)
Total Kjedlahl Nitrogen (mg/L)
Phosphorus (mg/L)
SB-01 12/11/2014 0.12 11 < 1.0 K,S 0.16
SB-01-FD 12/11/2014 0.10 10 < 1.0 K,S 0.63
SB-02 12/11/2014 0.071 9.5 < 1.0 K,S NA
SB-03 12/11/2014 0.10 14 < 1.0 K,S NA
SB-01 3/24/2015 0.15 11 < 1.0 K,S 0.12
SB-02 3/24/2015 0.17 9.6 1.0 S NA
SB-03 3/24/2015 0.26 12 < 1.0 K,S NA
SB-01 4/17/2015 0.25 9.3 < 1.0 K,S 0.078
SB-01-FD 4/17/2015 0.14 9.2 < 1.0 K,S 0.19
SB-02 4/17/2015 0.21 8.7 < 1.0 K,S NA
SB-03 4/17/2015 0.25 13 < 1.0 K,S NA Notes: FD “FD” appended to sample number indicates that the specified sample is a field duplicate sample. K The reported result is greater than the actual concentration of the analyte in the sample. The
reported result is the minimum practical quantitation limit of the analysis. NA Sample not analyzed for specified analytical parameter.
S The reported result was generated by a laboratory other than the one that reported the result. The reporting laboratory assures the validity of the reported result and its corresponding qualifiers.
All sample results may be used, as qualified, for any purposes.

Pecatonica River Stage 2 Report October 2, 2015
-9-
Tetra Tech also performed field monitoring in accordance with the approved monitoring plan. At each
sampling location, Tetra Tech used a Horiba U-10 Water Quality Checker to collect water quality data
including temperature, conductivity, dissolved oxygen, and pH. The flow rates at each surface water
sampling location in Winneshiek Creek and Spring Branch were calculated using flow velocities and
stream geometry measured in the field. Specifically, each stream cross section was broken down into
relevant geometrical areas based on the locations at which flow velocity was measured with a Flowwatch
flow velocity meter. The flow rates were then calculated using Riemann sums by multiplying the cross
sectional area of each geometrical area by the flow velocity measured in that area. The results of these
flow calculations and the field measurements discussed above are presented in Table 3-3 and Table 3-4.
Table 3-3. Field Measurements from Winneshiek Creek
Sample Number
Date Collected
Temperature (oC)
Conductivity (ms/cm)
Dissolved Oxygen (mg/L)
pH Flow Rate (ft3/s)
WC-01 12/11/2014 2.17 0.407 15.97 8.07 10.01
WC-01 3/24/2015 2.34 0.443 27.64 7.55 4.50
WC-01 4/17/2015 9.43 0.519 11.64 8.02 10.15
Table 3-4. Field Measurements from Spring Branch
Sample Number
Date Collected
Temperature (oC)
Conductivity (ms/cm)
Dissolved Oxygen (mg/L)
pH Flow Rate (ft3/s)
SB-01 12/11/2014 2.53 0.416 17.37 8.25 2.28
SB-02 12/11/2014 2.79 0.41 17.4 8.25 1.01
SB-03 12/11/2014 3.32 0.458 17.63 8.38 0.66
SB-01 3/24/2015 6.18 0.494 22.08 8.1 4.63
SB-02 3/24/2015 4.15 0.446 26.37 8.03 2.54
SB-03 3/24/2015 6.63 0.54 25.6 8.25 2.06
SB-01 4/17/2015 11.69 0.531 16.18 8.44 2.32
SB-02 4/17/2015 9.23 0.494 14.8 8.35 1.08
SB-03 4/17/2015 10.56 0.564 17.32 8.59 1.18
In addition to water quality measurements, field observations were recorded for the Spring Branch
watershed. These observations included percent cloud cover, percent shading, general vegetation, and
channel substrate. Vegetation identification efforts were limited by the timing of the sampling events
outside of the growing season. Where possible, Tetra Tech recorded observations both for the exact
sampling location, and for the general vicinity of the sampling location. The results of these field
observations are presented in Table 3-5.

Pecatonica River Stage 2 Report October 2, 2015
-10-
Table 3-5. Field Observations from Spring Branch
Sample Number
Date & Time Collected
Cloud Cover
Shading Vegetation Substrate
SB-01 12/11/2014 13:56
0% 100% at SB-01 40% throughout Spring Branch near SB-01
Hay, fescue, unidentified shrubs, unidentified trees unidentified grasses
Fine silt, some organic matter
SB-02 12/11/2014 11:28
40% 30% at SB-02 5% throughout Spring Branch near SB-02
Goldenrod (Solidago spp); fescue/ unidentified grasses, maple trees
Fine silt with decomposing organic matter, with fine gravel beneath
SB-03 12/11/2014 12:15
80% 10% at SB-03 5% throughout Spring Branch near SB-03
Hay, fescue, unidentified grasses
Fine gravel in riffles with fine silt and clay throughout
SB-01 3/24/2015 13:33
10% 10% at SB-01
Fescue, shrubs, unidentified trees, unidentified grasses
Silty-sand mixture. Significant bank erosion
SB-02 3/24/2015 11:30
0% 20% at SB-02 5% throughout Spring Branch near SB-02
Goldenrod (Solidago spp), fescue, maple trees, unidentified grasses
Silt with medium sized gravel. Bank erosion significant
SB-03 3/24/2015 11:58
0% 10% at SB-03 5% throughout Spring Branch near SB-03
Fescue, goldenrod (Solidago spp), unidentified grasses
Gravel, silt, gray clay. Bank erosion significant
SB-01 4/17/2015 11:15
30% 5% at SB-01 Unidentified grasses, fescue, unidentified trees
Silt with trace fine gravel. Bank erosion significant
SB-02 4/17/2015 09:58
85% 60% at SB-02 5% throughout Spring Branch near SB-02
Goldenrod (Solidago spp), fescue, maple trees
Silt with fine gravel. Bank erosion significant
SB-03 4/17/2015 10:20
85% 0% at SB-03 5% throughout Spring Branch near SB-03
Grass, fescue Clay, coarse gravel, silt. Bank erosion significant
4. Ammonia Source Assessment
Tetra Tech performed field reconnaissance in an attempt to determine potential sources of ammonia in the
Spring Branch watershed. This reconnaissance was performed through general observations during each
sampling event, with a focus on the ammonia source assessment during the March 2015 sampling event.

Pecatonica River Stage 2 Report October 2, 2015
-11-
The primary potential source of ammonia observed during field reconnaissance was the agricultural fields
that dominate land use in the watershed. During the December 2014 field event, Tetra Tech observed
manure being spread in an agricultural field located near sampling locations SB-02 and SB-03. Tetra Tech
did not observe any notable evidence of cattle use or access to Spring Branch. Tetra Tech did observe
apparent livestock farming operations in the watershed. The waste management practices of these
facilities are not known, but these operations could act as ammonia sources if waste is not controlled
appropriately. Tetra Tech also observed drain tiles from agricultural fields draining into Spring Branch
between sampling locations SB-02 and SB-01, including one drain tile located in the immediate vicinity
of SB-04.
5. Conclusions and Recommendations for Stage 3
Additional data collection was recommended in the Pecatonica River Total Maximum Daily Load
(TMDL) and Load Reduction Strategy (LRS) Stage 1 report. The additional data were necessary to
confirm impairments in Winneshiek Creek and Spring Branch and to support TMDLs and LRSs.
Winneshiek Creek
Winneshiek Creek is listed as impaired for sedimentation/siltation, total suspended solids, and
phosphorus. Monitoring data collected during 2014 and 2015 as part of this Stage 2 study show
concentrations of total suspended solids well below the water quality target of 40 mg/L. Sampling took
place during high and mid-range flow conditions in the creek. The data indicate that there is not a
sedimentation/siltation or total suspended solids impairment.
Phosphorus in the creek was found to be higher than the water quality target (0.156 mg/L), and therefore
phosphorus impairment has been verified and a LRS should be developed.
Recommendations:
Consider delisting this stream for sedimentation/siltation and total suspended solids; no TSS LRS
should be included in the Stage 3 report.
Include a total phosphorus LRS in the Stage 3 report.
Spring Branch
Spring Branch is listed as impaired for total ammonia and total phosphorus. Data collected during 2014
and 2015 as part of this Stage 2 study show concentrations of total ammonia well below the acute water
quality standard and TMDL endpoint of 15 mg/L. A source assessment conducted in the field and through
the use of aerial photos also did not identify any significant or continuous potential sources of ammonia in
the watershed. The data indicate that there is not an ammonia impairment, however there is likely
insufficient data to support delisting at this time. The samples were not collected during the critical
condition for ammonia in a stream, which would typically occur during low flow, hot summer months.
Phosphorus in the stream was found to be higher than the water quality target, and therefore phosphorus
impairment has been verified and a LRS should be developed.
Recommendations:
Consider collecting additional samples during critical conditions (low flow, warm temperatures)
to support delisting this stream for total ammonia; no total ammonia TMDL should be included in
the Stage 3 report.
Include a total phosphorus LRS in the Stage 3 report.

Pecatonica River Stage 2 Report October 2, 2015
Appendix A. Quality Assurance Project Plan

WATER QUALITY SAMPLING FOR TOTAL MAXIMUN DAILY LOADS FOR PECATONICAWATERSHED,
WINNESHIEK CREEK AND SPRING BRANCH
QUALITY ASSURANCE PROJECT PLANDocument Control Number 408, Revision 0
(valid through December 2015)
Prepared for
ILLINOIS ENVIRONMENTAL PROTECTION AGENCYBUREAU OF WATER
1021 North Grand Avenue EastSpringfield, Illinois 62794-9276
Contract FWN 13304
Date Prepared : December 1, 2014Prepared By : Tetra Tech, Inc.Tetra Tech Project Manager : Andrea PlevanTelephone No. : (612) 354-2224IEPA Work Assignment Manager : Abel HaileTelephone No. : (217) 782-9143


Water Quality Sampling Quality Assurance Project Plan QAPP 408, Revision 0for TMDLs for Pecatonica Watershed, Winneshiek Creek and Spring Branch Date: December 1, 2014
Page ii of vii
Stage 2 – Water Quality Sampling
CONTENTSSection Page
TITLE AND APPROVAL SHEET ...............................................................................................................I
ACRONYMS AND ABBREVIATIONS .................................................................................................... V
DISTRIBUTION LIST ............................................................................................................................. VII
INTRODUCTION ........................................................................................................................................ 1
1.0 PROJECT MANAGEMENT........................................................................................................... 1
1.1 PROJECT/TASK ORGANIZATION................................................................................. 3
1.2 PROBLEM DEFINITION AND BACKGROUND ........................................................... 5
1.3 PROJECT/TASK DESCRIPTION ..................................................................................... 5
1.4 DATA QUALITY OBJECTIVES AND CRITERIA FOR MEASUREMENT DATA... 11
1.4.1 Data Quality Objectives....................................................................................... 11
1.4.2 Measurement Quality Objectives......................................................................... 11
1.4.2.1 Sensitivity ............................................................................................ 13
1.4.2.2 Accuracy.............................................................................................. 16
1.4.2.3 Precision .............................................................................................. 17
1.4.2.4 Completeness....................................................................................... 18
1.4.2.5 Representativeness .............................................................................. 18
1.4.2.6 Comparability ...................................................................................... 19
1.5 SPECIAL TRAINING CERTIFICATION AND REQUIREMENTS ............................. 19
1.6 DOCUMENTATION AND RECORDS .......................................................................... 19
1.6.1 Field Operation Records ...................................................................................... 20
1.6.2 Laboratory Records.............................................................................................. 22
1.6.3 Data Handling Records........................................................................................ 22
2.0 DATA GENERATION AND ACQUISITION ............................................................................. 23
2.1 SAMPLING PROCESS DESIGN .................................................................................... 23
2.2 SAMPLING METHODS REQUIREMENTS.................................................................. 24
2.3 SAMPLE HANDLING AND CUSTODY REQUIREMENTS ....................................... 27
2.3.1 Field Logbooks .................................................................................................... 27
2.3.2 Field Sampling Records....................................................................................... 28
2.3.3 Sample Labels...................................................................................................... 28
2.3.4 Sample Designation ............................................................................................. 29
2.3.5 Chain-of-Custody Record .................................................................................... 29
2.3.6 Sample Packaging................................................................................................ 32
2.4 ANALYTICAL METHODS REQUIREMENTS............................................................. 32
2.5 QUALITY CONTROL REQUIREMENTS ..................................................................... 33
2.5.1 Field Quality Control Requirements.................................................................... 33
2.5.2 Laboratory Quality Control Requirements .......................................................... 34
2.5.2.1 Laboratory Control Samples................................................................ 34
2.5.2.2 Matrix Spike and Matrix Spike Duplicates ......................................... 34
2.5.3 Laboratory Quality Control Procedures............................................................... 35

Water Quality Sampling Quality Assurance Project Plan QAPP 408, Revision 0for TMDLs for Pecatonica Watershed, Winneshiek Creek and Spring Branch Date: December 1, 2014
Page iii of vii
Stage 2 – Water Quality Sampling
CONTENTS
Section Page
2.6 INSTRUMENT AND EQUIPMENT TESTING, INSPECTION, AND MAINTENANCEREQUIREMENTS............................................................................................................ 35
2.6.1 General Requirements.......................................................................................... 35
2.6.2 Field Equipment and Instruments ........................................................................ 36
2.6.3 Laboratory Instruments........................................................................................ 36
2.7 INSTRUMENT CALIBRATION AND FREQUENCY .................................................. 36
2.7.1 Calibration of Field Instruments .......................................................................... 37
2.7.2 Calibration of Laboratory Equipment.................................................................. 38
2.8 REQUIREMENTS FOR INSPECTION AND ACCEPTANCE OF SUPPLIES ANDCONSUMABLES............................................................................................................. 39
2.9 NON-DIRECT MEASUREMENTS ................................................................................ 40
2.10 DATA MANAGEMENT ................................................................................................. 40
3.0 ASSESSMENT AND OVERSIGHT............................................................................................. 42
3.1 ASSESSMENT AND RESPONSE ACTIONS ................................................................ 42
3.1.1 Field Assessments................................................................................................ 42
3.1.2 Laboratory Assessments ...................................................................................... 42
3.1.3 Field Corrective Action Procedures..................................................................... 43
3.1.4 Laboratory Corrective Action Procedures ........................................................... 43
3.2 REPORTS TO MANAGEMENT..................................................................................... 44
4.0 DATA VALIDATION AND USABILITY................................................................................... 45
4.1 DATA REVIEW, Verification, and validation................................................................. 45
4.2 Verification AND ValidATION METHODS................................................................... 45
4.2.1 Data Validation Responsibilities.......................................................................... 46
4.2.2 Data Validation Procedures ................................................................................. 46
4.3 RECONCILIATION WITH DATA QUALITY OBJECTIVES ...................................... 46
REFERENCES ........................................................................................................................................... 48
Attachment
A STAT QUALITY ASSURANCE MANUAL AND SOPs
B INSTRUMENT INSTRUCTION MANUALS AND SOPs

Water Quality Sampling Quality Assurance Project Plan QAPP 408, Revision 0for TMDLs for Pecatonica Watershed, Winneshiek Creek and Spring Branch Date: December 1, 2014
Page iv of vii
Stage 2 – Water Quality Sampling
TABLES
Table Page
1 KEY PROJECT PERSONNEL AND RESPONSIBILITIES.......................................................... 3
2 KEY PROJECT PERSONNEL CONTACT INFORMATION....................................................... 4
3 SUMMARY OF WATER QUALITY SAMPLING REQUIREMENTS........................................ 7
4 SAMPLING SITE DESCRIPTIONS .............................................................................................. 8
5 PROJECT DATA QUALITY OBJECTIVES ............................................................................... 12
6 SUMMARY OF MMCs, MMOs, MDLs AND RLs ..................................................................... 15
7 PERSONNEL QUALIFICATIONS .............................................................................................. 21
8 REQUIRED SAMPLE VOLUMES, ANALYTICAL METHODS, CONTAINERS,PRESERVATION TECHNIQUES, AND HOLDING TIMES..................................................... 26
9 FIELD QUALITY CONTROL SAMPLES................................................................................... 33
FIGURES
Figure Page
1 WATERSHED LOCATIONS ......................................................................................................... 2
2 TEAM ORGANIZATIONAL CHART........................................................................................... 4
3 WINNESHIEK SAMPLING SITES ............................................................................................... 9
4 SPRING BRANCH SAMPLING SITES....................................................................................... 10
5 EXAMPLE SAMPLE LABEL ...................................................................................................... 29
6 EXAMPLE CHAIN-OF-CUSTODY FORM ................................................................................ 31

Water Quality Sampling Quality Assurance Project Plan QAPP 408, Revision 0for TMDLs for Pecatonica Watershed, Winneshiek Creek and Spring Branch Date: December 1, 2014
Page v of vii
Stage 2 – Water Quality Sampling
ACRONYMS AND ABBREVIATIONS
BMP Best management practiceBOW Bureau of Water
CFR Code of Federal RegulationsCWA Clean Water Act
DO Dissolved oxygenDQO Data quality objective
GIS Geographic Information SystemGPS Global positioning system
IEPA Illinois Environmental Protection Agency
LCS Laboratory control sampleLCSD Laboratory control sample duplicate
MDL Method detection limitmg/L Milligrams per LitermL Milliliter
MMC Minimum Measurement CriteriaMMO Minimum Measurement ObjectiveMS Matrix spikeMSD Matrix spike duplicate
NH3 AmmoniaNO2 NitriteNO3 NitrateNWIS National Water Information System
PM Project manager
QA Quality assuranceQAPP Quality assurance project planQC Quality controlQCO Quality control officer
RL Reporting limitRPD Relative percent difference
SOP Standard operating procedureSM Standard methodSQL Sample quantitation limitSTART Superfund Technical Assessment and Response TeamSTAT STAT Analytical Corporation
T-ammonia Total ammoniaTDS Total dissolved solidsTetra Tech Tetra Tech Inc.

Water Quality Sampling Quality Assurance Project Plan QAPP 408, Revision 0for TMDLs for Pecatonica Watershed, Winneshiek Creek and Spring Branch Date: December 1, 2014
Page vi of vii
Stage 2 – Water Quality Sampling
TKN Total Kjeldahl nitrogenTMDL Total maximum daily loadTP Total phosphorusTS Total solidsTSS Total suspended solids
USDA U.S. Department of AgricultureUSEPA U.S. Environmental Protection AgencyUSGS U.S. Geological Survey
WAM Work assignment manager
WQ Water quality

Water Quality Sampling Quality Assurance Project Plan QAPP 408, Revision 0for TMDLs for Pecatonica Watershed, Winneshiek Creek and Spring Branch Date: December 1, 2014
Page vii of vii
Stage 2 – Water Quality Sampling
DISTRIBUTION LIST
Illinois Environnemental Protection Agency
Name: Abel HaileTitle: Illinois Environmental Protection Agency Bureau of Water
Work Assignment Manager
Name: Michelle RouseyTitle: Illinois Environmental Protection Agency Bureau of Water
Quality Assurance Officer
Tetra Tech, Inc.
Name: Andrea PlevanTitle: Tetra Tech, Inc., Project Manager
Name: John O’DonnellTitle: Tetra Tech, Inc., Quality Assurance Officer
Name: John Dirgo, Ph.D.Title: Tetra Tech, Inc., Quality Control Officer
Name: Adam PetercaTitle: Tetra Tech, Inc., Field Team Leader
STAT Analysis Corporation
Name: Jason KornfeindTitle: STAT Analysis Corporation Project Manager
Name: Tom BauerTitle: STAT Analysis Corporation Laboratory Manager – Quality Assurance Officer

Water Quality Sampling Quality Assurance Project Plan for QAPP 408, Revision 0TMDLs for Pecatonica Watershed, Winneshiek Creek and Spring Branch Date: December 1, 2014
Page 1 of 48
Stage 2 – Water Quality Sampling
INTRODUCTION
This quality assurance project plan (QAPP) has been prepared for the Illinois Environmental Protection
Agency (IEPA) for surface water quality data collection in Pecatonica watershed, including the
Winneshiek Creek and Spring Branch (see Figure 1). This QAPP was prepared by Tetra Tech, Inc. (Tetra
Tech), along with laboratory subcontractor STAT Analysis Corporation (STAT). STAT’s laboratory
capabilities for all project analytical requirements were evaluated on the basis of its quality management
system documentation (summarized in Attachment A), its geographic presence within Illinois, and its past
performance on similar and related projects.
Data will be collected to support the development of a total maximum daily load (TMDL) report for the
watershed and target water bodies identified therein (see Figure 1). This document describes the quality
control (QC) and quality assurance (QA) procedures to be used to ensure that the data generated during
field activities are accurate, complete, and representative of actual field conditions. All personnel working
on the project are required to read and comply with the procedures defined in this document to ensure the
quality and usability of the data. Field data collection and analysis will be conducted under the
responsibility of Tetra Tech.
This QAPP presents the project data quality objectives (DQO) developed through the U.S. Environmental
Protection Agency’s (USEPA) seven-step DQO process (USEPA 2006) and covers all 24 QAPP elements
required by QA/R-5 (USEPA 2001). Specifically, Section 1.0 discusses project management, Section 2.0
explains data generation and acquisition, Section 3.0 describes assessment and oversight actions, and
Section 4.0 discusses data validation and usability. Attachment A provides STAT’s specific analytical
methods and the QA manual. Attachment B includes standard operating procedures (SOP) that will be
followed during sample collection and instrument instruction manuals for field equipment.
1.0 PROJECT MANAGEMENT
This section discusses the project/task organization, the problem definition and background, the
project/task description, DQOs and criteria for measurement data, special training certification and
requirements, and documentation and records.

Water Quality Sampling Quality Assurance Project Plan for QAPP 408, Revision 0TMDLs for Pecatonica Watershed, Winneshiek Creek and Spring Branch Date: December 1, 2014
Page 2 of 48
Stage 2 – Water Quality Sampling
FIGURE 1WATERSHED LOCATIONS

Water Quality Sampling Quality Assurance Project Plan for QAPP 408, Revision 0TMDLs for Pecatonica Watershed, Winneshiek Creek and Spring Branch Date: December 1, 2014
Page 3 of 48
Stage 2 – Water Quality Sampling
1.1 PROJECT/TASK ORGANIZATION
Table 1 below summarizes the names, titles, and responsibilities of the multidisciplinary team of
technically qualified professionals who will staff this project. This team includes staff from the IEPA,
Tetra Tech, and STAT. Table 2 provides contact information for the team. Figure 2 presents a team
organizational chart and identifies project roles.
TABLE 1KEY PROJECT PERSONNEL AND RESPONSIBILITIES
Name Title and ResponsibilitiesIEPAAbel Haile BOW Work Assignment Manager (WAM) – The IEPA WAM will monitor
Tetra Tech’s performance and provide direction to the Tetra Tech projectmanager.
Michelle Rousey QA Officer – The IEPA QA officer will review and approve the QAPPdeveloped in support of this data collection effort, support the IEPA WAM in theassessment of contractor performance and in the development of technicaldirection, and participate in any audits conducted during the course of this datacollection effort. No audits are currently planned or scheduled for this project.
Tetra TechAndrea Plevan Project Manager (PM) – The project manager will coordinate project activities,
staffing, and budgets, and maintain responsibility for project QA. She willcoordinate with IEPA, oversee all field activities, and coordinate with the TetraTech sampling team leader and STAT project manager. She will also providewritten and verbal progress reports to the IEPA WAM.
John O’Donnell QA Officer – The QA Officer will assist the Project Manager in the oversight ofQAPP development, and will review and approve the final plan. Also responsiblefor consulting with the PM with respect to QA requirements and implementation,and for assisting with oversight of any significant corrective action investigationor implementation.
John Dirgo QC Officer – The QC Officer is responsible for implementing the QAPP withthe field and laboratory technical teams. The QC Officer will monitor QCactivities to determine conformance with the QAPP and review the QAPP forcompleteness and consistency. He will also be responsible for performing orverifying data validation and assessment processes.
Adam Peterca Field Team Leader – The sampling field team leader will be responsible forretrieving samples from each watershed and delivering them to the STATlaboratory and will oversee sampling activities.
Cordell Renner Field Sampling Technician – The assigned field sampling technician will assistwith collection of samples, temporary chilling and storing of sample containersprior to submittal for analysis, and coordination with the analytical laboratory.
STATJason Kornfeind Project Manager – The QA officer and project manager will oversee STAT
laboratory analytical activities. He will also coordinate data review, validation,and auditing requirements, and will review all work products for technical qualityand consistency.
Tom Bauer QA Officer/Laboratory Manager - The QA officer will ensure that the QA/QCprocedures described in this QAPP are implemented for STAT sample analysesand STAT laboratory report preparation.

Water Quality Sampling Quality Assurance Project Plan for QAPP 408, Revision 0TMDLs for Pecatonica Watershed, Winneshiek Creek and Spring Branch Date: December 1, 2014
Page 4 of 48
Stage 2 – Water Quality Sampling
TABLE 2KEY PROJECT PERSONNEL CONTACT INFORMATION
Name Title Organization EmailPhone
Number
Abel Haile Work Assignment Manager IEPA [email protected] 217-782-3362
Michelle Rousey Quality Assurance Officer IEPA [email protected] 217-785-3944
Andrea Plevan Project Manager Tetra Tech [email protected] 612-354-2224
John O’Donnell Quality Assurance Officer Tetra Tech john.o'[email protected] 703-385-6000
John Dirgo Quality Control Officer Tetra Tech [email protected] 312-201-7765
Adam Peterca Field Team Leader Tetra Tech [email protected] 312- 201-7768
Cordell Renner Field Sampling Technician Tetra Tech [email protected] 312-201-7759
Jason KornfeindProject Manager
STATAnalysis [email protected] 312-733-0551
Tom BauerQuality Assurance
Officer/Laboratory ManagerSTAT
Analysis [email protected] 312-733-0551
FIGURE 2TEAM ORGANIZATIONAL CHART

Water Quality Sampling Quality Assurance Project Plan for QAPP 408, Revision 0TMDLs for Pecatonica Watershed, Winneshiek Creek and Spring Branch Date: December 1, 2014
Page 5 of 48
Stage 2 – Water Quality Sampling
1.2 PROBLEM DEFINITION AND BACKGROUND
Section 303(d) of the Clean Water Act (CWA) and USEPA’s Water Quality Planning and Management
Regulations (Title 40 of the Code of Federal Regulations [CFR] Part 130) require states to identify water
bodies that do not meet water quality standards and to determine TMDLs for pollutants causing the
impairment. A TMDL is the total amount of pollutant load that a water body can receive and still meet the
water quality standards. It is the sum of the individual waste load allocations for point sources, load
allocations for nonpoint sources, and natural background loads with a margin of safety.
Under Section 303(d) of the CWA, IEPA has identified two segments within the Pecatonica watershed
identified in Section 1.1 as being impaired:
Winneshiek Creek (PWL-01)
Spring Branch (PWNC)
Figure 1 shows the locations of these listed segments in the watersheds. The segments have been placed
on the 303(d) list, which includes water bodies that are not meeting the State of Illinois water quality
standards.
IEPA has adopted the following three-stage approach for TMDL development:
Stage 1 – Watershed characterization, data analysis, and methodology selection
Stage 2 – Water quality sampling to fill data gaps identified during Stage 1
Stage 3 – Development of model, TMDL scenarios, and implementation plan
Tetra Tech has completed the Stage 1 report, for all of the segments, which has been reviewed by IEPA
(Tetra Tech 2014). Based on the Stage 1 report, IEPA has determined that additional data collection is
needed. IEPA has contracted Tetra Tech to conduct Stage 2 water quality sampling to support TMDL
development for the listed segments. This plan was developed to address the Stage 2 water quality
sampling.
1.3 PROJECT/TASK DESCRIPTION
The goal of the project is to collect water quality data at specific locations within each impaired segment
of the watershed for the purposes of TMDL development. The project includes the following tasks:

Water Quality Sampling Quality Assurance Project Plan for QAPP 408, Revision 0TMDLs for Pecatonica Watershed, Winneshiek Creek and Spring Branch Date: December 1, 2014
Page 6 of 48
Stage 2 – Water Quality Sampling
1. Prepare a QAPP for the data collection activities.
2. Conduct field sampling at the sampling sites including water quality and laboratory analysis.
3. Conduct a field investigation in the Spring Branch watershed for possible ammonia sources.
4. Submit three interim reports that discuss progress, problems encountered, and preliminary
findings. The first interim report will include the initial sampling plan and map(s) of monitoring
locations. The second interim report will include the resulting data and the third will be the final
report with all this information.
5. Submit the data collected for Stage 2 (in either ACCESS or EXCEL format) and a final report
which discusses data collection and/or monitoring process, data gaps and the reason therefore
should any exist, summarization of the data and the results of the collection/monitoring effort.
Table 3 summarizes the sampling requirements for the listed segments, including parameters to be
measured, sampling frequency, and timeframe. Table 4 lists the latitude and longitude of each sampling
site and provides a brief description of each site. Upon locating the sampling sites with a hand-held
Global Positioning System (GPS), Tetra Tech will evaluate the sampling site to confirm it is the best
location to collect the required samples. Conditions that may require sampling site relocation may
include:
If a discharge point for runoff into the stream is noted downstream of the proposed sampling site,
the sampling site may be relocated downstream of the discharge point.
The stream is inaccessible at the proposed sampling site.
If changes to the sampling sites locations are implemented in the field, the new sampling site locations
will be chosen in the same stream segment as the proposed sampling site noted in Figures 3 and 4. Each
final sampling site will be verified with a hand-held GPS and recorded in the field notes.
Sampling will be conducted in October – December 2014 or March 2015 depending on weather
conditions. The sampling events are to occur during varied flow conditions, yet spaced as close together
as possible. Figures 3 and 4 show the locations of sampling sites at each watershed.
The final data collection report, including the electronic water quality database, will be submitted to IEPA
for review 45 days after the final analytical data have been received.

Water Quality Sampling Quality Assurance Project Plan for QAPP 408, Revision 0TMDLs for Pecatonica Watershed, Winneshiek Creek and Spring Branch Date: December 1, 2014
Page 7 of 48
Stage 2 – Water Quality Sampling
TABLE 3SUMMARY OF WATER QUALITY SAMPLING REQUIREMENTS
Notes:
DO Dissolved oxygenNO2 + NO3 Nitrite plus nitrate-nitrogenT-ammonia Total ammoniaTKN Total Kjeldahl nitrogenTP Total phosphorusTSS Total suspended solids
WatershedWaterBody
ImpairmentCause(s) of
ConcernSegment
SamplingSite
MatrixField
ParametersLaboratoryParameter
SamplingFrequency
No. ofLocations
Dates
Pecatonica
WinneshiekCreek
TSS andphosphorus
PWL-01 WC01 Water
Temperature,DO, pH,
conductivity,flow (depth,velocity, and
streamgeometry)
TP, TSS 3 X 1Varying flow conditions
November – December 2014or March – April 2015
SpringBranch
Totalammonia
andphosphorus
PWNC
SB01SB02SB03SB04
Water
Temperature,pH,
conductivity,DO, flow(depth,
velocity andstream
geometry)
TKN, T-ammonia,
Total NO2 +NO3, TP
(downstreamonly)
3 X 3Varying flow conditions
November – December 2014or March – April 2015
GroundwaterTemperature,
DOT-ammonia,NO2 + NO3
3 X 1Varying flow conditions
November – December 2014or March – April 2015

Water Quality Sampling Quality Assurance Project Plan for QAPP 408, Revision 0TMDLs for Pecatonica Watershed, Winneshiek Creek and Spring Branch Date: December 1, 2014
Page 8 of 48
Stage 2 – Water Quality Sampling
TABLE 4SAMPLING SITE DESCRIPTIONS
Watershed Water Body SegmentSampling
SiteCounty Latitude† Longitude† Description
Pecatonica
WinneshiekCreek
PWL-01 WC01 Stephenson 42.306203 -89.514405
Approximately 215 feetupstream of Fawver Road and1.3 river miles upstream ofconfluence with PecatonicaRiver
Spring Branch PWNC
SB01 Stephenson 42.247254 -89.789886400 feet upstream from theconfluence with Yellow Creek
SB02 Stephenson 42.238077 -89.828829
375 feet upstream of SpringBranch split on the southerntributary (split occursapproximately 930 feet alongthe creek upstream from thebridge crossing at IL-73)
SB03 Stephenson 42.238921 -89.829000
240 feet upstream of SpringBranch split on the northerntributary (split occursapproximately 930 feet alongthe creek upstream from thebridge crossing at IL-73)
SB04 Stephenson 42.242022 -89.803758At the edge of Spring Branchon the downstream side of theLoran Road Bridge
†Latitude and longitude are reported using North American Datum of 1983 (NAD83)

Water Quality Sampling Quality Assurance Project Plan for QAPP 408, Revision 0TMDLs for Pecatonica Watershed, Winneshiek Creek and Spring Branch Date: December 1, 2014
Page 9 of 48
Stage 2 – Water Quality Sampling November 2014
FIGURE 3WINNESHIEK SAMPLING SITES

Water Quality Sampling Quality Assurance Project Plan for QAPP 408, Revision 0TMDLs for Pecatonica Watershed, Winneshiek Creek and Spring Branch Date: December 1, 2014
Page 10 of 48
Stage 2 – Water Quality Sampling November 2014
FIGURE 4SPRING BRANCH SAMPLING SITES

Water Quality Sampling Quality Assurance Project Plan for QAPP 408, Revision 0TMDLs for Pecatonica Watershed, Winneshiek Creek and Spring Branch Date: December 1, 2014
Page 11 of 48
Stage 2 – Water Quality Sampling November 2014
1.4 DATA QUALITY OBJECTIVES AND CRITERIA FOR MEASUREMENT DATA
This section describes the DQOs and measurement quality objectives (such as precision and accuracy) for
data that will be collected.
1.4.1 Data Quality Objectives
DQOs are qualitative and quantitative statements developed through a seven-step process based on
USEPA’s guidance for planning data collection projects (2006). Table 5 summarizes the project-specific
DQOs. The seven steps are as follows:
Step 1. State the Problem. Concisely describe the problem to be studied.
Step 2. Identify the Goals of the Study. Identify what questions the study will attempt to answerand what actions may result.
Step 3. Identify Information Inputs. Identify information that needs to be obtained andmeasurements that need to be taken to make decisions and resolve key study questions.
Step 4. Define the Study Boundaries. Specify the time periods and spatial area to which thestudy results will apply.
Step 5. Develop the Analytical Approach. The purpose of this step is to define specificparameters of interest, specify action levels for these parameters, integrate this information withoutputs from previous DQO steps, and describe a logical basis for choosing appropriate actionsbased on study results.
Step 6. Specify Performance or Acceptance Criteria. Identify the performance or acceptancecriteria that the collected data will need to achieve to minimize the possibility of either makingerroneous conclusions or incorrect decisions.
Step 7. Develop the Plan for Collecting Data. Evaluate information from the previous steps andgenerate alternative data collection designs.
Table 5 summarizes the DQOs for the project.
1.4.2 Measurement Quality Objectives
The overall QA objective for this water quality sampling effort is to implement procedures for field
sampling, chain of custody, laboratory analysis, and data reporting to produce well-documented data of
known quality.

Water Quality Sampling Quality Assurance Project Plan for QAPP 408, Revision 0TMDLs for Pecatonica Watershed, Winneshiek Creek and Spring Branch Date: December 1, 2014
Page 12 of 48
Stage 2 – Water Quality Sampling November 2014
TABLE 5PROJECT DATA QUALITY OBJECTIVES
STEP 1 STEP 2 STEP 3 STEP 4 STEP 5 STEP 6 STEP 7State the Problem Identify the Goals of
the StudyIdentify
Information InputsDefine StudyBoundaries
Develop theAnalyticalApproach
Specify Performanceor Acceptance
Criteria
Develop the Plan forCollecting Data
Two segmentswithin thePecatonicawatershed inIllinois have beenidentified byIEPA as beingimpaired and havebeen placed onthe 303(d) list.
Supplementaldata must becollected tocomplete TMDLdevelopment.
This data collectionwill inform estimatesof pollutant loads frompoint sources andnonpoint sources in thestudy area.
Based on the Stage 2sampling results, IEPAwill prepare animplementation planthat uses BMPs toreduce the existingpollutant loads andachieve the TMDLgoals, eventuallybringing the waterbody in compliancewith water qualitystandards.
Numeric andnarrative waterquality standards toestablish analyticalgoals for the Stage 2sampling, waterquality targetsdescribed in Stage 1report
Hydrologic andwater quality data
Known pointsources andnonpoint sourcesfrom watershed areaactivities/operations
National or localweather serviceforecasts to predictprecipitation eventsand variable flowconditions
The spatial boundaryof the study isdefined by thefollowing waterbodies: Winneshiek
Creek Spring Branch
The temporalboundary of thestudy is Octoberthrough December2014 and March2015
Sampling sites wereselected based onStage 1 results forthe watershed.
Samples will becollected undervariable flowconditions from twosegments in thePecatonicawatershed primarilyto fill data gapsidentified duringStage 1.
The sampling design isnot statistically based;therefore, there are nospecific decision errorsthat apply to projectresults.
Measurements will beperformed by qualifiedfield personnel and afully accreditedanalytical laboratory.
The analyticallaboratory will employmethods which aresuitably sensitive tocharacterize conditionsrelative to prevailingWQ standards and WQtargets described inStage 1, and for whichit retains currentaccreditation and validprocedures.
Sampling in eachwater body will bedirected. Thesampling sites wereselected based ondata gaps identifiedduring Stage 1 andinclude stations thatalready exist on thewater bodies.
Field staff willendeavor to capturemultiple flowconditions throughcoordination withthe laboratory andforecastinginformationavailable from thenational or localforecasts
Specific samplingprotocols arepresented inSection 2.2.
Notes:BMP Best management practiceIEPA Illinois Environmental Protection AgencyTMDL Total maximum daily loadWQ Water Quality

Water Quality Sampling Quality Assurance Project Plan forTMDLs for Pecatonica Watershed, Winneshiek Creek and Spring Branch
QAPP 408, Revision 0Date: December 1, 2014
Page 13 of 48
Stage 2 Water Quality Sampling
Other sections of this QAPP describe specific procedures for sampling, chain-of-custody documentation,
laboratory instrument calibration, laboratory analysis, data reporting, internal QC, audits, preventive
maintenance of field equipment, and corrective action. The purpose of this section is to address the level
of QC effort and the specific QA objectives for the data quality indicators of sensitivity, accuracy,
precision, completeness, representativeness, and comparability. Specific measurement quality objectives
for precision and accuracy of the analytical methods to be used are included in the laboratory SOPs for
those methods.
If analytical data fail to meet the QA objectives described in this section, Tetra Tech will explain in
writing why the data failed to meet the objectives (for example, matrix interferences caused by a high
concentration of one analyte would require dilution of the sample and an increase in the reporting limit)
and will describe the limitations and usefulness of the data. The following corrective actions may be taken
for data that do not meet QA objectives: (1) verifying that the analytical measurement system was in
control; (2) thoroughly checking all calculations; (3) assuming a sufficient quantity of sample is available,
reanalyzing the affected samples if authorized by IEPA; and (4) reporting data with appropriate qualifiers.
Corrective actions are discussed in Section 3.1.
1.4.2.1 Sensitivity
The QA objective for sensitivity is expressed in the form of the method detection limit (MDL) or
quantitation limit for the analytical method selected. Analyte MDLs shall be determined by the USEPA
method given in the Code of Federal Regulations (CFR), Volume 40, Part 136, Appendix B. The MDL is
defined as “the minimum concentration of a substance that can be measured and reported with 99%
confidence that the analyte concentration is greater than zero and is determined from analysis of a sample
in a given matrix containing the analyte.” Since the MDL procedure is based upon precision obtained for
a standard greater than the MDL, it also is a measure of method sensitivity at concentrations near the
MDL.
Quantitation limits, however, reflect the influences of the sample matrix on method sensitivity and are
typically higher than detection limits. Quantitation limits indicate the amount of material needed to
produce an instrument response that can be routinely identified and reliably quantified.

Water Quality Sampling Quality Assurance Project Plan forTMDLs for Pecatonica Watershed, Winneshiek Creek and Spring Branch
QAPP 408, Revision 0Date: December 1, 2014
Page 14 of 48
Stage 2 Water Quality Sampling
STAT’s quantitation limits are listed in the SOPs in Attachment A. STAT will provide results to the
sensitivity of the MDL with appropriate data qualifiers. The reporting limits (RLs) are the level to which
data are reported administratively for a specific test method and/or sample. The laboratory maintains RLs
higher than MDLs. The RL is considered the same as sample quantitation limit (SQL). Table 6
summarizes MMCs, MMOs, MDLs and RLs for various parameters. MMC are State of Illinois water
quality standards for general use waters where applicable. Where no MMC can be identified, the water
samples will be analyzed to the lowest concentration readily achievable by the STAT laboratory. The
MMO will be set at approximately one-fifth of the minimum measurement criteria shown to ensure that
analytes will be measured with reasonable accuracy at the MMC concentrations, and measured to
reasonable levels below the MMC.

Water Quality Sampling Quality Assurance Project Plan forTMDLs for Pecatonica Watershed, Winneshiek Creek and Spring Branch
QAPP 408, Revision 0Date: December 1, 2014
Page 15 of 48
Stage 2 Water Quality Sampling
TABLE 6SUMMARY OF MMC, MMO, AND MDLs AND RLs
Parameter Method Matrix MMC MMO MDL RLMS/MSDAccuracy
MS/MSDPrecision
LCSAccuracy
LCS Completeness
T-ammonia SM 4500-NH3 C-1997 Water 15.0 mg/L NA 0.025 mg/L 0.05 mg/L 75-125% <20% 80-120% 90%
Total NO2 +NO3
SM 4500NO3 F-2000 Water No Standard NA 0.035 mg/L 0.2 mg/L 75-125% <20% 80-120% 90%
TKN EPA 351.2 v2.0 1993 Water No Standard NA 0.3 mg/L 1.0 mg/L 75-125% <20% 80-120% 90%
TSS SM 2540 D-1997 Water No Standard NA 3.82 mg/L 7.5 mg/L NA NA 80-120% 90%
Phosphorus –Total
SM 4500P B,E-1999 Water 0.05 mg/L NA 0.01 mg/L 0.01 mg/L 75-125% <20% 80-120% 90%
TemperatureHoriba U-10
Instruction Manual*;SOP 061* and 11-2*
Water NA 1º C NA NA NA NA NA NA
DOHoriba U-10
Instruction Manual*Water NA
0.1mg/L
NA NA NA NA NA NA
pHHoriba U-10
Instruction Manual*;SOP 061* and 012-3*
Water NA 0.1 pH NA NA NA NA NA NA
ConductivityHoriba U-10
Instruction Manual*;SOP 061* and 013-2*
Water NA0.1
mS/cmNA NA NA NA NA NA
Flow Flowwatch Manual* Water NA0.1m/s
NA NA NA NA NA NA
Notes:
º C Degree CelsiusDO Dissolved oxygenEPA Environmental Protection AgencyLCS Laboratory control sampleMDL Method detection limitm/s Meters per secondmg/L Milligram per litermS/cm Micro Siemens per centimeterMMC Minimum Measurement Criteria (State of Illinois
General Water Use Quality Standard)MMO Minimum measurement objectiveMS/MSD Matrix spike/matrix spike dublicate
NA Not applicableNH3 AmmoniaNO2 NitriteNO3 NitrateRL Reporting limitSOP Standard operating procedureSM Standard MethodT-ammonia Total ammoniaTKN Total Kjeldahl nitrogenTSS Total suspended solids* Presented in Appendix B

Water Quality Sampling Quality Assurance Project Plan forTMDLs for Pecatonica Watershed, Winneshiek Creek and Spring Branch
QAPP 408, Revision 0Date: December 1, 2014
Page 16 of 48
Stage 2 Water Quality Sampling
1.4.2.2 Accuracy
Accuracy is the degree of agreement between an analytical measurement and a reference accepted as a
true value. The accuracy of a measurement system is affected by errors introduced through the sampling
process by field contamination, sample preservation, and sample handling. Other factors that may affect
accuracy are sample matrix, sample preparation, and analytical techniques. Sampling bias will be assessed
based on the results of the analysis of field duplicates, and on correlation of field data to laboratory
analytical results. Field duplicates are two samples collected from the same location and submitted blind
to the laboratory to identify the same analyte detection. The analytical laboratory will analyze laboratory
blanks and laboratory control samples (LCS) to evaluate laboratory accuracy in accordance with STAT’s
QA manual. Laboratory blanks are aliquots of laboratory reagent water processed with samples through
the entire analytical process to demonstrate that no target analytes are introduced in the measurement
system. LCSs are aliquots of laboratory water that have been spiked with known concentrations of target
analytes, and processed with environmental samples to assess potential bias of the measurement system.
These QC samples will be analyzed in each analytical batch or one set per analytical batch, whichever is
more frequent. The results of the spiked samples are used to calculate the percent recovery for evaluating
accuracy using the following formula:
Percent Recovery = [(S - C) / T] *100 (Equation 1)
where
S = Measured spiked sample concentration
C = Sample concentration
T = True or actual concentration of the spike
Data may be evaluated for accuracy using, in order of priority, LCSs and LCS duplicates (LCSD) and
matrix spike/matrix spike duplicates (MS/MSD). Failures of LCS, or LCSDs to meet QC criteria may
invalidate data, while MS/MSD results should be used with caution in assessing overall analytical bias
and precision.
Samples will be collected in sufficient quantity so that the laboratory has enough volume to accommodate
MS/MSD and laboratory duplicates in addition to an aliquot reserved for actual sample analysis. The
designated laboratory QC sample will include sufficient volume so that one reanalysis may be performed

Water Quality Sampling Quality Assurance Project Plan forTMDLs for Pecatonica Watershed, Winneshiek Creek and Spring Branch
QAPP 408, Revision 0Date: December 1, 2014
Page 17 of 48
Stage 2 Water Quality Sampling
if necessary. The sample chosen for laboratory QC sample collection shall be randomly selected for the
initial sampling event and rotated from one sampling location to the next for subsequent sampling events.
1.4.2.3 Precision
Precision is the degree of mutual agreement between individual measurements of the same property under
prescribed similar conditions. Data precision is affected by field sampling precision and laboratory
analytical precision. It is evaluated by collecting and analyzing field duplicates at a frequency of
10 percent or at least once per event. Field duplicates are used to assess precision for the entire sample
collection and measurement systems. Laboratory precision is evaluated by analyzing laboratory duplicates
or MS/MSDs as appropriate for the reference method. A laboratory duplicate would be analyzed if called
for in the laboratory’s SOP. A laboratory duplicate might also be used to evaluate precision for an
analysis that does not use or require MS/MSD samples. Laboratory duplicates or MS/MSD pairs are
usually prepared and analyzed at a rate of one per analytical batch. The results of the duplicate analysis
are used to calculate the relative percent difference (RPD) for evaluating precision using the following
formula:
RPD = [(A – B) / (A + B)/2] *100 (Equation 2)
where
A = Original sample concentration
B = Duplicate sample concentration
Four factors may impair the precision of duplicate data: matrix interference, laboratory imprecision,
sample heterogeneity, and the nature of the RPD calculation when applied to low native-sample
concentrations. Constituents present in the field sample may interfere with accurate quantification of the
target analyte. Laboratory imprecision is a result of inconsistency in preparing and analyzing the samples.
Heterogeneity in sediment samples is inherent because of the varied composition of natural materials and
the subsequent difficulty in collecting homogeneous samples. The relatively small sample sizes used in
inorganic analyses increases the potential for heterogeneity. Because the RPD calculation compares the
absolute difference of the values to the mean, if nondetect results are treated as zeros and only one of the
samples yields a nondetect result, the calculation would always yield an inflated 200 percent RPD result.
Even with the reporting of estimated results below the sample quantitation limit, low-level sample results
may indicate high RPDs and thus poor precision. Precision results require close examination when low-

Water Quality Sampling Quality Assurance Project Plan forTMDLs for Pecatonica Watershed, Winneshiek Creek and Spring Branch
QAPP 408, Revision 0Date: December 1, 2014
Page 18 of 48
Stage 2 Water Quality Sampling
level sample concentrations are being assessed. Data are generally not qualified strictly on the basis of
duplicate sample precision; rather, a determination must be made as to whether an apparent precision
deficit is due to matrix interference, heterogeneity, or field or laboratory imprecision.
1.4.2.4 Completeness
Completeness is defined as an assessment of the amount of valid analytical data obtained from a
measurement system compared with the amount of analytical data needed to achieve a particular level of
confidence. The percent completeness is calculated by dividing the number of valid sample results by the
total number of samples planned, and multiplying the result by 100 percent. Completeness will be
reported as the percentage of all measurements judged valid. The following equation will be used to
determine completeness:
%C = (V/T) * 100% (Equation 3)
where
%C = Percent completeness
V = Number of measurements judged valid
T = Total number of measurements planned
For this project, the QA objective for degree of completeness for both field and laboratory data is
90 percent. If completeness is less than the target of 90 percent, Tetra Tech will evaluate the data to
determine whether (1) there are enough data to complete the TMDLs or (2) additional data collection is
necessary.
1.4.2.5 Representativeness
Representativeness expresses the degree to which sample data accurately and precisely represent the
characteristics of a population, parameter variations at a sampling point, or an environmental condition
that they are intended to represent. Representativeness of data will be ensured using established field and
laboratory procedures and their consistent application. To aid in the evaluation of the representativeness
of the sample data, field and laboratory blank samples will be evaluated for the presence of contaminants,
and all data will be compared with available historical results and with results for similar samples
collected during the study. Data deemed non-representative through comparison with existing data will be
used only if accompanied by appropriate data qualifiers and limits of uncertainty.

Water Quality Sampling Quality Assurance Project Plan forTMDLs for Pecatonica Watershed, Winneshiek Creek and Spring Branch
QAPP 408, Revision 0Date: December 1, 2014
Page 19 of 48
Stage 2 Water Quality Sampling
1.4.2.6 Comparability
Comparability expresses the confidence with which one data set can be compared with another.
Comparability will be maximized by using standard analytical methods and standardized, documented
sampling techniques. Tetra Tech will document all sampling locations, conditions, and field sampling
methods. All results will be reported in standard units or, for field parameters, as defined in the method.
All laboratory calibrations will be performed using standards traceable to the National Institute for
Standards and Technology, IEPA-approved sources, or another certified reference standard source.
1.5 SPECIAL TRAINING CERTIFICATION AND REQUIREMENTS
Tetra Tech employs professionals who have been educated and trained in all aspects of water quality
sampling, and maintains comprehensive training programs to ensure that staff are up-to-date in proper
techniques for collecting representative samples from aquatic environments. As shown in Table 7, Tetra
Tech personnel are experienced at sampling a wide variety of media, including surface water and
sediment. In addition, Tetra Tech is not aware of any certifications or requirements necessary to complete
this sampling project.
Prior to the first sampling event, the Tetra Tech project manager and sampling personnel will review the
field procedures outlined in the QAPP, including the SOPs, and health and safety concerns. The Tetra
Tech project manager will ensure that any additional sampling personnel will have similar qualifications
and will review the QAPP and field procedures before their first sampling event.
1.6 DOCUMENTATION AND RECORDS
This section discusses the procedures for maintaining field operation, laboratory, and data handling
records. All records will be stored in a specific project folder on Tetra Tech’s internal drive. The drive is
password protected with only Tetra Tech personnel having access. Tetra Tech maintains project
documents and records for a minimum of 10 years. Hard copies of documents such as field log books will
be scanned and stored on Tetra Tech’s password protected internal drive. After electronic distribution to
IEPA and the field team, the final approved QAPP with signatures and dates will be stored on Tetra
Tech’s internal drive in the project specific folder.

Water Quality Sampling Quality Assurance Project Plan forTMDLs for Pecatonica Watershed, Winneshiek Creek and Spring Branch
QAPP 408, Revision 0Date: December 1, 2014
Page 20 of 48
Stage 2 Water Quality Sampling
1.6.1 Field Operation Records
Overall field operations will be documented. The documentation will consist of the following: sample
collection records, chain-of-custody records, QC sample records, records of general field procedures, and
corrective action reports. Documentation during sampling is essential to ensure proper sample
identification. Standard sample custody procedures will be used to maintain and document sample
integrity during collection, transportation, storage, and analysis. Field personnel will use permanently
bound field logbooks (See SOP 024) with sequentially numbered pages to maintain field records. The
front cover of the logbook will list the contract name and number, the project number, the site name,
names of subcontractors, the client, and name of the project manager. The following information will be
recorded in the field logbook:
Name and affiliation of all personnel present
Weather conditions during the field activity
Log and summary of daily activities and significant events
References to other field logbooks or forms that contain specific information
Discussions of problems encountered and their resolution
Discussions of deviations from the QAPP or other governing documents
Description of all photographs taken

Water Quality Sampling Quality Assurance Project Plan forTMDLs for Pecatonica Watershed, Winneshiek Creek and Spring Branch
QAPP 408, Revision 0Date: December 1, 2014
Page 21 of 48
Stage 2 Water Quality Sampling
TABLE 7PERSONNEL QUALIFICATIONS
Employee Years ofExperience
SPECIFIC TRAINING AND QUALIFICATIONS
Andrea Plevan 14 Ms. Plevan has 14 years of experience in water qualityinvestigations, aquatic ecology, total maximum daily load studies,lake and watershed management plans, and monitoring plans. Shehas overseen monitoring and data collection for a variety of lake,stream, and watershed water quality investigations.
John O’Donnell 32 Mr. O’Donnell is an analytical chemist by training with over 20years of laboratory and field sampling and analysis experience, andover 12 years of direct quality assurance management. He is amember of Tetra Tech’s Quality Council and is responsible for thepreparation of quality system descriptions (quality managementplans [QMPs]); oversight, development and implementation ofprogram and project-specific QA Guidance (QAPPs); developmentof standard operating procedures; participating in quality reviewprocesses including document and data reviews; and for overseeingcorrective action investigations, identification of remedies, andverification of corrective action effectiveness.
John Dirgo 35 Dr. Dirgo has 35 years of experience in air compliance andregulatory support, source and ambient air sampling, air pollutioncontrol, hazardous waste site investigations, risk assessment, andcompliance evaluations. He is currently a member of Tetra Tech’scorporate quality management team. He regularly conducts QAaudits of program activities; provides corrective actionrecommendations for work that does not fully meet programstandards; and provides corporate resources to assist in resolvingQA issues.
Adam Peterca 5 Mr. Peterca has over 5 years of experience in the environmental field as anecological engineer. He has experience sampling a variety ofenvironmental media, including designing habitat and biota assessments.In addition, Mr. Peterca has experience with habitat restoration design,including hydrologic and hydraulic modeling. Mr. Peterca is a projectmanager for EPA’s Superfund Technical Assessment and Response Team(START), and also has experience conducting environmental assessmentsand wetland delineations.
Cordell Renner 1 Mr. Renner has over 1 year of applied experience as an environmentalscientist. He has experience sampling a variety of environmental media.Mr. Renner has assisted in investigation activities at several contaminatedsites. Mr. Renner has also conducted numerous groundwater, soil, surfacewater, and waste water sampling events.

Water Quality Sampling Quality Assurance Project Plan forTMDLs for Pecatonica Watershed, Winneshiek Creek and Spring Branch
QAPP 408, Revision 0Date: December 1, 2014
Page 22 of 48
Stage 2 Water Quality Sampling
1.6.2 Laboratory Records
The following documentation will be required from STAT:
Transmittal letter
Case narratives, which will describe all QC nonconformances encountered during analysis ofsamples, in addition to any corrective actions taken, including
Sample results
Laboratory chronicle
Summary QC results, including but not limited to the following:
– Method blanks– Spike blanks– Matrix spike/matrix spike duplicate
Chain-of-custody forms pertaining to each sample delivery group or sample batch analyzed
List of data qualifiers and abbreviations
The project manager, in cooperation with the QA officer, will define site-specific requirements for data
reporting. The laboratory QA officer is responsible for ensuring that all laboratory data reporting
requirements in the QAPP are met.
1.6.3 Data Handling Records
Records documenting the protocols used in data reduction, verification, and validation will be maintained
primarily by the project manager but also possibly by the QA officer. Data reduction protocols address
operations such as converting raw data into reportable quantities and units, use of significant figures,
recording of extreme values, and blank corrections. Data verification ensures the accuracy of data
transcription and calculations, if necessary, through the manual checking of a set of computer
calculations. Data validation ensures that QC criteria are met.
STAT will submit analytical data reports to Tetra Tech. Each data report will contain a case narrative that
briefly describes the number of samples, the analyses, and any noteworthy analytical difficulties or
QA/QC issues associated with the submitted samples. The data report will also include signed chain-of-
custody forms, cooler receipt forms, analytical data, a QC package, and raw data.

Water Quality Sampling Quality Assurance Project Plan forTMDLs for Pecatonica Watershed, Winneshiek Creek and Spring Branch
QAPP 408, Revision 0Date: December 1, 2014
Page 23 of 48
Stage 2 Water Quality Sampling
2.0 DATA GENERATION AND ACQUISITION
This section describes the collection and analysis of the samples as well as the processes employed to
ensure the quality of the data. Section 2.1 summarizes the sampling process design. Section 2.2 describes
sampling methods requirements. Section 2.3 includes information on sample handling and custody.
Section 2.4 discusses analytical methods requirements. Section 2.5 discusses QC requirements. Sections
2.6 and 2.7 discuss the instrument and equipment testing, inspection, and maintenance, and instrument
calibration and frequency, respectively. Section 2.8 discusses requirements for inspection and acceptance
of supplies and consumables. Section 2.9 describes non-direct measurements. Section 2.10 discusses data
management.
2.1 SAMPLING PROCESS DESIGN
Based on the data gaps identified in the Stage 1 reports, samples will be collected from two segments
within the watersheds as shown in Figure 1. Figures 3 and 4 show the specific sampling sites along each
segment. Table 3 in Section 1.3 provides a complete summary of the sampling design for this project,
including the matrices, field and laboratory parameters, sampling frequency, and sampling dates for each
location.
At the sampling site on Winneshiek Creek, field measurements will be made for the following water
quality parameters: temperature, dissolved oxygen (DO), pH, and conductivity. Flow information
including depth, velocity, and stream geometry will also be measured. Water samples will be collected for
laboratory analysis for concentrations of total phosphorus (TP) and total suspended solids (TSS).
At each sampling site along Spring Branch, field measurements will be made for the following water
quality parameters: temperature, DO, pH, and conductivity. Flow information including depth, velocity,
and stream geometry will also be measured. Water samples will be collected for laboratory analysis for
concentrations of total Kjeldahl nitrogen (TKN), total ammonia (T-ammonia), Total nitrite (NO2)/nitrate
(NO3). TP will be collected at the most downstream site only. Field measurements will be collected in the
streams between 0 and 1 foot below the water surface. Water samples will be delivered to the laboratory,
STAT, for filtration and analysis.
Water Quality Sampling Quality Assurance Project Plan forTMDLs for Pecatonica Watershed, Winneshiek Creek and Spring Branch
QAPP 408, Revision 0Date: December 1, 2014
Page 24 of 48
Stage 2 Water Quality Sampling
A groundwater grab sample will be collected from a shallow well at one location along Spring Branch. If
a shallow well is not found, alternate field methods to obtain shallow groundwater samples (e.g., seeps,
springs, mini-piezometer) will be investigated. Assuming a shallow well is not found in the area, a seep or
spring will be sampled. If a seep or spring is not found in the field, groundwater grab samples will be
collected from a mini-piezometer installed at sample point SB-04 in Figure 4. The groundwater sample
will be analyzed for t- ammonia and nitrite plus nitrate, and field measurements will be made for
temperature and DO. Groundwater sampling will follow SOP No. 010 “Groundwater Sampling” (see
Attachment B).
Stream sampling procedures will occur at the center of the stream and will follow SOP No. 009, Section
2.1, “Surface Water Sampling by Submerging Sample Container” (see Attachment B). Stream samples
will be collected from 0 and 1 foot below the water surface. A composite sample will be collected of
water from the left bank, right bank, and center of the stream. The samples and measurements will be
collected between November and December of 2014 or between March and April of 2015 at varying
flows, although spaced as close as possible together. If a high flow event does not occur during this time
period, sampling may be conducted in March of 2015 to collect high flow conditions.
In Spring Branch, channel substrate, percent cloud cover, percent shading, and coarse streamside
vegetative summary will be observed at the surface to help evaluate the streambed material composition.
If the site conditions (such as accessibility) permit, the stream shading data collection will extend between
the upper and lower monitoring sites. Percent shading will be determined by taking a photo of the stream
and estimating the amount of shade that falls on the water.
2.2 SAMPLING METHODS REQUIREMENTS
For each sampling method, Tetra Tech will follow procedures outlined in the SOPs included in
Attachment B. The sampling methods and SOPs include the following:
Surface water sampling (see SOP No. 009, Section 2.1, for surficial stream sampling)
Groundwater sampling (SOP No. 010)

Water Quality Sampling Quality Assurance Project Plan forTMDLs for Pecatonica Watershed, Winneshiek Creek and Spring Branch
QAPP 408, Revision 0Date: December 1, 2014
Page 25 of 48
Stage 2 Water Quality Sampling
Tetra Tech will use a Horiba U-10 Water Quality Checker or similar device to measure the remaining
field parameters. The Horiba U-10 Water Quality Checker instruction manual is included in Attachment
B and includes procedures (see SOP 061) for measuring pH, conductivity, DO, turbidity, and temperature
(see Section 2 of the instruction manual).
Tetra Tech will use a Flowatch® flow measurement instrument or similar device to measure water
velocity at each of the sampling locations. The instruction manual is included in Attachment B and
includes procedures for measuring water velocity. Discharge will be computed by multiplying the water
velocity in each segment by its corresponding cross-sectional area. The cross-sectional area will be
calculated as the sum of all the segmental areas across the width of the stream at various individual water
depths. Table 8 summarizes the sample volume, preservation technique, and holding time requirements
for each laboratory analytical parameter.

Water Quality Sampling Quality Assurance Project Plan forTMDLs for Pecatonica Watershed, Winneshiek Creek and Spring Branch
QAPP 408, Revision 0Date: December 1, 2014
Page 26 of 48
Stage 2 Water Quality Sampling
TABLE 8REQUIRED SAMPLE VOLUMES, ANALYTICAL METHODS, CONTAINERS,
PRESERVATION TECHNIQUES, AND HOLDING TIMES
Parameter Analytical MethodInstrumentation-
Equipment
Volumeand
Container
PreservationTechnique
HoldingTimea
Laboratory
T-ammonia SM 4500-NH3 C-1997Selective ion
probe
1-L plasticbottle
Chill to ≤6ºC, pH2 with H2SO4
28 days
Total NO2 +NO3
SM 4500NO3 F-2000 Spectrophotometer1-L plastic
bottleChill to ≤6ºC, pH2 with
H2SO428 daysb
TKN EPA 351.2 v2.0 1993 Spectrophotometer1-L plastic
bottleChill to ≤6ºC, pH<2
with H2SO428 days
TSS SM 2540 D-1997Gravimetric-
analytical balance1-L plastic
bottleChill to <6ºC 7 days
Phosphorus– Total
SM 4500P B,E-1999 Spectrophotometer1-L plastic
bottleChill to ≤6ºC, pH<2
with H2SO428 days
Field
TemperatureHoriba U-10
Instruction Manual*;SOP 061* and 11-2*
Horiba U-10Plasticbottle
NA NA
DOHoriba U-10
Instruction Manual*Horiba U-10
Plasticbottle
NA NA
pHHoriba U-10
Instruction Manual*;SOP 061* and 012-3*
Horiba U-10Plasticbottle
NA NA
ConductivityHoriba U-10
Instruction Manual*;SOP 061* and 013-2*
Horiba U-10Plasticbottle
NA NA
Flow Flowwatch Manual* Flowwatch NA NA NA
Notes:
H2SO4 Sulfuric acidL LiterNH3 AmmoniaNO2 NitriteNO3 NitrateT-ammonia Total ammonia
TKN Total Kjeldahl nitrogenTP Total phosphorusTSS Total suspended solidsEPA Environmental Protection Agency
SM Standard Method
* Presented in Appendix B
a Holding time is measured from the time of sample collection to the time of sample preparation, extraction, or analysis.
b Samples to be analyzed for NO2 and NO3 only must be chilled to < 6ºC and analyzed within 48 hours; however, for thecombined analysis of NO2 + NO3, samples may be acidified, chilled, and analyzed within 28 days. Similarly, if samplesare to be analyzed for orthophosphate, they must be chilled to <6ºC and filtered within 15 minutes before analyzed andanalyzed within 48 hours; however, samples to be analyzed for TP may be acidified, chilled, and analyzed within 28days.

Water Quality Sampling Quality Assurance Project Plan forTMDLs for Pecatonica Watershed, Winneshiek Creek and Spring Branch
QAPP 408, Revision 0Date: December 1, 2014
Page 27 of 48
Stage 2 Water Quality Sampling
2.3 SAMPLE HANDLING AND CUSTODY REQUIREMENTS
Each sample collected by Tetra Tech will be traceable from the point of collection through analysis and
final disposition to ensure sample integrity. The team will use standard procedures to identify, track,
monitor, and maintain the chain of custody for all samples. These procedures are discussed below.
2.3.1 Field Logbooks
Daily field activities will be documented through journal entries in a bound field logbook dedicated to the
project. The logbook will be water-resistant, and all entries will be made in indelible ink. The logbook
will contain all pertinent information about sampling activities, site conditions, field methods used,
general observations, and other pertinent technical information. Examples of typical logbook entries
include the following:
Personnel present
Daily temperature and other climatic conditions including cloud cover
Field measurements, activities, and observations
Referenced sampling site descriptions (in relation to a stationary landmark) and map
Media sampled
Sample collection methods and equipment
Dates and times of sample collection
Types of sample containers used
Sample identification and cross-referencing
Sample types and preservatives used
Analytical parameters
Sampling personnel, distribution, and transporters
Instrument calibration procedures and frequency, and calibration records
The sampling team leader or designee will be responsible for maintaining all field records. Each logbook
page will be numbered, dated, and signed by the person making the entry. Corrections to the logbook will
be made by using a single strike mark through the entry to be corrected, then recording and initialing the
correct entry. For corrections made at a later date, the date of the correction will be noted.

Water Quality Sampling Quality Assurance Project Plan forTMDLs for Pecatonica Watershed, Winneshiek Creek and Spring Branch
QAPP 408, Revision 0Date: December 1, 2014
Page 28 of 48
Stage 2 Water Quality Sampling
Color digital photographs will be taken during the sampling activities. The name of the photographer,
date, time, site location, photograph orientation, and photograph description will be entered in the
logbook as photographs are taken.
Data collection sheets will be used to record all information pertaining to field measurements.
Information on these sheets will include sample identification, location (including latitude and longitude),
sampler, weather conditions, sample matrix, and the measured value for each parameter. Personnel
conducting sample measurements will be responsible for completing the data collection sheets. The
sampling team leader will review the sheets in the field to verify completion and accuracy.
2.3.2 Field Sampling Records
Logbooks, data collection sheets, and chain-of-custody forms will contain all information pertaining to
sample collection. Information recorded will include sample identification, location (including latitude
and longitude), sampling depth, date, time, sampler, and sample matrix. Ultimate responsibility for
maintaining and recording information belongs to the sampling team leader. All paperwork will be
completed using indelible ink.
2.3.3 Sample Labels
A sample label will be affixed to each sample container sent to the laboratory. This identification label
will be completed with the following information in indelible ink:
Water body (for example, “WC” for Winneshiek Creek)
Sample designation (see Section 2.3.4)
Date and time of sample collection
Preservative used
Sample collector’s initials
Analysis required
An example of a blank sample label is shown in Figure 5.

Water Quality Sampling Quality Assurance Project Plan forTMDLs for Pecatonica Watershed, Winneshiek Creek and Spring Branch
QAPP 408, Revision 0Date: December 1, 2014
Page 29 of 48
Stage 2 Water Quality Sampling
FIGURE 5EXAMPLE SAMPLE LABEL
2.3.4 Sample Designation
A sample numbering scheme has been developed to allow each sample to be uniquely identified and to
provide a means of tracking the sample from collection through analysis. The numbering scheme
indicates the sampling site, sample type (W = water), collection date, sample number, and depth (if
applicable). For example, the first water sample collected from Winneshiek Creek would be designated
WC01-W-082714-1(0-12). The unique sample number will be entered on sample labels, chain-of-custody
forms, and other records documenting sampling activities.
QC samples will be designated as follows: field duplicates will be designated by “FD” after the sample
type designation (“W”), respectively.
2.3.5 Chain-of-Custody Record
Standard sample chain-of-custody procedures will be used to maintain and document sample integrity
during collection, transportation, storage, and analysis. Sample chain-of-custody documents must be
written in indelible ink. Where necessary, the documents will be corrected by drawing one line through
the incorrect entry, entering the correct information, and initialing and dating the correction. A sample is
considered to be in custody if one of the following statements applies:
It is in a person’s physical possession or view.
It is in a secure area with restricted access.
It is placed in a container and secured with an official custody seal so that the sample cannot bereached without breaking the seal.

Water Quality Sampling Quality Assurance Project Plan forTMDLs for Pecatonica Watershed, Winneshiek Creek and Spring Branch
QAPP 408, Revision 0Date: December 1, 2014
Page 30 of 48
Stage 2 Water Quality Sampling
Samples and documentation must be maintained in the custody of authorized personnel or under
documented control in a secure area. The sampling team leader is responsible for proper sample handling
and documentation, so that the possession and handling of individual samples can be traced from the time
of collection to laboratory receipt. STAT’s QA officer is responsible for establishing a control system that
will allow sample possession to be traced from laboratory receipt to final disposition. Chain-of-custody
procedures provide an accurate written record that traces the possession of individual samples from the
time of collection in the field until they are accepted at the laboratory. The chain-of-custody record will
also be used to document the samples collected and the analyses requested. Figure 6 shows an example of
a blank chain-of custody form. Information to be recorded on the chain-of-custody record includes the
following:
Project name and number
Name and signature of sampler
Destination of samples
Technical contact and telephone number
Sample identification number
Sampling location
Date and time of collection
Sample matrix
Number and type of containers filled
Analysis or analyses requested
Preservatives used
Signatures of individuals involved in custody transfer (including date and time of transfer)
Relevant remarks related to sample analysis (such as samples selected for MS/MSD analysis)
Unused lines on the chain-of-custody record will be crossed out and initialed. Field personnel will sign
chain-of-custody records initiated in the field, place the record in a plastic bag, and tape it to the inside of
the lid of the shipping container used for sample transport. The field personnel will retain and file copies
of the chain-of-custody record before delivering samples to the lab. Multiple coolers may be sent in one
shipment to the laboratory. Each cooler will contain a separate chain-of-custody record of the samples.

Water Quality Sampling Quality Assurance Project Plan forTMDLs for Pecatonica Watershed, Winneshiek Creek and Spring Branch
QAPP 408, Revision 0Date: December 1, 2014
Page 31 of 48
Stage 2 Water Quality Sampling
FIGURE 6
EXAMPLE CHAIN-OF-CUSTODY FORM

Water Quality Sampling Quality Assurance Project Plan forTMDLs for Pecatonica Watershed, Winneshiek Creek and Spring Branch
QAPP 408, Revision 0Date: December 1, 2014
Page 32 of 48
Stage 2 Water Quality Sampling
2.3.6 Sample Packaging
After being appropriately containerized and labeled, samples should be packaged using the procedures
summarized below.
1. Place the sample in a resealable plastic bag.
2. Place the bagged sample in a cooler, and pack the cooler to prevent breakage.
3. Prevent breakage of bottles during shipment by either wrapping the sample containers in bubblewrap or lining the cooler with a noncombustible material such as vermiculite.
4. Add a sufficient quantity of ice to the cooler to cool samples to < 6 °C. Ice should be double-bagged in resealable plastic bags to prevent the melted ice from leaking out. As anoption, a temperature blank (a sample bottle filled with distilled water) can be included inthe cooler.
5. Seal the completed chain-of-custody forms in a plastic bag and tape the plastic bag to the insideof the cooler lid.
6. Tape any instructions for returning the cooler to the inside of the lid.
7. Close the lid of the cooler and tape it shut by wrapping strapping tape around both ends and thehinges of the cooler at least once. Tape shut any drain plugs on the cooler.
8. Transport samples to the laboratory for analysis.
Tetra Tech field personnel will deliver the samples to STAT’s Chicago laboratory following each
sampling event. Sample disposal will occur only on the order of the laboratory project manager, in
consultation with Tetra Tech and IEPA or when it is certain that the information is no longer required or
the samples have deteriorated.
2.4 ANALYTICAL METHODS REQUIREMENTS
STAT will conduct all analyses of water samples collected. STAT will analyze water samples for TKN,
T-ammonia , NO2 + NO3, TSS, and TP using methods specified in Table 8. Analytical methods are
included in STAT’s QA manual and the SOPs in Attachment A. In all cases, appropriate methods of
sample preparation, cleanup, and analyses are based on specific analytical parameters of interest, sample
matrices, and required quantitation limits. The requested standard turnaround time for sample results is
seven days.

Water Quality Sampling Quality Assurance Project Plan forTMDLs for Pecatonica Watershed, Winneshiek Creek and Spring Branch
QAPP 408, Revision 0Date: December 1, 2014
Page 33 of 48
Stage 2 Water Quality Sampling
2.5 QUALITY CONTROL REQUIREMENTS
The main functions of any sampling and analysis program are to obtain accurate and representative
environmental samples and to provide defensible analytical data. A program to evaluate field and
laboratory data was developed to achieve these goals. The quality of the field data will be assessed
through the collection and analysis of field QC samples on a regularly scheduled basis. Laboratory QC
samples will also be analyzed in accordance with the laboratory’s QA requirements and referenced
analytical method protocols to ensure that laboratory procedures and analyses are conducted properly.
The following subsections discuss the types of QC samples to be collected and analyzed for this project
and their role in ensuring acceptable project data. Specifically, the following subsections discuss field QC
requirements, laboratory QC requirements, and laboratory QC procedures. QC procedures are not limited
to those discussed in this section. Field and laboratory personnel, in accordance with specific method
protocols, may implement additional procedures.
2.5.1 Field Quality Control Requirements
Field QC samples are used to evaluate the validity of the field sampling effort. They are collected for
laboratory analysis to check sampling and analytical precision, accuracy, and representativeness. Table 9
summarizes the types and frequency of collection for field QC samples.
TABLE 9FIELD QUALITY CONTROL SAMPLES
Sample Type Frequency of AnalysisField duplicate 1 every other sampling eventa
Matrix spike/matrix spike duplicate 1 every other sampling eventb
Note:a A sampling event is defined as a round of sampling conducted at each sampling location. Table 4 lists
sampling locations.b Matrix spike / matrix spike duplicate are not applicable to TSS.
Field duplicate samples are independent samples collected as close as possible, in space and time, to the
original investigative sample. Field duplicate samples can measure the influence of sampling and field
procedures on the precision of an environmental measurement. They can also provide information on the
heterogeneity of a sampling site. Field duplicate samples are collected immediately after collection of the

Water Quality Sampling Quality Assurance Project Plan forTMDLs for Pecatonica Watershed, Winneshiek Creek and Spring Branch
QAPP 408, Revision 0Date: December 1, 2014
Page 34 of 48
Stage 2 Water Quality Sampling
original sample using the same collection method. Sampling personnel will be careful to collect the field
duplicate samples as close as possible to the locations of original samples. Field duplicate samples will be
collected every other sampling event. Duplicate field measurements will also be taken every other
sampling event.
MS/MSD samples are laboratory QC samples collected in the field. For aqueous samples, MS/MSD
samples require twice the normal sample volume for inorganic analyses. Section 2.5.2.2 describes
MS/MSD samples.
2.5.2 Laboratory Quality Control Requirements
STAT will follow its internal QA procedures and any additional QA procedures specific to the analytical
methods that will be used. Attachment A provides a copy of STAT’s QA manual and laboratory SOPs.
The laboratory QA officer is responsible for ensuring that all laboratory internal QC checks are conducted
in accordance with the laboratory’s QA manual and SOPs, and with the requirements of this QAPP. This
section contains brief descriptions of the laboratory QC samples to be analyzed by STAT.
2.5.2.1 Laboratory Control Samples
An LCS or blank spike originates in the laboratory as deionized water that has been spiked with standard
reference materials of known concentration. An LCS is analyzed to verify the accuracy of the analytical
system at a frequency of one per analytical batch. LCSs are prepared and analyzed using the same
procedures as field samples at the frequency prescribed in the individual analytical method. Method- and
laboratory-specific protocols will be followed to assess the usability of the data if LCS percent recovery
results (used to determine accuracy) or RPD results (used to determine precision) are outside established
acceptance limits.
2.5.2.2 Matrix Spike and Matrix Spike Duplicates
MS and MSD samples are analyzed, when appropriate, to evaluate the suitability of an analytical method
for a particular environmental sample matrix. The MS sample is prepared using a known concentration of
target analytes added to an aliquot of the field sample. The additional sample volume collected by the
field team will be used to create these samples. The samples will be spiked when they are prepared for
analysis at the laboratory. MS and MSD results are used to measure the efficiency of all of the steps of the
analytical method in recovering target analytes from an environmental sample matrix. The percent
recoveries will be calculated for each spiked analyte and used to evaluate analytical accuracy. The RPD

Water Quality Sampling Quality Assurance Project Plan forTMDLs for Pecatonica Watershed, Winneshiek Creek and Spring Branch
QAPP 408, Revision 0Date: December 1, 2014
Page 35 of 48
Stage 2 Water Quality Sampling
between spiked sample results will be calculated to evaluate precision. Precision is based on comparison
of the results for duplicate and original analyses. For inorganic analyses, a matrix duplicate may be
analyzed in place of an MSD. MS and MSD samples are analyzed at a frequency of 1 per 20 or fewer
investigative samples. If the MS and MSD percent recovery results used to assess accuracy or the RPD
results used to assess precision are outside the established acceptance limits, method- and laboratory-
specific protocols will be followed to evaluate data usability.
2.5.3 Laboratory Quality Control Procedures
The laboratory will establish SQLs and standard laboratory RLs adjusted for the characteristics of
individual samples. The SQL is a chemical-specific level that a laboratory should be able to routinely
detect and quantify in a given sample matrix. The SQLs should correspond to the lowest calibration
standard analyzed during the initial instrument calibration for the specific method. The SQL takes into
account changes in the preparation and analytical methodology that may alter the ability to detect an
analyte, including changes such as use of a smaller sample aliquot or dilution of the sample extracts,
digestates, or distillates. The laboratory will calculate and report SQLs for all environmental samples.
2.6 INSTRUMENT AND EQUIPMENT TESTING, INSPECTION, AND MAINTENANCEREQUIREMENTS
This section outlines testing, inspection, and maintenance procedures for field equipment and instruments
and for laboratory instruments. This section discusses general requirements that apply to field and
laboratory equipment, and field-specific and laboratory-specific requirements.
2.6.1 General Requirements
For most instruments, preventive maintenance is performed in accordance with procedures and schedules
recommended in (1) the instrument manufacturer’s literature or operating manual, or (2) SOPs associated
with particular applications of the instrument.
In some cases, testing, inspection, and maintenance procedures and schedules will differ from the
manufacturer’s specifications or SOPs. Differences can occur when a field instrument is used to make
critical measurements or when the analytical methods associated with a laboratory instrument require
more frequent testing, inspection, and maintenance.

Water Quality Sampling Quality Assurance Project Plan forTMDLs for Pecatonica Watershed, Winneshiek Creek and Spring Branch
QAPP 408, Revision 0Date: December 1, 2014
Page 36 of 48
Stage 2 Water Quality Sampling
2.6.2 Field Equipment and Instruments
Field equipment will be rented from Field Environmental Instruments, Inc. (Fields). Tetra Tech has a
contract with Fields and has successfully used Fields equipment on similar projects. Fields will be
responsible for thoroughly checking and calibrating field equipment and instruments before shipment or
transport to Tetra Tech prior to field activities. Copies of testing, inspection, and maintenance procedures
will be shipped to Tetra Tech with the equipment and instruments. After the equipment and instruments
arrive, the field technicians will assume responsibility for testing, inspection, and maintenance.
Detailed information regarding maintenance and servicing of field instruments is available in the
instruction manual of the specific instrument used. Field personnel will record service and maintenance
information in field logbooks. Specific preventive maintenance procedures will follow the manufacturer’s
recommendations. Following use, field equipment will be properly decontaminated before it is returned to
Fields. Critical spare parts such as tape, paper, pH probes, electrodes, batteries, and battery chargers will
be kept on site to minimize equipment downtime. Backup instruments, equipment, and additional spare
parts will be available on site or within a 1-day shipping period to avoid delays in the field schedule.
2.6.3 Laboratory Instruments
STAT will follow a maintenance schedule for each instrument used to analyze samples collected from the
watershed areas. All instruments will be serviced at scheduled intervals necessary to optimize factory
specifications. Routine preventative maintenance and major repairs will be documented in a maintenance
logbook. STAT also maintains an equipment tracking form for each instrument that documents identity;
date in service; manufacturer’s name, model number, and serial number; current location; and
preventative maintenance schedule. A list of critical spare parts for each instrument will be identified by
the STAT and requested from the manufacturer. These spare parts will be stored at the laboratory for
availability and use to reduce downtime.
2.7 INSTRUMENT CALIBRATION AND FREQUENCY
This section describes procedures for maintaining the accuracy of field equipment and laboratory
instruments used for field tests and laboratory analyses. The equipment and instruments should be
calibrated before each sampling event or, when not in use, on a scheduled periodic basis.

Water Quality Sampling Quality Assurance Project Plan forTMDLs for Pecatonica Watershed, Winneshiek Creek and Spring Branch
QAPP 408, Revision 0Date: December 1, 2014
Page 37 of 48
Stage 2 Water Quality Sampling
2.7.1 Calibration of Field Instruments
This section describes calibration procedures and frequency for maintaining the accuracy of instruments
used for obtaining field measurements. All calibrations along with instrument serial numbers will be
documented and recorded in field logbooks.
Each instrument will be examined to certify that it is in good operating condition. This examination
includes checking the manufacturer’s operating manual to ensure that all maintenance requirements are
being observed. Field notes from previous sampling trips will be reviewed so that notations on any prior
equipment problems are not overlooked and so that all necessary repairs to equipment have been carried
out.
Calibration of field instruments will be performed at the intervals specified by the manufacturer or more
frequently as conditions dictate. Field measurements will be made with a Horiba U-10 Water Quality
Checker or similar device. If an internally calibrated field instrument fails to meet calibration/checkout
procedures, it will be returned to the manufacturer for service. The Horiba U-10 Water Quality Checker
can be calibrated automatically for all four parameters (pH, conductivity, turbidity, and DO)
simultaneously, or manual calibration can be completed for each parameter individually. According to the
instruction manual included in Attachment B, manual calibration is more accurate, but the auto-
calibration procedure should be sufficient for most measurement operations. Tetra Tech will perform
manual calibration before and after each sampling event and will use the auto-calibration procedure as
necessary. Calibration procedures are included in the instruction manual in Attachment B, and a summary
of manual calibration procedures for each parameter is presented below.
pH
1. Wash the unit’s probe two to three times using deionized or distilled water.
2. Complete a zero calibration using a pH 7 standard solution (use the “UP” and “DOWN” keys toselect the value of the pH 7 standard solution at the temperature of the sample).
3. Complete a span calibration using either a pH 4 or pH 9 standard solution (use the “UP” and“DOWN” keys to select the value of the standard solution at the temperature of the sample).

Water Quality Sampling Quality Assurance Project Plan forTMDLs for Pecatonica Watershed, Winneshiek Creek and Spring Branch
QAPP 408, Revision 0Date: December 1, 2014
Page 38 of 48
Stage 2 Water Quality Sampling
Conductivity
1. Prepare three concentrations (0.005, 0.05, and 0.5 N) of potassium chloride standard solution forthe span calibration.
2. Wash the unit’s probe two to three times using deionized or distilled water.
3. Complete a zero calibration in atmospheric air; no solution is needed.
4. Complete a span calibration by washing the probe two to three times in the standard solution andplacing the unit probe in a beaker of each standard solution to calibrate the meter at a range of0 to 1, 1 to 10, and 10 to 100 millisiemens per centimeter
Turbidity
1. Prepare a standard solution of 800 Nephelometric turbidity units for the span calibration.
2. Wash the unit’s probe two to three times using deionized or distilled water.
3. Complete a zero calibration using deionized or distilled water.
4. Complete a span calibration using the standard solution of 800 Nephelometric turbidity units.
DO
1. Prepare a sodium sulfite solution for the zero calibration.
2. Complete the zero calibration using the sodium sulfite solution.
3. Complete the span calibration using deionized or tap water that has been saturated with oxygen inair from an air pump.
Field measurements will be made with Flowatch Flow Meter or similar device. If an internally calibrated
field instrument fails to meet calibration/checkout procedures, it will be returned to the manufacturer for
service. The instruction manual is included in Attachment B.
2.7.2 Calibration of Laboratory Equipment
All laboratory equipment will be calibrated according to the STAT QA manual (see Attachment A).
Instruments will be calibrated prior to use to establish its ability to meet the QC guidelines contained in
the test method for the instrument. Routine calibration is conducted at the frequency recommended in the
test method.
Laboratory analyses will be conducted in accordance with approved analytical methods and will follow
the calibration procedures and frequencies specified in the relevant method. Calibration procedures and
requirements will also be provided, as appropriate, for laboratory support equipment, such as balances,

Water Quality Sampling Quality Assurance Project Plan forTMDLs for Pecatonica Watershed, Winneshiek Creek and Spring Branch
QAPP 408, Revision 0Date: December 1, 2014
Page 39 of 48
Stage 2 Water Quality Sampling
mercury thermometers, pH meters, and other equipment used to take chemical and physical
measurements. All laboratory equipment used to analyze samples collected under this project will be
calibrated based upon written SOPs maintained by the laboratory. Calibration records (including the dates
and times calibration and the names of the personnel performing the calibration) will be filed at the
location where the analytical work is performed and maintained by the laboratory personnel performing
QC activities.
2.8 REQUIREMENTS FOR INSPECTION AND ACCEPTANCE OF SUPPLIES ANDCONSUMABLES
Supplies and consumables can be received either prior to sampling or at the sampling site. When supplies
are received prior to sampling, the project manager or designee will inspect the condition of all supplies
before the supplies are accepted for use on a project. If the supplies do not meet the acceptance criteria,
deficiencies will be noted on the packing slip and purchase order. The item will be returned to the vendor
for replacement or repair. When supplies are received in the field, the sampling team leader will inspect
them in accordance with the acceptance criteria. Any deficiencies or problems will be noted in the field
logbook. Deficient items will be returned for immediate replacement.
STAT will provide certified clean containers for all analyses. The containers will be inspected prior to
use, and any defective containers will be replaced before the sampling event begins.
Solvents and reagents used by the laboratory in all analytical procedures will be documented in a
laboratory logbook. At a minimum, information regarding the manufacturer, lot number, date received,
date opened, and date prepared should be included. Solvents and reagents will be tested for contamination
before use. The results of this procedure and any other quality inspections will be documented in a
laboratory logbook.
The laboratory will regularly check the temperatures of all refrigerators used to store project samples,
standards, and other consumables, and will document temperatures measured in a laboratory logbook.
Thermometers used to monitor temperatures will be subject to verification against a National Institute of
Standards and Technology-certified thermometer at a frequency prescribed in the laboratory’s QA
manual. Unless otherwise directed by the project manager, unused samples will be stored for a minimum
of 60 days following submittal of analytical data.

Water Quality Sampling Quality Assurance Project Plan forTMDLs for Pecatonica Watershed, Winneshiek Creek and Spring Branch
QAPP 408, Revision 0Date: December 1, 2014
Page 40 of 48
Stage 2 Water Quality Sampling
2.9 NON-DIRECT MEASUREMENTS
Tetra Tech is collecting new data to fill in data gaps identified and supplement previously collected data
discussed in the Stage 1 reports. The previously collected data for each segment were obtained from the
following sources:
U.S. Department of Agriculture (USDA)
USEPA
U.S. Geological Survey (USGS) National Water Information System (NWIS) database
IEPA
The Stage 1 report for the watershed summarizes and analyzes existing water quality data. The report
recommends additional data collection through sampling because the existing data were not recent (within
the past 10 years). The sampling sites and frequencies for this project are based on Stage 1 report
recommendations. The samples will be primarily collected from existing sites as shown in Table 4 and
Figures 3 and 4. The existing and new data will be combined for TMDL development.
2.10 DATA MANAGEMENT
Data for this project will be obtained from a combination of sources, including field measurements and
laboratory analyses of collected water samples. The data gathering process requires a coordinated effort
and will be conducted by project staff members in conjunction with all potential data producers.
The Tetra Tech sampling team leader will be responsible for review, transfer, and storage of all data
collected in the field. The sampling team leader will maintain documentation of sampling, logging, and
field measurements, and will note any deviations from the QAPP or SOPs.
Data obtained from STAT will be in the form of an electronic data deliverable in addition to the required
hard-copy analytical data package. Formal verification (or validation) of data will be conducted before
associated results are presented or used for subsequent activities. Tetra Tech will validate 10 percent of
the analytical data to ensure that the confirmatory data are accurate and defensible, unless otherwise
directed by IEPA. As a part of the data validation process, the electronic data deliverables will be
reviewed against the hard-copy deliverables to ensure the accurate transfer of data. In addition, the hard

Water Quality Sampling Quality Assurance Project Plan forTMDLs for Pecatonica Watershed, Winneshiek Creek and Spring Branch
QAPP 408, Revision 0Date: December 1, 2014
Page 41 of 48
Stage 2 Water Quality Sampling
copy will be evaluated for errors in the calculation of results. After the data validation, standard data
qualifiers can be placed on the data to indicate data usability. These qualifiers will be placed into the
electronic data file. Upon approval of the data set with the appropriate data qualifiers, the electronic data
will be released to the project manager for reporting.
After data validation and release of data, the project manager will use the data for project report
preparation. Tetra Tech will compile all relevant and verified laboratory analytical data into an electronic
database using Microsoft Access or Excel 2000. The analytical results will be evaluated for QA/QC and
reduced for assessment purposes. Data will be evaluated throughout the project to ensure that procedures
are adequate and numbers are reasonable. In addition, Tetra Tech will organize laboratory data into a
tabular format that can easily be incorporated into a Geographic Information System (GIS). Tetra Tech
will provide field data in a format consistent with the data requirements of the TMDL project. All data
will be stored in a specific project folder on Tetra Tech’s internal drive. The drive is password protected
with only Tetra Tech personnel having access. Tetra Tech maintains project documents and records for a
minimum of 10 years.

Water Quality Sampling Quality Assurance Project Plan forTMDLs for Pecatonica Watershed, Winneshiek Creek and Spring Branch
QAPP 408, Revision 0Date: December 1, 2014
Page 42 of 48
Stage 2 Water Quality Sampling
3.0 ASSESSMENT AND OVERSIGHT
This section discusses assessment and oversight reports of field and laboratory activities during data
collection and analysis. Section 3.1 includes assessment and response actions, and Section 3.2
summarizes reports to management.
3.1 ASSESSMENT AND RESPONSE ACTIONS
Assessments of field and laboratory procedures are conducted to support data quality and encourage
continuous improvement in the systems that support environmental data collection. This section discusses
both field and laboratory assessments as well as corrective action procedures to any QA issues.
3.1.1 Field Assessments
Generally, field assessments or audits are conducted early in the project so that any quality issues can be
resolved before large amounts of data are collected; however, no assessments or audits have been planned
or budgeted for this project. If IEPA desires to conduct its own assessments of project activities, the Tetra
Tech project manager will coordinate with the IEPA WAM regarding the times and locations of the
assessments.
In lieu of an assessment or audit, Tetra Tech will conduct a procedural review to coincide with the first
sampling event. The procedural review will be conducted by the project manager and QA officer with the
sampling staff prior to data collection and will cover sample collection and handling techniques, SOPs
and documentation requirements, health and safety, and any unique aspects of this project.
3.1.2 Laboratory Assessments
Performance and system assessments can be conducted to audit analytical work. Performance assessments
are quantitative checks on the quality of a measurement system. Performance assessments for a laboratory
may be accomplished by submitting reference materials as blind reference samples, which are samples
with known concentrations that are submitted to a laboratory without informing the laboratory of the
known concentration. System assessments are qualitative reviews of different aspects of analytical work
to check on the use of appropriate QC measures and the functioning of the QA system. No laboratory
assessments are currently funded or scheduled for this project; however, IEPA could conduct a laboratory
performance or system assessment on its own.

Water Quality Sampling Quality Assurance Project Plan forTMDLs for Pecatonica Watershed, Winneshiek Creek and Spring Branch
QAPP 408, Revision 0Date: December 1, 2014
Page 43 of 48
Stage 2 Water Quality Sampling
3.1.3 Field Corrective Action Procedures
If an assessment is conducted and findings are made indicating problems, field corrective action
procedures will depend on the type and severity of the finding. Tetra Tech classifies assessment findings
as either deficiencies or observations. Deficiencies are findings that may have a significant impact on data
quality and that will require corrective action. Observations are findings that do not directly affect data
quality but are suggestions for consideration and review. The project manager, sampling team leader, and
QA officer will hold a teleconference to discuss any deficiencies and the appropriate steps to resolve each
one by completing the following:
Determine when and how the problem developed
Assign responsibility for problem investigation and documentation
Select the corrective action to eliminate the problem
Develop a schedule for completing the corrective action
Assign responsibility for implementing the corrective action
Document and verify that the corrective action has eliminated the problem
Notify IEPA of the problem and the corrective action taken
3.1.4 Laboratory Corrective Action Procedures
Internal laboratory procedures for corrective action and descriptions of out-of-control situations that
require corrective action are contained in the laboratory QA manual in Attachment A. At a minimum,
corrective action will be implemented when any of the following three conditions occurs: (1) control
limits are exceeded, (2) method QC requirements are not met, or (3) sample holding times are exceeded.
The laboratory will report out-of-control situations to Tetra Tech within 2 working days after they are
identified. In addition, the laboratory project manager will prepare and submit a corrective action report to
the Tetra Tech project manager. This report will identify the out-of-control situation and the steps that the
laboratory has taken to rectify the situation and to prevent its recurrence.

Water Quality Sampling Quality Assurance Project Plan forTMDLs for Pecatonica Watershed, Winneshiek Creek and Spring Branch
QAPP 408, Revision 0Date: December 1, 2014
Page 44 of 48
Stage 2 Water Quality Sampling
3.2 REPORTS TO MANAGEMENT
Effective management of environmental data collection operations requires timely assessment and review
of measurement activities. It is essential that open communication, interaction, and feedback be
maintained among all project participants, including (1) the Tetra Tech QA and QC officers, project
manager, and sampling team leader; (2) the STAT laboratory project manager and QA officer, and (3) the
IEPA WAM and QA officer, as appropriate. The sampling team leader will notify the project manager
and Tetra Tech QC officer of any QA issues related to field sampling activities and will discuss any
necessary corrective actions to resolve the issues. If there are significant quality issues, the Tetra Tech
QAO may be consulted to initiate corrective action investigation and identification of potential remedies,
but most corrective actions are readily addressed at the task level between the QCO and sampling team
leader in consultation with the project manager, and will be discussed in subsequent quality assurance
discussion in data reports. The STAT project manager will notify the Tetra Tech project manager if any
significant problems occur during sample analysis. The Tetra Tech project manager will prepare monthly
progress reports for IEPA that will address any QA issues and facilitate timely communication of these
issues.
Water Quality Sampling Quality Assurance Project Plan forTMDLs for Pecatonica Watershed, Winneshiek Creek and Spring Branch
QAPP 408, Revision 0Date: December 1, 2014
Page 45 of 48
Stage 2 Water Quality Sampling
4.0 DATA VALIDATION AND USABILITY
This section describes the procedures used to review and verify field and laboratory data collected.
Section 4.1 discusses data review, verification, and validation. Section 4.2 includes verification and
validation methods. Section 4.3 addresses reconciliation with DQOs.
4.1 DATA REVIEW, VERIFICATION, AND VALIDATION
Validation and verification of data generated during field activities are essential to obtaining data of
defensible and acceptable quality. Field and laboratory measurement data reduction and review
procedures and requirements are specified in SOPs in Attachment B.
Field personnel will record, in a field logbook and data collection sheets, all raw data from chemical and
physical field measurements. The project manager has primary responsibility for (1) verifying that field
measurements were made correctly, (2) confirming that sample collection and handling procedures
specified in the QAPP were followed, and (3) ensuring that all field data reduction and review procedures
requirements are followed. The project manager is also responsible for assessing preliminary data quality
and for advising IEPA of any potential QA/QC problems with field data.
STAT will complete data reduction for laboratory measurements and will complete an in-house review of
all laboratory analytical results. The laboratory QA officer will be responsible for ensuring that all
laboratory data reduction and review procedures follow the requirements stated in this QAPP. The
laboratory QA officer will also be responsible for assessing data quality and for advising the Tetra Tech
QA officer of possible QA/QC problems with laboratory data.
4.2 VERIFICATION AND VALIDATION METHODS
This section outlines the basic data validation procedures that will be followed for all field and laboratory
measurements. The following subsections identify personnel who are responsible for data validation, and
general data validation procedures.
Water Quality Sampling Quality Assurance Project Plan forTMDLs for Pecatonica Watershed, Winneshiek Creek and Spring Branch
QAPP 408, Revision 0Date: December 1, 2014
Page 46 of 48
Stage 2 Water Quality Sampling
4.2.1 Data Validation Responsibilities
Tetra Tech is responsible for validation of analytical data provided by STAT. The QA officer has primary
responsibility for coordinating Tetra Tech’s data validation activities. Tetra Tech will validate 10 percent
of all STAT laboratory data. Data validation will be completed by one or more experienced data
reviewers.
4.2.2 Data Validation Procedures
Tetra Tech data reviewers will conduct a systematic review of the data on the basis of spike, duplicate,
and blank sampling results provided by the laboratory. The data review will identify any out-of-control
data points and omissions. Tetra Tech data reviewers will evaluate laboratory data for compliance with
the following information:
Holding times
Blanks
MS/MSD recovery results
LCS results
Field duplicate sample results
Other laboratory QC requirements specified by the method
Detection limits
Analyte quantitation
Sample results verification
Overall assessment of data for a sample delivery
Tetra Tech will review analytical data in general accordance with USEPA’s “National Functional
Guidelines for Superfund Inorganic Data Review” (USEPA 2013). In addition, the QC requirements set
out in this document and the analytical methods will be used as criteria for validation.
4.3 RECONCILIATION WITH DATA QUALITY OBJECTIVES
After water quality data have been reviewed and results verified and validated in accordance with the
procedures described above, the data must be further evaluated to determine whether the DQOs have been
met. Tetra Tech will systematically assess data quality and data usability. This assessment may include
the following:

Water Quality Sampling Quality Assurance Project Plan forTMDLs for Pecatonica Watershed, Winneshiek Creek and Spring Branch
QAPP 408, Revision 0Date: December 1, 2014
Page 47 of 48
Stage 2 Water Quality Sampling
Review of the sampling design and sampling methods to verify that these were implemented asplanned and are adequate to support project objectives
Review of project-specific data quality indicators for precision, accuracy, representativeness,completeness, comparability, and quantitation limits to determine whether acceptance criteriahave been met
Review of project-specific DQOs to determine whether they have been achieved by the datacollected
Evaluation of any limitations associated with the decisions to be made based on the data collected
Because this project is intended to supplement existing data and fill data gaps identified in the Stage 1
reports, data collected using methods specified in this QAPP should be sufficient for TMDL development
of the segments discussed in Section 1.3. The final report for the project will discuss any potential
impacts of the review findings on data usability and will clearly define any limitations associated with the
data and how any such limitations might affect the development of TMDLs.

Water Quality Sampling Quality Assurance Project Plan forTMDLs for Pecatonica Watershed, Winneshiek Creek and Spring Branch
QAPP 408, Revision 0Date: December 1, 2014
Page 48 of 48
Stage 2 Water Quality Sampling
REFERENCES
Tetra Tech. 2014. “Pecatonica River Total Maximum Daily Load and Load Reduction Strategies.”February.
U.S. Environmental Protection Agency (USEPA). 2006. “Guidance on Systematic Planning Using theData Quality Objectives Process (QA/G-4).” EPA/240/B-06/001. Office of EnvironmentalInformation (OEI). Washington, DC. February.
USEPA. 2001. “USEPA Requirements for Quality Assurance Project Plans (QA/R-5).” EPA/240/B-01/003. OEI. Washington, DC. March. Reissued May 2006.
USEPA. 2013. “National Functional Guidelines for Inorganic Superfund Data Review.” EPA 540-R-13-001. Office of Superfund Remediation and Technology Innovation. Washington, DC. October.

Water Quality Sampling Quality Assurance Project Plan for QAPP 408, Revision 1TMDLs for Pecatonica Watershed, Winneshiek Creek and Spring Branch Date: December 1, 2014
ATTACHMENT
ATTACHMENT A
STAT ANALYTICAL CORP. QUALITY ASSURANCE MANUAL AND SOPs
This attachment includes the following documents:
1. STAT Quality Assurance Manual
2. STAT - SOP: Total Kjeldahl Nitrogen (TKN) – Block Digestion with Semi-Automated Skalar
3. STAT - SOP: Total Ammonia Analysis
4. STAT – SOP: Automated NO3/NO2, NO2 AND NO3 Analysis by SM 4500-NO3 I
5. STAT - SOP: Total Dissolved Solids(TDS), Total Suspended Solids(TSS), and Total
Solids(TS)

Water Quality Sampling Quality Assurance Project Plan for QAPP 408, Revision 1TMDLs for Pecatonica Watershed, Winneshiek Creek and Spring Branch Date: December 1, 2014
ATTACHMENT
ATTACHMENT B
INSTRUMENT INSTRUCTION MANUALS AND SOPs
This attachment includes the following documents:
1. Horiba U-10 Instruction Manual
2. Flowatch Instruction Manual
3. Tetra Tech SOP No. 009 - Surface Water Sampling
4. Tetra Tech SOP No. 010 - Groundwater Sampling
5. Tetra Tech SOP No. 011 – Field Measurement of Water Temperature
6. Tetra Tech SOP No. 012 – Field Measurement of pH
7. Tetra Tech SOP No. 013 – Field Measurement of Specific Conductance
8. Tetra Tech SOP No. 024 - Recording of Notes in Field Logbook
9. Tetra Tech SOP No. 061 - Field Measurement of Groundwater Indicator Parameters


Analysis Corporation
STAT
Policy Statement
STAT Analysis Corporation This Quality Manual summarizes the policies and operational procedures associated with STAT Analysis Corporation in Chicago, Illinois. Specific protocols for sample handling and storage, chain-of-custody, and laboratory analysis, data reduction, corrective action, and reporting are described. All policies and procedures have been structured in accordance with the current National Environmental Laboratory Accreditation Conference (NELAC) standards (current as of the date of this publication), current American Industrial Hygiene Association (AIHA-LAP, LLC) Policy (current as of the date of this publication), National Voluntary Laboratory Accreditation Program (NVLAP) standards adopted in National Institute of Standards and Technology (NIST) Handbook 150, 2006 Edition, the requirements of the Consumer Products Safety Commission (CPSC), and International Standards Organization/International Electrotechnical Commission (ISO/IEC) 17025 (2005) regulations, guidance, and technical standards. The laboratory management is committed to comply with these standards. NVLAP has issued specific requirements for referencing the NVLAP term, logo, and symbol (NIST Handbook 150, 2006). STAT uses the NVLAP term and symbol for purposes of announcing the accredited status and for use on reports that describe testing within the scope of accreditation. STAT complies with the conditions detailed in NIST Handbook 150, Annex A. STAT Analysis does not use or reference the logo from any other accrediting authority. This manual has been prepared in accordance with the guidance documents available from Accreditating organizations. Further details on these policies and procedures are contained in SOPs and related documents. This Quality Manual, SOPs, and related documentation describe the laboratory’s management system policies related to quality. The purpose of this Quality Assurance Manual is to describe the quality management system in place at STAT Analysis Corporation. It is STAT’s policy to keep abreast of policy revisions issued by accrediting agencies and to implement changes within a reasonable time frame by revising this QAM and other appropriate SOPs in order to be compliant with existing accrediting agency policies. The QA Director monitors and tracks the schedule for policy updates based on notification by accreditation agencies. After identifying the changes to be addressed, the management team meets to create, plan and develop the implementation schedule. The QA Director oversees the implementation within the scheduled deadline. STAT Analysis Corporation performs chemical analyses for inorganic and organic constituents, microbiological analyses, and asbestos analyses in various matrices and products. The objective of STAT Analysis Corporation’s quality management system is to produce data that is scientifically valid and of known and documented quality in accordance with standards developed by NELAC, ISO/IEC 17025, AIHA-LAP, LLC, NIST/NVLAP, CPSC and any applicable federal or state government entity’s regulations or requirements. STAT Analysis Corporation conducts all business with integrity and in an ethical manner. The laboratory management is committed to good professional practice, to the quality of its environmental
QA 001 Quality Assurance Manual Revision 14
November 15, 2013 Page 2 of 93
\\Harrison\D\Quality Control\SOPs & QAM\Quality Assurance Manual\QA 001 QA MANUAL Rev 14.doc

Analysis Corporation
STAT
testing in servicing its customers, and to continually improve the effectiveness of the management system. All personnel involved with testing activities within the laboratory must review this quality manual. It is the responsibility of each staff member, manager, director, and owner to perform their duties with the highest ethical standards and professional conduct to ensure compliance with this Quality Manual and related documentation. Surendra N. Kumar, Ph.D. Bruce Gallant, Laboratory President/CEO Director
QA 001 Quality Assurance Manual Revision 14
November 15, 2013 Page 3 of 93
\\Harrison\D\Quality Control\SOPs & QAM\Quality Assurance Manual\QA 001 QA MANUAL Rev 14.doc
Analysis Corporation
STAT
Table of Contents 1. INTRODUCTION.......................................................................................................................7
2. LABORATORY ORGANIZATION and MANAGEMENT STRUCTURE ........................8 2.1 Staff Qualifications and Responsibilities...................................................................................8 2.2 Approved Signatories ..............................................................................................................12 2.3 New Work Requirements.........................................................................................................13 2.4 Departures from Policies and Procedures ................................................................................13
3. DOCUMENT CONTROL........................................................................................................14
4. GENERAL QUALITY CONTRO L PROCEDURES ..........................................................14 4.1 Introduction..............................................................................................................................15 4.2 Laboratory Apparatus and Instruments ...................................................................................15 4.3 Laboratory Supplies.................................................................................................................16 4.4 Laboratory Hazardous Wastes Handling and Disposal Procedures.........................................17 4.5 Selection and Purchasing of Services and Supplies.................................................................17
5. VERIFICATION PROCEDURES..........................................................................................18 5.1 Introduction..............................................................................................................................18 5.2 Traceability of Calculations.....................................................................................................18 5.3 Performance Testing................................................................................................................21 5.4 Precision ..................................................................................................................................26 5.5 Accuracy ..................................................................................................................................27 5.6 Annual Analytical Performance Summary..............................................................................27
6. METHODOLOGY ...................................................................................................................28
7. PHYSICAL FACILITIES and INSTRUMENTATION .......................................................28 7.1 Facilities...................................................................................................................................28 7.2 Equipment................................................................................................................................29 7.3 Equipment Maintenance Program ...........................................................................................29
8. SAMPLE RECEIPT and ACCEPTANCE.............................................................................30 8.1 Introduction..............................................................................................................................30 8.2 Sample Acceptance Policy ......................................................................................................31 8.3 Sample Acceptance Policy Differences...................................................................................31 8.4 Chain-of-Custody Form...........................................................................................................31 8.5 Standard Operating Procedure – Sample Receipt/Custody .....................................................31 8.6 Policy for Disposal of Laboratory Samples.............................................................................31
9. SAMPLE RECORDS, DATA REVIEW and DATA HANDLING......................................32 QA 001 Quality Assurance Manual
Revision 14 November 15, 2013
Page 4 of 93 \\Harrison\D\Quality Control\SOPs & QAM\Quality Assurance Manual\QA 001 QA MANUAL Rev 14.doc

Analysis Corporation
STAT
9.1 Sample Logging.......................................................................................................................32 9.2 Analytical Data Review and Handling ....................................................................................36 9.3 Computerized Analytical Data System....................................................................................33 9.4 Reporting .................................................................................................................................35
10. CORRECTIVE AND PREVENTIVE ACTIONS .................................................................35 10.1 Corrective Action……………………………………………………………………....35 10.2 Preventive Action………………………………………………………………..……..36
11. QUALITY EXCEPTION/ CASE NARRATIVE ...................................................................37
12. COMPLAINTS .........................................................................................................................37
13. CONFIDENTIALITY ..............................................................................................................37
14. INTERNAL AUDITS ...............................................................................................................37
15. MANAGEMENT REVIEW of the QUALITY SYSTEM.....................................................38
16. TRAINING ................................................................................................................................38
17. DATA INTEGRITY .................................................................................................................38
18. SUB-CONTRACTING.............................................................................................................40
19. LABORATORY SAFETY .......................................................................................................40 19.1 Introduction..............................................................................................................................40 19.2 General.....................................................................................................................................40 19.3 Sample Receiving and Login...................................................................................................41
20. DEFINITIONS ..........................................................................................................................42
Appendix 1 Summary of Changes from QAM Revision 11………………………………………61 Appendix 2 Organizational Chart....................................................................................................64 Appendix 3 STAT SOPs....................................................................................................................65 Appendix 4 Instrumentation.............................................................................................................74 Appendix 5 Sample Bottle Types and Preservation .......................................................................82 Appendix 6 Sample Acceptance Policy............................................................................................86 Appendix 7 Ethics Policy and Data Integrity Agreement..............................................................88
QA 001 Quality Assurance Manual Revision 14
November 15, 2013 Page 5 of 93
\\Harrison\D\Quality Control\SOPs & QAM\Quality Assurance Manual\QA 001 QA MANUAL Rev 14.doc
Analysis Corporation
STAT
Attachment 1 Facility Diagram............................................................................................................90 Attachment 2 Chain of Custody for NELAC Samples ......................................................................91 Attachment 3 Chain of Custody for Lead AIHA-LAP, LLC Samples.............................................92 Attachment 4 Chain of Custody for Asbestos Samples .....................................................................93 Attachment 5 Chain of Custody for Microbiology Samples .............................................................94 Attachment 6 Example of Notice of Confidentiality for Emails .......................................................95 Attachment 7 Example of Notice of Confidentiality for Facsimiles .................................................96
QA 001 Quality Assurance Manual Revision 14
November 15, 2013 Page 6 of 93
\\Harrison\D\Quality Control\SOPs & QAM\Quality Assurance Manual\QA 001 QA MANUAL Rev 14.doc

Analysis Corporation
STAT
1. INTRODUCTION
It is the policy of STAT Analysis Corporation (STAT) to produce analytical results of the highest degree of repeatability, precision, and accuracy in a laboratory that employs state of the art analytical instrumentation operated by highly skilled, qualified, motivated, and responsible analysts. The laboratory management is committed to follow NELAC, AIHA-LAP, LLC,DOD, CPSC NIST/NVLAP, and ISO/IEC 17025 requirements. This Quality Manual is based on NELAC, ISO 17025, NIST/NVLAP and AIHA-LAP, LLC standards. All employees are to be trained and committed to following the requirements herein. The primary purpose of this document is to establish and maintain uniform operational and quality control guidelines for operations that affect the quality of the data produced in this laboratory. The establishment of, and adherence to, uniform elements of an intra-laboratory quality control program are essential to the production of reliable analytical data. The QA/QC requirements for all relevant preparation and analytical methods, and any verified modifications of such, used in this laboratory are described in this manual or described in relevant Standard Operating Procedures (SOPs). While the implementation of a quality assurance policy is a management function, each individual has a responsibility for the operational aspects of quality control. It is the individual responsibility of each analyst and his/her supervisor to monitor quality control indicators and to provide for corrective actions when necessary. These corrective actions can range from routine corrective action to stopping work until the nonconformity has been resolved. Appropriate communication processes, such as training, seminars, and one-on-one instructions are used to train personnel regarding the effectiveness of the management system. Personnel are trained regarding relevance and importance of their activities and how they contribute to the achievement of the objectives of the management system. Personnel are trained on the importance of meeting customer requirements as well as statutory and regulatory requirements. Laboratory management ensures that the integrity of the management system is maintained when changes are planned and implemented. This manual and the quality control protocols described herein are not to be viewed as all-inclusive. Rather, they serve as a basic foundation on which to build stronger quality assurance/quality control program. It is the policy of this laboratory to use the most stringent controls whether dictated by methodologies and SOPs, accrediting bodies, or Quality Assurance Project Plans (QAPP). STAT reviews the QAM annually. The QAM is updated whenever the need for changes or updates is required. Each SOP will be reviewed whenever the need for changes or updates are required. The need for changes may arise due to availability of new or improved technologies or changes published in the reference method.. The current revision of the SOP will be compared to the reference method for technical and procedural merit to determine if any changes are necessary. Furthermore, as part of Internal Audit, each SOP is reviewed and need for changes or updates determined.
QA 001 Quality Assurance Manual Revision 14
November 15, 2013 Page 7 of 93
\\Harrison\D\Quality Control\SOPs & QAM\Quality Assurance Manual\QA 001 QA MANUAL Rev 14.doc

Analysis Corporation
STAT
This revision (Rev. 14) of the QAM was developed by modifying Rev.13 of the QAM. Summary of the changes made is presented in Appendix 1. An electronic file containing new text in color and deleted text identified as strike-outs is archived on the network. 2. LABORATORY ORGANIZATION and MANAGEMENT STRUCTURE
Hi-Tek Environmental Inc., d/b/a, STAT Analysis Corporation (STAT), FEIN 36-4128978, was incorporated in December 1996. The laboratory is located at 2242 W. Harrison Street, Chicago, IL 60612. An electronic keypunch provides limited access to this building. It is company policy that all employees must be free from commercial, financial and other pressures that might adversely interfere with the quality of their work. All employees must be aware that customer relations and service are an integral part of their job description. To prevent the possibility of staff being placed under pressure by customers or other sections of the laboratory, reporting relationships have been established to isolate staff from this pressure. The responsibilities of the employee in dealing with the customer will be specified in order to maintain independence of judgment and integrity. The Organizational Chart for STAT is shown in Appendix 2. 2.1 Staff Qualifications and Responsibilities This section will show that STAT have personnel, who, irrespective of other responsibilities, have the authority and the resources to fulfill their responsibilities, including the development, implementation, maintenance, and continuous improvement of the management system. They also have the resources to identify departures from the management system or other SOPs and to initiate corrective actions to minimize or prevent such departures.
2.1.1 President/CEO- ensures that those who hold the positions of Laboratory Director, Technical Manager, and Quality Assurance Director , meet the requirements of NELAC, ISO 17025, NIST/NVLAP, and AIHA-LAP, LLC.
2.1.2 Key Personell
2.1.2 .1 Laboratory Director
Duties The Laboratory Director has the overall responsibility for analytical and operational activities of the laboratory. The director will be responsible for supervision (and appointment of supervisors) of laboratory personnel and ensuring that sufficient numbers of qualified staff are employed to supervise and perform the work of the laboratory. The Director will be responsible for production and quality of data reported by the laboratory.
QA 001 Quality Assurance Manual Revision 14
November 15, 2013 Page 8 of 93
\\Harrison\D\Quality Control\SOPs & QAM\Quality Assurance Manual\QA 001 QA MANUAL Rev 14.doc

Analysis Corporation
STAT
Qualifications The Laboratory Director should have a minimum of 2 years experience managing a laboratory. He or she shall have earned a bachelor’s degree, or higher, in chemistry.
2.1.2.2Technical Manager Duties The Technical Manager, under the general direction of the laboratory director, is responsible for the appropriateness of the technical background of all tests performed by the laboratory and to insure the laboratory’s compliance with the NELAC and ISO 17025 standards.. The development, validation and approval of new methods is overseen by the Technical Manager in coordination with Department Managers and the Quality Assurance Director. The Technical Manager has the responsibility to monitor performance standards in quality assurance and quality control and monitoring the validity of the analyses performed and the data generated in the laboratory to assure quality data. This individual is part of the whole corrective action process and is responsible for the final approval of any corrective actions performed at the laboratory. He/she shall be available during at least 50 percent of the laboratory operating hours to address technical issues for laboratory staff and customers and acceptable onsite supervision must be demonstrated. The Technical Manager maintains the LIMS. The Technical Manager provides proper educational direction to laboratory staff. The Technical Manager’s responsibilities meet those defined for the Technical Manager in NELAC Chapter 4.1.1.1, NIST Handbook 150 Section 4.1, and AIHA-LAP, LLC Section 2A.5.1.1
The Technical Manager ensures that all laboratory personnel possess the necessary educational and technical background appropriate to the job they perform. By signing the Demonstration of Capability statement, the Technical Manager certifies that the laboratory analyst has met the requirements to perform the specific test method analysis.
In the event that the Technical Manager is absent for more than 15 consecutive calendar days, the Technical Manager will appoint the Laboratory Director as a temporary replacement. In the event that the Technical Manager is absent for more than 20 business days (for AIHA-LAP, LLC) or for more than 35 business days (For TNI/NELAC), the acting Technical Manager or the Quality Assurance Director will notify the Accrediting Authorities (IEPA, AIHA-LAP, LLC, NVLAP, ORELAP, Utah DEP, Kentucky DEP) in writing within 20 business days. This notification requirement shall be in effect if the Technical Manager,
QA 001 Quality Assurance Manual Revision 14
November 15, 2013 Page 9 of 93
\\Harrison\D\Quality Control\SOPs & QAM\Quality Assurance Manual\QA 001 QA MANUAL Rev 14.doc

Analysis Corporation
STAT
the EMPAT Technical Manager, the QA Director, the EMPAT QA Manager, or an analyst who is the only staff member that performs a test, are absent for reasons of extended family leave, illness, temporary disability, etc.
Qualifications The Technical Manager should have a minimum of 4 years experience in an environmental laboratory. He or she shall have earned a bachelor’s degree, or higher, in chemistry with a minimum of 24 college semester credit hours in chemistry. 2.1.2.3 EMPAT Technical Manager Duties The EMPAT Technical Manager, under the general direction of the laboratory director, is responsible for the appropriateness of the technical background of all tests performed by the microbiological laboratory. The EMPAT Technical Manager has the responsibility to monitor performance standards in quality assurance and quality control and monitoring the validity of the analyses performed and the data generated in the laboratory to assure quality data. The EMPAT Technical Manager is located on site and has the responsibility for the function and administration of the day-to-day operation of the microbiological laboratory. The EMPAT Technical Manager provides proper educational direction to microbiological laboratory staff. The EMPAT Technical Manager, or designee, functions as the approved signatory. Qualifications The EMPAT Technical Manager should have a minimum of 2 years experience in a microbiological environmental laboratory. He or she shall have earned a bachelor’s degree, or higher, in microbiology, biology, or related life science, with a minimum of 20 college semester credit hours in microbiology. 2.1.2.4 Quality Assurance Director Duties: The Quality Assurance Director (or Manager) has the responsibility for the maintenance, coordination and continuous improvement of the Quality Assurance and Quality control (QA/QC) program for the laboratory and to insure the laboratory’s compliance with the NELAC and ISO 17025 standards. The QA Director is responsible for training all new employees on their first day of employment in the importance of the QAM, the ethics policy and other issues as specified in SOP 1230 Section 14.1. The QA Director functions as the Data Integrity officer and reviews and approves all analytical SOPs or test methods. The QA Director is responsible for conducting or arranging an annual internal audit of the entire laboratory operation and technical systems, as described in SOP 006 Management Review of the Quality System, to gauge the effectiveness of the Quality System and to determine if opportunities for improvement are present.
QA 001 Quality Assurance Manual Revision 14
November 15, 2013 Page 10 of 93
\\Harrison\D\Quality Control\SOPs & QAM\Quality Assurance Manual\QA 001 QA MANUAL Rev 14.doc

Analysis Corporation
STAT
The Quality Assurance Director is responsible for the day-to-day monitoring of the laboratory quality systems as well as the data review procedures for the laboratory and also acts as the Lab’s Data Integrity Officer by implementing a program to detect and deter illegal or improper actions by the laboratory or staff. The QA Director reports directly to the President/CEO and is independent from the Technical Manger.
In the event that the QA Director is absent for more than fifteen consecutive calendar days, the President/CEO will appoint either the Technical Manager or the Laboratory Director as a temporary replacement.
Qualifications The Quality Assurance Director must have a minimum of a bachelor’s degree in natural or physical sciences and have documented training or experience in QA/QC and statistical procedures. He/she also must have a general knowledge of the analytical test methods. 2.1.2.5 EMPAT Quality Assurance Manager
Duties The EMPAT Laboratory Quality Assurance Manager has the responsibility for the maintenance and coordination of the quality assurance and quality control (QA/QC) program for the microbiological laboratory. The EMPAT Laboratory QA Manager is responsible for the data review procedures for the laboratory and re-analyzing five percent of all samples. The EMPAT Laboratory QA Manager will also provide genus/species identification when needed. The EMPAT Laboratory QA Manager is responsible for conducting an annual internal audit of the microbiological laboratory operation. Qualifications The EMPAT Laboratory QA Manager must have a minimum of a bachelor’s degree in microbiology, biology, or related life science. The EMPAT Laboratory QA Manager must have a minimum of six months of relevant microbiological laboratory experience and familiarity with microbiological QA/QC. ` 2.1.2.6 Department and Project Managers
Duties
Department Managers are responsible for supervising analysts, analysts in training, and technicians. They are responsible for reviewing and verifying data produced by analysts in training and technicians. Project Managers are responsible for primary customer contact. They review and approve customer’s reports for completeness and adherence to all project specific criteria.
QA 001 Quality Assurance Manual Revision 14
November 15, 2013 Page 11 of 93
\\Harrison\D\Quality Control\SOPs & QAM\Quality Assurance Manual\QA 001 QA MANUAL Rev 14.doc

Analysis Corporation
STAT
Qualifications Department Managers must have a minimum of a bachelor’s degree in natural or
physical sciences, enough course work to qualify for a minor in chemistry, and have at least one year of experience in the analyses pertaining to the applicable fields of testing.
Project Managers must have a minimum of a bachelor’s degree in natural or
physical sciences and have at least one year of experience in the analyses of environmental samples.
2.1.3 Non-Key Personnel
2.1.3.1 Analysts
Duties The analyst is responsible, under the direction of the Department Manager, for the applicable analyses of the samples submitted to the laboratory. Analysts shall be responsible for complying with all quality assurance and quality control requirements pertaining to their technical functions.
Qualifications The analyst shall have a bachelor’s degree (or equivalent), or an associates degree with one year experience, or greater than two years experience with experience in natural or physical sciences. Analysts will have one year of full-time employment in the environmental testing field, and have documented proof of technical proficiency via in-house training at STAT, including an Initial Demonstration of Capability (IDOC). Analysts shall have demonstrated ability to produce reliable results through accurate analysis of certified reference materials (CRMs), proficiency testing samples, or in-house quality control samples. Their performance must be documented. Instrumentation Analysts must have four hours of equipment manufacturer training or two-week apprenticeship under an experienced analyst. 2.1.3.2 Analyst in Training
Analyst in training must meet the requirements of Technician while in process of meeting the requirements of Analyst. 2.1.3.3 Technician
Duties The technician is responsible for carrying out the designated activities related to the analysis of materials submitted to the laboratory and works under the direct supervision of the Department Manager or Analyst.
QA 001 Quality Assurance Manual Revision 14
November 15, 2013 Page 12 of 93
\\Harrison\D\Quality Control\SOPs & QAM\Quality Assurance Manual\QA 001 QA MANUAL Rev 14.doc

Analysis Corporation
STAT
Qualifications The Technician shall have a minimum of a high school diploma or equivalent. Technicians will have documented proof of technical proficiency via in-house training at STAT, including an IDOC. Instrumentation Technicians must have four hours of equipment manufacturer training or two-week apprenticeship under an experienced analyst.
2.2 Approved Signatories
All analysts that have passed training for a particular analysis can sign off on data either as analyst or secondary review (as appropriate). All customer correspondence is to be signed either by the Laboratory Director, Technical Manager, Department Managers, or Project Managers as appropriate. For asbestos and microbiology, analysts sign reports. Quotes can be generated and signed by the President/CEO, Laboratory Director or Project Manager (unless specific approval is given to another employee by the named individuals). All bid proposals are to be signed by the President/CEO, Laboratory Director, Project Managers or designee.
2.3 New Work Requirements All new analyses must undergo a thorough review prior to release. The Laboratory Director, Technical Manager, Quality Assurance Director , and Department Manager may undertake this review. This review may include:
• Staff and appropriate equipment are available as well as appropriate workspace to perform the task.
• Standard Operating Procedure must be in place. • Initial Demonstration of Capability (IDOC) must be performed. • Method Detection Limit Study (if applicable) must be performed. • A Blind Quality Control Sample must be satisfactorily completed, if available.
The procedure to review new work and new test method analyses is outlined in SOP 220 Customer Service.
2.4 Departures from Policies and Procedures
All laboratory personnel are instructed to follow the policies and procedures as outlined in the Quality Assurance Manual and supporting laboratory documentation. On occasion, departures from these policies and procedures may be taken. Any such departures must be fully defined, documented, and approved by the Technical Manager or the President/CEO. If the departure is considered a permanent change, a new revision of the laboratory’s quality documentation may be necessary.
QA 001 Quality Assurance Manual Revision 14
November 15, 2013 Page 13 of 93
\\Harrison\D\Quality Control\SOPs & QAM\Quality Assurance Manual\QA 001 QA MANUAL Rev 14.doc

Analysis Corporation
STAT
Any modifications to reference test methods are listed in Section 5 of the test method SOPs. These modifications are approved by management as indicated by the signatures on the SOP cover page.
Minor modifications to test methods for particular samples are allowed if these modifications are fully documented. An example follows:
The test method SOP states that a 30-gram soil sample is extracted and analyzed for Semi-Volatile Organic compounds. The submitted sample weighs only 10 grams. The analyst notes in the logbook that the minimum amount of sample was not available for analysis. The customer agrees that the sample can be analyzed as submitted. The final reporting limit for this sample will be elevated due to limited sample size.
3. DOCUMENT CONTROL
All internal and external documents that form STAT Analysis Management System are tracked. Documents are assigned a unique document number, revision and effective date noted. Controlled documents (SOPs) are also listed with all individuals who have been issued these documents (including external customers). This document, QA 001 Quality Assurance Manual Revision 14, is a controlled document. The procedure to maintain and control laboratory documents is outlined in SOP 005 Document Control. Controlled copies of the SOPs, Quality Manual and other documents are located in each room in a controlled binder of the laboratory for personnel to use. The documents referenced in SOP 005 include software (e.g. excel spreadsheets and reporting templates, instrument operating software), instrument operation manuals, and other internal and external source documents. Lists of internal and external source documents, softwares, and instruction manuals are updated, if necessary, following annual review or following purchase of new equipment. As these documents are updated and revised, the QA department will replace each controlled copy with the revision in the controlled binders. The original hardcopy document is archived and all superceded controlled copies are destroyed (see SOP 240 Archiving). The computer file is archived via the computer network and will include all the changes to the document. Spreadsheets and other STAT generated electronic documents are tracked through the Master Document Spreadsheet List which is located in \\Harrison\d\Quality Control\\pinaki-littlefield\tracking\tracking-Master Document List, which contains spreadsheet title and revision number. All laboratory notebooks are considered to be controlled documents.
4. GENERAL LABORATORY PRACTICES All aspects of laboratory operations are documented in Standard Operating Procedures
(SOPs). Each page of these SOPs will contain 1) SOP Number, 2) Revision Number, 3) Effective Date, and 4) current page number of the total number of pages in the document. This is described in SOP 100, SOP on SOPs.
QA 001 Quality Assurance Manual
Revision 14 November 15, 2013
Page 14 of 93 \\Harrison\D\Quality Control\SOPs & QAM\Quality Assurance Manual\QA 001 QA MANUAL Rev 14.doc

Analysis Corporation
STAT
4.1 Introduction Intrinsic to the production of quality analytical data is the quality of laboratory services available to the analyst. Without adequate quality control being exercised with regard to facilities, services, laboratory environment, instrumentation, and laboratory supplies, an analyst cannot be expected to produce reliable analytical data. Access to the laboratory is restricted to STAT employees only, unless accompanied by a STAT employee. Recognizing the necessity of maintaining control over general laboratory operation, the subsequent sections outline provisions for maintaining the quality laboratory support services.
4.2 Laboratory Apparatus and Instruments
All support equipment is maintained in proper working order. All water baths, refrigerators, freezers, ovens, balances, pH meters, thermometers, mechanical pipettes, and the conductivity meter must be verified in accordance with SOP 1040 General Laboratory Practices (GLP) and/or the analytical SOP. Where possible, calibration and reference standards, traceable to national standards of measurement, are used in the laboratory to calibrate and/or verify the test equipment. These calibration and reference standards are only used for calibration and/or verification purposes. The laboratory uses an independent calibration service to perform an annual check of the balances and an annual check of the mechanical pipettes. In addition, an independent calibration service is used to perform a calibration check of the NIST reference thermometer at least every five years or as required by the manufacturer or calibration certificate. Vendors and service suppliers need to provide traceability of their products to NIST or to another recognized national standard of measurement. Criteria for identifying valid service suppliers and vendors and determining valid products are discussed in SOP 1330, Purchasing. Instructions for support equipment operations are found in STAT SOP 1040 General Laboratory Procedures. 4.2.1 Water baths 4.2.2 Refrigerators and freezers 4.2.3 Ovens 4.2.4 Balances 4.2.5 pH meters 4.2.6 Thermometers
Unless otherwise specified by regulatory methodology, it is the policy of STAT to use only non-mercury containing thermometers in all laboratory operations.
4.2.7 Mechanical Pipettes . 4.2.8 Plastic Tubes
QA 001 Quality Assurance Manual Revision 14
November 15, 2013 Page 15 of 93
\\Harrison\D\Quality Control\SOPs & QAM\Quality Assurance Manual\QA 001 QA MANUAL Rev 14.doc

Analysis Corporation
STAT
4.2.9 Weights 4.2.10 Conductivity meter 4.2.9 4.2.11 Incubators 4.2.12 Autoclaves
Record temperature, pressure, and time maintained during each autoclave use per SOP 1130.
4.3 Laboratory Supplies
4.3.1 Glassware Glassware used in general laboratory operations must be of high quality borosilicate glass. Volumetric glassware must be of Class “A” quality, except where the method specifies plastic volumetric flasks. Procedures for cleaning laboratory glassware are described in STAT SOP 1020 Laboratory Glassware Cleaning.
4.3.2 Chemicals, Reagents, Solvents and Gases
The quality of chemicals, reagents, solvents, standards and gases used in the laboratory is determined by the sensitivity and specificity of the analytical techniques being used. Reagents of lesser purity than specified by a method will not be used.
Reagents, chemicals, solvents, and standard reference materials (excluding high-demand items) should be purchased in quantities to minimize extended shelf storage.
All reagents, chemicals, solvents, and standard reference materials are initialed and dated when received, when opened or prepared, and discard when outdated, or when evidence of discoloration or deterioration is detected (STAT SOP 1010 Analytical Standards and Reagents Receipt and Preparation).
4.3.3 Laboratory Reagent Water
The laboratory reagent water system is tap water that is processed through a carbon-filtering tank and two mixed-beds ion exchange tanks. This water is checked daily to ensure that it has at least 1 megohm-cm resistivity (≤ 1 umhos/cm conductivity) at 25oC and recorded in conductivity logbook (STAT SOP 4200 Conductivity and SOP 1040 General Laboratory Practices). Reagent water blanks are performed with each water batch to monitor for potential contamination.
QA 001 Quality Assurance Manual Revision 14
November 15, 2013 Page 16 of 93
\\Harrison\D\Quality Control\SOPs & QAM\Quality Assurance Manual\QA 001 QA MANUAL Rev 14.doc

Analysis Corporation
STAT
4.4 Laboratory Hazardous Wastes Handling and Disposal Procedures
It is the policy of STAT Analysis to collect, store, package, label, ship and dispose of hazardous wastes in a manner which ensures compliance with all Federal, State and local laws, regulations, and ordinances. These procedures are designed to minimize employee exposure to hazards associated with laboratory-generated hazardous wastes and to afford maximum environmental protection (STAT SOP 1130 Waste Disposal).
4.5 Selection and Purchasing of Services and Supplies Goods and services are purchased from qualified companies and individuals. The purchased items may be chemicals, consumable items, equipment, calibration services, repair services, sub-contract laboratory services, consultant services, and building and environmental services. The laboratory maintains a list of qualified and approved vendors, suppliers, sub-contractors, consultants, and contractors. Service suppliers are deemed qualified if they have ISO 17025 accreditation in combination with ISO Guide 34 and a certificate bearing the seal of accreditation from an ILAC signatory. Purchased supplies and reagents and consumable materials that affect the quality of tests and/or calibrations are not used until they have been inspected or otherwise verified as complying with ISO 17025 accreditation. Actions taken to check compliance are documented. A sub-contractor, usually a testing laboratory, provides test reports to STAT that is used to supplement the information sent to STAT’s customers. A sub-contractor may perform test methods that are not currently being performed at STAT, or may serve as an adjunct to the testing methodology already in place at STAT. Sub-contractors are deemed qualified if they possess accreditation from the National Environmental Laboratory Accreditation Program (NELAP), American Industrial Hygiene Association (AIHA-LAP, LLC), Environmental Laboratory Accreditation Program (ELAP), National Voluntary Laboratory Accreditation Program (NVLAP), American Association for Laboratory Accreditation (A2LA), or from some other nationally recognized accreditation body. If there is no independent means to qualify a potential vendor or supplier, the following procedure is used: Obtain qualification statements, obtain a list of references or customers, and send inquiries to these parties to obtain written information concerning the quality of materials and services rendered. Contact the Better Business Bureau (BBB) to determine if any complaints have been filed. A request or a purchase order may be made to a vendor to supply a small lot of material to be qualified using STAT in-house test methodology. A request or a purchase order may be made to a supplier to perform a service that will be independently verified by an already approved supplier. If this qualifications procedure is deemed successful, the vendor or supplier may be added to the approved list. The results of this evaluation is recorded on the Vendor Evaluation Form (SOP 1330 Purchasing, Form #3,) STAT will determine the best value for its expenditures if two equally qualified and approved vendors or suppliers offer the same materials or services.
QA 001 Quality Assurance Manual Revision 14
November 15, 2013 Page 17 of 93
\\Harrison\D\Quality Control\SOPs & QAM\Quality Assurance Manual\QA 001 QA MANUAL Rev 14.doc

Analysis Corporation
STAT
5. VERIFICATION PROCEDURES
5.1 Introduction
It is the objective of STAT to provide our customers with data that is of known and documented quality consistent with the analytical methods and SOPs listed in Appendix 3. This is accomplished with the use of traceable calibrations and documentation of this traceability with external reference samples. Where possible, calibration and reference standards, traceable to national standards of measurement, are used in the laboratory to calibrate and/or verify the test equipment. These calibration and reference standards are only used for calibration and/or verification purposes.
5.2 Traceability of Calibrations Each analytical process undergoes the following to document calibrations used in the
laboratory:
5.2.1 Initial Demonstration of Capability: Each analyst to determine the range of instrument operation, if applicable, and to demonstrate precision and accuracy, analyzes a series of laboratory control standards. This study is signed by the analyst, Department Supervisor, the QA Director, and the Technical Manager. See the specific requirements in SOP 1230 Training and analytical SOPs.
5.2.2 Initial Calibration Determination: Based on the Initial Demonstration of
Capability (IDOC), an initial calibration is performed. The ICAL determination must meet the criteria specified in the analytical SOP.
If the regulatory limit is stated or defined for a particular analysis or test parameter, the laboratory’s policy is to perform the analysis using a calibration standard at or below the defined regulatory limit.
5.2.3 Initial Calibration Verification: The Initial Calibration Verification is
immediately performed to determine the validity of the initial calibration. This standard is from a second source, if available. Concentrations and acceptance criteria are specified in the relevant analytical SOP.
5.2.4 Method Detection Limit Study: The laboratory performs an MDL study prior to
instituting a new procedure/analysis and a LOD/LOQ study yearly thereafter. MDL study is not applicable for some tests, e.g., pH, odor, temperature, etc. These procedures are outlined in STAT SOP 1210 Method Detection Limits.
QA 001 Quality Assurance Manual Revision 14
November 15, 2013 Page 18 of 93
\\Harrison\D\Quality Control\SOPs & QAM\Quality Assurance Manual\QA 001 QA MANUAL Rev 14.doc

Analysis Corporation
STAT
5.2.5 Quality Control Check Sample: External reference standards that are analyzed as an unknown by the analyst. This provides an independent check of the analytical process. These results may be placed in the analysts’ training file. See section 5.3.2.2 for more details. The laboratory maintains a reference slide and spore collection of each microbiological sample identified. Because microbiological analyses measures constantly changing living organisms, these organisms are inherently variable. STAT SOP 005 Document Control contains references used in this laboratory.
5.2.6 Continuing Calibration Verification: A calibration standard is prepared and
analyzed when an initial calibration is not performed. At a minimum, a calibration check is analyzed at the beginning and at the end of each analytical batch. Organic internal standard methods are an exception where the calibration check is analyzed only at the beginning of the analytical sequence. Refer to the analytical SOPs for frequency and acceptance criteria. If a calibration check fails the appropriate SOP stated criteria, and routine corrective action fails to produce a second calibration check within acceptance criteria, then the initial calibration and initial calibration verification is performed. All samples analyzed since the last calibration check was in control will be re-analyzed, except in those instances where the calibration check was exceeded high (high bias) and there are non-detect results for the corresponding analyte in the samples associated with the calibration check. Those non-detects may be reported.
5.2.7 Method Blank Determination: A method blank is performed once per preparation
batch per matrix type. The method blank is a negative control. A method blank is acceptable if it does not contain an analyte of interest at a concentration greater than the highest of the following: the reporting limit, 10% of the regulatory limit for that analyte, or 10% of the measure concentration for that analyte in any environmental sample in the batch. Some approved test methods do not require method blanks (e.g., pH, temperature, conductivity, etc.) Refer to the individual analytical SOP for acceptance criteria.
5.2.8 Analytical Reagent Blank: Analytical reagents, without media, shall be prepared
and analyzed, when applicable, with each batch of samples, using the same procedure that is used for field samples.
5.2.9 Field Blank: It is recommended that customers of the laboratory supply
specimens of blank sampling media from the same source lot as was used for collecting the field samples. A field blank from this source lot can help determine possible contamination of an analyte during handling and shipping procedures.
5.2.10 Continuing Calibration Blank (Inorganic): Inorganic SOPs require continuing
calibration blanks analyzed each time a calibration check is analyzed. The same criteria are used as specified for method blanks (5.2.7). All samples analyzed
QA 001 Quality Assurance Manual Revision 14
November 15, 2013 Page 19 of 93
\\Harrison\D\Quality Control\SOPs & QAM\Quality Assurance Manual\QA 001 QA MANUAL Rev 14.doc

Analysis Corporation
STAT
since the last continuing calibration blank that was in control will be re-analyzed, except in those instances where there are non-detected results for the corresponding analyte in the samples associated with the continuing calibration blank. Those non-detected results may be reported.
5.2.11 Interference Check Standards (ICS): ICSs used in ICP-MS analysis checks for
metal complex interferents (e.g. Ar, C, Cl, etc) with a similar mass of low concentration analytes. The appropriate analytical SOP contains specific instructions for analysis of these standards.
5.2.12 System Tuning Verification (GC/MS and ICP/MS): The GC/MS is hardware
tuned before performing the initial and continuing calibrations. Refer to the individual analytical SOP for acceptance criteria.
5.2.13 Internal Standard Area Monitoring (GC/MS and ICP/MS): Internal standards are
monitored to determine the quality of the injection process. Criteria are in the appropriate analytical SOP with corrective action specified.
5.2.14 Laboratory Control Standard: Laboratory Control Standard (or Sample) (LCS) is
performed at least once per preparation batch per matrix. The LCS and MS/MSD are positive controls that measure the percent recovery (5.5) of the analytes added prior to preparation/analysis. They provide the assurance that the analytical system is capable of measuring the analytes specified. If the LCS does not meet control limits specified in the SOP, analysis is halted and corrective action taken to bring the system under control, including re-preparation of all samples in the batch associated with the out-of-control LCS. LCS is not performed when spiking solutions are not available, e.g., color, odor, temperature, dissolved oxygen, or turbidity.
5.2.15 Surrogate or System Monitoring Compounds (Organic): Surrogate compounds
are added to most organic chromatography methods. Surrogates indicate that sample preparation and analysis are within the appropriate method SOP criteria. Specific SOPs have procedures handling out-of-control situations, including sample re-extraction/re-analysis.
5.2.16 Matrix Spike/Matrix Spike Duplicate: Matrix Spike/Matrix Spike Duplicate
analysis is similar to LCS analysis (5.2.14) except it is performed on customer samples. The MS/MSD shall be prepared once per preparation batch of 20 or less samples per matrix type. If more than 20 samples are prepared a second MS/MSD shall be prepared after the twentieth sample.. Samples specified for MS/MSD analysis by customers will be selected if so indicated. MS/MSDs indicate the effect of the sample matrix on the precision and accuracy of the results generated using the selected method. This information does not determine the validity of the entire batch. For cases where the sample cannot be divided (e.g., wipes, air samples, not enough sample provided by customer) and thus a MS/MSD pair
QA 001 Quality Assurance Manual Revision 14
November 15, 2013 Page 20 of 93
\\Harrison\D\Quality Control\SOPs & QAM\Quality Assurance Manual\QA 001 QA MANUAL Rev 14.doc

Analysis Corporation
STAT
cannot be prepared for the preparation batch, an LCS/LCSD pair is analyzed to measure precision.
5.2.17 The laboratory will maintain a reference slide collection of asbestos types with
various asbestos concentrations from previous NIST Proficiency Analytical Testing rounds. Standard Reference Materials (SRMs) are purchased from NIST for calibrations.
5.2.18 Duplicate Analysis (for analyses not suitable for spiking): Samples that are not
suitable for MS/MSD analysis will be analyzed in duplicate. A Laboratory Control Standard Duplicate (LCSD) will also be performed for tests not suitable for matrix spike analysis or duplicate analysis (e.g. wipes, air samples, etc.). Relative Percent Difference (5.4) is calculated and compared to control criteria listed in the approved method SOP.
5.2.19 The laboratory maintains performance records to document the quality of data
that is generated. Method accuracy for samples is assessed and records maintained. STAT generates in-house acceptance limits and compares method performance data to the reference method criteria. The in-house control limits are generated based on a minimum of 20 data points. Parameters for which control limits are generated include, but not limited to, LCS, Surrogate recovery, and MS/MSD recoveries. Acceptance limits are developed based on three standard deviation from the average recovery and warning limits are developed based on two standard deviation from the average recovery. Control limits for the method parameters are generated by the QA Director in consultation with the Technical Manager, Laboratory Director, and Department Manager. Control limits are distributed to the analysts via updates to the LIMS control charts. The control limits are calculated based on in-house performance data. In-house generated data is compared to the specifications of the reference method. If the in-house limits are within the specifications of the reference method, the control limits are updated in LIMS. If the in-house limits are not within specifications, an investigation is performed to determine the cause(s) of the problem and a corrective action is completed. The analysis may continue until enough data points are collected to regenerate new control limits. Any QC data generated outside of reference method limits during that time frame, is flagged.
5.3 Performance Testing Samples
5.3.1 Introduction As part of the laboratory’s Quality Assurance program, an independent means of assessing laboratory accuracy for its performance in the various test methodologies has
QA 001 Quality Assurance Manual Revision 14
November 15, 2013 Page 21 of 93
\\Harrison\D\Quality Control\SOPs & QAM\Quality Assurance Manual\QA 001 QA MANUAL Rev 14.doc

Analysis Corporation
STAT
been developed. The Performance Testing Program analyzes Performance Testing (PT) samples on a routine basis. These samples, are of an unknown concentration to the analyst who performs the test. The purpose of analyzing these samples is to determine whether the analyst/laboratory can produce analytical results within specified acceptance criteria.
For analysis of all PT samples, with the exception of the EMPAT fungal direct examination program, the laboratory’s procedure is as follows:
• Upon receipt, the Performance Testing Samples are treated as any other sample submitted to the laboratory. They are logged into the system and assigned a unique laboratory number. A LIMS work order is generated and samples are distributed to the analysts. The samples are then prepared and analyzed in the same manner as any other submitted samples using the same procedures, equipment, and laboratory personnel. After the data review process, test results are recorded in the LIMS. A final report is generated and results are reported to the Technical Manager, Quality Assurance Director and Laboratory Director. Depending upon the type of PT sample, the final report is then submitted to the PT provider or evaluated in-house. After evaluation, either by the PT provider or by the QA Manager, the report is filed in the QA Manager’s office.
• For PT sample studies that are used for accreditation purposes, the evaluation report, copies of the PT study report forms, copies of all support documentation, and copies of any corrective action investigations and resolutions, are kept in the QA Manager’s files. This allows easy reconstruction and review of this data by the accrediting authority during on-site audits. This data, along with any electronic records, is kept at a minimum of five years from the date of the evaluation report received from the PT provider. This time frame may be increased to comply with any additional regulatory program requirements.
• All analysts participate in the PT process. Successful analyses are used to obtain accreditation or to maintain the laboratory’s current scope of accreditation. They may also be used to update employee-training records (continuing DOC), or to demonstrate to customers or other interested third parties that the laboratory is capable of producing quality data.
• For unacceptable results, or results that are in-control but are continually statistically biased high or low, corrective action must be taken to determine the cause of the problem. This is accomplished by the corrective action process (SOP QA 230 Corrective Action). For PT sample studies that are used for accreditation purposes, copies of any corrective action investigations and resolutions are available to accrediting authorities.
• For the EMPAT fungal direct examination program, the analyst views and identifies the unknown samples on-line. On a quarterly basis, the laboratory has access to 20 different digital images for identification of spores.
• The laboratory will notify its customers and interested third parties, in writing, of any change to the laboratory’s scope of accreditation (addition or deletion of analytes or fields of testing).
QA 001 Quality Assurance Manual
Revision 14 November 15, 2013
Page 22 of 93 \\Harrison\D\Quality Control\SOPs & QAM\Quality Assurance Manual\QA 001 QA MANUAL Rev 14.doc

Analysis Corporation
STAT
The laboratory has established policies in reference to the analysis of PT samples. They are as follows:
• PT samples are treated and analyzed in the same manner as other sample submitted to the laboratory.
• The laboratory does not send any PT sample, or portion of a PT sample, for which it seeks to obtain accreditation or maintain its current accreditation to another laboratory for analysis.
• The laboratory does not knowingly accept PT samples or portions of PT samples from other laboratories for any analyses for which the sending laboratory seeks accreditation or is accredited.
• Laboratory personnel do not communicate with any other individuals from any other laboratories concerning PT samples.
• Laboratory personnel do not attempt to obtain the assigned value or analyte concentration of any PT sample from the PT provider.
5.3.2 NELAC Performance Samples
The PT program is divided into two sections.
5.3.2.1 External Evaluation of Performance Sample The first section of the program is dedicated to the analysis of PT samples for compliance with accreditation programs such as NELAC. The PT samples for this section of the program are of an unknown concentration to all laboratory personnel (blind to the laboratory). At a minimum of two times per year (approximately every six months), PT samples for each field of testing (each analyte/method/matrix) are purchased from a Proficiency Testing Oversight Body/Proficiency Testing Provider Accreditor (PTOB/PTPA) approved PT provider, when available. After analysis, a report is submitted to the PT provider for evaluation. The Technical Manager, Quality Assurance Director and Laboratory Director are responsible for the accuracy and the format of the report submitted to the PT provider. In order to initially obtain and to currently maintain accreditation, the laboratory must be successful in the analysis of these samples in two of the three most recent rounds of testing. If there is a failure to successfully analyze a particular analyte or supplemental testing is warranted, the laboratory must wait at least 30 days before analyzing additional samples. To maintain accreditation, the laboratory will continue to analyze samples at the prescribed frequency (two PT studies for each PT field of testing per year) unless there is a change in the program or in the environmental regulations. It will maintain a history of at least two acceptable PT studies for each PT field of testing out of the most recent three studies. The laboratory authorizes the PT provider to release the results of the laboratory’s performance (sample results and acceptable/not acceptable status) on any of the PT samples directly to any accrediting authority, NELAP, and the PTOB/PTPA.
QA 001 Quality Assurance Manual
Revision 14 November 15, 2013
Page 23 of 93 \\Harrison\D\Quality Control\SOPs & QAM\Quality Assurance Manual\QA 001 QA MANUAL Rev 14.doc

Analysis Corporation
STAT
5.3.2.2 In-House Evaluation of Performance Samples The second section of the program is for in-house evaluation of analyst performance. The PT samples for this section of the program are of an unknown concentration to the analyst performing the test (blind to the analyst). The QA Manager purchases these samples that include the true analyte concentration and performance acceptance limits. The QA Manager does not divulge this information to any of the laboratory personnel. PT samples are purchased from a PTOB/PTPA approved PT provider or another provider that can provide samples that are traceable to NIST, when available. After analysis, a report is submitted to the QA Manager for evaluation. The successful analyses of these samples may be used as documentation for the analysts continuing Demonstration of Capability in the applicable test methods.
5.3.3 AIHA-PAT - Performance Samples For purposes of this program, an industrial hygiene laboratory is defined as a laboratory that analyzes samples or materials for the purpose of evaluating occupational exposure or contamination resulting from occupational activities. The laboratory participates in three programs for accreditation: 1) the AIHA-PAT Industrial Hygiene Laboratory Accreditation Program (IHLAP) for accreditation of industrial hygiene laboratories; 2) the AIHA-PAT Environmental Lead Laboratory Accreditation Program (ELLAP) for accreditation of laboratories performing lead analysis and, the AIHA PAT Environmental Microbiology Laboratory Accreditation Program (EMLAP). For the ELLAP program, the laboratory analyzes PAT samples in the following Fields of Testing: airborne particulates, dust wipes, paint chips and soil. The purpose of the PAT program is to ensure that the laboratory meets established performance criteria for the analysis of industrial hygiene samples. This laboratory chooses to participate in the four rounds of performance samples per year. AIHA-PAT PT programs are performance based and the programs do not specify the use of any particular analytical method when analyzing PT samples, except for asbestos by PCM. Proficiency testing samples shall be analyzed using the same analytical procedure used to test customer samples. The laboratory shall be responsible for the timely and proper submission of all PT sample results to the AIHA-PAT. The laboratory shall submit data using the AIHA Data Entry Portal on the AIHA web site. The data must be entered into the system by the specified deadline. An unreported result is classified as an outlier unless the AIHA-LAP, LLC has pre-approved nonparticipation. The AIHA-PAT shall provide the PT reports to each participating laboratory forty-five days after the close of the PT round. Accredited laboratories shall maintain these records for use during the assessment process. The laboratory is responsible for notifying the AIHA-PAT of any changes in laboratory status that may affect the receipt of PT samples/information, such as a change in address or named recipient.
QA 001 Quality Assurance Manual Revision 14
November 15, 2013 Page 24 of 93
\\Harrison\D\Quality Control\SOPs & QAM\Quality Assurance Manual\QA 001 QA MANUAL Rev 14.doc

Analysis Corporation
STAT
A result that is outside the statistical control limits determined for the Industrial Hygiene Performance Analytical Testing (IHPAT) or Environmental Lead Performance Analytical Testing (ELPAT) Environmental Microbiology Performance Analytical Testing (EMPAT) round is classified as nonconforming work.
5.3.3.1 IHPAT Round Performance Samples Proficiency is determined Field of Testing by Field of Testing and round by round. A laboratory is rated proficient for a given round for the applicable Field of Testing (FoT) if there is not more than twenty-five (25) percent deficiency for a given Field of Testing for that round. A laboratory is rated as proficient for the FoT if it passes two out of three consecutive test rounds. The laboratory shall have participated in at least two (2) PT rounds to be considered for accreditation. When PT samples are analyzed by more than one analyst, averaging the results for reporting is not permitted. A single analyst’s results are reported. 5.3.3.2 ELPAT Round Performance Samples A laboratory is rated proficient for the applicable FoT if there are not more than 25% cumulative outliers reported in the last four consecutive PT rounds in which the laboratory has participated at the time of accreditation or no outliers reported in the last two consecutive PT rounds. The laboratory shall have participated in at least two (2) PT rounds to be considered for accreditation. 5.3.3.3 EMPAT Round Performance Samples In order to maintain accreditation, the laboratory must be 85 % successful in the analysis of microbiology samples in the three most recent rounds of testing. To maintain accreditation, the laboratory will continue to analyze samples at the prescribed frequency (three PT studies for each PT field of testing per year) unless there is a change in the program or in the environmental regulations. It will maintain a history of at least 85 % acceptable PT studies for each PT field of testing out of the most recent three studies. 5.3.3.4 Inhouse PT (Demonstration of Competency, DOC) for Fields of Testing not covered by AIHA-LAP, LLC
Twice a year, a set of four media will be spiked at various levels by the QA director or designee. Spike levels will be given to the Department Manager. The blind samples will be run by the analyst and results evaluated against current in house limits for LCS recovery. The PT round will be considered passing for the FoT consisting of a single analyte if at least three out of four samples meet the LCS recovery acceptance limits. For FoTs containing multiple analytes, a sample is considered passing if 75% of the analytes meet the LCS recovery acceptance limits. Seventy-five percent of the samples must pass for the round to be considered passing. Results are evaluated by the QA Director for continuance of the FoT. Results are kept on file with the Department Manager. If a round fails, the round must be retested, four new samples are prepared/analyzed for each
QA 001 Quality Assurance Manual Revision 14
November 15, 2013 Page 25 of 93
\\Harrison\D\Quality Control\SOPs & QAM\Quality Assurance Manual\QA 001 QA MANUAL Rev 14.doc

Analysis Corporation
STAT
analyte and reevaluated. A laboratory is rated as proficient for the FoT if it passes two out of three consecutive test rounds. The laboratory shall have participated in at least two (2) PT rounds to be considered for accreditation. The laboratory will notify AIHA-LAP, LLC if it fails two out of three consecutive rounds and follow AIHA-LAP, LLC’s instruction for further action. Further details for each FoT are included in corresponding SOPs.
5.3.4 NVLAP Performance Samples
The PT program is divided into two sections. The first section of the program is dedicated to the analysis of PT samples for compliance with accreditation programs such as NIST/NVLAP. The PT samples for this section of the program are of an unknown concentration to all laboratory personnel (blind to the laboratory). PT samples for each field of testing are provided by NVLAP, generally, at a frequency of two times per year (approximately every six months). After analysis, a report is submitted to the PT provider for evaluation. The analysts, Technical Manager, Quality Assurance Director and Laboratory Director are responsible for the accuracy and the format of the report submitted to the PT provider. In order to initially obtain and to currently maintain accreditation, the laboratory must score less than 150 points on two out of the last three consecutive proficiency testing rounds. To maintain accreditation, the laboratory will continue to analyze samples at the prescribed frequency (two PT studies for each PT field of testing per year) unless there is a change in the program or in the environmental regulations. The laboratory authorizes the PT provider to the release the results of the laboratory’s performance (sample results and acceptable/not acceptable status) on any of the PT samples directly to the NIST/NVLAP. The second section of the program is for in-house evaluation of analyst performance. This is accomplished by a round-robin program. Asbestos samples are distributed to numerous laboratories and analysis is summarized and distributed to all participants. After analysis, a report is submitted to the QA Manager for evaluation. The successful analyses of these samples may be used as documentation for the analysts continuing Demonstration of Capability in the applicable test methods.
5.4 Precision
Precision is expressed as percent relative standard deviation and is calculated by the formula: % RSD = S x 100
X
Where: S = Standard Deviation X = Mean
QA 001 Quality Assurance Manual
Revision 14 November 15, 2013
Page 26 of 93 \\Harrison\D\Quality Control\SOPs & QAM\Quality Assurance Manual\QA 001 QA MANUAL Rev 14.doc

Analysis Corporation
STAT
Precision can also be expressed as relative percent difference and is calculated by the formula: % RPD = D x 100
X
Where: D = Difference between measurements X = Mean
Percent difference is calculated by the formula: %D = (X-Y) x 100
X
Where: X = Initial Measurement Y = Comparison Measurement
5.5 Accuracy
Accuracy is expressed as percent recovery and calculated by the formula: (Y – X)/Z x 100 = % Recovery Where: X = concentration in unspiked sample. Y = concentration in spiked sample. Z = theoretical spike concentration
5.6 Analytical Performance Summary
Quality control data are reviewed on a continuous basis. During the review, percent RSD, percent RPD, upper warning and control limits of precision data and percent recovery of accuracy data are evaluated against established control limits. If a statistically significant trend is observed, then warning and control limits may be updated, and documented in Addendum to the SOP.
Annually, a summary report of the laboratory's analytical performance is prepared. Contained in this report are: the precision data (average percent RSD or RPD, upper warning and control limits), and accuracy data (average total percent recovery of spiked samples, reference samples, and performance audit samples). The Quality Assurance Director prepares this summary and it is reviewed by the Technical and the Laboratory Director prior to distribution for use.
QA 001 Quality Assurance Manual Revision 14
November 15, 2013 Page 27 of 93
\\Harrison\D\Quality Control\SOPs & QAM\Quality Assurance Manual\QA 001 QA MANUAL Rev 14.doc

Analysis Corporation
STAT
6. METHODOLOGY
Test method SOPs are based upon nationally recognized test method references such as the United States Environmental Protection Agency (USEPA), National Institute for Occupation Safety and Health (NIOSH), NIST/NVLAP, Standard Methods (American Public Health Association, American Water Works Association, Water Environment Federation), CPSC and American Society for Testing and Materials (ASTM). These test methods are used for sample analyses, and the related sample handling and storage activities are appropriate and consistent with the required quality and accuracy deemed necessary for customers and their decision-making processes concerning environmental regulations and compliance. The laboratory uses the most stringent standard as stated in the reference test method or as specified in the applicable regulation.
Appendix 3 contains a table of the laboratory’s scope of test methods and SOPs.
7. PHYSICAL FACILITIES AND EQUIPMENT 7.1 Facilities
STAT has over 12,000 square feet of state-of-the-art laboratory facilities. An electronic key-punch provides limited access to this building. The laboratory space and ventilation system was specifically refurbished to achieve the critical needs of an environmental laboratory. For example, laboratories for air toxics and volatiles analyses are positively pressurized and are supplied with fresh air that is carbon filtered. Environmental lead is digested and analyzed in a laboratory separate from bulk lead samples (paint chips, dust, etc) to prevent cross contamination. Separate laboratories are provided for microbiology, optical microscopy and electron microscopy. Three organic extraction laboratories occupy nearly 1400 square feet of space and allow for extraction of air, water and soil with room for further expansion. A facility lay-out is provided in Appendix 4. There is no other testing facility being utilized other than the permanent lab premises. The rooms are dedicated to specific laboratory testing departments and administrative offices. The physical environment (temperature, humidity, lighting, and ventilation) is adequate to perform all testing methodologies. Temperature is monitored and controlled by individual thermostats in each room. Ventilation hoods are monitored as part of the laboratory safety program. Any problems encountered with the physical accommodations are immediately brought to the attention of the Technical Manager or the Laboratory Director. The building engineer is then notified to take immediate corrective action to remedy any problems.
As part of the Internal Audit Process (SOP 1220 Internal Quality Assurance Audit), the QA Manager is required to monitor the laboratory’s facilities to ensure that the facilities are adequate and that personnel are in compliance with laboratory policies. Those areas audited include the following:
• Ventilation: hoods checked and tagged per the Chemical Hygiene Plan QA 001 Quality Assurance Manual
Revision 14 November 15, 2013
Page 28 of 93 \\Harrison\D\Quality Control\SOPs & QAM\Quality Assurance Manual\QA 001 QA MANUAL Rev 14.doc

Analysis Corporation
STAT
• Room temperature: monitor the TCLP extraction area • Voltage surge suppressors to protect computer network and critical
instrumentation • Separation of incompatible areas is maintained • Personnel movement is limited to prevent cross-contamination • Good housekeeping practiced - items reviewed: benches, floors, hood used
properly, clutter, glassware cleaning space and storage, bottle/container storage • Waste storage area is reviewed to ensure safe practices • Air Monitoring for Spores in Microbiology Laboratory: Background
contamination is to be checked periodically (once every Quarter). If growth of Aggressive spores is observed, all areas of the laboratory are cleaned. The air system is checked, and if necessary, filter is replaced. Cleaning will continue until no background contamination is detected.
• Air Monitoring for Asbestos: Background contamination is to be checked periodically (once every Quarter) by taking air samples from areas where asbestos is handled, such as sample receiving, bulk asbestos analysis Laboratory, and PCM and Transmission Electron Microscopy (TEM) Laboratory. Samples are analyzed by TEM. If presence of asbestos is confirmed, all areas of the laboratory are cleaned. Cleaning will continue until no background contamination is detected.
• Background Monitoring for Lead in Lead Laboratory: Background contamination is to be checked periodically (once every Quarter). If lead is observed, all areas of the laboratory are cleaned. Cleaning will continue until no background contamination is detected.
7.2 Equipment
The major equipment in use at STAT Analysis Laboratory is listed in Appendix 4. The equipment list is under the control of the Quality Assurance Director . The list is updated as required whenever new equipment is purchased or current equipment is permanently removed from service.
7.3 Equipment Maintenance Program
Proper maintenance of laboratory instrumentation is a key to longevity of the instrumentation, as well as providing the analyst with equipment capable of producing reliable analyses. The analysts and on occasion, vendor specialists, share the responsibility for maintenance and repair of all STAT Analysis Laboratory equipment. Specific maintenance requirements are found in the analytical SOPs. Therimary elements of the equipment maintenance program include:
• All major equipment receives a daily check for such things as: cooling fan operation, pump operation, indicator readings, mechanical checks, clean air filters, etc.
• Service schedules are established for performing routine preventative maintenance on all major equipment items.
QA 001 Quality Assurance Manual Revision 14
November 15, 2013 Page 29 of 93
\\Harrison\D\Quality Control\SOPs & QAM\Quality Assurance Manual\QA 001 QA MANUAL Rev 14.doc

Analysis Corporation
STAT
• Records are maintained for all instrument repairs (See individual instrument maintenance logbooks).
• A conservative inventory of critical spare parts is maintained for high-use instrumentation.
• Vendor operation and maintenance manuals are maintained for laboratory instrumentation.
Any equipment that is found to be defective is taken out of service. The equipment is tagged by the person making the judgment and marked “Out of Service;” the person applies their initials and dates the tag. This action is noted in the maintenance logbook. The department supervisor is notified of this action. If deemed necessary, a corrective action report is initiated to determine if the malfunctioning equipment has potentially generated data that is suspect. The equipment is not put back into service until repairs are made and the equipment is shown to be performing properly after calibration and/or verification procedures have been successfully completed and documented in the maintenance logbook.
8. SAMPLE RECEIPT and ACCEPTANCE
8.1 Introduction Complete documentation of the sample collection and handling process is an extremely important aspect of a regulatory monitoring effort. Formal chain-of-custody procedures provide a written record of sample traceability, accountability and serve to validate sample integrity. All samples received by STAT Analysis are controlled by these procedures. For more information see STAT SOP 300 (Sample Receiving and Login Procedure).
Appendix 5 contains a table of acceptable sample containers with sample preservation requirements for analyses listed in section 6. Sample collection is typically a function of our customer’s activities. STAT does not provide sampling services. STAT’s customers deliver samples to the laboratory for testing. However, STAT will attempt to ensure compliance with all applicable ISO/IEC 17025, NIST/NVLAP, AIHA-LAP, LLC, and NELAC requirements. STAT requests customers to submit field blanks with their samples, where applicable. A summary of STAT’s written sample acceptance policy will be made available to sample collectors. Data from samples that do not meet the sample acceptance criteria will be unambiguously flagged to define the nature of the variance. Sampling procedures for collection of subsamples are described within each method’s Standard Operating Procedure (SOP).
8.2 Sample Acceptance Policy
QA 001 Quality Assurance Manual Revision 14
November 15, 2013 Page 30 of 93
\\Harrison\D\Quality Control\SOPs & QAM\Quality Assurance Manual\QA 001 QA MANUAL Rev 14.doc

Analysis Corporation
STAT
Please refer to Appendix 6 for a detailed description of STAT’s Sample Acceptance Policy. It becomes the customer’s responsibility to distribute the sample acceptance policy to all field collection personnel. STAT Analysis Corp endeavors not to reject samples for analysis the is is accreditred to perform except for reasons of safety, radioactivity or the requirement to maintain a legal Chain of Custody. NOTE: STAT Analyses will not accept samples that require legal Chain-of-Custody.
8.3 Sample Acceptance Policy Differences 8.3.1 Additional Requirements for NELAC Samples :
8.3.1.1.1 Liquid Samples for volatiles analyses do not contain headspace.
8.4 Chain-of Custody Form A Chain-of Custody (COC) should accompany every sample that is received for analysis by STAT Analysis. If the COC is not present, the customer will be notified and the exception noted on the Sample Log and Checklist/Receipt Form (Sample Receiving and Login Procedure). (Attachments 2-4 list examples of COC forms.)
8.5 Standard Operating Procedure – Sample Receipt/Custody The sample custodian or a designated alternate receives samples. Receiving and Login Procedure. STAT accepts samples between the hours of 8 AM to 8 PM, Monday through Friday. STAT has a secured sample drop box outside the building for samples that do not require preservation and can fit inside the box. For samples that arrive after hours, the sample custodian will receive the samples the next business day. 8.5.1 For specific details refer to SOP 300 Sample Receiving. is
8.6 Policy for Disposal of Laboratory Samples Samples and their extracts will normally be disposed of within (STAT SOP 1130 Waste Disposal) 90 days from receipt of samples or in accordance with individual SOPs. The exception to this will be when a sample hold request is implemented. A disposal report will be generated and provided to designated staff as appropriate for samples characterized as non-hazardous (routine environmental). Sample disposal of the routine environmental samples should be completed by the appropriate analyst within 2 weeks from disposal report distribution. The routine environmental samples will be disposed of in the following manner: Refer to STAT SOP 1130 Waste Disposal for specific procedures
QA 001 Quality Assurance Manual Revision 14
November 15, 2013 Page 31 of 93
\\Harrison\D\Quality Control\SOPs & QAM\Quality Assurance Manual\QA 001 QA MANUAL Rev 14.doc

Analysis Corporation
STAT
9. SAMPLE RECORDS, DATA REVIEW AND DATA HANDLING
Sample accountability through the analytical process can be divided into five major elements: (1) initial sample logging, (2) sample preparation, (3) data acquisition, (4) data review, and (5) documentation/storage. The location of the sample and data records is discussed in SOP 1000 Control and Use of Laboratory Notebooks and in SOP 240 Archiving. Sample records must be able to reproduce the resultant analytical data. It is management’s responsibility to ensure that all analytical and operational activities of the laboratory are properly and sufficiently documented. This is accomplished through the periodic audit and review processes as outlined in SOP 1220 Internal Quality Assurance Audit and SOP 006 Management Review of the Quality System. All data, whether manually generated or electronically generated, and final reports are available to the accrediting authority (NELAC, AIHA-LAP, LLC, etc.).
The following sections outline current sample and data documentation and review procedures.
9.1 Sample Logging
Samples received at STAT with accompanying identification and COC are logged into the Laboratory Information Management System. The sample custodian, or designate, signs the laboratory receipt section of the COC. Each sample, and each sub-sample appropriately preserved, is assigned a unique sample ID. 9.2 Analytical Data Review and Handling All raw analytical and instrument control data generated in the laboratory are either entered into bound data books or kept as strip charts, or in instruments computer hardcopy, tape, CD-ROM, or disk. The analyst reviews the data initially and all data entries checked 100% and then the data under goes a second review by a technical peer or supervisor. Errors, or potential errors, are investigated and corrected as necessary. The analytical section manager, Project Manager, Technical Manager, or Laboratory Director, for consistency of data and for assuring customer’s needs are met, performs final review. Refer to STAT SOP 1250 Data Review. Information contained in these data logbooks includes the following: Work Order Number, Sample number, parameter, date of preparation or analysis, analyst, and all pertinent instrument identification with analytical conditions. For non-computerized instruments all calibration data, all readout data, calculations, final concentration, and quality control data should be recorded in the logbook.
QA 001 Quality Assurance Manual
Revision 14 November 15, 2013
Page 32 of 93 \\Harrison\D\Quality Control\SOPs & QAM\Quality Assurance Manual\QA 001 QA MANUAL Rev 14.doc
Analysis Corporation
STAT
9.3 Computerized Analytical Data System 9.3.1 All sample results are entered into the STAT Analysis Laboratory Information
management System (LIMS). Sample preparation, as appropriate, will also be entered in LIMS.
9.3.2 For NELAC and IH/Lead samples, all appropriate Quality Control data associated with these results are entered into the LIMS, including, but not limited to, Initial Calibration, Initial Calibration Verification, Continuing Calibration Verification, Continuing Calibration Blank, Method Blanks, Laboratory Control Standards, Matrix Spike/Matrix Spike Duplicate, Internal Standard Recoveries, and Surrogate Recoveries.
9.3.3 For all other samples, the quality control information is entered into a separate
database or spreadsheet. The information is stored under a unique batch identification number. This information may include: Initial Calibration, Initial Calibration Verification, Continuing Calibration Verification, Continuing Calibration Blank, Method Blanks, Laboratory Control Standards, and Matrix Spike/Matrix Spike Duplicate recoveries as applicable.
9.3.4 Analytical Data Processing. All final analytical results are calculated after entry into the analytical results database.
9.3.5 Analytical Backlogs can be generated through the LIMS system. Sample Status will be updated to complete after results are calculated. Samples that are complete will no longer appear on an analytical backlog report. The work order will only be available for Final Report after all sample results have been calculated and subjected to the Quality Control Validation Process.
9.4 Reporting
Final results of all analyses are provided in a standard computerized report format and forwarded to the requester (customer) with cover memorandum. Remarks should be used with reported data to alert the user to some specific conditions that affects the data (e.g., holding times missed, samples diluted to remove interferences, etc.). Exceptions to this report format must be noted and have approval of the Technical Manager or Laboratory Director.
For modified methods, reports are generated by appending an “M” to the method identifier. Amendments or corrections to the issued test report are only made in the form of a revised document that includes the statement “This report is revised to reflect changes made after the initial report was issued” in the cover letter or in the case narrative.
QA 001 Quality Assurance Manual Revision 14
November 15, 2013 Page 33 of 93
\\Harrison\D\Quality Control\SOPs & QAM\Quality Assurance Manual\QA 001 QA MANUAL Rev 14.doc

Analysis Corporation
STAT
Customers are notified immediately, in writing, of any event that cast doubt on the correctness or validity of the laboratory’s calibrations, or test results given in any test report or amendment to a report. Such events might include: identification of defective measuring, identification of defective test equipment, or audit findings.
Test results are certified to meet all requirements of NELAC, NVLAP, and AIHA-LAP, LLC standards, or reasons are stated if they do not meet these standards. Sample results are, generally, not blank corrected. Readers are referred to the specific analytical SOPs for details regarding blank correction. If analysis requires blank correction, then the blank used for correction, as well as its value, are noted in the case narrative. In addition to the items mentioned, below, in 9.4.1 (7), the analytical report will make the following statements: 1. The report shall not be reproduced except in its entirety, unless written
approval has been obtained from the laboratory. 2. The results of this report relate only to the samples tested. 3. The laboratory certifies that the test results meet all requirements of IEPA
code, Title 35, Subtitle: A, NELAP/Part 186 or NIST Handbook 150 (2006 Edition) or the AIHA-LAP, LLC Policy Document, current revision.
4. Accredited and non-accredited analyses will be distinguished. 9.4.1 Reporting Requirements
The Analytical Report will only be issued in its entirety. The Report will include: 1. A Title, e.g.: Analytical Report, STAT Work Order # or STAT Batch #. 2. Date, name and address of laboratory, phone number and name of contact
person (with signature) and laboratory accreditation number. The person signing the report is accepting responsibility for the content of the report;
3. A unique Work Order Number and the total number of pages in the report, with all pages sequentially numbered;
4. Name and address of customer and project identification; 5. Description and unambiguous identification of the sample(s) including the
customer identification code, date of sample receipt, date and time of sample collection;
6. Clear identification (including lab name and accreditation number) of any sample results that were generated by a subcontracted laboratory;
7. Case Narrative outlining any sample acceptance outliers and /or sample results with any failures or deviations from approved SOPs including the use and definitions of data qualifiers; as well as reporting uncertainties as required.
8. Identification of approved test method with date of sample preparation, sample preparation method, and/or analysis;
QA 001 Quality Assurance Manual Revision 14
November 15, 2013 Page 34 of 93
\\Harrison\D\Quality Control\SOPs & QAM\Quality Assurance Manual\QA 001 QA MANUAL Rev 14.doc

Analysis Corporation
STAT
9. Identification of reporting units, such as mg/L, mg/Kg, mg/Kg–dry, ppbv, µg/filter µg/wipe, mg, µg, wt. %, or µg/m3;
10. Measurements, examinations and derived results, supported by tables, graphs, sketches and photographs as appropriate, and any failures identified;
11. A statement to the effect that sample results relate only to the analytes of interest tested or to the sample as received by the laboratory;
12. Reference to sampling procedures if performed by the laboratory; 13. Identification of analytical methods, including “M” for modified methods,
to reflect the methods listed in STAT’s FoTs from various accrediting agencies.
9.4.2 Reporting Differences
9.4.2.1 NELAC Differences 9.4.2.2 Clear identification of numerical results with values outside the
quantitation limits. 10. CORRECTIVE AND PREVENTIVE ACTIONS Non-conforming work arises out of the analytical process. Corrective and Preventive actions are mechanisms for identifying and correcting Nonconforming work. Quality control data are evaluated, and if data are found to be outside control limits, corrective actions are taken to correct the problem and to prevent incorrect data from being reported. Corrective/preventive actions are tracked through LIMS in the same manner.
10.1 Corrective Action
Routine corrective action will be taken at any time during the analytical process as
outlined in the quality control sections of each SOP. These types of out-of-control situations include such things as: instrument calibration outliers, blank contamination, poor laboratory control standard recovery, poor surrogate recovery, poor matrix spike/ matrix spike duplicate recovery or RPD, etc. These situations require immediate corrective action. These required actions are specified in each analytical SOP. All routine corrective actions taken are documented by the analyst on the raw data or appropriate checklist including their initials and date, to assure traceability of corrective actions performed. All nonconforming data are recorded in a database in a way that they can be reviewed and assessed for recurrence. The database documents all nonconforming and conforming events, which can be reviewed to identify incidences of warning limit and control limit exceedances. Multiple exceedances of warning limits may trigger preventive action. Similarly, multiple exceedances of control limits will trigger corrective action. When instances arise that are not covered by the routine corrective action procedures in the applicable analytical SOP, the analyst must bring the issue to the attention of the Department and the QA Manager. The issues will be discussed with the
QA 001 Quality Assurance Manual Revision 14
November 15, 2013 Page 35 of 93
\\Harrison\D\Quality Control\SOPs & QAM\Quality Assurance Manual\QA 001 QA MANUAL Rev 14.doc

Analysis Corporation
STAT
appropriate staff, the best corrective action determined, performed, documented in the raw data and reported to the customer in a case narrative.”
Some out-of-control situations require a more formal corrective action process. They may be the result of internal or external audits, out-of-control proficiency testing analysis, continuing control chart outliers, or even the inability to produce analytical results on time. These situations require a more stringent process. This process may involve technicians, analysts, and laboratory management. The Quality Assurance Director monitors this process (STAT SOP QA 230 Corrective Action). Essential steps in this process include documentation of the following:
• Identification of the problem. • Assigning a tracking number to the Corrective Action. • Assigning personnel to investigate the problem. • Uncovering the root cause of the problem. • Correcting the problem. • Monitoring the corrective action. • Documentation of the corrective action.
Corrective Actions are resolved in a time frame relative to the severity of the defined problem. Some corrective actions may need to be immediately implemented in order for production to continue. Other corrective actions may require a certain amount of time in order to complete a full investigation. An appropriate time frame for completion of the corrective action is discussed with the affected parties. All corrective action investigations are to be completed within a two-week time frame unless unusual circumstances are documented that would extend this deadline. Corrective Actions investigations involve assigning an individual to investigate and determine the cause of the problem. 10.2 Preventive Action Preventive actions are pro-active processes to identify opportunities for improvement rather than a reaction to the identification of problems. Preventive actions will be taken upon identification of needed improvements and potential sources of nonconformity. Action plans will be developed, implemented, and monitored to reduce the likelihood of the occurrence of such nonconformities and to improve on existing procedures. As part of the preventive action, operational procedures will be reviewed. Data review may also be conducted that include trend and risk analyses and proficiency-testing results.
Steps in the preventive action process may include:
• Identification of the source of nonconformity or needed improvements. • Assigning personnel to investigate • Reviewing operational procedures. • Implementing needed improvements or procedure to avoid potential
nonconformity.
QA 001 Quality Assurance Manual Revision 14
November 15, 2013 Page 36 of 93
\\Harrison\D\Quality Control\SOPs & QAM\Quality Assurance Manual\QA 001 QA MANUAL Rev 14.doc

Analysis Corporation
STAT
• Monitoring the preventive action. • Documentation of the preventive action. • Assigning a tracking number to the Preventive Action
11. QUALITY EXCEPTION REPORT/CASE NARRATIVE
Some out-of-control situations are not correctable (e.g., silver matrix recovery when certain levels of chloride are present or VOA system monitoring compound recoveries on samples containing activated carbon). The Quality Exception report is executed and included in the case narrative of the analytical final report (STAT SOP QA 230 Corrective Action).
12. COMPLAINT
Customer complaints are logged and resolved by project managers as outlined in STAT SOP 220 Customer Service. STAT seeks feedback from its customers so that improvements can be made to the management system, testing and calibration activities, and customer service.
13. CONFIDENTIALITY All customers, including government entities, are entitled to all aspects of their project to
be considered confidential. To protect national security concerns and proprietary rights, STAT Analysis will ensure customer confidentiality. No aspects of customer project can be released to others without the expressed written consent of the customer. All data, electronic media, and reports are considered confidential
A Notice of Confidentiality is affixed to outgoing e-mails and facsimiles transmittals.
Examples of these can be viewed in Attachments 5 and 6, respectively. 14. INTERNAL AUDITS The Laboratory will undergo an annual internal audit, or more frequently if warranted.
The Quality Assurance Director will take the lead in this activity. If the Quality Assurance Director is responsible for analytical activity, another member of the management team will audit that area. These activities are outlined in STAT SOP 1220 Internal Quality Assurance Audit. As part of the internal audit, STAT will keep abreast of policy revisions issued by accrediting agencies and to implement changes within a reasonable time frame by revising this QAM and other appropriate SOPs in order to be compliant with existing accrediting agency policies. STAT will contact the accrediting authorities to acquirethe current checklist prior to conducting the internal audit.
QA 001 Quality Assurance Manual Revision 14
November 15, 2013 Page 37 of 93
\\Harrison\D\Quality Control\SOPs & QAM\Quality Assurance Manual\QA 001 QA MANUAL Rev 14.doc

Analysis Corporation
STAT
15. MANAGEMENT REVIEW of the QUALITY SYSTEM
STAT strives continually to improve the effectiveness of its management system through the use of the quality policy, quality objectives, audit results, data analysis, corrective and preventive actions, and management review. This document, and the entire Quality Systems, is reviewed yearly. This process and procedures for development and submittal of quality assurance reports to management are outlined in STAT SOP 006 Management Review of Quality Systems. In addition to the annual report, quarterly quality assurance reports are developed and submitted to management. Finding from management reviews include recommended actions for improvement and the actions are carried out within a reasonable time frame and documented.
Changes made to appendices of this document will not constitute a revision to this
Quality Assurance Manual. 16. TRAINING STAT ensures that all employees will have proper training for their job. A training file is
maintained for each employee (STAT SOP 1230 Training (for NELAC/AIHA-LAP, LLC)). It is the responsibility of STAT Management to ensure all employees are educated on ethical and legal responsibilities, as well as, the punishment and penalties for improper, unethical, or illegal actions. Every employee is expected to read, understand, and sign a code of ethics statement.
The need for training beyond initial training on analytical SOPs will be assessed on a case-by-case basis. The department manager and laboratory director will determine if additional training is needed. The introduction of a new technique is an example of the need for additional training. The effectiveness of the training actions is evaluated by the trainer.
17. DATA INTEGRITY
STAT’s management is committed to support and implement specific requirements of the data integrity program. STAT’s procedures ensure that management and personnel are free from any undue internal and external commercial, financial, and other pressures and influences that may adversely affect the quality of their work. STAT promotes a culture of receptive environment where all employees can privately discuss ethical issues or report items of ethical concern. Such discussions are kept confidential, if need to be. The data integrity system includes four elements discussed below.
• Data Integrity Training: STAT has a training program in place for new employee orientation and on an annual basis for all employees to prevent breaches of ethical behavior. Written training material includes Appendix 7. Topics include:
QA 001 Quality Assurance Manual Revision 14
November 15, 2013 Page 38 of 93
\\Harrison\D\Quality Control\SOPs & QAM\Quality Assurance Manual\QA 001 QA MANUAL Rev 14.doc

Analysis Corporation
STAT
- Discussion regarding all data integrity procedures, data integrity training documentation, data integrity monitoring, and procedure documentation.
- Employees are trained on STAT’s responsibility to produce data that is scientifically valid, defensible, and of known and documented quality in accordance with all applicable federal, State, and local laws and regulations consistent with accepted professional and analytical practices in a manner that justifies the public trust. The employees are required to understand the critical need for honesty and full disclosure in all analytical reporting.
- Employees are provided specific examples of unethical behavior including improper data manipulations, adjustment of instrument time clocks, and inappropriate changes in samples, software, analytical conditions or concentrations of standards.
- Personnel are trained to inform STAT of any accidental or intentional reporting of non-authentic data by the employee or other employees. Employees are trained not to comply with instructions, requests, or direction by any manager or representative of management to perform any improper laboratory practices. Employees are trained to immediately report such event to all appropriate members of management including department manager, the Laboratory Director, the QA Manager and President/CEO, excluding such individuals who participated in such perceived improper instruction, request, or directive.
- Employees are required to understand that any infractions to the data integrity procedures will result in a detailed investigation. Any allegation of misconduct will be promptly investigated in an unbiased and confidential manner by an investigative team designated by the President. Investigation could lead to very serious consequences for the employee including immediate termination. The investigation, including any supporting documentation, actions and resolution, will be recorded and archived by the QA Director.
- Analysts are trained on proper documentation in Case Narratives where analytical data may be useful, but are partially deficient.
• Signed data integrity documentation for all employees: The initial data integrity
training and the annual refresher training have a space for employee signature to verify that the employee has participated in the training and understands his or her obligations related to data integrity issues (see Appendix 7: Ethics Policy and Data Integrity Agreement.).
• In-depth periodic monitoring of data integrity: STAT is committed to document
all activities associated with generating valid data. All tasks from sample receipt to issue of analytical reports are tracked and reviewed. Some examples of data monitoring activities include:
- Documentation and secondary review of sample log-in
QA 001 Quality Assurance Manual Revision 14
November 15, 2013 Page 39 of 93
\\Harrison\D\Quality Control\SOPs & QAM\Quality Assurance Manual\QA 001 QA MANUAL Rev 14.doc
Analysis Corporation
STAT
- Documentation and review of all sample preparation activities in specific logbooks
- Primary and secondary review of all analytical data - Primary and secondary review of all manual integration - Further review of all of the above steps by project manager and/or Quality
Manager - Calibration of measuring devices, such as thermometers, balances,
weights, and pipettes.
• Data Integrity Procedure documentation: All aspects of the data integrity procedures are documented. These include documenting all data monitoring activities. All customer communications are recorded. As discussed above, data integrity training material are developed and documented. Actions arising from data integrity issues, whether technical or ethical in nature, are documented.
18. SUB-CONTRACTING Any sub-contracting of accredited analytical work must be to another NELAC, ISO
17025, NVLAP, DOD or AIHA-LAP, LLC (or other ILAAC signatory) accredited laboratory with the appropriate fields of testing, approved test methods and analytes. STAT retains on file a copy of the certificates issued to the sub-contracting laboratory. The customer will be notified in writing of the intention to sub-contract analytical work. The analytical report contains the name and accreditation number of the sub-contracted laboratory. STAT maintains a record of all laboratories to which we subcontract analytical work. See STAT SOP 220 Customer Service for additional information.
19. LABORATORY SAFETY
19.1 Introduction
All STAT employees must accept the responsibility for acting in accordance with safety rules and practices and for reporting any observed safety hazard. This section highlights some general guidelines and rules that specifically apply to the analytical laboratory. Therefore, in addition to adhering to guidelines, each person is trained in, and expected to read, understand, and follow STAT SAP 003 Chemical Hygiene Plan.
19.2 General (additional requirements are detailed in STAT SAP 003 Chemical
Hygiene Plan)
• Lab coats and safety glasses should be worn at all times in the laboratory. The only exception to this is when personnel are working at computer terminals or microscopes. Lab coats are left in the laboratory. Latex or nitrile gloves are worn when chemical or samples are handled.
QA 001 Quality Assurance Manual Revision 14
November 15, 2013 Page 40 of 93
\\Harrison\D\Quality Control\SOPs & QAM\Quality Assurance Manual\QA 001 QA MANUAL Rev 14.doc

Analysis Corporation
STAT
• When working in any of the laboratories, it is recommended that all jewelry be removed and that personnel wash their hands frequently. Always wash hands thoroughly when leaving the laboratory.
• All containers should be labeled as to contents, with particular care to note corrosive or hazardous materials.
• There will be no eating, drinking, or smoking in any of the laboratories.
• An inventory of all chemicals used in the laboratory will be maintained.
• The Safety Officer will conduct a quarterly safety inspection of the laboratory.
• All work areas should be cleaned at the end of each workday. Spills should be
cleaned up immediately.
• Samples should be in laboratories only during preparation and analysis; other wise keep them in the storage area.
• New personnel must be familiarized with safety practices, location of safety
equipment, and made aware of possible hazards in the areas in which they will be working.
• Use safety guards where appropriate when using electrical equipment or
ventilation/fume hood systems. 19.3 Sample Receiving and Login
When possible, determine the source of the samples and any special hazards that might be associated with them. Some samples, when sealed in containers will build up pressure. Samples that indicate pressure should be brought to the attention of the Safety Officer or Laboratory Management.
QA 001 Quality Assurance Manual Revision 14
November 15, 2013 Page 41 of 93
\\Harrison\D\Quality Control\SOPs & QAM\Quality Assurance Manual\QA 001 QA MANUAL Rev 14.doc

Analysis Corporation
STAT
20. DEFINITIONS Acceptance Criteria: specified limits placed on characteristics of an item, process, or service defined in requirement documents. (NELAP) Acceptance Limits: Established mathematical data quality limits for analytical method performance. (AIHA-LAP, LLC) Accreditation: the process by which an agency or organization evaluates and recognizes a laboratory as meeting certain predetermined qualifications or standards, thereby accrediting the laboratory. In the context of the National Environmental Laboratory Accreditation Program (NELAP), this process is a voluntary one. (NELAC) A formal recognition that a facility meets AIHA LAP,LLC Policy Requirements to carry out specific tasks or specific types of tests. (AIHA-LAP, LLC) Accreditation Body: The territorial, state, or federal agency having responsibility and accountability for environmental laboratory accreditation and which grants accreditation. Accredited Laboratory: A testing laboratory that has been evaluated and granted accreditation covering a specific measurement or task, usually for a specific property or analyte, and for a specified period of time. (AIHA-LAP, LLC) Accrediting Authority: The Territorial, State, or federal agency having responsibility and accountability for environmental laboratory accreditation and which grants accreditation (NELAC)[1.5.2.3] Accrediting Authority Review Board (AARB): five voting members from Federal and State Accrediting Authorities and one non-voting member from USEPA, appointed by the NELAP Director, in consultation with the NELAC Board of Directors, for the purposes stated in 1.6.3.e. (NELAC) Accreditation Field of proficiency Testing: Same as “Field of Proficiency Testing.” Accuracy: The degree of agreement between an observed value and an accepted reference value. Accuracy includes a combination of precision and bias. See “Precison” and “Bias” a data quality indicator. (QAMS) (AIHA LAQAP) Addendum: Attachment to a document that contains new or altered text. AIHA: American Industrial Hygiene Association Aliquot See “Subsample” (AIHA-LAP, LLC) Analysis: The qualitative or quantitative determination of a property or analyte in a substance or material. (AIHA-LAP, LLC) Analysis Date: The calendar date of analysis associated with the analytical result reported for an accreditation or experimental field of proficiency testing. Analyst: the designated individual who performs the "hands-on" analytical methods and associated techniques and who is the one responsible for applying required laboratory practices and other pertinent quality controls to meet the required level of quality. (NELAC) Analytical Run: For chemical analyses, an analytical run consists of all samples processed continuously using an item of instrumentation or equipment. Such samples are analyzed applying the same set of standard calibration data. (AIHA-LAP, LLC) Analytical Sensitivity: The lowest concentration that can be detected by the method, based upon the amount or portion of sample analyzed (e.g., for methods involving a count = 1 raw count per
QA 001 Quality Assurance Manual Revision 14
November 15, 2013 Page 42 of 93
\\Harrison\D\Quality Control\SOPs & QAM\Quality Assurance Manual\QA 001 QA MANUAL Rev 14.doc

Analysis Corporation
STAT
amount or portion of sample analyzed, calculated and expressed in the final reporting units) (AIHA-LAP, LLC). Analytical Uncertainty: A subset of measurement uncertainty that includes all laboratory activities performed as part of the analysis. (NELAP) Applicant Laboratory or Applicant: the laboratory or organization applying for NELAP accreditation. (NELAC) Approved Signatory: Person who is recognized by a laboratory as competent and authorized by the laboratory management to sign test reports. (AIHA-LAP, LLC) Asbestos: A commercial term applied to the asbestiform varieties of six different minerals. The asbestos types are chrysotile, amosite, crocidolite, and asbestiform anthophyllite, asbestiform tremolite, and asbestiform actinolite. The properties of asbestos that caused it to be widely used commercially are: 1) its ability to be separated into long, thin, flexible fibers; 2) high tensile strength; 3) low thermal and electrical conductivity; 4) high chemical and mechanical durability; and 5) high heat resistance. Assessment: the evaluation process used to measure or establish the performance, effectiveness, and conformance of an organization and/or its systems to defined criteria (to the standards and requirements of NELAC). (NELAC) Assessment Criteria: the measures established by NELAC and applied in establishing the extent to which an applicant is in conformance with NELAC requirements. (NELAC) Assessment Team: the group of people authorized to perform the on-site inspection and proficiency testing data evaluation required to establish whether an applicant meets the criteria for NELAP accreditation. (NELAC) Assessor: One who performs on-site assessments of accrediting authorities and laboratories’ capability and capacity for meeting NELAC requirements by examining the records and other physical evidence for each one of the tests for which accreditation has been requested. (NELAC) Assessor: A person who conducts technical systems audits. Used interchangeable with site visitor, and auditor. (AIHA-LAP, LLC) Assessor Body: the organization that actually executes the accreditation process, i.e., receives and reviews accreditation applications, reviews QA documents, reviews proficiency testing results, performs on-site assessments, etc., whether EPA, the State, or contracted private party. (NELAC) ASTM: American Society for Testing and Materials Audit: a systematic and independent examination of facilities, equipment, personnel, training, procedures, record-keeping, data validation, data management, and reporting aspects of a system to determine whether QA/QC and technical activities are being conducted as planned and whether these activities will effectively achieve quality objectives. Batch: Environmental samples that are prepared and/or analyzed together with the same process and personnel, using the same lot(s) of reagents. A preparation batch is composed of one to 20 environmental samples of the same NELAC-defined matrix, meeting the above-mentioned criteria and with a maximum time between the start of processing of the first and last sample in the batch to be 24 hours. An analytical batch is composed of prepared environmental samples (extracts, digestates or concentrates) that are analyzed together as a group. An analytical batch can include prepared samples originating from various environmental matrices and can exceed 20 samples. (NELAC Quality Systems Committee)
QA 001 Quality Assurance Manual Revision 14
November 15, 2013 Page 43 of 93
\\Harrison\D\Quality Control\SOPs & QAM\Quality Assurance Manual\QA 001 QA MANUAL Rev 14.doc

Analysis Corporation
STAT
A group of samples that are processed in one operation: considered to be a uniform, discrete unit (AIHA-LAP, LLC) Bias: A systematic error manifested as a consistent positive or negative deviation from the known true value. (AIHA-LAP, LLC) The systemic or persistent distortion of a measurement process, which causes errors in one direction (i.e. the expected sample measurement is different from the sample’s true value). (NELAP) Blank: a sample that has not been exposed to the analyzed sample stream in order to monitor contamination during sampling, transport, storage or analysis. The blank is subjected to the usual analytical and measurement process to establish a zero baseline or background value and is sometimes used to adjust or correct routine analytical results. Blanks include: Field Blank: blank prepared in the field by filling a clean container with pure de-ionized water and appropriate preservative, if any, for the specific sampling activity being undertaken. (EPA OSWER) Instrument Blank: a clean sample (e.g., distilled water) processed through the instrumental steps of the measurement process; used to determine instrument contamination. (EPA-QAD) Method Blank: a sample of a matrix similar to the batch of associated samples (when available) that is free from the analytes of interest and is processed simultaneously with and under the same conditions as samples through all steps of the analytical procedures, and in which no target analytes or interferences are present at concentrations that impact the analytical results for sample analyses. (NELAC) Reagent Blank: (method reagent blank): a sample consisting of reagent(s), without the target analyte or sample matrix, introduced into the analytical procedure at the appropriate point and carried through all subsequent steps to determine the contribution of the reagents and of the involved analytical steps. (QAMS) Blind Sample: a sub-sample for analysis with a composition known to the submitter. The analyst/laboratory may know the identity of the sample but not its composition. It is used to test the analyst or laboratory’s proficiency in the execution of the measurement process. (NELAC) A sample submitted for analysis with a composition and identity known to the submitter, but unknown to the analyst, and used to evaluate proficiency in the execution of the measurement process. (AIHA-LAP, LLC) Calibration: A set of operations used: (1) to determine the value of a reference standard or reference material to a stated uncertainty; or (2) to determine the accuracy of the reading of a test device to a stated uncertainty. (AIHA-LAP, LLC) A set of operations that establish, under specified conditions, the relationship between values of quantities indicated by a measuring instrument or measuring system, or values represented by a material measure or a reference material, and the corresponding values realized by standards. (1) In calibration of support equipment, the values realized by standards are established through the use of reference standards that are traceable to the International system of units (SI). (2) In calibration according to methods, the values realized by standards are typically established through the use of reference materials that are either purchased by the laboratory with a certificate of analysis or purity, or prepared by the laboratory using support equipment that has been calibrated or verified to meet specifications. (NELAP)
QA 001 Quality Assurance Manual Revision 14
November 15, 2013 Page 44 of 93
\\Harrison\D\Quality Control\SOPs & QAM\Quality Assurance Manual\QA 001 QA MANUAL Rev 14.doc

Analysis Corporation
STAT
Calibration Curve: The mathematical relationship between the known values, such as concentrations, of a series of calibration standards and their instrument response. (NELAC) A graphical relationship between the known values for a series of calibration standards and instrument responses. The levels of the calibration standards should bracket the range of measurements. (AIHA) Calibration Method: a defined technical procedure for performing a calibration. (NELAC) Calibration Standard: a substance or reference material used for calibration (NELAC) Certification: Procedure by which a third party gives written assurance that the competence of a person, organization, or other entity to perform a function or service conforms to specified requirements. (AIHA-LAP, LLC) Certified Reference Material (CRM): Reference material accompanied by a certificate, having a value, measurement uncertainty, and stated metrological traceability chain to a national metrology institute.. (NELAC) A reference material that has one or more of its property values established by a technically valid procedure, and is accompanied by or traceable to a certificate or other documentation issued by a certifying body. (AIHA-LAP, LLC) Chain-of-Custody: Definitive evidence (a record) of the persons who had possession or custody of the sample(s) for all periods of time, as it moved from the point of collection to the final analytical result. (AIHA-LAP, LLC) Chain-of-Custody Form: Record that documents the possession of the samples from the time of collection to receipt in the laboratory. This record generally includes: the number and types of containers, the mode of collection; the collector; time of collection; preservation; and requested analyses. Check Sample: An uncontaminated sample matrix spiked with a known amount of analyte, usually from the same source as the calibration standard. It is generally used to establish the stability of the analytical system, but also may be used to assess the performance of all or a portion 2 of the measurement system. (AIHA-LAP, LLC) Clean Air Act: the enabling legislation in 42 U.S.C. 7401 et seq., Public Law 91-604, 84 Stat. 1676 Pub. L. 95-95, 91 Stat., 685 and Pub. L. 95-190, 91 Stat., 1399, as amended, empowering EPA to promulgate air quality standards, monitor and to enforce them. (NELAC) Client: See Customer. Comparability: Refers to the ability to compare data from different sources with a degree of confidence. Completeness: Refers to the amount of data that is successfully collected with respect to that amount intended in the study design. Comprehensive Environmental Response, Compensation and Liability Act (CERCLA/Superfund): the enabling legislation in 42 U.S.C. 9601-9675 et seq., as amended by the Superfund Amendments and Reauthorization Act of 1986 (SARA), 42 U.S.C. 9601et seq., to eliminate the health and environmental threats posed by hazardous waste sites. (NELAC) Confidential Business Information (CBI): information that an organization designates as having the potential of providing a competitor with inappropriate insight into its management, operation or products. NELAC and its representatives agree to safeguard identified CBI and to maintain all information identified as such in full confidentiality. Confirmation: verification of the identity of a component through the use of an approach with a different scientific principle from the original method. These may include, but are not limited to:
QA 001 Quality Assurance Manual Revision 14
November 15, 2013 Page 45 of 93
\\Harrison\D\Quality Control\SOPs & QAM\Quality Assurance Manual\QA 001 QA MANUAL Rev 14.doc

Analysis Corporation
STAT
Second column confirmation Alternate wavelength Derivatization Mass spectral interpretation Alternative detectors or Additional cleanup procedures. (NELAC) Conformance: an affirmative indication or judgment that a product or service has met the requirements of the relevant specifications, contract, or regulation; also the state of meeting the requirements. (ANSI/ASQC E4-1994) Contributor: a participant in NELAC who is not a Voting Member. Contributors include representatives of laboratories, manufacturers, industry, business, consumers, academia, laboratory associations, laboratory accreditation associations, counties, municipalities, and other political subdivisions, other federal and state officials not engaged in environmental activities, and other persons who are interested in the objectives and activities of NELAC. (NELAC)[Art III, Const] Control Chart: A graph of some measurement plotted over time or sequence of sampling, together with control limit(s) and, usually, a central line and warning limit(s). (AIHA-LAP, LLC) Corrective Action: the action taken to eliminate the causes of an existing nonconformity, defect or other undesirable situation in order to prevent recurrence. (ISO 8402) All activities taken, whether unsuccessful or not, to eliminate the cause(s) of an existing nonconformity or deficiency in order to prevent recurrence. (AIHA-LAP, LLC) Customer: Any person or organization that engages the services of a laboratory. Used interchangeably with “client” in this and other quality system documents. Data Audit: a qualitative and quantitative evaluation of the documentation and procedures associated with environmental measurements to verify that the resulting data are of acceptable quality (i.e., that they meet specified acceptance criteria). (NELAC) Data Reduction: the process of transforming raw data by arithmetic or statistical calculations, standard curves, concentration factors, etc., and collation into a more useable form. (NELAC) Deficiency: A failure to comply with the requirements of the AIHA-LAP, LLC accreditiaion programs or the laboratory’s own stated management system requirements.A failure to comply with a requirement of the AIHA Accreditation Program(s) or a laboratory’s own stated quality system requirements. (AIHA-LAP, LLC) Delegate: any environmental official of the States or the Federal government not sitting in the House of Representatives, who is eligible to vote in the House of Delegates. (NELAC) Demonstration of Capability: a procedure to establish the ability of the analyst to generate analytical results of acceptable accuracy and precision. (NELAC) Denial: The decision not to granta laboratory initial accreditation. (AIHA-LAP, LLC.)Detection Limit: the lowest concentration or amount of the target analyte that can be identified, measured, and reported with confidence that the analyte concentration is not a false positive value. See Method Detection Limit. (NELAC) Determination: An analysis with a qualitative result. (AIHA-LAP, LLC) Deviation: A departure from written procedures, test methods, contracts or any other standard operating procedure that is part of the laboratory Quality Assurance System. (AIHA-LAP, LLC)
QA 001 Quality Assurance Manual Revision 14
November 15, 2013 Page 46 of 93
\\Harrison\D\Quality Control\SOPs & QAM\Quality Assurance Manual\QA 001 QA MANUAL Rev 14.doc

Analysis Corporation
STAT
Document Control: the act of ensuring that documents (and revisions thereto) are proposed, reviewed for accuracy, approved for release by authorized personnel, distributed properly and controlled to ensure use of the correct version at the location where the prescribed activity is performed. (ASQC) Duplicate Samples: Two samples taken from and representative of the same population and carried through all steps of the sampling and analytical procedures in an identical manner. Duplicate samples are used to assess variance of the total method including sampling and analysis. (AIHA-LAP, LLC) Environmental Laboratory Advisory Board (ELAB): a Federal Advisory Committee, with members appointed by EPA and composed of a balance of non-state, non-federal representatives, from the environmental laboratory community, and chaired by an ELAB member. (NELAC)[1.6.2] Environmental Lead Laboratory Accreditation Program (ELLAP): This AIHA-LAP,LLC program complies with the requirements of the EPA National Lead Laboratory Accreditation Program (NLLAP) Laboratory Quality System Requirements (LQSR) and also conforms to the ISO/IEC 17025 Standard and ISO/IEC Guide 58 requirements. (AIHA-LAP, LLC) Environmental Lead Proficiency Analytical Testing (ELPAT): Required quarterly quality assurance lead samples of various matrices analyzed by accredited and participating laboratories as a way to determine laboratory testing proficiency of the ELLAP Results are evaluated by AIHA-PAT, LLC and are used to determine laboratory proficiency. AIHA-LAP, LLC) Environmental Monitoring Management Council (EMMC): an EPA Committee consisting of EPA managers and scientists, organized into a Policy Council, a Steering Group, ad hoc Panels, and work groups addressing specific objectives, established to address EPA-wide monitoring issues. (NELAC) Equipment: All physical items (including software and instruments) in the facility used in the performance of analytical testing. (AIHA-LAP, LLC) Equipment Log: A chronological record of preventive and emergency maintenance performed on any equipment. The logs include a record of calls, service technician summaries, records of calibration by the manufacturer, routine user maintenance, and other information as required by these policies. (AIHA-LAP, LLC) Experimental Field of Proficiency Testing (Experimental FoPT): Analytes for which a laboratory is required to analyze a PT sample if they seek or maintain accreditation for the field of accreditation but for which successful analysis is not required in order to obtain or maintain accreditation. Federal Insecticide, Fungicide and Rodenticide Act (FIFRA): the enabling legislation under 7 U.S.C. 135 et seq., as amended, that empowers the EPA to register insecticides, fungicides, and rodenticides. (NELAC) Federal Water Pollution Control Act (Clean Water Act, CWA): the enabling legislation under 33 U.S.C. 1251 et seq., Public Law 92-50086 Stat. 816, that empowers EPA to set discharge limitations, write discharge permits, monitor, and bring enforcement action for non-compliance. (NELAC) Field Blank: An analyte-free matrix carried to the sampling site, exposed to the sampling conditions (e.g., bottle caps removed), returned to the laboratory, treated as a sample, and carried through all steps of the analysis. For example, a clean culture media plate, sorbent tube, or a clean filter could be used as a field blank. The field blank, which should be treated just like the
QA 001 Quality Assurance Manual Revision 14
November 15, 2013 Page 47 of 93
\\Harrison\D\Quality Control\SOPs & QAM\Quality Assurance Manual\QA 001 QA MANUAL Rev 14.doc

Analysis Corporation
STAT
sample, evaluates possible effects attributable to shipping and field handling procedures. (AIHA-LAP, LLC) Field of Accreditation: Those matrix, technology/method, and analyte combinations for which the accreditation body offers accreditation. (NELAC) Field of Proficiency Testing (FoPT):Analysis for which a laboratory is required to successfully analyze a PT sample in order to obtain or maintain accreditation, collectively defined as: matrix, technology/method, analyte. FoT: Field of Testing Finding: an assessment conclusion referenced to a laboratory accreditation standard and supported by objective evidence that identifies a deviation from a laboratory accreditation standard requirement. (NELAC) Governmental Laboratory: as used in these standards, a laboratory owned by a Federal, state, or tribal government; includes government-owned contractor-operated laboratories. (NELAC) Holding Times (Maximum Allowable Holding Times): The maximum times that samples may be held prior to analysis and still be considered valid or not compromised. (40 CFR Part 136) The maximum time that can elapse between two specified activities. (NELAC) Inspection: an activity such as measuring, examining, testing, or gauging one or more characteristics of an entity and comparing the results with specified requirements in order to establish whether conformance is achieved for each characteristic. (ANSI/ASQC E4-1994) Interim Accreditation: temporary accreditation status for a laboratory that has met all accreditation criteria except for a pending on-site assessment which has been delayed for reasons beyond the control of the laboratory. (NELAC) Inter-laboratory Comparisons: Evaluation of tests on the same or similar items by two or more laboratories. (AIHA-LAP, LLC) Internal Quality Control: Routine activities and checks, such as periodic calibrations, duplicate analyses and matrix spikes that are included in routine internal procedures to control the accuracy and precision of measurements. Internal Standard: A known amount of standard added to a test portion of a sample as a reference for evaluating and controlling the precision and bias of the applied analytical method. (NELAC) Laboratory: a body that calibrates and/or tests. (ISO 25) An entity that tests, either at a fixed site, mobile facility or field operations facility. (AIHA-LAP, LLC) Laboratory Accreditation Programs (AIHA-LAP, LLC) General term referring to any AIHA_LAP, LLC program established to maintain standards of performance for laboratories analyzing samples and evaluating exposures to hazardous agents. (AIHA-LAP, LLC) Laboratory Assessment: An onsite evaluation of a laboratory for the purpose of conducting a technical systems audit to assess compliance with AIHA accreditation requirements and technical competence to perform the testing for which the Lab is seeking accreditation. (AIHA-LAP, LLC) Laboratory Control Sample (however named, such as laboratory fortified blank, spiked blank, or QC check sample): Laboratory Control Sample (LCS)/Method Spike Sample: A matrix-based reference material with an established concentration obtained from a source independent of the instrument calibration and traceable to NIST or other similar reference materials. The LCS is carried through the entire procedure from sample preparation through
QA 001 Quality Assurance Manual Revision 14
November 15, 2013 Page 48 of 93
\\Harrison\D\Quality Control\SOPs & QAM\Quality Assurance Manual\QA 001 QA MANUAL Rev 14.doc

Analysis Corporation
STAT
analysis as if it were a field sample. The purpose of the LCS is to evaluate bias of the method. (AIHA-LAP, LLC) A sample matrix, free from the anlytes of interest, spiked with verified known amounts of analytes or a material containing known and verified amounts of analytes and taken through all sample preparation and analytical steps of the procedure unless otherwise noted in a reference method. It is generally used to establish intra-laboratory or analyst specific precision and bias to assess the performance of all or portion of the measurement system. (NELAC) Laboratory Control Sample Duplicate (LCSD)/Method Spike Sample Duplicate: A duplicate of the LCS. (AIHA-LAP, LLC) Laboratory Duplicate: aliquots of a sample taken from the same container under laboratory conditions and processed and analyzed independently. (NELAC) Laboratory Quality Assurance Program(s) (LAP-LLC): General term referring to any AIHA program or programs established to maintain the highest possible standards of performance for analysts and/or laboratories analyzing samples and evaluating exposures to hazardous agents. (AIHA-LAP, LLC) Legal Chain-of-Custody Protocols: procedures employed to record the possession of samples from the time of sampling through the retention time specified by the client or program. These procedures are performed at the special request of the client and include the use of a Chain of Custody Form that documents the collection, transport, and receipt of compliance samples by the laboratory. In addition, these protocols document all handling of the samples within the laboratory. (NELAC) Limit(s) of Detection (LOD): A laboratory’s estimate of the minimum amount of an analyte in a given matrix that an analytical procedure can reliably detect in their facility. (NELAP) Limit(s) of Quantitation (LOQ): The minimum levels, concentrations, or quantities of a target variable (e.g., target analyte) that can be reported with a specific degree of confidence. (NELAC) Manager (however named): the individual designated as being responsible for the overall operation, all personnel, and the physical plant of the environmental laboratory. A supervisor may report to the manager. In some cases, the supervisor and the manager may be the same individual. (NELAC) Matrix: the substrate of a test sample.
Field of Accreditation Matrix: these matrix definitions shall be used when accrediting a laboratory (see Field of Accreditation).
Drinking Water: any aqueous sample that has been designated a potable or potential potable water source. Non-Potable Water: any aqueous sample excluded from the definition of Drinking Water matrix; includes surface water, groundwater, effluents, water treatment chemicals, and TCLP or other extracts. Solid and Chemical Materials: includes soils, sediments, sludges, products and by-products of an industrial process that results in a matrix not previously defined. Biological Tissue: any sample of a biological origin such as fish tissue, shellfish, or plant material. Such samples shall be grouped according to origin. Air and Emissions: whole gas or vapor samples including those contained in flexible or rigid wall containers and the extracted concentrated analytes of interest
QA 001 Quality Assurance Manual Revision 14
November 15, 2013 Page 49 of 93
\\Harrison\D\Quality Control\SOPs & QAM\Quality Assurance Manual\QA 001 QA MANUAL Rev 14.doc

Analysis Corporation
STAT
from a gas or vapor that are collected with a sorbent tube, impinger solution, filter, or other device. (NELAC).
Quality System Matrix: These matrix definitions are an expansion of the field of accreditation matrices and shall be used for purposes of batch and quality control requirements. These matrix distinctions shall be used:
Aqueous: any aqueous sample excluded from the definition of Drinking Water matrix or Saline/Estuarine source; includes surface water, groundwater, effluents, and TCLP or other extracts. Drinking Water: any aqueous sample that has been designated a potable or potential potable water source. Saline/Estuarine: any aqueous sample from an ocean or estuary, or other salt-water source such as the Great Salt Lake. Non-aqueous Liquid: any organic liquid with <15% settleable solids. Biological Tissue: any sample of a biological origin such as fish tissue, shellfish, or plant material. Such samples shall be grouped according to origin. Solids: includes soils, sediments, sludges and other matrices with >15% settleable solids. Chemical Waste: a product or by-product of an industrial process that results in a matrix not previously defined. Air and Emissions: whole gas or vapor samples including those contained in flexible or rigid wall containers and the extracted concentrated analytes of interest from a gas or vapor that are collected with a sorbent tube, impinger solution, filter, or other device. (NELAC)
The component or substrate (e.g., soil, air or charcoal tube) that contains the analyte of interest. (AIHA-LAP, LLC)
Matrix Duplicate: A replicate matrix prepared in the laboratory and analyzed to obtain a measure of precision. (NELAC) Matrix Spike (spiked sample or fortified sample): a sample prepared, taken through all sample preparation and analytical steps of the procedure unless otherwise noted in a reference method, by adding a known amount of target analyte to a specified amount of matrix sample for which an independent test result of target analyte concentration is available. Matrix spikes are used, for example, to determine the effect of the matrix on a method's recovery efficiency. (NELAC) An aliquot of sample, or sample media, spiked with a known concentration of target analyte(s). The spiking occurs prior to sample preparation and analysis. (AIHA-LAP, LLC) Matrix Spike Duplicate (spiked sample or fortified sample duplicate): A replicate matrix spike prepared in the laboratory and analyzed to obtain a measure of the precision of the recovery for each analyte. (NELAC) May: denotes permitted action, but not required action. Measurement Quality Objectives (MQOs): The desired sensitivity, range, precision, and bias of a measurement. Measurement System: A method, as implemented at a particular laboratory, and which includes the equipment used to perform the test and the operator(s). Method: see Test Method Method Blank: An unexposed sampling media or reagent(s), not taken to the field or shipped, but carried through the complete sample preparation and analytical procedure. The blank is used
QA 001 Quality Assurance Manual Revision 14
November 15, 2013 Page 50 of 93
\\Harrison\D\Quality Control\SOPs & QAM\Quality Assurance Manual\QA 001 QA MANUAL Rev 14.doc

Analysis Corporation
STAT
to assess possible background contamination from the analytical process. This blank may also be referred to as a laboratory blank. (AIHA-LAP, LLC) Method Detection Limit (MDL): the minimum concentration of a substance (an analyte) that can be measured and reported with 99% confidence that the analyte concentration is greater than zero and is determined from analysis of a sample in a given matrix containing the analyte. (40 CFR Part 136, Appendix B) The minimum concentration of an analyte that, in a given matrix and with a specific method, has a 99 percent probability of being identified, qualitatively or quantitatively measured, and reported to be greater than zero. (AIHA-LAP, LLC) Method Performance: A general term used to document the characteristics of a method. These characteristics usually include method detection limits, linearity, precision, accuracy and bias and uncertainty of measurement. See Acceptance Limits. (AIHA-LAP, LLC) Must: denotes a requirement that must be met. (Random House College Dictionary) National Accreditation Database: the publicly accessible database listing the accreditation status of all laboratories participating in NELAP. (NELAC) National Institute of Standards and Technology (NIST): A federal agency of the US Department of Commerce’s Technology Administration that is designed as the United States national metrology institute (NMI). (NELAC) National Environmental Laboratory Accreditation Conference (NELAC): a voluntary organization of State and Federal environmental officials and interest groups purposed primarily to establish mutually acceptable standards for accrediting environmental laboratories. A subset of NELAP. (NELAC) National Environmental Laboratory Accreditation Program (NELAP): the overall National Environmental Laboratory Accreditation Program of which NELAC is a part. (NELAC) National Voluntary Laboratory Accreditation Program (NVLAP): a program administered by NIST that is used by providers of proficiency testing to gain accreditation for all compounds/matrices for which NVLAP accreditation is available, and for which the provider intends to provide NELAP PT samples. (NELAC) Negative Control: measures taken to ensure that a test, its components, or the environment do not cause undesired effects, or produce incorrect test results. (NELAC) NELAC Standards: the plan of procedures for consistently evaluating and documenting the ability of laboratories performing environmental measurements to meet nationally defined standards established by the National Environmental Laboratory Accreditation Conference. (NELAC) NELAP Recognition: the determination by the NELAP Director that an accrediting authority meets the requirements of the NELAP and is authorized to grant NELAP accreditation to laboratories. (NELAC) Nonconformity: Noncompliance with any quality assurance policy, procedure, or specification. Nonconforming work results from an analysis event in which the QC results are not within acceptance limits and/or method specifications are not met. (AIHA-LAP, LLC) Non-governmental Laboratory: any laboratory not meeting the definition of the governmental laboratory. (NELAC) Performance Audit: the routine comparison of independently obtained qualitative and quantitative measurement system data with routinely obtained data in order to evaluate the proficiency of an analyst or laboratory. (NELAC)
QA 001 Quality Assurance Manual Revision 14
November 15, 2013 Page 51 of 93
\\Harrison\D\Quality Control\SOPs & QAM\Quality Assurance Manual\QA 001 QA MANUAL Rev 14.doc

Analysis Corporation
STAT
Performance Based Measurement System (PBMS): a set of processes wherein the data quality needs, mandates or limitations of a program or project are specified and serve as criteria for selecting measurement processes which will meet those needs in a cost-effective manner. (NELAC) Policy: An organization’s written statement of commitment to implement a management program element. (AIHA-LAP, LLC) Positive Control: measures taken to ensure that a test and/or its components are working properly and producing correct or expected results from positive test subjects. (NELAC) Precision: The degree to which a set of observations or measurements of the same property, obtained under similar conditions, conform to themselves; a data quality indicator. Precision is usually expressed as standard deviation, variance or range, in either absolute or relative terms. (NELAC) The degree to which a set of observations or measurements of the same property, usually obtained under similar conditions, conform to themselves. Precision is often expressed as standard deviation, variance or range, in either absolute or relative terms. (AIHA-LAP, LLC) Preventive Action: A planned activity to identify, recognize and control potential sources of nonconformity and to introduce needed improvements. (AIHA-LAP, LLC) Procedure: A written set of instructions that describe how to implement a policy requirement, or how to carry out a specific task. (AIHA-LAP, LLC) A specified way to carry out an activity or process. Procedures can be documented or not. (NELAC) Preservation: Any condition under which a sample must be kept in order to maintain the chemical and/or biological integrity prior to analysis. (NELAC) Primary Accreditation Body (Primary AB): The accreditation body responsible for assessing a laboratory’s total quality system, on-site assessment, and PT performance tracking for fields of accreditation. (NELAC) Proficiency Analytical Testing (PAT): Refers to any proficiency analytical testing program(s), such as the programs established under the Analytical Quality Programs. See Inter-laboratory Comparisons. (AIHA-LAP, LLC) Proficiency Testing (PT): A means to evaluate a laboratory’s performance under controlled conditions relative to a given set of criteria, through analysis of unknown samples provided by an external source. (NELAC) Proficiency Testing Oversight Body/Proficiency Testing Provider Accreditor (PTOB/PTPA): an organization with technical expertise, administrative capacity and financial resources sufficient to implement and operate a national program of PT provider evaluation and oversight that meets the responsibilities and requirements established by NELAC standards. (NELAC) Proficiency Testing (PT): Refers to any proficiency testing program(s),such as the programs established under the Analytical Quality Programs. (AIHA-LAP, LLC) Proficiency Testing Program (PT Program): the aggregate of providing rigorously controlled and standardized environmental samples to a laboratory for analysis, reporting of results, statistical evaluation of the results and the collective demographics and results summary of all participating laboratories. (NELAC) Proficiency Testing Provider (PTP): Aperson or organization accredited by the TNI-approved Proficiency Testing Provider Accreditor to operate a TNI-compliant PT program. (NELAC)
QA 001 Quality Assurance Manual Revision 14
November 15, 2013 Page 52 of 93
\\Harrison\D\Quality Control\SOPs & QAM\Quality Assurance Manual\QA 001 QA MANUAL Rev 14.doc

Analysis Corporation
STAT
Proficiency Testing Provider Accreditor (PTPA): An organization t5hat is approved by TNI to accredit and monitor the performance of proficiency testing providers. (NELAC) Proficiency Testing Sample (PT Sample): A sample, the composition of which is unknown to the laboratory and is provided to test whether the laboratory can produce analytical results within the specified acceptance criteria. (NELAC) Proficiency Testing Study (PT Study): A single complete sequence of circulation of proficiency testing samples to all participants in a proficiency test program. PT Study Opening Date: The calendar date that a PT sample is first made available to any laboratory by a PT provider. PT Study Closing Date: The calendar date for which analytical results for a PT sample shall be received by the PT provider from the laboratory. Protocol: a detailed written procedure for field and/or laboratory operation (e.g., sampling, analysis) that must be strictly followed. (NELAC) Quality: The suitability of a product or service for use, as perceived by the user. (AIHA-LAP, LLC) Quality Assurance: An integrated system of management activities involving planning, implementation, assessment, reporting and quality improvement to ensure that a process, item, or service is of the type and quality needed and expected by the client. (NELAC) An integrated system of activities involving planning, quality control, quality assessment, reporting, and quality improvement to ensure a product or service meets defined standards of quality within a stated level of confidence. (AIHA-LAP, LLC) Quality Assurance [Project] Plan (QAPP): a formal document describing the detailed quality control procedures by which the quality requirements defined for the data and decisions pertaining to a specific project are to be achieved. (EPA-QAD) Quality Control: The overall system of technical activities that measures the attributes and performance of a process , item, or service against defined standards to verify that they meet the stated requirements established by the customer; operational techniques and activities that are used to fulfill requirements for quality; also the system of activities and checks used to ensure that measurement systems are maintained within prescribed limits, providing protection against “out of control” conditions and ensuring that the results are of acceptable quality.. (NELAC) Technical activities whose purpose is to measure and control the quality of a product or service so that it meets the needs of users. The aim is to provide quality that is satisfactory, adequate, dependable and economical. (AIHA-LAP, LLC) Quality Control Sample: A sample used to assess the performance of all or a portion of the measurement system. One of any number of samples, such as CRM, a quality system matrix fortified by spiking, or actual samples fortified by spiking, intended to demonstrate that a measurement system or activity is in control. (NELAC) Quality Manager: The Quality Manger is responsible for implementation of the Quality Management System with direct access to the highest levels of management. The Quality Manger is responsible for planning and organizing audits. Quality Management System: System to establish a quality policy and quality objectives and to achieve those objectives. Quality Manual: a document stating the management policies, objectives, principles, organizational structure and authority, responsibilities, accountability, and implementation of an
QA 001 Quality Assurance Manual Revision 14
November 15, 2013 Page 53 of 93
\\Harrison\D\Quality Control\SOPs & QAM\Quality Assurance Manual\QA 001 QA MANUAL Rev 14.doc

Analysis Corporation
STAT
agency, organization, or laboratory, to ensure the quality of its product and the utility of its product to its users. (NELAC) A document stating the quality policy, quality system and internal quality control procedures of the laboratory. (AIHA-LAP, LLC) Quality System: a structured and documented management system describing the policies, objectives, principles, organizational authority, responsibilities, accountability, and implementation plan of an organization for ensuring quality in its work processes, products (items), and services. The quality system provides the framework for planning, implementing, and assessing work performed by the organization and for carrying out required QA and QC activities. Quantitation Limits: levels, concentrations, or quantities of a target variable (e.g., target analyte) that can be reported at a specified degree of confidence. (NELAC) Range: the difference between the minimum and the maximum of a set of values. (EPA-QAD) Raw Data: The documentation generated during sampling and analysis. This documentation includes, but not limited to, field notes, electronic data, magnetic tapes, untabulated sample results, QC sample results, print outs of chromatograms, instrument outputs, and handwritten records. (NELAC) Recognition: previously known as reciprocity. The mutual agreement of two or more parties (i.e., States) to accept each other’s findings regarding the ability of environmental testing laboratories in meeting NELAC standards. (NELAC)[1.5.3] Reference Material: Material or substance one or more of whose property values are sufficiently homogeneous and well established to be used for the calibration of an apparatus, the assessment of a measurement method, or for assigning values to materials. (NELAC) A material or substance, one or more properties of which are sufficiently homogeneous and well established to be used to monitor instrument and method performance. AIHA PAT samples may be used as reference materials. (AIHA-LAP, LLC) Reference Method: a method of known and documented accuracy and precision issued by an organization recognized as competent to do so. (NELAC) Reference Standard: Standard used for the calibration of working measurement standards in a given organization or at a given location.NELAC) A substance or reference material used to calibrate an instrument. Reference standards shall be NIST traceable or equivalent and of the highest quality available at the location. (AIHA-LAP, LLC) Reference Toxicant: the toxicant used in performing toxicity tests to indicate the sensitivity of a test organism and to demonstrate the laboratory’s ability to perform the test correctly and obtain consistent results (see Chapter 5, Appendix D, section 2.1f). (NELAC) Relative Percent Difference (RPD): A term defined as RPD = ((R1 – R2)/R) x 100 where R1 – R2 represents the absolute difference of two (2) values and R represents the average of the two (2) values. (AIHA-LAP, LLC) Relevant Degree: A program of collegiate study that is appropriate to the applicable accreditation program. (AIHA-LAP, LLC) Replicate Analyses: the measurements of the variable of interest performed identically on two or more sub-samples of the same sample within a short time interval. (NELAC) Reporting Limit: The lowest concentration of analyte in a sample that can be reported with a defined, reproducible level of certainty. This value is based on the low standard used for
QA 001 Quality Assurance Manual Revision 14
November 15, 2013 Page 54 of 93
\\Harrison\D\Quality Control\SOPs & QAM\Quality Assurance Manual\QA 001 QA MANUAL Rev 14.doc

Analysis Corporation
STAT
instrument calibration. For environmental lead analyses, the reporting limit must be at least twice the MDL. (AIHA-LAP, LLC) Representativeness: Refers to the degree to which the data collected accurately reflect the population, group or medium being sampled. Requirement: denotes a mandatory specification; often designated by the term “shall”. (NELAC) An essential criterion necessary for accreditation. (AIHA-LAP, LLC) Resource Conservation and Recovery Act (RCRA): the enabling legislation under 42 USC 321 et seq. (1976), that gives EPA the authority to control hazardous waste from the “cradle-to-grave”, including its generation, transportation, treatment, storage, and disposal. (NELAC) Revocation: the total or partial withdrawal of a laboratory’s accreditation by an accreditation body. (NELAC) The formal, permanent removal of a laboratory’s accreditation for noncompliance with AIHA accreditation requirements. (AIHA-LAP, LLC) Removal of the accredited status of a laboratory if the laboratory is found to have violated the conditions for accreditation. (NIST) Run: A set of consecutive measurements performed on different samples. (AIHA-LAP, LLC) Safe Drinking Water Act (SDWA): the enabling legislation, 42 USC 300f et seq. (1974), (Public Law 93-523), that requires the EPA to protect the quality of drinking water in the U.S. by setting maximum allowable contaminant levels, monitoring, and enforcing violations. (NELAC) Sample: for instrumental analyses, a sample is defined as an analytical determination. Thus a Continuing Calibration Verification Standard (CCV) is analyzed after every ten determinations, regardless of the type of sample (QC sample or test sample). For those test methods that require the analysis of an Initial or Continuing Calibration Blank (ICB or CCB) after the ICV or CCV analysis, the ICB or CCB is not counted as a determination. In addition, if a reagent/solvent blank analysis (rinse blank) is performed to ensure that carryover from a highly concentrated sample has not contaminated the system, this is not counted as a determination. For certain analyses (i.e., GC/MS), the requirement to analyze a CCV is per number of hours, not per number of determinations. Sample Log: A document where sample identification, date received, customer, etc., are noted when samples arrive at the laboratory. The log is part of the sample tracking system. See Sample Tracking. (AIHA-LAP, LLC) Sample Tracking: procedures employed to record the possession of the samples from the time of sampling until analysis, reporting, and archiving. These procedures include the use of a Chain of Custody Form that documents the collection, transport, and receipt of compliance samples to the laboratory. In addition, access to the laboratory is limited and controlled to protect the integrity of the samples. (NELAC) Sample Tracking: A documentation system of following a sample from receipt at the laboratory, through sample processing nd analysis, to final reporting. The system includes unique numbering, or bar coding labels, and the use of a Sample Log. (AIHA-LAP, LLC) Sampling: Activity related to obtaining a representative sample of the object of conformity assessment, according to a procedure. (NELAC) Secondary Accrediting Authority: the Territorial, State or federal agency that grants NELAC accreditation to laboratories, based upon their accreditation by a NELAP-recognized Primary Accrediting Authority. See also Recognition and Primary Accrediting Authority. (NELAC)[1.5.2.3]
QA 001 Quality Assurance Manual Revision 14
November 15, 2013 Page 55 of 93
\\Harrison\D\Quality Control\SOPs & QAM\Quality Assurance Manual\QA 001 QA MANUAL Rev 14.doc

Analysis Corporation
STAT
Selectivity: The ability to analyze, distinguish, and determine a specific analyte or parameter from another component that may be a potential or that may behave similarly to the target analyte or parameter within the measurement system. (NELAC) Sensitivity: the capability of a method or instrument to discriminate between measurement responses representing different levels (e.g., concentrations) of a variable of interest. (NELAC) Shall: denotes a requirement that is mandatory whenever the criterion for conformance with the specification requires that there is no deviation. This does not prohibit the use of alternative approaches or methods for implementing the specification so long as the requirement is fulfilled. (ANSI) Should: denotes a guideline or recommendation whenever noncompliance with the specification is permissible. (ANSI) Spike: a known mass of target analyte added to a blank sample or sub-sample; used to determine recovery efficiency or for other quality control purposes. (NELAC) SRM (NIST Standard Reference material): A reference material certified and distributed by the National Institute of Standards and Technology. Standard: The document describing the elements of laboratory accreditation that has been developed and established within the consensus principles of standard setting and meets the approval requirements of standard adoption organizations procedures and policies. (NELAC) A substance or material with properties believed to be known with sufficient accuracy to permit its use to evaluate the same property of another. In chemical measurements, it often describes a solution or substance commonly prepared by the analyst to establish a calibration curve or the analytical response function of an instrument. (AIHA-LAP, LLC) Standard Administrative Procedure (SAP): a written procedure that details administrative operations that thoroughly prescribes actions to be taken Standard Operating Procedures (SOPs): A written document which details the method for an operation, analysis, or action, with thoroughly prescribed techniques and steps. SOPs are officially as the methods for performing certain routine or repetitive tasks. (NELAC) A written document that details the procedures of an operation; an analysis or action whose techniques and procedures are thoroughly prescribed, and which are accepted as the procedure for performing certain routine or repetitive tasks. (AIHA-LAP, LLC) Standard Reference Material (SRM): a certified reference material produced by the U.S. National Institute of Standards and Technology or other equivalent organization and characterized for absolute content, independent of analytical method. (EPA-QAD) A certified reference material produced by the U.S. National Institute of Standards and Technology (NIST) and characterized for absolute content independent of analytical method. It is accompanied by a certificate that reports the results of the characterization and the intended use of the material. (AIHA-LAP, LLC) Standardization: The process of establishing the quantitative relationship between a known mass of target material and the measurement system (example, instrument response). See Calibration and Calibration curve. The term may also refer to activities that establish provisions for common and repeated use of accreditation policies to achieve an optimum level of conformity. (AIHA-LAP, LLC) Statistical Minimum Significant Difference (SMSD): the minimum difference between the control and a test concentration that is statistically significant; a measure of test sensitivity or power. The power of a test depends in part on the number of replicates per concentration; the
QA 001 Quality Assurance Manual Revision 14
November 15, 2013 Page 56 of 93
\\Harrison\D\Quality Control\SOPs & QAM\Quality Assurance Manual\QA 001 QA MANUAL Rev 14.doc

Analysis Corporation
STAT
significance level selected, e.g., 0.05, and the type of statistical analysis. If the variability remains constant, the sensitivity of the test increases as the number of replicates is increased. (NELAC) Stock Solution: A concentrated solution of analyte(s) or reagent(s) prepared and verified by prescribed procedure(s), and used for preparing calibration standards. See Calibration Standard. (AIHA-LAP, LLC) Study: This term refers to a PT study or supplemental PT study. Supplemental Proficiency Testing Study (Supplemental PT Study): A PT sample that may be from a lot previously released by a PT provider that meets the requirements for supplemental PT samples given in Volume 3 of TNI Standard but that does not have a pre-determined opening date and closing date. Subsample: A representative portion of a sample; a subsample may be taken from any location or a field sample; in analytical chemistry, an “aliquot.” (AIHA-LAP, LLC) Suggestion: Suggested activity or advice for improving laboratory performance often made during a site assessment. A suggestion is not a requirement. (AIHA-LAP, LLC) Supervisor (however named): the individual(s) designated as being responsible for a particular area or category of scientific analysis. This responsibility includes direct day-to-day supervision of technical employees, supply and instrument adequacy and upkeep, quality assurance/quality control duties and ascertaining that technical employees have the required balance of education, training and experience to perform the required analyses. (NELAC) Surrogate: a substance with properties that mimic the analyte of interest. It is unlikely to be found in environment samples and is added to them for quality control purposes. (QAMS) Suspension: the temporary removal of a laboratory’s accreditation for a defined period of time, which shall not exceed six (6) months or the period of accreditation, whichever is longer, in order to allow the laboratory time to correct deficiencies or area of nonconformance with the Standard. (NELAC) A temporary removal of the accredited status of a laboratory when it is found to be out of compliance with specific program requirements. (AIHA-LAP, LLC) Technical Director: individual(s) who has overall responsibility for the technical operation of the environmental testing laboratory. (NELAC) Technical Systems Audit: A thorough, systematic, onsite, qualitative evaluation of facilities, equipment, personnel, training, procedures, record keeping, data validation, data management and reporting aspects of a total quality system. (AIHA-LAP, LLC) Technology: A specific arrangement of analytical instruments, detection systems, and/or preparation techniques. Test: a technical operation that consists of the determination of one or more characteristics or performance of a given product, material, equipment, organism, physical phenomenon, process or service according to a specified procedure. The result of a test is normally recorded in a document sometimes called a test report or a test certificate. (ISO/IEC Guide 2-12.1, amended) A technical operation that consists of determining one or more elements in a sample according to a specified procedure. (AIHA-LAP, LLC) Test Method: Specified technical procedure for performing a test. See Standard Operating Procedure (AIHA-LAP, LLC)
QA 001 Quality Assurance Manual Revision 14
November 15, 2013 Page 57 of 93
\\Harrison\D\Quality Control\SOPs & QAM\Quality Assurance Manual\QA 001 QA MANUAL Rev 14.doc
Analysis Corporation
STAT
A body of procedures and techniques for performing an activity (e.g., sampling, chemical analysis, quantification), systematically presented in the order in which they are to be executed. (NELAC). Testing Laboratory: a laboratory that performs tests. (ISO/IEC Guide 2-12.4) Test Sensitivity/Power: the minimum significant difference (MSD) between the control and test concentration that is statistically significant. It is dependent on the number of replicates per concentration, the selected significance level, and the type of statistical analysis (see Chapter 5, Appendix D, section 2.4.a). (NELAC) TNI PT Board: A board consisting of TNI members or affiliates, appointed by the TNI Board of Directors, which is responsible for the successful implementation and operation of the TNI Proficiency Testing Program. The duties of the TNI PT Board are defined in the TNI PT Board Charter. Tolerance Chart: A chart in which the plotted quality control data is assessed via a tolerance level (e.g. +/- 10% of a mean) based on the precision level judged acceptable to meet overall quality/data use requirements instead of a statistical acceptance criteria (e.g. +/- 3 sigma) (applies to radiobioassay laboratories). (ANSI) Toxic Substances Control Act (TSCA): the enabling legislation in 15 USC 2601 et seq., (1976), that provides for testing, regulating, and screening all chemicals produced or imported into the United States for possible toxic effects prior to commercial manufacture. (NELAC) Traceability: The ability to trace the history, application, or location of an entity by means of recorded identifications. In a calibration sense, traceability relates measuring equipment to national or international standards, primary standards, basic physical constants or properties, or reference materials. In a data collection sense, it relates calculations and data generated throughout the project back to the requirements for the quality of the project. (NELAC) Property of the result of a measurement or the value of a standard whereby it can be related to stated references, usually international or national standards, through an unbroken chain of comparisons all having stated uncertainties. (NIST) The process of documenting the value of a reference material or standard as related to NIST standards or equivalent through an unbroken chain of comparisons with stated uncertainties. (AIHA-LAP, LLC) Uncertainty of Measurement: Result of the evaluation aimed at characterizing the range within which the true value of a test result is estimated to lie, generally within a given likelihood. (AIHA-LAP, LLC) Parameter, associated with the result of a measurement that characterizes the dispersion of the values that could reasonably be attributed to the measurand. (NIST) United States Environmental Protection Agency (EPA): the federal governmental agency with responsibility for protecting public health and safeguarding and improving the natural environment (i.e., the air, water, and land) upon which human life depends. (US-EPA) Validation: the process of substantiating specified performance criteria. (EPA-QAD) The process of confirming specified method performance criteria. (AIHA-LAP, LLC) Verification: confirmation by examination and objective evidence that specified requirements have been met. (NELAC) NOTE: In connection with the management of measuring equipment, verification provides a means for checking that the deviations between values indicated by a measuring instrument and corresponding known values of a measured quantity are consistently smaller than the maximum
QA 001 Quality Assurance Manual Revision 14
November 15, 2013 Page 58 of 93
\\Harrison\D\Quality Control\SOPs & QAM\Quality Assurance Manual\QA 001 QA MANUAL Rev 14.doc

Analysis Corporation
STAT
allowable error defined in a standard, regulation or specification peculiar to the management of the measuring equipment. The result of verification leads to a decision either to restore in service, to perform adjustment, to repair, to downgrade, or to declare obsolete. In all cases, it is required that a written trace of the verification performed shall be kept on the measuring instrument’s individual record. Confirmation by examination and provision of evidence that specified requirements have been met. (AIHA-LAP, LLC) Voting Member: officials in the employ of the Government of the United States, and the States, the Territories, the Possessions of the United States, or the District of Columbia and who are actively engaged in environmental regulatory programs or accreditation of environmental laboratories. (NELAC)
QA 001 Quality Assurance Manual Revision 14
November 15, 2013 Page 59 of 93
\\Harrison\D\Quality Control\SOPs & QAM\Quality Assurance Manual\QA 001 QA MANUAL Rev 14.doc

Analysis Corporation
STAT
Appendix 1
Summary of Changes from Rev 13
• Addition to the Introduction stating that the individual analyst has the responsibility to
monitor quality control indicators and to initiate corrective action that can include stopping work if necessary.
• Added a reference to Consumer Products Safety Commission (CPSC) to the Policy Statement and to Section I: Introduction Revised the Duties of the Quality Assurance Director (2.1.2.4) to bring them into agreement with DOD requirements and the requirement to insure compliance with ISO 17025.
• Revised Duties of Technical Manager (2.1.2.2) to include the requirement to insure compliance with ISO 17025.
• Revised sections 4.2 and 4.2.6 to require calibration of the NIST Traceable Thermometer at least every five years.
• Minor editorial revisions.
QA 001 Quality Assurance Manual Revision 14
November 15, 2013 Page 60 of 93
\\Harrison\D\Quality Control\SOPs & QAM\Quality Assurance Manual\QA 001 QA MANUAL Rev 14.doc

Analysis Corporation
STAT
APPENDIX 2: Organizational Chart
QA 001 Quality Assurance Manual Revision 14
November 15, 2013 Page 61 of 93
\\Harrison\D\Quality Control\SOPs & QAM\Quality Assurance Manual\QA 001 QA MANUAL Rev 14.doc

Analysis Corporation
STAT
APPENDIX 3: STAT SOPs
ADMINISTRATIVE SOPs SOP Number STAT SOP ADMINISTRATIVE PROCEDURES 005 SOP 005 Document Control 006 SOP 006 Management Review of Quality System 100 SOP 100 SOP on SOPs 230 SOP QA 230 Corrective Action 240 SOP 240 Archiving1000 SOP 1000 Control and Use of
Laboratory Notebooks 1010 SOP 1010 Analytical Standards and Reagents Receipt and
Preparation 1020 SOP QA 1020 Laboratory Glassware Cleaning 1040 SOP 1040 General Laboratory Practices 1210 SOP 1210 Method Detection Limits 1220 SOP 1220 Internal Quality Assurance Audit 1230 SOP 1230 Training 1250 SOP 1250 Data Review 1255 SOP 1255 Manual Integration 1270 SOP 1270 Uncertainty SAFETY DEPARTMENT 003 SOP QA 003 Chemical Hygiene Plan 1130 SOP 1130 Waste Disposal CUSTOMER SERVICE DEPARTMENT 220 SOP 220 Customer Service 300 SOP 300 Sample Receiving and Login Procedures 1330 SOP 1330 Purchasing INFORMATION TECHNOLOGY DEPARTMENT 1400 SOP 1400 LIMS 1500 SOP 1500 Computer Network
QA 001 Quality Assurance Manual Revision 14
November 15, 2013 Page 62 of 93
\\Harrison\D\Quality Control\SOPs & QAM\Quality Assurance Manual\QA 001 QA MANUAL Rev 14.doc

Analysis Corporation
STAT
APPENDIX 3 (cont.'d) NELAC APPROVED TEST METHODS
Laboratory Test Method STAT SOP SW846 9095A SOP 2010 Paint Filter Liquids Test by EPA Method 9095A SW846 1311 SOP 2125 Leaching Procedures (Toxicity Characteristic
Leaching Procedure (EPA Method 1311)) SW846 1312 SOP 2125 Leaching Procedures (Synthetic Precipitation
Leaching Procedure (EPA Method 1312)) SW846 3005A SOP 3005 SW848 3005 Acid Digestion of Waters for Total
Recoverable or Dissolved Metals for Analysis by FLAA, ICP, or ICP-MS
SW846 3620B SOP 3060 Florisil Clean up for PCBs and Pesticides (EPA
Method 3620B) SW846 3660B SOP 3070 Sulfur & Sulfuric Acid/Permanganate Cleanup
for PCBs and Pesticides (EPA Method 3660B & 3665A) SW846 3665A SOP 3070 Sulfur & Sulfuric Acid/Permanganate Cleanup
for PCBs and Pesticides (EPA Method 3660B & 3665A) SW846 3050B SOP 3110 SW846 3050B Acid Digestion of Sediment,
Sludges, and Soils for Metals Analysis by FLAA, ICP, or ICP-MS
SW846 3050B SOP 3115 Extraction of High Volume Filters SW846 3630C SOP 3330 Silica Gel Cleanup for Semi-Volatile Organics
(EPA Method 3630C) SW846 3510C SOP 3500 Extractions of Samples for Semi-Volatile
Organic Analyses (EPA Methods 3510C, 3520C, 3540, 3545, 3550B, 3580A, 8151A)
SW846 3540 SOP 3500 Soxhlet Extraction: Extractions of Samples for
Volatile and Semi-Volatile Organics (EPA Methods 3510C, 3520C, 3540, 3545, 3550B, 3580A, 8151A)
QA 001 Quality Assurance Manual Revision 14
November 15, 2013 Page 63 of 93
\\Harrison\D\Quality Control\SOPs & QAM\Quality Assurance Manual\QA 001 QA MANUAL Rev 14.doc

Analysis Corporation
STAT
APPENDIX 3 (cont.’d) NELAC APPROVED TEST METHODS
Laboratory Test Method STAT SOP SW846 3545 SOP 3500 Pressurized Fluid Extraction: Extractions of
water nonsoluble or slightly soluble Semi-Volatile Organics (EPA Methods 3510C, 3520C, 3540, 3545, 3550B, 3580A, 8151A)
SW846 3550B SOP 3500 Extractions of Samples for Semi-Volatile
Organic Analyses (EPA Methods 3510C, 3520C, 3550B, 3580A, 8151A)
SW846 3580A SOP 3500 Extractions of Samples for Semi-Volatile
Organic Analyses (EPA Methods 3510C, 3520C, 3550B, 3580A, 8151A)
SW846 8151A SOP 3500 Extractions of Samples for Semi-Volatile
Organic Analyses (EPA Methods 3510C, 3520C, 3550B, 3580A, 8151A)
SW846 9012A SOP 3610 Total and Amenable Cyanide: Distillation by
EPA 9012A SW846 Ch. 7 SOP 3615 Reactive Cyanide and Sulfide: Distillation by
SW 846, Chapter 7. SW846 9065 SOP 3620 Phenolics: Distillation by EPA 9065. SW846 8260B SOP 4000 Volatile Organic Compounds by Gas
Chromatography/Mass Spectrometry (GC/MS) (EPA Methods 5030B/5035/ 8260B)
SW846 8270C SOP 4020 Semi-Volatile Organic Compounds by Gas
Chromatography/Mass Spectrometry (GC/MS) (EPA Method 8270C)
SW846 8081A SOP 4050 Organochlorine Pesticides & PolyChlorinated
Biphenyl by Gas Chromatography/Electron Capture Detector (EPA Methods 8081A/8082)
SW846 8082 SOP 4050 Organochlorine Pesticides & PolyChlorinated
Biphenyl by Gas Chromatography/Electron Capture Detector (EPA Methods 8081A/8082)
QA 001 Quality Assurance Manual
Revision 14 November 15, 2013
Page 64 of 93 \\Harrison\D\Quality Control\SOPs & QAM\Quality Assurance Manual\QA 001 QA MANUAL Rev 14.doc

Analysis Corporation
STAT
APPENDIX 3 (cont.’d) NELAC APPROVED TEST METHODS
Laboratory Test Method STAT SOP ASTM Method D-4059 SOP 4051 PolyChlorinated Biphenyl by Gas
Chromatography/Electron Capture Detector (ASTM Method D-4059)--DRAFT
SW846 8321A SOP 4080 ChloroPhenoxy Herbicides by HPLC (EPA
Method 8321A) SW846 8015M SOP 4090 Total Petroleum Hydrocarbons by GC/FID SW846 1010 SOP 4105 Ignitibility by EPA 1010/ ASTM D93-02
Pensky-Martens Closed Cup and ASTM D1310 Tag Open Cup- DRAFT
SW846 9040B SOP 4210 pH of Aqueous, Soil and Waste Samples by EPA
Method 9040B, 9045C, 150.1 SW846 9045C SOP 4210 pH of Aqueous, Soil and Waste Samples by EPA
Method 9040B, 9045C, 150.1 SW846 8270C SIM SOP 4500 Polynuclear Aromatic Compounds by Gas
Chromatography/Mass Spectrometry (GC/MS) with Selective Ion Monitoring (SIM) (EPA Method 8270C SIM)
SW846 6020 SOP 4510 Metals Analysis by Inductively Coupled
Plasma- Mass Spectrometry (EPA Method 6020 and EPA Method IO-3.5)
SW846 7470A SOP 4530 Mercury in Water, Solid or Semisolid Water
(Manual Digestion/Automated Analysis Cold-Vapor Technique (EPA Method 7470A & 7471A)
SW846 7471A SOP 4530 Mercury in Water, Solid or Semisolid Water
(Manual Digestion/Automated Analysis Cold-Vapor Technique (EPA Method 7470A & 7471A)
SW846 3060A SOP 4600 Automated Hexavalent Chromium Analysis by
EPA Method 7196A and 3060A SW846 7196A SOP 4600 Automated Hexavalent Chromium Analysis by
EPA Method 7196A and 3060A
QA 001 Quality Assurance Manual Revision 14
November 15, 2013 Page 65 of 93
\\Harrison\D\Quality Control\SOPs & QAM\Quality Assurance Manual\QA 001 QA MANUAL Rev 14.doc

Analysis Corporation
STAT
APPENDIX 3 (cont.’d) NELAC APPROVED TEST METHODS
Laboratory Test Method STAT SOP SW846 9012A SOP 3610 Total and Amenable Cyanide: Distillation by
9012A SW846 Chapter 7.3.3.2 SOP 3615 Reactive Cyanide and Sulfide: Distillation by
SW846 Chapter 7 SW846 9065 SOP 3620 Phenolics 4AAP: Distillation by EPA 9065 EPA 415.1 SOP 4630 Total Organic Carbon By EPA 415.1 SW846 9012A SOP 4710 Automated Cyanide Analysis by EPA 9012A SW846 9066 SOP 4715 Automated Phenols – Analysis by EPA 9066 846 9034 SOP 4725 Automated Sulfide Analysis by EPA 376.2 and
EPA 9034 EPA 410.4 SOP 4260 Chemical Oxygen Demand by EPA 410.4 SW846 9023 TOX, EOX in Soils and Waters by SW846 9023 and 9020-
DRAFT
QA 001 Quality Assurance Manual Revision 14
November 15, 2013 Page 66 of 93
\\Harrison\D\Quality Control\SOPs & QAM\Quality Assurance Manual\QA 001 QA MANUAL Rev 14.doc

Analysis Corporation
STAT
APPENDIX 3 (cont’d) AIHA TEST METHODS
Laboratory Test Method STAT SOP NIOSH 7300 SOP 4515 Elements by ICP-MS by NIOSH 7300 -DRAFT NIOSH 6009 SOP 4535 Mercury in Air Monitoring Cartridges by -
NIOSH 6009 NIOSH 7082 SOP 4550 Lead Analysis of Lead by Atomic Absorption
Direct Aspiration (NIOSH 7082, EPA IO-3.2, and EPA 7420)
OSHA 07, NIOSH SOP 4700 Organic Vapors in Air Monitoring Cartridges by
Gas Chromatography (5515, 1400, 1501, 1500, 2000, NIOSH 7400 SOP 5100 Asbestos and Other Fibers by PCM NIOSH 5515 SOP 4701 Polynuclear Aromatic Hydrocarbon in Air
Monitoring Cartridges by GC/MS with Selective Ion Monitoring
NIOSH 5503 SOP 4702. Polychlorinated biphenyls in Air Monitoring
Cartridges by Gas Chromatography. OSHA 0500, 0600 SOP 4040 Sampling And Analysis of Ambient Air for
Total Suspended Particulate Matter (SPM) And PM10 Using High Volume (HV) Sampler
SOP 6110 SOP 6110 Analysis of Non-Viable Microbiological Air
Samples SOP 6120 SOP 6120 Analysis of Viable Microbiological Air Samples SOP 6210 SOP 6210 Analysis of Non-Viable Microbiological
Samples by Direct Examination SOP 6220 SOP 6220 Analysis of Viable Microbiological Swab and
Bulk Samples SOP 6310 Preparation of Media and Sterile Water
QA 001 Quality Assurance Manual
Revision 14 November 15, 2013
Page 67 of 93 \\Harrison\D\Quality Control\SOPs & QAM\Quality Assurance Manual\QA 001 QA MANUAL Rev 14.doc

Analysis Corporation
STAT
APPENDIX 3 (cont.’d) AMBIENT AIR TEST METHODS (ORDEQ/NELAC)
Laboratory Test Method STAT SOP EPA IO-3.1 SOP 3115 Extraction of High Volume Filters SW846 3510, 3550B, 3580A SOP 3500 Extractions of Samples for Semi-Volatile
Organic Analyses (EPA Methods 3510C, 3520C, 3550B, 3580A, 8151A)
EPA TO-14A/15 SOP 4010 Volatile Organic Compounds in Ambient Air by
2-Stage Thermal Desorption/Gas Chromatography/Mass Spectrometry (GC/MS) (EPA Method TO-14A/TO-15)
EPA TO-14A/15 SOP 4011 Flow Calibration of Passive Air Sampling
Equipment EPA TO-13A SOP 4030 Determination of Polycyclic Aromatic
Hydrocarbons in Ambient Air Using Gas Chromatography/ Mass Spectrometry by EPA TO-13A
EPA IO-3.1 SOP 4040 Sampling And Analysis of Ambient Air for
Total Suspended Particulate Matter (SPM) And PM10 Using High Volume (HV) Sampler
EPA IO-3.5 SOP 4510 Metals Analysis by Inductively Coupled
Plasma- Mass Spectrometry (EPA Method 6020 AND EPA Method IO-3.5)
IO-3.2, EPA 7420 SOP 4550 Analysis of Lead by Atomic Absorption Direct
Aspiration (NIOSH 7082, EPA IO-3.2, and EPA 7420)
QA 001 Quality Assurance Manual Revision 14
November 15, 2013 Page 68 of 93
\\Harrison\D\Quality Control\SOPs & QAM\Quality Assurance Manual\QA 001 QA MANUAL Rev 14.doc

Analysis Corporation
STAT
APPENDIX 3 (cont.’d) NIST/NVLAP METHODS
5200 SOP 5200 Polarized Light Microscopy (PLM) Analysis 5330 SOP 5300 Transmission Electron Microscopy (TEM) Sample
Analysis
OTHER TEST METHODS ASTM E1664 SOP 2000 Total Recoverable Oil & Grease by ASTM E1664
and EPA 9071B - DRAFT SW846 9071B SOP 2000 Total Recoverable Oil & Grease by ASTM
E1664 and EPA 9071B - DRAFT ATSM D4979 SOP 2040 Color, Order, Physical Description by ASTM
D4979 - DRAFT ASTM 5058-90 SOP 2080 Compatibility of Screening Analysis - DRAFT ASTM 3987-85 SOP 2125 Leaching Procedures (ASTM D3987-85
Leaching Procedure) EPA350.1 SOP 3250 Ammonia Distillation by EPA 350.1 - DRAFT ASTM D93-80 SOP 4105 Ignitibility by EPA 1010 Pensky-Martens
Closed Cup and ASTM D93-80 Open Cup – DRAFT SW846 9050A SOP 4200 Conductivity (Specific Conductance) EPA 150.1 SOP 4210 pH of Aqueous, Soil and Waste Samples (EPA
Method 9040B, 9045C, 150.1) SM 4500 SOP 4250 Ammonia as N in Soil and Water by SM 4500 EPA 410.4 SOP 4260 Chemical Oxygen Demand by EPA 410.4 SM 5210B Biological Oxygen Demand (BOD) and Carbonaceous BOD
(CBOD)
QA 001 Quality Assurance Manual Revision 14
November 15, 2013 Page 69 of 93
\\Harrison\D\Quality Control\SOPs & QAM\Quality Assurance Manual\QA 001 QA MANUAL Rev 14.doc

Analysis Corporation
STAT
APPENDIX 3 (cont.’d) OTHER TEST METHODS
Laboratory Test Method STAT SOP SM 45001 SOP 4420 Nitrates and Nitrites in Soils and Water by SM
4500 FR, I EPA 353.2 SOP 4420 Nitrates and Nitrites in Soils and Water by EPA
EPA 353.2 SM 2320B Alkalinity Analysis EPA 365.2 SOP 4450 Ortho-phosphate in Soils and Waters by EPA
365.2 - DRAFT EPA 160.4 SOP 4480 % Ash, FOC, % Solids and % Moisture by EPA
160.4, ASTM D2974, ASTM D2216, and ASTM 3550B ASTM D2974 SOP 4480 % Ash, FOC, % Solids and % Moisture by EPA
160.4, ASTM D2974, ASTM D2216, and ASTM 3550B ASTM D2216 SOP 4480 % Ash, FOC, % Solids and % Moisture by EPA
160.4, ASTM D2974, ASTM D2216, and ASTM 3550B – ASTM 3550B SOP 4480 % Ash, FOC, % Solids and % Moisture by EPA
160.4, ASTM D2974, ASTM D2216, and ASTM 3550B EPA 160.1 SOP 4482 Total Dissolved, Total Settleable Solids, and
Total Solids by EPA 160.1 EPA 160.2, and SM 2540 B-G EPA 160.2 SOP 4482 Total Dissolved, Total Settleable Solids, and
Total Solids by EPA 160.1 EPA 160.2, and SM 2540 B-G. SM 2540 B-G SOP 4482 Total Dissolved, Total Settleable Solids, and
Total Solids by EPA 160.1 EPA 160.2, and SM 2540 B-G. EPA 376.2 SOP 4725 Automated Sulfide Analysis by EPA 376.2 and
EPA 9034
QA 001 Quality Assurance Manual Revision 14
November 15, 2013 Page 70 of 93
\\Harrison\D\Quality Control\SOPs & QAM\Quality Assurance Manual\QA 001 QA MANUAL Rev 14.doc

Analysis Corporation
STAT
APPENDIX 4: INSTRUMENTATION Equipment Manufacturer Model # Serial # Dept.
5890 Series II GC 2950A27820
5971U MSD 3050A01584
GC/MS (SVOC-1) Hewlett Packard
6890 AS 3409A34948-3
SVOC
6890N GC US00033560
5973N MSD US9014004
GC/MS (SVOC-2) Agilent
7683N AS US95310985
SVOC
6890N GC US00037515
5973N MSD US03340461
GC/MS (SVOC-3) Agilent
7683N AS US01012145
SVOC
6890N GC US00042823
5973N MSD US10440761
GC/MS (SVOC-4) Agilent
7683N AS US11618674
SVOC
6890N GC CN52734690
5975N MSD US52430277
GC/MS (SVOC-5) Agilent
7683N AS CN5272615
SVOC
GC/MS (SVOC-6) Agilent 7890GC; 5975C MSD; 7683B AS
CN10705003/US83130313/CN83250642
SVOC
5890 Series II GC 3140A39325 GC/FID Hewlett Packard
6890 AS 3113G06781-3
SVOC
GC/FID2 Agilent 7890A GC; 7683B AS CN10724063/CN83250636
SVOC
GC/ECD PCB1 Agilent 6890N GC
7683N AS US00034720 US00411387
Pest/PCB
GC/ECD PCB2
Agilent 6890N GC 7683N AS
CN10445022 CN44731379
Pest/PCB
GC/ECD PCB3
Agilent 6890N GC 7683 AS
CN10606009 CN62239870
Pest/PCB
6890 GC US00023185 GC/MS (VOC-1) Hewlett Packard
5973 MSD US82311186
VOC
5890 Series Plus GC 2939A08878 GC/MS (VOC-2) Hewlett Packard
5971 MSD 3050A01916
VOC
6890N GC US00033670 GC/MS (VOC-3) Agilent
5973N MSD US03340480
VOC
6890N GC US00042820 GC/MS (VOC-4) Agilent
5973N MSD US10440768
VOC
GC/MS (VOC-5) Agilent 6890 GC CN10516053 Air Toxics
QA 001 Quality Assurance Manual Revision 14
November 15, 2013 Page 71 of 93
\\Harrison\D\Quality Control\SOPs & QAM\Quality Assurance Manual\QA 001 QA MANUAL Rev 14.doc

Analysis Corporation
STAT
APPENDIX 4: INSTRUMENTATION Equipment Manufacturer Model # Serial # Dept.
Agilent 5973 MS US44621448
Tekmar 14-ACAN-000 AS US05130007
6890 GC CN 10716027 5975C MS US 71235770
GC/MS (VOC-6) Agilent
Autocan 12 US 07100004
Air Toxics
Agilent 6890 US00001664 Tekmar 14-3100-OEL 241003
VOA-7 (GC FID/PID)
Varian Archon 13383
Air Toxics
GCFID HP 5890 3033A31565 Air Toxics 600 Controller SX5MM0449M
Pump MX5KM3223M HPLC 1 Waters
717 Autosampler MX5EM4621M
SVOC
G1311A Pump DE14917955
G1313A Autosampler DE14918512
G1322A Degasser DE14918512
G1316A Column Heater DE14926164
G1314A VWD JP11616431
HPLC 2
Agilent 1100
G1321A Fluorescence Det. DE14904016
SVOC
Hot Plate VWR Dynatherm 33918 ASB
Purified HEPA Filter Enclosure
Labconoco 3730000 02022032A-31 ASB
Sonicator Branson 2510 RLA1203942170 ASB
Balance-2 Mettler Toledo B303 1114032438 Micro
Analytical Balance-6
Mettler AE160 B81560 LEAD
Autosampler Perkin-Elmer AS90 507910 (8621) LEAD
Block Digestors CPI 05 C0530 293 LEAD
FLAA Perkin-Elmer PE Analyst 300 041S9110115 LEAD
Pyromultimagnestir
Labline 1268 058950057 LEAD
Analytical Balance-10
Mettler AB104-S 1128422933 METALS
Autosampler on ICP-MS1
CETAC ASX510 090007A5X5 METALS
Autosampler on ICP-MS2
Cetac ASX510 020230ASX METALS
Block Digestors CPI Int. - A METALS
Block Digestors CPI Int. - B METALS
Chiller on ICP-MS1
Neslab M75 102025049 METALS
Chiller on ICP-MS2
Neslab CFT-100 100175035 METALS
Kwikool AC Kwikool SWAC 2411 4480 METALS
QA 001 Quality Assurance Manual Revision 14
November 15, 2013 Page 72 of 93
\\Harrison\D\Quality Control\SOPs & QAM\Quality Assurance Manual\QA 001 QA MANUAL Rev 14.doc

Analysis Corporation
STAT
APPENDIX 4: INSTRUMENTATION Equipment Manufacturer Model # Serial # Dept.
High Vacuum Pump
Edwards E2M5 17915F METALS
ICP-MS-1 Agilent 7500i JP93200201 METALS
ICP-MS-2 Agilent 7500i JP13200437 METALS
Mercury Analyzer
CETAC M-6000A 060003MAS METALS
Water Bath VWR 1204 23005 METALS
Class Safety Enclosure
Labconoco 3730001 020220239A MICRO
Colony Counter Leica 3327 0002411463YPO003 MICRO
Conductivity Meter
VWR 61161-362 230355432 MICRO
Crystal Panel Viewer
Becken-Dickison BD-BBL 050604-1499 MICRO
Fluorescence Analysis Chamber
Spectriline CM-10 147858 MICRO
Fluorescence Analysis Chamber
UVP CC-10 95-00724 MICRO
Fume Enclosure Mystaire 100 MICRO
Fume Enclosure Mystaire FE100 MICRO
Furnace Thermolyne 48000 480911020760 MICRO
Hot plate VWR Dynatherm 0687 MICRO
Hot plate VWR Dynatherm 0686 MICRO
Hot Plate/ Stirrer VWR 371 2258 MICRO
Incubator (I-1) VWR 1510E 120060-2 MICRO
Incubator (I-2) VWR 1516E 04070804 MICRO
Microscope Olympus CX31 RBSFA 2M03757 MICRO
Microscope Olympus CH2 7L0064 MICRO
Microscope Olympus BH-2 223905 MICRO
Microscope Olympus BH-2 221905 MICRO
Microscope Olympus BH-2 217318 MICRO
Mini Vortex VWR 945300 14263 MICRO
pH /Temp. Meter 340
Beckman 511210 4585 MICRO
Sealer Index Quanti-Tray 89-10894-02 3510R MICRO
Smart Cycler II Cephid 900-0057 200306 MICRO
Refrigerator #10 Jordan AB-4-6 PR52858-99H RECEIVE
Refrigerator #6 Jordan AB-4-6 PR52857-99H RECEIVE
Refrigerator #7 NORPOLE NPGR2 RECEIVE
QA 001 Quality Assurance Manual Revision 14
November 15, 2013 Page 73 of 93
\\Harrison\D\Quality Control\SOPs & QAM\Quality Assurance Manual\QA 001 QA MANUAL Rev 14.doc

Analysis Corporation
STAT
APPENDIX 4: INSTRUMENTATION Equipment Manufacturer Model # Serial # Dept.
Refrigerator #8 Jordan AB-4-6 PR5381-00A VOC
Autosampler Varian 8200 8200-09311 STORAGE
Autosampler Varian SPS-5 95061148 STORAGE
Autosampler (VOC1)
Varian Archon 13037 STORAGE
FLAA Varian SpectrAA 200 31-100838-00 STORAGE
Hot plate Thermolyne Cimarec-3 66196070461 STORAGE
HPLC Pump Hewlett Packard 1050 STORAGE
Power Pack Varian SIPS/PP1 94111272 STORAGE
Purge & Trap (VOC2)
HP 1909 3432A10143 STORAGE
Sample introduction
Varian SIPS 1 95021096 STORAGE
Sonicator Branson 450 BI0009670 STORAGE
Spect 20 Baush & Lomb 33.31.72 1152868 STORAGE
TCLP tumblers Millipore Agitator 10 455VS4045 STORAGE
TCLP tumblers Millipore Agitator 10 455VS4049 STORAGE
Water Bath Precision Scientific 180 26AX-6 STORAGE
Desktop Centrifuge
Becton-Dickinson Compact II 31000253 SVOC
Fume enclosure Labconco 69000 020697466M SVOC
Fume enclosure Labconco 69000 020697440M SVOC
GC/ECD Varian 3600 3600-02846 SVOC
Heaters Glas Col TM106 158714a to 29A SVOC
Mini Vortex VWR 1945300 23007 SVOC
N2 Solvent Concentrator
Labconco 79100-00 991292324C SVOC
N2 Solvent Concentrator
Labconco 79100-00 000593233D SVOC
N2 Solvent Concentrator
Labconco 79100-00 000893763E SVOC
N2 Solvent Concentrator
Labconco 79100-00 000893764E SVOC
Refrigerator #78 GE TAX4DNCAWH 32373 SVOC
Refrigerator 13 Kenmore 253.6072101 WA2001629 SVOC
Sonicator Branson 450 BI120061 SVOC
Sonicator Branson 450 BI30158 SVOC
Sonicator Branson 450 BI99063085 SVOC
Top Loading Balance-4
Mettler Toledo PM300/49 F64687 SVOC
QA 001 Quality Assurance Manual Revision 14
November 15, 2013 Page 74 of 93
\\Harrison\D\Quality Control\SOPs & QAM\Quality Assurance Manual\QA 001 QA MANUAL Rev 14.doc

Analysis Corporation
STAT
APPENDIX 4: INSTRUMENTATION Equipment Manufacturer Model # Serial # Dept. Autosampler
(VOC2) Varian Archon 13037 VOC
Autosampler (VOC3)
Varian Archon 13176 VOC
Autosampler (VOC4)
Varian Archon 13553 VOC
Autosampler (VOC1)
Varian Archon 13553 VOC
Flow Meter Agilent ADM 1000 US06L31632 VOC
Freezer #0 GE FUM5SAARWH H2115897 VOC
Freezer #12 Kenmore 253.234.24101 WB32231534 VOC
Freezer #9 GE FUM5SAARWH V21100784 VOC
Fume enclosure Labconco 6900000 020697464M VOC
Purge & Trap (VOC1)
Tekmar 3100 US 01107021 VOC
Purge & Trap (VOC3)
Tekmar 3000 98019001 VOC
Purge & Trap (VOC4)
Tekmar 14-8900-00T US04356005 VOC
Refrigerator #14 Kenmore 56491601100 30200594 VOC
Sonicator Branson 2510 RLA070151006D VOC
Balance-1 Mettler Toledo PB403-S 1128192065 VOC
Vacuum Pump for VOC 2
Edwards E2M2 68877 VOC
Gas leak detector GPW-MAC 21-070 S20308 Air Tox
Gas leak detector GPW-MAC 21-050 J47706 VOC
Dessicator (D-1) Nalgene 5317-0180 Cat. 24987-056 WET
Analytical Balance-9
Mettler-Toledo AB304-S 1125191416 Metals
Box Furnace Lindberg Blue BF51828C-1 009L-516875-OL WET
COD Reactor Hach 4500 0107000022043 WET
Conductivity Meter
VWR 61161-362 230109686 WET
Digital Hygrometer/Ther
mometer
Control Company 35519-049 240130982 WET
Digital Hygrometer/Ther
mometer
Control Company 35519-049 240160719 WET
Environ Chamber Environmental Chamber Company
Tenney TH Jr 11863-528 WET
Flash Point Precision 74537 S03198 WET
Hot Plate/ Stirrer VWR 325 0868 WET
Hot Plate/ Stirrer VWR 325 0869 WET
QA 001 Quality Assurance Manual Revision 14
November 15, 2013 Page 75 of 93
\\Harrison\D\Quality Control\SOPs & QAM\Quality Assurance Manual\QA 001 QA MANUAL Rev 14.doc

Analysis Corporation
STAT
APPENDIX 4: INSTRUMENTATION Equipment Manufacturer Model # Serial # Dept.
Magnetic stirrer VWR VWR 200 58940-158 WET
Mini-Cyanide Distillation
System
RGW Instruments R-3166MS-100 2 WET
pH/mV/Temp Meter Series 20
Cole Palmer 570002-30 EP20/18094 WET
Phi240 pH/Temp Meter
Beckman Phi-340 3532 WET
QuickChem FIA Lachat 8000 A83000-1663 WET Spect 20 Baush & Lomb 33.31.72 0115280 WET
Stirrer VWR 205 7251 WET
Stirrer VWR 941006 6090 WET Stirrer VWR 941006 6096 WET Stirrer VWR 941006 6097 WET
Stirrer VWR 941006 6085 WET Stirrer VWR 941006 6093 WET Stirrer VWR 941006 6094 WET
TCLP tumblers Analytical Technologies 42RBFC1-E3 0685CPF0018 WET TCLP tumblers Millipore Agitator 10 455RY4029 WET
TOC/TOX Euroglass TOC 1200 2000.137 WET
Balance-12 Mettler PB1502-S 1126341459 WET Top Loading
Balance-7 Mettler BD202 4846 WET Top Loading
Balance-8 Mettler PB602 1113242526 WET
Balance-11 Mettler-Toledo 1129140668 SVOC
Balance-13 Mettler PB403 1129262406 Air Tox
Ba;ance 14 Mettle-Toledo AG-204 1118121901 WET
Transite Oven Blue M 11TA S3585 WET XYZ
Autosampler Lachat ASX 500 020122 ASX WET
Refri/Freezer 17 Kenmore WET
Refrigerator 16 ABSOCOLD SVOC
Refrigerator 18 Kenmore SVOC
Refri/Freezer 19 Kenmore SVOC
Refri/Freezer 20 Kenmore SVOC
Refri/Freezer 21 Kenmore Hallway
Refrigerator 22 Kenmore Micro
Refri/Freezer 23 Kenmore Air Tox Refri/Freezer
R12 Kenmore Micro QA 001 Quality Assurance Manual
Revision 14 November 15, 2013
Page 76 of 93 \\Harrison\D\Quality Control\SOPs & QAM\Quality Assurance Manual\QA 001 QA MANUAL Rev 14.doc

Analysis Corporation
STAT
APPENDIX 4: INSTRUMENTATION Equipment Manufacturer Model # Serial # Dept.
BOD Incubator VWR Micro
Incubator-3 Micro
Walk-in room
Manufacturer Equipment Model # Serial # Lab Olympus
Microscope CX31 2M03757 Micro Olympus
Microscope CX21 4J00403 Micro Bransonic
Ultrasonic Bath 2210R-MT RLA94060-072C ABS JEOL Electron Microscope JEM-100CX II EM156150-260
ABS JEOL Vacuum Evaporator JEE-4X EM300059-376
ABS Ladd Carbon rod Sharpener 30285 89-01-014
ABS
Olympus Microscope CH-2 9H0036
ABS Olympus PLM scope BH-2 H62105-00214
ABS Olympus PLM scope BH-2 HS2805-2000
ABS
Olympus Stereoscope 399597
ABS
Olympus Stereoscope SZX2 344125
ABS SPI Plasma Asher 11005 1586
ABS Thermolyne Muffle Furnace 48000 480911020760
ABS Olympus PCM Microscope CH-2 H92607-0318
ABS Oxford PCM filter fixer QuickFix 10931
ABS VWR
Hot plate / Stirrer 371 2258 ABS
VWR Hotplate Dylatherm 33918432 (cat.#) ABS
VWR Hotplate Dylatherm 33918432 (cat.#) ABS
VWR Mini Vortex 945300 14203 ABS
VWR Water Bath 1203 1103897 ABS
QA 001 Quality Assurance Manual Revision 14
November 15, 2013 Page 77 of 93
\\Harrison\D\Quality Control\SOPs & QAM\Quality Assurance Manual\QA 001 QA MANUAL Rev 14.doc

Analysis Corporation
STAT
APPENDIX 4: INSTRUMENTATION Equipment Manufacturer Model # Serial # Dept.
VWR Incubator 1 NA 1200602 Micro
VWR Incubator 2 NA 04070804 Micro
VWR Incubator 3 NA 04007506 Micro
Edwards High Vacuum Pump E2M5 17915F
ABS
Thermolyne Furnace 48000 480911020760 ABS
VWR BOD Incubator Model 2020 08006510 Metals
CEM MARS Microwave Oven R907501 MD1078 Metals
SPEX CertiPrep Freezer/Mills 6850-115 02021 Metals
SPEX CertiPrep AUTOEXTRACTOR 6814 10020 Metals
HAAKE SHAKER WATERBATH SWB20 920057 Metals
YSI Dissolved Oxygen meter 10D 100381 Metals
Cimarec hotplate HP131535 1757090481029 Metals
VWR hotplate VWR 97042-654 110510001 Metals
QA 001 Quality Assurance Manual Revision 14
November 15, 2013 Page 78 of 93
\\Harrison\D\Quality Control\SOPs & QAM\Quality Assurance Manual\QA 001 QA MANUAL Rev 14.doc

Analysis Corporation
STAT
APPENDIX 5 Sample Bottles and Preservation
WATER
METALS
Parameter Container Preservative Holding Time General, dissolved Plastic Filtered on site, 6 months (500 mL) HNO3 to pH<2
General, total Plastic HNO3 to pH<2 6 months
Chromium, hexavalent Plastic Cool 4°C 24 hours
Mercury Plastic HNO3 to pH<2 28 days
CONVENTIONAL PARAMETERS
Parameter Container Preservative Holding Time
Acidity Plastic Cool 4°C 14 days
Alkalinity Plastic Cool 4°C 14 days
Ammonia Plastic H2SO4 to pH<2, Cool 4°C 28 days
BOD Plastic Cool 4°C 48 hours
Bromide Plastic None 28 days
Chloride Plastic None 28 days
Chlorine Plastic Cool 4°C Analyze Immediately
Chromium Plastic Cool 4°C 24 hours
QA 001 Quality Assurance Manual Revision 14
November 15, 2013 Page 79 of 93
\\Harrison\D\Quality Control\SOPs & QAM\Quality Assurance Manual\QA 001 QA MANUAL Rev 14.doc

Analysis Corporation
STAT
COD Plastic H2SO4 to pH<2, Cool 4°C 28 days
APPENDIX 5 (cont’d) Sample Bottles and Preservation
CONVENTIONAL PARAMETERS
Parameter Container Preservative Holding Time
Color Plastic Cool 4°C 48 hours
Conductivity Plastic Cool 4°C 28 days
Cyanide, Total or Amenable Plastic NaOH to pH>12, Cool 4°C 14 days
Cyanide, Reactive Plastic NaOH to pH>12, Cool 4°C 14 days
Fluoride Plastic None 28 days
Hardness, Total Plastic HN03 to pH<2 6 months Nitrate/Nitrite Plastic H2S04 to pH<2, Cool 4°C 28 days Nitrate Plastic Cool, 4°C 48 hours Nitrite Plastic Cool, 4°C 48 hours Oil & Grease Glass H2SO4 to pH<2, Cool 4°C 28 days
pH Plastic None Analyze Immediately
Phenols Glass H2S04 to pH<2, Cool 4°C 28 days
Phosphorus, Ortho Plastic Cool 4°C 48 hours
Phosphorus, Total Plastic H2S04 to pH<2, Cool 4°C 28 days
Silica Plastic Cool 4°C 28 days
Solids, Dissolved Plastic Cool 4°C 7 days
Solids, Suspended Plastic Cool 4°C 7 days
Solids, Total Plastic Cool 4°C 7 days
Solids, Settleable Plastic Cool 4°C 48 hours
QA 001 Quality Assurance Manual Revision 14
November 15, 2013 Page 80 of 93
\\Harrison\D\Quality Control\SOPs & QAM\Quality Assurance Manual\QA 001 QA MANUAL Rev 14.doc

Analysis Corporation
STAT
APPENDIX 5 (cont’d) Sample Bottles and Preservation
CONVENTIONAL PARAMETERS
Parameter Container Preservative Holding Time
Solids, Volatile Plastic Cool 4°C 7 days
Sulfate Plastic Cool 4°C 28 days
Sulfide Plastic NaOH to pH>9, 7 days
Cool 4°C
Sulfide, Reactive Plastic NaOH to pH>9, 7 days Cool 4°C Sulfite Plastic None Analyze Immediately Surfactants, MBAS Plastic Cool 4°C 48 hours Turbidity Plastic Cool 4°C 48 hours Total Organic Carbon (TOC) Plastic H2S04 to pH<2, Cool 4°C 28 days Total Organic Halogens Glass H2S04 to pH<2, Cool 4°C 28 days (TOX)
ORGANICS
Parameter Container Preservative Holding Time HPLC Pesticides Glass vial 1.2 mL Chloroacetic acid 28 Days (Aldicarb / Carbonfuran) Cool 4°C EDB/DBCP Glass vial Cool 4°C 28 Days Endothall Glass Cool 4°C 7 days extraction 1-day analysis Pesticides and PCBs Glass Cool 4°C 7 days extraction 40 days analysis Petroleum Hydrocarbons Glass H2S04 to pH<2, Cool 4°C 28 days
QA 001 Quality Assurance Manual Revision 14
November 15, 2013 Page 81 of 93
\\Harrison\D\Quality Control\SOPs & QAM\Quality Assurance Manual\QA 001 QA MANUAL Rev 14.doc

Analysis Corporation
STAT
APPENDIX 5 (cont’d) Sample Bottles and Preservation
ORGANICS
Parameter Container Preservative Holding Time Phenoxyacid Herbicides Glass Cool 4°C 7 days extraction 40 days analysis Phthalate Esters Glass Cool 4°C 7 days extraction 40 days analysis Polynuclear Aromatic Glass Cool 4°C 7 days extraction Hydrocarbons 40 days analysis GC/MS Semivolatiles Glass Cool 4°C 7 days extraction 40 days analysis Total Petroleum Glass Cool 4°C 7 days extraction Hydrocarbons 40 days analysis Volatile Organics 40 ml Glass HCl to pH<2 14 days
SOIL
ALL PARAMETERS
Parameter Container Preservative Holding Time
All except VOA 2, 4, 8 or Cool 4°C See individual SOP 32 oz Glass Volatile Organics ENCORE* Cool 4°C 48 Hours Volatile Organics NaHSO4/ Cool 4°C 14 Days Methanol *Or equivalent
QA 001 Quality Assurance Manual Revision 14
November 15, 2013 Page 82 of 93
\\Harrison\D\Quality Control\SOPs & QAM\Quality Assurance Manual\QA 001 QA MANUAL Rev 14.doc

Analysis Corporation
STAT
Appendix 6: STAT Analysis Sample Acceptance Policy Chain of Custody Requirements: All samples must be submitted with a completed Chain-of-Custody
(COC) form filled out in ink. Please print legibly. The following information should be included:
1) Client Information: Company name and contact information. 2) Client Project Name or Number. 3) Sampler’s name. 4) Sample identification or location. 5) Date and Time of collection. 6) Matrix type. 7) Preservation type: Including chemical preservation as well as thermal preservation.
Environmental samples require thermal preservation and the temperature requirement for shipment/storage is 0.1-6ºC.
8) Total number of containers. 9) Requested analyses or reference to quote or other documentation specifying analysis. 10) Turn Around Time. 11) Special remarks: Includes any additional sample analysis requirements such as reporting limits, if
the samples are considered hazardous or contaminated, etc. 12) Signatures including date/time of all persons who have handled or possessed the samples. 13) If applicable, Purchase Order number, quote or other billing information.
Sampling/Container Requirements:
1) All samples must be labeled properly with unique identification in indelible ink, on water-resistant labels and correspond with the information on the COC. Date and time of sampling and preservation type should also be present on the label. Deviations between the sample number on the COC and sample containers will be noted on the sample receipt checklist.
2) All samples must be received in appropriate containers required by the analytical test methods and be received in good condition without any signs of damage or contamination. If the sampler suspects the outside of the container has been contaminated, it is imperative to notify the laboratory so that appropriate action can be taken to prevent cross contamination of samples.
3) Containers must have sufficient sample volume for analysis, with proper preservation. If QC is required (MS/MSD), additional sample must be submitted. Chemical preservation (pH) is checked at log in or by the analyst. Insufficient volume and improper preservation will be noted on the sample receipt checklist. Please see attachment for container and volume requirements.
4) All samples should be received within the analytical test method specified holding times. Hold time violations will be noted in the analytical report. For analysis with short hold time, please submit the sample with adequate time for analysis and notify your project manager when the sample will be arriving.
If a sample must be analyzed on a rush basis in order to meet hold time, additional rush surcharges may be applied.
NOTE: Sample containers provided by STAT Analysis may contain small amounts of chemical preservatives as required by the analytical test method and labeled as such. Please take necessary precautions when using these sample bottles. Be sure to cap bottles tightly before shipment. When shipping samples to STAT Analysis:
QA 001 Quality Assurance Manual Revision 14
November 15, 2013 Page 83 of 93
\\Harrison\D\Quality Control\SOPs & QAM\Quality Assurance Manual\QA 001 QA MANUAL Rev 14.doc

Analysis Corporation
STAT
1) Enclose completed COC form in sealed zip-lock bag in order to prevent water damage from melting ice.
2) Ensure that the sample cooler is sealed properly with tape to avoid opening while in transit. 3) Ensure that there is enough ice or cooling material (ice is preferred over ‘Blue Ice’) in order to
maintain required temperature preservation (0.1-6ºC). Samples received out of temperature compliance will be noted on the COC or sample receipt checklist.
4) Ensure that there is enough packing material in cooler to prevent damage to sample containers while in transit. Fill empty space in the cooler with bubble wrap or other packing material.
5) Be sure that samples containers are properly sealed so that water from melting ice does not enter the sample container. Shipping sample containers in sealed zip-lock bags can help prevent this.
6) Use extra packing material when shipping water samples. It is best to individually wrap glass water containers with bubble wrap or packing paper and then place in zip-lock bags.
NOTE: Samples that do not meet the above criteria will be flagged in an unambiguous manner defining the nature and substance of the variation. This will be noted on the final report.
QA 001 Quality Assurance Manual Revision 14
November 15, 2013 Page 84 of 93
\\Harrison\D\Quality Control\SOPs & QAM\Quality Assurance Manual\QA 001 QA MANUAL Rev 14.doc

Analysis Corporation
STAT
Appendix 7 Ethics Policy and Data Integrity Agreement
Ethics Policy and Data Integrity Agreement
It is STAT Analysis Corporation’s responsibility to produce data that is scientifically valid, defensible, and of known and documented quality in accordance with all applicable federal, State, and local laws and regulations consistent with accepted professional and analytical practices in a manner that justifies the public trust. STAT Analysis Corporation conducts all business with integrity and in an ethical manner. It is the responsibility of each staff member, manager, director, and owner to perform their duties with the highest ethical standards and professional conduct to ensure compliance with this Quality Manual and related documentation. The STAT Analysis Corporation laboratory has a Quality Assurance Manual designed to insure that work performed in the laboratory is accurate, precise, complete, comprehensive, reproducible and reflects the need of the customer/client while satisfying the requirements of appropriate State and Federal regulations. STAT Analysis Corporation will not offer any analysis for which we cannot demonstrate consistent quality and defensible analyses. Any allegation of misconduct will be promptly investigated in an unbiased and confidential manner by an investigative team designated by the President/CEO. The investigation including any supporting documentation, actions and resolution will be recorded and archived by the QA Manager. I. I understand the high standards of integrity required of me with regard to the duties I perform and
the data I report in connection with my employment at STAT Analysis Corporation. II. I state that I am free from any commercial, financial or other pressures and do not have any
conflicts of interests, which might adversely affect my duties at STAT Analysis Corporation. Laboratory analysts will not have any direct customer contact except with the approval of laboratory management, this includes but is not limited to telephone calls, emails, facsimiles, audits, etc.
III. I agree that in the performance of my duties at STAT Analysis Corporation:
a. I agree to read, understand, sign and comply with all the policies and procedures detailed in the latest revisions of the Quality Assurance Plan and SOPs at all times;
b. I will not intentionally report data that are not the actual values obtained without collaborating data acceptable to the laboratory’s Standard Operating Procedures. All modifications will be properly documented;
c. I will not invent data (dry lab) this includes raw data, support equipment calibrations; quantitative reports, LIMS etc.
d. I will not adjust the area of a peak in chromatography to bypass QC criteria (peak shaving or adding);
e. I shall not intentionally report the dates and times of data analyses that are not the actual dates and times of data analyses (time traveling);
f. I shall not intentionally represent another individual’s work as my own; g. I understand that if my job includes supervisory responsibilities, I shall not instruct, request,
or direct any subordinate to perform any laboratory practice, which is unethical or improper.
QA 001 Quality Assurance Manual Revision 14
November 15, 2013 Page 85 of 93
\\Harrison\D\Quality Control\SOPs & QAM\Quality Assurance Manual\QA 001 QA MANUAL Rev 14.doc

Analysis Corporation
STAT
IV. I will not compare or disclose results for any Performance Testing (PT) sample, or other similar QA or QC requirements, with any employee of any other laboratory, prior to the required submission date of the results to the person, organization, or entity supplying the PT sample.
V. I will not divulge customer names or their results outside of the company except to those parties
designated as an approved customer representative. VI. I agree to inform STAT Analysis Corporation of any accidental or intentional reporting of non-
authentic data by other employees or by myself in a timely manner. I understand that if any manager or representative of management instructs, requests, or directs me to perform any of the aforementioned improper laboratory practices (I – V), or if I am in doubt or uncertain as to whether or not such laboratory practices are proper, I will not comply, but I must immediately report such event to all appropriate members of management including my manager, the Laboratory Director, the QA Manager and President/CEO, excluding such individuals who participated in such perceived improper instruction, request, or directive.
I understand that failure to follow company policies and procedures, and failure to follow federal, State and local law, may result in discipline, up to and including termination. If I have knowledge of a non-compliant incident and do not report it, I will be subject to disciplinary measures up to and including termination. If I retaliate or in any way punished another employee for reporting a violation, I will be subject to discipline, up to and including termination.
____________________________________________________________________________ (Employee’s Signature) (Dated) ____________________________________________________________________________ (Print Name) ____________________________________________________________________________ (Witness Signature) (Dated) ____________________________________________________________________________ (Print Name) NOTE: This Ethics Policy/Data Integrity Agreement must be signed at the time of hire and re-signed between January 1 and January 15 of every year. Such signature is a condition of continued employment and failure to sign will result in immediate termination of employment.
QA 001 Quality Assurance Manual Revision 14
November 15, 2013 Page 86 of 93
\\Harrison\D\Quality Control\SOPs & QAM\Quality Assurance Manual\QA 001 QA MANUAL Rev 14.doc
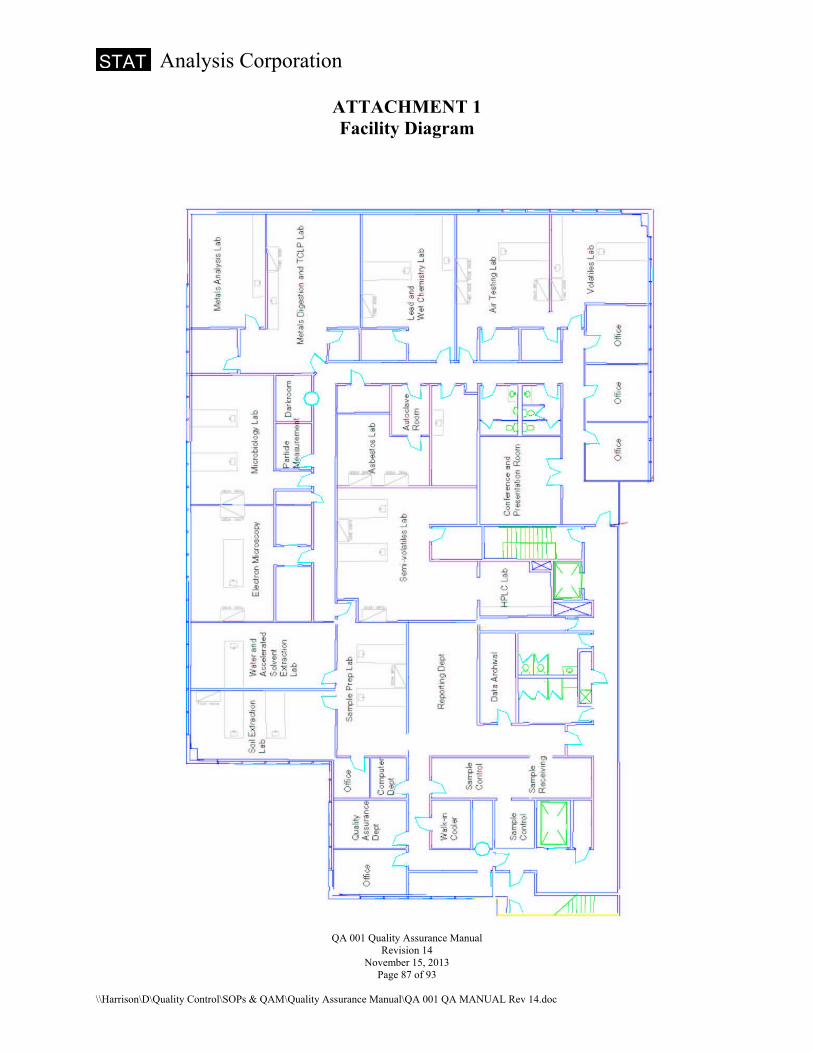
Analysis Corporation
STAT
ATTACHMENT 1 Facility Diagram
QA 001 Quality Assurance Manual Revision 14
November 15, 2013 Page 87 of 93
\\Harrison\D\Quality Control\SOPs & QAM\Quality Assurance Manual\QA 001 QA MANUAL Rev 14.doc

Analysis Corporation
STAT
ATTACHMENT 2
Example Chain of Custody for NELAC Samples
QA 001 Quality Assurance Manual Revision 14
November 15, 2013 Page 88 of 93
\\Harrison\D\Quality Control\SOPs & QAM\Quality Assurance Manual\QA 001 QA MANUAL Rev 14.doc

Analysis Corporation
STAT
ATTACHMENT 3 Example Chain of Custody for Pb AIHA Samples
QA 001 Quality Assurance Manual Revision 14
November 15, 2013 Page 89 of 93
\\Harrison\D\Quality Control\SOPs & QAM\Quality Assurance Manual\QA 001 QA MANUAL Rev 14.doc

Analysis Corporation
STAT
ATTACHMENT 4 Example Chain of Custody for Asbestos Samples
QA 001 Quality Assurance Manual Revision 14
November 15, 2013 Page 90 of 93
\\Harrison\D\Quality Control\SOPs & QAM\Quality Assurance Manual\QA 001 QA MANUAL Rev 14.doc

Analysis Corporation
STAT
ATTACHMENT 5
Microbiology Chain of Custody
QA 001 Quality Assurance Manual Revision 14
November 15, 2013 Page 91 of 93
\\Harrison\D\Quality Control\SOPs & QAM\Quality Assurance Manual\QA 001 QA MANUAL Rev 14.doc

Analysis Corporation
STAT
Attachment 6 Example of Notice of Confidentiality for E-mail
QA 001 Quality Assurance Manual Revision 14
November 15, 2013 Page 92 of 93
\\Harrison\D\Quality Control\SOPs & QAM\Quality Assurance Manual\QA 001 QA MANUAL Rev 14.doc

Analysis Corporation
QA 001 Quality Assurance Manual Revision 14
November 15, 2013 Page 93 of 93
\\Harrison\D\Quality Control\SOPs & QAM\Quality Assurance Manual\QA 001 QA MANUAL Rev 14.doc
STAT
Attachment 7 Example of Notice of Confidentiality for Facsimiles

Filename: u:\methods\sops\conv\436.3 tkn skalar.doc Date Revised: 01/20/14 Revision No.: 3 Page 1 of 14
First Environmental Laboratories
Standard Operating Procedure
Title: Total Kjeldahl Nitrogen (TKN) – Block Digestion with Semi-Automated Skalar Regulatory References: EPA 600/4-79-020, Method 351.2 R.2.0. (1993) Matrices: aqueous (wastewater and ground water), non-aqueous liquid, solids(soil/sediment), chemical wastes Regulatory Limits: NA Sample Collection, Preservation, Shipment, and Storage Sample Collection: All samples shall be collected using an appropriate sampling plan and properly preserved containers. The volume collected should be sufficient to insure a representative sample, allow for replicate analysis (if required), and minimize waste disposal. All samples should be held at 4oC until time of analysis. Preservation: pH <2 using H2SO4, all samples should be held at 4oC until time of analysis. Shipment: Samples should be shipped in a manner permitting continuation of storage at 4oC. Storage: Samples are stored prior to analysis at 4oC. Container: 250 cc plastic for aqueous samples or 4oz jar for solid samples Single Analysis Sample Volume: 25 mL or 2g Holding Time: 28 days (Range) Reporting Limit - Upper End: 1.0 mg/L – 10.0 mg/L Note: The range can be extended by diluting the sample Summary of Method: Samples are digested in a block digestor with sulfuric acid and copper sulfate as a catalyst. The digestion recovers nitrogen components of biological origin, such as amino acids, proteins, and peptides, as ammonia, but may not recover the nitrogenous compounds of some industrial wastes. Nitrate is not recovered. The digested sample is injected onto the automated flow injection analyzer where its pH is controlled by raising it to a known, basic pH by neutralization with a concentrated buffer. This in-line neutralization converts the ammonium cation to ammonia, and also prevents undue influence of the sulfuric acid matrix on the pH-sensitive color reaction. The color reaction of the automated procedure for the determination of Total Nitrogen is based on the modified Berthelot reaction; ammonia is chlorinated to monochloramine which reacts with salicylate to 5-aminosalicylate. After oxidation and oxidative coupling a green colored complex is formed. The reaction is catalyzed by nitroprusside, sodium hypochlorite is used for chlorine donation. The absorption of the formed complex is measured at 660 nm.
First Environmental Laboratories, Inc.

Filename: u:\methods\sops\conv\436.3 tkn skalar.doc Date Revised: 01/20/14 Revision No.: 3 Page 2 of 14 1. Instrumentation / Apparatus / Glassware 1.1. SA 5640 Block Digester with Controller 1.2. SA 5395 75 mL Digester Tubes 1.3. Hengar Granules for smooth boiling, non-selenized 1.4. SA 4000-01 Sans++ Analyzer 1.5. SA 1074 Random Access Auto Sampler 1.6. The Skalar Sans++ custom method designed for this instrument details cartridge components and consumables. Part numbers for consumables can be found in the catalog titled, “The Skalar Continuous Flow Analyzers Components and Accessories Booklet.” 1.7. SA1033 Disposable sample tubes, 10mL 1.8. Analytical balance capable of accurately weighing 0.0001g 1.9. Top loading balance capable of accurately weighing 0.1g 1.10. Maintenance is performed in accordance with procedures documented in the appropriate maintenance log book / file. 2. Reagents All reagents should be prepared from reagent grade materials using deionized water and volumetric glassware. 2.1. Digestion Solution: Dissolve 134 grams of potassium sulfate and 7.3 grams of cupric sulfate into 500 mL of DI water. Slowly add 134 mL of conc. H2SO4. Let cool and dilute volumetrically to 1 liter. Expiration Date: 1 month NFPA Diamond Safety Information for Sulfuric Acid (H2SO4): Health (blue) 3 / Reactivity (yellow) 2 /Hazard (white) no-water 2.2. Sodium Chloride Solution: Dilute 2 mL of FFD6 into a 1L volumetric flask with DI water. Mix. Expiration Date: 1 week (FFD6 is purchased from Skalar Analytical / Catalog #13908) 2.3. Stock Potassium Sodium Tartrate Solution: Dissolve 200 grams of potassium sodium tartrate (C4H4O6KNa – 4H2O) into 800 mL DI water. Dilute volumetrically to 1 liter. Expiration Date: 1 month 2.4. Stock Buffer Solution: Dissolve 134 grams of di-sodium hydrogen phoshate (Na2HPO4) into 800 mL of DI water. Add 20 grams of sodium hydroxide (NaOH). Dilute volumetrically to 1 liter. Expiration Date: 1 month NFPA Diamond Safety Information for Sodium Hydroxide (NaOH): Health (blue) 3 / Reactivity (yellow) 1 2.5. Sodium Hydroxide (5M): Dissolve 200 grams of sodium hydroxide (NaOH) into 800 mL of DI water. Dilute volumetrically to 1 liter. Expiration Date: 1 year NFPA Diamond Safety Information for Sodium Hydroxide (NaOH): Health (blue) 3 / Reactivity (yellow) 1
First Environmental Laboratories, Inc.

Filename: u:\methods\sops\conv\436.3 tkn skalar.doc Date Revised: 01/20/14 Revision No.: 3 Page 3 of 14 2.6. Buffer Solution: Mix 250 mL of Stock Potassium Sodium Tartrate Solution and 200 mL of Stock Buffer Solution into 200 mL of DI water. Add 110 mL of Sodium Hydroxide (5M) and mix. Dilute volumetrically to 1 liter. Expiration Date: 1 week NFPA Diamond Safety Information for Sodium Hydroxide (NaOH): Health (blue) 3 / Reactivity (yellow) 1 2.7. Salicylate-Nitroprusside Solution: Disslove 150 grams of sodium salicylate (C7H5NaO3) and 0.3 grams of sodium nitroprusside (Na[Fe(CN)5NO]2H2O) into 800 mL DI water. Dilute volumetrically to 1 liter. Expiration Date: 1 week 2.8. Hypochlorite Solution (5%): Purchased. Expiration Date: per manufacturer’sinstructions. NFPA Diamond Safety Information for Hypochlorite Solutions: Health (blue) 2 2.9. Hypochlorite Solution: Dilute 18.0 mL of sodium hypochlorite solution (5%) into 80 mL of DI water. Dilute volumetrically to 250mL. Expiration Date: 3 days 2.10. Rinsing Liquid: Dilute 400 mL of digestion solution into 600 mL of DI water. Dilute volumetrically to 1 liter. Expiration Date: 1 week NFPA Diamond Safety Information for Sulfuric Acid (H2SO4): Health (blue) 3 / Reactivity (yellow) 2 /Hazard (white) no-water 3. Standards All reference standards, purchased stock, purchased neat solutions, all intermediate solutions, and all working standards used more than one day, must be traceable to their source and method of preparation. Log books are kept documenting the preparation of standards from the “mother” source. Each reference, stock, intermediate and multiple use working standard is assigned a unique number and entered into the appropriate Standards Tracking Log. This unique number will also be applied to the label and the calibration certificate. The calibration certificate documents the traceability to national standards of measurement and is retained for reference. 3.1. 1,000 mg/L Total Nitrogen Stock Standard: Purchased as a prepared reagent. Expiration date: per manufacturer’s labeling. Source: ERA Catalog No. 985 Note: Ammonia Nitrogen is the stock used for Total Kjeldahl Nitrogen 3.2. 2,4,6,8,10 mg/L Total Kjeldahl Nitrogen Stock Standard for Calibration Curve: Add 0.2,0.4,0.6,0.8,1.0 mL of 1000 mg/L Total Kjeldahl Nitrogen stock to 60 mL of DI water + 40 mL of digestion solution. Expiration Date: 1 day 3.3. 1,000 mg/L Total Kjeldahl Nitrogen Second Source Stock Standard: Dissolve 3.819g of anhydrous ammonium chloride (NH4Cl), dried at 1050C for 2 hours, in DI water and dilute to 1 liter volumetrically. Expiration date: one year. 3.4. 5.0 mg/L CCVS: Add 0.500 mL of 1,000 mg/L second source stock to 60 mL of DI water + 40 mL of digestion solution. Expiration date: I month. 3.5. 1.0 mg/L Reporting Limit Verification Standard (RLVS): Add 100 uL of 1000 mg/L second source stock to 60 mL of DI water + 40 mL of digestion solution. Expiration date: I month.
First Environmental Laboratories, Inc.

Filename: u:\methods\sops\conv\436.3 tkn skalar.doc Date Revised: 01/20/14 Revision No.: 3 Page 4 of 14 3.6. Procedure Blank (PB): Add 25mL of DI water into 75 mL digester tube. Required to be processed with samples through digestion. 3.7. 10.0 mg/L Laboratory Control Sample (LCS): Add 0.250 mL of 1000 mg/L second source stock to 25 mL of DI water into 75 mL digester tube. Required to be processed with samples through digestion. 3.8. To Spike the Sample: Add 100 ul of 1000 mg/L second source stock to 25 ml of sample. The sample is now spiked with 1.0 mg/L of Total Kjeldahl Nitrogen. 3.9. Recommended source for PE samples is ERA or equivalent. 4. Analytical Procedure 4.1. Interferences 4.1.1. High nitrate concentrations (10x or more than the TKN level) result in low TKN values. If interference is suspected, samples should be diluted and reanalyzed. 4.1.2. Method interferences may be caused by contaminants in the reagent water, reagents, glassware, and other sample processing apparatus that bias the analyte response high. 4.2. Digestion Procedure 4.2.1. Wash all digester tubes in hot soapy water and rinse three times with DI water. Even glassware that has been washed the night before can pick up contaminants over night. All glassware must be washed and rinsed immediately prior to usage to avoid such contaminants. 4.2.2. Pipet 25 mL of sample into digester tubes. For soils and sludge use 0.5g to 25 mL of DI water. Add 3-4 boiling chips. 4.2.3. Pipet 10 mL of digestion solution into each digester tube. 4.2.4. Place digester tubes into digestion block and turn power on. 4.2.5. Press the start button on digestion block. Samples will digest for 1 hour at approximately 140oC. Then, the samples will digest for 1 hour at approximately 170oC. At this point, most of the water will be boiled off. Then finally, the samples will digest for 2.5 hours at approximately 380oC. The digestion block control panel will control all the temperature changes at the appropriate set times. 4.2.6. When the samples are finished digesting the unit will beep. Turn the power off and carefully take out the digester tubes and place in a cooling rack. The tubes will be very hot so where oven mitts. Be sure to let the samples cool off under the hood. 4.2.7. Ten minutes after the samples have been cooled, dilute with approximately 15-20 mL of DI water. Vortex mix each tube. This is very critical because the sample will harden on the bottom of the tube if water is added too late.
First Environmental Laboratories, Inc.

Filename: u:\methods\sops\conv\436.3 tkn skalar.doc Date Revised: 01/20/14 Revision No.: 3 Page 5 of 14 4.2.8. Dilute to a 25 mL volume, using a graduated cylinder. The samples are now ready to be analyzed on the instrument. If the samples are not going to be analyzed immediately, place a rubber stopper on each digester tube and store samples at 4oC. 4.3. Determinative Procedure 4.3.1. Filter all turbid samples through a glass micro fiber filter paper before pouring into sample tubes. 4.3.2. A calibration curve is analyzed each day samples are analyzed. 4.3.3. An aliquot of rinsing solution processed through the analyzer serves as the reagent/calibration blank and monitors the reagents for contamination. Frequency: daily at the beginning of the run, every ten samples throughout the run, and at the end of the run. 4.3.4. An aliquot of 5.0 mg/L CCVS processed through the analyzer monitors the performance of the determinative procedure. Frequency: daily at the beginning of the run, every ten samples throughout the run, and at the end of the run. 4.3.5. A reporting limit standard of 1.0 mg/L processed through the analyzer monitors the performance of the determinative procedure. Frequency: daily at the beginning of the run. 4.3.6. An aliquot of PB processed through the colorimetric analysis monitors the performance of the digestion procedure. Frequency: one per every 20 samples. 4.3.7. An aliquot of 10.0 mg/L LCS processed through the colorimetric analysis monitors the performance of the alkaline digestion procedure. Frequency: one per every 20 samples. 4.3.8. Duplicate spiked aliquots of sample (MS/MSD) monitor the precision and accuracy of the procedure for a specific matrix. Frequency: 1/10 samples or less of the same matrix. See Section 3.8. for instructions on how to spike the sample. 4.3.9. General Description of Procedure See bench reference for start up procedures for more detailed instructions. • After samples are poured up turn on computer, interface, and auto sampler. • Open Flow Access software. • Use remote control icon to open valves, start pumps, and turn on detector lamps. • Open raw data viewer in order to see when baseline stabilizes. • Set up sample table definition. • Check dilution range. • If running overnight, enable time program shut down with correct day of run. • Start analysis.
First Environmental Laboratories, Inc.

Filename: u:\methods\sops\conv\436.3 tkn skalar.doc Date Revised: 01/20/14 Revision No.: 3 Page 6 of 14 • Check to see the curve is in correct calibration after the calibration curve peaks are shown on the raw data
viewer. 4.3. Calculation The calculation module automatically calculates the concentration of the samples in mg/L. The analyst must calculate any predilution factors. Autodilutions are included in the calculations performed by the instrument. 4.4. Reporting Limits 4.4.1. The routine reporting limit for an aqueous sample is 1.0 mg/L. The routine reporting limit for a solid sample is 25 mg/kg. 4.4.2. Reporting limits are normally 3-10 times the method detection limit. During method validation, regulatory criteria are also compared to the proposed reporting limit to ensure that the reporting limit meets the regulatory criteria. Refer to the SOP titled, “Method Detection Limit” (#109) for details regarding the determination of the method detection limit.
First Environmental Laboratories, Inc.

Filename: u:\methods\sops\conv\436.3 tkn skalar.doc Date Revised: 01/20/14 Revision No.: 3 Page 7 of 14 5. Quality Control Indicator Assessment 5.1. Each quality control indicator (QCI) must be assessed for compliance with the following criterion on a real time basis. When applicable, the percent recovery and/or the relative percent difference (RPD) is also recorded on the raw data/lab book form.
Quality Control Indicator (QCI)
Frequency Acceptance Criteria (Specification or Statistical
Requirement)
Initial Corrective Action Final Action / Data Qualification
Method Detection Limit Study (MDL)
See MDL SOP #109 for details
See QC Table Notes 1
Initial method validation and each time there is a significant change in the test method that affects how the test is performed. or when a change in instrumentation occurs that affects the sensitivity of the analysis, provided the reporting limit is equal to the low standard in the calibration curve, or a reporting limit verification standard is run daily.
The calculated MDL must be greater than 1/10th the MDL spiking concentration and greater than “0”, and the MDL spiking concentration must be greater than the calculated MDL. Minimum of 7 replicates.
Re-analyze and re-process MDL for analytes that fail to meet acceptance criteria.
Do not report results below the MDL.
Initial Demonstration of Capability (IDC)
See IDC/IDMP SOP #106 for details
Initial method validation and each time there is a significant change in the instrumentation, personnel, matrix or test method that affects the sensitivity of the analysis.
The source and concentration of IDC may vary depending on the purpose of the study. %R = 80-120
Re-analyze and re-process IDC for analytes that fail to meet acceptance criteria.
IDC/IDMP criteria must be met prior to sample analysis.
Calibration Curve See Calibration Curves
Inorganic #102 for details and validation file for historic performance
Daily at the beginning of every new run.
cc = 0.995, back calculation of percent recovery within 10% of true value
Identify problem(s) and re-analyze the calibration curve.
Sample analysis must not begin until criteria are met.
Initial Calibration Verification (2nd source)
Immediately following the curve +10% or within stated limits as supplied by manufacturer (95% confidence limit)
Re-evaluate the calibration curve to verify that all criteria have been met.
Data can only be released for analytes that have passed the ICVS criteria.
First Environmental Laboratories, Inc.

Filename: u:\methods\sops\conv\436.3 tkn skalar.doc Date Revised: 01/20/14 Revision No.: 3 Page 8 of 14
Reagent Blank / Continuing Calibration
Blanks
Daily at the beginning, end, and after every 10th samples
Less than the reporting limit. If RB/CCB and samples have concentrations >RL, then the RB/CCB <10% of the sample concentration.
Check for contamination problems and/or instrument drift. Re -run the CCB and evaluate the sample results with respect to the CCB. Reanalyze samples as determined by this evaluation.
The data may be reported with the appropriate data qualifier. Flag samples that have analyte concentrations less than 10 times the concentration found in the applicable blank.
Continuing Calibration Standard (CCVS) -
concentration middle of range
Daily at the beginning, end, and after every 10th samples
Specification: + 10% Statistical Control: 3 standard deviations for the control limit and 2 standard deviations for the warning limit
Re-run the CCVS and evaluate the sample results with respect to the CCVS result. Reanalyze samples as determined by this evaluation.
Data can only be released for analytes that have passed the CCVS criteria.
Reporting Limit Verification Standard - concentration equaling
the reporting limit
Daily at the beginning @ a concentration equaling the reporting limit
Specification: + 25 Re-run the RLVS and evaluate the sample results with respect to the RLVS. Reanalyze samples as determined by this evaluation.
Results for positive samples can be reported. Results of non-detect samples need to be documented in the case narrative prepared by the analyst and included in the project file
Procedure Blank (PB) (or Method Blank) See Table Notes 3
Per batch See Table Note 4
Less than the reporting limit. If PB and samples have concentrations >RL, then the PB must be <10% of the sample concentration.
Check for contamination problems. Evaluate the sample results with respect to the PB. Reanalyze samples as determined by this evaluation.
If samples are not reprocessed, the data may be reported with the appropriate data qualifier. Flag samples that have analyte concentrations less than 10 times the concentration found in the applicable blank.
Laboratory Control Standard (LCS) -
concentration upper end of range
Per batch See Table Note 4
Specification: + 20% Statistical Control: 3 standard deviations for the control limit and 2 standard deviations for the warning limit
Determine cause of problem and re-prepare and re-analyze the affected samples.
Results of analytes failing to meet acceptance criteria need to be documented in the case narrative prepared by the analyst and included in the project file.
First Environmental Laboratories, Inc.

Filename: u:\methods\sops\conv\436.3 tkn skalar.doc Date Revised: 01/20/14 Revision No.: 3 Page 9 of 14
Matrix Spike / Matrix Spike Duplicate
(MS/MSD) - concentration 20 to 50
percent of range See Table Note 5
Per batch Selection of sample for MS/MSD is arbitrary See Table Note 4
Specification: +10% Recovery and RPD 20 Statistical Control: 3 standard deviations for the control limit and 2 standard deviation for the warning limit
Evaluate the LCS with respect to the MS/MSD. If the LCS was acceptable, evaluate sample for matrix interferences. Examine the sample for homogeneity. Evaluate the spike concentration vs. native analyte concentration. If the concentration of analyte is >4x the spike concentration, then the spiking level is insignificant to the sample. Evaluate the sample for the presence of interferences by re-analyzing the sample and the MS at a dilution. Acceptable spike recovery indicates the presence of interference.
The information from the MS/MSD is sample/matrix specific and is not normally used to determine the validity of an entire batch. No action is taken on out of control MS/MSD data alone to qualify an entire batch
QC Table Notes:
1. Detection Limit
• Detection limit shall be initially determined for the compounds of interest in each test method in a matrix in which there are not target analytes nor interferences at a concentration that would impact the results or the detection limit must be determined in the matrix of interest.
• Detection limits must be determined each time there is a change in the test method that affects how the test is performed, or when a change in instrumentation occurs that affects the sensitivity of the analysis.
• All sample processing steps of the analytical method shall be included in the determination of the detection limit.
2. If a QCI fails to meet accept criteria, the analyst will prepare a case narrative documenting the failure and the associated decisions regarding reanalysis vs. acceptance of the data. The case narrative will be added to the project file. Project management will review case narratives during the preparation of the final report and make final decisions regarding data flagging requirements.
3. Definition of Method Blank: (per NELAC Glossary 2002 Standard) a sample of a matrix similar to the batch of associated samples (when available) that is free from the analytes of interest and is processed simultaneously with and under the same conditions as samples through all steps of the analytical procedures, and in which no target analytes or interferences are present at concentration that impact the analytical results for sample analyses. Synonymous with procedure blank (PB).
4. Definition of Batch: (per NELAC Glossary 2002 Standard) environmental samples that are prepared and/or analyzed together with the same process and personnel, using the same lot(s) of reagents. A preparation batch is composed of one to 20 environmental samples of the same NELAC-defined matrix, meeting the above mentioned criteria and with a maximum time between the start of processing of the first and last sample in the batch to be 24 hours. An analytical batch is composed of prepared environmental samples (extracts,
First Environmental Laboratories, Inc.

Filename: u:\methods\sops\conv\436.3 tkn skalar.doc Date Revised: 01/20/14 Revision No.: 3 Page 10 of 14 digestates or concentrates) which are analyzed together as a group. An analytical batch can include prepared samples originating from various environmental matrices and can exceed 20 samples.
5. Definition of Matrix: (per NELAC Glossary 2002 Standard) the substrate of a test sample.
• Aqueous: any aqueous sample excluded from the definition of Drinking Water matrix or Saline/Estuarine source. Includes surface water, groundwater, effluents, and TCLP or other extracts.
• Drinking Water: any aqueous sample that has been designated a potable or potential potable water source.
• Solids: includes soils, sediments, sludges, and other matrices with >15% settleable solids.
• Chemical Waste: a product or by-product of an industrial process that results in a matrix not previously defined.
Analyte Concentration Standard 1
mg/L
Concentration Standard 2
mg/L
Concentration Standard 3
mg/L
Concentration Standard 4
mg/L
Concentration Standard 5
mg/L TKN 2.00mg/L 4.00mg/L 6.00mg/L 8.00mg/L 10.00mg/L
First Environmental Laboratories, Inc.

Filename: u:\methods\sops\conv\436.3 tkn skalar.doc Date Revised: 01/20/14 Revision No.: 3 Page 11 of 14 5.2. Method Performance 5.2.1. Method performance data can be found in EPA 600/R-93/100, Method 351.2 Section 13.0. Internal performance data will be collected in accordance with SOP #112, “Statistical Control”. 5.2.2. Prior to the use of this method on analytical samples, the method must be validated with an Initial Demonstration of Method Performance (IDMP) (also known as an Initial Demonstration of Capability (IDC)) and a Method Detection Limit Study (MDL). The IDMP and MDL requirements are summarized in section Table 5 of this SOP. The determinative procedure in this SOP must be used for the associated IDMP and MDL. The IDMP and MDL are detailed in SOP #106 and #109 respectively. 5.2.3. Refer to SOP #129, “Summary of Quality Control Indicators – Inorganics & Organics” for additional information regarding QCIs. Note: this is a training document, therefore, if information in this document conflicts with information in the method SOP, the method SOP takes precedence. 6. Notes 6.1. Tips and Hints 6.1.1. See historical data to make dilutions ahead of time. This prevents the calibration from being thrown off due to highly contaminated samples. 6.1.2. The autoanalyzer will re-analyze the sample following a sample that required a dilution. This procedure allows the analyst to check for carry-over. 6.1.3. Sentry File is used for storage of all data. Scan the data on the copier and then upload it into the proper cabinet in Sentry file. 6.1.4. Standard Methods for the Examination of Water and Wastewater, Standard Methods, 21st Edition, Method 4500 Norg–D, Block Digestion and Flow Injection Analysis Standard Methods, 22nd Edition, Method 4500 Norg–D, Block Digestion and Flow Injection Analysis 7. Definitions Where appropriate, definitions have been provided in this SOP. If additional clarification is required, refer Section 20 of the Quality Assurance Manual. 8. Safety The toxicity or carcinogenicity of each reagent used in this method have not been fully established. Each chemical should be regarded as a potential health hazard and exposure to these compounds should be as low as reasonably achievable. Material Safety Data Sheets (MSDS) are available for review. All reagents should be appropriately labeled. Always wear safety glasses for eye protection, protective clothing and observe proper mixing when working with chemicals and potentially hazardous samples. Additional information can be found in the laboratories’ Chemical Hygiene Plan. Copies of specific MSDS can be obtained from various websites on an as needed basis.
First Environmental Laboratories, Inc.

Filename: u:\methods\sops\conv\436.3 tkn skalar.doc Date Revised: 01/20/14 Revision No.: 3 Page 12 of 14 9. Pollution Prevention Pollution prevention is defined in EPA documents as any technique that reduces or eliminates the quantity or toxicity of waste at the point of generation. First Environmental Laboratories, Inc. uses reduced volume procedures, where feasible, in order to comply with EPA guidance. The laboratory continuously assesses new technology that assists in the reduction or elimination of waste. 10. Waste Management The analysis of samples inevitably produces various wastes. When possible, First Environmental Laboratories, Inc. minimizes all releases from hoods and bench operations. Wastes, which cannot be neutralized or made innocuous, are collected and disposed of in an appropriate manner. Additional information can be found in the laboratories’ Chemical Hygiene Plan, SOP #901, “Sample Disposal,” and SOP #902, “Waste Disposal.” 11. References The analyst is required to have read and understood various supporting documents including regulatory method references, First Environmental’s Quality Assurance Manual, First Environmental’s Chemical Hygiene Plan, and non-method SOPs that support QA activities.
SOP #102, “Calibration Curves – Inorganics.” Note: this is a training document, therefore, if information in this document conflicts with information in the method SOPs, the method SOP takes precedence.
SOP #129, “Summary of Quality Control Indicators – Inorganics and Organics.” Note: this is a training document, therefore, if information in this document conflicts with information in the method SOP, the method SOP takes precedence.
SOP #106, “Initial Demonstration of Capability / Initial Demonstration of Method Performance.”
SOP #109, “Method Detection Limits.”
SOP #112, “Statistical Control.”
SOP #118, “Measurement Traceability & Calibration.”
SOP #123, “Sample Instructions & Materials.”
SOP #901, “Sample Disposal”
SOP #902, “Waste Disposal”
First Environmental’s Quality Assurance Manual
First Environmental’s Chemical Hygiene Plan
“Method of Soil Analysis”, 2nd Edition, American society of Agronomy/Soil Science Society of America.
Skalar Method Bench Reference
First Environmental Laboratories, Inc.

Filename: u:\methods\sops\conv\436.3 tkn skalar.doc Date Revised: 01/20/14 Revision No.: 3 Page 13 of 14 12. Approvals
Reviewed for Technical Accuracy by: Joy Geraci
Reviewed for Quality Assurance Compliance by: Lorrie Walker Implementation Date: 01/20/14 End Use Date:__________________
First Environmental Laboratories, Inc.

Filename: u:\methods\sops\conv\436.3 tkn skalar.doc Date Revised: 01/20/14 Revision No.: 3 Page 14 of 14 Appendix to Automated Methods Ammonia Method 350.1R2.0 Chloride Method 4500 Cl-E Cyanide Method 335.4R1.0 Nitrate Method 353.2R2.0 Phenol Method 5330B,C Sulfate Method 375.2R2.0 TOC Method 5310C TKN Method 351.2R2.0 CAR to IEPA on site audit conducted August 13-15, 2008 Automated Nitrate (Skalar) 353.2 #7. Finding: For the method 353.2 (nitrate) SOP there is no mention of the linear dynamic range (LDR) that is required in the test method. Need to perform and document an initial LDR and verify every six months. Need to retain record of initial LDR and verifications. The assessor suggests performing the initial LCR (i.e., expanded calibration curve over entire linear range) and then every six months compare response of current calibration curve points or highest point to the LCR. If response of standard(s) is within +10% agreement then acceptable. Response: A curve is performed each time a run is initiated; the acceptance criteria for the correlation coefficient must be 0.995 or better. It is verified using a second source standard at the mid-range of the curve; the acceptance criteria is + 10% of the true value. If the low standard in the curve is greater than the reporting limit, a standard at the reporting limit is also analyzed. If samples exceed the high standard, they are diluted to fall within the range of analysis and re-analyzed. The linear range for the analysis was established during initial method validation based upon the method procedures and information provided by Skalar. Their information is based on knowledge of the chemistry and instrument performance AND the desired sensitivity for the procedure. Extending the curve would potentially degrade the reporting limit. All the controls and documentation is in place on a per run basis proving that that analysis of samples is valid. An LDR analysis will NOT be run every 6 months. CAR was accepted via e-mail on 10/06/08. See attached.
Reviewed for Technical Accuracy by: Joy Geraci
Reviewed for Quality Assurance Compliance by: Lorrie Franklin Implementation Date: 10/07/08 End Use Date: _____________________
First Environmental Laboratories, Inc.

Analysis Corporation
SOP 4250 Ammonia Analysis Revision 00
Effective Date: November 26, 2008 Page 2 of 28
STAT
Table of Contents Title Page ...................................................................................................................................1 Table of Contents.......................................................................................................................2 1. Identification of Test Methods .......................................................................................3 2. Applicable Matrix or Matrices .......................................................................................3 3. Detection Limits.............................................................................................................3 4. Scope and Application...................................................................................................3 5. Summary of Test Method ..............................................................................................3 6. Definitions ......................................................................................................................4 7. Interferences...................................................................................................................4 8. Safety .............................................................................................................................4 9. Equipment and Supplies ................................................................................................5 10. Reagents and Standards .................................................................................................5 11. Sample Collection, Preservation, Shipment and Storage ...............................................7 12. Quality Control ..............................................................................................................7 13. Calibration and Standardization.....................................................................................8 14. Procedure .....................................................................................................................11 15. Data Reduction, Calculations and Loading .................................................................13 16. Method Performance....................................................................................................14 17. Pollution Prevention.....................................................................................................15 18. Data Assessment and Criteria for Quality Control Measures ......................................15 19. Corrective Actions for Out-Of-Control Data ...............................................................16 20. Contingencies for Handling Out-Of-Control Or Unacceptable Data ..........................17 21. Waste Management......................................................................................................17 22. References ....................................................................................................................17 23. Forms, Figures, Tables, Diagrams, Flowcharts, Attachments or Validation Data ......18 APPENDIX A TROUBLESHOOTING .....................................................................19 APPENDIX B CREATING A METHOD..................................................................20 APPENDIX C DQM PLAN .......................................................................................23 APPENDIX D MANIFOLD DIAGRAM...................................................................25 APPENDIX E MANIFOLD INSTALLATION/REMOVAL....................................26 APPENDIX F MAINTENANCE SCHEDULE .........................................................28

Analysis Corporation
SOP 4250 Ammonia Analysis Revision 00
Effective Date: November 26, 2008 Page 3 of 28
STAT
1.0 Identification of Test Method
SOP Title: Ammonia Analysis is also known as Ammonia in the laboratory records.
2.0 Applicable Matrix or Matrices
This method is used to determine the concentration of Ammonium ion in aqueous samples, wastes, and leachates. This method is used to quantify the concentration of ammonia from the distillation procedure detailed in STAT SOP 3250 Ammonia Distillation by 4500-NH3 B
3.0 Detection Limits
The lab follows the procedure found in 40CFR Part 136B to determine the MDL for each matrix type on an annual basis. See the STAT Analysis SOP 1210 for the MDL procedure, frequency and acceptance criteria. The MDLs measured by the lab and all supporting documentation are in the laboratory QA files for review.
The laboratory determined MDL must always be less than the reporting limit (RL). The RL will usually range from three to ten times the laboratory measured MDL but this relationship may vary dependent on dilution of sample aliquots, matrix interferences, moisture adjustments (in solid samples), or method-specified requirements.
For the Phenate Method, the applicable range for aqueous samples is 0.05 to 5 mg/L and the applicable range for soil samples is 2.5 to 250 mg/Kg (as received basis). The applicable reporting level for titration of aqueous samples is 1 mg/L and for soils is 50 mg/kg (as received basis). Sample distillates with concentrations greater than the highest calibration standard are diluted and then reanalyzed. Samples with high concentrations of ammonia may also be redistilled using a smaller sample size and then analyzed.
4.0 Scope and Application
The method, based on Standard Methods 4500-NH3 H and C, is designed for the analysis of aqueous distillates for ammonia. Samples and QC samples are distilled prior to analysis. The distillation procedure described in SOP 3250 Ammonia Distillation by 4500-NH3 is designed for the determination of ammonia in aqueous solutions, solid waste materials, or effluents. This method is not applicable to oil or multiphasic samples or samples not amenable to the distillation procedure. This method may be performed using an Automated Phenate Method or the Titrimetric Method. For the automated method, it is restricted to use by or under the supervision of analysts experienced in the use of the Lachat Auto Analyzer.
5.0 Summary of Method
The Automated Method is based on Berthelot reaction of the distillate with alkaline phenol, then with sodium hypochlorite to form indophenol blue. Sodium nitroprusside (nitroferricyanide) is

Analysis Corporation
SOP 4250 Ammonia Analysis Revision 00
Effective Date: November 26, 2008 Page 4 of 28
STAT
added to enhance sensitivity. The absorbance of the reaction product is measured at 630 nm, and is directly proportional to the original ammonia concentration in the samples. The Titrimetric Method is based on titration with sulfuric acid until indicator turns a pale lavender.
Method Modifications from Reference This SOP reflects the reduced volume version of the method. Reduced volume versions of this method that use the same reagents and molar ratios are acceptable provided they meet the quality control and performance requirements stated in the method. Degassing to remove air bubbles is performed only if it is noticed that there are air spikes during analysis by the Phenate Method.
6.0 Definitions
The STAT Analysis Corporation Quality Assurance Manual (QAM) contains the definitions of standard terms used in this SOP.
7.0 Interferences
7.1 Interferences are eliminated or reduced by using the distillation procedure described in SOP 3250 Ammonia Distillation by 4500-NH3 B.
7.2 Calcium and Magnesium ions may precipitate if present in sufficient concentration. EDTA
(Ethylenediamine Tetraacetate) is added to the sample in line in order to prevent this problem 7.3 Oxidizing agents such as chlorine, detected by the liberation of iodine upon acidification in
the presence of potassium iodide, are removed immediately after sampling by the addition of an excess of sodium arsenite. If chlorine is not removed, the ammonium compounds may be partially oxidized and the results may be low.
7.4 Method interference may be caused by contaminants in the reagent water, reagents,
glassware, and other sample processing apparatus that bias analyte response. 8.0 Safety
8.1 All samples must be assumed as hazardous and appropriate precautions taken during handling.
8.2 Safety glasses, gloves, lab coats and closed toe shoes are to be worn. 8.3 Other safety precautions must be conducted in accordance with the SAP 003 Chemical
Hygiene Plan. Other actions can also be applied if deemed necessary. A reference file of material safety data sheets (MSDS) is available in the laboratory for personnel involved in an analysis using chemicals.

Analysis Corporation
SOP 4250 Ammonia Analysis Revision 00
Effective Date: November 26, 2008 Page 5 of 28
STAT
8.4 The toxicity or carcinogenicity of each reagent used in this method has not been fully established. Each chemical should be regarded as a potential health hazard and exposure should be as low as reasonably achievable. Cautions are included for materials known to be extremely hazardous.
8.5 The following chemicals have the potential to be highly toxic or hazardous, for detailed
explanation consults the MSDS. 8.5.1 Phenol is toxic and hygroscopic. Use extreme caution when handling this material. 8.5.2 Sulfuric acid is a strong oxidizer and sodium hydroxide is a strong reducing agent. Use
extreme caution when handling these materials. Avoid eye and skin contact. Wash exposed areas immediately with copious amounts of water.
8.5.3 Sodium Nitroferricyanide is toxic. Use extreme caution when handling this material. Avoid contact with acids which will releases cyanide gas.
9.0 Equipment and Supplies
9.1 LaCHAT AutoAnalyzer consisting of the following components: 9.1.1 Autosampler Cetac 9.1.2 Reagent Pump 9.1.3 System Unit Lachat 8000 9.1.4 Computer 9.1.5 Printer
9.2 Centrifuge Tubes, 50 mL graduated 9.3 Volumetric Flasks, Class A: 1000mL, 250mL, 100mL, 50mL, 25mL with stoppers 9.4 Autopipetter: 0.010 to 0.10 mL, 0.10 to 1.0 mL, 1.0 to 5.0 mL
9.5 Test Tubes, 15 mL and Tube Racks 9.6 Plastic and glass bottles for solution storage
9.7 Burette: 50 mL. with 0.1 mL graduations
9.8 Beaker: 250 mL.
10.0 Reagents and Standards
The following reagents and standards are required to perform this procedure. When instructions are given on how to prepare a specific volume of a reagent or standard, larger or smaller volumes can be prepared as needed so long as the final concentrations remain the same. Any other deviations from the reagents or standards listed in this SOP could be detrimental to the quality of the data produced. Such deviations would have to be approved and documented (see 230 Corrective Action SOP).
10.1 Instructions for labeling and record keeping of reagents and standards are contained in SOP
1010 Analytical Standards and Reagents Receipt and Preparation.

Analysis Corporation
SOP 4250 Ammonia Analysis Revision 00
Effective Date: November 26, 2008 Page 6 of 28
STAT
10.2 Reagents - In methods where the purity of reagents is not specified, analytical reagent grade shall be used. Reagents of lesser purity than those specified by the test method shall not be used.
10.3 Use ammonia-free reagent water (1 Mohm) for all solutions. Degas reagents with helium if
necessary to prevent bubble formation.
10.4 Reagent 1. Sodium Phenolate: In a 1-liter volumetric flask, dissolve 88 ml of 88% liquefied phenol, or 83 g crystalline phenol in 600 ml reagent water. While stirring, slowly add 32 g Sodium Hydroxide (NaOH for Nitrogen determination), cool, dilute to the mark with reagent water and invert to mix. Do not degas this reagent.
10.5 Reagent 2. Sodium Hypochlorite: In a 500-ml volumetric flask, mix 109 mL regular
Clorox © Bleach (6% sodium hypochlorite) with 125 mL. of DI water. Invert to mix.
10.6 Reagent 3. Buffer: In a 1-liter volumetric flask, dissolve 50.0 g Disodium Ethylenediamine Tetraacetate Dihydrate (Na2EDTA*2H2O) and 5.0 g Sodium Hydroxide (Nitrogen Determination grade) in approximately 900 ml reagent water. Mix until dissolved and dilute to the mark.
10.7 Reagent 4. Sodium Nitroprusside: To a 1-liter volumetric flask, dissolve 3.5 g Sodium
Nitroprusside (Sodium Nitroferricyanide). Dilute to the mark with reagent water and invert to mix.
10.8 Reagent 5. Carrier and Diluents (0.20% H2SO4): To a 1-liter volumetric flask, add
approximately 900 ml reagent water and 2 ml concentrated Sulfuric Acid. Dilute to the mark with reagent water and invert to mix.
10.9 Reagent 6. 0.02 N Sulfuric Acid (Titrant)
10.10 Standards for Phenate Method
10.10.1 At least one of the standards must be traceable to a NIST traceable source when
available. The manufacturer should include a certificate of analysis for each standard. If one is not provided, contact the manufacturer. Retain all certificates in the designated binder (see SOP 1010 Analytical Standards and Reagents Receipt and Preparation).
10.10.2 Standards must be prepared volumetrically using class-A volumetric glassware, calibrated micropipettes, or gas tight syringes. Do not use disposable pipettes to prepare standards.
10.10.3 Nitrogen Stock Calibration Standard: 1000 mg Nitrogen/L: Commercially Purchased. Store per manufacturer’s recommendations and shelf life. If shelf life is not stated, then this solution may be used for twelve months if stored in the original container at 0.1 - 6oC and shows no sign of deterioration.
10.10.4 Intermediate Ammonia Calibration Solution: 100 mg Nitrogen/L: Dilute 5 ml of Ammonia Stock Standard to 50 ml with 0.20% H2SO4 (Reagent 5). Invert to mix. This solution may be used for six months if stored at 0.1 - 6oC and shows no sign of deterioration.
10.10.5 Stock ICV/CCV Nitrogen Standard (2ndSource) 1000 mg Nitrogen/L: Commercially purchased. Store per manufacturer’s recommendations and shelf

Analysis Corporation
SOP 4250 Ammonia Analysis Revision 00
Effective Date: November 26, 2008 Page 7 of 28
STAT
life. If shelf life is not stated, then this solution may be used for twelve months if stored in the original container at 0.1 - 60C and shows no sign of deterioration.
10.10.6 Intermediate (ICV/CCV) Ammonia Standard 100 mg Nitrogen/L: Dilute 5 ml of Stock ICV/CCV Standard to 50 ml with 0.20% H2SO4 (Reagent 5), invert to mix. This solution may be used for six months if stored at 0.1 - 60C and shows no sign of deterioration.
10.10.7 Working ICV STD, 1 mg Nitrogen/L: Dilute 0.5 ml of Intermediate ICV/CCV STD to 50 ml with 0.20% H2SO4 (Reagent 5). Prepare this solution fresh daily.
10.10.8 Working CCV STD, 2.5 mg Nitrogen/L: Dilute 1.25 ml of Intermediate ICV/CCV STD to 50 ml with 0.20% H2SO4 (Reagent 5). Prepare this solution fresh daily.
10.10.9 The Calibration Standards are prepared according to Table 1 below. Add listed volumes of the Intermediate Ammonia Calibration Standard to each flask, and dilute to mark with 0.20% H2SO4 (Reagent 5). Cap and mix will.
Table 1 Ammonia Calibration Standards
Calibration Standard Concentration, mg
Nitrogen/L
Amount of Intermediate Calibration
Standard mL
Concentration of Intermediate Calibration
Standard, mg/L
Final Volume, mL
mg Nitrogen
per 50 mL
5 2.5 100 50 0.25 2.5 1.25 100 50 0.125 1 0.5 100 50 0.05
0.5 0.25 100 50 0.025 0.1 0.05 100 50 0.005
0.05 0.025 100 50 0.0025 0.01 0.005 100 50 0.0005
0 0 0 50 0 11.0 Sample Collection, Shipment, Preservation and Storage
Samples shall be placed on ice immediately after collection. The holding time is 28 days for a refrigerated sample (0.1 - 6oC) with proper chemical preservation (pH < 4). Distillation and analysis must occur within the 28 days period to be compliant.
12.0 Quality Control
The following details the QC requirements that apply to this analysis. Each Quality Control Indicator (QCI) provides information pertaining to either method or individual sample performance. Our goal is to produce defensible data of known and documented quality.
The results of these QCI samples are used to assess the acceptability of data.
12.1 Blanks
Method Blank analysis is performed to determine if any contamination is present in the analytical process and is used to evaluate acceptance of the batch of samples. A method

Analysis Corporation
SOP 4250 Ammonia Analysis Revision 00
Effective Date: November 26, 2008 Page 8 of 28
STAT
blank shall be prepared once per preparation batch of 20 or less samples per matrix type If more than 20 samples are prepared a second blank shall be prepared after the twentieth sample. The method blank shall be processed through all preparatory steps used for the samples, including cleanup procedures. The blank shall be analyzed using the same instrument and conditions as the samples.
12.2 Laboratory Control Sample (LCS)
The LCS is used to evaluate the performance of the total analytical system, including all preparation and analysis steps. The LCS shall be prepared once per preparation batch of 20 or less samples per matrix type. If more than 20 samples are prepared a second LCS shall be prepared after the twentieth sample. The LCS shall be processed through all preparatory steps used for the samples, including cleanup procedures. The LCS shall be analyzed using the same instrument and conditions as the samples.
12.3 Duplicates
Duplicates of field samples or of the LCS must be prepared in compliance with the method requirements and client directives. Note: The analysis of the Matrix Spike Duplicate (MSD) is used as a substitute for the laboratory duplicate.
12.4 Matrix Spike and Matrix Spike Duplicate (MS/MSD)
MS/MSDs indicate the effect of the sample matrix on the precision and accuracy of the results generated using the selected method. This information does not determine the validity of the entire batch. MS/MSD’s must be analyzed at a minimum of 1 per 20 samples per matrix per preparation procedure, or as specified by the required test method. For cases where the sample cannot be divided (e.g., wipes, air samples, not enough sample provided by customer) and thus a MS/MSD pair cannot be prepared in the preparation batch, an LCS/LCSD pair is prepared and analyzed to measure precision.
The MS/MSD pair shall be processed through all preparatory steps used for the samples. They shall be analyzed using the same instrument and conditions as the samples.
13.0 Calibration For the Phenate Method
Initial Calibration (ICAL) In addition to achieving the reference method requirements for the minimum number of calibration standards and the acceptance criteria (statistics) for calibration curve fit, the following ICAL criteria also apply:
13.1 The ICAL must be a minimum of 5 standards, not including a blank. 13.2 The ICAL must be verified with a second source standard (ICV) prior to the analysis of
samples. 13.3 Results of samples not bracketed by the ICAL range must be qualified on the final report. If
possible, dilute the sample or distill a smaller amount and reanalyze in order to achieve a result within the calibrated range of the instrument.

Analysis Corporation
SOP 4250 Ammonia Analysis Revision 00
Effective Date: November 26, 2008 Page 9 of 28
STAT
13.4 The lowest calibration standard may establish the reporting limit: RL = 0.05 mg/L for waters and 2.5 mg/Kg for soils (as received basis). The RL must be greater than or equal to the detection limit.
13.5 Samples must be quantitated from the initial calibration curve and may not be quantitated
from any instrument CCV. Initial Calibration Verification (ICV) In addition to the method requirements, the following ICV criteria also apply:
13.6 Must be a second source standard from the ICAL standards or from a different manufacturer lot number.
13.7 Must be traceable to NIST when available.
13.8 Must be analyzed when an ICAL is not performed on the day of analysis, prior to sample
analysis.
13.9 Initial Calibration Blank (ICB): (0.2% H2SO4) Analyzed immediately after the ICV. Acceptance limits are ± RL.
Continuing Calibration Verification (CCV) In addition to the method requirements, the following CCV criteria also apply: May be analyzed at the beginning of the batch to check the CCV recovery.
13.10 Must be analyzed after every 10 samples and at the end of each analytical batch.
13.11 If the CCV results obtained are outside the acceptance criteria, corrective actions must be performed. If routine corrective actions fail to produce an acceptable second consecutive (immediate) CCV, then either the lab has to demonstrate performance after corrective action with two consecutive successful CCVs, or a new ICAL must be performed. If the instrument has not demonstrated acceptable performance, sample analyses cannot continue until a new ICAL is established and verified with an ICV. However, sample data associated with an unacceptable CCV may be reported as qualified data under the following special conditions:
13.11.1 When the acceptance criteria for CCV are exceeded high, i.e., high bias, and there are
associated samples that are non-detects, then those non-detects may be reported. Otherwise the samples affected by the unacceptable calibration verification must be reanalyzed after a new ICAL has been established, evaluated and accepted.
13.11.2 When the acceptance criteria for the CCV are exceeded low, i.e., low bias, those
sample results may be reported if they exceed a maximum regulatory limit/decision level. Otherwise the samples affected by the unacceptable verification must be reanalyzed after a new ICAL is established and verified with an ICV.
13.11.3 When the acceptance criteria for the CCV are exceeded and it is not possible to
reanalyze the sample due to limited sample quantity AND a new sample cannot be obtained by the laboratory, the data may be reported with the appropriate data qualifiers if the client has been contacted and agrees, in writing, to accept the qualified data.

Analysis Corporation
SOP 4250 Ammonia Analysis Revision 00
Effective Date: November 26, 2008 Page 10 of 28
STAT
13.12 Continuing Calibration Blank (CCB): (0.2% H2SO4) Analyze immediately after the CCV. Acceptance limits are ± RL.
13.13 Records: Initial and Continuing Calibration Records will contain, at a minimum, the
following: 1. Calibration date 2. Test method 3. Instrument 4. Analysis date 5. Each analyte name 6. Analyst's initials or signature 7. Standard Concentration (appropriate units) and number of standards 8. Response (appropriate units) 9. Calibration curve or response factor 10. Evaluation of and Statistics for ICAL curve fit in order to judge calibration curve
acceptance 11. Evaluation of and Acceptance Limits for ICV analysis in order to judge calibration curve
acceptance 12. Evaluation of and Acceptance Limits for CCV analysis in order to judge continuing
calibration acceptance 13. Calibration Standards and Reagent Solutions IDs
Calibration Acceptance Summary:
Table 2 Calibration Requirements
QCI Frequency Standards Control Limits Corrective Action ICAL Daily or as needed, Minimum 5
standards, see Table 1 for concentrations
r = 0.995 Correct problem then repeat initial calibration
ICV After each new ICAL And at the beginning of each analytical run.
1.0 mg/L ± 10% of true value Correct problem then repeat initial calibration
ICB After each ICV 0.2% H2SO4 ± reporting limit Correct problem then repeat initial calibration
CCV Beginning (optional), every 10 samples, and end of the batch
2.5 mg/L ± 10% of true value Correct problem then repeat CCV or repeat initial calibration
CCB After each CCV 0.2% H2SO4 ± reporting limit Correct problem then repeat CCV or repeat initial calibration
Support Equipment: Autopipettes - Check autopipette to ensure standardization is within control limits (see SOP 1040 General Laboratory Practices for Pipette Calibration).
Balances - Be sure the balance is checked prior to use and performance criteria are met (see SOP 1040 General Laboratory Practices for Calibration of Balances).

Analysis Corporation
SOP 4250 Ammonia Analysis Revision 00
Effective Date: November 26, 2008 Page 11 of 28
STAT
14.0 Procedure (14.1 through 14.11 for the Phenate method)
14.1 Instrument Start Up 14.1.1 Turn on the power to all modules by turning on the power strip and allow the
autosampler to perform its startup routine. Wait until the autosampler stops with the probe above the wash bath.
14.1.2 If necessary, install the manifold on the channel you want to run. (See Appendix E.) 14.1.3 Make all the injection fluidic connections. 14.1.4 Make all the cell fluidic connections. 14.1.5 Set all pump tubes on the pump. (Varies method to method.) 14.1.6 Run reagent water through all the lines to make sure there are no leaks. 14.1.7 If there are no leaks, put actual reagents in line. 14.1.8 ALWAYS start pumping Buffer Solution FIRST. 14.1.9 Pour the calibration Standards into Standard vials, and place into the autosampler
Standards Rack. 14.1.10 Pour the Samples into test tubes and place into the Sample Rack. 14.1.11 If necessary, insert the interference filter into the upper slot in the detector. 14.1.12 Turn on the Heater by increasing the Set Point to 600C. Press the Set Point Key (Left
of the arrow keys) until the display shows the letters SP for Set Point. Press the big arrow keys for setting the temperature, press the ENTER key to save the information. Press the Set Point key once. The display will show the current temperature in Celsius. The red light will be lit when the heater is ON.
14.2 Software Set up
14.2.1 Double click on the Omnion FIA icon. Then click OK. The autosampler probe should go into the wash bath and the dilutor activity may be heard, the injection valves may turn to the inject state if they were not already there.
14.2.2 Log In with your user name and password. [User name: demo with no password will also get you in]. The Main Menu should appear.
14.2.3 From the Main Menu click on the Instrument button labeled FIA Instrument 1. Each valve allocated to this instrument will be cycled in turn from Load to Inject and back to Inject again. Omnion will automatically open the last Method and Tray that was used. (The names will appear at the top in the title bar.).
14.3 Open the Ammonia Method (To Create a Method see Appendix B)
14.3.1 Click on the Method button, or from the Main Menu click on File , then Open Method. This will open the Open Method Dialog window.
14.3.2 Double click on the method file you want to open: Ammonia met. or click once then click on OK.
14.3.3 From the Main Menu click on the Instrument button labeled FIA Instrument 1. Each valve allocated to this instrument will be cycled in turn from Load to Inject and back to Inject again. Omnion will automatically open the last Method and Tray that was used. (The names will appear at the top in the title bar.)
14.4 Opening and Editing the TRAY
14.4.1 Click on the Tray button or from the Main Menu, click on File, then Open Tray. 14.4.2 Click twice on the name of the tray you wish to open. (Ammonia tray) The First rows
of the tray spreadsheet are blue. This denotes that these samples are actually Calibration Standards. This is from the method and will not change. The Sample Type is Cal Std.

Analysis Corporation
SOP 4250 Ammonia Analysis Revision 00
Effective Date: November 26, 2008 Page 12 of 28
STAT
And the Level is NEVER 0; it will be a number from 1 to 14 (This will match the level in the Analyte Table in the method.) The Cup Number (Cup #) refers to the cup number in the Standard Rack and will be a number between 1 and 14.
14.4.3 Edit the Sample ID. Using the mouse, move the pointer to the cell and click once; type in the new ID. In the Sample Rack Loading Aid (Top Left) the sample cup you are editing will be in green.)
14.4.4 The Cup Numbers (Cup #) for sample will can be anything from 1 to 90. 14.4.5 The Level column is 0 for all samples of Sample Type Unknown 14.4.6 The Reps for samples and standards is 1 or 2. 14.4.7 To Schedule manual QC See Appendix C (DQM Plan)
14.5 Click on the Run Tray button. (Or from the Main Menu, click on Tray then Run Tray.)
14.5.1 Leave the Method and Tray boxes empty to use the ones that are active (open). 14.5.2 In the Data File box enter the name for your run, (i.e. 981006Ca. YYMMDD C (for
Calibration) and a (for number of the run... a b c...).) The extension *.fdt (FIA Data) is used by default.
14.5.3 The Autosampler Position refers to the autosampler sample rack position: 1, 2 or 3. 14.5.4 Skip Recalibration Block Box can be checked when you want to run a tray that
contains Cal standards and samples but you want only want to run samples 14.5.5 While the tray is processing, you can view the peaks and runtime report. 14.5.6 If the baseline does not appear on the screen change Display options. 14.5.7 Click Method, then Display Options 14.5.8 Specify the channel: 1. 14.5.9 Specify the voltage scale on the Y-axis (i.e. -1 to 3). 14.5.10 Click OK.
14.6 Analyze samples for Ammonia. Click on the RUN button. The tray will start running. After
the pump is allowed to pump at a normal speed for the period specified it the method, pump timing, the autosampler will move to the first calibration standard. The Standards and samples are done in Row order (on the computer screen), no matter where they are located on the autosampler tray.
14.7 While running you will see a STOP sign on the tool bar. To suspend the tray click on the
STOP sign. The Tray will pause and the computer gives you the choices of aborting or resuming the tray. At the end of the tray, after the last sample ID entered is reported, the sample probe should return to the rinse position and the STOP button will turn back into the RUN button.
14.8 If baseline drifts or other problems with precision arise, clean the manifold using the
following procedure. Place all reagent lines in reagent water for 5 min. Place all reagent lines in 1 M Hydrochloric Acid (1 volume concentrated HCl added to 11 volumes of reagent water) and pump for 10 min. Rinse with reagent water for 30 min.
14.9 System Shutdown Procedure
14.9.1 Remove the reagent transmission lines and place into the rinse solution and pump for 5 minutes at standard speed. 14.9.2. Place the lines into reagent water and allow the system to rinse 5 to 10 minutes at standard speed.

Analysis Corporation
SOP 4250 Ammonia Analysis Revision 00
Effective Date: November 26, 2008 Page 13 of 28
STAT
14.9.3 Remove the lines from the reagent water and allow all liquid to be pumped out of the manifold. 14.9.4 Turn off the pump and release the pump tube cartridges tension. Press the tube cartridges holders on the sides of the Isomatec pump. 14.9.5 Turn off the Heater by Reducing the Set Point to a temperature lower than room temperature. (e.g. 15°C). 14.9.6 Close all files 14.9.7 Switch off the master power strip
14.10 Documentation requirements. Record the following information in the appropriate logbook or data file. Include any deviations from this procedure.
14.10.1 Analyst initials, date [and time if required by the specific project or QAPP] of analysis, sample number or ID, initial sample volume or weight processed, final digestate volume, calibration standard sample or solution identifier, QC sample or solution identifier, reagent solutions identifiers, any dilution information, [beginning and ending times of analytical steps if required by the specific project or QAPP], data file name or batch ID, instrument method name, visual observations, and any other information as deemed necessary
14.10.2 Print out a copy of the calibration curve used and datafile (run sequence).
14.11 Routine Maintenance – Record all maintenance in the logbook. See Appendix F
14.12 Titrimetric Method: Fill burette with reagent upto the Zero mark (meniscus at 0). Place 50
mL. of the blank distillate in a beaker. Add titrant dropwise while swirling the beaker. Record amount of titrant used when color turns and remains lavender for 30 seconds. Repeat procedure for samples, LCS, MS/MSD.
15.0 Data Reduction, Calculations and Loading
15.1 The data system will then prepare a calibratio n curve by plotting response versus standard concentration. Sample concentration is calculated from the regression equation.
15.2 Report only those values that fall between the lowest and highest calibration standards.
Samples exceeding the highest standard must be diluted and reanalyzed. 15.3 Aqueous Samples: The concentration readout for aqueous sample distillates is mg Ammonia
as Nitrogen/L. It does not need further data reduction unless the initial sample volume was less than 50 mL. If less than 50 mL sample was distilled, calculate the concentration as follows: Concentration in mg Ammonia /L = readout * (50 ml/ initial sample volume analyzed in mL)
15.4 For sample results greater than the highest calibration standard, dilute the sample in a 10 mL
centrifuge tube using Reagent 5.
15.5 Pipette in the appropriate volume of sample into the tube, dilute to the mark with Reagent 5. Record the volume of distillate used for analysis. Dilution Factor = (10 mL/ distillate volume analyzed in mL). Use the dilution factor and calculate the concentration in aqueous samples as follows:

Analysis Corporation
SOP 4250 Ammonia Analysis Revision 00
Effective Date: November 26, 2008 Page 14 of 28
STAT
Concentration in mg Ammonia /L = readout * (10 ml/ distillate volume analyzed in mL)
15.6 Soil Samples: The concentration readout for soil samples must be multiplied by the following factor: Factor = (50 / sample weight in g). Calculate the concentration in soil samples as follows: Concentration in mg Ammonia /Kg = readout * (50/ sample weight in g) For soil sample results greater than the highest calibration standard, follow the dilution procedure in section 15.4
15.7 Soil samples reported on a dry weight basis: The concentration is divided by the decimal
equivalent of the percent residue of the soil at 1050C. 15.8 Report results in mg Ammonia /L, or mg Ammonia /Kg.
15.9 The procedure for uploading data into the LIMS system is detailed in SOP 1400 LIMS.
15.10 For the Titrimetric Method,
Mg NH3-N/L = (A-B) x 280/mL. sample Where, A: Volume of H2So4 required for sample (mL) B: Volume of H2So4 required for blank (mL)
16.0 Method Performance
Demonstration of Capability (DOC) Note: Each analyst must demonstrate the ability to generate acceptable results with this method.
All parameters of interest must meet the method acceptance criteria before actual sample analysis begins. See SOP 1230 Training for the procedure to perform and document the DOC. The DOCs for the analysts performing this method are located in the analysts’ training form folders located in the QA office files. A quality control (QC) reference concentrate is required containing Ammonia at a concentration of 1-4 times the reporting limit. The QC reference sample is made using stock standards prepared independently from those used for calibration. For the Phenate Method, distillation is required. For the Titrimetric method, disrtillation is not required.
For each analyte, calculate the mean recovery (X), standard deviation (s), relative standard deviation (RSD), and the average % Recovery (%R). Compare X and s and %R with the corresponding acceptance criteria for accuracy and precision, respectively. Note: RSD must be equal to or less than 20% and the %R must be within 100 ± 20%. These limits are taken from established in-house criteria If RSD and %R for all analytes meet the acceptance criteria, the system performance is acceptable and analysis of actual samples can begin. If RSD or %R falls outside the range for accuracy and precision, then the system performance is unacceptable for that analyte and corrective action must be taken.

Analysis Corporation
SOP 4250 Ammonia Analysis Revision 00
Effective Date: November 26, 2008 Page 15 of 28
STAT
Comparison to Reference Method Data There are no stated reference method criteria for ICV, LCS, Duplicate Sample or MS/MSD recoveries in Method 4500-NH3.
In-House Control Limits Method performance data is on file in the laboratory QC department. Comparison of method performance data for the laboratory to the reference method criteria occurs when laboratory in-house acceptance limits are generated. In-house generated data is compared to the specifications of the reference method. If the in-house limits are within the specifications of the reference method, the control limits are updated in LIMS. If the in-house limits are not within specifications, an investigation is performed to determine the cause(s) of the problem and a corrective action is completed. The analysis may continue until enough data points are collected to regenerate new control limits. Any QC data generated outside of reference method limits during that time frame is flagged.
The laboratory maintains performance records to document the quality of data that is generated. Method accuracy for samples is assessed and records maintained.
17.0 Pollution Prevention
The preparation of excessive volumes of laboratory reagents and standards shall be avoided so that waste and potential for pollution are minimized. Samples, reagents and standards shall be disposed in compliance with the laboratory waste disposal program and applicable waste disposal regulations. With the consent of the client, the samples may be returned to their origin for treatment.
Uncontaminated paper waste, glass and cans should be separated for recycling. Laboratory staff are required to protect the laboratory’s and our clients’ business information when disposing of recycling or waste from the facility.
18.0 Data Assessment and Criteria for Quality Control Measures
The laboratory maintains records to document the quality of data that is generated. Ongoing quality checks are compared with established performance criteria to determine if the results of analyses meet the performance characteristics of the method. The data review is conducted according to SOP 1250 Data Review.
Method Blank (MB) If the blank exceeds the RL (the lowest calibration standard), the source of contamination must be investigated and corrective actions taken. Affected samples must be reprocessed and reanalyzed or Data must be appropriately qualified if: 1) The concentration of a targeted analyte in the blank is at or above the reporting limit as
established by the SOP or by regulation, AND is greater than 1/10 of the amount measured in any sample .
2) The blank contamination otherwise affects the sample results as per the test method
requirements or the individual project data quality objectives.

Analysis Corporation
SOP 4250 Ammonia Analysis Revision 00
Effective Date: November 26, 2008 Page 16 of 28
STAT
Laboratory Control Sample (LCS) The results of the individual batch LCS are calculated in percent recovery (%R) and compared to established acceptance criteria (in-house limits). LCS %R limits are 100 ± 20%. If the LCS is outside the acceptance criteria, the analytical system is “out-of-control”. Any affected samples associated with an out of control LCS must be reprocessed and reanalyzed or the results reported with appropriate data qualifiers.
Matrix Spikes The results from MS/MSD are primarily designed to assess the precision and accuracy of analytical results in a given matrix and are expressed as percent recovery (%R) and relative percent difference (RPD). See the STAT QAM, Section 5.4 for the calculation for RPD. Results are compared to established acceptance criteria (in-house limits). For aqueous samples, MS/MSD %R limits are 100 ± 25% and RPD limits are 20%. For soil samples, MS/MSD %R limits are 100 ± 25% and RPD limits are 20%. For matrix spike results outside established criteria corrective action must be documented, or the data for the spiked sample is reported with appropriate data qualifying codes.
Duplicates
The results from laboratory Duplicates are designed to assess the precision of analytical results in a given matrix and are expressed as relative percent difference (RPD). See the STAT QAM, Section 5.4 for the calculation for RPD. Results are compared to established acceptance criteria (in-house limits). RPD limits are 20%. For duplicates results outside established criteria corrective action must be documented, or the data for the duplicate sample is reported with appropriate data qualifying codes.
19.0 Corrective Actions for Out-of-Control Data
The process for handling corrective actions is found in SOP 230 Corrective Action.
If the CCV, MB, LCS/LCSD, MS/MSD, or lab duplicate recovery of any parameter falls outside the designated acceptance range, the laboratory performance for that parameter is judged to be out of control, and the problem must be immediately identified and corrected. The analytical result for that parameter in the samples is suspect and is only reported for regulatory compliance purposes with the appropriate corrective action form. Immediate corrective action includes reanalyzing all affected samples by using any retained sample before the expiration of the holding time. Final data results must be qualified in the client report for reported results not meeting the laboratory-defined criteria.
1) Review standards preparation logbooks. Check all calculations and ensure dilution factors are
properly recorded. 2) Re-prepare the suspected standard or QC sample to identify possible preparation errors of the
standard or QC sample.
3) Re-Analyze the samples when the CCV or LCS is not within acceptable limits.

Analysis Corporation
SOP 4250 Ammonia Analysis Revision 00
Effective Date: November 26, 2008 Page 17 of 28
STAT
4) Perform routine preventative maintenance following manufacturer's specification. Record all maintenance in the instrument logbook.
20.0 Contingencies for Handling Out-of-Control Or Unacceptable Data
Every effort is made to prevent problems from occurring. When out of control or unacceptable data occurs the first option is to identify the problem and reanalyze the samples within the holding times. When this is not possible, the QA Manager and/or the Laboratory Director reviews data and discuss options with the client. Reanalysis or reporting the data with qualification is alternatives. Out-of-control or unacceptable data reported to the client must include the data qualifier, flag and discussion on the rationale for reporting.
The process for handling unacceptable and out of control data is found in section 11 of the Laboratory QAM. The reporting of data that is out of control must be approved and documented by Quality Assurance Manager and either the Technical Manager or the Laboratory Director.
21.0 Waste Management
The STAT Analysis Corporation SOP 1130 Waste Disposal identifies proper waste management practices for the chemicals and biological materials used in this procedure. Samples are stored and discarded accordance with SOP 1130 Waste Disposal.
22.0 References
22.1 Method 4500-NH3 B, H, and C. U.S. EPA, Standard Methods for the Examination of Water and Wastewater (20th Edition).
22.2 Determination of Total Recoverable Ammonia by Flow Injection Analysis. QuikChem Method 10-107-06-1-B.
22.3 STAT Analysis Corporation Quality Assurance Manual 22.4 STAT SOP 003 Chemical Hygiene Plan 22.5 STAT SOP 230 Corrective Actions 22.1 STAT SOP 1000 Control and Use of Laboratory Notebooks 22.2 STAT SOP 1010 Standard and Reagent Preparation 22.3 STAT SOP 1020 Glassware Cleaning 22.4 STAT SOP 1040 General Laboratory Procedures 22.5 STAT SOP 1130 Waste Disposal 22.6 STAT SOP 1210 Method Detection Limits (MDL’s) 22.7 STAT SOP 1230 Training 22.8 STAT SOP 1250 Data Review 22.6 STAT SOP 1400 LIMS 22.7 STAT SOP 3250 Ammonia Distillation by EPA 4500-NH3 B. 22.8 QuikChem 8000 Automated Ion Analyzer Omnion FIA Software. 22.9 QuikChem 8000 Automated Ion Analyzer Continuum Series “Flow Injection Analyzer”
Hardware Installation and System Operation.

Analysis Corporation
SOP 4250 Ammonia Analysis Revision 00
Effective Date: November 26, 2008 Page 18 of 28
STAT
23.0 Forms, Figures, Tables, Diagrams, Flowcharts, Attachments or Validation Data
23.1 Appendix A Troubleshooting 23.2 Appendix B Creating a Method 23.3 Appendix C DQM Plan 23.4 Appendix D Manifold Diagram 23.5 Appendix E Manifold Installation/ Removal 23.6 Appendix F Maintenance Schedule
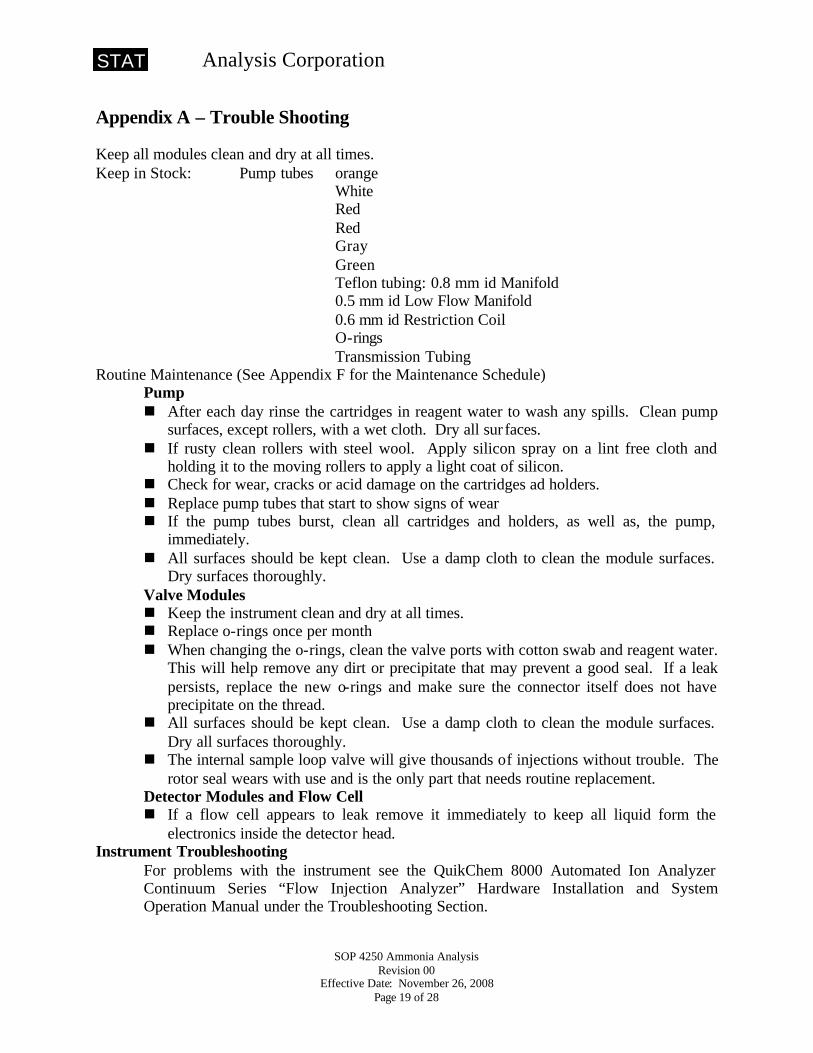
Analysis Corporation
SOP 4250 Ammonia Analysis Revision 00
Effective Date: November 26, 2008 Page 19 of 28
STAT
Appendix A – Trouble Shooting
Keep all modules clean and dry at all times. Keep in Stock: Pump tubes orange White Red Red Gray Green Teflon tubing: 0.8 mm id Manifold
0.5 mm id Low Flow Manifold 0.6 mm id Restriction Coil O-rings Transmission Tubing
Routine Maintenance (See Appendix F for the Maintenance Schedule) Pump
n After each day rinse the cartridges in reagent water to wash any spills. Clean pump surfaces, except rollers, with a wet cloth. Dry all sur faces.
n If rusty clean rollers with steel wool. Apply silicon spray on a lint free cloth and holding it to the moving rollers to apply a light coat of silicon.
n Check for wear, cracks or acid damage on the cartridges ad holders. n Replace pump tubes that start to show signs of wear n If the pump tubes burst, clean all cartridges and holders, as well as, the pump,
immediately. n All surfaces should be kept clean. Use a damp cloth to clean the module surfaces.
Dry surfaces thoroughly. Valve Modules n Keep the instrument clean and dry at all times. n Replace o-rings once per month n When changing the o-rings, clean the valve ports with cotton swab and reagent water.
This will help remove any dirt or precipitate that may prevent a good seal. If a leak persists, replace the new o-rings and make sure the connector itself does not have precipitate on the thread.
n All surfaces should be kept clean. Use a damp cloth to clean the module surfaces. Dry all surfaces thoroughly.
n The internal sample loop valve will give thousands of injections without trouble. The rotor seal wears with use and is the only part that needs routine replacement.
Detector Modules and Flow Cell n If a flow cell appears to leak remove it immediately to keep all liquid form the
electronics inside the detector head. Instrument Troubleshooting
For problems with the instrument see the QuikChem 8000 Automated Ion Analyzer Continuum Series “Flow Injection Analyzer” Hardware Installation and System Operation Manual under the Troubleshooting Section.

Analysis Corporation
SOP 4250 Ammonia Analysis Revision 00
Effective Date: November 26, 2008 Page 20 of 28
STAT
Appendix B – Creating A Method 1.1 Click on the Method button, or from the Main Menu click on File, then New Method. 1.2 Then Method will open and you will see the Analyte Table 1.3 Click on Analyte Name of channel and press backspace to delete. Enter the new analyte
name. If an analyte name is not present, the system will ignore that channel. 1.4 Fill out the analyte Table. Channel 1 Analyte Name Ammonia Concentration mg/L Level 1 5 Level 2 2.5 Level 3 1 Level 4 0.5 Level 5 0.1 Level 6 0.05 Level 7 0.01 Level 8 0 Calibration Rep Handling Average Calibration Fit Type 1st Order Polynomial Force Through Zero No Weighting Method None Concentration Scaling None Chemistry Direct Injection to Start Peak 41.8 s Peak Base Width 27.8 s % Width Tolerance 100% Threshold 10000 1.5 From the Main Menu, click on Method, then Valve Timing 1.6 Enter the Method Cycle Period. 60s 1.7 Sample Reaches the first valve 18s (For Standard Pump Sample Assembly) (travel
time from sample probe to port 6 usually 24 s if dilutor enter 28s) 1.8 Load Period 15s Load Time 0s Inject Period 45s Notice that Load Period + Injection Period = Cycle Period 1.9 Click OK 1.10 From the Main Menu, click on Method, then Sampler Timing. 1.11 The Sample Prep Sequence box is optional 1.12 Enter the Minimum Probe in Wash Period 5.0 s 1.13 Enter the Probe in Sample Period 24s

Analysis Corporation
SOP 4250 Ammonia Analysis Revision 00
Effective Date: November 26, 2008 Page 21 of 28
STAT
1.14 Click OK. 1.15 From the Main Menu, click on Method, then Pump Timing 1.16 Check the Go to Standby on Idle box X 1.17 Enter Idle Before Standby 180.0s 1.18 Enter At Speed Before Analysis 45.0s 1.19 Click OK. 1.20 From the Main Menu, click on File, then Save Method As 1.21 The FIA Method File Header will appear. Write a method description (analyte and sample loop size) and click OK. (i.e. Ammonia Sample Loop XXX cm) 1.22 The Method Save As dialog box will appear. 1.23 C:\ Omnion\Methods\
Change the name to Ammonia.met II To Fine Tune the Method 1.0 After you have run a data. 1.1 Open a file from the main menu click on File, Open Data and click twice on the Data file
name, i.e. 981006Ca.fdt. 1.2 Load the original method form this data by clicking on the Data menu the Load Method. 1.3 You should see the peaks on the screen. 1.4 Click on Data then Reanalyze Data. (Or click on the Reanalyze button.) 2.0 Fine Tuning the Threshold 2.1 Look before and after the tray to see some baseline. 2.2 From the menu click on Method, then Graphical, Events, Programming... 2.3 Click on Threshold. 2.4 The Status bar will prompt you to “Select Start of Baseline Section”. 2.5 Set the cursor at the beginning of the baseline region and click once. 2.6 You will be prompted to “Select End of Baseline Section”. 2.7 Move the mouse pointer to the end of the baseline region and click again. 2.8 Omnion calculates a Threshold value. 2.9 Click on OK to enter the value in the Analyte Table of your method 3.0 Fine Tuning the Peak Base Width 3.1 From the menu click on Method, then Graphical Events Programming... 3.2 Click on Peak Base Width. 3.3 You will be prompted to “Select Start of Peak” 3.4 Set the cursor at the beginning of the high standard and click once. 3.5 You will be prompted to “Select End of Peak” 3.6 Move the cursor to the end of the peak and click again. 3.7 Omnion calculates a Peak Base Width. 3.8 Click on OK to enter the value in the Analyte Table of your method 4.0 Save these new method parameters by clicking on File, then Save Method As.

Analysis Corporation
SOP 4250 Ammonia Analysis Revision 00
Effective Date: November 26, 2008 Page 22 of 28
STAT
5.0 Viewing a Method’s Calibration 5.1 Up to 4 replicates of each Standard can be applied to a method’s calibration. 5.2 If not already open, load the method form the data file by clicking on Data, Load Method. 5.3 Click on the button. (Or from the main menu click on Method, then Review Analyte
Calibration Curve. The Review Analyte Calibration window will appear. 5.4 Click Fit, and then Clear to ‘Clear’ the Calibration Replicate Table. 5.5 Click Exit. 5.6 Click the Analyze button. The re-analysis occurs exactly as it did in the actual tray run. 5.7 Click on the Review Calibration button again to see the curve. 6.0 Editing the Calibration 6.1 Clicking twice on any of the results in the calibration replicate Table will turn it red and
make it unused in the calibration. 6.2 To Use the point again, click twice on it again, and it will turn form red back to blue.

Analysis Corporation
SOP 4250 Ammonia Analysis Revision 00
Effective Date: November 26, 2008 Page 23 of 28
STAT
Appendix C – DQM Plan DQM Plan Consists of one or several DQM sets. Each Set has one or more samples. The DQM has 3 sections; the DQM set box, the DQM Sample Box, and the Channel Data box. 1.0 Adding DQM Sets 1.1 Click Tray, then Load DQM. 1.2 In the DQM Set Box click on the drop-down button showing the DQM Set ID , type in a
new name. (Check Standards, Duplicates, Matrix Spikes) 1.3 For the Check Standards Set check the Automatic box X. 1.4 Click ADD to add the set. NOTE: Automatic Sets never have their sample info in the tray table and the samples are loaded in the standards rack. Manual sets have their sample info in the tray table and the samples are loaded in the sample rack. 2.0 Adding DQM Samples 2.1 In the DQM Sample Box, click on the drop-down button showing the DQM Sample ID
and type in a new name (ICB, ICV, CCV, CCB, Method Blank, Dup 1, Spike, Spike Dup)
2.2 Click on the Append button. 2.3 Replicates should be 2 2.4 Click on the drop-down button showing the Type and select the type of sample. (Blank,
Unspiked, Spiked, AbsChkStd, RelChkStd, Dup 1, Dup 2) 2.5 For the Automatic Check Samples enter the Standard Rack Cup. 3.0 Editing Channel Data information. 3.1 In the Channel Data Box, select the appropriate channel. 3.2 If you can’t see the Test 1 row, click on the Add Test button. 3.3 The Test Explanation spells out the test that will be done for this DQM Sample and
depends on what Type the DQM Sample is. 3.4 If the standard has a known concentration it needs to be entered in the Known Conc box
along with the Conc Units. 3.5 Enter the Test Limit. 10.000% difference. 3.6 Select a Fail Action from the drop-down menu. Recalibrate & Repeat, Alarm &
message . 3.7 Enter the Pass/ Fail Message. NOTE: A Test Passes if test value < = Test Limit A Test Fails if Test value > Test Limit 3.8 You can perform more then 1 test on each check sample. 4.0 Scheduling Automatic DQM Sets 4.1 From the Main Menu, click on Tray, then Auto DQM Schedule 4.2 Select the Auto DQM Set from the drop-down menu. 4.3 Check the box (es) for the frequency of the sample 4.4 Click OK.

Analysis Corporation
SOP 4250 Ammonia Analysis Revision 00
Effective Date: November 26, 2008 Page 24 of 28
STAT
5.0 Inserting Manual DQM Sets 5.1 Click on the Tray Table button. 5.2 Click on the row number before which you want to insert the check sample. 5.3 From the Main Menu, click on Tray, then Manual DQM Insertion. 5.4 Click on the Manual DQM Set you wish to insert. 5.5 Enter the Sample ID’s of the DQM samples to reflect the actual identity of the samples.
(Note: The manual DQM sample rows are green.) 5.6 Renumber the Cup Numbers (Cup #) below the inserted Manual DQM Set by clicking
and dragging all the rows and cup numbers you wish to renumber. 5.7 Click on Tray, then Renumber Cups (or Ctrl-R) 5.8 Enter the Starting Number 5.9 Enter an Increment of 1. 5.10 Then click OK. 6.0 Calibration Pass/Fail Criteria 6.1 From the Main Menu, click on Method, then Calibration Failure Criteria 6.2 Select the appropriate channel. 6.3 Check the Minimum Correlation Coefficient (R2) Box and enter 0.995 6.4 Check the Maximum % Residual All Levels Box, and enter 10.0. 6.5 If the calibration passes, a message will be reported and the tray will continue to the nest
row. 6.6 If the calibration fails, a fail message will be reported and you will be given a choice to
Abort or continue the tray. 7.0 Save the DQM Plan 7.1 From the Main Menu, click File, then Save DQM Plan, or Save DQM Plan As... and
enter the File name Ammonia.dqm. The default extension is *.dqm.
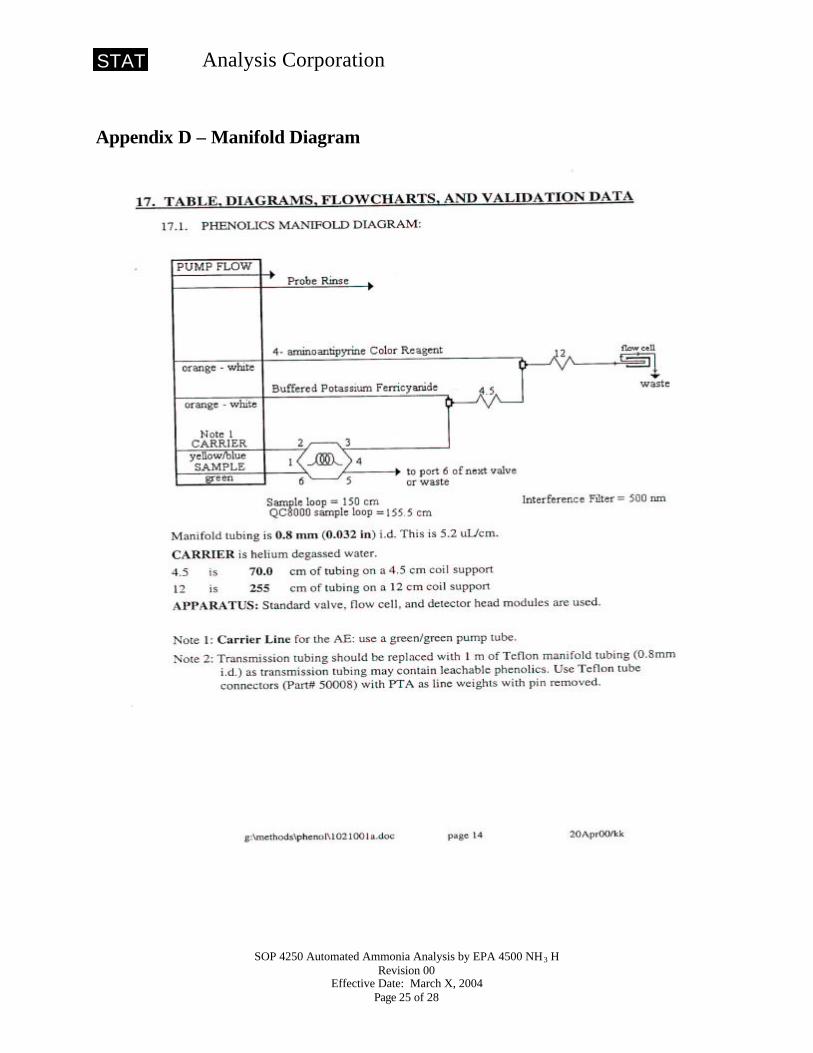
Analysis Corporation
SOP 4250 Automated Ammonia Analysis by EPA 4500 NH3 H Revision 00
Effective Date: March X, 2004 Page 25 of 28
STAT
Appendix D – Manifold Diagram

Analysis Corporation
SOP 4250 Automated Ammonia Analysis by EPA 4500 NH3 H Revision 00
Effective Date: March X, 2004 Page 26 of 28
STAT
Appendix E – Manifold Installation/Removal Manifold Installation Procedure 1.0 Unwrap the transmission lines from around the manifold and place the manifold over the
sample-processing module. 1.1 Remove the transmission lines from the union on the 650 cm side of the heating unit,
insert both ends through the hole in the manifold and reseat the manifold onto the sample-processing module.
1.2 Make the Injection Valve Connections as follows: 1.3 Port 1 & 4 - The Sample Loop 0.8 mm i.d. length 75 cm. 1.4 Port 2 - Carrier line is connected to Port 2 -> from valve, disconnect from
Fitting and connect to port 2 0.8 mm id and 30 cm long. 1.4 Port 3 - 20 cm 0.8 mm id between port 3 and the fitting on the manifold
next to the label -> from valve where the carrier line was connected. 1.5 Port 5 - 15 cm 0.8 mm id. between port 5 and the waste line. 1.6 Port 6 - Sample Line. 130 cm (Varies method to method) connected to the
probe on the autosampler; pump tube adapter, and 20 cm tubing connected to port 6 of valve.
2.0 Flow Cell Top tubing connected to waste line. Bottom line connected to the fitting in the manifold next to the label to flow cell ->. Attach one of the lines from the heater to the union going to the flow cell. Attach the other heater line to the pyridine-barb. acid Tee-fitting.
3.0 Pump 3.1 Sample Line - Autosampler to injection valve 6. 3.2 Wash Line - Reagent water to wash reservoir on the autosampler 3.3 Reagents Lines- Varies from method to method sees Ammonia diagram. 3.4 On the Ismatec Pump Cartridges the arrows point towards the System Unit with the
tension lever on the left. 3.5 Place all of the reagents lines into corresponding containers or Reagent water. 3.6 Move tension levers to the maximum tension (Top Far Right Position) 3.7 Clamp down all pump tube cartridges. (Press down one side at a time.) 3.8 Move tension lever back from the top far right until it makes a clicking sound. 3.9 Set the reagent pump speed to 35. 3.10 Turn on the pump. 3.11 Depress the green button to turn the pump ON. The System Unit will take control over
the pump speed. (The yellow button is the override standby button.) 3.12 Check to confirm that the probe wash reservoir is filing with rinse water. 3.13 Check for Leaks on the manifold, va lve, flow cell or any of the connections. 3.14 Do NOT leave any pump tubes clamped down when the pump is shut off for more then a
few minutes. 3.15 To Remove cartridges, Press the sides of the pump holder on which the cartridge is
engaged. 4.0 Insert the interface filter into the detector module.

Analysis Corporation
SOP 4250 Automated Ammonia Analysis by EPA 4500 NH3 H Revision 00
Effective Date: March X, 2004 Page 27 of 28
STAT
II Manifold Removal Procedure 1.0 Rinse the manifold 1.1 Detach the manifold tubing from the manifold fitting that is connected to Port 3 at the
injection valve. Leave the piece of tubing attached to the injection valve. 1.2 Disconnect the carrier pump tube from Port 2 of the injection valve. Take this tubing and
connect it to the manifold fitting that was connected to Port 3. 1.3 Detach output of the manifold from union on the flow cell tubing leave the union
connected to the flow cell 1.4 Remove the back pressure loop, if necessary 1.5 Detach heating unit tubing from the manifold, and reconnect to the union underneath the
manifold (650 cm side.) 1.6 Remove all manifold pump tubes from cartridges. 1.7 Remove the interface filter from the detector module 1.8 Remove the sample loop from Port 1 & 4 valve 1.9 Remove manifold from the Sample Processing Module (Channel) 1.10 Carefully wrap the transmission lines around the manifold and store it in the plastic
bubble bag.

Analysis Corporation
SOP 4250 Automated Ammonia Analysis by EPA 4500 NH3 H Revision 00
Effective Date: March X, 2004 Page 28 of 28
STAT
Appendix F – Maintenance Schedule All listed maintenance is performed as needed. Following is a checklist of items along with the maintenance that may need to be performed. It is the instrument analyst’s responsibility to check the condition of the instrument daily and perform any necessary maintenance to insure the instrument is operating correctly. AutoSampler Clean Surfaces AutoDilutor Clean Surfaces Prime dilutor with reagent water after using any other diluent Pump Clean Surfaces Rinse cartridges Detector Dry and clean all Surfaces System Unit Keep Dry and Clean Injection Valves Clean Ports and valve connections Autosampler Clean rods/ moving parts Pump Replace pump tubes as needed Clean pump tube adapters Manifold Clean union and tee as needed Injection valves Replace o-rings Manifold Replace o-rings Manifold Check all tubing and replace as needed Flow Cells Check and replace flares and o-rings as needed Computer Clean hard drive


Analysis Corporation
SOP 4420 Automated Nitrate/Nitrite Analysis Revision 00
Effective Date: December 23, 2008 Page 2 of 25
STAT
Table of Contents Title Page 1 Table of Contents 2 1. Identification of Test Methods 3 2. Applicable Matrix or Matrices 3 3. Detection Limits 3 4. Scope and Application 3 5. Summary of Test Method 3 6. Definitions 3 7. Interferences 4 8. Safety 4 9. Equipment and Supplies 4 10. Reagents and Standards 5 11. Sample Collection, Preservation, Shipment and Storage 6 12. Quality Control 6 13. Calibration and Standardization 8 14. Procedure 10 15. Data Reduction, Calculations and Loading 13 16. Method Performance 13 17. Pollution Prevention 14 18. Data Assessment and Criteria for Qua lity Control Measures 14 19. Corrective Actions for Out-Of-Control Data 15 20. Contingencies for Handling Out-Of-Control Or Unacceptable Data 15 21. Waste Management 16 22. References 16 23. Forms, Figures, Tables, Diagrams, Flowcharts, Attachments or Validation Data 16 APPENDIX A TROUBLESHOOTING 17 APPENDIX B CREATING A METHOD 18 APPENDIX C DQM PLAN 20 APPENDIX D MANIFOLD DIAGRAM 22 APPENDIX E MANIFOLD INSTALLATION/REMOVAL 23 APPENDIX F MAINTENANCE SCHEDULE 25

Analysis Corporation
SOP 4420 Automated Nitrate/Nitrite Analysis Revision 00
Effective Date: December 23, 2008 Page 3 of 25
STAT
1.0 Identification of Test Method SOP Title: Automated NO3/NO2, NO2 AND NO3 Analysis by SM 4500-NO3 I
2.0 Applicable Matrix or Matrices This method is used to determine the concentration of Nitrate/Nitrite as – mg N/L in aqueous samples, soils, wastes, and leachates. The lab follows the procedure found in 40CFR Part 136B to determine the MDL for each matrix type on an annual basis. See the STAT Analysis SOP 1210 for the MDL procedure, frequency and acceptance criteria. The MDLs measured by the lab and all supporting documentation is in the laboratory QA files for review. 3.0 Detection Limits The laboratory determined MDL must always be less than the reporting limit (RL). The RL will usually range from three to ten times the laboratory measured MDL but this relationship may vary dependent on dilution of sample aliquots, matrix interferences, or method-specified requirements.
The applicable range for aqueous samples is 0.2 - 20 mg N/L. The MDL for NO2 is 0.0321 mg N/L. The MDL of NO3 is 0.0857 mg N/L. The reporting limit for NO2 and NO3 is 0.2 mg N/L. 4.0 Scope and Application The method is designed for the analysis of aqueous samples. This method is restricted to use by or under the supervision of analysts experienced in the use of the Lachat Auto Analyzer. Note: Each analyst must demonstrate the ability to generate acceptable results with this method. 5.0 Summary of Method Nitrate is quantitatively reduced to nitrite by passage of the sample through a copperized cadmium column. Nitrite is determined by diazotizing with sulfanilamide followed by coupling with N-(1-naphthyl) ethylenediamine dihydrochoride. Absorbance of the color at 520 nm is proportional to the nitrate+nitrite in the sample. Nitrite alone can be determined by turning off the cadmium column. Nitrate is determined by subtracting nitrite results from nitrate plus nitrite results. Method Modifications from Reference Degassing to remove air bubbles is performed only if it is noticed that there are air spikes during analysis. 6.0 Definitions The STAT Analysis Corporation Quality Assurance Manual (QAM) contains the definitions of standard terms used in this SOP.

Analysis Corporation
SOP 4420 Automated Nitrate/Nitrite Analysis Revision 00
Effective Date: December 23, 2008 Page 4 of 25
STAT
7.0 Interferences
7.1 Residual chlorine can interfere by oxidizing the cadmium reduction column. Samples that contain large concentrations of oil and grease will coat the surface of the cadmium.
7.2 Sample turbidity may interfere. Turbidity can be removed by filtration through a 0.45 pore diameter membrane filter prior to analysis.
7.3 Low results can be obtained for samples that contain high concentration of iron and copper.
8.0 Safety
8.1 All samples must be assumed as hazardous and appropriate precautions taken during handling.
8.2 Safety glasses, gloves, lab coats and closed toe shoes are to be worn. 8.3 Other safety precautions must be conducted in accordance with the Chemical Hygiene Plan.
Other actions can also be applied if deemed necessary. A reference file of material safety data sheets (MSDS) is available in the laboratory for personnel involved in an analysis using chemicals.
8.4 The toxicity or carcinogenicity of each reagent used in this method has not been fully established. Each chemical should be regarded as a potential health hazard and exposure should be as low as reasonably achievable. Cautions are included for materials known to be extremely hazardous.
8.5 The following chemicals have the potential to be highly toxic or hazardous, for detailed explanation consults the MSDS.
Cadmium granules Ammonium hydroxide Sodium hydroxide Phosphoric acid Sulfanilamide 9.0 Equipment and Supplies
9.1 LaCHAT AutoAnalyzer consisting of the following components: 9.1.1 Autosampler Cetac 9.1.2 Reagent Pump 9.1.3 System Unit Lachat 8000 9.1.4 Computer 9.1.5 Printer
9.2 Centrifuge Tubes, 50 mL graduated 9.3 Volumetric Flasks, Class A: 1000mL, 250mL, 100mL, 50mL, 25mL with stoppers 9.4 Autopipetter: 0.010 to 0.10 mL, 0.10 to 1.0 mL, 1.0 to 5.0 mL
9.5 Test Tubes, 15 mL and Tube Racks 9.6 Plastic and glass bottles for solution storage

Analysis Corporation
SOP 4420 Automated Nitrate/Nitrite Analysis Revision 00
Effective Date: December 23, 2008 Page 5 of 25
STAT
10.0 Reagents and Standards The following reagents and standards are required to perform this procedure. When instructions are given on how to prepare a specific volume of a reagent or standard, larger or smaller volumes can be prepared as needed so long as the final concentrations remain the same. Any other deviations from the reagents or standards listed in this SOP could be detrimental to the quality of the data produced. Such deviations would have to be approved and documented (see 230 Corrective Action SOP).
10.1 Instructions for labeling and record keeping of reagents and standards are contained in SOP 1010 Standard and Reagent Preparation.
10.2 Reagents - In methods where the purity of reagents is not specified, analytical reagent grade
shall be used. Reagents of lesser purity than those specified by the test method shall not be used.
10.3 Use reagent water (1 Mohm) for all solutions. Degas reagents with helium if necessary to
prevent bubble formation.
10.4 Reagent 1. 15 N Sodium Hydroxide: Add 150 g NaOH very slowly to 250 ml of DI water. Cool and store in a plastic bottle.
10.5 Reagent 2 Sulfanilamide color reagent: In a 1 L volumetric flask add approximately 600
mL DI water, 100 mL 85% phosphoric acid, 40 g sulfanilamide, and 1.0 g N-(1-naphthyl) ethylenediamine dihydrochloride (NED). Dilute to the mark, and mix. Store in dark bottle. This solution is stable for one month.
10.6 Reagent 3. Ammonium Chloride Buffer: In a 1 liter volumetric flask dissolve 85.0 g ammonium chloride and 1.0 g Disodium Ethylenediamine Tetraacetate Dihydrate (Na2EDTA*2H2O) in about 800 ml water. Dilute to the mark and mix until dissolved. Adjust the pH to 8.5 with 15 N sodium hydroxide solution. This solution is stable for 6 month
10.7 Standards
10.7.1 At least one of the standards must be traceable to a NIST traceable source when available. The manufacturer should include a certificate of analysis for each standard. If one is not provided, contact the manufacturer. Retain all certificates in the designated binder (see SOP 1010 Reagent Receiving).
10.7.2 Standards must be prepared volumetrically using class A volumetric glassware, calibrated micropipettes, or gas tight syringes. Do not use disposable pipettes to prepare standards.
10.7.3 Nitrate Nitrogen Stock Calibration Standard: 1000 ppm NO3-N: Commercially Purchased. Store per manufacturer’s recommendations and shelf life. If shelf life is not stated, then this solution may be used for twelve months if stored in the original container at 0.1 - 6oC and shows no sign of deterioration.
10.7.4 Nitrite Nitrogen Stock Calibration Standard: 1000 ppm NO2-N: Commercially Purchased. Store per manufacturer’s recommendations and shelf life. If shelf life is not stated, then this solution may be used for twelve months if stored in the original container at 0.1 - 6oC and shows no sign of deterioration.
10.7.5 Nitrate Nitrogen Stock ICV/CCV Standard: 1000 ppm NO3-N: Commercially Purchased. Store per manufacturer’s recommendations and shelf life. If shelf life is

Analysis Corporation
SOP 4420 Automated Nitrate/Nitrite Analysis Revision 00
Effective Date: December 23, 2008 Page 6 of 25
STAT
not stated, then this solution may be used for twelve months if stored in the original container at 0.1 - 6oC and shows no sign of deterioration.
10.7.6 Nitrite Nitrogen Stock Calibration ICV/CCV Standard: 1000 ppm NO2-N: Commercially Purchased. Store per manufacturer’s recommendations and shelf life. If shelf life is not stated, then this solution may be used for twelve months if stored in the original container at 0.1 - 6oC and shows no sign of deterioration.
10.7.7 Working ICV STD, 5 ppm: Dilute 0.25 ml of Stock ICV/CCV STD to 50 ml DI. Prepare this solution fresh daily.
10.7.8 Working CCV STD, 10 ppm: Dilute 0.5 ml of Stock ICV/CCV STD to 50 ml with DI. Prepare this solution fresh daily.
10.7.8.1For LCS, 0.5 mL of 1000 ppm, dilute 0.5 mL of 1000mg/L in 50 mL of reagent water.
10.7.8.2For MS/MSD, dilute 0.5 of 1000 ppm in 50 mL of sample. 10.7.9 The Calibration Standards are prepared according to Table 1 below. Add listed
volumes of the Stock Calibration Standard to each flask, and dilute to mark with DI. Cap and mix will.
Table 1 Nitrate/Nitrite Calibration Standards
Calibration Standard Concentration, mg/L
Amount of Stock Calibration
Standard mL
Concentration of Stock Calibration Standard, mg/L
Final Volume, mL
20 1.0 1000 50 10 0.5 1000 50 5 0.25
1000 50
1 0.05 1000 50 .4 0.02 1000 50 .2 0.01 1000 50 0 0 0 50
11.0 Sample Collection, Shipment, Preservation and Storage Samples shall be placed on ice immediately after collection. The holding time is 28 days for a refrigerated sample (0.1 - 6oC) for total nitrate/nitrite with proper chemical preservation (pH < 4). The holding time for nitrate or nitrite is 48 hours from time of collection. 12.0 Quality Control The following details the QC requirements that apply to this analysis. Each Quality Control Indicator (QCI) provides information pertaining to either method or individual sample performance. Our goal is to produce defensible data of known and documented quality. The results of these QCI samples are used to assess the acceptability of data.

Analysis Corporation
SOP 4420 Automated Nitrate/Nitrite Analysis Revision 00
Effective Date: December 23, 2008 Page 7 of 25
STAT
12.1 Blanks
Method Blank analysis is performed to determine if any contamination is present in the analytical process and is used to evaluate acceptance of the batch of samples. A method blank shall be prepared once per preparation batch of 20 or less samples per matrix type (see Section 6 for definition of a prep batch). If more than 20 samples are prepared a second blank shall be prepared after the twentieth sample. The method blank shall be processed through all preparatory steps used for the samples, including cleanup procedures. The blank shall be analyzed using the same instrument and conditions as the samples.
12.2 Laboratory Control Sample (LCS)
The LCS is used to evaluate the performance of the total analytical system, including all preparation and analysis steps. The LCS shall be prepared once per preparation batch of 20 or less samples per matrix type. If more than 20 samples are prepared a second LCS shall be prepared after the twentieth sample. The LCS shall be processed through all preparatory steps used for the samples, including cleanup procedures. The LCS shall be analyzed using the same instrument and conditions as the samples.
12.3 Duplicates
Duplicates of field samples or of the LCS must be prepared in compliance with the method requirements and client directives. Note: The analysis of the Matrix Spike Duplicate (MSD) is used as a substitute for the laboratory duplicate. In those cases when there is insufficient sample to perform either a duplicate analysis or MSD analysis, the duplicate analysis of the LCS (LCS/LCSD) is used to judge the precision of the analytical results.
12.4 Matrix Spike and Matrix Spike Duplicate (MS/MSD)
MS/MSDs indicate the effect of the sample matrix on the precision and accuracy of the results generated using the selected method. This information does not determine the validity of the entire batch. MS/MSDs must be analyzed at a minimum of 1 per 20 samples per matrix per preparation procedure, or as specified by the required test method. If an MS/MSD pair is not analyzed in the preparation batch, an LCS/LCSD pair is analyzed.
Samples chosen for matrix spiking are rotated among different clients and/or different client projects. This is accomplished through communication between the Department Manager and the analyst. In addition, designated samples, as indicated by client request or contract requirement, are matrix spiked.
The MS/MSD pair shall be processed through all preparatory steps used for the samples. They shall be analyzed using the same instrument and conditions as the samples.

Analysis Corporation
SOP 4420 Automated Nitrate/Nitrite Analysis Revision 00
Effective Date: December 23, 2008 Page 8 of 25
STAT
13.0 Calibration and Standardization Initial Calibration (ICAL) In addition to achieving the reference method requirements for the minimum number of calibration standards and the acceptance criteria (statistics) for calibration curve fit, the following ICAL criteria also apply:
13.1 The ICAL must be a minimum of 5 standards, not including a blank. 13.2 The ICAL must be verified with a second source standard (ICV) prior to the analysis of
samples. 13.3 Results of samples not bracketed by the ICAL range must be qualified on the final report. If
possible, dilute the sample or extract and reana lyze in order to achieve a result within the calibrated range of the instrument.
13.4 The lowest calibration standard may establish the reporting limit: RL = 0.2mg/L. The RL
must be greater than or equal to the detection limit. 13.5 Samples must be quantitated from the initial calibration curve and may not be quantitated
from any instrument CCV. Initial Calibration Verification (ICV) In addition to the method requirements, the following ICV criteria also apply:
13.6 Must be a second source standard from the ICAL standards or from a different manufacturer lot number.
13.7 Must be traceable to NIST when available.
13.8 Must be analyzed when an ICAL is not performed on the day of analysis, prior to sample
analysis. Continuing Calibration Verification (CCV) In addition to the method requirements, the following CCV criteria also apply:
13.9 May be analyzed at the beginning of the batch to check the CCV recovery. 13.10 Must be analyzed after every 10 samples and at the end of each analytical batch. 13.11 If the CCV results obtained are outside the acceptance criteria, corrective actions must be
performed. If routine corrective actions fail to produce an acceptable second consecutive (immediate) CCV, then either the lab has to demonstrate performance after corrective action with two consecutive successful CCVs, or a new ICAL must be performed. If the instrument has not demonstrated acceptable performance, sample analyses cannot continue until a new

Analysis Corporation
SOP 4420 Automated Nitrate/Nitrite Analysis Revision 00
Effective Date: December 23, 2008 Page 9 of 25
STAT
ICAL is established and verified with an ICV. However, sample data associated with an unacceptable CCV may be reported as qualified data under the following special conditions:
13.11.1 When the acceptance criteria for CCV are exceeded high, i.e., high bias, and there are
associated samples that are non-detects, then those non-detects may be reported. Otherwise the samples affected by the unacceptable calibration verification must be reanalyzed after a new ICAL has been established, evaluated and accepted.
13.11.2 When the acceptance criteria for the CCV are exceeded low, i.e., low bias, those
sample results may be reported if they exceed a maximum regulatory limit/decision level. Otherwise the samples affected by the unacceptable verification must be reanalyzed after a new ICAL is established and verified with an ICV.
13.11.3 When the acceptance criteria for the CCV are exceeded and it is not possible to
reanalyze the sample due to limited sample quantity AND a new sample cannot be obtained by the laboratory, the data may be reported with the appropriate data qualifiers if the client has been contacted and agrees, in writing, to accept the qualified data.
13.12 Records: Initial and Continuing Calibration Records will contain, at a minimum, the
following:
1. Calibration date 2. Test method 3. Instrument 4. Analysis date 5. Each analyte name 6. Analyst's initials or signature 7. Standard Concentration (appropriate units) and number of standards 8. Response (appropriate units) 9. Calibration curve or response factor 10. Evaluation of and Statistics for ICAL curve fit in order to judge calibration curve
acceptance 11. Evaluation of and Acceptance Limits for ICV analysis in order to judge calibration curve
acceptance 12. Evaluation of and Acceptance Limits for CCV analysis in order to judge continuing
calibration acceptance 13. Calibration Standards and Reagent Solutions IDs

Analysis Corporation
SOP 4420 Automated Nitrate/Nitrite Analysis Revision 00
Effective Date: December 23, 2008 Page 10 of 25
STAT
Calibration Acceptance Summary:
Table 2 Calibration Requirements
QCI Frequency Standards Control Limits Corrective Action ICAL Daily or as needed, Minimum 5 standards,
see Table 1 for concentrations
r = 0.995 Correct problem then repeat initial calibration
ICV After each new ICAL And at the beginning of each analytical run.
5.0 mg/L ± 10% of true value Correct problem then repeat initial calibration
CCV Beginning (optional), every 10 samples, and end of the batch
10.0 mg/L ± 10% of true value Correct problem then repeat CCV or repeat initial calibration
ICB After ICV Reagent water <RL Correct problem then repeat CCV or repeat initial calibration
CCB After CCV Reagent water <RL Correct problem then repeat CCV or repeat initial calibration
Support Equipment Autopipettes - Check autopipette to ensure standardization is within control limits (see SOP 1040 for Pipette Calibration). Balances - Be sure the balance is checked prior to use and performance criteria are met (see SOP 1040 for Calibration of Balances). 14.0 Procedure
14.1 Instrument Start Up
14.1.1 Turn on the power to all modules by turning on the power strip and allow the autosampler to perform its startup routine. Wait until the autosampler stops with the probe above the wash bath.
14.1.2 If necessary, install the manifold on the channel you want to run. (See Appendix E.) 14.1.3 Make all the injection fluidic connections. 14.1.4 Make all the cell fluidic connections. 14.1.5 Set all pump tubes on the pump. (Varies method to method.) 14.1.6 Run reagent water through all the lines to make sure there are no leaks. 14.1.7 If there are no leaks, put actual reagents in line. 14.1.8 ALWAYS start pumping Buffer Solution FIRST. 14.1.9 Pour the calibration Standards into Standard vials, and place into the autosampler
Standards Rack. 14.1.10 Pour the Samples into test tubes and place into the Sample Rack. 14.1.11 If necessary, insert the interference filter into the upper slot in the detector.
14.2 Software Set up

Analysis Corporation
SOP 4420 Automated Nitrate/Nitrite Analysis Revision 00
Effective Date: December 23, 2008 Page 11 of 25
STAT
14.2.1 Double click on the Omnion FIA icon. Then click OK. The autosampler probe should go into the wash bath and the dilutor activity may be heard, the injection valves may turn to the inject state if they were not already there.
14.2.2 Log In with your user name and password. [User name: demo with no password will also get you in]. The Main Menu should appear.
14.2.3 From the Main Menu click on the Instrument button labeled FIA Instrume nt 1. Each valve allocated to this instrument will be cycled in turn from Load to Inject and back to Inject again. Omnion will automatically open the last Method and Tray that was used. (The names will appear at the top in the title bar.)
14.3 Open the Nitrate/Nitrite Method (To Create a Method see Appendix B)
14.3.1 Click on the Method button, or from the Main Menu click on File , then Open Method.
This will open the Open Method Dialog window. 14.3.2 Double click on the method file you want to open: Nitrite/Nitrate me t. or click once
then click on OK. 14.3.3 From the Main Menu click on the Instrument button labeled FIA Instrument 1. Each
valve allocated to this instrument will be cycled in turn from Load to Inject and back to Inject again. Omnion will automatically open the last Method and Tray that was used. (The names will appear at the top in the title bar.)
14.4 Opening and Editing the TRAY
14.4.1 Click on the Tray button or from the Main Menu, click on File, then Open Tray. 14.4.2 Click twice on the name of the tray you wish to open. Nitrate/Nitrite) The First rows of
the tray spreadsheet are blue. This denotes that these samples are actually Calibration Standards. This is from the method and will not change. The Sample Type is Cal Std. And the Level is NEVER 0, it will be a number from 1 to 14 (This will match the level in the Analyte Table in the method.) The Cup Number (Cup #) refers to the cup number in the Standard Rack and will be a number between 1 and 14.
14.4.3 Edit the Sample ID. Using the mouse, move the pointer to the cell and click once; type in the new ID. In the Sample Rack Loading Aid (Top Left) the sample cup you are editing will be in green.)
14.4.4 The Cup Numbers (Cup #) for sample will be anything between 1 to 90. 14.4.5 The Level column is 0 for all samples of Sample Type Unknown 14.4.6 The Reps for samples and standards is 1 or 2. 14.4.7 To Schedule manual QC See Appendix C (DQM Plan)
14.5 Click on the Run Tray button. (Or from the Main Menu, click on Tray then Run Tray.)
14.5.1 Leave the Method and Tray boxes empty to use the ones that are active (open). 14.5.2 In the Data File box enter the name for your run. i.e. 981006Ca. YYMMDD C (for
Calibration) and a (for number of the run... a b c...) The extension *.fdt (FIA Data) is used by default.
14.5.3 The Autosampler Position refers to the autosampler sample rack position; 1, 2 or 3. 14.5.4 Skip Recalibration Block Box can be checked when you want to run a tray that
contains Cal standards and samples but you want only want to run samples 14.5.5 While the tray is processing, you can view the peaks and runtime report. 14.5.6 If the baseline does not appear on the screen change Display options. 14.5.7 Click Method, then Display Options

Analysis Corporation
SOP 4420 Automated Nitrate/Nitrite Analysis Revision 00
Effective Date: December 23, 2008 Page 12 of 25
STAT
14.5.8 Specify the channel: 1. 14.5.9 Specify the voltage scale on the Y axis (i.e. -1 to 3). 14.5.10 Click OK.
14.6 Analyze samples for Total Nitrate/Nitrite by turning flow to the cadmium column on.
Analyze samples for Nitrite by turning cadmium column off. Click on the RUN button. The tray will start running. After the pump is allowed to pump at a normal speed for the period specified it the method, pump timing, the autosampler will move to the first calibration standard. The Standards and samples are done in Row order(on the computer screen), no matter where they are located on the autosampler tray.
14.7 While running you will see a STOP sign on the tool bar. To suspend the tray click on the
STOP sign. The Tray will pause and the computer gives you the choices of aborting or resuming the tray. At the end of the tray, after the last sample ID entered is reported, the sample probe should return to the rinse position and the STOP button will turn back into the RUN button.
Note : Cadmium Column always should be filled with buffer solution. Run buffer solution before turning off column, and after turning on column.
14.8 System Shutdown Procedure
14.8.1 Remove the reagent transmission lines and place into the rinse solution and pump for 5
minutes at standard speed. 14.8.2 Place the lines into reagent water and allow the system to rinse 5 to 10 minutes at
standard speed. 14.8.3 Remove the lines from the reagent water and allow all liquid to be pumped out of the
manifold. 14.8.4 Turn off the pump and release the pump tube cartridges tension. Press the tube cartridges
holders on the sides of the Isomatec pump. 14.8.5 Close all files 14.8.6 Switch off the master power strip
14.9 Documentation requirements. Record the following information in the appropriate logbook or
data file. Include any deviations from this procedure.
14.9.2 Analyst initials, date [and time if required by the specific project or QAPP] of analysis, sample number or ID, initial sample volume or weight processed, final digestate volume, calibration standard sample or solution identifier, QC sample or solution identifier, reagent solutions identifiers, any dilution information, [beginning and ending times of analytical steps if required by the specific project or QAPP], data file name or batch ID, instrument method name, visual observations, and any other information as deemed necessary
14.9.3 Print out a copy of the calibration curve used and datafile (run sequence).
14.10 Routine Maintenance – Record all maintenance in the logbook. See Appendix F

Analysis Corporation
SOP 4420 Automated Nitrate/Nitrite Analysis Revision 00
Effective Date: December 23, 2008 Page 13 of 25
STAT
15.0 Data Reduction, Calculations and Loading
15.1 The data system will then prepare a calibration curve by plotting response versus standard concentration. Sample concentration is calculated from the regression equation.
15.2 Report only those values that fall between the lowest and highest calibration standards.
Samples exceeding the highest standard must be diluted and reanalyzed or qualified.
15.3 Aqueous Samples: The concentration readout for aqueous samples is mg Nitrates/Nitrites as Nitrogen/L. It does not need further data reduction.
15.4 For sample results greater than the highest calibration standard, dilute the sample using DI to
bring within range.
15.5 The procedure for uploading data into the LIMS system is detailed in SOP 1400 LIMS.
15.6 Nitrite can be determined without cadmium column.
NO3/NO2 – NO2 = NO3 (Total – Nitrite = Nitrate) 16.0 Method Performance Demonstration of Capability (DOC) All parameters of interest must meet the method acceptance criteria before actual sample analysis begins. See SOP 1230 Training for the procedure to perform and document the DOC. The DOCs for the analysts performing this method are located in the analysts’ training form folders located in the QA office files. A quality control (QC) reference concentrate is required containing Nitrates/Nitrites at a concentration of 0.2 mg/L the Reporting level using the ICV/LCS solution. The QC reference sample is made using stock standards prepared independently from those used for calibration. For each analyte calculate the mean recovery (X) and standard deviation (s) and the average % Recovery (%R). Compare X and s and %R with the corresponding acceptance criteria for accuracy and precision, respectively. Note: For aqueous samples, X must be within 0.2 ± 0.04 mg/L and s must be less than 0.1mg/L and %R must be within 100 ± 20These limits are taken from established in-house criteria If X and s and %R for all analytes meet the acceptance criteria, the system performance is acceptable and analysis of actual samples can begin. If X or %R falls outside the range for accuracy, or s exceeds the precision limit, then the system performance is unacceptable for that analyte and corrective action must be taken. Comparison to Reference Method Data In-House Control Limits Method performance data is on file in the laboratory QC department. Comparison of method performance data for the laboratory to the reference method criteria occurs when laboratory in-house acceptance limits are generated. In-house generated data is compared to the specifications of the

Analysis Corporation
SOP 4420 Automated Nitrate/Nitrite Analysis Revision 00
Effective Date: December 23, 2008 Page 14 of 25
STAT
reference method. If the in-house limits are within the specifications of the reference method, the control limits are updated in LIMS. If the in-house limits are not within specifications, an investigation is performed to determine the cause(s) of the problem and a corrective action is completed. The analysis may continue until enough data points are collected to regenerate new control limits. Any QC data generated outside of reference method limits during that time frame is flagged. The laboratory maintains performance records to document the quality of data that is generated. Method accuracy for samples is assessed and records maintained. 17.0 Pollution Prevention The preparation of excessive volumes of laboratory reagents and standards shall be avoided so that waste and potential for pollution are minimized. Samples, reagents and standards shall be disposed in compliance with the laboratory waste disposal program and applicable waste disposal regulations. With the consent of the client, the samples may be returned to their origin for treatment.
Uncontaminated paper waste, glass and cans should be separated for recycling. Laboratory staff are required to protect the laboratory’s and our clients’ business information when disposing of recycling or waste from the facility. 18.0 Data Assessment and Criteria for Quality Control Measures The laboratory maintains records to document the quality of data that is generated. Ongoing quality checks are compared with established performance criteria to determine if the results of analyses meet the performance characteristics of the method. The data review is conducted according to SOP 1250 Data Review. Method Blank (MB) If the blank exceeds the RL (the lowest calibration standard), the source of contamination must be investigated and corrective actions taken.
Affected samples must be reprocessed and reanalyzed or Data must be appropriately qualified if:
1) The concentration of a targeted analyte in the blank is at or above the reporting limit as
established by the SOP or by regulation, AND is greater than 1/10 of the amount measured in any sample.
2) The blank contamination otherwise affects the sample results as per the test method
requirements or the individual project data quality objectives. Laboratory Control Sample (LCS) The results of the individual batch LCS are calculated in percent recovery (%R) and compared to established acceptance criteria (in-house limits). LCS %R limits are 100 ± 20%. If the LCS is outside the acceptance criteria, the analytical system is “out of control”. Any affected samples associated with an out

Analysis Corporation
SOP 4420 Automated Nitrate/Nitrite Analysis Revision 00
Effective Date: December 23, 2008 Page 15 of 25
STAT
of control LCS must be reprocessed and reanalyzed or the results reported with appropriate data qualifiers. Matrix Spikes The results from MS/MSD are primarily designed to assess the precision and accuracy of analytical results in a given matrix and are expressed as percent recovery (%R) and relative percent difference (RPD). See the STAT QAM, Section 5.4 for the calculation for RPD. Results are compared to established acceptance criteria (in-house limits). For aqueous samples, MS/MSD %R limits are 100 ± 25% and RPD limits are 20%. For soil samples, MS/MSD %R limits are 100 ± 25% and RPD limits are 20%. For matrix spike results outside established criteria corrective action must be documented, or the data for the spiked sample is reported with appropriate data qualifying codes. Duplicates The results from laboratory Duplicates are designed to assess the precision of analytical results in a given matrix and are expressed as relative percent difference (RPD). See the STAT QAM, Section 5.4 for the calculation for RPD. Results are compared to established acceptance criteria (in-house limits). RPD limits are 20%. For duplicates results outside established criteria corrective action must be documented or the data for the duplicate sample is reported with appropriate data qualifying codes.
19.0 Corrective Actions for Out-of-Control Data The process for handling corrective actions is found in SOP 230 Corrective Action. If the CCV, MB, LCS/LCSD, MS/MSD, or lab duplicate recovery of any parameter falls outside the designated acceptance range, the laboratory performance for that parameter is judged to be out of control, and the problem must be immediately identified and corrected. The analytical result for that parameter in the samples is suspect and is only reported for regulatory compliance purposes with the appropriate corrective action form. Immediate corrective action includes reanalyzing all affected samples by using any retained sample before the expiration of the holding time. Final data results must be qualified in the client report for reported results not meeting the laboratory-defined criteria.
1) Review standards preparation logbooks. Check all calculations and ensure dilution factors are properly recorded.
2) Re-prepare the suspected standard or QC sample to identify possible preparation errors of the
standard or QC sample.
3) Re-Analyze the samples when the CCV or LCS is not within acceptable limits.
4) Perform routine preventative maintenance following manufacturer's specification. Record all maintenance in the instrument logbook.
20.0 Contingencies for Handling Out-of-Control Or Unacceptable Data Every effort is made to prevent problems from occurring. When out of control or unacceptable data occurs the first option is to identify the problem and reanalyze the samples within the holding times.

Analysis Corporation
SOP 4420 Automated Nitrate/Nitrite Analysis Revision 00
Effective Date: December 23, 2008 Page 16 of 25
STAT
When this is not possible, the QA Manager and/or the Laboratory Director reviews data and discuss options with the client. Reanalysis or reporting the data with qualification is alternatives. Out of control or unacceptable data reported to the client must include the data qualifier, flag and discussion on the rationale for reporting.
The process for handling unacceptable and out of control data is found in section 11 of the Laboratory QAM. The reporting of data that is out of control must be approved and documented by Quality Assurance Manager and either the Technical Manager or the Laboratory Director.
21.0 Waste Management The STAT Analysis Corporation SOP 1130 Waste Disposal identifies proper waste management practices for the chemicals and biological materials used in this procedure. Samples are stored and discarded accordance with SOP 1130 Waste Disposal. 22.0 References
22.1 Method EPA 4500-NO3 I, U.S. EPA. Standard Methods for the Examination of Water and Wastewater (20th Edition).
22.2 Determination of Total Recoverable Nitrates/Nitrites by Flow Injection Analysis. QuikChem Method 10-107-04-1-A
22.3 . 22.1 STAT SOP 1040 General Laboratory Procedures 22.2 STAT SOP 1020 Glassware Cleaning 22.3 STAT SOP 1010 Standard and Reagent Preparation 22.4 STAT SOP 1000 Control and Use of Laboratory Notebooks 22.5 STAT SOP 230 Corrective Actions 22.6 STAT SOP 1400 LIMS 22.7 STAT SOP 1130 Waste Disposal 22.8 STAT SOP 003 Chemical Hygiene Plan 22.9 STAT SOP 1250 Data Review 22.10 STAT SOP 1230 Training 22.11 STAT SOP 1210 Method Detection Limits (MDLs) 22.12 STAT Analysis Corporation Quality Assurance Manual 22.13 QuikChem 8000 Automated Ion Analyzer Omnion FIA Software. 22.14 QuikChem 8000 Automated Ion Analyzer Continuum Series “Flow Injection Analyzer”
Hardware Installation and System Operation. 23.0 Forms, Figures, Tables, Diagrams, Flowcharts, Attachments or
Validation Data
23.1 Appendix A Troubleshooting 23.2 Appendix B Creating a Method 23.3 Appendix C DQM Plan 23.4 Appendix D Manifold Diagram 23.5 Appendix E Manifold Installation/ Removal 23.6 Appendix F Maintenance Schedule

Analysis Corporation
SOP 4420 Automated Nitrate/Nitrite Analysis Revision 00
Effective Date: December 23, 2008 Page 17 of 25
STAT
Appendix A – Trouble Shooting
Keep all modules clean and dry at all times.
Routine Maintenance (See Appendix F for the Maintenance Schedule) Pump
n After each day rinse the cartridges in reagent Water to wash any spills. Clean pump surfaces, except rollers, with a wet cloth. Dry all surfaces
n If rusty clean rollers with steel wool. A light coat of silicon spray can be applied by spraying on a lint free cloth and holding it to the moving rollers
n Check for wear, cracks or acid damage on the cartridges ad holders n Replace pump tubes that start to show signs of wear n If the pump tubes burst, clean all cartridges and holders, as well as, the pump,
immediately. n All surfaces should be kept clean. Use a damp cloth to clean the module surfaces.
Dry surfaces thoroughly. Valve Modules n Keep the instrument clean and dry at all times. n Replace o-rings once per month n When changing the o-rings, clean the valve ports with cotton swab and reagent water.
This will help remove any dirt or precipitate that may prevent a good seal. If a leak persists, replace the new o-rings and make sure the connector itself does not have precipitate on the thread.
n All surfaces should be kept clean. Use a damp cloth to clean the module surfaces. Dry all surfaces thoroughly.
n The internal sample loop valve will give thousands of injections without trouble. The rotor seal wears with use and is the only part that needs routine replacement.
Detector Modules and Flow Cell n If a flow cell appears to leak remove it immediately to keep all liquid form the
electronics inside the detector head. Instrument Troubleshooting
For problems with the instrument see the QuikChem 8000 Automated Ion Analyzer Continuum Series “Flow Injection Analyzer” Hardware Installation and System Operation Manual under the Troubleshooting Section.
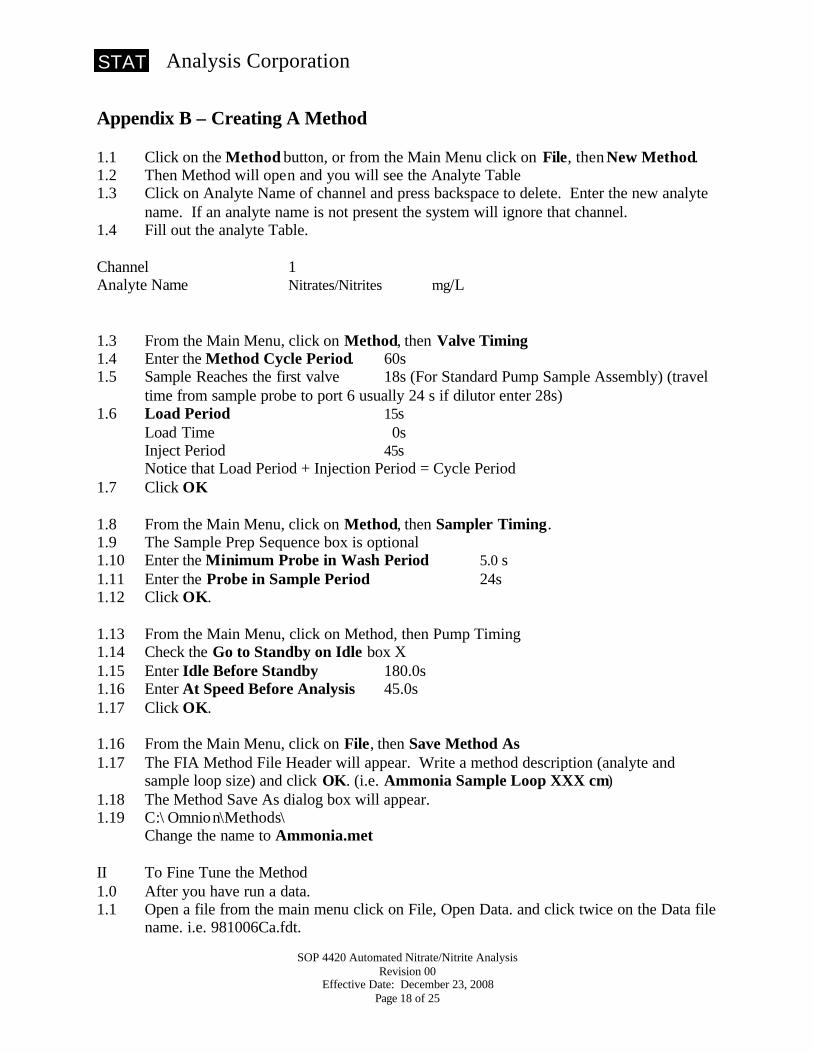
Analysis Corporation
SOP 4420 Automated Nitrate/Nitrite Analysis Revision 00
Effective Date: December 23, 2008 Page 18 of 25
STAT
Appendix B – Creating A Method 1.1 Click on the Method button, or from the Main Menu click on File, then New Method. 1.2 Then Method will open and you will see the Analyte Table 1.3 Click on Analyte Name of channel and press backspace to delete. Enter the new analyte
name. If an analyte name is not present the system will ignore that channel. 1.4 Fill out the analyte Table. Channel 1 Analyte Name Nitrates/Nitrites mg/L 1.3 From the Main Menu, click on Method, then Valve Timing 1.4 Enter the Method Cycle Period. 60s 1.5 Sample Reaches the first valve 18s (For Standard Pump Sample Assembly) (travel
time from sample probe to port 6 usually 24 s if dilutor enter 28s) 1.6 Load Period 15s Load Time 0s Inject Period 45s Notice that Load Period + Injection Period = Cycle Period 1.7 Click OK 1.8 From the Main Menu, click on Method, then Sampler Timing. 1.9 The Sample Prep Sequence box is optional 1.10 Enter the Minimum Probe in Wash Period 5.0 s 1.11 Enter the Probe in Sample Period 24s 1.12 Click OK. 1.13 From the Main Menu, click on Method, then Pump Timing 1.14 Check the Go to Standby on Idle box X 1.15 Enter Idle Before Standby 180.0s 1.16 Enter At Speed Before Analysis 45.0s 1.17 Click OK. 1.16 From the Main Menu, click on File, then Save Method As 1.17 The FIA Method File Header will appear. Write a method description (analyte and
sample loop size) and click OK. (i.e. Ammonia Sample Loop XXX cm) 1.18 The Method Save As dialog box will appear. 1.19 C:\ Omnion\Methods\
Change the name to Ammonia.met II To Fine Tune the Method 1.0 After you have run a data. 1.1 Open a file from the main menu click on File, Open Data. and click twice on the Data file
name. i.e. 981006Ca.fdt.

Analysis Corporation
SOP 4420 Automated Nitrate/Nitrite Analysis Revision 00
Effective Date: December 23, 2008 Page 19 of 25
STAT
1.2 Load the original method form this data by clicking on the Data menu the Load Method. 1.3 You should see the peaks on the screen. 1.4 Click on Data then Reanalyze Data. (Or click on the Reanalyze button.) 2.0 Fine Tuning the Threshold 2.1 Look before and after the tray to see some baseline. 2.2 From the menu click on Method, then Graphical Events Programming... 2.3 Click on Threshold. 2.4 The Status bar will prompt you to “Select Start of Baseline Section”. 2.5 Set the cursor at the beginning of the baseline region and click once. 2.6 You will be prompted to “Select End of Baseline Section”. 2.7 Move the mouse pointer to the end of the baseline region and click again. 2.8 Omnion calculates a Threshold value. 2.9 Click on OK to enter the value in the Analyte Table of your method 3.0 Fine Tuning the Peak Base Width 3.1 From the menu click on Method, then Graphical Events Programming... 3.2 Click on Peak Base Width. 3.3 You will be prompted to “Select Start of Peak” 3.4 Set the cursor at the beginning of the high standard and click once. 3.5 You will be prompted to “Select End of Peak” 3.6 Move the cursor to the end of the peak and click again. 3.7 Omnion calculates a Peak Base Width. 3.8 Click on OK to enter the value in the Analyte Table of your method 4.0 Save these new method parameters by clicking on File, then Save Method As. 5.0 Viewing a Method’s Calibration 5.1 Up to 4 replicates of each Standard can be applied to a method’s calibration. 5.2 If not already open, load the method form the data file by clicking on Data, Load Method. 5.3 Click on the button. (or from the main menu click on Method, then Review Analyte
Calibration Curve. The Review Analyte Calibration window will appear. 5.4 Click Fit, then Clear. to ‘Clear’ the Calibration Replicate Table. 5.5 Click Exit. 5.6 Click the Analyze button. The re-analysis occurs exactly as it did in the actual tray run. 5.7 Click on the Review Calibration button again to see the curve. 6.0 Editing the Calibration 6.1 Clicking twice on any of the results in the calibration replicate Table will turn it red and
make it unused in the calibration. 6.2 To Use the point again, click twice on it again, and it will turn form red back to blue.

Analysis Corporation
SOP 4420 Automated Nitrate/Nitrite Analysis Revision 00
Effective Date: December 23, 2008 Page 20 of 25
STAT
Appendix C – DQM Plan DQM Plan
Consists of one or several DQM Sets. Each Set has one or more samples. The DQM has 3 sections; the DQM Set box, the DQM Sample Box, and the Channel Data box.
1.0 Adding DQM Sets 1.1 Click Tray, then Load DQM. 1.2 In the DQM Set Box click on the drop-down button showing the DQM Set ID, type in a
new name. (Check Standards, Duplicates, Matrix Spikes) 1.3 For the Check Standards Set check the Automatic box X. 1.4 Click ADD to add the set. NOTE: Automatic Sets never have their sample info in the tray table and the samples are loaded in the standards rack. Manual sets have their sample info in the tray table and the samples are loaded in the sample rack. 2.0 Adding DQM Samples 2.1 In the DQM Sample Box, click on the drop-down button showing the DQM Sample ID
and type in a new name (ICB, ICV, CCV, CCB, Method Blank, Dup 1, Spike, Spike Dup)
2.2 Click on the Append button. 2.3 Replicates should be 2 2.4 Click on the drop-down button showing the Type and select the type of sample. (Blank,
Unspiked, Spiked, AbsChkStd, RelChkStd, Dup 1, Dup 2) 2.5 For the Automatic Check Samples enter the Standard Rack Cup. 3.0 Editing Channel Data information. 3.1 In the Channel Data Box, select the appropriate channel. 3.2 If you can’t see the Test 1 row, click on the Add Test button. 3.3 The Test Explanation spells out the test that will be done for this DQM Sample and
depends on what Type the DQM Sample is. 3.4 If the standard has a known concentration it needs to be entered in the Known Conc box
along with the Conc Units. 3.5 Enter the Test Limit. 10.000% difference. 3.6 Select a Fail Action from the drop-down menu. Recalibrate & Repeat, Alarm &
message . 3.7 Enter the Pass/ Fail Message. NOTE: A Test Passes if test value < = Test Limit A Test Fails if Test value > Test Limit 3.8 You can perform more then 1 test on each check sample. 4.0 Scheduling Automatic DQM Sets 4.1 From the Main Menu, click on Tray, then Auto DQM Schedule 4.2 Select the Auto DQM Set from the drop-down menu. 4.3 Check the box (es) for the frequency of the sample 4.4 Click OK.

Analysis Corporation
SOP 4420 Automated Nitrate/Nitrite Analysis Revision 00
Effective Date: December 23, 2008 Page 21 of 25
STAT
5.0 Inserting Manual DQM Sets 5.1 Click on the Tray Table button. 5.2 Click on the row number before which you want to insert the check sample. 5.3 From the Main Menu, click on Tray, then Manual DQM Insertion. 5.4 Click on the Manual DQM Set you wish to insert. 5.5 Enter the Sample ID’s of the DQM samples to reflect the actual identity of the samples.
(Note: The manual DQM sample rows are green.) 5.6 Renumber the Cup Numbers (Cup #) below the inserted Manual DQM Set by clicking
and dragging all the rows and cup numbers you wish to renumber. 5.7 Click on Tray, then Renumber Cups (or Ctrl-R) 5.8 Enter the Starting Number 5.9 Enter an Increment of 1. 5.10 Then click OK. 6.0 Calibration Pass/Fail Criteria 6.1 From the Main Menu, click on Method, then Calibration Failure Criteria 6.2 Select the appropriate channel. 6.3 Check the Minimum Correlation Coefficient (R2) Box and enter 0.995 6.4 Check the Maximum % Residual All Levels Box, and enter 10.0. 6.5 If the calibration passes, a message will be reported and the tray will continue to the nest
row. 6.6 If the calibration fails, a fail message will be reported and you will be given a choice to
Abort or continue the tray. 7.0 Save the DQM Plan 7.1 From the Main Menu, click File, then Save DQM Plan, or Save DQM Plan As... and
enter the File name Ammonia.dqm. The default extension is *.dqm.

Analysis Corporation
SOP 4250 Automated Ammonia Analysis Revision 00
Effective Date: March 1, 2004 Page 22 of 25
STAT
Appendix D – Manifold Diagram

Analysis Corporation
SOP 4250 Automated Ammonia Analysis Revision 00
Effective Date: March 1, 2004 Page 23 of 25
STAT
Appendix E – Manifold Installation/Removal Manifold Installation Procedure 1.0 Unwrap the transmission lines from around the manifold and place the manifold over the
sample processing module. 1.1 Remove the transmission lines from the union on the 650 cm side of the heating unit,
insert both ends through the hole in the manifold and reseat the manifold onto the sample processing module.
1.2 Make the Injection Valve Connections as follows: 1.3 Port 1 & 4 - The Sample Loop 0.8 mm i.d. length 75 cm. 1.4 Port 2 - Carrier line is connected to Port 2 -> from valve, disconnect from
Fitting and connect to port 2 0.8 mm id and 30 cm long. 1.4 Port 3 - 20 cm 0.8 mm id between port 3 and the fitting on the manifold
next to the label -> from valve where the carrier line was connected. 1.5 Port 5 - 15 cm 0.8 mm is between port 5 and the waste line. 1.6 Port 6 - Sample Line. 130 cm (Varies method to method) connected to the
probe on the autosampler, pump tube adapter, and 20 cm tubing connected to port 6 of valve.
2.0 Flow Cell Top tubing connected to waste line. Bottom line connected to the fitting in the manifold next to the label to flow cell ->. Attach one of the lines from the heater to the union going to the flow cell. Attach the other heater line to the pyridine-Barb. Acid Tee fitting.
3.0 Pump 3.1 Sample Line - Autosampler to injection valve 6. 3.2 Wash Line - Reagent water to wash reservoir on the autosampler 3.3 Reagents Lines- Varies from method to method sees Ammonia diagram. 3.4 On the Ismatec Pump Cartridges the arrows point towards the System Unit with the
tension lever on the left. 3.5 Place all of the reagents lines into corresponding containers or Reagent water. 3.6 Move tension levers to the maximum tension (Top Far Right Position) 3.7 Clamp down all pump tube cartridges. (Press down one side at a time.) 3.8 Move tension lever back from the top far right until it makes a clicking sound. 3.9 Set the reagent pump speed to 35. 3.10 Turn on the pump. 3.11 Depress the green button to turn the pump ON. The System Unit will take control over
the pump speed. (The yellow button is the override standby button.) 3.12 Check to confirm that the probe wash reservoir is filing with rinse water. 3.13 Check for Leaks on the manifold, valve, flow cell or any of the connections. 3.14 Do NOT leave any pump tubes clamped down when the pump is shut off for more then a
few minutes. 3.15 To Remove cartridges, Press the sides of the pump holder on which the cartridge is
engaged. 4.0 Insert the interface filter into the detector module.
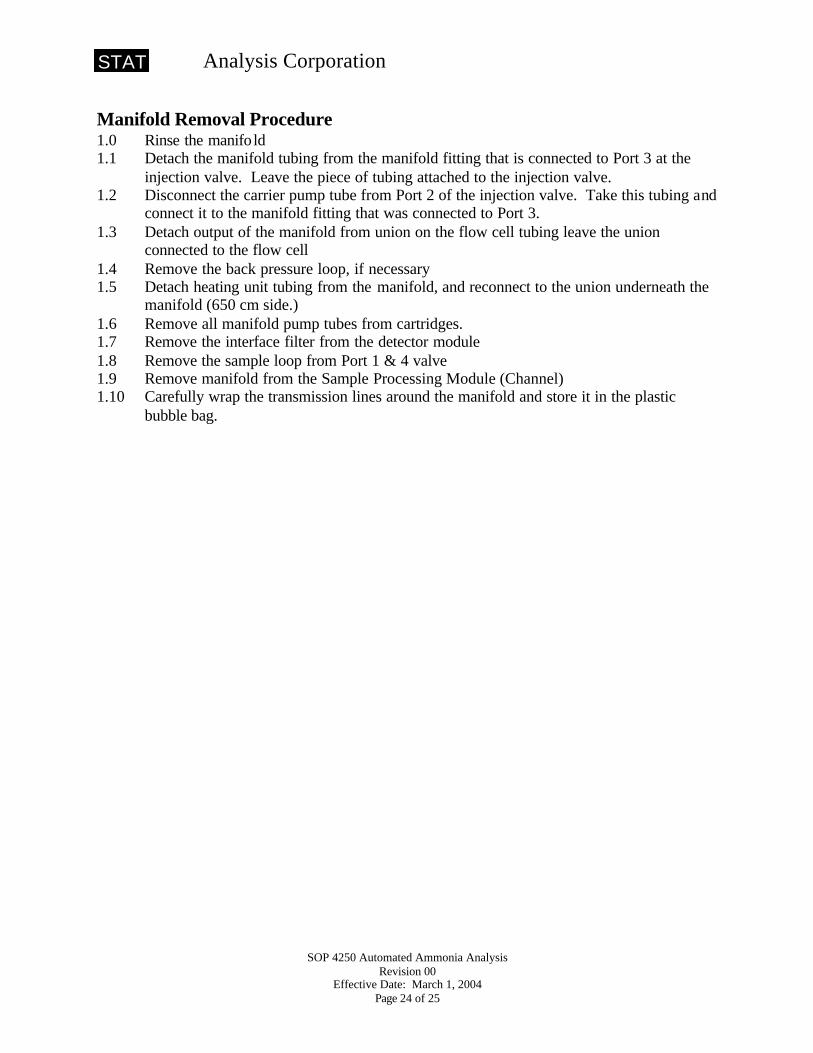
Analysis Corporation
SOP 4250 Automated Ammonia Analysis Revision 00
Effective Date: March 1, 2004 Page 24 of 25
STAT
Manifold Removal Procedure 1.0 Rinse the manifold 1.1 Detach the manifold tubing from the manifold fitting that is connected to Port 3 at the
injection valve. Leave the piece of tubing attached to the injection valve. 1.2 Disconnect the carrier pump tube from Port 2 of the injection valve. Take this tubing and
connect it to the manifold fitting that was connected to Port 3. 1.3 Detach output of the manifold from union on the flow cell tubing leave the union
connected to the flow cell 1.4 Remove the back pressure loop, if necessary 1.5 Detach heating unit tubing from the manifold, and reconnect to the union underneath the
manifold (650 cm side.) 1.6 Remove all manifold pump tubes from cartridges. 1.7 Remove the interface filter from the detector module 1.8 Remove the sample loop from Port 1 & 4 valve 1.9 Remove manifold from the Sample Processing Module (Channel) 1.10 Carefully wrap the transmission lines around the manifold and store it in the plastic
bubble bag.

Analysis Corporation
SOP 4250 Automated Ammonia Analysis Revision 00
Effective Date: March 1, 2004 Page 25 of 25
STAT
Appendix F – Maintenance Schedule All listed maintenance is performed as needed. Following is a checklist of items along with the maintenance that may need to be performed. It is the instrument analyst’s responsibility to check the condition of the instrument daily and perform any necessary maintenance to insure the instrument is operating correctly. AutoSampler Clean Surfaces AutoDilutor Clean Surfaces Prime dilutor with reagent water after using any other diluent Pump Clean Surfaces Rinse cartridges Detector Dry and clean all Surfaces System Unit Keep Dry and Clean Injection Valves Clean Ports and valve connections Autosampler Clean rods/ moving parts Pump Replace pump tubes as needed Clean pump tube adapters Manifold Clean union and tee as needed Injection valves Replace o-rings Manifold Replace o-rings Manifold Check all tubing and replace as needed Flow Cells Check and replace flares and o-rings as needed Computer Clean hard drive


Analysis Corporation
SOP Title: TDS, TSS, TS Revision 00
Effective Date: December 23, 2008 Page 2 of 13
\\Harrison\d\Quality Control\Quality Manual & SOPs\4000 Anaytical SOPs\SOP 4482\SOP4482 Percent Moisture.doc
STAT
Table of Contents Title Page 1 Table of Contents 2 1. Identification of Test Methods 3 2. Applicable Matrix or Matrices 3 3. Detection Limits 3 4. Scope and Application 3 5. Summary of Test Method 3 6. Definitions 4 7. Interferences 4 8. Safety 5 9. Equipment and Supplies 5 10. Reagents and Standards 6 11. Sample Collection, Preservation, Shipment and Storage 6 12. Quality Control 6 13. Calibration and Standardization 7 14. Procedure 7 15. Data Reduction, Calculations and Loading 9 16. Method Performance 10 17. Pollution Prevention 11 18. Data Assessment and Criteria for Quality Control Measures 11 19. Corrective Actions for Out-Of-Control Data 12 20. Contingencies for Handling Out-Of-Control Or Unacceptable Data 12 21. Waste Management 13 22. References 13 23. Forms, Figures, Tables, Diagrams, Flowcharts, Attachments or Validation Data 13

Analysis Corporation
SOP Title: TDS, TSS, TS Revision 00
Effective Date: December 23, 2008 Page 3 of 13
\\Harrison\d\Quality Control\Quality Manual & SOPs\4000 Anaytical SOPs\SOP 4482\SOP4482 Percent Moisture.doc
STAT
1.0 Identification of Test Method
SOP Title: Total Dissolved Solids(TDS), Total Suspended Solids(TSS), and Total Solids(TS) 2.0 Applicable Matrix or Matrices This method is applicable to the following matrices: drinking water, surface and saline water, solid, and multiphasic wastes.
3.0 Detection Limits
The applicable range for Total Suspended Solids (TSS) is 4 to 20,000 mg/L. The Method Detection Limit for TSS is 3.8 mg/L. The reporting limit for TSS is 8 mg/L.
The applicable range for Total Dissolved Solids (TDS) and Total Solids (TS) is 12 to 20,000 mg/L. The Method Detection Limit for TDS and TS is 3.1 mg/L. The reporting limit for TDS and TS is 6 mg/L.
The Method Detection Limits for Volatile solids (VS) and fixed solids (FS) have not been determined at this time.
4.0 Scope and Application
4.1 Solid analyses are important in the control of wastewater treatment processes. 4.2 Total Suspended Solids can include various materials including industrial wastes,
sewage, etc. and is often used to measure turbidity in water. 4.3 Total Dissolved Solids is used to estimate the quality of drinking water because it
represents the amount of dissolved ions in water. 4.4 Total Volatile Solids are those solids lost on ignition (heating to 550oC.) They are useful
because they give a rough approximation of the amount of organic matter present in the solid fraction of wastewater, activated sludge and industrial wastes
NOTE: Each analyst must demonstrate the ability to generate acceptable results with this method.
5.0 Summary of Test Method
5.1 Total Suspended Solids
The sample is shaken and filtered through a preweighed 1.5 micron glass filter, which is dried to a constant weight in an oven at 103-105oC. The trapped solids and filter are cooled in a desiccator, weighed, and calculations perform for TSS.

Analysis Corporation
SOP Title: TDS, TSS, TS Revision 00
Effective Date: December 23, 2008 Page 4 of 13
\\Harrison\d\Quality Control\Quality Manual & SOPs\4000 Anaytical SOPs\SOP 4482\SOP4482 Percent Moisture.doc
STAT
5.2 Total Dissolved Solids The sample is shaken and filtered through a 1.5-micron glass filter. The filtrate is collected in a preweighed beaker. It is dried to a constant weight in an oven at 180 + 2oC, then cool to room temperature, weighed, and calculations perform for TDS.
5.3 Total Solids
The sample is shaken and poured through an evaporating dish and dried to a constant weight after oven drying at 103-105oC, cooled in a dessicator and weighed.
5.4 Method modifications from Reference –
Duplicate samples must be within 10% (5% - 2540C)
6.0 Definitions
The STAT Analysis Corporation Quality Assurance Manual (QAM) contains the definitions of standard terms used in this SOP.
Preparation batch - composed of one to 20 environmental samples of the same NELAC-defined matrix, meeting the above-mentioned criteria and with a maximum time between the start of processing of the first and last sample in the batch to be 24 hours (NELAC).
Analytical batch - composed of prepared environmental samples (extracts, digestates or concentrates) that are analyzed together as a group. An analytical batch can include prepared samples originating from various environmental matrices and can exceed 20 samples (NELAC).
Total Suspended Solids (TSS)-solids that are trapped by a filter, expressed as mg/L (also known as filterable residue)
Total Dissolved Solids (TDS) - (also known as non-filterable residue) -solids remaining after evaporation of a sample that has been passed through a filter, expressed as mg/L
Total Solids (TS) - (also known as Total Residue) –After oven drying at 103-105oC, expressed as mg/L
Fixed Solids (FS) – solids remaining from TSS after ignition at 550 oC, expressed as mg/L
Volatile Solids (VS) – solids lost after ignit ion at 550 oC, expressed as mg/L
7.0 Interferences
7.1 Highly mineralized waters with large amounts of calcium, magnesium, chloride and/or sulfate may be hygroscopic and require longer drying, desiccation, and rapid weighing.
7.2 Samples high in bicarbonate require a longer drying time at 180oC (for TDS) to insure
complete conversion of bicarbonate to carbonate.

Analysis Corporation
SOP Title: TDS, TSS, TS Revision 00
Effective Date: December 23, 2008 Page 5 of 13
\\Harrison\d\Quality Control\Quality Manual & SOPs\4000 Anaytical SOPs\SOP 4482\SOP4482 Percent Moisture.doc
STAT
7.3 Too much residue in the aluminum dish can reduce the amount of water that can be evaporated during drying. Samples containing high amounts of minerals and other hygroscopic materials may require a smaller sample size to help insure removal of all moisture.
8.0 Safety
8.1 All samples must be assumed as hazardous and appropriate precautions taken during handling.
8.2 Safety glasses, gloves, lab coats and closed toe shoes are to be worn. 8.3 Other safety precautions must be conducted in accordance with the Chemical Hygiene
Plan. Other actions can also be applied if deemed necessary. A reference file of material safety data sheets (MSDS) is available in each room for personnel involved in an analysis using chemicals.
8.4 The toxicity or carcinogenicity of each reagent used in this method has not been fully
established. Each chemical should be regarded as a potential health hazard and exposure should be as low as reasonably achievable. Cautions are included for known extremely hazardous materials.
8.5 A reference file of material safety data sheets (MSDS) is available in the lab for personnel involved in any analysis using chemicals.
9.0 Equipment and Supplies
The following apparatus is recommended for performing this procedure. Equivalent items can be used, if with their use, the analytical and QA/QC requirements in this SOP can be met.
9.1 Whatman filters – AH 934 55mm, porosity: fine(1.5 microns) glass fiber filters
9.2 Disposable aluminum dishes – 75mm diameter
9.3 Porcelain crucibles – (31 x 26 mm) diameter x height (mL 10) and (35 x 29) (mL 15)
9.4 Oven for operation to 100 ± 5oC and 180 ± 5oC 9.5 Muffle furnace for operation up to 550 oC
9.6 250 mL, 500mL, and 1000mL graduated cylinders (Pyrex)
9.7 Forceps
9.8 Filter flask - 250 mL, 500mL
9.9 Analytical balance capable of weighing to + 0.0001g.

Analysis Corporation
SOP Title: TDS, TSS, TS Revision 00
Effective Date: December 23, 2008 Page 6 of 13
\\Harrison\d\Quality Control\Quality Manual & SOPs\4000 Anaytical SOPs\SOP 4482\SOP4482 Percent Moisture.doc
STAT
9.10 Desiccant Blue (97% CaSO4 and 3% CoCl2) and white (100% CaSO4) A mixture of 10% blue and 90% white should be used in the desiccator. When the desiccant turns from blue to pink (indicating water absorption), heat in an oven at 180 oC overnight to drive off moisture.
9.11 Desiccator
9.12 Buchner funnels w/rubber stoppers-56mm (top diameter) 42mm (perforated diameter)
9.13 150, 250, 400 mL glass beakers (Pyrex)
9.14 Thermometer (-10oC to 260oC)
9.15 Steam bath
10.0 Reagents and Standards 10.1 Deionized water – ASTM type 2 reagent grade water
10.2 Sodium Chloride – (reagent grade) Dry in an oven at 180oC for 1 hour and store in a
tightly sealed container in a dessicator. Shelf life is 5 years.
10.3 Diatomaceous Earth (DE) - Dry in an oven at 180oC for 1 hour and store in a tightly sealed container in a dessicator. Shelf life is 5 years.
10.4 Stock solution for Laboratory Control Sample (LCS) for TDS/TSS /TS– Weigh out 2
grams of DE and 1 grams of sodium chloride. Add to 1000 ml of reagent water, mix well and store in a plastic bottle at room temperature. Shelf life is one year. T.V. for TSS is 2,000 mg/L and TDS is 1,000 mg/L.
11.0 Sample Collection, Preservation and Handling
Samples should be analyzed as soon as possible. No preservation is needed. Samples must be analyzed within seven days from the time of collection. Store at 0.1 – 6 oC until analysis.
12.0 Quality Control
12.1 Method Blank A Method Blank analysis is performed to determine if any contamination is present in the analytical process and is used to evaluate acceptance of the batch of samples. A Method Blank must be processed through the same conditions as the associated samples for TSS and TDS using reagent water. The Method Blank is of a similar matrix (e.g. reagent water) and is free of analytes of interest.

Analysis Corporation
SOP Title: TDS, TSS, TS Revision 00
Effective Date: December 23, 2008 Page 7 of 13
\\Harrison\d\Quality Control\Quality Manual & SOPs\4000 Anaytical SOPs\SOP 4482\SOP4482 Percent Moisture.doc
STAT
12.2 Laboratory Control Sample (LCS) - The LCS is used to evaluate the performance of the total analytical system, including all preparation and analysis steps. The LCS is a controlled matrix (e.g., reagent water, Ottawa sand, glass beads, etc.), known to be free of analytes of interest, spiked with known and verified concentrations of analytes. Alternatively the LCS may consist of a media containing known and verified concentrations of analytes or as Certified Reference Material (CRM). All LCS analyte concentrations must be within the calibration range. The LCS must be analyzed at a minimum of once per preparation batch.
12.3 Duplicates - Duplicates are defined as replicate aliquots of the same sample taken
through the entire analytical procedure. The result from this analysis is an indication of the precision of the analytical method. The duplicate provides a usable measure of precision only when target analytes are found in the sample chosen for duplication. Duplicates are performed on replicate aliquots of actual samples. The duplicate analysis must be analyzed at a frequency of at least once per 20 samples per preparation batch.
12.4 MS/MSDs are not applicable to this method.
13.0 Calibration and Standardization
13.1 Balances need to be checked daily with the appropriate weights prior to use (refer to SOP 1040 General Laboratory Practices).
13.2 Thermometers - Check thermometers to ensure the calibration is not expired (refer to SOP 1040 General Laboratory Practices for Thermometer Calibration).
14.0 Procedure Analysis for all procedures should be done on a well-mixed sample. Remove any large objects or paper from the aliquot being used for the test. Note in the logbook that large objects were not included in the analysis. If analysis is requested by the customer on the complete sample, large object(s) must be cut or crushed to a small size in order to be included with the rest of the sample. Check with the Project Management or the Department Manager when testing any samples, which require processing as above.
Note: Always use clean forceps to transfer the filter.
14.1 Total Suspended Solids (TSS)
Filter Conditioning
14.1 Set up filtraton apparatus. Place the filter in the Buchner funnel, wet with reagent
water and apply vacuum. Pre-wash the filter with three 20 ml portions of reagent water and discard. When all water has been vacuumed through the filters, place the filters on aluminum weighing dishes in a 103° -105°C oven for 20 minutes to dry. (If volatile suspended solids are to be analyzed, move the dry filters into a preheated

Analysis Corporation
SOP Title: TDS, TSS, TS Revision 00
Effective Date: December 23, 2008 Page 8 of 13
\\Harrison\d\Quality Control\Quality Manual & SOPs\4000 Anaytical SOPs\SOP 4482\SOP4482 Percent Moisture.doc
STAT
550°C muffle furnace for 15 minutes); if the volatile portion does not need to be determined, place the filters and aluminum weighing dishes into a desiccator to cool and skip to step 3.
14.2 Remove the filters and aluminum weighing dish from the muffle furnace and place
on a clean heat resistant surface. Allow to cool for one minute before placing in the desiccator.
14.3 Cool the filters to ambient temperature in the desiccator before use. Washed filters
and aluminum weighing dishes should be stored in a desiccator. 14.4 Record in the logbook the weight of a preconditioned filter and aluminum dish. Set
up the filtration unit. Using tweezers, transfer the filter to the buchner funnel. Wet the filter with reagent grade water and turn on the vacuum to seal the filter.
14.5 Shake the sample and pour 200 mL of sample into a 250 mL graduated cylinder
(note: For TSS, a different sample size may be used as long as the total amount of residue on the filter paper does not exceed 200 mgs). For the Method Blank analysis use at least as much reagent water as the volume in the samples.
14.6 Filter the sample and wash the filter paper and graduated cylinder with three
successive 10 mL volumes of reagent water. Wash the sides of the funnel to transfer all solids onto the filter paper. Continue the vacuum filtration until all the liquid has passed through and the filter appears dry. (Keep the filtrate if TDS is needed.)
14.7 Remove the filter and place on the aluminum dish. Dry at 103-105oC for at least 1
hour. Cool in a desiccator and record the weight in the logbook.
Note: The final weight should not be more than 200mg. If greater than this restart with a smaller sample size. 14.8 Place the filter and aluminum dish in the oven. Dry at 103-105oC for 15 minutes.
Cool in a desiccator and record the weight in the logbook.
14.9 Repeat this procedure until the change in the weight of the residue remains within 4% or less than 0.5 mg from one weighing to the next. (This is referred to as constant weight.)
Total Dissolved Solids (TDS)
14.10 Heat a clean glass beaker for one hour at 180 + 2oC in an oven. 14.11 Cool slightly and store in a desiccator until needed. 14.12 Weigh the beaker immediately prior to use. 14.13 Perform Step 14.1 14.14 Perform step 14.6 to obtain the filtrate. 14.15 Pour the filtrate into the beaker and rinse the filter flask three times with reagent
water.

Analysis Corporation
SOP Title: TDS, TSS, TS Revision 00
Effective Date: December 23, 2008 Page 9 of 13
\\Harrison\d\Quality Control\Quality Manual & SOPs\4000 Anaytical SOPs\SOP 4482\SOP4482 Percent Moisture.doc
STAT
14.16 Place the beaker in the oven at 180 + 2oC. Evaporate to dryness for at least 1 hour.
14.17 Cool slightly and store in a desiccator until ambient temperature is reached. Record the weight in the logbook.
14.18 Repeat steps 14.15 and 14.16 until the change in the weight of the residue remains within 4% or less than 0.5 mg from one weighing to the next.
Total Solids (TS) 14.19 If volatile solids are to be measured ignite clean aluminum evaporating dish at 550 oC
for 1 hour in a muffle furnace. If only total solids are to be measured, heat a clean dish to 103-105 oC for one hour. Store cooled dish in dessicator. Weigh immediately before use.
14.20 Choose a sample volume that will yield a residue between 2.5 and 200 mg. Stir sample with magnetic stir bar and pipette a measured volume from the middle of the sample, but off center from the vortex to a preweigh dish. Evaporate to dryness in a drying oven. If necessary add successive sample portions to the same dish after evaporation and dry in oven. Oven temperature may need to be lowered to prevent boiling and splattering of sample during drying.
14.21 Dry for at least one hour at 103-105 oC. Cool dish and dessicate to ambient temperature. Record the weight and place in oven for 15 minutes. Remove, cool and dessicate. Reweigh and repeat drying until a constant weight is achieved.
Volatile Solids (VS)/ Fixed Solids (FS) 14.18 Record the weight of the dried filter, residue and aluminum dish from step 14.9 or
14.20 and place in a preheated muffle furnace at 550oC for 15 minutes. 14.19 Remove and let filter and aluminum dish cool partially in air until most of the heat
has been dissipated (about one minute). (Alternately place in oven at 105oC for at least 5 minutes).
14.20 Transfer to a desiccator for final cooling. Do not overload desiccator. Weigh the filter and aluminum dish as soon as it has cooled to ambient temperature.
14.21 Repeat cycle of igniting, cooling, desiccating, and weighing until a constant weight is obtained or until weight change is le ss than 4% or 0.5 mg, whichever is less.
15.0 Data Reduction, Calculations, and Loading
15.1 TSS as mg/L = (A-B) x 1000/ sample volume L
Where A = weight of filter and dish + residue in grams B = weight of filter and dish in grams
15.2 TDS as mg/L = (A-B) x 1000/sample volume L
Where A = weight of beaker + filtrate in grams B = weight of the beaker in grams

Analysis Corporation
SOP Title: TDS, TSS, TS Revision 00
Effective Date: December 23, 2008 Page 10 of 13
\\Harrison\d\Quality Control\Quality Manual & SOPs\4000 Anaytical SOPs\SOP 4482\SOP4482 Percent Moisture.doc
STAT
15.3 Total Volatile Solids = (A-B) x 1000/ sample volume L
A = weight of residue + dish before ignition in grams B = weight of residue + dish or filter after ignition in grams
15.4 Total Fixed Solids = (B-C) x 1000/ sample volume L
B = weight of residue + dish or filter after ignition in grams C= weight of dish or filter in grams
The procedure for uploading data into the LIMS system is detailed in SOP 1400 LIMS. 16.0 Method Performance
All parameters of interest must meet the method acceptance criteria before actual sample analysis begins. See SOP 1230 Training for the procedure to perform and document the DOC. The DOCs for the analysts performing this method are located in the analysts’ training form folders located in the QA office files. A quality control (QC) reference concentrate is required for each procedure using the LCS Analyze four aliquots for TDS using the LCS standard stock. Dilute 24 mL of LCS stock to 1000mL with reagent water. Calculate the mean recovery (X) and standard deviation (s) and the average % Recovery (%R). Compare X and s and %R with the corresponding acceptance criteria for accuracy and precision, respectively. Note: X must be within 24 ± 4.8 mg/L and s must be less than 4.8 mg/L and %R must be within 100 ± 20%. Analyze four aliquots for TSS and using the LCS standard stock. Dilute 4 mL of LCS stock to 500mL with reagent water for each TSS aliquot. Calculate the mean recovery (X) and standard deviation (s) and the average % Recovery (%R). Compare X and s and %R with the corresponding acceptance criteria for accuracy and precision, respectively. Note: X must be within 16 ± 3.2 mg/L and s must be less than 3.2 mg/L and %R must be within 100 ± 20%. Analyze four aliquots for TS using the LCS standard stock. Dilute 48 mL of LCS stock to 1000mL with reagent water for each TS aliquot. Calculate the mean recovery (X) and standard deviation (s) and the average % Recovery (%R). Compare X and s and %R with the corresponding acceptance criteria for accuracy and precision, respectively. Note: X must be within 72 ± 7.2 mg/L and s must be less than 7.2 mg/L and %R must be within 100 ± 20% These limits are taken from established in-house criteria. If X and s and %R for all analytes meet the acceptance criteria, the system performance is acceptable and analysis of actual samples can begin. If any individual X or %R falls outside the range for accuracy, or any

Analysis Corporation
SOP Title: TDS, TSS, TS Revision 00
Effective Date: December 23, 2008 Page 11 of 13
\\Harrison\d\Quality Control\Quality Manual & SOPs\4000 Anaytical SOPs\SOP 4482\SOP4482 Percent Moisture.doc
STAT
individual s exceeds the precision limit, then the system performance is unacceptable for that analyte and corrective action must be taken.
17.0 Pollution Prevention
Samples shall be disposed in compliance with the lab waste disposal program and applicable waste disposal regulations.
18.0 Data Assessment and Criteria for Quality Control Measures The laboratory must maintain records to document the quality of data that is generated. Ongoing data quality checks are compared with established performance criteria to determine if the results of analyses meet the performance characteristics of the method. When results of QC samples indicate atypical method performance, a calibration verification standard is used to confirm the measurements were performed in an in-control mode of operation. The data review is conducted according to SOP 1250 Data Review. Method Blank (MB) If the blank exceeds the RL (usually the lowest calibration standard), the source of contamination must be investigated and corrective actions taken.
Affected samples must be reprocessed and reanalyzed or Data must be appropriately qualified if:
1) The concentration of a targeted analyte in the blank is at or above the reporting limit as
established by the SOP or by regulation, AND is greater than 1/10 of the amount measured in any sample.
2) The blank contamination otherwise affects the sample results as per the test method requirements
or the individual project data quality objectives. Laboratory Control Sample (LCS) The results of the individual batch LCS are calculated in percent recovery (%R) and compared to established acceptance criteria (in-house limits). LCS %R limits are 100 ± 20% for both aqueous and soil samples. If the LCS is outside the acceptance criteria, the analytical system is “out of control”. Any affected samples associated with an out of control LCS must be reprocessed and reanalyzed or the results reported with appropriate data qualifiers. Matrix Spikes Not needed for these methods. Duplicates The results from laboratory Duplicates are designed to assess the precision of analytical results in a given matrix and are expressed as relative percent difference (RPD). See the STAT QAM, Section 5.4 for the

Analysis Corporation
SOP Title: TDS, TSS, TS Revision 00
Effective Date: December 23, 2008 Page 12 of 13
\\Harrison\d\Quality Control\Quality Manual & SOPs\4000 Anaytical SOPs\SOP 4482\SOP4482 Percent Moisture.doc
STAT
calculation for RPD. Results are compared to established acceptance criteria (in-house limits). RPD limits are 20 %. For duplicates results outside established criteria corrective action must be documented, or the data for the duplicate sample is reported with appropriate data qualifying codes.
19.0 Corrective Actions for Out of Control Data The process for handling out of control data is found in SOP 230 Corrective Action.
If the Method Blank, LCS, or lab duplicate of any parameter falls outside the designated acceptance range, the laboratory performance for that parameter is judged to be out of control, and the problem must be immediately identified and corrected. The analytical result for that parameter in the samples is suspect and is only reported for regulatory compliance purposes with the appropriate corrective action form. Immediate corrective action includes reanalyzing all affected samples by using any retained sample before the expiration of the holding time. Final data results must be qualified in the client report for reported results not meeting the laboratory-defined criteria.
1) Review standards preparation logbooks. Check all calculations and ensure dilution factors are properly recorded.
2) Re-prepare the suspected standard or QC sample to identify possible preparation errors of the standard or QC sample.
3) Re-Analyze the samples when the LCS or Duplicate is not within acceptable limits. 4) Perform routine preventative maintenance following manufacturer’s specification.
Record all maintenance in the instrument logbook.
20.0 Contingencies for Handling Out-of-Control or Unacceptable Data Every effort is made to prevent problems from occurring. When out of control or unacceptable data occurs the first option is to identify the problem and reanalyze the samples within the holding times. When this is not possible, the QA Manager and/or the Laboratory Director review the data and discuss options with the client. Reanalysis or reporting the data with qualifications is an alternative. Out of control or unacceptable data reported to the client must include the data qualifier, flag and discussion on the rationale for reporting.
Holding time exceedance, or improper preservation are noted on the corrective action form and included on the final report.
20.1 The process for handling unacceptable and out of control data is found in the Laboratory QAM Section 11. The reporting of data that is out of control must be approved and documented by the Quality Assurance Manager and either the Technical Manager or the Laboratory Director.
20.2 Client Requested Modifications:
20.2.1 Clients must request modifications from the laboratory SOP in writing to the lab.
20.2.2 The Laboratory Director, Technical Manager and Quality Assurance Manager
will evaluate the requested client deviations; determine the feasibility of the deviation and the potential effects on the data.

Analysis Corporation
SOP Title: TDS, TSS, TS Revision 00
Effective Date: December 23, 2008 Page 13 of 13
\\Harrison\d\Quality Control\Quality Manual & SOPs\4000 Anaytical SOPs\SOP 4482\SOP4482 Percent Moisture.doc
STAT
20.2.3 If it is determined that the laboratory will perform the requested deviations, the
Laboratory Director, Technical Manager and Quality Assurance Manager will decide if a method validation study is required.
20.2.4 The designated project manager will retain all documentation concerning the
requested deviation, including all correspondence with the client, in the client folder.
20.2.5 The final analytical report must include the statement “This report has analyses performed using client requested modifications”.
21.0 Waste Management The STAT Analysis Corporation SOP 1130 Waste Disposal identifies proper waste management practices for the chemicals and biological materials used in this procedure. Samples are stored and discarded accordance with SOP 1130 Waste Disposal.
.
22.0 References
22.1 Standard Test Methods for Moisture, Ash, and Organic Matter of Peat and Other Organic Soils, ASTM D 2974-87 (1987).
22.2 Standard Methods for the Examination of Water and Wastewater, 20th Edition (1998).
22.3 Methods for Chemical Analysis of Water and Wastewater, U.S. Environmental Protection Agency, EPA methods 160.1, 160.2, 160.3, 160.4
22.4 STAT SOP 1000 Control and Use of Laboratory Notebooks 22.5 SOP 1400 LIMS 22.6 STAT SOP 1210 Method Detection Limits (MDLs) 22.7 SOP 1040 General Laboratory Practices 22.8 STAT SOP 1020 Glassware Cleaning 22.9 STAT SOP 1250 Data Review 22.10 SOP 230 Corrective Actions 22.11 SOP 1130 Waste Disposal 22.12 SOP 1230 Training 22.13 SOP 003 Chemical Hygiene Plan 22.14 SOP 1010 Standard and Reagent Preparation 22.15 STAT Analysis Corporation Quality Assurance Manual
23. Forms, Figures, Tables, Diagrams, Flowcharts, Attachments or
Validation Data
None.


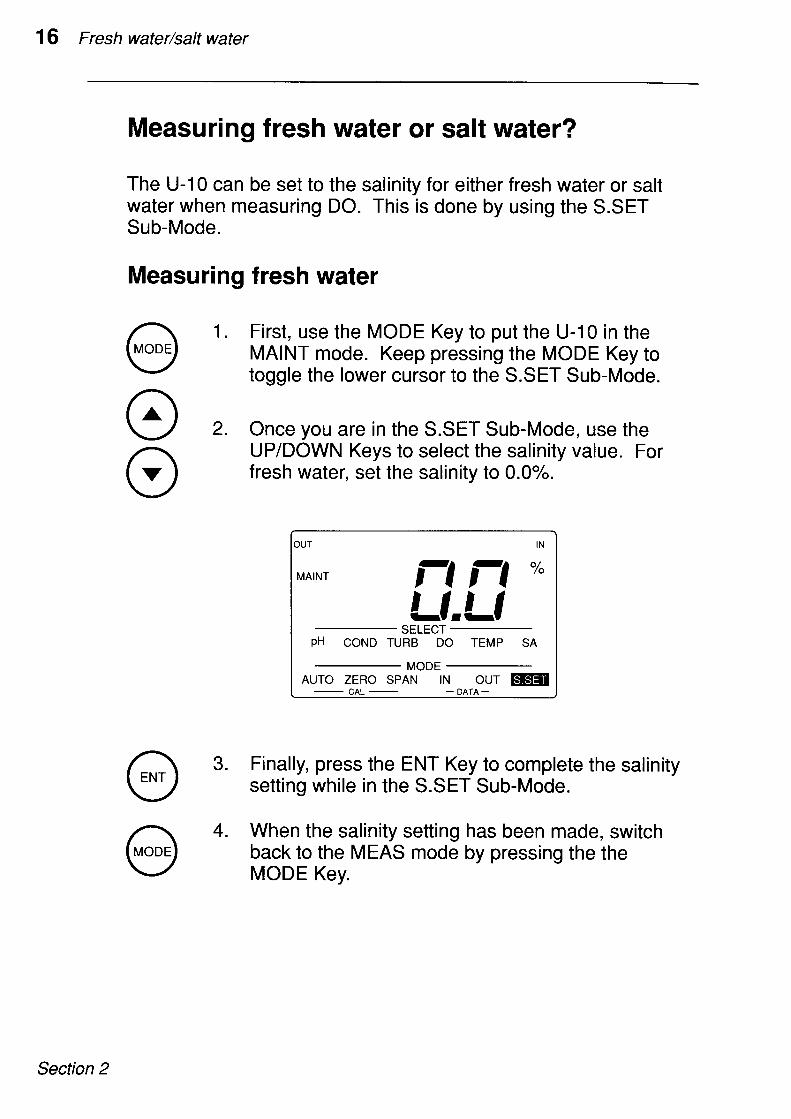


Impellers specifications› Regular size windspeed impeller: ø 20 mm, hole diameter ø 33 mm. Minimum sensitivity: < 3km/h - < 1m/s Precision : +/-2% ‘‘off-axis’’ error: +/-30° / +/-3% Operating temperature : -50°C to +100°C› Small size windspeed impeller: ø 12 mm, hole diameter ø 18 mm. Minimum sensitivity: < 3km/h - < 1m/s Precision: +/-2% ‘‘off-axis’’ error: +/-10° / +/-3% Withstood temperature: -50°C to +100°C› Water impeller: ø 60 mm Minimum sensitivity: < 0.3km/h - < 0.1m/s Precision: +/-2% ‘‘off-axis’’ error: +/-20° / +/-3%
Technical data› Sealed and weatherproof instrument› Thread on the bottom of the instrument for fixing to a tripod (1/4’’)› Speed resolution : 0.1 for all units (except in cm/s: 3cm/s)› Maximum speed: 150 km/h (except in cm/s: 999cm/s)› Thermometer precision : +/- 0.2°C› Thermometer resolution : 0.1°C› Power supply : 2 batteries, 1.5V AA Battery lifetime, at least 3 years with occasional use of the display backlight. To replace, loosen the three screws on the metal plate.› Weight : 210 grams (insubmersible)› Dimensions : ø66 X 137 mm› Warranty : 1 year› All cable are in PUR
WarrantyYour instrument has a one year warranty, against material or manufacturing defects, from JDC ELECTRONIC SA starting from the date of pur-chase. The warranty does not cover damage caused by incorrect use.The speed measuring principle of is based on the detection of a rotating magnetic field produced by an impeller. If the device is subject to a strong magnetic field produced by a transformer or motor, it may happen that the instrument shows undesirable values, without any rotation from the impeller.
More information is available on our website under www.jdc.ch.
Vous venez d’acquérir un appareil de haute précision, réalisé avec les technologies les plus modernes. Il a été conçu pour résister à un usage intensif. Cependant et afin de conserver son aspect et sa précision, nous vous recommandons de le traiter avec soin et de lire attenti-vement ce mode d’emploi.
Le système se compose au minimum de:› 1 boîtier d’affichage› 1 sonde› 1 hélice
Fonction des boutonsON : pression pendant 1s OFF : pression pendant 2s (non auto off)LIGHT : courte pression on et off UP : mode réglageSTART / STOP : mode chronomètreDOWN : mode réglageLAP / RESET : mode chronomètreSET / CAL : mode réglageRESET MEMORY : pression pendant 3s
ConfigurationPour entrer dans le mode configuration de votre appareil, il suffit de presser sur le bouton . Lorsqu’on presse une nouvelle fois sur le bouton , le système valide le réglage s’il y a eu une modification, sinon il passe au ré-glage suivant. Pour modifier les réglages, il faut utiliser les boutons et . Voici la manière de procéder pour les différents réglages de l’appareil.Unité de mesure de la vitesse des fluides et des gaz Les unités sélectionnables sont : knots, mph, km/h, m/s, fps, mph et cm/s. Une fois l’unité choisie, celle-ci reste affichée en haut à droite. Lorsqu’aucune unité n’est affi-chée, l’appareil se trouve en mode cm/s.Unité de mesure de la température Les unités sélectionnables sont : °F, °C, °F et °C .Réglage du temps de la moyenneLes temps sélectionnables sont : --- (pondération), 3’’, 6’’, 12’’, 30’’, 1’, 6’, 30’, 1:00’, 6:00’, 12:00’, 24:00’ ou Timer .Le mode Timer permet de mesurer la moyenne sur une durée définie entre un start (presser ) et un stop (pres-ser ), ce temps est affiché sur la ligne inférieure. Ce Timer permet également d’utiliser la fonction LapTime (presser , le symbole clignote). Le bouton per-met aussi de faire une mise à zéro du Timer. Celui-ci fonctionne de la même manière qu’un chronomètre standard.Réglage de l’affichage de la vitesse et de la températureLes affichages sélectionnables sont :---,MIN,AV,MAX.Lorsqu’on sélectionne AV, il s’agit de la moyenne pour la température et pour le vent. L’affichage des valeurs moyennes se fait toujours simultanément pour la vi-tesse (au milieu) et pour la température (en bas). Les autres modes (---,MIN,MAX) concernent uniquement la température.
Le réglage de l’affichage n’est pas disponible si l’unité sélectionnée est °F ou °C .Mesure de la vitesse d’écoulement d’un fluideVitesse instantanée (en haut) Vitesse maximum (au milieu)L’affichage de la vitesse maximale se fait sur la partie centrale. Il s’agit de la valeur maximale mesurée sur la durée de la moyenne. La valeur est mise à zéro lors d’un RESET de la mémoire.Vitesse moyenne (au milieu si le mode AV est sélectionné)
Mesure de la températureLe capteur de température est intégré à l’extremité de la sonde.Température instantanéeImportant : l’inertie thermique de la sonde agit directe-ment sur le temps de stabilisation de la mesure. Plus la différence de température est importante, plus ce temps sera long dans l’air.Pour la mesure dans l’eau, le temps de réaction sera très court.Température ressentieComme vous le savez certainement, les basses températures sont dangereuses pour le corps humain. Mais saviez-vous que le vent influence fortement les températu-res ressenties réellement par votre corps ? Par exemple, une température ambiante de 0°C et un vent de 30 km/h agissent comme une température de -13°C ! Le résultat du calcul de l’effet du vent sur la température s’appelle «température ressentie».Le vous calcule instantanément la température ressentie.Température minimumTempérature maximumDans ces deux modes, il s’agit de la valeur minimale ou maximale mesurée sur la durée de la moyenne. La valeur est mise à zéro lors d’un RESET de la mémoire. Ces valeurs ne sont pas données pour la température ressentie.Caractéristiques des sondesDisponible en 2 longueurs différentes, ces sondes sont indispensables pour y fixer des hélices de mesures.› Tige en aluminium télescopique, d’une longueur totale e 1,2 mètres pour mesurer dans les tubes de ventilation difficiles d’accès ou de grand diamètre, dans des rivières ou canalisations.› Tige en aluminium, longueur 10 cm. Pour transformer votre en anémomètre compact (s’utilise surtout avec les hélices pour gaz ø 20mm et ø 12mm)› Sonde avec hélice lestée à l’extrémité d’un câble de 15 mètres pour les mesures depuis une structure sur plombant la rivière.
' ''
You have just acquired a piece of high precision equi-pment which has been created using the most modern technology. It has been designed to stand up to inten-sive use. However, in order to maintain its appearance and its precision, we recommend that you treat it with care and read this manual carefully.
To work properly, the system has to include at least:
› 1 display unit› 1 probe› 1 impeller
Function of the buttonsON : press for 1 second OFF : press for 2 seconds (not auto off)LIGHT : press on and off brieflyUP : setting modeSTART / STOP : chronometer modeDOWN : setting modeLAP / RESET : chronometer modeSET / CAL : setting modeRESET MEMORY : press for 3 seconds
ConfigurationTo access the configuration mode of your instrument, just press on the button. Pressing the button once again cause the system to confirm the setting if there has been a change. If not then it goes to the next set-ting. To modify the settings the and buttons have to be used. Here is how to proceed with the different instrument settings.Speed measuring unit The units to be selected are : knots, mph, km/h, m/s, fps and cm/s. Once the unit is chosen, it remains displayed in the top right. If no other unit is chosen the instrument is set to the cm/s.Temperature measurement unit The units to be selected are : °F, °C, °F and °C .Setting the time of the average The times to be selected are : --- (weighting), 3’’, 6’’, 12’’, 30’’, 1’, 6’, 30’, 1:00’, 6:00’, 12:00’, 24:00’ or timer .The timer mode allows measurement of the average between start (press ) and stop (press ), this time is displayed on the lower lines. This timer allows the use of the LapTime function (press , the symbol flashes). The button also allows the timer to be re-set to zero. This works in the same way as a standard chronometer.Setting of the speed and temperature displays The displays to be selected are : ---, MIN, AV, MAX.If AV is selected, the average of temperature and wind are shown. The display of average values is always made simultaneously for the speed (at the centre) and temperature (at the bottom). The other modes (---, MIN, MAX) only concern the temperature.Setting of the display is not possible if the units selected are °F or °C .
Measuring air or liquid flowsInstantaneous speed (at the top) Maximum speed (at the centre)The display of the maximum speed is made at the central part. It is the maximum measured value of the time of the average. The value is reset to zero during a RESET of the memory.Average speed (at the center if AV is selected)
Measuring the temperature The temperature sensor is on the end of each probe.Instantaneous temperatureImportant : Thermal inertia of the instrument directly affects the stabilization time of the measurement. The greater the temperature difference, is the longer this time will be. This time will be shorter if the wind speed is higher.Wind-chill temperatureAs you know, exposure to low temperatures is potentially dangerous to the human body. But did you know that wind plays a significant part in how your body actually feels temperatures? For example, an ambient temperature of 0°C and a 30 km/h wind have the same effect on you as a temperature of -13°C! The result of the calculation of the effect of wind on the temperature is called the “wind-chill temperature”. The shows immediately the wind-chill.Minimum temperatureMaximum temperatureThese two modes show the min or max values measured over time of the average. The value is reset to zero during a RESET of the memory. These values are not those of the temperature felt by the body.Probe specificationsAvailable in 2 different lengths, these 2 probes are es-sential to install any impeller.› Aluminium telescopic rod, total length of 1.2m with 2 meters cable to measure in hard-to-reach ventilation shafts, air conditioning conduits, rivers flows and irrigation canals.› Aluminium small rod, 10 cm long to use your as a compact windmeter (mostly used with windspeed impellers ø 20mm and ø 12mm)› Probe with a 15 meters sounding cable with water- flow impeller, to measure water flow from bridges.
' ''
Caractéristiques des hélices› Hélice taille standard : gaz ø 20 mm, trou de passage ø 33 mm. Sensibilité minimum : < 3km/h - < 1m/s Précision : +/-2% Erreur ‘‘off-axis’’ : +/-30° / +/-3% Température d’utilisation : -50°C à +100°C› Hélice petite taille : gaz ø 12 mm, trou de passage ø 18 mm. Sensibilité minimum : < 3km/h - < 1m/s Précision : +/-2% Erreur ‘‘off-axis’’ : +/-10° / +/-3% Température d’utilisation : -50°C à +100°C› Hélice eau : ø 60 mm Sensibilité minimum : < 0.3km/h - < 0.1m/s Précision : +/-2% Erreur ‘‘off-axis’’ : +/-20° / +/-3%
Données techniques› Appareil étanche et résistant aux intempéries›Filetage sous l’appareil permettant sa fixation sur un trépied (1/4’’)› Résolution de la vitesse: 0.1 pour toutes les unités (sauf cm/s: 3cm/s)› Vitesse maximale: 150km/h (sauf cm/s: 999cm/s)› Précision du thermomètre : +/- 0.2°C› Résolution du thermomètre : 0.1°C› Alimentation : 2 piles 1.5V AA Autonomie des piles, au minimum 3 ans avec un usage occasionnel de l’éclairage de l’affichage. Pour le changement, dévisser les trois vis de la plaque métallique.› Poids : 210 grammes (insubmersible)› Dimensions : ø66 X 137 mm› Garantie : 1 année› Tous les câbles sont en PUR
GarantieVotre instrument est garanti par JDC ELECTRONIC SA pendant une année à partir de la date d’achat contre tout défaut matériel ou de fabrication. Sont exclus de cette garantie les dommages causés par une utilisation inadéquate.Le principe de mesure de la vitesse du est basé sur la détection du champ magnétique tournant produit par l’hélice. Si l’appareil est en présence d’un fort champ magnétique produit par un transformateur ou un moteur, il se peut que l’instrument indique des va-leurs non désirées, en l’absence de rotation de l’hélice.
Vous trouverez encore plus d’informations sur notre site internet www.jdc.ch.
FREN
JDC Electronic SARue des Uttins 40
1400 Yverdon-les-BainsSwitzerland
Phone: +41 24 445 21 21Fax: +41 24 445 21 23
Email: [email protected]
Website : www.jdc.ch
JDC Electronic SARue des Uttins 40
1400 Yverdon-les-BainsSwitzerland
Phone: +41 24 445 21 21Fax: +41 24 445 21 23
Email: [email protected]
Website : www.jdc.ch
++
Developed and manufactured by:
JDC Electronic SASwitzerlandwww.jdc.ch
North American Sales & Support:
NTech USAPO Box 284
Holmen, WI [email protected]
608.498.4021
WIND METERS Xplorer 1: Wind speed only Xplorer 2: Adds Temperature Xplorer 3: Adds Digital Compass Xplorer 4: Adds Air Pressure and Altitude EOLE: “Cup-style” Wind Speed METEOS: “Cup-Style” Wind plus Temperature ATMOS: “Cup-Style” Wind, Temperature, Humidity
Products available through NTech USA:
OTHER PRODUCTS FLOWATCH: Flowofwater/fluids SPEEDWATCH: Wireless Boat Knotmeter POROSIMETER: Porosity of fabrics

SOP APPROVAL FORM TETRA TECH EM INC. ENVIRONMENTAL STANDARD OPERATING PROCEDURE SURFACE WATER SAMPLING SOP NO. 009 REVISION NO. 4 Last Reviewed: June 2009
6-19-09
Quality Assurance Approved
Date

Tetra Tech EM Inc. – Environmental SOP No. 009 Page 1 of 13Title: Surface Water Sampling Revision No. 4, June 2009
Last Reviewed: June 2009
1.0 BACKGROUND
Surface water sampling is conducted to determine the quality of surface water entering, leaving, or
affected by a site. Surface water bodies that can be sampled include streams, rivers, lakes, ponds,
lagoons, and surface impoundments. This standard operating procedure (SOP) discusses common
methods of collecting grab samples that represent water quality in a water body at a particular point in
time.
A series of grab samples also can be composited to represent water quality over a longer period of time.
Composite samples can be flow proportional or time proportional. The details of compositing water
samples are not included in this SOP.
1.1 PURPOSE
This SOP establishes the requirements and procedures for surface water sampling.
1.2 SCOPE
This SOP applies to surface water sampling and the instruments and methods used to collect the samples.
1.3 DEFINITIONS
Kemmerer Sampler: A messenger-activated water sampling device. Water flows through the device
until the release mechanism is triggered to close the container.
Peristaltic Pump: A rotary, positive-displacement pumping device characterized by its low suction and
rhythmic operation, and by the fact that the pump does not come into direct contact with the water being
sampled.
Pond Sampler: A sampling device fabricated by using an adjustable beaker clamp to attach a beaker to a
telescoping, heavy-duty aluminum pole.

Tetra Tech EM Inc. – Environmental SOP No. 009 Page 2 of 13Title: Surface Water Sampling Revision No. 4, June 2009
Last Reviewed: June 2009
1.4 REFERENCES
U.S. Environmental Protection Agency (EPA). 1977. “Procedures Manual for Ground Water Monitoring at Solid Waste Disposal Facilities.” EPA-530/SW-611. August.
EPA. 1980. “Samplers and Sampling Procedures for Hazardous Waste Streams.” EPA-600/2-80-018.
January. EPA. 1984. “Characterization of Hazardous Waste Sites — A Methods Manual, Volume II. Available
Sampling Methods.” Second Edition. EPA-600/4-84-076. December. EPA. 2002. “Surface Water Sampling.” Environmental Response Team SOP #2013 (Rev. #1.0,
12/17/02). On-Line Address: http://loostrom.com/kosov/separatasidor/usepasurfacewatersampling.pdf
EPA. 2007. “Operating Procedure – Surface Water Sampling.” Science and Ecosystem Support
Division. SCSDPROC-201-R1. November.
1.5 REQUIREMENTS AND RESOURCES
Surface water sampling requires a variety of procedures and instruments. The choice of procedure should
be determined by site-specific conditions, such as the type of surface water body, the sampling depth, and
the sample location’s distance from shore.
Samples can be collected from shallow depths by submerging the sample container. An intermediary
disposable collection container or one constructed of a nonreactive material also may be used. A pond
sampler, a peristaltic pump, or a Kemmerer sampler may be used to provide extended reach. The
following equipment may be required to sample surface water:
· Decontamination materials
· Sample containers and labels
· Point-source bailer
· Dipper
· Boat
· Pond sampler
· Peristaltic pump with batteries or power source
· Silicone tubing
· Heavy-wall Teflon® tubing
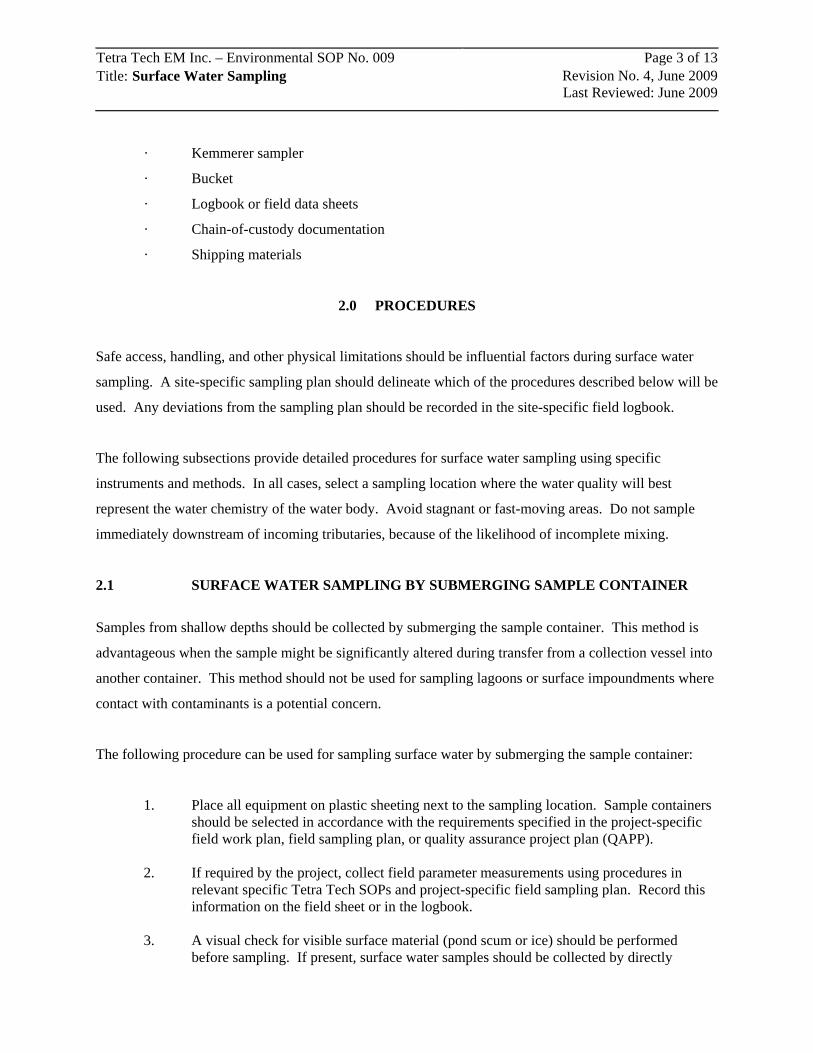
Tetra Tech EM Inc. – Environmental SOP No. 009 Page 3 of 13Title: Surface Water Sampling Revision No. 4, June 2009
Last Reviewed: June 2009
· Kemmerer sampler
· Bucket
· Logbook or field data sheets
· Chain-of-custody documentation
· Shipping materials
2.0 PROCEDURES
Safe access, handling, and other physical limitations should be influential factors during surface water
sampling. A site-specific sampling plan should delineate which of the procedures described below will be
used. Any deviations from the sampling plan should be recorded in the site-specific field logbook.
The following subsections provide detailed procedures for surface water sampling using specific
instruments and methods. In all cases, select a sampling location where the water quality will best
represent the water chemistry of the water body. Avoid stagnant or fast-moving areas. Do not sample
immediately downstream of incoming tributaries, because of the likelihood of incomplete mixing.
2.1 SURFACE WATER SAMPLING BY SUBMERGING SAMPLE CONTAINER
Samples from shallow depths should be collected by submerging the sample container. This method is
advantageous when the sample might be significantly altered during transfer from a collection vessel into
another container. This method should not be used for sampling lagoons or surface impoundments where
contact with contaminants is a potential concern.
The following procedure can be used for sampling surface water by submerging the sample container:
1. Place all equipment on plastic sheeting next to the sampling location. Sample containers should be selected in accordance with the requirements specified in the project-specific field work plan, field sampling plan, or quality assurance project plan (QAPP).
2. If required by the project, collect field parameter measurements using procedures in
relevant specific Tetra Tech SOPs and project-specific field sampling plan. Record this information on the field sheet or in the logbook.
3. A visual check for visible surface material (pond scum or ice) should be performed
before sampling. If present, surface water samples should be collected by directly

Tetra Tech EM Inc. – Environmental SOP No. 009 Page 4 of 13Title: Surface Water Sampling Revision No. 4, June 2009
Last Reviewed: June 2009
submerging the sample container (with lid still on) into the surface water at the specified sampling location. Avoid contacting the bottom of the water body with the sample container because this will disturb sediment that may interfere with the surface water sample. Once submerged, the lid should be removed to allow the container to fill with water below any visible material on the surface of the water. A visual check should be conducted during and after sample collection to ensure sample integrity. If no surface materials are present, sample as instructed below.
4. For stream sampling, sample the location farthest downstream first. In general, work
from zones suspected of low contamination to zones of high contamination. Orient the mouth of the sample container facing upstream while standing downstream so as not to stir up any sediment that would contaminate the sample. Avoid contacting the bottom of the water body with the sample container because this will disturb sediment that may interfere with the surface water sample.
5. For a larger body of surface water, such as a lake, collect samples near the shore, unless
boats are feasible and permitted. Collect samples from shallow depths by submerging the sample container. Avoid contacting the bottom of the water body with the sample container because this will disturb sediment that may interfere with the surface water sample. If sampling from a boat, collect the sample as far away as possible from the outboard engine to avoid possible fuel contamination.
6. If sediment samples are to be collected (using procedures in SOP No. 006 [Sludge and
Sediment Sampling]) with surface water samples, collect surface water samples at each location before collecting sediment samples to avoid contaminating the water samples with excess suspended particles generated during sediment sampling.
7. Continue delivery of the sample until the container is almost full. If sampling for volatile
organic compounds (VOC) or other analytical parameters requiring pre-preserved sample containers, the use of a transfer device is recommended so that the preservative is not displaced.
8. Preserve the sample in accordance with requirements specified in the project-specific
field work plan, field sampling plan, or QAPP. Ensure that a Teflon® liner is present in the cap of the sample container if required. Secure the cap tightly and affix a completed sample label to the container.
9. Complete all chain-of-custody documentation, field logbook entries, and sample
packaging requirements.

Tetra Tech EM Inc. – Environmental SOP No. 009 Page 5 of 13Title: Surface Water Sampling Revision No. 4, June 2009
Last Reviewed: June 2009
2.2 SURFACE WATER SAMPLING WITH TRANSFER DEVICE
A dipper, bailer, or other device made of inert material, such as stainless steel or Teflon®, can be used to
transfer liquid samples from their source to a sample container. This prevents contamination of the
outside of the sample container as a result of direct immersion in surface water. Depending on the
sampling application, the transfer device may be either disposed of or reused. If reused, the device should
be thoroughly rinsed and decontaminated in accordance with SOP 002 (General Equipment
Decontamination), prior to sampling a different source.
A transfer device can be used in most sampling situations, and is preferred when (1) direct contact or
physical access limitations pose a health and safety concern and (2) sample containers are pre-preserved.
However, direct collection by submerging the sample container is the preferred method when possible.
The following procedure can be used for sampling surface water with a dipper, bailer, or other transfer
device:
1 Place all equipment on plastic sheeting next to the sampling location. Sample containers should be selected in accordance with the requirements specified in the project-specific field work plan, field sampling plan, or QAPP.
2. If required by the project, collect field parameter measurements using procedures in
relevant specific Tetra Tech SOPs. Record this information on the field sheet or in the logbook.
3. With minimal surface water disturbance, submerge a precleaned dipper, bailer, or other
transfer device.
4. Allow the device to fill slowly and continuously.
5. Retrieve the device from the surface water with minimal disturbance.
6. Remove the cap from the sample container. Slightly tilt the mouth of the container below the edge of the transfer device.
7. Empty the device slowly, allowing the sample to flow gently down the inside of the
container with minimal entry turbulence. Continue delivery of the sample until the container is almost full. If sampling for VOCs, the container must be completely filled leaving no head space.
8. Preserve the sample in accordance with requirements specified in the project-specific
field work plan, field sampling plan, or QAPP. Ensure that a Teflon® liner is present in

Tetra Tech EM Inc. – Environmental SOP No. 009 Page 6 of 13Title: Surface Water Sampling Revision No. 4, June 2009
Last Reviewed: June 2009
the cap of the sample container if required. Secure the cap tightly and affix a completed sample label to the container.
9. Complete all chain-of-custody documentation, field logbook entries, and sample
packaging requirements.
10. Decontaminate the transfer device prior to reuse or storage using the procedures in SOP No. 002 (General Equipment Decontamination).
2.3 SURFACE WATER SAMPLING WITH POND SAMPLER
A pond sampler may be used to collect liquid samples from ponds, pits, and lagoons (see Figure 1). A
pond sampler is easily and inexpensively fabricated. To construct a pond sampler, use an adjustable
clamp to attach a sampling beaker to the end of a two- or three-piece telescoping aluminum tube. The
telescoping tube serves as the handle. All nondisposable equipment should be cleaned before and after
each use.
The following procedure can be used for sampling surface water with a pond sampler:
1. Place all equipment on plastic sheeting next to the sampling location. Sample containers should be selected in accordance with the requirements specified in the project-specific field work plan, field sampling plan, or QAPP.
2. If required by the project, collect field parameter measurements using procedures in
relevant specific Tetra Tech SOPs. Record this information on the field sheet or in the logbook.
3. Assemble the pond sampler. Ensure that the sampling beaker, bolts, and nuts securing
the clamp to the pole are tightened properly.
4. Collect the sample by slowly submerging the precleaned beaker with minimal surface water disturbance.
5. Retrieve the pond sampler from the surface water with minimal disturbance.
6. Remove the cap from the sample container. Slightly tilt the mouth of the container below
the edge of the beaker.
7. Empty the beaker slowly, allowing the sample to flow gently down the inside of the container with minimal entry turbulence. Continue delivery until the container is almost full. If sampling for VOCs, the container must be completely filled leaving no head space.

Tetra Tech EM Inc. – Environmental SOP No. 009 Page 7 of 13Title: Surface Water Sampling Revision No. 4, June 2009
Last Reviewed: June 2009
8. Preserve the sample in accordance with requirements specified in the project-specific field work plan, field sampling plan, or QAPP. Ensure that a Teflon® liner is present in the cap of the sample container if required. Secure the cap tightly and affix a completed sample label to the container.
9. Complete all chain-of-custody documentation, field logbook entries, and sample
packaging requirements.
10. Decontaminate the pond sampler prior to reuse or storage using the procedures in SOP No. 002 (General Equipment Decontamination).
2.4 SURFACE WATER SAMPLING WITH PERISTALTIC PUMP
To extend reach in sampling efforts, a small peristaltic pump can be used (see Figure 2). A peristaltic
pump draws the sample through heavy-wall Teflon® tubing and pumps it directly into the sample
container. Use of a peristaltic pump allows the operator to reach out into a liquid body, to sample from a
depth or to sweep the width of a narrow stream. A battery-powered pump is preferable because it
eliminates the need for a direct current generator or an alternating current inverter.
If medical-grade silicone tubing is used in the peristaltic pump, it is suitable for sampling almost any
parameter, including most organics. However, some VOC stripping may occur and some sample material
may adhere to the tubing. Teflon® tubing may be used in place of silicone tubing on the intake side of the
pump to minimize the amount of sample adherence to the tubing. If tubing is to be reused, it should be
cleaned before and after each use following the procedures specified in SOP No. 002 (General Equipment
Decontamination). Depending on project requirements, it may be necessary to replace the Teflon® intake
tubing and the pump silicone tubing between sampling locations to prevent cross contamination.
Procedures for sampling surface water with a peristaltic pump are as follows:
1. Place all equipment on plastic sheeting next to the sampling location. Sample containers should be selected in accordance with the requirements specified in the project-specific field work plan, field sampling plan, or QAPP.
2. If required by the project, collect field parameter measurements using procedures in
relevant specific Tetra Tech SOPs. Record this information on the field sheet or in the logbook.
3. Install clean, medical-grade silicone tubing in the pump head according to the
manufacturer’s instructions. Allow enough tubing on the discharge side to facilitate

Tetra Tech EM Inc. – Environmental SOP No. 009 Page 8 of 13Title: Surface Water Sampling Revision No. 4, June 2009
Last Reviewed: June 2009
delivery of liquid into the sample container. Allow only enough tubing on the suction end for attachment to the intake line. This will minimize sample contact with the tubing.
4. Select the length of intake tubing needed to reach the required sample location. Attach it
to the intake side of the pump tubing. Heavy-wall Teflon® tubing of a diameter equal to that of the required pump tubing suits most applications. A heavier tubing wall will allow slightly greater lateral reach.
5. If possible, allow several liters of surface water to pass through the pump before
collecting the sample. Collect this purge volume. Return it to the source after the samples have been withdrawn.
6. Fill the sample container by allowing the pump discharge to flow gently down the inside
of the bottle with minimal entry turbulence. Continue delivery of the sample until the container is almost full.
7. If sampling for VOCs, the VOC sample must be collected using one of the “soda straw”
variations. Ideally, the tubing intake will be placed at the depth from which the sample is to be collected and the pump will be run for several minutes to fill the tubing with water representative of that interval. After several minutes, the pump is turned off and the tubing string is retrieved. The pump speed is then reduced to a slow pumping rate and the pump direction is reversed. After the pump is turned back on, the sample stream is collected into the VOC vials as it is pushed from the tubing by the pump. Care must be taken to prevent any water that was in contact with the peristaltic pump head tubing from being incorporated into the sample.
8. Preserve the sample in accordance with requirements specified in the project-specific
field work plan, field sampling plan, or QAPP. Ensure that a Teflon® liner is present in the cap of the sample container if required. Secure the cap tightly and affix a completed sample label to the container.
9. Complete all chain-of-custody documentation, field logbook entries, and sample
packaging requirements.
10. Allow the pump to drain, and then disassemble it. Decontaminate the tubing before reuse using the procedures in SOP No. 002 (General Equipment Decontamination), or dispose of it.
2.5 SURFACE WATER SAMPLING WITH KEMMERER SAMPLER
The Kemmerer sampler (see Figure 3) is used to collect surface water samples when the required sample
depth is greater than that which can be sampled with a pump. A Kemmerer sampler may be constructed
of various materials to be compatible with the required analytical technique. The sampler should be
cleaned before and after each use.

Tetra Tech EM Inc. – Environmental SOP No. 009 Page 9 of 13Title: Surface Water Sampling Revision No. 4, June 2009
Last Reviewed: June 2009
Procedures for sampling surface water with a Kemmerer sampler are as follows:
1. Place all equipment on plastic sheeting next to the sampling location. Sample containers should be selected in accordance with the requirements in specified in the project-specific field work plan, field sampling plan, or QAPP.
2. If required by the project, collect field parameter measurements using procedures in
relevant specific Tetra Tech SOPs. Record this information on the field sheet or in the logbook.
3. Inspect the body of the Kemmerer sampler to ensure that the drain line valve is closed, as
appropriate. Measure and mark the sample line (cable) at the desired sampling depth.
4. Open the sampler by lifting the upper stopper-trip head assembly.
5. Gradually lower the sampler into the surface water until the sample liquid reaches the sample line.
6. Place a messenger on the sample line and release it, closing the sampler.
7. Retrieve the sampler. Prevent accidental opening of the lower stopper by holding the
center rod of the sampler.
8. Rinse or wipe off the exterior of the sampler. Recover the sample by grasping the lower stopper and sampler body with one hand. Transfer the sample by lifting the upper stopper with the other hand and carefully pouring the contents into the sample container. If a drain line valve is present, hold the valve over the sample container, and open the valve slowly to release the sample.
9. Transfer the sample slowly, allowing it to flow gently down the inside of the container
with minimal entry turbulence. Continue delivery until the container is almost full. If sampling for VOCs, the container must be completely filled leaving no head space.
10. Preserve the sample in accordance with requirements specified in the project-specific
field work plan, field sampling plan, or QAPP. Ensure that a Teflon® liner is present in the cap of the sample container if required. Secure the cap tightly and affix a completed sample label to the container.
11. Complete all chain-of-custody documentation, field logbook entries, and sample
packaging requirements.
12. Decontaminate the Kemmerer sampler prior to reuse or storage using the procedures in SOP No. 002 (General Equipment Decontamination).

Tetra Tech EM Inc. – Environmental SOP No. 009 Page 10 of 13Title: Surface Water Sampling Revision No. 4, June 2009
Last Reviewed: June 2009
2.6 SURFACE WATER SAMPLING WITH BUCKET
A plastic bucket is used to collect surface water samples for measurement of water quality parameters
(such as pH, temperature, and conductivity) or classical water quality parameters (ammonia, nitrate-
nitrite, phosphorus, and total organic carbon). This method is not recommended for collecting samples
for chemical analysis. A bucket is commonly used to collect a sample when the water depth is too great
for wading, it is not possible to deploy a boat, or access is restricted (excessive vegetation or steep
embankments) and the water column is well mixed. The water body is usually accessed from a bridge.
The bucket is lowered by rope over the side of the bridge and, upon retrieval, the water is poured into the
appropriate sample containers.

Tetra Tech EM Inc. – Environmental SOP No. 009 Page 11 of 13Title: Surface Water Sampling Revision No. 4, June 2009
Last Reviewed: June 2009
FIGURE 1 POND SAMPLER

Tetra Tech EM Inc. – Environmental SOP No. 009 Page 12 of 13Title: Surface Water Sampling Revision No. 4, June 2009
Last Reviewed: June 2009
FIGURE 2 PERISTALTIC PUMP FOR LIQUID SAMPLING
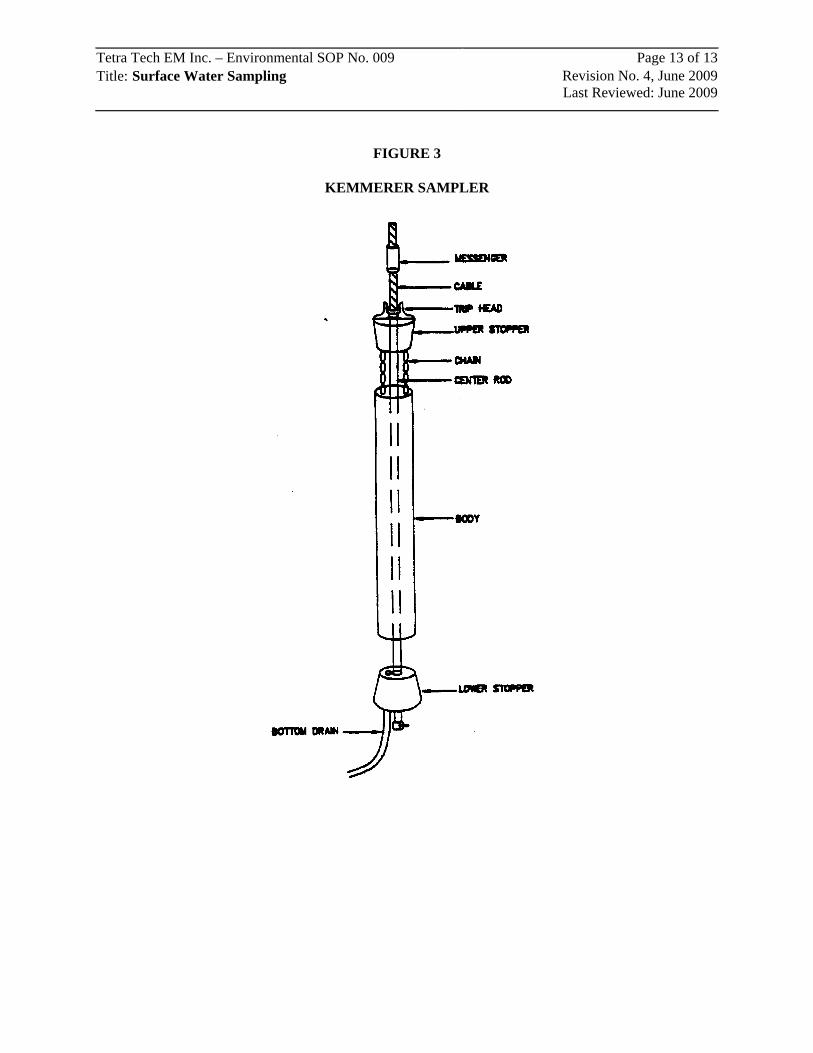
Tetra Tech EM Inc. – Environmental SOP No. 009 Page 13 of 13Title: Surface Water Sampling Revision No. 4, June 2009
Last Reviewed: June 2009
FIGURE 3 KEMMERER SAMPLER

SOP APPROVAL FORM TETRA TECH EM INC. ENVIRONMENTAL STANDARD OPERATING PROCEDURE GROUNDWATER SAMPLING SOP NO. 010 REVISION NO. 4 Last Reviewed: June 2009
6-19-09
Quality Assurance Approved
Date

Tetra Tech EM Inc. - Environmental SOP No. 010 Page 1 of 16Title: Groundwater Sampling Revision No. 4, June 2009
Last Reviewed: June 2009
1.0 BACKGROUND
Groundwater sampling may be required for a variety of reasons, such as to examine potable or industrial
water supplies, check for and track contaminant plume movement in the vicinity of a land disposal or spill
site, conduct Resource Conservation and Recovery Act (RCRA) compliance monitoring, or examine a
site where historical information is minimal or nonexistent, but where groundwater may be contaminated.
Groundwater is usually sampled through an in-place well, either temporarily or permanently installed.
SOP No. 020 (Monitoring Well Installation) provides guidance for installing new monitoring wells.
However, it can also be sampled anywhere groundwater is present, such as in a pit or a dug or drilled
hole.
1.1 PURPOSE
This standard operating procedure (SOP) establishes the requirements and procedures for determining the
quality of groundwater entering, leaving, or affected by site activities through groundwater sampling.
The samples are obtained by retrieving water from a well screened in the aquifer or aquifers underlying a
site.
1.2 SCOPE
This SOP provides general guidance for groundwater sampling activities conducted in the field. SOP
No. 015 (Groundwater Sample Collection Using Micropurge Technology) provides additional specific
guidance for using low-flow methods to collect groundwater samples.
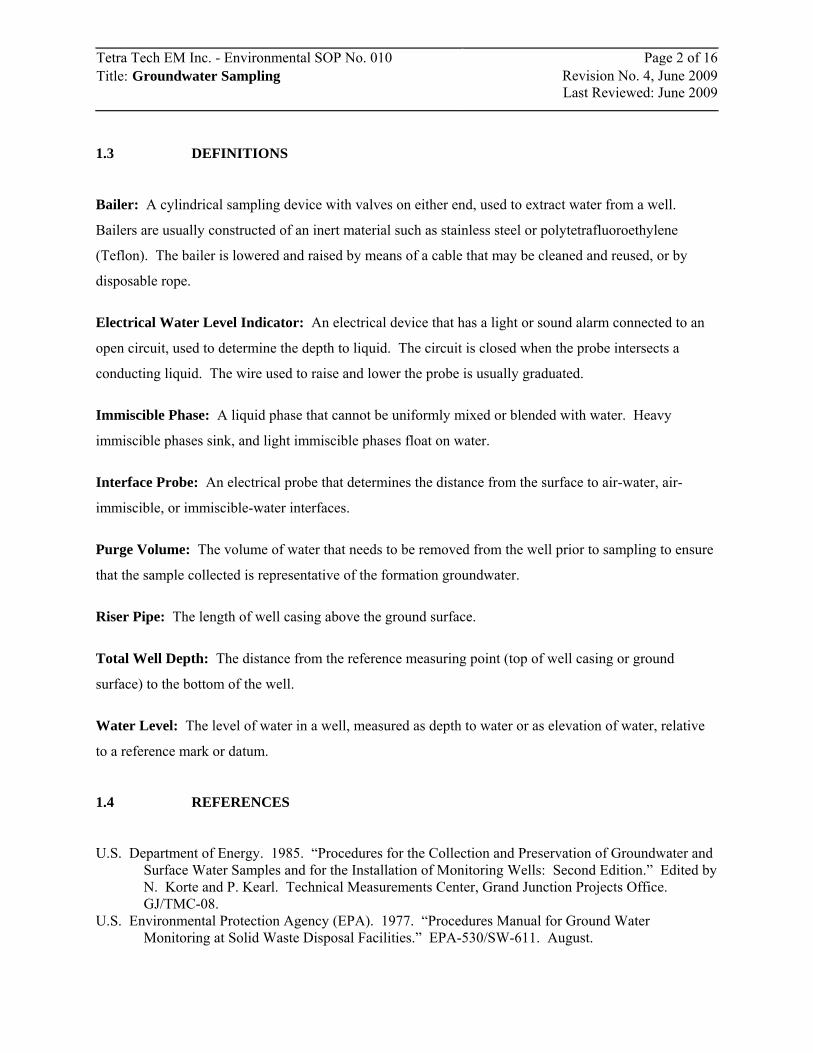
Tetra Tech EM Inc. - Environmental SOP No. 010 Page 2 of 16Title: Groundwater Sampling Revision No. 4, June 2009
Last Reviewed: June 2009
1.3 DEFINITIONS
Bailer: A cylindrical sampling device with valves on either end, used to extract water from a well.
Bailers are usually constructed of an inert material such as stainless steel or polytetrafluoroethylene
(Teflon). The bailer is lowered and raised by means of a cable that may be cleaned and reused, or by
disposable rope.
Electrical Water Level Indicator: An electrical device that has a light or sound alarm connected to an
open circuit, used to determine the depth to liquid. The circuit is closed when the probe intersects a
conducting liquid. The wire used to raise and lower the probe is usually graduated.
Immiscible Phase: A liquid phase that cannot be uniformly mixed or blended with water. Heavy
immiscible phases sink, and light immiscible phases float on water.
Interface Probe: An electrical probe that determines the distance from the surface to air-water, air-
immiscible, or immiscible-water interfaces.
Purge Volume: The volume of water that needs to be removed from the well prior to sampling to ensure
that the sample collected is representative of the formation groundwater.
Riser Pipe: The length of well casing above the ground surface.
Total Well Depth: The distance from the reference measuring point (top of well casing or ground
surface) to the bottom of the well.
Water Level: The level of water in a well, measured as depth to water or as elevation of water, relative
to a reference mark or datum.
1.4 REFERENCES
U.S. Department of Energy. 1985. “Procedures for the Collection and Preservation of Groundwater and Surface Water Samples and for the Installation of Monitoring Wells: Second Edition.” Edited by N. Korte and P. Kearl. Technical Measurements Center, Grand Junction Projects Office. GJ/TMC-08.
U.S. Environmental Protection Agency (EPA). 1977. “Procedures Manual for Ground Water Monitoring at Solid Waste Disposal Facilities.” EPA-530/SW-611. August.

Tetra Tech EM Inc. - Environmental SOP No. 010 Page 3 of 16Title: Groundwater Sampling Revision No. 4, June 2009
Last Reviewed: June 2009
EPA. 1984. “Sampling at Hazardous Materials Incidents.” EPA Hazardous Response Support Division,
Cincinnati, 1984. EPA. 1995. “Groundwater Well Sampling.” Environmental Response Team SOP #2007 (Rev. #0.0,
01/26/95). http://www.ert.org/products/2007.PDF U.S. Geological Survey. 1984. “National Handbook of Recommended Methods for Water-Data
Acquisition” Reston, Virginia. Yeskis, D. and B. Zavala. 2002. Ground-Water Sampling Guidelines for Superfund and RCRA Project
Managers. U.S. Environmental Protection Agency, Office of Solid Waste and Emergency Response. Publication: EPA542-S-02-001. May. http://www.epa.gov/tio/tsp/download/gw_sampling_guide.pdf
1.5 REQUIREMENTS AND RESOURCES
There are various options available to obtain groundwater samples. The procedures are outlined in the
following section. The equipment needed to accomplish these procedures includes the following:
· Organic vapor detector with a flame ionization detector (FID) or a photoionization detector (PID)
· Pipe wrench and/or other tools needed to open monitoring wells (socket wrench, mallet,
etc.)
· Electrical water level indicator or interface probe
· Purging device (type needed depends on well depth, casing diameter, and type of sample desired; see sampling devices below)
· Graduated cylinder or bucket
· Sampling device (type needed depends upon depth to water and type of sample desired)
- Teflon bailer - Stainless steel bailer - Teflon bladder pump - Stainless steel submersible (non-oil-bearing) pump - Existing dedicated equipment - Peristaltic pump
· Sample containers
· Wastewater containers

Tetra Tech EM Inc. - Environmental SOP No. 010 Page 4 of 16Title: Groundwater Sampling Revision No. 4, June 2009
Last Reviewed: June 2009
· Field logbook
· Stopwatch
Additional equipment is required to complete measurement of field parameters (for example, pH, specific
conductance, and temperature) of the groundwater in the well. Refer to Tetra Tech SOP 061 (Field
Measurement of Dissolved Oxygen, Oxidation-Reduction Potential, pH, Specific Conductance,
Temperature, and Turbidity Using a Multi-Parameter Water Quality Meter) or individual field parameter
SOPs as appropriate.
2.0 PROCEDURE
Prior to sampling, a site-specific sampling plan should be developed. The plan should take into
consideration the site characteristics and should include:
· Specific, repeatable well measurement techniques and reference points for determining the depth to water and the depth to the bottom of the well
· Specific method of purging and selection of purging equipment
· Specific methods and equipment for measurements of field parameters
· Specific method of sample collection and the sampling equipment that will be used
· Specific parameters for which samples will be analyzed
· Order in which sample bottles will be filled, based on the analytical parameters
The following sections discuss procedures for approaching the well, establishing a sample preparation
area, making preliminary well measurements, purging the well, and collecting samples.
2.1 APPROACHING THE WELL
In general, all wells should be assumed to pose a health and safety risk until field measurements indicate
otherwise. Approach the well from the upwind side. Record well appearance and the general condition
of the protective casing, surface seal, and surrounding area in the logbook.
Once at the well, the lead person should systematically use the organic vapor detector to survey the
immediate area around the well (from the breathing zone to the top of the casing to the ground). If

Tetra Tech EM Inc. - Environmental SOP No. 010 Page 5 of 16Title: Groundwater Sampling Revision No. 4, June 2009
Last Reviewed: June 2009
elevated FID and PID meter readings are encountered, retreat to a safe area and instruct the sampling
team to either let vapors dissipate and approach the well again or put on the appropriate level of personal
protective equipment (PPE), as specified in the site-specific health and safety plan. See SOP No. 003
(Organic Vapor Air Monitoring) for additional air monitoring guidance.
Some monitoring wells have the potential to contain pressurized headspace—for example, through the
generation of gases from contaminated groundwater, due to biological processes, degradation of
contaminants, or simply based on location such as near a landfill or in areas that intersect lithological
abnormalities; or through intentional artificial means such as those associated with air sparging systems.
Injection or extraction wells may be artificially pressurized and may remain so for several days after the
system has been turned off. This presents a hazard to people opening these wells. Tetra Tech personnel
shall employ the following practices to minimize these hazards:
Wear safety glasses to protect the eyes. If site-specific observations and conditions indicate that the
wells may be pressurized, wear a full-face shield over the safety eye protection. Do not place the face or any other part of the body over the well when opening because this may
place you in a strike zone.
Open the well cover at arm’s length, then step away and allow the well to off gas and stabilize. Upon opening the well casing, the lead person should systematically survey inside the well casing, above
the well casing in the breathing zone, and in the immediate area around the well. If elevated FID or PID
meter readings in the breathing zone are encountered (see health and safety plan for action levels), retreat
and put on appropriate PPE. It is important to remember that action levels are based on readings in the
breathing zone, not within the well casing. Representative organic vapor detector readings should be
recorded in the logbook. Also look out for insects or other animals that may nest in well openings, and
refer to the health and safety plan for specific hazards.
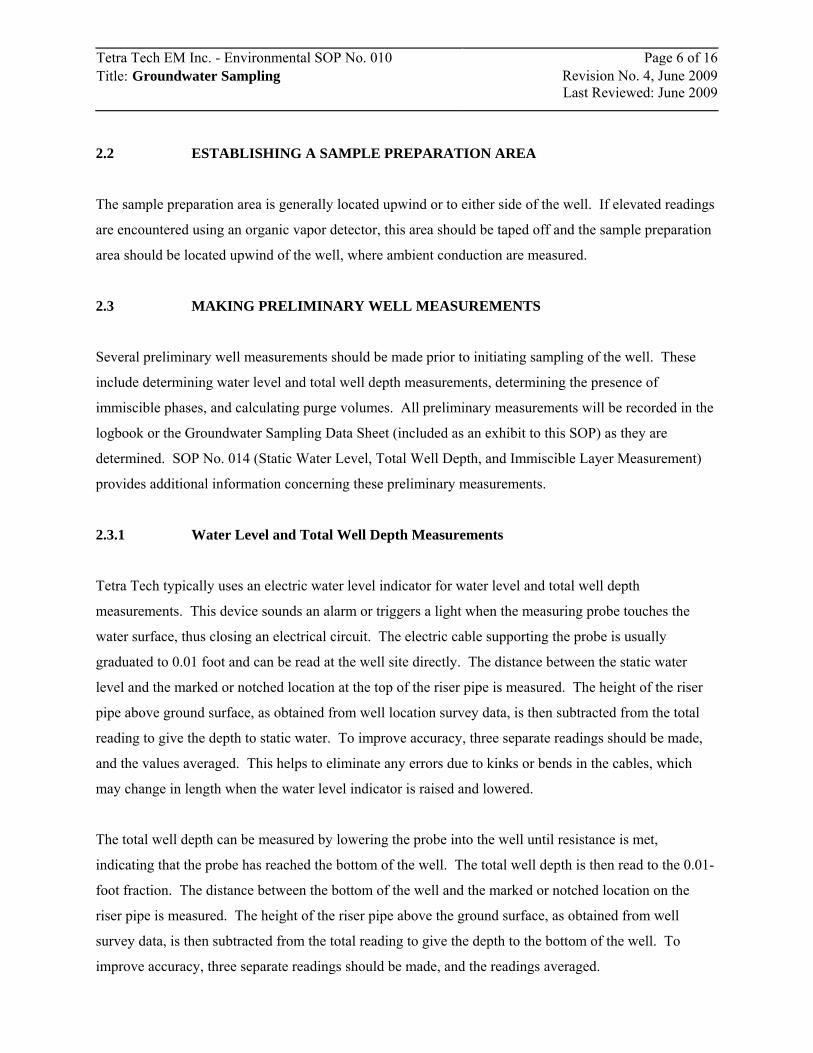
Tetra Tech EM Inc. - Environmental SOP No. 010 Page 6 of 16Title: Groundwater Sampling Revision No. 4, June 2009
Last Reviewed: June 2009
2.2 ESTABLISHING A SAMPLE PREPARATION AREA
The sample preparation area is generally located upwind or to either side of the well. If elevated readings
are encountered using an organic vapor detector, this area should be taped off and the sample preparation
area should be located upwind of the well, where ambient conduction are measured.
2.3 MAKING PRELIMINARY WELL MEASUREMENTS
Several preliminary well measurements should be made prior to initiating sampling of the well. These
include determining water level and total well depth measurements, determining the presence of
immiscible phases, and calculating purge volumes. All preliminary measurements will be recorded in the
logbook or the Groundwater Sampling Data Sheet (included as an exhibit to this SOP) as they are
determined. SOP No. 014 (Static Water Level, Total Well Depth, and Immiscible Layer Measurement)
provides additional information concerning these preliminary measurements.
2.3.1 Water Level and Total Well Depth Measurements
Tetra Tech typically uses an electric water level indicator for water level and total well depth
measurements. This device sounds an alarm or triggers a light when the measuring probe touches the
water surface, thus closing an electrical circuit. The electric cable supporting the probe is usually
graduated to 0.01 foot and can be read at the well site directly. The distance between the static water
level and the marked or notched location at the top of the riser pipe is measured. The height of the riser
pipe above ground surface, as obtained from well location survey data, is then subtracted from the total
reading to give the depth to static water. To improve accuracy, three separate readings should be made,
and the values averaged. This helps to eliminate any errors due to kinks or bends in the cables, which
may change in length when the water level indicator is raised and lowered.
The total well depth can be measured by lowering the probe into the well until resistance is met,
indicating that the probe has reached the bottom of the well. The total well depth is then read to the 0.01-
foot fraction. The distance between the bottom of the well and the marked or notched location on the
riser pipe is measured. The height of the riser pipe above the ground surface, as obtained from well
survey data, is then subtracted from the total reading to give the depth to the bottom of the well. To
improve accuracy, three separate readings should be made, and the readings averaged.

Tetra Tech EM Inc. - Environmental SOP No. 010 Page 7 of 16Title: Groundwater Sampling Revision No. 4, June 2009
Last Reviewed: June 2009
2.3.2 Determining if Immiscible Nonaqueous-Phases Liquids are Present
If immiscible, nonaqueous-phase liquid (NAPL) are present, the following measurement activities should
be undertaken. Organic liquids are measured by lowering an interface probe slowly to the surface of the
liquid in the well. When the audible alarm sounds, record the depth. If the alarm is continuous, a floating
immiscible layer has been detected. To determine the thickness of this layer, continue lowering the probe
slowly until the alarm changes to an oscillating signal. The oscillating signal indicates that the probe has
detected an aqueous layer. Record this depth as the depth to water and determine the thickness and the
volume of the immiscible layer.
Continue lowering the probe into the well to determine if dense immiscible phases (sinkers) are present.
If the alarm signal changes from oscillating to a continuous sound, a heavier immiscible layer has been
detected; record this depth.
Continue lowering the probe to the bottom of the well and record the total depth. Calculate and record
the sinker phase volume and total water volume in the well (see equation in Section 2.3.3). If immiscible
phases are present, immediately refer to Section 2.5.3 or 2.5.4 of this SOP for sample collection
procedures.
2.3.3 Determination of Purging Volume
If the presence of immiscible phases does not need to be determined, determine the depth to water and the
total depth of the well as described in Section 2.3.1. Once these measurements have been made and
recorded, use Table 1 to calculate the total volume of water in the well. Multiply this volume by the
purging factor to determine purging volume. The minimum purging factor is typically three casing
volumes but may be superseded by site-specific program requirements, individual well yield
characteristics, or stabilization of field parameters measured during purging. Field parameters (for
example, pH, specific conductance, and temperature) should be measured prior to purging and after each
well volume. All field parameter data should be recorded in the field logbook, Groundwater Sampling
Data Sheet, or personal digital assistant (PDA). Refer to specific Tetra Tech SOP 061 as appropriate for
more detailed procedures for determining these field parameters.

Tetra Tech EM Inc. - Environmental SOP No. 010 Page 8 of 16Title: Groundwater Sampling Revision No. 4, June 2009
Last Reviewed: June 2009
The volume of water in the well is based on the following formula:
where
V = static volume of water in the well (gallons)
r = inside radius of the well (feet)
h = length of water in the well (total well depth minus depth to water) (feet)
7.48 = conversion factor (cubic feet to gallons)
Common well sizes and corresponding volumes are as follows:
1-inch well = h x 0.041 gal/ft 2-inch well = h x 0.163 gal/ft 3-inch well = h x 0.367 gal/ft 4-inch well = h x 0.652 gal/ft
2.4 PURGING THE WELL
Currently, Tetra Tech standards allow for six options for purging wells:
1. Teflon bailers
2. Stainless steel bailers
3. Teflon bladder pumps
4. Stainless steel submersible (non-oil-bearing) pumps
5. Existing dedicated equipment
6. Peristaltic pumps (these devices are for shallow wells only)
As previously stated, the minimum purging volume is typically three casing volumes. Exceptions to this
standard may be made in the case of low-yield wells. When purging low-yield wells, purge the well until
the water level is equal to the top of screen elevation (if possible). Samples should be collected no sooner
than 2 hours after purging and when sufficient groundwater volume is available.
V = πr2h x 7.48

Tetra Tech EM Inc. - Environmental SOP No. 010 Page 9 of 16Title: Groundwater Sampling Revision No. 4, June 2009
Last Reviewed: June 2009
The well should be purged until measured field parameters have stabilized. If any field parameter has not
stabilized, additional purging should be performed. To be considered stable, field parameters should
change by no more than the stabilization criteria listed on Table 1 between each well volume purged. If
the above conditions have not been met after a specified period of time, purging will be considered
complete and sampling can begin. Refer to the field sampling plan or quality assurance project plan for
specified time period. Record the final well stabilization parameters on the Groundwater Sampling Data
Sheet, and indicate if the well purging was considered complete due to stabilized parameters or exceeding
the specified period of time.
At no time should the purging rate be high enough to cause the groundwater to cascade back into the well,
as this could result in excessive aeration and potential stripping of volatile constituents.
The actual volume of purged water can be measured using several acceptable methods:
· When bailers are used, the actual volume of each bailer’s contents can be measured using a calibrated bucket.
· If a pump is used for purging, the pump rate can be determined by using a bucket of
known volume, stopwatch, and the duration of pumping time necessary to purge the known volume.
2.5 SAMPLE COLLECTION
This section first describes general groundwater sample collection procedures. This section also describes
procedures for collecting groundwater samples for volatile organic analysis (VOA) and for collecting
samples when light or heavy immiscible layers are present in a monitoring well. Samples of light and
heavy immiscible layers should be collected before the well is purged. Site-specific sampling plans may
indicate that, based on the presence of NAPL, no groundwater sample is to be collected.

Tetra Tech EM Inc. - Environmental SOP No. 010 Page 10 of 16Title: Groundwater Sampling Revision No. 4, June 2009
Last Reviewed: June 2009
2.5.1 General Groundwater Sampling Procedures
The technique used to withdraw a groundwater sample from a well should be selected based on the
parameters for which the sample will be analyzed. To ensure that the groundwater samples are
representative, it is important to avoid physically altering or chemically contaminating the sample during
collection, withdrawal, or containerization. If the samples are to be analyzed for volatile organic
compounds, it is critical that air does not become entrained in the water column.
Acceptable sampling devices for all parameters are double check valve stainless steel or Teflon bailers,
bladder pumps, low-flow positive displacement pumps, or for shallow wells, peristaltic pumps.
Additional measurements of field parameters should be performed at the time of sampling.
In some cases, it may become necessary to use dedicated equipment already in the well to collect samples.
This is particularly true of high-volume, deep wells (>150 feet) where bladder pumps are ineffective and
bailing is impractical. If existing equipment must be used, however, determine the make and model of the
pump and obtain information on component construction materials from the manufacturer or facility
representatives. If an existing pump is to be used for sampling, make sure the flow volume can be
reduced so that a reliable VOA sample can be taken. Record the specific port, tap, or valve from which
the sample is collected. If nondedicated sampling equipment is used, the least contaminated wells should
be purged and sampled first and most contaminated wells should be purged and sampled last (if past
sampling data are available to make this determination).
General sampling procedures are as follows:
· Clean sampling equipment should not be placed directly on the ground. Use a plastic drop cloth or feed line from clean reels. Never place contaminated lines back on reels.
· Check the operation of the bailer check valve assemblies to confirm free operation.
· If the bailer cable is to be decontaminated and reused, it must be made of Teflon-coated
stainless steel.
· Lower sampling equipment slowly into the well to avoid degassing the water and damaging the equipment.
· Pump flow rates should be adjusted to eliminate intermittent or pulsed flow. The settings
should be determined during the purging operations.

Tetra Tech EM Inc. - Environmental SOP No. 010 Page 11 of 16Title: Groundwater Sampling Revision No. 4, June 2009
Last Reviewed: June 2009
· A separate sample volume should be collected to measure necessary field parameters. Samples should be collected and containerized following procedures outlined in the project-specific field sampling plan (FSP), quality assurance project plan (QAPP), and in the order of the parameters’ volatilization sensitivity. Table 2 lists the preferred collection order for common groundwater parameters.
Intermediate containers should never be used to prepare VOA samples and should be avoided for all
parameters in general. All VOA containers should be filled at a single sampling point or from a single
bailer volume. Also refer to site-specific sampling plan for other sample handling requirements that may
be unique to a site or to specific chemical constituents.
2.5.2 Collection of Volatile Organics Samples
This section discusses in detail the collection of samples for VOA using either a bailer or bladder pump.
Other pumps (such as positive displacement or peristaltic) can be used. The following factors are critical
to the collection of representative samples for VOA: ensuring that no air has become entrained in the
water column, achieving low pump flow rates (less than 100 milliliter [mL] per minute, if possible),
avoiding flow surges, and adjusting sample preservatives if they are found to cause reactions with the
sample.
2.5.2.1 Collection with Bailers
Samples for VOA should be collected from the first bailer removed from the well after purging is
complete. The most effective means requires two people. One person should retrieve the bailer from the
well and pour its contents into the appropriate number of 40-mL VOA vials held by the second person.
Each vial should be capped and inverted to check if any air bubbles are present. If a bubble exists,
unscrew the cap and add more water, or discard and repeat if vials are not pre-preserved. If bubbling
persists in a vial containing acid preservative, the sample may need to be collected without the
preservative and the laboratory notified to add preservative upon receipt. The sample should be
transferred from the bailer to the sample container in a manner that will limit the amount of agitation in
order to reduce the loss of volatile organics from the sample.

Tetra Tech EM Inc. - Environmental SOP No. 010 Page 12 of 16Title: Groundwater Sampling Revision No. 4, June 2009
Last Reviewed: June 2009
Always fill VOA vials from a single bailer volume. If the bailer is refilled, samples cannot be considered
duplicates or splits.
2.5.2.2 Collection with a Bladder Pump (Well Wizard)
To successfully perform VOA sampling with a Well Wizard bladder pump, the following steps must be
completed:
1. Following manufacturer’s directions, activate the pump. Full water flow from the discharge tubing will begin after 5 to 15 pumping cycles. These initial pumping cycles are required to purge air from the pump and discharge tubing. The discharge and recharge settings must be manually set and adjusted to pump at optimum flow rates. To activate the bladder, it is best to set the initial cycle at long discharge and recharge rates.
2. Reduce water flow rate for VOA sample collection. To reduce the water flow rate, turn
the throttle control valve (located on the left side of the Well Wizard pump control panel) counterclockwise.
3. Collect VOA sample from discharge tubing. VOA vials must be placed beneath the
discharge tubing while avoiding direct contact between the vials and the tubing. Never place tubing past the mouth of the VOA vial. The pump throttle control must be turned as necessary to maintain a trickle of water in order to obtain a meniscus in the vial.
4. Continue with non-VOA sampling. Increase pump flow rate by turning the throttle
control knob clockwise.
2.5.3 Sampling of Light Immiscible Floaters
The approach used when collecting a sample of a floating layer depends on the depth to the floating layer
and the thickness of that layer. If the thickness of the floater is 2 feet or greater, a bottom-filling valve
bailer should be used. Slowly lower the bailer until contact is made with the floater surface, and lower
the bailer to a depth less than that of the floater-water interface depth as determined by preliminary
measurements with the interface probe.
When the thickness of the floating layer is less than 2 feet and the depth to the surface of the floating
layer is less than 15 feet, a peristaltic pump can be used to extract a sample.
When the thickness of the floating layer is less than 2 feet and the depth to the surface of the floating
layer is beyond the effective “lift” of a peristaltic pump (greater than 25 feet), a bailer can be modified to
allow filling from the top only (an acceptable alternative is to use a top- loading Teflon or stainless-steel

Tetra Tech EM Inc. - Environmental SOP No. 010 Page 13 of 16Title: Groundwater Sampling Revision No. 4, June 2009
Last Reviewed: June 2009
bailer). Disassemble the bailer’s bottom check valve and insert a piece of 2-inch-diameter Teflon sheet
between the ball and ball seat. This will seal off the bottom valve. Remove the ball from the top check
valve, thus allowing the sample to enter from the top. To overcome buoyancy when the bailer is lowered
into the floater, place a length of 1-inch stainless steel pipe on the retrieval line above the bailer (this pipe
may have to be notched to allow sample entry if the pipe remains within the top of the bailer). As an
alternative, use a top-loading stainless-steel bailer. Lower the device, carefully measuring the depth to the
surface of the floating layer, until the top of the bailer is level with the top of the floating layer. Lower
the bailer an additional one-half thickness of the floating layer and collect the sample. This technique is
the most effective method of collection if the floating layer is only a few inches thick.
2.5.4 Sampling of Heavy Immiscible Sinkers
The best method for collecting a sample of a sinker is the use of a double check valve bailer. The key to
sample collection is controlled, slow lowering and raising of the bailer to and from the bottom of the well.
Sample collection methods are equivalent to those described in Section 2.5.3 above.

Tetra Tech EM Inc. - Environmental SOP No. 010 Page 14 of 16Title: Groundwater Sampling Revision No. 4, June 2009
Last Reviewed: June 2009
TABLE 1 STABILIZATION CRITERIA FOR WATER QUALITY PARAMETERS Parameter Stabilization Criterion pH ± 0.1 units Specific Conductance ± 3 percent Oxidation-Reduction Potential ± 10 millivolts Turbidity ± 10 percent (when greater than 10 nephelometric turbidity units
[NTU]) Dissolved Oxygen ± 0.3 milligrams per liter or ± 10 percent

Tetra Tech EM Inc. - Environmental SOP No. 010 Page 15 of 16Title: Groundwater Sampling Revision No. 4, June 2009
Last Reviewed: June 2009
TABLE 2 ORDER OF PREFERRED SAMPLE COLLECTION
1. VOA 2. Purgeable organic halogens (POX) 3. Total organic halogens (TOX) 4. Cyanide 5. Extractable organics 6. Purgeable organic carbon (POC) 7. Total metals 8. Dissolved metals 9. Total organic carbon (TOC) 10. Phenols 11. Sulfate and chloride 12. Nitrate and ammonia 13. Radionuclides

Tetra Tech EM Inc. - Environmental SOP No. 010 Page 16 of 16Title: Groundwater Sampling Revision No. 4, June 2009
Last Reviewed: June 2009
Tetra Tech EM Inc. EXHIBIT: GROUNDWATER Page of SAMPLING DATA SHEET Date
Well Name Screen Interval
Project
Station Elevation GND TOC
Immiscible Phases Present Yes No
Project No.
Static Water Level (from TOC)
Type
Well Location
Well Stick Up
Measured with
Sample Date
Static Elevation
PID Readings (background)
Well Depth MEAS RPTD
PID Reading (TOC)
Sampling Personnel
Feet of Water
Wells Installed by
Sample ID
Gallons/Foot
Installation Date
Duplicate ID
Casing Volume
Development Date(s)
FIELD CHEMISTRY CALIBRATIONS
Date/Time Spec. Conductance: Standard μmhos/c
Reading μmhos/cm at C
pH: pH 4.00 - _______ at _________ C
pH 7.00 - _______ at _________ C
pH 10.00 - ______ at _______ C
Slope
Dissolved Oxygen: D.O. Meter
mg/L at C
PID: Calibration Gas PPM Span Reading
PURGING
Cumulative Volume of
Water Removed (Purged)
PID/OVA Reading
Time
Discharge Rate
(mL/min)
Dissolve
d Oxygen (mg/L)
pH
Eh/ORP
(mV)
Temp. (C)
Specific Conduct. (μmhos/cm at C)
Turbidit
y (NTU)
Gallons
Casing
Vol.
Location
Value
Depth to
Water (ft)
Comments
SAMPLE PARAMETERS
Condition of well: Remarks:

SOP APPROVAL FORM
TETRA TECH EM INC.
ENVIRONMENTAL STANDARD OPERATING PROCEDURE
FIELD MEASUREMENT OF WATER TEMPERATURE
SOP NO. 011
REVISION NO. 2
Last Reviewed: November 1999
May 11, 1993
Quality Assurance Approved Date

Tetra Tech EM Inc. - Environmental SOP No. 011 Page 1 of 3Title: Field Measurement of Water Temperature Revision No. 2, May 11, 1993
Last Reviewed: November 1999
1.0 BACKGROUND
Water temperature readings are used in the calculation of various forms of alkalinity, in studies of
saturation and stability with respect to calcium carbonate, in the calculation of salinity, and in general
laboratory operations. Properly measuring water temperature, therefore, is important to a wide variety of
field measurements.
1.1 PURPOSE
This standard operating procedure (SOP) establishes the requirements and procedures for measuring water
temperature in the field.
1.2 SCOPE
This SOP applies to measuring the temperature of surface water and groundwater while in the field.
1.3 DEFINITION
National Institute of Standards and Technology Certified Thermometer: A thermometer that carries
certification of its temperature-reading precision.
1.4 REFERENCE
U.S. Environmental Protection Agency. 1986. “Resource Conservation and Recovery Act (RCRA)Ground-Water Monitoring Technical Enforcement Guidance Document.” September.
1.5 REQUIREMENTS AND RESOURCES
The following equipment may be required for the measurement of water temperature in the field:
• Mercury-filled thermometer with metal case
• Electronic thermistor with accuracy of 0.1 EC and with an extension probe

Tetra Tech EM Inc. - Environmental SOP No. 011 Page 2 of 3Title: Field Measurement of Water Temperature Revision No. 2, May 11, 1993
Last Reviewed: November 1999
• National Institute of Standards and Technology certified thermometer
• Sample container
• Decontamination materials
• Field logbook
2.0 PROCEDURES
Under normal conditions, temperature measurements may be made with any reliable, glass, mercury-filled
thermometer. At a minimum, the thermometer should have a scale etched on the capillary glass every 0.1
or 0.2 EC. The thermometer should have a minimal thermal capacity to permit rapid equilibration. The
thermometer should be calibrated at least annually using a precision thermometer certified by the National
Institute of Standards and Technology. Thermometers should be housed in a metal case to prevent
breakage.
In some situations, temperature measurements may be made with a digital electronic thermistor with an
accuracy of 0.1 EC. The thermistor must be maintained as described in the manufacturer’s operation and
maintenance manual. In particular, always check the energy level of the thermistor’s battery before each
use. If the standard probe is not sufficient for taking temperature readings, then an extension probe may be
used. Follow the manufacturer’s directions to ensure that unbalanced resistance in the extension probe
does not distort temperature readings.
Temperature measurements should be taken at the water source. If it is not possible to measure the
temperature at the source, collect a sample of the water to be measured and place the sample in an
intermediate container. When an intermediate container is used, fill the container with the sample and
allow the temperature of the container to equilibrate with that of the sample and record the temperature.
Dispose of the sample and collect a new sample. Place the new sample in an intermediate container and
repeat the process just described.
Take temperature readings using the thermometer or probe while it is immersed in water long enough to
allow complete equilibration. Depending on the type of thermometer, immerse it to mark or immerse
totally. Report results to the nearest 0.1 or 1.0 EC, depending on the project specifications.

Tetra Tech EM Inc. - Environmental SOP No. 011 Page 3 of 3Title: Field Measurement of Water Temperature Revision No. 2, May 11, 1993
Last Reviewed: November 1999
Record measurements in the field logbook. After taking the measurements, decontaminate the thermometer
or probe.

SOP APPROVAL FORM
TETRA TECH EM INC.
ENVIRONMENTAL STANDARD OPERATING PROCEDURE
FIELD MEASUREMENT of pH
SOP NO. 012
REVISION NO. 3
Last Reviewed: November 1999
May 18, 1993
Quality Assurance Approved Date

Tetra Tech EM Inc. - Environmental SOP No. 012 Page 1 of 6Title: Field Measurement of pH Revision No. 3, May 18, 1993
Last Reviewed: November 1999
1.0 BACKGROUND
Determining pH is critical for predicting and interpreting the reactions and migration of dissolved chemical
constituents in groundwater or surface water. The pH of groundwater or surface water must be determined
when a sample is collected in the field.
1.1 PURPOSE
This standard operating procedure (SOP) establishes the requirements and procedures for measuring the
pH of water samples in the field.
1.2 SCOPE
This SOP applies to the use of pH meters in the field.
1.3 DEFINITIONS
pH Electrode: An electrode that measures the hydrogen ion potential of a solution by comparing it to a
standard solution with a known hydrogen ion potential. A thin glass membrane functions as a cation
exchange surface. When the electric potential of the interior of the glass membrane is compared to the
electric potential of a standard solution kept isolated from the environment, a quantitative determination of
the change in the internal solution’s electric potential, induced by the external solution, can be made.
Nernst Potential: Nernst Potential is the voltage observed when the glass membrane separates the external
solution from the internal solution. Nernst Potential varies depending on the hydrogen ion potential
between the external and internal solutions and, therefore, correlates with the pH of the solution. Because
the hydrogen ion content of the internal solution is constant, the changes in Nernst Potential are due to the
changes in the external solution.
Buffer Solution: A buffer solution is capable of maintaining the relative concentrations of acids and bases
by neutralizing, within limits, added acids or bases. It has a known pH for a specific temperature range.

Tetra Tech EM Inc. - Environmental SOP No. 012 Page 2 of 6Title: Field Measurement of pH Revision No. 3, May 18, 1993
Last Reviewed: November 1999
1.4 REFERENCES
None
1.5 REQUIREMENTS AND RESOURCES
The pH meters used by personnel in the field should have temperature and slope adjustments and a
repeatability of plus or minus 0.01 standard pH unit. Meters used for pH field measurement should be of
rugged construction. A foam-lined carrying case is convenient both for transport and for use as a work
table. Battery-operated meters with easily replaceable or rechargeable batteries are required. Also, a spare
pH electrode should be available in the field. Both the spare and working electrodes should be immersed in
a pH 4 or pH 7 buffer solution when not in use.
The following are recommended for field measurement of pH:
• pH meter with repeatability of ±0.01 standard pH unit
• Buffer solutions of pH 4, 7, and 10
• pH electrode (probe)
• Electrode filling solution
• Electrode holder
• Calibrated thermometer
• Deionized water and wash bottle
• Disposable beakers
• Logbook or field sheets
2.0 PROCEDURES
Meter calibration and field measurement procedures are outlined in the following subsections.

Tetra Tech EM Inc. - Environmental SOP No. 012 Page 3 of 6Title: Field Measurement of pH Revision No. 3, May 18, 1993
Last Reviewed: November 1999
2.1 CALIBRATION
Commercially prepared buffer solutions should be used for calibration. Solutions traceable to the National
Institute of Standards and Technology can be purchased inexpensively from any major laboratory supply
company. These solutions are certified with an accuracy of plus or minus 0.01 pH unit at a specific
temperature, usually 25 EC. Theoretically, buffer solutions are stable indefinitely. However, they are
susceptible to contamination, and old, partially full bottles should be replaced.
Because various terms are used to describe the pH meter calibration process, providing a detailed set of
instructions for each type of instrument is not practical. Always refer to the manufacturer’s instructions
when using a particular instrument. The general procedure below can be used to calibrate any pH meter.
1. Calibrate the meter with two buffer solutions to determine if the electrodes are in workingorder. The slope cannot be adjusted with a one-point calibration.
2. To calibrate the meter, use one buffer solution with a pH greater than and one buffersolution with a pH less than the anticipated pH of the sample. For example, for ananticipated pH of 6, calibrate with pH 4 and pH 7 buffers; for an anticipated pH of 8,calibrate with pH 7 and pH 10 buffers.
3. Ensure that the buffers are at the same temperature as the sample (within 2 EC). Pouraliquots into small containers; never put the electrode into the buffer storage bottles.
4. Adjust the instrument to read the pH 7 buffer accurately. Adjust the temperaturecompensator according to the manufacturer’s instructions. Be sure to rinse the probe withdeionized water after taking the calibration measurement.
5. Adjust the instrument to read the pH of the second buffer accurately. If it is not possibleto adjust the instrument to read the pH of buffer solutions accurately, check for a defectiveelectrode or contaminated buffer solution. Be sure to rinse the probe with deionized waterafter taking the calibration measurement.
6. The meter must be calibrated before the start of each work day. Check the calibrationperiodically and recalibrate if necessary.

Tetra Tech EM Inc. - Environmental SOP No. 012 Page 4 of 6Title: Field Measurement of pH Revision No. 3, May 18, 1993
Last Reviewed: November 1999
2.2 FIELD MEASUREMENT
Do not filter field samples prior to analysis. When measuring the pH of groundwater samples, use a
submersible pump or bladder pump to obtain the sample to minimize the release of gas from the sample.
The procedure below should be used for field measurement of pH.
1. Calibrate the instrument and set the temperature compensation in accordance with themanufacturer’s instructions.
2. Collect the sample to be measured in a prerinsed jar or beaker or a flow-through cell.
3. Measure the temperature of the sample to the nearest 0.1 EC.
4. Set the temperature compensation on the pH meter to the temperature of the sample,following the manufacturer’s instructions.
5. Rinse the probe with deionized water.
6. Immerse the probe in the sample. Record the pH value indicated. If the sample is beingpumped through a closed container, wait for the temperature and pH to stabilize. Stopsample flow to eliminate streaming potential. Record the pH value indicated.
7. Record measurements in a logbook, on field sheets, or as specified in the project workplan.
3.0 POTENTIAL PROBLEMS
Temperature, atmospheric contamination, and ionic strength are factors that may affect pH measurements.
Each of these three factors is discussed below. Color, turbidity, and colloids will not affect pH
measurements.
Temperature: As indicated in Table 1, pH is affected by temperature. To prevent this from causing
incorrect pH readings, the temperature compensator on the pH meter must be set to the temperature of the
sample. Also, the meter must be calibrated at approximately this same temperature. The temperatures of
the buffer and the unknown liquid should both be recorded at the time of measurement. Ideally, their
temperatures should be within 2 EC of each other.

Tetra Tech EM Inc. - Environmental SOP No. 012 Page 5 of 6Title: Field Measurement of pH Revision No. 3, May 18, 1993
Last Reviewed: November 1999
Atmospheric Contamination: Atmospheric contamination can be a significant problem when sampling the
pH of groundwater. When the sample is exposed to air, dissolved oxygen and carbon dioxide can change a
sample’s pH. To ensure that this problem does not affect the pH measurement, a groundwater sample
should ideally be pumped through a closed container in which pH and temperature probes are immersed.
The measurements should not be recorded until both temperature and pH have stabilized. The sampling
pump should be stopped before recording the data because a streaming potential will affect the
measurement in a flowing sample.
Ionic Strength: Because of the potential for errors due to ionic strength, pH measurement should always
be accompanied by a measurement of specific conductance.
In general terms, pH is a measure of hydrogen ion activity. Normally, water samples are assumed to be
ideal solutions in which other ions do not affect hydrogen ion activity. However, if the ionic strength is too
high, this assumption does not hold true. Some site investigations include sampling of waste ponds or other
highly contaminated water that has very high ionic strength. Because buffer solutions used in the field are
not made with a similarly high concentration of dissolved ions, pH measurement of highly contaminated
water will be inaccurate. Similarly, pH measurement of samples with very low ionic strength will be
inaccurate because the low ionic strength of the sample approaches the level of resistance in the glass
electrode. To reduce this problem, samples with very low ionic strength should be stirred for a few seconds
before taking a reading. Even then, several minutes may be required for the reading to stabilize.
High sodium concentration also may produce errors in pH measurement because of the high ionic strength
of these solutions. To measure the pH of such solutions, a special electrode is needed. Such an electrode
can be purchased from any of several electrode manufacturers.

Tetra Tech EM Inc. - Environmental SOP No. 012 Page 6 of 6Title: Field Measurement of pH Revision No. 3, May 18, 1993
Last Reviewed: November 1999
TABLE 1
pH OF BUFFER SOLUTIONS AS A FUNCTION OF TEMPERATURE
Standard
Buffer Solution pH
4.0 7.0 10.0
Temperature (EC)
0 4.01 7.13 10.34
5 3.99 7.10 10.26
10 4.00 7.07 10.19
15 3.99 7.05 10.12
20 4.00 7.02 10.06
25 4.00 7.00 10.00
30 4.01 6.99 9.94

SOP APPROVAL FORM
TETRA TECH EM INC.
ENVIRONMENTAL STANDARD OPERATING PROCEDURE
FIELD MEASUREMENT OF SPECIFIC CONDUCTANCE
SOP NO. 013
REVISION NO. 2
Last Reviewed: November 1999
May 18, 1993
Quality Assurance Approved Date

Tetra Tech EM Inc. - Environmental SOP No. 013 Page 1 of 6Title: Field Measurement of Specific Conductance Revision No. 2, May 18, 1993
Last Reviewed: November 1999
1.0 BACKGROUND
Specific conductance is a widely used parameter for evaluating groundwater and surface water quality. It is
a simple indicator of change within a system and provides useful information to laboratory personnel
performing other measurements on a water sample.
1.1 PURPOSE
Specific conductance should be determined at the time the sample is collected. This standard operating
procedure (SOP) establishes the requirements and procedures for measuring the specific conductance of
groundwater or surface water in the field.
1.2 SCOPE
This SOP applies to the use of specific conductance meters in the field.
1.3 DEFINITION
Specific Conductance - Specific conductance is the reciprocal of electrical resistivity. The values of
electrical resistivity and specific conductance depend on the number of ions in a solution. Pure water has
100 percent resistivity and no specific conductance. As ions are added to a solution, resistivity drops and
specific conductance increases.
1.4 REFERENCES
U.S. Environmental Protection Agency. 1996. “Test Methods for Evaluating Solid Waste, Volume 1C:Laboratory Manual Physical/Chemical Methods, SW-846.”
American Society for Testing and Materials Annual Book of Standards. “Standard Test Methods forElectrical Conductivity and Resistivity of Water, Method D-1125.”
U.S. Geological Survey. 1977. National Handbook of Recommended Methods for Water DataAcquisition.

Tetra Tech EM Inc. - Environmental SOP No. 013 Page 2 of 6Title: Field Measurement of Specific Conductance Revision No. 2, May 18, 1993
Last Reviewed: November 1999
1.5 REQUIREMENTS AND RESOURCES
Specific conductance meters should measure temperature, have a temperature compensator, and read
directly in micromhos per centimeter (Fmhos/cm), corrected to 25 EC. For field measurements, a probe-
type unit is preferred over a pipet-type unit. Specific conductance meters should have a foam-lined carrying
case and should be battery-operated with easily rechargeable or replaceable batteries. A relative accuracy
of plus or minus 3 percent is adequate.
The following are required for calibrating a specific conductance meter and for the field measurement of
specific conductance:
• A probe-type specific conductance meter meeting the requirements given above
• Deionized water and wash bottle
• Disposable beakers
• Reagent-grade potassium chloride (KCl) or a commercially-prepared, standard 0.01 molar(M) KCl solution
• Sampling containers
• Sampling equipment
• 1-liter mixing container
• Calibrated thermometer
• Field logbook
2.0 PROCEDURES
Meter calibration and field measurement procedures are outlined in the following subsections.

Tetra Tech EM Inc. - Environmental SOP No. 013 Page 3 of 6Title: Field Measurement of Specific Conductance Revision No. 2, May 18, 1993
Last Reviewed: November 1999
K 'C1 % C2
106 x C3
2.1 METER CALIBRATION
Reagent-grade KCl is the universal standard for calibrating specific conductance equipment. The electrodes
are calibrated by reading the specific conductance of standard KCl solutions. A concentration of 0.01 M
KCl should be used because its specific conductance is closest to that of most natural samples.
The measuring circuit of the specific conductance meter is calibrated either by the manufacturer or with a
calibrating resistor. The manufacturer’s instructions for the particular instrument should be followed for
calibrating the specific conductance meter.
Individual manufacturers may use slightly different terminology, but the following general procedure will
always apply:
1. Prepare a 0.01 M KCl solution by dissolving 0.745 gram of pure, dry KCl in 1 liter ofdeionized water. The base conductivity for the prepared solution is 1,408.1 Fmhos/cm at25 EC; if the deionized water has any conductance, it must be corrected to 25 EC andadded to the value of the solution. Alternatively, commercially prepared solutions can beused.
2. Measure the temperatures of the 0.01 M KCl solution and the deionized water used for thedilution. They should be at the same temperature (±0.2 EC).
3. Using Table 1, determine the expected specific conductance of the 0.01M KCl solution atthe temperature measured.
4. Measure the specific conductance of the 0.01M KCl solution and of the deionized water.
5. Use the following equation to check the cell constant specified by the manufacturer:
whereK = the cell constantC1 = the specific conductance of the deionized waterC2 = the specific conductance of the 0.01 M KCl solutionC3 = the expected specific conductance from the Table 1
6. A measured cell constant different from that specified by the manufacturer generallyindicates that the electrodes are dirty. If this is the case, replace the electrode with a clean

Tetra Tech EM Inc. - Environmental SOP No. 013 Page 4 of 6Title: Field Measurement of Specific Conductance Revision No. 2, May 18, 1993
Last Reviewed: November 1999
spare or clean and replatinize the electrode in accordance with instructions in themanufacturer’s manual or in the American Society for Testing and MaterialsMethod D-1125, Section 8.3.
7. After verifying that the cell constant is acceptable, measure the specific conductance ofsamples in accordance with to the procedure given in Section 2.2.
2.2 FIELD MEASUREMENT
Do not filter samples before analysis. To minimize gas releases from groundwater samples, a submersible
pump or bladder pump should be used to obtain samples.
The following procedure should be used for field measurement of specific conductance:
1. Calibrate the instrument and check the cell constant in accordance with the manufacturer’sinstructions and the procedure provided in Section 2.1.
2. Collect the sample in a prerinsed jar or beaker or a flow-through cell.
3. Rinse the specific conductance meter probe with deionized water.
4. Using a thermometer or the specific conductance meter itself, measure and record thetemperature of the sample in EC.
5. Immerse the specific conductance meter probe in the sample. Record the reading inFmhos/cm.
6. Record measurements in the field logbook or as specified in the project work plan.
3.0 POTENTIAL PROBLEMS
Principal problem areas for specific conductance measurement are the temperature effect, determination of
the cell constant, and allowance for very high ionic strengths. A change in temperature of 10 EC can cause
a 20 percent change in the measured specific conductance. Reported data should note whether temperature
correction has been applied. Some instruments perform temperature correction automatically, but this, too,
should be noted for the reported data. All data should be corrected to 25 EC.

Tetra Tech EM Inc. - Environmental SOP No. 013 Page 5 of 6Title: Field Measurement of Specific Conductance Revision No. 2, May 18, 1993
Last Reviewed: November 1999
Field personnel must be aware that a significant change in the cell constant indicates that the electrodes
require cleaning or replacement. The constant should be checked at each calibration, as described in
Section 2.1.
Specific conductance varies directly with ion concentrations up to a specific conductance of about
5,000 Fmhos/cm. Samples collected at most sites seldom have a specific conductance greater than
5,000 Fmhos/cm. Readings above this level should not be considered accurate. However, such
readings can still provide useful information about the relative levels of conductance and should be noted.
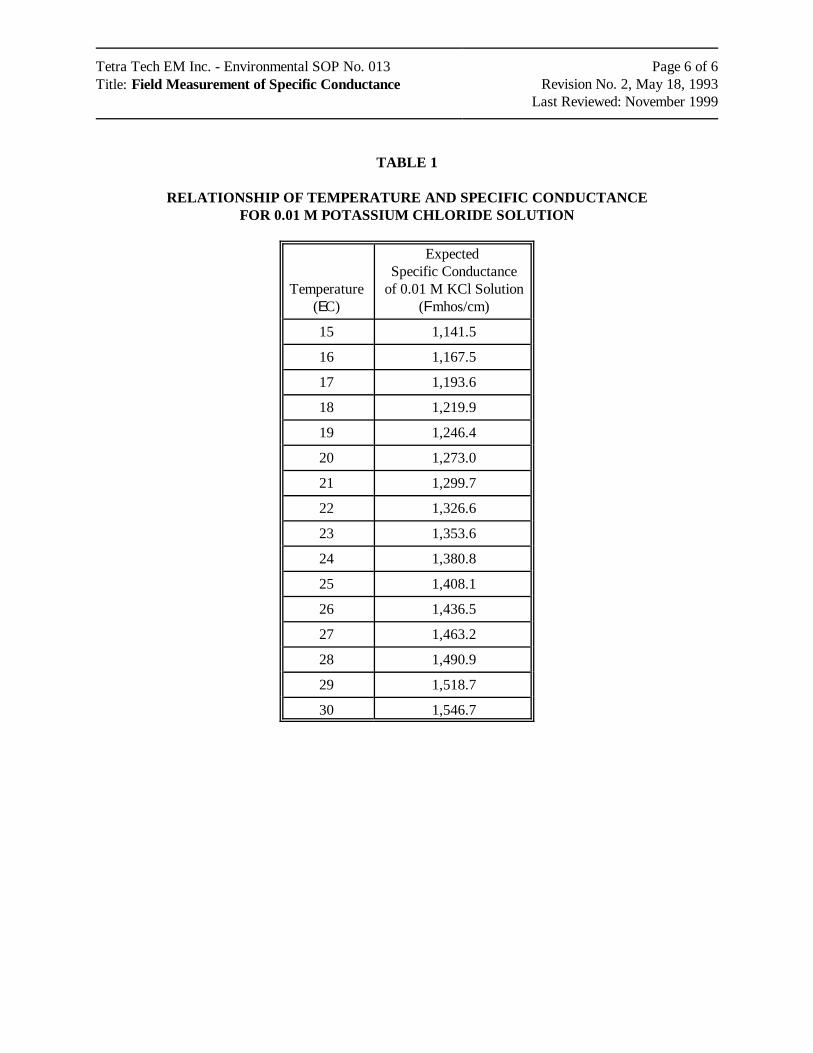
Tetra Tech EM Inc. - Environmental SOP No. 013 Page 6 of 6Title: Field Measurement of Specific Conductance Revision No. 2, May 18, 1993
Last Reviewed: November 1999
TABLE 1
RELATIONSHIP OF TEMPERATURE AND SPECIFIC CONDUCTANCEFOR 0.01 M POTASSIUM CHLORIDE SOLUTION
Temperature(EC)
Expected Specific Conductance
of 0.01 M KCl Solution(Fmhos/cm)
15 1,141.5
16 1,167.5
17 1,193.6
18 1,219.9
19 1,246.4
20 1,273.0
21 1,299.7
22 1,326.6
23 1,353.6
24 1,380.8
25 1,408.1
26 1,436.5
27 1,463.2
28 1,490.9
29 1,518.7
30 1,546.7

SOP APPROVAL FORM TETRA TECH EM INC. ENVIRONMENTAL STANDARD OPERATING PROCEDURE RECORDING OF NOTES IN FIELD LOGBOOK SOP NO. 024 REVISION NO. 1 May 18, 1993 Last Reviewed: December 2008
December 5, 2008 Quality Assurance Approved Date
Tetra Tech EM Inc. – Environmental SOP No. 024 Page 1 of 6Title: Recording of Notes in Field Logbook Revision No. 1, May 18, 1993
Last Reviewed: December 2008
1.0 BACKGROUND
The field logbook should contain detailed records of all the field activities, interviews of people, and
observations of conditions at a site. Entries should be described in as much detail as possible so that
personnel can accurately reconstruct, after the fact, activities and events during their performance of field
assignments. Field logbooks are considered accountable documents in enforcement proceedings and may
be subject to review. Therefore, the entries in the logbook must be accurate and detailed; and they must
reflect the importance of the field events.
1.1 PURPOSE
The purpose of this standard operating procedure (SOP) is to provide guidance to ensure that logbook
documentation for any field activity is correct, complete, and adequate. Logbooks are used for
identifying, locating, labeling, and tracking samples. A logbook should document any deviations from
the project approach, work plans, quality assurance project plans, health and safety plans, sampling plans,
and any changes in project personnel. They also serve as documentation of any photographs taken during
the course of the project. In addition, the data recorded in the logbook may assist in the interpretation of
analytical results. A complete and accurate logbook also aids in maintaining good quality control.
Quality control is enhanced by proper documentation of all observations, activities, and decisions.
1.2 SCOPE
This SOP establishes the general requirements and procedures for recording notes in the field logbook.
1.3 DEFINITIONS
None
1.4 REFERENCES
Compton, R.R. 1985. Geology in the Field. John Wiley and Sons. New York, N.Y.

Tetra Tech EM Inc. – Environmental SOP No. 024 Page 2 of 6Title: Recording of Notes in Field Logbook Revision No. 1, May 18, 1993
Last Reviewed: December 2008
1.5 REQUIREMENTS AND RESOURCES
The following items are required for field notation:
• Field logbooks
• Ballpoint pens with permanent ink
• 6-inch ruler (optional)
Field logbooks should be bound (sewn) with water-resistant and acid-proof covers; they should have
preprinted lines and wide columns. They should be approximately 7 1/2 by 4 1/2 inches or 8 1/2 by 11
inches in size. Loose-leaf sheets are not acceptable for field notes. If notes are written on loose paper,
they must be transcribed as soon as possible into a regular field logbook by the same person who recorded
the notes.
Logbooks can be obtained from an individual’s office supply room or directly from outside suppliers.
Logbooks must meet the requirements specified in this SOP and should include preprinted pages that are
consecutively numbered. If the numbers must be written by hand, the numbers should be circled so that
they are not confused with data.
2.0 PROCEDURES
The following subsections provide general guidelines and formatting requirements for field logbooks, and
detailed procedures for completing field logbooks.
2.1 GENERAL GUIDELINES
• A separate field logbook must be maintained for each project. If a site consists of multiple subsites, designate a separate logbook for each subsite. For special tasks, such as periodic well water-level measurements, data from multiple subsites may be entered into one logbook that contains only one type of information.
• All logbooks must be bound and contain consecutively numbered pages.
• No pages can be removed from the logbook for any purpose.

Tetra Tech EM Inc. – Environmental SOP No. 024 Page 3 of 6Title: Recording of Notes in Field Logbook Revision No. 1, May 18, 1993
Last Reviewed: December 2008
• All field activities, meetings, photographs, and names of personnel must be recorded in the site logbook.
• Each logbook pertaining to a site or subsite should be assigned a serial number based on the date the logbook is issued to the project manager. The first issued logbook should be assigned number 1, the next issued logbook assigned number 2, and so on. The project manager is to maintain a record of all logbooks issued under the project.
• All information must be entered with a ballpoint pen with waterproof ink. Do not use pens with “wet ink,” because the ink may wash out if the paper gets wet. Pencils are not permissible for field notes because information can be erased. The entries should be written dark enough so that the logbook can be easily photocopied.
• Do not enter information in the logbook that is not related to the project. The language used in the logbook should be factual and objective.
• Begin a new page for each day’s notes.
• Write notes on every line of the logbook. If a subject changes and an additional blank space is necessary to make the new subject title stand out, skip one line before beginning the new subject. Do not skip any pages or parts of pages unless a day’s activity ends in the middle of a page.
• Draw a diagonal line on any blank spaces of four lines or more to prevent unauthorized entries.
2.2 LOGBOOK FORMAT
The layout and organization of each field logbook should be consistent with other field logbooks.
Guidelines for the cover, spine, and internal pagination are discussed below.
2.2.1 FORMAT OF FIELD LOGBOOK COVER AND SPINE
Write the following information in clear capital letters on the front cover of each logbook using a
Sharpie® or similar type permanent ink marker:
• Logbook identification number
• The serial number of the logbook (assigned by the project manager)
• Name of the site, city, and state
• Name of subsite if applicable
• Type of activity

Tetra Tech EM Inc. – Environmental SOP No. 024 Page 4 of 6Title: Recording of Notes in Field Logbook Revision No. 1, May 18, 1993
Last Reviewed: December 2008
• Beginning and ending dates of activities entered into the logbook
• “Tetra Tech EM Inc.” City and State
• “REWARD IF FOUND”
Some of the information listed above, such as the list of activities and ending dates, should be entered
after the entire logbook has been filled or after decision that the remaining blank pages in the logbook will
not be filled.
The spine of the logbook should contain an abbreviated version of the information on the cover: for
example, “1, Col. Ave., Hastings, 5/88 - 8/88.”
2.2.2 First Page of the Field Logbook
Spaces are usually provided on the inside front cover (or the opening page in some logbooks), for the
company name (“Tetra Tech EM Inc.”), address, contact name, and telephone number. If preprinted
spaces for this information are not provided in the logbook, write the information on the first available
page.
2.3 ENTERING INFORMATION IN THE LOGBOOK
Enter the following information at the beginning of each day or whenever warranted during the course of
a day:
• Date
• Starting time
• Specific location
• General weather conditions and approximate temperature
• Names of personnel present at the site. Note the affiliation(s) and designation(s) of all personnel
• Equipment calibration and equipment models used.
• Changes in instructions or activities at the site
• Levels of personal protective clothing and equipment

Tetra Tech EM Inc. – Environmental SOP No. 024 Page 5 of 6Title: Recording of Notes in Field Logbook Revision No. 1, May 18, 1993
Last Reviewed: December 2008
• A general title of the first task undertaken (for example, well installation at MW-11, decon at borehole BH-11, groundwater sampling at MW-11)
• Approximate scale for all diagrams. If this can’t be done, write “not to scale” on the diagram. Indicate the north direction on all maps and cross-sections. Label features on each diagram.
• Corrections, if necessary, necessarily including a single line through the entry being corrected. Initial and date any corrections made in the logbook.
• After last entry on each page, initials of the person recording notes. No information is to be entered in the area following these initials.
• At the end of the day, signature of the person recording notes and date at the bottom of the last page. Indicate the end of the work day by writing “Left site at (time).” A diagonal line must be drawn across any remaining blank space at the bottom of this last page.
The following information should be recorded in the logbook after taking a photograph:
• Time, date, location, direction, and, if appropriate, weather conditions
• Description of the subject photographed and the reason for taking the picture
• Sequential number of the photograph and the film roll number or disposable camera used (if applicable)
• Name of the photographer.
The following information should be entered into the logbook when collecting samples:
• Location description
• Name(s) of sampler(s)
• Collection time
• Designation of sample as a grab or composite sample
• Type of sample (water, sediment, soil gas, etc.)
• On-site measurement data (pH, temperature, specific conductivity)
• Field observations (odors, colors, weather, etc.)
• Preliminary sample description
• Type of preservative used
• Instrument readings.

Tetra Tech EM Inc. – Environmental SOP No. 024 Page 6 of 6Title: Recording of Notes in Field Logbook Revision No. 1, May 18, 1993
Last Reviewed: December 2008
If pre-printed field data forms are available (forms such as the micropurge field data collection form),
data should be entered on these pre-printed forms rather than into field logbooks. Note in the logbook
that the field data are recorded on separate forms.
2.4 PRECAUTIONS
Custody of field logbooks must be maintained at all times. Field personnel must keep the logbooks in a
secure place (locked car, trailer, or field office) when the logbook is not in personal possession.
Logbooks are official project documents and must be treated as such.

SOP APPROVAL FORM
TETRA TECH EM INC.
ENVIRONMENTAL STANDARD OPERATING PROCEDURE
FIELD MEASUREMENT OF GROUNDWATER INDICATOR PARAMETERS
SOP NO. 061
REVISION NO. 2
Last Reviewed: July 2009
July 2009 Quality Assurance Approved
Date

Tetra Tech EM Inc. - Environmental SOP No. 061 Page 1 of 9 Title: Field Measurement of Groundwater Revision No. 2, July 2009 Indicator Parameters Last Reviewed: July 2009
1.0 BACKGROUND
Various water quality monitoring systems can be used for determining groundwater indicator parameters
in the field. Commonly measured field indicator parameters include pH, specific conductance,
temperature, oxidation-reduction potential (ORP), dissolved oxygen (DO) and turbidity. Groundwater
field measurements are typically collected in conjunction with groundwater sampling or monitoring well
development (see SOPs 010, 015, and 021).
Various types of water quality systems exist including down-hole systems and flow through cells. Tetra
Tech used several common water quality meters including various types of In-Situ, YSI, Hydac, and
Horiba meters (see Figure 1 at the end of this SOP). The sampling team should select the type of meter or
monitoring system based on site-specific conditions including data collection needs, the types of wells
being sampled, and the sampling procedures used. Multiple parameter systems should be used when
multiple field parameters are to be measured.
1.1 PURPOSE
This standard operating procedure (SOP) establishes the general requirements and procedures for using
various water quality monitoring systems for determining groundwater pH, specific conductance,
temperature, ORP, DO and turbidity in the field.
1.2 SCOPE
This SOP applies to general procedures for calibrating and operating water quality monitoring systems in
the field. The project work plan or field sampling plan should identify the types of systems to be used
and the actual project-specific field parameters to be measured. For each type of water quality system,
the manufacturer’s manual should be consulted for specific operating instructions.

Tetra Tech EM Inc. - Environmental SOP No. 061 Page 2 of 9 Title: Field Measurement of Groundwater Revision No. 2, July 2009 Indicator Parameters Last Reviewed: July 2009
1.3 DEFINITIONS
Single Parameter System: A meter or monitoring system consisting of a single probe designed to
measure a single indicator parameter.
Multiple Parameter System: A meter or monitoring system consisting of multiple probes capable of
measuring multiple indicator parameters.
Open Container Measurements: Field measurements performed in an open container such as a cup, a
jar, or a bucket where an air/water interface exists.
Flow-Through Chamber or Cell: A plastic cell or chamber connected to the sample pump discharge
tubing so that a continuous flow of water passes across the probes. Additional tubing is used to route
water from the flow-through cell to a waste container or final discharge point.
Down-Hole Monitoring System: A meter or monitoring system where probes are submerged by
inserting them into the well. The probes are attached to the meter (located at the well head or ground
surface) by one or more cables.
pH: A measure of the acidity or alkalinity of a solution. The pH scale ranges from 0 to 14 with strongly
acidic solutions at the low end, strongly basic solutions at the high end, and “pure” or neutral water at 7.
Field measurements of pH are recorded in standard units.
Specific Conductance: The ability of a solution to conduct electricity; a measure of the solution’s ionic
activity and content. The higher the concentration of ionic (dissolved) constituents, the higher the
conductivity. Conductivity of the same water changes substantially with temperature. Specific
conductivity is generally found to be a good measure of the concentration of total dissolved solids (TDS)
and salinity. Conductivity is measured by placing two electrodes (with opposite electrical charge) in the
water. For a known electrical current, the voltage drop across the electrodes reveals the solution’s
resistance. Since the resistance of aqueous solution changes with temperature (resistance drops with
increasing temperature), the resistance is corrected to the resistance of the solution at 25 ºC. Field
measurements are recorded in units of microsiemens per centimeters (µS/cm).

Tetra Tech EM Inc. - Environmental SOP No. 061 Page 3 of 9 Title: Field Measurement of Groundwater Revision No. 2, July 2009 Indicator Parameters Last Reviewed: July 2009
Temperature: The degree of hotness or coldness of the solution being measured. Field measurements
are typically recorded in degrees Celsius (°C).
ORP: ORP, or redox potential, is the tendency of a chemical species to acquire electrons and be reduced.
In aqueous solutions, the reduction potential is the tendency of the solution to either gain or lose
electrons when new chemical species are introduced. A solution with a higher (more positive) reduction
potential than the new species will have a tendency to gain electrons from the new species (to be reduced
by oxidizing the new species) and a solution with a lower (more negative) reduction potential will have a
tendency to lose electrons to the new species (to be oxidized by reducing the new species). Just as the
transfer of hydrogen ions between chemical species determines the pH of an aqueous solution, the transfer
of electrons between chemical species determines the reduction potential of an aqueous solution. Like
pH, the reduction potential represents an intensity factor. It does not characterize the capacity of the
system for oxidation or reduction, in much the same way that pH does not characterize the buffering
capacity. Field measurements are typically recorded in millivolts (mV).
DO: Dissolved oxygen (or oxygen saturation) is a relative measure of the amount of oxygen dissolved or
carried in a given medium. In aquatic environments, dissolved oxygen is a relative measure of the
amount of oxygen (O2) dissolved in the water. Field measurements are typically recorded in milligrams
per liter (mg/L).
Turbidity: Turbidity is the cloudiness or haziness of a fluid caused by individual particles (suspended
solids). Fluids can contain suspended solid matter consisting of particles of many different sizes. While
some suspended material will be large enough and heavy enough to settle rapidly to the bottom of the
container if a liquid sample is left to stand, very small particles will settle only very slowly or not at all if
the sample is regularly agitated or the particles are colloidal. These small solid particles cause the liquid
to appear turbid. Field measurements are typically recorded in Nephelometric Turbidity Units (NTU).
1.4 REFERENCE
Essential Handbook of Ground-Water Sampling by Gillian Nielsen, 2007.
Tetra Tech EM Inc. July 2009. SOPs 010, 015, and 021

Tetra Tech EM Inc. - Environmental SOP No. 061 Page 4 of 9 Title: Field Measurement of Groundwater Revision No. 2, July 2009 Indicator Parameters Last Reviewed: July 2009
1.5 REQUIREMENTS AND RESOURCES
The following items are typically required to measure groundwater pH, specific conductance,
temperature, ORP, DO, and turbidity using this SOP:
• Single or multiple parameter water quality measuring system
• Specific conductance calibration solutions
• Buffer solutions of pH 4, 7, and 10 for pH calibration
• Distilled or deionized water
• Rinse bottle
• 50-milliliter (mL) sample cups or beakers
• Sample tubing and connectors (specific to each type of system)
• Waste container to collect purge water
• Logbook or field data sheets
2.0 PROCEDURES
The procedures outlined in this SOP are general and may apply to various types of water quality
monitoring systems to measure groundwater pH, specific conductance, temperature, ORP, DO and
turbidity in the field. General procedures for testing and calibrating the monitoring systems are presented
first, followed by procedures for using the instruments and making field measurements. Each particular
monitoring system should be identified in the project work plan or field sampling plan and should be
operated in accordance with the manufacturer’s instruction manual.
Tetra Tech EM Inc. - Environmental SOP No. 061 Page 5 of 9 Title: Field Measurement of Groundwater Revision No. 2, July 2009 Indicator Parameters Last Reviewed: July 2009
2.1 TESTING AND CALIBRATION PROCEDURES
Each field meter or monitoring system should be calibrated according to manufacturer’s specifications.
In general, equipment should be thoroughly cleaned then calibrated and tested before the start-up of
sampling at each site. Equipment should be calibrated and tested using manufacturer provided solutions
and standards. Care should be taken to rinse the probes between testing and calibration to prevent cross
contaminating solutions. Solutions should be poured from the manufacturer’s container into another
container to prevent compromising the entire solution provided by the manufacturer. Calibration and
testing of field equipment should be documented each time it is performed in field logbooks (or field data
sheets, if applicable). If testing and calibration measurements are out of tolerance, the instrument must be
serviced or repaired.
2.2 FIELD MEASUREMENT PROCEDURES
Each field meter or monitoring system should be operated according to manufacturer’s specifications.
The actual field procedures will vary depending on the type of monitoring system being used (open
container systems, flow-through cell systems, or down-hole systems) and the types of field parameters
being measured. In addition, most systems include a data logging option. A description of open
container, flow-through cell, and down-hole measurement processes are discussed below, followed by a
general procedural summary and a summary of common errors associated with field measurements of
indicator parameters.
2.2.1 Open Container Measurements
Open container measurements consist of collecting groundwater and placing it in a cup or container for
field measurements using a hand held system. This method of field measurements is commonly used
when bailing wells, but can also be used when pumping wells. Prior to field measurements, the
equipment must be cleaned and calibrated following manufacturer’s specifications. Field measurements
should then be made at the frequency and for the indicator parameters specified in the project work plan
or field sampling plan. To make open container field measurements, samplers collect groundwater from
the well and place in a cup or container large enough to adequately submerge the probe or probes, as
specified in the manufacturer’s operations manual. For open containers, measurements should be taken in
the following order: temperature, specific conductance, pH, and turbidity. Open container systems are
not recommended for low-flow sampling as flow-through systems are more appropriate. The probes and

Tetra Tech EM Inc. - Environmental SOP No. 061 Page 6 of 9 Title: Field Measurement of Groundwater Revision No. 2, July 2009 Indicator Parameters Last Reviewed: July 2009
cup or container should be thoroughly rinsed after each field measurement and between sampling
locations.
2.2.2 Flow-Through Cell Measurements
Flow-through cell systems consist of measuring groundwater parameters as a continuous flow of water
passes across the probes through a cell or chamber, and is primarily used when pumping wells and using
low-flow sampling procedures. Prior to field measurements, the equipment must be cleaned and
calibrated following manufacturer’s specifications. Field measurements should then be made at the
frequency and for the indicator parameters specified in the project work plan or field sampling plan.
The flow-through cell or chamber is placed “in line” between the discharge tubing of the pump and the
container used to collect purged water. The outlet from the pump must be connected to the sample
chamber input. The sample chamber outlet must then be connected or routed to a waste container (or to
another designated discharge point). Tubing, fittings, and adaptors are generally required and may be
provided by the manufacturer. Pump discharge tubing and chamber inlets and outlets are typically 1/2 or
3/8 inch diameter.
After the cell or chamber is connected to the pump discharge tubing and waste collection container, the
sensors should be inserted into the sensor mounting plate in their respective ports. Any unused sensor
ports must have plugs installed to close off the sample chamber. The probe cables are then connected to
the meter following manufacturer’s specifications.
With the system connected, the sampler should turn on the pump according to the manufacturer’s
instructions and then turn on the water quality monitor. Before recording any values, the sample chamber
should be full, all air should be voided, and all of the displayed values should be stable. The probes and
sample chamber should be thoroughly rinsed between sampling locations.
2.2.3 Down-Hole Measurements
Down-hole measurement systems consist of inserting the probes (or a multi-parameter sensor housing)
inside a well to obtain field measurements, and is primarily used when pumping wells. Prior to field
measurements, the equipment must be cleaned and calibrated following manufacturer’s specifications.

Tetra Tech EM Inc. - Environmental SOP No. 061 Page 7 of 9 Title: Field Measurement of Groundwater Revision No. 2, July 2009 Indicator Parameters Last Reviewed: July 2009
Field measurements should then be made at the frequency and for the indicator parameters specified in
the project work plan or field sampling plan.
The probes or sensor are attached to a hand held meter or control unit by a cable and lowered inside the
well to be sampled. Limiting factors when using down-hole systems include probe or sensor diameters
and available cable lengths. The probes should be thoroughly decontaminated between sampling
locations...
2.2.4 General Procedures for Field Measurements of Indicator Parameters
The following section discusses general procedures that typically apply to making field measurements of
indicator parameters using various types of field instruments. Each particular type of meter or monitoring
system should be identified in the project work plan or field sampling plan and should be operated in
accordance with the manufacturer’s instruction manual.
1. Inspect the instrument and batteries prior to the field effort.
2. Check the integrity of the buffer solutions used for field calibration since frequent replacement is necessary as a result of degradation upon exposure to the atmosphere.
3. If applicable, make sure all electrolyte solutions within the electrode(s) are at proper levels and no air bubbles are present within the electrode(s).
4. Calibrate the meter and electrode(s) on a daily use basis (or as recommended) following manufacturer's instructions and record data in field logbook or on field data sheets.
5. Immerse the electrode(s) in the sample. Stabilization may take several seconds to several minutes. If the parameter values continues to drift, the sample temperature may not be stable, a physical reaction (e.g., degassing) may be occurring in the sample, or the meter or electrode may be malfunctioning. The failure of the measurements to stabilize should be clearly noted in the logbook or field data sheet. For DO, provide for sufficient flow past the membrane by gently stirring the sample. Probes without stirrers placed in wells (down-hole measurements) may be gently moved up and down to achieve the required mixing.
6. Read and record the value of each parameter being measured making sure units of measure are clearly recorded.
7. Rinse the electrode(s) with deionized water.
8. Store the electrode(s) in accordance with manufacturer’s instructions

Tetra Tech EM Inc. - Environmental SOP No. 061 Page 8 of 9 Title: Field Measurement of Groundwater Revision No. 2, July 2009 Indicator Parameters Last Reviewed: July 2009
2.2.5 Common Errors or Problems Associated With Field Measurements
The project work plan or field sampling plan should clearly identify the types of parameters to be
measured, the measurement frequency, and “stabilization” requirements. It is essential to ensure that the
type of monitoring system selected is compatible with the monitoring well sampling or development
methods to be utilized. Some common errors to avoid are identified below:
• No, or incorrect equipment calibration
• Incorrect or expired calibration standards
• Poor equipment maintenance
• Inadequate training or unfamiliarity with equipment
• No record of units of measure and “+” or “-“ values for ORP
• Too much time taken to measure temperature sensitive parameters
• DO and ORP measured in closed systems (flow-through cell or down-hole) instead of closed cell systems

Tetra Tech EM Inc. - Environmental SOP No. 061 Page 9 of 9 Title: Field Measurement of Groundwater Revision No. 2, July 2009 Indicator Parameters Last Reviewed: July 2009
FIGURE 1 THE HORIBA U-10 WATER QUALITY MONITORING SYSTEM
THE IN-SITU TROLL 9500 LOW-FLOW SYSTEM THE YSI HAND HELD 556 METER
Horiba U-10
In-Situ Troll
YSI 556

Pecatonica River Stage 2 Report October 2, 2015
Appendix B. Lab Reports

Page 1 of 14

January 09, 2015Date:STAT Analysis Corporation
Project: Pecatonica TMDL, Freeport, ILClient: Tetra Tech EM Inc.
Work Order: 14120344Work Order Sample Summary
Lab Sample ID Client Sample ID Collection DateTag Number Date Received
Revision 1
14120344-001A WC01 - 121114 12/11/2014 9:14:00 AM 12/11/201414120344-001B WC01 - 121114 12/11/2014 9:14:00 AM 12/11/201414120344-002A WC01 - 121114-D 12/11/2014 9:14:00 AM 12/11/201414120344-003A SB02 - 121114 12/11/2014 11:28:00 AM 12/11/201414120344-004A SB03 - 121114 12/11/2014 12:15:00 PM 12/11/201414120344-005A SB01 - 121114 12/11/2014 1:56:00 PM 12/11/201414120344-006A SB01 - 121114-D 12/11/2014 1:56:00 PM 12/11/2014
Page 2 of 14

January 09, 2015Date:STAT Analysis Corporation
Project: Pecatonica TMDL, Freeport, ILCLIENT: Tetra Tech EM Inc.
Work Order: 14120344CASE NARRATIVE
Revision 1
Phosphate results for samples SB01 - 121114 (14120344-005A) and SB01 - 121114-D (14120344-006A) were initially reported as Phosphate as PO4. The report contains Phosphate results expressed as Phosphorus (as P).
Total Kjedahl Nitrogen analysis was subcontracted to First Environmental Laboratories, Naperville, IL NELAP 100292.
Page 3 of 14

Project: Pecatonica TMDL, Freeport, ILClient: Tetra Tech EM Inc.
Work Order: 14120344
Date Printed: January 09, 2015
STAT Analysis Corporation2242 West Harrison St., Suite 200, Chicago, IL 60612-3766Tel: (312) 733-0551 Fax: (312) 733-2386 [email protected]
Date Reported: January 09, 2015
Accreditations:IEPA ELAP 100445;ORELAP IL300001;AIHA-LAP, LLC 101160;NVLAP LabCode 101202-0
ANALYTICAL RESULTS
Revision 1
Client Sample ID:WC01 - 121114Lab ID: 14120344-001 Collection Date: 12/11/2014 9:14:00 AM
Matrix: Water
Analyses Result Qualifier Units Date AnalyzedRL DF
Phosphorus (as P) SM4500P,B,E Analyst: YZPrep Date: 12/16/2014Phosphorus (as P) * 12/16/20140.050 mg/L 10.10
Total Suspended Solids E160.2 Analyst: RWPrep Date: 12/12/2014Total Suspended Solids * 12/12/20147.5 mg/L 1ND
Client Sample ID:WC01 - 121114-DLab ID: 14120344-002 Collection Date: 12/11/2014 9:14:00 AM
Matrix: Water
Analyses Result Qualifier Units Date AnalyzedRL DF
Total Suspended Solids E160.2 Analyst: RWPrep Date: 12/12/2014Total Suspended Solids * 12/12/20147.5 mg/L 1ND
Client Sample ID:SB02 - 121114Lab ID: 14120344-003 Collection Date: 12/11/2014 11:28:00 AM
Matrix: Water
Analyses Result Qualifier Units Date AnalyzedRL DF
Total Kjeldahl Nitrogen M4500-NORG Analyst: SUBPrep Date:Total Kjeldahl Nitrogen * 12/18/20141.0 mg/L 1ND
Nitrate and Nitrite M4500-NO3F Analyst: YZPrep Date: 12/13/2014Nitrogen, Nitrate-Nitrite 12/13/20140.20 mg/L 19.5
Ammonia as Nitrogen E350.1 Analyst: YZPrep Date: 12/16/2014Nitrogen, Ammonia (As N) * 12/16/20140.050 mg/L 10.071
Qualifiers: J - Analyte detected below quantitation limitsB - Analyte detected in the associated Method Blank
S - Spike Recovery outside accepted recovery limitsR - RPD outside accepted recovery limits
ND - Not Detected at the Reporting Limit
E - Value above quantitation range* - Non-accredited parameter H - Holding time exceededHT - Sample received past holding time
RL - Reporting / Quantitation Limit for the analysis
Page 4 of 14

Project: Pecatonica TMDL, Freeport, ILClient: Tetra Tech EM Inc.
Work Order: 14120344
Date Printed: January 09, 2015
STAT Analysis Corporation2242 West Harrison St., Suite 200, Chicago, IL 60612-3766Tel: (312) 733-0551 Fax: (312) 733-2386 [email protected]
Date Reported: January 09, 2015
Accreditations:IEPA ELAP 100445;ORELAP IL300001;AIHA-LAP, LLC 101160;NVLAP LabCode 101202-0
ANALYTICAL RESULTS
Revision 1
Client Sample ID:SB03 - 121114Lab ID: 14120344-004 Collection Date: 12/11/2014 12:15:00 PM
Matrix: Water
Analyses Result Qualifier Units Date AnalyzedRL DF
Total Kjeldahl Nitrogen M4500-NORG Analyst: SUBPrep Date:Total Kjeldahl Nitrogen * 12/18/20141.0 mg/L 1ND
Nitrate and Nitrite M4500-NO3F Analyst: YZPrep Date: 12/13/2014Nitrogen, Nitrate-Nitrite 12/13/20140.20 mg/L 114
Ammonia as Nitrogen E350.1 Analyst: YZPrep Date: 12/16/2014Nitrogen, Ammonia (As N) * 12/16/20140.050 mg/L 10.10
Client Sample ID:SB01 - 121114Lab ID: 14120344-005 Collection Date: 12/11/2014 1:56:00 PM
Matrix: Water
Analyses Result Qualifier Units Date AnalyzedRL DF
Total Kjeldahl Nitrogen M4500-NORG Analyst: SUBPrep Date:Total Kjeldahl Nitrogen * 12/18/20141.0 mg/L 1ND
Nitrate and Nitrite M4500-NO3F Analyst: YZPrep Date: 12/13/2014Nitrogen, Nitrate-Nitrite 12/13/20140.20 mg/L 111
Ammonia as Nitrogen E350.1 Analyst: YZPrep Date: 12/16/2014Nitrogen, Ammonia (As N) * 12/16/20140.050 mg/L 10.12
Phosphorus (as P) SM4500P,B,E Analyst: YZPrep Date: 1/8/2015Phosphorus (as P) * 1/8/20150.062 mg/L 1.250.16
Qualifiers: J - Analyte detected below quantitation limitsB - Analyte detected in the associated Method Blank
S - Spike Recovery outside accepted recovery limitsR - RPD outside accepted recovery limits
ND - Not Detected at the Reporting Limit
E - Value above quantitation range* - Non-accredited parameter H - Holding time exceededHT - Sample received past holding time
RL - Reporting / Quantitation Limit for the analysis
Page 5 of 14

Project: Pecatonica TMDL, Freeport, ILClient: Tetra Tech EM Inc.
Work Order: 14120344
Date Printed: January 09, 2015
STAT Analysis Corporation2242 West Harrison St., Suite 200, Chicago, IL 60612-3766Tel: (312) 733-0551 Fax: (312) 733-2386 [email protected]
Date Reported: January 09, 2015
Accreditations:IEPA ELAP 100445;ORELAP IL300001;AIHA-LAP, LLC 101160;NVLAP LabCode 101202-0
ANALYTICAL RESULTS
Revision 1
Client Sample ID:SB01 - 121114-DLab ID: 14120344-006 Collection Date: 12/11/2014 1:56:00 PM
Matrix: Water
Analyses Result Qualifier Units Date AnalyzedRL DF
Total Kjeldahl Nitrogen M4500-NORG Analyst: SUBPrep Date:Total Kjeldahl Nitrogen * 12/18/20141.0 mg/L 1ND
Nitrate and Nitrite M4500-NO3F Analyst: YZPrep Date: 12/13/2014Nitrogen, Nitrate-Nitrite 12/13/20140.20 mg/L 110
Ammonia as Nitrogen E350.1 Analyst: YZPrep Date: 12/16/2014Nitrogen, Ammonia (As N) * 12/16/20140.050 mg/L 10.10
Phosphorus (as P) SM4500P,B,E Analyst: YZPrep Date: 1/8/2015Phosphorus (as P) * 1/8/20150.050 mg/L 10.63
Qualifiers: J - Analyte detected below quantitation limitsB - Analyte detected in the associated Method Blank
S - Spike Recovery outside accepted recovery limitsR - RPD outside accepted recovery limits
ND - Not Detected at the Reporting Limit
E - Value above quantitation range* - Non-accredited parameter H - Holding time exceededHT - Sample received past holding time
RL - Reporting / Quantitation Limit for the analysis
Page 6 of 14

Page 7 of 14
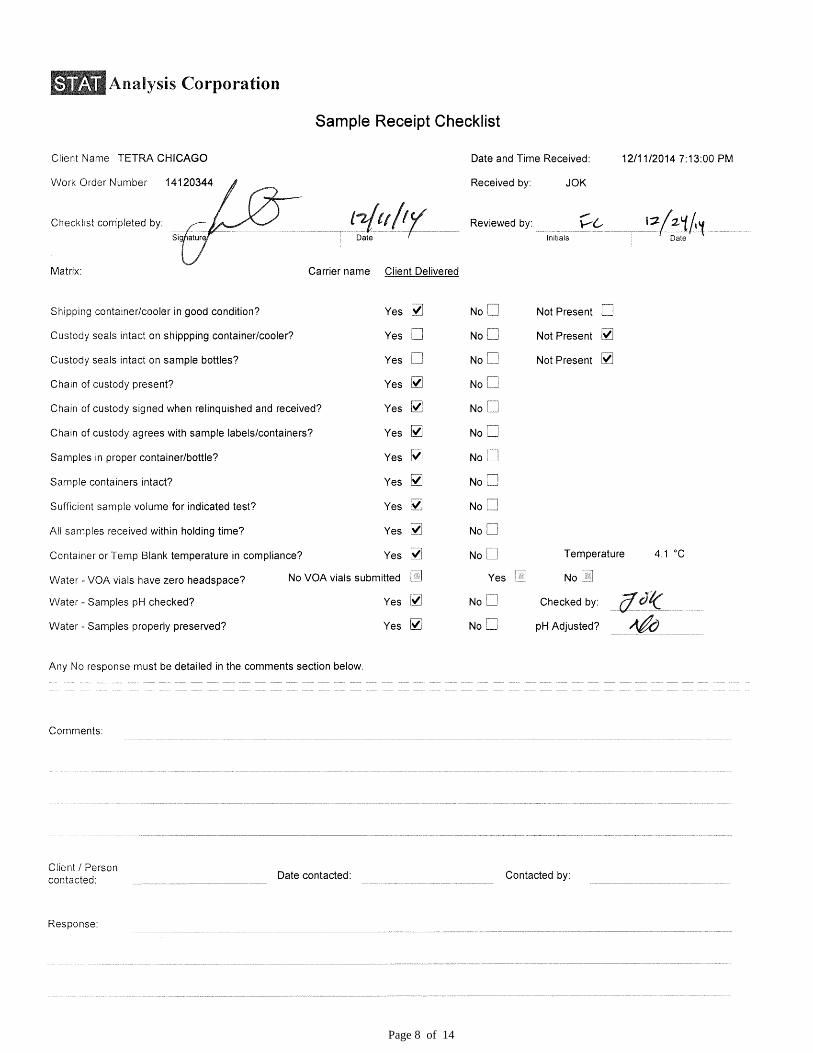
Page 8 of 14

Project: Pecatonica TMDL, Freeport, IL
CLIENT: Tetra Tech EM Inc.Work Order: 14120344
ANALYTICAL QC SUMMARY REPORT
BatchID: 81514Wet Chemistry
QC SUMMARY
PREP SUMMARY
Sample ID:NH4MBW1 121614
TestNo:E350.1
Analysis Date:12/16/2014
Prep Date:12/16/2014
Analyte Result SPK valueSPK
Ref Val % RECRPD
Ref Val %RPDLow Limit
High Limit
RPDLimit Qual
Units:mg/L
PQL
Customer ID:
ZZZZZ
Run ID:LACHAT_141216E
SeqNo:2870200MBLK
SampType:
Nitrogen, Ammonia (As N) *0.050ND
Sample ID:NH4LCSW1 121614
TestNo:E350.1
Analysis Date:12/16/2014
Prep Date:12/16/2014
Analyte Result SPK valueSPK
Ref Val % RECRPD
Ref Val %RPDLow Limit
High Limit
RPDLimit Qual
Units:mg/L
PQL
Customer ID:
ZZZZZ
Run ID:LACHAT_141216E
SeqNo:2870201LCS
SampType:
Nitrogen, Ammonia (As N) 2.5 87.6 80 120 *0.050 0 0 02.191
Sample ID:14120344-005AMS
TestNo:E350.1
Analysis Date:12/16/2014
Prep Date:12/16/2014
Analyte Result SPK valueSPK
Ref Val % RECRPD
Ref Val %RPDLow Limit
High Limit
RPDLimit Qual
Units:mg/L
PQL
Customer ID:
SB01 - 121114
Run ID:LACHAT_141216E
SeqNo:2870203MS
SampType:
Nitrogen, Ammonia (As N) 2.5 89.2 75 125 *0.050 0.1247 0 02.354
Sample ID:14120344-005AMSD
TestNo:E350.1
Analysis Date:12/16/2014
Prep Date:12/16/2014
Analyte Result SPK valueSPK
Ref Val % RECRPD
Ref Val %RPDLow Limit
High Limit
RPDLimit Qual
Units:mg/L
PQL
Customer ID:
SB01 - 121114
Run ID:LACHAT_141216E
SeqNo:2870204MSD
SampType:
Nitrogen, Ammonia (As N) 2.5 87.4 75 125 20 *0.050 0.1247 2.354 1.832.311
Sample ID Matrix pH SampAmt Sol Added Sol Recov Fin Vol factor PrepStart PrepEnd12/16/201412/16/20141.000NH4MBW1 121614 50 500 0
12/16/201412/16/20141.000NH4LCSW1 121614 50 500 012/16/201412/16/20141.00014120344-003A 50 500 0Water
12/16/201412/16/20141.00014120344-004A 50 500 0Water
12/16/201412/16/20141.00014120344-005A 50 500 0Water
12/16/201412/16/20141.00014120344-005AMS 50 500 0Water
12/16/201412/16/20141.00014120344-005AMSD 50 500 0Water
12/16/201412/16/20141.00014120344-006A 50 500 0Water
12/16/201412/16/20141.000IDOC1 50 500 0
12/16/201412/16/20141.000IDOC2 50 500 0
12/16/201412/16/20141.000IDOC3 50 500 0
12/16/201412/16/20141.000IDOC4 50 500 0
Qualifiers: J - Analyte detected below quantitation limits
B - Analyte detected in the associated Method BlankS - Spike Recovery outside accepted recovery limits
R - RPD outside accepted recovery limits
ND - Not Detected at the Reporting Limit
* - Non Accredited Parameter H/HT - Holding Time Exceeded
E - Value above quantitation range
Page 9 of 14

Project: Pecatonica TMDL, Freeport, IL
CLIENT: Tetra Tech EM Inc.Work Order: 14120344
ANALYTICAL QC SUMMARY REPORT
BatchID: R105623Wet Chemistry
Sample ID:N2N3MBW1 121314
TestNo:M4500-NO3F
Analysis Date:12/13/2014
Prep Date:12/13/2014
Analyte Result SPK valueSPK
Ref Val % REC RPD Ref Val %RPD
Low Limit
High Limit
RPDLimit Qual
Units:mg/L
PQL
Customer ID:
ZZZZZ
Run ID:LACHAT_141213A
SeqNo:2867869MBLK
SampType:
Nitrogen, Nitrate-Nitrite 0.20ND
Sample ID:N2N3LCSW1 121314
TestNo:M4500-NO3F
Analysis Date:12/13/2014
Prep Date:12/13/2014
Analyte Result SPK valueSPK
Ref Val % RECRPD
Ref Val %RPDLow Limit
High Limit
RPDLimit Qual
Units:mg/L
PQL
Customer ID:
ZZZZZ
Run ID:LACHAT_141213A
SeqNo:2867870LCS
SampType:
Nitrogen, Nitrate-Nitrite 10 107 80 1200.20 0 0 010.67
Sample ID:14120344-005AMS
TestNo:M4500-NO3F
Analysis Date:12/13/2014
Prep Date:12/13/2014
Analyte Result SPK valueSPK
Ref Val % RECRPD
Ref Val %RPDLow Limit
High Limit
RPDLimit Qual
Units:mg/L
PQL
Customer ID:
SB01 - 121114
Run ID:LACHAT_141213A
SeqNo:2867872MS
SampType:
Nitrogen, Nitrate-Nitrite 10 88.2 75 1250.20 10.77 0 019.59
Sample ID:14120344-005AMSD
TestNo:M4500-NO3F
Analysis Date:12/13/2014
Prep Date:12/13/2014
Analyte Result SPK valueSPK
Ref Val % RECRPD
Ref Val %RPDLow Limit
High Limit
RPDLimit Qual
Units:mg/L
PQL
Customer ID:
SB01 - 121114
Run ID:LACHAT_141213A
SeqNo:2867877MSD
SampType:
Nitrogen, Nitrate-Nitrite 10 95.1 75 125 200.40 10.77 19.59 3.4720.28
Qualifiers: J - Analyte detected below quantitation limits
B - Analyte detected in the associated Method BlankS - Spike Recovery outside accepted recovery limits
R - RPD outside accepted recovery limits
ND - Not Detected at the Reporting Limit
* - Non Accredited Parameter H/HT - Holding Time Exceeded
E - Value above quantitation range
Page 10 of 14

Project: Pecatonica TMDL, Freeport, IL
CLIENT: Tetra Tech EM Inc.Work Order: 14120344
ANALYTICAL QC SUMMARY REPORT
BatchID: R105694Wet Chemistry
Sample ID:TPMBW1 121614
TestNo:SM4500P,B,E
Analysis Date:12/16/2014
Prep Date:12/16/2014
Analyte Result SPK valueSPK
Ref Val % REC RPD Ref Val %RPD
Low Limit
High Limit
RPDLimit Qual
Units:mg/L
PQL
Customer ID:
ZZZZZ
Run ID:SPEC_141216B
SeqNo:2870160MBLK
SampType:
Phosphorus (as P) *0.050ND
Sample ID:TPLCSW1 121614
TestNo:SM4500P,B,E
Analysis Date:12/16/2014
Prep Date:12/16/2014
Analyte Result SPK valueSPK
Ref Val % RECRPD
Ref Val %RPDLow Limit
High Limit
RPDLimit Qual
Units:mg/L
PQL
Customer ID:
ZZZZZ
Run ID:SPEC_141216B
SeqNo:2870161LCS
SampType:
Phosphorus (as P) 0.5 101 80 120 *0.050 0 0 00.5073
Sample ID:14120344-001BMS
TestNo:SM4500P,B,E
Analysis Date:12/16/2014
Prep Date:12/16/2014
Analyte Result SPK valueSPK
Ref Val % RECRPD
Ref Val %RPDLow Limit
High Limit
RPDLimit Qual
Units:mg/L
PQL
Customer ID:
WC01 - 121114
Run ID:SPEC_141216B
SeqNo:2870163MS
SampType:
Phosphorus (as P) 0.5 88.9 75 125 *0.050 0.1035 0 00.548
Sample ID:14120344-001BMSD
TestNo:SM4500P,B,E
Analysis Date:12/16/2014
Prep Date:12/16/2014
Analyte Result SPK valueSPK
Ref Val % RECRPD
Ref Val %RPDLow Limit
High Limit
RPDLimit Qual
Units:mg/L
PQL
Customer ID:
WC01 - 121114
Run ID:SPEC_141216B
SeqNo:2870164MSD
SampType:
Phosphorus (as P) 0.5 84.1 75 125 20 *0.050 0.1035 0.548 4.480.524
Qualifiers: J - Analyte detected below quantitation limits
B - Analyte detected in the associated Method BlankS - Spike Recovery outside accepted recovery limits
R - RPD outside accepted recovery limits
ND - Not Detected at the Reporting Limit
* - Non Accredited Parameter H/HT - Holding Time Exceeded
E - Value above quantitation range
Page 11 of 14

Project: Pecatonica TMDL, Freeport, IL
CLIENT: Tetra Tech EM Inc.Work Order: 14120344
ANALYTICAL QC SUMMARY REPORT
BatchID: R106180Wet Chemistry
Sample ID:TPMBW1 010815
TestNo:SM4500P,B,E
Analysis Date:1/8/2015
Prep Date:1/8/2015
Analyte Result SPK valueSPK
Ref Val % REC RPD Ref Val %RPD
Low Limit
High Limit
RPDLimit Qual
Units:mg/L
PQL
Customer ID:
ZZZZZ
Run ID:SPEC_150108C
SeqNo:2883532MBLK
SampType:
Phosphorus (as P) *0.050ND
Sample ID:TPLCSW1 010815
TestNo:SM4500P,B,E
Analysis Date:1/8/2015
Prep Date:1/8/2015
Analyte Result SPK valueSPK
Ref Val % RECRPD
Ref Val %RPDLow Limit
High Limit
RPDLimit Qual
Units:mg/L
PQL
Customer ID:
ZZZZZ
Run ID:SPEC_150108C
SeqNo:2883533LCS
SampType:
Phosphorus (as P) 0.5 101 80 120 *0.050 0 0 00.5073
Sample ID:14120344-005AMS
TestNo:SM4500P,B,E
Analysis Date:1/8/2015
Prep Date:1/8/2015
Analyte Result SPK valueSPK
Ref Val % RECRPD
Ref Val %RPDLow Limit
High Limit
RPDLimit Qual
Units:mg/L
PQL
Customer ID:
SB01 - 121114
Run ID:SPEC_150108C
SeqNo:2883535MS
SampType:
Phosphorus (as P) 0.5 77.8 75 125 *0.050 0.1586 0 00.5477
Sample ID:14120344-005AMSD
TestNo:SM4500P,B,E
Analysis Date:1/8/2015
Prep Date:1/8/2015
Analyte Result SPK valueSPK
Ref Val % RECRPD
Ref Val %RPDLow Limit
High Limit
RPDLimit Qual
Units:mg/L
PQL
Customer ID:
SB01 - 121114
Run ID:SPEC_150108C
SeqNo:2883536MSD
SampType:
Phosphorus (as P) 0.5 75.3 75 125 20 *0.050 0.1586 0.5477 2.350.535
Qualifiers: J - Analyte detected below quantitation limits
B - Analyte detected in the associated Method BlankS - Spike Recovery outside accepted recovery limits
R - RPD outside accepted recovery limits
ND - Not Detected at the Reporting Limit
* - Non Accredited Parameter H/HT - Holding Time Exceeded
E - Value above quantitation range
Page 12 of 14

Project: Pecatonica TMDL, Freeport, IL
CLIENT: Tetra Tech EM Inc.Work Order: 14120344
ANALYTICAL QC SUMMARY REPORT
BatchID: R105583Wet Chemistry
Sample ID:TSSMBK 12/11/14
TestNo:E160.2
Analysis Date:12/11/2014
Prep Date:12/11/2014
Analyte Result SPK valueSPK
Ref Val % REC RPD Ref Val %RPD
Low Limit
High Limit
RPDLimit Qual
Units:mg/L
PQL
Customer ID:
ZZZZZ
Run ID:BALANCE_141211A
SeqNo:2866885MBLK
SampType:
Total Suspended Solids *7.5ND
Sample ID:TSSLCS 12/11/14
TestNo:E160.2
Analysis Date:12/11/2014
Prep Date:12/11/2014
Analyte Result SPK valueSPK
Ref Val % RECRPD
Ref Val %RPDLow Limit
High Limit
RPDLimit Qual
Units:mg/L
PQL
Customer ID:
ZZZZZ
Run ID:BALANCE_141211A
SeqNo:2866886LCS
SampType:
Total Suspended Solids 1000 94.6 80 120 *7.5 0 0 0946
Sample ID:14120315-012ADUP
TestNo:E160.2
Analysis Date:12/11/2014
Prep Date:12/11/2014
Analyte Result SPK valueSPK
Ref Val % RECRPD
Ref Val %RPDLow Limit
High Limit
RPDLimit Qual
Units:mg/L
PQL
Customer ID:
ZZZZZ
Run ID:BALANCE_141211A
SeqNo:2866889DUP
SampType:
Total Suspended Solids 0 0 0 0 20 *7.5 0 0 0ND
Qualifiers: J - Analyte detected below quantitation limits
B - Analyte detected in the associated Method BlankS - Spike Recovery outside accepted recovery limits
R - RPD outside accepted recovery limits
ND - Not Detected at the Reporting Limit
* - Non Accredited Parameter H/HT - Holding Time Exceeded
E - Value above quantitation range
Page 13 of 14

Page 14 of 14

1 of 14

April 07, 2015Date:STAT Analysis Corporation
Project: 103IS3456, Pecatonica TMDL, Stephenson Co., ILClient: Tetra Tech EM Inc.
Work Order: 15030703Work Order Sample Summary
Lab Sample ID Client Sample ID Collection DateTag Number Date Received
Revision 0
15030703-001A WC-01-032415 3/24/2015 9:18:00 AM 3/24/201515030703-001B WC-01-032415 3/24/2015 9:18:00 AM 3/24/201515030703-002A SB-01-032415 3/24/2015 1:26:00 PM 3/24/201515030703-003A SB-02-032415 3/24/2015 11:20:00 AM 3/24/201515030703-004A SB-03-032415 3/24/2015 11:50:00 AM 3/24/2015
2 of 14

April 07, 2015Date:STAT Analysis Corporation
Project: 103IS3456, Pecatonica TMDL, Stephenson Co., ILCLIENT: Tetra Tech EM Inc.
Work Order: 15030703CASE NARRATIVE
Revision 0
Total Kjedahl Nitrogen analysis was subcontracted to First Environmental Laboratories, Naperville, IL NELAP 100292.
3 of 14
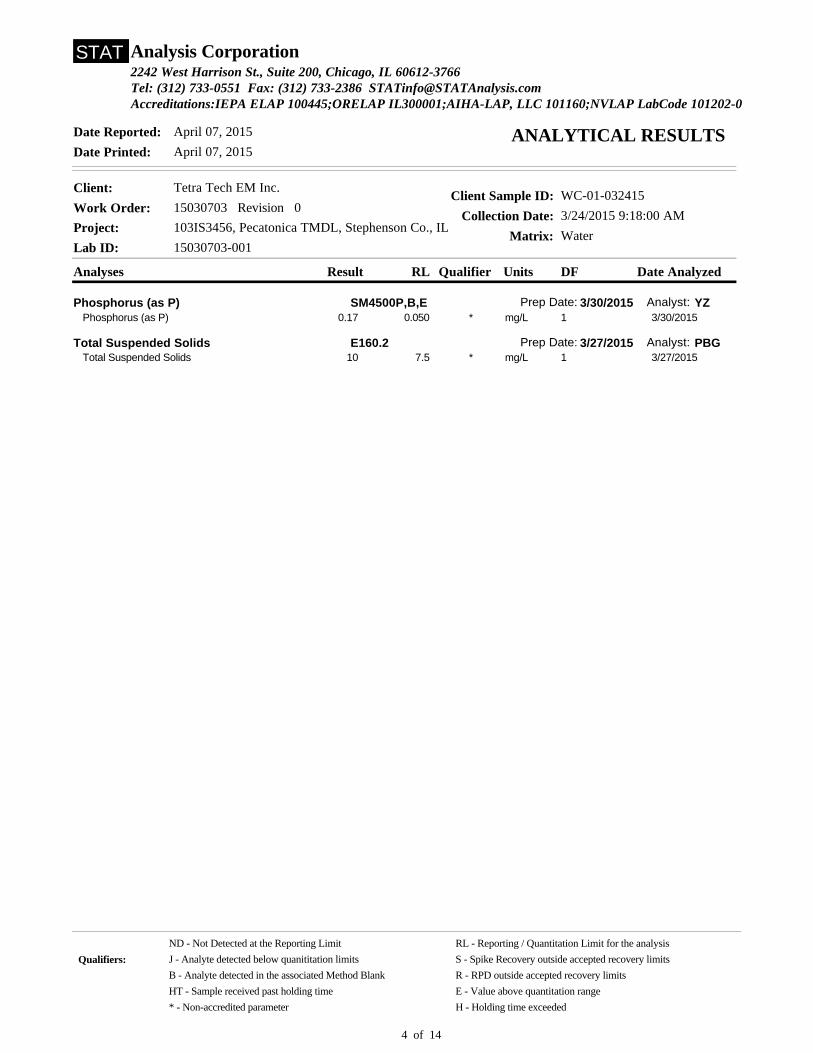
Project: 103IS3456, Pecatonica TMDL, Stephenson Co., IL
Client Sample ID: WC-01-032415
Collection Date: 3/24/2015 9:18:00 AM
Matrix: Water
Analyses Result Qualifier Units Date AnalyzedRL
Client: Tetra Tech EM Inc.
Work Order: 15030703
DF
Lab ID: 15030703-001
Date Printed: April 07, 2015
STAT Analysis Corporation2242 West Harrison St., Suite 200, Chicago, IL 60612-3766Tel: (312) 733-0551 Fax: (312) 733-2386 [email protected]
Date Reported: April 07, 2015
Accreditations:IEPA ELAP 100445;ORELAP IL300001;AIHA-LAP, LLC 101160;NVLAP LabCode 101202-0
ANALYTICAL RESULTS
Revision 0
Phosphorus (as P) SM4500P,B,E Analyst: YZPrep Date: 3/30/2015Phosphorus (as P) * 3/30/20150.050 mg/L 10.17
Total Suspended Solids E160.2 Analyst: PBGPrep Date: 3/27/2015Total Suspended Solids * 3/27/20157.5 mg/L 110
Qualifiers: J - Analyte detected below quanititation limitsB - Analyte detected in the associated Method Blank
S - Spike Recovery outside accepted recovery limitsR - RPD outside accepted recovery limits
ND - Not Detected at the Reporting Limit
E - Value above quantitation range* - Non-accredited parameterHT - Sample received past holding time
H - Holding time exceeded
RL - Reporting / Quantitation Limit for the analysis
4 of 14

Project: 103IS3456, Pecatonica TMDL, Stephenson Co., IL
Client Sample ID: SB-01-032415
Collection Date: 3/24/2015 1:26:00 PM
Matrix: Water
Analyses Result Qualifier Units Date AnalyzedRL
Client: Tetra Tech EM Inc.
Work Order: 15030703
DF
Lab ID: 15030703-002
Date Printed: April 07, 2015
STAT Analysis Corporation2242 West Harrison St., Suite 200, Chicago, IL 60612-3766Tel: (312) 733-0551 Fax: (312) 733-2386 [email protected]
Date Reported: April 07, 2015
Accreditations:IEPA ELAP 100445;ORELAP IL300001;AIHA-LAP, LLC 101160;NVLAP LabCode 101202-0
ANALYTICAL RESULTS
Revision 0
Total Kjeldahl Nitrogen M4500-NORG Analyst: SUBPrep Date:Total Kjeldahl Nitrogen * 4/1/20151.0 mg/L 1ND
Nitrate and Nitrite M4500-NO3F Analyst: YZPrep Date: 3/26/2015Nitrogen, Nitrate-Nitrite 3/26/20150.20 mg/L 111
Ammonia as Nitrogen E350.1 Analyst: YZPrep Date: 3/27/2015Nitrogen, Ammonia (As N) * 3/27/20150.050 mg/L 10.15
Phosphorus (as P) SM4500P,B,E Analyst: YZPrep Date: 3/30/2015Phosphorus (as P) * 3/30/20150.050 mg/L 10.12
Qualifiers: J - Analyte detected below quanititation limitsB - Analyte detected in the associated Method Blank
S - Spike Recovery outside accepted recovery limitsR - RPD outside accepted recovery limits
ND - Not Detected at the Reporting Limit
E - Value above quantitation range* - Non-accredited parameterHT - Sample received past holding time
H - Holding time exceeded
RL - Reporting / Quantitation Limit for the analysis
5 of 14

Project: 103IS3456, Pecatonica TMDL, Stephenson Co., IL
Client Sample ID: SB-02-032415
Collection Date: 3/24/2015 11:20:00 AM
Matrix: Water
Analyses Result Qualifier Units Date AnalyzedRL
Client: Tetra Tech EM Inc.
Work Order: 15030703
DF
Lab ID: 15030703-003
Date Printed: April 07, 2015
STAT Analysis Corporation2242 West Harrison St., Suite 200, Chicago, IL 60612-3766Tel: (312) 733-0551 Fax: (312) 733-2386 [email protected]
Date Reported: April 07, 2015
Accreditations:IEPA ELAP 100445;ORELAP IL300001;AIHA-LAP, LLC 101160;NVLAP LabCode 101202-0
ANALYTICAL RESULTS
Revision 0
Total Kjeldahl Nitrogen M4500-NORG Analyst: SUBPrep Date:Total Kjeldahl Nitrogen * 4/1/20151.0 mg/L 11.0
Nitrate and Nitrite M4500-NO3F Analyst: YZPrep Date: 3/26/2015Nitrogen, Nitrate-Nitrite 3/26/20151.0 mg/L 59.6
Ammonia as Nitrogen E350.1 Analyst: YZPrep Date: 3/27/2015Nitrogen, Ammonia (As N) * 3/27/20150.050 mg/L 10.17
Qualifiers: J - Analyte detected below quanititation limitsB - Analyte detected in the associated Method Blank
S - Spike Recovery outside accepted recovery limitsR - RPD outside accepted recovery limits
ND - Not Detected at the Reporting Limit
E - Value above quantitation range* - Non-accredited parameterHT - Sample received past holding time
H - Holding time exceeded
RL - Reporting / Quantitation Limit for the analysis
6 of 14

Project: 103IS3456, Pecatonica TMDL, Stephenson Co., IL
Client Sample ID: SB-03-032415
Collection Date: 3/24/2015 11:50:00 AM
Matrix: Water
Analyses Result Qualifier Units Date AnalyzedRL
Client: Tetra Tech EM Inc.
Work Order: 15030703
DF
Lab ID: 15030703-004
Date Printed: April 07, 2015
STAT Analysis Corporation2242 West Harrison St., Suite 200, Chicago, IL 60612-3766Tel: (312) 733-0551 Fax: (312) 733-2386 [email protected]
Date Reported: April 07, 2015
Accreditations:IEPA ELAP 100445;ORELAP IL300001;AIHA-LAP, LLC 101160;NVLAP LabCode 101202-0
ANALYTICAL RESULTS
Revision 0
Total Kjeldahl Nitrogen M4500-NORG Analyst: SUBPrep Date:Total Kjeldahl Nitrogen * 4/1/20151.0 mg/L 1ND
Nitrate and Nitrite M4500-NO3F Analyst: YZPrep Date: 3/26/2015Nitrogen, Nitrate-Nitrite 3/26/20150.20 mg/L 112
Ammonia as Nitrogen E350.1 Analyst: YZPrep Date: 3/27/2015Nitrogen, Ammonia (As N) * 3/27/20150.050 mg/L 10.26
Qualifiers: J - Analyte detected below quanititation limitsB - Analyte detected in the associated Method Blank
S - Spike Recovery outside accepted recovery limitsR - RPD outside accepted recovery limits
ND - Not Detected at the Reporting Limit
E - Value above quantitation range* - Non-accredited parameterHT - Sample received past holding time
H - Holding time exceeded
RL - Reporting / Quantitation Limit for the analysis
7 of 14

8 of 14

9 of 14

Project: 103IS3456, Pecatonica TMDL, Stephenson Co., IL
CLIENT: Tetra Tech EM Inc.Work Order: 15030703
ANALYTICAL QC SUMMARY REPORT
BatchID: 83282Wet Chemistry
QC SUMMARY
PREP SUMMARY
Sample ID:NH4MBW1 032715
TestNo:E350.1
Analysis Date:3/27/2015
Prep Date:3/27/2015
Analyte Result SPK valueSPK Ref
Val % RECRPD
Ref Val %RPDLow Limit
High Limit
RPDLimit Qual
Units:mg/L
PQL
Customer ID:
ZZZZZ
Run ID:LACHAT_150327B
SeqNo:2933638MBLK
SampType:
Nitrogen, Ammonia (As N) *0.050ND
Sample ID:NH4LCSW1 032715
TestNo:E350.1
Analysis Date:3/27/2015
Prep Date:3/27/2015
Analyte Result SPK valueSPK Ref
Val % RECRPD
Ref Val %RPDLow Limit
High Limit
RPDLimit Qual
Units:mg/L
PQL
Customer ID:
ZZZZZ
Run ID:LACHAT_150327B
SeqNo:2933640LCS
SampType:
Nitrogen, Ammonia (As N) 2.5 101 80 120 *0.050 0 0 02.526
Sample ID:15030703-003AMS
TestNo:E350.1
Analysis Date:3/27/2015
Prep Date:3/27/2015
Analyte Result SPK valueSPK Ref
Val % RECRPD
Ref Val %RPDLow Limit
High Limit
RPDLimit Qual
Units:mg/L
PQL
Customer ID:
SB-02-032415
Run ID:LACHAT_150327B
SeqNo:2933642MS
SampType:
Nitrogen, Ammonia (As N) 2.5 103 75 125 *0.050 0.1711 0 02.735
Sample ID:15030703-003AMSD
TestNo:E350.1
Analysis Date:3/27/2015
Prep Date:3/27/2015
Analyte Result SPK valueSPK Ref
Val % RECRPD
Ref Val %RPDLow Limit
High Limit
RPDLimit Qual
Units:mg/L
PQL
Customer ID:
SB-02-032415
Run ID:LACHAT_150327B
SeqNo:2933643MSD
SampType:
Nitrogen, Ammonia (As N) 2.5 106 75 125 20 *0.050 0.1711 2.735 3.072.82
Sample ID Matrix pH SampAmt Sol Added Sol Recov Fin Vol factor PrepStart PrepEnd3/27/20153/27/20151.000NH4MBW1 032715 50 500 0
3/27/20153/27/20151.000NH4LCSW1 032715 50 500 0
3/27/20153/27/20151.00015030703-002A 50 500 0Water
3/27/20153/27/20151.00015030703-003A 50 500 0Water
3/27/20153/27/20151.00015030703-004A 50 500 0Water
3/27/20153/27/20151.00015030703-003AMS 50 500 0Water
3/27/20153/27/20151.00015030703-003AMSD 50 500 0Water
Qualifiers: J - Analyte detected below quantitation limits
B - Analyte detected in the associated Method BlankS - Spike Recovery outside accepted recovery limits
R - RPD outside accepted recovery limits
ND - Not Detected at the Reporting Limit
* - Non Accredited Parameter H/HT - Holding Time Exceeded
E - Value above quantitation range
10 of 14

Project: 103IS3456, Pecatonica TMDL, Stephenson Co., IL
CLIENT: Tetra Tech EM Inc.Work Order: 15030703
ANALYTICAL QC SUMMARY REPORT
BatchID: R108065Wet Chemistry
Sample ID:N2N3MW1 032615
TestNo:M4500-NO3F
Analysis Date:3/26/2015
Prep Date:3/26/2015
Analyte Result SPK valueSPK Ref
Val % RECRPD
Ref Val %RPDLow Limit
High Limit
RPDLimit Qual
Units:mg/L
PQL
Customer ID:
ZZZZZ
Run ID:LACHAT_150326C
SeqNo:2933479MBLK
SampType:
Nitrogen, Nitrate-Nitrite 0.20ND
Sample ID:N2N3LCSW1 032615
TestNo:M4500-NO3F
Analysis Date:3/26/2015
Prep Date:3/26/2015
Analyte Result SPK valueSPK Ref
Val % RECRPD
Ref Val %RPDLow Limit
High Limit
RPDLimit Qual
Units:mg/L
PQL
Customer ID:
ZZZZZ
Run ID:LACHAT_150326C
SeqNo:2933480LCS
SampType:
Nitrogen, Nitrate-Nitrite 10 95.8 80 1200.20 0 0 09.581
Sample ID:15030703-003AMS
TestNo:M4500-NO3F
Analysis Date:3/26/2015
Prep Date:3/26/2015
Analyte Result SPK valueSPK Ref
Val % RECRPD
Ref Val %RPDLow Limit
High Limit
RPDLimit Qual
Units:mg/L
PQL
Customer ID:
SB-02-032415
Run ID:LACHAT_150326C
SeqNo:2933482MS
SampType:
Nitrogen, Nitrate-Nitrite 50 103 75 1251.0 9.582 0 060.9
Sample ID:15030703-003AMSD
TestNo:M4500-NO3F
Analysis Date:3/26/2015
Prep Date:3/26/2015
Analyte Result SPK valueSPK Ref
Val % RECRPD
Ref Val %RPDLow Limit
High Limit
RPDLimit Qual
Units:mg/L
PQL
Customer ID:
SB-02-032415
Run ID:LACHAT_150326C
SeqNo:2933483MSD
SampType:
Nitrogen, Nitrate-Nitrite 50 99.8 75 125 201.0 9.582 60.9 2.3259.5
Qualifiers: J - Analyte detected below quantitation limits
B - Analyte detected in the associated Method BlankS - Spike Recovery outside accepted recovery limits
R - RPD outside accepted recovery limits
ND - Not Detected at the Reporting Limit
* - Non Accredited Parameter H/HT - Holding Time Exceeded
E - Value above quantitation range
11 of 14

Project: 103IS3456, Pecatonica TMDL, Stephenson Co., IL
CLIENT: Tetra Tech EM Inc.Work Order: 15030703
ANALYTICAL QC SUMMARY REPORT
BatchID: R108091Wet Chemistry
Sample ID:TSSMBK 3/27/15
TestNo:E160.2
Analysis Date:3/27/2015
Prep Date:3/27/2015
Analyte Result SPK valueSPK Ref
Val % RECRPD
Ref Val %RPDLow Limit
High Limit
RPDLimit Qual
Units:mg/L
PQL
Customer ID:
ZZZZZ
Run ID:BALANCE_150327B
SeqNo:2934229MBLK
SampType:
Total Suspended Solids *7.5ND
Sample ID:TSSLCS 3/27/15
TestNo:E160.2
Analysis Date:3/27/2015
Prep Date:3/27/2015
Analyte Result SPK valueSPK Ref
Val % RECRPD
Ref Val %RPDLow Limit
High Limit
RPDLimit Qual
Units:mg/L
PQL
Customer ID:
ZZZZZ
Run ID:BALANCE_150327B
SeqNo:2934230LCS
SampType:
Total Suspended Solids 1000 99.5 80 120 *7.5 0 0 0995
Sample ID:15030703-001ADUP
TestNo:E160.2
Analysis Date:3/27/2015
Prep Date:3/27/2015
Analyte Result SPK valueSPK Ref
Val % RECRPD
Ref Val %RPDLow Limit
High Limit
RPDLimit Qual
Units:mg/L
PQL
Customer ID:
WC-01-032415
Run ID:BALANCE_150327B
SeqNo:2934232DUP
SampType:
Total Suspended Solids 0 0 0 0 20 *7.5 0 10 10.59
Qualifiers: J - Analyte detected below quantitation limits
B - Analyte detected in the associated Method BlankS - Spike Recovery outside accepted recovery limits
R - RPD outside accepted recovery limits
ND - Not Detected at the Reporting Limit
* - Non Accredited Parameter H/HT - Holding Time Exceeded
E - Value above quantitation range
12 of 14

Project: 103IS3456, Pecatonica TMDL, Stephenson Co., IL
CLIENT: Tetra Tech EM Inc.Work Order: 15030703
ANALYTICAL QC SUMMARY REPORT
BatchID: R108110Wet Chemistry
Sample ID:TPMBW1 033015
TestNo:SM4500P,B,E
Analysis Date:3/30/2015
Prep Date:3/30/2015
Analyte Result SPK valueSPK Ref
Val % RECRPD
Ref Val %RPDLow Limit
High Limit
RPDLimit Qual
Units:mg/L
PQL
Customer ID:
ZZZZZ
Run ID:SPEC_150330B
SeqNo:2935079MBLK
SampType:
Phosphorus (as P) *0.050ND
Sample ID:TPLCSW1 033015
TestNo:SM4500P,B,E
Analysis Date:3/30/2015
Prep Date:3/30/2015
Analyte Result SPK valueSPK Ref
Val % RECRPD
Ref Val %RPDLow Limit
High Limit
RPDLimit Qual
Units:mg/L
PQL
Customer ID:
ZZZZZ
Run ID:SPEC_150330B
SeqNo:2935080LCS
SampType:
Phosphorus (as P) 0.5 101 80 120 *0.050 0 0 00.5073
Sample ID:15030703-002AMS
TestNo:SM4500P,B,E
Analysis Date:3/30/2015
Prep Date:3/30/2015
Analyte Result SPK valueSPK Ref
Val % RECRPD
Ref Val %RPDLow Limit
High Limit
RPDLimit Qual
Units:mg/L
PQL
Customer ID:
SB-01-032415
Run ID:SPEC_150330B
SeqNo:2935084MS
SampType:
Phosphorus (as P) 0.5 84.6 75 125 *0.050 0.1247 0 00.5477
Sample ID:15030703-002AMSD
TestNo:SM4500P,B,E
Analysis Date:3/30/2015
Prep Date:3/30/2015
Analyte Result SPK valueSPK Ref
Val % RECRPD
Ref Val %RPDLow Limit
High Limit
RPDLimit Qual
Units:mg/L
PQL
Customer ID:
SB-01-032415
Run ID:SPEC_150330B
SeqNo:2935086MSD
SampType:
Phosphorus (as P) 0.5 82.9 75 125 20 *0.050 0.1247 0.5477 1.560.5392
Qualifiers: J - Analyte detected below quantitation limits
B - Analyte detected in the associated Method BlankS - Spike Recovery outside accepted recovery limits
R - RPD outside accepted recovery limits
ND - Not Detected at the Reporting Limit
* - Non Accredited Parameter H/HT - Holding Time Exceeded
E - Value above quantitation range
13 of 14

14 of 14

1 of 17

April 24, 2015Date:STAT Analysis Corporation
Project: 103IS3456, Pecatonica TMDLClient: Tetra Tech EM Inc.
Work Order: 15040582Work Order Sample Summary
Lab Sample ID Client Sample ID Collection DateTag Number Date Received
Revision 0
15040582-001A WC-01-041715 4/17/2015 8:24:00 AM 4/17/201515040582-001B WC-01-041715 4/17/2015 8:24:00 AM 4/17/201515040582-002A WC-01-041715-D 4/17/2015 8:24:00 AM 4/17/201515040582-003A SB-02-041715 4/17/2015 9:47:00 AM 4/17/201515040582-004A SB-03-041715 4/17/2015 10:12:00 AM 4/17/201515040582-005A SB-01-041715 4/17/2015 11:02:00 AMMS/MSD 4/17/201515040582-005B SB-01-041715 4/17/2015 11:02:00 AM 4/17/201515040582-006A SB-01-041715-D 4/17/2015 11:02:00 AM 4/17/201515040582-007A SB-04-041715 4/17/2015 11:37:00 AM 4/17/2015
2 of 17

April 24, 2015Date:STAT Analysis Corporation
Project: 103IS3456, Pecatonica TMDLCLIENT: Tetra Tech EM Inc.
Work Order: 15040582CASE NARRATIVE
Revision 0
Total Kjedahl Nitrogen analysis was subcontracted to First Environmental Laboratories, Naperville, IL NELAP 100292.
3 of 17

Project: 103IS3456, Pecatonica TMDL
Client Sample ID: WC-01-041715
Collection Date: 4/17/2015 8:24:00 AM
Matrix: Water
Analyses Result Qualifier Units Date AnalyzedRL
Client: Tetra Tech EM Inc.
Work Order: 15040582
DF
Lab ID: 15040582-001
Date Printed: April 24, 2015
STAT Analysis Corporation2242 West Harrison St., Suite 200, Chicago, IL 60612-3766Tel: (312) 733-0551 Fax: (312) 733-2386 [email protected]
Date Reported: April 24, 2015
Accreditations:IEPA ELAP 100445;ORELAP IL300001;AIHA-LAP, LLC 101160;NVLAP LabCode 101202-0
ANALYTICAL RESULTS
Revision 0
Phosphorus (as P) SM4500P,B,E Analyst: YZPrep Date: 4/24/2015Phosphorus (as P) * 4/24/20150.050 mg/L 10.41
Total Suspended Solids E160.2 Analyst: PBGPrep Date: 4/20/2015Total Suspended Solids * 4/20/20157.5 mg/L 1ND
Qualifiers: J - Analyte detected below quanititation limitsB - Analyte detected in the associated Method Blank
S - Spike Recovery outside accepted recovery limitsR - RPD outside accepted recovery limits
ND - Not Detected at the Reporting Limit
E - Value above quantitation range* - Non-accredited parameterHT - Sample received past holding time
H - Holding time exceeded
RL - Reporting / Quantitation Limit for the analysis
4 of 17
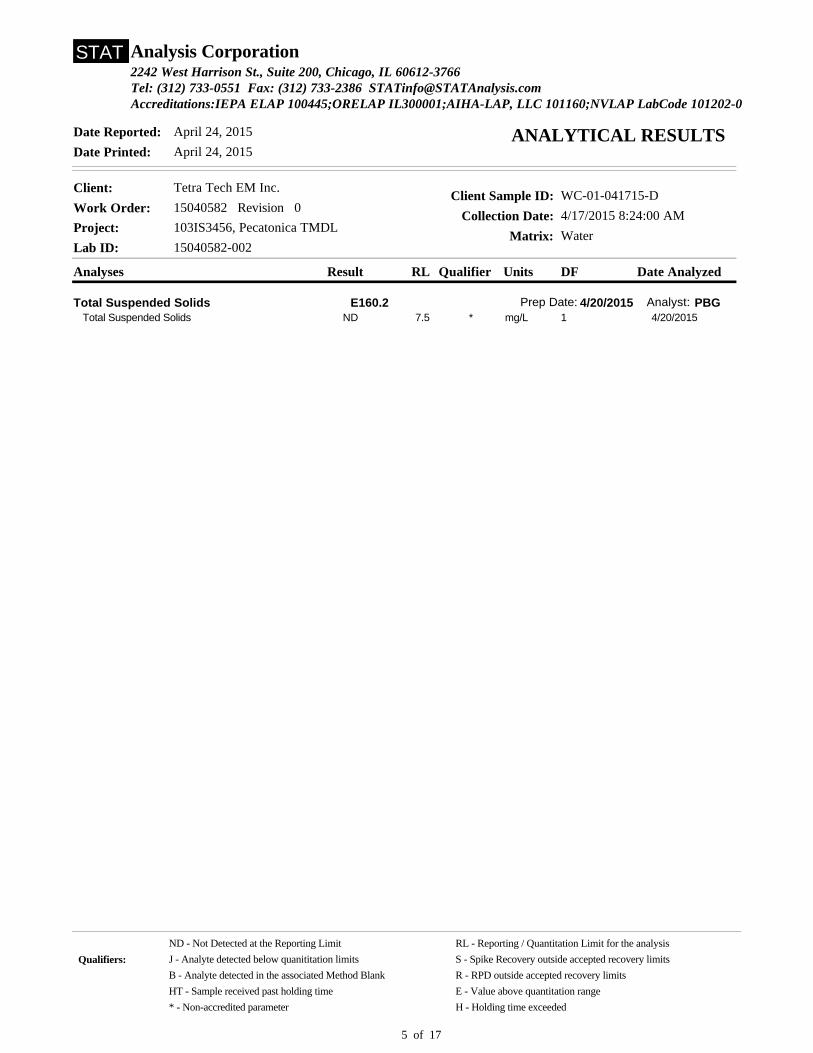
Project: 103IS3456, Pecatonica TMDL
Client Sample ID: WC-01-041715-D
Collection Date: 4/17/2015 8:24:00 AM
Matrix: Water
Analyses Result Qualifier Units Date AnalyzedRL
Client: Tetra Tech EM Inc.
Work Order: 15040582
DF
Lab ID: 15040582-002
Date Printed: April 24, 2015
STAT Analysis Corporation2242 West Harrison St., Suite 200, Chicago, IL 60612-3766Tel: (312) 733-0551 Fax: (312) 733-2386 [email protected]
Date Reported: April 24, 2015
Accreditations:IEPA ELAP 100445;ORELAP IL300001;AIHA-LAP, LLC 101160;NVLAP LabCode 101202-0
ANALYTICAL RESULTS
Revision 0
Total Suspended Solids E160.2 Analyst: PBGPrep Date: 4/20/2015Total Suspended Solids * 4/20/20157.5 mg/L 1ND
Qualifiers: J - Analyte detected below quanititation limitsB - Analyte detected in the associated Method Blank
S - Spike Recovery outside accepted recovery limitsR - RPD outside accepted recovery limits
ND - Not Detected at the Reporting Limit
E - Value above quantitation range* - Non-accredited parameterHT - Sample received past holding time
H - Holding time exceeded
RL - Reporting / Quantitation Limit for the analysis
5 of 17

Project: 103IS3456, Pecatonica TMDL
Client Sample ID: SB-02-041715
Collection Date: 4/17/2015 9:47:00 AM
Matrix: Water
Analyses Result Qualifier Units Date AnalyzedRL
Client: Tetra Tech EM Inc.
Work Order: 15040582
DF
Lab ID: 15040582-003
Date Printed: April 24, 2015
STAT Analysis Corporation2242 West Harrison St., Suite 200, Chicago, IL 60612-3766Tel: (312) 733-0551 Fax: (312) 733-2386 [email protected]
Date Reported: April 24, 2015
Accreditations:IEPA ELAP 100445;ORELAP IL300001;AIHA-LAP, LLC 101160;NVLAP LabCode 101202-0
ANALYTICAL RESULTS
Revision 0
Ammonia as Nitrogen E350.1 Analyst: YZPrep Date: 4/24/2015Nitrogen, Ammonia (As N) * 4/24/20150.050 mg/L 10.21
Nitrate and Nitrite M4500-NO3F Analyst: YZPrep Date: 4/20/2015Nitrogen, Nitrate-Nitrite 4/20/20150.20 mg/L 18.7
Total Kjeldahl Nitrogen M4500-NORG Analyst: SUBPrep Date:Total Kjeldahl Nitrogen * 4/23/20151.0 mg/L 1ND
Qualifiers: J - Analyte detected below quanititation limitsB - Analyte detected in the associated Method Blank
S - Spike Recovery outside accepted recovery limitsR - RPD outside accepted recovery limits
ND - Not Detected at the Reporting Limit
E - Value above quantitation range* - Non-accredited parameterHT - Sample received past holding time
H - Holding time exceeded
RL - Reporting / Quantitation Limit for the analysis
6 of 17

Project: 103IS3456, Pecatonica TMDL
Client Sample ID: SB-03-041715
Collection Date: 4/17/2015 10:12:00 AM
Matrix: Water
Analyses Result Qualifier Units Date AnalyzedRL
Client: Tetra Tech EM Inc.
Work Order: 15040582
DF
Lab ID: 15040582-004
Date Printed: April 24, 2015
STAT Analysis Corporation2242 West Harrison St., Suite 200, Chicago, IL 60612-3766Tel: (312) 733-0551 Fax: (312) 733-2386 [email protected]
Date Reported: April 24, 2015
Accreditations:IEPA ELAP 100445;ORELAP IL300001;AIHA-LAP, LLC 101160;NVLAP LabCode 101202-0
ANALYTICAL RESULTS
Revision 0
Ammonia as Nitrogen E350.1 Analyst: YZPrep Date: 4/24/2015Nitrogen, Ammonia (As N) * 4/24/20150.050 mg/L 10.25
Nitrate and Nitrite M4500-NO3F Analyst: YZPrep Date: 4/20/2015Nitrogen, Nitrate-Nitrite 4/20/20150.20 mg/L 113
Total Kjeldahl Nitrogen M4500-NORG Analyst: SUBPrep Date:Total Kjeldahl Nitrogen * 4/23/20151.0 mg/L 1ND
Qualifiers: J - Analyte detected below quanititation limitsB - Analyte detected in the associated Method Blank
S - Spike Recovery outside accepted recovery limitsR - RPD outside accepted recovery limits
ND - Not Detected at the Reporting Limit
E - Value above quantitation range* - Non-accredited parameterHT - Sample received past holding time
H - Holding time exceeded
RL - Reporting / Quantitation Limit for the analysis
7 of 17

Project: 103IS3456, Pecatonica TMDL
Client Sample ID: SB-01-041715
Collection Date: 4/17/2015 11:02:00 AM
Matrix: Water
Analyses Result Qualifier Units Date AnalyzedRL
Client: Tetra Tech EM Inc.
Work Order: 15040582
DF
Lab ID: 15040582-005
Date Printed: April 24, 2015
STAT Analysis Corporation2242 West Harrison St., Suite 200, Chicago, IL 60612-3766Tel: (312) 733-0551 Fax: (312) 733-2386 [email protected]
Date Reported: April 24, 2015
Accreditations:IEPA ELAP 100445;ORELAP IL300001;AIHA-LAP, LLC 101160;NVLAP LabCode 101202-0
ANALYTICAL RESULTS
Revision 0
Ammonia as Nitrogen E350.1 Analyst: YZPrep Date: 4/24/2015Nitrogen, Ammonia (As N) * 4/24/20150.050 mg/L 10.25
Nitrate and Nitrite M4500-NO3F Analyst: YZPrep Date: 4/20/2015Nitrogen, Nitrate-Nitrite 4/20/20150.20 mg/L 19.3
Phosphorus (as P) SM4500P,B,E Analyst: YZPrep Date: 4/24/2015Phosphorus (as P) * 4/24/20150.050 mg/L 10.078
Total Kjeldahl Nitrogen M4500-NORG Analyst: SUBPrep Date:Total Kjeldahl Nitrogen * 4/23/20151.0 mg/L 1ND
Qualifiers: J - Analyte detected below quanititation limitsB - Analyte detected in the associated Method Blank
S - Spike Recovery outside accepted recovery limitsR - RPD outside accepted recovery limits
ND - Not Detected at the Reporting Limit
E - Value above quantitation range* - Non-accredited parameterHT - Sample received past holding time
H - Holding time exceeded
RL - Reporting / Quantitation Limit for the analysis
8 of 17

Project: 103IS3456, Pecatonica TMDL
Client Sample ID: SB-01-041715-D
Collection Date: 4/17/2015 11:02:00 AM
Matrix: Water
Analyses Result Qualifier Units Date AnalyzedRL
Client: Tetra Tech EM Inc.
Work Order: 15040582
DF
Lab ID: 15040582-006
Date Printed: April 24, 2015
STAT Analysis Corporation2242 West Harrison St., Suite 200, Chicago, IL 60612-3766Tel: (312) 733-0551 Fax: (312) 733-2386 [email protected]
Date Reported: April 24, 2015
Accreditations:IEPA ELAP 100445;ORELAP IL300001;AIHA-LAP, LLC 101160;NVLAP LabCode 101202-0
ANALYTICAL RESULTS
Revision 0
Ammonia as Nitrogen E350.1 Analyst: YZPrep Date: 4/24/2015Nitrogen, Ammonia (As N) * 4/24/20150.058 mg/L 10.14
Nitrate and Nitrite M4500-NO3F Analyst: YZPrep Date: 4/20/2015Nitrogen, Nitrate-Nitrite 4/20/20150.20 mg/L 19.2
Phosphorus (as P) SM4500P,B,E Analyst: YZPrep Date: 4/24/2015Phosphorus (as P) * 4/24/20150.050 mg/L 10.19
Total Kjeldahl Nitrogen M4500-NORG Analyst: SUBPrep Date:Total Kjeldahl Nitrogen * 4/23/20151.0 mg/L 1ND
Qualifiers: J - Analyte detected below quanititation limitsB - Analyte detected in the associated Method Blank
S - Spike Recovery outside accepted recovery limitsR - RPD outside accepted recovery limits
ND - Not Detected at the Reporting Limit
E - Value above quantitation range* - Non-accredited parameterHT - Sample received past holding time
H - Holding time exceeded
RL - Reporting / Quantitation Limit for the analysis
9 of 17

Project: 103IS3456, Pecatonica TMDL
Client Sample ID: SB-04-041715
Collection Date: 4/17/2015 11:37:00 AM
Matrix: Water
Analyses Result Qualifier Units Date AnalyzedRL
Client: Tetra Tech EM Inc.
Work Order: 15040582
DF
Lab ID: 15040582-007
Date Printed: April 24, 2015
STAT Analysis Corporation2242 West Harrison St., Suite 200, Chicago, IL 60612-3766Tel: (312) 733-0551 Fax: (312) 733-2386 [email protected]
Date Reported: April 24, 2015
Accreditations:IEPA ELAP 100445;ORELAP IL300001;AIHA-LAP, LLC 101160;NVLAP LabCode 101202-0
ANALYTICAL RESULTS
Revision 0
Ammonia as Nitrogen E350.1 Analyst: YZPrep Date: 4/24/2015Nitrogen, Ammonia (As N) * 4/24/20150.050 mg/L 10.22
Nitrate and Nitrite M4500-NO3F Analyst: YZPrep Date: 4/20/2015Nitrogen, Nitrate-Nitrite 4/20/20150.20 mg/L 118
Qualifiers: J - Analyte detected below quanititation limitsB - Analyte detected in the associated Method Blank
S - Spike Recovery outside accepted recovery limitsR - RPD outside accepted recovery limits
ND - Not Detected at the Reporting Limit
E - Value above quantitation range* - Non-accredited parameterHT - Sample received past holding time
H - Holding time exceeded
RL - Reporting / Quantitation Limit for the analysis
10 of 17

11 of 17

12 of 17

Project: 103IS3456, Pecatonica TMDL
CLIENT: Tetra Tech EM Inc.Work Order: 15040582
ANALYTICAL QC SUMMARY REPORT
BatchID: 83837Wet Chemistry
QC SUMMARY
PREP BATCH SUMMARY
Sample ID:NH4MBW1 042415
TestNo:E350.1
Analysis Date:4/24/2015
Prep Date:4/24/2015
Analyte Result SPK valueSPK Ref
Val % RECRPD
Ref Val %RPDLow Limit
High Limit
RPDLimit Qual
Units:mg/L
PQL
Customer ID:
ZZZZZ
Run ID:LACHAT_150424B
SeqNo:2957244MBLK
SampType:
Nitrogen, Ammonia (As N) *0.050ND
Sample ID:NH4LCSW1 042415
TestNo:E350.1
Analysis Date:4/24/2015
Prep Date:4/24/2015
Analyte Result SPK valueSPK Ref
Val % RECRPD
Ref Val %RPDLow Limit
High Limit
RPDLimit Qual
Units:mg/L
PQL
Customer ID:
ZZZZZ
Run ID:LACHAT_150424B
SeqNo:2957225LCS
SampType:
Nitrogen, Ammonia (As N) 2.5 103 80 120 *0.050 0 0 02.564
Sample ID:15040582-005AMS
TestNo:E350.1
Analysis Date:4/24/2015
Prep Date:4/24/2015
Analyte Result SPK valueSPK Ref
Val % RECRPD
Ref Val %RPDLow Limit
High Limit
RPDLimit Qual
Units:mg/L
PQL
Customer ID:
SB-01-041715
Run ID:LACHAT_150424B
SeqNo:2957227MS
SampType:
Nitrogen, Ammonia (As N) 2.5 96.9 75 125 *0.050 0.255 0 02.678
Sample ID:15040582-005AMSD
TestNo:E350.1
Analysis Date:4/24/2015
Prep Date:4/24/2015
Analyte Result SPK valueSPK Ref
Val % RECRPD
Ref Val %RPDLow Limit
High Limit
RPDLimit Qual
Units:mg/L
PQL
Customer ID:
SB-01-041715
Run ID:LACHAT_150424B
SeqNo:2957228MSD
SampType:
Nitrogen, Ammonia (As N) 2.5 99.4 75 125 20 *0.050 0.255 2.678 2.272.739
Sample ID Matrix pH SampAmt Sol Added Sol Recov Fin Vol factor PrepStart PrepEnd4/24/20154/24/20151.000NH4MBW1 042415 50 500 0
4/24/20154/24/20151.000NH4LCSW1 042415 50 500 0
4/24/20154/24/20151.00015040582-003A 50 500 0Water
4/24/20154/24/20151.00015040582-004A 50 500 0Water
4/24/20154/24/20151.00015040582-005A 50 500 0Water
4/24/20154/24/20151.00015040582-005AMS 50 500 0Water
4/24/20154/24/20151.00015040582-005AMSD 50 500 0Water
4/24/20154/24/20151.16015040582-006A 50 580 0Water
4/24/20154/24/20151.00015040582-007A 50 500 0Water
4/24/20154/24/20151.00015040604-009A 50 500 0Aqueous
Qualifiers: J - Analyte detected below quantitation limits
B - Analyte detected in the associated Method BlankS - Spike Recovery outside accepted recovery limits
R - RPD outside accepted recovery limits
ND - Not Detected at the Reporting Limit
* - Non Accredited Parameter H/HT - Holding Time Exceeded
E - Value above quantitation range
13 of 17

Project: 103IS3456, Pecatonica TMDL
CLIENT: Tetra Tech EM Inc.Work Order: 15040582
ANALYTICAL QC SUMMARY REPORT
BatchID: R108761Wet Chemistry
QC SUMMARY
ANALYTICAL RUN SUMMARY
Sample ID:N2N3MBW1 042015
TestNo:M4500-NO3F
Analysis Date:4/20/2015
Prep Date:4/20/2015
Analyte Result SPK valueSPK Ref
Val % RECRPD
Ref Val %RPDLow Limit
High Limit
RPDLimit Qual
Units:mg/L
PQL
Customer ID:
ZZZZZ
Run ID:LACHAT_150420A
SeqNo:2952752MBLK
SampType:
Nitrogen, Nitrate-Nitrite 0.20ND
Sample ID:N2N3LCSW1 042015
TestNo:M4500-NO3F
Analysis Date:4/20/2015
Prep Date:4/20/2015
Analyte Result SPK valueSPK Ref
Val % RECRPD
Ref Val %RPDLow Limit
High Limit
RPDLimit Qual
Units:mg/L
PQL
Customer ID:
ZZZZZ
Run ID:LACHAT_150420A
SeqNo:2952753LCS
SampType:
Nitrogen, Nitrate-Nitrite 10 103 80 1200.20 0 0 010.26
Sample ID:15040582-005AMS
TestNo:M4500-NO3F
Analysis Date:4/20/2015
Prep Date:4/20/2015
Analyte Result SPK valueSPK Ref
Val % RECRPD
Ref Val %RPDLow Limit
High Limit
RPDLimit Qual
Units:mg/L
PQL
Customer ID:
SB-01-041715
Run ID:LACHAT_150420A
SeqNo:2952756MS
SampType:
Nitrogen, Nitrate-Nitrite 10 99.1 75 1250.20 9.276 0 019.19
Sample ID:15040582-005AMSD
TestNo:M4500-NO3F
Analysis Date:4/20/2015
Prep Date:4/20/2015
Analyte Result SPK valueSPK Ref
Val % RECRPD
Ref Val %RPDLow Limit
High Limit
RPDLimit Qual
Units:mg/L
PQL
Customer ID:
SB-01-041715
Run ID:LACHAT_150420A
SeqNo:2952757MSD
SampType:
Nitrogen, Nitrate-Nitrite 10 98.7 75 125 200.20 9.276 19.19 0.23719.14
SeqNo Sample ID Type Test Code Batch DF Date Analyzed
ICVICV 1 04/20/2015 10:192952749 N2N3_W R108761
ICBICB 1 04/20/2015 10:212952750 N2N3_W R108761
SAMP10 PPM NO2 1 04/20/2015 10:232952751 NO2_WW R108761
MBLKN2N3MBW1 042015 1 04/20/2015 10:252952752 N2N3_W R108761
LCSN2N3LCSW1 042015 1 04/20/2015 10:272952753 N2N3_W R108761
SAMP15040582-005A 1 04/20/2015 10:292952755 N2N3_W R108761
MS15040582-005AMS 1 04/20/2015 10:312952756 N2N3_W R108761
MSD15040582-005AMSD 1 04/20/2015 10:332952757 N2N3_W R108761
SAMP15040582-003A 1 04/20/2015 10:362952758 N2N3_W R108761
SAMP15040582-004A 1 04/20/2015 10:382952759 N2N3_W R108761
SAMP15040582-006A 1 04/20/2015 10:402952760 N2N3_W R108761
SAMP15040582-007A 1 04/20/2015 10:422952761 N2N3_W R108761
CCVCCV 1 04/20/2015 10:442952762 N2N3_W R108761
CCBCCB 1 04/20/2015 10:462952763 N2N3_W R108761
Qualifiers: J - Analyte detected below quantitation limits
B - Analyte detected in the associated Method BlankS - Spike Recovery outside accepted recovery limits
R - RPD outside accepted recovery limits
ND - Not Detected at the Reporting Limit
* - Non Accredited Parameter H/HT - Holding Time Exceeded
E - Value above quantitation range
14 of 17

Project: 103IS3456, Pecatonica TMDL
CLIENT: Tetra Tech EM Inc.Work Order: 15040582
ANALYTICAL QC SUMMARY REPORT
BatchID: R108895Wet Chemistry
QC SUMMARY
ANALYTICAL RUN SUMMARY
Sample ID:TPMBW1 042415
TestNo:SM4500P,B,E
Analysis Date:4/24/2015
Prep Date:4/24/2015
Analyte Result SPK valueSPK Ref
Val % RECRPD
Ref Val %RPDLow Limit
High Limit
RPDLimit Qual
Units:mg/L
PQL
Customer ID:
ZZZZZ
Run ID:SPEC_150424A
SeqNo:2957102MBLK
SampType:
Phosphorus (as P) *0.050ND
Sample ID:TPLCSW1 042415
TestNo:SM4500P,B,E
Analysis Date:4/24/2015
Prep Date:4/24/2015
Analyte Result SPK valueSPK Ref
Val % RECRPD
Ref Val %RPDLow Limit
High Limit
RPDLimit Qual
Units:mg/L
PQL
Customer ID:
ZZZZZ
Run ID:SPEC_150424A
SeqNo:2957103LCS
SampType:
Phosphorus (as P) 0.5 101 80 120 *0.050 0 0 00.5073
Sample ID:15040582-005AMS
TestNo:SM4500P,B,E
Analysis Date:4/24/2015
Prep Date:4/24/2015
Analyte Result SPK valueSPK Ref
Val % RECRPD
Ref Val %RPDLow Limit
High Limit
RPDLimit Qual
Units:mg/L
PQL
Customer ID:
SB-01-041715
Run ID:SPEC_150424A
SeqNo:2957105MS
SampType:
Phosphorus (as P) 0.5 103 75 125 *0.050 0.07797 0 00.5923
Sample ID:15040582-005AMSD
TestNo:SM4500P,B,E
Analysis Date:4/24/2015
Prep Date:4/24/2015
Analyte Result SPK valueSPK Ref
Val % RECRPD
Ref Val %RPDLow Limit
High Limit
RPDLimit Qual
Units:mg/L
PQL
Customer ID:
SB-01-041715
Run ID:SPEC_150424A
SeqNo:2957106MSD
SampType:
Phosphorus (as P) 0.5 101 75 125 20 *0.050 0.07797 0.5923 1.810.5817
SeqNo Sample ID Type Test Code Batch DF Date Analyzed
ICVICV 1 04/24/20152957100 P_TW_SM4500 R108895
ICBICB 1 04/24/20152957101 P_TW_SM4500 R108895
MBLKTPMBW1 042415 1 04/24/20152957102 P_TW_SM4500 R108895
LCSTPLCSW1 042415 1 04/24/20152957103 P_TW_SM4500 R108895
SAMP15040582-005A 1 04/24/20152957104 P_TW_SM4500 R108895
MS15040582-005AMS 1 04/24/20152957105 P_TW_SM4500 R108895
MSD15040582-005AMSD 1 04/24/20152957106 P_TW_SM4500 R108895
SAMP15040582-001B 1 04/24/20152957107 P_TW_SM4500 R108895
SAMP15040582-006A 1 04/24/20152957108 P_TW_SM4500 R108895
CCVCCV 1 04/24/20152957109 P_TW_SM4500 R108895
CCBCCB 1 04/24/20152957110 P_TW_SM4500 R108895
Qualifiers: J - Analyte detected below quantitation limits
B - Analyte detected in the associated Method BlankS - Spike Recovery outside accepted recovery limits
R - RPD outside accepted recovery limits
ND - Not Detected at the Reporting Limit
* - Non Accredited Parameter H/HT - Holding Time Exceeded
E - Value above quantitation range
15 of 17

Project: 103IS3456, Pecatonica TMDL
CLIENT: Tetra Tech EM Inc.Work Order: 15040582
ANALYTICAL QC SUMMARY REPORT
BatchID: R108806Wet Chemistry
QC SUMMARY
ANALYTICAL RUN SUMMARY
Sample ID:TSSMBK 4/21/15
TestNo:E160.2
Analysis Date:4/20/2015
Prep Date:4/20/2015
Analyte Result SPK valueSPK Ref
Val % RECRPD
Ref Val %RPDLow Limit
High Limit
RPDLimit Qual
Units:mg/L
PQL
Customer ID:
ZZZZZ
Run ID:BALANCE_150420F
SeqNo:2954210MBLK
SampType:
Total Suspended Solids *7.5ND
Sample ID:TSSLCS 4/21/15
TestNo:E160.2
Analysis Date:4/20/2015
Prep Date:4/20/2015
Analyte Result SPK valueSPK Ref
Val % RECRPD
Ref Val %RPDLow Limit
High Limit
RPDLimit Qual
Units:mg/L
PQL
Customer ID:
ZZZZZ
Run ID:BALANCE_150420F
SeqNo:2954211LCS
SampType:
Total Suspended Solids 1000 95.6 80 120 *7.5 0 0 0955.5
Sample ID:15040542-012ADUP
TestNo:E160.2
Analysis Date:4/20/2015
Prep Date:4/20/2015
Analyte Result SPK valueSPK Ref
Val % RECRPD
Ref Val %RPDLow Limit
High Limit
RPDLimit Qual
Units:mg/L
PQL
Customer ID:
ZZZZZ
Run ID:BALANCE_150420F
SeqNo:2954214DUP
SampType:
Total Suspended Solids 0 0 0 0 20 *7.5 0 0 0ND
SeqNo Sample ID Type Test Code Batch DF Date Analyzed
MBLKTSSMBK 4/21/15 1 04/20/20152954210 TSS_W R108806
LCSTSSLCS 4/21/15 1 04/20/20152954211 TSS_W R108806
SAMP15040542-011A 1 04/20/20152954212 TSS_W R108806
SAMP15040542-012A 1 04/20/20152954213 TSS_W R108806
DUP15040542-012ADUP 1 04/20/20152954214 TSS_W R108806
SAMP15040582-001A 1 04/20/20152954215 TSS_W R108806
SAMP15040582-002A 1 04/20/20152954216 TSS_W R108806
SAMP15040639-001B 1 04/21/20152954217 TSS_W R108806
SAMP15040604-006A 1 04/21/20152954238 TSS_W R108806
Qualifiers: J - Analyte detected below quantitation limits
B - Analyte detected in the associated Method BlankS - Spike Recovery outside accepted recovery limits
R - RPD outside accepted recovery limits
ND - Not Detected at the Reporting Limit
* - Non Accredited Parameter H/HT - Holding Time Exceeded
E - Value above quantitation range
16 of 17

17 of 17

1
DATA VERIFICATION SUMMARY
This section is a brief verification of the results of the analytical chemistry test performed on surface
water samples collected from the Lower Pecatonica River in Stephenson County, Illinois, in three
sampling events, in December 2014, March 2015, and April 2015. Tetra Tech collected the samples as
part of a study to establish total maximum daily load (TMDL) values for the Pecatonica watershed. The
samples were hand-delivered to STAT Analysis Corporation (STAT) in Chicago, Illinois, who identified
each batch of samples as a work order. The TKN analyses were subcontracted to First Environmental
Laboratories, Inc., of Naperville, Illinois, and the results included with STAT’s results. Table 1 lists the
methods used in the analyses. The three methods referenced for each parameter are comparable to one
another.
Table 1. Laboratory methods
Parameter Method Stated in QAPP Method used by
lab Method indicated in IEPA data submittal template
Total suspended solids
SM 2540 D-1997 EPA 160.2 160.2_M
Total phosphorus SM 4500P B,E-1999 SM 4500-P B,E 4500-P-E
Nitrogen, ammonia SM 4500-NH3 C-1997 EPA 350.1 350.1
Nitrogen, nitrate-nitrite
SM 4500NO3 F-2000 SM 4500-NO3 F 4500-NO3(F)
Total Kjeldahl nitrogen
EPA 351.2 v2.0 1993 EPA 351.2 351.2
The following sections discuss the results of each work order, with emphasis on irregularities that would
affect data usability. A final section provides an overall summary of the results of this data verification.
1.0 Work Order No. 14120344
Work order No. 14120344 includes four samples and two field duplicate samples collected on 11
December. There were no problems with sample preservation and holding times, blanks, laboratory
control sample (LCS) results, and laboratory duplicate results.
Most field duplicate results were practically identical. The field duplicate sample from SB01-121114
yielded approximately 4 times the phosphorus concentration as the primary sample. The results were
submitted individually to IEPA for the primary sample and the field duplicate, and the reported results are
not qualified.
Most matrix spike/matrix spike duplicate (MS/MSD) results were within their quality control (QC) limits.
The TKN MS/MSD analyses yielded recoveries of about 80 percent, below the laboratory’s QC limits of
90 to 110 percent. However, the MS and MSD recoveries were within the acceptable range set forth in the

2
QAPP (75-125%). The MS and MSDs reported by the lab were considered acceptable and were not
qualified.
2.0 Work Order No. 15030703
Work Order No. 15030703 includes four samples collected on 24 March. There were no problems with
sample preservation and holding times, blanks, LCS results, and laboratory duplicate results.
Most matrix spike/matrix spike duplicate (MS/MSD) results were within their quality control (QC) limits.
The TKN MS/MSD analyses yielded recoveries just over 80 percent, below the laboratory’s QC limits of
90 to 110 percent. However, the MS and MSD recoveries were within the acceptable range set forth in the
QAPP (75-125%). The MS and MSDs reported by the lab were considered acceptable and were not
qualified.
3.0 Work Order No. 15040582
Work Order No. 15040582 includes five samples and two field duplicate samples collected on 17 April.
There were no problems with sample preservation and holding times, blanks, LCS results, and laboratory
duplicate results.
Most field duplicate results were practically identical, but the field duplicate sample from SB01-041715
yielded about twice the phosphorus concentration as the primary sample. The results were submitted
individually to IEPA for the primary sample and the field duplicate, and the reported results are not
qualified.
Most matrix spike/matrix spike duplicate (MS/MSD) results were well within their quality control (QC)
limits. The TKN MS/MSD analyses yielded recoveries just over 80 percent, below the laboratory’s QC
limits of 90 to 110 percent. However, the MS and MSD recoveries were within the acceptable range set
forth in the QAPP (75-125%). The MS and MSDs reported by the lab were considered acceptable and
were not qualified.
4.0 Overall Evaluation
There were no results rejected; all results may be used for any purposes.