
Fishing Down the Bighead and Silver Carps - Greater Peoria ...
193
Fishing Down the Bighead and Silver Carps: Reducing the Risk of Invasion to the Great Lakes FINAL REPORT January 2015 James E. Garvey, Director and Professor, Fisheries and Illinois Aquaculture Center, Center for Ecology, and Department of Zoology, Southern Illinois University, Carbondale, IL Greg G. Sass, Director, Illinois River Biological Station, Illinois Natural History Survey, Prairie Research Institute, University of Illinois at Urbana-Champaign, Havana, IL Jesse Trushenski, Assistant Professor, Fisheries and Illinois Aquaculture Center, Department of Zoology, Department of Animal Science, Food, and Nutrition, Southern Illinois University, Carbondale, IL David Glover, Research Scientist, Department of Evolution, Ecology, and Organismal Biology. Aquatic Ecology Laboratory, The Ohio State University, Columbus, OH Marybeth K. Brey, Postdoctoral Fellow, Fisheries and Illinois Aquaculture Center, Southern Illinois University, Carbondale, IL Patrice M. Charlebois, AIS Coordinator, Illinois-Indiana Sea Grant Jeff Levengood, Assistant Professor of Research, Center for Wildlife Ecology, Prairie Research Institute, Illinois Natural History Survey, University of Illinois at Urbana-Champaign, Urbana-Champaign, IL Brian Roth, Assistant Professor, Department of Fisheries and Wildlife, Michigan State University, East Lansing, MI Greg Whitledge, Associate Professor, Fisheries and Illinois Aquaculture Center, Center for Ecology, and Department of Zoology, Southern Illinois University, Carbondale, IL Silvia Secchi, Associate Professor, Department of Geography and Environmental Resources, Southern Illinois University, Carbondale, IL Wesley Bouska, Researcher II, Center for Fisheries, Aquaculture and Aquatic Sciences, Southern Illinois University, Carbondale, IL. Ruairi MacNamara, Postdoctoral Fellow, Center for Fisheries, Aquaculture and Aquatic Sciences. Southern Illinois University, Carbondale, IL Brian C. Small, Associate Professor, Fisheries and Illinois Aquaculture Center, Department of Animal Science, Food, and Nutrition, Southern Illinois University, Carbondale, IL Sara J. Tripp, Resource Scientist, Missouri Department of Conservation, Jefferson City, Missouri Andrew F. Casper, Director, Illinois River Biological Station (IRBS), Havana, IL
-
Upload
khangminh22 -
Category
Documents
-
view
0 -
download
0
Transcript of Fishing Down the Bighead and Silver Carps - Greater Peoria ...

Fishing Down the Bighead and Silver Carps: Reducing the Risk of Invasion to the Great Lakes
FINAL REPORT
January 2015
James E. Garvey, Director and Professor, Fisheries and Illinois Aquaculture Center, Center for Ecology,
and Department of Zoology, Southern Illinois University, Carbondale, IL
Greg G. Sass, Director, Illinois River Biological Station, Illinois Natural History Survey, Prairie Research
Institute, University of Illinois at Urbana-Champaign, Havana, IL
Jesse Trushenski, Assistant Professor, Fisheries and Illinois Aquaculture Center, Department of Zoology,
Department of Animal Science, Food, and Nutrition, Southern Illinois University, Carbondale, IL
David Glover, Research Scientist, Department of Evolution, Ecology, and Organismal Biology. Aquatic
Ecology Laboratory, The Ohio State University, Columbus, OH
Marybeth K. Brey, Postdoctoral Fellow, Fisheries and Illinois Aquaculture Center, Southern Illinois
University, Carbondale, IL
Patrice M. Charlebois, AIS Coordinator, Illinois-Indiana Sea Grant Jeff Levengood, Assistant Professor of Research, Center for Wildlife Ecology, Prairie Research Institute,
Illinois Natural History Survey, University of Illinois at Urbana-Champaign, Urbana-Champaign, IL
Brian Roth, Assistant Professor, Department of Fisheries and Wildlife, Michigan State University, East
Lansing, MI
Greg Whitledge, Associate Professor, Fisheries and Illinois Aquaculture Center, Center for Ecology, and
Department of Zoology, Southern Illinois University, Carbondale, IL
Silvia Secchi, Associate Professor, Department of Geography and Environmental Resources, Southern
Illinois University, Carbondale, IL
Wesley Bouska, Researcher II, Center for Fisheries, Aquaculture and Aquatic Sciences, Southern Illinois
University, Carbondale, IL.
Ruairi MacNamara, Postdoctoral Fellow, Center for Fisheries, Aquaculture and Aquatic Sciences.
Southern Illinois University, Carbondale, IL
Brian C. Small, Associate Professor, Fisheries and Illinois Aquaculture Center, Department of Animal
Science, Food, and Nutrition, Southern Illinois University, Carbondale, IL
Sara J. Tripp, Resource Scientist, Missouri Department of Conservation, Jefferson City, Missouri
Andrew F. Casper, Director, Illinois River Biological Station (IRBS), Havana, IL

James Lames, Site Manager, Alice L. Kibbe Life Science Station, Western Illinois University, Warsaw, IL
Sarah Varble, Enviornmental Resources and Policy, Southern Illinois University, Carbondale, IL
Rich M. Pendleton, LTRMP Fish Component Specialist, Illinois River Biological Station (IRBS), Havana, IL
Collin J. Hinz, Zooplankton Coordinator, Illinois River Biological Station (IRBS), Havana, IL
Jason A. DeBoer, LTEF Component Specialist, Illinois River Biological Station (IRBS), Havana, IL
Mark W. Fritts, LTEF Component Specialist, Illinois River Biological Station (IRBS), Havana, IL

TABLE OF CONTENTS
CHAPTER 1: Executive Summary ......................................................................................................... 4
Highlights ................................................................................................................................................... 4
CHAPTER 2: Quantifying Density and Biomass of Asian carp in the Illinois River Using Hydroacoustics . 6
Tables and Figures .................................................................................................................................... 19
CHAPTER 3: Training, certification, pilot incentive, marketing and removal research project for the
long-term strategy in reducing and controlling Asian Carp populations.............................................. 37
Introduction: ........................................................................................................................................... 37
Component 1: Pilot training, certification, and incentive program ........................................................ 38
Component 2: Population Metrics of Commercially Caught Asian Carp, the Ecological Effectiveness of
Asian Carp Removal and the Commercial Suitability of Carp Meal ........................................................ 43
Tables and Figures ................................................................................................................................... 50
CHAPTER 4: Evaluating the Efficiency of Harvest ............................................................................... 59
Tables and Figures .................................................................................................................................... 66
CHAPTER 5: Modeling Asian carp population responses to harvest in the Illinois River ....................... 72
Tables and Figures .................................................................................................................................... 74
CHAPTER 6: Ecosystem responses to a large-scale reduction of Asian carp in the lower Illinois River .. 75
Tables and Figures ................................................................................................................................... 80
CHAPTER 7: Using telemetry to quantify movement of Asian carp ..................................................... 85
Tables and Figures .................................................................................................................................... 92
CHAPTER 8: Identification of natal environment of adult Asian carps in the Illinois River using otolith
microchemistry and stable isotope analysis .................................................................................... 101
CHAPTER 9: Nutrient Composition of Asian Carp from the Illinois River ........................................... 105
Tables and Figures ................................................................................................................................. 107
CHAPTER 10: Potential Contaminants in Asian Carps of the Illinois River ......................................... 109
Tables and Figures .................................................................................................................................. 110
CHAPTER 11: Increasing Commercial Harvest to Reduce Density-Dependent Effects and Movement of
Asian Carp ..................................................................................................................................... 112
CHAPTER 12: Marketing of Asian Carp ............................................................................................ 113
APPENDIX 1: Asian Carp Fish Meal Report: ..................................................................................... 114
APPENDIX II: Publications .............................................................................................................. 117

CHAPTER 1
Executive Summary
Bighead carp and silver carp (hereafter, Asian carp) invaded the Illinois River waterway for over a decade
ago. Populations of these fishes have grown dense in the lower and middle Illinois River and both
species are approaching the Chicago Area Waterway System (CAWS) and the defensive electrical barrier.
Without control, immigrants from the lower river will continue to migrate upstream, challenging the
CAWS and ultimately the Great Lakes until they are reduced. This follows the “cockroach analogy” in
that control of an insect infestation will be ineffective if only the few appearing out in the open are
eliminated. Rather, effective control requires eradication at the source, such as in the cupboards or
walls of an infested home. To protect the upstream CAWS and the Great Lakes while ameliorating the
problem in US rivers and interior lakes, the populations of carp in the downstream reaches of the Illinois
River need to be continually suppressed.
Asian carp are by far the world’s most cultured fish because they are a healthful source of protein and
perhaps omega-3 fatty acids. Thus, unlike so many nuisance or invasive species, these problematic
fishes in the US have one positive aspect: they can be converted to desirable food for both human and
nonhuman consumption. The research described herein is designed with one simple idea in mind: to
beat Asian carp in the Illinois River and eventually other US waterways by consuming them. Harvesting
is an immediate, revenue-positive complement to other control efforts which may be effective but have
not yet been developed.
Overharvest of Asian carp occurs in their native range and thus is possible in the Illinois River and other
waterways of the US. However, several research questions must be addressed to ensure that both
public and private resources are expended wisely and efficiently to effectively control these species.
This report describes a multi-institution effort to quantify the abundance and ecological impact of these
species in the Illinois River and then determine whether fishing is a viable option for control. Successful
fishing requires an incentive on behalf of the commercial fishers and processors. Thus, marketing
options need to be identified.
This report covers project findings since Fall 2010. The ecological and fish nutrition research began
during fall 2010. The marketing research started in spring 2011. Funding for this research derived from
Cooperative Agreement No. 30181AJ071 between the U.S. Fish and Wildlife Service and the Illinois
Department of Natural Resources. Eight published journal articles have come out of this work to date
(see Appendix), with many others currently in review or in the works.
Highlights:
Density, biomass and hydroacoustic surveys (Chapter 2):
In 2010-2011, eight parallel hydroacoustic transects covered an estimated 0.39% of the
total volume of 427.8 river km of the Illinois River. The main channel of the Illinois River
from the confluence of the Illinois River and Mississippi River to Starved Rock Lock and
Dam was surveyed, a total of 3,422.5 river km.

Protocols have been developed and refined so that surveys are analyzed in a
comparable fashion, to provide replicate annual Asian carp population estimates.
Main channel Asian carp abundance (silver carp and bighead carp) was estimated at
743,435 (95% CI = 658,091 – 828,780) among all three lower reaches of the Illinois River
combined and abundance generally declined moving upstream. Average total biomass
was estimated to be 1,738 per km (95% CI = 1,538 – 1,937) and 3.30 metric tons per km
(95% CI = 2.92 – 3.69).
Fishing experiment. A contract was been awarded for the purchase and processing of Asian carp
from the Peoria and LaGrange reaches of the Illinois River. Nearly 2 million pounds of carp were
harvested from the lower river (Peoria, La Grange, and Alton pools) in 2012 (Chapters 3 and 4).
Changes in Asian carp demographics were observed (Chapter 3).
Incentives (Chapter 3). A program providing a training/certification program for fishermen,
including vouchers for designated pounds of fish removed from the Illinois River will be
implemented in September
Demographic responses to fishing (Chapter 3)
Changes in the population size structure, relative abundance, and sex ratios were evident in 2013 relative to 2012 for silver carp in the three lower reaches of the Illinois River.
Young-of-year Silver carp were collected in the Alton reach (N=4) in 2013 and in large numbers in 2014. 2013 was the first time YOY Asian carp have been collected since standardized sampling began in 2011, indicating a successful spawning event in the Illinois and/or Mississippi Rivers in 2013.
CPUE of silver carp decreased across years for all reaches combined (overall CPUE down 42% since 2011), and for the La Grange reach in particular (CPUE down 60% since 2011), although no statistically significant difference was found.
There have been significant reductions in mean length-at-age across multiple age-classes from 2011 to 2012, and again from 2012 to 2013, indicating selective removal of larger individuals from the population, most likely through commercial fishing.
Gizzard shad overall CPUE increased from 74.6 (SE = 20) fish per hour of electrofishing in 2012, to 964.9 (SE = 274.7) fish per hour in 2013, these increases were isolated to the Alton and La Grange reaches. No differences were observed in 2014.
Genetic identification of carp showed 49.24% hybridization of Asian carp in the lower
reaches of the Illinois River. “Pure” bighead and silver carp are still being identified.
One F1 backcross (bighead carp x silver carp) was also detected in the Alton reach.
Harvest efficiency (Chapter 4):
Harvest efficiency was evaluated in two backwater locations commonly fished by IL DNR
contracted commercial fishermen. Of the 320 Asian carp externally tagged in the HMSC
backwater near Morris, IL in May 2012 a total of 167 (~52.2%) marked individuals were
harvested through IDNR-contracted commercial fishing efforts by the end of December
2013. The majority these individuals (~47%) were harvested in 2012.
Emigration of Asian carp from the HMSC backwater appeared low in 2012, but was
much higher in 2013. Thirty-two of the 39 fish (82%) that were tagged with acoustic

transmitters in 2013 left the HMSC backwater at some point, possibly decreasing
susceptibility to harvest in 2013.
The estimated exploitation rate for this backwater area was 55% over an 82-week
period for non-immigrants (89% in 2012 and 38 in 2013 ), suggesting that commercial
fishing is effective at the current population size
However, estimates concerning the population rate of changed combined with
estimated immigration in 2013 suggest that harvest was unable to outpace immigration
for most of 2013 (and 2012). This suggests that continued harvest during all times of
year is necessary and additional harvest from source populations (i.e., lower Illinois
River) is encouraged to limit the number of immigrants to the upper river and decrease
propagule pressure on the CAWS.
Fishing estimate (model; Chapter 5). The basic harvest assessment model has been built and
parameterized with data from Asian carp populations. This initial model was published in
Fisheries magazine in 2013. The second version of the model is in the works with data collected
over the past four years. This model will allow managers to determine the sizes and pounds of
Asian carp that need to be removed from the Illinois River to suppress population growth.
Environmental impact (Chapter 6). Contrary to initial hypotheses, our results indicated that the
reduction of Asian carp through controlled commercial fishing did not significantly influence
zooplankton densities, gizzard shad relative weight, or gizzard shad catch-per-unit effort in the
Illinois River. Rotifers are proportionally dominant in terms of abundance in both upper and
lower river sections, but they were more abundant in the lower river. Whereas cladocerans
were more abundant in the upper river. As predicted, primary productivity (i.e., chlorophyll-a
concentration) decreased from downstream to upstream and total phosphorus (mg/L)
decreased from upstream to downstream.
Movement (Chapter 7). Asian carp commonly move from the Mississippi River into the Illinois
River. Approximately 30% of individuals tagged in the Mississippi River made their way to the
Illinois at some point. Upstream movement tended to occur (in all years) in late March and into
April. Subsequent downstream movement was typically followed (late April, early May)
suggesting spawning movements. Additional movement into and out of backwater locations
correlated with changes in river discharge was also documented in all years. Movement was
corroborated by using otolith core Sr:Ca data. We estimated that 28-53% of adult silver carp and
26-48% of hybrids in the Illinois River were immigrants that originated in the middle Mississippi
or Missouri Rivers. Only 5% of the fish analyzed had otolith core δ18O and δ13C signatures
indicative of use of floodplain lake habitats during early life, consistent with data from prior
years (Chapter 8).
Nutritional content (Chapter 9). Asian carp in the Illinois River have similar protein content to
fish from marine systems, although total oil content is lower. Lipid composition of the oil
present is similar to that found in many marine-derived sources with 20-25% long-chain,
polyunsaturated fatty acids.
Contaminants (Chapter 10). Methylmercury and PCB concentrations were sufficiently high in
some Asian carp to warrant limiting meals in sensitive human cohorts (e.g., pregnant women)

based on Illinois sportfish advisories. However, concentrations of both contaminants were well
below the US FDA action levels of > 1 ppm for methylmercury and > 2 ppm for PCBs.
Marketing summit (Chapter 11). A 2-day summit convened at the Great Rivers Research and
Education Center during fall 2010. A network of experts from eight states from both private and
public sectors was developed and is being used to develop economically viable ways to exploit
Asian carp in the Illinois River and other river systems in the US. Summit results can be obtained
at http://www.iiseagrant.org/catalog/ais/asian_carp_summit.html.
Marketing survey (Chapter 11). A result of the marketing summit was a desire by private
industry to develop domestic markets for Asian carp. A survey is being developed to determine
how restaurants, the primary consumer of seafood in the US, will use Asian carp as well as the
concerns of chefs about the species. Results to date suggest that the primary consumer concern
is about contaminants in the fish.
Contact: Jim Garvey, [email protected], 618-536-7761

CHAPTER 2
Quantifying density and biomass of Asian carp in the Illinois River using Hydroacoustic Surveys
Goals: Estimate the abundance of Asian carp in each of the lower reaches of the Illinois River to set a
baseline for assessing reductions by commercial harvesting and other eradication efforts.
Justification: The current density and biomass of bighead carp and silver carp in the Illinois River are
unknown. Determining the standing stock of Asian carp in the Illinois River is a critical initial step in
evaluating the efficacy of controlling these populations with commercial fishing, as well as to determine
the potential to meet demands from various markets. Acoustic-derived density and biomass estimates
will not only aid in the construction of population models to forecast exploitation effects, but will also
help to identify both large-scale and microhabitat hotspots for focusing commercial fishing efforts. As
commercial harvesting increases, it is essential to evaluate population responses over time, such as
compensatory reproduction, to determine the effectiveness of commercial fishing as a long-term control
strategy and to adapt strategies for efficiently reducing abundances of Asian carp.
Research Approach: To estimate the baseline density, size distribution, and biomass of Asian carp
among the five lower reaches of the Illinois River we will conduct acoustic surveys using a Biosonics DT-X
split-beam echosounder (200 kHz, 6.8° split) along the main channel.
Contact: Ruairi MacNamara, 1125 Lincoln Drive, 173 Life Sciences II, Southern Illinois University,
Carbondale, IL 62901, [email protected]
David Glover, [email protected], Department of Evolution, Ecology, and Organismal Biology. Aquatic
Ecology Laboratory, The Ohio State University, Columbus, OH
James Garvey, [email protected] Lincoln Drive, 173 Life Sciences II, Southern Illinois University,
Carbondale, IL 62901
Introduction:
Estimate of baseline abundance, size distribution, and biomass of Asian carp and other fishes in the Illinois River
General overview
Baseline density, size distribution, and biomass of Asian carp and other fishes was estimated in the main channel among the three lower reaches of the Illinois River (i.e., Alton, La Grange, and Peoria) via a combination of hydroacoustic surveys and standardized sampling (i.e., pulsed-DC electrofishing and trammel netting). In general, hydroacoustic sampling was used to determine the total number and length-frequency distribution of all fishes within each reach. Data from standardized sampling was then used to devise total length-specific proportion of Asian carp and other fishes to distribute acoustic-derived abundance among species as a function of size. Reach-specific length-weight regressions were then determined for each group of fishes to estimate total biomass as a function of total length. Total

abundance and biomass of Asian carp and other fishes was then extrapolated to the total interpolated volume based on the proportion of water volume sampled.
Hydroacoustic sampling
Hydroacoustic sampling was carried out in approximately 11-km stretches per day during low river stage periods using a down-looking split-beam transducer (BioSonics, Inc., 208 kHz, 6.8° 6 dB beam angle) set at 15 cm below the surface (Table 2.1). Acoustic data was collected using Visual Acquisition 6 from 1.15 to 15-m depth at a ping rate of 5 pings per second and a 0.40-ms pulse duration. Data collection was set to begin 1 m from the transducer face to account for the near-field distance (Simmonds and MacLennan 2005). Temperature was recorded and input into Visual Acquisition 6 prior to data collection to compensate for the effect of water temperature on two-way transmission loss via its effect on the speed of sound in water and absorption coefficients. The split-beam acoustic transducer was calibrated on-axis with a 200 kHz tungsten carbide sphere throughout the duration of sampling following Foote et al. (1987).
We used a stratified random sampling design for hydroacoustic surveys to compensate for the spatial distribution of Asian carp. The first two transects were conducted parallel to the shoreline following the 1.5-m depth contour of the main channel; subsequent transects were conducted at distances progressively closer to the middle of the channel (Figure 1a). Specifically, the second set of transects were conducted parallel to the first two transects ~2 m closer to the middle of the channel. The following two transects were conducted at ~4-m distance from the second set of transects. The final set of transects were conducted at 6-m distance from the third set of transects or were evenly spaced to fill in the gaps of the unsampled area for narrow stretches of river. All transects were completed by traveling downstream with the current at approximately 9.5 km/hr to limit the amount of Asian carp evasion as it relates to outboard motor noise.
Total fish abundance and size distribution
Echoview 5.0 was used to estimate the total number of fish and size distribution within each of the
three lower reaches of the Illinois River. Data collected from the split-beam acoustics was analyzed 1 m
from the transducer face (actual depth = 1.15 m) to the river bottom. Target strength (TS) was
compensated for two-way signal loss as it is affected by range from the transducer, the speed of sound
in water, signal absorption, and angle at which echoes were received. Background noise was filtered by
removing TS-compensated acoustic signals less than -60 dB. Fish targets were determined using the
split-beam single target detection algorithm (method 2) (Table 2) and size of fish targets was
determined using the relationship between maximum dorsal-aspect TS and TL (Love 1971; Figure 2).
A stratified analysis was performed to determine the mean density and variance for each reach of the
three lower reaches within the Illinois River following Scheaffer et al. (1996) and Parker-Stetter et al.
(2009). Hydroacoustic data was separated into four strata (i.e., strata 1 = 1.5-m depth contours from
both sides of the channel; strata 2-4 are progressively closer to the middle of the channel). Each 1.852
river km (i.e., one nautical mi) sampled along these strata represented replicates of strata. Strata-
specific density ( ) and associated within-strata variance ( ) was calculated using:

where is the number of one-mile replicates in stratum h, and is the mean density of replicate i
within stratum h. The reach-specific mean density ( ) was calculated using:
where L is the total number of strata, A is the volume of sampled water for all strata combined, and Ah is
the volume of sampled water for strata h estimated by the beam volume sum method in Echoview 5.0,
such that the mean density is weighted by the sampled volume in each strata. The standard error of the
estimated reach-specific mean density ( ) was calculated using:
following the variable nomenclature defined above. Total fish abundance (N) was estimated by
multiplying by the total reach volume determined by interpolating depth contours via a triangulated
irregular network in ArcMap 9.3 (Figure 1b). The standard error for total fish abundance (SE(N)) was
estimated by multiplying by the total reach volume.
The length-frequency distribution of acoustic-detected fish was used to inform the length-frequency
distribution of the extrapolated abundance within each reach. Specifically, the proportion of fish within
each 1-mm interval was determined for each reach and multiplied by total estimated abundance and
corresponding 95% CIs.
Species-specific abundance, length distribution, and biomass
Data collected from standardized sampling conducted in each reach during summer 2010 was used to
inform acoustic estimates to determine species-specific abundance, length distribution, and biomass.
Length-frequency distributions were determined for silver carp, bighead carp, gar spp., and other fishes
at 20-mm TL increments. Gar spp. were determined separately from Asian carp and other fishes due to
their morphological differences for determining biomass from length-weight relationships. The
proportion of silver carp, bighead carp, gar, and other fishes was determined for each 20-mm length
group; these proportions were then linearly interpolated for each 1-mm TL. The length-specific
proportion of fish groups was then applied to the acoustic-derived length-frequency distribution to

estimate the total number of silver carp, bighead carp, gar, and other fishes as a function of TL. Reach-
specific length-weight regressions were determined for each fish group (Table 3). Length-specific
biomass of each fish category was estimated by1-mm TL increments by multiplying mass determined
from length-weight regressions by total estimated species-specific abundance. Total biomass was
determined by summing species- and length-specific biomass. Gar spp. and other fishes were combined
into a single category for presentation purposes.
Asian carp spatial distribution and depth use
Given that it is not possible to determine species composition from acoustic estimates, only a subset of
fish targets that had a greater than 50% chance of being an Asian carp were used to analyze patterns of
spatial distribution and depth use. Specifically, fish targets within 20-mm TL size categories that were
composed of 50% or more of Asian carp were selected for analyses.
The spatial distribution of Asian carp was determined by summing the total number of highly probably
Asian carp acoustic targets along each 1.6 river km in ArcMap 9.3. The cumulative proportion of Asian
carp were then plotted against river km to determine the highest abundance of Asian carp as it relates
to a linear spatial distribution. It is important to note that this analysis was conducted only on detected
fish and not on extrapolated abundance. This approach does not account for varying sampled volumes
along the river; yet, given that total number of Asian carp along the Illinois River is likely of greater
importance than density for concentrated commercial fishing efforts, this analysis does provide an
indication of the relative spatial abundance of Asian carp.
Depth use was determined by assigning Asian carp fish targets to depth categories at 1-m intervals. The
proportion of Asian carp using a particular depth interval and associated 95% confidence intervals was
determined using an intercept only model using the logistic procedure (SAS Institute 2009) for each size
category and reach combination. Probabilities of Asian carp presence and 95% confidence intervals
were then used to determine the potential range of abundances found at each depth interval as it is
influenced by sample size and associated confidence for each reach. Densities of Asian carp were then
determined by dividing depth-specific volume estimates for each reach and depth combination to
construct volumetrically compensated depth use and associated confidence intervals.
Results
A total of eight parallel hydroacoustic transects were completed along the main channel from fall 2010
to summer 2011 along 427.8 river km of the Illinois River from the confluence of the Illinois River and
Mississippi River to Starved Rock Lock and Dam for a total of 3,422.5 river km of transect distance.
Overall, an estimated 0.39% of the total volume was sampled with hydroacoustics and this was fairly
similar among reaches (Table 2.1). Hydroacoustic surveys took 39 days of actual sampling, not including
the standardized sampling that is necessary to inform acoustic estimates on the length-specific
prportion of Asian carp to other fishes.
Main channel Asian carp abundance (silver carp and bighead carp) was estimated at 743,435 (95% CI =
658,091 – 828,780) among all three lower reaches of the Illinois River combined and abundance

generally declined moving upstream (Table 4). Specifically, Asian carp abundance was highest in the
Alton reach (P < 0.05), but was not different between La Grange and Peoria (P > 0.05). This trend was
identical for silver carp and other fishes. Bighead carp were least abundant in the Peoria reach (P <
0.05), whereas abundance was not different between Alton and La Grange (P > 0.05).
Main channel Asian carp biomass was estimated to be 1,413 metric tons (95% CI = 1,249.3 – 1,576.7)
within the main channel of the three lower reaches of the Illinois River (Table 4). Despite differences in
abundance, biomass of silver carp and Asian carp collectively were not different among all reaches (P >
0.05), suggesting that the average mass of Asian carp is smaller in the downstream reaches. Bighead
carp biomass trends were similar to their abundance, with Peoria having substantially lower biomass
than the other two reaches (P < 0.05). Biomass of other fishes significantly declined moving upstream (P
< 0.05).
To compensate for varying reach size, abundance and biomass was expressed on a river-km basis (Table
5). Overall Asian carp density and biomass/km among all reaches combined was estimated to be 1,738
per km (95% CI = 1,538 – 1,937) and 3.30 metric tons per km (95% CI = 2.92 – 3.69), respectively (Table
5). Asian carp density was lowest in Peoria (P < 0.05), but not different between Alton and La Grange (P
> 0.05); yet, Asian carp biomass/km was only different between Alton and Peoria (P < 0.05). Silver carp
density was similar among all three lower reaches (P > 0.05), but silver carp biomass was highest in the
Peoria reach (P < 0.05). Bighead carp density and biomass/km was lowest in the Peoria reach (P < 0.05),
but similar between Alton and La Grange (P > 0.05). Similar to total biomass trends, biomass/km of
other fishes declined moving upstream (P < 0.05), yet the biomass/km was not different between Peoria
and La Grange (P < 0.05).
The length-frequency distribution of all fishes declined exponentially (Figure 2.3). It was apparent,
however, that Asian carp (particularly silver carp) dominated the fish community at lengths ≥ 420-mm TL
in all three lower reaches of the Illinois River. Although Asian carp made up approximately 10% of the
fish community overall in terms of numerical abundance, they comprised between 60 and 100% of the
fish community for TL > 420 mm and these trends were similar among all reaches (Figure 2.4). Lower
proportions of Asian carp to other fishes at sizes > 420-mm TL was primarily associated with the
presence of gar spp. A Kruskal-Wallis test indicated that the Asian carp length-frequency distribution
was different among reaches ( = 13.52, P = 0.001). A Wilcoxon rank sum test indicated that the Asian
carp size distribution tended to be larger in Alton and La Grange compared to Peoria (z ≤ -2.93; P ≤
0.002), but was not different between Alton and La Grange (z = 0.047; P = 0.48).
In terms of biomass, Asian carp dominated biomass of fishes > 400-mm TL (Figure 2.5). However, it was
clearer with biomass compared to abundance that bighead carp dominated the fish community at sizes
> 800 mm-TL, particularly in the Alton and La Grange reaches. Bighead carp appear to be relatively non-
abundant in the Peoria reach, which increased the average mass per Asian carp individual due to greater
mass of similar-sized silver carp within the Peoria reach compared to bighead carp from Alton or La
Grange (Table 3). Overall, Asian carp comprised approximately 63% of the total fish biomass in all three
reaches combined. The proportional biomass composed of Asian carp as a function of size, however,

indicates that Asian carp biomass dominance is restricted to sizes > 400-mm TL, ranging in dominance
from 65 to 100% of the fish community in all reaches combined (Figure 2.6).
The cumulative proportion of acoustically detected Asian carp (N = 2,755) indicated that close to 30% of
the total Asian carp population was located within the first 25 km of the Alton reach, near the
confluence with the Mississippi River (Figure 2.7a). The fairly consistent slope of the cumulative
proportion of Asian carp at distances > 25 river km, however, suggests that Asian carp are distributed
fairly equally along the entire Illinois River. Yet, distinct modes in the proportion of Asian carp indicated
that Asian carp were not distributed equally along the entire Illinois River. The highest proportion of
acoustically detected Asian carp (N = 2725) were generally found near the downstream and upstream
areas of each reach, particularly in the Alton and La Grange reaches (Figure 2.7b). However, other
modes were present throughout each reach suggesting that high abundances of Asian carp may be
associated with particular features of the Illinois River.
The highest proportions of Asian carp were detected at 5-m, 4-m, and between 4- and 5-m depth within
the Alton, La Grange, and Peoria reaches, respectively (P < 0.05; Figure 2.8). However, these results
closely resembled the depth-specific estimates of sampled volume. After correcting for volumetric
estimates, these patterns generally held (Figure 9). In the Alton reach, the highest Asian carp densities
were detected at 5 m, but it was evident that Asian carp were using depths between 4 and 8 m. The
apparent high densities of Asian carp found at depths ≥ 8 m in the La Grange reach were due to low
volumes of water sampled at these depths; the large confidence limits are indicative of low numbers of
fish found at these depths (i.e., only 38 out of 1239 Asian carp were found at these depths). As such,
Asian carp in the La Grange reach were most likely to be found between 3- and 5-m depths, with the
highest probability of occurrence at 4 m when depths ≥ 8 m are ignored. Similar high variation in depth
use was found at 10-m depth in the Peoria reach, which included only two out of 646 Asian carp. Thus,
Asian carp in the Peoria reach were most likely to be found between 4- and 6-m depths, with the highest
chance of occurrence at 4-m depth (P < 0.05).
Discussion
The results of this study indicated that the abundance and biomass of Asian carp collectively in the
lower three reaches of the Illinois River (i.e., Alton, La Grange, and Peoria reaches) was 743,435 (95% CI
= 658,091 – 828,780) and 1,413 metric tons (95% CI = 1,249.3 – 1,576.7), respectively. These estimates
suggest that Asian carp comprise 10% and 63% of the fish community in terms of numerical abundance
and biomass, respectively. Yet, Asian carp compose between 60% to 100% of the fish community at
sizes greater than approximately 400-mm TL in terms of both abundance and biomass. An estimated
30% of the Asian carp population was found within the first 25 km of the Illinois River near the
confluence with the Mississippi River, which is consistent with the general spatial distribution provided
by Sneed (2006). At the macroscale, the spatial distribution of Asian carp was generally uniform across
river distance of the three lower reaches at distances > 25 river km. Yet, distinct modes indicated that
Asian carp had clumped distributions, particularly near dams, suggesting that Asian carp density may be
related to particular features within the Illinois River. Further analyses with respect to relationships
between Illinois River features (e.g., presence of backwaters, tributaries, availability of food resources,

and refuge from flow) and Asian carp abundance relative to these data will give greater insight into
factors affecting the spatial distribution of Asian carp.
The abundance and biomass estimates of silver carp and bighead carp in this study represent
conservative population estimates for the Illinois River for several reasons. First and foremost, the
sampled area did not include nearshore depths < 1.5 m, excludes surface volume to 1.15-m depth, and
did not include backwater areas or tributaries. Sneed (2006) estimated a nearly 1:1 ratio between Asian
carp density found in backwaters and the main channel (on a surface area basis), suggesting that a high
proportion of Asian carp were not sampled in this study. Further, the results of this study apply to the
Alton, La Grange, and Peoria reaches of the Illinois River and exclude the Starved Rock and Marseilles
reaches where populations of Asian carp are known to exist. Similar hydroacoustic surveys were
actually completed on the Starved Rock and Marseilles reaches during fall 2010 (an additional 75 river
km, 600 km total transect distance). These data were not included in this report because standardized
sampling data were not available concerning the length-specific proportional abundances of Asian carp
and other fishes to inform hydroacoustic estimates, which may be available from other research
institutions (e.g., Illinois Natural History Survey). The inclusion of these data would increase the
estimates of Asian carp abundance and biomass for the main channel of the Illinois River.
Second, although hydroacoustics is thought to be a less biased sampling technique than other capture
gears, one limitation of hydroacoustic sampling is that species-specific information cannot be
determined unless there are clear spatial segregations among fish species or other classification
variables of interest (e.g., age class). Thus, these estimates rely on some form of paired sampling
technique to determine species composition, such that these proportional estimates can be used to
inform hydroacoustic estimates. As a result, the separation of the overall size distribution determined
from hydroacoustic sampling into species-specific information is inherently prone to similar gear biases
from standardized sampling. Species-specific information for these results was gleaned from pulsed-DC
electrofishing and trammel nets, which have known size biases. Given the elusiveness of Asian carp to
capture gears, it is likely that our Asian carp abundance and biomass estimates are conservatively low in
our standardized sampling and as a result hydroacoustic estimates, particularly for YOY Asian carp which
were not detected with our sampling. Nevertheless, future estimates with combined hydroacoustic
surveys and standardized sampling through time will allow for relative comparisons to be made
concerning changes in Asian carp abundance and biomass as well as other fishes.
A third potential factor contributing to low estimates of Asian carp, specifically silver carp, is evasion
from hydroacoustic gear, which was also observed by Snead (2006). Although the frequency of the
hydroacoustic transducer used in this study (200,000 Hz) was much higher than the hearing capabilities
of Asian carp (range = 300 Hz to 2,000 Hz; Lovell et al. 2006), silver carp were observed jumping away
from the boat during hydroacoustic sampling likely due to outboard motor noise. However, it is
unknown whether these fish were originally shallower than our minimum detection depth of 1.15, such
that these fish would have not been detected regardless of evasion. One potential way to compensate
for evasion in future hydroacoustic surveys is to conduct side-looking hydroacoustic transects to
determine the density of fishes near the surface. Nevertheless, further research is needed to determine
the potential effect of evasion of Asian carp on hydroacoustic estimates.

Lastly, the volume sampled with hydroacoustics represents only 0.3% of the total volume overall,
despite conducting 3,422.5 river km of transect distance along the three lower reaches of the Illinois
River. The low sampled volume was most likely due to the stratified sampling design that focused on
depths between 3 and 7 m rather than directly over the thalweg where the majority of the volume is
located (Figures 2.1a and 2.7). Thus, despite the low estimated volume of sampled volume, the
stratified sampling design focused on areas in which Asian carp are located, yet deep areas where Asian
carp are less abundant were still sampled, ultimately reducing variance and providing a more precise
and accurate depiction of density, abundance, and biomass in the main channel. Further, if our
estimates of proportion of sampled volume were presented on an aerial basis, as done by Sneed (2006),
our coverage of the Illinois River would be much higher.
To our knowledge, there have only been two previous studies conducted to estimate the abundance and
biomass of Asian carp in the Illinois River for comparison purposes (i.e., Snead 2006; Sass et al. 2010).
Despite the potential factors contributing to a conservative estimate, silver carp abundance in the La
Grange reach, based on a mark-recapture study conducted on the La Grange reach from 2007-2008,
estimated silver carp abundance to be 328,192 (95% CI = 231,226 – 484,474; Sass et al. 2010), which
overlapped with our estimates. Given that our estimates pertain only to the main channel, whereas
estimates provided by Sass et al. (2010) include backwater areas, indicates that the silver carp
population is still increasing. Signs of reduced condition in silver carp and bighead carp from this study
compared to Irons et al. (2007), however, suggest that the Asian carp population may be reaching
carrying capacity. Specifically, Sass et al. (2010) used the length-weight relationship for silver carp
developed by Irons et al. (2007) from data collected between 1990 to 2006 (i.e., log10mass =
3.122·log10TL – 5.294). Regression analyses indicated that both the intercept (F1,580 = 7.33; P = 0.007)
and slope (F1,580 = 10.66; P = 0.001) of this relationship was higher than our estimate of the silver carp
length-weight regression parameters in the La Grange reach. The intercept (F1,8 = 30.48; P = 0.0006) and
slope (F1,8 = 33.70; P = 0.0004) for bighead carp from the La Grange reach determined in this study was
also lower than that estimated by Irons et al. (2007) (i.e., log10mass = 3.122·log10TL – 5.294). The
reduced condition of Asian carp in the La Grange reach may be responsible for our estimates of silver
carp biomass being significantly lower than estimates provided by Sass et al. (2010), which was
estimated to be 704.6 (95% CI = 496.4 -1,040.1). Yet, shifts in the size distribution toward smaller sizes
could also contribute to lower biomass estimates, despite similar abundance estimates, in this study
compared to Sass et al. (2010), which deserves further investigation.
Estimates of Asian carp (silver carp and bighead carp, collectively) abundance and biomass from a
combination of side-scan sonar, mark-recapture estimates, and ratios of Asian carp to other fishes from
mark-recapture surveys yielded an Asian carp abundance and biomass estimate of 865,067 (439,867 in
the main channel and 425,200 in backwater lakes) and 5,425 metric tons (3,299 metric tons in the main
channel and 2,126 metric tons in backwater lakes), respectively (Sneed 2006). Although these results
were presented as the minimum abundance of Asian carp present in the Illinois River (from the
confluence with the Mississippi River to Ottawa, IL) for similar reasons stated above, confidence limits of
these estimates were not presented making it impossible to assess the precision of these estimates.
Nevertheless, the upper 95% confidence interval of Asian carp abundance was significantly lower than

the estimate provided by Sneed (2006). Given that Asian carp density estimates were sampled along 35
locations by Sneed (2006) and the results of our study indicated that Asian carp abundance is not
equally distributed along the Illinois River, the estimates by Sneed (2006) pertaining to main channel
abundance is subject to high variability in density and abundance. Therefore, if confidence limits were
available for estimates of Asian carp abundance, it is highly likely that our estimates would overlap with
that of Sneed (2006) specific to the main channel of the Illinois River. However, biomass estimates of
Asian carp for the main channel from Sneed (2006) were 2.3 times higher than our estimates, which
cannot be explained merely by variation. Estimates of Asian carp biomass from Sneed (2006), however,
extrapolated the average weight of Asian carp from the main channel to the estimated abundance
opposed to extrapolating size-specific biomass estimates to a length-frequency distribution as was
conducted in this study and by Sass et al. (2010). Given that the size distribution of Asian carp is not
normally distributed, the biomass estimates of Asian carp from Sneed (2006) were greatly
overestimated.
Depth use of Asian carp was highest between 4 and 5 m, but high densities were generally found
between 3 and 8 m. It is important to note that these estimates do not account for the maximum depth
at which Asian carp were detected to determine whether they were more associated with the surface or
bottom. In addition, each reach was sampled with hydroacoustic surveys during different time periods
when Asian carp may be behaving differently; thus, depth use comparisons among reaches may not be
meaningful. Repeated hydroacoustic surveys over given areas across time would be necessary to
determine changes in depth use as a function of season and whether these patterns are similar among
reaches.
The relationship between maximum dorsal-aspect TS and TL used in this study was developed from
multiple species from several studies and includes fish that do or do not have gas bladders (Love 1971).
It has been estimated that 50% of the dorsal- and side-aspect TS from a fish is generated by the gas
bladder (Jones and Pearce 1958), with the skeleton and flesh (Volberg 1963) and scales (Diercks and
Goldsberry 1970) reflecting the other half, listed in decreasing order of magnitude. Thus, the dorsal-
and side-aspect TS of a given fish species and size is an emergent property of the size and morphology of
the gas bladder, body morphology, proximate composition, and possibly the type and size of scales.
Given that the gas bladder of Asian carp are much larger than the majority of fish species (personal
observation), the TS threshold used in this study would likely underestimate the size of Asian carp.
Therefore information concerning both the maximum side-aspect TS and dorsal-aspect TS for Asian carp
and other fish species common in the Great Lakes and Mississippi River Basin would refine size-
distribution estimates of Asian carp from acoustic surveys and would also help to refine the search
window for detecting Asian carp for other research objectives (e.g., Asian carp detection for barrier
defense operations), and may facilitate determination of species composition.
The results of this study, while conservative, suggest that the potential to commercially harvest 22,680
metric tons (50 million lb) of Asian carp per year to fulfill contract agreements between The state of
Illinois, Big River Fish Corporation, and China are likely not possible. Even if our upper 95% confidence
limit estimate of Asian carp biomass was doubled to compensate for the lack of sampling in backwater
lakes based on the ratio of Asian carp abundance in backwater areas to the main channel, our estimate
would only increase to 3,153.4 metric tons (6.95 million lb), falling well short of the contract goal.
Nevertheless, future estimates of abundance and biomass of Asian carp need to address the
shortcomings of this study. Specifically, future studies should attempt to include estimates of density
near the surface via side-looking acoustics, which would compensate for the 1.15 m layer of unsampled
volume in this study and could facilitate in reducing evasion of Asian carp during acoustic surveys.
Further, an emphasis should be placed on backwater areas for two reasons. First, nearly half of the
estimated Asian carp biomass was present in the backwater lakes based on a previous study conducted
on the Illinois River (Sneed 2006). Second, given that these areas will likely be the most easily
commercially fished areas due to difficulties associated with fishing in the main channel of the Illinois
River due to flow, steep drop offs and overall greater depths than backwater areas, and barge traffic. It
is unlikely that down-looking hydroacoustic surveys would be successful in backwater lakes along the
Illinois River, primarily due to the shallow depths. Thus, future studies should incorporate side-looking
hydroacoustic surveys and/or side-scan sonar to estimate abundance and biomass in backwater lakes.

Literature cited
Brandt, S.B, D.M. Mason, E.V. Patrick, R.L. Argyle, L. Wells, P.A. Unger, and D.J. Stewart. 1991. Acoustic
measures of the abundance and size of pelagic planktivores in Lake Michigan. Canadian Journal
of Fisheries and Aquatic Sciences 48: 894-908.
Diercks, K.J. and T.G. Goldsberry. 1970. Target strength of a single fish. Journal of the Acoustic Society of
Amercia 48 (1, Part 2): 415-416.
Foote, K.G., H.P. Knudsen, G. Vestnes, D.N. MacLennan, E.J. Simmonds. 1987. Calibration of acoustic
instruments for fish density estimation: a practical guide. ICES Cooperative Research Report, No.
144.
Jones, F.R.H., and G. Pearce. 1958. Acoustic reflexion experiments with perch (Perca fluviatis Linn.) to
determine the proportion of the echo returned by the swimbladder. Journal of Experimental
Biology 35: 437-450.
Love, R.H. 1971. Measurements of fish target strength: a review. Fishery Bulletin 69: 703-715.
Parker-Stretter, S.L., L.G. Rudstam, P.J. Sullivan, D.M. Warner. 2009. Standard operating procedures for
fisheries acoustic surveys in the Great Lakes. Great Lakes Fisheries Commission
SpeciaPublication 09-01.
SAS Institute. 2008. SAS System Version 9.1.3. Cary, NC: SAS Institute, Inc.
Sass, G.G, T.R. Cook, K.S. Irons, M.A. McClelland, N.N. Michaels, T.M. O’Hara, M.R. Stroub. 2010. A mark-recapture population estimate for invasive silver carp (Hypopthalmichthys molitrix) in the La Grange Reach, Illinois River. Biological Invasions 12: 433-436.
Scheaffer, R.L., W. Mendenhall, III, and R.L. Ott. 1996. Elementary survey sampling 5th edition. Duxbury
Press, London, U.K.
Simmonds, J., and D. MacLennan. 2005. Fisheries acoustics: theory and practice. Blackwell, Oxford, UK.
Sneed, J. 2006. Asian carp biomass survey of the Illinois River and Anderson, Big, Chautauqua, Lilly, and
Matanzas Lakes. Final report to the University of Illinois and Illinois Department of Natural
Resources, 47 pp.
Volberg, H.W. 1963. Target strength measurements of fish. Straza Industries Report. R-101, El Cajon,
California, 146 pp.

Table 2.1. Summary of hydroacoustics transects conducted for the Alton, La Grange, and Peoria reaches
on the Illinois River. A total of eight parallel transects were conducted along each river mile section.
Volume sampled was estimated with EchoView 5.0 based on the shape of the acoustic beam and depth
of each ping emitted. Total volume was estimated using ArcMap 9.3 by interpolating each GPS-
referenced depth from all acoustic pings (5 per second) within the main channel only via triangulated
irregular networks and was not extrapolated beyond our transects (i.e., total volume does not include
nearshore depths < 1.5 m and excludes surface volume to 1.15-m depth).
River km begin River km end Date sampled Volume
sampled (m3) Total estimated
volume (m3) Percent sampled
Alton
0.0 17.2 8/6/2011 116,983 21,060,499 0.56
17.2 29.3 8/5/2011 53,142 11,251,468 0.47
29.3 42.2 8/4/2011 30,944 11,071,868 0.28
42.2 52.2 8/3/2011 20,661 4,810,774 0.43
52.2 59.3 7/30/2011 16,620 5,424,036 0.31
59.3 70.4 7/29/2011 13,765 7,688,491 0.18
70.4 81.5 7/28/2011 20,997 7,962,532 0.26
81.5 92.6 7/27/2011 20,550 6,855,928 0.30
92.6 103.7 7/26/2011 19,217 6,595,422 0.29
103.7 114.8 7/25/2011 28,084 6,614,914 0.42
114.8 125.9 7/24/2011 16,567 4,519,487 0.37
125.9 137.0 7/23/2011 21,535 4,710,438 0.46
137.0 148.5 7/22/2011 21,778 5,066,111 0.43
Reach total 400,845 103,631,968 0.39
La Grange
148.5 155.8 11/14/2010 10,570 4,457,211 0.24
155.8 167.6 11/13/2010 10,161 4,892,474 0.21
167.6 180.0 11/12/2010 13,873 4,603,177 0.30
180.0 191.9 11/11/2010 19,775 4,413,807 0.45
191.9 202.6 11/10/2010 7,627 3,195,897 0.24

202.6 215.4 11/9/2010 15,349 3,450,464 0.44
215.4 226.9 11/8/2010 11,228 3,464,060 0.32
226.9 238.0 11/7/2010 12,671 3,846,906 0.33
238.0 248.2 11/6/2010 5,842 2,308,675 0.25
248.2 259.3 11/5/2010 10,668 3,604,144 0.30
259.3 269.5 11/4/2010 19,992 3,043,250 0.66
269.5 280.0 10/21/2010 15,750 3,037,015 0.52
280.0 283.2 10/20/2010 19,445 1,047,236 1.86
283.2 291.9 10/11/2010 22,945 2,149,483 1.07
Reach total 195,896 47,513,801 0.41

Table 2,1, continued.
River km begin River km end Date sampled Volume
sampled (m3) Total estimated
volume (m3) Percent sampled
Peoria
291.9 296.7 4/18/2011 8,662 1,914,212 0.45
296.7 308.5 4/17/2011 23,404 6,391,295 0.37
308.5 320.8 4/16/2011 15,357 4,044,471 0.38
320.8 334.3 4/15/2011 19,246 4,906,887 0.39
334.3 346.3 4/14/2011 28,327 7,299,597 0.39
346.3 359.3 4/13/2011 27,960 7,448,243 0.38
359.3 370.4 4/12/2011 18,168 5,656,675 0.32
370.4 382.4 4/11/2011 19,689 6,472,205 0.30
382.4 394.5 4/10/2011 25,709 6,809,722 0.38
394.5 405.4 4/9/2011 21,886 5,583,505 0.39
405.4 416.1 4/8/2011 35,639 5,659,289 0.63
416.1 427.8 4/7/2011 16,908 4,437,282 0.38
Reach total 260,954 66,623,383 0.39
Grand total 857,694 217,769,153 0.39

Table 2.2. Values used for the single-target detection algorithm (method 2) in EchoView 5.0 during post-
processing following Parker-Stetter et al. (2009). Target strength (TS) thresholds were determined
based on the relationship between maximum dorsal-aspect TS and TL (Love 1971; Figure 2), and
correspond to a minimum and maximum length between 59- and 1200-mm TL.
Variable Value
Minimum TS threshold (dB) -50.00
Maximum TS threshold (dB) -24.64
Pulse length determination level (dB) 6.0
Minimum normalized pulse length 0.6
Maximum normalized pulse length 1.5
Beam compensation model BioSonics
Maximum s.d. of minor-axis angle° 0.6
Maximum s.d. of major-axis angle° 0.6

Table 2.3. Reach-specific length-weight regression parameters and associated standard errors (SE) for
silver carp, bighead carp, gar spp. and other fishes determined from standardized sampling. The
functional form of the length-weight regressions was log10mass = a' + b · log10TL, where mass is in g and
TL is in mm.
Fish category a' SE b SE N P R2
Alton
Silver carp -4.94 0.07 2.98 0.07 364 <0.0001 0.9702
Bighead carp -2.72 0.54 2.21 0.18 10 <0.0001 0.9470
Gar spp. -6.34 0.75 3.30 0.27 24 <0.0001 0.8709
Other fishes -5.17 0.09 3.10 0.04 137 <0.0001 0.9766
La Grange
Silver carp -5.09 0.07 3.03 0.03 582 <0.0001 0.9538
Bighead carp -4.00 0.15 2.65 0.05 10 <0.0001 0.9968
Gar spp. -3.78 1.44 2.34 0.52 20 0.0003 0.5248
Other fishes -4.94 0.12 3.00 0.05 115 <0.0001 0.9664
Peoria
Silver carp -5.44 0.06 3.16 0.02 571 <0.0001 0.9753
Bighead carp -6.14 0.36 3.43 0.13 24 <0.0001 0.9677
Gar spp. -6.14 - 3.21 - 2 - 1.0000
Other fishes -5.38 0.07 3.18 0.03 194 <0.0001 0.9809

Table 2.4. Mean abundance (N) and biomass (metric tons) and associated 95% confidence intervals for silver carp, bighead carp, Asian carp
combined (silver carp and bighead carp only), and all other fishes for the three lower reaches of the Illinois River. The proportion of total fish
abundance composed of Asian carp among all reaches combined was 10.02% (95% CI = 10.00 to 10.04%), whereas the proportion of total fish
biomass composed of Asian carp among all reaches combined was 63.47% (95% CI = 63.40 to 63.53%). Means with different letters indicate
significant differences within each group of fishes at the α = 0.05 level.
Abundance (N) Biomass (metric tons)
Reach Mean Lower 95% CI Upper 95% CI
Mean Lower 95% CI Upper 95% CI
Silver carp
Alton 284,817a 262,093 307,541
373.7a 343.8 403.5
La Grange 218,470b 183,836 253,104
308.2a 259.3 357.1
Peoria 180,137b 159,074 201,200
393.3a 347.3 439.3
Total 683,424 605,002 761,845
1,075.2 950.5 1,199.9
Bighead carp
Alton 26,269a 24,173 28,365
177.0a 162.8 191.1
La Grange 21,194a 17,834 24,554
147.4a 124.0 170.7
Peoria 12,548b 11,081 14,016
13.5b 11.9 15.0
Total 60,011 53,088 66,935
337.8 298.8 376.9
Asian carp combined
Alton 311,086a 286,266 335,905
550.6a 506.7 594.6
La Grange 239,664b 201,670 277,658
455.6a 383.4 527.8
Peoria 192,685b 170,155 215,216
406.8a 359.2 454.4

Total 743,435 658,091 828,780
1,413.0 1,249.3 1,576.7
Other fishes
Alton 2,855,671a 2,627,833 3,083,509
378.1a 348.0 408.3
La Grange 1,849,149b 1,556,003 2,142,295
263.0b 221.3 304.7
Peoria 1,971,672b 1,741,125 2,202,219
172.0c 151.9 192.1
Total 6,676,493 5,924,962 7,428,024 813.1 721.2 905.1

Table 2.5. Mean density (N/km) and biomass/km (metric tons) and associated 95% confidence intervals for silver carp, bighead carp, Asian carp
combined (silver carp and bighead carp only), and all other fishes for the three lower reaches of the Illinois River. Means with different letters
indicate significant differences within each group of fishes at the α = 0.05 level.
Density (N/km) Biomass/km (metric tons)
Reach Mean Lower 95% CI Upper 95% CI
Mean Lower 95% CI Upper 95% CI
Silver carp
Alton 1,918a 1,765 2,071
2.52b 2.32 2.72
La Grange 1,524a 1,282 1,766
2.15b 1.81 2.49
Peoria 1,325a 1,170 1,480
2.89a 2.56 3.23
Total 1,597 1,414 1,781
2.51 2.22 2.80
Bighead carp
Alton 177a 163 191
1.19a 1.10 1.29
La Grange 148a 124 171
1.03a 0.87 1.19
Peoria 92b 82 103
0.10b 0.09 0.11
Total 140 124 156
0.79 0.70 0.88
Asian carp combined
Alton 2,094a 1,927 2,262
3.71a 3.41 4.00
La Grange 1,672a 1,407 1,937
3.18ab 2.67 3.68
Peoria 1,417b 1,252 1,583
2.99b 2.64 3.34
Total 1,738 1,538 1,937
3.30 2.92 3.69

Other fishes
Alton 19,226a 17,692 20,760
2.55a 2.34 2.75
La Grange 12,900b 10,855 14,945
1.84b 1.54 2.13
Peoria 14,504b 12,808 16,200
1.27c 1.12 1.41
Total 15,606 13,849 17,363 1.90 1.69 2.12

Figure 2.1. Example of a) hydroacoustic transects and b) interpolated depth contours for Alton reach
river mile 10-11 (river km 18.5-20.4). Depth contours were estimated using ArcMap 9.3 by interpolating
each GPS-referenced depth from all acoustic pings (5 per second) within the main channel via
triangulated irregular networks and was not extrapolated beyond our transects (i.e., depth contours do
not include nearshore depths < 1.5 m).

Maximum dorsal-aspect target strength (dB)
-50 -45 -40 -35 -30 -25
Tota
l le
ngth
(m
m)
0
200
400
600
800
1000
1200
1400
TL = 1000*10[(TS + 26.1852) / 19.4]
Figure 2.2. Total length plotted as a function of maximum dorsal-aspect target strength (TS) as
determined by Love (1971).

Figure 2.3. Estimated length-frequency for silver carp, bighead carp, and other fishes for the a) Alton reach, b) La Grange reach, c) Peoria reach, and
d) all reaches combined for the Illinois River. Note the varying scales in abundance.

Figure 2.4. Estimated proportion of total fish abundance composed of Asian carp for the a) Alton reach, b) La Grange reach, c) Peoria reach, and d)
all reaches combined for the Illinois River.

Figure 2.5. Estimated biomass of silver carp, bighead carp, and other fishes for the a) Alton reach, b) La Grange reach, c) Peoria reach, and d) all
reaches combined for the Illinois River. Note the varying scales in biomass.

Figure 2.6. Estimated proportion of total fish biomass composed of Asian carp for the a) Alton reach, b) La Grange reach, c) Peoria reach, and d) all
reaches combined for the Illinois River.

River km
0 25 50 75 100 125 150 175 200 225 250 275 300 325 350 375 400 425
Cu
mu
lative
pro
po
rtio
n o
f A
sia
n c
arp
0.0
0.2
0.4
0.6
0.8
1.0
0 25 50 75 100 125 150 175 200 225 250 275 300 325 350 375 400 425
Pro
po
rtio
n o
f A
sia
n c
arp
0.00
0.02
0.04
0.06
0.08
Confluence o
f th
e M
issis
sip
pi and Illi
nois
Riv
ers
La G
range L
ock a
nd D
am
Peoria L
ock a
nd D
am
Sta
rved R
ock L
ock a
nd D
amb)
a)
Alton reach La Grange reach Peoria reach
Alton reach La Grange reach Peoria reach
Figure 2.7. a) Cumulative proportion and b) proportion of acoustically detected Asian carp as a function of river km (N = 2,725). Vertical dashed
lines indicate spatial separations among reaches. Size classes that were composed of > 50% Asian carp were used for analysis purposes.

a) Alton
2 3 4 5 6 7 8 9 10 11 12 13 14 15
0.00
0.05
0.10
0.15
0.20
0.25
0.30
0.35
0.0
0.1
0.2
0.3
0.4
0.5
0.6Proportion of sampled volume
Probability of Asian carp
b) LaGrange
2 3 4 5 6 7 8 9 10 11 12 13 14 15
Pro
po
rtio
n o
f sa
mp
led
vo
lum
e
0.00
0.05
0.10
0.15
0.20
0.25
0.30
0.35
Pro
po
rtio
n o
f A
sia
n c
arp
0.0
0.1
0.2
0.3
0.4
0.5
0.6
c) Peoria
Depth (m)
2 3 4 5 6 7 8 9 10 11 12 13 14 15
0.00
0.05
0.10
0.15
0.20
0.25
0.30
0.35
0.0
0.1
0.2
0.3
0.4
0.5
0.6
Figure 2.8. Estimated proportional frequency of Asian carp and proportion of acoustically sampled
volume plotted across 1-m depth intervals for a) Alton, b) La Grange, and c) Peoria reaches of the Illinois
River. Size classes that were composed of > 50% Asian carp were used for analysis purposes. Error bars
represent the 95% confidence interval for proportion of Asian carp at a particular depth.

36
a) Alton
2 3 4 5 6 7 8 9 10 11
0.0
0.2
0.4
0.6
0.8
1.0
1.2
1.4
1.6
b) LaGrange
2 3 4 5 6 7 8 9 10 11
De
nsity (
# /
1,0
00
m3
)
0.0
0.4
0.8
1.2
1.6
2.0
2.4
8.010.012.0
c) Peoria
Depth (m)
2 3 4 5 6 7 8 9 10 11
0.0
0.2
0.4
0.6
0.8
1.0
1.2
1.4
1.6
a
b
b bcb
c
dd
d
a
abcd
abcde
bcde
b
c
cdde
e
a
b
c
dd
e
bcde
Figure 2.9. Estimated Asian carp density (#/1,000 m3) and corresponding 95% confidence intervals
plotted across 1-m depth intervals for a) Alton, b) La Grange, and c) Peoria reaches of the Illinois River.
Size classes that were composed of > 50% Asian carp were used for analysis purposes. Bars with
different letters indicate significant differences at an α = 0.05 level.

37
CHAPTER 3
Training, certification, pilot incentive, marketing and removal research project for the long-term
strategy in reducing and controlling Asian Carp populations
INTRODUCTION
Examples of commercially valuable fish stocks being depleted through overfishing abound.
Overexploitation has threatened paddlefish Polyodon spathula fisheries in the U.S. (Bettoli et. al 2009),
destroyed the Atlantic cod Gadus morhua fishery of the North Atlantic (Hutchings and Myers 1994), the
Pacific sardine Sardinops sagax fishery of California (Helfman et. al 2009), the Peruvian anchoveta
Engraulis ringens fishery in Peru (Helfman et. al 2009), and many others. It has been estimated that
over half of commercially valuable marine fisheries are in need of rebuilding (Worm et. al 2009). Inland
waters are not immune to overfishing (Allan et. al 2005). Within the U.S., many historically lucrative
commercial fisheries have closed due to overfishing (Quinn 2009). Our ability to decimate fisheries is
well documented, but examples of using exploitative fishing practices to successfully control invasive
species are less common.
Asian carp is a collective term for silver carp Hypopthalmichthys molitrix), bighead carp
Hypopthalmichthys nobilis, grass carp Ctenopharyngodon idella, and black carp Mylopharyngodon
piceus. These fish most likely escaped from aquaculture and sewage treatment ponds in Arkansas and
elsewhere in the 1970's, the result of a misguided campaign by the Department of Agriculture to
promote these fish as a non-chemical means of improving water quality. Asian carp have since spread
through much of the Mississippi River basin (Tucker et. al 1996). Asian carp, primarily silver and bighead
carp, became common in the Illinois River in the late 1990's (Chick and Pegg 2001). Presently, these
invaders now dominate the fish community in the Illinois River (Garvey et. al 2013). Mobile
hydroacoustic surveys of the Illinois River in 2011 and 2012 have conservatively estimated that Asian
carp now account for more than 60% of the total fish biomass in the river system (Garvey et. al 2013).
As filter feeders, Asian carp do compete for resources with native fishes like paddlefish, gizzard shad
Dorosoma cepedianum, and bigmouth buffalo Ictiobus cyprinellus, and studies have shown reduced
fitness in these native species where they share habitat with Asian carp (Irons et. al 2007; Schrank et. al
2003). Perhaps of most concern is the possibility that Asian carp will migrate into the Laurentian Great
Lakes via the Chicago Sanitary and Shipping Canal, a man-made connection between the Mississippi
River Basin and the Great Lakes Basin. Although the impacts of Asian carp establishing populations in
the Great Lakes are unknown and there is debate about whether Asian carp could establish thriving
populations within the Great Lakes (e.g., Kolar and Lodge 2002, Cooke and Hill 2010, Rasmussen et al.
2011), these species could jeopardize important commercial and recreational fisheries. In addition to
the ecological threats posed by Asian carp, their erratic leaping behavior (> 3 m out of the water) that is
exhibited when disturbed by vibrations such as a motor boat driving by, also poses a risk to public
safety.
In order to reduce Asian carp abundance, to improve conditions for native fishes, and to reduce the
likelihood of Asian carp migrating towards the Great Lakes, an enhanced Asian carp commercial

38
harvesting strategy was developed and implemented through collaborations among commercial
fishermen, processors, researchers (e.g., Illinois Natural History Survey and State Universities), agencies
(e.g., Sea Grant, IL Department of Natural Resources, IL Department of Economic Opportunity), and
fisheries managers. Asian carp populations were monitored to provide information about the impact of
commercial harvest and potential responses of the populations to increased harvest as marketing
efforts are implemented.
Component 1: Pilot training, certification, and incentive program
To fulfill the first component of the harvesting strategy, the Center for Fisheries, Aquaculture, and
Aquatic Sciences (CFAAS), Southern Illinois University, instituted a training, certification, and incentive
program to support the removal of Asian carp throughout the Mississippi and Illinois River systems via
Illinois licensed commercial fishermen.
METHODS:
A list of commercial fishermen interested in participating in an Asian carp training, certification and
incentive program was developed with input from the Illinois Commercial Fishing Association (ICFA), and
a lottery was used to select the finalists. The training and certification program included training on safe
handling of Asian carp for consumption in foreign and domestic markets, how to properly license and
safely operate a commercial fishing fleet, and how to coordinate and communicate Asian carp harvest
data to other stakeholder groups.
A pilot program was completed in spring 2011 and evaluated with input from the ICFA, the CFAAS, the
participant fishermen, and IDNR to develop and implement a full incentives program for fishing Asian
carp that began in summer/fall 2011. Following training and certification, those fishermen who proved
to be the most proficient at removing Asian carp became eligible for incentives to aid them in quickly
and efficiently meeting growing market demand. For participating fishermen enrolled in the incentives
program, the cost of membership to the ICFA, the commercial fishing license fee, certification training
fee, and commercial fishing tag fees were all waived. Furthermore, participating fishermen were given a
$1,000 bonus to help pay for fuel and net costs after they removed 50,000 pounds of Asian carp, and
another bonus of $3,000 after 100,000 pounds of Asian carp were removed. Commercial fishermen
enrolled in the incentives program were issued a handheld GPS device and were required to report to
CFAAS the locations from which the Asian carp were being removed.
RESULTS AND DISCUSSION:
The pilot training and certification program successfully identified a group of ten commercial fishermen
and their deckhands who were most proficient at harvesting Asian carp. These fishermen were then
chosen to participate in the full incentives program that began in the Summer of 2011. Although the
fishermen were successful in removing Asian carp from the Illinois River, the data collection goals of the
incentives program were not fully achieved. Specifically, commercial fishermen were wary to report to
CFAAS important data such as fishing location (GPS coordinates), despite their eligibility for cash
incentives, and despite knowing before they joined the incentives program what their obligations would

39
be. It is suspected that these fishermen ultimately placed a greater value on their proprietary
information (i.e. fishing locations and methods) than what they could gain from the incentives by fully
participating in the program, suggesting that the incentives package was too low to achieve full
compliance.
Of the ten commercial fishermen enrolled in the incentives program, harvest data was collected from
only five fishermen, of which only three fully participated. These three fishermen provided GPS
locations and dates of their fishing efforts, harvested a combined total of 496,859 pounds of Asian carp
from the Illinois River, and received a total of $8,000 in incentive payments (Table 3.1). Although these
three fishermen technically fulfilled the obligations of the incentive program, review showed the GPS
coordinates provided by the fishermen were typically those of the boat access ramp at which they
launched, delivering little if any information to managers on specific removal locations. The other two
fishermen for which data was available harvested a total 97,343 lbs. of Asian carp, but no GPS
coordinates were provided. Overall harvest of Asian carp by fishermen enrolled in this program was
594,202 lbs., and was composed of approximately 83% silver carp and 17% bighead carp.
If future incentives programs are considered, better communication must be established
between the commercial fishermen and the data collecting agency to ensure that participating
fishermen know and fulfill their obligations. It may also be necessary to increase incentive amounts to
make participation more attractive to commercial fishermen for full program compliance.

40
Table3.1. Commercial fishermen who fully participated in the incentive fishing program including
harvest information, processor information, and fishing coordinates. Bolded row indicates when harvest
requirements were met for incentive payments.
Fisherman
License
# Processor
Delivery
Date
lbs
SVCP
lbs
BHCP lbs total GPS N GPS W
O. Briney 945 Schafer 11/01/11 6389 753 7142 41.06.648 89.21.113
O. Briney 945 Schafer 11/02/11 8202 190 8392 40.45.234 89.33.505
O. Briney 945 Schafer 11/04/11 4528 377 4905 40.45.228 89.33.879
O. Briney 945 Schafer 11/07/11 4209 100 4309 40.45.223 89.33.520
O. Briney 945 Schafer 11/08/11 5004 3350 8354 40.06.444 89.21.367
O. Briney 945 Schafer 11/09/11 5315 561 5876 40.42.059 89.34.305
O. Briney 945 Schafer 11/11/11 6438 1193 7631 41.06.495 89.21.365
O. Briney 945 Schafer 11/14/11 5038 330 5368 40.45.225 89.33.516
O. Briney 945 Schafer 11/15/11 1989 1336 3325 40.01.450 89.24.894
O. Briney 945 Schafer 11/16/11 7002 1085 8087 41.06.650 89.21.107
O. Briney 945 Schafer/B.R. 11/21/11
5479 41.01.502 89.24.893
O. Briney 945 Schafer 11/22/11
0 41.01.502 89.24.887
O. Briney 945 Schafer 11/23/11 11464 4386 15850 41.06.495 89.01.367
O. Briney 945 Schafer 11/25/11 15536 2219 17755 41.064.492 89.21.362
O. Briney 945 Schafer 11/28/11 4138 35 4173 41.06.495 89.21.331
O. Briney 945 Schafer 11/30/11 8891 1931 10822 41.06.500 89.21.336
O. Briney 945 Schafer 12/06/11 5809 1907 7716 41.06.502 89.21.337
O. Briney 945 Schafer 12/07/11 7671 2410 10081 41.06.500 89.21.35
O. Briney 945 Schafer 12/08/11 10185 1745 11930 41.06.502 89.21.337
O. Briney 945 Schafer 12/08/11
41.06.500 89.21.337
O. Briney 945 Schafer 12/09/11 4361 850 5211 41.06.502 89.21.337
Fisherman License
Processor Delivery lbs lbs
lbs total GPS N GPS W

41
# Date SVCP BHCP
O. Briney 945 Schafer 12/12/11 8182 1252 9434 40.45.221 89.33.575
O. Briney 945 Schafer 12/09/11 4361 830 5191 41.06.502 89.21.337
O. Briney 945 Schafer 12/13/11 11317 94 11411 40.54.919 89.28.967
O. Briney 945 Schafer 12/14/11 3029 511 3540 40.42.047 89.34.310
O. Briney 945 Schafer 12/15/11 5162 434 5596 40.42.066 89.34.300
O. Briney 945 Schafer 12/19/11 8033 77 8110 41.06.500 89.21.335
O. Briney 945 Schafer 12/20/11 7922
7922 41.06.500 89.21.335
O. Briney 945 Schafer 12/22/11 5836 2564 8400 41.11.282 89.977
O. Briney 945 Schafer 12/26/11 9536 813 10349 39.52.225 90.32.981
O. Briney 945 Schafer 12/28/11 4341 941 5282 41.06.497 89.21.335
O. Briney 945 Schafer 12/29/11 1785 1556 3341 41.06.497 89.21.335
O. Briney 945 Schafer 12/29/11 4804 1653 6457 41.06.497 87.21.335
L. Gregerson 4037 Big River 10/31/11
1552 40.00.956 90.26.510
L. Gregerson 4037 Big River 11/05/11
2446 40.19.094 90.03.647
L. Gregerson 4037 Big River 11/12/11
2957 40.03.831 90.25.593
L. Gregerson 4037 Big River 12/05/11
11424 GPS error Bath, IL
L. Gregerson 4037 Big River 12/10/11 4316 1598 5914 40.11.490 90.09.734
L. Gregerson 4037 Big River 12/12/11
6922 40.05.879 90.25.387
L. Gregerson 4037 Big River 12/17/11 3137 825 3962 40.11.526 90.08.703
L. Gregerson 4037 Big River 12/19/11 4690 760 5450 40.05.878 90.25.387
D. Riley 217 Schafer 11/04/11 4528 377 4905 40.45.228 89.33.879
D. Riley 217 Schafer 11/07/11 4209 100 4309 40.45.223 89.33.520
D. Riley 217 Schafer 11/08/11 5004 3350 8354 40.06.444 89.21.367
D. Riley 217 Schafer 11/09/11 5315 561 5876 40.42.059 89.34.305
D. Riley 217 Schafer 11/14/11 5038 330 5368 40.45.225 89.33.516

42
Fisherman
License
# Processor
Delivery
Date
lbs
SVCP
lbs
BHCP lbs total GPS N GPS W
D. Riley 217 Schafer 11/15/11 1989 1336 3325 40.01.450 89.24.894
D. Riley 217 Schafer 11/16/11 7002 1085 8087 41.06.650 89.21.107
D. Riley 217 Schafer/B.R. 11/21/11
5479 41.01.502 89.24.893
D. Riley 217 Schafer 11/23/11 11464 4386 15850 41.06.495 89.01.367
D. Riley 217 Schafer 11/25/11 15536 2219 17755 41.06.492 89.21.362
D. Riley 217 Schafer 11/28/11 4138 35 4173 41.06.495 89.21.331
D. Riley 217 Schafer 11/30/11 8891 1931 10822 41.06.500 89.21.336
D. Riley 217 Schafer 12/01/11 6389 753 7142 41.06.648 89.21.113
D. Riley 217 Schafer 12/06/11 5809 1907 7716 41.06.502 89.21.337
D. Riley 217 Schafer 12/07/11 7671 2410 10081 41.06.500 89.21.35
D. Riley 217 Schafer 12/08/11 10185 1745 11930 41.06.502 89.21.337
D. Riley 217 Schafer 12/12/11 8182 1252 9434 40.45.221 89.33.575
D. Riley 217 Schafer 12/13/11 11317 94 11411 40.54.919 89.28.967
D. Riley 217 Schafer 12/14/11 3029 511 3540 40.42.047 89.34.310
D. Riley 217 Schafer 12/15/11 5162 434 5596 40.42.066 89.34.300
D. Riley 217 Schafer 12/16/11 4903 245 5148 41.01.501 89.24.891
D. Riley 217 Schafer 12/19/11 8033 77 8110 41.06.500 89.21.335
D. Riley 217 Schafer 12/20/11 7922
7922 41.06.500 89.21.335
D. Riley 217 Schafer 12/22/11 5836 2564 8400 41.11.282 89.977
D. Riley 217 Schafer 12/26/11 9536 813 10349 39.52.225 90.32.981
D. Riley 217 Schafer 12/28/11 4341 941 5282 41.06.497 89.21.335
D. Riley 217 Schafer 12/29/11 4804 997 5801 41.06.497 89.21.335
D. Riley 217 Schafer 12/30/11 3516 3112 6628 40.03.876 90.25.627
Total 388369 72231 496859

43
Component 2: Population Metrics of Commercially Caught Asian Carp, the Ecological Effectiveness of
Asian Carp Removal and the Commercial Suitability of Carp Meal.
The second commercial harvest component was conducted independently of the certification and
incentives project and fishermen were not eligible for harvest incentives. The second component was a
targeted, research-oriented fishing effort to understand the ecological effectiveness of Asian carp
harvest, and to determine the commercial suitability of Asian carp fish meal for inclusion in aquafeeds.
Prior to the implementation of this harvest component, CFAAS initiated an ongoing standardized
sampling program in the Illinois River that includes electrofishing, trammel netting, and split-beam
hydroacoustic surveys, allowing comparisons of Asian carp population metrics in the river pre- and post-
harvesting efforts (Garvey et al. 2013).The Asian carp removed through this research component were
processed into fish meal that was delivered to CFAAS. Portions of this meal were used in feed inclusion
experiments and remaining fish meal was sold to private markets, with revenue generated used for the
express purpose of conducting further research or aiding in Great Lakes restoration (Appendix).
The taxonomic, seasonal, and geographic variation in nutritional composition of bighead and silver carp
were determined to assess their suitability for rendering and subsequent use as a protein source in
aquafeeds. This data has since been published in peer-reviewed literature (Bowzer et al. 2013;
Appendix).
METHODS:
Through a competitive bidding process, Big River Fish Company, a processing plant in Pearl, IL, was
selected to hire and pay licensed Illinois commercial fishermen to harvest at least one million pounds of
Asian carp from the lower three reaches of the Illinois River (Alton, La Grange, and Peoria). Researchers
from the CFAAS visited the processing plant approximately every two weeks from 1 February 2012 thru
8 May 2012 while fishing was occurring, and collected data from harvested bighead and silver carp.
During each visit, up to 100 silver carp and 100 bighead carp from each IL river reach were randomly
selected from the delivered commercial harvest. Fish were weighed and measured, additionally, post-
cleithra for age determination, sex, and gonad weights were collected from a subsample of up to five
fish of each species and each reach within 50-mm total length group intervals.
Mean length-at-age
Post-cleithra were sectioned transversely across the center with a Buehler 1.5 amp diamond-blade low-
speed isomet saw following Johal et al. (2000). Sections were read by two independent readers using
side illumination from a Dolan-Jenner MI-150 fiber optic light; if disagreements between readers could
not be resolved the age was omitted from analyses. Age distributions were developed for the entire
sample using an age-length key. Silver carp and bighead carp mean length-at-age was compared among
reaches using a two-way analysis of variance (ANOVA). Comparisons were made for age classes 2.5
through 8.5 for silver carp and 2.5 through 11.5 for bighead carp. If the F-test detected significant
differences, post-hoc t-tests were conducted to determine where differences existed. A two-way
ANOVA was also used to compare mean length-at-age between silver carp harvested by commercial
fishermen and silver carp collected by electrofishing in 2012 (Garvey et al. 2013).

44
Length-weight relationships
Length-weight relationships were developed for commercially caught silver and bighead carp within
each reach as well as all reaches combined after log10-transforming weight and total length data.
Outliers within the data were identified and removed if they could not be rectified from original data
sheets and were not biologically reasonable. The slope and intercept parameters of the length-weight
relationships were then compared among reaches using an analysis of covariance (ANCOVA).
Mortality
The types of commercial gears used by commercial fishermen were varied and generally not reported.
Examination of the catch data appeared to show gear selectivity towards larger individuals. Because the
statistical models used to estimate mortality assume the sampling gear adequately represents the
standing length distribution of the population, an accurate estimate of mortality could not be developed
from commercially harvested Asian carp data (Miranda and Bettoli, 2007).
Indices of spawning condition
Commercially harvested Asian carp were collected before the spawning period. As such, we tested for
changes in gonadosomatic index (GSI) as a function of TL for female silver and bighead carp using a two-
dimensional Kolmogorov-Smirnov test (Garvey et al. 1998) to determine the size at which variation in
GSI increases such that the probability of having a higher GSI increases, which is indicative of the
potential size at maturation.
Sex ratio of Asian carp
Sex ratios of commercially harvested Asian carp were investigated within and among reaches. A chi-
squared goodness of fit analysis was conducted to determine whether overall sex ratios differed from
1:1, and a chi-squared test of independence tested whether the sex ratios differed spatially among
reaches. All statistical analyses were conducted using SAS 9.2. (SAS Institute 2009).
RESULTS AND DISCUSSION:
The initial goal of harvesting 1 million pounds of Asian carp to be processed into fish meal was quickly
surpassed, and by the completion of this component, nearly 3 million pounds of Asian carp were
removed and processed. Between 25 January 2012 and 11 June 2012, commercial fishermen harvested
1,776,656 pounds of Asian carp from the Alton reach, 493,636 pounds from the La Grange reach, and
609,708 pounds from the Peoria reach, for a total of 2.88 million pounds (Figure 1).
Researchers from CFAAS weighed and measured 2,778 Asian carp (1,761 silver and 1,017 bighead). Of
these fish, 662 were sexed, and GSI's were calculated for 298 fish. Post cleithra were removed and aged
from 292 fish (133 silvers, 159 bighead).
Mean length-at-age

45
Mean length-at-age for silver carp harvested by commercial fishermen differed significantly among
reaches for most age classes (P < 0.05; Figure 3.2). Mean length-at-age was significantly higher than all
other reaches for fish harvested from the Peoria reach for age classes 2.5, 3.5, and 4.5. In age classes
5.5, 6.5, and 7.5, mean length-at-age tended to be highest in the Alton reach. Mean length-at-age was
actually quite homogenous for fish harvested from the Peoria reach, ranging from 613-694 mm TL
across all sampled age classes, indicating a bias in commercial gears towards larger fish.
Comparisons of mean length-at-age from commercially harvested silver carp and those collected from
electrofishing in 2012 further demonstrated the size selectivity of commercial gears. Commercially
harvested fish had significantly greater mean lengths-at-age compared to silver carp collected with
electrofishing for all age classes and reaches (P < 0.05) except for age-6.5 in the Peoria and La Grange
reaches, where although mean TL was larger in commercially caught fish, it was not significant (Figure
3).
Due to low sample sizes of bighead carp collected during standardized sampling, we did not compare
their mean length-at-age to commercially caught bighead carp. Comparisons of mean length-at-age of
commercially harvested bighead carp among reaches showed harvested bighead carp tended to have
greater mean TL from the Alton pool up to age 7.5,with no differences among reaches observed after
age 7.5 (Figure 3.4).
Age and length frequency of harvested Asian carp
Over 25% of commercially harvested silver carp were age 5.5 and older, compared to just over 7% of
silver carp collected during standardized electrofishing (Figure 3.5). The length frequency histogram
comparing commercial harvest to standardized sampling shows a bimodal distribution of commercially
caught silver and bighead carp for most reaches and for all reaches combined (Figure 3.6). This suggests
that not only are commercial fishermen harvesting more larger, older fish, compared to our
standardized sampling, but they are also harvesting the largest fish within younger age classes. This is
supported by the lack of a bimodal distribution in the age-frequency histogram of commercially
harvested fish (Figure 3.5).
These data indicate that commercial fishermen are successfully removing larger and older individuals
from the population. While standardized sampling does not collect as many of these larger fish, the
length-frequency histograms developed from that sampling are likely a better representation of the
population size-structure as a whole. Continued monitoring of the age and length-frequency of
commercially harvested fish and continued standardized sampling in the IL River will further help us to
determine the efficacy of electrofishing as a tool for estimating size structure of Asian carp populations,
and the efficacy of commercial fishing in controlling the Asian carp population as a whole. Commercial
harvest modeling has suggested that in order to deplete Asian carp populations in the IL River, all age
classes must be targeted for removal (Tsehaye et al. 2013). Currently, it does not appear that
commercial removal of smaller Asian carp is occurring.
Length-weight relationships

46
Analysis of covariance indicated that the intercept and slope of the length-weight relationships were
significantly different among reaches for commercially caught silver carp (slope: F2, 1752 = 90.76; P <
0.0001; intercept: F2, 1752 = 90.74; P < 0.0001), and bighead carp (slope: F2, 1006 = 0.077; P < 0.0001;
intercept: F2, 1006 = 0.078; P < 0.0001; Table 1). Specifically, silver carp length-weight relationship
parameters were different among all reaches (P < 0.05), with smaller TL silver carp in the Alton and
Peoria reaches being generally heavier than those in the La Grange reach, and longer TL silver carp being
heaviest in the La Grange reach, and least heavy in the Alton reach. These same differences in length-
weight relationships by reach were also observed in the 2012 standardized sampling data (Garvey et al.
2013). Bighead carp length-weight relationship parameters differed among Alton and Peoria reaches,
but not between Alton and La Grange, or between La Grange and Peoria. Specifically, smaller TL
bighead carp tended to be heavier in the Peoria reach compared to the Alton reach, while larger TL
bighead carp were heavier in the Alton reach compared to the Peoria reach (Table 1). Comparisons of
bighead carp length-weight trends in commercial catches to standardized sampling was not attempted
due to low sample size. Future research may want to investigate habitat or forage differences among
reaches that may better explain the observed differences in fitness between different size classes of
silver and bighead carp among reaches
Indices of spawning condition
The size at which variation in commercially harvested female silver carp GSI increased, such that the
probability of having a higher GSI increased, was 506-mm TL for the Alton reach (P = 0.026), and was
indicative of the size at maturity. Based on our age-length key, these estimates correspond to an age-at-
maturity between age 3 and 4. For the Peoria and La Grange reaches, female silver carp variation in GSI
was statistically homogenous across TL (P = 0.09; 0.671) respectively. This could be an artifact of low
sample size and a lack of GSI values for multiple size classes of fish (in the Peoria reach, GSI values were
only available for female silver carp >700 mm TL). Mean GSI of commercially harvested female silver
carp ranged from 0.016 (SE = 0.0033) to 0.022 (SE = 0.0054) among reaches (Table 3.2). Mean GSI for
female silver carp from 2012 standardized sampling ranged from 0.0017 (SE = 0.0028) to 0.0064 among
reaches. These fish were collected post-spawn, which is reflected in their lower GSI values. However,
the estimated size at maturity for commercially caught silver carp, pre-spawn, was comparable to the
estimates made for fish collected during standardized sampling, post-spawn (Garvey et al. 2013).
The size at which variation in female bighead carp GSI increased, such that the probability of having a
higher GSI increased, was 674-mm TL for the Alton reach (P = 0.002), and 636-mm TL for the La Grange
reach (P = 0.001) and was indicative of the size at maturity. Based on our age-length key, these
estimates correspond to an age-at-maturity between age 3 and 4. For the Alton reach, female bighead
carp variation in GSI was statistically homogenous across TL (P = 0.209) potentially due to small sample
size (N = 15) and lack of small, immature individuals in which we would expect to see low GSI values with
low variation. Mean GSI for female bighead carp ranged from 0.0142 (SE = 0.0042) to 0.0149 (SE =
0.0049) among reaches (Table 3.5). Standardized sampling activities have not historically collected
enough female bighead carp to make comparisons of GSI to the commercial catch.

47
Future efforts should include increasing our sample size and our confidence in these values. Continued
monitoring of GSI in Asian carp populations in the Illinois River will be important in determining trends in
reproductive success.
Sex ratio of Asian carp
Sex ratios were not significantly different from 1:1 for commercially harvested silver carp when all
reaches were combined (217 females, 236 males; = 0.80; P = 0.398) but did differ from 1:1 when
reaches were treated separately ( = 12.68; P = 0.002). Specifically, the Alton and La Grange
commercial catches were composed of roughly 55% males and 45% females, whereas the Peoria reach
was 63% male and 37% female for a 1.73:1 ratio.
Sex ratios of commercially harvested bighead carp also did not differ from 1:1 when all reaches were
combined (95 females, 114 males; =1.727; P = 0.213). Bighead carp sex ratios did not significantly
differ from 1:1 among reaches ( = 4.67; P = 0.099) although there tended to be more females
harvested in the Alton reach, and more males harvested in the La Grange and Peoria reaches. Given the
tendency for commercial gears to harvest larger fish, it was counter to our expectations that commercial
catches did not harvest proportionately more females, particularly larger females from younger age
classes. It will be important to continue monitoring sex ratios in the future to make inferences about
the potential intrinsic rate of increase of Asian carp abundance.
Catch per unit effort pre- and post-harvest
We observed a 33% reduction in silver carp electrofishing CPUE for the three lower reaches of the
Illinois River combined, from 151.9 fish/hour (SE = 19.7) in summer 2011 (before harvest component 2)
to 102.1 fish/hour (SE = 22.8) in summer 2012, after the harvest component (P = 0.0027; Figure 3.7). By
reach, silver carp mean CPUE was significantly reduced from 2011 to 2012 in the Alton reach by more
than half (P = 0.0007), but was not different between years for the La Grange reach (P = 0.07) or the
Peoria reach (P = 0.59) despite a trend of lower CPUE in both of these reaches. The reduction in CPUE
may indicate that commercial removals are lowering silver carp abundance in the Illinois River. Reduced
abundance of silver carp may also be related to water level fluctuations in the Illinois River over the last
two years. Specifically, the summer of 2011 was characterized by above-average precipitation and high
water levels. In contrast, 2012 was an abnormally dry year, and water levels on the Illinois River were
significantly lower, which could have triggered an emigration of silver carp out of the system.
Electrofishing CPUE for bighead carp was not different from 2011 to 2012 for the lower three reaches of
the Illinois River combined or among reaches (P > 0.28). Despite the lack of statistical difference
between years, overall bighead carp CPUE was reduced from 2.9 fish/hr in 2011 to 0.3 fish/hr in 2012
among all reaches. The relatively low abundance of bighead carp along with the variability in catch
rates, to some extent due to our inefficiency at capturing bighead carp, is likely the reason for not
detecting differences in CPUE between years. Specifically, of the 2.88 million lbs. of Asian carp
harvested in the three lower reaches of the Illinois River in Spring 2012 for conversion to fish meal, 45%
was composed of bighead carp. As such, we would have expected strong declines in relative abundance

48
of bighead carp. Additional analyses regarding total catches from commercial fishermen brought to
processing plants, and continued monitoring by our standardized sampling program may provide a
better indication of whether declines in bighead carp and silver carp abundance are occurring, or will
continue to occur.
DISCUSSION POINTS
While a limited number of commercial fishermen reported using seines, which would harvest all sizes of
Asian carp, the majority of fishermen used gill or trammel nets to target larger fish (personal
communication). This selectivity for larger fish was apparent when comparing age frequencies, length
frequencies, and mean length at age of commercially caught Asian carp to those caught by electrofishing
during standardized sampling. Standardized sampling is limited in its ability to collect as many large fish
as commercial gears, but the data that is collected is likely more representative of the population as a
whole. Additional monitoring may be necessary to determine whether larger fish in the population are
underrepresented in our standardized sampling regimen, and to investigate whether the lack of strong
recruitment in recent years could also have facilitated some of our observed results. Continued
population and harvest monitoring will help us to determine what compensatory responses Asian carp
populations may experience as a result of ongoing fishing pressures.
REFERENCES CITED
Allan J. D., R. Abell, Z. Hogan, C. Revenga, B. W. Taylor, R. L. Welcomme, and K. Winemiller. 2005.
Overfishing of Inland Waters. Bioscience 55(12): 1041-1051.
Bettoli, P.W., J. A. Kerns, and G. D. Scholten. 2009. Status of paddlefish in the United States. Pages 23-
38 in Paukert C. P. and G. D. Scholten, ed. Paddlefish management, propagation, and
conservation in the 21st century: Building from 20 years of research and management.
American Fisheries Society, Symposium 66, Bethesda, Maryland.
Bowzer, J., J. Trushenski, and D. C. Glover. 2013. Potential of Asian carp from the Illinois River as a
source of raw materials for fish meal production. North American Journal of Aquaculture
75:404–415.
Chick, J. H. and M. A. Pegg. 2001. Invasive carp in the Mississippi River basin. Science 292: 2250-
2251.
Cooke, S. L., and W. R. Hill. 2010. Can filter-feeding Asian carp invade the Laurentian Great Lakes?
A bioenergetic modeling exercise. Freshwater Biology 56:2138-2152.
Garvey, J. D. Glover, M. Brey, G. Whitledge, and W. Bouska. 2013. Population status of Asian carp in the
Illinois River in 2012: Implications of harvest and other control strategies. Center for Fisheries,
Aquaculture and Aquatic Sciences, Southern Illinois University. IL DNR Annual Report.
Garvey, J.E., E.A. Marschall, and R.A. Wright. 1998. From star charts to stoneflies: detecting
relationships in continuous bivariate data. Ecology 79: 442-447.

49
Helfman, G., B. B. Collette, D. E. Facey, and B. W. Bowen. 2009. The Diversity of Fishes: Biology,
Evolution, and Ecology, 2nd Edition.
Hutchings, J. A., and R. A. Myers. 1994. What can be learned from the collapse of a renewable
resource? Atlantic cod, Gadus morhua, of Newfoundland and Labrador. Canadian Journal of
Fisheries and Aquatic Sciences 51(9): 2126-2146.
Irons, K. S., G. G. Sass, M. A. McClelland, and J. D. Stafford. 2007. Reduced condition factor of two
native fish species coincident with invasion of non-native Asian carps in the Illinois River, U.S.A.
Is this evidence for competition and reduced fitness? Journal of Fish Biology 71: 258-273.
Johal, M. S., H. R. Esmaeili, and K. K. Tandon. 2000. Postcleithrum of silver carp, Hypophthalmichthys
molitrix (Van. 1844), an authentic indicator for age determination. Current Science 79: 945-946.
Kolar, C. S., and D. M. Lodge. 2002. Ecological predictions and risk assessment for alien fishes in
North America. Science 298:1233-1236.
Miranda, L. E., and P. W. Bettoli. 2007. Mortality. Pages 229-278 in C. S. Guy and M. L. Brown, editors.
Analysis and interpretation of freshwater fisheries data. American Fisheries Society, Bethesda,
Maryland.
Quinn, J. W. 2009. Harvest of Paddlefish in North America. Pages 203-221 in Paukert, C. P. and G. D.
Scholten, ed. Paddlefish management, propagation, and conservation in the 21st century:
Building from 20 years of research and management. American Fisheries Society, Symposium
66, Bethesda, Maryland.
Rasmussen, J. L., H. A. Regier, R. E. Sparks, and W. W. Taylor. 2011. Dividing the waters: The case for
hydrologic separation of the North American Great Lakes and Mississippi River Basins. Journal
of Great Lakes Research 37(3): 588-592.
Schrank, S. J., C. S. Guy, and J. F. Fairchild. 2003. Competitive interactions between Age-0 bighead carp
and paddlefish. Transactions of the American Fisheries Society 132: 1222-1228.
Tsehaye, I., M. Catalano, G. Sass, D. Glover, and B. Roth. 2013. Prospects for fishery-induced collapse of
invasive Asian carp in the Illinois River. Fisheries 38(10):445-454.
Tucker, J. K., F. A. Cronin, R. A. Hrabik, M. D. Petersen, and D. P. Herzog. 1996. The bighead carp
(Hypophthalmichthys nobilis) in the Mississippi River. Journal of Freshwater Ecology 11(2): 241-
243.
Worm B., R. Hilborn, J. K. Baum, T. A. Branch, J. S. Collie, C. Costello, M. J. Fogarty, E. A. Fulton, J. A.
Hutchings, S. Jennings, O. P. Jensen, H. K. Lotze, P. M. Mace, T. R. McClanahan, C. Minto, S. R.
Palumbi, A. M. Parma, D. Ricard, A. A. Rosenberg, R. Watson, and D. Zeller. 2009. Rebuilding
global fisheries. Science 325: 578-585.

50
Table 3.1. Parameter values from the length-weight relationships (log10mass = a' + b · log10TL) for
commercially caught silver carp and bighead carp from the lower three reaches of the Illinois River,
2012. Parameter estimates with different letters indicate significantly different values among reaches at
the α = 0.05 level, as determined by ANCOVA.
Reach a' SE b SE R2 P N
Silver carp
Alton -4.552a 0.101 2.845a 0.036 0.91 <0.0001 646
La Grange -5.806b 0.074 3.294b 0.027 0.96 <0.0001 580
La Grange* -5.294 - 3.122 - - <0.001 1,451
Peoria -3.237c 0.173 2.374c 0.061 0.74 <0.0001 526
Bighead carp
Alton -4.123a 0.104 2.688a 0.036 0.94 <0.0001 338
La Grange -4.723ab 0.074 2.889ab 0.026 0.97 <0.0001 382
La Grange* -4.838 - 2.952 - - <0.001 73
Peoria -3.878b 0.164 2.592b 0.057 0.88 <0.0001 286
* Results from Irons et al. (2007) for comparison purposes to data collected from the La Grange reach
from 1990-2006.

51
Table 3.2. Mean gonadosomatic index (GSI) for commercially harvested bighead carp and silver carp by
reach and sex in the Illinois River, 2012.
Species Sex N Mean GSI SE
Alton
Bighead carp F 32 0.0148 0.0034
Bighead carp M 30 0.0019 0.0003
Silver carp F 38 0.0160 0.0033
Silver carp M 23 0.0042 0.0018
La Grange
Bighead carp F 20 0.0142 0.0042
Bighead carp M 36 0.0019 0.0003
Silver carp F 26 0.0165 0.0042
Silver carp M 20 0.0042 0.0019
Peoria
Bighead carp F 15 0.0149 0.0049
Bighead carp M 26 0.0019 0.0003
Silver carp F 7 0.0220 0.0054
Silver carp M 24 0.0043 0.0018

52
Alton
Y D
ata
La Grange
Month
Feb Mar Apr May Jun
Asia
n C
arp
Sh
ipp
ed
by B
ig R
iver
Pro
cesso
r (1
,000 l
bs.)
0
100
200
300
400
500
600
700Peoria
Feb Mar Apr May Jun
0
500
1000
1500
2000
2500
3000
3500
Illinois River
Figure 3.1. Cumulative commercial harvest of Asian carp for fish meal production by reach and month,
IL River, 2012.

53
Age
2.5 3.5 4.5 5.5 6.5 7.5 8.5
Me
an
To
tal L
en
gth
(m
m)
0
200
400
600
800
1000Alton
La Grange
Peoria
A BB B
BB
B
A
C CC
CB
AA A A
A A AC
Figure 3.2. Mean length-at-age with associated standard error for commercially caught silver carp in the
three lower reaches of the Illinois River; different letters indicate significantly different mean total
lengths among reaches (P ≤ 0.05), as determined by a two-way ANOVA.

54
Alto
n
Me
an
TL
(m
m)
0
200
400
600
800
1000Big River Processor
Standardized Sampling 2012
La
Gra
ng
e
0
200
400
600
800
Pe
oria
Age
2.5 3.5 4.5 5.5 6.5 7.5 8.5
0
200
400
600
800
*
*
Figure 3.3. Mean length-at-age and associated standard error of commercially harvested silver carp, and
silver carp collected by electrofishing during standardized sampling, IL River, 2012; Asterisk denotes a
nonsignificant difference in mean total length (P ≤ 0.05), as determined by a two-way ANOVA.

55
Age
2.5 3.5 4.5 5.5 6.5 7.5 8.5 9.5 10.5 11.5
Mean
To
tal L
en
gth
(m
m)
0
200
400
600
800
1000
1200
1400
Alton
La Grange
Peoria
AB C
A A
A AA
A
AA
A
A A A
AA
A
B C
B B B C BA
Figure 3.4. Mean length-at-age with associated standard error for commercially caught bighead carp in
the three lower reaches of the Illinois River; different letters indicate significantly different mean total
lengths among reaches (P ≤ 0.05), as determined by a two-way ANOVA.

56
Silver Carp
0
20
40
60
80
100
Big River N = 1,759
Standardized N = 1,093
Bighead Carp
Big River N = 1,015
Standardized N = 20
0
20
40
60
80
Big River N = 650
Standardized N = 145
Big River N = 341
Standardized N = 1
0
20
40
60
80
Big River N = 583
Standardized N = 417
Big River N = 388
Standardized N = 4
1.5 2.5 3.5 4.5 5.5 6.5 7.5 8.5
Pro
po
rtio
n o
f N
0
20
40
60
80
Big River N = 526
Standardized N = 531
Age
1.5 2.5 3.5 4.5 5.5 6.5 7.5 8.5 9.5 10.5 11.5 12.5
Big River N =286
Standardized N = 15
Illino
is R
iver
Alto
n R
each
La G
ran
ge R
each
Peo
ria R
each
Figure 3.5: Age frequency of commercially harvested silver and bighead carp compared to carp
collected during standardized sampling, IL River, 2012.

57
Silver CarpP
erc
en
t o
f N
0
10
20
30
40
50
60
Big River N = 1,761
Standardized N = 1,093
Bighead Carp
Big River N = 1,016
Standardized N = 21
0
10
20
30
40
50
Big River N = 650
Standardized N = 145
Big River N = 341
Standardized N = 2
0
10
20
30
40
50
Big River N = 583
Standardized N = 417
Big River N = 388
Standardized N = 4
326-3
50
351-3
75
376-4
00
401-4
25
426-4
50
451-4
75
476-5
00
501-5
25
526-5
50
551-5
75
576-6
00
601-6
25
626-6
50
651-6
75
676-7
00
701-7
25
726-7
50
751-7
75
776-8
00
801-8
25
826-8
50
851-8
75
876-9
00
901-9
25
926-9
50
951-9
75
976-1
000
1001-1
025
1026-1
050
1051-1
075
1076-1
100
1101-1
125
1126-1
150
1151-1
175
1176-1
200
0
10
20
30
40
50
Big River N = 528
Standardized N = 531
Total Length Category (mm)
326-3
50
351-3
75
376-4
00
401-4
25
426-4
50
451-4
75
476-5
00
501-5
25
526-5
50
551-5
75
576-6
00
601-6
25
626-6
50
651-6
75
676-7
00
701-7
25
726-7
50
751-7
75
776-8
00
801-8
25
826-8
50
851-8
75
876-9
00
901-9
25
926-9
50
951-9
75
976-1
000
1001-1
025
1026-1
050
1051-1
075
1076-1
100
1101-1
125
1126-1
150
1151-1
175
1176-1
200
Big River N = 287
Standardized N = 15
Illino
is R
ive
rA
lton
Re
ac
hL
a G
ran
ge
Re
ac
hP
eo
ria R
ea
ch
Figure 3.6: Length frequency of commercially harvested silver and bighead carp compared to carp
collected during standardized sampling, IL River, 2012.
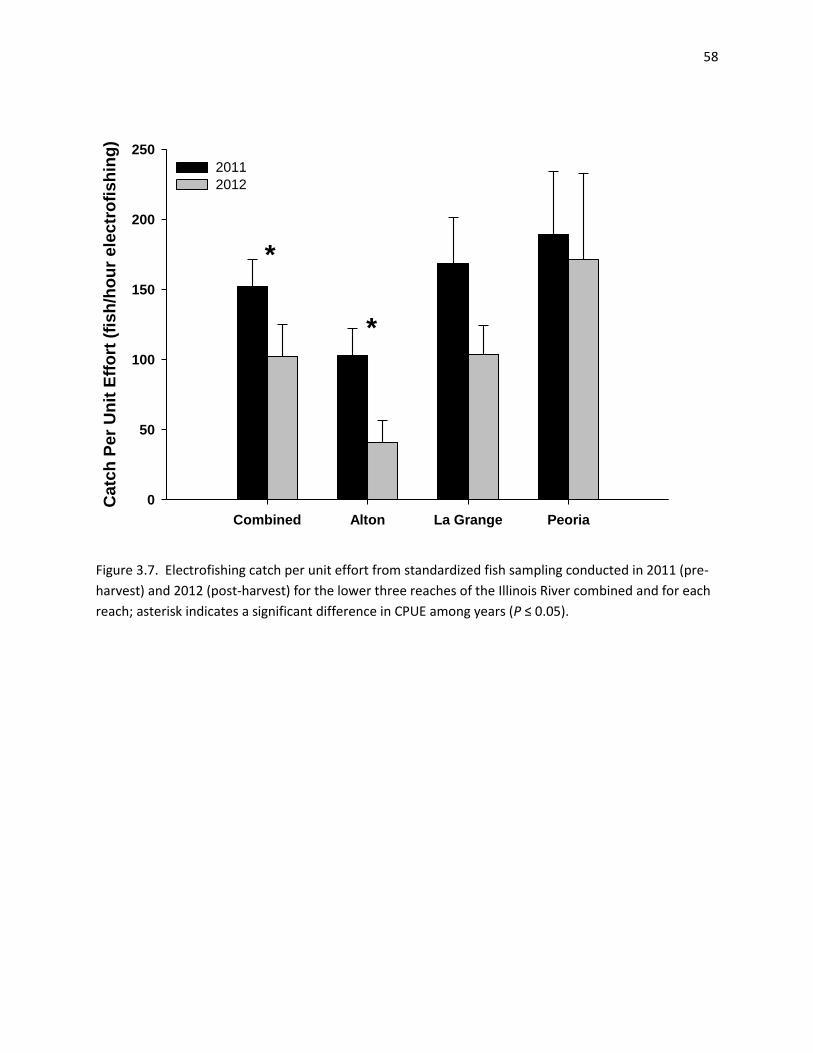
58
Combined Alton La Grange Peoria
Ca
tch
Pe
r U
nit
Eff
ort
(fi
sh
/ho
ur
ele
ctr
ofi
sh
ing
)
0
50
100
150
200
250
2011
2012
*
*
Figure 3.7. Electrofishing catch per unit effort from standardized fish sampling conducted in 2011 (pre-
harvest) and 2012 (post-harvest) for the lower three reaches of the Illinois River combined and for each
reach; asterisk indicates a significant difference in CPUE among years (P ≤ 0.05).

59
CHAPTER 4
Evaluating the Efficiency of Harvest
Introduction: Harvest efforts in the upstream portions of the Illinois River, initiated in 2011, have
continued to be part of an integrated control strategy for reducing the risk of Asian carp from gaining
access to the Great Lakes. In 2011, Illinois Department of Natural Resources (IDNR)-contracted
commercial harvest resulted in the removal of 351.6 tons of Asian carp from the Dresden, Starved Rock,
and Marseilles reaches, eliminating the possibility that those fish will progress any further upstream
toward the Chicago Area Waterway System (CAWS). In 2012, the number of Asian carp harvested
dropped to 284.53 tons, even though fishing effort was similar.
In addition to declines in harvest, three separate hydroacoustic surveys, conducted by Southern Illinois
University Carbondale (SIUC) in 2011, indicated a rapid decline in total fish abundance from 300,250 to
198,090 fish in the Hanson Material Service Corporation (HMSC) east pit. These pits are located on the
Marseilles reach near Morris, IL and are fished as part of the Barrier Defense Asian carp Removal
project. The declines in abundance were consistent with a reduction in CPE observed in that area, yet
harvest alone could not account for the decline in total fish abundance. In this study, we sought to
better understand how other factors, such as emigration from the study area, could help explain Asian
carp population dynamics in these upstream areas.
In 2013, we built on the information gained in 2011 and 2012 and continued to monitor the efficiency of
upstream harvest of Asian carp in the upper reaches, but most closely in the HMSC backwater of the
Marseilles Reach. This information is important for determining the efficacy of harvest in these upper
reaches of the Illinois River, defining the role of immigration from the lower river to the upper reaches,
and ultimately reducing propagule pressure of Asian carp on the Great Lakes.
Methods and Materials: SIUC initiated a mark-recapture study (320 Asian carp were tagged) in spring
2012 within the HMSC east and west pits to estimate population size, movement patterns, and
exploitation rates for Asian carp. In 2013, another mark-recapture study was initiated to bolster mark-
recapture information from 2012. With the assistance of IDNR contracted commercial fishermen, an
additional 276 fish (92 bighead carp, 148 silver carp, and 36 hybrid Asian carp) were captured with gill
nets and tagged in the HMSC east pits on 7 April 2013. Using the same protocol as in 2012, fish were
weighed (nearest g), TL measured (nearest mm), tagged with individually numbered reward jaw tags
(aluminum, size 1242-9C, National Band and Tag Co.), and released at the site of capture. To better
estimate exploitation, survival, and immigration to the upper reaches of the Illinois River, SIUC also
initiated a mark-recapture study in the Starved Rock pool in 2013. On 8 May 2013, 263 Asian carp (43
bighead carp, 211 silver carp, and 9 hybrid Asian carp) were jaw tagged in the Sheehan Island backwater
of the Starved Rock pool (near Buffalo Rock) following the same protocol used in the Marseilles
backwater. Recoveries of tagged fish from both areas were recorded from contracted commercial
fishermen throughout the Barrier Defense Asian Carp Removal Project. Fliers were provided to IDNR
personnel, contracted commercial fishermen, bow fishing groups, and fish processing plants to increase

60
awareness of the mark-recapture study and to provide reporting instructions. The jaw tag number,
“REWARD,” and contact information for SIUC were clearly marked on each jaw tag.
A Link-Barker Jolly-Seber mark-recapture model (Link and Barker 2005) for open populations was
employed in Program MARK® to calculate an overall survival rate (φ), capture probability (p), and
immigration rate (f) for all available commercial fishing periods (30 April 2012 – 17 November 2013) as
well as weekly estimates of survival, exploitation, rate of population change, and immigration for 2012
and 2013 independently. For annual mark-recapture models, φ, p, and f were allowed to vary
temporally (between sampling periods). For the combined 2012-2013 model, φ, p, and f were held
constant to decrease the parameters in the model and increase precision of the estimates.
Immigration and emigration rates throughout the Illinois River, as well as movement between the east
and west gravel pits of the HMSC backwater, are also being estimated with acoustic telemetry. To date,
with assistance from IDNR-contracted commercial fishermen and Illinois Natural History Survey (INHS),
691 acoustic transmitters have been implanted in Asian carp in the Illinois River or Pool 26 of the
Mississippi River. In addition to the 354 fish that were tagged in 2012, 337 Asian carp were tagged with
Vemco® acoustic transmitters (v16, v13, v9, or v6 transmitting at 69 KHz) in the Illinois River in 2013
(Table 1). A total of thirty-six fish were tagged in the Dresden Island pool, with10 fish being released in
Rock Run Rookery and 28 released near the confluence with the Kankakee River. In the Marseilles pool,
96 fish were tagged with transmitters; 56 were released in the main channel at the Morris boat ramp,
and 38 were released in the HMS pits (21 in the west pit, 17 in the east pit). In the Starved Rock pool, 54
fish were tagged and released at the Starved Rock Marina. To determine the amount of movement
between pools in the lower Illinois River and Upper Illinois River, additional fish were tagged in the
Peoria (51 fish near Lacon, IL), La Grange (54 fish near Havana, IL) and the Alton pools (46 fish near
Hardin, IL).
A network of 30 Vemco® VR2W receivers was deployed in the Illinois River by SIUC in 2012 to monitor
movement of acoustically tagged Asian carp (Alton = 9, LaGrange = 7, Peoria = 6, Starved Rock = 4, and
Marseilles = 4). This network has been continuously monitored and VR2Ws downloaded every 2-4
months to record fish detections. Receivers have been placed in and around each lock chamber and
near major tributaries to track large-scale movements within and among reaches, though three
receivers were specifically placed within the HMSC gravel pits to better understand the factors affecting
Asian carp immigration and emigration within this area (Figure 4.1). All fish with acoustic transmitters
were also tagged with individually numbered $50 reward jaw tags (aluminum, size 1242-9C, National
Band and Tag Co.) to provide incentives to fishermen not contracted by the IDNR to return transmitters.
IDNR-contracted fishermen have been instructed to return healthy fish back to the water as soon after
capture as possible. Temperature loggers (HOBO Pendant® model UA-002-64) were deployed with all
receivers to examine how this may influence movement of Asian carp. Please see Chapter 3 for more
details concerning acoustic telemetry.
Results and Discussion:
Harvest

61
IDNR contracted commercial fishermen harvested a total of 16,025 Asian carp (6,756 bighead carp,
9,223 silver carp, 46 grass carp) from the east and west pits of the HMSC during the 2013 Barrier
Defense Asian Carp Removal Project. This was slightly fewer fish (~14%) than the total number
harvested in 2012 (18,712 bighead and silver carp). Although fewer fish were removed from the HMSC
pits in 2013 there was no significant difference (ANOVA; P < 0.001) in commercial fishing effort (catch
per effort; CPE (fish/1000 yards of gill net)) between 2012 (61.4 + 0.4 fish/1000 yards) and 2013 (52.7 +
0.4 fish/1000 yards), suggesting that Asian carp numbers have declined or are declining in this
backwater. Average CPE for 2013 in the Starved Rock pool (277.3 + 28.9 fish/1000 yards) was
significantly greater (ANOVA; P<0.001) than for either year in the HMSC pits.
Mark-recapture
Of the 320 Asian carp externally tagged in the HMSC gravel pits in 2012, a total of 156 marked
individuals were harvested (49%) during 2012. By December of 2013, only 11 additional carp from this
tagging cohort were harvested (total of 167 carp, 52.2%). To date, 71 out of 276 fish (25.6%) from the
2013 tagging cohort have been harvested. This is a significantly smaller proportion of the tagged
population than was recaptured during the 2012 mark-recapture study. Assuming that natural mortality
has been constant, this suggests that fish have either moved out of areas where commercial fishing is
taking place (but still within the backwater) or that they have moved out of the HMSC pits entirely. Not
surprisingly, a much lower recapture rate was observed for fish tagged in Starved Rock pool. Not
including three fish that were harvested by bow fishermen, 32 of the 263 fish tagged (~12.2%) were
harvested by commercial fishermen over a 30-week period (5 May 2013 – 7 December 2013).
Only two individuals (tagged in the HMSC pits) were recaptured outside of the backwater where they
were tagged. One was captured in nearby Peacock Slough and another in Sheehan Island in the Starved
Rock Pool. This number is similar to the number of jaw tagged fish detected outside of their tagging
location in 2012 (three fish), suggesting that emigration rates of Asian carp (outside their original pool)
were very low, which increased their susceptibility to harvest. Acoustically telemetered fish, however,
indicated that movement in and out of this area is relatively high with 57% of fish tagged in the HMSC
pits moving out at some point in 2012. Data are still being processed for August – December 2013;
however, when telemetry data are combined with estimated immigration rates from 2012 and 2013
(through 14 August 2013), a positive correlation exists (R = 0.57) between the number of fish moving
into the HMSC pits and the estimated mark-recapture immigration rate. Combining these data suggests
that Asian carp are residents in the backwater, make short forays into the main channel, but eventually
may return to this backwater, and that additional immigration may be occurring more frequently than
just the spring and fall movement periods. Further analyses should be conducted to test the significance
of this relationship.
Excluding the three Asian carp that were caught outside of the HMSC backwater in 2012 and 2013 and
the 15 that were recaptured during the USGS water gun experiments in this area, the estimated
exploitation rate for this backwater area for the 2012 commercial fishing period (30 weeks; 7 May 2012
– 3 December 2012) was 0.89 (95% CI = 0.86 -0.91) for non-immigrants (i.e., the fish present at the
beginning of the mark-recapture study). Immigration rates during this time period were very low (close

62
to zero), likely contributing to the high exploitation rate. In 2013 the estimated immigration rate rose to
0.22 individuals per individual in the population (Table 4.1), contributing to a much lower exploitation
rate. It should be noted that although this rate is lower, a 0.38 exploitation rate is still respectable for
the goal of carp removal in this backwater. When data from 2012 and 2013 were combined, the
estimated exploitation rate was 0.55. In addition, in 2012 and 2013, CPE of Asian carp declined at a
slower rate than the proportion of marked individuals (Figures 4.2a and 4.2c), suggesting that
immigration into this backwater increased at a faster rate than those removed through harvest. In fact
immigration estimates from Link-Barker mark-recapture models indicated that immigration into the
HMSC pits was cyclic (Figure 4.2b, Figure 4.3d), with more immigration occurring during spring and early
summer in 2012 and 2013 (Figure 4.2b, Figure 4.3d)
Estimates from Link-Barker mark-recapture models indicated that the rate of population change was
greater than one for half of the sampling periods. It is likely that pulses of commercial harvest allowed
the population growth rate to dip below one for periods of time throughout the year. It appears that
early spring and fall are two time periods when harvest was able to outpace the lower immigration rates
(Figure 3). Harvest may be particularly necessary during these time periods to keep population rate of
change below one. In annual mark-recapture models the rate of population change decreased from
increased from 2012 to 2013, exhibiting a downward trend (Figure 4.2b), suggesting that fish were still
being removed faster than they immigrated. However, more immigration in 2013, as indicated by mark-
recapture estimates and telemetry data, may have kept the population growth rate greater than one for
periods in July and October. This suggests that continued harvest throughout the year may be necessary
to keep Asian carp populations at bay, and increased harvest during the fall and spring may allow
commercial fishermen to more significantly lower carp numbers.
Because confidence intervals were extremely wide for annual mark-recapture models where capture
probability (p), immigration (f), and survival probability (φ) varied with time, these variables were held
constant and one estimate of p,f, and φ were calculated for each year (Table 4.2). The rate of
population change was still estimated for each sample period (Figure 3b). Exploitation rate decreased to
0.38 in 2013 from 0.89 in 2012, signifying that any fish present at the beginning of the study (in 2013)
had a 38% chance of mortality (if they did not emigrate) if they remained in the HMSC backwater. Thus,
commercial fishing seems largly effective, especially against resident fish in the backwaters. However,
estimates of immigration rate increased in 2013 to 0.08 fish per fish in the population per week, from
nearly zero in 2012. This may be a function of the high water and increased flow in 2013, attracting fish
into the backwaters.
Telemetry
Continued analysis of telemetry data indicates that movement into and out of the HMSC pits from the
Marseilles main channel, and from the east pit to the west pit, is high and likely correlates with river
discharge and temperature (during spawning periods; Figure 4.5). However, movement in the reverse
direction, between the HMSC west to the east west pits was relatively low. Of the 22 fish that were
tagged with acoustic transmitters in the HMSC west pit in 2013, 4 (~18%) were detected in the east pit,

63
but 22 fish that were tagged outside the west pit (either in the Marseilles main channel, in the east pit,
or in another pool) were detected in the west pit.
Asian carp movement into and out of the HMSC pits seems to correspond with changes in river
discharge (Figure 4.4). In the spring, movement increased starting in early march and continued until
early June, when river discharge increased. In the fall, Asian carp movement increased in early
September and ceased by December. Increased commercial fishing prior to and during times of peak
movement may target individuals emigrating out of or immigrating into the HMSC pits, thus targeting
transient fish.
Modelling Summit and Spatially Explicit Model: A spatially explicit model that incorporates movement
among reaches is currently underway. This model will help us better understand these population
dynamics and to determine how immigration and emigration affect these estimates. A modeling
summit was held in St. Louis in February 2013 to discuss modeling approaches. More information about
the model and the modeling summit can be found in Chapter 5.
Recommendations: Although overall return rate was exceptionally high for a mark-recapture study,
weekly estimates of exploitation and population rate of change had extremely high standard errors due
to a small proportion of tagged individuals in the population. Adding additional fish in 2013 helped
slightly, but we recommend putting more faith in the annual model estimates (i.e., estimates with very
tight 95% CI) than the weekly estimates. Using the trends we observed this year, an increase in the
number of tagged individuals is still warranted. Nearly 1000 fish should be tagged to yield more precise
weekly estimates of survival and population growth rate. In addition, instead of removing tagged
individuals from the population each week, it would be helpful for commercial fishermen to return all
tagged fish to the water. This should increase the number of fish available for capture each week, thus
decreasing the error in our models.
We also assumed that tag loss was negligible for these analyses and could therefore have affected these
results. We know that some fish that were tagged on the upper jaw early in the season had some tag
loss. We modified our tagging technique so that all fish are tagged, tightly, on the lower jaw. Given that
estimates of emigration appeared to be exceptionally high due to the declining proportions of marked
individuals harvested, determining tag loss is still needed.
Immigration, at least to the HMSC pits, seems to be the driving factor keeping the population growth
rate above one in this area. Estimates concerning the population rate of changed combined with
estimated immigration in 2013 suggest that harvest was unable to outpace immigration for most of
2013 (and 2012) even though CPE decreased as effort remained the same. This suggests that continued
harvest during all times of year is necessary, and additional harvest from source populations (i.e., lower
Illinois River) is encouraged, to limit the number of immigrants to the upper river and decrease
propagule pressure on the CAWS
Project Highlights:
64
Of the 320 Asian carp externally tagged in the HMSC backwater near Morris, IL in May 2012 a total of 167 (~52.2%) marked individuals were harvested through IDNR-contracted commercial fishing efforts by the end of December 2013. The majority these individuals (~47%) were harvested in 2012.
Estimates of the population rate of change in the Asian carp population in the HMSC pits using mark-recapture models still indicate a declining population, suggesting commercial fishing is effective at the current population size.
Emigration of Asian carp from the HMSC backwater appeared low in 2012, but was much higher in 2013. Thirty-two of the 39 fish (82%) that were tagged with acoustic transmitters in 2013 left the HMSC backwater at some point, possibly decreasing susceptibility to harvest in 2013.
Of the 22 fish that were tagged with acoustic transmitters in the HMSC west pit in 2013, 4 (~18%) were detected in the east pit during 2013. Only one fish tagged in the east pit moved to the west pit, but 22 fish that were tagged outside the west pit (either in the Marseilles main channel, in the east pit, or in another pool) were detected in the west pit.
The estimated exploitation rate for this backwater area was 100% over an 82-week period for non-immigrants (i.e., the fish present at the beginning of the mark-recapture study in 2013 and 89% in 2012, suggesting that commercial fishing is effective at the current population size.
Estimates concerning the population rate of changed combined with estimated immigration in
2013 suggest that harvest was unable to outpace immigration for most of 2013 (and 2012). This
suggests that continued harvest during all times of year is necessary and additional harvest from
source populations (i.e., lower Illinois River) is encouraged to limit the number of immigrants to
the upper river and decrease propagule pressure on the CAWS.

65
References
Link, W. A. and R. J. Barker. 2005. Modeling association among demographic parameters in analysis of
open population capture-recapture data. Biometrics 61(1): 46-54.

66
Figure 4.1. Map of Hanson Material Services Corporation backwater near Morris, IL indicating locations of VR2 receivers to quantify movement
in/out of this backwater and between the west and east pits.
Illinois River
East Pit
West Pit

67
Table 4.1. Link-Barker mark-recapture estimates and 95% confidence intervals (95% CI) of weekly
exploitation rate (1-φ) and immigration rate (f) for the HMSC pits in 2012 and 2013, run on an annual
basis (30 weeks; φ(.)p(.)f(.)) for each year (reported as weekly rates), for the HMSC pits with both years
combined (82 weeks).
Estimate 95% CI Estimate 95% CI Estimate 95% CI
Exploitation rate 0.89 0.86 - 0.91 0.38 0.27- 0.52 0.55 0.555 -0.557
HMSC 2013HMSC 2012 HMSC 2012-2013 combined
Immigration rate 0.22 0.23 - 0.273.4 x 10-9
1.4 x 10⁻¹³
-
9.4 x 10⁻⁷
7.9 x 10-64 0.154-0.181
Table 4. 2. Number of bighead and silver carp tagged with acoustic transmitters per pool or backwater
of the Illinois River in 2012 and 2013.
2012
Bighead
carp
Silver
carp Total
Pool 26 19 129 148
Dresden 8 5 13
Marseilles 33 1 34
Starved Rock 56 103 159
Total 116 238 354
2013
Bighead
carp
Silver
carp Total
Rock Run Rookery 10 10
Dresden 26 2 28
Marseilles 2 54 56
HMSC Pits 19 19 38
Starved Rock 8 46 54
Peoria 6 45 51
La Grange 21 33 54
Alton 13 33 46
Total 105 232 337

68
May Jun Jul Aug Sep Oct Nov Dec
Pro
po
rtio
n o
f ta
gg
ed
fis
h h
arv
es
ted
0.00
0.02
0.04
0.06
0.08
0.10
May Jun Jul Aug Sep Oct Nov Dec
Ra
te o
f p
op
ula
tio
n c
ha
ng
e (
0
2
4
6
8
Date (2013)
May Jun Jul Aug Sep Oct Nov Dec
CP
E (
N/1
00
0 y
ard
s)
20
30
40
50
60
70
80
90
100
May Jun Jul Aug Sep Oct Nov Dec
Imm
igra
tio
n (
N/N
in
po
pu
lati
on
)
0.0
0.4
0.8
1.2
1.6
2.0a) b)
c) d)
Figure 4.2. a) Catch per effort (CPE) of Asian carp from IDNR-contracted commercial fishermen in 2013
for the time-period fish were tagged, b) immigration (number of fish entering per fish in the HMSC pits)
estimated by Link-Barker mark-recapture model for 2013 data only, c) proportion of tagged Asian carp
recaptured correcting for those previously removed (only for fish tagged in 2013), and d) rate of
population change with values near one indicating no population change.

69
Date
Mar 2012 Jun 2012 Sep 2012 Dec 2012 Mar 2013 Jun 2013 Sep 2013 Dec 2013
Rate
of
popula
tion c
hange (
)
0
5
10
15
25
Mar 2012 Jun 2012 Sep 2012 Dec 2012 Mar 2013 Jun 2013 Sep 2013 Dec 2013
CP
E (
N/1
,00
0 y
ard
s)
0
20
40
60
80
100
120
140
a)
b)
Date
Mar 2012 Jun 2012 Sep 2012 Dec 2012 Mar 2013 Jun 2013 Sep 2013 Dec 2013
Exp
loita
tio
n r
ate
0.0
0.1
0.5
0.6 c)
Mar 2012 Jun 2012 Sep 2012 Dec 2012 Mar 2013 Jun 2013 Sep 2013 Dec 2013
Imm
igra
nts
(N
/N in
po
pu
latio
n)
0.0
0.5
1.0
1.5
2.5
3.0
d)
Figure 4.3. a) Catch per effort (CPE) of Asian carp from IDNR-contracted commercial fishermen, b)
estimated weekly rates of population change with values near one indicating no population change, c)
exploitation rate as a function of time, and immigration (N/N in population) for the HMSC pits in 2012
and 2013 (82-week model with all available data).

70
Feb Apr Jun Aug Oct Dec
CP
E
(N/1
00
0 y
ard
s)
0
20
40
60
80
100
120 2012
2013
Month
Feb Apr Jun Aug Oct Dec
Rate
of
po
pu
lati
on
ch
an
ge
0
1
2
3
4
5
6
7
122012
2013
a)
b)
Figure 4.4. A comparison of a) CPE (number of fish per 1000 yards of gill net) and b) the rate of
population change (values below one represent a declining population), between 2012 and 2013. Solid
lines show the linear regression for 2012 and dashed lines represent the linear regression for 2013.
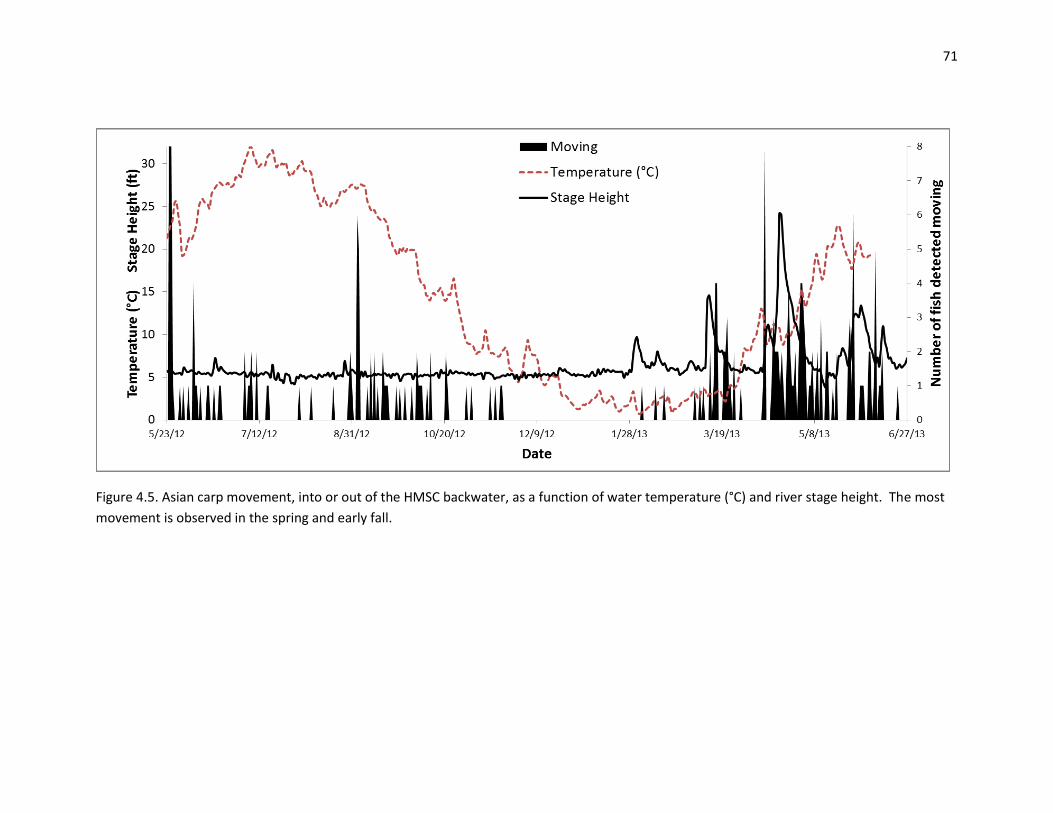
71
Figure 4.5. Asian carp movement, into or out of the HMSC backwater, as a function of water temperature (°C) and river stage height. The most
movement is observed in the spring and early fall.

72
CHAPTER 5
Modeling Asian carp population responses to harvest in the Illinois River
Goal: Our goal was to develop a stock assessment framework capable of testing how the Asian carp
population would respond to commercial harvest in the Illinois River.
Justification: Commercial harvest in the Illinois River has unknown repercussions on the Asian carp
population therein. Our model will be able to determine how varying harvest rates will affect the
abundance and size distribution of Asian carp species in the immediate and long-term future. This
exercise is necessary to understand how harvest affects Asian carp populations and to develop
predictions of harvest rates necessary to reduce propagule pressure into Lake Michigan.
Contact: Brian Roth; [email protected]; 13 Natural Resources Building, Michigan State University; 517-
353-7854
David Glover; [email protected] Department of Evolution, Ecology, and Organismal Biology. Aquatic
Ecology Laboratory, The Ohio State University, Columbus, Ohio
Publications (Appendix):
Tsehaye, I., Catalano, M., Sass, G., Glover, D., & Roth, B. (2013). Prospects for fishery-induced collapse
of invasive Asian carp in the Illinois River. Fisheries,38(10), 445-454.
Introduction: An initial study was conducted to explore prospects for the “collapse” of Asian Carp in the
Illinois River through intensive fishing. Based on a meta-analysis of demographic data, we developed a
dynamic simulation model to compare the performance of existing and alternative removal strategies
for the Illinois River. The initial model projections suggested that Asian Carp in the Illinois River are un-
likely to collapse if existing harvest rates are kept below 0.7 or fishing continues to be size selective
(targeting only fish >500 mm or <500 mm) or species selective (targeting mostly Bighead Carp), although
their biomasses could be greatly reduced. We argue that it would still be possible to achieve fishing
effort targets predicted by our model to collapse the Asian Carp populations if efforts to expand
commercial fishing are combined with economic incentives to improve size selectivity and species
targeting. A second model is now being developed with additional data to better determine exactly
what amount of fishing is needed to decrease upstream Asian carp movement and decrease population
numbers.
During two days of February 2013, fisheries investigators with broad experience in marine and
freshwater systems convened to discuss ways to model the populations of Asian carps (bighead and
silver) in the Illinois River, with particular focus on the potential for these species to increase densities in
proximity to the electrical barrier in the Chicago Sanitary Ship Canal (CSSC) within the Chicago Area
Waterway System (CAWS). Contracted harvest is occurring in the upper Illinois River to reduce the
potential “propagule pressure” of Asian carp on the CSSC. We identified two modeling approaches. The
first (Version 1.0) is a stochastic, stage-structured model exploring the impact of size-dependent harvest
on the population trajectory of both species in the Illinois River. The model was developed as part of a

73
research effort conducted during 2010-2011 and is coded in statistical modeling software (see results in
Garvey et al. 2012 and Tsehaye et al. 2013). The output of Version 1.0 showed that the response of the
population to fishing pressure is highly variable, with the conclusion that harvest must occur on all sizes
of Asian carp with a high exploitation rate (> 70%) to cause the mean population growth rate to decline.
Although the current model structure and approach are sound, the output might not be all that useful to
managers interested in assessing “risk” of the population reaching the barrier system. Thus, a model
Version 2.0, which does not yet exist, will need to be constructed. The group agreed that this model
must start from “scratch” and will require a significant amount of data. Importantly, the currency of the
model needs to be decided and kept consistent. The critical output of the model will be the probability
that carp will establish in the proximity of the electrical barrier in the CAWS. Different management
strategies will be incorporated into the model to assess the change in this probability from a strategy of
no control. Contracted fishing in the upper Illinois River is removing up to 1.5 million pounds annually. In
the lower river, commercial fishing is occurring. The model will allow us to assess what would happen to
the population in proximity to the CSSC if current harvest strategies are stopped or redistributed
throughout the Illinois River. Management strategies such as size-selective control, reduction in
reproductive output, and selective barriers may also be built into the model.
Model Structure (Figure 5.1):
The model will be spatially explicit. Responses near the barrier will depend on control efforts both in the upper river (defined as above Starved Rock Lock and Dam) and in the lower river.
The model will allow managers to forecast population dynamics and “risk” to the barrier for 50 years.
The approach will generally be Eulerian in design. Rather than following individuals, population dynamics will be divided into temporally and spatially discrete cells. The distribution of responses will be followed within those cells and they will interact.
Recruitment needs to be understood with research and incorporated as an independent process. Fish produced will be distributed throughout the lower river where recruitment is known to occur.
The “Adult” component of the population model will have explicit temporal and spatial components.
Data Collection and Parameterization: Data for Version 2.0 are being collected and exist in the
literature. The group agreed that building a model skeleton with place-holder variables is possible within
a few months, but the challenge will be assembling data and getting them into the proper currency for
the model. Data needed include larval growth and survival, spatial distribution of larval settling sites,
density-dependent demographic relationships for adults, and dependence of movement on hydrology,
density, and size (Figure 5.1). Simulations of the Version 2.0 will provide a response surface by which
management strategies will be assessed.

74
Figure 5.1. Structure of model Version 2.0

75
CHAPTER 6
Ecosystem responses to a large-scale reduction of Asian carp in the lower Illinois River
Goal: To quantify pre-Asian carp reduction effort chlorophyll a and nutrient concentrations, zooplankton community composition and concentration, and fish community characteristics among six reaches of the Illinois River. Identical sampling efforts will be conducted during the Asian carp eradication effort to test for ecosystem responses. Justification: Due to their planktivorous feeding behavior and miniscule filtering capacities, Asian carp have been shown to alter phytoplankton and zooplankton community composition and concentrations. Changes to these lower trophic levels as a consequence of Asian carp may negatively influence native fishes that require these resources during certain life stages or throughout their entire lives. In the Illinois River, rotifer concentrations are positively correlated with Asian carp abundances. Prior to the Asian carp invasion, the zooplankton community of the Illinois River was dominated by cladocerans and copepods. We will test for changes in chlorophyll a and nutrient concentrations, zooplankton community composition and concentrations, and the native fish community in response to the Asian carp reduction effort. Research Approach: Chlorophyll a, nutrient, and zooplankton samples are being collected biweekly in six reaches of the Illinois River using standard methods. The fish community is being assessed by two separate long-term fish population monitoring programs on the Illinois River. These attributes of the Illinois River will be assessed pre- and post-Asian carp reduction. Contact: Andrew Casper, Director, [email protected], Illinois River Biological Station, Havana, Illinois (309)-543-6000 Introduction
Controlled commercial fishing for the reduction of Asian carp (Hypothalmychthyes spp.) was instituted
during 2010 in an attempt to reduce migration pressure on the Dispersal Barrier and thus reduce the risk
of Asian carp entering the CAWS and Lake Michigan (see Barrier Defense Asian Carp Removal Project
Description/Chapter). High densities of Asian carp are believed to exert a strong direct impact on
ecosystem structure and function, primarily by the consumption of plankton. Thus, it is plausible that
Asian carp reduction efforts (i.e. commercial fishing) may produce detectable responses in variables
such as zooplankton community structure, density, and productivity. Short-term changes in these direct
response variables could provide insight into any of Asian carp’s lagged impact on the native fish
community. Monitoring of zooplankton response has been conducted since 2009 and riverine fish
monitoring has been conducted by the Long-Term Illinois, Mississippi, Ohio, and Wabash River Fish
Population Monitoring program (LTEF) since 1989. The results of these surveys are presented with the
objective of increasing our understanding of the ecosystem responses that may have occurred as a
result of Asian carp removal efforts.
Methods

76
Plankton sampling occurred monthly (May-Oct) at 18 sites throughout the Illinois Waterway (Alton, La
Grange, Peoria, Starved Rock, Marseilles, Dresden) from May thru October of 2011-2013 and at a subset
of 6 sites during 2009 and 2010. At each site-date combination, three vertically-integrated 55-µm 30-L
sample replicates were obtained by pumping water through 55-µm mesh. Zooplankton were preserved
in the field using a 12% sugar-buffered formalin solution with Rose Bengal stain added after returning to
the laboratory. For microscopic analyses, samples were concentrated to a known volume from which a
homogenized 5 mL subsample was transferred to a counting wheel with a Hensen-Stemple pipette.
Zooplankton were identified to the lowest possible taxonomic unit using a dissecting scope and the
resulting densities are given as the number of individuals per liter of water sampled. Productivity was
evaluated by measuring total phosphorus and chlorophyll a. Two replicate water samples were collected
0.5 m below the surface at each site-date combination. Chlorophyll-a concentrations were estimated by
acetone extraction using standard fluorometric techniques. Total phosphorus concentrations were
estimated by the ascorbic acid method after digestion with persulfate under acid conditions (Soballe and
Fischer 2004).
Asian carp reduction activities through commercial fishing occurred predominately in the upper river
section (Starved Rock, Marseilles, and Dresden reaches). During 2010, removals were limited to only the
Marseilles and Dresden reaches, whereas from 2011 to 2013 they occurred in all three upper reaches.
Removals from the lower river section (Alton, La Grange, and Peoria reaches) only occurred once during
2012. Based on the distribution of commercial fishing pressure, river geomorphology, and natural
differences in ecology, we grouped sites into upper and lower river sections (Theiling 1999, McClelland
et al. 2006).
Analyses
To investigate how the reduction through commercial fishing affected measured ecosystem responses,
we only considered the upper section of the river where most of the reduction activities have occurred.
Zooplankton density was evaluated using mixed model one-way ANOVA with commercial fishing
(presence/absence) as the fixed effect, and site and year as random effects (2009 and 2011-2013,
respectively). We indexed zooplankton density as the mean of three replicate samples taken during June
of each year. We only considered June zooplankton data because a complete set of all site-month data
was not available for all years.
Although Asian carp now comprise the greatest proportion of planktivore biomass in the Illinois
Waterway, native planktivores are still important components of the aquatic food web. Therefore, we
also included an analysis of the effect of Asian carp reductions on gizzard shad, as gizzard shad can be an
indicator for other native plankton-feeding fishes. Gizzard shad (Dorosoma cepedianum) are a dominant
water column planktivore within the Illinois Waterway and have previously been shown to exhibit
reduction in body condition in relation to Asian carp establishment (Irons et al. 2007). If Asian carp can
out-compete gizzard shad for plankton, then gizzard shad and the species that utilize them may be
indirectly impacted. Thus in an effort to determine if reductions of Asian carp are having a positive effect
on gizzard shad, we evaluated gizzard shad abundance and condition using mixed model one-way
ANOVA with commercial fishing as the fixed effect, and site and year as random effects. Condition was

77
indexed as relative weight (Wr; see Irons et al. 2007) and abundance was indexed as catch-per-unit
effort (CPUEn).
Independent of commercial fishing, mean annual zooplankton densities and mean annual productivity
(chlorophyll a and total phosphorus) were compared by section and year using mixed model, two-way
ANOVA with section (upper/lower) and year as fixed effects and site as a random effect. Zooplankton
density was indexed as the mean of three monthly replicate samples averaged among the six months
sampled each year. Similarly, productivity was indexed as the mean of the two monthly replicate
samples averaged among the six months sampled each year. Data from 2009-2010 could not be included
with data from 2011-2013 because the same site-date combinations were not sampled during each
period. In addition, three other sites were excluded from the analysis because they only occurred in one
reach (La Grange) and were deemed different enough from the more standard main channel conditions
and would therefore obscure results. These included two backwater sites and one side channel site.
Results – Effects of Asian Carp Reduction on Ecosystem Responses
The presence of commercial fishing did not significantly influence rotifer (f = 0.20, p = 0.70), cladoceran
(f = 0.54, p = 0.54), copepod (f = 3.31, p = 0.21), nauplii (f = 0.22, p = 0.68), or total zooplankton densities
(f = 0.22, p = 0.69; Figure 6.1). Furthermore, there were no statistically significant effect of reduction
activities on gizzard shad condition (f = 0.65, p = 0.42) or abundance (f = 0.06, p = 0.94; Figure 6.2).
Results – Ecosystem Variability in Relation to River Mile
Independent of commercial fishing, rotifer density and total zooplankton density varied by year and
river section (p < 0.02 and p < 0.001, respectively), with rotifers tending to be proportionally more
abundant in the lower section (Table 6.1; Figures 6.3 and 6.4). There was also a significant year by
section interaction for both rotifer and total zooplankton density (both p < 0.01), likely a result of high
rotifer densities in the upper section during 2012 (Figure 6.4). Cladoceran density varied by river section
(p = 0.03) as they tended to be more abundant in the upper river and by year (p = 0.002) with 2012
significantly different from 2011 and 2013. Nauplii density differed by year (p = 0.05) and there was a
significant year by section interaction (p = 0.01) as higher nauplii abundances were observed in the
lower river during 2013(Figure 6.4). Only copepod density did not differ between river section and year.
Chlorophyll-a concentration differed by river section (p < 0.001). Trends indicate chlorophyll-a
concentration tended to decrease from downstream to upstream, primarily a consequence of dramatic
decreases within the upper river (Figure 6.5). Conversely, total phosphorus tended to be progressively
greater upstream and was significantly different between river section and year (both p < 0.001; Figure
6.6) with 2012 significantly different from 2011 and 2013.
Discussion
Based on our analysis, we were unable to detect an influence of controlled commercial fishing of Asian
carp on those ecosystem responses measured during the course of the study. However, several factors
aside from commercial fishing pressure on Asian carp, may explain our findings. These include:

78
- The inherent biotic and abiotic differences that exist between the upper and lower river sections regardless of the establishment of Asian carp (Theiling 1999, McClelland et al. 2006). The lack of a significant response suggests that the differences we observed in productivity and zooplankton communities should not be directly attributed to commercial reductions of Asian carp.
- The relative paucity of zooplankton data collected prior to the onset of Asian carp reduction efforts in 2009. Moreover, small-sample sizes and ineffective sampling designs may have failed to detect year-to-year or site-to-site variation and could obscure broader patterns that may have emerged with additional pre-reduction data.
- In addition to the lack of a plankton response, there was also no response of gizzard shad abundance (CPUEn) or condition (Wr). This lack of response could be attributed to a possible lagged response due to longer generation times of fishes.
Aside from these results, several other notable conclusions may be reached.
- While small-bodied rotifers dominated the zooplankton community, they were more abundant in
the lower section of the Illinois River where Asian carp densities are highest. In a previous study,
increasing densities of silver carp lead to significant reductions in larger bodied plankton like
cladocerans and to a lesser extent copepods, but had no effect on rotifer densities (Domaizon
and Dévaux 1999). These patterns may be attributed to the lower prey escape ability of
cladocerans in conjunction with longer generation times making them more susceptible to
suppression by planktivory and competition (Domaizon and Dévaux 1999, Lu et al. 2002).
Therefore, higher rotifer concentrations coinciding with higher carp densities may be an
indication of greater Asian carp foraging. Additionally, cladocerans were observed to be more
abundant in the upper river, which may be a function of both reduction efforts and/or lower
ambient Asian carp densities of the upper river.
- In terms of productivity, total phosphorous and chlorophyll-a concentrations did not appear to be
correlated; total phosphorous increased upstream while chlorophyll a decreased upstream.
However, it is worth noting general upstream decreases in the chlorophyll-a concentration are
largely driven by a greater magnitude of decrease in the upper river.
Recommendations
Monitoring of productivity and zooplankton should continue to contribute to a better understanding of
the long-term ecosystem effects of controlled commercial removal of Asian carp. Removals could be
conducted in intermediate connected backwaters that isolate from the main river during low water to
increase the ability to detect ecosystem responses to removal efforts. After colonization during high
water, reductions could occur during periods of isolation to account for immigration and emigration.
Concurrent ecosystem monitoring could also be conducted at more frequent and specific time intervals
coinciding with removal events. In situ experimental enclosures or experimental ponds may also be
beneficial to manipulate carp densities and initial ecosystem parameters (e.g. zooplankton,
phytoplankton, nutrients).
Project Highlights:

79
Reduction of Asian carp through controlled commercial fishing did not significantly influence
zooplankton densities, gizzard shad relative weight, or gizzard shad catch-per-unit effort
Rotifers are proportionally dominant in terms of abundance in both upper and lower river
sections
o Rotifers tended to be more abundant in the lower section when compared to the upper
section
o Cladocerans tended to be more abundant in the upper section when compared to the
lower section
Primary productivity (i.e., chlorophyll-a concentration) decreased from downstream to
upstream
Total phosphorus (mg/L) decreased from upstream to downstream.
References:
Domaizon, I., and J. Dévaux. 1999. Impact of moderate silver carp biomass gradient on zooplankton
communities in a eutrophic reservoir. Consequences for the use of silver carp in biomanipulation.
Comptes Rendus De L Academie Des Sciences Serie Iii-Sciences De La Vie-Life Sciences. 322:621-628.
Irons, K.S., G.G. Sass, M.A. McClelland, and J. D. Stafford. 2007. Reduced condition factor of two native
fish species coincident with invasion of non-native Asian carps in the Illinois River, U.S.A. Is this
evidence for competition and reduced fitness? Journal of Fish Biology 71:258-273.
Li, M., P. Xie, H. Tang, Z. Shao, and L. Xie. 2002. Experimental study of trophic cascade effect of silver
carp (Hypophthalmichthys molitrixon) in a subtropical lake, Lake Donghu: on plankton community
and underlying mechanisms of changes of crustacean community. Hydrobiologia 487:19-31.
McClelland, M.A., M.A. Pegg, and T.W. Spier. 2006. Longitudinal patterns of the Illinois River fish
community. Journal of Freshwater Ecology. 21:91-99.
Soballe, D.M., and J.R. Fischer. 2004. Long Term Resource Monitoring Program Procedures: Water
quality monitoring. U.S. Geological Survey, Upper Midwest Environmental Sciences Center, La
Crosse, Wisconsin, March 2004. Technical Report LTRMP 2004-T002-1 (Ref. 95-P002-5). 73 pp. +
Appendixes A
Theiling C. 1999. River geomorphology and floodplain habitats. Pages 4:1-4:21 in Delaney, R.L., K.
Lubinski, and C. Theiling, editors. Ecological status and trends of the Upper Mississippi River system
1998: a report of the Long Term Resource Monitoring Program. U.S. Geological Survey, Upper
Midwest Environmental Sciences Center, La Crosse, Wisconsin. April 1999. LTRMP 99-T001.

80
Table 6.1. Zooplankton density (mean (± SD); individuals/L) by river section and year (May-Oct).
Section Year
No.
Samples Rotifers/L Cladocerans/L Copepods/L Nauplii/L Total Zoop/L
Lower 2011 199
131.2
(133.0) 1.9 (2.3) 0.4 (0.7) 2 (2.1)
135.6
(134.5)
(12 sites) 2012 213 153.9 (83.2) 3.8 (6.0) 0.4 (0.7) 2.2 (2.4) 160.3 (82.5)
2013 211
213.9
(146.1) 2.1 (2.9) 0.7 (1.0) 5.7 (7.2)
222.4
(148.1)
2011-2013 623
167.0
(128.1) 2.6 (4.2) 0.5 (0.8) 3.3 (4.9)
173.5
(129.7)
Upper 2011 53 23.3 (16.5) 2.1 (2.4) 0.5 (0.4) 3.5 (6.3) 29.6 (19.9)
(3 sites) 2012 54
102.7
(149.7) 7.9 (15.8) 0.6 (0.7) 3.2 (3.2)
114.4
(157.8)
2013 54 40.3 (42.5) 4.8 (8.3) 0.4 (0.6) 3.0 (3.0) 48.6 (42.2)
2011-2013 161 55.6 (96.3) 5 (10.6) 0.5 (0.6) 3.3 (4.4) 64.4 (101.5)

81
Figure 6.1. Mean (± SD) June zooplankton densities by year within the upper river.

82
Figure 6.2. Condition (Wr; mean ± SD) and catch-per-unit effort (CPUEn; mean ± SD) of gizzard shad by
year within the upper river.
Figure 6.3. A) Proportion of zooplankton and B) zooplankton density by section and year (May-Oct).
Note: actual densities differ between river sections.
A B

83
Figure 6.4. Density of zooplankton (May – Oct) including rotifers, nauplii, copepods, cladocerans and total zooplankton by river section and year.

84
Figure 6.5. Mean (± SD) annual (June-October) chlorophyll a concentration as a function of river mile.
Dashed vertical line separates river sections.
Figure 6.6. Mean (± SD) annual (June-Sept) total phosphorus concentration as a function of river mile.
Dashed vertical line separates river section.

85
CHAPTER 7
Using telemetry to quantify movement of Asian carp Goal: Effective control of Asian carp in the Illinois River requires an understanding of how many fish are immigrating from downstream reaches and the Mississippi River. Justification: Asian carp invaded the Illinois River from lower reaches. The extent by which both species move upstream to contribute to the populations in the Illinois River is unknown. For harvest to be effective, the density of Asian carp removed needs to outpace the number of fish moving upstream to replace them. Research Approach: Acoustic telemetry was used to track the movements of 300 adult Asian carp (150 silver carp and 150 bighead carp) tagged in the fall of 2010 in Pool 26 of the Mississippi River near the confluence with the Illinois River. Since that time the fish have been tracked using a stationary receiver array that extends from Keokuk, IA down to Caruthersville, MO in the Mississippi River and then the portion of the Illinois River downstream of Starved Rock Dam down to the confluence with the Mississippi River (Figure 7.1). In 2012, receivers were removed from the Mississippi River and relocated to the Illinois River. Currently there are over 40 stationary receivers maintained by SIU in the Illinois River (Figure 7.2). Abstract: Since fall 2010, 79 Asian carp (26%) have entered the Illinois River, moving up at least 6 river miles (Table 7.1). Forty-six of those moved upriver to River mile 22.1 near Hardin, IL. Forty-two of those fish continued upriver also being detected at river mile 39.7, with 27 of those entering Apple Creek. Thirty-five carp moved above LaGrange dam, up to river mile 80.8. Six carp continued on up to river mile 161 and were detected above and below the Peoria Lock and Dam (Figure 7.1). From 2012 to 2014, 709 additional Asian carp were implanted with acoustic transmitters (2014 N = 250; 2013 N = 337; 2012 N = 372). A network of 30 Vemco® VR2W receivers was deployed in the Illinois River by SIUC in 2012 to monitor movement of acoustically tagged Asian carp. This network has been continuously monitored and VR2Ws downloaded every 2-4 months to record fish detections. Receivers have been placed in and around each lock chamber and near major tributaries to track large-scale movements within and among reaches, though three receivers were specifically placed within the HMSC gravel pits to better understand the factors affecting Asian carp immigration and emigration within this area. Immigration and emigration rates throughout the Illinois River, as well as movement between the east and west gravel pits of the HMSC backwater, are also being estimated with acoustic telemetry. To date, with assistance from IDNR-contracted commercial fishermen and Illinois Natural History Survey (INHS), 691 acoustic transmitters have been implanted in Asian carp in the Illinois River or Pool 26 of the Mississippi River. Contact: Marybeth K. Brey, [email protected], 919-508-7190, Postdoctoral Fellow, Southern Illinois University, Carbondale, Illinois Introduction: Immigration and upstream movement of Asian carp was quantified with telemetry in
2010-2011, and indicated that 30% of Asian carp (tagged in the Mississippi River) immigrated into the
Illinois River from the Mississippi River and subsequently made long distance trips up the Illinois River,
but did not extend past Starved Rock Lock and Dam. Immigration and upstream movement
corresponded with elevated flow in the river during spring through summer. However, Asian carp that

86
moved upstream, returned to downstream locations as water levels dropped in late summer. Examining
how immigration and movement rates of Asian carp change in relation to seasonal and annual changes
in river flow as well as determining how changes in Asian carp density affect these movement rates are
important considerations for forecasting population responses to removal efforts and predicting how
this will affect the probability of movement toward or away from the Chicago Area Waterway System
(CAWS).
Multi-year data on movement will allow us to predict the river conditions (e.g., threshold discharge,
temperature) that trigger mass movement of fish in the Illinois River. Periods of mass movement might
be times when removal efforts need to be increased. If removal efforts are successful and movement is
density dependent, then frequency of movement of fish toward the CAWS should decline through time.
Even if movement is not density dependent but related solely to temperature and river discharge,
successful removal efforts would reduce the number of fish that could potential arrive at the CAWS.
Tracking tagged fish over time may also allow us to locate areas that attract (or deter) Asian carp. Focus
on these areas during commercial harvest events could have positive effects on decreasing the
population growth rate of carp in the upper reaches.
Our data suggest that Asian carp that are resident in the upper reaches may have different movement
behaviors (i.e., staying put) relative to the fish in the lower river. By dividing tagged fish between north
and south river reaches, we will determine whether this is true. The alternate is that all fish in the north
are transient “visitors” to the north moving downstream. This effort also will allow us to test whether
Asian carp frequently move past Starved Rock Lock and Dam and whether the route of movement is
through the gates or the lock. If movement is concentrated through the lock, then control efforts may
be directed toward these structures in the upper river. Lastly, determining how Asian carp interact with
the locks and dams of the Illinois River is an important consideration for parameterizing spatially explicit
models as the type of dam (e.g., wicket dams on the lower Illinois River compared to the gated lock and
dams at Brandon Road) may affect the probability for successful passage.
Methods:
Acoustic transmitters—tagging
In 2012, 372 Asian carp were tagged with Vemco® acoustic transmitters (v16, v13, v9, or v6 transmitting
at 69 KHz) in the Marseilles, Starved Rock, and Dresden Pools of the Illinois River and in Pool 26 of the
Mississippi River (124 bighead carp, 243 silver carp, and nine hybrid Asian carp). In early summer and
late fall, when water temperatures were optimal for fish recovery, acoustic transmitters were implanted
into Asian carp (77 in early summer and 296 in late fall). One hundred and sixty-four fish were tagged in
the Starved Rock pool near Sheehan Island, 41 were tagged within the east pit of Hanson’s Material
Services Corp. near Morris, IL, 13 were tagged in the Dresden pool near the confluence with the
Kankakee River, and 155 were tagged in Pool 26 of the Mississippi near Alton, IL (see Table 1 for
breakdown by species).

87
In 2013, an additional 337 Asian carp were tagged with acoustic transmitters in the Illinois River (Table
1). A total of thirty-eight fish were tagged in the Dresden Island pool, with10 fish being released in Rock
Run Rookery, a backwater lake in the Dresden pool, and 28 fish released near the confluence with the
Kankakee River. In the Marseilles pool, 96 fish were tagged with transmitters; 56 were released in the
main channel at the Morris boat ramp and 38 were released in the Hanson Material Service Corporation
(HMSC) pits (21 in the west pit, 17 in the east pit). In the Starved Rock pool, 54 fish were tagged and
released at the Starved Rock Marina. To determine the amount of movement between pools in the
lower Illinois River and Upper Illinois River, additional fish were tagged in the Peoria (N = 51 fish near
Lacon, IL), La Grange (N = 54 fish near Havana, IL) and the Alton pools (N = 46 fish near Hardin, IL). For a
breakdown by species, refer to Table 1.
All fish were also tagged with individually numbered $50 reward jaw tags (aluminum, size 1242-9C,
National Band and Tag Co.) to provide incentives to fishermen not contracted by the IDNR to return
transmitters. IDNR contracted fishermen have been instructed to return healthy fish back to the water
as soon after capture as possible.
Receivers
A total of 36 Vemco® VR2W receivers had been deployed in the Illinois River to monitor movement of acoustically tagged Asian carp (Alton = 7, Swan Lake = 1, LaGrange = 7, Peoria = 6, Starved Rock = 7, and Marseilles = 3; Figure 6.1) in 2012. One receiver has also been placed in each lock chamber (La Grange, Peoria, Starved Rock, Marseilles, and Dresden Island) and on each upstream and downstream side of the lock and dam, with the exception of Dresden (receivers maintained by the USACE) and Marseilles (only downstream). Additional receivers are located in main channel locations as well as near major tributaries to track large-scale movements within and among reaches. Three receivers were placed within Hanson Material Service Corporation gravel pits to better understand the factors affecting Asian carp immigration and emigration within that area. Finally, active tracking by boat using a Vemco® VR100 receiver was conducted in the Sheehan Island area of the Starved Rock Pool on 21 November and 6 December 2012 and in the Marseilles reach and HMSC pits on 24 May 2013, and periodically in 2014. Discharge and temperature To relate fish movement to changes in river discharge, we needed to create discharge-gage height (or state height) relationships for each reach of the river. Discharge (Q; m-1s-1) measurements were collected using an Acoustic Doppler Current Profiler (ADCP) in the Starved Rock reach, Alton reach, and at the confluence of the Mississippi and Illinois Rivers in 2012 and 2013. Measurements were taken near Buffalo Rock (Starved Rock reach; ~RM 234) on 8 May, 17 July, 12 August, 23 October, 21 November, and 6 December in 2012 and 15 January, 13 February, 10 April, and 8 May in 2013. Discharge measurements were taken at the confluence and on the IL River at Grafton, IL on 12 July, 23 August, 26 October, 20 November, and 6 December in 2012 and the 18 January, 20 February, and 5 April 2013. Second order polynomial relationships were fit to discharge and river gage height or river stage height (depending on available data from USGS gaging stations) for these areas (Figure 6.3 and Figure 6.4). These relationships will be used to determine how change in discharge is related to fish movement.

88
Temperature loggers were also placed on all VR2W receivers to determine how movement relates to changes in water temperature. Movement and temperature data have been and will continue to be downloaded at 3-month intervals to determine how discharge and water temperature affect movement of Asian carp. Results and Discussion: General movement Since fall 2010, 79 Asian carp (26%) have entered the Illinois River, moving up at least 6 river miles (Table 6.1). Forty-six of those moved upriver to River mile 22.1 near Hardin, IL. Forty-two of those fish continued upriver also being detected at river mile 39.7, with 27 of those entering Apple Creek. Thirty-five carp moved above LaGrange dam, up to river mile 80.8. Six carp continued on up to river mile 161 and were detected above and below the Peoria Lock and Dam (Figure 7.1). Over 1.4 million positive (known transmitter) detections have been recorded on passive VR2W receivers from May 2012 to December 2013 on VR2W receivers located along the Illinois River (from Grafton, IL to Dresden Island Lock and Dam). From these detections, 273 individual Asian carp have been identified (including fish tagged by USACE and SIU fish tagged in 2010 with active transmitters). The redetection rate of fish tagged in 2012 was 31.2% and 27.0% in 2013 (Table 7.2). Of the 348 Asian carp that were tagged in the Mississippi River by SIU in October/November 2010 (with active transmitters during this study), 47 were redetected in the Illinois River (Table 6.3). Five of those fish immigrated into Swan Lake, a backwater of the Alton reach located between RM 5 and RM 13. Including the fish that moved into Swan Lake, the immigration rate from the Mississippi River to the Illinois River over ~2.5 years was 13.5%. Of the fish that were tagged in the Mississippi River (Pool 26) in fall 2012 (N = 148), twelve were redetected in the Illinois River (Alton = 3, La Grange = 3, Peoria = 3, Swan Lake = 3). Including the three fish last relocated in Swan Lake, the 1-year immigration rate for 2012 carp was 8.1%. Although we do not know the number of fish that died during this time period, this is a starting point from which to parameterize spatially explicit movement models for the river and gives us an idea of the proportion of fish emigrating from the Mississippi River into the Illinois River.
Passage through locks and dams and between reaches
Fish detections in lock and dams increased in 2013, in part due to the additional receivers in the lock
chambers. Eighty-one fish were detected in lock chambers. Two bighead carp and one silver carp were
detected in the lock chamber of the Marseilles Lock and Dam. The two bighead carp (originally tagged
by the USACE in the HMSC pits in October 2012) passed successfully downstream (one back upstream,
then downstream again). Both were last detected moving further downstream through Starved Rock
Lock and Dam into the Peoria pool in September 2013. The silver carp, which was initially tagged in the
Sheehan Island backwater in the Starved Rock pool, did not successfully pass upstream through the
Marseilles Lock and Dam and returned back downstream to the Sheehan Island backwater in the Starved
Rock reach.
In addition to the two bighead carp that passed downstream through the Starved Rock Lock and Dam,
seven additional fish attempted to pass downstream. One bighead carp successfully passed and

89
continued to move downstream, while the other six moved back and forth near the receiver before
turning back upstream to the Sheehan Island backwater area. No fish were detected moving upstream
through the Starved Rock Lock chamber in 2013, although one fish (from Pool 26) was detected in the
Starved Rock pool.
In the Dresden Island lock chamber, seven fish were detected, all during the months of May and June.
One fish, originally tagged in the Dresden pool, successfully passed downstream (multiple attempts; 10-
12 May 2013). Another moved from the HMSC pits into the lock chamber and back to the HMSC pits
(25-26 June). The other five fish only show detections in the lock chamber. We do not have receivers
upstream of Dresden Island Lock and Dam and therefore rely on the USACE for any detection above that
area. These five fish were not detected again downstream of the dam, they likely passed upstream.
Fish tagged in the Starved Rock and Marseilles pools showed extremely high site fidelity, with 50% of all
fish tagged in the Starved Rock pool relocating within that pool and 78.8% of redetected fish staying in
that pool (Table 7.4). In 2012, nearly 20% (thirty-six individual fish) of the fish tagged in the Sheehan
Island backwater were relocated there up to seven months post-tagging, suggesting that Starved Rock
may act as a staging area (waiting area for fish until conditions become favorable for moving, either to
spawn or migrate) for Asian carp and/or a natural barrier to upstream movement. The receiver in
Sheehan Island has been sent to Vemco for repairs, but we suspect the number of fish redetected in
that backwater is still high. Fish tagged in the HMSC pits in the Marseilles reach in 2012 also showed
high site fidelity. Of fish tagged and subsequently redetected, 72.5% stayed within the Marseilles pool,
10% moved upstream, and 17.5% moved downstream (Table 7.4).
Spawning movements
Spawning aggregations were observed for the first time in the Marseilles reach in 2013 (22 May). Fish
detections and movement in the HMSC backwater of the Marseilles reach were compared to
temperature and river discharge (stage height used as a proximate measure of discharge in this reach)
to determine what cues triggered spawning movements in carp. Because a receiver is located in the
connecting channel between the main river channel and the backwater of the HMSC pits, we were able
to tell when fish moved out of the pits, into the pits, or stayed in the connecting channel (staging).
Staging fish were fish that stayed within detection range of the receiver in the connecting channel for an
extended period of time without moving into or out of the pits. Fish that were “moving” were detected
on both the receiver in the connecting channel and the receiver at the mouth of the pits (Figure 7.5).
Staging fish were most abundant from the 1 May – 8 May, at which time fish began to move (Figure 7.6).
The 8 May was the first date that water temperature rose above 18°C, a trigger for spawning movement
in their native habitat (Yangtze River; Li et al. 2013). No movement and minimal staging was detected
on the 9-10 May, 21 May, 28 May, or 3 June 2013. Each period of no fish detections (number of fish
moving or staging is zero) is a likely spawning event when all fish were in the main channel. Each of
these periods corresponded to elevated river discharge and river temperatures above 18°C, and a
significant, albeit weak, positive correlation between the number of fish staging and the stage height of
the Marseilles reach (R = 0.16; P = 0.001), suggesting that each rise in river stage height (elevated

90
discharge) triggered a spawning event during this period. Although spawning aggregations were only
observed during the 22 May, there were likely three additional spawning movements in the spring.
Movement, river discharge, and temperature
Many fish species exhibit movement related to river discharge (Taylor and Cooke 2012), and carp do not appear to be an exception. Sharp rises in river stage and current velocity have been shown to trigger movement in Asian carp in China (Wang et al. 2013). For the Illinois River, the number of unique fish moving upstream and downstream was calculated per day and a three day moving average was taken (Figure 7.7). Overall, the most movement (upstream or downstream) occurred from April to mid-July and in November. The greatest upstream movement occurred during the end of April, and the greatest downstream movement occurred during the end of May and beginning of November. Fish were possibly cuing on increased river discharge in the spring for movement. Additional analyses are being conducted to determine reach specific cues for movement. Recommendations:
We were able to monitor and discern patterns of Asian carp movement throughout the entire Illinois
River, showing the general time periods that fish were moving. No Asian carp were detected near the
CAWS, so no fine scale movement monitoring was necessary. Additional active tracking should be
conducted to locate fish tagged in the Dresden Island pool and in the Rock Run Rookery. Additional
“proxy” fish should also be tagged in the upper reaches (above Dresden Island) to determine how Asian
carp may respond to environmental cues in that area.
We were also able to determine differences between “immigrant” carp from the Mississippi and lower
Illinois Rivers and “resident” carp in the upper Illinois River. Although fish from the Mississippi River
were detected as far upstream as the Starved Rock pool, no “immigrant” fish were present further
upstream. Carp from the Mississippi River are capable of making long distance migrations in a relatively
short period of time (e.g., Alton pool to the Starved Rock pool in less than one month), however the
immigration rate into the Illinois River was only measured at 13.5% over a 2.5-year period, suggesting
that fish already present in the Illinois River are of greater concern than those in the Mississippi River.
However, if the current immigration rate were to continue, there would still be a constant influx of fish
from downstream reaches. An increase in downstream harvest may be necessary to ultimately decrease
the propagule pressure at the CAWS.
River discharge, river gage height, and temperature in the Illinois River were related to movement
patterns of Asian carp. Movement in 2013 appeared to be greater than in 2012, likely due to the
increased river discharge in 2013. Temperatures over 18°C and increases in river discharge during the
month of May appeared to trigger spawning movements in the Marseilles reach. Increasing fishing
pressure prior to such events (April) may help to decrease the number of spawning individuals when
conditions become favorable.

91
Although we are not yet able to relate carp movement to biomass of fish in the river due to the long
processing time of our hydroacoustics data, we will continue to monitor Asian carp movement though
the Illinois River in 2013 and make such comparisons as soon as data become available. We recommend
increased effort to locate fish in side channels and backwater areas, as these may be important staging
locations or barriers to movement for Asian carp, and more closely monitoring fine scale movements in
those areas.
Highlights:
In 2013, an additional 337 Asian carp were tagged with acoustic transmitters in the Illinois River (Rock Run Rookery = 10, Dresden Island = 28, Marseilles = 93, Starved Rock = 54, Peoria = 51, La Grange = 54, Alton = 46).
Of the 348 Asian carp that were tagged in the Mississippi River by SIU in October/November 2010, 47 were redetected in the Illinois River. The immigration rate from the Mississippi River to the Illinois River over ~2.5 years was 13.5%.
Over 1.4 million positive (known transmitter) detections have been recorded on passive VR2W receivers from May 2012 to December 2013 on receivers located along the Illinois River. From these detections, 273 individual Asian carp have been identified. The redetection rate of fish tagged in 2012 was 31.2% and 27.0% in 2013
Fish were detected in all lock chambers in 2013. No successful upstream movement was detected through the Marseilles Lock and Dam, although attempts were made. Two fish did successfully pass downstream. This is the first record of fish moving through the Marseilles Lock and Dam.
In the Dresden Island lock chamber, seven fish were detected, all during the months of May and June. One was confirmed passing downstream and five potentially moved upstream (awaiting USACE detection data).
Spawning was observed for the first time in the Marseilles reach on 22 May 2013. A significant, positive correlation between the number of fish staging in the HMSC pits and the stage height of the Marseilles reach was found, suggesting that elevated discharge and temperatures above 18°C triggered multiple spawning events in May 2013.
River-wide, the most movement (upstream or downstream) occurred from April to mid-July and in November. The greatest upstream movement occurred during the end of April, and the greatest downstream movement occurred during the end of May and beginning of November.
References:
Taylor, M. K. and S. J. Cooke, S. J. 2012. Meta-analyses of the effects of river flow on fish movement and
activity. Environmental Reviews, 20(4), 211-219.
Li, M., X. Gao, S. Yang, Z. Duan, W. Cao, and H. Liu. 2013. Effects of Environmental Factors on Natural
Reproduction of the Four Major Chinese Carps in the Yangtze River, China. Zoological science,
30(4), 296-303.
Tsehaye, I., M. Catalano, G. Sass, D. Glover, B. Roth. 2013. Prospects for fishery-induced collapse of
invasive Asian carp in the Illinois River. Fisheries 38(10): 445-454.

92
Table 7.1. Location data for acoustically tagged Asian carp in the Illinois Riverduring fall 2010 through summer 2011.
River Miles Moved up the Illinois River Number of Silver Carp
Number of Bighead Carp
5.7 river miles (Grafton, IL) 15 10
22.1 river miles (Hardin, IL) 6 1 Up to 22.1 then back down to 5.7 (38.5 total river miles) 1 0
38.5 river miles (Apple Creek near Pearl, IL) 4 1
39.7 river miles (Pearl, IL) 1 2 Up to 39.7 then back down to 22.1 (57.3 total river miles) 1 0 Up to 39.7 down to 5.7 then upto 84.1 (160.8 river miles) 1 0
84.1 river miles (Beardstown, IL Above LaGrange Dam) 11 5
Up to 84.1 down to 39.7 (128.5 total miles) 2 0
Up to 84.1 down to 22.1 (146.1 total miles) 1 0
Up to 84.1 down to 5.7 (162.5 total miles) 6 1
155.3 river miles (Below Peoria Lock and Dam) 1 1
161 river miles (Above Peoria Lock and Dam) 2 0
Up to 161 down to 84.1 (235.9 total river miles) 1 0

93
Table 7.2. The number of bighead and silver carp tagged with acoustic transmitters, the number
redetected (to date), and the redetection rate by reach for 2012 and 2013.
2012
Bighead
carp
Silver
carpTotal
Number
redetected
Redetection
rate
Pool 26 19 129 148 14 9.46%
Dresden Island 25 20 45b
5 16.67%
Marseilles 48 16 64a
40 62.50%
Starved Rock 56 103 159 66 41.51%
Total 148 268 401 125 31.17%a Includes 30 USACE fish tagged in the east pits.
b Includes 17 USACE fish tagged in the Dresden Island Pool.
2013
Bighead
carp
Silver
carpTotal
Number
redetected
Redetection
rate
Rock Run Rookery 10 10 4 40.00%
Dresden Island 26 2 28 9 32.14%
Marseilles 2 54 56 0 0.00%
HMSC Pits 19 19 38 25 65.79%
Starved Rock 8 46 54 3 5.56%
Peoria 6 45 51 1 1.96%
La Grange 21 33 54 4 7.41%
Alton 13 33 46 45 97.83%
Total 105 232 337 91 27.00%
Table 7.3. The number of fish tagged in the Mississippi River by SIU in October and November 2010
(with active transmitters during 2012-2013) that were redetected in the Illinois River. Numbers show
the furthest upstream reach in which fish were last detected.
To Illinois River Reach
Alton
Swan Lake
(Alton BW) La Grange Peoria Starved Rock
From
Mississippi
River Pool:
(tagged 2010)
22 1 1 1
26 8 5 18 11 1
27 1

94
Table 7.4. The probability of a detected fish being tagged in a pool (left column), and moving to another
pool (top row). Only the furthest pool from the tagging location was counted (e.g., although a fish
tagged in Marseilles had to move through the Starved Rock pool to reach Peoria, Starved Rock is not the
final destination, so that fish would not be included in the Starved Rock count), so all probabilities will
sum to one (within rounding error) per tagged pool.
Alton La Grange Peoria Starved Rock Marseilles Dresden Is.
Pool 26 0.57 0.21 0.21
Starved Rock 0.03 0.15 0.79 0.03
Marseilles 0.05 0.13 0.73 0.10
Dresden Is. 0.40 0.60
Movement to:
Mo
vem
en
t
fro
m:

95
Figure 7.1. Illinois and Mississippi River waterways. Each circle represents a stationary receiver that is in the river recording the location of acoustically tagged Asian carp continuously in 2010.

96
Figure 7.2. Locations of all active VR2W receivers along the Illinois River.

97
Figure 7.3. Second order polynomial relationship between discharge (Q; m3s-1) and Illinois River stage
height (SH; ft.) for Hardin, IL (Alton reach) developed using Acoustic Current Doppler Profiler to measure
discharge every approximately two months from spring 2012 – spring 2013 in Alton, IL. River gage
height measurements were obtained from the USGS gaging station in Hardin, IL.
Figure 7.4. Second order polynomial relationship between river gage height (G; ft.) and total discharge
(Q; m-1s-1) for the Starved Rock reach of the Illinois River. Discharge was measured downstream of
Sheehan Island.

98
Figure 1. Map of Hanson Material Services Corporation backwater near Morris, IL indicating locations of VR2 receivers to quantify
movement in/out of this backwater and between the west and east pits.
East Pit
West Pit
Figure 7.5. Map of Hanson Material Services Corporation (HMSC) backwater near Morris, IL indicating locations of VR2 receivers to quantify movement in/out of this backwater and between the west and east pits.

99
Figure 7.6. The number of fish detected staging in (grey) and moving to or from (black) the HMSC pits,
along with corresponding river discharge and temperature over May 2013. Each period of no fish
detections (number of fish moving or staging is zero) is a likely spawning event when all fish were in the
main channel. Spawning was observed in the reach on 22 May.

100
Figure 7.7. Three period moving averages of upstream (solid line) and downstream (dashed line) Asian
carp movement by date for the entire Illinois River for all fish redetected in 2012 and 2013.

101
CHAPTER 8
Identification of natal environment of adult Asian carps in the Illinois River using otolith microchemistry and stable isotope analysis
Goals: Estimate the relative abundances of resident (Illinois River origin) and immigrant (Mississippi or Missouri river origin) bighead carp and silver carp in four reaches of the Illinois River (Alton, LaGrange, Peoria, and upper river). Characterize timing and patterns of inter-river movement for immigrants. Estimate the proportion of Asian carp that use floodplain lakes along the middle and lower Illinois River as larval and juvenile nursery areas. Justification: Asian carps are known to be reproducing in the Illinois, middle Mississippi, and lower Missouri Rivers. However, the extent to which the Asian carp stock in the Illinois River is derived from recruits from within the Illinois River vs. immigrants from the Mississippi and Missouri Rivers is unknown. Asian carp are also known to use connected floodplain lakes during early life, but the contribution of these habitats to Asian carp recruitment in the Illinois River is also unknown. Knowledge of Asian carp recruitment sources is needed to: 1) assess the degree to which stocks of these species in the Illinois River may be replenished by immigrants from other rivers and the need to expand the geographic scope of enhanced commercial harvest efforts and 2) to direct commercial fishing and other control efforts to target locations that are supporting Asian carp populations. Research Approach: Bighead and silver carps are being collected from each of four reaches of the Illinois River (Alton, LaGrange, Peoria, and upper river). Both asterisci otoliths are extracted from each fish; one otolith per fish is sectioned and analyzed for strontium:calcium ratio (Sr:Ca) using laser ablation-ICPMS and the second otolith is analyzed for stable oxygen and carbon isotope ratios (δ18O and δ13C). Sr:Ca, δ18O and δ13C of the otolith core (which reflects early life history) will be used to infer natal environment for individual fish; changes in Sr:Ca across sectioned otoliths will be used to assess timing and long-term patterns of inter-river movement. Abstract: Water chemistry data continued to indicate that Sr:Ca is consistently higher in the middle
Mississippi and Missouri rivers compared to the Illinois River, thus enabling use of this marker as an
indicator of fish that have immigrated into the Illinois River from these other rivers. Using otolith core
Sr:Ca data, we estimated that 28-53% of adult silver carp and 26-48% of hybrids in the Illinois River were
immigrants that originated in the middle Mississippi or Missouri Rivers. Only 5% of the fish analyzed had
otolith core δ18O and δ13C signatures indicative of use of floodplain lake habitats during early life,
consistent with data from prior years. Among silver carp and hybrids that were immigrants to the Illinois
River, the vast majority originated in the middle Mississippi River; only 2-8% of the total number of silver
carp and hybrids captured in the Illinois River originated in the Missouri River. In contrast to silver carp
and hybrids, otolith core Sr:Ca indicated that 91-98% of bighead carp analyzed originated in the Illinois
River, with 2% originating in the middle Mississippi River, consistent with data from prior years.
Contact: Greg Whitledge, Associate Professor, Southern Illinois University Carbondale, IL; (618) 453-6089; [email protected]

102
Introduction: Asian carps are known to be reproducing in the Illinois, middle Mississippi, and lower
Missouri Rivers. Initial estimates of the extent to which Asian carp stocks in the Illinois River are derived
from recruits from within the Illinois River itself vs. immigrants from the Mississippi and Missouri Rivers
were obtained from otoliths collected during 2010-2011 sampling. We also estimated the contribution
of floodplain lake habitats to Asian carp recruitment in the Illinois River. Asian carps are known to
exhibit substantial inter-annual variation in recruitment and also within-river movement rates by adult
fish. Thus, there is a need to determine whether the principle natal environments of Asian carps in the
Illinois River may also differ among years. Knowledge of Asian carp recruitment sources is also needed
to: 1) determine whether enhanced commercial harvest of Asian carps in the Illinois River is effectively
reducing recruitment of these species within the Illinois River (as indicated by a decrease in the relative
abundance of Illinois River-origin fish), 2) assess the degree to which Asian carp stocks in the Illinois
River may be replenished by immigrants from other rivers (immigration rates are an important
component of population models) and the potential need to expand the geographic scope of enhanced
commercial harvest efforts and 3) direct commercial fishing and other control efforts to target locations
that are supporting Asian carp populations.
Objectives: Estimate the relative abundances of resident (Illinois River origin) and immigrant (Mississippi
or Missouri river origin) bighead carp, silver carp, and hybrids of these two species in four reaches of the
Illinois River (Alton, LaGrange-Peoria, and upper river [upstream from Starved Rock Lock and Dam]) to
assess inter-annual variability in recruitment sources of Asian carps and evaluate potential effects of
enhanced commercial harvest on proportions of resident and immigrant fish. Characterize timing and
patterns of inter-river movement for immigrants. Refine estimates of the proportion of Asian carp that
use floodplain lakes along the middle and lower Illinois River as larval and juvenile nursery areas.
Methods: Adult bighead and silver carps were collected from each of three reaches of the Illinois River
(Alton, LaGrange-Peoria, and upper river) during 2012-2013 by electrofishing and trammel netting.
Caudal fin clips were obtained from each fish and sent to Jim Lamer at Western Illinois University for
identification of bighead carp, silver carp, and hybrids. Both lapilli otoliths were extracted from each
fish. One otolith per fish was sectioned and analyzed for strontium:calcium ratio (Sr:Ca) along a transect
from the core to the edge of the sectioned otolith using laser ablation-ICPMS. A 250 μg subsample from
the core of the second otolith from each fish was obtained using a micromill; a core subsample of this
mass represents otolith carbonate deposited during age-0. The core subsample from the second otolith
from each fish was analyzed for stable oxygen and carbon isotope ratios (δ18O and δ13C) using a
ThermoFinnigan Delta plus XP isotope ratio mass spectrometer interfaced with a Gas Bench II carbonate
analyzer. Previously established relationships between water and otolith Sr:Ca and water and otolith
δ18O for Asian carps were used to characterize expected otolith Sr:Ca and δ18O signatures for fish that
originated in the Illinois, Missouri, and Mississippi rivers and for fish that used floodplain lake habitats
during their early life history. Sr:Ca, δ18O and δ13C of the otolith core (which reflects early life history)
were used to infer natal environment for individual fish. Changes in Sr:Ca across sectioned otoliths were
used to assess timing and long-term patterns of inter-river movement for individual fish.

103
Water samples were collected from the Illinois River (Alton and LaGrange reaches and the upper river),
five of its floodplain lakes, the upper and middle Mississippi River, and the lower Missouri River during
June, August, and October 2010, 2011, 2012, and 2013 to verify persistence of distinct water chemical
signatures among these locations that were observed in prior studies. Water samples were analyzed for
Sr:Ca and stable oxygen isotope ratio (δ18O).
Results and Discussion: Water chemistry data continue to indicate that Sr:Ca is consistently higher in
the middle Mississippi and Missouri rivers compared to the Illinois River, thus enabling use of this
marker as an indicator of fish that have immigrated into the Illinois River from these other rivers. The
water δ18O signature of floodplain lakes frequently differs from that of the Illinois River, enabling use of
δ18O as a marker of Asian carp use of floodplain lake habitats during early life, although flooding can
temporarily eliminate the distinct water δ18O signature of connected floodplain lakes during some years.
Two hundred two adult Asian carp (59 silver carp, 70 bighead carp, 73 hybrids) collected from the Illinois
River during 2012-2013 were analyzed for δ18O and δ13C of the otolith core. All fish identified as bighead
carp based on external morphology were confirmed to be bighead carp based on genetic analysis; all
hybrids had initially been identified as silver carp based on external morphology. Only 5% of the fish
analyzed had otolith core δ18O and δ13C signatures indicative of use of floodplain lake habitats during
early life, consistent with data from prior years. Limited evidence for use of floodplain lake habitats
during early life may be due to the limited number and connectivity of floodplain lakes along the Illinois
River or recent floods that may have temporarily eliminated the distinct signature of connected
floodplain lakes. Our data indicate that most adult Asian carp in the Illinois River used river channel
habitats during their first year of life, suggesting that low-velocity, near-shore areas within the river
represent the predominant nursery habitat for larval and young juvenile Asian carp. Collection of some
adult fish in the upper river that had used floodplain lake habitat during age-0 suggests that these fish
immigrated from downriver where most of the floodplain lakes occur.
Otoliths from adult Asian carp collected from the Illinois River during 2012-2013 were also analyzed for
Sr:Ca to determine river-of-origin. Forty seven percent of adult silver carp and 52% of hybrids had otolith
core (first 10 μm of laser transect) Sr:Ca signatures indicative of Illinois River origin. Using otolith core
Sr:Ca data, we estimated that 28-53% of adult silver carp and 26-48% of hybrids in the Illinois River were
immigrants that originated in the middle Mississippi or Missouri Rivers (the range in our estimate of the
percentage of immigrants reflects some uncertainty in our statistical model used to assign natal
environment to individual fish). We have also observed (based on changes in Sr:Ca across sectioned
otoliths) several silver carp and hybrids that entered, exited, and re-entered the Illinois River from the
Mississippi River at multiple times during their life. Our estimates of percent immigrants for silver carp
and hybrids were slightly higher than the estimated contribution of immigrants to the Illinois River adult
silver carp stock in 2010-2011 (11-39% immigrants). Among silver carp and hybrids that were immigrants
to the Illinois River, the vast majority originated in the middle Mississippi River; only 2-8% of the total
number of silver carp and hybrids captured in the Illinois River originated in the Missouri River. The
percentage of immigrants to the Illinois River declined from downstream to upstream reaches of the
Illinois River for both silver carp and hybrids. Estimates of percent immigrants for silver carp and hybrids

104
combined ranged from 41-75% for the Alton reach, 29-41% for the LaGrange reach, and 3-25% for the
upper river. These results suggest that dams may reduce the replenishment rate of the Asian carp stock
in the upper Illinois River by immigrants from the Mississippi River if control efforts are successful in
reducing Asian carp abundance in the upper Illinois River. In contrast to silver carp and hybrids, otolith
core Sr:Ca indicated that 91-98% of bighead carp analyzed originated in the Illinois River, with 2%
originating in the middle Mississippi River, consistent with data from prior years.
Recommendations: Our results indicate that Asian carp stocks in the Illinois River are primarily
supported by recruitment from within the Illinois River itself, suggesting that control efforts should
continue to focus on the Illinois River. However, the substantial percentage of silver carp and hybrids
that immigrate into the Illinois River continues to suggest that sustainable control of silver carp in the
Illinois River will likely require expanding control (e.g., commercial harvest) efforts for this species to
include the middle Mississippi River. Whether the higher percentage of immigrant silver carp in the
Illinois River compared to prior years is at least partly due to enhanced commercial harvest or if this
simply represents natural year-to-year variation is presently unclear; monitoring to determine the
principle natal environments of Asian carp in the Illinois River during future years could be used to
assess whether control efforts reduce recruitment of Asian carps within the Illinois River.

105
CHAPTER 9
Nutrient composition of Asian Carp harvested from the Illinois River Goal: Determine the proximate and fatty acid composition of Asian carp, compositional plasticity with respect to harvest season and location, and shelf stability of Asian carp sourced from various reaches of the Illinois River in order to determine the best end-uses for meals rendered from these fish. Justification: Identification of markets with great profit potential will incentivize Asian carp fishing efforts and increase the effectiveness of market-driven approaches to control Asian carp populations. A variety of potential end-uses for Asian carp have been identified, including rendering into protein meals for use as animal feedstocks, fertilizers, etc. Rendered carp meals would be similar to marine-derived fish meals, and like these products, would have lower- and higher-value uses depending on their composition. The primary determinants of fish meal/oil quality are nutrient content and composition, contaminant levels, and oxidative stability. These measures are known to vary in marine rendered products by species, season/year, and geographic location of harvest. In order to determine the ideal marketing strategies for carp products, it is necessary to quantify the pertinent compositional variability of the raw material. Research Approach: Silver and bighead carps are being seasonally harvested from the Illinois River, pulverized, and processed to determine total moisture, lipid, protein, and ash content of the carcasses, as well as fatty acid composition of the lipid fraction. Subsamples of the processed carcasses are also being monitored for production of oxidative metabolites (indicators of spoilage) during refrigerated storage. Abstract: To date, we have quantified the proximate and fatty acid composition of silver carp harvest in the Fall of 2010 from the Alton, La Grange, Peoria, and Starved Rock reaches of the Illinois River (see Tables 8-1 and 8-2). Bighead carp appear to be less abundant than silver carp and were only caught in the La Grange and Peoria reaches during the Fall 2010 sampling season. In general, the proximate composition of silver carp (~7-25% lipid, 55-60% protein, 15-25% ash) appears to be quite suitable for rendered into protein meals for livestock feeds. Bighead carp appear to be slightly leaner than silver carp harvested from most regions (5-8% lipid, 65% protein, 24-27% ash), but would also be quite suitable for rendering into protein meals for livestock feeding. Although the ash content of these feeds is higher than what is typically reported for marine-origin fish meals, higher levels of bioavailable calcium and phosphorus might make Asian carp meals particularly attractive for plant-based aquafeeds, wherein these two macrominerals are typically limiting. The fatty acid composition of silver and bighead carp also suggests that aquaculture feeds would be an appropriate, high-value end use for rendered carp meal: Although the total lipid content of Asian carp is lower than those species typically sourced for rendering, the composition of the carp lipid is on par with most marine-origin protein and lipid ingredients (20-25% long-chain polyunsaturated fatty acids). Contact: Jesse Trushenski, Assistant Professor Southern Illinois University Carbondale, 618/536-7761, [email protected] Publications (Appendix):

106
Bowzer, J., Trushenski, J., and Glover, D. C. (2013): Potential of Asian Carp from the Illinois River as a Source of Raw Materials for Fish Meal Production, North American Journal of Aquaculture, 75:3, 404-415.
Bowzer, J., Bergman, A., and Trushenski, J. (2014) Growth Performance of Largemouth Bass Fed Fish
Meal Derived from Asian Carp, North American Journal of Aquaculture, 76:3, 185-189, DOI: 10.1080/15222055.2014.893473
Bowzer, J., Trushenski, J., Rawles, S., Gaylord, T. G., & Barrows, F. T. (2014). Apparent digestibility of
Asian carp‐and common carp‐derived fish meals in feeds for hybrid striped bass Morone saxatilis♀× M. chrysops♂ and rainbow trout Oncorhynchus mykiss. Aquaculture Nutrition.
Bowzer, J. and Trushenski, J. (2015) Growth Performance of Hybrid Striped Bass, Rainbow Trout, and
Cobia Utilizing Asian Carp Meal-Based Aquafeeds, North American Journal of Aquaculture, 77:1, 59-67, DOI: 10.1080/15222055.2014.960117
Bowzer, J. and Trushenski, J. (2015) The Potential of Asian Carp as a Raw Material for Fish Meal
Production. Sustainable Aquaculture Digital. In press.

107
Table 9.1. Proximate composition (means ± SE) of whole silver and bighead carps collected from reaches of the Illinois River Fall 2010.
Location &
Species % DM % Moisture Lipid (%) Ash (%) Protein (%) TL (mm)
Alton S 25.6 ± 0.7 74.4 ± 0.7 11.7 ± 2.0 26.8 ± 1.1 54.8 ± 0.9 568 ± 16.9
La Grange S 25.5 ± 0.4 74.5 ± 0.4 17.8 ± 1.1 21.8 ± 0.3 60.0 ± 0.8 472 ± 6.0
Peoria S 21.7 ± 0.4 78.3 ± 0.4 7.1 ± 0.6 25.2 ± 1.1 65.7 ± 1.2 400 ± 12.3
Starved Rock S 27.5 ± 0.8 72.5 ± 0.8 25.0 ± 1.8 15.5 ± 0.7 55.0 ± 1.3 564 ± 30.8
La Grange B 20.9 ± 0.5 79.1 ± 0.5 7.9 ± 1.3 26.9 ± 0.9 67.1 ± 1.2 813 ± 14.1
Peoria B 18.3 ± 2.3 81.7 ± 2.3 4.9 ± 2.9 24.2 ± 0.8 66.0 ± 2.6 441 ± 19.0
S=silver carp
B=bighead carp

108
Table 9.2. Fatty acid composition (means ± SE) of silver and bighead carps collected from reaches of the Illinois River in the
Fall of 2010.
Reach & Species
Alton S La Grange S Peoria S Starved Rock S La Grange B Peoria B
Total SFA 32.0 ± 0.8 31.6 ± 0.2 32.6 ± 0.4 28.2 ± 0.3 32.2 ± 0.6 32.1 ± 0.3
Total MUFA 32.2 ± 2.1 30.5 ± 0.4 24.7 ± 0.6 36.7 ± 1.2 29.3 ± 1.2 25.9 ± 2.3
Total PUFA 35.9 ± 1.6 37.8 ± 0.5 42.7 ± 0.5 35.1 ± 0.5 38.5 ± 0.7 42.0 ± 2.0
Total MC-PUFA 10.2 ± 0.4 13.3 ± 0.3 11.8 ± 0.5 11.0 ± 0.4 9.3 ± 0.4 9.3 ± 0.3
Total LC-PUFA 21.7 ± 1.6 21.0 ± 0.4 26.9 ± 0.5 18.2 ± 0.6 27.0 ± 1.1 30.3 ± 2.5
(n-3):(n-6) 4.0 ± 0.2 5.2 ± 0.1 4.6 ± 0.1 5.4 ± 0.1 3.2 ± 0.2 3.6 ± 0.0
S=Silver carp
B=Bighead carp

109
CHAPTER 10
Potential Contaminants in Asian Carps of the Illinois River
Goal: To determine if concentrations of selected contaminants in Asian carp from the Illinois River meet regulatory tolerances and guidelines for commerce as food and value-added products, and recreational fish consumption advisories.
Justification: Determining the safety of Asian carp for consumption by humans and food animals is critical to the development of a commercial market.
Research Approach: We used accepted fisheries techniques to capture edible flesh samples of 15 fish of each species from each of 4 pools for comparisons. We also received samples from 27 ground fish provided by colleagues (Trushenski/Bowzer) to examine contaminant concentrations in whole fish relative to fillets; and additional 10 samples collected in 2011 will be analyzed. All samples were analyzed by an accredited chemistry laboratory.
Abstract: Efforts to control invasive bighead (Hypophthalmichthys nobilis) and silver carp (H. molitrix) may include harvest for human consumption. We measured concentrations of arsenic (As), mercury (Hg), and selenium (Se) in fillets from silver and bighead carp collected from the lower Illinois River, Illinois, USA, to determine whether concentrations were of health concern and differed by species, size, and location. Concentrations of total As were below detection limits in most bighead (92%) and silver (77%) carp fillets, whereas inorganic As was below detection limits in all samples. Mean Hg concentrations were greater in bighead (0.068mgkg(-1)) than in silver carp (0.035mgkg(-1)), and were smallest in carp from the confluence of the Illinois and Mississippi rivers. Mercury concentrations in fillets were positively correlated with body mass in both species. Concentrations of Hg were below the US Food and Drug Administration's (USFDA) action level (1ppm as methyl-Hg); however, concentrations in some bighead (70%) and silver (12%) carp fell within the range that would invoke a recommendation to limit meals in sensitive cohorts. Mean Se concentrations were greater in silver (0.332mgkg(-1)) than in bighead (0.281mgkg(-1)) carp fillets, and were below the 1.5mgkg(-1) limit for an unrestricted number of meals/month. The mean molar ratio of Se:Hg in fillets was lower in bighead (14.0) than in silver (29.1) carp and was negatively correlated with mass in both species Concentrations of Hg in bighead and silver carp fillets should be considered when assessing the risks associated with the use of these species as a protein source.
Publications (Appendix):
Levengood, J. M., Soucek, D. J., Dickinson, A., Sass, G. G., & Epifanio, J. M. (2013). Spatial and
interspecific patterns in persistent contaminant loads in bighead and silver carp from the
Illinois River. Ecotoxicology, 22(7), 1174-1182.
Contact: Jeff Levengood, IL Natural History Survey, University of Illinois, 1816 S Oak St, Champaign, IL 61820. 217/333-6767

110
Figure 10.1. Methylmercury concentrations in fillets of Asian carps from 3 pools on the Illinois River, 2010. The blue line represents the threshold above which the most sensitive groups (women of child-bearing age and children 15 years old and younger) are advised to limit consumption to 1 meal/week. The red line represents the threshold above which the most sensitive groups (women of child-bearing age and children 15 years old and younger) are advised to limit consumption to 1 meal/month. The FDA Action Level represents the concentration at which the agency will take legal action to remove the product from the market. Sample sizes are n= 15 per species/pool.

111
Figure 10-2. Total PCB concentrations in sample of ground, whole Asian carps from 4 pools on the Illinois River, 2010. The blue line represents the threshold above which the most sensitive groups (women of child-bearing age and children 15 years old and younger) are advised to limit consumption to 1 meal/month. The FDA Action Level represents the concentration at which the agency will take legal action to remove the product from the market. Samples size are n= 5 except n= 2 for bighead carp from Peoria pool.

112
CHAPTER 11
Increasing Commercial Harvest to Reduce Density-Dependent Effects and Movement of Asian Carp Goal: Hosting a summit that brings together experts and stakeholders to explore the opportunities for and impediments to commercial harvesting of Asian carp. Justification: When considering the past and present management efforts for Asian carp, one strategy that has not received widespread attention is the potential for marketing these fish commercially. Because Asian carp are relative newcomers to our waters, there has been limited effort by commercial entities in the Mississippi Basin. Likewise, because creating commercial markets to control unwanted species such as Asian carp is a non-traditional management approach, there are few examples of this strategy for managers to follow. In short, both entities are “starting from scratch.” This summit allowed for an understanding of the various issues by all stakeholders including potentially conflicting motivations and goals. Research Approach: The summit was held at the Great Rivers Research and Education Center, which is located at the confluence of the Illinois, Missouri and Mississippi rivers in Grafton, IL. A summit advisory group (SAG) was established to help identify the pertinent stakeholders and to develop the agenda of the 2-day meeting, which ultimately consisted of a mixture of presentations on current state of knowledge and facilitated break-out sessions to allow for in-depth exploration of the topic. Proceedings from the summit were published and made available to the summit participants and the general public. Abstract: The Asian Carp Marketing Summit brought together experts from eight states including representatives from restaurants, commercial fishing, processing and related businesses, as well as agencies, and academic institutions. Planned as a forum for stakeholders to identify obstacles and opportunities associated with commercial marketing of Asian carp as a way to reduce their numbers in the Mississippi River Basin, the summit fostered development of a thriving expert network and efforts are on track to turn the conclusions reached at the summit into action. At the summit, participants agreed that high-value Asian carp fillets marketed to restaurants and retailers may provide the financial incentive for extensive harvesting of these fish. Looking to have immediate impact, they also recommended that whole fish be exported in high numbers to Asian markets, where these species are already popular food fish. Finally, they recommended converting Asian carp by-products into pet food or treats to eliminate waste and maximize profit opportunities. The Illinois departments of Natural Resources (IDNR) and Commerce and Economic Opportunity (DCEO) are now developing programs to help further these goals. Contact: Patrice M. Charlebois, AIS Coordinator, Illinois-Indiana Sea Grant. Ph: 847-242-6441. Email: [email protected].

113
CHAPTER 12
Marketing of Asian Carp Goal: The goal of this project is to estimate the potential market size for Asian carp for human consumption, both as a restaurant product and for at home consumption. The size of the potential market is an important determinant of the value of the fish and it affects the net costs of the eradication efforts. Justification: Though there are sporadic and isolated efforts to introduce the Asian Carp to the American consumer, particularly on the part of Chefs, a comprehensive evaluation of the market potential for the fish has never been conducted. In particular, there is no understanding of what the potential barriers to widespread consumption of Asian carp are, what preconceptions about this fish exist, what information would help in the marketing efforts for the carp, and what forms of preparation of the fish are acceptable to the public. Abstract: Since a substantial portion of US consumers’ fish expenditures occur at restaurants (see for example Food and Agricultural Commodity Consumption in the United States: Looking Ahead to 2020. By Biing-Hwan Lin, Jayachandran N. Variyam, Jane Allshouse, and John Cromartie, Food and Rural Economics Division, Economic Research Service, U.S. Department of Agriculture, Agricultural Economic Report No. 820), we followed a double pronged approach. We developed a survey of consumers to obtain information on the marketability of Asian Carp, and we interviewed chefs to ascertain their degree of interest in the fish and their concerns. A survey of the relevant literature was completed and a theoretical model (neophobia towards new foods was used to analyze the survey data. This is the first national survey on the attitudes of US fish consumers towards Asain carp. Contrary to the negative connotation attached to carp, most participants were willing to try a free sample of Asian carp. We also found that people would be willing to pay for it. The second approach was the Chef’s component. We visited with Chefs at Kendall College’s Culinary School in Chicago where they prepared carp and relayed their thoughts about the fish. Their main concerns were related to the contaminants in the carp, but they were enthusiastic about the invasivore aspect of the project. This suggests that emphasizing the low levels of contaminants of the fish will be very important for the restaurant market. In addition, Chef Philippe Parola visited Carbondale in early September 2011 and gave a demonstration on cooking the carp to community members and SIU students. Publication (Appendix):
Varble, S., & Secchi, S. (2013). Human consumption as an invasive species management strategy. A
preliminary assessment of the marketing potential of invasive Asian carp in the
US. Appetite, 65, 58-67.
Contact: Silvia Secchi, Assistant Professor, Southern Illinois University Carbondale, (618)453-1714, E-mail: [email protected]
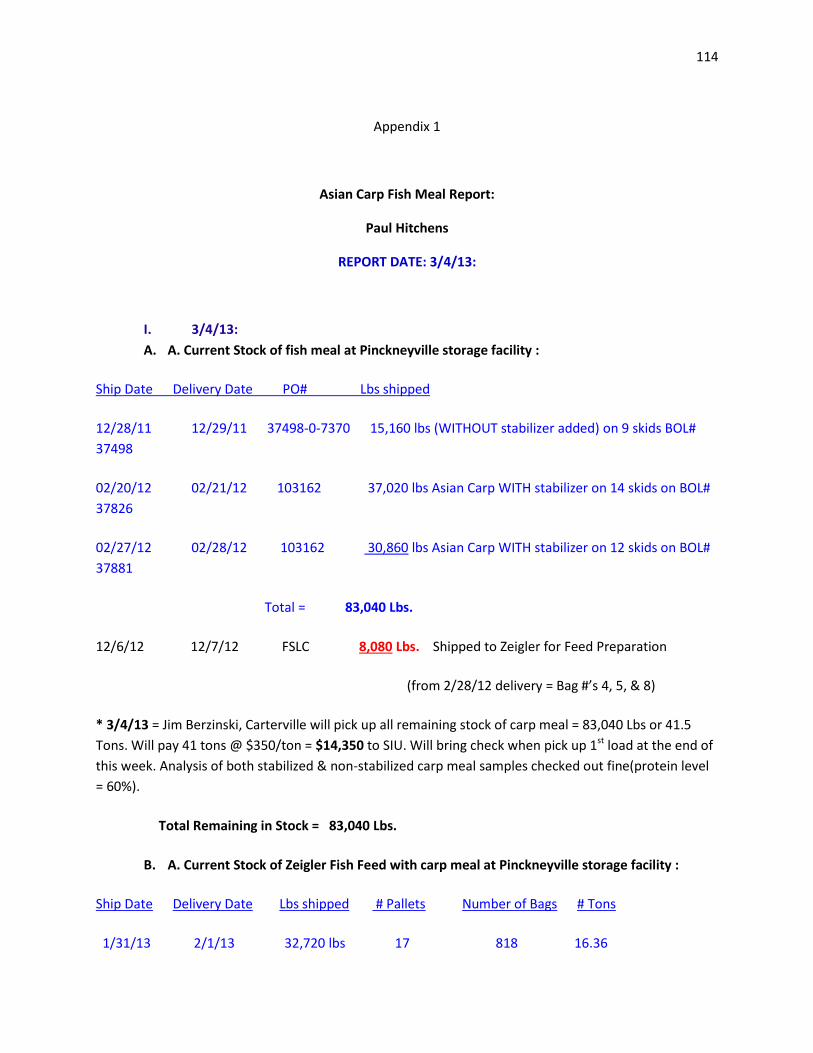
114
Appendix 1
Asian Carp Fish Meal Report:
Paul Hitchens
REPORT DATE: 3/4/13:
I. 3/4/13:
A. A. Current Stock of fish meal at Pinckneyville storage facility :
Ship Date Delivery Date PO# Lbs shipped
12/28/11 12/29/11 37498-0-7370 15,160 lbs (WITHOUT stabilizer added) on 9 skids BOL#
37498
02/20/12 02/21/12 103162 37,020 lbs Asian Carp WITH stabilizer on 14 skids on BOL#
37826
02/27/12 02/28/12 103162 30,860 lbs Asian Carp WITH stabilizer on 12 skids on BOL#
37881
Total = 83,040 Lbs.
12/6/12 12/7/12 FSLC 8,080 Lbs. Shipped to Zeigler for Feed Preparation
(from 2/28/12 delivery = Bag #’s 4, 5, & 8)
* 3/4/13 = Jim Berzinski, Carterville will pick up all remaining stock of carp meal = 83,040 Lbs or 41.5
Tons. Will pay 41 tons @ $350/ton = $14,350 to SIU. Will bring check when pick up 1st load at the end of
this week. Analysis of both stabilized & non-stabilized carp meal samples checked out fine(protein level
= 60%).
Total Remaining in Stock = 83,040 Lbs.
B. A. Current Stock of Zeigler Fish Feed with carp meal at Pinckneyville storage facility :
Ship Date Delivery Date Lbs shipped # Pallets Number of Bags # Tons
1/31/13 2/1/13 32,720 lbs 17 818 16.36

115
1/31/13: Meeting with Timpner Farm & Waeltz Farms to organize production trials in both farms for feed tesing on HSB cage culture. Explained procedures and objectives of study.
Bags will be split up between the two HSB producers (Timpner Farm & Waeltz Farms) for production testing this starting this spring.
Control bags for production tests have not arrived from Zeigler to date.
II. 2/12/13: Gray Magee, Grafton - Progress Report
1. Plan on construction of plant this March 2013.
2. Will produce fish meal only.
3. In connection with Caterpillar group in Peoria & Falcon Protein Products.
4. Will be no odor or waste.
5. Estimated production figures of 15,000,000 Lbs. of carp meal/year.
6. Will be able to process 50-60,000 Lbs./day.
7. Will E-Mail letter with further update to me & Dr. Garvey.
8. Interested in buying carp meal & will send sample for analysis.
III. 2/13/13:
1. Mailed Gray Magee samples for analysis.
IV. 2/13/13:
1. Phone conversation with Rick Smith@ Big Rivers concerning USDA Asian carp
certification for USAID/FAS project. Retrieved data on whole fish prices, shipping,
supplies, etc. Production figures from 2012
a. Big Head & Silver = 3,110,000
V. 2/13/13:
1. Called Jeff Gay for results on carp meal analysis and progress on purchasing of excess
carp meal in Pinckneyville freezer unit = Does not want to buy any, due to age of the
product.
VI. 2/13/13:
1. Phone conversation with Jill Rendleman concerning carp meal for fertilizer. Discussed
price & amount for sales. Needs organic only & sample for analysis. Concern of
stabilizer & excessive heat.
VII. 2/14/13:
1. Called Jeff Gay for results on carp meal analysis and data on processing for
maximum temperatures, stabilizer ingredient, etc. for fertilizer sales.
2. Stabilizer = Ethoxyquin @ 500 ppm(I Lb./Ton) & T= 275 F.
a. Dissipates out over time. Probably none left in product.
b. Commonly used in Pet Foods.
VIII. 2/15/13:
1. Called Maschhoff for possible carp meal sale. Want sample.
IX. 2/15/13:

116
1. Phone conversation with Mike Schafer @ Schafer Fisheries concerning USDA Asian
carp certification for USAID/FAS project. Retrieved data on processed & value added
fish prices, shipping, supplies, etc. Production figures from 2012:
a. Big Head = 1,740,045
b. Silver = 4,382,461
c. Grass Carp = 338,949
d. Common Carp = 1,833,226
e. Total = 8,294,681
X. 2/15/13:
1. Meeting with Jill Rendleman at farm for sample delivery & sales possibilities/price.
XI. 2/18/13:
1. Mailed Maschhof samples for analysis.
XII. 2/18/13:
1. Called Jim Berzinski for possible carp meal sale in hog diets.
2. Want sample. Will meet @ freezer tomorrow to promote product & collect samples.
XIII. 2/19/13:
1. Met Berzinski @ freezer in P’Ville to promote product & collect samples.
2. Interested in buying all for $350/ton if analysis verifies quality. Waiting results.
XIV. 2/20/13:
1. Phone conversation with Rick Smith @ Big Rivers. Low fishing month for January, as
Lisa McKee is out of commission from heart attack suffered over holidays. Is
recovering, but slowly. Actual Lbs. of product purchased will have to wait until she
gets back.
2. Griggsville packing plant is should be ready to receive product in March or April,
2013.
XV. IATS Carp Sales for February 2013 Report = 1/31/13 through 2/28/13 :
1. Coordinated 3 carp shipments for food fish sales to 1 Toronto buyer/hauler with Big
Rivers:
2. Channel Catfish = 0 Lbs. @ $1.00/Lb.
3. Common Carp (Live) = 2,056 Lbs. @ $0.70/Lb.
4. Buffalo Carp (Live) = 0Lbs. @ $0.90/Lb.
5. Big Head (On Ice) = 11,177 Lbs. @ $0.35/Lb.
6. Grass Carp (On Ice) = 2,056 Lbs. @ $0.55/Lb.
7. Total Asian carp sold = 13,233 Lbs.
8. Total Lbs. sold through IATS = 15,109 Lbs.
9. IATS will receive $0.05/Lb. on brokerage fees.

117
APPENDIX II
PUBLICATIONS TO FOLLOW: Bowzer, J. and Trushenski, J. (2015) Growth Performance of Hybrid Striped Bass, Rainbow Trout, and
Cobia Utilizing Asian Carp Meal-Based Aquafeeds, North American Journal of Aquaculture, 77:1, 59-67, DOI: 10.1080/15222055.2014.960117
Bowzer, J. and Trushenski, J. (2015) The Potential of Asian Carp as a Raw Material for Fish Meal
Production. Sustainable Aquaculture Digital. In press.
Bowzer, J., Bergman, A., and Trushenski, J. (2014) Growth Performance of Largemouth Bass Fed Fish Meal Derived from Asian Carp, North American Journal of Aquaculture, 76:3, 185-189, DOI: 10.1080/15222055.2014.893473
Bowzer, J., Trushenski, J., and Glover, D. C. (2013): Potential of Asian Carp from the Illinois River as a Source of Raw Materials for Fish Meal Production, North American Journal of Aquaculture, 75:3, 404-415.
Bowzer, J., Trushenski, J., Rawles, S., Gaylord, T. G., & Barrows, F. T. (2014). Apparent digestibility of Asian carp‐and common carp‐derived fish meals in feeds for hybrid striped bass Morone saxatilis♀× M. chrysops♂ and rainbow trout Oncorhynchus mykiss. Aquaculture Nutrition.
Levengood, J. M., Soucek, D. J., Dickinson, A., Sass, G. G., & Epifanio, J. M. (2013). Spatial and
interspecific patterns in persistent contaminant loads in bighead and silver carp from the Illinois
River. Ecotoxicology, 22(7), 1174-1182.
Tsehaye, I., Catalano, M., Sass, G., Glover, D., & Roth, B. (2013). Prospects for fishery-induced collapse of
invasive Asian carp in the Illinois River. Fisheries,38(10), 445-454.
Varble, S., & Secchi, S. (2013). Human consumption as an invasive species management strategy. A
preliminary assessment of the marketing potential of invasive Asian carp in the US. Appetite, 65,
58-67.

This article was downloaded by: [Southern Illinois University]On: 27 June 2013, At: 11:56Publisher: Taylor & FrancisInforma Ltd Registered in England and Wales Registered Number: 1072954 Registered office: Mortimer House,37-41 Mortimer Street, London W1T 3JH, UK
North American Journal of AquaculturePublication details, including instructions for authors and subscription information:http://www.tandfonline.com/loi/unaj20
Potential of Asian Carp from the Illinois River as aSource of Raw Materials for Fish Meal ProductionJohn Bowzer a , Jesse Trushenski a & David C. Glover aa Center for Fisheries, Aquaculture, and Aquatic Sciences , Southern Illinois UniversityCarbondale , Life Science II, Room 173, 1125 Lincoln Drive, Carbondale , Illinois ,62901-6511 , USAPublished online: 20 Jun 2013.
To cite this article: John Bowzer , Jesse Trushenski & David C. Glover (2013): Potential of Asian Carp from the Illinois River asa Source of Raw Materials for Fish Meal Production, North American Journal of Aquaculture, 75:3, 404-415
To link to this article: http://dx.doi.org/10.1080/15222055.2013.793634
PLEASE SCROLL DOWN FOR ARTICLE
Full terms and conditions of use: http://www.tandfonline.com/page/terms-and-conditions
This article may be used for research, teaching, and private study purposes. Any substantial or systematicreproduction, redistribution, reselling, loan, sub-licensing, systematic supply, or distribution in any form toanyone is expressly forbidden.
The publisher does not give any warranty express or implied or make any representation that the contentswill be complete or accurate or up to date. The accuracy of any instructions, formulae, and drug doses shouldbe independently verified with primary sources. The publisher shall not be liable for any loss, actions, claims,proceedings, demand, or costs or damages whatsoever or howsoever caused arising directly or indirectly inconnection with or arising out of the use of this material.

North American Journal of Aquaculture 75:404–415, 2013C© American Fisheries Society 2013ISSN: 1522-2055 print / 1548-8454 onlineDOI: 10.1080/15222055.2013.793634
ARTICLE
Potential of Asian Carp from the Illinois River as a Sourceof Raw Materials for Fish Meal Production
John Bowzer, Jesse Trushenski,* and David C. GloverCenter for Fisheries, Aquaculture, and Aquatic Sciences, Southern Illinois University Carbondale,Life Science II, Room 173, 1125 Lincoln Drive, Carbondale, Illinois 62901-6511, USA
AbstractIncentivizing overfishing through the creation of high-value markets for Silver Carp Hypophthalmichthys molitrix
and Bighead Carp H. nobilis has been proposed as a management strategy for controlling Asian carp in the IllinoisRiver. Asian carp may be rendered into a protein-dense fish meal, and one of the most attractive, high-value enduses for such a product is aquafeed manufacturing. However, the nutritional content and shelf stability of Asian carpas a raw material must be determined to assess its suitability for rendering and subsequent use as a protein sourcein aquafeeds, which was the focus of this study. To determine seasonal, geographical, and species variation in bodycomposition, fatty acids, and oxidative stability, Asian carp were collected from five reaches of the Illinois Riverduring the fall, spring, and summer (up to 12 individuals of each species per reach per season) and analyzed. Slightgeographical, seasonal, and species variation exists in the body composition and fatty acid profiles of adult Asian carpfrom the Illinois River. There was an apparent trend of increasing lipid content from lower to upper reaches and fromfall to summer. Bighead Carp tended to be leaner (higher protein, moisture, and ash content) than Silver Carp (higherlipid content). Although Asian carp generally appear to be a good source of long-chain polyunsaturated fatty acidsregardless of capture location or season, the concentration of these nutrients was highest in the fall. Oxidative stabilityanalysis indicated Asian carp meal will need stabilizers to increase shelf life. Collectively, our results suggest Asiancarp-based fish meals would be nutritionally suitable for use in aquafeeds, if precautions are taken to stabilize theproduct during storage. Creating demand for carp meal in the aquafeed manufacturing sector may prove a valuablestrategy for aiding in the control of Asian carp populations in the Illinois River.
Following the rapid expansion of populations of SilverCarp Hypophthalmichthys molitrix and Bighead Carp H. nobilis(Chick and Pegg 2001), hereafter referred to as Asian carp, inthe Mississippi River basin, a variety of management strategiesaimed at controlling their movement and reducing their densityhave been suggested. These strategies include behavioral barri-ers (e.g., strobe lights, acoustic deterrents, air bubble curtains,electrical barriers), physical barriers (e.g., vertical drops, rotat-ing drums, floating curtains), and chemical barriers (e.g., lowoxygen, carbon dioxide; Conover et al. 2007; Rach et al. 2009).All of these approaches have been considered for controllingAsian carp in the Illinois River, a focal point for Asian carp con-trol because of the hydrologic connection formed between theMississippi River basin and the Great Lakes basin via the Des
*Corresponding author: [email protected] December 5, 2012; accepted April 2, 2013
Plaines River and Chicago Area Waterway System (CAWS). Aseries of electrical deterrence barriers are currently in place inthe CAWS (Moy et al. 2011), and an intensive surveillance pro-gram is in place to monitor the system for Asian carp (ACRCC2012). Additional control efforts in the Illinois River are pri-marily focused on harvest and chemical eradication (Rach et al.2009; ACRCC 2012). Although this “all-of-the-above” manage-ment approach appears diffuse rather than strategic, a redundantmultistrategy approach is likely necessary to effectively sup-press Asian carp populations in the Illinois River.
Harvest-based control efforts can be augmented by harness-ing potential market forces to incentivize overfishing, but sub-sidies, low interest loans, or contract fisheries may be necessaryuntil the market is fully developed (Conover et al. 2007). Asian
404
Dow
nloa
ded
by [
Sout
hern
Illi
nois
Uni
vers
ity]
at 1
1:56
27
June
201
3

ASIAN CARP IN FISH MEAL PRODUCTION 405
carp are not favored food fish in the United States and, therefore,industrial end uses and markets are likely to generate greaterdemand. A considerable volume of Asian carp is currently be-ing exported from Illinois to China for human consumption,but transportation costs and logistics limit this approach andits ability to drive harvest pressure to control carp populations.Like other fishes with limited seafood market potential (e.g.,menhadens, anchovies, herrings), Asian carp can be rendered toproduce nutrient-dense fish meals. Fish meals are rendered pro-tein products derived from fish carcasses or offal. These productsare primarily used as fertilizers or as feed ingredients in com-panion animal and livestock feeds. At this time, Asian carp areprimarily processed into fertilizers, but it may be possible totarget the higher value uses in the animal feeds industry, in par-ticular aquafeeds. An Asian carp meal has several advantagesover other alternative feedstuffs in aquafeed production becauseof its similarity to traditional, marine-origin fish meals that areconsidered ideal proteins in many ways. Fish meal replacementin aquafeeds presents a variety of challenges. Fish have a higherprotein demand relative to other livestock (Keembiyehetty andGatlin 1992), and protein tends to be the most expensive dietarycomponent. Aquafeed manufacturers have relied on fish mealas a protein-dense ingredient to meet this demand, but the ris-ing cost of fish meal has forced feed manufactures to explorealternative sources.
Fish meal replacement can be difficult depending on the qual-ities of the alternative feedstuff. For example, soybean meal isone of the most promising plant protein sources as a fish mealalternative because of its favorable amino acid profile and rela-tively protein content compared with other plant-derived proteinmeals (Gatlin et al. 2007). Despite the routine use of soy prod-ucts in fish feeds (Hendricks 2002), high inclusion levels canconfer undesired attributes to the feeds (Kaushik 2008), result-ing in poor palatability (Adelizi et al. 1998), low feed conversionefficiency (Davies and Morris 1997), reduced mineral availabil-ity (Trushenski et al. 2006), and intestinal antinutritional ef-fects (Ostaszewska et al. 2005; Heikkinen et al. 2006; Iwashitaet al. 2008; Santigosa et al. 2008). In addition to soy prod-ucts, a variety of other plant-based (e.g., canola, corn, wheat)and animal-based (e.g., poultry, blood, feather) feedstuffs havebeen explored. However, the chemical composition, digestibil-ity, palatability, antinutritional factors, nutrient utilization, orfunctional inclusion of these feedstuffs pose challenges to in-corporating them into aquafeeds (Glencross et al. 2007). AnAsian carp meal could be an ideal alternative because it mimicstraditional fish meal sources and is unlikely to exhibit the unde-sirable attributes of other alternatives. Furthermore, the ecolog-ical integrity of the Mississippi River basin would also benefitfrom the increased removal of these invasive fish.
The global supply of fish meal remains static at 5–6 mil-lion metric tons/year, and the aquaculture sector is the largestconsumer (approximately 60%) of fish meal in the world, eventhough fish meal use in aquafeeds (in terms of dietary inclu-sion rates) has slowly decreased since 2006 (FAO 2012). Asthe aquaculture industry continues to grow, the combination of
a static supply, high demand, and overdependence of aquafeedmanufacturers on fish meal has led to a dramatic increase in feedcost. Fish meal prices doubled from US$694 to $1,379/metricton between March 2007 and March 2008 (Tacon and Metian2008), and current prices are approaching $2,000/metric ton(FAO 2013). Although the use of fish meal in aquafeeds is pre-dicted to decrease in the future due to an improved knowledgeof the digestive processes and nutritional requirements of manyfarm-raised fishes (FAO 2012), fish meal will continue to play acritical role in aquafeed production, particularly for carnivorousspecies. Thus, the aquaculture industry could benefit from anunderutilized alternative fish meal source such as Asian carp.
Increased demand for fish meal developed from Asian carpwould provide an incentive for commercial fishers to capturelarge quantities of these fishes, facilitating population control(Conover et al. 2007). Modeling predictions have suggested thatharvest of both small and large Asian carp is essential to theircontrol (Garvey et al. 2007, 2012). Given that current fishingefforts are aimed primarily at large fish for human consump-tion markets, Asian carp meal would also incentivize harvest ofsmaller and younger fish. Harvest enhancement is also attrac-tive in that it could reduce the need for costly and unpopularchemical eradication strategies (e.g., Vasquez et al. 2012) whilesimultaneously revitalizing the regional commercial fishing in-dustry. It has also been suggested that the only viable solution tocontrol established populations of Asian carp in the short termis through enhanced harvest efforts (Conover et al. 2007). How-ever, demand for Asian carp meal is dependent on the abilityto produce a stable supply and quality rendered product. Thenutritional composition and associated value of traditional re-duction fisheries (i.e., fisheries that process their catch into fishmeal or fish oil) landings are known to vary by species as well asharvest location and season (Bragadottir et al. 2004; Boran et al.2008). Furthermore, fish meal is more susceptible to oxidativespoilage than other protein meals due to its high surface-area-to-volume ratio and higher concentrations of unsaturated fattyacids (El-Lakany and March 1974; Boran et al. 2008). There-fore, the variability in nutritional value and protection againstoxidation are critical factors in determining the market value ofAsian carp meal as a feedstuff as well as its potential to facil-itate the control of Asian carp populations and to support theaquafeed industry.
This study was designed to determine the suitability of ren-dering Asian carp into fish meal as a feedstuff for aquafeeds andbriefly examine its potential to control carp populations throughoverharvest to support fish meal production. To assess the appro-priateness of Asian carp as a feedstuff for aquafeed production,the species-related, seasonal, and geographic variation in bodycomposition and storage stability were evaluated.
METHODSTo assess taxonomic, seasonal, and geographic variation in
the composition of Asian carp, Bighead Carp and Silver Carpwere collected seasonally during fall (2010), spring (2011), and
Dow
nloa
ded
by [
Sout
hern
Illi
nois
Uni
vers
ity]
at 1
1:56
27
June
201
3

406 BOWZER ET AL.
TABLE 1. Numbers of Silver and Bighead carps harvested from each reach of the Illinois River in fall 2010, spring 2011, and summer 2011.
Harvest location
Season Species Alton La Grange Peoria Starved Rock Marseilles
Fall Silver 12 12 12 12 0Bighead 0 2 12 0 0
Spring Silver 12 12 12 12 10Bighead 0 0 0 12 12
Summer Silver 12 12 12 12 12Bighead 10 10 12 12 12
summer (2011) from five reaches of the Illinois River (up to 12fish of each species per reach per season; Table 1). The reacheswere separated by lock and dam complexes, and consisted ofAlton, La Grange, Peoria, Starved Rock, and Marseilles. Fishwere harvested using trammel nets and pulsed DC electrofish-ing, and commercial fishers assisted with several collections.Fish were transported on ice to the Center for Fisheries, Aqua-culture, and Aquatic Sciences at Southern Illinois UniversityCarbondale (Carbondale, Illinois), where the carcasses werefrozen (–20◦C) prior to compositional analysis.
Carcasses were individually homogenized prior to analy-sis. Due to the large body size and thick bones of Asian carp,frozen carcasses were first cut into pieces (∼5-cm cubes) usinga butcher’s bone saw. The partially thawed pieces were then ho-mogenized in a knife mill (Knife Mill GM 300; Retsch, Haan,Germany). A 200-g subsample of the resulting homogenate wascollected and stored frozen until compositional analysis. Somefish had to be homogenized in batches due to their large size. Inthese cases, batches were combined in a large bowl and mixedthoroughly by hand prior to subsample collection.
The subsamples were lyophilized (Freezone 6; Labconco,Kansas City, Missouri) to determine moisture content andsubsequently pulverized using a coffee–spice grinder fordetermination of protein, ash, and lipid content. Total lipid wasdetermined gravimetrically following chloroform–methanolextraction modified from Folch et al. (1957). Resultant lipidfractions were analyzed for fatty acid composition accordingto the procedures described by Laporte and Trushenski (2011).Briefly, samples were subjected to acid-catalyzed transmethy-lation performed overnight at 50◦C as described by Christie(1982), and the resultant fatty acid methyl esters (FAME)were separated using a Shimadzu GC-17A gas chromatograph(Shimadzu Scientific Instruments, Kyoto, Japan) equipped witha flame ionization detector fitted with a permanently bondedpolyethylene glycol, fused silica capillary column (Omegawax250, 30 m × 0.25 mm ID, 0.25-µm film; Sigma Aldrich, St.Louis, Missouri). The injection volume was 1.0 µL, with heliumas the carrier gas (30 cm/s, 205◦C), and an injector temperatureof 250◦C. A split injection technique (100:1) was used, with atemperature program as follows: 50◦C held for 2 min, increasedto 220◦C at 4◦C/min, and held at 220◦C for 15 min. Individual
FAME were identified by reference to external standards(Supelco 37 Component FAME Mix, PUFAs-1, and PUFAs-3;Supelco, Bellefonte, Pennsylvania). Ash content was deter-mined gravimetrically after incineration in a muffle furnacefor 4 h at 650◦C. A LECO protein analyzer (FP-528; LECOCorporation, St. Joseph, Michigan) was used to determineprotein content.
To estimate oxidative stability of Asian carp fish meal, thesubsamples of lyophilized, ground Asian carp were placed in arefrigerator (0, 2, 4, and 8 weeks) and analyzed for the presenceof peroxides and aldehydes with Peroxysafe and Aldesafe col-orimetric assay kits (SafTest, Phoenix, Arizona). The sampleswere stored at –80◦C until analysis, and all peroxide–aldehydeconcentrations were standardized for whole-body lipid content(Folch et al. 1957). These values were compared with those ofa commercially available, stabilized fish meal (Special Selectmenhaden fish meal; Omega Protein, Houston, Texas) storedunder the same conditions.
Individual fish served as the experimental units for all statis-tical analyses (n = 12). A factorial analysis was not possible dueto missing combinations of independent variables as a result ofincomplete sampling (Table 1). As such, a nested ANOVA de-sign was used within the generalized linear mixed-model frame-work (GLIMMIX procedures) of the Statistical Analysis Systemversion 9.2 (SAS Institute, Cary, North Carolina) to determinewhether there were differences in proximate composition amonglocations within each season as well as among seasons withina specific location; separate species-specific models were usedfor moisture, protein, lipid, and ash content. These data werealso analyzed using a nested ANOVA within the mixed-modelframework to determine whether differences in proximate com-position existed between species within a specific location andharvest season. A one-way ANOVA was used to determine dif-ferences among species across seasons and locations. Linearregression was used to determine the relationship between to-tal length and body composition of Asian carp. Individual fishcollected during the fall sample season were used to determineoxidative stability of Asian carp meals compared with that ofa stabilized fish meal control using repeated-measures mixed-model analysis. In all cases, differences were considered signif-icant at an α-level of 0.05.
Dow
nloa
ded
by [
Sout
hern
Illi
nois
Uni
vers
ity]
at 1
1:56
27
June
201
3

ASIAN CARP IN FISH MEAL PRODUCTION 407
TABLE 2. Proximate composition (%) of Asian carp harvested seasonally from the Illinois River (fall 2010–summer 2011) and pooled across all five harvestlocations (Alton, La Grange, Peoria, Starved Rock, and Marseilles). Numeric labels indicate mean percent composition of the intact carcasses (i.e., wet matterbasis); numbers may not add to 100% because of minor amounts of carbohydrate not analyzed and rounding errors. Letters indicate significant differences withinspecies across seasons at P < 0.05.
Seasons
Species Composition Fall Spring Summer
Silver Carp Moisture 74.9 ± 0.4 z 71.0 ± 0.4 y 69.2 ± 0.4 xProtein 14.8 ± 0.8 y 15.7 ± 0.7 z 16.3 ± 0.7 zLipid 3.9 ± 1.1 y 6.1 ± 1.0 z 7.4 ± 1.0 zAsh 5.6 ± 0.6 z 6.0 ± 0.5 z 5.6 ± 0.5 y
Bighead Carp Moisture 80.4 ± 0.8 z 78.5 ± 0.4 z 76.7 ± 0.3 yProtein 13.1 ± 1.8 zy 13.4 ± 0.9 y 15.5 ± 0.6 zLipid 1.3 ± 1.5 2.0 ± 0.8 2.3 ± 0.5Ash 5.0 ± 1.3 z 4.5 ± 0.7 y 4.8 ± 0.5 y
RESULTSThere were significant seasonal differences in body compo-
sition (Table 2) and FAME groups (Figure 1) in Asian carp fromthe Illinois River. Similar trends were observed for both Silver
FIGURE 1. Fatty acid composition (% FAME) of Asian carp collected sea-sonally from the Illinois River (fall 2010–summer 2011). Data were pooledacross all five harvest locations (Alton, La Grange, Peoria, Starved Rock, andMarseilles). SFAs = saturated fatty acids (no double bonds), MUFAs = mo-nounsaturated fatty acids (one double bond), PUFAs = polyunsaturated fattyacids (two or more double bonds), MC-PUFAs = medium-chain polyunsatu-rated fatty acids (18 carbon atoms, two or more double bonds), LC-PUFAs =long-chain polyunsaturated fatty acids (20 or 22 carbon atoms, three or moredouble bonds). Different letters indicate significant differences within speciesacross seasons at P < 0.05; error bars indicate SE.
Carp and Bighead Carp: moisture, protein, and ash decreasedacross harvest seasons, fall to summer, while lipid increased.Saturated fatty acids (SFAs) and monounsaturated fatty acids(MUFAs) increased over the same time period, while polyunsat-urated fatty acids (PUFAs), medium-chain polyunsaturated fattyacids (MC-PUFAs), long-chain polyunsaturated fatty acids (LC-PUFAs), n-3, n-6, and the ratio of n-3 to n-6 (n-3:n-6) decreased.
Geographical differences in body composition and FAMEgroups within each season were also observed. Silver Carpdemonstrated similar patterns among seasons in body compo-sition: moisture and ash content of Silver Carp decreased fromlower reaches to upper reaches (Alton to Marseilles), while lipidincreased (Table 3). However, Silver Carp from the Peoria Reachdid not follow these general trends in fall and spring. Proteincontent of Silver Carp within each season varied geographicallywith no apparent trends. The FAME groups for Silver Carp didnot demonstrate any trends during fall, but spring and summerharvest periods showed similar geographic trends (Table 4). Sat-urated fatty acids decreased from lower to upper reaches of theIllinois River, while PUFAs, MC-PUFAs, LC-PUFAs, n-3, andn-6 increased moving up the river, peaking in Peoria before de-creasing again (except for the n-6 group in spring, where therewere no significant differences). Geographical differences forBighead Carp were limited to the summer harvest period dueto data gaps in fall and spring, and no trends were apparentin the body composition of Bighead Carp. However, BigheadCarp collected from the Marseilles Reach tended to be dissimi-lar (higher lipid content with lower moisture and ash) from theother reaches, except in protein content (Table 3). Few trendswere apparent in Bighead Carp FAME groups (Table 5). Similarto Silver Carp, SFAs in Bighead Carp decreased in the upperreaches of the river. Additionally, n-3 fatty acids decreased inthe upper reaches.
There were significant differences between Bighead and Sil-ver carps within individual season–reach data sets and across allgeographic locations and seasons. Overall, Bighead Carp were
Dow
nloa
ded
by [
Sout
hern
Illi
nois
Uni
vers
ity]
at 1
1:56
27
June
201
3

408 BOWZER ET AL.
TABLE 3. Proximate composition (%, mean ± SE) of Asian carp collected from the five reaches within the Illinois River (fall 2010–summer 2011). Lipid,protein, and ash are based on dry matter. Letters indicate significant geographical differences within each season at P < 0.05; ND = no data.
Harvest location
Species Season Composition Alton LaGrange Peoria Starved Rock Marseilles
Silver Carp Fall Moisture 74.3 ± 0.9 z 74.5 ± 0.9 z 78.3 ± 0.9 z 72.5 ± 0.9 y NDLipid 11.9 ± 2.2 y 17.8 ± 2.2 zy 7.1 ± 2.2 y 25.0 ± 2.2 z NDProtein 54.9 ± 1.6 y 60.0 ± 1.6 zy 65.7 ± 1.6 z 55.0 ± 1.6 y NDAsh 27.0 ± 1.2 z 21.8 ± 1.2 z 25.2 ± 1.2 z 15.5 ± 1.2 y ND
Spring Moisture 73.7 ± 0.9 z 70.2 ± 0.9 zy 73.7 ± 0.9 z 68.7 ± 0.9 y 68.5 ± 1.0 yLipid 12.0 ± 2.2 y 24.8 ± 2.2 z 12.9 ± 2.2 y 25.7 ± 2.2 z 29.4 ± 2.5 zProtein 54.9 ± 1.6 52.8 ± 1.6 57.3 ± 1.6 51.6 ± 1.6 53.1 ± 1.8Ash 30.1 ± 1.2 z 18.1 ± 1.2 yx 23.5 ± 1.2 y 16.7 ± 1.2 x 14.7 ± 1.3 x
Summer Moisture 71.4 ± 0.9 z 70.5 ± 0.9 z 70.4 ± 0.9 z 68.1 ± 0.9 zy 65.6 ± 0.9 yLipid 14.2 ± 2.2 y 18.6 ± 2.2 y 21.2 ± 2.2 y 29.9 ± 2.2 z 36.9 ± 2.2 zProtein 56.7 ± 1.6 z 54.1 ± 1.6 zy 53.7 ± 1.6 zy 51.1 ± 1.6 zy 48.8 ± 1.6 yAsh 25.8 ± 1.2 z 22.4 ± 1.2 zy 18.2 ± 1.2 y 14.6 ± 1.2 x 10.1 ± 1.2 x
Bighead Carp Fall Moisture ND 79.1 ± 0.6 81.7 ± 1.4 ND NDLipid ND 7.9 ± 1.1 4.9 ± 2.8 ND NDProtein ND 67.1 ± 1.3 66.0 ± 3.3 ND NDAsh ND 26.9 ± 1.0 24.2 ± 2.3 ND ND
Spring Moisture ND ND ND 79.9 ± 0.6 77.2 ± 0.6Lipid ND ND ND 4.7 ± 1.1 y 14.4 ± 1.1 zProtein ND ND ND 62.8 ± 1.3 62.0 ± 1.3Ash ND ND ND 24.4 ± 1.0 z 17.8 ± 1.0 y
Summer Moisture 77.2 ± 0.6 z 77.9 ± 0.6 z 76.1 ± 0.6 zy 78.5 ± 0.6 z 73.7 ± 0.6 yLipid 6.4 ± 1.2 y 7.5 ± 1.2 y 9.7 ± 1.2 y 7.2 ± 1.1 y 18.4 ± 1.1 zProtein 68.2 ± 1.5 67.4 ± 1.5 63.9 ± 1.5 68.9 ± 1.3 64.5 ± 1.3Ash 22.4 ± 1.0 z 21.8 ± 1.0 z 22.2 ± 1.0 z 21.0 ± 1.0 z 15.3 ± 1.0 y
leaner (higher moisture, protein, and ash, but lower lipid con-tent) than Silver Carp in all reaches studied, regardless of seasonor geographic location (Table 6). The overall fatty acid profile ofAsian carp (Table 7) demonstrated that Silver Carp had higherMUFAs, MC-PUFAs, and n-3:n-6, whereas Bighead Carp hadhigher levels of SFAs, n-6, and LC-PUFAs. Both species hadsimilar levels of PUFAs and n-3.
Body composition was observed to be a function of totallength in Silver Carp. Lipid had a strong positive relationshipwith length (r2 = 0.38, P = 0.0001). Moisture (r2 = 0.42, P =0.0005) and protein (r2 = 0.39, P = 0.0001) had strong negativerelationships, whereas ash had a moderate negative relationshipto total length (r2 = 0.20, P = 0.0001; Figure 2). In BigheadCarp, only protein was moderately related to total length (r2 =0.13, P = 0.0005).
The test of parallelism (fish meal type × time) for spoilageindicators (aldehydes P = 0.0078 and peroxides P = 0.0001)was significant. Aldehydes (P = 0.0015) and peroxides (P =0.0010) significantly increased over time, and there were sig-nificant differences between fish meal types for the presence ofaldehydes (P = 0.0289) and peroxides (P = 0.0047). The di-vergent trend of both carp meals from the control was apparent,
and the presence of spoilage indicators was substantially higherin the unstabilized carp meals than in the stabilized menhadenmeal by 8 weeks (56 d; Figure 3). Additionally, aldehydes weremore prevalent in both carp meals than peroxides.
DISCUSSIONAsian carp appear to be suitable for rendering and inclusion
in aquafeeds based on their composition. Market economicsand free-market access largely determine whether a fish is usedfor direct human consumption or rendered for feed production(Tacon et al. 2006; Tacon and Metian 2008), and given that Asiancarp are not a favored food fish in the United States, this under-utilized resource is better suited to other applications, includingfish meal production. The proximate composition of Asian carpis similar to traditional fish meal sources such as menhaden(Rawles et al. 2010) and anchovy (IFFO 2006c; Glencross et al.2007). However, the ash content of Asian carp is higher than tra-ditional fish meal sources, but this may make it more attractivein aquafeeds that partially substitute fish meal with plant-basedmeals due to the higher levels of calcium and phosphorus in fishmeals that tend to be low in plant protein sources.
Dow
nloa
ded
by [
Sout
hern
Illi
nois
Uni
vers
ity]
at 1
1:56
27
June
201
3

ASIAN CARP IN FISH MEAL PRODUCTION 409
TABLE 4. Fatty acid composition (% FAME, mean ± SE) for Silver Carp collected from five reaches within the Illinois River (fall 2010–summer 2011). Lettersindicate significant geographical differences within each season at P < 0.05; ND = no data.
Harvest location
Season Fatty acid group Alton LaGrange Peoria Starved Rock Marseilles
Fall SFAs 32.0 ± 0.9 zy 31.7 ± 0.8 zy 32.6 ± 0.8 z 28.2 ± 0.8 y NDMUFAs 32.2 ± 1.3 zy 30.5 ± 1.2 yx 24.7 ± 1.3 x 36.7 ± 1.2 z NDPUFAs 35.9 ± 1.2 y 37.8 ± 1.1 zy 42.7 ± 1.1 z 35.1 ± 1.1 y NDMC-PUFAs 10.2 ± 0.5 y 13.3 ± 0.4 z 11.8 ± 0.4 zy 11.0 ± 0.4 y NDLC-PUFAs 21.7 ± 0.9 y 21.0 ± 0.8 y 26.9 ± 0.9 z 18.2 ± 0.8 y NDn-3 24.7 ± 0.9 yx 28.2 ± 0.9 zy 31.3 ± 0.9 z 23.1 ± 0.9 x NDn-6 6.4 ± 0.3 zy 5.5 ± 0.2 yx 6.9 ± 0.3 z 4.3 ± 0.2 x NDn-3:n-6 4.0 ± 0.2 y 5.2 ± 0.2 z 4.6 ± 0.2 zy 5.4 ± 0.2 z ND
Spring SFAs 43.4 ± 0.8 z 36.5 ± 0.8 y 34.3 ± 0.8 yx 32.0 ± 0.8 x 34.4 ± 0.9 yxMUFAs 37.1 ± 1.2 z 41.8 ± 1.2 z 31.9 ± 1.2 y 40.1 ± 1.2 z 40.7 ± 1.3 zPUFAs 19.4 ± 1.1 w 21.7 ± 1.1 xw 33.7 ± 1.1 z 28.0 ± 1.1 y 24.9 ± 1.2 yxMC-PUFAs 7.6 ± 0.4 y 8.7 ± 0.4 z 10.6 ± 0.4 z 9.1 ± 0.4 z 10.5 ± 0.5 zLC-PUFAs 8.5 ± 0.8 x 10.0 ± 0.8 yx 18.9 ± 0.8 z 13.4 ± 0.8 y 12.5 ± 0.9 yxn-3 10.8 ± 0.9 w 13.3 ± 0.9 xw 23.4 ± 0.9 z 16.9 ± 0.9 yx 17.6 ± 0.9 yn-6 4.2 ± 0.2 4.5 ± 0.2 5.1 ± 0.2 4.0 ± 0.2 4.7 ± 0.3n-3:n-6 2.6 ± 0.2 x 3.0 ± 0.2 yx 4.6 ± 0.2 z 4.2 ± 0.2 z 3.9 ± 0.2 zy
Summer SFAs 42.6 ± 0.8 z 40.2 ± 0.8 zy 36.6 ± 0.8 y 35.7 ± 0.8 y 36.9 ± 0.8 yMUFAs 35.3 ± 1.2 yx 34.3 ± 1.2 x 30.6 ± 1.2 x 39.7 ± 1.2 zy 42.6 ± 1.2 zPUFAs 22.1 ± 1.1 y 25.5 ± 1.1 y 32.8 ± 1.1 z 24.5 ± 1.1 y 20.5 ± 1.1 yMC-PUFAs 8.7 ± 0.4 y 10.6 ± 0.4 zy 10.9 ± 0.4 z 9.0 ± 0.4zy 8.5 ± 0.4 yLC-PUFAs 10.1 ± 0.8 y 11.7 ± 0.8 y 15.9 ± 0.8 z 11.2 ± 0.8 y 9.5 ± 0.8 yn-3 14.9 ± 0.9 yx 17.8 ± 0.9 zy 20.5 ± 0.9 z 15.3 ± 0.9 yx 13.5 ± 0.9 xn-6 3.1 ± 0.2 y 3.8 ± 0.2 y 5.1 ± 0.2 z 3.8 ± 0.2 y 3.7 ± 0.2 yn-3:n-6 4.8 ± 0.2 z 4.8 ± 0.2 z 4.3 ± 0.2 zy 4.0 ± 0.2 zy 3.6 ± 0.2 y
The composition and quality of fish meal is based on fishcondition at the time of harvest, which varies. The body condi-tion of a fish and overall well-being is assumed to be adequatewith sufficient lipid reserves, i.e., fish with higher fat content arein better condition (Anderson and Gutreuter 1983). The qual-ity and chemical composition of fish meal within and amongspecies depends on age, sex, diet, environment, and harvest sea-son (Boran et al. 2008). Similar to many forage fish typicallyrendered into fish meal, we found that Asian carp carcass com-position and quality varied seasonally, geographically, and byspecies. In general, Asian carp were leaner (low fat content) inthe lower reaches of the Illinois River and during seasons withlower primary productivity such as fall. Additionally, BigheadCarp were leaner than Silver Carp across seasons and samplereaches, similar to results from the Missouri River (Orazio et al.2011). Variation in the proximate composition of fish meal isclosely related to the diet and feed intake of the species be-ing rendered (Bragadottir et al. 2004). Most reduction fisheriesare based on plankton-eating species, such as menhaden andanchovy, which naturally experience seasonal variation in prox-imate body composition due to the seasonality of planktonicforage (Huss 1988). Given that Asian carp are also planktivo-
rous (Williamson and Garvey 2005; Sampson et al. 2009), it isreasonable to observe similar seasonal variation in these species.During periods of ample food availability such as summer, pro-tein content of the carcass will increase to a point, and thenlipid deposition increases as feed intake surpasses energetic re-quirements, making a nutrient-rich fish for fish meal production(Bragadottir et al. 2004; Boran et al. 2008). Following seasonswith typically greater phyto- and zooplankton abundance, lipiddeposition and overall body condition of Asian carp increasedas well. However, seasonal availability of food does not explainall of the inconsistencies in body condition among reaches fromseason to season.
It would be expected that if primary production was thedominant factor affecting the composition of Asian carp, over-all body condition should not vary appreciably by reach giventhat the entire Illinois River is subject to the same seasonal shiftsin climate and broadly similar productivity cycles (though pro-ductivity may be somewhat higher in the downstream reaches).Several reaches did not follow this pattern, indicating that otherfactors are contributing to the condition of these fish. Just asfish are more nutritionally valuable during periods of amplefood, they will be less nutritionally valuable as a raw material
Dow
nloa
ded
by [
Sout
hern
Illi
nois
Uni
vers
ity]
at 1
1:56
27
June
201
3

410 BOWZER ET AL.
TABLE 5. Fatty acid composition (% FAME, mean ± SE) for Bighead Carp collected from five reaches within the Illinois River (fall 2010–summer 2011).Letters indicate significant geographical differences within each season at P < 0.05; ND = no data.
Harvest location
Season Fatty acid group Alton LaGrange Peoria Starved Rock Marseilles
Fall SFAs ND 32.2 ± 2.6 32.2 ± 6.0 ND NDMUFAs ND 29.3 ± 1.8 25.9 ± 4.3 ND NDPUFAs ND 38.5 ± 1.5 42.0 ± 3.6 ND NDMC-PUFAs ND 9.3 ± 1.0 9.3 ± 2.3 ND NDLC-PUFAs ND 27.0 ± 1.2 30.3 ± 2.8 ND NDn-3 ND 27.1 ± 1.1 30.5 ± 2.5 ND NDn-6 ND 8.6 ± 1.7 8.4 ± 4.1 ND NDn-3:n-6 ND 3.2 ± 0.7 3.6 ± 1.6 ND ND
Spring SFAs ND ND ND 38.7 ± 2.5 40.5 ± 2.5MUFAs ND ND ND 26.1 ± 1.7 y 35.9 ± 1.7 zPUFAs ND ND ND 35.3 ± 1.5 z 23.7 ± 1.5 yMC-PUFAs ND ND ND 5.7 ± 0.9 y 9.7 ± 9 zLC-PUFAs ND ND ND 28.4 ± 1.1 z 12.4 ± 1.1 yn-3 ND ND ND 24.5 ± 1.0 z 15.8 ± 1.0 yn-6 ND ND ND 9.0 ± 1.7 5.6 ± 1.7n-3:n-6 ND ND ND 2.8 ± 0.6 2.8 ± 0.6
Summer SFAs 42.8 ± 2.7 z 40.7 ± 2.7 z 40.0 ± 2.7 z 37.7 ± 2.5 zy 27.9 ± 2.5 yMUFAs 31.1 ± 1.9 yx 27.8 ± 1.9 w 29.9 ± 1.9 x 38.2 ± 1.7 zy 39.1 ± 1.7 zPUFAs 26.1 ± 1.6 zy 21.4 ± 1.6 yx 30.1 ± 1.6 z 24.1 ± 1.5 zyx 18.1 ± 1.5 xMC-PUFAs 8.3 ± 1.0 zy 7.1 ± 1.0 y 9.5 ± 1.0 zy 7.2 ± 0.9 y 11.9 ± 0.9 zLC-PUFAs 16.6 ± 1.2 zy 13.0 ± 1.2 zy 17.8 ± 1.2 z 15.6 ± 1.1 zy 11.9 ± 1.1 yn-3 20.0 ± 1.1 z 17.2 ± 1.1 zy 19.7 ± 1.1 zy 15.2 ± 1.0 yx 12.3 ± 1.0 xn-6 4.3 ± 1.8 y 4.5 ± 1.9 y 6.5 ± 1.8 zy 6.9 ± 1.7 zy 13.2 ± 1.7 zn-3:n-6 4.7 ± 0.7 zy 4.2 ± 0.7 zy 3.2 ± 0.7 y 2.2 ± 0.6 y 6.3 ± 0.6 z
during periods of starvation or high energy expenditure due tonatural behavior (e.g., spawning, migration), stress (e.g., subop-timal temperature, low dissolved oxygen), food shortages (e.g.,increased competition, reduced prey availability), and seasonaldecreases in feed intake (e.g., overwintering). The lower bodycondition observed in Asian carp from the lower reaches of theIllinois River, and Bighead Carp in general, are likely attributedto competition. Bighead and Silver carps can have substantialdiet overlap despite Silver Carp’s broader feeding range, includ-ing the capacity to consume smaller food particles (Sampsonet al. 2009). Additionally, Asian carp compete with native filterfeeding fishes such as Gizzard Shad Dorosoma cepedianum andBigmouth Buffalo Ictiobus cyprinellus (Irons et al. 2007; Samp-son et al. 2009). Because of the similarities in diet compositionamong Asian carp and native planktivores within the MississippiRiver basin, interspecific competition among species is highlyprobable in these systems (Sampson et al. 2009). Although thereis no evidence of direct competition (i.e., limited food availabil-ity) in the Illinois River, the body condition of Gizzard Shad andBigmouth Buffalo has decreased since the proliferation of Asiancarp, and these changes were not strongly linked to complemen-tary changes in other abiotic and biotic variables (Irons et al.
2007). Asian carp population densities are highest in the lowerreaches of the Illinois River, particularly in Alton, LaGrange,and Peoria (Sass et al. 2010; Garvey et al. 2012), and higherdensities probably contributed to lower overall body conditionas a result of intraspecific competition for prey resources. Thisis supported by evidence that body condition improves in theupper reaches of the Illinois River as the population densityof Asian carp decreases, which is contrary to expectations ifproductivity was the primary factor affecting body condition.Enhanced harvest of Asian carp should reduce both intra- andinterspecific competition among planktivores, resulting in betterbody condition for Asian carp as well as native planktivorousfishes. However, gear selection and methods used to enhanceharvest of Asian carp should be considered carefully to reducethe risk of native species bycatch, which may further affect theecological integrity of the system.
Several lines of evidence suggest that Silver Carp can effec-tively outcompete Bighead Carp for prey resources in the IllinoisRiver. Anecdotal evidence regarding Bighead Carp—such as thelower body condition (in this study and Orazio et al. 2011), nar-rower range of potential food particles (Sampson et al. 2009),lower abundance (Garvey et al. 2012), and the apparent faster
Dow
nloa
ded
by [
Sout
hern
Illi
nois
Uni
vers
ity]
at 1
1:56
27
June
201
3

ASIAN CARP IN FISH MEAL PRODUCTION 411
TABLE 6. Proximate composition (%) of Asian carp harvested from the Illi-nois River (fall 2010–summer 2011) across all five harvest locations (Alton, LaGrange, Peoria, Starved Rock, and Marseilles) and seasons. Numeric labels in-dicate mean percent composition of the intact carcasses (i.e., wet matter basis);numbers may not add to 100% because of minor amounts of carbohydrates notanalyzed and rounding errors.
Species
Composition Silver Carp Bighead Carp
Moisture 71.5 ± 0.3 y 77.5 ± 0.4 zProtein 15.7 ± 0.5 z 14.7 ± 0.6 yLipid 5.8 ± 0.7 z 2.2 ± 1.0 yAsh 5.8 ± 0.5 5.8 ± 0.6
rate of upstream movement (J. Garvey, Southern Illinois Uni-versity Carbondale, personal communication)—compared withSilver Carp suggest they may be moving to less dense areasupstream in response to competitive exclusion. However, thishypothesis of competitive differences between these two Asiancarp species needs to be explored further and is beyond thescope of this project. However, these variations in body com-position have a fundamental importance to consumers, manu-facturers, and wholesalers that demand a product equivalent totheir expectations (Boran et al. 2008). Nevertheless, it shouldbe noted that the geographic, seasonal, and species differencesobserved in this study were minor, and all size-classes of fishharvested would be deemed as valuable inputs for fish mealproduction.
To our knowledge this is the first attempt to process Asiancarp into fish meal; these fish are typically marketed as seafoodthroughout the rest of the world. Much like the food fish indus-try, however, stabilizing the product is of critical importance.Freezing and frozen storage are important methods for preserv-ing fish products such as fillets and fish meal (Asgharzadehet al. 2010). One of the principal methods of predicting shelflife in processed food products is monitoring the level of lipiddegradation by testing for the presence of peroxides and alde-hydes (Sewald and DeVries 2012), and it is apparent that if anAsian carp meal product is to be used in aquafeed production,it will need to be stabilized to increase shelf life. The rate thatspoilage occurs depends on product composition, particularlylipid composition in regards to chain length and hydrogen sat-uration, as well as environmental factors such as temperature,moisture, surface area, and light (Belitz et al. 2004; Sewald andDeVries 2012). Given that lipids present in fish meals containa high proportion of unsaturated fatty acids and large surfacearea, they are particularly susceptible to spoilage (El-Lakanyand March 1974). Silver Carp also have higher lipid contentthan Bighead Carp, which may make them more susceptible tospoilage. The rapid increase in the presence of peroxides andaldehydes in the Asian carp meals relative to the stable levels ofthe fish meal control demonstrates the need for antioxidants to
TABLE 7. Fatty acid composition (% FAME, mean ± SE) of Asian carpcollected from the Illinois River across all seasons (fall 2010–summer 2011)and harvest locations. Significant differences were determined at P < 0.05.
Fatty acid(s) Silver Carp Bighead Carp
12:0 0.15 ± 0.09 y 0.60 ± 0.12 z13:0 0.06 ± 0.01 y 0.13 ± 0.01 z14:0 6.53 ± 0.13 z 5.49 ± 0.17 y15:0 1.04 ± 0.05 y 1.39 ± 0.07 z16:0 22.10 ± 0.27 z 20.37 ± 0.35 y17:0 0.50 ± 0.02 y 0.90 ± 0.02 z18:0 4.93 ± 0.18 y 8.86 ± 0.23 z20:0 0.25 ± 0.01 y 0.46 ± 0.01 z22:0 0.02 ± 0.05 y 0.38 ± 0.06 z24:0 0.01 ± 0.01 y 0.07 ± 0.02 zSFAs 35.59 ± 0.51 y 37.67 ± 0.67 z16:1n-7 14.74 ± 0.23 z 10.61 ± 0.30 y18:1n-9 16.21 ± 0.47 15.21 ± 0.6218:1n-7 3.63 ± 0.12 y 5.61 ± 0.16 z20:1n-9 0.98 ± 0.03 y 1.20 ± 0.04 z22:1n-11 0.01 ± 0.01 y 0.05 ± 0.01 z22:1n-9 0.00 ± 0.03 y 0.22 ± 0.04 zMUFAs 35.63 ± 0.52 z 32.73 ± 0.68 y16:2n-4 1.91 ± 0.12 z 1.39 ± 0.15 y16:3n-4 1.93 ± 0.05 z 0.70 ± 0.07 y18:3n-4 1.07 ± 0.03 z 0.81 ± 0.04 y18:2n-6 2.55 ± 0.05 y 3.05 ± 0.06 z18:3n-6 0.28 ± 0.02 0.28 ± 0.0320:2n-6 0.27 ± 0.01 y 0.42 ± 0.01 z20:3n-6 0.34 ± 0.01 y 0.44 ± 0.01 z20:4n-6 1.17 ± 0.11 y 2.33 ± 0.14 zn-6 4.61 ± 0.13 y 6.36 ± 0.17 z18:3n-3 4.41 ± 0.10 z 3.22 ± 0.13 y18:4n-3 1.71 ± 0.05 z 0.94 ± 0.06 y20:3n-3 0.31 ± 0.08 y 0.77 ± 0.10 z20:4n-3 1.65 ± 0.04 z 1.28 ± 0.05 y20:5n-3 6.37 ± 0.20 6.35 ± 0.2622:5n-3 1.57 ± 0.07 y 2.04 ± 0.09 z22:6n-3 3.23 ± 0.17 y 4.56 ± 0.23 zn-3 19.26 ± 0.50 19.05 ± 0.65PUFAs 28.78 ± 0.62 27.70 ± 0.81LC-PUFAs 14.85 ± 0.51 y 18.24 ± 0.67 zMC-PUFAs 10.01 ± 0.21 z 8.68 ± 0.27 yn-3:n-6 4.21 ± 0.13 z 3.63 ± 0.18 y
increase the shelf life of an Asian carp meal product. A rangeof synthetic antioxidants are available and used in animal feeds,but ethoxyquin is the most frequently used synthetic stabilizerin fish meal because it is considerably more effective than othercommon feed additives (Lundebye et al. 2010). Given its effec-tiveness in other fish meals, it could easily be incorporated intoAsian carp-based fish meals to extend shelf life.
Dow
nloa
ded
by [
Sout
hern
Illi
nois
Uni
vers
ity]
at 1
1:56
27
June
201
3

412 BOWZER ET AL.
FIGURE 2. Relationship between total length and proximate composition of Silver Carp harvested from the Illinois River (fall 2010–summer 2011). Percentlipid, protein, and ash were determined on dry matter basis.
A stabilized Asian carp meal is a nutritionally suitable alter-native for aquafeed production because of its similarity to tradi-tional marine-based fish meals. The quality and concentration ofessential nutrients in fish meal makes it a valuable componentin the diets of most aquaculture species and many terrestrialfarm-raised animals (IFFO 2006a) because it promotes normalgrowth, increases feed efficiency, enhances nutrient absorption,and improves palatability (Sullivan and Reigh 1995; Watanabe2002; IFFO 2006b; Oyelese and Odubayo 2010). Additionally,the nutrients in fish meal are also effective for maintaining goodhealth and improved disease resistance in fish through an en-hanced immune response (Watanabe 2002; IFFO 2006b). Oneof the more important attributes of fish meal that are devoidin other alternative protein sources is the small, yet biologicalimportant, amount of LC-PUFAs (20 and 22 carbon, three ormore double-bonded fatty acids). Given that many carnivorousspecies lack the ability to synthesize sufficient amounts of LC-PUFAs de novo, it is critical to provide LC-PUFAs in the diet.Adequate levels of LC-PUFAs are necessary for proper develop-ment and function. One of their many functions includes actingas precursors for eicosanoids that are involved in cardiovascu-lar modulation, immunity and inflammatory response, renal andneural function, and reproduction (Sargent et al. 2002). An Asiancarp-based fish meal would have similar levels of LC-PUFAsand benefits as those mentioned above from marine fish mealsources while also directing an otherwise unutilized resourceto the human food chain, making it an attractive feedstuff foraquafeed manufacturers and the aquaculture industry.
Given the beneficial attributes of fish meal, feed manufac-turers are willing to pay higher prices for fish meal (currently∼$1,900/metric ton) compared with lower quality alternativeprotein sources such as soybean meal (∼$500/metric ton; FAO2013). Currently, Asian carp meal is priced at $600–650/metricton (P. Hitchens, Southern Illinois University Carbondale, per-sonal communication), and fish markets along the Illinois Riverpay commercial fishers approximately $0.33/kg and $0.40/kgfor Silver and Bighead carps, respectively (Schaffer’s Fish Mar-ket, personal communication). Experienced commercial fishingcrews (i.e., one to two boats and three to eight fishers) can rou-tinely harvest > 10,000 kg of Asian carp/d from the IllinoisRiver under optimal harvest conditions (R. Smith, Big RiverFish, personal communication; Irons et al. 2007). Thus, Asiancarp provide another source of income for commercial fish-ers while also providing a cost-effective alternative feedstuffto aquafeed producers. Additionally, the National Managementand Control Plan for Bighead, Black, Grass, and Silver carps inthe United States indicates that harvest enhancement is the onlyviable short-term control strategy for Asian carp where pop-ulations are already established (Conover et al. 2007). Giventhat Asian carp meal is a high-quality product like traditionalmarine fish meals but is currently priced similarly to lower-quality alternatives, this product may become an especiallyattractive ingredient for aquafeed manufacturers. However, itis expected that the price of Asian cap meal will increase tosimilar levels of traditional marine fish meal sources if a mar-ket is established. It is unclear what effects, if any, changes in
Dow
nloa
ded
by [
Sout
hern
Illi
nois
Uni
vers
ity]
at 1
1:56
27
June
201
3

ASIAN CARP IN FISH MEAL PRODUCTION 413
FIGURE 3. Oxidative stability of unstabilized Asian carp meals (Silver Carp =solid black line–diamonds, Bighead Carp = dashed black line–circles) comparedwith a commercially available stabilized menhaden fish meal control (grayline–triangles) based on the development of (A) aldehydes and (B) peroxidesduring refrigerated storage. Values were standardized for lipid content; errorbars represent SE.
price structure may have on demand for Asian carp-derived fishmeal.
The aquaculture industry continues to be the fastest-growinganimal food producing sector, at a rate of roughly 8.8%/year(FAO 2012). To meet rising demand, the supply of feed inputswill also have to grow at similar rates (Tacon and Metian 2008).However, the aquaculture industry has not addressed its overde-pendence on fish meal in the production of aquafeeds. Whenthe supply of fish meal became static, the aquaculture indus-try responded by paying higher prices and consuming largerportions of the global fish meal supply, while other industriesfound cheaper alternatives. The aquaculture industry now con-sumes the largest portion of the global supply of fish meal atapproximately 60%, with little chance of consuming more of theoverall supply (FAO 2012). The overdependence of aquacultureon fish meal to produce balanced and palatable aquafeeds forfishes makes them vulnerable to price fluctuations (Cheng et al.2004). Thus, feed costs can be a significant variable cost in manyaquaculture operations (Kaushik and Seiliez 2010). The indus-try could therefore benefit from an underutilized source of rawmaterial such as Asian carp. An Asian carp meal is currentlya more economical alternative feedstuff to marine-based fish
meals and could ameliorate some of the effects of price shiftson aquafeed production while maintaining the overall qualityof the feed. However, the ability of an Asian carp meal to ame-liorate future price shifts maybe reduced given that its price isexpected to increase because of its potential to be a high-valuefeedstuff.
In conclusion, reducing costs of feed can make aquaculturemore profitable by substituting expensive ingredients (marinefish meal) for comparable, more cost-effective ingredients suchas an Asian carp meal. The body composition and FAME profileof Asian carp from the Illinois River indicates that a renderedAsian carp meal is broadly similar to traditional marine fishmeal sources but presently at a fraction of the cost. However,it is reasonable to expect that the price of Asian carp mealwill increase to reflect the prices of similar products, such astraditional marine fish meal sources, but if the price does notincrease to reflect this value, subsidies may be necessary tosupport the industry. Although subsidizing enhanced harvestto support this industry may be more cost effective than othercontrol options. Given that the infrastructure, processing plants,transport, and commercial fishers to support an Asian carp mealindustry is already being developed, a marketing strategy ofAsian carp products is a logical approach to aid in the controlof Asian carp populations in the Illinois River.
ACKNOWLEDGMENTSThe authors thank the Illinois Department of Natural Re-
sources for financial support of the work described herein. Wealso thank Chris Bowzer, Jake Norman, Matt Young, and theIllinois Natural History Survey for assistance in the field, labo-ratory, or both.
REFERENCESACRCC (Asian Carp Regional Coordinating Committee). 2012. FY 2012 Asian
carp control strategy framework. ACRCC, U.S. Fish and Wildlife, Universityof Texas, Arlington. Available: asiancarp.us/documents/2012Framework.pdf.(November 2012).
Adelizi, P. D., R. R. Rosati, K. Warner, Y. V. Wu, T. R. Muench, M. R. White,and P. B. Brown. 1998. Evaluation of fish-meal free diets for Rainbow Trout,Oncorhynchus mykiss. Aquaculture Nutrition 4:255–262.
Anderson, R. O., and S. J. Gutreuter. 1983. Length, weight, and associatedstructural indices. Pages 283–300 in L. A. Nielsen and D. L. Johnson, editors.Fisheries techniques. American Fisheries Society, Bethesda, Maryland.
Asgharzadeh, A., B. Shabanpour, S. P. Aubourg, and H. Hosseini. 2010. Chem-ical changes in Silver Carp (Hypophthalmichthys molitrix) minced muscleduring frozen storage: effect of a previous washing process. Grasas y Aceites61:95–101.
Belitz, H. D., W. Grosch, and P. Schieberle. 2004. Food chemistry, 3rd revisededition. Springer, New York.
Boran, G., M. Boran, and H. Karacam. 2008. Seasonal changes in proximatecomposition of anchovy and storage stability of anchovy oil. Journal of FoodQuality 31:503–513.
Bragadottir, M., H. Palmadottir, and K. Kristbergsson. 2004. Composition andchemical changes during storage of fish meal from Capelin (Mallotus villo-sus). Journal of Agricultural and Food Chemistry 52:1572–1580.
Dow
nloa
ded
by [
Sout
hern
Illi
nois
Uni
vers
ity]
at 1
1:56
27
June
201
3

414 BOWZER ET AL.
Cheng, Z. J., R. W. Hardy, and N. J. Huige. 2004. Apparent digestibility coeffi-cients of nutrients in brewer’s and rendered animal by-products for RainbowTrout (Oncorhynchus mykiss Walbaum). Aquaculture Research 35:1–9.
Chick, J. H., and M. A. Pegg. 2001. Invasive carp in the Mississippi River basin.Science 292:2250–2251.
Christie, W. W. 1982. Lipid analysis: isolation, separation, identification, andstructural analysis of lipids, 2nd edition. Pergamon, Oxford, UK.
Conover, G., R. Simmonds, and M. Whalen, editors. 2007. Management andcontrol plan for Bighead, Black, Grass, and Silver carps in the UnitedStates. Aquatic Nuisance Species Task Force, Asian Carp Working Group,Washington, D.C.
Davies, S. J., and P. C. Morris. 1997. Influence of multiple amino acid sup-plementation on the performance of Rainbow Trout, Oncorhynchus mykiss(Walbaum), fed soya based diets. Aquaculture Research 28:65–74.
El-Lakany, S., and B. E. March. 1974. Chemical and nutritive changes in herringmeal during storage at different temperatures with and without antioxidanttreatment. Journal of the Science of Food and Agriculture 25:899–906.
FAO (Food and Agriculture Organization of the United Nations). 2012. Thestate of world fisheries and aquaculture 2012. FAO, Fisheries and AquacultureDepartment, Rome.
FAO (Food and Agriculture Organization of the United Nations). 2013. Com-modity price index. FAO, Economic and Social Development Department,Rome. Available: www.fao.org/economic/est/prices. (March 2013).
Folch, J., M. Lees, and G. H. Sloane Stanley. 1957. A simple method forthe isolation and purification of total lipides from animal tissues. Journal ofBiological Chemistry 226:497–509.
Garvey, J. E., K. L. DeGrandchamp, and C. J. Williamson. 2007. Life historyattributes of Asian carps in the upper Mississippi River system. AquaticNuisance Species Research Program, Technical Note ERDC/TN ANSRP-07-1, U.S. Army Corps of Engineers Research and Development Center,Vicksburg, Mississippi. Available: el.erdc.usace.army.mil/elpubs/pdf/ansrp07-1.pdf. (November 2012).
Garvey, J. E., G. G. Sass, J. Trushenski, D. Glover, P. M. Charlebois, J. Leven-good, B. Roth, G. Whitledge, B. C. Small, S. J. Tripp, and S Secchi. 2012.Fishing down the Bighead and Silver carps: reducing the risk of invasionto the Great Lakes. Final Report to the U.S. Fish and Wildlife Service andthe Illinois Department of Natural Resources, Springfield. Available: asian-carp.us/documents/CARP2011.pdf. (November 2012).
Gatlin, D. M., III, F. T. Barrows, P. Brown, K. Dabrowski, T. Gibson Gaylord,R. W. Hardy, E. Herman, G. Hu, Å. Krogdahl, R. Nelson, K. Overturf, M.Rust, W. Sealey, D. Skonberg, E. J. Souza, D. Stone, R. Wilson, and E.Wurtele. 2007. Expanding the utilization of sustainable plant products inaquafeeds: a review. Aquaculture Research 38:551–579.
Glencross, B. D., M. Booth, and G. L. Allan. 2007. A feed is only as good asits ingredients: a review of ingredient evaluation strategies for aquaculturefeeds. Aquaculture Nutrition 13:17–34.
Heikkinen, J., J. Vielma, O. Kemilainen, M. Tiirola, P. Eskelinen, T. Kiuru, D.Navia-Paldanius, and A. von Wright. 2006. Effects of soybean meal baseddiet on growth performance, gut histopathology and intestinal microbiotaof juvenile Rainbow Trout (Oncorhynchus mykiss). Aquaculture 261:259–268.
Hendricks, J. D. 2002. Adventitious toxins. Pages 602–641 in J. E. Halver andR. W. Hardy, editors. Fish nutrition, 3rd edition. Academic Press, San Diego,California.
Huss, H. H. 1988. Fresh fish: quality and quality changes. FAO (Food andAgriculture Organization of the United Nations) Fisheries Series 29.
IFFO (International Fishmeal and Fish Oil Organisation). 2006a. Whatare fishmeal and fish oil? IFFO, St. Albans, UK. Available: www.iffo.net/default.asp?contentID=716. (April 2011).
IFFO (International Fishmeal and Fish Oil Organisation). 2006b. Benefitsof fishmeal and fish oil use. IFFO, St. Albans, UK. Available: www.iffo.net/default.asp?contentID=717. (April 2011).
IFFO (International Fishmeal and Fish Oil Organisation). 2006c. The productionof fishmeal and fish oil from Peruvian Anchovy. IFFO, St. Albans, UK.Available: www.iffo.net/downloads/67.pdf. (April 2011).
Irons, K. S., G. G. Sass, M. A. McClelland, and J. D. Stafford. 2007. Reducedcondition factor of two native fish species coincident with invasion of non-native Asian carps in the Illinois River, U.S.A.: is this evidence for competitionand reduced fitness? Journal of Fish Biology 71(Supplement D):258–273.
Iwashita, Y., T. Yamamoto, H. Furuita, T. Sugita, and N. Suzuki. 2008. Influenceof certain soybean antinutritional factors supplemented to a casein-basedsemipurified diet on intestinal and liver morphology in fingerling RainbowTrout Oncorhynchus mykiss. Fisheries Science 74:1075–1082.
Kaushik, S. J. 2008. Soybean products in salmonid diets. Pages 261–279 in C.Lim, C. D. Webster, and C. S. Lee, editors. Alternative protein sources inaquaculture diets. Haworth Press, New York.
Kaushik, S. J., and I. Seiliez. 2010. Protein and amino acid nutrition andmetabolism in fish: current knowledge and future needs. Aquaculture Re-search 41:322–332.
Keembiyehetty, C. N., and D. M. Gatlin III. 1992. Dietary lysine requirement ofjuvenile hybrid Striped Bass (Morone chrysops × M. saxatilis). Aquaculture104:271–277.
Laporte, J., and J. Trushenski. 2011. Growth performance and tissue fatty acidcomposition of Largemouth Bass fed diets containing fish oil or blends of fishoil and soy-derived lipids. North American Journal of Aquaculture 73:435–444.
Lundebye, A. K., H. Hove, A. Mage, V. J. Bohne, and K. Hamre. 2010. Levels ofsynthetic antioxidants (ethoxyquin, butylated hydroxytoluene and butylatedhydroxyanisole) in fish feed and commercially farmed fish. Food Additivesand Contaminants A 27:1652–1657.
Moy, P. B., I. Polls, and J. M. Dettmers. 2011. The Chicago sanitary and shipcanal aquatic nuisance species dispersal barrier. Pages 121–137 in D. C.Chapman and M. H. Hoff, editors. Invasive Asian carps in North America.American Fisheries Society, Symposium 74, Bethesda, Maryland.
Orazio, C. E., D. C. Chapman, T. W. May, J. C. Meadows, M. J. Walther, andK. R. Echols. 2011. Evaluation of environmental contaminants and elementsin bigheaded carps of the Missouri River at Easley, Missouri, USA. Pages199–213 in D. C. Chapman and M. H. Hoff, editors. Invasive Asian carpsin North America. American Fisheries Society, Symposium 74, Bethesda,Maryland.
Ostaszewska, T., K. Dabrowski, M. E. Palacios, M. Olejniczak, and M. Wiec-zorek. 2005. Growth and morphological changes in the digestive tract ofRainbow Trout (Oncorhynchus mykiss) and pacu (Piaractus mesopotamicus)due to casein replacement with soybean proteins. Aquaculture 245:273–286.
Oyelese, O. A., and O. O. Odubayo. 2010. Shelflife of fishmeal, paste andcake of Tilapia niloticus and supplementation of conventional fishmeal withtilapia fishmeal in the diet of Clarias gariepinus fingerlings. Journal of FoodProcessing and Preservation 34(Supplement 1):149–163.
Rach, J. J., M. Boogaard, and C. Kolar. 2009. Toxicity of rotenone and antimycinto Silver Carp and Bighead Carp. North American Journal of Fisheries Man-agement 29:388–395.
Rawles, S. D., K. R. Thompson, Y. J. Brady, L. S. Metts, A. L. Gannam, R.G. Twibell, and C. D. Webster. 2010. A comparison of two faecal collectionmethods for protein and amino acid digestibility coefficients of menhaden fishmeal and two grades of poultry by-product meals for market-size sunshinebass (Morone chrysops × M. saxatilis). Aquaculture Nutrition 16:81–90.
Sampson, S. J., J. H. Chick, and M. A. Pegg. 2009. Diet overlap among twoAsian carp and three native fishes in backwater lakes on the Illinois andMississippi rivers. Biological Invasions 11:483–496.
Santigosa, E., J. Sanchez, F. Medale, S. Kaushik, J. Perez-Sanchez, and M. A.Gallardo. 2008. Modifications of digestive enzymes in trout (Oncorhynchusmykiss) and sea bream (Sparus aurata) in response to dietary fish meal re-placement by plant protein sources. Aquaculture 282:68–74.
Sargent, J. R., D. R. Tocher, and J. G. Bell. 2002. The lipids. Pages 182–257 inJ. E. Halver and R. W. Hardy, editors. Fish nutrition, 3rd edition. AcademicPress, San Diego, California.
Sass, G. G., T. R. Cook, K. S. Irons, M. A. McClelland, N. N. Michaels, T. M.O’Hara, and M. R. Stroub. 2010. A mark–recapture population estimate forinvasive Silver Carp (Hypophthalmichthys molitrix) in the La Grange Reach,Illinois River. Biological Invasions 12:433–436.
Dow
nloa
ded
by [
Sout
hern
Illi
nois
Uni
vers
ity]
at 1
1:56
27
June
201
3

ASIAN CARP IN FISH MEAL PRODUCTION 415
Sewald, M., and J. DeVries. 2012. Food product shelf life. Medallion Labora-tories, Minneapolis, Minnesota. Available: www.medlabs.com/Downloads/food product shelf life web.pdf. (October 2012).
Sullivan, J. A., and R. C. Reigh. 1995. Apparent digestibility of selectedfeedstuffs in diets for hybrid Striped Bass (Morone saxatilis♀ × Moronechrysops♂). Aquaculture 138:313–322.
Tacon, A. G. J., M. R. Hasan, and R. P. Subasinghe. 2006. Use of fisheryresources as feed inputs to aquaculture development: trends and policy im-plications. FAO (Food and Agriculture Organization of the United Nations)Fisheries Circular 1018.
Tacon, A. G. J., and M. Metian. 2008. Global overview on the use of fishmeal and fish oil in industrially compounded aquafeeds: trends and futureprospects. Aquaculture 285:146–158.
Trushenski, J. T., C. S. Kasper, and C. C. Kohler. 2006. Challenges and oppor-tunities in finfish nutrition. North American Journal of Aquaculture 68:122–140.
Vasquez, M. E., J. Rinderneck, J. Newman, S. McMillin, B. Finlayson, A.Mekebri, D. Crane, and R. S. Tjeerdema. 2012. Rotenone formulation fatein Lake Davis following the 2007 treatment. Environmental Toxicology andChemistry 31:1032–1041.
Watanabe, T. 2002. Strategies for further development of aquatic feeds. FisheriesScience 68:242–252.
Williamson, C. J., and J. E. Garvey. 2005. Growth, fecundity, anddiets of newly established Silver Carp in the middle MississippiRiver. Transactions of the American Fisheries Society 134:1423–1430.
Dow
nloa
ded
by [
Sout
hern
Illi
nois
Uni
vers
ity]
at 1
1:56
27
June
201
3

This article was downloaded by: [Southern Illinois University]On: 16 October 2014, At: 09:15Publisher: Taylor & FrancisInforma Ltd Registered in England and Wales Registered Number: 1072954 Registered office: Mortimer House,37-41 Mortimer Street, London W1T 3JH, UK
North American Journal of AquaculturePublication details, including instructions for authors and subscription information:http://www.tandfonline.com/loi/unaj20
Growth Performance of Largemouth Bass Fed Fish MealDerived from Asian CarpJohn Bowzera, Alexis Bergmana & Jesse Trushenskiaa Center for Fisheries Aquaculture and Aquatic Sciences, Southern IllinoisUniversity–Carbondale, 1125 Lincoln Drive, Carbondale, Illinois 62901, USAPublished online: 21 May 2014.
To cite this article: John Bowzer, Alexis Bergman & Jesse Trushenski (2014) Growth Performance of Largemouth Bass Fed FishMeal Derived from Asian Carp, North American Journal of Aquaculture, 76:3, 185-189, DOI: 10.1080/15222055.2014.893473
To link to this article: http://dx.doi.org/10.1080/15222055.2014.893473
PLEASE SCROLL DOWN FOR ARTICLE
Taylor & Francis makes every effort to ensure the accuracy of all the information (the “Content”) containedin the publications on our platform. However, Taylor & Francis, our agents, and our licensors make norepresentations or warranties whatsoever as to the accuracy, completeness, or suitability for any purpose of theContent. Any opinions and views expressed in this publication are the opinions and views of the authors, andare not the views of or endorsed by Taylor & Francis. The accuracy of the Content should not be relied upon andshould be independently verified with primary sources of information. Taylor and Francis shall not be liable forany losses, actions, claims, proceedings, demands, costs, expenses, damages, and other liabilities whatsoeveror howsoever caused arising directly or indirectly in connection with, in relation to or arising out of the use ofthe Content.
This article may be used for research, teaching, and private study purposes. Any substantial or systematicreproduction, redistribution, reselling, loan, sub-licensing, systematic supply, or distribution in anyform to anyone is expressly forbidden. Terms & Conditions of access and use can be found at http://www.tandfonline.com/page/terms-and-conditions

North American Journal of Aquaculture 76:185–189, 2014C© American Fisheries Society 2014ISSN: 1522-2055 print / 1548-8454 onlineDOI: 10.1080/15222055.2014.893473
TECHNICAL NOTE
Growth Performance of Largemouth Bass Fed Fish MealDerived from Asian Carp
John Bowzer, Alexis Bergman, and Jesse Trushenski*Center for Fisheries Aquaculture and Aquatic Sciences, Southern Illinois University–Carbondale,1125 Lincoln Drive, Carbondale, Illinois 62901, USA
AbstractFeeds for carnivorous fish like Largemouth Bass Micropterus
salmoides are commonly based on marine-origin fish meal, but thisingredient is costly. Fish meal derived from undesirable species,such as invasive Asian carp Hypophthalmichthys spp., is a promis-ing alternative source of protein for carnivorous fish, but infor-mation regarding its biological value as a feed ingredient is lim-ited. Accordingly, we evaluated the growth performance of juvenileLargemouth Bass (initial weight, 11.6 ± 0.2 g [mean ± SE]) rearedfor 8 weeks on practical diets (∼14.5% lipid, ∼42% digestible pro-tein) containing different levels of menhaden fish meal (MFM),Asian carp meal (CFM), or a 50:50 blend of these ingredients suchthat 40% (40 MFM, 40 CFM) or 60% (60 MFM, 60 CFM, 60 Blend)of the estimated digestible protein content was derived from fishmeal. Weight gain (329–388%), feed conversion ratio (0.78–0.97),and specific growth rate (2.65–2.88% body weight/d) were gen-erally consistent among treatments. Although our results suggestthat performance is greater among fish fed diets with greater fishmeal inclusion, regardless of its origin, this trend was not sup-ported by clear statistical evidence. Asian carp fish meal appearsto be broadly equivalent to MFM in feeds for Largemouth Bass.Development of CFM as a feed ingredient may offer producersof Largemouth Bass and other carnivorous fishes some savings infeed cost and encourage the harvest of invasive Asian carp.
Largemouth Bass Micropterus salmoides is widely recog-nized as a popular sport fish across the United States, and theirpopularity continues to grow as a food fish in live markets, par-ticularly in cities with large ethnic populations (Coursey et al.2013). Commercial production has relied primarily on diets con-taining high levels of marine-origin fish meal often considerednecessary to encourage feeding behavior and satisfy the dietaryrequirements of carnivorous fishes like Largemouth Bass.Replacement of fish meal with alternative proteins, particularlyplant-derived protein meals such as soybean meal, is problem-atic for Largemouth Bass as they are relatively intolerant of
*Corresponding author: [email protected] November 20, 2013; accepted February 4, 2014
carbohydrate-rich diets (Coursey et al. 2013). The carbohydratecontent of most plant-derived protein meals exceeds 20%,which is considered too high for Largemouth Bass (Mitchellet al. 2002), rendering aggressive fish meal replacement withplant-derived protein meals impractical. Animal-derived proteinmeals (e.g., poultry byproduct meal, blood meal) do not presentthe same challenges as plant-derived feedstuffs and may be well-utilized by Largemouth Bass (Portz and Cyrino 2004; Courseyet al. 2013), but each of these products has some limitationscompared with fish meal, including amino acid deficiencies andreduced palatability (Tidwell et al. 2005; Subhadra et al. 2006).
Feed costs are typically the highest production expense inaquaculture (Naylor et al. 2000) and represent approximately50% of production costs in Largemouth Bass culture (Tidwellet al. 2000). Feed costs are greatly influenced by the price of fishmeal and overreliance of feed manufacturers on this feedstuff asa primary source of protein for species like Largemouth Bass.Economic incentives to spare or replace fish meal in carnivo-rous fish feeds are strengthened by growing concerns regardingthe sustainability and ecological effects of reduction fisheries(i.e., fisheries providing raw materials for fish meal and fish oilproduction) and public perception of feeding fish to fish as apractice. Concerns over costs and future supplies led the Foodand Agriculture Organization (FAO) of the United Nations todescribe marine-origin fish meals as the greatest market con-straint to the continued growth of aquaculture (FAO 2008). Theaquaculture industry would obviously benefit from the identifi-cation of effective, lower cost alternatives to fish meal.
One promising alternative to marine-origin fish meal isfish meal rendered from freshwater Silver Carp Hypoph-thalmichthys molitrix and Bighead Carp H. nobilis (hereafterreferred to together as Asian carp). Both species are invasivein North America and are particularly problematic in theMississippi River basin where they have become especially
185
Dow
nloa
ded
by [
Sout
hern
Illi
nois
Uni
vers
ity]
at 0
9:15
16
Oct
ober
201
4

186 BOWZER ET AL.
abundant (McClelland et al. 2012; Tsehaye et al. 2013). Invasivespecies are widely recognized for their adverse effects onnative populations and industries associated with these naturalresources (Vitousek et al. 1997; Lodge et al. 2006). The threatof Asian carp entering the Great Lakes and disrupting the $7billion fishing industry centered on that system has promptedgovernment agencies to devise and implement various controlstrategies (Tsehaye et al. 2013). Although an integratedmanagement strategy is necessary to effectively control Asiancarp populations, harvest enhancement is currently the onlyviable short-term control strategy where populations are alreadyestablished (Conover et al. 2007). Although some fish are beingharvested from Illinois waters for human consumption, Asiancarp are not a favored food fish in the United States, and marketsfor industrial uses such as livestock feeding are consideredthe most promising for encouraging harvest (Bowzer et al.2013). Current pricing estimates for Asian carp meal (CFM;US$600–650/metric ton: P. Hitchens, Southern Illinois Univer-sity Carbondale, personal communication) are low comparedwith traditional marine-origin fish meals ($1,500–2,000/metricton: FAO 2013), and previous research has demonstrated thatthe digestibility of CFM is comparable to that of menhadenBrevoortia spp. fish meal (MFM) in aquafeeds (Bowzer et al.,in press). As such, CFM appears promising as an alternativeto marine-origin fish meal in feeds for carnivorous fishes suchas Largemouth Bass; however, the biological value of this feedingredient has yet to be directly evaluated. Accordingly, weassessed the growth performance of Largemouth Bass fed dietscontaining different levels of MFM or CFM.
METHODSFifteen tanks in a recirculation aquaculture system con-
sisting of twenty-four 50-L tanks with supplemental aerationand mechanical and biological filtration units were stockedwith juvenile Largemouth Bass (initial weight, 11.6 ± 0.2 g[mean ± SE]; 10 fish per tank). Water temperature and dissolvedoxygen were measured daily (YSI 550 temperature–oxygenmeter; Yellow Springs Instruments, Yellow Springs, Ohio),whereas other water quality conditions (total ammonia nitrogen,nitrite-nitrogen, nitrate-nitrogen, and alkalinity) were measuredweekly (Hach DR 2800 portable spectrophotometer, digitaltitrator, and reagents; Hach Company, Loveland, Colorado).Throughout the trial, the photoperiod was 14 h light : 10 hdark and water quality conditions were maintained withinranges suitable for Largemouth Bass: water temperature =24.4 ± 1.8◦C, dissolved oxygen = 6.69 ± 0.73 mg/L, totalammonia nitrogen = 0.36 ± 0.11 mg/L, nitrite-nitrogen =0.02 ± 0.01 mg/L, nitrate-nitrogen = 16.15 ± 2.51 mg/L, pH =7.73 ± 0.14, and alkalinity = 186 ± 59 mg/L.
Practical diets were formulated to contain approximately14.5% lipid, 42% digestible protein (based on apparentdigestibility coefficients reported for Rainbow Trout On-corhynchus mykiss by Barrows et al. 2012), and different levels
TABLE 1. Composition (g/kg dry matter basis) of Asian carp meal (CFM)and menhaden fish meal (MFM) in test diets for Largemouth Bass (adaptedfrom Bowzer et al., in press).
Composition CFM MFM
Protein (crude) 640.1 687.3Lipid (crude) 122.7 101.3Ash 246.4 213.7Dry matter 971.4 943.3
of MFM (Omega Protein, Houston, Texas), CFM (ProteinProducts, Gainsville, Florida), or a 50:50 blend of these ingre-dients such that 40% (40 MFM, 40 CFM) or 60% (60 MFM, 60CFM, 60 Blend) of the estimated digestible protein content wasderived from fish meal (Tables 1, 2). Feeds were manufacturedand analyzed in triplicate to determine proximate composition(Table 2) using standard methods described in detail byRombenso et al. (2013). Feeds were randomly assigned totriplicate tanks (N = 3), and fish were fed assigned dietsonce daily (1100 hours) to apparent satiation for a period of 8weeks. At the end of the trial, fish were harvested, counted, andgroup-weighed by tank to assess growth performance in termsof the following metrics:
Weight gain (%)
= 100 × average individual final weight − average individual initial weight
average individual initial weight
Feed conversion ratio (FCR)
= average individual feed consumption (drymatter)
average individual weight gain
Specific growth rate (SGR, % bodyweight/day)
= 100 × loge (final weight) − loge(initial weight)
days of feeding
Feed intake (Fl, % body weight/day)
=100 × total dry matter intake/(initial individual weight × final individual weight)0.5
days of feeding
Three fish per tank were then euthanized with an overdose oftricaine methanesulfonate (MS-222; ∼200 mg/L in culture wa-ter; fish immersed until opercular ventilation had ceased for10 min) then individually weighed and dissected to calculateorganosomatic indices as follows:
Hepatosomatic Index (HSI)
= 100 × (liver weight/whole body weight)
Viscerosomatic Index (VSI)
= 100 × (total viscera weight/whole body weight)
All data were analyzed by one-way ANOVA (PROCGLIMMIX) to determine the significance of differences be-tween diets (SAS version 9.3, SAS Institute, Cary, NorthCarolina). Post hoc Tukey’s honestly significant difference(HSD) pairwise comparison tests were used when omnibus tests
Dow
nloa
ded
by [
Sout
hern
Illi
nois
Uni
vers
ity]
at 0
9:15
16
Oct
ober
201
4

TECHNICAL NOTE 187
TABLE 2. Dietary formulation (g/kg, as-fed basis) and proximate composition (g/kg, dry matter basis, except dry matter) of diets based on Asian carp meal(CFM) or menhaden fish meal (MFM) fed to Largemouth Bass. Numerals in diet names indicate the percentage of digestible protein content provided by a fishmeal source, i.e., 60 indicates 60%.
Ingredient 60 MFM 40 MFM 60 CFM 40 CFM 60 Blend
Menhaden fish meala 376.7 251.1 0 0 188.3Asian carp mealb 0 0 450.8 300.5 225.4Soybean mealc 183.9 295.9 126.9 260.1 198.6Poultry byproduct meald 150.0 250.0 250.0 250.0 200.0Wheat bran 143.5 50.0 50.0 50.0 50.0Menhaden fish oila 66.7 73.8 43.1 60.2 58.5Blood meale 50.0 50.0 50.0 50.0 50.0Carboxymethyl cellulose 20.0 20.0 20.0 20.0 20.0Choline chloride 6.0 6.0 6.0 6.0 6.0Mineral premixf 1.0 1.0 1.0 1.0 1.0Vitamin premixg 1.2 1.2 1.2 1.2 1.2Stay Ch 1.0 1.0 1.0 1.0 1.0Protein (crude) 538.9 515.8 558.7 525.9 540.9Protein (digestible) 420.0 410.0 428.9 401.8 433.0Lipid (crude) 130.0 130.0 130.0 130.0 130.0Analyzed composition:
Dry matter 945 942 949 949 930Protein (crude) 526 548 596 563 571Lipid (crude) 144 152 149 146 148Ash 113 105 131 99 122
aOmega Protein, Houston, Texas.bProtein Products, Gainsville, Florida.cSeimer Enterprises, Teutopolis, Illinois (47% protein).dTyson, Robards, Kentucky (pet food grade).eDarling International, Irving, Texas.fFormulated to contain 24.897% zinc oxide, 14.933% ferrous sulfate, 3.470% manganese oxide, 0.967% cupric carbonate, 0.262% potassium iodide, 0.060% sodium selenate, and
0.030% cobalt carbonate in a cellulose base.gFormulated to contain 25.000% L-ascorbyl-2-polyphosphate, 14.000% RRR-alpha tocopheryl acetate, 13.160% vitamin K, 12.500% inositol, 12.500% nicotinic acid, 7.500%
riboflavin, 6.250% calcium pantothenate, 2.500% pyridoxine hydrochloride, 1.250% thiamine mononitrate, 1.000% vitamin A palmitate, 0.500% cyanocobalamin, 0.450% folic acid0.125% biotin, and 0.010% cholecalciferol in a cellulose base.
hArgent Laboratories, Redmond, Washington.
indicated significant differences among dietary groups. Addi-tionally, data from the MFM and CFM series (i.e., excluding the60 Blend) were analyzed by two-way ANOVA (PROC GLIM-MIX) to determine the significance of fish meal type and inclu-sion level as main and interactive effects. All differences wereconsidered significant at P < 0.05.
RESULTS AND DISCUSSIONOur results indicate that growth performance of Largemouth
Bass is not influenced by the origin of the fish meal or inclusionlevel (Tables 3, 4). Weight gain (329–388%), FCR (0.78–0.97),and SGR (2.65–2.88% body weight/d) were generally consistentfor fish among fish meal types and inclusion levels. Feed intakewas highest in the 40 CFM group and lowest in the 60 Blendgroup, and neither group showed any obvious patterns relatedto fish meal inclusion level or origin. Hepatosomatic and vis-cerosomatic indices did not vary among treatment groups, andsurvival was 100% in all groups. Kop and Korkut (2010) con-
ducted a similar experiment with juvenile Rainbow Trout fedpractical isonitrogenous and isoenergetic diets utilizing threedifferent fish meal types: Peruvian fish meal (traditional com-mercial fish meal), locally produced (Izmir, Turkey) anchovyfish meal, and locally produced fish meal from the by-productsof several fish species (Gilthead Sea Bream Sparus aurata, SeaBass Dicentrarchus labrax, and Rainbow Trout). Their resultsindicated that the origin of fish meal did not influence growthperformance. Similarly, our data indicate that while some in-clusion of fish meal may be important to ensure rapid, efficientgrowth in Largemouth Bass juveniles, traditional marine-originfish meals such as MFM could be replaced with CFM withoutcompromising performance.
Although there was no statistical difference in growth per-formance among treatments, in general diets containing higherlevels of fish meal performed better, except the 60 MFM diet(Table 3). Growth with the 60 MFM diet was not significantlylower than that for any of the other fish meal diets, but it waslower than expected (i.e., higher fish meal inclusion typically
Dow
nloa
ded
by [
Sout
hern
Illi
nois
Uni
vers
ity]
at 0
9:15
16
Oct
ober
201
4

188 BOWZER ET AL.
TABLE 3. Growth performance of Largemouth Bass fed diets containing Asian carp meal (CFM) or menhaden fish meal (MFM). Values represent least-squaresmeans; pooled SE and P-values resulting from one-way ANOVA tests are also provided. No significant differences were observed for any parameters (P < 0.05).
Parameter 60 MFM 40 MFM 60 CFM 40 CFM 60 Blend Pooled SE P-value
Initial weight (g) 11.7 11.5 11.5 11.5 11.7 0.2 0.64Final weight (g) 50.1 52.6 54.3 53.2 56.9 2.4 0.15Weight gain (%) 329 356 370 364 388 18 0.09Specific growth rate (% body weight/d) 2.65 2.76 2.81 2.79 2.88 0.07 0.09Feed conversion ratio 0.97 0.95 0.90 0.94 0.78 0.07 0.11Feed intake (% body weight/d) 2.79 2.87 2.78 2.90 2.50 0.15 0.14Hepatosomatic index 1.00 0.93 1.01 0.95 0.98 0.08 0.82Viscerosomatic index 6.71 6.82 6.31 6.07 6.77 0.58 0.63
leads to better growth). Fish meal replacement studies have beensuccessful in partially or completely replacing fish meal with avariety of alternative plant- and animal-based protein meals formany species, including Largemouth Bass (Cochran et al. 2009),hybrid striped bass (White Bass Morone chrysops × StripedBass M. saxatilis) (Rawles et al. 2011), and Rainbow Trout(Baboli et al. 2013). Therefore it is not surprising that therewere no significant treatment effects in this study. However, thelower than expected growth performance observed in the 60MFM diet of this study can likely be attributed to the lower thanintended protein content in the diet (Table 2). In general, theanalyzed composition of the diets exceeded intended proteincontent based on their formulations, except the 60 MFM diet,which was lower than intended; the analyzed crude proteincontent of the 60 MFM diet was approximately 40 g (g/kg,as-fed basis) lower than intended, whereas all of the other dietswere near their intended crude protein content (± 10 g/kg,as-fed basis). This suggests that some mistakes were madeduring feed manufacturing, which led to lower protein contentand likely contributed to the reduced performance in the 60MFM treatment. Regardless, growth performance observedin this trial was generally good and consistent with rangesreported in other Largemouth Bass feeding trials (Tidwell et al.
2005; Coursey et al. 2013). The data also suggest that some fishmeal sparing with alternative plant and animal protein meals ispossible without affecting growth performance.
Overall, feed conversion was exceptional in this study (FCR,0.78–0.97). Feed intake (2.50–2.90% body weight/d) was simi-lar among dietary treatments with no apparent trend. Althoughgrowth performance was undoubtedly influenced in part by mi-nor differences in feed intake, no clear trends emerged, suggest-ing there are corresponding patterns of reduced intake in fishfrom the lower fish meal treatments and elevated intake in fishfed diets with higher levels of fish meal included or differen-tial intake of diets based on one fish meal type or the other.There were no evident trends observed in HSI (0.93–1.01) orVSI (6.07–6.82), and these values are consistent with the resultsof previous studies (Tidwell et al. 2005; Coursey et al. 2013).Additionally, there were no mortalities during our study. Giventhat feed conversion was exceptional in this study and there werefew differences in growth, feed intake, HSI, or VSI, Asian carpmeal appears to be a suitable substitute for traditional marinefish meals.
Our study demonstrates that Asian carp meal is a suitable sub-stitute for more expensive fish meals and some fish meal sparingis possible without compromising growth of Largemouth Bass.
TABLE 4. Growth performance of Largemouth Bass fed diets containing Asian carp meal (CFM) or menhaden fish meal (MFM), excluding the 60 Blend.Numerals in inclusion level terms indicate the percentage of digestible protein content provided by a fish meal source, i.e., 60 indicates 60%. Values representleast-squares means; pooled SE and P-values resulting from two-way ANOVA tests are also provided. No significant main or interactive effects were observed forany parameter (P > 0.05).
Fish meal type Inclusion level
Parameter MFM CFM Pooled SE P-value 60 40 Pooled SE P-value
Initial weight (g) 11.6 11.5 0.08 0.26 11.6 11.5 0.08 0.26Final weight (g) 51.4 53.7 1.8 0.23 52.2 52.9 1.8 0.71Weight gain (%) 343 367 14 0.11 350 360 14 0.48Specific growth rate (% body weight/d) 2.70 2.80 0.04 0.12 2.73 2.78 0.06 0.45Feed conversion ratio 0.96 0.92 0.05 0.45 0.94 0.95 0.05 0.83Feed intake (% body weight/d) 2.83 2.84 0.09 0.92 2.79 2.89 0.09 0.28Hepatosomatic index 0.97 0.98 0.05 0.81 1.01 0.94 0.05 0.25Viscerosomatic index 6.77 6.19 0.41 0.20 6.51 6.44 0.41 0.87
Dow
nloa
ded
by [
Sout
hern
Illi
nois
Uni
vers
ity]
at 0
9:15
16
Oct
ober
201
4

TECHNICAL NOTE 189
However, some caution should be taken when extrapolating tocommercial-scale production since these fish were reared un-der optimal conditions and variations in temperature, stress,dissolved oxygen, parasites, and other challenges that are typ-ical of intensive commercial fish culture; but, these concernsshould be minimal given that Asian carp meal and traditionalfish meal sources have similar proximate compositions. There-fore the production of Largemouth Bass, and likely that of othercarnivorous species, could benefit from using Asian carp mealin practical diets.
ACKNOWLEDGMENTSWe extend our sincere thanks to the Illinois Soybean Asso-
ciation for supporting this research project under grant num-ber ISA-12-10-59-240-550-10. We also thank Omega Protein,Tyson, and Darling International for the donation of feedstuffsused to prepare the feeds evaluated in this work.
REFERENCESBaboli, M. J., M. Dawodi, and A. Gorjipor. 2013. Effect of replacement fish
meal by poultry meal on growth, survival, and body composition of RainbowTrout (Oncorhynchus mykiss). International Research Journal of Applied andBasic Sciences 5:296–300.
Barrows, F. T., T. F. Gaylord, W. Sealey, and S. D. Rawles. 2012. Databaseof nutrient digestibilities of 355 traditional and novel feed ingredients fortrout and hybrid Striped Bass. U.S. Department of Agriculture–AgriculturalResearch Service. Available: http://www.ars.usda.gov/Main/docs.htm?docid=21905. (April 2014).
Bowzer, J., J. T. Trushenski, and D. Glover. 2013. Potential of Asian carp fromthe Illinois River as a source of raw materials for fish meal production. NorthAmerican Journal of Aquaculture 75:404–415.
Bowzer, J., J. T. Trushenski, S. Rawles, T. G. Gaylord, and F. T. Barrows. Inpress. Apparent digestibility of Asian carp- and Common Carp-derived fishmeals in feeds for hybrid Striped Bass Morone saxatilis ♀ × M. chrysops♂ and Rainbow Trout Oncorhynchus mykiss. Aquaculture Nutrition. DOI:10.1111/anu.12136.
Cochran, N. J., S. D. Coyle, and J. H. Tidwell. 2009. Evaluation of reducedfish meal diets for second year growout of the Largemouth Bass, Micropterussalmoides. Journal of the World Aquaculture Society 40:735–743.
Conover, G., R. Simmonds, and M. Whalen, editors. 2007. Management andcontrol plan for Bighead, Black, Grass, and Silver carps in the UnitedStates. Aquatic Nuisance Species Task Force, Asian Carp Working Group,Washington, D.C.
Coursey, A. R., J. T. Trushenski, and C. Kohler. 2013. Alternative feedingstrategies to maximize fish oil and fish meal sparing in Largemouth Bassculture while maintaining production performance and product value. NorthAmerican Journal of Aquaculture 75:266–276.
FAO (Food and Agriculture Organization of the United Nations). 2008. Thestate of world fisheries and aquaculture 2008. FAO, Fisheries and AquacultureDepartment, Rome.
FAO (Food and Agriculture Organization of the United Nations). 2013. Com-modity price index. FAO, Economic and Social Development Department,Rome. Available: http://www.fao.org/economic/est/prices. (October 2013).
Kop, A., and A. Y. Korkut. 2010. Effects of diets with difference fish meal originson the performance of Rainbow Trout Oncorhynchus mykiss (Walbaum).Journal of Animal and Veterinary Advances 9:581–583.
Lodge, D. M., S. Williams, H. J. MacIsaac, K. R. Hayes, B. Leung, S. Reichard,R. N. Mack, P. B. Moyle, M. Smith, D. A. Andow, J. T. Carlton, and A.McMichael. 2006. Biological invasions: recommendations for U.S. policyand management. Ecological Applications 16:2035–2054.
McClelland, M. A. G. G. Sass, T. R. Cook, K. S. Irons, N. N. Michaels, T. M.O’Hara, and C. S. Smith. 2012. The long-term Illinois River fish populationmonitoring program. Fisheries 37:340–350.
Mitchell, A. J., A. E. Goodwin, R. R. Lochman, and D. M. Tieman. 2002.Massive hepatic necrosis and nodular regeneration in Largemouth Bass feddiets high in available carbohydrate. Journal of the World Aquaculture Society33:466–477.
Naylor, R. L., R. J. Goldburg, J. H. Primavera, N. Kautsky, M. C. M. Beveridge,J. Clay, C. Folke, J. Lubchenko, H. Looney, and M. Troell. 2000. Effect ofaquaculture on world fish supplies. Nature 405:1017–1024.
Portz, L., and E. P. Cyrino. 2004. Digestibility of nutrients and amino acids ofdifferent protein sources in practical diets by Largemouth Bass Micropterussalmoides (Lacepede, 1802). Aquaculture Research 35:312–320.
Rawles, S. D., K. R. Thompson, Y. J. Brady, L. S. Metts, M. Y. Aksoy, A. L.Gannam, R. G. Twibell, S. Ostrand, and C. D. Webster. 2011. Effects of replac-ing fish meal with poultry by-product meal and soybean meal and reducedprotein level on the performance and immune status of pond-grown sun-shine bass (Morone chrysops × M. saxatilis). Aquaculture Nutrition 17:708–721.
Rombenso, A., C. Crouse, and J. T. Trushenski. 2013. Comparison of traditionaland fermented soybean meals as alternatives to fish meal in hybrid StripedBass feeds. North American Journal of Aquaculture 75:197–204.
Subhadra, B., R. Lochmann, S. Rawles, and R. Chen. 2006. Effect of fish-mealreplacement with poultry by-product meal on the growth, tissue compositionand hematological parameters of Largemouth Bass (Micropterus salmoides)fed diets containing different lipids. Aquaculture 260:221–231.
Tidwell, J. H., S. D. Coyle, L. A. Bright, and D. Yasharian. 2005. Evaluationof plant and animal source proteins for replacement of fish meal in practicaldiets for the Largemouth Bass (Micropterus salmoides). Journal of the WorldAquaculture Society 36:454–463.
Tidwell, J. H., S. D. Coyle, and T. A. Woods. 2000. Species profile:Largemouth Bass. South Regional Aquaculture Center, Publication 722,Stoneville, Mississippi. Available: https://srac.tamu.edu/index.cfm/event/getFactSheet/whichfactsheet/144./ (October 2013).
Tsehaye, I., M. Ctalano, G. Sass, D. Glover, and B. Roth. 2013. Prospects forfishery-induced collapse of invasive Asian carp in the Illinois River. Fisheries38:445–454.
Vitousek, P. M., C. M. D’Antonio, L. L. Loope, M. Rejmanek, and R. West-brooks. 1997. Introduced species: a significant component of human-causedglobal environmental change. New Zealand Journal of Ecology 21:1–16.
Dow
nloa
ded
by [
Sout
hern
Illi
nois
Uni
vers
ity]
at 0
9:15
16
Oct
ober
201
4

1 1 2 3 4
1 Center for Fisheries Aquaculture and Aquatic Sciences, Southern Illinois University Carbondale, Carbondale, IL, USA;2 United States Department of Agriculture (USDA), Agricultural Research Service (ARS), Harry K. Dupree Stuttgart
National Aquaculture Research Center, Stuttgart, AR, USA; 3 U.S. Fish and Wildlife Service, Bozeman Fish Technology
Center, Bozeman, MT, USA; 4 U.S. Department of Agriculture Agricultural Research Service, Bozeman Fish Technology
Center, Bozeman, MT, USA
Apparent digestibility coefficients (ADCs) of nutrients
(crude protein, amino acids, crude lipid, fatty acids, and
minerals) were determined for fish meals derived from men-
haden, Asian carp (combination of silver and bighead
carps), and common carp in feeds for hybrid striped bass
and rainbow trout. Extruded test diets were formulated to
contain a 70 : 30 mixture of reference diet and test ingredi-
ent with yttrium oxide (1 g kg�1) serving as the inert mar-
ker. Diets were randomly assigned to triplicate tanks and
fish were fed once per day at 2% body weight. Fecal sam-
ples were collected by manual stripping. The ADCs were
calculated according to standard procedures. The composi-
tion and digestibility of Asian carp and common carp
meals was broadly similar to menhaden meal. Protein
digestibility ranged from 86.5% (Asian carp meal) to
93.1% (common carp meal). Lipid was highly digestible
with ADCs >100% for all ingredients. Although the Asian
carp meal was less digestible than the other two fish meals,
it was still a highly digestible ingredient. Our data suggest
that fish meals derived from Asian or common carp would
be valuable feedstuffs in diets for hybrid striped bass, rain-
bow trout, and possibly other cultured fishes.
KEY WORDS: bighead carps, fishmeal, Hypophthalmichthys
spp., invasive species, sunshine bass
Received 30 April 2013; accepted 17 September 2013
Correspondence: J. Trushenski, Center for Fisheries, Aquaculture, and
Aquatic Sciences, Southern Illinois University Carbondale, Carbondale,
IL 62901, USA. E-mail [email protected]
Marine-origin fish meal has traditionally been used as the
principal protein source in aquafeeds for carnivorous taxa
because it generally meets the essential amino acid require-
ments of fish, it is protein dense, highly palatable, and
readily accepted by tuna (Van Barneveld & Vandepeer
2007), yellowtail (Seriola sp.; Kolkovski & Sakakura 2007),
grouper (Epinephelus sp.; Ottolenghi et al. 2004; Sim et al.
2005), barramundi (Lates calcarifer; Thongrod 2007), snap-
per (Lutjanus sp.; Tacon & Metian 2009), flounder (Para-
lichthys sp.; Tacon & Metian 2009), croaker (Larimichthys
sp.; Tacon & Metian 2009), and pompano (Trachinotus sp.;
Tacon & Metian 2009). Given that protein tends to be the
most expensive component of fish feeds and feed typically
accounts for 40–50% of operating costs of intensive fish
production (Cheng et al. 2004), there are considerable eco-
nomic incentives to reduce the aquaculture industry’s reli-
ance on fish meal as a primary dietary ingredient. The
aquaculture industry continues to grow to meet the increas-
ing demand for fisheries products (FAO 2012), but a com-
bination of stagnant supply and high demand for fish meal
has led to dramatic increases in fish meal costs. Whereas
the price of fish meal from 1985 to 2000 fluctuated around
$500 per metric ton, current prices exceed $2000 per metric
ton (FAO 2013). Current supplies of fish meal will not be
. . . . . . . . . . . . . . . . . . . . . . . . . . . . . . . . . . . . . . . . . . . . . . . . . . . . . . . . . . . . . . . . . . . . . . . . . . . . . . . . . . . . . . . . . . . . . .
ª 2014 John Wiley & Sons Ltd
2014 doi: 10.1111/anu.12136. . . . . . . . . . . . . . . . . . . . . . . . . . . . . . . . . . . . . . . . . . . . . . . . . . . . . . . . . . . . . . . . . . . . . . . . . . . . . . . . . . . . . . . . . .
Aquaculture Nutrition

sufficient to meet the demand of future production if die-
tary inclusion of fish meal remains at high levels (Hardy &
Tacon 2002): although fish meal has other applications,
more than 70% of global production is used in the produc-
tion of aquafeeds (Tacon & Metian 2011). Even though the
use of fish meal in aquafeeds is expected to decline in the
future due to an improved knowledge of the digestive pro-
cesses and nutritional requirements of many farm-raised
fishes (Food & Agriculture Organization of the United
Nations (FAO) 2012), fish meal will continue to play an
essential role as a dietary protein source in aquafeeds, par-
ticularly for emerging culture taxa. Finding a source of fish
meal from underutilized alternative fish meal sources such
as silver carp Hypopthalmichthys molitrix and bighead carp
H. nobilis (hereafter referred to simply as Asian carp) as
well as common carp Cyprinus carpio will benefit the aqua-
culture industry.
Asian and common carp are low value fishes with little
potential as food fishes in the United States. Therefore,
they are particularly suited for industrial applications such
as rendering. Like traditional fish meal sources with lim-
ited seafood market potential (e.g., menhadens, anchovies,
and herrings), Asian and common carp could be rendered
to produce nutrient-dense meals for livestock feeds, espe-
cially aquafeeds. Common carp are abundant in many riv-
ers and impoundments across the United States (Nico
et al. 2013) and recently Asian carp have rapidly
expanded and proliferated in the Mississippi River Basin
(Conover et al. 2007). The abundance and wide distribu-
tion of carps make them an attractive target for new
reduction fisheries. Although these fisheries do not com-
pare in volume to traditional marine fish meal sources,
they may provide a cost-effective supplement to marine
harvest. However, demand for these carp meals depends
on producing a quality rendered product. The nutritional
compositions of fishes are known to vary by taxon as well
as harvest location and season (Bragadottir et al. 2004;
Boran et al. 2008).
Asian and common carp meals have advantages over
other alternative feedstuffs in aquafeed production due to
their similarity to traditional fish meal sources. Fish meal
replacement presents a variety of challenges for nutrition-
ally demanding carnivorous fish. Fish feeds contain higher
protein levels than other livestock feeds (Keembiyehetty
& Gatlin 1992), and aquafeed manufacturers have tradi-
tionally relied on fish meal to meet this demand. The ris-
ing cost of marine fish meals has forced feed
manufacturers to explore a variety of plant-based (e.g.,
soybean, canola, corn, and wheat) and animal-based (e.g.,
poultry, blood, and feather) feedstuffs. However, a combi-
nation of chemical composition, nutrient utilization,
digestibility, anti-nutritional factors, palatability, and
functional attributes of these feedstuffs has made it diffi-
cult to create fish meal-free formulations that perform
equally to formulations that include fish meal (Glencross
et al. 2007). For example, soybean meal is a promising
alternative to fish meal because of its favorable amino
acid profile and relatively protein-dense content (Gatlin
et al. 2007). Although soybean meal is routinely incorpo-
rated into fish feeds at moderate levels (Hendricks 2003),
high inclusion levels have resulted in poorer fish perfor-
mance, reduced diet palatibility (Adelizi et al. 1998),
higher feed conversion ratios (Davies & Morris 1997),
and decreased mineral availability (Trushenski et al.
2006), and detrimental effects of anti-nutrients in soybean
meals has been well documented on the intestine of sal-
monids (Ostaszewska et al. 2005; Heikkinen et al. 2006;
Iwashita et al. 2008). Similar results have been demon-
strated with other alternative feedstuffs (Subhadra et al.
2006; Lewis & Kohler 2008; Merida et al. 2010). Asian
and common carp meals, on the other hand, would prob-
ably present few, if any, problems commonly associated
with alternative feedstuffs.
Although numerous trials have reported the digestibil-
ity of various ingredients and feeds in fishes, such as
hybrid striped bass Morone chrysops 9 M. saxatilis (also
referred to as sunshine bass) and rainbow trout
Oncorhynchus mykiss, digestibility data from studies utiliz-
ing extruded feeds is somewhat limited (Rawles et al.
2006a,b; Gaylord et al. 2010). As extrusion is the pre-
dominant method for the manufacture of commercial
feeds used in hybrid striped bass and rainbow trout cul-
ture, the most relevant digestibility coefficients come from
test diets manufactured in a similar process (Rawles et al.
2010; Glencross et al. 2011). Without data on the digest-
ibility or availability of nutrients from the ingredients
used in a formulation, one must make assumptions that
may limit the ability of nutritionists and feed manufactur-
ers to deliver high-performing diets based on alternative
ingredients. Thus, in view of promising compositional
data (Table 1), the potential use of Asian and common
carp meals in aquafeeds will depend in part on the avail-
ability of nutrients from these products. Therefore, the
objective of this study was to determine the nutrient com-
position and compare apparent digestibility of nutrients
from fish meals derived from menhaden, Asian carp, and
common carp in extruded feeds for hybrid striped bass
and rainbow trout.
. . . . . . . . . . . . . . . . . . . . . . . . . . . . . . . . . . . . . . . . . . . . . . . . . . . . . . . . . . . . . . . . . . . . . . . . . . . . . . . . . . . . . . . . . . . . . .
Aquaculture Nutrition ª 2014 John Wiley & Sons Ltd

Hybrid striped bass (~140 g average weight; Keo Fish
Farms Inc., Keo, AR, USA) and rainbow trout (~115 g
average weight; Crystal Lake Fisheries, Ava, MO, USA)
were used to determine the apparent digestibility coeffi-
cients (ADCs) of three fish meal sources: menhaden (Spe-
cial SelectTM; Omega Protein, Houston, TX, USA),
common carp (harvested from Utah Lake, Utah experi-
mental fish meal; Northwest Fisheries Science Center, Seat-
tle, WA, USA), and Asian carp (harvested from Illinois
waterways, Protein Products, Gainsville, Florida)
(Tables 1-3). The Asian carp meal was subjected to routine
quality control/quality assurance tests by a commercial feed
manufacturer and met typical standards for fish meal used
in aquafeed manufacturing (personal communication, Scott
Snyder; formerly of Zeigler Bros., Inc., Gardners, PA,
USA). The Asian carp meal was derived primarily from sil-
ver carp, although some bighead carp were likely included
in the rendering process. Although previous research had
shown the composition of carps to vary by harvest location
and season (Vujkovi�c et al. 1999; Steffens & Wirth 2005;
Guler et al. 2008), previous research had indicated that
both species harvested from the Illinois River had generally
comparable value as raw materials for rendering into a
Table 1 Composition (g kg�1 dry matter basis) of fish meal
sources fed to hybrid striped bass and rainbow trout
Composition
Asian
carp
Common
carp Menhaden
Protein (crude) 640.1 674.6 687.3
Lipid (crude) 122.7 169.3 101.3
Ash 246.4 161.2 213.7
Dry matter 971.4 857.4 943.3
Amino acid
Ala 32.1 36.5 31.3
Arg 27.2 30.0 25.8
Asp 42.8 36.8 38.2
Cys 4.0 2.3 3.8
Glu 53.3 47.3 49.9
Gly 32.7 49.0 36.6
His 10.0 7.0 9.4
Ile 21.1 15.6 18.3
Leu 36.4 27.6 32.8
Lys 36.1 26.5 31.4
Met 14.7 10.4 12.9
Phe 19.7 16.3 17.0
Pro 25.2 36.4 25.7
Ser 17.2 16.8 18.5
Tau 5.0 5.0 3.7
Thr 20.5 18.0 19.1
Trp 14.3 11.2 14.3
Tyr 15.7 11.1 12.9
Val 23.0 19.0 20.6
Table 2 Fatty acid composition (g kg�1 of identified fatty acids on
a dry matter basis) of fish meal sources fed to hybrid striped bass
and rainbow trout
Fatty acid(s) Asian carp Common carp Menhaden
14:0 13.7 34.3 101.8
16:0 212.2 193.3 252.9
16:1n-7 36.0 97.7 117.3
16:2n-4 0.5 5.0 14.7
17:0 2.4 9.7 5.3
16:3n-4 0.0 2.5 17.0
17:1 0.0 3.8 0.0
18:0 63.9 42.9 51.9
18:1n-9 470.4 183.7 81.9
18:1n-7 23.8 69.6 32.1
18:2n-6 118.8 93.3 13.3
18:3n-6 2.1 1.5 1.7
18:3n-4 1.2 4.1 4.9
18:3n-3 8.8 83.9 9.6
18:4n-3 1.0 18.6 18.5
20:1n-9 13.2 10.8 9.6
20:2n-6 6.5 7.7 1.6
20:3n-6 7.5 4.2 2.6
20:4n-6 7.5 26.1 17.3
20:5n-3 4.2 56.7 125.8
22:5n-3 1.9 18.5 25.4
22:6n-3 4.4 32.1 95.0
SFA1 292.1 280.2 411.9
MUFA2 543.4 365.7 240.8
PUFA3 164.4 354.1 347.3
MC-PUFA4 132.0 201.5 47.9
LC-PUFA5 32.0 145.1 267.6
n-3 20.3 209.7 274.2
n-6 142.5 132.7 36.5
1 SFA = saturated fatty acids (no double bonds).2 MUFA = monounsaturated fatty acids (1 double bond).3 PUFA = polyunsaturated fatty acids (2 or more double bonds).4 MC-PUFA = medium-chain polyunsaturated fatty acids (18 car-
bon atoms with 2 or more double bonds).5 LC-PUFA = long-chain polyunsaturated fatty acids (20 or more
carbon atoms with 3 or more double bonds).
Table 3 Mineral composition (ug g�1 sample) of fish meal sources
fed to hybrid striped bass and rainbow trout
Mineral Asian carp
Common
carp Menhaden
Ba BD1 BD 13.0
Cu BD BD BD
Mn BD BD 64.3
Ti 42.0 41.6 44.0
Ca 61615 30665 46815
Fe 197 126 851
Mg 2340 1572 3301
P 9289 20711 15143
K BD BD BD
S 6106 7231 8743
Zn 137 381 117
Y BD BD BD
1 BD = below detection level.
. . . . . . . . . . . . . . . . . . . . . . . . . . . . . . . . . . . . . . . . . . . . . . . . . . . . . . . . . . . . . . . . . . . . . . . . . . . . . . . . . . . . . . . . . . . . . .
Aquaculture Nutrition ª 2014 John Wiley & Sons Ltd

protein meal (Bowzer et al. 2013). The methods of Cho
et al. (1982) and Bureau et al. (1999) were used to estimate
the apparent digestibility of crude protein, amino acids,
crude lipid, fatty acids, and minerals as described by Bar-
rows et al. (2012). Yttrium oxide served as the inert maker,
and the reference diet met or exceeded all known nutri-
tional requirements of hybrid striped bass and rainbow
trout (NRC 2011) (Table 4). Test diets consisted of a
70 : 30 ratio (dry matter basis) of reference diet to test
ingredient.
All diets were manufactured with a twin-screw cooking
extruder (DNDL-44; Buhler AG, Uzwil, Switzerland) with
an 18 s exposure to an average temperature of 109 °C. The
die plate (3 mm) was water cooled to an average tempera-
ture of 60 °C. Pressure varied at the die head from 18 to
29 bar, depending on the diet. The pellets were dried in a
pulse-bed drier (Buhler AG) for ~15 min at 88 °C or until
final moisture levels were <100 g kg�1 as determined by
microwave moisture analyzer (uWave; Omnimark, Bohe-
mia, NY, USA). The pellets were then cooled with forced
air at ambient temperatures. All added oil was incorpo-
rated in the mix rather than top coated.
Both trials followed similar procedures in comparable
recirculating systems with continuous flow and aeration.
Tanks were stocked with five fish and water temperatures
were maintained at approximately 22 and 16 °C for hybrid
striped bass and rainbow trout, respectively. The photope-
riod remained 24 h light throughout both trials. Each test
diet was randomly assigned to triplicate tanks (N = 3) and
fed once per day at 2% body weight. The fish were accli-
mated to experimental conditions for 1 week prior to the
beginning of fecal sample collection. Fecal samples were col-
lected by manual stripping 8 h (hybrid striped bass) and
26 h (rainbow trout) postfeeding. Collection times were cho-
sen based on previous experience with gut passage rates and
fecal sample collection for these taxa. Manual stripping was
accomplished by transferring fish to an aerated sedative bath
[hybrid striped bass: 30 mg L�1 and rainbow trout:
15 mg L�1 eugenol; AQUI-S 20E (10% eugenol), Aqui-S
New Zealand Ltd., Lower Hutt, New Zealand], gently drying
the vent area of sedated fish, and applying pressure to the
lower abdominal region to expel fecal material into a plastic
tube. Precautions were taken to exclude water, urine, mucus,
scales, etc. from the fecal samples. Following fecal sample
collection, fish were returned to their respective tanks to
recover, and normal feeding and culture conditions resumed
the subsequent day. The process was repeated every 2 days,
pooling fecal material by tank, until a sufficient volume of
feces was obtained for analysis.
Dry matter analysis of ingredients, diets, and feces was
performed according to standard methods (AOAC 1995).
Mineral contents were quantified in ingredients, diets and
feces by inductively coupled plasma atomic absorption
spectrophotometry following nitric acid digestion (Ander-
son 1996). Crude protein (N 9 6.25) was determined in
ingredients, diets, and feces by the Dumas method (Associ-
ation of Official Analytical Chemists (AOAC) 1995) on a
Leco TruSpec N nitrogen determinator (LECO Corp., St.
Joseph, MI, USA). Amino acid concentrations in samples
were determined by high performance liquid chromatogra-
phy (HP1100; Agilent Technologies, Wilmington, DE,
USA) following acid hydrolysis (Association of Official
Analytical Chemists (AOAC) 1995) using precolumn
o-phthaldehyde derivatization (Fleming et al. 1992). Tryp-
tophan in samples was similarly analyzed by HPLC follow-
ing basic hydrolysis (AOAC 2000). Total lipid was
determined gravimetrically following chloroform/methanol
extraction modified from Folch et al. (1957). Resultant
lipid fractions were analyzed for fatty acid composition
according to the procedures described by Laporte & Tru-
shenski (2011). Samples were subjected to acid-catalyzed
transmethylation performed overnight at 50 °C as
described by Christie (1982) and the resultant fatty acid
methyl esters (FAME) were separated using a Shimadzu
GC-17A gas chromatograph (Shimadzu Scientific Instru-
ments, Kyoto, Japan) equipped with a flame ionization
detector fitted with a permanently bonded polyethylene gly-
col, fused silica capillary column (Omegawax 250,
30 9 0.25 mm I.D., 0.25 lm film; Sigma Aldrich, St.
Louis, MO, USA). Individual FAME were identified by
reference to external standards (Supelco 37 Component
Table 4 Composition of reference diet (g kg�1) dry matter basis
adapted from Barrows et al. (2012)
Ingredient
Wheat flour 293.3
Squid meal 250.0
Soy protein concentrate 171.4
Menhaden fish oil 133.9
Corn protein concentrate 83.4
Soybean meal, solvent extracted 43.0
Vitamin premix ARS 702 10.0
Choline chloride 6.0
Taurine 5.0
Stay-C 2.0
Trace mineral premix 1.0
Yttrium oxide 1.0
Analyzed composition
Crude protein 464.2
Crude lipid 142.9
. . . . . . . . . . . . . . . . . . . . . . . . . . . . . . . . . . . . . . . . . . . . . . . . . . . . . . . . . . . . . . . . . . . . . . . . . . . . . . . . . . . . . . . . . . . . . .
Aquaculture Nutrition ª 2014 John Wiley & Sons Ltd
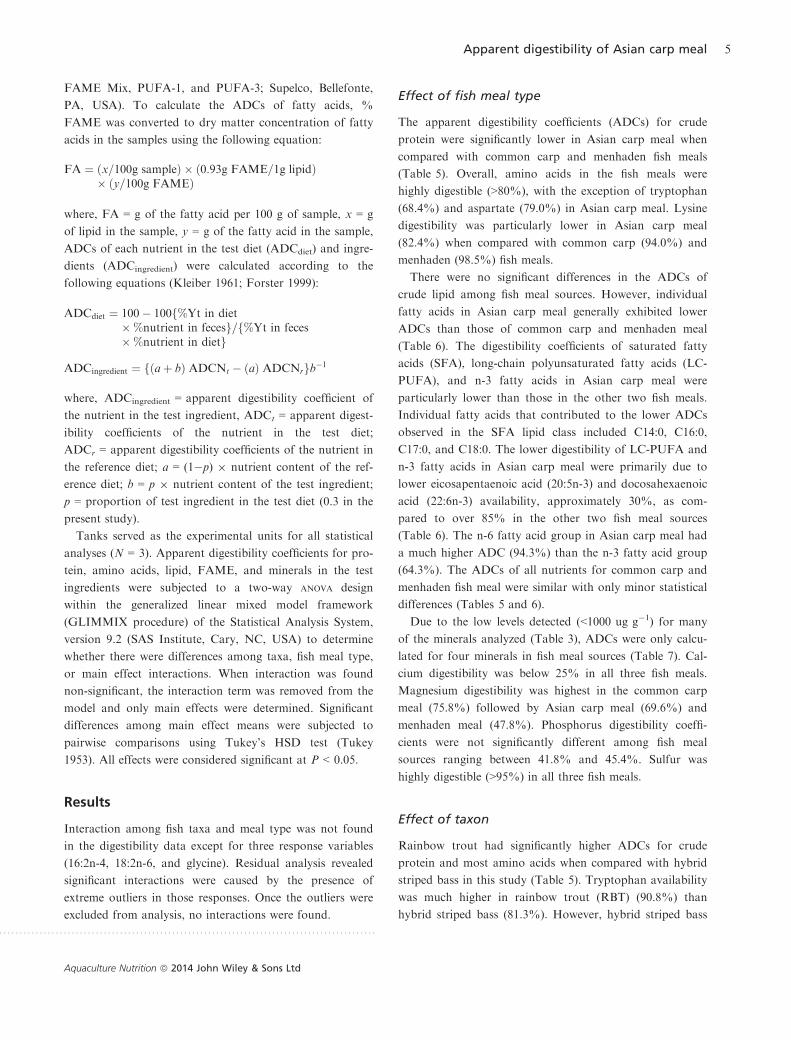
FAME Mix, PUFA-1, and PUFA-3; Supelco, Bellefonte,
PA, USA). To calculate the ADCs of fatty acids, %
FAME was converted to dry matter concentration of fatty
acids in the samples using the following equation:
FA ¼ ðx=100g sampleÞ � ð0:93g FAME=1g lipidÞ� ðy=100g FAMEÞ
where, FA = g of the fatty acid per 100 g of sample, x = g
of lipid in the sample, y = g of the fatty acid in the sample,
ADCs of each nutrient in the test diet (ADCdiet) and ingre-
dients (ADCingredient) were calculated according to the
following equations (Kleiber 1961; Forster 1999):
ADCdiet ¼ 100� 100f%Yt in diet�%nutrient in fecesg=f%Yt in feces�%nutrient in dietg
ADCingredient ¼ fðaþ bÞ ADCNt � ðaÞ ADCNrgb�1
where, ADCingredient = apparent digestibility coefficient of
the nutrient in the test ingredient, ADCt = apparent digest-
ibility coefficients of the nutrient in the test diet;
ADCr = apparent digestibility coefficients of the nutrient in
the reference diet; a = (1�p) 9 nutrient content of the ref-
erence diet; b = p 9 nutrient content of the test ingredient;
p = proportion of test ingredient in the test diet (0.3 in the
present study).
Tanks served as the experimental units for all statistical
analyses (N = 3). Apparent digestibility coefficients for pro-
tein, amino acids, lipid, FAME, and minerals in the test
ingredients were subjected to a two-way ANOVA design
within the generalized linear mixed model framework
(GLIMMIX procedure) of the Statistical Analysis System,
version 9.2 (SAS Institute, Cary, NC, USA) to determine
whether there were differences among taxa, fish meal type,
or main effect interactions. When interaction was found
non-significant, the interaction term was removed from the
model and only main effects were determined. Significant
differences among main effect means were subjected to
pairwise comparisons using Tukey’s HSD test (Tukey
1953). All effects were considered significant at P < 0.05.
Interaction among fish taxa and meal type was not found
in the digestibility data except for three response variables
(16:2n-4, 18:2n-6, and glycine). Residual analysis revealed
significant interactions were caused by the presence of
extreme outliers in those responses. Once the outliers were
excluded from analysis, no interactions were found.
The apparent digestibility coefficients (ADCs) for crude
protein were significantly lower in Asian carp meal when
compared with common carp and menhaden fish meals
(Table 5). Overall, amino acids in the fish meals were
highly digestible (>80%), with the exception of tryptophan
(68.4%) and aspartate (79.0%) in Asian carp meal. Lysine
digestibility was particularly lower in Asian carp meal
(82.4%) when compared with common carp (94.0%) and
menhaden (98.5%) fish meals.
There were no significant differences in the ADCs of
crude lipid among fish meal sources. However, individual
fatty acids in Asian carp meal generally exhibited lower
ADCs than those of common carp and menhaden meal
(Table 6). The digestibility coefficients of saturated fatty
acids (SFA), long-chain polyunsaturated fatty acids (LC-
PUFA), and n-3 fatty acids in Asian carp meal were
particularly lower than those in the other two fish meals.
Individual fatty acids that contributed to the lower ADCs
observed in the SFA lipid class included C14:0, C16:0,
C17:0, and C18:0. The lower digestibility of LC-PUFA and
n-3 fatty acids in Asian carp meal were primarily due to
lower eicosapentaenoic acid (20:5n-3) and docosahexaenoic
acid (22:6n-3) availability, approximately 30%, as com-
pared to over 85% in the other two fish meal sources
(Table 6). The n-6 fatty acid group in Asian carp meal had
a much higher ADC (94.3%) than the n-3 fatty acid group
(64.3%). The ADCs of all nutrients for common carp and
menhaden fish meal were similar with only minor statistical
differences (Tables 5 and 6).
Due to the low levels detected (<1000 ug g�1) for many
of the minerals analyzed (Table 3), ADCs were only calcu-
lated for four minerals in fish meal sources (Table 7). Cal-
cium digestibility was below 25% in all three fish meals.
Magnesium digestibility was highest in the common carp
meal (75.8%) followed by Asian carp meal (69.6%) and
menhaden meal (47.8%). Phosphorus digestibility coeffi-
cients were not significantly different among fish meal
sources ranging between 41.8% and 45.4%. Sulfur was
highly digestible (>95%) in all three fish meals.
Rainbow trout had significantly higher ADCs for crude
protein and most amino acids when compared with hybrid
striped bass in this study (Table 5). Tryptophan availability
was much higher in rainbow trout (RBT) (90.8%) than
hybrid striped bass (81.3%). However, hybrid striped bass
. . . . . . . . . . . . . . . . . . . . . . . . . . . . . . . . . . . . . . . . . . . . . . . . . . . . . . . . . . . . . . . . . . . . . . . . . . . . . . . . . . . . . . . . . . . . . .
Aquaculture Nutrition ª 2014 John Wiley & Sons Ltd

had significantly higher ADCs for proline (100.6%) than
rainbow trout (93.0%). Although crude lipid was not sig-
nificantly different between taxa, hybrid striped bass gener-
ally had slightly higher digestibility coefficients than
rainbow trout for individual FAMEs. The availability of
SFA was particularly higher in hybrid striped bass (87.1%)
when compared with rainbow trout (71.4%). However, the
overall ADCs of all nutrients in the tested fish meals were
high for both taxa.
Few taxon differences were observed in mineral availabil-
ity (Table 7). Rainbow trout (50.2%) had a significantly
higher ADC for phosphorus when compared with hybrid
striped bass (35.9%). However, hybrid striped bass
(104.8%) appear to utilize sulfur better than rainbow trout
(97.4%). The ADCs for calcium and magnesium were not
significantly different between taxa.
Market and environmental factors suggest that traditional
marine sources of fish meal are not capable of sustainably
increasing catches to support increases in demand (Tacon
& Nates 2007). Given that marine fish meal is a dominant
ingredient in the diets of many cultured carnivorous fish
due to the demanding nutritional needs of these taxa,
nutritionists have been concerned with finding suitable
alternatives. When considering potential replacements,
nutrient composition and digestibility are usually evaluated
first because nutrient availability is necessary for accurate
and low-cost diet formulations (Rawles et al. 2010). Fresh-
water fish meal sources, such as the Asian carp and com-
mon carp evaluated in this study, are similar
compositionally to traditional marine fish meal sources,
particularly with respect to crude protein and amino acid
content, and given that Asian carp meal is currently priced
at $600-650 per metric ton (P. Hitchens, Southern Illinois
University Carbondale, personal communication), carp
meals are promising cost-effective alternative protein
sources for aquafeed manufacturers that may be able to
alleviate some of the demand on marine fish meal sources.
However, it is expected that the price of Asian carp meal
will more closely resemble traditional marine-origin fish
meal sources once the market is established due to the simi-
larity of the products. Even though the fatty acid profiles
varied among fish meals in this study, particularly in bene-
ficial 20:5n-3 and 22:6n-3 content, which was highest in the
menhaden meal, the primary source of these nutrients in
the diet typically comes from the oil source used in the for-
mulation. Given the importance of other ingredients, such
as fish oil, as sources of beneficial LC-PUFA, the fatty acid
profile of fish meal is of less concern in the context of
aquafeed formulation. Nevertheless, the common carp meal
used in this study more closely resembled the fatty acid
profile of menhaden meal. Additionally, mineral content
Table 5 Apparent digestibility coefficients for crude protein and amino acids from three fish meal sources in extruded feeds for hybrid
striped bass and rainbow trout
Protein/amino
acid
Fish meal source Taxon
Asian carp Common carp Menhaden Hybrid striped bass Rainbow trout
Protein 86.5 � 0.3y 93.1 � 0.3z 92.7 � 0.3z 89.3 � 0.2y 92.2 � 0.2z
Ala 86.5 � 0.4x 92.0 � 0.4y 94.3 � 0.4z 90.6 � 0.3 91.3 � 0.3
Arg 96.6 � 1.2y 101.2 � 1.2z 102.3 � 1.2z 98.8 � 0.9 101.2 � 0.9
Asp 79.0 � 0.5y 89.8 � 0.5z 89.4 � 0.5z 84.4 � 0.4y 87.8 � 0.4z
Cys 88.9 � 4.6 89.7 � 4.6 97.8 � 4.6 91.9 � 3.8 92.4 � 3.8
Glu 88.8 � 0.2x 93.6 � 0.2y 94.8 � 0.2z 91.8 � 0.2y 93.0 � 0.2z
Gly 86.0 � 0.6y 84.7 � 0.6y 90.5 � 0.6z 86.4 � 0.5 87.6 � 0.5
His 84.5 � 0.4x 87.9 � 0.4y 92.4 � 0.4z 87.3 � 0.3y 89.2 � 0.3z
Ile 81.2 � 0.7y 94.3 � 0.7z 95.7 � 0.7z 89.8 � 0.5 91.1 � 0.5
Leu 89.6 � 0.3y 94.4 � 0.3z 95.1 � 0.3z 92.8 � 0.2 93.3 � 0.2
Lys 82.4 � 0.6x 94.0 � 0.6y 98.5 � 0.6z 91.2 � 0.5 92.0 � 0.5
Met 85.7 � 0.5x 91.6 � 0.5y 95.4 � 0.5z 90.2 � 0.4y 91.6 � 0.4z
Phe 90.2 � 0.3y 94.6 � 0.3z 95.4 � 0.3z 93.3 � 0.3 93.5 � 0.3
Pro 96.3 � 2.3 98.7 � 2.3 95.5 � 2.3 100.6 � 1.8z 93.0 � 1.8y
Ser 87.9 � 0.4y 89.0 � 0.4y 92.3 � 0.4z 88.7 � 0.3y 90.8 � 0.3z
Tau 127.0 � 8.6 129.9 � 8.6 116.0 � 8.6 128.8 � 7.0 119.7 � 7.0
Thr 85.9 � 0.4x 91.5 � 0.4y 93.2 � 0.4z 89.4 � 0.4y 91.0 � 0.4z
Trp 68.4 � 2.5y 95.4 � 2.5z 94.5 � 2.5z 81.3 � 2.1y 90.8 � 2.1z
Tyr 89.2 � 0.3y 94.3 � 0.3z 94.6 � 0.3z 91.7 � 0.2y 93.6 � 0.2z
Val 85.5 � 0.6y 94.9 � 0.6z 95.6 � 0.6z 90.6 � 0.5 92.1 � 0.5
. . . . . . . . . . . . . . . . . . . . . . . . . . . . . . . . . . . . . . . . . . . . . . . . . . . . . . . . . . . . . . . . . . . . . . . . . . . . . . . . . . . . . . . . . . . . . .
Aquaculture Nutrition ª 2014 John Wiley & Sons Ltd

was similar among the studied fish meals, although phos-
phorus content was slightly higher in the common carp
meal.
Although the Asian carp meal in this study was generally
less digestible than the common carp and menhaden fish
meals, it was still a highly digestible, nutrient-dense product
that could be included in feed formulations. Effective diets
can still be formulated with ingredients with slightly lower
ADCs, but more of that ingredient needs to be added to
have the same level of digestible nutrients. Lower ADCs,
however, will have an effect on the value or price of an
ingredient.
Table 6 Apparent digestibility coefficients for crude lipid and fatty acids from three fish meal sources in extruded feeds for hybrid striped
bass and rainbow trout
Lipid/fatty
acid(s)
Fish meal source Taxon
Asian carp Common carp Menhaden Hybrid striped bass Rainbow trout
Lipid 103.5 � 1.1 100.6 � 1.1 100.2 � 1.1 101.3 � 0.8 101.6 � 0.8
14:0 49.5 � 9.4y 92.1 � 9.4z 96.6 � 9.4z 90.1 � 7.7z 68.6 � 7.7y
16:0 70.4 � 4.1y 86.8 � 4.1z 93.4 � 4.1z 89.7 � 3.4z 77.4 � 3.4y
16:1n-7 86.4 � 1.5y 96.4 � 1.5z 97.7 � 1.5z 94.5 � 1.2 92.5 � 1.2
16:2n-4 116.8 � 1.0z 99.6 � 1.0y 99.6 � 1.0y 99.6 � 0.8y 111.0 � 0.8z
17:0 48.5 � 7.0y 86.4 � 7.0z 89.9 � 7.0z 83.3 � 5.7 66.6 � 5.7
16:3n-4 BD1 100.0 � 0.2 99.7 � 0.2 100.0 � 0.2 99.7 � 0.2
17:1 BD 100.0 � 0.0 BD 100.0 � 0.0 100.0 � 0.0
18:0 63.5 � 4.7y 73.3 � 4.7zy 86.2 � 4.7z 82.0 � 3.9z 66.6 � 3.9y
18:1n-9 93.6 � 1.6 95.1 � 1.6 95.7 � 1.6 95.3 � 1.3 94.3 � 1.3
18:1n-7 85.2 � 1.6y 95.1 � 1.7z 96.6 � 1.7z 93.6 � 1.4 91.1 � 1.4
18:2n-6 95.5 � 1.1y 97.2 � 1.1y 106.4 � 1.1z 97.7 � 0.9y 101.7 � 0.9z
18:3n-6 97.6 � 4.7 82.4 � 4.7 98.2 � 4.7 101.0 � 3.8z 84.4 � 3.8y
18:3n-4 100.0 � 0.5 100.0 � 0.5 99.1 � 0.5 100.0 � 0.4 99.4 � 0.4
18:3n-3 92.9 � 1.5 98.0 � 1.5 98.1 � 1.5 94.8 � 1.2 97.9 � 1.2
18:4n-3 100.0 � 0.3 99.7 � 0.3 99.2 � 0.3 99.5 � 0.3 99.7 � 0.3
20:1n-9 87.4 � 1.9y 89.6 � 1.9y 98.4 � 1.9z 91.9 � 1.5 91.8 � 1.5
20:2n-6 93.9 � 2.2 97.5 � 2.2 96.9 � 2.2 98.4 � 1.8 93.8 � 1.8
20:3n-6 91.5 � 4.8 92.1 � 4.8 99.2 � 4.8 96.7 � 3.9 91.8 � 3.9
20:4n-6 76.3 � 1.5y 93.8 � 1.5z 95.2 � 1.5z 87.2 � 1.3 89.6 � 1.3
20:5n-3 29.8 � 6.2y 93.9 � 6.2z 98.0 � 6.2z 70.0 � 5.0 77.8 � 5.0
22:5n-3 76.9 � 8.0 97.1 � 8.0 97.8 � 8.0 89.3 � 6.5 91.9 � 6.5
22:6n-3 29.4 � 4.6y 85.9 � 4.6z 96.1 � 4.6z 72.0 � 3.7 68.9 � 3.7
SFA2 67.8 � 4.4y 85.6 � 4.4z 93.2 � 4.4z 88.8 � 3.6z 75.6 � 3.6y
MUFA3 92.6 � 1.1y 95.3 � 1.1zy 96.8 � 1.1z 95.5 � 0.9 94.3 � 0.9
PUFA4 90.0 � 1.0y 95.6 � 1.0z 97.7 � 1.0z 94.4 � 0.8 94.5 � 0.8
MC-PUFA5 95.2 � 0.7y 97.6 � 0.7y 100.4 � 0.7z 97.1 � 0.6 98.3 � 0.6
LC-PUFA6 70.1 � 2.4y 92.7 � 2.4z 97.1 � 2.4z 86.3 � 1.9 86.9 � 1.9
n-3 64.3 � 3.3y 95.1 � 3.3z 97.4 � 3.3z 84.5 � 2.7 86.7 � 2.7
n-6 94.3 � 1.0y 96.3 � 1.0zy 99.9 � 1.0z 96.2 � 0.8 97.4 � 0.8
1 BD = below detection level.2 SFA = saturated fatty acids (no double bonds).3 MUFA = monounsaturated fatty acids (1 double bond).4 PUFA = polyunsaturated fatty acids (2 or more double bonds).5 MC-PUFA = medium-chain polyunsaturated fatty acids (18 carbon atoms with 2 or more double bonds).6 LC-PUFA = long-chain polyunsaturated fatty acids (20 or more carbon atoms with 3 or more double bonds).
Table 7 Apparent digestibility coefficients of minerals from three fish meal sources in extruded feeds for hybrid striped bass and rainbow
trout
Mineral
Fish meal source Taxon
Asian carp Common carp Menhaden Hybrid striped bass Rainbow trout
Ca 22.3 � 3.3z 10.4 � 3.3zy 9.1 � 3.3y 12.1 � 2.7 15.7 � 2.7
Mg 69.6 � 7.5zy 75.8 � 7.5z 47.8 � 7.5y 69.9 � 6.1 58.9 � 6.1
P 41.8 � 2.5 42.0 � 2.5 45.4 � 2.5 35.9 � 2.0y 50.2 � 7.5z
S 108.1 � 2.5z 95.6 � 2.3y 99.7 � 2.3zy 104.8 � 1.9z 97.4 � 1.9y
. . . . . . . . . . . . . . . . . . . . . . . . . . . . . . . . . . . . . . . . . . . . . . . . . . . . . . . . . . . . . . . . . . . . . . . . . . . . . . . . . . . . . . . . . . . . . .
Aquaculture Nutrition ª 2014 John Wiley & Sons Ltd

Poultry byproduct meal is considered a cost-effective
alternative to fish meal for many fish including hybrid
striped bass and rainbow trout (Gaylord & Rawles 2005;
El-Haroun et al. 2009; Rawles et al. 2010). However, the
fish meals evaluated in this study had higher nutrient
digestibility and availability than the poultry by-product
assessed by Rawles et al. (2010) for hybrid striped bass
and Cheng et al. (2004) for rainbow trout. However, we
did see slightly lower protein and amino acid digestibility
for menhaden meal than previous reports for hybrid
striped bass using the manual stripping method (Rawles
et al. 2010). The ADCs of common carp and menhaden
fish meals were largely similar. The greatest difference
between fish meals regarding digestibility coefficients was
in LC-PUFA and n-3 fatty acids, particularly 20:5n-3 and
22:6n-3. The Asian carp meal had significantly lower
digestibility coefficients for these lipid groups and fatty
acids when compared with the common carp and menha-
den meals. The lower digestibility coefficients can prob-
ably be attributed to the much lower content of LC-
PUFA, n-3 fatty acids, 20:5n-3, and 22:6n-3 in the
composition of the Asian carp meal. It should be noted
that the nutritional composition of the carp meals is
dependent on the source of the raw materials and manu-
facturing processes. Bowzer et al. (2013) demonstrated
variation in Asian carp harvested from the Illinois River
seasonally and geographically with bighead carp being lea-
ner in general than silver carp. Similarly, differences in
body composition have been observed in common carp
(Spiric et al. 2010; Mraz et al. 2012). Others have
reported Asian carp to have higher concentrations of LC-
PUFA and n-3 fatty acids (Vujkovi�c et al. 1999; Steffens
& Wirth 2005; Guler et al. 2008), which may be attrib-
uted to differences in harvest location and season. How-
ever, it is equally important to note that these authors
reported tissue fatty acid levels, which may not be directly
comparable with levels in rendered products derived from
these fish.
Additionally, water pollution concerns in the aquatic
environment associated with aquaculture production have
increased tremendously over the last decade (Cheng et al.
2004). Phosphorus and nitrogen tend to be the nutrients of
greatest concern. Therefore, feedstuffs that contain highly
digestible protein and phosphorus at appropriate levels can
reduce the processing necessary to remove these nutrients
from the discharge of aquaculture facilities. Since the carp
meals are highly digestible with only slightly higher (com-
mon carp meal) or lower (Asian carp meal) phosphorus
levels when compared with menhaden meal, they would be
appropriate alternative feedstuffs in regards to maintaining
or reducing the levels of nitrogen and phosphorus in the
discharge of aquaculture facilities.
In general, few differences in nutrient ADCs were
observed between RBT and hybrid striped bass in the cur-
rent study with high digestibility and availability observed
for all nutrients tested except calcium and phosphorus.
Apparent availability of calcium was generally low for both
taxa as well as in each fish meal source. Although calcium
availability appears low, our values are similar to Sugiura
et al. (1998) in which a variety of protein meal sources
were evaluated in rainbow trout and coho salmon O. kis-
utch. Phosphorus was moderately available to both taxa,
but rainbow trout (50.2%) had a much higher apparent
availability when compared with hybrid striped bass
(35.9%). Phosphorus availability in this study was lower
than previously reported for rainbow trout in a variety of
protein meal sources (Sugiura et al. 1998; Cheng et al.
2004). However, a direct comparison of ADCs for phos-
phorus with other studies is difficult due to differences
among and within taxa, experimental procedures, and
phosphorus levels in the ingredients (Papatryphon & Soares
2001). Additionally, ADCs are influenced by interactions
with other nutrients (Papatryphon & Soares 2001). Given
that few studies have compared multiple taxa with the
same dietary treatments, determining potential differences
among taxa is difficult (Burr et al. 2011). Possible reasons
for the higher phosphorus ADC observed in rainbow trout
in this study are that the dietary phosphorus concentrations
in the diets were close to the estimated requirement for
rainbow trout which would maximize the ADCs when
compared with hybrid striped bass (Riche & Brown 1996)
or the differences in fecal collection times could have
influenced the observed ADCs.
It is widely recognized that different fecal collection tech-
niques affect digestibility estimates, making comparisons
between experiments difficult (Anderson et al. 1995;
Glencross et al. 2005). In the current study, manual strip-
ping was used to collect samples. Amirkolaie et al. (2005)
stated that the main disadvantage of this method is the
removal of gut content prior to complete digestion as well
as possible contamination of feces (e.g., blood, slime,
semen, or eggs) which can artificially increase nutrient con-
tent resulting in underestimated digestibility. Although care
was taken to minimize contamination, it has been shown
that repeated handling with the use of sedation (like in the
present study) during manual stripping can affect intestinal
transit and lower digestibility estimates when compared
with other techniques (Spyridakis et al. 1989). However,
. . . . . . . . . . . . . . . . . . . . . . . . . . . . . . . . . . . . . . . . . . . . . . . . . . . . . . . . . . . . . . . . . . . . . . . . . . . . . . . . . . . . . . . . . . . . . .
Aquaculture Nutrition ª 2014 John Wiley & Sons Ltd

Stone et al. (2008) did not see a reduction in the ADCs of
rainbow trout with repeated manual stripping. Although
discrepancies exist among methods, manual stripping is still
considered a preferred conservative method for determining
digestibility in fish (Glencross et al. 2005), and our results
should be considered conservative estimates. Even assum-
ing some underestimation of digestibility, all fish meals
tested were highly digestible.
In conclusion, data from the current trial suggest that
Asian and common carp meals are highly digestible and
nutrient-dense feedstuffs broadly similar to menhaden meal
which could be used as cost-effective alternatives in aqua-
feeds. Even though Asian carp meal is slightly less digest-
ible when compared with the other fish meal sources tested
in this study, it is still a highly digestible and composition-
ally desirable when compared with other alternative protein
meals. Although Asian and common carp populations are
unlikely to support the volume of landings associated with
traditional, marine reduction fisheries, they could be a
valuable source of additional inputs for aquafeed
manufacturing.
The authors thank the Illinois Department of Natural
Resources for financial support of the work described
herein. We also thank Chris Bowzer, Andrew Ciuris, and
Matthew Young for assistance in data collection and pro-
cessing, and David Glover for guidance regarding statistical
analysis.
Adelizi, P.D., Rosati, R.R., Warner, K., Wu, Y.V., Muench, T.R.,
White, M.R. & Brown, P.B. (1998) Evaluation of fish-meal free
diets for rainbow trout, Oncorhynchus mykiss. Aquacult. Nutr., 4,
255–262.Amirkolaie, A.K., El-Shafai, S.A., Eding, E.H., Schrama, J.W. &
Verreth, J.A. (2005) Comparison of faecal collection method
with high and low-quality diets regarding digestibility and faecal
characteristics measurements in Nile tilapia. Aquacult. Res., 36,
578–585.Anderson, K.A. (1996) Micro-digestion and ICP-AES analysis for
the determination of macro and micro elements in plant tissues.
Atom. Spectrosc., 17, 30–33.Anderson, J.S., Lall, S.P., Anderson, D.M. & McNiven, M.A.
(1995) Availability of amino acids from various fish meals fed to
Atlantic salmon (Salmo salar). Aquaculture, 138, 291–301.Association of Official Analytical Chemists (AOAC). (1995) Offi-
cial Methods of Analysis. Association of Official Analytical
Chemists, Inc., Arlington, Virginia, USA.
Association of Official Analytical Chemists (AOAC). (2000) Offi-
cial Methods of Analysis, 17th edn. Association of Analytical
Chemists International, Gaithersburg, Maryland, USA.
Barrows, F.T., Gaylord, T.G., Sealey, W. & Rawles, S.D. (2012)
Database of nutrient digestibilities of traditional and novel feed
ingredients for trout and hybrid striped bass. Available at: http://
www.ars.usda.gov/sp2UserFiles/Place/53660000/fish/Digestibility
%20Database%20%20V2012a.xlsx.
Boran, G., Boran, M. & Karacam, H. (2008) Seasonal changes in
proximate composition of anchovy and storage stability of
anchovy oil. J. Food Qual., 31, 503–513.Bowzer, J., Trushenski, J.T. & Glover, D.C. (2013) Potential of
Asian carp from the Illinois River as a source of raw materials
for fish meal production. N. Am. J. Aquac., 75, 404–415.Bragadottir, M., Palmadottir, H. & Kristbergsson, K. (2004) Com-
position and chemical changes during storage of fish meal from
Capelin (Mallotus villosus). J. Agric. Food Chem., 53, 1572–1580.Bureau, D.P., Harris, A.M. & Cho, C.Y. (1999) Apparent digest-
ibility of rendered animal protein ingredients for rainbow trout
(Oncorhynchus mykiss). Aquaculture, 180, 345–358.Burr, G.S., Barrows, F.T., Gaylord, G. & Wolters, W.R. (2011)
Apparent digestibility of macro-nutrients and phosphorus in
plant-derived ingredients for Atlantic salmon, Salmo salar and
Arctic charr, Salvelinus alpines. Aquacult. Nutr., 17, 570–577.Cheng, Z.J., Hardy, R.W. & Huige, H.J. (2004) Apparent digest-
ibility coefficients of nutrients in brewer’s and rendered animal
by-products for rainbow trout (Oncorhynchus mykiss (Wal-
baum)). Aquacult. Res., 35, 1–9.Cho, C.Y., Slinger, S.J. & Bayley, H.S. (1982) Bioenergetics of sal-
monid fishes: energy intake, expenditure and productivity. Comp.
Biochem. Physiol., 73B, 25–41.Christie, W.W. (1982) Lipid Analysis, 2nd edn. Pergamon, Oxford.
Conover, G., Simmonds, R. & Whalen, M. (2007) Management
and Control Plan for Asian Carps in the United States. Aquatic
Nuisance Species Task Force, Asian Carp Working Group,
Washington, DC.
Davies, S. & Morris, P. (1997) Influence of multiple amino acid
supplementation on the performance of rainbow trout, On-
corhynchus mykiss (Walbaum), fed soya based diets. Aquat. Res.,
28, 65–74.El-Haroun, E.R., Azevedo, P.A. & Bureau, D.P. (2009) High diet-
ary incorporation levels of rendered animal protein ingredients
on performance of rainbow trout Oncorhynchus mykiss
(Walbaum, 1972). Aquaculture, 290, 269–274.Fleming, J., Taylor, T., Miller, C. & Woodward, C. (1992) Analy-
sis of complex mixtures of amino acids using the HP 1050 Mod-
ular HPLC. Application Note 228-212, publication no. 5091-
5615E. Agilent Technologies Inc., Palo Alto, CA, USA.
Folch, J., Lees, M. & Sloane-Standley, G.H. (1957) A simple
method for the isolation and purification of total lipids from ani-
mal tissues. J. Biol. Chem., 276, 497–507.Food and Agriculture Organization of the United Nations (FAO)
(2012) The State of World Fisheries and Aquaculture. FAO of
the United Nations, Rome, Italy.
Food and Agriculture Organization of the United Nations (FAO).
(2013) FAO commodity prices. Website. Available at: http://
www.fao.org/economic/est/prices. Accessed 5 March 2013.
Forster, I. (1999) A note on the method of calculating digestibility
coefficients of nutrients provided by single ingredients to feeds
of aquatic animals. Aquacult. Nutr., 5, 143–145.Gatlin, D. III, Barrows, F., Bellis, D. et al. (2007) Expanding the
utilization of sustainable plant products in aquafeeds: a review.
Aquacult. Res., 38, 551–579.Gaylord, T.G. & Rawles, S.D. (2005) The modification of poultry
by-product meal for use in hybrid striped bass Morone chrys-
ops 9 M. saxatilis diets. J. World Aquac. Soc., 36, 363–374.
. . . . . . . . . . . . . . . . . . . . . . . . . . . . . . . . . . . . . . . . . . . . . . . . . . . . . . . . . . . . . . . . . . . . . . . . . . . . . . . . . . . . . . . . . . . . . .
Aquaculture Nutrition ª 2014 John Wiley & Sons Ltd

Gaylord, T.G., Barrows, F.T. & Rawles, S.D. (2010) Apparent
amino acid availability from feedstuffs in extruded diets for rain-
bow trout Oncorhynchus mykiss. Aquacult. Nutr., 16, 400–406.Glencross, B.D., Evans, D., Dods, K., McCafferty, P., Hawkins,
W., Maas, R. & Sipsas, S. (2005) Evaluation of the digestible
value of lupin and soybean protein concentrates and isolates
when fed to rainbow trout Oncorhynchus mykiss, using either
stripping or settlement faecel collection methods. Aquaculture,
245, 211–220. http://www.ars.usda.gov/sp2UserFiles/Place/
53660000/fish/Digestibility%20Database%20%20V2012a.xlsx
Glencross, B.D., Booth, M. & Allan, G.L. (2007) A feed is only as
good as its ingredients-a review of ingredient evaluation strate-
gies for aquaculture feeds. Aquacult. Nutr., 13, 17–34.Glencross, B.D., Hawkins, W., Evans, D., Rutherford, N.,
McCafferty, P., Dods, K. & Hauler, R. (2011) A comparison of
the effect of diet extrusion or screw-press pelleting on the digest-
ibility of grain protein products when fed to rainbow trout (On-
corhynchus mykiss). Aquaculture, 312, 154–161.Guler, G.O., Kiztanir, B., Aktumsek, A., Citil, O.B. & Ozparlak,
H. (2008) Determination of the seasonal changes on total fatty
acid composition and x3/x6 ratios of carp (Cyprinus carpio L.)
muscle lipids in Beysehir Lake (Turkey). Food Chem., 108, 689–694.
Hardy, R.W. & Tacon, A.G.J. (2002) Fish meal – historical uses,
production trends and future outlook for sustainable supplies.
In: Responsible Marine Aquaculture (Stickney, R.R. & McVey,
J.P. eds), pp. 311–325. CABI Publishing, Oxford, UK.
Heikkinen, J., Vielma, J., Kemilainen, O., Tiirola, M., Eskelinen,
P., Kiuru, T., Navia-paldanius, D. & von Wright, A. (2006)
Effects of soybean meal based diet on growth performance, gut
histopathology and intestinal microbiota of juvenile rainbow
trout (Oncorhynchus mykiss). Aquaculture, 261, 259–268.Hendricks, J.D. (2003) Adventidious toxins. In: Fish Nutrition,
3rd edn (Halver, J.E. & Hardy, R.W. eds), pp 602–641. Aca-
demic Press, Elsevier Science, USA.
Iwashita, Y., Yamamoto, T., Furuita, H., Sugita, T. & Suzuki, N.
(2008) Influence of certain soybean antinutritional factors sup-
plemented to a casein-based semipurified diet on intestinal and
liver morphology in fingerling rainbow trout Oncorhynchus my-
kiss. Fish. Sci., 74, 1075–1082.Keembiyehetty, C.N. & Gatlin, D.M. III (1992) Dietary lysine
requirement of juvenile hybrid striped bass (Morone chrys-
ops 9 M. saxatilis). Aquaculture, 104, 271–277.Kleiber, M. (1961) The Fire of Life: An Introduction to Animal
Energetics. John Wiley and Sons Inc., New York, NY, USA.
Kolkovski, S. & Sakakura, Y. (2007) Yellowtail kingfish culture–Opportunities and problems. World Aquac., 38, 44–71.
Laporte, J. & Trushenski, J. (2011) Growth performance and tissue
fatty acid composition of largemouth bass fed diets containing
fish oil or blends of fish oil and soy-derived lipids. N. Am. J.
Aquac., 73, 435–444.Lewis, H.A. & Kohler, C.C. (2008) Corn gluten meal partially
replaces dietary fish meal without compromising growth or fatty
acid composition of sunshine bass. N. Am. J. Aquac., 70, 50–60.
Mraz, J., Machova, J., Kozak, P. & Pickova, J. (2012) Lipid con-
tent and composition in common carp – optimization of n-3
fatty acids in different pond production systems. J. Appl. Ich-
thyol., 28, 238–244.Merida, S.N., Tomas-Vidal, A., Martinez-Llorens, S. & Cerda,
M.J. (2010) Sunflower meal as a partial substitute in juvenile
sharpsnout sea bream (Diplodu puntazzo) diets: amino acid reten-
tion, gut and liver histology. Aquaculture, 298, 275–281.
National Research Council (NRC). (2011) Nutrient requirements
of fish and shrimp. National Academy Press, Washington, DC.
Nico, L., Maynard, E., Schofield, P.J., Cannister, M., Larson, J.,
Fusaro, A. & Neilson, M. (2013) Cyprinus Carpio. USGS Nonin-
digenous Aquatic Species Database, Gainesville, FL. http://nas.
er.usgs.gov/queries/factsheet.aspx?speciesID=4 Revision Date:
1/23/2013.
Ostaszewska, T., Dabrowski, K., Palacios, M.E., Olejniczak, M. &
Wieczorek, M. (2005) Growth and morphological changes in the
digestive tract of rainbow trout (Oncorhynchus mykiss) and pacu
(Piaractus mesopotamicus) due to casein replacement with soy-
bean proteins. Aquaculture, 245, 273–286.Ottolenghi, F., Silvestri, C., Giordano, P., Lovatelli, A. & New,
M.B. (2004) Capture-Based Aquaculture. The Fattening of Eels,
Groupers, Tunas, and Yellowtails, pp. 308. FAO, Rome.
Papatryphon, E. & Soares, J.H. Jr (2001) The effect of phytase on
apparent digestibility of four practical plant feedstuffs fed to
striped bass, Morone saxatilis. Aquacult. Nutr., 7, 161–167.Rawles, S.D., Gaylord, T.G. & Gatlin, D.M.I.I.I. (2006a) Digest-
ibility of gross nutrients by sunshine bass in animal by-product
and commercially-blended products used as fish meal replace-
ments. N. Am. J. Aquac., 68, 74–80.Rawles, S.D., Riche, M., Gaylord, T.G., Webb, J., Freeman, D.W.
& Davis, M. (2006b) Evaluation of poultry by-product meal in
commercial diets for hybrid striped bass (Morone chrys-
ops 9 M. saxatilis) in recirculated tank production. Aquaculture,
259, 377–389.Rawles, S.D., Thompson, K.R., Brady, Y.J., Metts, L.S., Gan-
nam, A.L., Twibell, R.G. & Webster, C.D. (2010) A compari-
son of two faecal collection methods for protein and amino
acid digestibility coefficients of menhaden fish meal and two
grades of poultry by-product meals for market-size sunshine
bass (Monrone chrysops 9 M. saxatilis). Aquacult. Nutr., 16,
81–90.Riche, M. & Brown, P.B. (1996) Availability of phosphorus from
feedstuffs fed to rainbow trout, Oncorhynchus mykiss. Aquacul-
ture, 142, 269–282.Sim, S.Y., Rimmer, M.A., Toledo, J.D., Sugama, K., Rumengan,
I., Williams, K.C. & Phillips, M.J. (2005) A Practical Guide to
Feeds and Feed Management for Culture Groupers, pp. 18. Net-
work of Aquaculture Centers in Asia and the Pacific (NACA),
Bangkok, Thailand
Spiric, A., Trbovic, D., Vranic, D., Djinovic, J., Petronijevic, R. &
Matekalo-Sverak, V. (2010) Statistical evaluation of fatty acid
profile and cholesterol content in fish (common carp) lipids
obtained by different sample preparation procedures. Anal.
Chim. Acta, 672, 66–71.Spyridakis, R., Metailler, J., Gavaudan, J. & Riaza, A. (1989)
Studies on nutrient digestibility in European sea bass (Dicentrar-
chus labrax): methodologies aspects concerning digesta collec-
tion. Aquaculture, 77, 61–70.Steffens, W. & Wirth, M. (2005) Freshwater fish—an important
source of n-3 polyunsaturated fatty acids: a review. Arch. Polish
Fish., 13, 5–16.Stone, D.A.J., Sealey, W.M., Hardy, R.W., Overturf, K., Gaylord,
T.G. & Johansen, K.A. (2008) Evaluation of the effects of
repeated fecal collection by manual stripping on the plasma cor-
tisol levels, TNF- I gene expression, and digestibility and avail-
ability of nutrients from hydrolyzed poultry and egg meal by
rainbow trout, Oncorhynchus mykiss (Walbaum). Aquaculture,
275, 250–259.Subhadra, B., Lochmann, R., Rawles, S. & Chen, R. (2006) Effect
of fish-meal replacement with poultry by-product meal on the
. . . . . . . . . . . . . . . . . . . . . . . . . . . . . . . . . . . . . . . . . . . . . . . . . . . . . . . . . . . . . . . . . . . . . . . . . . . . . . . . . . . . . . . . . . . . . .
Aquaculture Nutrition ª 2014 John Wiley & Sons Ltd

growth, tissue composition and hematological parameters of
largemouth bass (Micropterus salmoides) fed diets containing dif-
ferent lipids. Aquaculture, 260, 221–231.Sugiura, S.H., Dong, F.M., Rathbone, C.K. & Hardy, R.W.
(1998) Apparent protein digestibility and mineral availabilities in
various feed ingredients for salmonid feeds. Aquaculture, 159,
177–202.Tacon, A.G.J. & Metian, M. (2009) Fishing for aquaculture: non-
food use of small pelagic forage fish-A global perspective. Rev.
Fish. Sci., 17, 305–317.Tacon, A.G.J. & Metian, M. (2011) Demand and Supply of Feed
Ingredients for Farmed Fish and Crustaceans. FAO Fisheries
and Aquaculture Technical Paper 564, pp. 87. Food and Agri-
culture Organization, Rome.
Tacon, A.G.J. & Nates, S.F. (2007) Meeting the feed supply chal-
lenges of aquaculture. In: Proceedings of the Global Trade Con-
ference on Aquaculture, Qingdao, China (Arthur, R. &
Nierentz, J. eds), pp. 117–121. 29–31 May 2007. FAO Fisheries
Proceedings No. 9, FAO, Rome, Italy.
Thongrod, S. (2007) Analysis of feeds and fertilizers for sustainable
aquaculture development in Thailand. In: Study and Analysis of
Feeds and Fertilizers for Sustainable Aquaculture Development
(Hasan, M.R., Hecht, T., De Silva, S.S. & Tacon, A.G.J. eds),
pp. 309–330. FAO Fisheries Technical Paper No. 497. FAO,
Rome.
Trushenski, J.T., Kasper, C.S. & Kohler, C.C. (2006) Challenges
and opportunities in finfish nutrition. N. Am. J. Aquac., 68, 122–140.
Tukey, J.W. (1953) The Problem of Multiple Comparisons.
Unpublished manuscript. Princeton University, Princeton, NJ,
USA.
Van Barneveld, R.J. & Vandepeer, M.E. (2007) Practical nutrition
of farmed tuna and pelagic finfish. Aqua Culture Asia Pacific, 3,
22–23.Vujkovi�c, G., Karlovi�c, ��D., Vujkovi�c, I., Vorosbaranyi, I. & Jova-
novi�c, B. (1999) Composition of muscle tissue lipids of silver
carp and bighead carp. J. Am. Oil Chemists Soc., 76, 475–480.
. . . . . . . . . . . . . . . . . . . . . . . . . . . . . . . . . . . . . . . . . . . . . . . . . . . . . . . . . . . . . . . . . . . . . . . . . . . . . . . . . . . . . . . . . . . . . .
Aquaculture Nutrition ª 2014 John Wiley & Sons Ltd

This article was downloaded by: [Southern Illinois University]On: 18 December 2014, At: 11:16Publisher: Taylor & FrancisInforma Ltd Registered in England and Wales Registered Number: 1072954 Registered office: Mortimer House,37-41 Mortimer Street, London W1T 3JH, UK
Click for updates
North American Journal of AquaculturePublication details, including instructions for authors and subscription information:http://www.tandfonline.com/loi/unaj20
Growth Performance of Hybrid Striped Bass, RainbowTrout, and Cobia Utilizing Asian Carp Meal-BasedAquafeedsJohn Bowzera & Jesse Trushenskiaa Center for Fisheries Aquaculture and Aquatic Sciences, Southern Illinois UniversityCarbondale, 1125 Lincoln Drive, Carbondale, Illinois 62901, USAPublished online: 16 Dec 2014.
To cite this article: John Bowzer & Jesse Trushenski (2015) Growth Performance of Hybrid Striped Bass, RainbowTrout, and Cobia Utilizing Asian Carp Meal-Based Aquafeeds, North American Journal of Aquaculture, 77:1, 59-67, DOI:10.1080/15222055.2014.960117
To link to this article: http://dx.doi.org/10.1080/15222055.2014.960117
PLEASE SCROLL DOWN FOR ARTICLE
Taylor & Francis makes every effort to ensure the accuracy of all the information (the “Content”) containedin the publications on our platform. However, Taylor & Francis, our agents, and our licensors make norepresentations or warranties whatsoever as to the accuracy, completeness, or suitability for any purpose of theContent. Any opinions and views expressed in this publication are the opinions and views of the authors, andare not the views of or endorsed by Taylor & Francis. The accuracy of the Content should not be relied upon andshould be independently verified with primary sources of information. Taylor and Francis shall not be liable forany losses, actions, claims, proceedings, demands, costs, expenses, damages, and other liabilities whatsoeveror howsoever caused arising directly or indirectly in connection with, in relation to or arising out of the use ofthe Content.
This article may be used for research, teaching, and private study purposes. Any substantial or systematicreproduction, redistribution, reselling, loan, sub-licensing, systematic supply, or distribution in anyform to anyone is expressly forbidden. Terms & Conditions of access and use can be found at http://www.tandfonline.com/page/terms-and-conditions

North American Journal of Aquaculture 77:59–67, 2015C© American Fisheries Society 2015ISSN: 1522-2055 print / 1548-8454 onlineDOI: 10.1080/15222055.2014.960117
ARTICLE
Growth Performance of Hybrid Striped Bass, Rainbow Trout,and Cobia Utilizing Asian Carp Meal-Based Aquafeeds
John Bowzer and Jesse Trushenski*Center for Fisheries Aquaculture and Aquatic Sciences, Southern Illinois University Carbondale,1125 Lincoln Drive, Carbondale, Illinois 62901, USA
AbstractFish meal sparing is more difficult for nutritionally demanding carnivorous fishes, but economic considerations
and the limited supply of fish meal continue to incentivize investigations of alternative protein sources for aquafeeds.A promising alternative to traditional, marine-origin fish meal is fish meal derived from undesirable freshwaterspecies, such as the invasive Asian carp Hypophthalmichthys spp. To assess the relative value of such ingredients,we evaluated growth performance of juvenile hybrid Striped Bass (White Bass Morone chrysops × Striped Bass M.saxatilis; initial weight, 21.9 ± 0.2 g [mean ± SE]), Rainbow Trout Oncorhynchus mykiss (15.1 ± 0.2 g), and CobiaRachycentron canadum (57.2 ± 0.5 g) reared for 8 weeks on practical diets containing different levels of menhadenfish meal (MFM), Asian carp meal (CFM), or a 50:50 blend of these ingredients such that 0, 20, 40, or 60% of theestimated digestible protein content was derived from fish meal. Growth performance was generally consistent acrosstaxa, and weight gain tended to increase with fish meal inclusion, regardless of its origin. However, Cobia did performbetter on CFM-based diets, suggesting that MFM or CFM can yield improved performance for some taxa or lifestages, but these differences are likely to be marginal in most circumstances. We conclude CFM is a suitable andperhaps lower-cost alternative to MFM in feeds for carnivorous fishes.
Feed accounts for a substantial portion of overall operatingcosts (40–50%) for intensive aquaculture facilities (Cheng et al.2004). Protein is typically the most expensive component ofanimal feed, and this is particularly problematic in aquafeedsbecause fish have a much higher protein demand compared withother livestock (Keembiyehetty and Gatlin 1992). Historically,fish meal was used as a primary ingredient in aquafeeds be-cause of its high protein density, favorable amino acid profile,and digestibility and palatability to aquatic livestock. However,fish meal inclusion rates have been declining in recent decades(Tacon and Metian 2008; Tacon et al. 2011) because it is consid-erably more expensive than other alternative plant- and animal-derived protein sources (Gatlin et al. 2007; Welch et al. 2010;FAO 2014). However, sparing fish meal with these alternativescan be particularly difficult for nutritionally demanding carniv-orous fishes, which may not readily accept or perform as wellon diets with reduced levels or free of fish meal. Fish meal has
*Corresponding author: [email protected] June 9, 2014; accepted August 13, 2014
been the primary protein source for carnivorous species becauseit generally meets all essential amino acid requirements, is pro-tein dense, and is highly palatable; but, due to the high cost ofthis ingredient and its overall high inclusion levels in the diets,there are considerable economic incentives to reduce fish mealuse in aquafeeds (Watanabe 2002).
A potential alternative to traditional marine-origin fish mealis a freshwater fish meal rendered from invasive species such asSilver Carp Hypophthalmichthys molitrix and Bighead Carp H.nobilis (hereafter referred to collectively as Asian carp). Asiancarp have become particularly abundant in the Mississippi Riverbasin (McClelland et al. 2012; Tsehaye et al. 2013), and sinceinvasive species typically have adverse effects on native pop-ulations and economically important activities (Vitousek et al.1997; Lodge et al. 2006), a variety of control and eradicationstrategies have been investigated and deployed. Of these, controlthrough increased harvest pressure is a primary focus because it
59
Dow
nloa
ded
by [
Sout
hern
Illi
nois
Uni
vers
ity]
at 1
1:16
18
Dec
embe
r 20
14

60 BOWZER AND TRUSHENSKI
is currently the only viable short-term control strategy (Conoveret al. 2007). Considerable fishing pressure is needed to success-fully control Asian carp in this system (Tsehaye et al. 2013);thus, market research and development have been undertaken toincrease the demand for Asian carp (Nelson 2013; Varble andSecchi 2013). However, since Asian carp are not a preferredfood fish in the United States, industrial applications, such asrendering into protein meals for livestock feeding, are consid-ered the most promising to incentivize harvest (Conover et al.2007; Bowzer et al. 2013).
Asian carp meal has several advantages over other alterna-tive protein sources. Utilization of plant-origin (i.e., derivativesof oilseeds or grains) and animal-origin (i.e., by-products oflivestock processing) feedstuffs in aquafeeds can be restrictedby inadequate nutrient levels, digestibility, or palatability; thepresence of antinutritional factors; or practical limitations to in-clusion in the diet (e.g., high cost, complications related to feedmanufacturing; Glencross et al. 2007). For instance, soybeanmeal is one of the most promising alternative protein sources(Gatlin et al. 2007), and despite its routine use in aquafeeds(Hendricks 2003) high inclusion levels can result in undesirableeffects such as poor palatability (Adelizi et al. 1998), low feedconversion efficiency (Davies and Morris 1997), and gut enteri-tis (Heikkinen et al. 2006; Iwashita et al. 2008). Fish meals,including Asian carp meal, do not appear to present any of thesechallenges (Bowzer et al., in press). Furthermore, while mostmarine fisheries are unlikely to withstand greater fishing pres-sure (FAO 2012), greater harvest of Asian carp would likelyimprove the ecological integrity of the Mississippi River basin.
Rendering Asian carp into fish meal may increase demandand associated harvest pressure on these invasive fish, but de-mand for Asian carp meal is dependent on the product’s qualityand pricing. Current pricing estimates for Asian carp meal rangefrom US$600–650/metric ton (P. Hitchens, Southern IllinoisUniversity Carbondale, personal communication), considerablylower than current pricing for marine-origin fish meal ($1,500–2,000/metric ton: FAO 2014). Additionally, an industry must beestablished to produce the product to supply the market. Giventhat, development of large-scale Asian carp meal productionfacilities has been relatively slow due to initial high risk of in-vestment in a new product and little information regarding itsnutritional value, contaminant load, or potential volume until re-cently. Researchers have begun to fill in many of these data gapssuch as establishing that the digestibility of Asian carp meal iscomparable to that of other fish meals in aquafeeds (Bowzeret al., in press), and its practical feeding value in LargemouthBass Micropterus salmoides feeds is similar to menhaden fishmeal (Bowzer et al. 2014). As this information has becomeavailable, interest and investment in Asian carp rendering hasincreased; a facility specializing in Asian carp meal productionrecently opened in Grafton, Illinois (Moon 2014). Therefore,Asian carp meal appears to be a promising protein source foraquafeeds, but its utilization by a range of nutritionally demand-ing carnivorous fish species has yet to be fully determined.
Accordingly, we assessed the growth performance of hybridStriped Bass (White Bass Morone chrysops × Striped BassM. saxatilis), Rainbow Trout Oncorhynchus mykiss, and CobiaRachycentron canadum fed diets containing different levels ofmenhaden fish meal (MFM) or Asian carp meal (CFM).
METHODSFish were held in recirculating aquaculture systems with con-
tinuous aeration and mechanical and biological filtration units.Trials with hybrid Striped Bass (initial weight, 21.9 ± 0.2 g[mean ± SE]; Keo Fish Farms, Keo, Arkansas) and RainbowTrout (15.1 ± 0.2 g; Crystal Lake Fisheries, Ava, Missouri)were conducted at the Center for Fisheries, Aquaculture, andAquatic Sciences (CFAAS) at Southern Illinois University Car-bondale, Carbondale, Illinois, while the Cobia (57.2 ± 0.5 g;Troutlodge Marine Farms, Vero Beach, Florida) trial was con-ducted at the Virginia Seafood Agricultural Research and Ex-tension Center at Virginia Tech, Hampton, Virginia. Stockingdensity, tank size, system filtration, and water quality for eachsystem are described in Table 1. Water temperature and dis-solved oxygen were measured daily (YSI 550 temperature–oxygen meter; Yellow Springs Instruments, Yellow Springs,Ohio), whereas other water quality conditions (total ammonianitrogen, nitrite-nitrogen, nitrate-nitrogen, alkalinity, and salin-ity [Cobia trial only]) were measured weekly for each system(Hach DR 2800 portable spectrophotometer, digital titrator, andreagents; Hach Company, Loveland, Colorado). Water qualityconditions were maintained within suitable ranges throughoutthe trials (Table 1).
Practical diets were formulated to meet the known nutritionalrequirements of hybrid Striped Bass, Rainbow Trout, and Co-bia (NRC 2011) and to contain approximately 40:12%, 42:13%,and 45:12% digestible protein : lipid, respectively (Table 2). Thediets contained different levels of menhaden fish meal (MFM;Special Select, Omega Protein., Houston, Texas), Asian carp fishmeal (CFM; Protein Products, Gainsville, Florida), or a 50:50blend of these ingredients such that 0% (0 FM), 20% (20 MFM,20 CFM), 40% (40 MFM, 40 CFM), or 60% (60 MFM, 60CFM, 60 Blend) of the estimated digestible protein content wasderived from a fish meal source. Estimates of digestible pro-tein content were based on apparent digestibility coefficientsreported for hybrid Striped Bass and Rainbow Trout (Barrowset al. 2012; Bowzer et al., in press); digestibility coefficientswere not available for Cobia; therefore, these feeds were for-mulated using Rainbow Trout values. Errors were made in theformulation of two diets (10% lipid in 60 MFM diet versus 12%in other diets for Cobia; 45% digestible protein in 60 CFM dietversus 40% in other diets for hybrid Striped Bass). Diets weremanufactured and analyzed in triplicate to determine proximatecomposition (Table 3) using standard methods described in de-tail by Rombenso et al. (2013). Minor differences resulting fromthe formulation errors mentioned above and/or inaccuracies iningredient weighing or mixing were observed; however, these
Dow
nloa
ded
by [
Sout
hern
Illi
nois
Uni
vers
ity]
at 1
1:16
18
Dec
embe
r 20
14
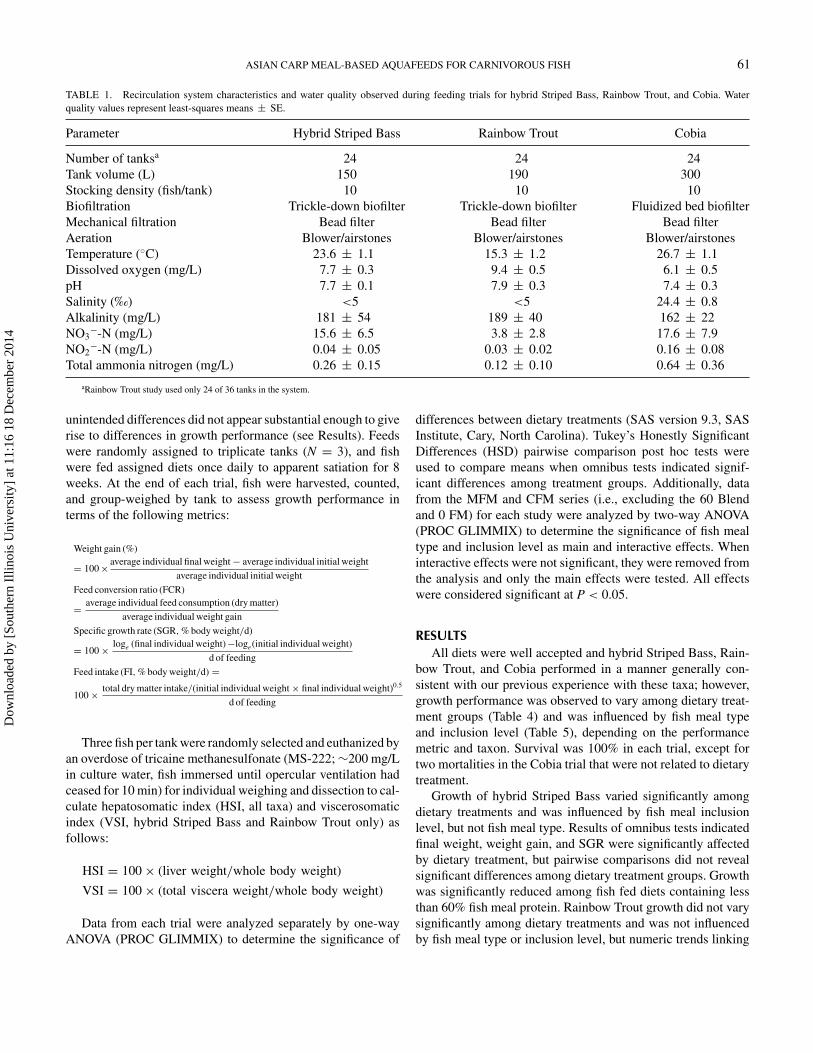
ASIAN CARP MEAL-BASED AQUAFEEDS FOR CARNIVOROUS FISH 61
TABLE 1. Recirculation system characteristics and water quality observed during feeding trials for hybrid Striped Bass, Rainbow Trout, and Cobia. Waterquality values represent least-squares means ± SE.
Parameter Hybrid Striped Bass Rainbow Trout Cobia
Number of tanksa 24 24 24Tank volume (L) 150 190 300Stocking density (fish/tank) 10 10 10Biofiltration Trickle-down biofilter Trickle-down biofilter Fluidized bed biofilterMechanical filtration Bead filter Bead filter Bead filterAeration Blower/airstones Blower/airstones Blower/airstonesTemperature (◦C) 23.6 ± 1.1 15.3 ± 1.2 26.7 ± 1.1Dissolved oxygen (mg/L) 7.7 ± 0.3 9.4 ± 0.5 6.1 ± 0.5pH 7.7 ± 0.1 7.9 ± 0.3 7.4 ± 0.3Salinity (‰) <5 <5 24.4 ± 0.8Alkalinity (mg/L) 181 ± 54 189 ± 40 162 ± 22NO3
−-N (mg/L) 15.6 ± 6.5 3.8 ± 2.8 17.6 ± 7.9NO2
−-N (mg/L) 0.04 ± 0.05 0.03 ± 0.02 0.16 ± 0.08Total ammonia nitrogen (mg/L) 0.26 ± 0.15 0.12 ± 0.10 0.64 ± 0.36
aRainbow Trout study used only 24 of 36 tanks in the system.
unintended differences did not appear substantial enough to giverise to differences in growth performance (see Results). Feedswere randomly assigned to triplicate tanks (N = 3), and fishwere fed assigned diets once daily to apparent satiation for 8weeks. At the end of each trial, fish were harvested, counted,and group-weighed by tank to assess growth performance interms of the following metrics:
Weight gain (%)
= 100 × average individual final weight − average individual initial weight
average individual initial weight
Feed conversion ratio (FCR)
= average individual feed consumption (dry matter)
average individual weight gain
Specific growth rate (SGR, % body weight/d)
= 100 × loge (final individual weight) −loge(initial individual weight)
d of feeding
Feed intake (FI, % body weight/d) =
100 × total dry matter intake/(initial individual weight × final individual weight)0.5
d of feeding
Three fish per tank were randomly selected and euthanized byan overdose of tricaine methanesulfonate (MS-222; ∼200 mg/Lin culture water, fish immersed until opercular ventilation hadceased for 10 min) for individual weighing and dissection to cal-culate hepatosomatic index (HSI, all taxa) and viscerosomaticindex (VSI, hybrid Striped Bass and Rainbow Trout only) asfollows:
HSI = 100 × (liver weight/whole body weight)
VSI = 100 × (total viscera weight/whole body weight)
Data from each trial were analyzed separately by one-wayANOVA (PROC GLIMMIX) to determine the significance of
differences between dietary treatments (SAS version 9.3, SASInstitute, Cary, North Carolina). Tukey’s Honestly SignificantDifferences (HSD) pairwise comparison post hoc tests wereused to compare means when omnibus tests indicated signif-icant differences among treatment groups. Additionally, datafrom the MFM and CFM series (i.e., excluding the 60 Blendand 0 FM) for each study were analyzed by two-way ANOVA(PROC GLIMMIX) to determine the significance of fish mealtype and inclusion level as main and interactive effects. Wheninteractive effects were not significant, they were removed fromthe analysis and only the main effects were tested. All effectswere considered significant at P < 0.05.
RESULTSAll diets were well accepted and hybrid Striped Bass, Rain-
bow Trout, and Cobia performed in a manner generally con-sistent with our previous experience with these taxa; however,growth performance was observed to vary among dietary treat-ment groups (Table 4) and was influenced by fish meal typeand inclusion level (Table 5), depending on the performancemetric and taxon. Survival was 100% in each trial, except fortwo mortalities in the Cobia trial that were not related to dietarytreatment.
Growth of hybrid Striped Bass varied significantly amongdietary treatments and was influenced by fish meal inclusionlevel, but not fish meal type. Results of omnibus tests indicatedfinal weight, weight gain, and SGR were significantly affectedby dietary treatment, but pairwise comparisons did not revealsignificant differences among dietary treatment groups. Growthwas significantly reduced among fish fed diets containing lessthan 60% fish meal protein. Rainbow Trout growth did not varysignificantly among dietary treatments and was not influencedby fish meal type or inclusion level, but numeric trends linking
Dow
nloa
ded
by [
Sout
hern
Illi
nois
Uni
vers
ity]
at 1
1:16
18
Dec
embe
r 20
14

62 BOWZER AND TRUSHENSKI
TABLE 2. Feed formulations (g/kg, on as-fed basis) of diets where 60, 40, 20, or 0% of digestible protein consists of fish meal (Asian carp meal [CFM],menhaden fish meal [MFM], or blend) fed to hybrid Striped Bass, Rainbow Trout, and Cobia.
Ingredient 60 MFM 40 MFM 20 MFM 60 CFM 40 CFM 20 CFM 60 Blend 0 FM
Hybrid Striped BassMenhaden fish meal 358.7 239.2 119.6 0.0 0.0 0.0 180.0 0.0Asian carp meal 0.0 0.0 0.0 429.3 286.2 143.1 215.0 0.0Soybean meal 207.3 355.0 487.0 314.6 338.3 453.7 203.9 487.9Poultry byproduct meal 67.0 120.0 190.0 135.1 152.6 232.8 80.0 399.6Wheat bran 275.3 186.5 98.3 47.6 137.9 75.3 239.1 16.9Menhaden fish oil 62.5 70.1 75.9 44.1 55.8 65.8 52.9 66.3Carboxymethyl cellulose 20.0 20.0 20.0 20.0 20.0 20.0 20.0 20.0Choline chloride 6.0 6.0 6.0 6.0 6.0 6.0 6.0 6.0Mineral premix 1.0 1.0 1.0 1.0 1.0 1.0 1.0 1.0Vitamin premix 1.2 1.2 1.2 1.2 1.2 1.2 1.2 1.2Stay C 1.0 1.0 1.0 1.0 1.0 1.0 1.0 1.0Protein (crude) 460.0 474.3 491.4 551.2 497.9 507.7 475.8 531.8Protein (digestible) 400.0 400.0 400.0 450.0 400.0 400.0 400.0 400.0Lipid (crude) 120.0 120.0 120.0 120.0 120.0 120.0 120.0 120.0
Rainbow TroutMenhaden fish meal 376.7 251.1 125.6 0.0 0.0 0.0 188.3 0.0Asian carp meal 0.0 0.0 0.0 450.8 300.5 150.3 225.4 0.0Soybean meal 200.0 200.0 200.0 150.0 200.0 200.2 200.0 243.7Poultry byproduct meal 183.1 318.5 453.8 160.6 281.2 435.0 155.2 560.0Wheat bran 91.7 85.5 79.3 108.9 83.2 78.0 90.0 55.1Menhaden fish oil 69.3 65.7 62.1 50.6 56.0 57.2 62.0 62.1Blood meal 50.0 50.0 50.0 50.0 50.0 50.0 50.0 50.0Carboxymethyl cellulose 20.0 20.0 20.0 20.0 20.0 20.0 20.0 20.0Choline chloride 6.0 6.0 6.0 6.0 6.0 6.0 6.0 6.0Mineral premix 1.0 1.0 1.0 1.0 1.0 1.0 1.0 1.0Vitamin premix 1.2 1.2 1.2 1.2 1.2 1.2 1.2 1.2Stay C 1.0 1.0 1.0 1.0 1.0 1.0 1.0 1.0Protein (crude) 517.5 519.2 520.9 523.0 522.4 522.5 519.9 522.0Protein (digestible) 420.0 420.0 420.0 420.0 420.0 420.0 420.0 420.0Lipid (crude) 130.0 130.0 130.0 130.0 130.0 130.0 130.0 130.0
CobiaMenhaden fish meal 403.6 269.0 134.5 0.0 0.0 0.0 201.8 0.0Asian carp meal 0.0 0.0 0.0 483.0 322.0 161.0 242.0 0.0Soybean meal 164.5 263.6 408.2 158.2 287.8 370.7 137.9 358.7Poultry byproduct meal 70.0 120.0 177.1 110.0 162.0 225.2 80.0 320.0Wheat bran 248.6 169.7 84.1 136.8 86.3 58.2 199.6 71.1Menhaden fish oil 39.2 68.5 76.9 37.8 52.7 65.6 49.5 73.9Soy protein isolate 45.0 80.0 90.0 45.0 60.0 90.0 60.0 147.1Carboxymethyl cellulose 20.0 20.0 20.0 20.0 20.0 20.0 20.0 20.0Choline chloride 6.0 6.0 6.0 6.0 6.0 6.0 6.0 6.0Mineral premix 1.0 1.0 1.0 1.0 1.0 1.0 1.0 1.0Vitamin premix 1.2 1.2 1.2 1.2 1.2 1.2 1.2 1.2Stay C 1.0 1.0 1.0 1.0 1.0 1.0 1.0 1.0Protein (crude) 507.6 517.5 532.2 543.9 547.0 550.4 522.1 556.4Protein (digestible) 450.0 450.0 450.0 450.0 450.0 450.0 450.0 450.0Lipid (crude) 100.0 120.0 120.0 120.0 120.0 120.0 120.0 120.0
Dow
nloa
ded
by [
Sout
hern
Illi
nois
Uni
vers
ity]
at 1
1:16
18
Dec
embe
r 20
14

ASIAN CARP MEAL-BASED AQUAFEEDS FOR CARNIVOROUS FISH 63
TABLE 3. Analyzed composition (g/kg, on as-fed basis) of diets where 60, 40, 20 or 0% of digestible protein consists of fish meal (Asian carp meal [CFM],menhaden fish meal [MFM], or blend) fed to hybrid Striped Bass, Rainbow Trout, and Cobia.
Parameter 60 MFM 40 MFM 20 MFM 60 CFM 40 CFM 20 CFM 60 Blend 0 FM
Hybrid Striped BassDry matter 943.2 943.7 941.0 937.8 941.6 940.1 936.7 931.8Protein (crude) 447.1 456.0 474.5 574.0 491.1 491.6 472.6 525.6Lipid (crude) 125.7 128.4 131.7 130.5 123.5 126.0 125.3 127.2Ash 107.3 103.6 94.6 131.2 112.4 90.4 116.8 91.6
Rainbow TroutDry matter 940.1 943.2 941.0 936.7 937.8 941.6 943.7 931.8Protein (crude) 545.9 568.5 582.2 552.5 569.8 571.6 557.1 574.8Lipid (crude) 138.4 140.5 143.9 133.4 137.4 139.1 142.4 140.7Ash 134.1 123.6 103.8 144.8 123.2 111.4 229.7 105.1
CobiaDry matter 940.1 943.2 941.0 936.7 937.8 941.6 943.7 931.8Protein (crude) 545.9 568.5 582.2 552.5 569.8 571.6 557.1 574.8Lipid (crude) 138.4 140.5 143.9 133.4 137.4 139.1 142.4 140.7Ash 134.1 123.6 103.8 144.8 123.2 111.4 229.7 105.1
TABLE 4. Growth performance (final weight, weight gain, SGR, and FCR), FI, HSI, and VSI of hybrid Striped Bass, Rainbow Trout, and Cobia fed diets where60, 40, 20, or 0% of digestible protein consists of fish meal (Asian carp meal [CFM], menhaden fish meal [MFM], or Blend). Values represent least-squared means;pooled SEs and P-values resulting from one-way ANOVA tests are also provided. Letters indicate significant treatment differences (P < 0.05).
Parameter 60 MFM 40 MFM 20 MFM 60 CFM 40 CFM 20 CFM 60 Blend 0 FM Pooled SE P-value
Hybrid Striped BassInitial weight (g) 21.9 22.0 21.9 21.9 22.0 21.7 22.0 21.8 0.2 0.77Final weight (g)a 72.3 61.3 58.1 73.1 61.5 59.9 68.3 63.7 4.6 0.03Weight gain (%)a 230 179 165 233 180 176 211 192 21 0.03SGR (% body weight/d)a 2.2 1.9 1.8 2.2 1.8 1.8 2.1 1.9 0.1 0.04FCR 1.1 1.0 1.1 1.1 1.1 1.1 1.1 1.1 0.1 0.89FI (% body weight/d) 2.6 2.1 2.1 2.6 2.3 2.2 2.3 2.3 0.2 0.03HSI 1.5 1.4 1.2 1.5 1.4 1.4 1.3 1.3 0.1 0.08VSI 6.7 7.3 6.8 7.2 7.0 7.5 6.8 7.4 0.5 0.65
Rainbow TroutInitial weight (g) 14.9 15.1 15.1 15.1 15.1 15.1 15.1 15.0 0.2 0.97Final weight (g) 45.7 45.5 38.7 48.3 45.5 43.6 43.4 41.6 5.3 0.74Weight gain (%) 206 200 158 221 201 188 188 178 35 0.75SGR (% body weight/d) 1.8 1.7 1.4 1.6 1.9 1.8 1.7 1.6 0.3 0.71FCR 1.0 0.9 1.1 0.9 1.0 1.0 1.0 1.0 0.1 0.65FI (% body weight/d) 2.1 1.9 1.9 2.0 2.2 2.1 2.0 1.9 0.2 0.83HSI 1.8 1.9 2.3 1.8 2.0 2.0 2.2 2.0 0.2 0.05VSI 12.4 12.1 12.1 11.6 11.5 11.5 11.4 12.6 0.5 0.17
Cobiab
Initial weight (g) 57.2 57.8 56.9 57.1 56.8 57.3 57.3 57.0 3.8 0.31Final weight (g) 217.9 zy 221.3 zy 203.1 zy 249.4 z 238.2 zy 206.9 zy 242.4 zy 186.2 y 16.9 0.02Weight gain (%) 281 zy 283 zy 257 zy 337 z 333 z 273 zy 323 z 227y 26 0.01SGR (% body weight/d) 2.4 zy 2.4 zy 2.3 zy 2.7 z 2.7 z 2.4 zy 2.6 z 2.2 y 0.1 <0.01FCR 1.7 zy 1.6 zy 1.8 zy 1.5 y 1.5 y 1.7 zy 1.6 y 1.9 z 0.1 <0.01FI (% body weight/d) 4.5 4.4 4.4 4.3 4.3 4.5 4.5 4.3 0.2 0.86HSI 1.9 1.7 1.8 1.6 1.8 1.7 1.7 3.4 0.9 0.45
aAlthough the omnibus test indicated a significant treatment effect, the more conservative Tukey’s HSD pairwise comparison test failed to identify differences among means.bVSI was not assessed in Cobia.
Dow
nloa
ded
by [
Sout
hern
Illi
nois
Uni
vers
ity]
at 1
1:16
18
Dec
embe
r 20
14

64 BOWZER AND TRUSHENSKI
TABLE 5. Growth performance (final weight, weight gain, SGR, and FCR), FI, HSI, and VSI of hybrid Striped Bass, Rainbow Trout, and Cobia fed diets inwhich 20, 40, or 60% of digestible protein consisted of fish meal provided by Asian carp meal (CFM) or menhaden fish meal (MFM), excluding the 60 Blend.Values represent least-squared means; pooled SEs and P-values resulting from two-way ANOVA tests are also provided. Letters indicate significance differences(P < 0.05). The interaction term was not significant for all parameters; it was removed from the analysis and only the main effects were tested and reported.
Fish meal type Inclusion level
Parameter MFM CFM Pooled SE P-value 20% 40% 60% Pooled SE P-value
Hybrid Striped BassInitial weight (g) 22.0 21.9 0.1 0.49 21.8 22.0 21.9 0.1 0.37Final weight (g) 63.9 64.8 2.5 0.70 59.0 y 61.4 y 72.7 z 3.0 <0.01Weight gain (%) 191 196 11 0.66 170 y 179 y 232 z 14 <0.01SGR (% body weight/d) 1.9 2.0 0.1 0.62 1.8 y 1.9 y 2.2 z 0.1 <0.01FCR 1.1 1.1 0.0 0.66 1.1 1.1 1.1 0.1 0.95FI (% body weight/d) 2.2 2.3 0.1 0.33 2.1 2.2 2.6 0.1 <0.01HSI 1.3 1.4 0.1 0.13 1.3 1.4 1.5 0.1 0.08VSI 6.9 7.3 0.3 0.32 7.2 7.2 6.9 0.4 0.79
Rainbow TroutInitial weight (g) 15.0 15.1 0.1 0.72 15.1 15.1 15.0 0.1 0.74Final weight (g) 43.3 45.8 2.7 0.37 41.2 45.5 47.0 3.3 0.23Weight gain (%) 188 203 18 0.41 173 201 213 22 0.21SGR (% body weight/d) 1.7 1.8 0.1 0.51 1.6 1.8 1.7 0.2 0.55FCR 1.0 1.0 0.1 0.68 1.1 1.0 1.0 0.1 0.32FI (% body weight/d) 2.0 2.1 0.1 0.47 2.0 2.0 2.1 0.1 0.80HSI 2.0 1.9 0.1 0.42 2.2z 1.9 zy 1.8 y 0.1 0.03VSI 12.2 z 11.5 y 0.3 0.02 11.8 11.8 12.0 0.3 0.80
Cobiaa
Initial weight (g) 57.3 57.1 2.4 0.30 57.1 57.3 57.1 2.9 0.82Final weight (g) 214.1 231.5 10.2 0.11 205.0 229.7 233.6 12.5 0.08Weight gain (%) 273 y 314 z 15 0.02 265 308 309 19 0.05SGR (% body weight/d) 2.4 y 2.6 z 0.1 0.02 2.4 2.5 2.5 0.1 0.04FCR 1.7 z 1.6 y 0.0 <0.01 1.7 z 1.6 y 1.6 y 0.1 <0.01FI (% body weight/d) 4.4 4.4 0.1 0.69 4.5 4.4 4.4 0.1 0.67HSI 1.8 1.7 0.1 0.29 1.7 1.7 1.8 0.1 0.98
aVSI was not analyzed in Cobia.
improved growth with higher fish meal inclusion were evident.Growth of Cobia varied significantly among dietary treatmentgroups and was influenced by fish meal type and inclusion level.Although not statistically significant in each study, growth wasgenerally greater among fish fed the CFM-based feeds, particu-larly at the higher inclusion levels. Overall, similar trends wereobserved among studies (i.e., better growth with higher fish mealinclusion and CFM).
For hybrid Striped Bass, FCR, HSI, and VSI did not varyamong dietary treatments and were unaffected by fish meal typeor inclusion level. However, FI increased with inclusion level,regardless of fish meal type. In Rainbow Trout, FCR, FI, HSI,and VSI did not vary among dietary treatments. Additionally,FCR and FI were not influenced by fish meal type or inclusionlevel, but Rainbow Trout HSI was significantly increased amongfish fed diets with lower fish meal inclusion levels. Furthermore,although VSI was unaffected by fish meal inclusion level, it was
affected by fish meal type. Rainbow Trout fed diets containingMFM had higher VSI. Cobia FI and HSI did not vary amongdietary treatments and were unaffected by fish meal type orinclusion level; however, FCR was significantly reduced amongCobia fed CFM diets and diets with higher fish meal inclusionlevels.
DISCUSSIONOur results indicate that growth performance is broadly con-
sistent among hybrid Striped Bass, Rainbow Trout, and Co-bia fed MFM or CFM. This suggests that CFM (∼$650/metricton; P. Hitchens, Southern Illinois University Carbondale, per-sonal communication) is a cost-effective alternative to tradi-tional marine-origin fish meals ($1,500–2,000/metric ton: FAO2014). Given that, substituting traditional fish meals with CFMin the diets of other carnivorous fishes will not likely affectgrowth performance negatively. Any differences in growth per-
Dow
nloa
ded
by [
Sout
hern
Illi
nois
Uni
vers
ity]
at 1
1:16
18
Dec
embe
r 20
14

ASIAN CARP MEAL-BASED AQUAFEEDS FOR CARNIVOROUS FISH 65
formance associated with utilizing CFM will likely be minimaland the result of nuances in dietary needs and formulations.Therefore, CFM appears to be a suitable, cost-effective substi-tute to traditional marine-origin fish meals in the diets of carniv-orous fish. Published information comparing fish meal types islimited, but appears generally supportive. For example, in a sim-ilar study with juvenile Largemouth Bass fed diets containingCFM, there were no significant differences in growth perfor-mance when compared with menhaden fish meal (Bowzer et al.2014). Kop and Korkut (2010) performed a comparable studywith juvenile Rainbow Trout assessing three different marine-based fish meals: Peruvian fish meal (traditional commercialfish meal), locally produced (Izmir, Turkey) anchovy fish meal,and locally produced fish meal from the by-products of severalspecies (Gilthead Sea Bream Sparus aurata, Sea Bass Dicen-trarchus labrax, and Rainbow Trout). Their results indicatedthat growth performance was not influenced by fish meal type.
As long as the product used is fresh, properly stored, and ofhigh quality, the effect of fish meal type on growth performanceof fish seems minor. The level of fish meal inclusion, however,appears to have a strong influence on feed intake and growthperformance. Typically, the more fish meal that is includedin the diet, the better the growth. Yet, due to its variable butgenerally high cost, fish meal sparing is common practice indiet formulations for many species including hybrid StripedBass (Rawles et al. 2011), Rainbow Trout (Baboli et al. 2013),and Cobia (Trushenski et al. 2013). These studies have reportedsuccess (i.e., similar growth performance among fish fed fishmeal-based and alternative protein-based feeds) in partiallyreplacing fish meal with a variety of alternative plant- andanimal-based protein meals provided that some amount offish meal was included in the diet. Correspondingly, our datasuggest that some inclusion of fish meal, regardless of origin,is important to ensure rapid, efficient growth. This also impliessome fish meal sparing is possible without affecting growthperformance. Therefore, it is not unexpected that there werelittle to no significant differences in growth provided that asufficient amount of fish meal was included in the diet.
Feed conversion and intake values were within expectationsfor each study. However, Cobia demonstrated better feed con-version when fed diets containing CFM and higher inclusionlevels of fish meal. This better feed conversion may explain thegreater growth performance observed in Cobia fed diets con-taining CFM and higher inclusion levels. Minor differences infeed intake can certainly influence growth performance, butgiven that no clear trends emerged, suggesting reduced in-take occurred due to fish meal origin or lower inclusion levels,better feed conversion seems to be a reasonable explanation forthe improved growth observed with CFM and higher fish mealinclusion diets in Cobia. Although the nutritional compositionof CFM and MFM are relatively similar, as demonstrated byBowzer et al. (in press), small differences in the crude proteincontent and amino acid profile of these meals may explain theslightly better FCR observed in this study. Additionally, better
feed conversion with higher inclusion levels of fish meal in thediet is typical of many carnivorous fishes, and this was clearlydemonstrated by Salze et al. (2010) who replaced fish meal withgraded levels of soy protein concentrate in the diets of juvenileCobia. Therefore, the better FCR values for diets having higherfish meal inclusion was not surprising, and the small differencebetween fish meal types is likely due to minor differences in thecomposition of the meals.
There were no apparent trends for hybrid Striped Bassor Cobia in relation to organosomatic indices, but RainbowTrout were leaner (i.e., lower VSI) when fed CFM-based diets.Additionally, Rainbow Trout fed diets with lower inclusion lev-els of fish meal had slightly larger livers than fish fed dietswith higher inclusion levels of fish meal. The lower fat deposi-tion in Rainbow Trout fed CFM diets can at least partially beattributed to those diets having less crude lipid coupled withhigher ash content compared with the MFM diets. These dis-crepancies in the diets are relatively small, but likely contributedto the minor differences in lipid deposition observed betweenfish meal types. It is also well documented in Rainbow Troutthat liver size varies with the digestible carbohydrate content ofthe diet (Kaushik et al. 1989; Escaffre et al. 2007) due to anapparent inefficiency to utilize this macronutrient (Skiba-Cassyet al. 2013); however, it is not likely this is the key factor thatcontributed to differences in liver size in this study since thecarbohydrate content remained similar among the diets. Poultryby-product was the main ingredient to replace fish meal in thelower inclusion level diets, and therefore, it is likely the keyfactor contributing to the variation in liver size. Steffens (1994)demonstrated that methionine and lysine supplementation wasnecessary to maintain proper growth in Rainbow Trout whensparing or substituting fish meal with poultry by-product. Al-though our diets were formulated to meet all known nutrientrequirements of Rainbow Trout and were therefore not supple-mented with additional crystalline amino acids, differences inessential and nonessential amino acid availability due to higherinclusion levels of poultry by-product meal may have causedthe variation in liver size observed in this study (Steffens 1994).
In conclusion, CFM appears to be a cost-effective alterna-tive protein source to traditional marine-origin fish meal in thediets of carnivorous fishes such as hybrid Striped Bass, Rain-bow Trout, and Cobia. Some subtle differences in growth andorganosomatic indices were observed among the taxa we inves-tigated, but these differences were marginal. Caution should betaken when considering full-scale, commercial production giventhat these fish were reared under optimal conditions for only an8-week feeding trial. Further long-term studies should be con-ducted under conditions typical of intensive commercial cultureof these fish (i.e., temperature and oxygen fluctuations, stress,and disease), which may adversely affect growth or survival, butdue to the similarity of CFM to traditional marine-origin fishmeals, we believe these concerns are relatively minor. There-fore, further development of a CFM industry could not onlyproduce a cost-effective alternative to traditional marine-origin
Dow
nloa
ded
by [
Sout
hern
Illi
nois
Uni
vers
ity]
at 1
1:16
18
Dec
embe
r 20
14
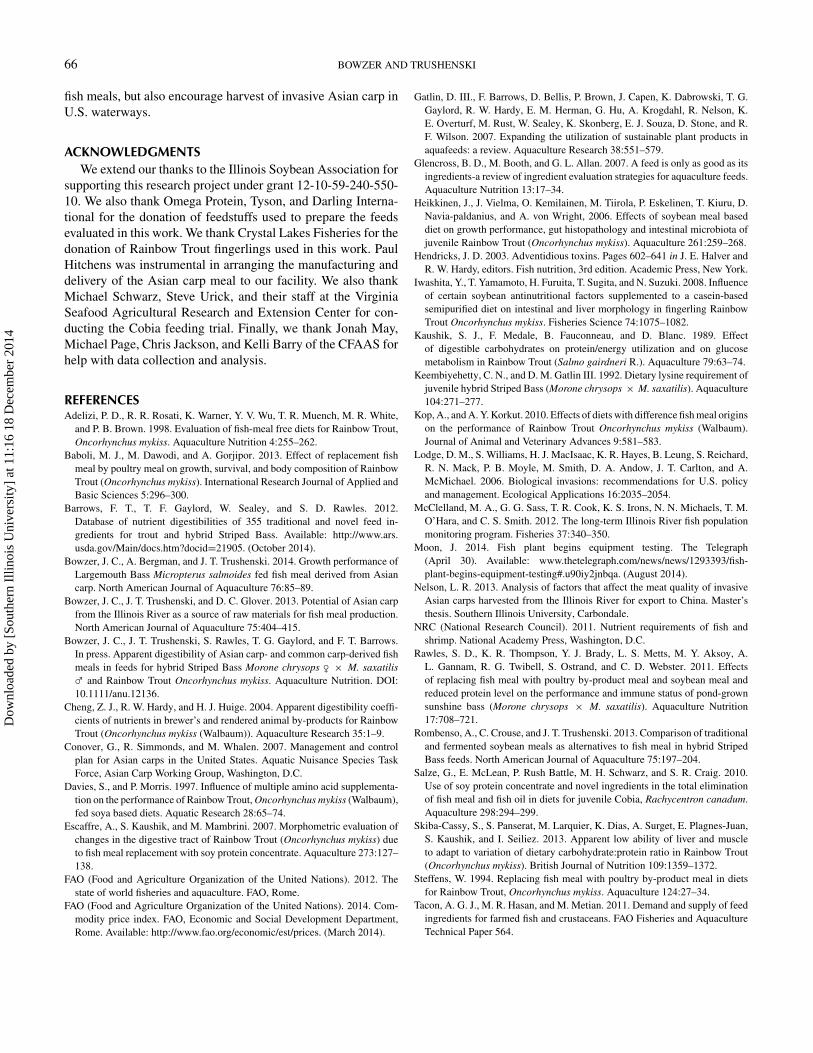
66 BOWZER AND TRUSHENSKI
fish meals, but also encourage harvest of invasive Asian carp inU.S. waterways.
ACKNOWLEDGMENTSWe extend our thanks to the Illinois Soybean Association for
supporting this research project under grant 12-10-59-240-550-10. We also thank Omega Protein, Tyson, and Darling Interna-tional for the donation of feedstuffs used to prepare the feedsevaluated in this work. We thank Crystal Lakes Fisheries for thedonation of Rainbow Trout fingerlings used in this work. PaulHitchens was instrumental in arranging the manufacturing anddelivery of the Asian carp meal to our facility. We also thankMichael Schwarz, Steve Urick, and their staff at the VirginiaSeafood Agricultural Research and Extension Center for con-ducting the Cobia feeding trial. Finally, we thank Jonah May,Michael Page, Chris Jackson, and Kelli Barry of the CFAAS forhelp with data collection and analysis.
REFERENCESAdelizi, P. D., R. R. Rosati, K. Warner, Y. V. Wu, T. R. Muench, M. R. White,
and P. B. Brown. 1998. Evaluation of fish-meal free diets for Rainbow Trout,Oncorhynchus mykiss. Aquaculture Nutrition 4:255–262.
Baboli, M. J., M. Dawodi, and A. Gorjipor. 2013. Effect of replacement fishmeal by poultry meal on growth, survival, and body composition of RainbowTrout (Oncorhynchus mykiss). International Research Journal of Applied andBasic Sciences 5:296–300.
Barrows, F. T., T. F. Gaylord, W. Sealey, and S. D. Rawles. 2012.Database of nutrient digestibilities of 355 traditional and novel feed in-gredients for trout and hybrid Striped Bass. Available: http://www.ars.usda.gov/Main/docs.htm?docid=21905. (October 2014).
Bowzer, J. C., A. Bergman, and J. T. Trushenski. 2014. Growth performance ofLargemouth Bass Micropterus salmoides fed fish meal derived from Asiancarp. North American Journal of Aquaculture 76:85–89.
Bowzer, J. C., J. T. Trushenski, and D. C. Glover. 2013. Potential of Asian carpfrom the Illinois River as a source of raw materials for fish meal production.North American Journal of Aquaculture 75:404–415.
Bowzer, J. C., J. T. Trushenski, S. Rawles, T. G. Gaylord, and F. T. Barrows.In press. Apparent digestibility of Asian carp- and common carp-derived fishmeals in feeds for hybrid Striped Bass Morone chrysops ♀ × M. saxatilis♂ and Rainbow Trout Oncorhynchus mykiss. Aquaculture Nutrition. DOI:10.1111/anu.12136.
Cheng, Z. J., R. W. Hardy, and H. J. Huige. 2004. Apparent digestibility coeffi-cients of nutrients in brewer’s and rendered animal by-products for RainbowTrout (Oncorhynchus mykiss (Walbaum)). Aquaculture Research 35:1–9.
Conover, G., R. Simmonds, and M. Whalen. 2007. Management and controlplan for Asian carps in the United States. Aquatic Nuisance Species TaskForce, Asian Carp Working Group, Washington, D.C.
Davies, S., and P. Morris. 1997. Influence of multiple amino acid supplementa-tion on the performance of Rainbow Trout, Oncorhynchus mykiss (Walbaum),fed soya based diets. Aquatic Research 28:65–74.
Escaffre, A., S. Kaushik, and M. Mambrini. 2007. Morphometric evaluation ofchanges in the digestive tract of Rainbow Trout (Oncorhynchus mykiss) dueto fish meal replacement with soy protein concentrate. Aquaculture 273:127–138.
FAO (Food and Agriculture Organization of the United Nations). 2012. Thestate of world fisheries and aquaculture. FAO, Rome.
FAO (Food and Agriculture Organization of the United Nations). 2014. Com-modity price index. FAO, Economic and Social Development Department,Rome. Available: http://www.fao.org/economic/est/prices. (March 2014).
Gatlin, D. III., F. Barrows, D. Bellis, P. Brown, J. Capen, K. Dabrowski, T. G.Gaylord, R. W. Hardy, E. M. Herman, G. Hu, A. Krogdahl, R. Nelson, K.E. Overturf, M. Rust, W. Sealey, K. Skonberg, E. J. Souza, D. Stone, and R.F. Wilson. 2007. Expanding the utilization of sustainable plant products inaquafeeds: a review. Aquaculture Research 38:551–579.
Glencross, B. D., M. Booth, and G. L. Allan. 2007. A feed is only as good as itsingredients-a review of ingredient evaluation strategies for aquaculture feeds.Aquaculture Nutrition 13:17–34.
Heikkinen, J., J. Vielma, O. Kemilainen, M. Tiirola, P. Eskelinen, T. Kiuru, D.Navia-paldanius, and A. von Wright, 2006. Effects of soybean meal baseddiet on growth performance, gut histopathology and intestinal microbiota ofjuvenile Rainbow Trout (Oncorhynchus mykiss). Aquaculture 261:259–268.
Hendricks, J. D. 2003. Adventidious toxins. Pages 602–641 in J. E. Halver andR. W. Hardy, editors. Fish nutrition, 3rd edition. Academic Press, New York.
Iwashita, Y., T. Yamamoto, H. Furuita, T. Sugita, and N. Suzuki. 2008. Influenceof certain soybean antinutritional factors supplemented to a casein-basedsemipurified diet on intestinal and liver morphology in fingerling RainbowTrout Oncorhynchus mykiss. Fisheries Science 74:1075–1082.
Kaushik, S. J., F. Medale, B. Fauconneau, and D. Blanc. 1989. Effectof digestible carbohydrates on protein/energy utilization and on glucosemetabolism in Rainbow Trout (Salmo gairdneri R.). Aquaculture 79:63–74.
Keembiyehetty, C. N., and D. M. Gatlin III. 1992. Dietary lysine requirement ofjuvenile hybrid Striped Bass (Morone chrysops × M. saxatilis). Aquaculture104:271–277.
Kop, A., and A. Y. Korkut. 2010. Effects of diets with difference fish meal originson the performance of Rainbow Trout Oncorhynchus mykiss (Walbaum).Journal of Animal and Veterinary Advances 9:581–583.
Lodge, D. M., S. Williams, H. J. MacIsaac, K. R. Hayes, B. Leung, S. Reichard,R. N. Mack, P. B. Moyle, M. Smith, D. A. Andow, J. T. Carlton, and A.McMichael. 2006. Biological invasions: recommendations for U.S. policyand management. Ecological Applications 16:2035–2054.
McClelland, M. A., G. G. Sass, T. R. Cook, K. S. Irons, N. N. Michaels, T. M.O’Hara, and C. S. Smith. 2012. The long-term Illinois River fish populationmonitoring program. Fisheries 37:340–350.
Moon, J. 2014. Fish plant begins equipment testing. The Telegraph(April 30). Available: www.thetelegraph.com/news/news/1293393/fish-plant-begins-equipment-testing#.u90iy2jnbqa. (August 2014).
Nelson, L. R. 2013. Analysis of factors that affect the meat quality of invasiveAsian carps harvested from the Illinois River for export to China. Master’sthesis. Southern Illinois University, Carbondale.
NRC (National Research Council). 2011. Nutrient requirements of fish andshrimp. National Academy Press, Washington, D.C.
Rawles, S. D., K. R. Thompson, Y. J. Brady, L. S. Metts, M. Y. Aksoy, A.L. Gannam, R. G. Twibell, S. Ostrand, and C. D. Webster. 2011. Effectsof replacing fish meal with poultry by-product meal and soybean meal andreduced protein level on the performance and immune status of pond-grownsunshine bass (Morone chrysops × M. saxatilis). Aquaculture Nutrition17:708–721.
Rombenso, A., C. Crouse, and J. T. Trushenski. 2013. Comparison of traditionaland fermented soybean meals as alternatives to fish meal in hybrid StripedBass feeds. North American Journal of Aquaculture 75:197–204.
Salze, G., E. McLean, P. Rush Battle, M. H. Schwarz, and S. R. Craig. 2010.Use of soy protein concentrate and novel ingredients in the total eliminationof fish meal and fish oil in diets for juvenile Cobia, Rachycentron canadum.Aquaculture 298:294–299.
Skiba-Cassy, S., S. Panserat, M. Larquier, K. Dias, A. Surget, E. Plagnes-Juan,S. Kaushik, and I. Seiliez. 2013. Apparent low ability of liver and muscleto adapt to variation of dietary carbohydrate:protein ratio in Rainbow Trout(Oncorhynchus mykiss). British Journal of Nutrition 109:1359–1372.
Steffens, W. 1994. Replacing fish meal with poultry by-product meal in dietsfor Rainbow Trout, Oncorhynchus mykiss. Aquaculture 124:27–34.
Tacon, A. G. J., M. R. Hasan, and M. Metian. 2011. Demand and supply of feedingredients for farmed fish and crustaceans. FAO Fisheries and AquacultureTechnical Paper 564.
Dow
nloa
ded
by [
Sout
hern
Illi
nois
Uni
vers
ity]
at 1
1:16
18
Dec
embe
r 20
14

ASIAN CARP MEAL-BASED AQUAFEEDS FOR CARNIVOROUS FISH 67
Tacon, A. G. J., and M. Metian. 2008. Global overview on the use of fishmeal and fish oil in industrially compounded aquafeeds: trends and futureprospects. Aquaculture 285:146–158.
Trushenski, J. T., M. Schwarz, W. V. N. Pessoa, B. Mulligan, C. Crouse,B. Gause, F. Yamamoto, and B. Delbos. 2013. Amending reduced fish-meal feeds with marine lecithin, but not soy lecithin, improves thegrowth of juvenile Cobia and may attenuate heightened responses to stresschallenge. Journal of Animal Physiology and Animal Nutrition 97:170–180.
Tsehaye, I., M. Ctalano, G. Sass, D. Glover, and B. Roth. 2013. Prospects forfishery-induced collapse of invasive Asian carp in the Illinois River. Fisheries38:445–454.
Varble, S., and S. Secchi. 2013. Human consumption as an invasive speciesmanagement strategy, a preliminary assessment of the marketing potential ofinvasive Asian carp in the US. Appetite 65:58–67.
Vitousek, P. M., C. M. D’Antonio, L. L. Loope, M. Rejmanek, and R.Westbrooks. 1997. Introduced species: a significant component of human-caused global environmental change. New Zealand Journal of Ecology 21:1–16.
Watanabe, T. 2002. Strategies for further development of aquatic feeds. FisheriesScience 68:242–252.
Welch, A., R. Hoenig, J. Stieglitz, D. Benetti, A. Tacon, N. Sims, and B.O’Hanlon. 2010. From fishing to the sustainable farming of carnivorousmarine finfish. Reviews in Fisheries Science 18:235–247.
Dow
nloa
ded
by [
Sout
hern
Illi
nois
Uni
vers
ity]
at 1
1:16
18
Dec
embe
r 20
14

The Potential of Asian Carp as a Raw Material for Fish Meal Production 1
2
John C. Bowzer and Jesse T. Trushenski* 3
4
Center for Fisheries, Aquaculture, and Aquatic Sciences, Southern Illinois University Carbondale, 5
Carbondale, Illinois 62901, USA 6
7
*Corresponding author, email: [email protected] 8
9
The native range of Silver Carp Hypophthalmichthys molitrix and Bighead Carp H. nobilis, 10
collectively referred to as bigheaded carp or Asian carp, includes wide ranges of the Asian 11
continent. However, following inadvertent introduction in the southeastern United States, they 12
have also become widely distributed in the Mississippi River Basin in North America. 13
Populations of these invasive species have grown dramatically in recent years, and evidence 14
suggests that the large numbers and biomass of Asian carp in the Mississippi River Basin, 15
particularly the Illinois River, are negatively affecting the ecological integrity of these systems. 16
Additionally, economically and recreationally important activities (e.g., transportation, sport 17
fishing, pleasure boating, and water sports) have been disrupted in waters where Asian carp 18
have become abundant. There is great public concern over the threat Asian carp may pose to 19
the economic and recreational value of U.S. and Canadian waterways, including various major 20
river systems and the Great Lakes. These concerns prompted the exploration of a variety of 21
strategies aimed at controlling the spread of Asian carp and reducing their densities in the 22

Mississippi River Basin. 23
Efforts to control movement of Asian carp and limit their spread have included 24
behavioral barriers (e.g., strobe lights, acoustic deterrents, air bubble curtains, electrical 25
barriers), physical barriers (e.g., vertical drops, rotating drums, floating curtains), and chemical 26
barriers (e.g., low oxygen, carbon dioxide). These efforts are geographically focused on the 27
upstream ‘invasion front’ and the Chicago Area Waterways System which connects the 28
Mississippi River Basin and the Great Lakes. Efforts to reduce Asian carp densities have been 29
primarily focused on the larger, downstream populations in order to reduce pressure on the 30
invasion front. Early efforts to reduce Asian carp densities primarily focused on chemical 31
eradication (e.g., use of rotenone), and research to refine chemical eradication-related 32
approaches is ongoing. Harvest has also been considered as an approach to reducing Asian 33
carp abundance (Tsehaye et al. 2013), but the impact of these efforts continues to be limited by 34
American consumers’ apathy towards carp as food fish and the logistical challenges of accessing 35
other, more favorable export markets (i.e., China). A more promising approach to harvest-36
based control of Asian carp is to create market demand by developing industrial applications for 37
these fish, such as rendering to produce Asian carp meal for use in aquaculture and other 38
livestock feeds. 39
To develop market demand for Asian carp meal, various attributes of the raw material 40
and finished product had to be established including nutrient content, shelf stability, 41
contaminant burden, digestibility and utilization by aquatic livestock, and performance of Asian 42
carp meal-based feeds in comparison with traditional fish meal-based formulations. First, a 43
survey was conducted to determine the seasonal and geographical variation in nutrient content 44

of Asian carp as raw materials for rendering (Bowzer et al. 2013). Fish were collected from five 45
reaches of the Illinois River during the fall, spring, and summer, pulverized and dried to a meal, 46
and analyzed to determine nutrient content and oxidation during refrigerated storage. Results 47
indicated only slight geographical and seasonal variation in composition and that, if the finished 48
product were properly stabilized with antioxidants, Asian carp appeared to be a good raw 49
material for rendering into fish meal. Work by other researchers also demonstrated that the 50
levels of various environmental contaminants were relatively low in Asian carp and posed little 51
risk in the context of fish meal production and livestock feeding (Rogowski et al. 2009). In 52
cooperation with research-supported Asian Carp harvest, Asian carp meal was commercially 53
rendered (Protein Products, Gainesville, Florida) for determinations of digestibility and lab- and 54
farm-scale feeding trials. Standard digestibility trials conducted with Rainbow Trout 55
Oncorhynchus mykiss and Hybrid Striped Bass Morone chrysops x M. saxatilis indicated that 56
Asian carp fish meal was slightly less digestible than menhaden fish meal, but generally well-57
digested by both fish (Bowzer et al. 2014a). Using the apparent digestibility coefficients 58
generated by this work, practical feed formulations were developed for lab-scale feeding trials 59
with Hybrid Striped Bass, Rainbow Trout, Largemouth Bass Micropterus salmoides, and Cobia 60
Rachycentron canadum. These trials demonstrated that each of these fish readily accepted 61
Asian carp meal-based feeds and grew as well on these as on menhaden fish meal-based feeds, 62
adding further credence to Asian carp meal as a high-value ingredient for aquaculture feeds 63
(Bowzer et al. 2014b; Bowzer and Trushenski 2015). 64
To validate these results further, cooperative farm-scale trials were initiated with two 65
Illinois Hybrid Striped Bass growers to compare Zeigler Bros. (Gardners, Pennsylvania) “Silver” 66

fish feed (the company’s standard product line for Hybrid Striped Bass) and an equivalent 67
formulation manufactured by Zeigler Bros. containing Asian carp meal and soybean meal in lieu 68
of marine-origin fish meal as the primary protein source (J. Trushenski, unpublished data). 69
Results from both farms indicated that the Asian carp meal-based feed yielded performance 70
broadly consistent with the traditional fish meal-based formulation. Results from one farm 71
suggested feed conversion ratios (FCRs) were higher among fish fed the carp/soy-based feed, 72
indicating inferior growth efficiency; however, FCRs were quite high for both treatments 73
suggesting that estimates of livestock biomass and/or feed management could be improved at 74
this farm. Dress-out (% of body weight represented by boneless, skinless fillets) was greater 75
among fish fed the Asian carp meal-based feed, suggesting that these fish were leaner and 76
yielded more edible product per unit body mass. Results from the other farm suggested 77
growth rates were generally consistent among fish fed the Asian carp meal-based feed and the 78
traditional fish meal-based feed. Although farm-scale trials are often complicated by a lesser 79
degree of experimental control and the constraints of commercial fish production, these trials 80
added further credibility to growing interest in the use of Asian carp meal in aquaculture feeds. 81
Collectively, our results suggest that, in general, Asian carp fish meal is a highly-82
digestible, nutrient-dense ingredient suitable for aquaculture feeds. Given that performance 83
associated with Asian carp meal is generally consistent with that of more expensive traditional 84
fish meals, Asian carp meal may provide some cost savings for aquaculture feed manufacturers 85
and growers. Moreover, demand for Asian carp meal will help to incentivize harvest as means 86
of reducing Asian carp densities and contribute to effective management of these invasive fish. 87
Despite these findings and considerable interest from private investors—as evidenced by the 88

opening of a new processing facility in Grafton, Illinois and the city of Havana, Illinois 89
authorizing funding to determine the economic feasibility of various fish products—progress 90
related to population control through Asian carp meal-driven approaches has been slow. Start-91
up businesses tend to be high-risk endeavors and generally require large capital investments, 92
particularly since needed infrastructure (e.g., processing and distribution facilities) is often 93
inadequate or absent. Without a well-defined market or established product price, business 94
planning becomes more nebulous and investment may be potentially riskier. Knowledge gaps 95
related to available biomass for harvest, population dynamics, and Asian carp meal quality and 96
value as a feed ingredient have also tempered enthusiasm for investment. Publically generated 97
information can help to address these issues, as they have in the case of market-based 98
approaches to Asian carp management. As additional information has become available, 99
interested parties have gained greater predictive power regarding potential markets, prices, 100
and return on investment. Nonetheless, harvest-based control measures are constrained by 101
the small size and relatively domestic nature of the current commercial fishing fleet targeting 102
Asian carp in American waters. If the value of landed Asian carp increased substantially, either 103
through greater demand or public incentives measures, the fishery would likely become larger, 104
more industrialized, and more effective in reducing Asian carp abundance. It is our hope that 105
these issues can be overcome through public/private partnerships and that markets for Asian 106
carp meal can be effectively harnessed to support management approaches to limit the effects 107
of invasive populations of Asian carp and provide the aquaculture industry with a much- 108
needed source of high quality protein for feeds. 109
110

References 111
Bowzer, J., and J. Trushenski. 2015. Growth Performance of Hybrid Striped Bass, Rainbow 112
Trout, and Cobia Utilizing Asian Carp Meal-based Aquafeeds. North American Journal of 113
Aquaculture, in press. 114
Bowzer, J., J. Trushenski, and D.C. Glover. 2013. Potential of Asian Carp from the Illinois River 115
as a Source of Raw Materials for Fish Meal Production. North American Journal of 116
Aquaculture 75:404-415. 117
Bowzer, J., J. Trushenski, S. Rawles, T.G. Gaylord, and F.T. Barrows. 2014a. Apparent 118
Digestibility of Asian Carp- and Common Carp-derived Fish Meals in Feeds for Hybrid 119
Striped Bass Morone chrysops ♀ × M. saxatilis ♂ and Rainbow Trout Oncorhynchus 120
mykiss. Aquaculture Nutrition, DOI: 10.1111/anu.12136. 121
Bowzer, J., A. Bergman, and J. Trushenski. 2014b. Growth Performance of Largemouth Bass 122
Fed Fish Meal Derived from Asian Carp. North American Journal of Aquaculture 76:185-123
189. 124
Rogowski, D.L., D.J. Soucek, J.M. Levengood, S.R. Johnson, J.H. Chick, J.M. Dettmers, M.A. Pegg, 125
and J.M. Epifanio. 2009. Contaminant Concentrations in Asian Carps, Invasive Species 126
in the Mississippi and Illinois Rivers. Environmental Monitoring and Assessment 127
157:211-222. 128
Tsehaye, I., M. Catalano, G. Sass, D. Glover, and B. Roth. 2013. Prospects for Fishery-induced 129
Collapse of Invasive Asian Carp in the Illinois River. Fisheries 38:445-454. 130

Spatial and interspecific patterns in persistent contaminant loadsin bighead and silver carp from the Illinois River
Jeffrey M. Levengood • David J. Soucek •
Amy Dickinson • Gregory G. Sass • John M. Epifanio
Accepted: 12 July 2013 / Published online: 26 July 2013! Springer Science+Business Media New York 2013
Abstract We measured concentrations of selected or-ganohalogens, fluorinated compounds and mercury in whole,
ground silver (Hypophthalmichthys molitrix) and bighead
(H. nobilis) carp from the Illinois River, Illinois, in 2010 and2011 to characterize spatial and interspecific patterns of
contaminant burdens. Silver carp, which had greater lipid
content, tended to have greater concentrations of lipophiliccompounds. Concentrations of organohalogens were gener-
ally greater in carp from the upper reaches of the river. The
halogenated compounds were associated with length andlipid content in silver carp. Bighead carp had greater mercury
concentrations than did silver carp; total mercury concen-
trations were negatively associated with lipid content ofbighead carp. Perfluorinated compounds, comprised pre-
dominantly of perfluorooctane sulfonic acid, did not vary by
species or river reach. Chlordanes and polychlorinatedbiphenyls were of potential concern with regard to the use of
these carp as animal feed additives. Our results indicated that,
even though they occupy a lower trophic level than manysimilarly-sized fish, these carp may accumulate measureable
concentrations of organic contaminants.
Keywords Asian carp ! PCB ! PBDE ! Chlordane !PFOS ! Mercury
Introduction
Silver (Hypophthalmichthys molitrix) and bighead (H. no-
bilis) carp (hereafter collectively Asian carp), two invasiveand U.S. federally injurious species of cyprinid native to
Asia, escaped from aquaculture facilities in Arkansas in the
early 1970s, and rapidly spread throughout the MississippiRiver (Kelly et al. 2011). Populations of Asian carp in the
Illinois River increased exponentially in the 2000s, to a level
where they became a threat to the ecosystem including nativefish communities (Irons et al. 2007; Sass et al. 2010), as well
as caused safety concerns for boaters. Concerns that the carp
will reach Lake Michigan and subsequently other GreatLakes through the Chicago Sanitary and Ship Canal have led
to implementation of measures designed to decrease the
likelihood of such an occurrence (e.g., electric barriers, Moyet al. 2011). Commercial harvest of the carp is also being
evaluated as a measure to reduce their populations. This has
necessitated the creation of markets for Asian carp to makecommercial fishing for them an economically viable activity.
In addition to their potential or realized use as a protein
source for animal feed and fertilizer, fish oil, and fish meal(Conover et al. 2007; Garvey et al. 2012), Asian carp are now
promoted by one world-renowned chef as ‘‘silverfin’’ (see
http://www.silverfincraze.com), provided as a protein sourcefor impoverished people (see http://www.dnr.illinois.gov/
Pages/TargetHungerNow), and shipped abroad (e.g., to
China) for human consumption. There are also continuedefforts to introduce the fish into the diets of the typical US
consumer (Garvey et al. 2012).
Electronic supplementary material The online version of thisarticle (doi:10.1007/s10646-013-1105-6) contains supplementarymaterial, which is available to authorized users.
J. M. Levengood (&) ! D. J. Soucek ! A. Dickinson !G. G. Sass ! J. M. EpifanioIllinois Natural History Survey, University of Illinoisat Urbana-Champaign, 1816 S. Oak St., Champaign,IL 61820, USAe-mail: [email protected]
Present Address:G. G. SassWisconsin Department of Natural Resources, 10810 CountyHwy N, Boulder Junction, WI 54512, USA
123
Ecotoxicology (2013) 22:1174–1182
DOI 10.1007/s10646-013-1105-6

Previous examinations of contaminants in Asian carp in
Illinois were spatially limited and showed variable con-centrations. Rogowski et al. (2009) determined that mer-
cury (Hg) was present in some individuals of both species
at concentrations that would trigger sportfish consumptionadvisories. Polychlorinated biphenyls (PCBs) were detec-
ted in some fish; however, detectable concentrations were
well below the FDA action level of 2.0 ppm in the edibleportion of fish (Rogowski et al. 2009).
The purpose of our study was to measure concentrationsof selected organohalogens [PCBs, chlordane, hexachlo-
robenzene (HCB), hexachlorocyclohexane (HCH), and
polybrominated diphenyl ethers (PBDE)], fluorinatedcompounds (FLC) and mercury (Hg) in samples of whole,
ground bighead and silver carp from a number of locations
on the Illinois River in 2010 and 2011. Our goal was tomeasure and better characterize spatial and interspecific
patterns of contaminant burdens in these fish within the
Illinois River basin.
Methods
A total of 42 fresh silver and bighead carp specimens were
solicited from commercial fishermen during 2010 and 2011from the Alton (n = 0 bighead/5 silver), LaGrange (5/5),
Peoria (2/5), Starved Rock (5/5), and Marseilles (5/5)
reaches of the Illinois River (Fig. 1). Fish were placed inindividual plastic bags on wet ice for transportation and
placed in a -29 "C freezer. Frozen fish were cut into
pieces using a band saw; partially thawed pieces were thenpassed through a knife mill for homogenization and an
aliquot collected onto acetone-cleaned, food-grade alumi-
num foil, placed into individually-marked plastic bags, andshipped frozen to the laboratory for analysis. Samples of
ground homogenized tissue were prepared in accordance
with EPA Method 3050B and analyzed for mercury via aThermo X-Series II with Collision Cell Technology
Inductively Coupled Plasma Mass Spectrometer according
to EPA Method 6020. The detection limit for mercury was0.0071 ng/g. Samples analyzed for PCB and pesticides
were prepared in accordance with EPA Method 3540.
Pesticides analysis for chlordane, a-chlordane, c-chlor-dane, a-BHC, b-BHC, d-BHC, lindane, and HCB) was
performed on an HP (Agilent) 5890 Gas Chromatograph
with dual electron capture detectors following EPAMethod 8081. Detection limits for pesticides ranged from
0.23 lg/kg for HCB to 4.25 lg/kg for chlordane. PCB
analysis was performed on an HP (Agilent) 6890 Plus GasChromatograph with dual micro-electron capture detectors
according to EPA Method 8082 and expressed as Aroclors;
the detection limit for PCBs as Aroclors was 39.1 lg/kg.Restek RTX CLPesticides I, 30 m 9 0.32 mm I.D. and
RTX CLPesticides II, 30 m 9 0.32 mm I.D. were used for
separation of both PCBs and pesticides.Samples were analyzed for 10 PBDE congeners (BDE 47,
77, 99, 100, 153, 154, 181, 183, 190 and 209) using EPA
Method 1614 (modified) via Waters AutoSpec Ultima highresolution mass spectrometer with a Restek RTX-1614
15 m 9 0.25 mm 9 0.1 lm column. The detection limits for
PBDEs ranged from 1.09 ng/kg (BDE 77) to 57.9 ng/kg (BDE190), except the detection limits for BDE 209 ranged from 141
to 3,120 ng/kg. Thirteen perfluorinated compounds (PFCs)(C4 through C12 perfluoro-acids, perfluorbutane sulfonate,
perfluorohexane sulfonate, perfluorooctane sulfonate, and
perfluorooctane sulfonamide) were quantified with an AppliedBiosystems API 5000 LC/MS/MS using a Phenomenex Luna
3um C8 (2) Mercury, 20 m 9 4.0 mm column. There was no
EPA method for PFC analysis in tissue. Detection limits forPFCs ranged from 0.151 ng/g (C4) to 0.456 ng/g (C12); the
detection limit for PFOS was 0.214 ng/g.
Quality control measures included percent recovery oflaboratory fortified blanks, certified reference material (in
some cases), and matrix spikes. Other quality control data
reported included relative percent difference (RPD)between spiked duplicates, and analysis of laboratory
blanks. With a few exceptions Quality Control results ran-
ged from acceptable to excellent (see Supplementary Datafor details).
Sum PBDEs were calculated as the sum of the con-
centrations of all congeners that were detected in at leastone sample (47, 99, 100, 153, 154, 183, and 209). For
samples with congeners below detection limit, half the
detection limit was used in calculating sum PBDEs.Likewise, sum chlordane values were calculated as the sum
of alpha, gamma, and technical chlordane, and sum FLCs
were calculated as the sum of all thirteen congeners, withthe same conditions as described above for samples with
values below detection limits.
To determine if weight was a significant covariate forspecies or site, we conducted ANCOVA for mean con-
taminant concentrations using JMP-IN software (Sall and
Lehman 1996). We used both site and species as thetreatment effect in separate analyses, with length being the
covariate in both cases. Length was never found to be a
statistically significant covariate; consequently mean con-centrations of total PCBs, sum PBDEs, sum chlordane,
total Hg, sum FLCs, % lipid, and fish length were com-
pared among sites and between species using two-wayanalysis of variance (ANOVA) with JMP-IN software (Sall
and Lehman 1996). Post-hoc pairwise comparisons were
conducted using the Tukey HSD test. In addition, we usedthe Pearson product-moment correlation to investigate
relationships between physical characteristics (length,
% lipid) and contaminant concentrations in each speciesseparately. Dry weight conversions were based on the
Contaminants in Asian carp 1175
123

mean % moisture of the ground samples (76 %) as deter-
mined by lyophilization.
Results
Bighead carp were larger on average than silver carp
(F1,36 = 31.2, p \ 0.001). When the species were pooled,
Asian carp from the Peoria reach were smaller than those
collected from the other reaches (Fig. 2a; F4,36 = 7.8,
p = 0.001). Lipid content was much greater in silver carp(Fig. 2b; F1,36 = 27.9, p \ 0.001). The disparity between
species was greatest in specimens from the Starved Rock
reach. With species combined, lipid stores were greater infish from the Marseilles reach than in those from the Peoria
reach.
Fig. 1 Map showing the Illinois River and locations of dams and river reaches sampled for Asian carp in this study
1176 J. M. Levengood et al.
123

Silver carp contained significantly greater (F1,36 = 4.8,
p = 0.04) PCB concentrations on average (258.6 ng/g),than did silver carp (209.5 ng/g). Mean total PCB con-
centrations varied across reaches (F4,36 = 9.2, p \ 0.001),
and generally increased from downstream to upstream(Fig. 3a). Most notably, silver carp from the Marseilles
reach contained much greater PCB concentrations than did
fish of either species from the other river reaches. Aroclors1254 (44 and 45 % in silver and bighead, respectively) and
1260 (44 % in both species) predominated in both species;Aroclor 1248 represented 14 % of PCBs in both carp
species.
Sum chlordanes (sum of technical chlordane, a- andc-isomers) concentrations varied by site (F4,36 = 16.0,
p \ 0.001) but not by species (F1,36 = 3.2, p = 0.08).
Concentrations in fish from the Marseilles reach were sig-nificantly greater than those at the other sites (Fig. 3b). The
alpha-, beta- and delta-BHC isomers of lindane were not
detectable in whole fish; gamma-BHC (lindane) wasdetectable in more bighead than silver carp (47 vs. 20 %,
respectively), albeit at very low concentrations (max. =
1.9 ng/g). HCB was detected at very low concentrations in asmall proportion of whole bighead carp (12 % to 0.84 ng/g),
though not in silver carp.
PBDE concentrations were greater in silver carp(F1,36 = 4.1, p = 0.05) and in carp from the Starved Rock
and Marseilles reaches (F4,36 = 7.2, p \ 0.001; Fig. 3c).
Congener PBDE 47 predominated in both species, fol-lowed by lesser amounts of PBDE 100, 147, and 209
(Fig. 3d). Congeners PBDEs 99, 153 and 83 were very
minor components of PBDEs in Asian carp in the IllinoisRiver.
FLC nominally increased in both species from
LaGrange to Starved Rock reaches, but did not differ eitherby species (F1,31 = 0.0, p = 0.88) or reach (F4,31 = 1.3,
p = 0.28; Fig. 4). FLC were dominated by perfluorooc-tanesulfonic acid (PFOS), which averaged 51 and 58 % of
the total measured FLCs in silver and bighead carp,
respectively. FLC were not analyzed in silver carp from theMarseilles pool.
Mercury concentrations were greater in bighead carp
(F1,36 = 10.6, p = 0.002), and were lower in carp from theMarseilles reach (F4,36 = 4.3, p = 0.006; Fig. 5). Mercury
concentrations were much greater in bighead than silver
carp from both the LaGrange and Starved Rock reaches(F3,36 = 11.8, p \ 0.001). The average mercury concen-
tration was lowest, on average, in silver carp from
LaGrange and bighead carp from Marseilles reaches.Lipid content was positively correlated with body length
in silver though not bighead carp. Chlordane was positively
and Hg was negatively correlated with lipid content inbighead carp, whereas the halogenated compounds were
positively associated with both size and lipid content in
silver carp (Table 1).
Discussion
Very little published information exists on contaminants in
silver and bighead carp in the midwestern United States.Orazio et al. (2006) analyzed composited fillets and whole-
body samples of these species collected from one location
on the lower Missouri River. Organohalogen concentra-tions were greater in the more lipid-rich silver carp, and
concentrations tended to be greater in whole fish than in
fillets (Orazio et al. 2006). Greater concentrations of mer-cury in bighead carp compared to silver carp were attrib-
uted to their higher trophic position. Bighead carp are
typically zooplanktivorous, while silver carp are generallyphytoplanktivorous. Rogowski et al. (2009) examined a
suite of toxicants in skinless fillets from three locations on
the Mississippi and Illinois rivers. Organochlorines weregenerally undetectable and mercury concentrations were
elevated enough in some fish that consumption advisories
were recommended (Rogowski et al. 2009). Our studypresents a broader examination of environmental contam-
inants in bighead and silver carp from the Illinois River.
PCBs, organochlorines widely used as electrical insu-lating fluids and coolants until banned in the United States
Fig. 2 Mean a total length (mm) and b % lipid ? sd in silver andbighead carp from 5 reaches on the Illinois River, Illinois. We did notexamine bighead carp from the Alton pool
Contaminants in Asian carp 1177
123

in 1979, are still available in the environment and arepresent in fishes from the Illinois River. Groschen et al.
(2000) detected PCBs in fish tissues from 15 of 20 loca-
tions in the lower Illinois River (from the Starved Rockreach downstream). The 2012 Illinois Fish Advisory
included consumption restrictions on some species of fish
throughout the Illinois River due to PCB concentrations
within fillets (IDPH 2012). This advisory included bigheadand silver carp from the lower Illinois River. In agreement
with these surveys, we detected PCBs in samples of whole,
ground carp from the Illinois River.When all reaches were pooled, the PCB concentrations
we observed were, on average, much greater than in
composites of both bighead (40 ng/g) and silver (95 ng/g)
Fig. 3 Mean a total PCB, b chlordane, and c sum PBDE concentrations (ng/g ww) ? sd, and d PBDE congener composition in silver andbighead carp from the Illinois River, Illinois. We did not examine bighead carp from the Alton pool
Fig. 4 Mean sum FLC concentrations (ng/g ww) ? sd in silver andbighead carp from 5 reaches on the Illinois River, Illinois. We did notexamine bighead carp from the Alton pool, nor did we measure FLCsin silver carp from the Marseilles pool
Fig. 5 Mean mercury concentrations (ng/g ww) ? sd in silver andbighead carp from 5 reaches on the Illinois River, Illinois. We did notexamine bighead carp from the Alton pool
1178 J. M. Levengood et al.
123

carp from one location on the Missouri River, Missouri
(Orazio et al. 2006). However, concentrations in silver carpfrom the lower Illinois River (Alton and LaGrange reaches)
were similar to that observed by Orazio et al. (2006). We
are not aware of other information on PCBs in whole silveror bighead carp, or recent data for whole specimens of any
species from the Illinois River, for comparison.
We observed greater concentrations of PCBs in bigheadand silver carp collected in the upper reaches compared to
the lower reaches of the Illinois River. The lower DesPlaines River is a heavily urban-industrialized waterway
that carries sanitary, storm water, and industrial effluents to
the Illinois River. Because Chicago is a large source-areafor contaminants, the elevated concentrations of PCBs we
observed may be related to the proximity of fish to this
source. We observed a maximum total PCB concentrationof 584 ng/g. When converted to dry mass (1,947 ng/g), this
concentration was just below the FDA PCB tolerance of
2.0 mg/kg for feed components including fishmeal. Ele-vated concentrations of PCBs in whole fish, especially
those harvested in close proximity to heavily urbanized-
industrialized areas, should be considered when determin-ing uses for ground fish meal.
PCB as Aroclors 1254 and 1260 predominated in our
study. These ‘‘heavier’’ PCBs have also been observed inother fishes (e.g., alewife Alosa pseudoharengus, Leven-
good and Schaeffer (2010); Mozambique tilapia Oreochr-
omis mossambicus, Yang et al. (2008); lake trout Salvelinusnamaycush, Gerstenberger et al. (1997). The more heavily-
chlorinated congeners, like those present in Aroclors 1254
and 1260, are more resistant to degradation and tend toaccumulate in animal tissue (Beyer and Biziuk 2009).
Given the persistence of these forms and their widespread
use and presence in the aquatic environment, it is notsurprising that we observed them in bighead and silver carp
from the Illinois River.
PBDE are flame-retardants that are ubiquitous in theenvironment and present in fish tissue. Homogenates of
whole common carp (Cyprinus carpio) collected from the
lower Des Plaines River about 64 km upstream from ourupper-most sampling site had mean PBDE concentrations
of 14.5 ng/g (Rice et al. 2002) and were similar to what weobserved in bighead carp (16.6 ng/g), but much lower than
in silver carp (33.9 ng/g) from the Marseilles reach of the
Illinois River. Common carp are typically benthivores,whereas bighead and silver carp are generally planktivo-
rous and filter phytoplankton and zooplankton from the
water column. Bighead and silver carp may switch tobenthic feeding and consume detritus if plankton are lim-
ited, but this behavior is more common in bighead than in
silver carp (Cremer and Smitherman 1980; Opuszynski1981). Greater rates of benthivory by Illinois River bighead
carp compared to silver carp may explain the differences in
PBDE concentrations between the species.The dominant isomers in common carp (Cyprinus car-
pio) collected from the lower Des Plaines River about
64 km upstream from our upper-most sampling site wereBDE 181 and 183 (Rice et al. 2002), whereas BDE 47, 100,
154, and to a lesser extent 209 predominated in Asian carp
in our study. Larger PBDEs (e.g., BDE 209) are believed tobioaccumulate to a lesser degree than less-brominated
forms. Smaller forms (e.g., BDE 47 and 100) tend to bio-
magnify in aquatic food chains (Kuo et al. 2010). In ourstudy, sum PBDEs were positively correlated with lipid in
Table 1 Correlation matrix for physical characters and contaminant concentrations in bighead and silver carp from the Illinois River
Bighead carp
Length % Lipid PCB PBDEP
Chlor tHg FLC
Weight 0.969* -0.152 0.022 0.031 -0.157 0.270 0.240
Length – -0.091 0.136 0.139 -0.005 0.223 0.193
% lipid – – 0.173 0.047 0.626* -0.701* -0.371
Silver carp
Length % Lipid PCB PBDEP
Chlor tHg FLCa
Weight 0.960* 0.464* 0.572* 0.521* 0.746* 0.017 0.151
Length – 0.424* 0.523* 0.414* 0.765* -0.069 0.020
% lipid – – 0.431* 0.502* 0.563* -0.388 -0.087
Values shown are r values
PCB total polychlorinated biphenyls, PBDE sum polybrominated diphenyl ethers,P
Chlor sum chlordanes, tHg total mercury, FLC sumfluorinated compounds
* Indicates significant correlation (p \ 0.05)a Correlations between FLC and all other variables for silver carp did not include the Marseilles pool because FLCs were not measured inMarseilles silver carp
Contaminants in Asian carp 1179
123
silver carp, but not in the less lipid-rich bighead carp.
Individually, congeners BDE 47, 110 and 153 were posi-tively correlated with lipid content in silver carp (p \ 0.05,
r = 0.25–0.28), whereas only BDE 153 was associated
with lipids in bighead carp (p \ 0.01, r = 0.52). Meanconcentrations of PBDE 47 were very similar in bighead
carp from the Missouri (10 ppb; Orazio et al. 2006) and
Illinois rivers, whereas concentrations where notablygreater, on average, in silver carp from the Missouri River
(30 ppb; Orazio et al. 2006) than in those collected fromthe Illinois River in our study. In contrast, the average
PBDE 47 concentration was much less in common carp
collected from the lower Des Plaines River in Illinois(2.54 ppb; Rice et al. 2002).
FLCs, stick- and stain-resisting chemicals used in a
variety of consumer products, are recently-emerged con-taminants widely present in fishes of the upper Mississippi,
Ohio, and Missouri rivers (Ye et al. 2008a) and the Great
Lakes (Giesy and Kannan 2001; Kannan et al. 2005).PFOS, a once widely-used surfactant, is often the pre-
dominant FLC in fishes (e.g., Taniyasu et al. 2003; Kannan
et al. 2005; Sinclair et al. 2006; Delinsky et al. 2010) aswell as in benthic organisms (Kannan et al. 2005). Ye et al.
(2008a) examined FLC concentrations in whole fish
homogenates from the Ohio, Missouri and upper Missis-sippi rivers; PFOS comprised 73 % of PFCs in fish from
the Ohio and Missouri rivers and 91 % in the upper Mis-
sissippi River. In another study, PFOS comprised 77–89 %of PFCs in common carp from locations on the upper
Mississippi River (Ye et al. 2008b). The proportions
observed by Ye et al. (2008a, b) were much greater thanthose observed in this study.
Although Delinsky et al. (2010) noted greater FLC
concentrations in fishes from waters more proximate tolarge cities and downstream of sewage treatment plants,
FLC concentrations did not vary by river reach in our
study. Our results suggest that PFOS may be relativelyhomogenous within the Illinoi River. Perfluorinated com-
pounds in rivers are generally associated with sewage
treatment plants, especially those that discharge industrial/commercial effluents (e.g., Ahrens et al. 2009; Delinsky
et al. 2010; Lin et al. 2010). Effluents from Chicago can be
traced the entire length of the Illinois River to its conflu-ence with the Mississippi River (Kelly et al. 2010). There
are also many additional sources of sewage effluent along
the river; 75 National Pollutant Discharge EliminationSystem-permitted facilities occur along the main stem of
the middle Illinois River alone (Tetra Tech Inc 2010). Low
variability in PFCs among Illinois River reaches may alsoindicate that Asian carp travel extensively throughout the
river. Bighead and silver carp move considerably within
and between reaches of the Illinois River (DeGrandchampet al. 2008). Based on our findings, further examination of
the fate and movements of PFCs within the Illinois River
system is warranted.Chlordane is an organochlorine insecticide that was
widely used until 1988, when it was banned due to its
persistent, bioaccumulative, and toxic characteristics.Chlordane was previously detected in livers from fishes in
20 sampled locations on the lower Illinois River (Mar-
seilles reach downstream) (Groschen et al. 2000). Chlor-dane was also present in fillets from some fish in our
previous study of Asian carp, albeit at very low concen-trations (Rogowski et al. 2009). Mean concentrations of
(total) chlordane were greater in bighead carp from the
Illinois River than in those from the Missouri River(15 ppb; Orazio et al. 2006), whereas chlordane was much
greater, on average, in silver carp from the latter (50 ppb;
Orazio et al. 2006). Chlordane concentrations in six of the17 bighead (35 %) and six of the 25 silver (24 %) carp we
examined, when converted to dry weight, exceeded the
FDA limit of 0.1 mg/kg (100 ng/g; assumed dry mass)chlordane in animal feed, and were greatest in bighead and
silver carp from the upper-most pool that we sampled.
Atmospheric mercury deposition and subsequent mer-cury-containing runoff is an important source of this ele-
ment in river systems (e.g., Ambrose et al. 2005; Hope
2005). Storm water runoff from heavily urbanized water-sheds, such as the upper Illinois River basin, may con-
tribute substantially to river mercury loads (Chon et al.
2012). Cultivated lands can also contribute substantially toriver mercury loads, as runoff carries mercury-laden soil
into tributaries (Balogh et al. 2003). With 83 % of its 3.86
million hectare watershed under cultivation (I. DozierUSDA pers. comm.), coupled with high rates of erosion,
run-off is likely a major source of mercury into the Illinois
River. Point-source effluents may also contribute to river-ine mercury loads. Sixty-five facilities in the Illinois River
watershed (within the state of Illinois) reported mercury
releases in one or more previous years (US EPA 2012).Methyl- and total mercury concentrations in sediments
from some locations of the upper Illinois River basin were
above the national median (Groschen et al. 2004). Mercuryconcentrations in sediments of the lower Illinois River
basin were greatest at the confluence of the Fox and Illinois
rivers (Starved Rock reach) and decreased downstream(Groschen et al. 2000). Illinois has a statewide mercury
consumption advisory for predatory fish from all state
waters. Thus, in spite of their low trophic level, it is notsurprising that we observed measureable concentrations of
mercury in bighead and silver carp from the Illinois River.
Methyl-mercury becomes covalently bound to proteinsulfhydryl groups and therefore tends to accumulate in
proteinaceous tissue. This may explain the negative asso-
ciation we observed between Hg and the lipid content offish, especially in the leaner bighead carp. This relationship
1180 J. M. Levengood et al.
123

between the two species varied by river reach, although
when data from all sites were combined, bighead carp hadgreater mean mercury concentrations (24.0 ng/g vs. silver
carp 12.6 ng/g). Mercury concentrations were not corre-
lated with size (length), with the exception of the Mar-seilles reach. However, mercury concentrations reflected
the size relationship between the species; i.e., greater in
bighead carp from LaGrange and Starved Rock, and similarbetween the two species at Peoria reach. Rogowski et al.
(2009) reported that that the bighead carp they examinedwere larger on average and occupied a higher trophic
position than did silver carp, based on d15N levels, and
therefore had greater mercury concentrations in fillets.Mean mercury concentrations in Asian carp from the
Illinois River were much less than in a limited sample of
whole carp from the Missouri River (bighead 100 ng/g,silver 37 ng/g; Orazio et al. 2006), although the maximum
concentration in silver carp in our sample (32 ng/g)
approached the mean in the Missouri sample. Mercurylevels in our samples were also less than the maximum
permissible levels for feed materials produced from fish or
other marine animals in the European Union (0.5 mg/kg dw).The National Research Council considers the maximum
tolerable concentration for some animals to be 1.0 mg/kg dw
for rodents, poultry, horses, and fish. These guidelines are foranimal health, not to prevent accumulation in edible tissues.
Conversion of our maximum value (0.032 mg/kg) to dry
mass (0.107 mg/kg) yielded a concentration that was stillconsiderably lower than both NRC guidelines and EU
Directive.
Silver carp in the Illinois River were more lipid-rich andtended to have greater concentrations of lipophilic com-
pounds compared to bighead carp. Concentrations of or-
ganohalogens in carp generally increased upriver,presumably due to inputs from the heavily urban-industri-
alized lower Des Plaines River. Some chemicals (i.e.,
PCBs and chlordanes) were of potential concern withregard to the use of bighead and silver carp as animal feed
additives. The zooplanktivorous bighead carp contained
greater mercury concentrations than did the more phyto-planktivorous silver carp. Silver and bighead carp may
accumulate measureable concentrations of organic con-
taminants, and species and collection location need to beconsidered when contemplating commercial uses of these
species.
Acknowledgments This study was conducted with US EPA GreatLakes Restoration Initiative funds provided by the US Fish andWildlife Service to the Illinois Department of Natural Resources(IDNR) under Cooperative Agreement No. 30181AJ071. Additionalsupport was provided by Illinois-Indiana Sea Grant. Special thanks toKevin Irons, Tom Heavisides and Steve Schultz, IDNR, David Gloverand John Bowzer, Southern Illinois University at Carbondale, andDiane Greer, Illinois Natural History Survey.
Conflict of interest The authors declare they have no conflict ofinterest.
References
Ahrens L, Felizeter S, Strum R, Xie Z, Ebinghaus R (2009)Polyfluorinated compounds in waste water treatment planteffluents and surface waters along the River Elbe, Germany.Mar Poll Bull 58:1326–1333
Ambrose RB Jr, Tsiros IX, Wool TA (2005) Modeling mercury fluxesand concentrations in a Georgia watershed receiving atmosphericdeposition load from direct and indirect sources. J Air WasteManage Assoc 55:594–603
Balogh SJ, Huang Y, Offerman HJ, Meyer ML, Johnson DK (2003)Methylmercury in rivers draining cultivated watersheds. SciTotal Environ 304:305–313
Beyer A, Biziuk M (2009) Environmental fate and global distributionof polychlorinated biphenyls. Rev Env Contam Tox201:137–158
Chon HS, Ohandja DG, Voulvoulis N (2012) Assessing the relativecontribution of wastewater treatment plants to levels of metals inreceiving waters for catchment management. Water Air Soil Poll223:3987–4006
Conover G, Simmonds R, Whalen M (2007) Management and controlplan for bighead, black, grass, and silver carps in the UnitedStates. Aquatic Nuisance Species Task Force, Asian CarpWorking Group, Washington, p 223
Cremer MC, Smitherman RO (1980) Food habits and growth of silverand bighead carp in cages and ponds. Aquaculture 20:57–64
DeGrandchamp K, Garvey J, Colombo R (2008) Movement andhabitat selection by invasive Asian carps in a large river. TransAm Fish Soc 137:45–56
Delinsky AD, Strynar MJ, McCann PJ, Varns JL, McMillan L,Nakayama SF, Lindstrom AB (2010) Geographical distributionof perfluorinated compounds in fish from Minnesota lakes andrivers. Environ Sci Tech 44:2549–2554
Garvey JE, Sass GG, Trushenski J, Glover D, Charlebois PM,Levengood J, Roth B, Whitledge B. Small BC, Tripp SJ, SecchiS (2012) Fishing down the bighead and silver carps: Reducingthe risk of invasion to the Great Lakes. Research summary.March 2012. 184 pp. http://www.asiancarp.us/documents/CARP2011.pdf. Accessed 9 March 2013
Gerstenberger SL, Gallinet MP, Dellinger JA (1997) Polychlorinatedbiphenyl congeners and selected organochlorines in LakeSuperior fish, USA. Environ Tox Chem 16:2222–2228
Giesy JP, Kannan K (2001) Global distribution of perfluorooctanesulfonate in wildlife. Environ Sci Tech 35:1339–1342
Groschen GE, Harris MA, King RB, Terrio PJ, Warner KL (2000)Water Quality in the Lower Illinois River Basin, Illinois,1995–98: U.S. Geological Survey Circular 1209, 36 p. http://pubs.water.usgs.gov/circ1209/. Accessed 9 Mar 2013
Groschen GE, Arnold TL, Harris MA, Dupre EH, Fitzpatrick FA,Scudder BC, Morrow WS Jr, Terrio PJ, Warner KL, Murphy EA(2004) Water Quality in the Upper Illinois River Basin, Illinois,Indiana, and Wisconsin, 1999–2001: U.S. Geological SurveyCircular 1230, 32 p. available on-line at http://pubs.usgs.gov/circ/2004/1230/. Accessed 9 Mar 2013
Hope BK (2005) A mass budget for mercury in the Willamette RiverBasin, Oregon, USA. Water Air Soil Poll 161:365–382
IDPH (2012) Illinois Fish Advisory 2012. http://www.idph.state.il.us/envhealth/fishadvisory/index.htm. Accessed 8 Mar 2013
Contaminants in Asian carp 1181
123

Irons KS, Sass GG, McClelland MA, Stafford JD (2007) Reducedcondition factor of two native fish species coincident withinvasion of non-native Asian carps in the Illinois River, U.S.A. Isthis evidence for competition and reduced fitness? J Fish Bio71:258–273
Kannan K, Tao L, Sinclair E, Pastva SD, Jude DJ (2005) Perfluo-rinated compounds in aquatic organisms at various trophic levelsin a Great lakes food chain. Arch Environ Contam Tox48:559–566
Kelly WR, Panno SV, Hackley KC, Hwang HH, Martinsek AT, MarkusM (2010) Using chloride and other ions to trace sewage and roadsalt in the Illinois Waterway. Appl Geochem 25:661–673
Kelly AM, Engle CR, Armstrong ML, Freeze M, Mitchell AJ (2011)History of introductions and governmental involvement inpromoting the use of grass, silver, and bighead carps. In:Chapman DC, Hoff MH (eds) Invasive Asian carps in NorthAmerica. Am Fish Soc Symp 74, Bethesda, pp 121–138
Kuo YM, Sepulveda M, Sutton T, Ochoa-Acuna H, Muir A (2010)Bioaccumulation and biotransformation of decabromodiphenylether and effects on daily growth in juvenile lake whitefish(Coregonus clupeaformis). Ecotox 19:751–760
Levengood JM, Schaeffer DJ (2010) Comparison of PCB profiles inthe embryos and principal prey of a breeding colony of black-crowned night-herons. J Great Lakes Res 36:548–553
Lin A, Panchangam S, Ciou PS (2010) High levels of perfluoro-chemicals in Taiwan’s wastewater treatment plants and down-stream rivers pose great risk to local aquatic ecosystems.Chemosphere 80:1167–1174
Moy PB, Polls I, Dettmers JM (2011) The Chicago Sanitary and ShipCanal Aquatic Nuisance Species Dispersal Barrier. In: ChapmanDC, Hoff MH (eds) Invasive Asian carps in North America. AmFish Soc Symp 74, Bethesda, pp 121–138
Opuszynski K (1981) Comparisons of the usefulness of the silver carpand the bighead carp as additional fish in carp ponds. Aquacul-ture 25:223–233
Orazio C, Chapman D, May T, Meadows J, Echols K, Walther M (2006)Contaminant levels in bighead and silver Asian carps, MissouriRiver at Easley Missouri, 2005. www.ifishillinois.org/asiancarp/posters/orazio_contaminants.pdf. Accessed 8 November 2012
Rice CP, Chernyak SM, Begnoche L, Quintal R, Hickey J (2002)Comparisons of PBDE composition and concentration in fishcollected from the Detroit River, MI and Des Plaines River, IL.Chemo 49:731–737
Rogowski DL, Soucek DJ, Levengood JM, Johnson SR, Chick JH,Dettmers JM, Pegg MA, Epifanio JM (2009) Contaminantconcentrations in Asian carps, invasive species in the Mississippiand Illinois rivers. Environ Monit Assess 157:211–222
Sall J, Lehman A (1996) JMP Start Statistics, SAS Institute. DuxburyPress, Belmont
Sass GG, Cook TR, Irons KS, McClelland MA, Michaels NN, O’HaraTM, Stroub MR (2010) A mark-recapture population estimatefor invasive silver carp (Hypophthalmichthys molitrix) in the LaGrange Reach, Illinois River. Biol Invas 12:433–436
Sinclair E, Mayack DT, Roblee K, Yamashita N, Kannan K (2006)Occurrence of perfluoroalkyl surfactants in water, fish, and birdsfrom New York state. Arch Environ Contam Tox 50:398–410
Taniyasu S, Kannan K, Horii Y, Hanari N, Yamashita N (2003) Asurvey of perfluorooctane sulfonate and related perfluorinatedorganic compounds in water, fish, birds, and humans from Japan.Environ SciTech 37:2634–2639
Tetra Tech Inc (2010) Illinois River (Peoria Area) TMDL and LRSDevelopment: Watershed Characterization and Source Assess-ment Report (Stage 1). Review draft.http://www.idaillinois.org/cdm/fullbrowser/collection/edi/id/526081/rv/compoundobject/cpd/526086. Accessed 9 March 2013
US EPA (2012) Toxics Release Inventory. http://www.epa.gov/tri/index.htm. Accessed 3 Dec 2012
Yang F, Wilcox B, Jin S, Aguirre AA, Rougee L, Xu Y, Lu Y (2008)Detection and quantitative analysis of polychlorinated biphenylsin tilapia from Hawaiian waters. Chemosphere 73:133–137
Ye X, Strynar MJ, Nakayama SF, Varns J, Helfant L, Lazorchak J,Lindstrom AB (2008a) Perfluorinated compounds in whole fishhomogenates from the Ohio, Missouri, and Upper Mississippirivers, USA. Environ Poll 156:1227–1232
Ye X, Schoenfuss HL, Jahns ND, Delinsky AD, Strynar MJ, Varns J,Nakayama SF, Helfant L, Lazorchak J, Lindstrom AB (2008b)Perfluorinated compounds in common carp (Cyprinus carpio)fillets from the Upper Mississippi River. Environ Int 34:932–938
1182 J. M. Levengood et al.
123

Fisheries • Vol 38 No 10 • October 2013 • www.fisheries.org 445
FEATURE
Prospects for Fishery-Induced Collapse of Invasive Asian Carp in the Illinois River
Prospectos de un colapso inducido por pesca en la carpa asiática del Río IllinoisRESUMEN: . La carpa asiática amenaza con invadir el Lago Michigan a través del sistema de vías acuáticas del área de Chicago, lo cual podría acarrear serias consecuen-cias en las tramas tróficas de los grandes lagos. Además de los esfuerzos llevados a cabo para impedir el ingreso de estos peces al Lago Michigan mediante barreras eléctricas, el estado de Illinois ha iniciado un programa de pesca en el Río Illinois, cuya finalidad es reducir la densidad po-blacional a través de una pesca comercial intensiva. En este estudio se exploran los prospectos de un colapso de la carpa asiática por medio de un régimen de pesca inten-siva. Sobre la base de un meta-análisis de datos demográfi-cos, se desarrolla un modelo de simulación dinámica para comparar el desempeño de estrategias de explotación tanto reales como alternativas para el Río Illinois. Las proyec-ciones del modelo sugieren que, de mantenerse las tasas de captura por debajo de 0.7 o si la pesca continua siendo selectiva a tallas (dirigiéndose a peces >500 mm o <500 mm) o a especies (carpa cabezona), entonces es poco prob-able colapsar la carpa asiática en el Río Illinois, aunque la biomasa se puede reducir considerablemente. Se argu-menta que, pese a lo anterior, es posible lograr el nivel de esfuerzo pesquero predicho por el modelo, necesario para colapsar las poblaciones de la carpa asiática, si la pesca comercial se expande y se combina con incentivos económicos con tal de mejorar la selectividad a la talla y a las especies objetivo.
Iyob Tsehaye and Matthew CatalanoQuantitative Fisheries Center, Department of Fisheries and Wildlife, Michigan State University, East Lansing, MI
Greg SassIllinois River Biological Station, Illinois Natural History Survey, Havana, IL
David GloverCenter for Fisheries, Aquaculture, & Aquatic Sciences, Southern Illinois University, Carbondale, IL
Brian RothDepartment of Fisheries and Wildlife, Michigan State University, 480 Wilson Road, Room 13 Natural Resources Building, East Lansing, MI 48824. E-mail: [email protected]
ABSTRACT: Invasive Asian Carp are threatening to enter Lake Michigan through the Chicago Area Waterway System, with potentially serious consequences for Great Lakes food webs. Alongside efforts to keep these fishes from entering Lake Michigan with electric barriers, the state of Illinois initiated a fishing program aimed at reducing their densities through intensive commercial exploitation on the Illinois River. In this study, we explore prospects for the “collapse” of Asian Carp in the Illinois River through intensive fishing. Based on a meta-analysis of demographic data, we developed a dynamic simulation model to compare the performance of existing and alternative removal strategies for the Illinois River. Our model projections suggest that Asian Carp in the Illinois River are un-likely to collapse if existing harvest rates are kept below 0.7 or fishing continues to be size selective (targeting only fish >500 mm or <500 mm) or species selective (targeting mostly Bighead Carp), although their biomasses could be greatly reduced. We argue that it would still be possible to achieve fishing effort targets predicted by our model to collapse the Asian Carp popu-lations if efforts to expand commercial fishing are combined with economic incentives to improve size selectivity and species targeting.
INTRODUCTION
Invasive species have long been recognized as a major cause of decline of native freshwater species and loss of bio-diversity worldwide, with biological invasions and associated economic and ecological effects growing annually (Vitousek et al. 1997; Lodge et al. 2006; Jelks et al. 2008). At current invasion rates, nonnative species are predicted to have the most adverse effects on biodiversity in freshwater ecosystems in the next century (Sala et al. 2000). Given the serious threat that biological invasions pose to ecosystem structure and func-tion, management agencies have developed control programs
to reduce abundance or limit spread of invasive species into new systems (Lodge et al. 2006; Keller et al. 2007, 2008). For example, the National Park Service has developed a Lake Trout (Salvelinus namaycush) suppression program in Yellowstone Lake with the aim to rehabilitate native Cutthroat Trout (On-corhynchus clarkii bouvieri; Syslo et al. 2011). Similarly, the Great Lakes Fishery Commission has implemented a binational integrated pest management program in the Great Lakes to con-trol invasive Sea Lamprey (Petromyzon marinus), thereby al-lowing recovery of native fishes impaired by their predation (Jones et al. 2009). Because future biological invasion rates are predicted to increase (Lodge et al. 2006), similar large-scale re-movals of invasive species are likely to be considered for many other ecosystems (Kolar and Lodge 2002).
With many of its native populations already imperiled by nonnative species, the Laurentian Great Lakes face a new threat of invasion from Bighead Carp (Hypophthalmichthys nobilis) and Silver Carp (H. molitrix), highly efficient filter-feeding species collectively known as Asian Carp (Chapman and Hoff

Fisheries • Vol 38 No 10 • October 2013• www.fisheries.org 446
2011). In light of evidence of global Asian Carp introductions leading to decreased fish diversity and abundances, an Asian Carp invasion of the Great Lakes is feared to adversely affect native populations, with potentially serious consequences for aquatic food webs and a fishing industry valued at $7 billion annually (Schrank et al. 2003; Irons et al. 2007; Southwick As-sociates, Inc. 2008; Sampson et al. 2009). Asian Carp were first introduced into North America in the early 1970s to control algae in aquaculture and municipal wastewater treatment facili-ties (Kelly et al. 2011). Shortly thereafter, they escaped confine-ment and established naturally reproducing populations in the Mississippi River (Chick and Pegg 2001). Since that time, their abundance has increased exponentially, and both species have migrated up the Mississippi River and its tributaries (Sass et al. 2010; Chapman and Hoff 2011; Irons et al. 2011). There are now dense populations of both species throughout the Illinois River, threatening to enter Lake Michigan through the Chicago Area Waterway System (Cooke and Hill 2010; Sass et al. 2010; Cudmore and Mandrak 2011).
Given political resistance to closure of navigation locks on the Chicago Area Waterway System, management agencies are trying to prevent invasion of the Great Lakes by Asian Carp with electric barriers built on the Chicago Sanitary and Ship Canal (Moy et al. 2011). However, these barriers may not be 100% effective at repelling Asian Carp; traces of environmental DNA have been detected in Lake Michigan, and a live Bighead Carp was captured beyond the barriers in June 2010 (Jerde et al. 2011; Mahon et al. 2011). Along with the use of electric barriers, the state of Illinois has recently developed a fishing program aimed at reducing Asian Carp densities through in-tensive commercial exploitation on the Illinois River, with the ultimate goal being to minimize propagule pressure on the elec-tric barriers (Garvey et al. 2012). Pursuant to this program, the Illinois Department of Commerce and Economic Opportunity signed an agreement in 2010 to export 13.6–22.7 million kg of Asian Carp annually to the People’s Republic of China, where they have more commercial value than in North America (Gar-vey et al. 2012). Although commercial exploitation is expected to lead to a substantial reduction in Asian Carp biomass, the fishing program was developed without adequate understand-ing of Asian Carp population dynamics, which is essentially a prerequisite for the development of an effective fishing policy.
Garvey et al. (2006) performed a yield-per-recruit analysis for Asian Carp in the upper Mississippi River and found that high exploitation rates targeting small (<200 mm) individu-als would be required to reduce abundance by 50%. However, their analysis did not account for density-dependent effects on recruitment and uncertainty in demographic parameters, such as growth and natural mortality. In this study, we obtained im-proved estimates of demographic parameters with reduced un-certainties using a meta-analysis of multiple data sets on key life history characteristics of Asian Carp in the Illinois and middle Mississippi rivers. We then developed a dynamic simulation model to compare the effectiveness of various harvest policies at reducing Asian Carp biomass in the Illinois River. Finally, we explored exploitation rates necessary to “collapse” these
populations and examined how size- and species-selective har-vesting may affect efficacy of these removals.
METHODS
Population Dynamics
We assessed the population dynamics of Silver (SC) and Bighead Carp (BC) using hierarchical Bayesian meta-analyses of life history data collected from the Illinois and middle Missis-sippi rivers. The data were obtained from all known published and unpublished studies of SC and BC population dynamics in these systems (Table 1). The life history characteristics exam-ined were longevity, natural mortality, growth, maturity, and the strength of compensatory density dependence in recruitment.
Longevity was assumed to be the age of the oldest indi-vidual in our data, which were derived from pectoral fin spine readings. Natural mortality (M) rates were estimated using four methods, including catch curve analysis (Chapman and Robson 1960) and three empirical methods relating natural mortality to demographic and/or environmental parameters (Pauly 1980; Hoenig 1983; Jensen 1996). Growth parameters (L∞, K, t0, σ
2) were estimated by fitting hierarchical Bayesian von Bertalanffy growth models to individual length–age data from eight studies for each species, with study treated as a random effect:
( ) iataK
iiaiiieLL ,)(
,,,01 ε−= −−
∞ , (1)
where L∞,i is the asymptotic length (mm) for study i, with each study representing a unique combination of investigator, year, and location; Ki is the growth coefficient, t0,i is the time at zero length; and εa,i are age- and study-specific random errors rep-resenting individual variation in length at age. We assumed that L∞,i and Ki were independent and log-normally distributed across studies. For both parameters, we assumed uninforma-tive log-normal priors (mean = 0; σ2 = 1.0 × 10⁶). The data sets we used were uninformative on t0 because few observations of age-1 fish existed, and Asian Carp grow rapidly in their first year. This lack of information resulted in unrealistically high L∞ and unrealistically low K estimates. Thus, we allowed an informative prior on t0,i. The prior was based on the mean and variance of estimates found on fishbase.org (SC: n = 6, mean = −0.067 years, σ = 0.027; BC: n = 5, mean = 0.042, σ = 0.049), which were mostly from studies within the native range of these species. Probability of maturity (mi) was estimated as a func-tion of fish length by fitting Bayesian binomial logit models to pooled female SC and BC maturity data from three studies conducted in the Illinois River:
ii LCCm 10)(logit += , (2)
where Li is the observed total length (mm) of a female fish i, C0 is the intercept, and C1 is the slope. Length at 50% maturity was determined as −C0/C1. Observed maturity (1 = mature, 0 = immature) was determined from macroscopic visual inspection and the gonadosomatic index (100 × Ovary weight/Ovary-free

Fisheries • Vol 38 No 10 • October 2013 • www.fisheries.org 447
fish weight). Females were assumed mature if the gonadoso-matic index exceeded 1%, a cutoff consistent with macroscopic observations on a subset of individuals. Our analysis was based on data collected from May to August because BC gonads be-come very small in winter and hence are difficult to detect. Pooled data were used for maturity analysis because only three studies were available and few observations of immature fish existed for two of the data sets. All Bayesian models (growth, maturity, and catch curve) were fit using Markov chain Monte Carlo simulation using a Gibbs sampler as implemented in WinBUGS (Spiegelhalter et al. 2004). Posterior distributions of parameters were assessed after 500,000 Markov chain Monte Carlo samples and a burn-in period of 20,000, with a thinning interval of 100 samples. Convergence was assessed with the Gelman-Rubin statistic and by inspecting trace plots.
The strength of compensatory density dependence in re-cruitment is typically assessed by fitting stock–recruitment relationships to recruit and spawner abundance data. How-ever, data on BC and SC in the Illinois and Mississippi rivers were not sufficient to estimate stock–recruitment relationships. Therefore, we obtained estimates of Ricker’s stock–recruitment (Ricker 1954) parameters for SC and BC based on the strength of compensatory density dependence in recruitment drawn from a published meta-analysis of stock–recruit data from 208
Table 1. Summary of data sets used for analyses of Silver and Bighead Carp life history parameters. Each data set represents a unique combi-nation of investigator, year, and river reach. River abbreviations are as follows: IR = Illinois River, MMR = Middle Mississippi River. The sample size (N; number of fish examined) is indicated for each study.
Species Analyses Investigator Year River (reach) N
SC Growth and natural mortality 1 2004 IR (Alton) 26
1 2005 IR (Alton) 49
2 2010 IR (Alton) 102
2 2010 IR (La Grange) 287
2 2010 IR (Peoria) 233
2 2010 IR (Starved Rock) 14
4 2007 IR (La Grange) 145
5 2003 MMR (Pool 27) 147
Maturity 3 2008 IR (La Grange) 187
1 2004 IR (Alton) 31
1 2005 IR (Alton) 20
BC Growth and natural mortality 1 2004 IR (Alton) 78
1 2005 IR (Alton) 78
6 1998 MMR (Pool 27) 32
6 1999 MMR (Pool 27) 4
2 2010 IR (Peoria) 2
1 2004 MMR (Pool 27) 2
6 1998 MMR (Pool 26) 12
6 1999 MMR (Pool 26) 8
Maturity 3 2008 IR (La Grange) 80
1 2004 IR (Alton) 81
1 2005 IR (Alton) 33
Investigators: 1. K. Baerwaldt, unpublished, Southern Illinois University; 2. D. Glover and J. Garvey, unpublished, Southern Illinois University (Garvey et al. 2012); 3. E. Trone, unpublished, Illinois River Biological Station, Illinois Natural History Survey; 4. LTRMP, Illinois River Biological Station, Illinois Natural History Survey (USGS 2012); 5. C. Williamson and D. Garvey (Williamson and Garvey 2005); 6. M. Nuevo, R. J. Sheehan and P. S. Wills (Nuevo et al. 2004).
commercially exploited fish stocks (Myers et al. 1999). More specifically, stock–recruitment parameters for SC and BC were calculated using empirical relationships that predict Ricker stock–recruitment parameters from maximum lifetime repro-ductive rate ( ) adjusted for the expected lifetime spawner bio-mass per recruit of a population at carrying capacity (unfished) equilibrium (Walters and Martell 2004). Probability distribu-tions of stock–recruitment parameters were obtained by calcu-lating Ricker’s α and β for each of the maximum reproductive rates drawn by sampling with replacement (i.e., bootstrapping) from the meta-analysis estimates of for the 208 species. A measure of interannual recruitment variation ( ) and associ-ated uncertainty was obtained by resampling with replacement from meta-analysis estimates of for 54 commercially ex-ploited marine fish stocks (Goodwin et al. 2006).
Simulation Model
To evaluate the performance of alternative exploitation rates at achieving removal targets, we constructed an age-struc-tured dynamic simulation model that forecasted biomass and harvest of SC and BC over a 25-year time horizon in the Illinois River under different fishing scenarios. We used 10% of un-fished biomass as a removal target, below which the population was considered to have collapsed (Worm et al. 2009). At 10%
2Rσ
2Rσ
α
α

Fisheries • Vol 38 No 10 • October 2013• www.fisheries.org 448
of unfished biomass, recruitment is presumed to be severely reduced, and a population would no longer play a substantial ecological role (Worm et al. 2009).
Numerical recruitment to the first age-class was generated separately for each species from a Ricker stock–recruitment re-lationship, which included stochasticity to allow for interannual recruitment variation. The average unfished recruitment was set at an arbitrary value of 1.0 because (1) the absolute magnitude of abundance for these species was unknown for the Illinois River and (2) population scaling was not relevant to our analysis because we evaluated the effects of proportional removals on relative changes in biomass. For each species, numbers at age after recruitment were calculated over time using an accounting equation of the form:
)1(,1,1 UveNN aM
tata −= −++ , (3)
where e−M is survival in the absence of fishing mortality, va is age-specific vulnerability to fishing, and U is time-invariant annual exploitation rate. Biomass at age was obtained by mul-tiplying abundances by an estimate of mean individual mass at age, which was calculated as a power function of length at age obtained from the literature (Irons et al. 2007).
By incorporating U and va into the accounting equation, the simulation model allowed us to evaluate changes to the Asian Carp populations under different combinations of (a) exploita-tion rates (0.5 to 0.9 in 0.1 increments) and (b) vulnerability schedules (all size classes fully targeted by the fishery, only fish >500 mm targeted or only fish <500 mm targeted). We assumed that vulnerability of each species to harvest was determined solely by their respective length at age relative to the target size threshold (i.e., 500 mm) and not by any other inherent charac-teristic of the species (e.g., locations relative to fishing areas, commercial value). Populations of both species were modeled separately over time and aggregate Asian Carp biomass was cal-culated by summation. Initial species composition was assumed to be 82% SC and 18% BC based on their relative biomasses in the 2006–2010 collections of the Long Term Resource Monitor-ing Program (LTRMP; U.S. Geological Survey 2012) from the La Grange Reach of the Illinois River and Pool 26 of the Missis-sippi River. Finally, because no data existed to inform whether current population size has reached equilibrium or what current Asian Carp population size is relative to system carrying capac-ity, we evaluated population responses to fishing assuming that initial (i.e., current; 2012) Asian Carp biomass was (a) already at carrying capacity equilibrium; (b) 75% of carrying capac-ity equilibrium; and (c) 50% of carrying capacity equilibrium. The most recent biomass estimates from the three lower reaches (Peoria, La Grange, and Alton) of the Illinois River were 1,075 MT (95% confidence interval = 950–1,200 MT) for SC and 338 MT (95% confidence interval = 298–377 MT) for BC based on over 3,423 km of hydroacoustics transects, which represented about 0.39% of total river volume (Garvey et al. 2012).
We accounted for uncertainty in Asian Carp population dynamics when evaluating the performance of alternative har-
vest strategies by repeating the 25-year simulations for 1,000 combinations of (a) stock–recruitment parameters, (b) maturity, (c) natural mortality, and (d) growth parameters, which were taken from the Bayesian posterior distributions or bootstrapped samples of parameters from the demographic analyses and lit-erature values. For each of the 1,000 simulated time series, we computed proportional change in biomass by dividing initial biomass (i.e., year 1) by the final biomass (i.e., year 25). The distribution of proportional biomass change across the 1,000 simulations was evaluated for each fishing scenario. The prob-ability of collapse was then computed as the percentage of simulations in which final biomass was less than 10% of the initial. For each fishing scenario, we visually inspected time series plots of biomass to determine the number of years needed to cause population collapse.
Data from LTRMP suggest that SC constitute a larger pro-portion of Asian Carp biomass in the Illinois River (Sass et al. 2010). Therefore, in the absence of species-selective fishing, the response to fishing of the aggregate Asian Carp population is expected to more closely resemble the SC response to fishing. However, harvest data from the Illinois Department of Natu-ral Resources suggest that existing fish targeting strategies are more selective toward BC than SC, with BC catches compris-ing nearly 90% of current commercial harvest of Asian Carp (Irons et al. 2007). The preference for BC may be due to their larger size, easier capture (i.e., trammel netting and gill netting), or perhaps a higher value. Thus, to mimic existing fisheries, we ran an additional set of simulations assuming that BC of a given age were twice as vulnerable to existing fishing methods compared to SC. These scenarios allowed for an evaluation of the efficacy of commercial removals if current species targeting practices persisted into the future.
RESULTS
Population Dynamics
Maximum age (longevity) estimates of wild SC and BC from outside of North America suggest that these species can reach ages of 7 to 16 years (Johal et al. 2001; Kolar et al. 2007). Despite sufficient time since colonization (late 1980s–early 1990s), the oldest fish observed in our data set were 7 years old for both species, which is close to the maximum observed age from the Mississippi River basin (Schrank and Guy 2002; Nuevo et al. 2004; Williamson and Garvey 2005). Although pectoral fin spine readings may have underestimated maximum age, this would have a minimal effect on our estimates of popu-lation dynamics parameters. Other life history parameter esti-mates differed between the two species (Table 2). SC reached a smaller asymptotic length than BC, but both species approached asymptotic length at nearly the same rate (Table 2). BC reached maturity at a larger size than SC, with their length at 50% matu-rity much higher than that for SC (Table 2). Differences in size at maturity and length at age resulted in substantial differences in maturity at age between the two species. We estimated that 38% (±20%) of age-2 and 61% (±20%) of age-3 SC were ma-ture, whereas 3% (±4%) of age-2 and 21% (±15%) of age-3 BC

Fisheries • Vol 38 No 10 • October 2013 • www.fisheries.org 449
Table 2. Growth and maturity parameter and natural mortality estimates (and associated uncertainties) from meta-analyses of Bighead and Sil-ver Carp population dynamics in the Illinois and Middle Mississippi Rivers.
Species Analysis Variable Expected value Median Lower 95% confidence interval Upper 95% confidence interval SE
SC Growth L∞ 802.826 793.700 628.663 1,020.050 98.150
K 0.445 0.435 0.255 0.702 0.109
t0 −0.230 −0.232 −0.351 −0.115 0.062
σl 0.103 0.103 0.098 0.107 0.002
Maturity C0 −6.226 −6.104 −9.158 −3.734 1.410
C1 0.011 0.011 0.008 0.016 0.002
L50% 545.341 548.399 483.881 590.915 27.452
Natural mortality M 0.684 0.654 0.298 1.258 0.255
Pauly 0.363 0.310 0.093 0.930 0.226
Hoenig 0.733 0.652 0.243 1.642 0.402
Jensen 0.667 0.652 0.383 1.053 0.164
CC 0.984 0.975 0.778 1.241 0.121
Length–weight a* 5.082 × 10⁻⁶ NA NA NA NA
b* 3.122 NA NA NA NA
Stock–recruitment α 19.152 6.716 0.605 128.51 45.940
β 2.829 1.313 0.181 17.205 5.582
BC Growth L∞ 982.938 983.250 890.170 1,086.025 49.071
K 0.433 0.418 0.304 0.668 0.087
t0 −0.015 −0.012 −0.202 0.178 0.097
σl 0.104 0.103 0.094 0.115 0.005
Maturity C0 −15.859 −15.770 −21.762 −10.290 2.902
C1 0.020 0.020 0.013 0.028 0.004
L50% 784.562 785.749 762.082 802.780 10.454
Natural mortality M 0.654 0.631 0.293 1.244 0.239
Pauly 0.333 0.281 0.093 0.868 0.203
Hoenig 0.723 0.632 0.236 1.653 0.396
Jensen 0.650 0.626 0.456 1.001 0.131
CC 0.885 0.875 0.680 1.110 0.114
Length–weight a* 1.452 × 10⁻⁵ NA NA NA NA
b* 2.952 NA NA NA NA
Stock–recruitment α 21.476 6.035 0.538 121.422 119.224
β 3.272 1.333 0.190 14.897 16.797
Both Recruitment σR † 0.542 0.500 0.230 1.240 0.233
Parameter symbols: L∞ = asymptotic length; K = growth coefficient; t0 = time at zero length; σl = standard deviation in length at age (log scale); C0 = maturity inter-cept; C1 = maturity slope; L50% = length at 50% maturity (−C0/C1); M = instantaneous natural mortality rate (average of four methods); a = length–weight coefficient; b = length–weight exponent; α = initial slope of Ricker stock–recruitment relationship; β = density-dependent parameter of stock–recruitment relationship; σR = standard deviation of recruitment variability (log scale). *Irons et al. (2007)†Goodwin et al. (2006)

Fisheries • Vol 38 No 10 • October 2013• www.fisheries.org 450
were mature. Instantaneous natural mortality rate, given as an average of estimates from the four methods, did not vary much between the two species (Table 2). Given these estimates of mortality, maturity, and von Bertalanffy growth parameters for each species, median Ricker parameters were estimated at α = 6.716 and β = 1.313 for SC and α = 6.035 and β = 1.333 for BC.
Population Response to Fishing
Although population responses to fishing were predicted to be highly variable due to high uncertainty in life history pa-rameters for both species (especially in stock–recruitment pa-rameters), underlying trends were evident. In general, model predictions indicated that exploitation rates must be maintained at considerably high levels to collapse the aggregate Asian Carp population. However, higher exploitation rates are required to cause the SC population to collapse, which is attributable to
their earlier maturity and smaller length at age, resulting in lower overall vulnerability to fishing in the size-selective sce-narios (Figure 1). When all age classes were assumed to be fully vulnerable to harvest, the SC and BC populations had a 60% and 68% probability of collapse at exploitation rates of 0.7 and 0.6, respectively (Figure 1), and the aggregate population had a 65% probability of being reduced to 10% or less of its ini-tial biomass at an exploitation rate of 0.7. Under size-selective harvesting that targeted either small (<500 mm) or large (>500 mm) Asian Carp, both populations were less likely to collapse at an exploitation rate of 0.7, with the probability of collapse for the aggregate population estimated at 25% (Figure 1). Given the relative body sizes of SC and BC, targeting smaller fish was predicted to have stronger effects on SC than BC. With initial biomasses below carrying capacity, both SC and BC popula-tions would continue to increase if subjected to low levels of exploitation targeting only small or large fish (e.g., when only
Figure 1. Proportions (median, first, and third quartiles) of initial biomass remaining at year 25 for Silver Carp, Bighead Carp, and the aggregate Asian Carp population in the Illinois River as a function of exploitation rate under different vulnerability schedules (all size classes fully targeted, only fish >500 mm targeted and only fish <500 mm targeted) and assumptions of current population size relative to population size at carrying capacity (popu-lation at carrying capacity equilibrium, eql; population at 75% of carrying capacity equilibrium, 75% of eql; and population at 50% of carrying capacity equilibrium, 50% of eql).

Fisheries • Vol 38 No 10 • October 2013 • www.fisheries.org 451
initial harvesting), with biomass stabilizing in subsequent years (Figure 3).
DISCUSSION
Previous studies based on the LTRMP and fishery-depen-dent data suggest that both Asian Carp populations in the Il-linois River have increased considerably in recent years (Chick and Pegg 2001; Sass et al. 2010; Irons et al. 2011). The SC pop-ulation has experienced exponential growth since 2000, with the subadult and adult population size in the La Grange Reach of the Illinois River estimated at 2,500 fish per kilometer river length in the late 2000s (Sass et al. 2010). Although information
Figure 2. Proportions (median, first, and third quartiles) of initial biomass remaining at year 25 for Silver Carp, Bighead Carp, and the aggregate Asian Carp population in the Illinois River as a function of exploitation rate, assuming all size classes were equally targeted, but Bighead Carp are twice as vulnerable to existing fishing methods as Silver Carp, and under different assumptions of current population size relative to population size at carrying capacity equilibrium (population at carrying capacity equilibrium, eql; population at 75% of carrying capacity equilibrium, 75% of eql; and population at 50% of carrying capacity equilibrium, 50% of eql). (Note that all exploitation rates are in relation to aggregate population size, not individual population size; initial species composition was 82% Silver Carp and 18% Bighead Carp.)
Figure 3. Silver and Bighead Carp biomass trajectories (median, first, and third quartiles) under different levels of exploitation rate (U; 0.5, 0.7, and 0.9), assuming all sizes were fully vulnerable to fishing.
fish >500 mm were targeted and U = 0.5; Figure 1). If all sizes were assumed fully targeted, both populations would decrease from their initial biomasses irrespective of assumptions of ini-tial population size relative to carrying capacity.
Our results indicated that even at an exploitation rate that would collapse the BC population with a probability of almost 100%, the aggregate Asian Carp biomass could on average be reduced to at most 50% of the initial biomass, with probability of collapse less than 25% (Figure 2). Although predicted popu-lation responses to fishing varied between the two species, bio-mass projections indicated that the largest population responses to fishing occurred during the first few years (1–5 years after

Fisheries • Vol 38 No 10 • October 2013• www.fisheries.org 452
on population growth of BC is limited, Illinois commercial har-vest of this species suggests exponential population growth since the 1990s (Irons et al. 2007). With the exception of infor-mation on body condition of adult Asian Carp (mass at length) being lower than historically reported (Garvey et al. 2012), no data existed to inform what current Asian Carp population size might be relative to system carrying capacity. Thus, unless an effective control program is put in place, it is possible that Asian Carp densities in the Illinois River will continue to increase and raise the threat of invasions of the Great Lakes.
Although operating models have been used for several ex-ploited fish stocks to develop policies that objectively account for uncertainty in key fishery parameters (Walters and Martell 2004), few invasive species control programs have followed a model-based evaluation of alternative removal strategies. In this study, we developed a simulation model for SC and BC that explicitly accounted for uncertainty in key demographic parameters when comparing the performance of alternative harvest polices at reducing Asian Carp biomass in the Illinois River. Based on our model predictions and evidence of Asian Carp collapse elsewhere, including in their native Yangtze River (Li et al. 1990), we argue that it may be possible to collapse the SC and BC populations in the Illinois River if efforts to expand commercial fishing of Asian Carp are combined with economic incentives to capture a wider range of fish sizes and increase targeting of SC. Our predictions showed that targeting all size classes of Asian Carp was the most effective strategy at achieving removal targets, which is consistent with results from the equilibrium yield-per-recruit analysis by Garvey et al. (2006). Although our simulation results suggested that target-ing only small or large individuals would decrease the prob-ability of achieving removal targets, size-selective fishing is the strategy that is most likely to be implemented in practice; indeed, targeting larger-sized Asian Carp is the strategy that has been proposed by the commercial fishing industry (Garvey et al. 2012). Small Asian Carp are less desirable because of their lower commercial value under current market conditions. In addition, harvest of smaller individuals could be economically less viable due to higher rates of bycatch and fouling in the smaller-mesh gears used to catch these sizes. Thus, to improve the effectiveness of existing fishing practices, strong economic incentives will be required to encourage less size-selective fish-ing. Economic incentives to target small fish may come from increased use of Asian Carp for fish meal, liquid fertilizer, and/or fish oil products. To test the effectiveness of such a strategy, Southern Illinois University actually initiated a pilot fishing program encouraging fishers by providing monetary incentives to harvest up to 1.36 million kg of Asian Carp of all sizes to be converted to fish meal (Garvey et al. 2012). Similar to our sug-gestions for improving Asian Carp removals from the Illinois River, changing the size selectivity of fishing was also recom-mended to increase the efficacy of Lake Trout suppression strat-egies in Yellowstone Lake, where targeting mature Lake Trout or undeveloped embryos was predicted to yield better outcomes (Syslo et al. 2011).
Due to their higher reproductive rate and larger population size, a higher exploitation rate would be required to achieve de-sired removal targets for SC than for BC. Thus, continued con-centration of fishing effort on BC (for their market value or ease of capture) will undermine the prospects for achieving desired removal targets. Therefore, just as for improving size selectivity of fishing, the stronger economic incentive to target BC needs to be reversed to achieve the level of fishing effort needed to collapse the aggregate Asian Carp population, possibly through offering incentives to harvest more SC. Overall, the species- and size-selective nature of existing Asian Carp fisheries highlights the need to realign economic incentives with fishery manage-ment goals to improve the prospects for the collapse of Asian Carp in the Illinois River.
Though our Asian Carp simulation model could serve as a valuable management tool for simulating the consequences of management decisions for SC and BC removals from the Illinois River, the process of evaluating population responses to fishing could also help identify areas of critical uncertainty in the population dynamics and/or fisheries of Asian Carp. For example, our analysis showed that recruitment dynamics were a critical source of uncertainty in predicting Asian Carp popula-tion responses to fishing. Only one study to date has published a stock–recruitment relationship for Asian Carp (Hoff et al. 2011). However, the Hoff et al. (2011) study was based entirely on catch-per-effort data, which cannot be used directly for assess-ing recruitment dynamics without knowledge of differences in catchability among adults and recruits. It was for this reason that we employed a literature-based approach to obtain estimates of Ricker stock–recruitment parameters. Unsurprisingly, our ap-proach resulted in a high degree of uncertainty, which appro-priately reflected our level of understanding of the recruitment dynamics of these species in the Mississippi River basin.
Finally, though our population model could already be used to develop effective removal policies for the Illinois River, it could also be readily adapted to allow for the development of temporally or spatially explicit fishing policies by incorporating information on temporal and spatial distribution of Asian Carp in the river. While information on spatial distribution of Asian Carp could allow managers to improve the efficacy of existing removal strategies by directing fishing and other control efforts toward areas of fish aggregations, data on interannual variabil-ity in fish abundance could be used to vary fishing effort sea-sonally in order to improve removal impacts. Indeed, there are ongoing studies to gather information on the spatial and tem-poral distributions of Asian Carp in the Illinois River, includ-ing hydroacoustic and telemetry studies to quantify Asian Carp movement from the adjacent Mississippi River into the Illinois River and reconstruct their interannual patterns of distribution (DeGrandchamp et al. 2008; Garvey et al. 2012). By allowing us to evaluate the effectiveness of various harvest location and timing scenarios, such additional information from recent and ongoing studies could be used to develop more refined removal policies, thereby improving the prospects for the collapse of Asian Carp in the Illinois River.

Fisheries • Vol 38 No 10 • October 2013 • www.fisheries.org 453
ACKNOWLEDGMENTS
This study was supported by funding through Cooperative Agreement No. 30181AJ071 between the U.S. Fish and Wild-life Service and the Illinois Department of Natural Resources. We acknowledge additional financial support from the Fisheries and Illinois Aquaculture Center, Southern Illinois University, Carbondale, through J. Garvey and from the Quantitative Fish-eries Center, Michigan State University, through M. Jones and J. Bence. We are grateful to K. Baerwaldt, J. Garvey, and E. Trone for making available their Asian Carp life history data from the Illinois and Middle Mississippi rivers. This is manu-script 2013-09 of the Quantitative Fisheries Center at Michigan State University.
REFERENCES
Chapman, D. G., and M. H. Hoff. 2011. Invasive Asian Carps in North America. American Fisheries Society, Bethesda, Maryland.
Chapman, D. G., and D. S. Robson. 1960. The analysis of a catch curve. Biometrics 16:354–368.
Chick, J. H., and M. Pegg. 2001. Invasive Carp in the Mississippi River Basin. Science 292:2250–2251.
Cooke, S. L., and W. R. Hill. 2010. Can filter-feeding Asian Carp in-vade the Laurentian Great Lakes? A bioenergetic modeling exer-cise. Freshwater Biology 55:2138–2152.
Cudmore, B., and N. E. Mandrak. 2011. Assessing the biological risk of Asian Carps to Canada. Pages 15–30 in D. C. Chapman and M. H. Hoff, editors. Invasive Asian Carps in North America. American Fisheries Society, Bethesda, Maryland.
DeGrandchamp, K., J. Garvey, and R. Colombo. 2008. Movement and habitat selection by invasive Asian Carps in a large river. Transac-tions of the American Fisheries Society 137:45–56.
Garvey, J. E., K. L. DeGrandchamp, and C. J. Williamson. 2006. Growth, fecundity, and diets of Asian Carps in the Upper Missis-sippi River system. U.S. Army Corps of Engineer Research and Development Center, ANSRP Technical Notes Collection (ERDC/EL ANSRP-06), Vicksburg, Mississippi.
Garvey, J. E., G. G. Sass, J. Trushenski, D. Glover, P. M. Charlebois, J. Levengood, B. Roth, G. Whitledge, B. C. Small, S .J. Tripp, and S. Secchi. 2012. Fishing down the Bighead and Silver carps: re-ducing the risk of invasion to the Great Lakes. Project completion report. U.S. Fish and Wildlife Service and Illinois Department of Natural Resources.
Goodwin, N. B., A. Grant, A. L. Perry, N. K. Dulvy, and J. D. Reyn-olds. 2006. Life history correlates of density-dependent recruit-ment in marine fishes. Canadian Journal of Fisheries and Aquatic Sciences 63:494–509.
Hoenig, J. M. 1983. Empirical use of longevity data to estimate mortal-ity rates. Fishery Bulletin 82:898–903.
Hoff, M. H., M. A. Pegg, and K. S. Irons. 2011. Management implica-tions from a stock–recruit model for the Bighead Carp in por-tions of the Illinois and Mississippi rivers. Pages 5–14 in D. C. Chapman and M. H. Hoff, editors. Invasive Asian Carps in North America. American Fisheries Society, Bethesda, Maryland.
Irons, K. S., G. G. Sass, M. A. McClelland, and T. M. O’Hara. 2011. Bighead Carp invasion of the La Grange Reach of the Illinois River: insight from the Long Term Resource Monitoring Program. Pages 31–50 in D. C. Chapman and M. H. Hoff, editors. Inva-sive Asian Carps in North America. American Fisheries Society, Bethesda, Maryland.
Irons, K. S., G. G. Sass, M. A. McClelland, and J. D. Stafford. 2007. Reduced condition factor of two native fish species coincident with invasion of non-native Asian carps in the Illinois River, U.S.A. Is this evidence for competition and reduced fitness? Jour-nal of Fish Biology 71:258–273.
Jelks, H. L., S. J. Walsh, N. M. Burkhead, S. Contreras-Balderas, E. Diaz-Pardo, D. A. Hendrickson, J. Lyons, N. E. Mandrak, F. Mc-Cormick, J. S. Nelson, S. P. Platania, B. A. Porter, C. B. Ren-aud, J. J. Schmitter-Soto, E. B. Taylor, and M. L. Warren. 2008. Conservation status of imperiled North American freshwater and diadromous fishes. Fisheries 33:372–407.
Jensen, A. L. 1996. Beverton and Holt life history invariants result from optimal trade-off of reproduction and survival. Canadian Journal of Fisheries and Aquatic Sciences 53:820–822.
Jerde, C. L., A. R. Mahon, W. L. Chadderton, and D. M. Lodge. 2011. “Sight-unseen” detection of rare aquatic species using environ-mental DNA. Conservation Letters 4:150–157.
Johal, M. S., H. R. Esmaeili, and K. K. Tandon. 2001. A comparison of back-calculated lengths of Silver Carp derived from bony struc-tures. Journal of Fish Biology 59:1483–1493.
Jones, M. L., B. J. Irwin, G. J. A. Hansen, H. A. Dawson, A. J. Treble, W. Liu, W. Dai, and J. R. Bence. 2009. An operating model for the integrated pest management of Great Lakes Sea Lampreys. The Open Fish Science Journal 2:59–73.
Keller, R. P., K. Frang, and D. M. Lodge. 2008. Preventing the spread of invasive species: economic benefits of intervention guided by ecological predictions. Conservation Biology 22:80–88.
Keller, R. P., D. M. Lodge, and D. C. Finnoff. 2007. Risk assessment for invasive species produces net bioeconomic benefits. Proceed-ings of the National Academy of Sciences 104:203–207.
Kelly, A. M., C. R. Engle, M. L. Armstrong, M. Freeze, and A. J. Mitchell. 2011. History of introductions and governmental in-volvement in promoting the use of Grass, Silver, and Bighead carps. Pages 163–174 in D. C. Chapman and M. H. Hoff, editors. Invasive Asian Carps in North America. American Fisheries So-ciety, Bethesda, Maryland.
Kolar, C. S., D. C. Chapman, W. R. Courtenay, Jr., C. M. Housel, J. D. Williams, and D. P. Jennings. 2007. Bigheaded Carps: a biological synopsis and environmental risk assessment. American Fisheries Society, Bethesda, Maryland.
Kolar, C. S., and D. M. Lodge. 2002. Ecological predictions and risk assessment for alien fishes in North America. Science 298:1233–1236.
Li, S. F., W. Lu, B. Zhou, M. Xu, and M. Ren. 1990. Status of fisher-ies resources of Silver, Bighead, and Grass carp in the Yangtze River, Pearl River, and Heilongjiang River. Freshwater Fisheries 6:15–20.
Lodge, D. M., S. Williams, H. J. MacIsaac, K. R. Hayes, B. Leung, S. Reichard, R. N. Mack, P. B. Moyle, M. Smith, D. A. Andow, J. T. Carlton, and A. McMichael. 2006. Biological invasions: recom-mendations for U.S. policy and management. Ecological Applica-tions 16:2035–2054.
Mahon, A. R., C. L. Jerde, W. L. Chadderton, and D. M. Lodge. 2011. Using environmental DNA to elucidate the Asian Carp (genus Hy-pophthalmichthys) invasion front in the Chicago Area Waterway System. Integrative and Comparative Biology 51:e1–e157.
Moy, P. B., I. Polls, and J. M. Dettmers. 2011. The Chicago Sanitary and Ship Canal aquatic nuisance species dispersal barrier. Pages 127–137 in D. C. Chapman and M. H. Hoff, editors. Invasive Asian Carps in North America. American Fisheries Society, Bethesda, Maryland.
Myers, R. A., K. G. Bowen, and N. J. Barrowman. 1999. Maximum reproductive rate of fish at low population sizes. Canadian Journal of Fisheries and Aquatic Sciences 56:2404–2419.

Fisheries • Vol 38 No 10 • October 2013• www.fisheries.org 454
Nuevo, M., R. J. Sheehan, and P. S. Wills. 2004. Age and growth of the Bighead Carp Hypophthalmichthys nobilis in the middle Missis-sippi River. Archiv für Hydrobiologie 160:215–230.
Pauly, D. 1980. On the interrelationships between natural mortality, growth parameters, and mean environmental temperature in 175 fish stocks. Journal du Conseil 39:175–192.
Ricker, W. E. 1954. Stock and recruitment. Journal of the Fisheries Research Board of Canada 11:559–623.
Sala, O. E., F. S. Chapin, J. J. Armesto, E. Berlow, J. Bloomfield, R. Dirzo, E. Huber-Sanwald, L. F. Huenneke, R. B. Jackson, A. Kinzig, R. Leemans, D. M. Lodge, H. A. Mooney, M. Oesterheld, N. L. Poff, M. T. Sykes, B. H. Walker, M. Walker, and D. H. Wall. 2000. Global biodiversity scenarios for the year 2100. Science 287:1770–1774.
Sampson, S., J. Chick, and M. Pegg. 2009. Diet overlap among two Asian Carp and three native fishes in backwater lakes on the Il-linois and Mississippi rivers. Biological Invasions 11:483–496.
Sass, G., T. Cook, K. Irons, M. McClelland, N. Michaels, T. M. O’Hara, and M. Stroub. 2010. A mark–recapture population estimate for invasive Silver Carp (Hypophthalmichthys molitrix) in the La Grange Reach, Illinois River. Biological Invasions 12:433–436.
Schrank, S. J., and C. S. Guy. 2002. Age, growth, and gonadal char-acteristics of adult Bighead Carp, Hypophthalmichthys nobilis, in the Lower Missouri River. Environmental Biology of Fishes 64:443–450.
Schrank, S. J., C. S. Guy, and J. F. Fairchild. 2003. Competitive interac-tions between age-0 Bighead Carp and Paddlefish. Transactions of the American Fisheries Society 132:1222–1228.
Southwick Associates, Inc. 2008. Today’s angler. American Sportfish-ing Association, Alexandria, Virginia.
Spiegelhalter, D. J., A. Thomas, N. Best, and D. Lunn. 2004. Win-BUGS User Manual (version 1.4.1). MRC Biostatistics Unit, Cambridge, UK. Syslo, J. M., C. S. Guy, P. E. Bigelow, P. D. Doepke, B. D. Ertel, and T. M. Koel. 2011. Response of non-na-tive Lake Trout (Salvelinus namaycush) to 15 years of harvest in Yellowstone Lake, Yellowstone National Park. Canadian Journal of Fisheries and Aquatic Sciences 68:2132–2145.
Syslo, J. M., C. S. Guy, P. E. Bigelow, P. D. Doepke, B. D. Ertel, and T. M. Koel. 2011. Response of non-native lake trout (Salvelinus namaycush) to 15 years of harvest in Yellowstone Lake, Yellow-stone National Park. Canadian Journal of Fisheries and Aquatic Sciences 68:2132–2145.
U.S. Geological Survey. 2012. Long Term Resource Monitoring Pro-gram–Environmental Management Program (LTRMP-EMP). Available: http://www.umesc.usgs.gov/ltrmp.html. (September 2012).
Vitousek, P. M., C. M. D’Antonio, L. L. Loope, M. Rejmanek, and R. Westbrooks. 1997. Introduced species: a significant component of human-caused global environmental change. New Zealand Jour-nal of Ecology 21:1–16.
Walters, C. J., and S. J. D. Martell. 2004. Fisheries ecology and man-agement. Princeton University Press, Princeton, New Jersey.
Williamson, C. J., and J. E. Garvey. 2005. Growth, fecundity, and diets of newly established silver carp in the Middle Mississippi River. Transactions of the American Fisheries Society 134:1423–1430.
Worm, B., R. Hilborn, J. K. Baum, T. A. Branch, J. S. Collie, C. Costello, M. J. Fogarty, E. A. Fulton, J. A. Hutchings, S. Jen-nings, O. P. Jensen, H. K. Lotze, P. M. Mace, T. R. McClanahan, C. Minto, S. R. Palumbi, A. M. Parma, D. Ricard, A. A. Rosen-berg, R. Watson, and D. Zeller. 2009. Rebuilding global fisheries. Science 325:578–585
From the Archives
I have stated enough to show the prospects before us in the way of increasing, to an almost unlimited degree, the food re-sources of our country, and in rendering the productiveness of our waters, in this respect, superior, acre to acre, to that of land. Of course, time and expenditure of money will be required, but the larger the scale of operations the sooner and more effectually the result will be ac-complished. There is also something still to be done by the United States in the way of extending the area of cultivation of lobsters, crabs, oysters, etc., if not by actual planting on a larger scale, yet by making the necessary experiments and supplying detailed instruction for the work. It is not impossible, indeed, that the great Salt Lake and other interior bodies of saline waters may be made the nurseries of objects such as those men-tioned above.
Spencer F. Baird (1873): National Fish Culture, Transactions of the American Fisheries Society, 2:1, 25-32.

(This is a sample cover image for this issue. The actual cover is not yet available at this time.)
This article appeared in a journal published by Elsevier. The attachedcopy is furnished to the author for internal non-commercial researchand education use, including for instruction at the authors institution
and sharing with colleagues.
Other uses, including reproduction and distribution, or selling orlicensing copies, or posting to personal, institutional or third party
websites are prohibited.
In most cases authors are permitted to post their version of thearticle (e.g. in Word or Tex form) to their personal website orinstitutional repository. Authors requiring further information
regarding Elsevier’s archiving and manuscript policies areencouraged to visit:
http://www.elsevier.com/copyright

Author's personal copy
Research report
Human consumption as an invasive species management strategy.A preliminary assessment of the marketing potential of invasive Asiancarp in the US q
Sarah Varble, Silvia Secchi ⇑Southern Illinois University, Agriculture Building, Mailcode 4410, 1205 Lincoln Drive, Carbondale, IL 62901, USA
a r t i c l e i n f o
Article history:Received 1 August 2012Received in revised form 12 January 2013Accepted 15 January 2013Available online 13 February 2013
Keywords:Fish consumptionConsumer attitudesHealth benefitsEnvironmental awarenessNeophobiaAsian carp
a b s t r a c t
Over the past 20 years, Asian carp have invaded rivers and lakes in the Midwest and southern UnitedStates, with large negative impacts, such as encroachment on the habitat of native fish and mass die-off. They also respond to boat motors by jumping out of the water, which can cause harm to boatersand fishermen. Policymakers in the Great Lakes region between the US and Canada are worried aboutpossible expansion of the Asian carp to their region and its effects on their fishing industry. A potentialsolution to the problem is to harvest Asian carp for human consumption. This study analyzes the resultsof the first national survey on the attitudes of US fish consumers towards Asian carp. We find that this is apotentially promising strategy. Most respondents would be willing to try a free sample of Asian carp andwould be willing to pay for it. Because of the negative connotation attached to carp in general, this figureis encouraging. Creating demand for Asian carp could be a market based, cost-effective solution for aproblem (invasive species) that is typically dealt with through command and control policies, if it is cou-pled with appropriate policies and safeguards to ensure the fish is eventually eradicated and not culti-vated for profit after removal from US rivers and lakes.
� 2013 Elsevier Ltd. All rights reserved.
Introduction
Over the past 20 years, silver carp (Hypophthalmichthys molitrix)and bighead carp (Hypophthalmichthys nobilis), collectively knownas Asian carp, have invaded rivers and lakes in the Midwest andsouthern United States. Their widespread distribution throughoutthe US is shown in Fig. 1. They have had negative impacts on nativefish, such as paddlefish, bigmouth buffalo, and gizzard shad, by di-rectly competing for food and space (Irons, Sass, McClelland, &Stafford, 2007), thus, reducing native fish diversity (Chick & Pegg,2001). Their ability to outcompete native fish results in decreasedfish landings of more profitable native fish for commercial fisher-men, which affects their economic welfare. Asian carp affectrecreationalists through their mass die-offs and propensity to jumpout of the water in response to a boat’s motor (Garvey, Ickes, &
Zigler, 2010). This causes dangerous and unpleasant situationsfor boaters, waterskiers, and recreational fishermen. In addition,their encroachment towards the Great Lakes has led to a federallawsuit initiated by Michigan, Minnesota, Wisconsin, Ohio andPennsylvania against the Metropolitan Water Reclamation Districtof Greater Chicago. The lawsuit would require the Army Corps ofEngineers (a co-defendant) to build physical barriers between theMississippi River and Lake Michigan in order to shut off all accessroutes (Egan, 2010). These states fear damage to a $7 billion fishingindustry if Asian carp move into the Great Lakes (Asian Carp Regio-nal Coordinating Committee, 2012). Though a Federal judge dis-missed the lawsuit on December 3rd 2012, he also noted that hewould reconsider the case if the plaintiffs re-filed under differentgrounds (Flesher & Webber, 2012). Overall, Asian carp have costtax payers millions of dollars and caused unmeasurable damagesto aquatic ecosystems. A potential solution to the problem is toharvest Asian carp for human consumption. Previous carp market-ing research has focused on a specific US state and canned carppreparation (Engle & Kouka, 1995). This study analyzes the resultsof the first national survey on the attitudes of US fish consumerstowards Asian carp.
While Asian carp have continued to increase their abundance,this trend is not common among many other fish species. Chileanseabass, Atlantic cod, orange roughy, flounder and red snapper areonly a few of the numerous fish that have been overfished
0195-6663/$ - see front matter � 2013 Elsevier Ltd. All rights reserved.http://dx.doi.org/10.1016/j.appet.2013.01.022
q Acknowledgements: We thankfully acknowledge funding from the IllinoisDepartment of Natural Resources (IDNR) that made this research possible. Theviews expressed here are those of the authors and do not necessarily reflect those ofthe IDNR. We thank Sylvia Smith, Philippe Parola, Bill Connors, Jerry Bradley at theNeighborhood Coop, Jim Garvey, David Glover and the Fisheries and IllinoisAquaculture Center for help in the formulation of the survey and understanding ofthe Asian carp issue, and three anonymous reviewers for helping us substantiallyimprove the manuscript.⇑ Corresponding author.
E-mail address: [email protected] (S. Secchi).
Appetite 65 (2013) 58–67
Contents lists available at SciVerse ScienceDirect
Appetite
journal homepage: www.elsevier .com/locate /appet

Author's personal copy
according to the Monterey Bay Seafood Watch (Monterey BayAquarium, 2012b). As researchers have touted the benefits of eat-ing fish and a growing world population keeps demanding moreprotein, fish consumption has increased substantially. In the Uni-ted States alone, consumption of edible fish meat has increasedfrom 3.7 billion pounds in 1990 to 4.8 billion pounds in 2010(Van Voorhees & Lowther, 2011), much of which is imported. USimports of edible fishery products in 2010 were worth $14.8 bil-lion. In the US, the expansion in total consumption in the last dec-ade has been mainly due to population growth, with flat per capitaconsumption. Worldwide, however, in the last 20 years there hasbeen an increase in per capita consumption, even excluding ques-tionable statistics from China (FAO, 2012). The increase is entirelydue to aquaculture, as capture fisheries have been unable to keepup with demand. Given this overall background, a proposed solu-tion to the Asian carp invasion is to use the meat for domestic con-sumption. This would alleviate the stress on America’s waterwaysand would provide a local, plentiful supply of fish.
However, many challenges must be overcome before this solu-tion can be implemented. On the marketing side, one of the biggesthurdles at this moment is that American consumers have a nega-tive view of Asian carp as food. Much of this stems from the mis-conception that bighead and silver carp taste like their cousins,the common and grass carps. Although all of these carp originatedfrom Asia, silver and bighead carp have a much lighter, more del-icate flavor than grass or common carp (Bardach, Ryther, & McLar-ney, 1972). This is one of the reasons why silver and bighead carpare the most cultured fish in the world by weight (FAO, 2012).
The difference in taste is mainly due to their diet. Both bigheadand silver carp are filter feeders and their diet consists of zooplank-ton and phytoplankton. Grass and common carp are bottom feed-ers (Bardach et al., 1972), which impacts the flavor of their meat.Occasionally other factors can cause off flavors, such as algae thatis occasionally present in the water, which can emit toxins such asgeosmin and methylisoborneol (Persson, 1984; Tabachek & Yur-kowski, 1976). However, research done by Papp, Kerepeczki, Pekár,and Gál (2007) found that bottom feeding common carp had 5–10times the amount of geosmin present in their fillets than filterfeeding silver carp, concluding that the type of feeding habits af-fects meat flavor (Papp et al., 2007). Another issue specific to theUS is that, because they are so numerous in rivers and streams inthe Midwest, silver and bighead carp are considered to have littlevalue (carp is currently selling at about 5 cents a pound), thus con-sumers may not be willing to pay for their meat. Further, since they
will be harvested from rivers that may be thought to have waterquality issues, demand for Asian carp meat may be decreased asconsumers are already aware of the dangers of eating fish (Verbekeet al., 2008). On the other hand, carp would be locally harvestedand processed, and this may be valued by consumers who preferlocal food. Local production coupled with the fact that consumingcarp is actually helping solve an environmental problem may makecarp products more attractive. Indeed, in the US, proponents of theinvasivore movement promote the eating of invasive species as amanagement strategy (Weis, 2011).
On the production side, however, there are concerns because ofpotential ecological and fisheries management impacts of harvest-ing Asian carp. From a ecological perspective, preliminary stochas-tic simulation modeling results suggest that fishing could collapsethe Asian carp population to functional extinction if all sizes ofAsian carp are harvested (Garvey et al., 2012). Specifically, theprobability of collapse is much less if only small or large Asian carpare harvested. As such, a market based solely on the human con-sumption of large adults would also have to be combined withmarkets that could target smaller Asian carp, such as organic fertil-izer, livestock and aquaculture feeds, and pharmaceuticals (i.e., fishoil). However, the removal of the large, fecund females could havea larger effect on population declines than predicted given that re-cent evidence suggests that larger females spawn earlier within aspawning season than smaller Asian carp, potentially leading togreater reproductive success of larger females (Glover, 2012). Froma fisheries management perspective, there is some evidence thatthe harvest of Asian carp will not negatively affect the harvest ofother fish in the Illinois and Mississippi rivers, and that the supplyof fish is relatively unresponsive to the price of fish (Speir & Brozo-vic, 2006). This suggests that fishermen in the area have either lim-ited ability to fish one specific species or are unwilling to expendthe extra effort necessary to target a particular species. The maincaveat is that these conclusions are based on an inventory of exist-ing fleet and technology/gear. The fishermen included in the anal-ysis were mostly part-timers (273 out of 320, or 85%), and usedsmall boats (Speir & Brozovic, 2006). If Asian carp prices were toincrease well above historical averages, perhaps through the useof temporary subsidies, and rents were created in the fishery, eco-nomic theory and the history of fisheries’ management indicatethat more fishermen, possibly with larger boats, will enter themarket (Beddington, Agnew, & Clark, 2007). This is indeed thesame long term conclusion reached by the authors of the Asiancarp fishery management paper (Speir & Brozovic, 2006).
Fig. 1. Distribution of Asian carp in the US according to the US Geological Survey’s Nonindigenous Aquatic Species database.
S. Varble, S. Secchi / Appetite 65 (2013) 58–67 59

Author's personal copy
Methods
Conducting a survey to determine the market potential of a‘‘new’’ fish entails considering several issues simultaneously,including those mentioned above. In addition, considerations mustbe made for awareness of health benefits and health concerns asso-ciated with fish consumption (Verbeke et al., 2008), overfishing ofwild populations, and human psychological aversion to new prod-ucts of animal origin (Pliner & Pelchat, 1991). All of these variablesand more must be taken into account for a full assessment to beperformed. To determine the market potential of Asian carp, multi-ple measures were tested through a web-based, national survey,which was pre-tested with local consumers in Carbondale, Illinois.To pretest the survey, we set up a table in front of the Neighbor-hood Grocery Co-op and asked customers to complete the survey.Based on their answers, we edited it as necessary. Both the pretestand the final survey received approval from Southern Illinois Uni-versity Human Subjects Committee, and all participants providedinformed consent.
The final survey consisted of forty questions and was adminis-tered by Synovate, a market research company. A screening ques-tion, ‘‘Have you consumed fish in the last month’’, was sent toevery member of Synovate’s online panel to determine whichrespondents ate fish on a regular basis. The respondents who an-swered ‘‘yes’’ to the screening question were sent the final survey.Because the entire panel was only asked whether or not they hadeaten fish in the last month, not the frequency of their fish con-sumption, we only know the frequency of consumption for the pa-nel members who completed the survey. Over 35% of therespondents consumed fish at home once a week or more fre-quently, and 40% of them consumed fish at home once or twice amonth. The reason behind the pre-screening of the potentialrespondents was to include only fish consumers, since peoplewho do not like/do not eat fish would not likely be willing to tryAsian carp, and many of our questions would not pertain to them.Based on data from the National Health and Nutrition ExaminationSurvey III conducted by Center for Disease Control and Preventionused by the US Environmental Protection Agency (EPA), 88% ofadults in the US consume fish/shellfish at least once a month and58% consume fish/shellfish at least once a week (OEHHA, 2001).When Synovate polled their panel members, approximately 68%(15,810 out of 23,376) responded that they had eaten fish in theprevious month. Once Synovate determined which respondentson their panel ate fish, the final survey was administered. The sur-vey instrument is available from the authors upon request.
Due to our sampling procedure, and the pre-selection of fishconsumers as respondents, assessment of validity is complex.There is limited available data to compare our sample with thepopulation of US fish consumers, since the existing national sur-veys are conducted to assess the potential for exposure to toxicchemicals and not for marketing purposes. Therefore, data on race,income and geographical location of fish consumers is not avail-able. In 2002, the US EPA issued a study on per capita fish con-sumption in the US using the 1994–1996, and 1998 USDAContinuing Survey of Food Intakes by Individuals, which are basedon a representative sample of the US population and use a twonon-consecutive day recall period. Of the 20,607 respondents ofall ages, only 4391 (21%) had eaten fish and were part of the fishconsumption analysis. Within the adult population, the respon-dents that had consumed fish were 28% of the sample. Womenwere 48% of the adult sample,1 and people 45 and older comprised
58% of the adult consumer sample, (US EPA, 2002). In our sample,women are 51.5%, and 59.9% of the sample are 45 and older. By con-trast, according to the 2010 US census, 51.7% of the adult populationwas over 44 years old, and 50.8% was female. It therefore appearsthat fish consumers tend to be older than the general population,and our sample reflects that. Compared to the general census, oursample under represents both African Americans and Latinos, butethnicity in not available in the EPA survey of fish consumers. Thegeographical distribution of the sample on the other hand closelymatches that of the census population (Howden & Meyer, 2012; Lof-quist, Lugaila, O’Connell, & Feliz, 2012).
In the survey, willingness to try (WTT) and willingness to pay(WTP) for Asian carp meat were both measured. Because Asiancarp is an exotic, novel food, consumers may not be willing to pur-chase it without first tasting it, therefore, WTP might not be anaccurate measurement of the true market potential. Thus, we firstasked respondents if they would be willing to try a free sample ofAsian carp in the grocery store. Since the sample is free and therespondent does not have to invest more than their willingnessto experiment, this measurement could give a better preliminaryassessment. We also assessed willingness to pay because its mea-surement gives insight on the characteristics of respondents will-ing to go beyond a free taste test of Asian carp and therefore canprovide initial information on what the best avenues to marketAsian might currently be, prior to any large scale marketing efforts(Schupp, Gillespie, O’Neil, Prinyawiwatkul, & Makienko, 2005;Schupp et al., 2003).
Other variables measured included frequency of fish consump-tion in restaurants and at home, awareness of Asian carp and theproblems they cause, awareness of overfishing/depleted fishstocks, health benefits and health concerns associated with con-suming fish, purchase habits of new food items, interest in tryingif Asian carp was locally caught and processed. The survey also in-cluded sociodemographic measures such as age, income, urban/suburban/rural residence, and education. There are several reasonswhy each measure was included in the survey, which will be de-scribed in detail next. The hypotheses tested and their relation-ships to the specific variables are described in Table 1.
Fish consumption – Restaurants and home
The likelihood of a person trying a new type of fish is largelybased on whether the person already consumes seafood. Basedon previous research, consumers have the most aversion to foodsof animal origin and are least likely to try new types of flesh foods(Pliner & Pelchat, 1991). Schupp, Gillespie, O’Neil, Prinyawiwatkul,and Makienko (2005) found a correlation between consumption ofgame meat and willingness to try exotic meat. Therefore, if an indi-vidual does not already consume fish, it is highly unlikely that theywill try Asian carp. Higher frequencies of fish consumption, both athome and in restaurants, should lead to a higher willingness to tryAsian carp.
H1. The higher the frequency of fish consumption in restaurantsand at home, the higher the willingness to try (WTT) andwillingness to pay (WTP) for Asian carp.
Asian carp awareness
In previous studies about a multitude of environmental issuessuch as climate change (Semenza et al., 2008) and picking up litter(Brown, Ham, & Hughes, 2010), awareness of an issue often leadsto action to help resolve the issue as hypothesized by Bambergand Möser (2007), Stern (2000), and many others trying to developmodels to predict determinants of pro-environmental behavior
1 Note that EPA’s definition of adults is 15 and older, slightly different from ourswhich is 18 and older. This likely increases the number of younger adults in the EPAsample, therefore the percentage of 45 and over would be higher than 60.1 if ourdefinition had been used.
60 S. Varble, S. Secchi / Appetite 65 (2013) 58–67

Author's personal copy
(Bamberg & Möser, 2007; Stern, 2000). Thus, awareness of Asiancarp and the problems they have caused in US waterways shouldresult in an increase in willingness to try and willingness to payfor Asian carp meat as a way to combat the Asian carp invasion.
H2. The higher the awareness of problems caused by Asian carp inthe US, the higher the WTT and WTP.
Awareness of overfishing and Monterey Bay Seafood Watch
The Monterey Bay Seafood Watch (MBSW) is the oldest andmost established seafood guide that helps consumers make ethicalseafood choices (Jacquet et al., 2010). The MBSW lists species thatare safe to eat in terms of population health and fishing practices(green list), okay to eat in moderation (yellow list), and shouldnot be eaten at all (red list). People who follow the recommenda-tions of the MBSW do not consume fish species that are on thered list. We chose the MBSW as our indicator because it is the old-est program of its kind, it distributes the guide to zoos and aquar-iums nationwide, and it is the one that other seafood lists are basedon. However, there have been debates over whether it is effectiveand the program recently modified its sustainability assessmentcriteria and the frequency with which updates are made (MontereyBay Aquarium, 2012a). The awareness of the problem of overfish-ing and decreased fish stock health can lead to changes in con-sumption behavior, as described in the section above about Asiancarp awareness. When individuals are aware of the problem,behavior change can result. Thus, consumers who follow theMBSW should be more willing to try and willing to pay for Asiancarp from US waterways because they are a species that are notthreatened by overfishing, and depleting Asian carp fish stocks isconsidered to have positive environmental impacts, unlike thedepletion of native fish stocks.
H3. The higher the awareness and following of the Monterey BaySeafood Watch, the higher the WTT and WTP.
Health benefits and health concerns
Fish consumption has gained popularity in recent years as re-search has revealed many positive health benefits from eating fish.These are attributed mostly to omega-3 fatty acids which areshown to decrease heart disease and arthritis, and increase brainfunction, especially in babies and children (Sidhu, 2003). However,eating fish also poses health risks and can be perceived as a risky
behavior. Some fish bioaccumulate toxins from their habitat, whichleads to toxins building up in their meat. Thus, fish meat can con-tain high levels of heavy metals, such as methyl mercury and cad-mium, and other toxins such as polychlorinated biphenyls anddioxins (Sidhu, 2003). For years, pregnant and nursing women,children, and the elderly have been advised to only eat several spe-cies of fish in moderation, including tuna, orange roughy, shark,and tilefish, because of the presence of these toxins (NRDC, 2012).
To some, the health risks of fish consumption may outweigh thebenefits provided by the omega-3 fatty acids. A survey of Belgianconsumers in 2004 showed that the respondents were more awareof safety risks associated with fish consumption than health bene-fits (Verbeke et al., 2005, 2008). For those individuals who are moreaware of safety risks, willingness to try Asian carp may be lowerthan those respondents aware of health benefits associated withfish consumption.
H4. Respondents aware of the health benefits of fish consumptionwill be more WTT and WTP than those respondents with healthconcerns about fish consumption.
Purchase habits
Based on the Diffusion of Innovation Theory, rates of new prod-uct adoption vary, and only a small fraction of the populationquickly adopts a new product. These individuals are identified asinnovators and early adopters (Rogers, 2003). Innovators and earlyadopters are characterized by being more likely to take risks andmore willing to try new products. Thus the respondents who iden-tify themselves as one of the first to buy new products at the gro-cery store (innovators and early adopters) should be more willingto try Asian carp as they are willing to take more risks.
H5. Respondents who self identify themselves as product pur-chase leaders will be more WTT and WTP for Asian carp.
Locally caught and processed
Demand for local products has risen recently as concerns overeconomic and environmental issues have become more wide-spread. These concerns include keeping jobs local to support thelocal economy and reducing greenhouse gas emissions throughreductions in shipping. Studies of local agricultural products haveshown that consumers are willing to pay more for locally producedfood (Adams & Salois, 2010; Darby et al., 2008; Hu et al., 2009).
Table 1Hypotheses with variable tested and whether it was supported by results.
# Hypothesis Variable measured Results
H1 The higher the frequency of fish consumption in restaurants and at home, the higher thewillingness to try (WTT) and willingness to pay (WTP) for Asian carp
Overallconsumption
Not supported
H2 The higher the awareness of problems caused by Asian carp in the US, the higher the WTT andWTP
AC Supported for WTT
H3 The higher the awareness and following of the Monterey Bay Seafood Watch, the higher theWTT and WTP
MBSW Supported for WTP_sticks
H4 Respondents aware of the health benefits of fish consumption will be more WTT and WTP thanthose respondents with health concerns about fish consumption
Health concerns,Health benefits
Not supported
H5 Respondents who self identify themselves as product purchase leaders will be more WTT andWTP for Asian carp
Purchase Habit Supported for all WTP
H6 Locally caught and processed fish will increase WTT and WTP Local Supported for WTT, WTP_fillet, steak,cakes
H7 Respondents with higher levels of education will be more willing to try and pay for Asian carpas will females and older respondents
Education, Genderand Age
Not supported for Education and Age,Gender supported for WTP_steak
H8 Respondents with higher neophobia will be less willing to try and pay Neophobia Supported for WTT, WTP_fillet and steak
S. Varble, S. Secchi / Appetite 65 (2013) 58–67 61

Author's personal copy
However, in our pilot survey, many individuals expressed concernover eating fish from local, Midwest rivers and streams due to thepollution. This is partly because consumers have better knowledgeof their local waters than they do of overseas fisheries and aquacul-ture production practices. Nevertheless, the perceived health riskassociated with eating polluted fish may decrease respondents’willingness to try Asian carp, as discussed earlier in the paper.Therefore, it is unknown what net effect the locally caught variablewill have on willingness to try or pay for Asian carp that has beencaught in Midwestern waterways. Geography may be a determin-ing factor in whether respondents are more or less willing to tryAsian carp, as respondents living outside the Midwest may notbe as aware of the pollution found in Midwest waterways. How-ever, as can be seen in Fig. 1, Asian carp have invaded waterwaysas far west as California and as far east as New Jersey and Florida,so they are not only a Midwest problem, but a national problem. Ifrespondents are aware of the large spread of Asian carp popula-tions across the US, all respondents may perceive Asian carp as‘‘local’’.
H6. Locally caught and processed fish will increase WTT and WTP.
Socio-demographic variables
Socio-demographic variables are very influential in willingnessto try and pay for fish and local foods. In a previous Asian carp con-sumption survey focused on Arkansas consumers and canned carppreparation, Engle and Kouka (1995) found that gender and agewere each influential on taste preference. Older females tendedto rate canned bighead carp higher in blind taste tests against sal-mon and tuna (Engle & Kouka, 1995). Foltz, Dasgupta, and Deva-doss (1999) found that age, education level, and income werepredictors of willingness to buy trout (Foltz et al., 1999). Since in-come is highly correlated with education level we will only useeducation level in our hypothesis testing.
H7. Respondents with higher levels of education will be morewilling to try and pay for Asian carp as will females and olderrespondents.
Food neophobia
Food neophobia is a measure of a person’s willingness to try dif-ferent and unique foods (Pliner & Hobden, 1992). Many food neo-phobia studies have focused on neophobia in children (Dovey et al.,2008; Pliner, 1994). However, neophobia can last through adult-hood and is important in marketing acceptance of new food prod-ucts (Henriques, King, & Meiselman, 2009). The neophobia scalehas also been shown to predict a person’s willingness to pay (San-juán-López, Philippidis, & Resano-Ezcaray, 2011). In researchexamining acceptance of novel saffron products, Sanjuán-Lópezet al. (2011) found that respondents who have greater food neo-phobia are less willing to pay to try new products.
H8. Respondents with higher neophobia will be less willing to tryand pay.
Dependent variables: Willingness to try and willingness to pay
The dependent variables measured in the survey were willing-ness to try (WTT) a free sample of Asian carp in the grocery store,and willingness to pay (WTP) for four different preparations ofAsian carp in two different settings (in a restaurant and at a gro-cery store). The preparations are described in Table 2, as are thenumbers of respondents willing to try/pay for the carp and theirpercentages.
We chose these preparations because Asian carp is notoriouslybony, to the extent that many recreational fishermen will not eatthe meat because of the bones. However, if properly debonedand prepared, consumers will not have to be concerned with thebones when eating Asian carp. Several methods can be used to ex-tract the bones from the meat. One method is to fillet the fish andthen cook (either by steaming or baking) the meat with the bonesintact (Fig. 2). Once the meat has been cooked the bones are easilyremoved and the meat can be fashioned into several different prep-arations, such as fish cakes, sticks, or reconstructed fillets. Thismethod produces the most meat from the fish. Another methodis to simply cut around the bones while cleaning the fish. With thismethod, only small strips of meat can be rendered from the fish
Table 2Percent of respondents willing to buy Asian carp, mean price respondents are willing to pay for each preparation, and comparison between mean WTP (willingness to pay) andactual price of preparation at a grocery store/restaurant.
Product description Number of respondentswilling to buy (%)
Mean WTP for allrespondents
Mean WTP forrespondents willing tobuy
Actual price for similarproduct available in market
Grocerystore
10-oz package of two frozen Asian carp filletscrusted with Panko bread crumbs
138 $3.20 $4.70 $6.34a
(68%) $5.98b
12-oz box of 14 wild-caught, frozen Asian carpfish sticks
134 $3.20 $4.80 $3.96c
(66%)
Restaurant Asian carp fish cakes, made with breadcrumbs, herbs and spices
119 $5.90 $9.90 Blue Crab Cake $7.99d
(59%) Old Fashioned Fish Cakes$15.95f
Asian carp steak, grilled and served with atomato garlic sauce
130 $7.00 $10.80 Atlantic Salmon $14.25e
(64%) Tilapia $13.50e
Rainbow Trout $13.50e
Cod $25.50e
a Gorton’s Garlic & Herb Seasoned Tilapia Fillets (13.3 oz).b Morey’s Lemon Pepper Tilapia (10 oz).c Gorton’s Fish Sticks (11.4 oz).d Crabby Bill’s Seafood Co. (various locations in Florida).e Red Lobster Restaurant (Nationwide, but prices are for O’Fallon, IL).f Union Oyster House (Boston, MA).
62 S. Varble, S. Secchi / Appetite 65 (2013) 58–67

Author's personal copy
and much of the meat is wasted because it is very difficult to re-move the bones prior to cooking. Chef Philippe Parola, who wasan early proponent of the invasivore movement and has developedseveral recipes for Asian carp, helped us identify the dishes used inthe survey based on preparations that could potentially be found ingrocery stores and restaurants that give consumers the least expo-sure to bones.
Though the survey asked for willingness to pay at different pricepoints ranging from $2 to $10 for the fish sticks to be consumed athome and $8 to $16 for the fish steak at a restaurant, there was notmuch variation in the responses (see Table 3), therefore the WTPregressions were run as simple binary choices.
Results
The respondents (N = 202) came from various backgrounds andgeographic locations within the United States. The sample wasevenly distributed on a gender basis, and it included a larger num-ber of older (61% over 45), married (69%) and childless (68%) con-sumers (Table 4). The sample was quite evenly distributedbetween consumers with only some college or less and collegegraduates or more. Geographically, the South was slightly
overrepresented and about half the sample had incomes of over$60,000/year and half below (note that not answering the incomequestion was an option so the total of responses to this question isless than the total of respondents). The data was analyzed usingSPSS software.
Fish consumption – Restaurants and home
Respondents were asked when eating at a restaurant or athome, how often they consumed seafood. The answer choiceswere: ‘‘More than twice a week, once or twice a week, once ortwice a month, once every 2–3 months, and never.’’ The resultsfrom the survey show that the greatest number of respondents(n = 84, 34%) only ate fish once every 2–3 months in restaurants(coded as 1), however, 32% (n = 81) eat fish once or twice a monthat home (coded as 2). Only slightly over 3% of respondents re-sponded that they ate fish more than twice a week at home or inrestaurants (coded as 4). These numbers are slightly lower thanthe statistics from the OEHHA (2001), as stated earlier. In theirstudy, 88% of consumers eat fish once a month and 58% eat fishonce a week (OEHHA, 2001). Fish consumption in both restaurantsand at home were highly correlated (p > .01) with the MontereyBay Aquarium Watch measures and the Asian carp awareness mea-sures, which could mean that those individuals who eat fish areaware of issues of overfishing and ecosystem health. Home con-sumption and restaurant consumption were combined in theregression analysis.
Asian carp awareness
The awareness of problems caused by Asian carp was deter-mined through agreement with two statements: ‘‘I am aware ofthe environmental damage done by Asian carp in the UnitedStates’’ and ‘‘I am aware of the effort to prevent Asian carp fromentering Lake Michigan’’. Respondents were required to determinetheir awareness through a seven-point Likert scale (1 = stronglydisagree, 7 = strongly agree). Likert type scales have been usedextensively in the literature to assess environmental awareness.Some examples of previous surveys that have used Likert scales in-clude studies on the levels of environmental awareness in smalland medium sized enterprises (Gadenne, Kennedy, & McKeiver,2009), watershed conservation and preservation (Story & Forsyth,2008), and individual determination of environmental concernsand behavior (Nisbet, Zelenski, & Murphy, 2009). Thirty-eight per-cent (n = 77) of respondents stated that they agreed with the firststatement, and 42% (n = 84) agreed with the second statement.The results from each statement were combined for an overallAsian carp awareness measure in the regression analysis. The over-all mean for the combined measure was 7.44 with a minimum of 2and maximum value of 14 (Table 3). Based on this statistic, mostrespondents had a neutral knowledge of both statements.
Awareness of overfishing and Monterey Bay Seafood Watch
Awareness of overfishing and the Monterey Bay Seafood Watch(MBSW) was measured by two questions: ‘‘I am aware of the Mon-terey Bay Aquarium Seafood Watch’’ and ‘‘I try to follow the rec-ommendations of the Monterey Bay Seafood Watch.’’ These weremeasured on a Likert-type scale from one to seven (1 = stronglydisagree, 7 = strongly agree). The majority of respondents dis-agreed with each statement. Seventy-one percent said that theywere not aware of the MBSW, and 57% did not follow it. The ques-tions were combined for the analysis to comprise one MBSW mea-sure. The combined MBSW mean was 5.48. Based on the mean ofthe combined Asian carp awareness measure and this measure,
Fig. 2. Asian carp require extra processing due to their bone structure. Photo credit:Sylvia Smith, SIUC.
Table 3Descriptive statistics of variables.
Variable Minimum Maximum Mean Std. Deviation
WTPsticks 0 10 3.17 2.81WTPfillet 0 10 3.22 2.80WTPsteak 0 16 6.95 5.52WTPcakes 0 16 5.85 5.15WTPsticks_binary 0 1 0.66 0.47WTPfillet_binary 0 1 0.68 0.47WTPsteak_binary 0 1 0.64 0.48WTPcakes_binary 0 1 0.59 0.49WTT 0 1 0.73 0.45Neophobia 10 63 32.77 10.42Age 19 83 48.50 16.26Education 1 4 2.55 0.98Purchase Habit 0 3 1.98 0.77Gender 0 1 0.51 0.50Health Concerns 0 1 0.29 0.46Health Benefits 0 1 0.93 0.26Local 1 3 2.32 0.57Overall Consumption 1 8 3.84 1.42AC Awareness 2 14 7.44 4.04MBSW 2 14 5.48 3.16
S. Varble, S. Secchi / Appetite 65 (2013) 58–67 63

Author's personal copy
there was higher appreciation among respondents of the problemscaused by Asian carp than of the Monterey Bay Seafood Watch.
Health benefits and health concerns
Ninety-three percent of respondents stated that they wereaware of health benefits (1 = aware of benefits, 0 = not aware ofbenefits) of eating fish, and only 29% (n = 59) had health concernswith eating fish (Table 3). Of those respondents who listed whathealth benefits they were aware of, omega-3 fatty acids was thetop reason, being mentioned by 51% (n = 96) of respondents. Thesecond reason (31%) was that fish is a lean meat. Forty-three peo-ple listed mercury as their top concern with fish consumption.Contaminants were the second most frequently listed reason. Thisis the opposite of what Verbeke et al. (2005, 2008) found. However,their survey consisted of Belgian respondents and was conductedin 2003. European respondents may have different views thanAmericans regarding health concerns about food. Perceptionsmay have also changed in the 9 years between the two surveysas much more evidence about the benefits of eating fish has beenpublished. By contrast, in a recent survey of elderly Australian sub-jects, Grieger, Miller, and Cobiac (2012) found that a majority ofrespondents believe that fish is healthy (Grieger et al., 2012),which supports our results.
Purchase habits
Respondents’ purchase habits were measured through thequestion ‘‘When thinking about buying new food products, howwould you describe yourself?’’ with answers ranging from ‘‘Asone of the first to buy’’ (coded as 3) through ‘‘will not purchase’’(coded as 0). Twenty-six percent responded that they are productleaders, and are one of the first to buy. Forty-eight percent pur-chase after few others have purchased, 23% purchase after manypeople have purchased, and only 2% will not purchase. This ques-tion correlated highly (p > .01) with age (younger respondentsare more likely to be product purchase leaders), and home fishconsumption.
Locally caught and processed
Respondents were asked whether they would be more or lessinclined to try Asian carp if it were locally caught and processed(coded 3 = more, 1 = less) or if it would make no difference (coded2). This measure was highly correlated with awareness of healthconcerns and age. Thirty-seven percent of respondents answeredthat they would be more willing to try Asian carp if it were local,it would make no difference to 57%, and only 5% said that theywould be less inclined to try Asian carp if it were locally caughtand processed. A separate correlation found no significant link be-tween geographical location and locally caught and processed(r = �0.091), which can be assumed to mean that respondentsdid not associate Asian carp only with the Midwest. Since aquacul-ture is a global endeavor and much of the fish eaten in the US is im-ported, as discussed earlier, simply being raised in the US may beconsidered ‘‘local’’ by many respondents.
Neophobia
The food neophobia scale was comprised of 10 different ques-tions on a seven point scale determined to be effective by Plinerand Hobden (1992). The answers to the questions were summedto obtain one neophobia score. The higher the score, the more neo-phobic the respondent is. Possible scores could range from 10 to70, and the mean for our sample was 32.7 with a standard devia-tion of 10.42 (Table 3). Since the mean was rather low, mostTa
ble
4D
emog
raph
ics
ofsu
rvey
resp
onde
nts.
Tota
lA
geG
ende
rM
arit
alSt
atu
sC
hil
dren
Edu
cati
on
18–4
445
+M
ale
Fem
ale
Sin
gle
Mar
ried
/att
ach
edH
ave
chil
dren
No
chil
dren
Som
eco
lleg
eor
less
Col
lege
grad
uat
eor
mor
e
Tota
lre
spon
den
ts20
281
121
9810
462
140
6513
798
104
Will
ing
totr
ya
free
sam
ple
147
(73%
)67
(83%
)80
(66%
)71
(72%
)76
(73%
)41
(66%
)10
6(7
6%)
49(7
5%)
98(7
2%)
70(7
1%)
77(7
4%)
Not
wil
lin
gto
try
afr
eesa
mpl
e55
(27%
)14
(17%
)41
(34%
)27
(28%
)28
(27%
)21
(34%
)34
(24%
)16
(25%
)39
(28%
)28
(29%
)27
(26%
)
Tota
lIn
com
eR
egio
n
<$60
,000
$60,
000+
Nor
th-E
ast
Mid
wes
tSo
uth
Wes
t
Tota
lre
spon
den
ts20
288
9239
4575
43W
illin
gto
try
afr
eesa
mpl
e14
7(7
3%)
64(7
3%)
69(7
5%)
29(7
4%)
35(7
8%)
54(7
2%)
29(6
7%)
Not
wil
lin
gto
try
afr
eesa
mpl
e55
(27%
)24
(27%
)23
(25%
)10
(26%
)10
(22%
)21
(28%
)14
(33%
)
64 S. Varble, S. Secchi / Appetite 65 (2013) 58–67

Author's personal copy
respondents were not very neophobic. Respondents who were neo-phobic were older, less educated, less aware of health benefitsassociated with eating fish, and product purchase laggards.
Willingness to pay and willingness to try
Examination of the responses to the willingness to try and payquestions indicates that over 70% of the sample was willing to try afree sample of the carp. The most popular preparation that respon-dents (68%) were willing to pay for was the fillet from the grocerystore. The least popular preparation was fish cakes, with only 59%of respondents reporting they would pay (Table 2).
Logistic regression
Willingness to tryA logistic regression with WTT as the dependent variable
showed that the independent variables explained between 27.3%and 39.5% of the variance (Cox & Snell R2 = .273, NagelkerkeR2 = .395, see Table 5). The significant variables included neopho-bia, Asian carp awareness, and locally caught and processed. Thissupports hypotheses 2, 6, and 8 (Tables 1 and 5).
Willingness to payAs we note above, the willingness to pay variables were evalu-
ated through a logistic regression. Therefore, the answers were re-coded as 0 = not willing to pay, and 1 = willing to pay (dependingon the preparation, the willingness to pay amount could rangefrom $2 to $16). The significance of the results was similar to thoseof the WTT, with the lowest for the WTP for store-bought fish fillets
(Cox & Snell R2 = .274, and Nagelkerke R2 = .384), and highest forthe steak at a restaurant (Cox & Snell R2 = .323, and NagelkerkeR2 = .444). As shown in Table 5, age was a significant predictor inWTP for all preparations of Asian carp. Younger respondents weremore likely to be willing to pay for Asian carp. Respondents whowere product purchase leaders were also more likely to pay forAsian carp, which supports hypothesis five. The locally caughtand processed measure was a significant predictor of willingnessto pay for most preparations. Respondents who answered that theywere more likely to try the carp if it was locally caught and pro-cessed, or if it made no difference to them, were more willing topay for every preparation except fish sticks, which partially sup-ported hypothesis six. This may be due to the fact that purchasing‘‘local’’ food is not important to the segment of the population thateats fish sticks. Another explanation could be that, due to theirheavily processed nature, fish sticks are not widely seen as some-thing that could be manufactured locally. Neophobia was signifi-cant in predicting WTP for fillets and steaks. Those individualswho were more food neophobic were less likely to pay. Finally,contrary to hypothesis three, people who were more willing topay for fish sticks were less aware of the Monterey Bay SeafoodWatch and less likely to follow its recommendations.
Discussion
Based on the results from our survey, the market potential forAsian carp meat in the United States is considerable. Most respon-dents said they would be willing to at least try a free sample ofAsian carp, and would be willing to pay for some preparation of
Table 5Logistic regression of willingness to try (WTT), and willingness to pay (WTP) for sticks, fillets, steaks, and cakes.
WTT WTP sticks WTP fillet
B S.E. Wald Exp(B) B S.E. Wald Exp(B) B S.E. Wald Exp(B)
Age �0.02 0.01 2.65 0.98 �0.05 0.01 12.88** 0.95 �0.03 0.01 6.262** 0.97Gender 0.25 0.43 0.34 1.29 0.54 0.42 1.69 1.72 0.52 0.42 1.544 1.69Education �0.27 0.22 1.43 0.77 �0.25 0.21 1.36 0.78 �0.10 0.21 .212 0.91Purchase Habit 0.18 0.32 0.32 1.19 0.90 0.32 8.14** 2.46 0.87 0.32 7.63** 2.39Local 1.05 0.38 7.76** 2.85 0.51 0.34 2.27 1.66 0.79 0.35 5.21* 2.21Asian Carp Awareness 0.14 0.06 5.37* 1.15 0.07 0.05 1.70 1.07 0.09 0.05 2.643 1.09MBSW �0.13 0.08 2.76 0.88 �0.14 0.07 4.02* 0.87 �0.12 0.07 2.907 0.89Overall Fish Consumption 0.05 0.15 0.10 1.05 0.20 0.15 1.74 1.22 0.16 0.15 1.037 1.17Neophobia �0.11 0.03 16.38*** 0.89 �0.04 0.02 3.17 0.96 �0.05 0.02 4.53* 0.95Health Concerns 0.32 0.46 0.49 1.38 0.17 0.43 0.16 1.19 0.34 0.44 .612 1.41Health Benefits 0.24 0.72 0.11 1.27 0.24 0.71 0.11 1.27 �0.12 0.69 .029 0.89Constant 3.27 2.17 2.26 26.22 1.49 2.07 0.52 4.42 0.03 2.08 .000 1.03
Cox & Snell R Square .273 .286 .274Nagelkerke R Square .395 .397 .384
WTP steak WTP cakes
B S.E. Wald Exp(B) B S.E. Wald Exp(B)
Age �0.04 0.01 10.26*** 0.96 �0.05 0.01 15.32*** 0.95Gender 1.01 0.44 5.18* 2.74 0.70 0.40 3.11 2.02Education 0.01 0.21 0.00 1.01 0.02 0.20 0.01 1.02Purchase Habit 0.61 0.31 3.83* 1.84 0.68 0.29 5.39* 1.98Local 0.97 0.35 7.79** 2.65 0.81 0.33 6.11* 2.24Asian Carp Awareness 0.04 0.05 0.56 1.04 0.10 0.05 3.66 1.10MBSW 0.08 0.07 1.13 1.08 0.03 0.07 0.22 1.03Overall Fish Consumption 0.11 0.16 0.50 1.12 0.03 0.15 0.04 1.03Neophobia �0.08 0.03 9.39** 0.92 �0.04 0.02 3.00 0.96Health Concerns �0.09 0.43 0.04 0.91 0.25 0.41 0.39 1.29Health Benefits 0.89 0.73 1.49 2.44 0.47 0.68 0.47 1.59Constant 0.57 2.12 0.07 1.77 �0.55 1.94 0.08 0.57
Cox & Snell R Square .323 .287Nagelkerke R Square .444 .387
* p < 0.05.** p < 0.01.*** p < 0.001.
S. Varble, S. Secchi / Appetite 65 (2013) 58–67 65
Author's personal copy
it. Because of the negative connotation attached to carp in general,this figure is encouraging. The willingness to pay measures werealso encouraging in determining market potential. While over halfof the respondents replied they would be willing to pay for differ-ent preparations of Asian carp, the respondents who were willingto pay, would be willing to pay similar or equal prices as othermore popular fish on the market (see Table 2).
While 202 respondents is a relatively small sample size for eval-uating market potential and obtaining target market information,the goal of our survey was to provide preliminary results onwhether a market for Asian carp meat exists. The results fromour survey could also provide a preliminary basis for the develop-ment of an Awareness-Trial-Repeat analysis to further examinemarket potential and forecasting (Narasimhan & Sen, 1983). An-other avenue to pursue in terms of market potential is theAsian–American segment of the US population. Our sample onlycontained six respondents from Asian descent, and thus was toosmall to draw any conclusions about the market potential for thispopulation segment.2
Creating demand for the human consumption of Asian carp inthe US could be a market based, cost effective solution for a prob-lem (invasive species) that is typically dealt with through com-mand and control type abatement. Invasive species are anegative externatility of globalization. Asian carp, specifically, arein part a negative externality of an industry developed to try tomeet the demand for consumable fish. They were originallybrought into the United States as a non-chemical alternative toclean aquaculture and wastewater ponds for the production ofother farm raised fish. Later they were raised as a source of fishmeat. They escaped confinement in the 1970s and have since madetheir way up the Mississippi River (Chick & Pegg, 2001) and nowconstitute the highest known densities in the world in portionsof the Illinois River (Sass et al., 2010). As it is obvious from Fig. 1,their distribution is widespread.
A high consumer demand for Asian carp would result in morepeople fishing and processing them, which would not only removecarp from waterways, but would also create more jobs. An alterna-tive to using tax money to fight the carp invasion, consumers whobuy and eat Asian carp would be paying for the removal. This strat-egy could be coupled with the production of fertilizer or aquacul-ture fish foods from small carp and parts discarded fromprocessing. These uses would make sense economically given thatthe price of natural gas – a key input to fertilizer – is projected toincrease and so is demand for fish (FAO, 2012; US Department ofEnergy Energy Information Administration, 2012). As we note inthe introduction, preliminary modeling work suggests that if allsizes of carp are caught, fishing is an effective management strat-egy. Specifically, harvest rates (catch divided by the initial fish pop-ulation) of 0.6 and above are effective in reducing fish populations(Garvey et al., 2012). Current lack of data and uncertainty on thestarting population conditions mean that only relative results areavailable, and no absolute size of fish harvest can be determined(Glover, 2012).
Intuitively, therefore, this would seem to be a win–win strategyfor ecosystems, taxpayers, consumers, commercial fishermen andprocessors, and recreationalists. However researchers have con-flicting views and some issues remain unresolved because of theuncertainty still surrounding the Asian carp’s population dynamicsdiscussed in the introduction. Other possible limitations to this ap-
proach include changing the way people view Asian carp, fromsomething that is unsavory to something that is appetizing andappealing. Creating the infrastructure necessary to harvest andprocess Asian carp is also a large financial barrier. Last but notleast, there are concerns about creating a market for invasive spe-cies, whose ultimate goal is to extirpate the species and thus disap-pear as well. A recent article by Nuñez, Kuebbing, Dimarco, andSimberloff (2012) outlines the benefits and consequences of creat-ing a consumer market for invasive species (Nuñez et al., 2012).Marketing efforts have already been initiated for many invasivespecies throughout the United States. These include kudzu, lion-fish, nutria, snakehead, and garlic mustard These marketing at-tempts are all at different stages, though none have yet been ableto successfully eradicate the target species. It is important thateducation be included as a key part of any invasive species market-ing campaigns so that the species does not become incorporatedinto the local culture. This has occurred both in Hawaii and Pata-gonia with the wild boar and would make eradication even moredifficult (Nuñez et al., 2012).
Therefore, although creating a market for invasive species mayhelp to eliminate them from the ecosystem they threaten, it mayalso result in people and organizations cultivating them for profitafter their removal from the specified ecosystem. This would causeadditional problems including the possibility of reintroduction.Possible strategies need to incorporate research on backstop tech-nologies such as aquaculture, and appropriate marketing, regula-tory and education schemes so that the general public, thefishermen and the processors are all aware of the long term objec-tives of the fishery. A thorough investigation of future implicationsneeds to be performed. This will have value for the management ofother invasive species as well.
The use of fishermen to control nuisance-causing species is notentirely novel. It has been explored in the Pacific Northwest to re-duce Northern Pikeminnow populations, which have been inflatedby the construction of hydropower dams and which prey on juve-nile salmon (Best, 2006). Many surveys and studies have focusedon market potential of exotic meats (McLean-Meyinsse, 1994;Schupp, Gillespie, O’Neil, Prinyawiwatkul, & Makienko, 2005),and several papers discuss developing a market for invasives,including the already mentioned Nuñez et al. (2012) and Jojola,Witmer, and Nolte (2005), which discusses the potential for nutriamanagement through human consumption in Louisiana. Recent lit-erature has started exploring commercial harvest as a strategy forcontrolling overabundant native species such as white tailed deerin North America (VerCauteren et al., 2011). However, this is oneof the first studies trying to establish market potential of an exoticinvasive species for human consumption using a national survey.
To accurately assess the preliminary market potential of Asiancarp, nationwide fish consumption must be measured. In thisstudy, we performed preliminary market research to find outhow many respondents eat fish before the survey was conducted.We had difficulties finding other studies that measured the na-tional frequency of fish consumption and what percentage of thepopulation consumes fish at all. The existing literature typicallylooks at fish consumption through a toxicology lens (OEHHA,2001). This is one of few national studies examining fish consump-tion for market research purposes.
In summary, our survey provides a good preliminary assess-ment for entrepreneurs and organizations interested in developingthe infrastructure necessary to create a market for Asian carp.Much work still needs to be completed, including determining ifnegative future repercussions may arise from developing marketdemand. In particular, it is critical to create bioeconomic modelsbased on realistic carp population growth models to establishhow commercial fishing will help in reducing population pressure,and whether the carp can be completely eradicated, perhaps with
2 While we did not have enough Asian American respondents to fully test themarketing potential of this population segment, it would be beneficial to conduct asecond survey to ascertain this information. Asian carp were imported from Asia,where they are considered a delicacy. Much of the Asian carp currently harvestedfrom US waterways is shipped to China for consumption. Populations of EasternEuropean descent could also be potential targets, given their traditional diets.
66 S. Varble, S. Secchi / Appetite 65 (2013) 58–67

Author's personal copy
complementary policies. If so, alternative fisheries and productswill have to be developed in the long term. The eradication ofthe carp would open up ecological niches for other species and thisshould be investigated. However, based on this assessment, thereis interest within US consumers for Asian carp meat.
References
Adams, D. C., & Salois, M. J. (2010). Local versus organic. A turn in consumerpreferences and willingness-to-pay. Renewable Agriculture and Food Systems,25(04), 331–341.
Asian Carp Regional Coordinating Committee (2012). Asian carp control. Backgroundand threat. <http://www.asiancarp.org/background.asp> Retrieved 23.07.12.
Bamberg, S., & Möser, G. (2007). Twenty years after Hines, Hungerford, and Tomera.A new meta-analysis of psycho-social determinants of pro-environmentalbehaviour. Journal of Environmental Psychology, 27(1), 14–25.
Bardach, J. E., Ryther, J. H., & McLarney, W. O. (1972). Aquaculture. The farming andhusbandry of freshwater and marine organisms. London, UK: John Wiley & Sons,Inc.
Beddington, J. R., Agnew, D. J., & Clark, C. W. (2007). Current problems in themanagement of marine fisheries. Science, 316(5832), 1713–1716.
Best, B. J. (2006). Bio-economic analysis of a predator control program. The NorthernPikeminnow Sport Reward Fishery.
Brown, T. J., Ham, S. H., & Hughes, M. (2010). Picking up litter. An application oftheory-based communication to influence tourist behaviour in protected areas.Journal of Sustainable Tourism, 18(7), 879–900.
Chick, J. H., & Pegg, M. A. (2001). Invasive carp in the Mississippi River Basin. Science,292(5525), 2250–2251.
Darby, K., Batte, M. T., Ernst, S., & Roe, B. (2008). Decomposing local. A conjointanalysis of locally produced foods. American Journal of Agricultural Economics,90(2), 476–486.
Dovey, T. M., Staples, P. A., Gibson, E. L., & Halford, J. C. G. (2008). Food neophobiaand ‘picky/fussy’ eating in children. A review. Appetite, 50(2–3), 181–193.
Egan, D. (2010). State joins in Asian carp suit. Wisconsin, 4 others demand Chicagowater system close 2 locks, increase netting efforts. Journal Sentinel. <http://www.jsonline.com/news/wisconsin/98753699.html>.
Engle, C. K., & Kouka, P.-J. (1995). Potential consumer acceptance of canned bigheadcarp. A structural model analysis. Marine Resource Economics, 10(2), 15.
FAO (2012). The state of world fisheries and aquaculture. Rome, Italy: Food andAgriculture Organization.
Flesher, J., & Webber, T. (2012, December 3rd). Judge dismisses Asian carp lawsuit,says states can amend claims against the government. Washington Post.
Foltz, J., Dasgupta, S., & Devadoss, S. (1999). Consumer perceptions of trout as a fooditem. The International Food and Agribusiness Management Review, 2(1), 83–101.
Gadenne, D., Kennedy, J., & McKeiver, C. (2009). An empirical study ofenvironmental awareness and practices in SMEs. Journal of Business Ethics,84(1), 45–63.
Garvey, J. E., Sass, G. G., Trushenski, J., Glover, D., Charlebois, P. M., Levengood, J.,et al. (2012). Fishing down the bighead and silver carps. Reducing the risk ofinvasion to the Great Lakes (187 pp.). Final Report to the US Fish and WildlifeService and the Illinois Department of Natural Resources. <http://asiancarp.us/documents/EXECCARP2011.pdf>.
Garvey, J. E., Ickes, B., & Zigler, S. (2010). Challenges in merging fisheries researchand management. The Upper Mississippi River experience. Hydrobiologia,640(1), 125–144.
Glover, D. (2012). Personal communication.Grieger, J. A., Miller, M., & Cobiac, L. (2012). Knowledge and barriers relating to fish
consumption in older Australians. Appetite, 59(2), 456–463.Henriques, A. S., King, S. C., & Meiselman, H. L. (2009). Consumer segmentation
based on food neophobia and its application to product development. FoodQuality and Preference, 20(2), 83–91.
Howden, L. M., & Meyer, J. A. (2012). Age and sex composition. 2010; 2010 Census,briefs C2010BR-03.
Hu, W., Woods, T., & Bastin, S. (2009). Consumer acceptance and willingness to payfor BLUEBERRY products with nonconventional attributes. Journal of Agriculturaland Applied Economics, 41(1), 47–60.
Irons, K. S., Sass, G. G., McClelland, M. A., & Stafford, J. D. (2007). Reduced conditionfactor of two native fish species coincident with invasion of non-native Asiancarps in the Illinois River, USA. Is this evidence for competition and reducedfitness? Journal of Fish Biology, 71, 258–273.
Jacquet, J., Hocevar, J., Lai, S., Majluf, P., Pelletier, N., Pitcher, T., et al. (2010).Conserving wild fish in a sea of market-based efforts. Oryx, 44(01), 45–56.
Jojola, S. M., Witmer, G. W. & Nolte, D. L. (2005). Nutria: an invasive rodent pest or avalued resource. In D. L. Nolte & K. A. Fagerstone (Eds.), Proceedings of thewildlife damage management conference (pp. 120–126). University of Nebraska-Lincoln.
Lofquist, D., Lugaila, T., O’Connell, M., & Feliz, S. (2012). Households and families.2010; 2010 Census, briefs C2010BR-14.
McLean-Meyinsse, P. E. (1994). Consumer perceptions of, and attitudes toward,rabbit meat. Journal of Agribusiness, 12(1).
Monterey Bay Aquarium (2012a, January 2012). Developing Seafood Watch�
recommendations. <http://www.montereybayaquarium.org/cr/cr_seafoodwatch/content/media/MBA_SeafoodWatch_NationalGuide.pdf>Retrieved 06.03.12.
Monterey Bay Aquarium (2012b, January 2012). Monterey bay aquarium nationalseafood watch guide. <http://www.montereybayaquarium.org/cr/cr_seafoodwatch/content/media/MBA_SeafoodWatch_NationalGuide.pdf>Retrieved 06.03.12.
Narasimhan, C., & Sen, S. K. (1983). New product models for test market data.Journal of Marketing, 47(1), 11–24.
Nisbet, E. K., Zelenski, J. M., & Murphy, S. A. (2009). The nature relatedness scale.Linking individuals’ connection with nature to environmental concern andbehavior. Environment and Behavior, 41(5), 715–740.
NRDC (2012). Mercury contamination in fish. <http://www.nrdc.org/health/effects/mercury/guide.asp> Retrieved 08.05.12.
Nuñez, M. A., Kuebbing, S., Dimarco, R. D., & Simberloff, D. (2012). Invasive species.To eat or not to eat, that is the question. Conservation Letters.
OEHHA (2001). Chemicals in fish. Consumption of fish and shellfish in california and theUnited States. Final report.
Papp, Z. G., Kerepeczki, E., Pekár, F., & Gál, D. (2007). Natural origins of off-flavoursin fish related to feeding habits. Water Science and Technology, 55(5), 301–309.
Persson, P.-E. (1984). Uptake and release of environmentally occurring odorouscompounds by fish. A review. Water Research, 18(10), 1263–1271.
Pliner, P. (1994). Development of measures of food neophobia in children. Appetite,23(2), 147–163.
Pliner, P., & Hobden, K. (1992). Development of a scale to measure the trait of foodneophobia in humans. Appetite, 19(2), 105–120.
Pliner, P., & Pelchat, M. L. (1991). Neophobia in humans and the special status offoods of animal origin. Appetite, 16(3), 205–218.
Rogers, E. M. (2003). Diffusion of innovations. New York: Free Press.Sanjuán-López, A. I., Philippidis, G., & Resano-Ezcaray, H. (2011). How useful is
acceptability to explain economic value? An application on the introduction ofinnovative saffron products into commercial markets. Food Quality andPreference, 22(3), 255–263.
Sass, G., Cook, T., Irons, K., McClelland, M., Michaels, N., Matthew O’Hara, T., et al.(2010). A mark-recapture population estimate for invasive silver carp(Hypophthalmichthys molitrix) in the La Grange Reach, Illinois River. BiologicalInvasions, 12(3), 433–436.
Schupp, A. R., Makienko, I., Gillespie, J. M., Prinyawiwatkul, W., O’Neil, C. E., & Pavon,N. (2003). Taste panel evaluations of the acceptability and willingness to pay foralternative blends of ground meats. Paper presented at the Southern AgriculturalEconomics Association 2003 annual meeting, February 1–5, 2003, Mobile,Alabama.
Schupp, A. R., Gillespie, J. M., O’Neil, C. E., Prinyawiwatkul, W., & Makienko, I. (2005).The impact of an ‘‘Exotic’’ label on consumer willingness to taste test, purchase,and price a new meat product. Journal of Food Distribution Research, 36(2),50–60.
Semenza, J. C., Hall, D. E., Wilson, D. J., Bontempo, B. D., Sailor, D. J., & George, L. A.(2008). Public perception of climate change. Voluntary mitigation and barriersto behavior change. American Journal of Preventive Medicine, 35(5), 479–487.
Sidhu, K. S. (2003). Health benefits and potential risks related to consumption of fishor fish oil. Regulatory Toxicology and Pharmacology, 38(3), 336–344.
Speir, C., & Brozovic, N. (2006). Supply response of commercial fishermen andimplications for management of invasive Asian carp. Paper presented at the 2006annual meeting, July 23–26, Long Beach, CA.
Stern, P. C. (2000). New environmental theories. Toward a coherent theory ofenvironmentally significant behavior. Journal of Social Issues, 56(3), 407–424.
Story, P. A., & Forsyth, D. R. (2008). Watershed conservation and preservation.Environmental engagement as helping behavior. Journal of EnvironmentalPsychology, 28(4), 305–317.
Tabachek, J.-A. L., & Yurkowski, M. (1976). Isolation and identification of blue-greenalgae producing muddy odor metabolites, Geosmin, and 2-methylisoborneol, insaline lakes in Manitoba. Journal of the Fisheries Research Board of Canada, 33(1),25–35.
US EPA (2002). Estimated per capita fish consumption in the United States.US Department of Energy Energy Information Administration (2012). Annual energy
outlook.Van Voorhees, D., & Lowther, A. (2011). Fisheries of the United States 2010.
Government Printing Office.Verbeke, W., Sioen, I., Pieniak, Z., Camp, J. V., & Henauw, S. D. (2005). Consumer
perception versus scientific evidence about health benefits and safety risks fromfish consumption. Public Health Nutrition, 8(4), 422–429.
Verbeke, W., Vanhonacker, F., Frewer, L. J., Sioen, I., De Henauw, S., & Van Camp, J.(2008). Communicating risks and benefits from fish consumption. Impact onBelgian consumers’ perception and intention to eat fish. Risk Analysis. AnInternational Journal, 28(4), 951–967.
VerCauteren, K. C., Anderson, C. W., van Deelen, T. R., Drake, D., Walter, W. D.,Vantassel, S. M., et al. (2011). Regulated commercial harvest to manageoverabundant white-tailed deer. An idea to consider? Wildlife Society Bulletin,35(3), 185–194.
Weis, J. S. (2011). Invasion and predation in aquatic ecosystems. Current Zoology,57(5), 613–624.
S. Varble, S. Secchi / Appetite 65 (2013) 58–67 67