Developing an Erosion Risk Map Using Soft Computing Methods (Case Study at Sifnos Island
Upload
khangminh22Category
view
4download
0
U.S. Department of the InteriorU.S. Geological Survey
COMPARISON OF METHODS FOR COMPUTINGSTREAMFLOW STATISTICS FORPENNSYLVANIA STREAMS
by Marla H. Ehlke and Lloyd A. Reed
Water-Resources Investigations Report 99-4068
prepared in cooperation with the
PENNSYLVANIA DEPARTMENT OF TRANSPORTATION
Lemoyne, Pennsylvania1999

ii
U.S. DEPARTMENT OF THE INTERIORBRUCE BABBITT, Secretary
U.S. GEOLOGICAL SURVEY
Charles G. Groat, Director
For additional information Copies of this report may bewrite to: purchased from:
District Chief U.S. Geological SurveyU.S. Geological Survey Branch of Information Services840 Market Street Box 25286Lemoyne, Pennsylvania 17043-1584 Denver, Colorado 80225-0286
iii
Abstract . . . . . . . . . . . . . . . . . . . . . . . . . . . . . . . . . . . . . . . . . . . . . . . . . . . . . . . . . . . . . . . . . . . . . . . . . . . . . . . . . . . . 1
Introduction . . . . . . . . . . . . . . . . . . . . . . . . . . . . . . . . . . . . . . . . . . . . . . . . . . . . . . . . . . . . . . . . . . . . . . . . . . . . . . . . 1
Purpose and scope. . . . . . . . . . . . . . . . . . . . . . . . . . . . . . . . . . . . . . . . . . . . . . . . . . . . . . . . . . . . . . . . . . . . . . 2
Previous investigations. . . . . . . . . . . . . . . . . . . . . . . . . . . . . . . . . . . . . . . . . . . . . . . . . . . . . . . . . . . . . . . . . . 2
Methods for computing streamflow statistics . . . . . . . . . . . . . . . . . . . . . . . . . . . . . . . . . . . . . . . . . . . . . . . . . . . . 3
Log-Pearson distribution of gaged streamflow data . . . . . . . . . . . . . . . . . . . . . . . . . . . . . . . . . . . . . . . . . 3
Regional regression equations. . . . . . . . . . . . . . . . . . . . . . . . . . . . . . . . . . . . . . . . . . . . . . . . . . . . . . . . . . . . 3
WRI 82-21. . . . . . . . . . . . . . . . . . . . . . . . . . . . . . . . . . . . . . . . . . . . . . . . . . . . . . . . . . . . . . . . . . . . . . . . 3
Low flow . . . . . . . . . . . . . . . . . . . . . . . . . . . . . . . . . . . . . . . . . . . . . . . . . . . . . . . . . . . . . . . . . . . 4
Flood flow . . . . . . . . . . . . . . . . . . . . . . . . . . . . . . . . . . . . . . . . . . . . . . . . . . . . . . . . . . . . . . . . . 10
PSU-IV . . . . . . . . . . . . . . . . . . . . . . . . . . . . . . . . . . . . . . . . . . . . . . . . . . . . . . . . . . . . . . . . . . . . . . . . . 13
Comparison of Log-Pearson distribution to regional regression equations for gaged locations onPennsylvania streams . . . . . . . . . . . . . . . . . . . . . . . . . . . . . . . . . . . . . . . . . . . . . . . . . . . . . . . . . . . . . . . . . . . . 16
Low-flow statistics computed from Log-Pearson distribution and WRI 82-21 regionalregression equations . . . . . . . . . . . . . . . . . . . . . . . . . . . . . . . . . . . . . . . . . . . . . . . . . . . . . . . . . . . . . . . . . 16
Streams with flow unaffected by carbonate bedrock, mining, or regulation. . . . . . . . . . . . . . . 16
Streams with flow affected by carbonate bedrock . . . . . . . . . . . . . . . . . . . . . . . . . . . . . . . . . . . . . 18
Streams with flow affected by extensive mining . . . . . . . . . . . . . . . . . . . . . . . . . . . . . . . . . . . . . . 20
Flood-flow statistics computed from Log-Pearson distribution and regional regressionequations . . . . . . . . . . . . . . . . . . . . . . . . . . . . . . . . . . . . . . . . . . . . . . . . . . . . . . . . . . . . . . . . . . . . . . . . . . . 22
WRI 82-21 regional regression equations compared to Log-Pearson distribution . . . . . . . . . . 22
PSU-IV regional regression equations compared to Log-Pearson distribution. . . . . . . . . . . . . 22
Limitations of WRI 82-21 regional regression equations. . . . . . . . . . . . . . . . . . . . . . . . . . . . . . . . . . . . . 25
Summary and conclusions . . . . . . . . . . . . . . . . . . . . . . . . . . . . . . . . . . . . . . . . . . . . . . . . . . . . . . . . . . . . . . . . . . . 26
References cited . . . . . . . . . . . . . . . . . . . . . . . . . . . . . . . . . . . . . . . . . . . . . . . . . . . . . . . . . . . . . . . . . . . . . . . . . . . . 27
Appendix 1. Low-flow statistics for gaged Pennsylvania streams . . . . . . . . . . . . . . . . . . . . . . . . . . . . . . . . . . 29
Appendix 2. Flood-flow statistics for gaged Pennsylvania streams. . . . . . . . . . . . . . . . . . . . . . . . . . . . . . . . . 41
Appendix 3. 7-day 10-year low-flow statistic (Q7,10) computed from Log-Pearson distributionof streamflow data and WRI 82-21 regional regression equations for gaged locations onstreams in Pennsylvania unaffected by carbonate bedrock, extensive mining, or regulation. . . . . . . . 51
Appendix 4. Comparison of streamflow statistics computed using Log-Pearson distributionand regression equations . . . . . . . . . . . . . . . . . . . . . . . . . . . . . . . . . . . . . . . . . . . . . . . . . . . . . . . . . . . . . . . . . 55
Appendix 5. Flood-flow statistics computed from Log-Pearson distribution of streamflow dataand WRI 82-21 regional regression equations for gaged locations on streams inPennsylvania . . . . . . . . . . . . . . . . . . . . . . . . . . . . . . . . . . . . . . . . . . . . . . . . . . . . . . . . . . . . . . . . . . . . . . . . . . . 68
Appendix 6. Flood-flow statistics computed from Log-Pearson distribution of streamflow dataand PSU-IV regional regression equations for gaged locations on streams inPennsylvania . . . . . . . . . . . . . . . . . . . . . . . . . . . . . . . . . . . . . . . . . . . . . . . . . . . . . . . . . . . . . . . . . . . . . . . . . . . 76
CONTENTS
Page
iv
Figures 1-4. Maps showing:
1. Pennsylvania WRI 82-21 low-flow regions . . . . . . . . . . . . . . . . . . . . . . . . . . . . . . . . . 5
2. Distributions of average annual precipitation and potentialevapotranspiration in Pennsylvania . . . . . . . . . . . . . . . . . . . . . . . . . . . . . . . . . . 6
3. Pennsylvania WRI 82-21 flood-flow regions . . . . . . . . . . . . . . . . . . . . . . . . . . . . . . 11
4. Pennsylvania PSU-IV flood-flow regions . . . . . . . . . . . . . . . . . . . . . . . . . . . . . . . . . 14
5-11. Graphs showing:
5. Comparison of 7-day 10-year low-flow statistic (Q7,10) computed fromLog-Pearson distribution of streamflow data and WRI 82-21 regionalregression equations for low-flow region 2. . . . . . . . . . . . . . . . . . . . . . . . . . . . 17
6. Comparison of 7-day 10-year low-flow statistic (Q7,10) computed fromLog-Pearson distribution of streamflow data and WRI 82-21 regionalregression equations for low-flow region 3. . . . . . . . . . . . . . . . . . . . . . . . . . . . 17
7. Comparison of 7-day 10-year low-flow statistic (Q7,10) computed fromLog-Pearson distribution of streamflow data and WRI 82-21 regionalregression equations for gaged locations on streams in Pennsylvaniawith flow affected by carbonate bedrock (at least 10 percent carbonatebedrock) . . . . . . . . . . . . . . . . . . . . . . . . . . . . . . . . . . . . . . . . . . . . . . . . . . . . . . . . . 20
8. Comparison of 7-day 10-year low-flow statistic (Q7,10) computed fromLog-Pearson distribution of streamflow data and WRI 82-21 regionalregression equations for gaged locations on streams in Pennsylvaniawith flow affected by extensive mining. . . . . . . . . . . . . . . . . . . . . . . . . . . . . . . 21
9. Comparison of 100-year flood-flow statistic (Q100) computed from Log-Pearson distribution of streamflow data and WRI 82-21 regionalregression equations for flood-flow region 5W . . . . . . . . . . . . . . . . . . . . . . . . 23
10. Comparison of 100-year flood-flow statistic (Q100) computed from Log-Pearson distribution of streamflow data and WRI 82-21 regionalregression equations for flood-flow region 6A. . . . . . . . . . . . . . . . . . . . . . . . . 23
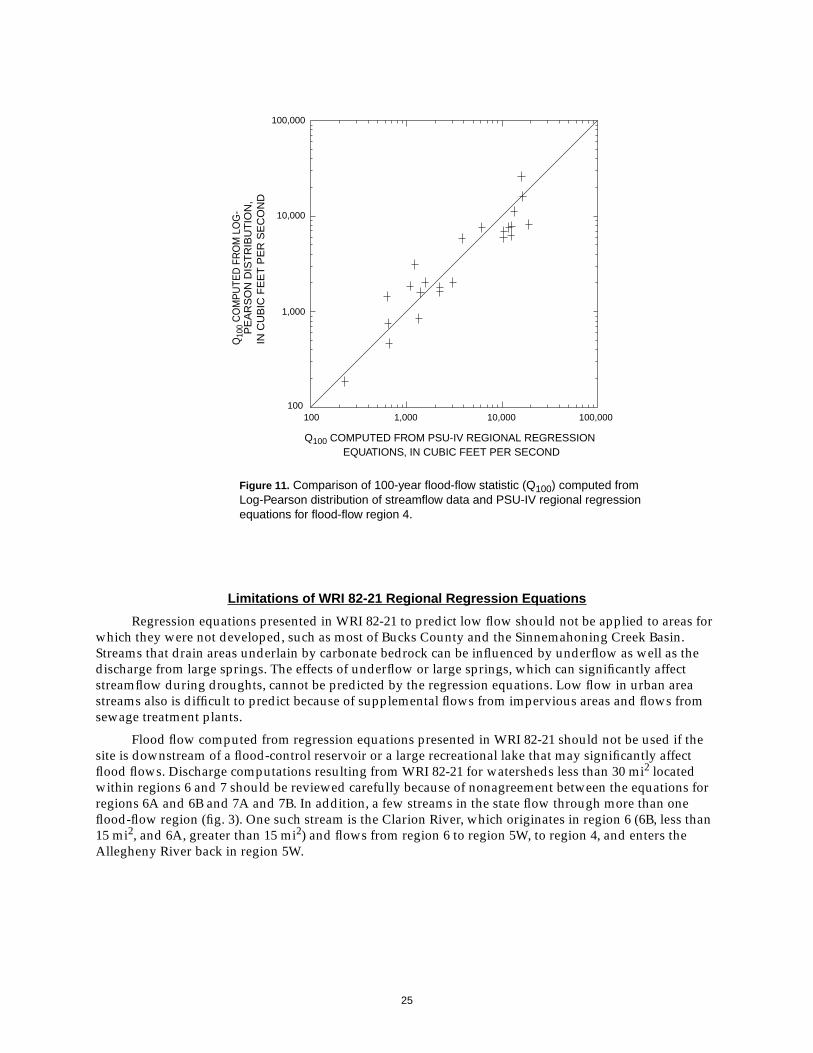
11. Comparison of 100-year flood-flow statistic (Q100) computed from Log-Pearson distribution of streamflow data and PSU-IV regionalregression equations for flood-flow region 4 . . . . . . . . . . . . . . . . . . . . . . . . . . 25
ILLUSTRATIONS
Page

v
Table 1. Regression coefficients for use with WRI 82-21 low-flow regional regressionequations for the computation of 7-day 10-year low flow for Pennsylvanialow-flow regions . . . . . . . . . . . . . . . . . . . . . . . . . . . . . . . . . . . . . . . . . . . . . . . . . . . . . . . . . . 5
2. Geologic index weights for rock-stratigraphic units in Pennsylvania for usewith WRI 82-21 low-flow regional regression equations . . . . . . . . . . . . . . . . . . . . . . . . 7
3. Regression coefficients for use with WRI 82-21 flood-flow regional regressionequations for Pennsylvania flood-flow regions . . . . . . . . . . . . . . . . . . . . . . . . . . . . . . . 12
4. Results of t-test on signed ranks comparing 7-day 10-year low-flow statistic (Q7,10)computed from Log-Pearson distribution of streamflow data and WRI 82-21regional regression equations for Pennsylvania low-flow regions . . . . . . . . . . . . . . . 18
5. 7-day 10-year low-flow statistic (Q7,10) computed from Log-Pearson distribution ofstreamflow data and WRI-82-21 regional regression equations for gagedlocations on streams in Pennsylvania with flow affected by carbonate bedrock . . . 19
6. 7-day 10-year low-flow statistic (Q7,10) computed from Log-Pearson distribution ofstreamflow data and WRI-82-21 regional regression equations for gagedlocations on streams in Pennsylvania with flow affected by extensive mining. . . . . 21
7. Results of t-test on signed-ranks comparing 50- and 100-year flood flows(Q50 and Q100) computed from Log-Pearson distribution of streamflow dataand WRI 82-21 regional regression equations for Pennsylvania flood-flowregions. . . . . . . . . . . . . . . . . . . . . . . . . . . . . . . . . . . . . . . . . . . . . . . . . . . . . . . . . . . . . . . . . . 24
8. Results of t-test on signed-ranks comparing 50- and 100-year flood flows (Q50 and Q100)computed from Log-Pearson distribution of streamflow data and PSU-IVregional regression equations for Pennsylvania flood-flow regions . . . . . . . . . . . . . . 24
TABLES
Page
vi
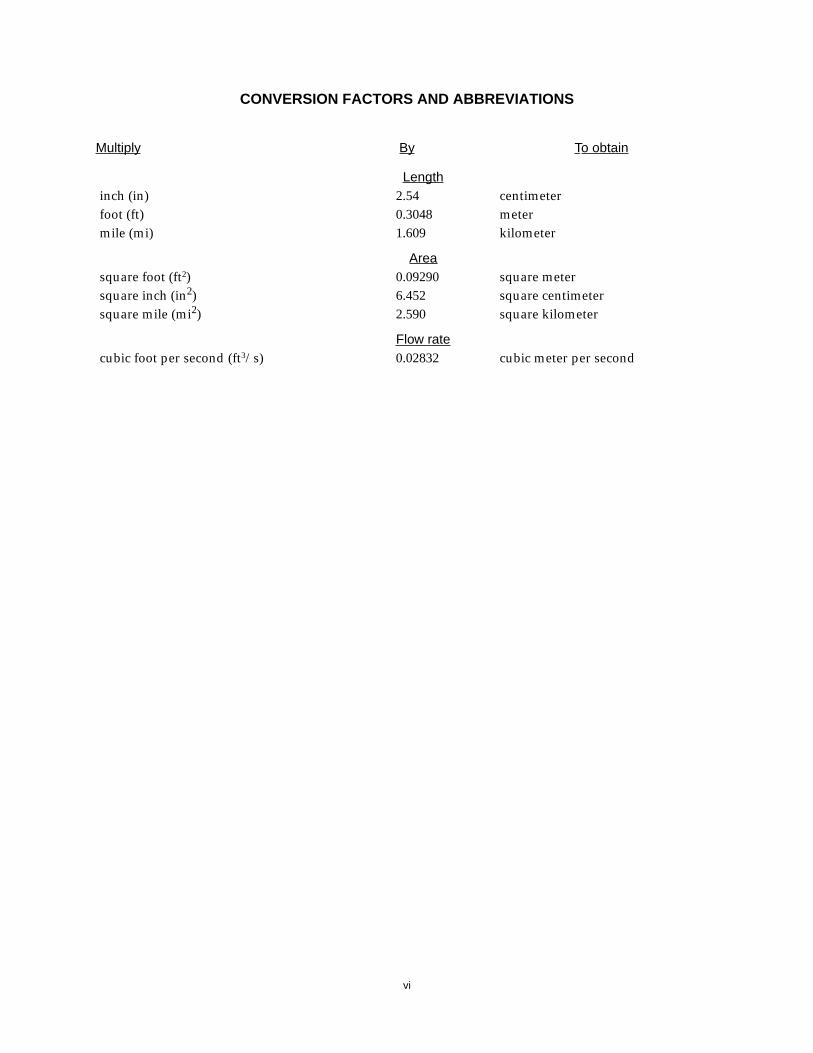
Multiply By To obtain
Lengthinch (in) 2.54 centimeterfoot (ft) 0.3048 metermile (mi) 1.609 kilometer
Areasquare foot (ft2) 0.09290 square metersquare inch (in2) 6.452 square centimetersquare mile (mi2) 2.590 square kilometer
Flow ratecubic foot per second (ft3/s) 0.02832 cubic meter per second
CONVERSION FACTORS AND ABBREVIATIONS
1
COMPARISON OF METHODS FOR COMPUTINGSTREAMFLOW STATISTICS
FOR PENNSYLVANIA STREAMS
by Marla H. Ehlke and Lloyd A. Reed
ABSTRACT
Methods for computing streamflow statistics intended for use on ungaged locations onPennsylvania streams are presented and compared to frequency distributions of gaged streamflow data.The streamflow statistics used in the comparisons include the 7-day 10-year low flow, 50-year flood flow,and the 100-year flood flow; additional statistics are presented. Streamflow statistics for gaged locations onstreams in Pennsylvania were computed using three methods for the comparisons: 1) Log-Pearson typeIII frequency distribution (Log-Pearson) of continuous-record streamflow data, 2) regional regressionequations developed by the U.S. Geological Survey in 1982 (WRI 82-21), and 3) regional regressionequations developed by the Pennsylvania State University in 1981 (PSU-IV). Log-Pearson distribution wasconsidered the reference method for evaluation of the regional regression equations. Low-flow statisticswere computed using the Log-Pearson distribution and WRI 82-21, whereas flood-flow statistics werecomputed using all three methods. The urban adjustment for PSU-IV was modified from therecommended computation to exclude Philadelphia and the surrounding areas (region 1) from theadjustment. Adjustments for storage area for PSU-IV were also slightly modified.
A comparison of the 7-day 10-year low flow computed from Log-Pearson distribution and WRI-82-21 showed that the methods produced significantly different values for about 7 percent of the state. Thesame methods produced 50-year and 100-year flood flows that were significantly different for about24 percent of the state. Flood-flow statistics computed using Log-Pearson distribution and PSU-IV werenot significantly different in any regions of the state. These findings are based on a statistical comparisonusing the t-test on signed ranks and graphical methods.
INTRODUCTION
Reliable low-flow statistics are used by planners to estimate available surface-water supplies, and byregulatory agencies to evaluate applications for permits for irrigation and water-supply withdrawals fromstreams as well as applications for permits for wastewater discharges. The quantity and quality ofwastewater that can be discharged into a stream and the level of treatment required for the wastewater isdependent on low flow because of the dilution capacity of the stream. A commonly used low-flow statisticfor regulatory purposes is the 7-day 10-year low-flow statistic (Q7,10), which is the average minimumstreamflow that can be expected for 7 consecutive days once every 10 years. The 1- and 30-day 10-yearlow-flow statistics (Q1,10 and Q30,10), which are the average minimum streamflows expected for 1 and30 days, respectively, once every 10 years, can be used for analyzing and utilizing low-flow data.
Reliable flood-flow statistics are essential to engineers who design construction projects and toplanners who must develop and implement flood-plain management techniques. The size, style, anddesign of flood-control structures, bridges, and culverts are dependent on the magnitude of the predictedflood flow. Reliable flood-flow statistics are needed to ensure safety and to prevent overspending. Floodscan be destructive and dangerous, especially if a structure designed to withstand an estimated flood failsbecause of an underestimation of flood flows. Statistics commonly used for evaluating flood flow forconstruction projects include the flow that can be expected every 10, 25, 50, 100, and 500 years (Q10, Q25,Q50, Q100, and Q500, respectively).
2
The U.S. Geological Survey (USGS), in cooperation with the Pennsylvania Department ofTransportation (PennDOT), compared methods of computing low-flow and flood-flow statistics for gagedlocations on streams in Pennsylvania. When streamflow statistics are needed on reaches of streamswithout a nearby streamflow-gaging station, methods other than the Log-Pearson type III frequencydistribution of measured streamflow data are used to compute the statistics. Regional regression equationsare one of the other methods used to compute streamflow statistics. Regional regression equationspresented by Flippo (1982b) of the USGS, and Aron and Kibler (1981) of the Pennsylvania State Universityare widely used to compute streamflow statistics for ungaged reaches of streams. This report presents acomparison of both low-flow and flood-flow statistics for gaged streams in Pennsylvania computed fromthe Log-Pearson type III frequency distribution of measured streamflow data and from regional regressionequations.
Purpose and Scope
This report compares methods for computing streamflow statistics at gaged locations onPennsylvania streams. Although several different methods can be used to determine streamflow statistics,this report will focus on the following three methods: 1) Log-Pearson type III frequency distribution ofcontinuous-record gaged streamflow data, hereafter referred to as Log-Pearson, 2) regional regressionequations developed for Pennsylvania streams by Flippo (1982b), hereafter referred to as WRI 82-21, and3) regional regression equations developed by the Pennsylvania State University (Aron and Kibler, 1981),hereafter referred to as PSU-IV. Log-Pearson analysis of gaged streamflow data is the methodologyadopted by the Federal agencies participating on the Hydrology Committee of the Water ResourcesCouncil (1981) and is considered the reference point for evaluation of the regional regression equations.The low-flow method comparison uses Q7,10 because it is the only low-flow statistic that can be estimatedby WRI 82-21. The statistics Q50 and Q100 can be estimated by WRI 82-21 and PSU-IV and are used in theflood-flow comparison to compare as many overlapping statistics as possible.
This report compares the Q7,10 computed from Log-Pearson analysis of continuous-record gagedstreamflow data with Q7,10 computed from WRI 82-21 regression equations. Because regulation ofstreamflow, underlying carbonate bedrock, and extensive upstream mining can affect the flow of streamsduring droughts, a comparison is made for gaged locations on Pennsylvania streams with flow unaffectedby those factors. Streams with flow affected by underlying carbonate bedrock and extensive upstreammining are compared separately. This report also compares the Q50 and Q100 statistics computed fromLog-Pearson analysis of continuous-record gaged streamflow data with those computed from WRI 82-21regional regression equations and with those computed from PSU-IV regional regression equations. Thecomparison with WRI 82-21 is made for gaged locations on Pennsylvania streams with at least 10 years ofcontinuous record, and the comparison with PSU-IV is made for gaged locations with at least 10 years ofcontinuous record and drainage areas less than 150 mi2 at the site of interest. WRI 82-21 and PSU-IVregional regression equations for computing flood-flow statistics account for streams underlain bycarbonate bedrock through either a separate region (WRI 82-21) or a carbonate adjustment (PSU-IV).
Previous In vestigations
Regional regression equations developed for computing low-flow statistics for ungaged reaches ofstreams in Pennsylvania were presented by Flippo (1982a). Regional regression equations were developedfor estimating flood-flow statistics by Flippo (1977). Both low- and flood-flow regional regressionequations were revised and the updated equations were presented by Flippo in 1982 (1982b). Regionalregression equations developed by the Pennsylvania State University in 1981 (PSU-IV) were an updatedversion of equations previously developed by the Pennsylvania State University (Reich and others, 1971).Low-flow statistics computed by use of the Log-Pearson analysis of gaged streamflow data for Pennsyl-vania streams were published in a report by Page and Shaw (1977). Revised streamflow statistics,incorporating more recent data, have not been published since 1982.
3
METHODS FOR COMPUTING STREAMFLOW STATISTICS
Streams with 10 or more years of continuous record were used to determine selected streamflowstatistics by use of Log-Pearson analysis and regional regression equations for this analysis. Thestreamflow data used were the most complete dataset available at the time of computation. The majorityof the low-flow data runs through the 1995 climatic year (a 12-month period from April 1 to March 31),and the majority of the flood-flow data runs through the 1996 water year (a 12-month period from October1 to September 30).
Log-Pearson Distrib ution of Ga ged Streamflo w Data
Data from streamflow-gaging stations were converted to streamflow statistics by use of the Log-Pearson techniques in the USGS computer-based National Water Data Storage and Retrieval (WATSTORE)system (Hutchison, 1975). The computation of flood-flow statistics in WATSTORE uses the methodologyadopted by the Federal agencies participating on the Hydrology Committee of the Water ResourcesCouncil (1981).
Low-flow data from streamflow-gaging stations can be skewed by an excessive dry or wet period ofrecord, or a short period of record. Low-flow data in such periods can be normalized, which consists ofcorrelating records from the streamflow-gaging station in question with those from a long-termstreamflow-gaging station with similar hydrological conditions and preferably in the same watershed.Two low-flow analyses are made for the long-term station, one for the entire period of record and one forthe period of record in question. The ratio of the long-term low-flow statistic at the index station dividedby the short-term low-flow statistic at the index station resulting from this analysis was multiplied by thelow-flow statistic for the short-term station to determine the normalized low-flow statistic for the short-term station.
A comparison was made between the unadjusted low-flow statistics and normalized low-flowstatistics used in this report for streamflow-gaging stations with a relatively short period of record,averaging 17 years. This comparison of 29 selected streamflow-gaging stations resulted in a medianabsolute value of percentage difference between the unadjusted and normalized equalling 6.3 percent.Low-flow data comparisons in the sections that follow are made to unadjusted low-flow statisticscomputed from Log-Pearson.
Regional Regression Equations
WRI 82-21 and PSU-IV regional regression equations divide Pennsylvania into regions. Each regionhas a separate equation and basin characteristics defining the region. Both methods were based onstreamflow data compiled through the mid 1970’s.
WRI 82-21
In 1982, Flippo presented modified regional regression equations developed to compute low- andflood-flow statistics for ungaged locations on Pennsylvania streams (Flippo, 1982b). The equations weredeveloped by statistical analyses of flow records by use of factors known to affect streamflow. Indeveloping the regional regression equations, linear regressions were performed with statistics computedfrom Log-Pearson as dependent variables and drainage basin characteristics as independent variables(Flippo, 1977). Peripheral stations in the initial partitioning of the regions were retested for ‘fit’ bycomparing their residuals with corresponding residuals that resulted when the station data were includedin the regression analysis for the adjacent group of stations (Flippo, 1982a).
4
Low Flo w
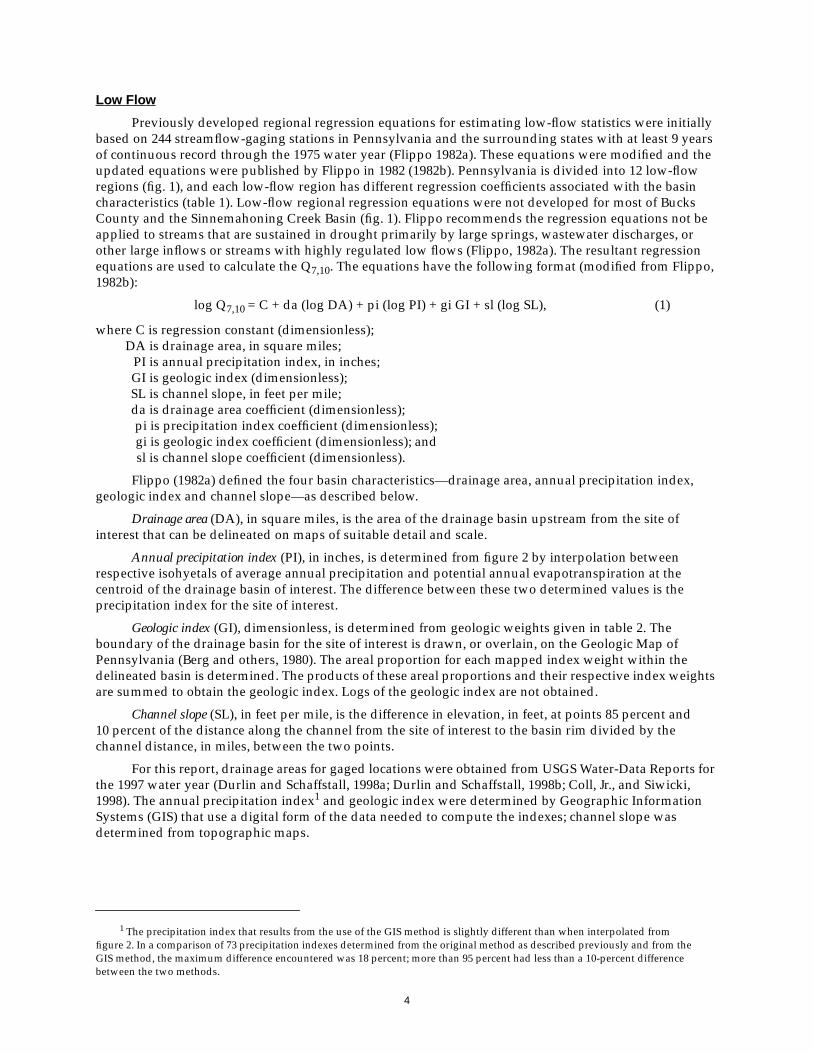
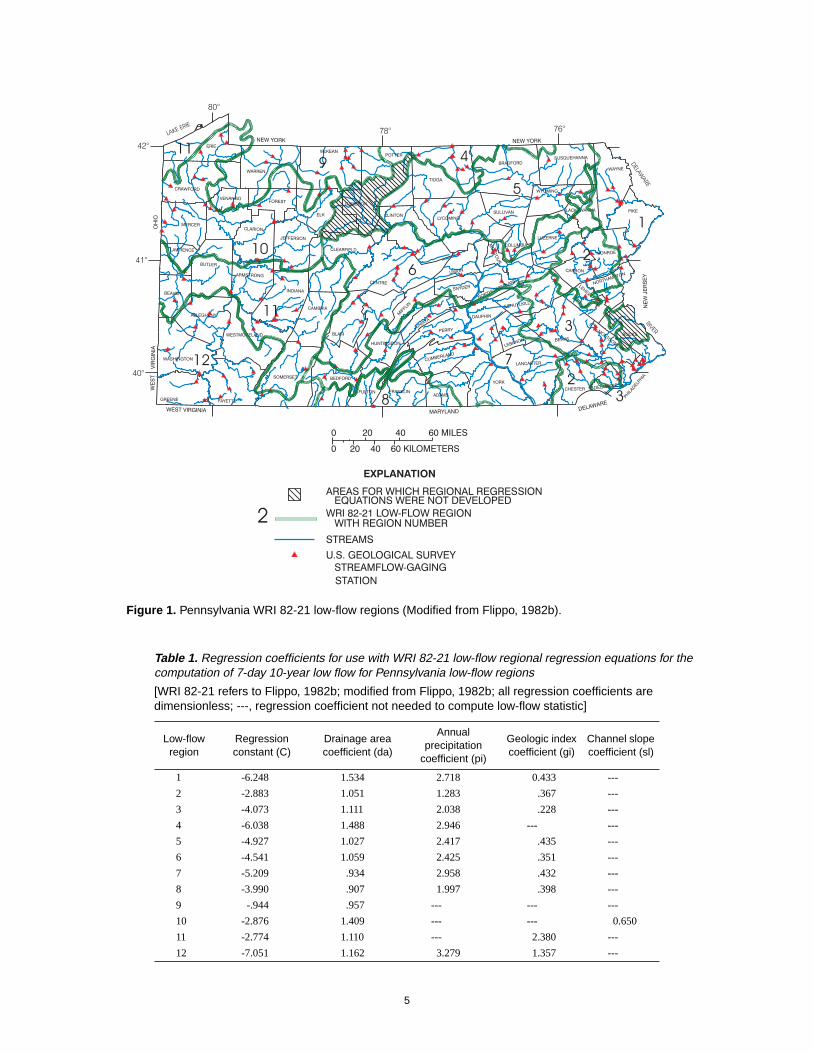
Previously developed regional regression equations for estimating low-flow statistics were initiallybased on 244 streamflow-gaging stations in Pennsylvania and the surrounding states with at least 9 yearsof continuous record through the 1975 water year (Flippo 1982a). These equations were modified and theupdated equations were published by Flippo in 1982 (1982b). Pennsylvania is divided into 12 low-flowregions (fig. 1), and each low-flow region has different regression coefficients associated with the basincharacteristics (table 1). Low-flow regional regression equations were not developed for most of BucksCounty and the Sinnemahoning Creek Basin (fig. 1). Flippo recommends the regression equations not beapplied to streams that are sustained in drought primarily by large springs, wastewater discharges, orother large inflows or streams with highly regulated low flows (Flippo, 1982a). The resultant regressionequations are used to calculate the Q7,10. The equations have the following format (modified from Flippo,1982b):
log Q7,10 = C + da (log DA) + pi (log PI) + gi GI + sl (log SL), (1)
where C is regression constant (dimensionless);DA is drainage area, in square miles;
PI is annual precipitation index, in inches;GI is geologic index (dimensionless);SL is channel slope, in feet per mile;da is drainage area coefficient (dimensionless);pi is precipitation index coefficient (dimensionless);gi is geologic index coefficient (dimensionless); andsl is channel slope coefficient (dimensionless).
Flippo (1982a) defined the four basin characteristics—drainage area, annual precipitation index,geologic index and channel slope—as described below.
Drainage area (DA), in square miles, is the area of the drainage basin upstream from the site ofinterest that can be delineated on maps of suitable detail and scale.
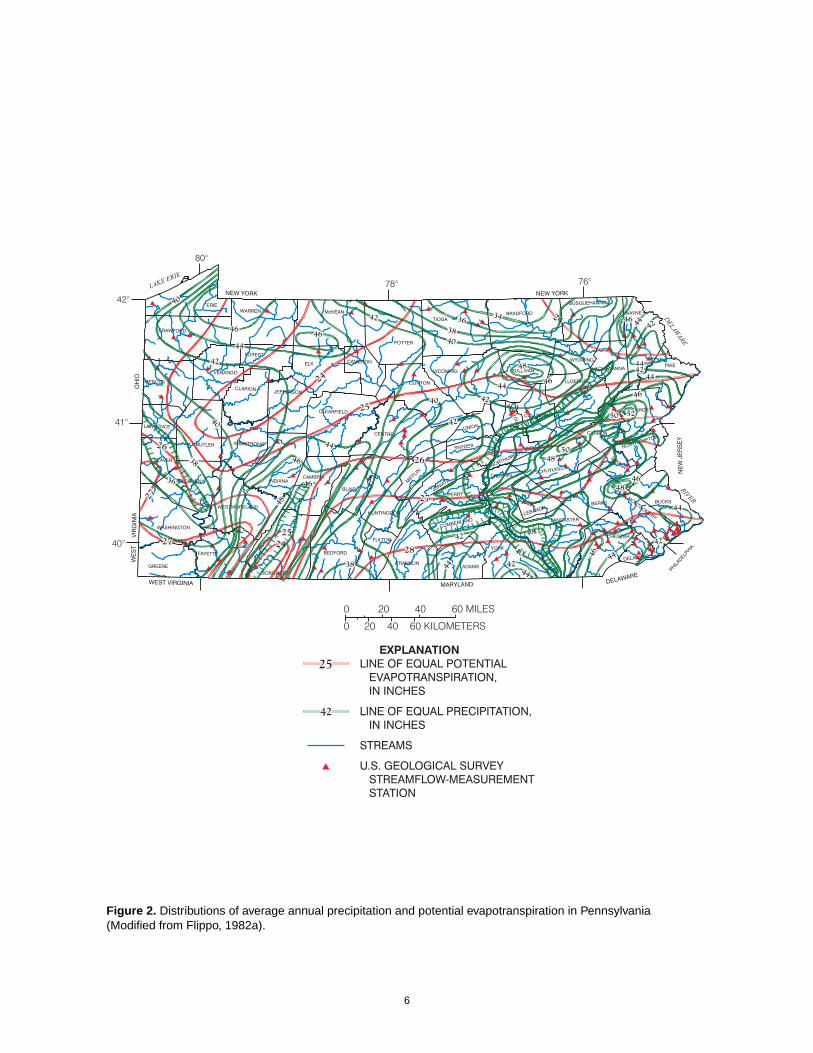
Annual precipitation index (PI), in inches, is determined from figure 2 by interpolation betweenrespective isohyetals of average annual precipitation and potential annual evapotranspiration at thecentroid of the drainage basin of interest. The difference between these two determined values is theprecipitation index for the site of interest.
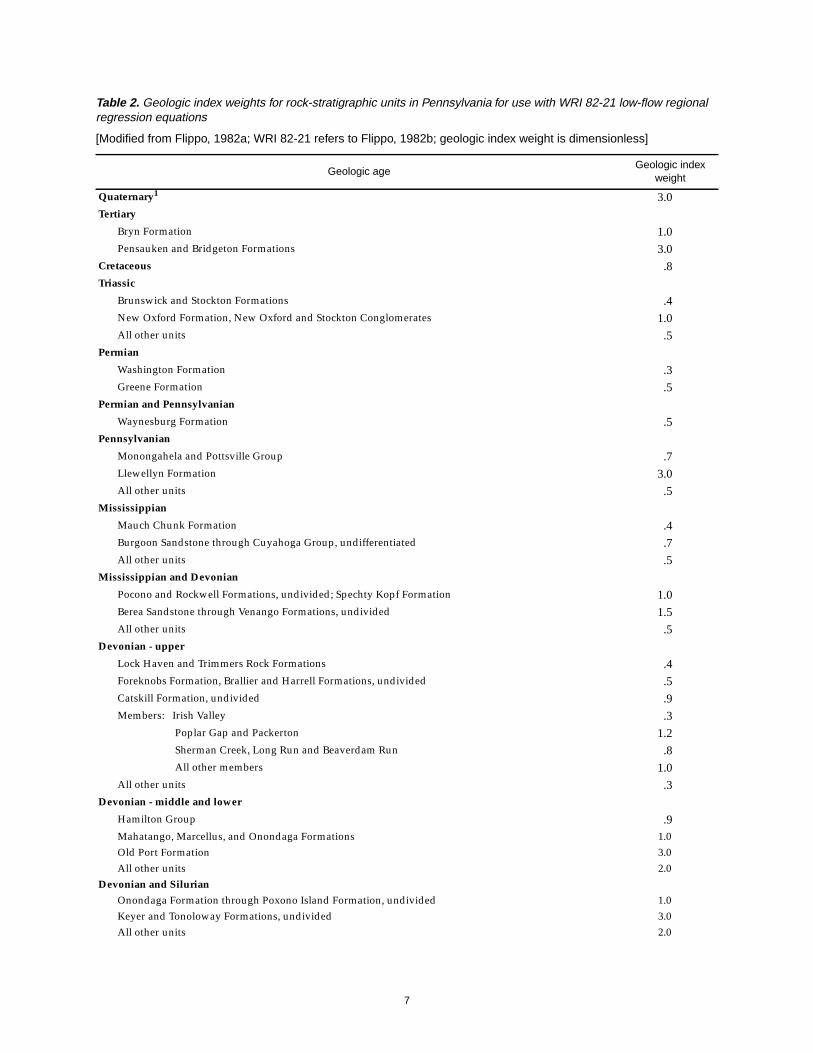
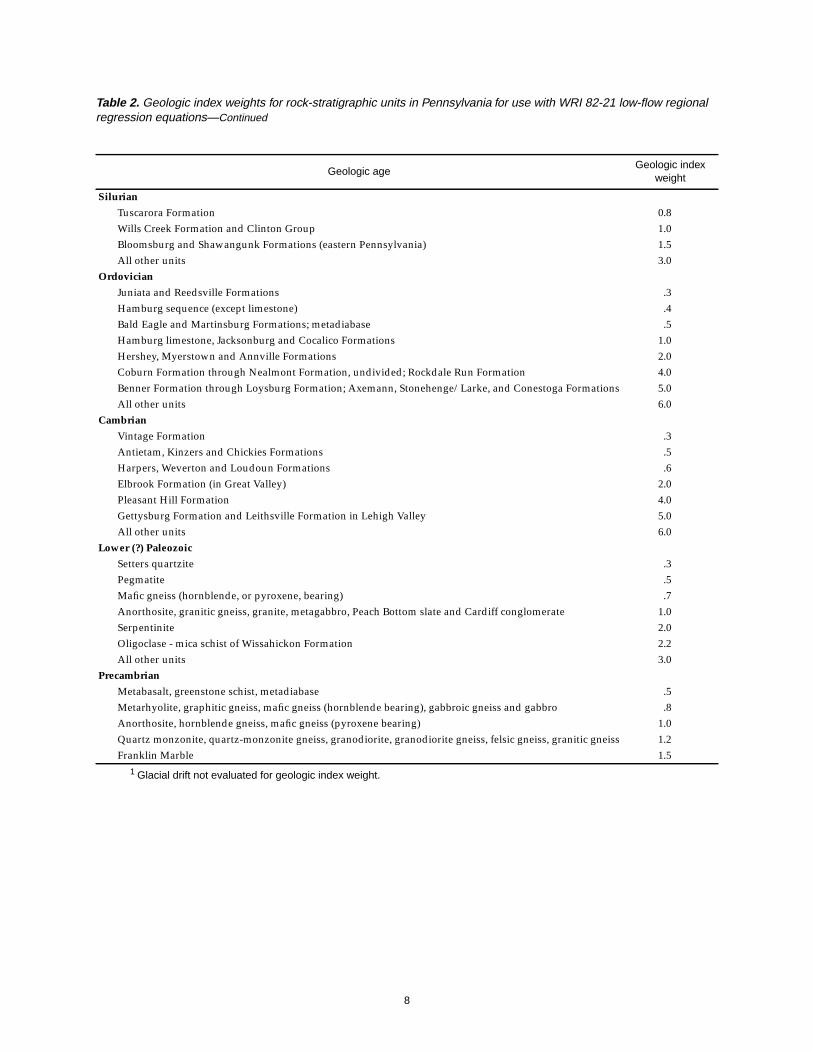
Geologic index (GI), dimensionless, is determined from geologic weights given in table 2. Theboundary of the drainage basin for the site of interest is drawn, or overlain, on the Geologic Map ofPennsylvania (Berg and others, 1980). The areal proportion for each mapped index weight within thedelineated basin is determined. The products of these areal proportions and their respective index weightsare summed to obtain the geologic index. Logs of the geologic index are not obtained.
Channel slope (SL), in feet per mile, is the difference in elevation, in feet, at points 85 percent and10 percent of the distance along the channel from the site of interest to the basin rim divided by thechannel distance, in miles, between the two points.
For this report, drainage areas for gaged locations were obtained from USGS Water-Data Reports forthe 1997 water year (Durlin and Schaffstall, 1998a; Durlin and Schaffstall, 1998b; Coll, Jr., and Siwicki,1998). The annual precipitation index1 and geologic index were determined by Geographic InformationSystems (GIS) that use a digital form of the data needed to compute the indexes; channel slope wasdetermined from topographic maps.
1 The precipitation index that results from the use of the GIS method is slightly different than when interpolated fromfigure 2. In a comparison of 73 precipitation indexes determined from the original method as described previously and from theGIS method, the maximum difference encountered was 18 percent; more than 95 percent had less than a 10-percent differencebetween the two methods.
5
Table 1. Regression coefficients for use with WRI 82-21 low-flow regional regression equations for thecomputation of 7-day 10-year low flow for Pennsylvania low-flow regions
[WRI 82-21 refers to Flippo, 1982b; modified from Flippo, 1982b; all regression coefficients aredimensionless; ---, regression coefficient not needed to compute low-flow statistic]
Low-flowregion
Regressionconstant (C)
Drainage areacoefficient (da)
Annualprecipitation
coefficient (pi)
Geologic indexcoefficient (gi)
Channel slopecoefficient (sl)
1 -6.248 1.534 2.718 0.433 ---2 -2.883 1.051 1.283 .367 ---3 -4.073 1.111 2.038 .228 ---4 -6.038 1.488 2.946 --- ---5 -4.927 1.027 2.417 .435 ---6 -4.541 1.059 2.425 .351 ---7 -5.209 .934 2.958 .432 ---8 -3.990 .907 1.997 .398 ---9 -.944 .957 --- --- ---10 -2.876 1.409 --- --- 0.65011 -2.774 1.110 --- 2.380 ---12 -7.051 1.162 3.279 1.357 ---
Figure 1. Pennsylvania WRI 82-21 low-flow regions (Modified from Flippo, 1982b).
6
Figure 2. Distributions of average annual precipitation and potential evapotranspiration in Pennsylvania(Modified from Flippo, 1982a).
7
Table 2. Geologic index weights for rock-stratigraphic units in Pennsylvania for use with WRI 82-21 low-flow regionalregression equations
[Modified from Flippo, 1982a; WRI 82-21 refers to Flippo, 1982b; geologic index weight is dimensionless]
Geologic ageGeologic index
weight
Quaternary1 3.0Tertiary
Bryn Formation 1.0Pensauken and Bridgeton Formations 3.0
Cretaceous .8Triassic
Brunswick and Stockton Formations .4New Oxford Formation, New Oxford and Stockton Conglomerates 1.0All other units .5
Permian
Washington Formation .3Greene Formation .5
Permian and Pennsylvanian
Waynesburg Formation .5Pennsylvanian
Monongahela and Pottsville Group .7Llewellyn Formation 3.0All other units .5
Mississippian
Mauch Chunk Formation .4Burgoon Sandstone through Cuyahoga Group, undifferentiated .7All other units .5
Mississippian and Devonian
Pocono and Rockwell Formations, undivided; Spechty Kopf Formation 1.0Berea Sandstone through Venango Formations, undivided 1.5All other units .5
Devonian - upper
Lock Haven and Trimmers Rock Formations .4Foreknobs Formation, Brallier and Harrell Formations, undivided .5Catskill Formation, undivided .9Members: Irish Valley .3
Poplar Gap and Packerton 1.2Sherman Creek, Long Run and Beaverdam Run .8All other members 1.0
All other units .3Devonian - middle and lower
Hamilton Group .9Mahatango, Marcellus, and Onondaga Formations 1.0Old Port Formation 3.0All other units 2.0
Devonian and Silurian
Onondaga Formation through Poxono Island Formation, undivided 1.0Keyer and Tonoloway Formations, undivided 3.0All other units 2.0
8
Silurian
Tuscarora Formation 0.8Wills Creek Formation and Clinton Group 1.0Bloomsburg and Shawangunk Formations (eastern Pennsylvania) 1.5All other units 3.0
Ordovician
Juniata and Reedsville Formations .3Hamburg sequence (except limestone) .4Bald Eagle and Martinsburg Formations; metadiabase .5Hamburg limestone, Jacksonburg and Cocalico Formations 1.0Hershey, Myerstown and Annville Formations 2.0Coburn Formation through Nealmont Formation, undivided; Rockdale Run Formation 4.0Benner Formation through Loysburg Formation; Axemann, Stonehenge/Larke, and Conestoga Formations 5.0All other units 6.0
Cambrian
Vintage Formation .3Antietam, Kinzers and Chickies Formations .5Harpers, Weverton and Loudoun Formations .6Elbrook Formation (in Great Valley) 2.0Pleasant Hill Formation 4.0Gettysburg Formation and Leithsville Formation in Lehigh Valley 5.0All other units 6.0
Lower (?) Paleozoic
Setters quartzite .3Pegmatite .5Mafic gneiss (hornblende, or pyroxene, bearing) .7Anorthosite, granitic gneiss, granite, metagabbro, Peach Bottom slate and Cardiff conglomerate 1.0Serpentinite 2.0Oligoclase - mica schist of Wissahickon Formation 2.2All other units 3.0
Precambrian
Metabasalt, greenstone schist, metadiabase .5Metarhyolite, graphitic gneiss, mafic gneiss (hornblende bearing), gabbroic gneiss and gabbro .8Anorthosite, hornblende gneiss, mafic gneiss (pyroxene bearing) 1.0Quartz monzonite, quartz-monzonite gneiss, granodiorite, granodiorite gneiss, felsic gneiss, granitic gneiss 1.2Franklin Marble 1.5
1 Glacial drift not evaluated for geologic index weight.
Table 2. Geologic index weights for rock-stratigraphic units in Pennsylvania for use with WRI 82-21 low-flow regionalregression equations—Continued
[Modified from Flippo, 1982a; WRI 82-21 refers to Flippo, 1982b; geologic index weight is dimensionless]
Geologic ageGeologic index
weight

9
The following example illustrates the use of a regional regression equation (1):
Example: Estimate the 7-day 10-year low flow of Northkill Creek, a tributary of Tulpehocken Creek,at its mouth.
1. From figure 1, the site is located in low-flow region 3.2. Table 1 indicates that drainage area (DA), annual precipitation index (PI), and
geologic index (GI) are needed to compute an estimate.3. From topographic maps, the drainage area is determined as 42.1 mi2.4. Annual precipitation and average potential evapotranspiration obtained from
figure 2 are used to compute PI as:PI = 46.1 in. - 26.8 in.PI = 19.3 in.
5. From the Geologic Map of Pennsylvania (Berg and others, 1980) and table 2, atabulation like the following is prepared to compute GI:
6. The substituted regression equation is:log Q7,10 = -4.073 + 1.111(log 42.1) + 2.038(log 19.3) + (0.228)(0.54)
7. Solution of the equation gives:log Q7,10 = 0.475Q7,10 = 2.98 ft3/s.
Rock Unit Symbol Rock Unit Approximate Fractionin basin
GI weight (Table 2) GI fraction
Ss Shawangunk Fm. 0.125 1.5 0.188Ohsg/Oh Hamburg Sequence 0.875 0.4 0.350
1.00 GI = 0.54

10
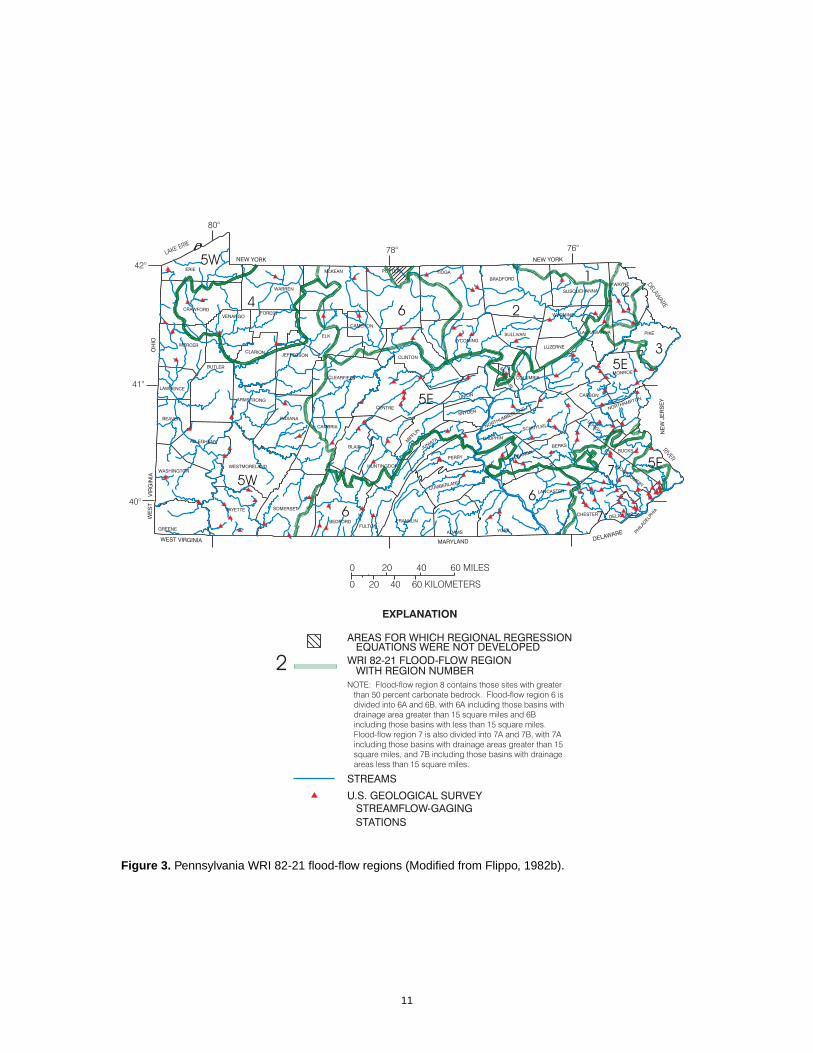
Flood Flo w
Previously developed regression equations for estimating flood-flow statistics were initially basedon peak-discharge records from 400 streamflow-gaging stations with at least 9 years of continuous record(except for 21 records with 7-9 years) through the 1972 water year (Flippo, 1977). The equations weremodified to their present form in 1982 by use of peak-flow records throughout the 1975 water year (Flippo,1982b). Pennsylvania is divided into flood-flow regions as shown in figure 3. Flood-flow region 8 includesthose streams with at least 50 percent carbonate bedrock underlying the basin at the site of interest (Flippo,1977). The regression coefficients associated with basin characteristics in the flood-flow regressionequations for Q50 and Q100 are listed in table 3. The equations have the following format (modified fromFlippo, 1982b):
log Q50 or Q100 = C + da (log DA) + fr (log FR) + pi (log PI) + sl (log SL) + st (log ST) + el (log EL), (2)
where C is regression constant (dimensionless);DA is drainage area, in square miles;FR is percentage forest;PI is annual precipitation index, in inches;SL is channel slope, in feet per mile;ST is percentage storage;EL is mean basin elevation in hundreds of feet above sea level;da is drainage area coefficient (dimensionless);fr is percentage forest coefficient (dimensionless);pi is precipitation index coefficient (dimensionless);sl is channel slope coefficient (dimensionless);st is percentage storage coefficient (dimensionless); andel is mean basin elevation coefficient (dimensionless).
Flippo (1977) defined the basin characteristics—percentage forest, percentage basin storage, andmean basin elevation—as described below. Drainage area, annual precipitation index, and channel slopeare defined on p. 4.
Percentage forest (FR) at the site of interest is the percentage of drainage area within the basin that isforested plus 1.0 percent.
Percentage storage (ST) at the site of interest is the percentage of storage area (lakes, ponds, andswamps) within the basin plus 1.0 percent.
Mean basin elevation (EL), in hundreds of feet above sea level, is the mean elevation of the basin.
For this report, drainage areas were obtained from USGS Water-Data Reports for the 1997 water year(Durlin and Schaffstall, 1998a; Durlin and Schaffstall, 1998b; Coll, Jr., and Siwicki, 1998). The annualprecipitation index and percentage forest were determined by GIS methods; channel slope, percentagestorage, and mean basin elevation were determined from topographic maps.
11
Figure 3. Pennsylvania WRI 82-21 flood-flow regions (Modified from Flippo, 1982b).

12
Table 3. Regression coefficients for use with WRI 82-21 flood-flow regional regression equations for Pennsylvaniaflood-flow regions
[WRI 82-21 refers to Flippo, 1982b; modified from Flippo, 1982b; all regression coefficients are dimensionless;coefficients needed to compute Q50 are not shaded; coefficients needed to compute Q100 are shaded; regions 6Aand 7A include drainage areas greater than 15 square miles; regions 6B and 7B include drainage areas less than15 square miles; region 8 includes basins underlain by at least 50 percent carbonate bedrock; ---, regressioncoefficient not needed to compute flood-flow statistic]
Flood-flowregion
Regressionconstant
(C)
Drainagearea
coefficient(da)
Percent forestcoefficient
(fr)
Annualprecipitationcoefficient
(pi)
Channelslope
coefficient(sl)
Percentstorage
coefficient(st)
Mean basinelevationcoefficient
(el)
1 1.217 1.003 --- --- 0.443 --- ---1.283 .994 --- --- .450 --- ---
2 2.684 .744 --- --- --- --- ---2.791 .733 --- --- --- --- ---
3 2.130 .875 --- --- --- --- ---2.196 .888 --- --- --- --- ---
4 2.243 .756 --- --- --- --- ---2.293 .754 --- --- --- --- ---
5E 1.356 .745 --- 0.945 --- --- ---1.365 .727 --- 1.041 --- --- ---
5W 2.443 .757 --- --- --- --- ---2.518 .751 --- --- --- --- ---
6A 2.505 .790 --- --- --- --- ---2.633 .775 --- --- --- --- ---
6B 3.250 .981 -0.496 --- --- --- ---3.382 1.001 -.519 --- --- --- ---
7A 2.883 .727 -.142 --- --- --- ---2.950 .706 -.100 --- --- --- ---
7B 2.890 .871 --- --- --- -0.574 ---2.986 .878 --- --- --- -.430 ---
8 2.401 .819 .593 --- --- --- -1.1272.587 .820 .604 --- --- --- -1.323

13
The following example illustrates the use of a regional regression equation (2):
Example: Estimate the 100-year flood flow of Northkill Creek, a tributary of Tulpehocken Creek, at itsmouth.
1. From figure 3, the site is located in flood-flow region 5E.2. Table 3 indicates that drainage area (DA) and annual precipitation index (PI)
are needed to compute an estimate.3. From topographic maps, the drainage area is determined as 42.1 mi2.4. Annual precipitation and average potential evapotranspiration obtained from
figure 2 are used to compute PI as:PI = 46.1 in. - 26.8 in.PI = 19.3 in.
5. The substituted regression equation is:log Q100 = 1.365 + 0.727(log 42.1) + 1.041(log 19.3)
6. Solution of the equation gives:log Q100 = 3.884Q100 = 7,660 ft3/s.
PSU-IV
The Pennsylvania State University developed PSU-IV in 1981 to estimate flood peaks with returnperiods from 2 to 200 years through a two-step graphical procedure (Aron and Kibler, 1981). PSU-IV isbased on streamflow data collected through 1977 from 129 Pennsylvania watersheds (Aron and Kibler,1981). Pennsylvania is divided into four flood-frequency regions (fig. 4). The variables needed to calculateflood flows by use of PSU-IV include drainage area, percentage forested, basin divide elevation, skewcoefficient, and standard deviation (Aron and Kibler, 1981). Aron and Kibler (1981) defined these variablesas described below:
Drainage area, in square miles, is the area of the watershed above the site of interest.
Percentage forest is the percentage of the watershed covered by forest.
Basin divide elevation (elevation of the divide), in feet above mean sea level, is the elevation of thepoint on the watershed boundary to which the longest collector has been extended.
Skew coefficient is the generalized skew coefficient of logarithms of annual maximum streamflow forthe watershed of interest.
Standard deviation is the generalized standard deviation of logarithms of annual maximumstreamflow for the watershed of interest.
Adjustments to the estimated flood peak are recommended for basins with urbanization, storagearea (lakes, swamps, and reservoirs), carbonate bedrock, and small drainage area (Aron and Kibler, 1981).PSU-IV recommends that urban adjustments be applied to basins with greater than 2 percent imperviousarea (Aron and Kibler, 1981). For storage-area adjustments, PSU-IV recommends application if a portion ofthe basin has the flood storage area capability to hold 0.2 ft of runoff (Aron and Kibler, 1981). PSU-IVrecommends that carbonate-bedrock adjustment be applied to basins with greater than or equal to3 percent carbonate bedrock (Aron and Kibler, 1981). Basins less than 1.5 mi2 should have small drainagearea adjustments (Aron and Kibler, 1981). All adjustments for this report were made as suggested inProcedure PSU-IV for estimating design flood peaks on ungaged Pennsylvania watersheds (Aron and Kibler, 1981)except the adjustments for urbanization and storage area were simplified.

14
The adjustment for urbanization was simplified by use of a relation between percentage imperviousand adjustment ratio defined by
urban flood ratio = (percentage impervious)x (3)
Qt is the flood discharge for return interval (t).
Percentage impervious is dependent on the classification of land use and its correspondingcoefficient. These coefficients were determined from road and farmstead densities throughout the state ontopographic maps.
Qt x
10 0.211
25 .188
50 .173
100 .168
500 .156
low intensity developed —0.25high intensity residential — .45high intensity commercial/industrial — .60crops (agriculture) — .015grass — .05forest — .008barren — .01
Figure 4. Pennsylvania PSU-IV flood-flow regions (Modified from Aron and Kibler, 1981).
15
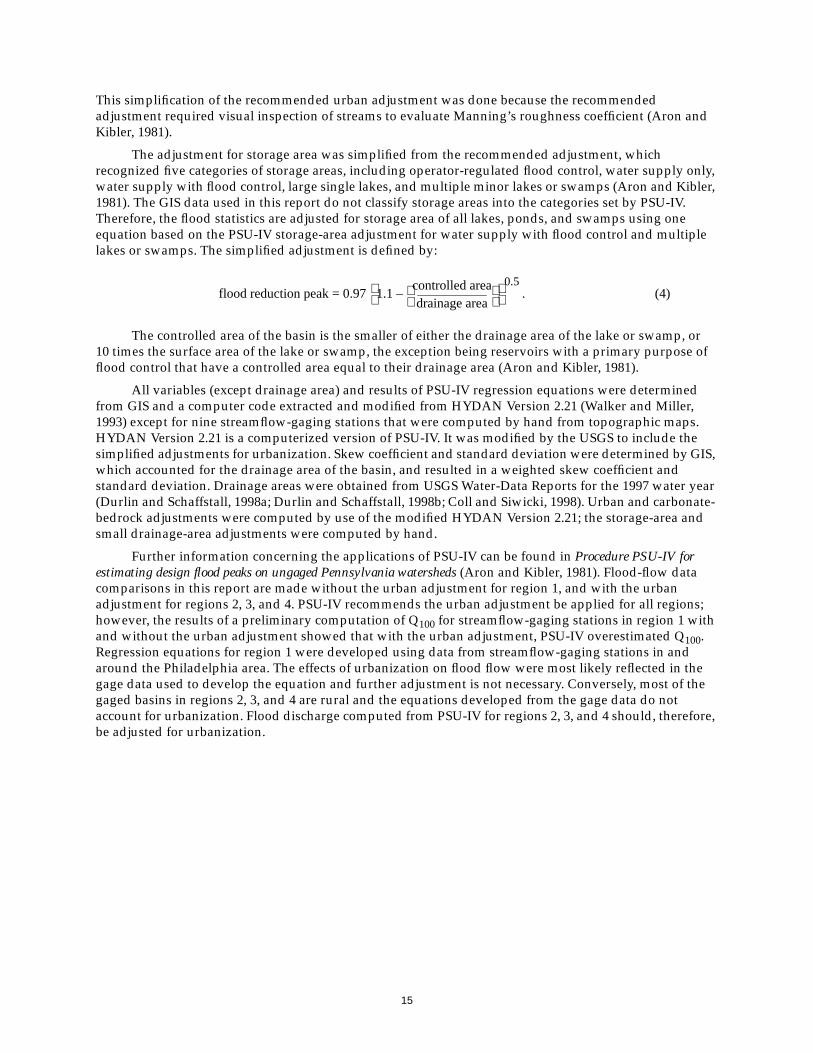
This simplification of the recommended urban adjustment was done because the recommendedadjustment required visual inspection of streams to evaluate Manning’s roughness coefficient (Aron andKibler, 1981).
The adjustment for storage area was simplified from the recommended adjustment, whichrecognized five categories of storage areas, including operator-regulated flood control, water supply only,water supply with flood control, large single lakes, and multiple minor lakes or swamps (Aron and Kibler,1981). The GIS data used in this report do not classify storage areas into the categories set by PSU-IV.Therefore, the flood statistics are adjusted for storage area of all lakes, ponds, and swamps using oneequation based on the PSU-IV storage-area adjustment for water supply with flood control and multiplelakes or swamps. The simplified adjustment is defined by:
. (4)
The controlled area of the basin is the smaller of either the drainage area of the lake or swamp, or10 times the surface area of the lake or swamp, the exception being reservoirs with a primary purpose offlood control that have a controlled area equal to their drainage area (Aron and Kibler, 1981).
All variables (except drainage area) and results of PSU-IV regression equations were determinedfrom GIS and a computer code extracted and modified from HYDAN Version 2.21 (Walker and Miller,1993) except for nine streamflow-gaging stations that were computed by hand from topographic maps.HYDAN Version 2.21 is a computerized version of PSU-IV. It was modified by the USGS to include thesimplified adjustments for urbanization. Skew coefficient and standard deviation were determined by GIS,which accounted for the drainage area of the basin, and resulted in a weighted skew coefficient andstandard deviation. Drainage areas were obtained from USGS Water-Data Reports for the 1997 water year(Durlin and Schaffstall, 1998a; Durlin and Schaffstall, 1998b; Coll and Siwicki, 1998). Urban and carbonate-bedrock adjustments were computed by use of the modified HYDAN Version 2.21; the storage-area andsmall drainage-area adjustments were computed by hand.
Further information concerning the applications of PSU-IV can be found in Procedure PSU-IV forestimating design flood peaks on ungaged Pennsylvania watersheds (Aron and Kibler, 1981). Flood-flow datacomparisons in this report are made without the urban adjustment for region 1, and with the urbanadjustment for regions 2, 3, and 4. PSU-IV recommends the urban adjustment be applied for all regions;however, the results of a preliminary computation of Q100 for streamflow-gaging stations in region 1 withand without the urban adjustment showed that with the urban adjustment, PSU-IV overestimated Q100.Regression equations for region 1 were developed using data from streamflow-gaging stations in andaround the Philadelphia area. The effects of urbanization on flood flow were most likely reflected in thegage data used to develop the equation and further adjustment is not necessary. Conversely, most of thegaged basins in regions 2, 3, and 4 are rural and the equations developed from the gage data do notaccount for urbanization. Flood discharge computed from PSU-IV for regions 2, 3, and 4 should, therefore,be adjusted for urbanization.
flood reduction peak = 0.97 1.1controlled areadrainage area
– 0.5

16
COMPARISON OF LOG-PEARSON DISTRIBUTION TO REGIONAL REGRESSIONEQUATIONS FOR GAGED LOCATIONS ON PENNSYLVANIA STREAMS
Streamflow statistics (Q7,10, Q50, and Q100) computed from Log-Pearson analysis of gagedstreamflow data and equivalent statistics computed for each streamflow-gaging station by use of theappropriate regional regression equations were compared graphically and with a t-test on signed ranks(Helsel and Hirsch, 1997).
The t-test on signed ranks is a nonparametric test used to determine if the difference between thepaired datasets is significantly different from zero (Helsel and Hirsch, 1997). This test was selected becauseit lessens the need for normal distribution of the differences between the data pairs through the use of ranktransformation and because the test uses a standard t-distribution to determine probabilities (p-value).The need for symmetry in the differences is also lessened with rank transformation. A 95-percentconfidence level (alpha (α) = 0.05) was selected for the rejection of the null hypothesis. If the probability ofsignificant differences between the streamflow datasets as computed by the test (p-value) is less than orequal to this selected alpha level, then the datasets are declared significantly different. This confidencelevel was selected to provide a reasonable balance between maximizing the probability of finding realsignificant differences between the streamflow datasets and minimizing the probability of failing to findany significant differences that exist.
A complete list of low-flow and flood-flow statistics for streamflow-gaging stations with 10 or moreyears of record computed by Log-Pearson distribution of streamflow-gaging stations can be found inAppendixes 1 and 2, respectively. Low-flow statistics include the Q1,10, Q7,10, Q30,10, the medianstreamflow, and the mean streamflow. Flood-flow statistics include Q10, Q25, Q50, Q100, and Q500. Theseadditional streamflow statistics are provided as a supplement to this report because updated,comprehensive streamflow statistics have not been published by USGS since 1982.
Low-Flo w Statistics Computed Fr om Log-P earson Distrib ution and WRI 82-21Regional Regression Equations
A total of 208 currently operating or discontinued streamflow-gaging stations have at least 10 yearsof continuous flow data with little or no regulation. At 151 of these 208 stations, streamflow is not affectedby carbonate bedrock or extensive mining. Of the remaining 57 stations, 31 are on streams that drainbasins underlain by at least 10 percent carbonate bedrock, 17 are on streams that are extensively mined, 6are on streams located in subregions for which low-flow regional regression equations have not beendeveloped (fig. 1), and 3 were not used in the analysis because they did not produce acceptable low-flowstatistics. Some low-flow statistics were eliminated following the examination of Log-Pearson frequencydistribution plots. These statistics are shown as dashed lines in Appendix 1. In situations where regulationof streamflow divided the period of record, only the record prior to regulation was used.
Streams With Flow Unaffected by Carbonate Bedrock, Mining, or Regulation
A comparison was made between Q7,10 calculated from Log-Pearson analysis for 151 stations inPennsylvania and WRI 82-21 (Appendix 3). Stations with at least 10 years of continuous record having lessthan 10 percent of the basin underlain by carbonate bedrock and with flow unaffected by extensive miningor regulation were included in this analysis. The results indicate considerable variation among individualstreamflow-gaging stations, but overall, the values computed from WRI 82-21 are consistent with thevalues from Log-Pearson distribution. For example, the Q7,10 for Dyberry Creek near Honesdale (stationnumber 01429500) computed from Log-Pearson distribution was 2.80 ft3/s compared to 2.62 ft3/scomputed by WRI 82-21. The graphical comparison between Q7,10 computed from Log-Pearsondistribution and WRI 82-21 for regions 2 and 3 are shown in figures 5 and 6 as examples of the agreementand disagreement of the data, respectively. The graphical comparison for all the regions can be found inAppendix 4. The results of the t-test on signed-ranks for each region are listed in table 4. Region 3 is theonly region to show a significant difference between the two methods (table 4).

17
Q7,
10 C
OM
PU
TE
D F
RO
M L
OG
-P
EA
RS
ON
DIS
TR
IBU
TIO
N,
Figure 5. Comparison of 7-day, 10-year low-flow statistic (Q7,10) computedfrom Log-Pearson distribution of streamflow data and WRI 82-21 regionalregression equations for low-flow region 2.
Q7,10 COMPUTED FROM WRI 82-21 REGIONAL REGRESSIONEQUATIONS, IN CUBIC FEET PER SECOND
IN C
UB
IC F
EE
T P
ER
SE
CO
ND
100 1,0001010.10.1
1
10
100
1,000
Figure 6. Comparison of 7-day, 10-year low-flow statistic (Q7,10) computedfrom Log-Pearson distribution of streamflow data and WRI 82-21 regionalregression equations for low-flow region 3.
Q7,10 COMPUTED FROM WRI 82-21 REGIONAL REGRESSIONEQUATIONS, IN CUBIC FEET PER SECOND
Q7,
10 C
OM
PU
TE
D F
RO
M L
OG
-P
EA
RS
ON
DIS
TR
IBU
TIO
N,
IN C
UB
IC F
EE
T P
ER
SE
CO
ND
1005020105210.50.20.1
100
50
20
10
5
2
1
0.5
0.2
0.1
18
The t-test on signed ranks for region 3 resulted in tr = -3.02 and an approximate p-value of 0.007(table 4). The confidence level in declaring the datasets significantly different is about 99 percent. Figure 6shows that WRI 82-21 underestimates Q7,10 when compared to values computed from Log-Pearsondistribution for region 3, which corresponds to the negative value of tr .
About 40 percent of low-flow region 3 is composed of the heavily urbanized Philadelphia area,which could help explain the uniformly lower values of Q7,10 computed by WRI 82-21 compared to thosecomputed by Log-Pearson. Some explanations may include outflow from sewage treatment plants and oldstorm pipes that were not properly sealed, which the regression equations cannot predict. Also, theregression equations do not incorporate flow from impervious areas that originate from activities such asopen fire hydrants, car washing, and runoff from small storms.
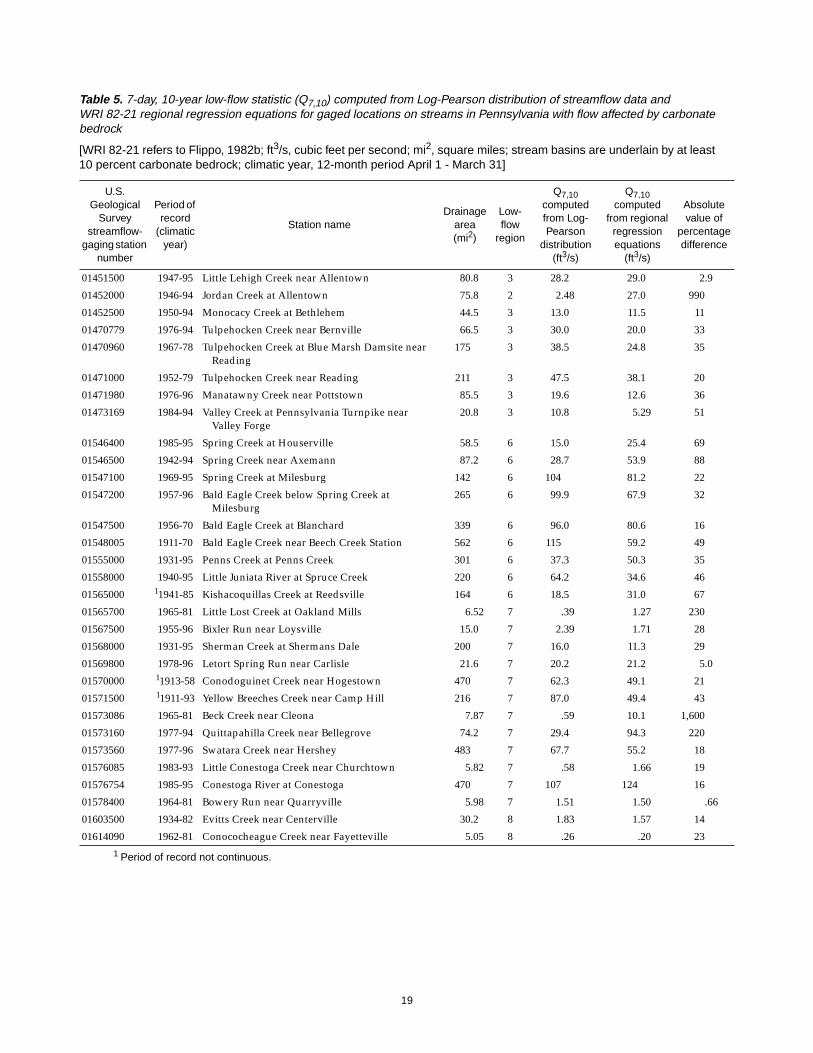
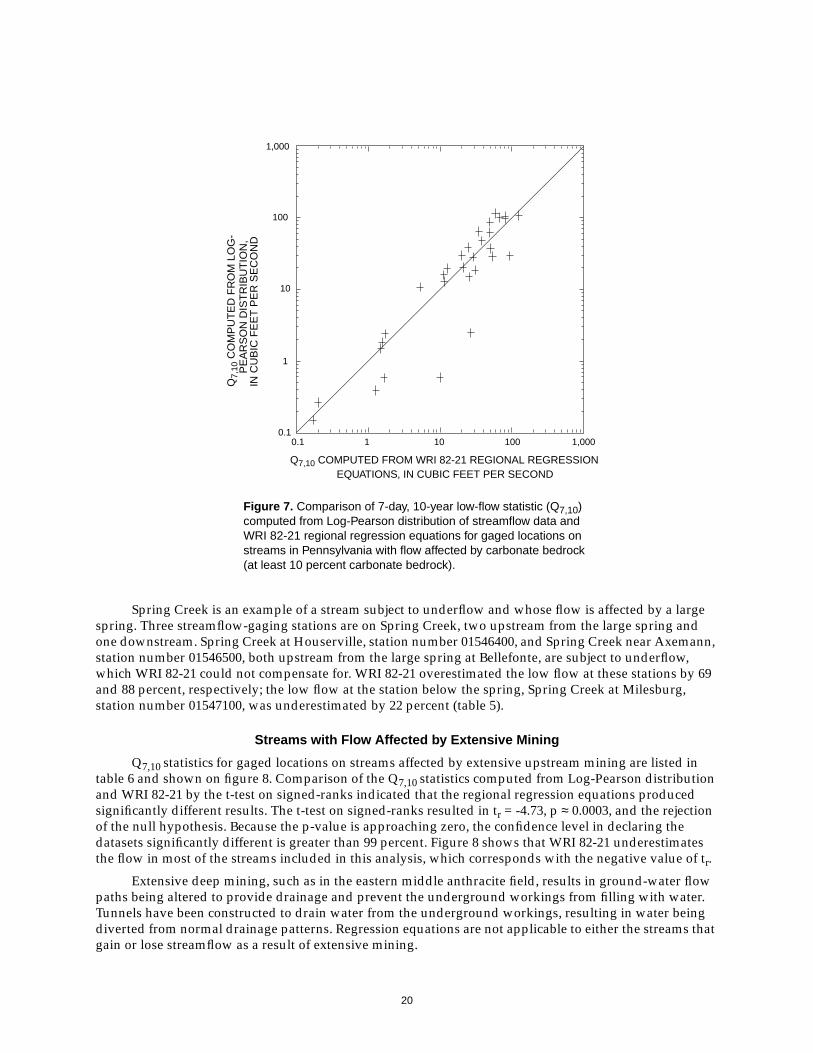
Streams with Flow Affected by Carbonate Bedrock
The Q7,10 for 31 stations at which flow is affected by carbonate bedrock are listed in table 5 andshown on figure 7. The streams included in this analysis have at least 10 percent of their basin underlainby carbonate bedrock at the site of interest. Comparison of the Q7,10 data by the t-test on signed-ranksresulted in tr = -1.00, p ≈ 0.35, and the acceptance of the null hypothesis. Although the test did not producea significant difference between the Q7,10 computations by WRI 82-21 and Log-Pearson, low flow affectedby carbonate bedrock can be difficult to predict with regression equations, depending on how muchunderflow the stream is subject to and where, in relation to the spring (or other stream recharge zone), thesite of interest is located.
Table 4. Results of t-test on signed ranks comparing 7-day,10-year low flow statistic (Q7,10) computed from Log-Pearsondistribution of streamflow data and WRI 82-21 regionalregression equations for Pennsylvania low-flow regions
[WRI 82-21 refers to Flippo, 1982b; >, greater than;--, insufficient data for analysis]
Low-flowregion
Paired T-statistic
(tr)
Difference betweenmethods for computing
Q7,10
Approximatep-value1
1 -1.08 not significant 0.332 -.36 not significant .733 -3.02 significant .0074 -2.53 not significant .055 -1.96 not significant .076 -.65 not significant .537 -.53 not significant .618 -- -- --9 .21 not significant >.40
10 .22 not significant >.4011 1.28 not significant .2412 -1.10 not significant .33
1 p-value interpolated from table of student’s t-distribution.
19
Table 5. 7-day, 10-year low-flow statistic (Q7,10) computed from Log-Pearson distribution of streamflow data andWRI 82-21 regional regression equations for gaged locations on streams in Pennsylvania with flow affected by carbonatebedrock
[WRI 82-21 refers to Flippo, 1982b; ft3/s, cubic feet per second; mi2, square miles; stream basins are underlain by at least10 percent carbonate bedrock; climatic year, 12-month period April 1 - March 31]
U.S.Geological
Surveystreamflow-
gaging stationnumber
Period ofrecord
(climaticyear)
Station nameDrainage
area(mi2)
Low-flow
region
Q7,10computedfrom Log-Pearson
distribution(ft3/s)
Q7,10computed
from regionalregressionequations
(ft3/s)
Absolutevalue of
percentagedifference
01451500 1947-95 Little Lehigh Creek near Allentown 80.8 3 28.2 29.0 2.9
01452000 1946-94 Jordan Creek at Allentown 75.8 2 2.48 27.0 990
01452500 1950-94 Monocacy Creek at Bethlehem 44.5 3 13.0 11.5 11
01470779 1976-94 Tulpehocken Creek near Bernville 66.5 3 30.0 20.0 33
01470960 1967-78 Tulpehocken Creek at Blue Marsh Damsite nearReading
175 3 38.5 24.8 35
01471000 1952-79 Tulpehocken Creek near Reading 211 3 47.5 38.1 20
01471980 1976-96 Manatawny Creek near Pottstown 85.5 3 19.6 12.6 36
01473169 1984-94 Valley Creek at Pennsylvania Turnpike nearValley Forge
20.8 3 10.8 5.29 51
01546400 1985-95 Spring Creek at Houserville 58.5 6 15.0 25.4 69
01546500 1942-94 Spring Creek near Axemann 87.2 6 28.7 53.9 88
01547100 1969-95 Spring Creek at Milesburg 142 6 104 81.2 22
01547200 1957-96 Bald Eagle Creek below Spring Creek atMilesburg
265 6 99.9 67.9 32
01547500 1956-70 Bald Eagle Creek at Blanchard 339 6 96.0 80.6 16
01548005 1911-70 Bald Eagle Creek near Beech Creek Station 562 6 115 59.2 49
01555000 1931-95 Penns Creek at Penns Creek 301 6 37.3 50.3 35
01558000 1940-95 Little Juniata River at Spruce Creek 220 6 64.2 34.6 46
01565000 11941-85 Kishacoquillas Creek at Reedsville 164 6 18.5 31.0 67
01565700 1965-81 Little Lost Creek at Oakland Mills 6.52 7 .39 1.27 230
01567500 1955-96 Bixler Run near Loysville 15.0 7 2.39 1.71 28
01568000 1931-95 Sherman Creek at Shermans Dale 200 7 16.0 11.3 29
01569800 1978-96 Letort Spring Run near Carlisle 21.6 7 20.2 21.2 5.0
01570000 11913-58 Conodoguinet Creek near Hogestown 470 7 62.3 49.1 21
01571500 11911-93 Yellow Breeches Creek near Camp Hill 216 7 87.0 49.4 43
01573086 1965-81 Beck Creek near Cleona 7.87 7 .59 10.1 1,600
01573160 1977-94 Quittapahilla Creek near Bellegrove 74.2 7 29.4 94.3 220
01573560 1977-96 Swatara Creek near Hershey 483 7 67.7 55.2 18
01576085 1983-93 Little Conestoga Creek near Churchtown 5.82 7 .58 1.66 19
01576754 1985-95 Conestoga River at Conestoga 470 7 107 124 16
01578400 1964-81 Bowery Run near Quarryville 5.98 7 1.51 1.50 .66
01603500 1934-82 Evitts Creek near Centerville 30.2 8 1.83 1.57 14
01614090 1962-81 Conococheague Creek near Fayetteville 5.05 8 .26 .20 23
1 Period of record not continuous.
20
Spring Creek is an example of a stream subject to underflow and whose flow is affected by a largespring. Three streamflow-gaging stations are on Spring Creek, two upstream from the large spring andone downstream. Spring Creek at Houserville, station number 01546400, and Spring Creek near Axemann,station number 01546500, both upstream from the large spring at Bellefonte, are subject to underflow,which WRI 82-21 could not compensate for. WRI 82-21 overestimated the low flow at these stations by 69and 88 percent, respectively; the low flow at the station below the spring, Spring Creek at Milesburg,station number 01547100, was underestimated by 22 percent (table 5).
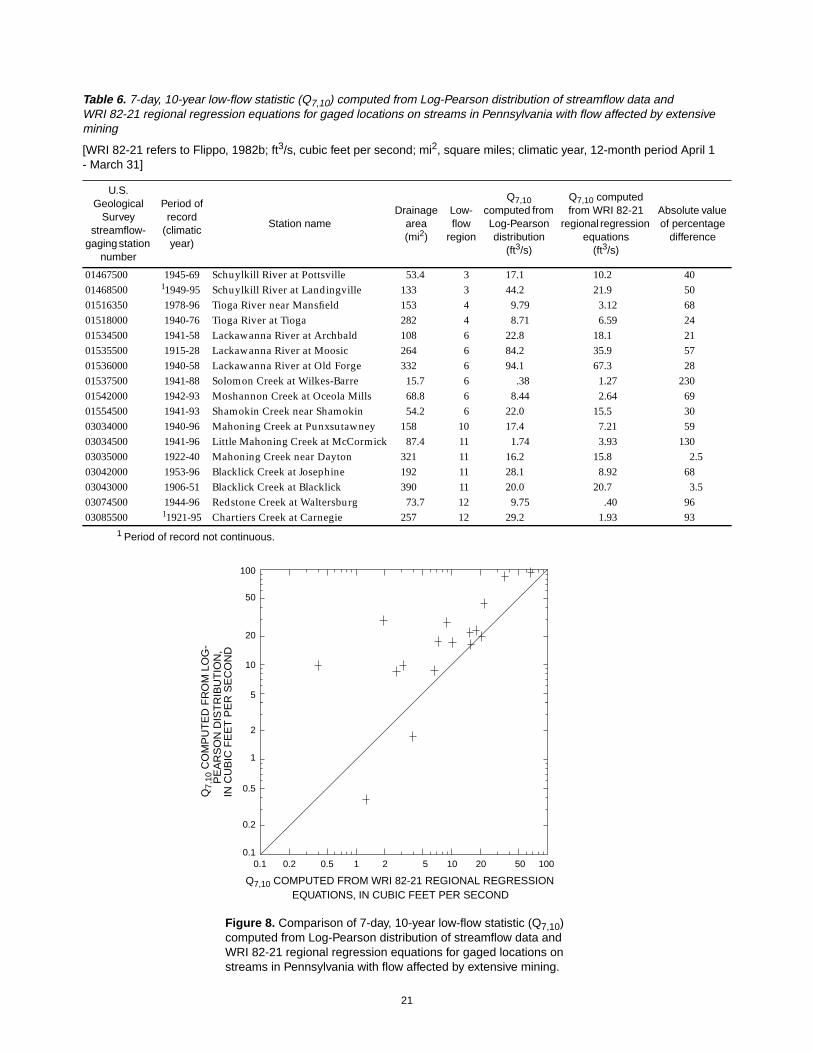
Streams with Flow Affected by Extensive Mining
Q7,10 statistics for gaged locations on streams affected by extensive upstream mining are listed intable 6 and shown on figure 8. Comparison of the Q7,10 statistics computed from Log-Pearson distributionand WRI 82-21 by the t-test on signed-ranks indicated that the regional regression equations producedsignificantly different results. The t-test on signed-ranks resulted in tr = -4.73, p ≈ 0.0003, and the rejectionof the null hypothesis. Because the p-value is approaching zero, the confidence level in declaring thedatasets significantly different is greater than 99 percent. Figure 8 shows that WRI 82-21 underestimatesthe flow in most of the streams included in this analysis, which corresponds with the negative value of tr.
Extensive deep mining, such as in the eastern middle anthracite field, results in ground-water flowpaths being altered to provide drainage and prevent the underground workings from filling with water.Tunnels have been constructed to drain water from the underground workings, resulting in water beingdiverted from normal drainage patterns. Regression equations are not applicable to either the streams thatgain or lose streamflow as a result of extensive mining.
Figure 7. Comparison of 7-day, 10-year low-flow statistic (Q7,10)computed from Log-Pearson distribution of streamflow data andWRI 82-21 regional regression equations for gaged locations onstreams in Pennsylvania with flow affected by carbonate bedrock(at least 10 percent carbonate bedrock).
Q7,10 COMPUTED FROM WRI 82-21 REGIONAL REGRESSIONEQUATIONS, IN CUBIC FEET PER SECOND
Q7,
10 C
OM
PU
TE
D F
RO
M L
OG
-P
EA
RS
ON
DIS
TR
IBU
TIO
N,
IN C
UB
IC F
EE
T P
ER
SE
CO
ND
100 1,0001010.10.1
1
10
100
1,000
21
Table 6. 7-day, 10-year low-flow statistic (Q7,10) computed from Log-Pearson distribution of streamflow data andWRI 82-21 regional regression equations for gaged locations on streams in Pennsylvania with flow affected by extensivemining
[WRI 82-21 refers to Flippo, 1982b; ft3/s, cubic feet per second; mi2, square miles; climatic year, 12-month period April 1- March 31]
U.S.Geological
Surveystreamflow-
gaging stationnumber
Period ofrecord
(climaticyear)
Station nameDrainage
area(mi2)
Low-flow
region
Q7,10computed fromLog-Pearsondistribution
(ft3/s)
Q7,10 computedfrom WRI 82-21
regional regressionequations
(ft3/s)
Absolute valueof percentage
difference
01467500 1945-69 Schuylkill River at Pottsville 53.4 3 17.1 10.2 4001468500 11949-95 Schuylkill River at Landingville 133 3 44.2 21.9 5001516350 1978-96 Tioga River near Mansfield 153 4 9.79 3.12 6801518000 1940-76 Tioga River at Tioga 282 4 8.71 6.59 2401534500 1941-58 Lackawanna River at Archbald 108 6 22.8 18.1 2101535500 1915-28 Lackawanna River at Moosic 264 6 84.2 35.9 5701536000 1940-58 Lackawanna River at Old Forge 332 6 94.1 67.3 2801537500 1941-88 Solomon Creek at Wilkes-Barre 15.7 6 .38 1.27 23001542000 1942-93 Moshannon Creek at Oceola Mills 68.8 6 8.44 2.64 6901554500 1941-93 Shamokin Creek near Shamokin 54.2 6 22.0 15.5 3003034000 1940-96 Mahoning Creek at Punxsutawney 158 10 17.4 7.21 5903034500 1941-96 Little Mahoning Creek at McCormick 87.4 11 1.74 3.93 13003035000 1922-40 Mahoning Creek near Dayton 321 11 16.2 15.8 2.503042000 1953-96 Blacklick Creek at Josephine 192 11 28.1 8.92 6803043000 1906-51 Blacklick Creek at Blacklick 390 11 20.0 20.7 3.503074500 1944-96 Redstone Creek at Waltersburg 73.7 12 9.75 .40 9603085500 11921-95 Chartiers Creek at Carnegie 257 12 29.2 1.93 93
1 Period of record not continuous.
Figure 8. Comparison of 7-day, 10-year low-flow statistic (Q7,10)computed from Log-Pearson distribution of streamflow data andWRI 82-21 regional regression equations for gaged locations onstreams in Pennsylvania with flow affected by extensive mining.
Q7,10 COMPUTED FROM WRI 82-21 REGIONAL REGRESSIONEQUATIONS, IN CUBIC FEET PER SECOND
Q7,
10 C
OM
PU
TE
D F
RO
M L
OG
-P
EA
RS
ON
DIS
TR
IBU
TIO
N,
IN C
UB
IC F
EE
T P
ER
SE
CO
ND
1005020105210.50.20.1
100
50
20
10
5
2
1
0.5
0.2
0.1

22
Flood-Flo w Statistics Computed fr om Log-P earson Distrib utionand Regional Regression Equations
Continuous-record streamflow-gaging stations in Pennsylvania with 10 or more years of recordthrough water year 1996 were used in this analysis. In situations where regulation of the streamflowdivided the period of record, only the record prior to regulation was used. Streams affected by regulationwere not used. Flood-flow statistics for the 50-year and 100-year floods were computed for this analysis.The 50-year and 100-year floods are used for the analysis to compare as many overlapping flood-flowstatistics estimated by both WRI 82-21 and PSU-IV as possible.
WRI 82-21 Regional Regression Equations Compared to Log-Pearson Distribution
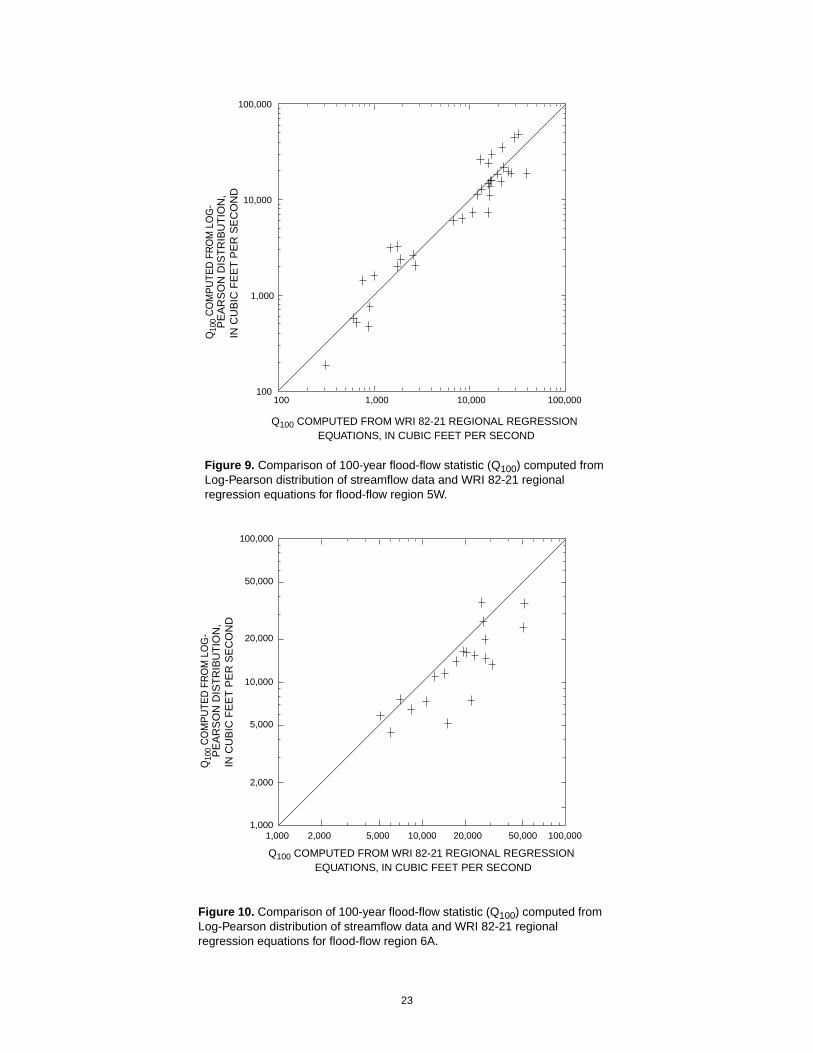
A comparison was made between the 50- and 100-year flood flows computed from Log-Pearsondistribution for 206 streamflow-gaging stations in Pennsylvania and WRI 82-21 regional regressionequations (Appendix 5). No streamflow-gaging stations fell within flood-flow region 1 (fig. 3)2. Thegraphical comparison between values of Q100 computed from Log-Pearson distribution and WRI 82-21 forregions 5W and 6A are shown in figures 9 and 10 as examples of the agreement and disagreement of thedata, respectively. The graphical comparison for all the regions can be found in Appendix 4.
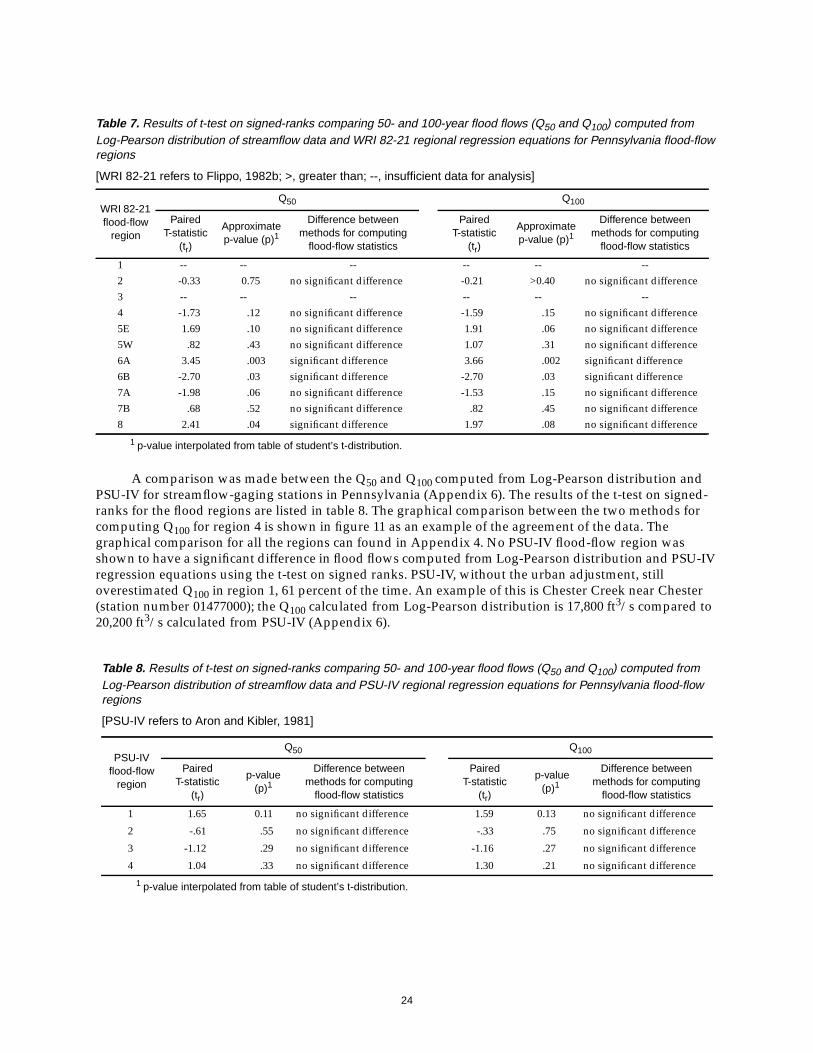
The results of the t-test on signed ranks are listed in table 7. Equations for three flood-flow regionswere shown to produce significantly different datasets. Figure 10 shows that WRI 82-21 overestimates Q100for region 6A, which corresponds with the positive value of tr, equalling 3.66 (table 7). Equations for flood-flow regions 6A, 6B, and 8 were shown to produce significantly different computations of Q50 from thoseproduced from Log-Pearson distribution. Equations for flood-flow regions 6A and 6B were shown toproduce significantly different computations of Q100 from those produced from Log-Pearson distribution.The p-values for the regions in which the equations produce significantly different statistics are all lessthan 0.05, which means the confidence levels in declaring the datasets significantly different are greaterthan 95 percent. Combined, these three regions—6A, 6B, and 8—constitute approximately 24 percent ofthe state.
PSU-IV Regional Regression Equations Compared to Log-Pearson Distribution
A total of 137 streamflow-gaging stations were included in this comparison between the Log-Pearson distribution of streamflow data and PSU-IV regional regression equations. Only stations with10 or more years of continuous record and with drainage areas less than or equal to 150 mi2 were used.PSU-IV was originally developed using data from streams with drainage areas up to 233 mi2. Acomparison between the Log-Pearson distribution and PSU-IV regional regression equations from 28 siteswith drainage areas between 150 and 233 mi2 showed PSU-IV overestimated Q100 at 21 of the 28 sites by anaverage of 50 percent. Because of the overestimation at sites with large drainage areas, a limit of 150 mi2
was selected for this comparison. PSU-IV can estimate flood peaks with return periods from 2 to 200 years,but only the 50- and 100-year flood flows were computed for this report.
PSU-IV values were adjusted if the drainage basin contained lakes, swamps, or flood controlstructures, significant carbonate bedrock, urban areas, or if the basin was less than 1.5 mi2 in drainage area.The adjustments for storage area and urbanization were modified from the recommendations made by thePennsylvania State University. Region 1 was not adjusted for urbanization for this analysis because theeffects of urbanization on flood flow are most likely reflected in the equation for region 1. However, aninitial comparison of PSU-IV flood-flow values for region 1 with application of the urbanizationadjustment and values calculated from Log-Pearson distribution using the t-test on signed ranks showed asignificant difference in flood-flow values.
2 Regression equations were developed for region 1 using streamflow-gaging stations located in the state of New York(Flippo, 1982b).
23
Figure 9. Comparison of 100-year flood-flow statistic (Q100) computed fromLog-Pearson distribution of streamflow data and WRI 82-21 regionalregression equations for flood-flow region 5W.
Q10
0 C
OM
PU
TED
FR
OM
LO
G-
PE
AR
SO
N D
IST
RIB
UT
ION
,
Q100 COMPUTED FROM WRI 82-21 REGIONAL REGRESSIONEQUATIONS, IN CUBIC FEET PER SECOND
100 100,0001,000 10,000100
100,000
1,000
10,000
IN C
UB
IC F
EE
T P
ER
SE
CO
ND
Figure 10. Comparison of 100-year flood-flow statistic (Q100) computed fromLog-Pearson distribution of streamflow data and WRI 82-21 regionalregression equations for flood-flow region 6A.
Q100 COMPUTED FROM WRI 82-21 REGIONAL REGRESSIONEQUATIONS, IN CUBIC FEET PER SECOND
Q10
0 C
OM
PU
TED
FR
OM
LO
G-
PE
AR
SO
N D
IST
RIB
UT
ION
,IN
CU
BIC
FE
ET
PE
R S
EC
ON
D
1,000 100,0002,000 5,000 10,000 20,000 50,0001,000
100,000
2,000
5,000
10,000
20,000
50,000
24
A comparison was made between the Q50 and Q100 computed from Log-Pearson distribution andPSU-IV for streamflow-gaging stations in Pennsylvania (Appendix 6). The results of the t-test on signed-ranks for the flood regions are listed in table 8. The graphical comparison between the two methods forcomputing Q100 for region 4 is shown in figure 11 as an example of the agreement of the data. Thegraphical comparison for all the regions can found in Appendix 4. No PSU-IV flood-flow region wasshown to have a significant difference in flood flows computed from Log-Pearson distribution and PSU-IVregression equations using the t-test on signed ranks. PSU-IV, without the urban adjustment, stilloverestimated Q100 in region 1, 61 percent of the time. An example of this is Chester Creek near Chester(station number 01477000); the Q100 calculated from Log-Pearson distribution is 17,800 ft3/s compared to20,200 ft3/s calculated from PSU-IV (Appendix 6).
Table 7. Results of t-test on signed-ranks comparing 50- and 100-year flood flows (Q50 and Q100) computed fromLog-Pearson distribution of streamflow data and WRI 82-21 regional regression equations for Pennsylvania flood-flowregions
[WRI 82-21 refers to Flippo, 1982b; >, greater than; --, insufficient data for analysis]
WRI 82-21flood-flow
region
Q50 Q100
PairedT-statistic
(tr)
Approximatep-value (p)1
1 p-value interpolated from table of student’s t-distribution.
Difference betweenmethods for computing
flood-flow statistics
PairedT-statistic
(tr)
Approximatep-value (p)1
Difference betweenmethods for computing
flood-flow statistics
1 -- -- -- -- -- --2 -0.33 0.75 no significant difference -0.21 >0.40 no significant difference3 -- -- -- -- -- --4 -1.73 .12 no significant difference -1.59 .15 no significant difference5E 1.69 .10 no significant difference 1.91 .06 no significant difference5W .82 .43 no significant difference 1.07 .31 no significant difference6A 3.45 .003 significant difference 3.66 .002 significant difference6B -2.70 .03 significant difference -2.70 .03 significant difference7A -1.98 .06 no significant difference -1.53 .15 no significant difference7B .68 .52 no significant difference .82 .45 no significant difference8 2.41 .04 significant difference 1.97 .08 no significant difference
Table 8. Results of t-test on signed-ranks comparing 50- and 100-year flood flows (Q50 and Q100) computed fromLog-Pearson distribution of streamflow data and PSU-IV regional regression equations for Pennsylvania flood-flowregions
[PSU-IV refers to Aron and Kibler, 1981]
PSU-IVflood-flow
region
Q50 Q100
PairedT-statistic
(tr)
p-value(p)1
1 p-value interpolated from table of student’s t-distribution.
Difference betweenmethods for computing
flood-flow statistics
PairedT-statistic
(tr)
p-value(p)1
Difference betweenmethods for computing
flood-flow statistics
1 1.65 0.11 no significant difference 1.59 0.13 no significant difference
2 -.61 .55 no significant difference -.33 .75 no significant difference
3 -1.12 .29 no significant difference -1.16 .27 no significant difference
4 1.04 .33 no significant difference 1.30 .21 no significant difference
25
Limitations of WRI 82-21 Regional Regression Equations
Regression equations presented in WRI 82-21 to predict low flow should not be applied to areas forwhich they were not developed, such as most of Bucks County and the Sinnemahoning Creek Basin.Streams that drain areas underlain by carbonate bedrock can be influenced by underflow as well as thedischarge from large springs. The effects of underflow or large springs, which can significantly affectstreamflow during droughts, cannot be predicted by the regression equations. Low flow in urban areastreams also is difficult to predict because of supplemental flows from impervious areas and flows fromsewage treatment plants.
Flood flow computed from regression equations presented in WRI 82-21 should not be used if thesite is downstream of a flood-control reservoir or a large recreational lake that may significantly affectflood flows. Discharge computations resulting from WRI 82-21 for watersheds less than 30 mi2 locatedwithin regions 6 and 7 should be reviewed carefully because of nonagreement between the equations forregions 6A and 6B and 7A and 7B. In addition, a few streams in the state flow through more than oneflood-flow region (fig. 3). One such stream is the Clarion River, which originates in region 6 (6B, less than15 mi2, and 6A, greater than 15 mi2) and flows from region 6 to region 5W, to region 4, and enters theAllegheny River back in region 5W.
Figure 11. Comparison of 100-year flood-flow statistic (Q100) computed fromLog-Pearson distribution of streamflow data and PSU-IV regional regressionequations for flood-flow region 4.
100 100,0001,000 10,000100
100,000
1,000
10,000
Q100 COMPUTED FROM PSU-IV REGIONAL REGRESSIONEQUATIONS, IN CUBIC FEET PER SECOND
Q10
0 C
OM
PU
TED
FR
OM
LO
G-
PE
AR
SO
N D
IST
RIB
UT
ION
,IN
CU
BIC
FE
ET
PE
R S
EC
ON
D
26
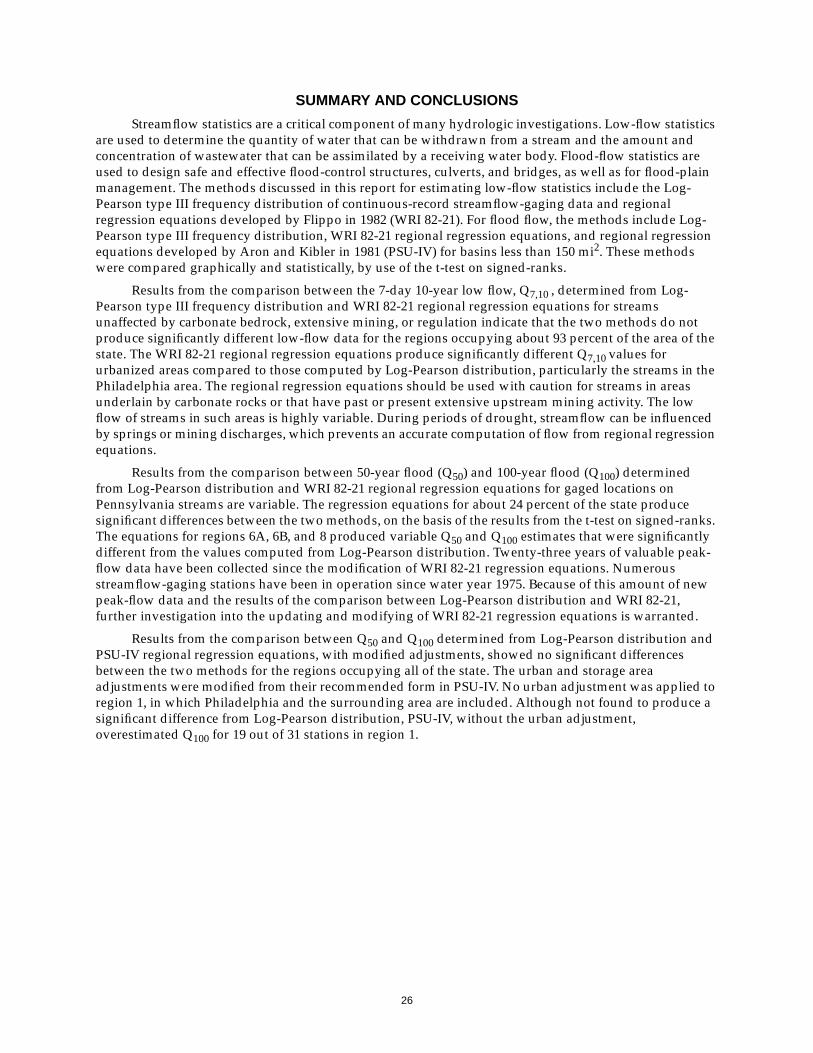
SUMMARY AND CONCLUSIONS
Streamflow statistics are a critical component of many hydrologic investigations. Low-flow statisticsare used to determine the quantity of water that can be withdrawn from a stream and the amount andconcentration of wastewater that can be assimilated by a receiving water body. Flood-flow statistics areused to design safe and effective flood-control structures, culverts, and bridges, as well as for flood-plainmanagement. The methods discussed in this report for estimating low-flow statistics include the Log-Pearson type III frequency distribution of continuous-record streamflow-gaging data and regionalregression equations developed by Flippo in 1982 (WRI 82-21). For flood flow, the methods include Log-Pearson type III frequency distribution, WRI 82-21 regional regression equations, and regional regressionequations developed by Aron and Kibler in 1981 (PSU-IV) for basins less than 150 mi2. These methodswere compared graphically and statistically, by use of the t-test on signed-ranks.
Results from the comparison between the 7-day 10-year low flow, Q7,10 , determined from Log-Pearson type III frequency distribution and WRI 82-21 regional regression equations for streamsunaffected by carbonate bedrock, extensive mining, or regulation indicate that the two methods do notproduce significantly different low-flow data for the regions occupying about 93 percent of the area of thestate. The WRI 82-21 regional regression equations produce significantly different Q7,10 values forurbanized areas compared to those computed by Log-Pearson distribution, particularly the streams in thePhiladelphia area. The regional regression equations should be used with caution for streams in areasunderlain by carbonate rocks or that have past or present extensive upstream mining activity. The lowflow of streams in such areas is highly variable. During periods of drought, streamflow can be influencedby springs or mining discharges, which prevents an accurate computation of flow from regional regressionequations.
Results from the comparison between 50-year flood (Q50) and 100-year flood (Q100) determinedfrom Log-Pearson distribution and WRI 82-21 regional regression equations for gaged locations onPennsylvania streams are variable. The regression equations for about 24 percent of the state producesignificant differences between the two methods, on the basis of the results from the t-test on signed-ranks.The equations for regions 6A, 6B, and 8 produced variable Q50 and Q100 estimates that were significantlydifferent from the values computed from Log-Pearson distribution. Twenty-three years of valuable peak-flow data have been collected since the modification of WRI 82-21 regression equations. Numerousstreamflow-gaging stations have been in operation since water year 1975. Because of this amount of newpeak-flow data and the results of the comparison between Log-Pearson distribution and WRI 82-21,further investigation into the updating and modifying of WRI 82-21 regression equations is warranted.
Results from the comparison between Q50 and Q100 determined from Log-Pearson distribution andPSU-IV regional regression equations, with modified adjustments, showed no significant differencesbetween the two methods for the regions occupying all of the state. The urban and storage areaadjustments were modified from their recommended form in PSU-IV. No urban adjustment was applied toregion 1, in which Philadelphia and the surrounding area are included. Although not found to produce asignificant difference from Log-Pearson distribution, PSU-IV, without the urban adjustment,overestimated Q100 for 19 out of 31 stations in region 1.
27
REFERENCES CITED
Aron, G., and Kibler, D.F., 1981, Procedure PSU-IV for estimating design flood peaks on ungagedPennsylvania watersheds: Institute of Research on Land and Water Resources, FHWA/PA 81-013,variously paged.
Berg, T.M., Edmunds, W.E., Geyer, A.R., and others, 1980, Geologic Map of Pennsylvania: PennsylvaniaGeological Survey, 4th ser., Map 1.
Coll, M.B., Jr., and Siwicki, R.W., 1998, Water-resources data, Pennsylvania, water year 1997—Volume 3,Ohio River and St. Lawrence River Basins: U.S. Geological Survey Water-Data Report PA-97-3,339 p.
Durlin, R.R., and Schaffstall, W.P., 1998a, Water-resources data, Pennsylvania, water year 1997—Volume 1,Delaware River Basin: U.S. Geological Survey Water-Data Report PA-97-1, 372 p.
_____1998b, Water-resources data, Pennsylvania, water year 1997—Volume 2, Susquehanna and PotomacRiver Basins: U.S. Geological Survey Water-Data Report PA-97-2, 439 p.
Flippo, H.N., Jr., 1977, Floods in Pennsylvania: Harrisburg, Pa., Pennsylvania Department ofEnvironmental Resources, Water Resources Bulletin No. 13, 59 p.
_____1982a, Technical manual for estimating low-flow characteristics of Pennsylvania streams:Harrisburg, Pa., Pennsylvania Department of Environmental Resources, Water Resources BulletinNo. 15, 86 p.
_____1982b, Evaluation of the streamflow data program in Pennsylvania: U.S. Geological Survey Water-Resources Investigations 82-21, 56 p.
Helsel, D.R., and Hirsch, R.M., 1997, Statistical methods in water resources: New York, Elsevier SciencePublishing Co., Inc., 529 p.
Hutchison, N.E., comp., 1975, WATSTORE User’s Guide Volume 1: U.S. Geological Survey Open-FileReport 75-426, vol. 1, variously paged.
Hydrology Committee, 1981, Guidelines for determining flood flow frequency: U.S. Water ResourcesCouncil Bulletin 17B, 182 p.
Page, L.V., and Shaw, L.C., 1977, Low-flow characteristics of Pennsylvania streams: PennsylvaniaDepartment Environmental Resources Bulletin No. 12, 441 p.
Reich, B.M., King, Y.P., and White, E.L., 1971, Flood peak frequency design manual - PSU III, interim reportto Pennsylvania Department of Transportation, Bureau of Materials, Testing, and Research, ResearchProject No. 68-26, Civil Engineering Department: State College, Pa., The Pennsylvania StateUniversity, 5 p.
Walker, R., and Miller, P., 1993, Hydraulic analysis program, Version 2.21: Pennsylvania Department ofTransportation, Bureau of Design, Bridge Division.

28
APPENDIXES

29
Appendix 1. Low-flow statistics for gaged Pennsylvania streams
[Low-flow statistics computed from Log-Pearson distribution of streamflow data; ---, calculated statistic not shown; mi2, square miles; ft3/s, cubic feet per second;climatic year, 12-month period April 1 - March 31]
U.S.Geological
Surveystreamflow-
gaging stationnumber
Period ofrecord
(climaticyear)
Station nameDrainage
area(mi2)
Medianstreamflow
(ft3/s)
Meanstreamflow
(ft3/s)
1-day,10-year low-flow statistic
(ft3/s)
7-day,10-year low-flow statistic
(ft3/s)
30-day,10-year low-flow statistic
(ft3/s)
01429000 1946-59 West Branch Lackawaxen River at Prompton 59.7 60.4 116 5.54 6.25 8.9301429000 1962-95 West Branch Lackawaxen River at Prompton 59.7 55.4 105 3.63 4.77 7.3801429500 1945-58 Dyberry Creek near Honesdale 64.6 55.0 114 2.31 2.80 4.4501429500 1961-95 Dyberry Creek near Honesdale 64.6 55.1 112 2.38 3.07 4.4601430500 1923-38 Lackawaxen River at West Hawley 206 198 352 17.9 24.0 30.301431000 1946-60 Middle Creek near Hawley 78.4 63.8 133 2.64 3.08 4.1901431500 11910-59 Lackawaxen River at Hawley 290 245 491 13.5 17.8 26.201431500 1961-95 Lackawaxen River at Hawley 290 244 478 21.8 23.8 29.901432000 1911-24 Wallenpaupack Creek at Wilsonville 228 246 404 7.69 21.2 34.301439500 1910-96 Bush Kill at Shoemakers 117 162 235 6.76 7.72 10.601440400 1959-96 Brodhead Creek at Analomink 65.9 84.6 144 7.00 7.54 9.1301441000 1913-38 McMichaels Creek at Stroudsburg 65.3 80.4 119 13.3 16.0 19.301442500 1952-95 Brodhead Creek at Minisink Hills 259 347 559 44.7 48.7 57.201446600 1963-78 Martins Creek near East Bangor 10.4 7.40 17.0 --- .20 .2001447500 1945-96 Lehigh River at Stoddardtsville 91.7 128 190 12.2 13.3 16.701447680 1971-96 Tunkhannock Creek near Long Pond 18 34.1 47.5 3.82 4.23 5.5501447720 1962-95 Tobyhanna Creek near Blakeslee 118 180 289 28.2 30.8 40.901447800 1963-96 Lehigh River below Francis E. Walter Reservoir near White Haven 290 418 631 36.5 44.0 58.601448000 1918-59 Lehigh River at Tannery 322 449 673 49.7 67.4 79.601448500 1950-95 Dilldown Creek near Long Pond 2.39 3.20 4.88 .41 .44 .5201449000 1984-95 Lehigh River at Lehighton 591 892 1,340 144 157 20101449360 1968-96 Pohopoco Creek at Kresgeville 49.9 75.8 104 15.8 16.3 18.401449500 1945-57 Wild Creek at Hatchery 16.8 29.3 38.1 5.22 5.45 5.9601449500 1960-78 Wild Creek at Hatchery 16.8 28.3 34 1.32 1.66 2.3001449800 1971-96 Pohopoco Creek below Beltzville Lake near Parryville 96.4 107 172 13.3 14.9 17.701450000 1945-69 Pohopoco Creek near Parryville 109 119 174 18.3 19.6 22.001450500 1941-96 Aquashicola Creek at Palmerton 76.7 101 153 15.0 16.9 20.001451500 1947-95 Little Lehigh Creek near Allentown 80.8 79.2 99.8 26.9 28.2 31.401451800 1967-94 Jordan Creek near Schnecksville 53 49.2 92.7 1.84 2.58 4.1701452000 1946-94 Jordan Creek at Allentown 75.8 61.5 115 --- 2.48 4.00
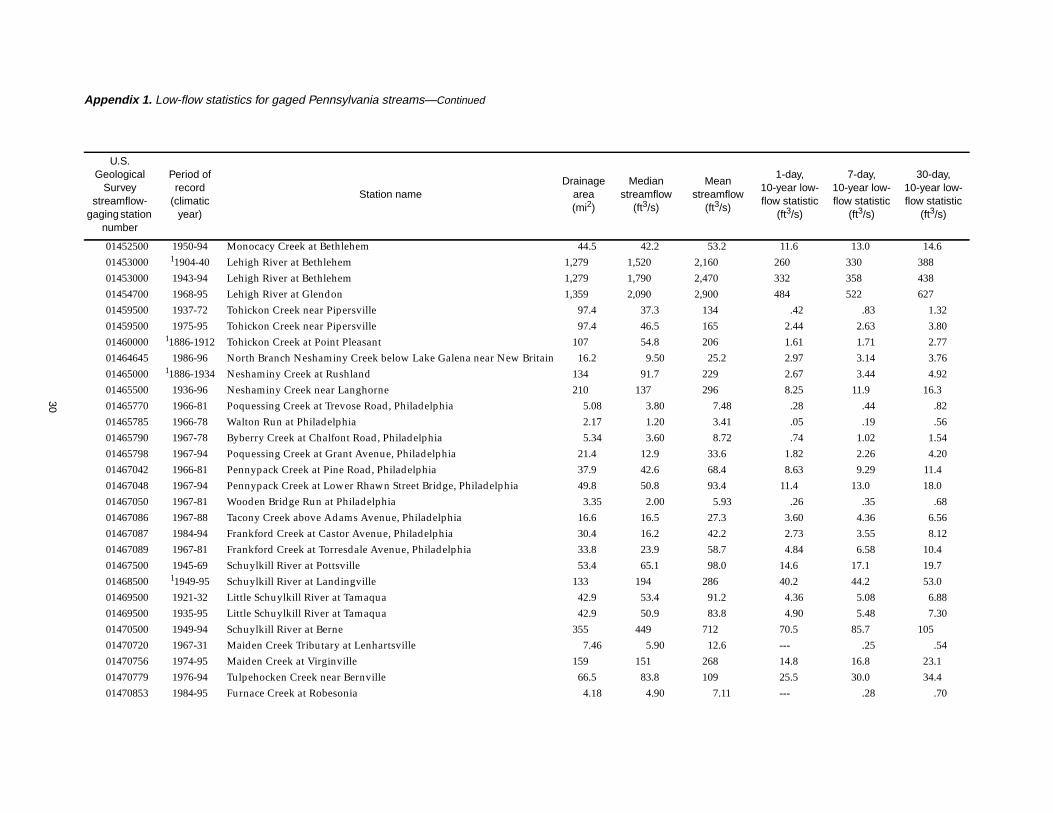
30
01452500 1950-94 Monocacy Creek at Bethlehem 44.5 42.2 53.2 11.6 13.0 14.601453000 11904-40 Lehigh River at Bethlehem 1,279 1,520 2,160 260 330 38801453000 1943-94 Lehigh River at Bethlehem 1,279 1,790 2,470 332 358 43801454700 1968-95 Lehigh River at Glendon 1,359 2,090 2,900 484 522 62701459500 1937-72 Tohickon Creek near Pipersville 97.4 37.3 134 .42 .83 1.3201459500 1975-95 Tohickon Creek near Pipersville 97.4 46.5 165 2.44 2.63 3.8001460000 11886-1912 Tohickon Creek at Point Pleasant 107 54.8 206 1.61 1.71 2.7701464645 1986-96 North Branch Neshaminy Creek below Lake Galena near New Britain 16.2 9.50 25.2 2.97 3.14 3.7601465000 11886-1934 Neshaminy Creek at Rushland 134 91.7 229 2.67 3.44 4.9201465500 1936-96 Neshaminy Creek near Langhorne 210 137 296 8.25 11.9 16.301465770 1966-81 Poquessing Creek at Trevose Road, Philadelphia 5.08 3.80 7.48 .28 .44 .8201465785 1966-78 Walton Run at Philadelphia 2.17 1.20 3.41 .05 .19 .5601465790 1967-78 Byberry Creek at Chalfont Road, Philadelphia 5.34 3.60 8.72 .74 1.02 1.5401465798 1967-94 Poquessing Creek at Grant Avenue, Philadelphia 21.4 12.9 33.6 1.82 2.26 4.2001467042 1966-81 Pennypack Creek at Pine Road, Philadelphia 37.9 42.6 68.4 8.63 9.29 11.401467048 1967-94 Pennypack Creek at Lower Rhawn Street Bridge, Philadelphia 49.8 50.8 93.4 11.4 13.0 18.001467050 1967-81 Wooden Bridge Run at Philadelphia 3.35 2.00 5.93 .26 .35 .6801467086 1967-88 Tacony Creek above Adams Avenue, Philadelphia 16.6 16.5 27.3 3.60 4.36 6.5601467087 1984-94 Frankford Creek at Castor Avenue, Philadelphia 30.4 16.2 42.2 2.73 3.55 8.1201467089 1967-81 Frankford Creek at Torresdale Avenue, Philadelphia 33.8 23.9 58.7 4.84 6.58 10.401467500 1945-69 Schuylkill River at Pottsville 53.4 65.1 98.0 14.6 17.1 19.701468500 11949-95 Schuylkill River at Landingville 133 194 286 40.2 44.2 53.001469500 1921-32 Little Schuylkill River at Tamaqua 42.9 53.4 91.2 4.36 5.08 6.8801469500 1935-95 Little Schuylkill River at Tamaqua 42.9 50.9 83.8 4.90 5.48 7.3001470500 1949-94 Schuylkill River at Berne 355 449 712 70.5 85.7 10501470720 1967-31 Maiden Creek Tributary at Lenhartsville 7.46 5.90 12.6 --- .25 .5401470756 1974-95 Maiden Creek at Virginville 159 151 268 14.8 16.8 23.101470779 1976-94 Tulpehocken Creek near Bernville 66.5 83.8 109 25.5 30.0 34.401470853 1984-95 Furnace Creek at Robesonia 4.18 4.90 7.11 --- .28 .70
Appendix 1. Low-flow statistics for gaged Pennsylvania streams—Continued
[Low-flow statistics computed from Log-Pearson distribution of streamflow data; ---, calculated statistic not shown; mi2, square miles; ft3/s, cubic feet per second;climatic year, 12-month period April 1 - March 31]
U.S.Geological
Surveystreamflow-
gaging stationnumber
Period ofrecord
(climaticyear)
Station nameDrainage
area(mi2)
Medianstreamflow
(ft3/s)
Meanstreamflow
(ft3/s)
1-day,10-year low-flow statistic
(ft3/s)
7-day,10-year low-flow statistic
(ft3/s)
30-day,10-year low-flow statistic
(ft3/s)
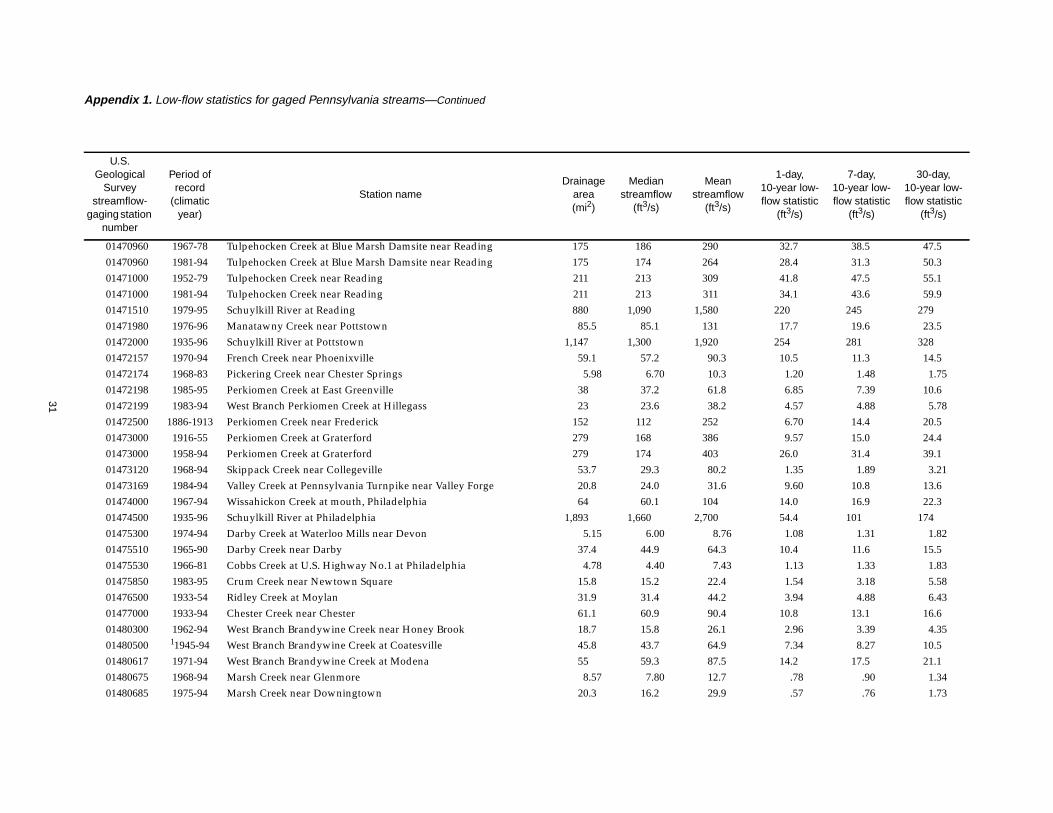
31
01470960 1967-78 Tulpehocken Creek at Blue Marsh Damsite near Reading 175 186 290 32.7 38.5 47.501470960 1981-94 Tulpehocken Creek at Blue Marsh Damsite near Reading 175 174 264 28.4 31.3 50.301471000 1952-79 Tulpehocken Creek near Reading 211 213 309 41.8 47.5 55.101471000 1981-94 Tulpehocken Creek near Reading 211 213 311 34.1 43.6 59.901471510 1979-95 Schuylkill River at Reading 880 1,090 1,580 220 245 27901471980 1976-96 Manatawny Creek near Pottstown 85.5 85.1 131 17.7 19.6 23.501472000 1935-96 Schuylkill River at Pottstown 1,147 1,300 1,920 254 281 32801472157 1970-94 French Creek near Phoenixville 59.1 57.2 90.3 10.5 11.3 14.501472174 1968-83 Pickering Creek near Chester Springs 5.98 6.70 10.3 1.20 1.48 1.7501472198 1985-95 Perkiomen Creek at East Greenville 38 37.2 61.8 6.85 7.39 10.601472199 1983-94 West Branch Perkiomen Creek at Hillegass 23 23.6 38.2 4.57 4.88 5.7801472500 1886-1913 Perkiomen Creek near Frederick 152 112 252 6.70 14.4 20.501473000 1916-55 Perkiomen Creek at Graterford 279 168 386 9.57 15.0 24.401473000 1958-94 Perkiomen Creek at Graterford 279 174 403 26.0 31.4 39.101473120 1968-94 Skippack Creek near Collegeville 53.7 29.3 80.2 1.35 1.89 3.2101473169 1984-94 Valley Creek at Pennsylvania Turnpike near Valley Forge 20.8 24.0 31.6 9.60 10.8 13.601474000 1967-94 Wissahickon Creek at mouth, Philadelphia 64 60.1 104 14.0 16.9 22.301474500 1935-96 Schuylkill River at Philadelphia 1,893 1,660 2,700 54.4 101 17401475300 1974-94 Darby Creek at Waterloo Mills near Devon 5.15 6.00 8.76 1.08 1.31 1.8201475510 1965-90 Darby Creek near Darby 37.4 44.9 64.3 10.4 11.6 15.501475530 1966-81 Cobbs Creek at U.S. Highway No.1 at Philadelphia 4.78 4.40 7.43 1.13 1.33 1.8301475850 1983-95 Crum Creek near Newtown Square 15.8 15.2 22.4 1.54 3.18 5.5801476500 1933-54 Ridley Creek at Moylan 31.9 31.4 44.2 3.94 4.88 6.4301477000 1933-94 Chester Creek near Chester 61.1 60.9 90.4 10.8 13.1 16.601480300 1962-94 West Branch Brandywine Creek near Honey Brook 18.7 15.8 26.1 2.96 3.39 4.3501480500 11945-94 West Branch Brandywine Creek at Coatesville 45.8 43.7 64.9 7.34 8.27 10.501480617 1971-94 West Branch Brandywine Creek at Modena 55 59.3 87.5 14.2 17.5 21.101480675 1968-94 Marsh Creek near Glenmore 8.57 7.80 12.7 .78 .90 1.3401480685 1975-94 Marsh Creek near Downingtown 20.3 16.2 29.9 .57 .76 1.73
Appendix 1. Low-flow statistics for gaged Pennsylvania streams—Continued
[Low-flow statistics computed from Log-Pearson distribution of streamflow data; ---, calculated statistic not shown; mi2, square miles; ft3/s, cubic feet per second;climatic year, 12-month period April 1 - March 31]
U.S.Geological
Surveystreamflow-
gaging stationnumber
Period ofrecord
(climaticyear)
Station nameDrainage
area(mi2)
Medianstreamflow
(ft3/s)
Meanstreamflow
(ft3/s)
1-day,10-year low-flow statistic
(ft3/s)
7-day,10-year low-flow statistic
(ft3/s)
30-day,10-year low-flow statistic
(ft3/s)

32
01480700 1975-96 East Branch Brandywine Creek near Downingtown 60.6 58.0 90.7 12.4 14.5 18.501480800 1958-68 East Branch Brandywine Creek at Downingtown 81.6 55.9 85.8 11.5 12.0 14.601480870 1975-94 East Branch Brandywine Creek below Downingtown 89.9 95.5 147 26.1 28.6 34.001481000 11913-72 Brandywine Creek at Chadds Ford 287 275 376 62.0 68.0 78.501481000 1975-95 Brandywine Creek at Chadds Ford 287 295 433 83.4 89.1 10201516350 1978-96 Tioga River near Mansfield 153 97.5 218 9.09 9.79 11.601516500 1956-95 Corey Creek near Mainesburg 12.2 4.30 12.7 --- .05 .1401517000 1957-76 Elk Run near Mainesburg 10.2 3.50 10.7 --- .06 .0801518000 1940-76 Tioga River at Tioga 282 132 334 7.48 8.71 10.801518000 1977-95 Tioga River at Tioga 282 182 451 21.4 24.3 26.401518500 1955-74 Crooked Creek at Tioga 122 35.2 113 2.13 2.33 2.8101518700 1981-96 Tioga River at Tioga Junction 446 198 508 24.4 28.5 32.201518862 1985-95 Cowanesque River at Westfield 90.6 42.0 98.1 .83 1.14 2.0401520000 1953-76 Cowanesque River near Lawrenceville 298 91.8 281 1.61 2.10 3.2201520000 1981-95 Cowanesque River near Lawrenceville 298 102 304 6.21 6.79 8.6701531500 1915-78 Susquehanna River at Towanda 7,797 5,430 10,700 536 568 67201531500 1981-95 Susquehanna River at Towanda 7,797 5,680 10,500 574 621 82101531500 1915-95 Susquehanna River at Towanda 7,797 5,470 10,600 547 581 69901532000 1915-96 Towanda Creek near Monroetown 215 117 289 2.23 2.79 4.5201532850 1967-79 Middle Branch Wyalusing Creek Tributary near Birchardsville 5.67 4.30 10.6 .12 .16 .3001533400 1980-96 Susquehanna River at Meshoppen 8,720 6,170 11,400 624 672 84201533500 1942-58 North Branch Mehoopany Creek near Lovelton 35.2 20.7 46.9 .42 .60 .7701533950 1962-78 South Branch Tunkhannock Creek near Montdale 12.6 7.20 17.5 .19 .26 .6201534000 1915-93 Tunkhannock Creek near Tunkhannock 383 257 538 15.6 17.5 24.401534300 1961-95 Lackawanna River near Forest City 38.8 39.3 72.7 --- 1.66 2.8601534500 1941-58 Lackawanna River at Archbald 108 124 207 18.7 22.8 25.501534500 1961-96 Lackawanna River at Archbald 108 121 201 15.7 18.0 21.101535500 1915-28 Lackawanna River at Moosic 264 325 478 72.0 84.2 89.401536000 1940-58 Lackawanna River at Old Forge 332 343 558 77.3 94.1 105
Appendix 1. Low-flow statistics for gaged Pennsylvania streams—Continued
[Low-flow statistics computed from Log-Pearson distribution of streamflow data; ---, calculated statistic not shown; mi2, square miles; ft3/s, cubic feet per second;climatic year, 12-month period April 1 - March 31]
U.S.Geological
Surveystreamflow-
gaging stationnumber
Period ofrecord
(climaticyear)
Station nameDrainage
area(mi2)
Medianstreamflow
(ft3/s)
Meanstreamflow
(ft3/s)
1-day,10-year low-flow statistic
(ft3/s)
7-day,10-year low-flow statistic
(ft3/s)
30-day,10-year low-flow statistic
(ft3/s)

33
01536000 1961-95 Lackawanna River at Old Forge 332 241 442 30.9 35.2 42.901536500 1901-78 Susquehanna River at Wilkes-Barre 9,960 7,040 13,420 775 808 92201536500 1981-96 Susquehanna River at Wilkes-Barre 9,960 7,430 13,400 827 874 1,05001536500 1900-96 Susquehanna River at Wilkes-Barre 9,960 7,100 13,400 785 821 94501537000 1943-92 Toby Creek at Luzerne 32.4 20.9 41.3 1.32 1.99 3.0501537500 1941-88 Solomon Creek at Wilkes-Barre 15.7 11.4 18.9 --- .38 .5401538000 1921-95 Wapwallopen Creek near Wapwallopen 43.8 41.4 65.1 2.92 3.45 4.8701539000 1940-95 Fishing Creek near Bloomsburg 274 275 481 15.6 17.1 21.601539500 1942-58 Little Fishing Creek at Eyers Grove 56.5 37.7 85.5 .14 .28 1.0301540000 1915-28 Fishing Creek at Bloomsburg 355 386 682 22.5 37.0 56.401540500 1981-95 Susquehanna River at Danville 11,220 8,660 15,200 1,140 1,200 1,41001540500 1906-96 Susquehanna River at Danville 11,220 8,420 15,200 960 1,010 1,20001541000 1913-95 West Branch Susquehanna River at Bower 315 287 558 24.3 26.9 34.201541200 1967-95 West Branch Susquehanna River at Curwensville 367 405 690 30.6 43.6 62.501541303 1980-95 West Branch Susquehanna River at Hyde 474 524 873 51.2 58.8 82.701541308 1969-79 Bradley Run near Ashville 6.77 7.70 13.1 1.28 1.32 1.6001541500 1915-59 Clearfield Creek at Dimeling 371 278 573 14.7 21.0 28.301541500 1962-96 Clearfield Creek at Dimeling 371 331 600 38.3 41.2 51.401542000 1942-93 Moshannon Creek at Oceola Mills 68.8 68.2 111 7.49 8.44 11.001542500 1942-59 West Branch Susquehanna River at Karthaus 1,462 1,390 2,520 117 126 14801542500 1962-96 West Branch Susquehanna River at Karthaus 1,462 1,520 2,520 170 185 22601542810 1966-95 Waldy Run near Emporium 5.24 3.60 9.05 .07 .08 .2501543000 1913-95 Driftwood Branch Sinnemahoning Creek near Sinnemahoning 272 209 453 2.83 4.11 9.4301543500 1940-96 Sinnemahoning Creek at Sinnemahoning 685 571 1,150 10.1 14.0 25.701544000 1958-95 First Fork Sinnemahoning Creek near Sinnemahoning 245 196 400 2.73 6.40 10.601544500 1942-95 Kettle Creek at Cross Fork 136 109 229 4.32 5.04 7.6501545000 1964-95 Kettle Creek near Westport 233 186 379 7.23 8.98 13.501546000 1912-28 North Bald Eagle Creek at Milesburg 119 80.8 212 1.75 2.15 3.7001546400 1985-95 Spring Creek at Houserville 58.5 45.9 64.4 14.6 15.0 16.6
Appendix 1. Low-flow statistics for gaged Pennsylvania streams—Continued
[Low-flow statistics computed from Log-Pearson distribution of streamflow data; ---, calculated statistic not shown; mi2, square miles; ft3/s, cubic feet per second;climatic year, 12-month period April 1 - March 31]
U.S.Geological
Surveystreamflow-
gaging stationnumber
Period ofrecord
(climaticyear)
Station nameDrainage
area(mi2)
Medianstreamflow
(ft3/s)
Meanstreamflow
(ft3/s)
1-day,10-year low-flow statistic
(ft3/s)
7-day,10-year low-flow statistic
(ft3/s)
30-day,10-year low-flow statistic
(ft3/s)
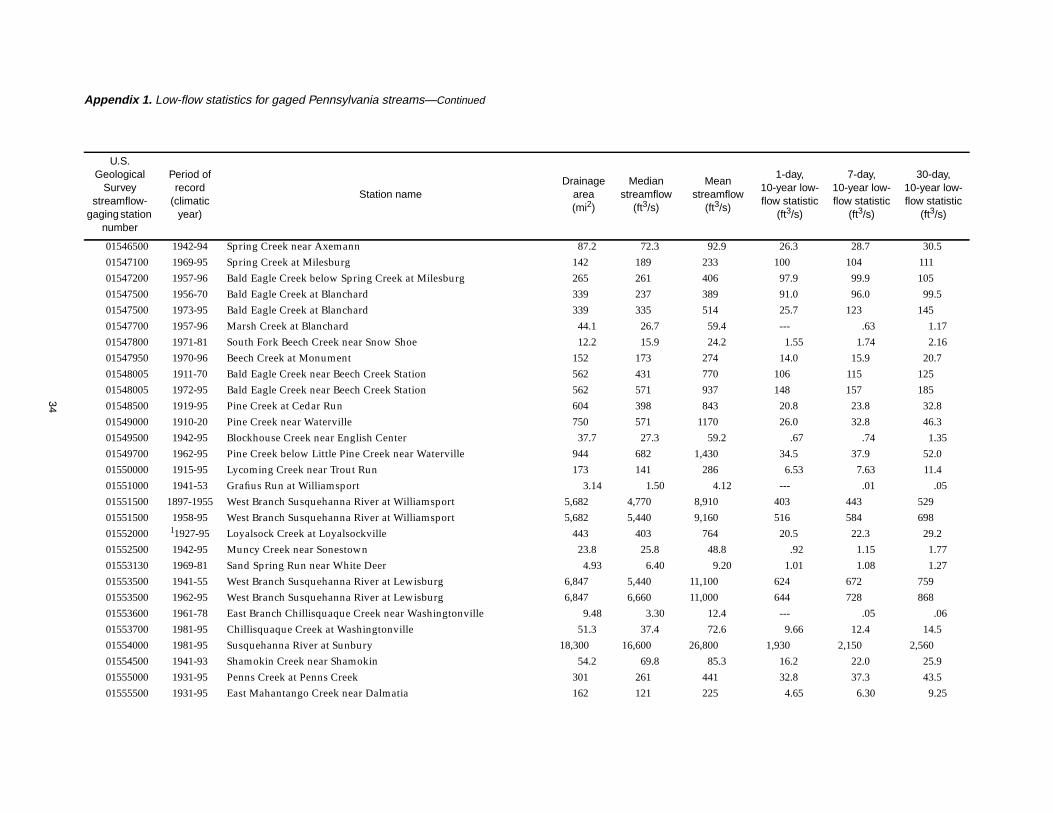
34
01546500 1942-94 Spring Creek near Axemann 87.2 72.3 92.9 26.3 28.7 30.501547100 1969-95 Spring Creek at Milesburg 142 189 233 100 104 11101547200 1957-96 Bald Eagle Creek below Spring Creek at Milesburg 265 261 406 97.9 99.9 10501547500 1956-70 Bald Eagle Creek at Blanchard 339 237 389 91.0 96.0 99.501547500 1973-95 Bald Eagle Creek at Blanchard 339 335 514 25.7 123 14501547700 1957-96 Marsh Creek at Blanchard 44.1 26.7 59.4 --- .63 1.1701547800 1971-81 South Fork Beech Creek near Snow Shoe 12.2 15.9 24.2 1.55 1.74 2.1601547950 1970-96 Beech Creek at Monument 152 173 274 14.0 15.9 20.701548005 1911-70 Bald Eagle Creek near Beech Creek Station 562 431 770 106 115 12501548005 1972-95 Bald Eagle Creek near Beech Creek Station 562 571 937 148 157 18501548500 1919-95 Pine Creek at Cedar Run 604 398 843 20.8 23.8 32.801549000 1910-20 Pine Creek near Waterville 750 571 1170 26.0 32.8 46.301549500 1942-95 Blockhouse Creek near English Center 37.7 27.3 59.2 .67 .74 1.3501549700 1962-95 Pine Creek below Little Pine Creek near Waterville 944 682 1,430 34.5 37.9 52.001550000 1915-95 Lycoming Creek near Trout Run 173 141 286 6.53 7.63 11.401551000 1941-53 Grafius Run at Williamsport 3.14 1.50 4.12 --- .01 .0501551500 1897-1955 West Branch Susquehanna River at Williamsport 5,682 4,770 8,910 403 443 52901551500 1958-95 West Branch Susquehanna River at Williamsport 5,682 5,440 9,160 516 584 69801552000 11927-95 Loyalsock Creek at Loyalsockville 443 403 764 20.5 22.3 29.201552500 1942-95 Muncy Creek near Sonestown 23.8 25.8 48.8 .92 1.15 1.7701553130 1969-81 Sand Spring Run near White Deer 4.93 6.40 9.20 1.01 1.08 1.2701553500 1941-55 West Branch Susquehanna River at Lewisburg 6,847 5,440 11,100 624 672 75901553500 1962-95 West Branch Susquehanna River at Lewisburg 6,847 6,660 11,000 644 728 86801553600 1961-78 East Branch Chillisquaque Creek near Washingtonville 9.48 3.30 12.4 --- .05 .0601553700 1981-95 Chillisquaque Creek at Washingtonville 51.3 37.4 72.6 9.66 12.4 14.501554000 1981-95 Susquehanna River at Sunbury 18,300 16,600 26,800 1,930 2,150 2,56001554500 1941-93 Shamokin Creek near Shamokin 54.2 69.8 85.3 16.2 22.0 25.901555000 1931-95 Penns Creek at Penns Creek 301 261 441 32.8 37.3 43.501555500 1931-95 East Mahantango Creek near Dalmatia 162 121 225 4.65 6.30 9.25
Appendix 1. Low-flow statistics for gaged Pennsylvania streams—Continued
[Low-flow statistics computed from Log-Pearson distribution of streamflow data; ---, calculated statistic not shown; mi2, square miles; ft3/s, cubic feet per second;climatic year, 12-month period April 1 - March 31]
U.S.Geological
Surveystreamflow-
gaging stationnumber
Period ofrecord
(climaticyear)
Station nameDrainage
area(mi2)
Medianstreamflow
(ft3/s)
Meanstreamflow
(ft3/s)
1-day,10-year low-flow statistic
(ft3/s)
7-day,10-year low-flow statistic
(ft3/s)
30-day,10-year low-flow statistic
(ft3/s)
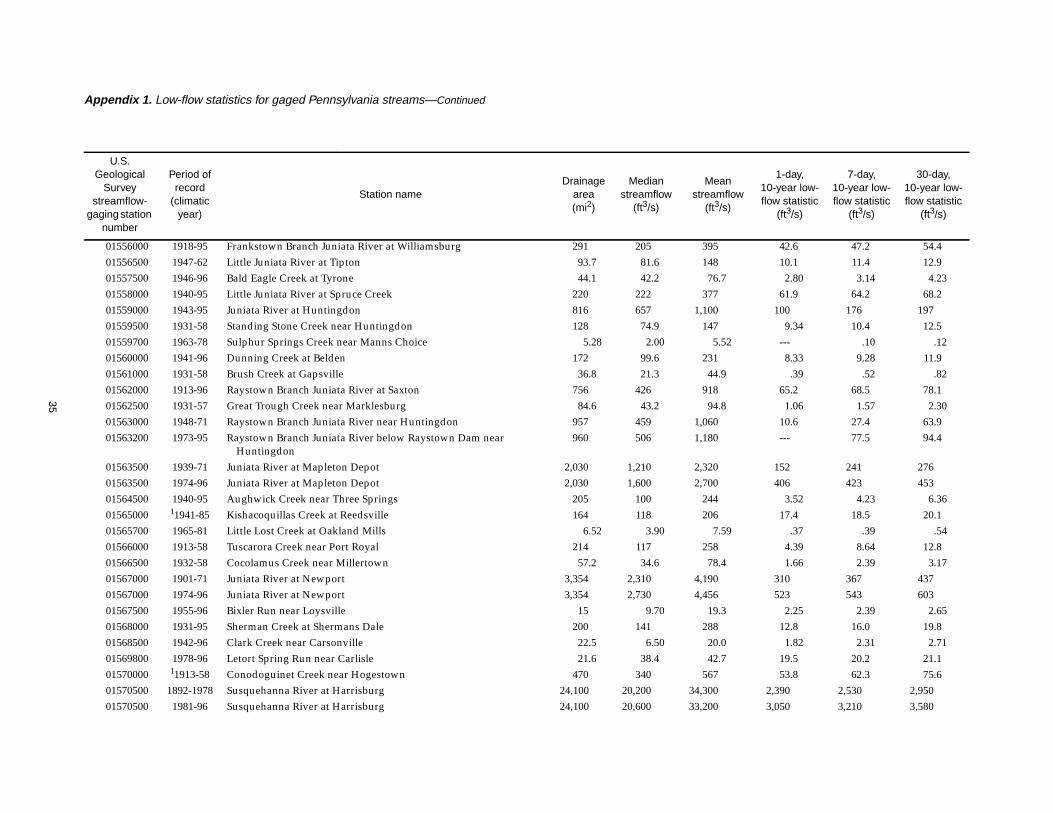
35
01556000 1918-95 Frankstown Branch Juniata River at Williamsburg 291 205 395 42.6 47.2 54.401556500 1947-62 Little Juniata River at Tipton 93.7 81.6 148 10.1 11.4 12.901557500 1946-96 Bald Eagle Creek at Tyrone 44.1 42.2 76.7 2.80 3.14 4.2301558000 1940-95 Little Juniata River at Spruce Creek 220 222 377 61.9 64.2 68.201559000 1943-95 Juniata River at Huntingdon 816 657 1,100 100 176 19701559500 1931-58 Standing Stone Creek near Huntingdon 128 74.9 147 9.34 10.4 12.501559700 1963-78 Sulphur Springs Creek near Manns Choice 5.28 2.00 5.52 --- .10 .1201560000 1941-96 Dunning Creek at Belden 172 99.6 231 8.33 9.28 11.901561000 1931-58 Brush Creek at Gapsville 36.8 21.3 44.9 .39 .52 .8201562000 1913-96 Raystown Branch Juniata River at Saxton 756 426 918 65.2 68.5 78.101562500 1931-57 Great Trough Creek near Marklesburg 84.6 43.2 94.8 1.06 1.57 2.3001563000 1948-71 Raystown Branch Juniata River near Huntingdon 957 459 1,060 10.6 27.4 63.901563200 1973-95 Raystown Branch Juniata River below Raystown Dam near
Huntingdon960 506 1,180 --- 77.5 94.4
01563500 1939-71 Juniata River at Mapleton Depot 2,030 1,210 2,320 152 241 27601563500 1974-96 Juniata River at Mapleton Depot 2,030 1,600 2,700 406 423 45301564500 1940-95 Aughwick Creek near Three Springs 205 100 244 3.52 4.23 6.3601565000 11941-85 Kishacoquillas Creek at Reedsville 164 118 206 17.4 18.5 20.101565700 1965-81 Little Lost Creek at Oakland Mills 6.52 3.90 7.59 .37 .39 .5401566000 1913-58 Tuscarora Creek near Port Royal 214 117 258 4.39 8.64 12.801566500 1932-58 Cocolamus Creek near Millertown 57.2 34.6 78.4 1.66 2.39 3.1701567000 1901-71 Juniata River at Newport 3,354 2,310 4,190 310 367 43701567000 1974-96 Juniata River at Newport 3,354 2,730 4,456 523 543 60301567500 1955-96 Bixler Run near Loysville 15 9.70 19.3 2.25 2.39 2.6501568000 1931-95 Sherman Creek at Shermans Dale 200 141 288 12.8 16.0 19.801568500 1942-96 Clark Creek near Carsonville 22.5 6.50 20.0 1.82 2.31 2.7101569800 1978-96 Letort Spring Run near Carlisle 21.6 38.4 42.7 19.5 20.2 21.101570000 11913-58 Conodoguinet Creek near Hogestown 470 340 567 53.8 62.3 75.601570500 1892-1978 Susquehanna River at Harrisburg 24,100 20,200 34,300 2,390 2,530 2,95001570500 1981-96 Susquehanna River at Harrisburg 24,100 20,600 33,200 3,050 3,210 3,580
Appendix 1. Low-flow statistics for gaged Pennsylvania streams—Continued
[Low-flow statistics computed from Log-Pearson distribution of streamflow data; ---, calculated statistic not shown; mi2, square miles; ft3/s, cubic feet per second;climatic year, 12-month period April 1 - March 31]
U.S.Geological
Surveystreamflow-
gaging stationnumber
Period ofrecord
(climaticyear)
Station nameDrainage
area(mi2)
Medianstreamflow
(ft3/s)
Meanstreamflow
(ft3/s)
1-day,10-year low-flow statistic
(ft3/s)
7-day,10-year low-flow statistic
(ft3/s)
30-day,10-year low-flow statistic
(ft3/s)
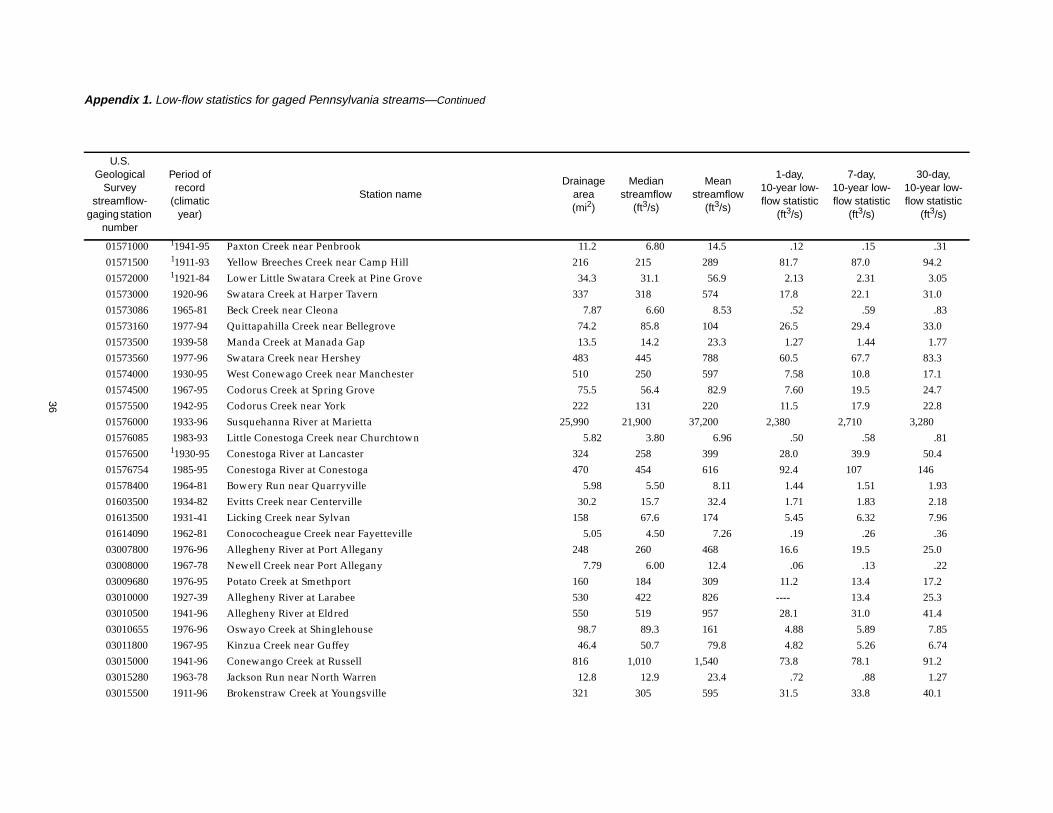
36
01571000 11941-95 Paxton Creek near Penbrook 11.2 6.80 14.5 .12 .15 .3101571500 11911-93 Yellow Breeches Creek near Camp Hill 216 215 289 81.7 87.0 94.201572000 11921-84 Lower Little Swatara Creek at Pine Grove 34.3 31.1 56.9 2.13 2.31 3.0501573000 1920-96 Swatara Creek at Harper Tavern 337 318 574 17.8 22.1 31.001573086 1965-81 Beck Creek near Cleona 7.87 6.60 8.53 .52 .59 .8301573160 1977-94 Quittapahilla Creek near Bellegrove 74.2 85.8 104 26.5 29.4 33.001573500 1939-58 Manda Creek at Manada Gap 13.5 14.2 23.3 1.27 1.44 1.7701573560 1977-96 Swatara Creek near Hershey 483 445 788 60.5 67.7 83.301574000 1930-95 West Conewago Creek near Manchester 510 250 597 7.58 10.8 17.101574500 1967-95 Codorus Creek at Spring Grove 75.5 56.4 82.9 7.60 19.5 24.701575500 1942-95 Codorus Creek near York 222 131 220 11.5 17.9 22.801576000 1933-96 Susquehanna River at Marietta 25,990 21,900 37,200 2,380 2,710 3,28001576085 1983-93 Little Conestoga Creek near Churchtown 5.82 3.80 6.96 .50 .58 .8101576500 11930-95 Conestoga River at Lancaster 324 258 399 28.0 39.9 50.401576754 1985-95 Conestoga River at Conestoga 470 454 616 92.4 107 14601578400 1964-81 Bowery Run near Quarryville 5.98 5.50 8.11 1.44 1.51 1.9301603500 1934-82 Evitts Creek near Centerville 30.2 15.7 32.4 1.71 1.83 2.1801613500 1931-41 Licking Creek near Sylvan 158 67.6 174 5.45 6.32 7.9601614090 1962-81 Conococheague Creek near Fayetteville 5.05 4.50 7.26 .19 .26 .3603007800 1976-96 Allegheny River at Port Allegany 248 260 468 16.6 19.5 25.003008000 1967-78 Newell Creek near Port Allegany 7.79 6.00 12.4 .06 .13 .2203009680 1976-95 Potato Creek at Smethport 160 184 309 11.2 13.4 17.203010000 1927-39 Allegheny River at Larabee 530 422 826 ---- 13.4 25.303010500 1941-96 Allegheny River at Eldred 550 519 957 28.1 31.0 41.403010655 1976-96 Oswayo Creek at Shinglehouse 98.7 89.3 161 4.88 5.89 7.8503011800 1967-95 Kinzua Creek near Guffey 46.4 50.7 79.8 4.82 5.26 6.7403015000 1941-96 Conewango Creek at Russell 816 1,010 1,540 73.8 78.1 91.203015280 1963-78 Jackson Run near North Warren 12.8 12.9 23.4 .72 .88 1.2703015500 1911-96 Brokenstraw Creek at Youngsville 321 305 595 31.5 33.8 40.1
Appendix 1. Low-flow statistics for gaged Pennsylvania streams—Continued
[Low-flow statistics computed from Log-Pearson distribution of streamflow data; ---, calculated statistic not shown; mi2, square miles; ft3/s, cubic feet per second;climatic year, 12-month period April 1 - March 31]
U.S.Geological
Surveystreamflow-
gaging stationnumber
Period ofrecord
(climaticyear)
Station nameDrainage
area(mi2)
Medianstreamflow
(ft3/s)
Meanstreamflow
(ft3/s)
1-day,10-year low-flow statistic
(ft3/s)
7-day,10-year low-flow statistic
(ft3/s)
30-day,10-year low-flow statistic
(ft3/s)

37
03016000 1943-96 Allegheny River at West Hickory 3,660 4,330 6,720 367 394 47203017500 1940-79 Tionesta Creek at Lynch 233 245 430 14.6 16.4 22.103019000 1924-40 Tionesta Creek at Nebraska 469 390 815 20.2 24.6 35.803020000 1941-91 Tionesta Creek at Tionesta Dam 479 531 900 --- --- 40.803020500 1934-96 Oil Creek at Rouseville 300 294 544 28.0 30.6 37.703021000 1911-32 Oil Creek near Rouseville 315 242 515 26.2 33.7 40.803021350 1976-96 French Creek near Wattsburg 92 106 220 4.37 5.11 8.6203021410 1976-94 West Branch French Creek near Lowville 52.3 59.7 131 2.24 2.69 4.7403021700 1962-78 Little Conneautee Creek near McKean 3.6 2.30 7.61 --- .01 .0303022500 1923-39 French Creek at Saegerstown 629 506 1,060 27.0 31.0 38.803022540 1976-96 Woodcock Creek at Blooming Valley 31.1 30.2 55.3 2.05 2.32 3.3603023000 1912-38 Cussewago Creek near Meadville 90.2 45.5 128 .31 .42 .9503023500 1910-25 French Creek at Carlton 998 845 1,750 68.5 72.3 97.803024000 1934-70 French Creek at Utica 1,028 907 1,730 58.1 62.0 78.203024000 1973-96 French Creek at Utica 1,028 1,380 2,020 86.6 95.7 11703025000 1934-79 Sugar Creek at Sugarcreek 166 144 273 14.5 16.6 20.003025200 1966-78 Patchel Run near Franklin 5.69 5.50 8.68 .58 .63 .8903026500 1953-96 Sevenmile Run near Rasselas 7.84 8.20 14.7 .17 .22 .3603027500 1954-91 East Branch Clarion River at East Branch Clarion River Dam 73.2 108 138 --- 15.7 19.903028000 1955-96 West Branch Clarion River at Wilcox 63 75.4 128 5.93 6.67 8.4203028500 1954-94 Clarion River at Johnsonburg 204 258 384 55.4 65.3 78.703029000 1942-51 Clarion River at Ridgway 303 313 603 17.7 25.3 31.603029400 1961-78 Toms Run at Cooksburg 12.6 8.90 19.5 .44 .56 .7703029500 1940-51 Clarion River at Cooksburg 807 802 1,470 51.8 57.4 70.803029500 1954-96 Clarion River at Cooksburg 807 909 1,490 143 164 18703030500 1949-95 Clarion River near Piney 951 1,150 1,800 17.1 66.4 13503031000 1943-53 Clarion River at St. Petersburg 1,246 1,230 2,250 38.4 55.1 72.703031500 1934-95 Allegheny River at Parker 7,671 8,820 13,800 649 772 97103031950 1965-81 Big Run near Sprankle Mills 7.38 7.00 13.2 .27 .41 .73
Appendix 1. Low-flow statistics for gaged Pennsylvania streams—Continued
[Low-flow statistics computed from Log-Pearson distribution of streamflow data; ---, calculated statistic not shown; mi2, square miles; ft3/s, cubic feet per second;climatic year, 12-month period April 1 - March 31]
U.S.Geological
Surveystreamflow-
gaging stationnumber
Period ofrecord
(climaticyear)
Station nameDrainage
area(mi2)
Medianstreamflow
(ft3/s)
Meanstreamflow
(ft3/s)
1-day,10-year low-flow statistic
(ft3/s)
7-day,10-year low-flow statistic
(ft3/s)
30-day,10-year low-flow statistic
(ft3/s)
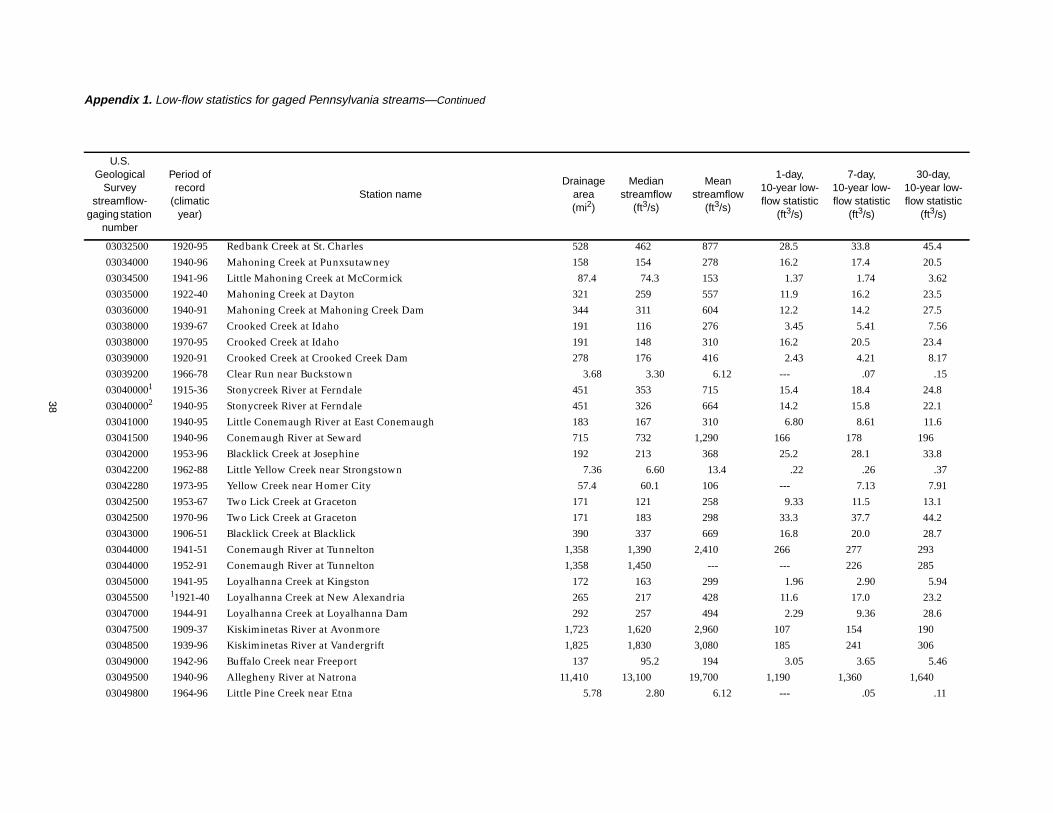
38
03032500 1920-95 Redbank Creek at St. Charles 528 462 877 28.5 33.8 45.403034000 1940-96 Mahoning Creek at Punxsutawney 158 154 278 16.2 17.4 20.503034500 1941-96 Little Mahoning Creek at McCormick 87.4 74.3 153 1.37 1.74 3.6203035000 1922-40 Mahoning Creek at Dayton 321 259 557 11.9 16.2 23.503036000 1940-91 Mahoning Creek at Mahoning Creek Dam 344 311 604 12.2 14.2 27.503038000 1939-67 Crooked Creek at Idaho 191 116 276 3.45 5.41 7.5603038000 1970-95 Crooked Creek at Idaho 191 148 310 16.2 20.5 23.403039000 1920-91 Crooked Creek at Crooked Creek Dam 278 176 416 2.43 4.21 8.1703039200 1966-78 Clear Run near Buckstown 3.68 3.30 6.12 --- .07 .15030400001 1915-36 Stonycreek River at Ferndale 451 353 715 15.4 18.4 24.8030400002 1940-95 Stonycreek River at Ferndale 451 326 664 14.2 15.8 22.103041000 1940-95 Little Conemaugh River at East Conemaugh 183 167 310 6.80 8.61 11.603041500 1940-96 Conemaugh River at Seward 715 732 1,290 166 178 19603042000 1953-96 Blacklick Creek at Josephine 192 213 368 25.2 28.1 33.803042200 1962-88 Little Yellow Creek near Strongstown 7.36 6.60 13.4 .22 .26 .3703042280 1973-95 Yellow Creek near Homer City 57.4 60.1 106 --- 7.13 7.9103042500 1953-67 Two Lick Creek at Graceton 171 121 258 9.33 11.5 13.103042500 1970-96 Two Lick Creek at Graceton 171 183 298 33.3 37.7 44.203043000 1906-51 Blacklick Creek at Blacklick 390 337 669 16.8 20.0 28.703044000 1941-51 Conemaugh River at Tunnelton 1,358 1,390 2,410 266 277 29303044000 1952-91 Conemaugh River at Tunnelton 1,358 1,450 --- --- 226 28503045000 1941-95 Loyalhanna Creek at Kingston 172 163 299 1.96 2.90 5.9403045500 11921-40 Loyalhanna Creek at New Alexandria 265 217 428 11.6 17.0 23.203047000 1944-91 Loyalhanna Creek at Loyalhanna Dam 292 257 494 2.29 9.36 28.603047500 1909-37 Kiskiminetas River at Avonmore 1,723 1,620 2,960 107 154 19003048500 1939-96 Kiskiminetas River at Vandergrift 1,825 1,830 3,080 185 241 30603049000 1942-96 Buffalo Creek near Freeport 137 95.2 194 3.05 3.65 5.4603049500 1940-96 Allegheny River at Natrona 11,410 13,100 19,700 1,190 1,360 1,64003049800 1964-96 Little Pine Creek near Etna 5.78 2.80 6.12 --- .05 .11
Appendix 1. Low-flow statistics for gaged Pennsylvania streams—Continued
[Low-flow statistics computed from Log-Pearson distribution of streamflow data; ---, calculated statistic not shown; mi2, square miles; ft3/s, cubic feet per second;climatic year, 12-month period April 1 - March 31]
U.S.Geological
Surveystreamflow-
gaging stationnumber
Period ofrecord
(climaticyear)
Station nameDrainage
area(mi2)
Medianstreamflow
(ft3/s)
Meanstreamflow
(ft3/s)
1-day,10-year low-flow statistic
(ft3/s)
7-day,10-year low-flow statistic
(ft3/s)
30-day,10-year low-flow statistic
(ft3/s)
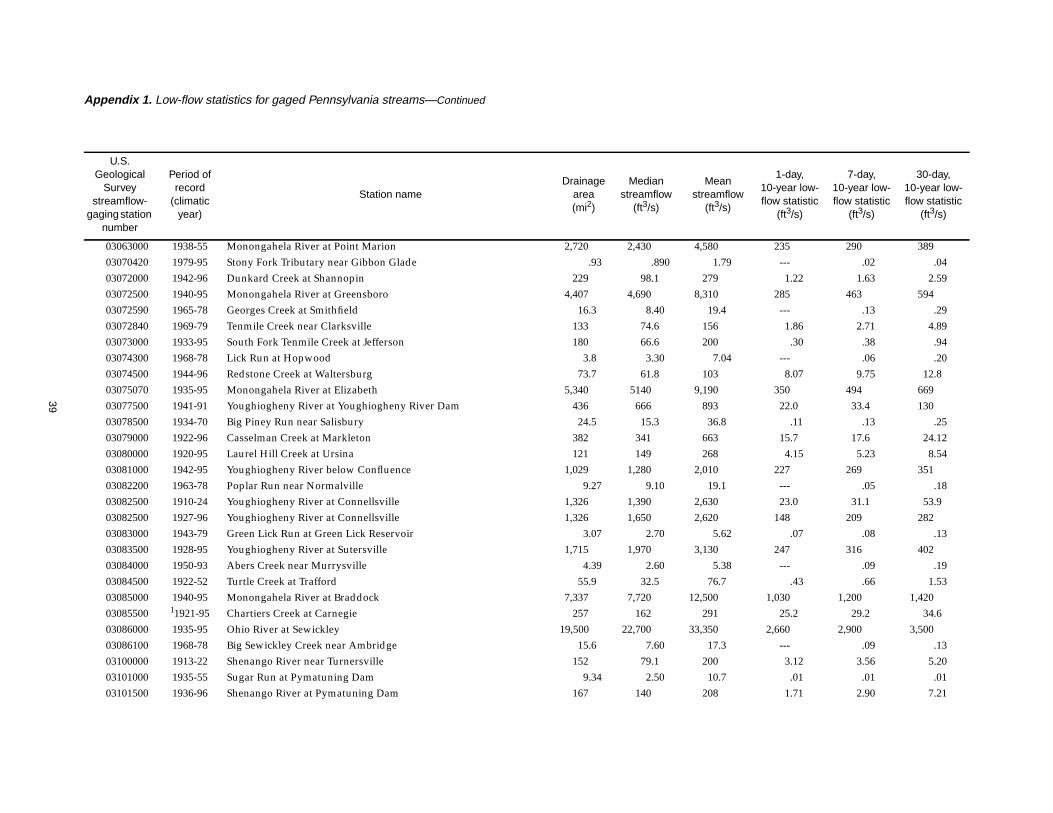
39
03063000 1938-55 Monongahela River at Point Marion 2,720 2,430 4,580 235 290 38903070420 1979-95 Stony Fork Tributary near Gibbon Glade .93 .890 1.79 --- .02 .0403072000 1942-96 Dunkard Creek at Shannopin 229 98.1 279 1.22 1.63 2.5903072500 1940-95 Monongahela River at Greensboro 4,407 4,690 8,310 285 463 59403072590 1965-78 Georges Creek at Smithfield 16.3 8.40 19.4 --- .13 .2903072840 1969-79 Tenmile Creek near Clarksville 133 74.6 156 1.86 2.71 4.8903073000 1933-95 South Fork Tenmile Creek at Jefferson 180 66.6 200 .30 .38 .9403074300 1968-78 Lick Run at Hopwood 3.8 3.30 7.04 --- .06 .2003074500 1944-96 Redstone Creek at Waltersburg 73.7 61.8 103 8.07 9.75 12.803075070 1935-95 Monongahela River at Elizabeth 5,340 5140 9,190 350 494 66903077500 1941-91 Youghiogheny River at Youghiogheny River Dam 436 666 893 22.0 33.4 13003078500 1934-70 Big Piney Run near Salisbury 24.5 15.3 36.8 .11 .13 .2503079000 1922-96 Casselman Creek at Markleton 382 341 663 15.7 17.6 24.1203080000 1920-95 Laurel Hill Creek at Ursina 121 149 268 4.15 5.23 8.5403081000 1942-95 Youghiogheny River below Confluence 1,029 1,280 2,010 227 269 35103082200 1963-78 Poplar Run near Normalville 9.27 9.10 19.1 --- .05 .1803082500 1910-24 Youghiogheny River at Connellsville 1,326 1,390 2,630 23.0 31.1 53.903082500 1927-96 Youghiogheny River at Connellsville 1,326 1,650 2,620 148 209 28203083000 1943-79 Green Lick Run at Green Lick Reservoir 3.07 2.70 5.62 .07 .08 .1303083500 1928-95 Youghiogheny River at Sutersville 1,715 1,970 3,130 247 316 40203084000 1950-93 Abers Creek near Murrysville 4.39 2.60 5.38 --- .09 .1903084500 1922-52 Turtle Creek at Trafford 55.9 32.5 76.7 .43 .66 1.5303085000 1940-95 Monongahela River at Braddock 7,337 7,720 12,500 1,030 1,200 1,42003085500 11921-95 Chartiers Creek at Carnegie 257 162 291 25.2 29.2 34.603086000 1935-95 Ohio River at Sewickley 19,500 22,700 33,350 2,660 2,900 3,50003086100 1968-78 Big Sewickley Creek near Ambridge 15.6 7.60 17.3 --- .09 .1303100000 1913-22 Shenango River near Turnersville 152 79.1 200 3.12 3.56 5.2003101000 1935-55 Sugar Run at Pymatuning Dam 9.34 2.50 10.7 .01 .01 .0103101500 1936-96 Shenango River at Pymatuning Dam 167 140 208 1.71 2.90 7.21
Appendix 1. Low-flow statistics for gaged Pennsylvania streams—Continued
[Low-flow statistics computed from Log-Pearson distribution of streamflow data; ---, calculated statistic not shown; mi2, square miles; ft3/s, cubic feet per second;climatic year, 12-month period April 1 - March 31]
U.S.Geological
Surveystreamflow-
gaging stationnumber
Period ofrecord
(climaticyear)
Station nameDrainage
area(mi2)
Medianstreamflow
(ft3/s)
Meanstreamflow
(ft3/s)
1-day,10-year low-flow statistic
(ft3/s)
7-day,10-year low-flow statistic
(ft3/s)
30-day,10-year low-flow statistic
(ft3/s)
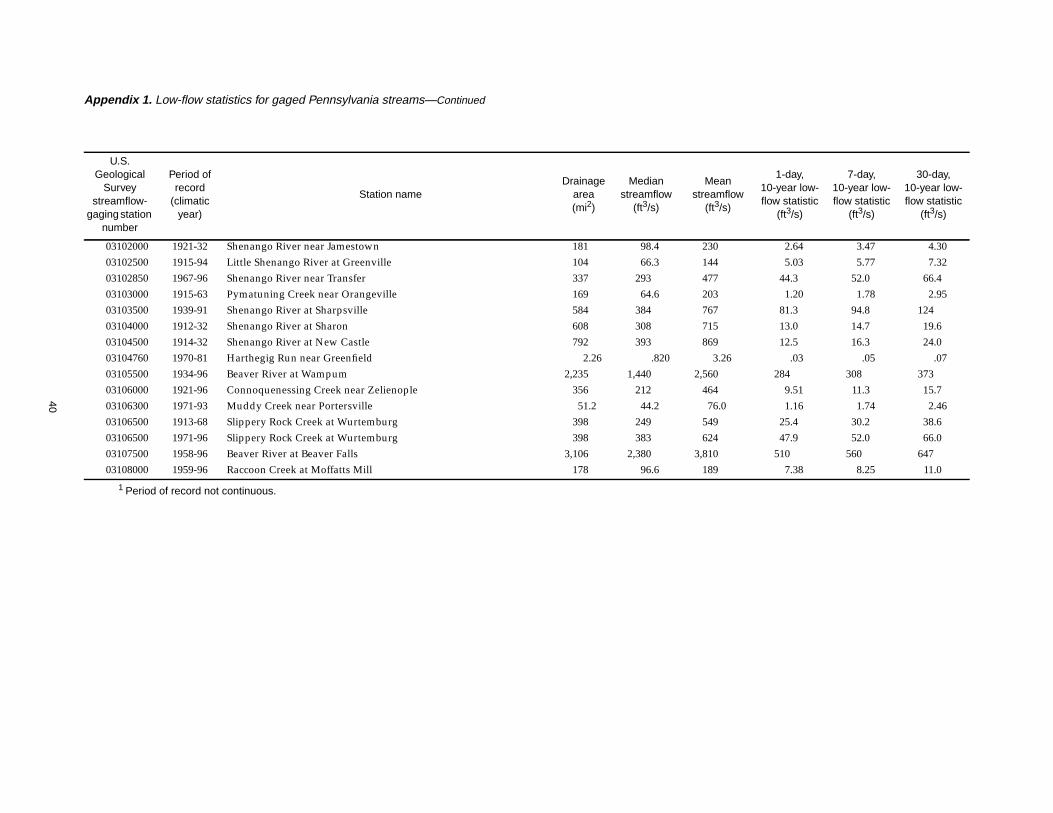
40
03102000 1921-32 Shenango River near Jamestown 181 98.4 230 2.64 3.47 4.3003102500 1915-94 Little Shenango River at Greenville 104 66.3 144 5.03 5.77 7.3203102850 1967-96 Shenango River near Transfer 337 293 477 44.3 52.0 66.403103000 1915-63 Pymatuning Creek near Orangeville 169 64.6 203 1.20 1.78 2.9503103500 1939-91 Shenango River at Sharpsville 584 384 767 81.3 94.8 12403104000 1912-32 Shenango River at Sharon 608 308 715 13.0 14.7 19.603104500 1914-32 Shenango River at New Castle 792 393 869 12.5 16.3 24.003104760 1970-81 Harthegig Run near Greenfield 2.26 .820 3.26 .03 .05 .0703105500 1934-96 Beaver River at Wampum 2,235 1,440 2,560 284 308 37303106000 1921-96 Connoquenessing Creek near Zelienople 356 212 464 9.51 11.3 15.703106300 1971-93 Muddy Creek near Portersville 51.2 44.2 76.0 1.16 1.74 2.4603106500 1913-68 Slippery Rock Creek at Wurtemburg 398 249 549 25.4 30.2 38.603106500 1971-96 Slippery Rock Creek at Wurtemburg 398 383 624 47.9 52.0 66.003107500 1958-96 Beaver River at Beaver Falls 3,106 2,380 3,810 510 560 64703108000 1959-96 Raccoon Creek at Moffatts Mill 178 96.6 189 7.38 8.25 11.0
1 Period of record not continuous.
Appendix 1. Low-flow statistics for gaged Pennsylvania streams—Continued
[Low-flow statistics computed from Log-Pearson distribution of streamflow data; ---, calculated statistic not shown; mi2, square miles; ft3/s, cubic feet per second;climatic year, 12-month period April 1 - March 31]
U.S.Geological
Surveystreamflow-
gaging stationnumber
Period ofrecord
(climaticyear)
Station nameDrainage
area(mi2)
Medianstreamflow
(ft3/s)
Meanstreamflow
(ft3/s)
1-day,10-year low-flow statistic
(ft3/s)
7-day,10-year low-flow statistic
(ft3/s)
30-day,10-year low-flow statistic
(ft3/s)
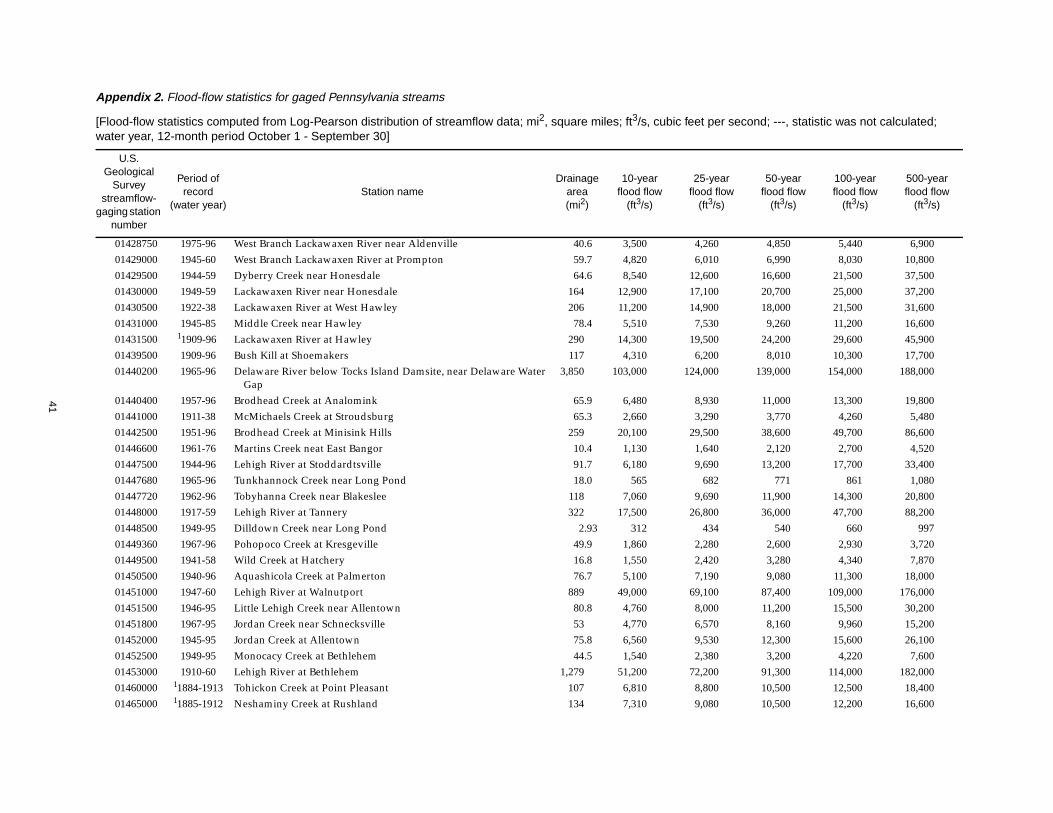
41
Appendix 2. Flood-flow statistics for gaged Pennsylvania streams
[Flood-flow statistics computed from Log-Pearson distribution of streamflow data; mi2, square miles; ft3/s, cubic feet per second; ---, statistic was not calculated;water year, 12-month period October 1 - September 30]
U.S.Geological
Surveystreamflow-
gaging stationnumber
Period ofrecord
(water year)Station name
Drainagearea(mi2)
10-yearflood flow
(ft3/s)
25-yearflood flow
(ft3/s)
50-yearflood flow
(ft3/s)
100-yearflood flow
(ft3/s)
500-yearflood flow
(ft3/s)
01428750 1975-96 West Branch Lackawaxen River near Aldenville 40.6 3,500 4,260 4,850 5,440 6,90001429000 1945-60 West Branch Lackawaxen River at Prompton 59.7 4,820 6,010 6,990 8,030 10,80001429500 1944-59 Dyberry Creek near Honesdale 64.6 8,540 12,600 16,600 21,500 37,50001430000 1949-59 Lackawaxen River near Honesdale 164 12,900 17,100 20,700 25,000 37,20001430500 1922-38 Lackawaxen River at West Hawley 206 11,200 14,900 18,000 21,500 31,60001431000 1945-85 Middle Creek near Hawley 78.4 5,510 7,530 9,260 11,200 16,60001431500 11909-96 Lackawaxen River at Hawley 290 14,300 19,500 24,200 29,600 45,90001439500 1909-96 Bush Kill at Shoemakers 117 4,310 6,200 8,010 10,300 17,70001440200 1965-96 Delaware River below Tocks Island Damsite, near Delaware Water
Gap3,850 103,000 124,000 139,000 154,000 188,000
01440400 1957-96 Brodhead Creek at Analomink 65.9 6,480 8,930 11,000 13,300 19,80001441000 1911-38 McMichaels Creek at Stroudsburg 65.3 2,660 3,290 3,770 4,260 5,48001442500 1951-96 Brodhead Creek at Minisink Hills 259 20,100 29,500 38,600 49,700 86,60001446600 1961-76 Martins Creek neat East Bangor 10.4 1,130 1,640 2,120 2,700 4,52001447500 1944-96 Lehigh River at Stoddardtsville 91.7 6,180 9,690 13,200 17,700 33,40001447680 1965-96 Tunkhannock Creek near Long Pond 18.0 565 682 771 861 1,08001447720 1962-96 Tobyhanna Creek near Blakeslee 118 7,060 9,690 11,900 14,300 20,80001448000 1917-59 Lehigh River at Tannery 322 17,500 26,800 36,000 47,700 88,20001448500 1949-95 Dilldown Creek near Long Pond 2.93 312 434 540 660 99701449360 1967-96 Pohopoco Creek at Kresgeville 49.9 1,860 2,280 2,600 2,930 3,72001449500 1941-58 Wild Creek at Hatchery 16.8 1,550 2,420 3,280 4,340 7,87001450500 1940-96 Aquashicola Creek at Palmerton 76.7 5,100 7,190 9,080 11,300 18,00001451000 1947-60 Lehigh River at Walnutport 889 49,000 69,100 87,400 109,000 176,00001451500 1946-95 Little Lehigh Creek near Allentown 80.8 4,760 8,000 11,200 15,500 30,20001451800 1967-95 Jordan Creek near Schnecksville 53 4,770 6,570 8,160 9,960 15,20001452000 1945-95 Jordan Creek at Allentown 75.8 6,560 9,530 12,300 15,600 26,10001452500 1949-95 Monocacy Creek at Bethlehem 44.5 1,540 2,380 3,200 4,220 7,60001453000 1910-60 Lehigh River at Bethlehem 1,279 51,200 72,200 91,300 114,000 182,00001460000 11884-1913 Tohickon Creek at Point Pleasant 107 6,810 8,800 10,500 12,500 18,40001465000 11885-1912 Neshaminy Creek at Rushland 134 7,310 9,080 10,500 12,200 16,600

42
01465500 1935-95 Neshaminy Creek near Langhorne 210 20,000 26,600 32,200 38,500 56,60001465770 1965-81 Poquessing Creek at Trevose Road, Philadelphia 5.08 1,320 1,710 2,040 2,430 3,52001465785 1965-78 Walton Run at Philadelphia 2.17 1,120 1,380 1,590 1,820 2,43001465790 1966-78 Byberry Creek at Chalfont Road, Philadelphia 5.34 1,420 1,790 2,110 2,450 3,39001465798 1966-96 Poquessing Creek at Grant Avenue, Philadelphia 21.4 5,350 7,560 9,000 10,600 14,90001467042 1965-81 Pennypack Creek at Pine Road, Philadelphia 37.9 4,270 5,200 5,940 6,720 8,70001467048 1966-95 Pennypack Creek at Lower Rhawn Street Bridge, Philadelphia 49.8 5,960 7,480 8,700 10,000 13,50001467050 1965-81 Wooden Bridge Run at Philadelphia 3.35 1,660 2,150 2,570 3,030 4,32001467086 1966-86 Tacony Creek above Adams Avenue, Philadelphia 16.6 4,080 5,000 5,700 6,410 8,16001467087 1982-95 Frankford Creek at Castor Avenue, Philadelphia 30.4 10,200 12,400 14,000 15,700 19,80001467089 1966-81 Frankford Creek at Torresdale Avenue, Philadelphia 33.8 9,670 11,200 12,300 13,400 16,00001467500 11948-94 Schuylkill River at Pottsville 53.4 3,460 4,890 6,140 7,580 11,70001468500 1973-96 Schuylkill River at Landingville 133 6,720 9,200 11,400 14,000 21,80001469500 1920-96 Little Schuylkill River at Tamaqua 42.9 3,300 4,390 5,270 6,200 8,53001470500 1948-95 Schuylkill River at Berne 355 21,800 28,700 34,500 40,800 58,20001470720 1962-80 Maiden Creek Tributary at Lenhartsville 7.46 1,320 1,980 2,600 3,340 5,64001470756 1973-95 Maiden Creek at Virginville 159 9,660 13,100 16,300 19,900 30,90001470779 1975-96 Tulpehocken Creek near Bernville 66.5 5,080 7,440 9,570 12,000 19,40001470853 1983-95 Furnace Creek at Robesonia 4.18 498 646 766 894 1,23001470960 1965-78 Tulpehocken Creek at Blue Marsh Damsite near Reading 175 11,000 16,300 21,100 26,800 44,00001471000 1951-78 Tulpehocken Creek near Reading 211 9,340 12,200 14,600 17,200 24,60001471510 11902-95 Schuylkill River at Reading 880 37,000 47,100 55,300 63,900 86,30001471980 1975-95 Manatawny Creek near Pottstown 85.5 5,620 7,200 8,510 9,920 13,70001472000 1928-95 Schuylkill River at Pottstown 1,147 38,900 50,500 60,100 70,700 99,60001472157 1969-95 French Creek near Phoenixville 59.1 5,720 8,600 11,400 14,800 26,20001472198 1981-96 Perkiomen Creek at East Greenville 38 5,370 7,320 8,980 10,800 15,92001472199 1982-95 West Branch Perkiomen Creek at Hillegass 23 2,610 3,330 3,890 4,490 6,01001472500 1885-1911 Perkiomen Creek near Frederick 152 7,190 8,540 9,630 10,800 13,80001472620 1984-95 East Branch Perkiomen Creek near Dublin 4.05 1,990 2,790 3,510 4,330 6,710
Appendix 2. Flood-flow statistics for gaged Pennsylvania streams—Continued
[Flood-flow statistics computed from Log-Pearson distribution of streamflow data; mi2, square miles; ft3/s, cubic feet per second; ---, statistic was not calculated;water year, 12-month period October 1 - September 30]
U.S.Geological
Surveystreamflow-
gaging stationnumber
Period ofrecord
(water year)Station name
Drainagearea(mi2)
10-yearflood flow
(ft3/s)
25-yearflood flow
(ft3/s)
50-yearflood flow
(ft3/s)
100-yearflood flow
(ft3/s)
500-yearflood flow
(ft3/s)
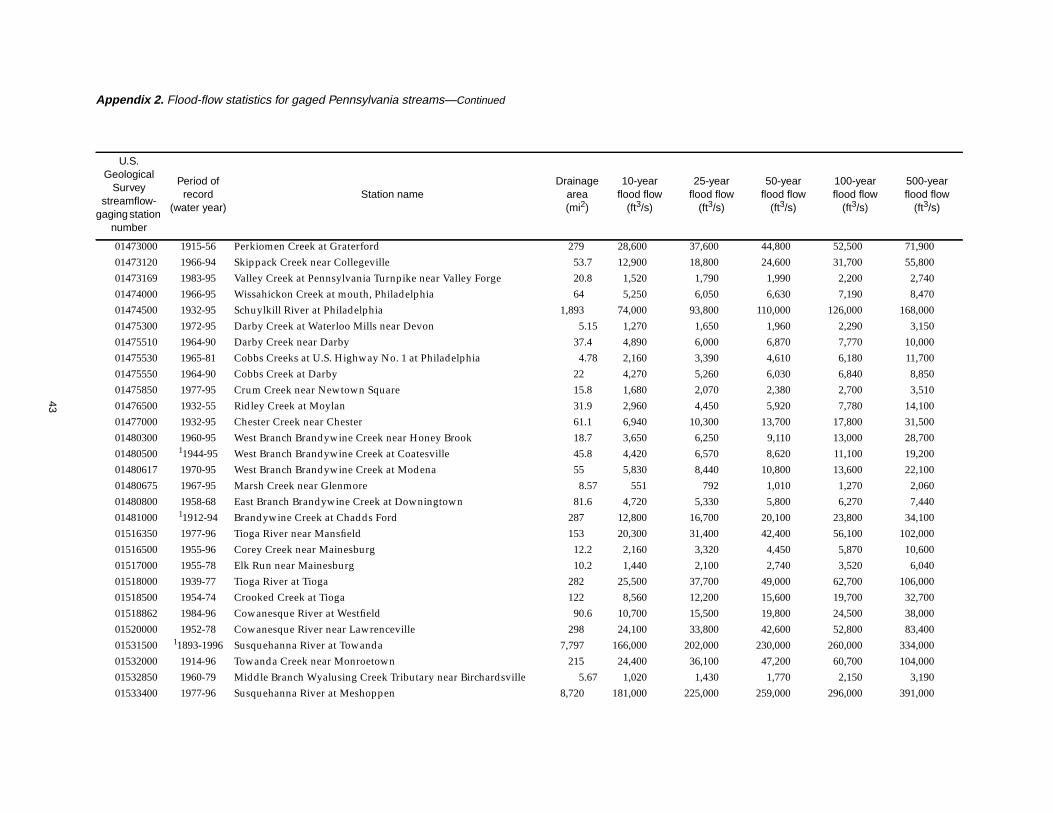
43
01473000 1915-56 Perkiomen Creek at Graterford 279 28,600 37,600 44,800 52,500 71,90001473120 1966-94 Skippack Creek near Collegeville 53.7 12,900 18,800 24,600 31,700 55,80001473169 1983-95 Valley Creek at Pennsylvania Turnpike near Valley Forge 20.8 1,520 1,790 1,990 2,200 2,74001474000 1966-95 Wissahickon Creek at mouth, Philadelphia 64 5,250 6,050 6,630 7,190 8,47001474500 1932-95 Schuylkill River at Philadelphia 1,893 74,000 93,800 110,000 126,000 168,00001475300 1972-95 Darby Creek at Waterloo Mills near Devon 5.15 1,270 1,650 1,960 2,290 3,15001475510 1964-90 Darby Creek near Darby 37.4 4,890 6,000 6,870 7,770 10,00001475530 1965-81 Cobbs Creeks at U.S. Highway No. 1 at Philadelphia 4.78 2,160 3,390 4,610 6,180 11,70001475550 1964-90 Cobbs Creek at Darby 22 4,270 5,260 6,030 6,840 8,85001475850 1977-95 Crum Creek near Newtown Square 15.8 1,680 2,070 2,380 2,700 3,51001476500 1932-55 Ridley Creek at Moylan 31.9 2,960 4,450 5,920 7,780 14,10001477000 1932-95 Chester Creek near Chester 61.1 6,940 10,300 13,700 17,800 31,50001480300 1960-95 West Branch Brandywine Creek near Honey Brook 18.7 3,650 6,250 9,110 13,000 28,70001480500 11944-95 West Branch Brandywine Creek at Coatesville 45.8 4,420 6,570 8,620 11,100 19,20001480617 1970-95 West Branch Brandywine Creek at Modena 55 5,830 8,440 10,800 13,600 22,10001480675 1967-95 Marsh Creek near Glenmore 8.57 551 792 1,010 1,270 2,06001480800 1958-68 East Branch Brandywine Creek at Downingtown 81.6 4,720 5,330 5,800 6,270 7,44001481000 11912-94 Brandywine Creek at Chadds Ford 287 12,800 16,700 20,100 23,800 34,10001516350 1977-96 Tioga River near Mansfield 153 20,300 31,400 42,400 56,100 102,00001516500 1955-96 Corey Creek near Mainesburg 12.2 2,160 3,320 4,450 5,870 10,60001517000 1955-78 Elk Run near Mainesburg 10.2 1,440 2,100 2,740 3,520 6,04001518000 1939-77 Tioga River at Tioga 282 25,500 37,700 49,000 62,700 106,00001518500 1954-74 Crooked Creek at Tioga 122 8,560 12,200 15,600 19,700 32,70001518862 1984-96 Cowanesque River at Westfield 90.6 10,700 15,500 19,800 24,500 38,00001520000 1952-78 Cowanesque River near Lawrenceville 298 24,100 33,800 42,600 52,800 83,40001531500 11893-1996 Susquehanna River at Towanda 7,797 166,000 202,000 230,000 260,000 334,00001532000 1914-96 Towanda Creek near Monroetown 215 24,400 36,100 47,200 60,700 104,00001532850 1960-79 Middle Branch Wyalusing Creek Tributary near Birchardsville 5.67 1,020 1,430 1,770 2,150 3,19001533400 1977-96 Susquehanna River at Meshoppen 8,720 181,000 225,000 259,000 296,000 391,000
Appendix 2. Flood-flow statistics for gaged Pennsylvania streams—Continued
[Flood-flow statistics computed from Log-Pearson distribution of streamflow data; mi2, square miles; ft3/s, cubic feet per second; ---, statistic was not calculated;water year, 12-month period October 1 - September 30]
U.S.Geological
Surveystreamflow-
gaging stationnumber
Period ofrecord
(water year)Station name
Drainagearea(mi2)
10-yearflood flow
(ft3/s)
25-yearflood flow
(ft3/s)
50-yearflood flow
(ft3/s)
100-yearflood flow
(ft3/s)
500-yearflood flow
(ft3/s)
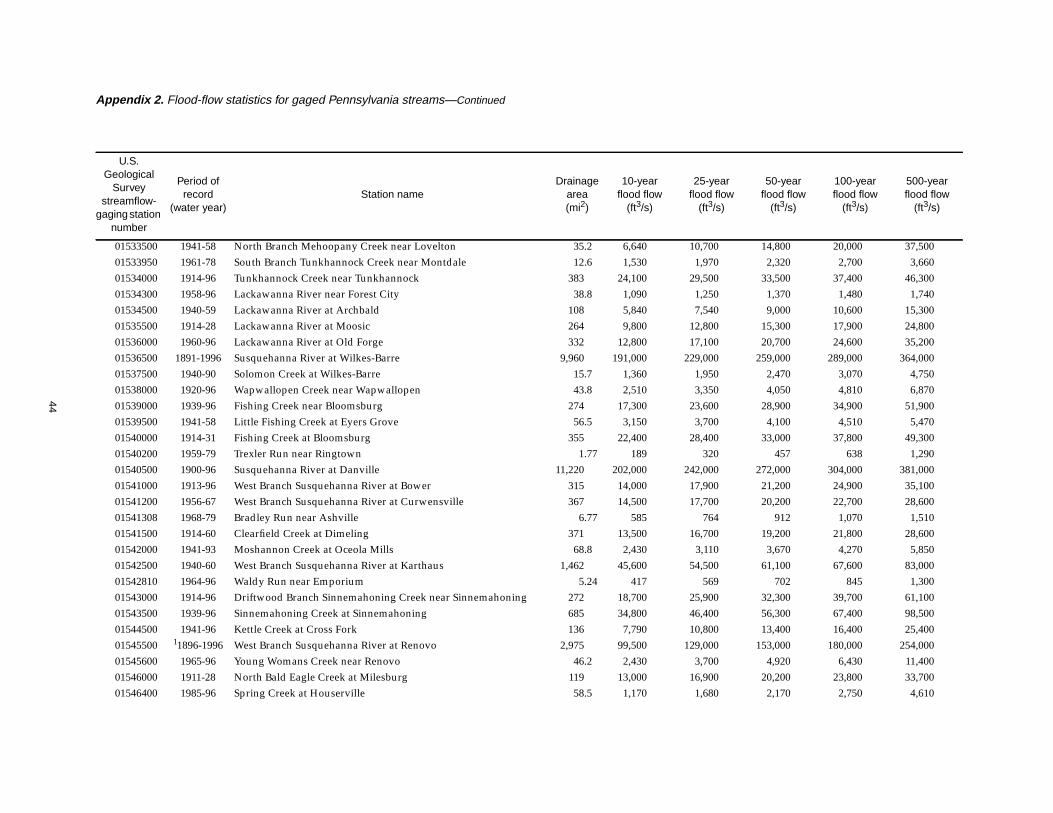
44
01533500 1941-58 North Branch Mehoopany Creek near Lovelton 35.2 6,640 10,700 14,800 20,000 37,50001533950 1961-78 South Branch Tunkhannock Creek near Montdale 12.6 1,530 1,970 2,320 2,700 3,66001534000 1914-96 Tunkhannock Creek near Tunkhannock 383 24,100 29,500 33,500 37,400 46,30001534300 1958-96 Lackawanna River near Forest City 38.8 1,090 1,250 1,370 1,480 1,74001534500 1940-59 Lackawanna River at Archbald 108 5,840 7,540 9,000 10,600 15,30001535500 1914-28 Lackawanna River at Moosic 264 9,800 12,800 15,300 17,900 24,80001536000 1960-96 Lackawanna River at Old Forge 332 12,800 17,100 20,700 24,600 35,20001536500 1891-1996 Susquehanna River at Wilkes-Barre 9,960 191,000 229,000 259,000 289,000 364,00001537500 1940-90 Solomon Creek at Wilkes-Barre 15.7 1,360 1,950 2,470 3,070 4,75001538000 1920-96 Wapwallopen Creek near Wapwallopen 43.8 2,510 3,350 4,050 4,810 6,87001539000 1939-96 Fishing Creek near Bloomsburg 274 17,300 23,600 28,900 34,900 51,90001539500 1941-58 Little Fishing Creek at Eyers Grove 56.5 3,150 3,700 4,100 4,510 5,47001540000 1914-31 Fishing Creek at Bloomsburg 355 22,400 28,400 33,000 37,800 49,30001540200 1959-79 Trexler Run near Ringtown 1.77 189 320 457 638 1,29001540500 1900-96 Susquehanna River at Danville 11,220 202,000 242,000 272,000 304,000 381,00001541000 1913-96 West Branch Susquehanna River at Bower 315 14,000 17,900 21,200 24,900 35,10001541200 1956-67 West Branch Susquehanna River at Curwensville 367 14,500 17,700 20,200 22,700 28,60001541308 1968-79 Bradley Run near Ashville 6.77 585 764 912 1,070 1,51001541500 1914-60 Clearfield Creek at Dimeling 371 13,500 16,700 19,200 21,800 28,60001542000 1941-93 Moshannon Creek at Oceola Mills 68.8 2,430 3,110 3,670 4,270 5,85001542500 1940-60 West Branch Susquehanna River at Karthaus 1,462 45,600 54,500 61,100 67,600 83,00001542810 1964-96 Waldy Run near Emporium 5.24 417 569 702 845 1,30001543000 1914-96 Driftwood Branch Sinnemahoning Creek near Sinnemahoning 272 18,700 25,900 32,300 39,700 61,10001543500 1939-96 Sinnemahoning Creek at Sinnemahoning 685 34,800 46,400 56,300 67,400 98,50001544500 1941-96 Kettle Creek at Cross Fork 136 7,790 10,800 13,400 16,400 25,40001545500 11896-1996 West Branch Susquehanna River at Renovo 2,975 99,500 129,000 153,000 180,000 254,00001545600 1965-96 Young Womans Creek near Renovo 46.2 2,430 3,700 4,920 6,430 11,40001546000 1911-28 North Bald Eagle Creek at Milesburg 119 13,000 16,900 20,200 23,800 33,70001546400 1985-96 Spring Creek at Houserville 58.5 1,170 1,680 2,170 2,750 4,610
Appendix 2. Flood-flow statistics for gaged Pennsylvania streams—Continued
[Flood-flow statistics computed from Log-Pearson distribution of streamflow data; mi2, square miles; ft3/s, cubic feet per second; ---, statistic was not calculated;water year, 12-month period October 1 - September 30]
U.S.Geological
Surveystreamflow-
gaging stationnumber
Period ofrecord
(water year)Station name
Drainagearea(mi2)
10-yearflood flow
(ft3/s)
25-yearflood flow
(ft3/s)
50-yearflood flow
(ft3/s)
100-yearflood flow
(ft3/s)
500-yearflood flow
(ft3/s)

45
01546500 1941-96 Spring Creek near Axemann 87.2 1,940 3,050 4,170 5,630 10,80001547100 1967-96 Spring Creek at Milesburg 142 3,270 4,900 6,450 8,350 14,50001547200 1957-96 Bald Eagle Creek below Spring Creek at Milesburg 265 11,100 15,200 18,800 22,800 34,60001547500 1955-69 Bald Eagle Creek at Blanchard 339 7,560 9,350 10,800 12,200 15,80001547700 1956-96 Marsh Creek at Blanchard 44.1 3,100 4,640 6,120 7,940 13,90001547800 1959-81 South Fork Beech Creek near Snow Shoe 12.2 687 947 1,180 1,440 2,22001547950 1968-96 Beech Creek at Monument 152 5,430 7,300 8,910 10,700 15,70001548000 1911-65 Bald Eagle Creek at Beech Creek Station 562 17,100 20,600 23,400 26,100 32,50001548500 1919-96 Pine Creek at Cedar Run 604 25,800 35,600 44,300 54,300 84,20001549000 1909-20 Pine Creek near Waterville 750 34,400 40,700 45,200 49,600 59,30001549500 1941-96 Blockhouse Creek near English Center 37.7 3,890 5,320 6,560 7,960 12,00001549700 1958-96 Pine Creek below Little Pine Creek near Waterville 944 42,800 58,700 72,700 88,600 135,00001549780 1960-78 Larrys Creek at Cogan House 6.8 572 814 1,040 1,300 2,11001550000 1914-96 Lycoming Creek near Trout Run 173 14,100 19,200 23,700 28,800 43,30001551000 1940-53 Grafius Run at Williamsport 3.14 711 997 1,240 1,500 2,19001551500 1895-1961 West Branch Susquehanna River at Williamsport 5,682 162,000 195,000 221,000 247,000 309,00001552000 11926-96 Loyalsock Creek at Loyalsock 443 44,400 61,900 77,200 94,500 144,00001552500 1941-96 Muncy Creek near Sonestown 23.8 4,190 6,000 7,660 9,600 15,50001553130 1968-81 Sand Spring Run near White Deer 4.93 587 1,010 1,440 2,000 3,99001553500 1940-61 West Branch Susquehanna River at Lewisburg 6,847 181,000 221,000 253,000 286,000 373,00001553600 1960-78 East Branch Chillisquaque Creek near Washingtonville 9.48 2,220 3,400 4,550 5,970 10,70001553700 1980-96 Chillisquaque Creek at Washingtonville 51.3 3,480 4,100 4,560 5,030 6,15001554000 1919-95 Susquehanna River at Sunbury 18,300 343,000 429,000 500,000 577,000 786,00001554500 1940-93 Shamokin Creek near Shamokin 54.2 1,850 2,550 3,190 3,940 6,26001555000 1930-95 Penns Creek at Penns Creek 301 11,600 16,100 20,000 24,500 37,60001555500 1930-95 East Mahantango Creek near Dalmatia 162 10,700 16,200 21,800 28,900 53,90001556000 1917-95 Frankstown Branch Juniata River at Williamsport 291 11,900 15,200 17,800 20,500 27,60001556500 1946-81 Little Juniata River at Tipton 93.7 5,030 6,450 7,580 8,780 11,80001557500 1940-95 Bald Eagle Creek at Tyrone 44.1 2,890 3,800 4,540 5,350 7,500
Appendix 2. Flood-flow statistics for gaged Pennsylvania streams—Continued
[Flood-flow statistics computed from Log-Pearson distribution of streamflow data; mi2, square miles; ft3/s, cubic feet per second; ---, statistic was not calculated;water year, 12-month period October 1 - September 30]
U.S.Geological
Surveystreamflow-
gaging stationnumber
Period ofrecord
(water year)Station name
Drainagearea(mi2)
10-yearflood flow
(ft3/s)
25-yearflood flow
(ft3/s)
50-yearflood flow
(ft3/s)
100-yearflood flow
(ft3/s)
500-yearflood flow
(ft3/s)

46
01558000 1939-95 Little Juniata River at Spruce Creek 220 10,600 14,600 18,300 22,600 35,60001559000 11896-1991 Juniata River at Huntingdon 816 27,700 37,900 47,000 57,500 89,00001559500 1930-58 Standing Stone Creek near Huntingdon 128 4,610 5,920 7,010 8,210 11,50001559700 1962-78 Sulphur Springs Creek near Manns Choice 5.28 773 1,130 1,470 1,860 3,04001560000 1940-95 Dunning Creek at Belden 172 8,050 10,600 12,800 15,300 22,10001561000 1930-58 Brush Creek at Gapsville 36.8 2,610 4,110 5,620 7,540 14,20001562000 1912-95 Raystown Branch Juniata River at Saxton 756 27,000 34,500 40,400 46,600 62,50001562500 1930-57 Great Trough Creek near Marklesburg 84.6 3,610 5,020 6,290 7,770 12,20001563000 1946-71 Raystown Branch Juniata River near Huntingdon 957 23,400 27,500 30,300 33,000 38,80001563500 1938-72 Juniata River at Mapleton Depot 2,030 53,600 72,100 88,100 106,000 158,00001564500 1939-95 Aughwick Creek near Three Springs 205 13,200 17,900 22,000 26,500 39,20001565000 11940-95 Kishacoquillas Creek at Reedsville 164 5,390 7,270 8,870 10,700 15,70001565700 1960-81 Little Lost Creek at Oakland Mills 6.52 634 982 1,330 1,780 3,35001566000 1912-58 Tuscarora Creek near Port Royal 214 11,300 14,400 17,000 19,800 27,20001566500 1930-58 Cocolamus Creek near Millertown 57.2 4,610 5,810 6,740 7,700 10,00001567000 1899-72 Juniata River at Newport 3,354 85,600 111,000 132,000 155,000 219,00001567500 1954-95 Bixler Run near Loysville 15 2,680 4,620 6,740 9,660 21,20001568000 11927-95 Sherman Creek at Shermans Dale 200 15,700 22,400 28,500 35,800 58,10001569800 1976-95 Letort Spring Run near Carlisle 21.6 685 1,100 1,540 2,120 4,26001570000 11929-96 Conodoguinet Creek near Hogestown 470 13,000 16,900 20,300 24,100 35,00001570500 1891-1996 Susquehanna River at Harrisburg 24,100 441,000 551,000 641,000 740,000 1,010,00001571000 11940-94 Paxton Creek near Penbrook 11.2 2,900 3,880 4,690 5,560 7,91001571500 11910-95 Yellow Breeches Creek near Camp Hill 216 5,930 8,650 11,300 14,600 25,60001572000 1920-32 Lower Little Swatara Creek at Pine Grove 34.3 2,700 3,750 4,700 5,820 9,21001573000 1919-95 Swatara Creek at Harper Tavern 337 17,700 23,500 28,600 34,500 51,80001573086 1964-81 Beck Creek near Cleona 7.87 1,320 3,150 5,710 9,990 ---01573160 1975-93 Quittapahilla Creek near Bellegrove 74.2 2,200 3,280 4,320 5,630 10,00001573500 1938-58 Manda Creek at Manada Gap 13.5 1,790 2,810 3,820 5,080 9,28001573560 1975-95 Swatara Creek near Hershey 483 18,700 24,400 29,500 35,300 52,000
Appendix 2. Flood-flow statistics for gaged Pennsylvania streams—Continued
[Flood-flow statistics computed from Log-Pearson distribution of streamflow data; mi2, square miles; ft3/s, cubic feet per second; ---, statistic was not calculated;water year, 12-month period October 1 - September 30]
U.S.Geological
Surveystreamflow-
gaging stationnumber
Period ofrecord
(water year)Station name
Drainagearea(mi2)
10-yearflood flow
(ft3/s)
25-yearflood flow
(ft3/s)
50-yearflood flow
(ft3/s)
100-yearflood flow
(ft3/s)
500-yearflood flow
(ft3/s)

47
01574000 1929-95 West Conewago Creek near Manchester 510 29,400 40,100 50,100 62,000 100,00001574500 1930-66 Codorus Creek at Spring Grove 75.5 4,620 6,670 8,610 11,000 18,50001575000 1928-71 South Branch Codorus Creek near York 117 5,410 8,060 10,600 13,900 24,70001576000 1932-72 Susquehanna River at Marietta 25,990 487,000 641,000 777,000 934,000 1,400,00001576085 1982-95 Little Conestoga Creek near Churchtown 5.82 1,550 2,060 2,480 2,930 4,12001576500 11929-96 Conestoga River at Lancaster 324 15,900 22,200 27,700 34,100 52,90001576754 1985-95 Conestoga River at Conestoga 470 18,300 22,900 26,600 30,600 40,90001578400 1963-81 Bowery Run near Quarryville 5.98 2,000 3,440 5,040 7,270 16,20001601000 1952-86 Wills Creek below Hyndman 146 8,660 11,300 13,600 16,100 23,00001603500 1933-82 Evitts Creek near Centerville 30.2 2,120 2,940 3,640 4,430 6,67001613050 1963-96 Tonoloway Creek near Needmore 10.7 837 1,130 1,380 1,640 2,35001614090 1961-81 Conococheague Creek near Fayetteville 5.05 296 466 634 845 1,56003007800 1975-96 Allegheny River at Port Allegany 248 8,820 10,600 11,900 13,200 16,50003008000 1960-78 Newell Creek near Port Allegany 7.79 1,490 2,470 3,470 4,780 9,45003009680 1975-95 Potato Creek at Smethport 160 5,550 6,320 6,880 7,410 8,62003010500 1916-96 Allegheny River at Eldred 550 16,600 24,000 31,100 39,800 68,30003010655 1975-96 Oswayo Creek at Shinglehouse 98.7 3,540 4,220 4,720 5,200 6,28003011800 1966-96 Kinzua Creek near Guffey 46.4 3,110 4,300 5,340 6,500 9,80003015000 1940-61 Conewango Creek at Russell 816 13,100 15,300 16,900 18,400 21,80003015280 1963-79 Jackson Run near North Warren 12.8 685 760 812 861 96603015500 1910-96 Brokenstraw Creek at Youngsville 321 11,900 14,100 15,600 17,100 20,60003016000 1942-65 Allegheny River at West Hickory 3,660 82,800 97,200 107,000 117,000 139,00003017500 1938-79 Tionesta Creek at Lynch 233 10,600 13,200 15,200 17,300 22,50003019000 11910-40 Tionesta Creek at Nebraska 469 13,900 16,100 17,800 19,400 23,00003020500 1910-96 Oil Creek at Rouseville 300 12,800 15,400 17,500 19,600 24,70003021350 1975-96 French Creek near Wattsburg 92 6,020 6,920 7,530 8,110 936003021410 1975-94 West Branch French Creek near Lowville 52.3 5,230 6,580 7,690 8,870 12,00003021700 1961-78 Little Conneautee Creek near McKean 3.6 537 681 797 921 1,24003022500 1922-39 French Creek at Saegerstown 629 15,900 18,500 20,400 22,300 26,500
Appendix 2. Flood-flow statistics for gaged Pennsylvania streams—Continued
[Flood-flow statistics computed from Log-Pearson distribution of streamflow data; mi2, square miles; ft3/s, cubic feet per second; ---, statistic was not calculated;water year, 12-month period October 1 - September 30]
U.S.Geological
Surveystreamflow-
gaging stationnumber
Period ofrecord
(water year)Station name
Drainagearea(mi2)
10-yearflood flow
(ft3/s)
25-yearflood flow
(ft3/s)
50-yearflood flow
(ft3/s)
100-yearflood flow
(ft3/s)
500-yearflood flow
(ft3/s)
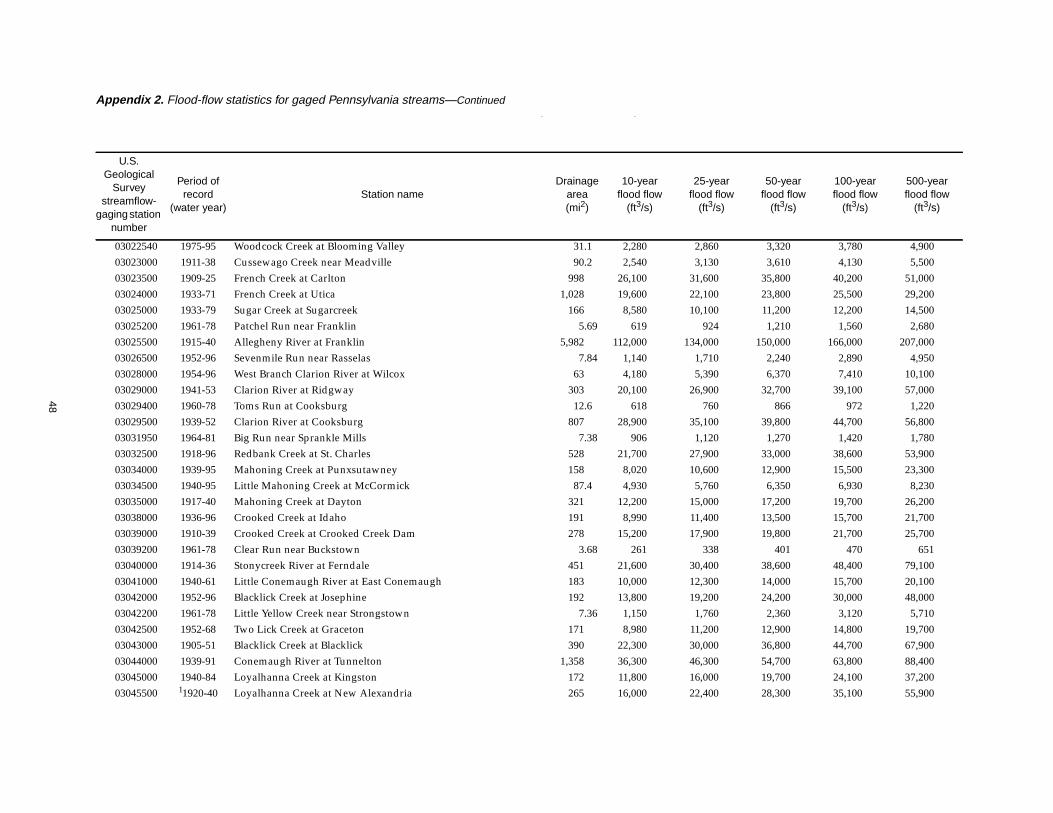
48
03022540 1975-95 Woodcock Creek at Blooming Valley 31.1 2,280 2,860 3,320 3,780 4,90003023000 1911-38 Cussewago Creek near Meadville 90.2 2,540 3,130 3,610 4,130 5,50003023500 1909-25 French Creek at Carlton 998 26,100 31,600 35,800 40,200 51,00003024000 1933-71 French Creek at Utica 1,028 19,600 22,100 23,800 25,500 29,20003025000 1933-79 Sugar Creek at Sugarcreek 166 8,580 10,100 11,200 12,200 14,50003025200 1961-78 Patchel Run near Franklin 5.69 619 924 1,210 1,560 2,68003025500 1915-40 Allegheny River at Franklin 5,982 112,000 134,000 150,000 166,000 207,00003026500 1952-96 Sevenmile Run near Rasselas 7.84 1,140 1,710 2,240 2,890 4,95003028000 1954-96 West Branch Clarion River at Wilcox 63 4,180 5,390 6,370 7,410 10,10003029000 1941-53 Clarion River at Ridgway 303 20,100 26,900 32,700 39,100 57,00003029400 1960-78 Toms Run at Cooksburg 12.6 618 760 866 972 1,22003029500 1939-52 Clarion River at Cooksburg 807 28,900 35,100 39,800 44,700 56,80003031950 1964-81 Big Run near Sprankle Mills 7.38 906 1,120 1,270 1,420 1,78003032500 1918-96 Redbank Creek at St. Charles 528 21,700 27,900 33,000 38,600 53,90003034000 1939-95 Mahoning Creek at Punxsutawney 158 8,020 10,600 12,900 15,500 23,30003034500 1940-95 Little Mahoning Creek at McCormick 87.4 4,930 5,760 6,350 6,930 8,23003035000 1917-40 Mahoning Creek at Dayton 321 12,200 15,000 17,200 19,700 26,20003038000 1936-96 Crooked Creek at Idaho 191 8,990 11,400 13,500 15,700 21,70003039000 1910-39 Crooked Creek at Crooked Creek Dam 278 15,200 17,900 19,800 21,700 25,70003039200 1961-78 Clear Run near Buckstown 3.68 261 338 401 470 65103040000 1914-36 Stonycreek River at Ferndale 451 21,600 30,400 38,600 48,400 79,10003041000 1940-61 Little Conemaugh River at East Conemaugh 183 10,000 12,300 14,000 15,700 20,10003042000 1952-96 Blacklick Creek at Josephine 192 13,800 19,200 24,200 30,000 48,00003042200 1961-78 Little Yellow Creek near Strongstown 7.36 1,150 1,760 2,360 3,120 5,71003042500 1952-68 Two Lick Creek at Graceton 171 8,980 11,200 12,900 14,800 19,70003043000 1905-51 Blacklick Creek at Blacklick 390 22,300 30,000 36,800 44,700 67,90003044000 1939-91 Conemaugh River at Tunnelton 1,358 36,300 46,300 54,700 63,800 88,40003045000 1940-84 Loyalhanna Creek at Kingston 172 11,800 16,000 19,700 24,100 37,20003045500 11920-40 Loyalhanna Creek at New Alexandria 265 16,000 22,400 28,300 35,100 55,900
Appendix 2. Flood-flow statistics for gaged Pennsylvania streams—Continued
[Flood-flow statistics computed from Log-Pearson distribution of streamflow data; mi2, square miles; ft3/s, cubic feet per second; ---, statistic was not calculated;water year, 12-month period October 1 - September 30]
U.S.Geological
Surveystreamflow-
gaging stationnumber
Period ofrecord
(water year)Station name
Drainagearea(mi2)
10-yearflood flow
(ft3/s)
25-yearflood flow
(ft3/s)
50-yearflood flow
(ft3/s)
100-yearflood flow
(ft3/s)
500-yearflood flow
(ft3/s)

49
03047500 11884-1904 Kiskiminetas River at Avonmore 1,723 74,400 95,200 112,000 130,000 177,00003049000 1941-96 Buffalo Creek near Freeport 137 7,360 9,390 11,100 12,800 17,60003049800 1963-96 Little Pine Creek near Etna 5.78 1,160 2,160 3,310 4,930 11,70003070420 1978-89 Stony Fork Tributary near Gibbon Glade .93 111 139 162 186 24703072000 1941-96 Dunkard Creek at Shannopin 229 12,200 14,700 16,600 18,500 22,90003072590 1964-78 Georges Creek at Smithfield 16.3 1,210 1,520 1,770 2,030 2,70003072840 1969-79 Tenmile Creek near Clarksville 133 10,700 15,800 20,600 26,300 44,30003073000 1932-95 South Fork Tenmile Creek at Jefferson 180 9,840 11,500 12,700 13,700 16,10003074300 1959-78 Lick Run at Hopwood 3.8 350 490 613 754 1,17003074500 1943-96 Redstone Creek at Waltersburg 73.7 3,900 4,830 5,570 6,340 8,30003078500 11933-86 Big Piney Run near Salisbury 24.5 2500 3,610 4,630 5,820 9,46003079000 1915-96 Casselman Creek at Markleton 382 20,600 27,200 32,900 39,400 58,00003080000 1914-96 Laurel Hill Creek at Ursina 121 7,120 8,730 9,960 11,200 14,20003082200 1961-78 Poplar Run near Normalville 9.27 1,150 1,470 1,730 2,010 2,79003082500 11891-1924 Youghiogheny River at Connellsville 1,326 53,800 65,500 74,700 84,300 109,00003083000 1929-79 Green Lick Run at Green Lick Reservoir 3.07 592 866 1,120 1,430 2,39003084000 1949-93 Abers Creek near Murrysville 4.39 896 1,160 1,370 1,590 2,12003084500 1917-52 Turtle Creek at Trafford 55.9 3,900 4,750 5,380 6,000 7,45003085500 11916-96 Chartiers Creek at Carnegie 257 9,830 12,100 13,800 15,500 19,50003086100 1963-78 Big Sewickley Creek near Ambridge 15.6 1,320 1,790 2,180 2,630 3,87003100000 1912-22 Shenango River near Turnersville 152 6,170 8,100 9,710 11,500 16,40003101000 1935-55 Sugar Run at Pymatuning Dam 9.34 1,430 2,050 2,610 3,230 5,02003102000 1920-32 Shenango River near Jamestown 181 2,800 3,060 3,230 3,400 3,75003102500 1914-96 Little Shenango River at Greenville 104 4,510 5,610 6,470 7,340 9,49003103000 1914-63 Pymatuning Creek near Orangeville 169 5,010 5,970 6,650 7,290 8,68003104000 1910-32 Shenango River at Sharon 608 15,700 19,800 22,900 26,200 34,20003104500 1913-33 Shenango River at New Castle 792 16,500 21,300 25,300 29,700 41,60003104760 1969-80 Harthegig Run near Greenfield 2.26 342 434 504 577 75603106000 1916-96 Connoquenessing Creek near Zelienople 356 12,600 15,100 17,000 19,000 23,800
Appendix 2. Flood-flow statistics for gaged Pennsylvania streams—Continued
[Flood-flow statistics computed from Log-Pearson distribution of streamflow data; mi2, square miles; ft3/s, cubic feet per second; ---, statistic was not calculated;water year, 12-month period October 1 - September 30]
U.S.Geological
Surveystreamflow-
gaging stationnumber
Period ofrecord
(water year)Station name
Drainagearea(mi2)
10-yearflood flow
(ft3/s)
25-yearflood flow
(ft3/s)
50-yearflood flow
(ft3/s)
100-yearflood flow
(ft3/s)
500-yearflood flow
(ft3/s)
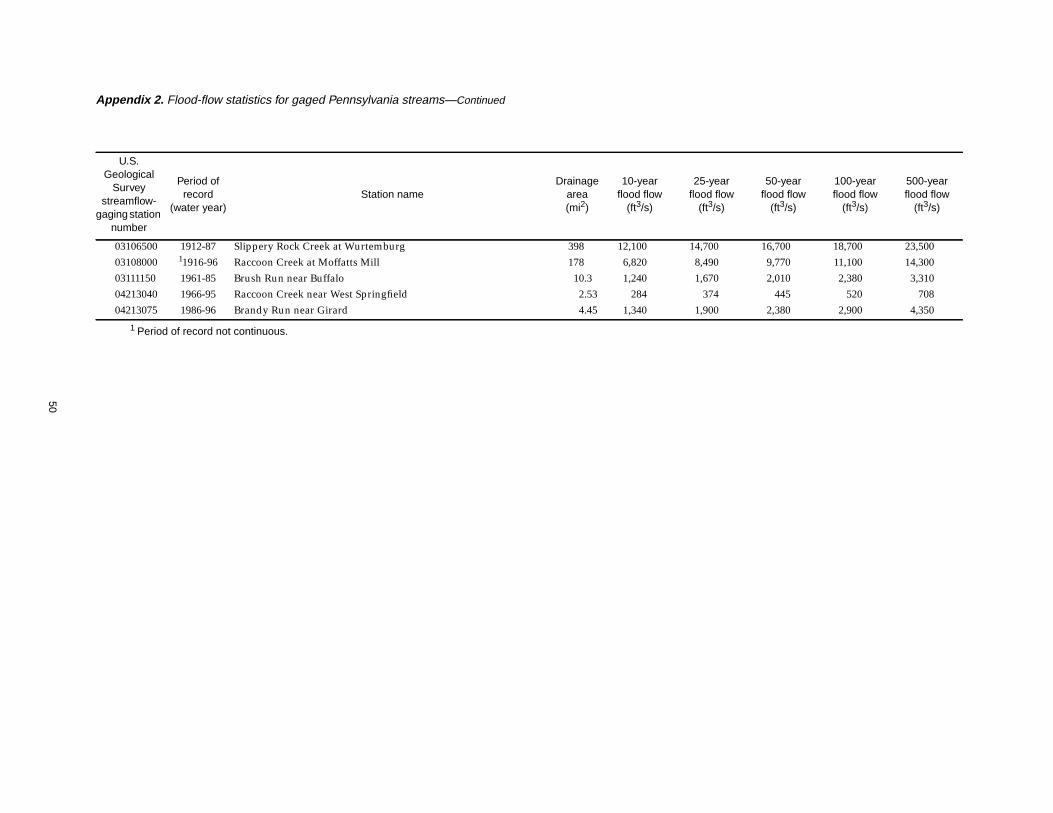
50
03106500 1912-87 Slippery Rock Creek at Wurtemburg 398 12,100 14,700 16,700 18,700 23,50003108000 11916-96 Raccoon Creek at Moffatts Mill 178 6,820 8,490 9,770 11,100 14,30003111150 1961-85 Brush Run near Buffalo 10.3 1,240 1,670 2,010 2,380 3,31004213040 1966-95 Raccoon Creek near West Springfield 2.53 284 374 445 520 70804213075 1986-96 Brandy Run near Girard 4.45 1,340 1,900 2,380 2,900 4,350
1 Period of record not continuous.
Appendix 2. Flood-flow statistics for gaged Pennsylvania streams—Continued
[Flood-flow statistics computed from Log-Pearson distribution of streamflow data; mi2, square miles; ft3/s, cubic feet per second; ---, statistic was not calculated;water year, 12-month period October 1 - September 30]
U.S.Geological
Surveystreamflow-
gaging stationnumber
Period ofrecord
(water year)Station name
Drainagearea(mi2)
10-yearflood flow
(ft3/s)
25-yearflood flow
(ft3/s)
50-yearflood flow
(ft3/s)
100-yearflood flow
(ft3/s)
500-yearflood flow
(ft3/s)
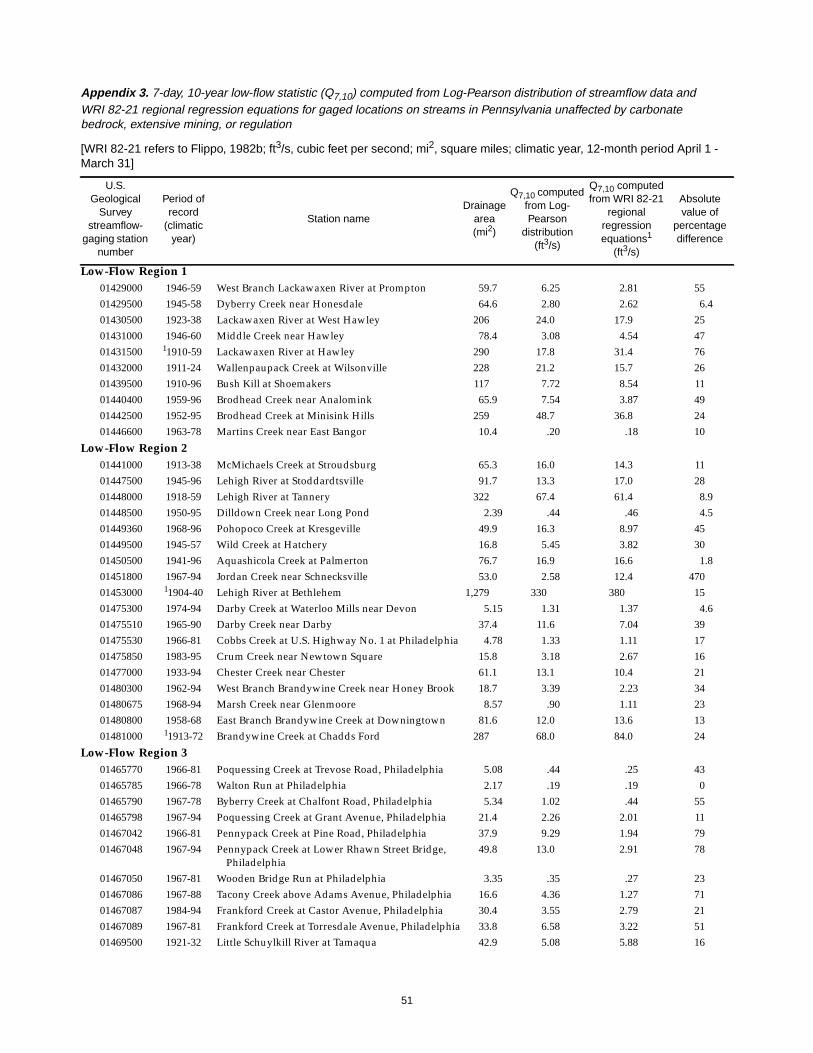
51
Appendix 3. 7-day, 10-year low-flow statistic (Q7,10) computed from Log-Pearson distribution of streamflow data andWRI 82-21 regional regression equations for gaged locations on streams in Pennsylvania unaffected by carbonatebedrock, extensive mining, or regulation
[WRI 82-21 refers to Flippo, 1982b; ft3/s, cubic feet per second; mi2, square miles; climatic year, 12-month period April 1 -March 31]
U.S.Geological
Surveystreamflow-
gaging stationnumber
Period ofrecord
(climaticyear)
Station nameDrainage
area(mi2)
Q7,10 computedfrom Log-Pearson
distribution(ft3/s)
Q7,10 computedfrom WRI 82-21
regionalregressionequations1
(ft3/s)
Absolutevalue of
percentagedifference
Low-Flow Region 101429000 1946-59 West Branch Lackawaxen River at Prompton 59.7 6.25 2.81 5501429500 1945-58 Dyberry Creek near Honesdale 64.6 2.80 2.62 6.401430500 1923-38 Lackawaxen River at West Hawley 206 24.0 17.9 2501431000 1946-60 Middle Creek near Hawley 78.4 3.08 4.54 4701431500 11910-59 Lackawaxen River at Hawley 290 17.8 31.4 7601432000 1911-24 Wallenpaupack Creek at Wilsonville 228 21.2 15.7 2601439500 1910-96 Bush Kill at Shoemakers 117 7.72 8.54 1101440400 1959-96 Brodhead Creek near Analomink 65.9 7.54 3.87 4901442500 1952-95 Brodhead Creek at Minisink Hills 259 48.7 36.8 2401446600 1963-78 Martins Creek near East Bangor 10.4 .20 .18 10
Low-Flow Region 201441000 1913-38 McMichaels Creek at Stroudsburg 65.3 16.0 14.3 1101447500 1945-96 Lehigh River at Stoddardtsville 91.7 13.3 17.0 2801448000 1918-59 Lehigh River at Tannery 322 67.4 61.4 8.901448500 1950-95 Dilldown Creek near Long Pond 2.39 .44 .46 4.501449360 1968-96 Pohopoco Creek at Kresgeville 49.9 16.3 8.97 4501449500 1945-57 Wild Creek at Hatchery 16.8 5.45 3.82 3001450500 1941-96 Aquashicola Creek at Palmerton 76.7 16.9 16.6 1.801451800 1967-94 Jordan Creek near Schnecksville 53.0 2.58 12.4 47001453000 11904-40 Lehigh River at Bethlehem 1,279 330 380 1501475300 1974-94 Darby Creek at Waterloo Mills near Devon 5.15 1.31 1.37 4.601475510 1965-90 Darby Creek near Darby 37.4 11.6 7.04 3901475530 1966-81 Cobbs Creek at U.S. Highway No. 1 at Philadelphia 4.78 1.33 1.11 1701475850 1983-95 Crum Creek near Newtown Square 15.8 3.18 2.67 1601477000 1933-94 Chester Creek near Chester 61.1 13.1 10.4 2101480300 1962-94 West Branch Brandywine Creek near Honey Brook 18.7 3.39 2.23 3401480675 1968-94 Marsh Creek near Glenmoore 8.57 .90 1.11 2301480800 1958-68 East Branch Brandywine Creek at Downingtown 81.6 12.0 13.6 1301481000 11913-72 Brandywine Creek at Chadds Ford 287 68.0 84.0 24
Low-Flow Region 301465770 1966-81 Poquessing Creek at Trevose Road, Philadelphia 5.08 .44 .25 4301465785 1966-78 Walton Run at Philadelphia 2.17 .19 .19 001465790 1967-78 Byberry Creek at Chalfont Road, Philadelphia 5.34 1.02 .44 5501465798 1967-94 Poquessing Creek at Grant Avenue, Philadelphia 21.4 2.26 2.01 1101467042 1966-81 Pennypack Creek at Pine Road, Philadelphia 37.9 9.29 1.94 7901467048 1967-94 Pennypack Creek at Lower Rhawn Street Bridge,
Philadelphia49.8 13.0 2.91 78
01467050 1967-81 Wooden Bridge Run at Philadelphia 3.35 .35 .27 2301467086 1967-88 Tacony Creek above Adams Avenue, Philadelphia 16.6 4.36 1.27 7101467087 1984-94 Frankford Creek at Castor Avenue, Philadelphia 30.4 3.55 2.79 2101467089 1967-81 Frankford Creek at Torresdale Avenue, Philadelphia 33.8 6.58 3.22 5101469500 1921-32 Little Schuylkill River at Tamaqua 42.9 5.08 5.88 16
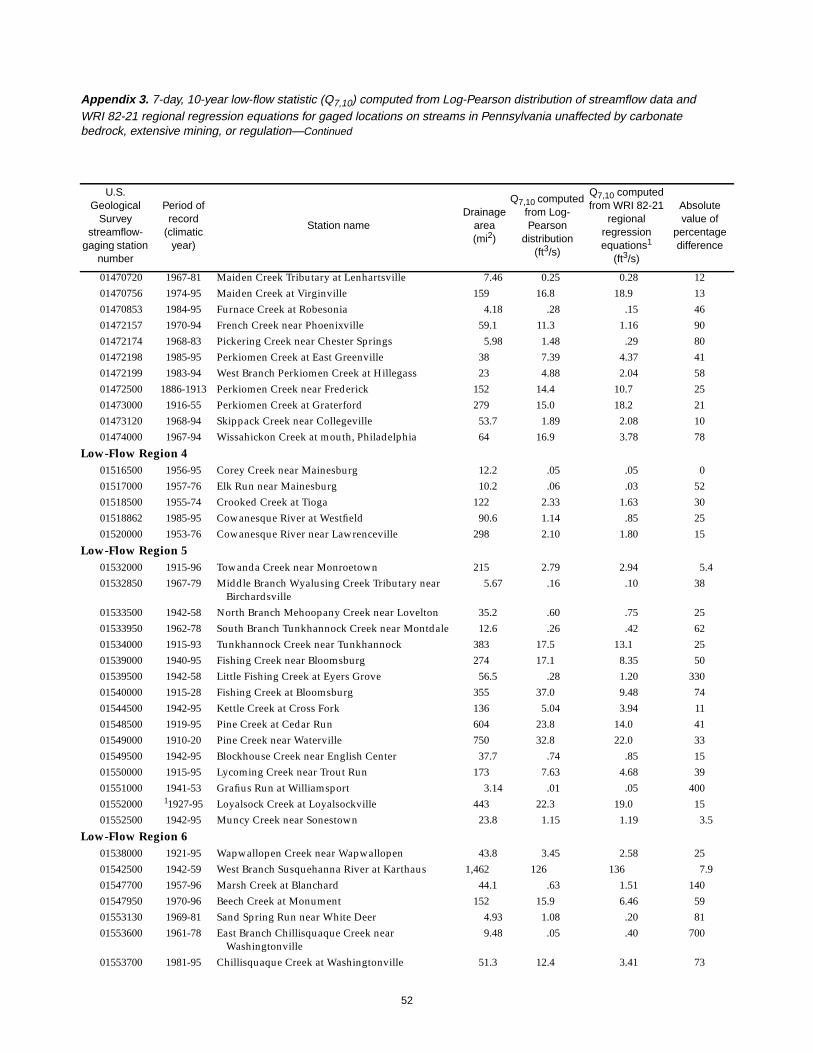
52
01470720 1967-81 Maiden Creek Tributary at Lenhartsville 7.46 0.25 0.28 1201470756 1974-95 Maiden Creek at Virginville 159 16.8 18.9 1301470853 1984-95 Furnace Creek at Robesonia 4.18 .28 .15 4601472157 1970-94 French Creek near Phoenixville 59.1 11.3 1.16 9001472174 1968-83 Pickering Creek near Chester Springs 5.98 1.48 .29 8001472198 1985-95 Perkiomen Creek at East Greenville 38 7.39 4.37 4101472199 1983-94 West Branch Perkiomen Creek at Hillegass 23 4.88 2.04 5801472500 1886-1913 Perkiomen Creek near Frederick 152 14.4 10.7 2501473000 1916-55 Perkiomen Creek at Graterford 279 15.0 18.2 2101473120 1968-94 Skippack Creek near Collegeville 53.7 1.89 2.08 1001474000 1967-94 Wissahickon Creek at mouth, Philadelphia 64 16.9 3.78 78
Low-Flow Region 401516500 1956-95 Corey Creek near Mainesburg 12.2 .05 .05 001517000 1957-76 Elk Run near Mainesburg 10.2 .06 .03 5201518500 1955-74 Crooked Creek at Tioga 122 2.33 1.63 3001518862 1985-95 Cowanesque River at Westfield 90.6 1.14 .85 2501520000 1953-76 Cowanesque River near Lawrenceville 298 2.10 1.80 15
Low-Flow Region 501532000 1915-96 Towanda Creek near Monroetown 215 2.79 2.94 5.401532850 1967-79 Middle Branch Wyalusing Creek Tributary near
Birchardsville5.67 .16 .10 38
01533500 1942-58 North Branch Mehoopany Creek near Lovelton 35.2 .60 .75 2501533950 1962-78 South Branch Tunkhannock Creek near Montdale 12.6 .26 .42 6201534000 1915-93 Tunkhannock Creek near Tunkhannock 383 17.5 13.1 2501539000 1940-95 Fishing Creek near Bloomsburg 274 17.1 8.35 5001539500 1942-58 Little Fishing Creek at Eyers Grove 56.5 .28 1.20 33001540000 1915-28 Fishing Creek at Bloomsburg 355 37.0 9.48 7401544500 1942-95 Kettle Creek at Cross Fork 136 5.04 3.94 1101548500 1919-95 Pine Creek at Cedar Run 604 23.8 14.0 4101549000 1910-20 Pine Creek near Waterville 750 32.8 22.0 3301549500 1942-95 Blockhouse Creek near English Center 37.7 .74 .85 1501550000 1915-95 Lycoming Creek near Trout Run 173 7.63 4.68 3901551000 1941-53 Grafius Run at Williamsport 3.14 .01 .05 40001552000 11927-95 Loyalsock Creek at Loyalsockville 443 22.3 19.0 1501552500 1942-95 Muncy Creek near Sonestown 23.8 1.15 1.19 3.5
Low-Flow Region 601538000 1921-95 Wapwallopen Creek near Wapwallopen 43.8 3.45 2.58 2501542500 1942-59 West Branch Susquehanna River at Karthaus 1,462 126 136 7.901547700 1957-96 Marsh Creek at Blanchard 44.1 .63 1.51 14001547950 1970-96 Beech Creek at Monument 152 15.9 6.46 5901553130 1969-81 Sand Spring Run near White Deer 4.93 1.08 .20 8101553600 1961-78 East Branch Chillisquaque Creek near
Washingtonville9.48 .05 .40 700
01553700 1981-95 Chillisquaque Creek at Washingtonville 51.3 12.4 3.41 73
Appendix 3. 7-day, 10-year low-flow statistic (Q7,10) computed from Log-Pearson distribution of streamflow data andWRI 82-21 regional regression equations for gaged locations on streams in Pennsylvania unaffected by carbonatebedrock, extensive mining, or regulation—Continued
[WRI 82-21 refers to Flippo, 1982b; ft3/s, cubic feet per second; mi2, square miles; climatic year, 12-month period April 1 -March 31]
U.S.Geological
Surveystreamflow-
gaging stationnumber
Period ofrecord
(climaticyear)
Station nameDrainage
area(mi2)
Q7,10 computedfrom Log-Pearson
distribution(ft3/s)
Q7,10 computedfrom WRI 82-21
regionalregressionequations1
(ft3/s)
Absolutevalue of
percentagedifference

53
01556000 1918-95 Frankstown Branch Juniata River at Williamsburg 291 47.2 38.1 1901556500 1947-62 Little Juniata River at Tipton 93.7 11.4 9.11 2001557500 1946-96 Bald Eagle Creek at Tyrone 44.1 3.14 3.35 6.701559500 1931-58 Standing Stone Creek near Huntingdon 128 10.4 6.71 3601560000 1941-96 Dunning Creek at Belden 172 9.28 13.8 4901562000 1913-96 Raystown Branch Juniata River at Saxton 756 68.5 69.6 1.6
Low-Flow Region 701555500 1931-95 East Mahantango Creek near Dalmatia 162 6.30 5.56 1201559700 1963-78 Sulphur Springs Creek near Manns Choice 5.28 .10 .08 2001561000 1931-58 Brush Creek at Gapsville 36.8 .52 .41 2101562500 1931-57 Great Trough Creek near Marklesburg 84.6 1.57 1.20 2401564500 1940-95 Aughwick Creek near Three Springs 205 4.23 4.31 1.901566000 1913-58 Tuscarora Creek near Port Royal 214 8.64 8.01 7.301566500 1932-58 Cocolamus Creek near Millertown 57.2 2.39 1.80 2501571000 11941-95 Paxton Creek near Penbrook 11.2 .15 .17 1301572000 11921-84 Lower Little Swatara Creek at Pine Grove 34.3 2.31 2.44 5.601573000 1920-96 Swatara Creek at Harper Tavern 337 22.1 22.8 3.201573500 1939-58 Manada Creek at Manada Gap 13.5 1.44 .79 4501574000 1930-95 West Conewago Creek near Manchester 510 10.8 12.1 12
Low-Flow Region 801613500 1932-41 Licking Creek near Sylvan 158 6.32 5.50 13
Low-Flow Region 903007800 1976-96 Allegheny River at Port Allegany 248 19.5 22.2 1403008000 1967-78 Newell Creek near Port Allegany 7.79 .13 .81 52003009680 1976-95 Potato Creek at Smethport 160 13.4 14.6 9.103010000 1927-39 Allegheny River at Larabee 530 13.4 46.0 24003010500 1941-96 Allegheny River at Eldred 550 31.0 47.7 5403010655 1976-96 Oswayo Creek at Shinglehouse 98.7 5.89 9.22 5703011800 1967-95 Kinzua Creek near Guffey 46.4 5.26 4.48 1503015280 1963-78 Jackson Run near North Warren 12.8 .88 1.30 4803015500 1911-96 Brokenstraw Creek at Youngsville 321 33.8 28.5 1603020500 1934-96 Oil Creek at Rouseville 300 30.6 26.7 1303021000 1911-32 Oil Creek near Rouseville 315 33.7 28.0 1703025000 1934-79 Sugar Creek at Sugarcreek 166 16.6 15.2 8.903025200 1966-78 Patchel Run near Franklin 5.69 .63 .60 4.803028000 1955-96 West Branch Clarion River at Wilcox 63 6.67 6.00 10
Low-Flow Region 1003017500 1940-79 Tionesta Creek at Lynch 233 16.4 12.6 2303019000 1924-40 Tionesta Creek at Nebraska 469 24.6 27.7 1303021350 1976-96 French Creek near Wattsburg 92 5.11 5.13 .3903021410 1976-94 West Branch French Creek near Lowville 52.3 2.69 1.29 5203021700 1962-78 Little Conneautee Creek near McKean 3.6 .01 .05 40003022500 1923-39 French Creek at Saegerstown- 629 31.0 38.9 2503022540 1976-96 Woodcock Creek at Blooming Valley 31.1 2.32 1.04 55
Appendix 3. 7-day, 10-year low-flow statistic (Q7,10) computed from Log-Pearson distribution of streamflow data andWRI 82-21 regional regression equations for gaged locations on streams in Pennsylvania unaffected by carbonatebedrock, extensive mining, or regulation—Continued
[WRI 82-21 refers to Flippo, 1982b; ft3/s, cubic feet per second; mi2, square miles; climatic year, 12-month period April 1 -March 31]
U.S.Geological
Surveystreamflow-
gaging stationnumber
Period ofrecord
(climaticyear)
Station nameDrainage
area(mi2)
Q7,10 computedfrom Log-Pearson
distribution(ft3/s)
Q7,10 computedfrom WRI 82-21
regionalregressionequations1
(ft3/s)
Absolutevalue of
percentagedifference
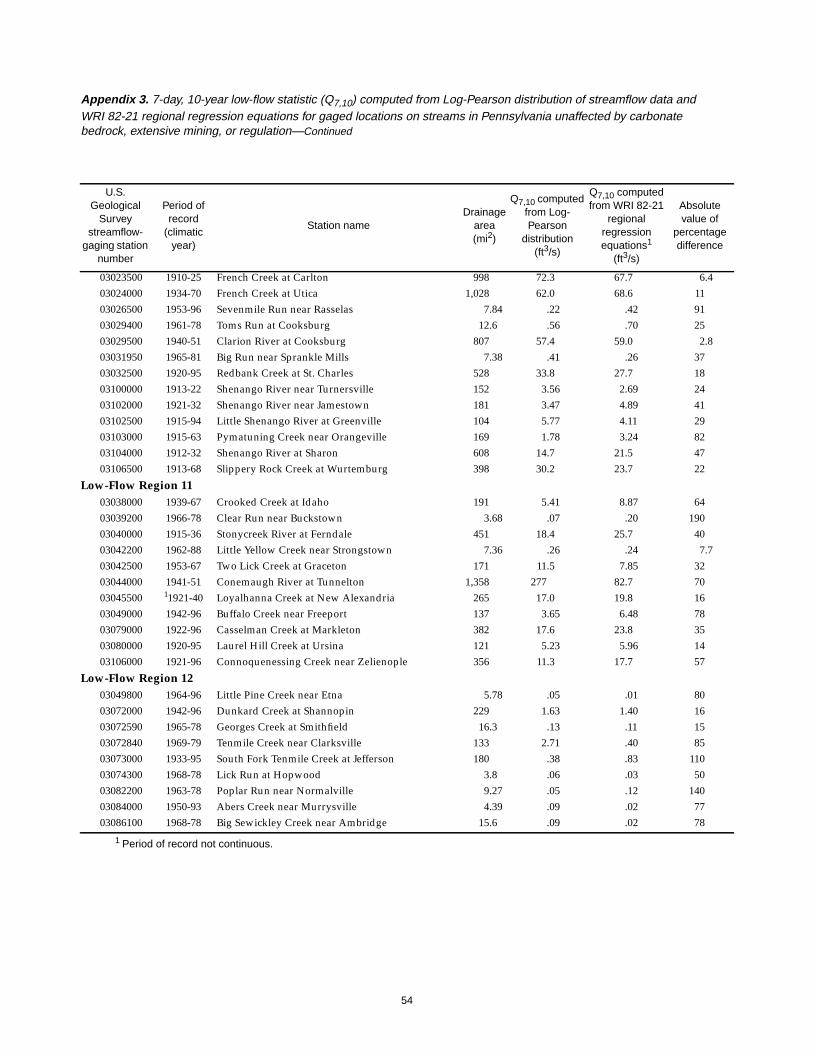
54
03023500 1910-25 French Creek at Carlton 998 72.3 67.7 6.403024000 1934-70 French Creek at Utica 1,028 62.0 68.6 1103026500 1953-96 Sevenmile Run near Rasselas 7.84 .22 .42 9103029400 1961-78 Toms Run at Cooksburg 12.6 .56 .70 2503029500 1940-51 Clarion River at Cooksburg 807 57.4 59.0 2.803031950 1965-81 Big Run near Sprankle Mills 7.38 .41 .26 3703032500 1920-95 Redbank Creek at St. Charles 528 33.8 27.7 1803100000 1913-22 Shenango River near Turnersville 152 3.56 2.69 2403102000 1921-32 Shenango River near Jamestown 181 3.47 4.89 4103102500 1915-94 Little Shenango River at Greenville 104 5.77 4.11 2903103000 1915-63 Pymatuning Creek near Orangeville 169 1.78 3.24 8203104000 1912-32 Shenango River at Sharon 608 14.7 21.5 4703106500 1913-68 Slippery Rock Creek at Wurtemburg 398 30.2 23.7 22
Low-Flow Region 1103038000 1939-67 Crooked Creek at Idaho 191 5.41 8.87 6403039200 1966-78 Clear Run near Buckstown 3.68 .07 .20 19003040000 1915-36 Stonycreek River at Ferndale 451 18.4 25.7 4003042200 1962-88 Little Yellow Creek near Strongstown 7.36 .26 .24 7.703042500 1953-67 Two Lick Creek at Graceton 171 11.5 7.85 3203044000 1941-51 Conemaugh River at Tunnelton 1,358 277 82.7 7003045500 11921-40 Loyalhanna Creek at New Alexandria 265 17.0 19.8 1603049000 1942-96 Buffalo Creek near Freeport 137 3.65 6.48 7803079000 1922-96 Casselman Creek at Markleton 382 17.6 23.8 3503080000 1920-95 Laurel Hill Creek at Ursina 121 5.23 5.96 1403106000 1921-96 Connoquenessing Creek near Zelienople 356 11.3 17.7 57
Low-Flow Region 1203049800 1964-96 Little Pine Creek near Etna 5.78 .05 .01 8003072000 1942-96 Dunkard Creek at Shannopin 229 1.63 1.40 1603072590 1965-78 Georges Creek at Smithfield 16.3 .13 .11 1503072840 1969-79 Tenmile Creek near Clarksville 133 2.71 .40 8503073000 1933-95 South Fork Tenmile Creek at Jefferson 180 .38 .83 11003074300 1968-78 Lick Run at Hopwood 3.8 .06 .03 5003082200 1963-78 Poplar Run near Normalville 9.27 .05 .12 14003084000 1950-93 Abers Creek near Murrysville 4.39 .09 .02 7703086100 1968-78 Big Sewickley Creek near Ambridge 15.6 .09 .02 78
1 Period of record not continuous.
Appendix 3. 7-day, 10-year low-flow statistic (Q7,10) computed from Log-Pearson distribution of streamflow data andWRI 82-21 regional regression equations for gaged locations on streams in Pennsylvania unaffected by carbonatebedrock, extensive mining, or regulation—Continued
[WRI 82-21 refers to Flippo, 1982b; ft3/s, cubic feet per second; mi2, square miles; climatic year, 12-month period April 1 -March 31]
U.S.Geological
Surveystreamflow-
gaging stationnumber
Period ofrecord
(climaticyear)
Station nameDrainage
area(mi2)
Q7,10 computedfrom Log-Pearson
distribution(ft3/s)
Q7,10 computedfrom WRI 82-21
regionalregressionequations1
(ft3/s)
Absolutevalue of
percentagedifference

55
Appendix 4. Comparison of streamflow statistics computed using Log-Pearson distribution and regression equations
Comparison of 7-day, 10-year low-flow statistic (Q7,10) computed using Log-Pearson distributionand WRI 82-21 regional regression equations for low-flow region 1.
Q7,10 COMPUTED FROM WRI 82-21 REGIONAL REGRESSIONEQUATIONS, IN CUBIC FEET PER SECOND
0.1 1000.2 0.5 1 2 5 10 20 500.1
100
0.2
0.5
1
2
5
10
20
50
Q7,
10C
OM
PU
TE
D F
RO
M L
OG
-P
EA
RS
ON
DIS
TR
IBU
TIO
N,
IN C
UB
IC F
EE
T P
ER
SE
CO
ND
Comparison of 7-day, 10-year low-flow statistic (Q7,10) computed from Log-Pearson distributionof streamgage data and WRI 82-21 regional regression equations for low-flow region 2.
0.1 1,0001 10 1000.1
1,000
1
10
100
Q7,10 COMPUTED FROM WRI 82-21 REGIONAL REGRESSIONEQUATIONS, IN CUBIC FEET PER SECOND
Q7,
10 C
OM
PU
TE
D F
RO
M L
OG
-P
EA
RS
ON
DIS
TR
IBU
TIO
N,
IN C
UB
IC F
EE
T P
ER
SE
CO
ND
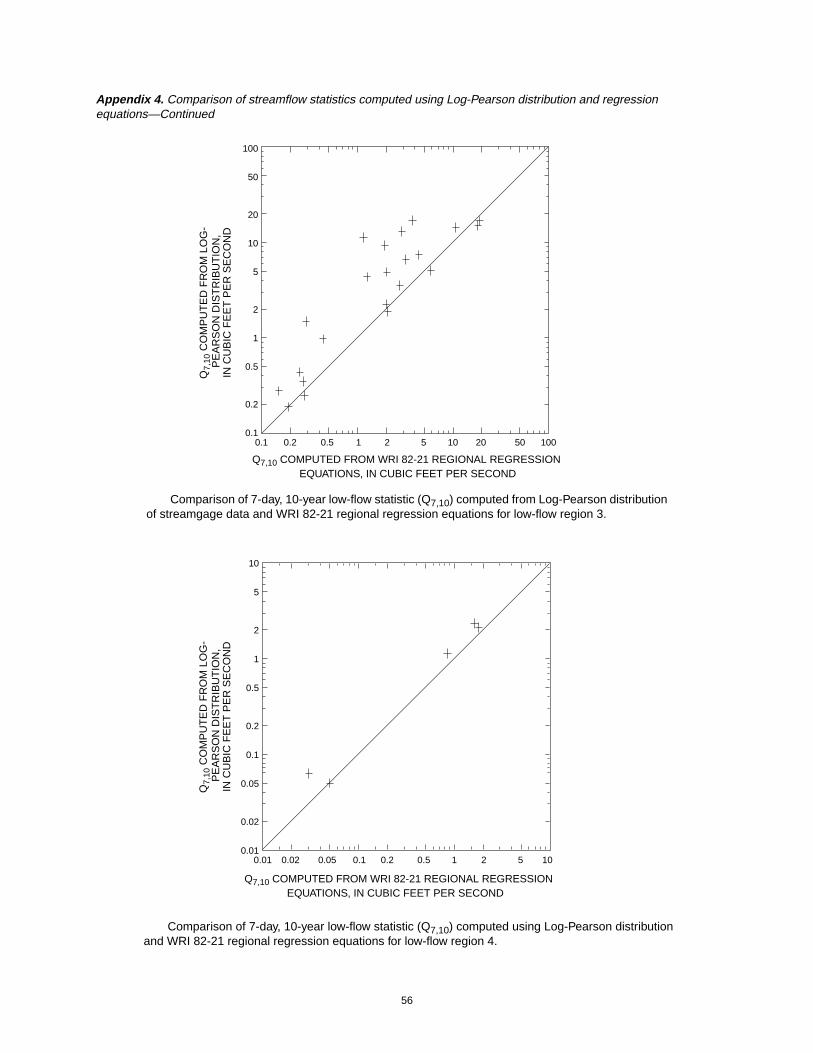
56
Comparison of 7-day, 10-year low-flow statistic (Q7,10) computed from Log-Pearson distributionof streamgage data and WRI 82-21 regional regression equations for low-flow region 3.
0.1 1000.2 0.5 1 2 5 10 20 500.1
100
0.2
0.5
1
2
5
10
20
50
Q7,10 COMPUTED FROM WRI 82-21 REGIONAL REGRESSIONEQUATIONS, IN CUBIC FEET PER SECOND
Q7,
10 C
OM
PU
TE
D F
RO
M L
OG
-P
EA
RS
ON
DIS
TR
IBU
TIO
N,
IN C
UB
IC F
EE
T P
ER
SE
CO
ND
Comparison of 7-day, 10-year low-flow statistic (Q7,10) computed using Log-Pearson distributionand WRI 82-21 regional regression equations for low-flow region 4.
0.01 100.02 0.05 0.1 0.2 0.5 1 2 50.01
10
0.02
0.05
0.1
0.2
0.5
1
2
5
Q7,10 COMPUTED FROM WRI 82-21 REGIONAL REGRESSIONEQUATIONS, IN CUBIC FEET PER SECOND
Q7,
10 C
OM
PU
TE
D F
RO
M L
OG
-P
EA
RS
ON
DIS
TR
IBU
TIO
N,
IN C
UB
IC F
EE
T P
ER
SE
CO
ND
Appendix 4. Comparison of streamflow statistics computed using Log-Pearson distribution and regressionequations—Continued
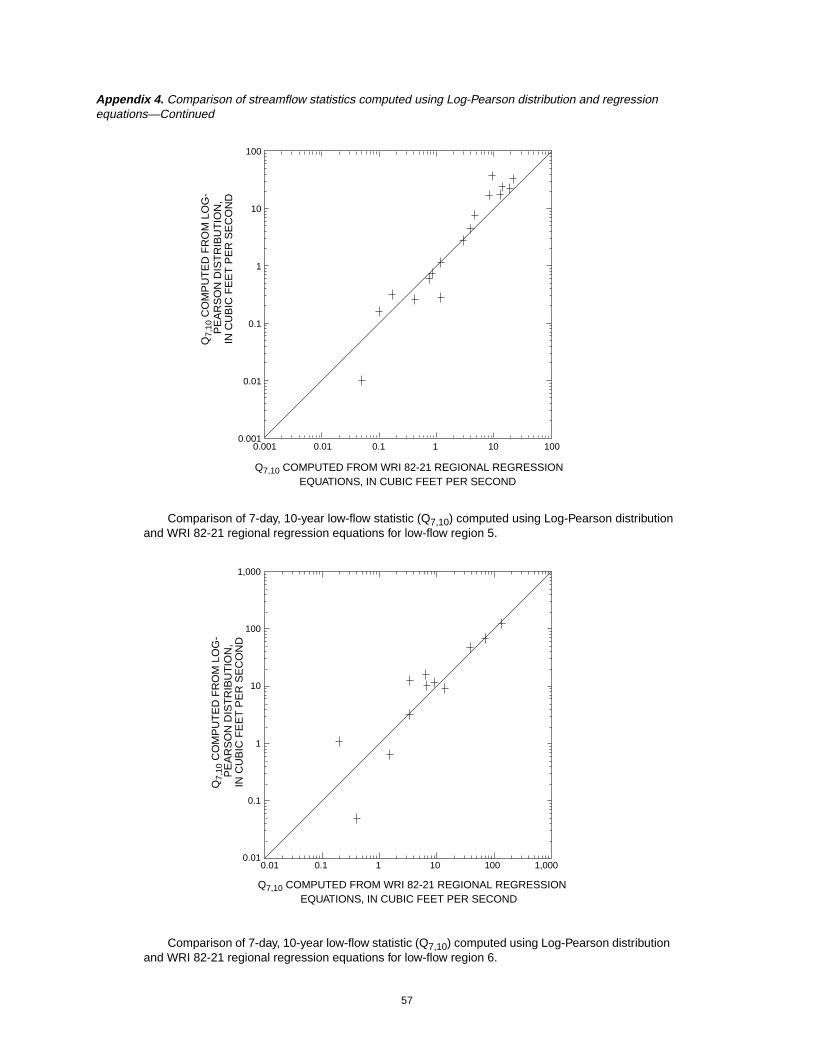
57
Comparison of 7-day, 10-year low-flow statistic (Q7,10) computed using Log-Pearson distributionand WRI 82-21 regional regression equations for low-flow region 5.
0.001 1000.01 0.1 1 100.001
100
0.01
0.1
1
10
Q7,10 COMPUTED FROM WRI 82-21 REGIONAL REGRESSIONEQUATIONS, IN CUBIC FEET PER SECOND
Q7,
10 C
OM
PU
TE
D F
RO
M L
OG
-P
EA
RS
ON
DIS
TR
IBU
TIO
N,
IN C
UB
IC F
EE
T P
ER
SE
CO
ND
Comparison of 7-day, 10-year low-flow statistic (Q7,10) computed using Log-Pearson distributionand WRI 82-21 regional regression equations for low-flow region 6.
Q7,
10 C
OM
PU
TE
D F
RO
M L
OG
-P
EA
RS
ON
DIS
TR
IBU
TIO
N,
IN C
UB
IC F
EE
T P
ER
SE
CO
ND
0.01
1,000
0.1
1
10
100
0.01 0.1 1 10 100 1,000
Q7,10 COMPUTED FROM WRI 82-21 REGIONAL REGRESSIONEQUATIONS, IN CUBIC FEET PER SECOND
Appendix 4. Comparison of streamflow statistics computed using Log-Pearson distribution and regressionequations—Continued

58
Comparison of 7-day, 10-year low-flow statistic (Q7,10) computed using Log-Pearson distributionand WRI 82-21 regional regression equations for low-flow region 7.
100
50
20
10
0.01 0.02 0.05 0.1 0.2 0.5 1 2 5 10 20 50 100
Q7,
10 C
OM
PU
TE
D F
RO
M L
OG
-P
EA
RS
ON
DIS
TR
IBU
TIO
N,
IN C
UB
IC F
EE
T P
ER
SE
CO
ND
Comparison of 7-day, 10-year low-flow statistic (Q7,10) computed using Log-Pearson distributionand WRI 82-21 regional regression equations for low-flow region 9.
0.1
100
0.2
0.5
1
2
5
10
20
50
Q7,
10 C
OM
PU
TE
D F
RO
M L
OG
-P
EA
RS
ON
DIS
TR
IBU
TIO
N,
IN C
UB
IC F
EE
T P
ER
SE
CO
ND
0.1 1000.2 0.5 1 2 5 10 20 50
Q7,10 COMPUTED FROM WRI 82-21 REGIONAL REGRESSIONEQUATIONS, IN CUBIC FEET PER SECOND
Q7,10 COMPUTED FROM WRI 82-21 REGIONAL REGRESSIONEQUATIONS, IN CUBIC FEET PER SECOND
0.01
0.02
0.05
0.1
0.2
0.5
1
2
5
Appendix 4. Comparison of streamflow statistics computed using Log-Pearson distribution and regressionequations—Continued
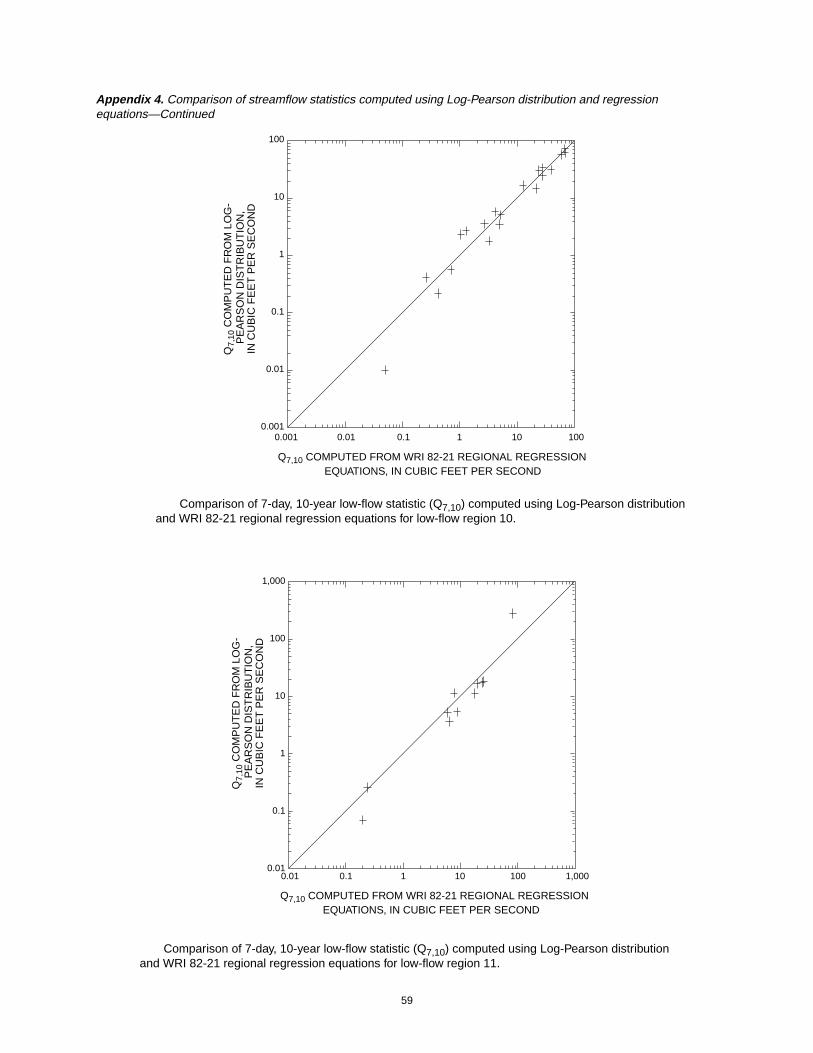
59
Comparison of 7-day, 10-year low-flow statistic (Q7,10) computed using Log-Pearson distributionand WRI 82-21 regional regression equations for low-flow region 10.
0.001
100
0.01
0.1
1
10
Q7,
10 C
OM
PU
TE
D F
RO
M L
OG
-P
EA
RS
ON
DIS
TR
IBU
TIO
N,
IN C
UB
IC F
EE
T P
ER
SE
CO
ND
0.001 0.01 0.1 100101
Q7,10 COMPUTED FROM WRI 82-21 REGIONAL REGRESSIONEQUATIONS, IN CUBIC FEET PER SECOND
Comparison of 7-day, 10-year low-flow statistic (Q7,10) computed using Log-Pearson distributionand WRI 82-21 regional regression equations for low-flow region 11.
Q7,10 COMPUTED FROM WRI 82-21 REGIONAL REGRESSIONEQUATIONS, IN CUBIC FEET PER SECOND
0.01 1,0000.1 1 10 1000.01
1,000
0.1
1
10
100
Q7,
10 C
OM
PU
TE
D F
RO
M L
OG
-P
EA
RS
ON
DIS
TR
IBU
TIO
N,
IN C
UB
IC F
EE
T P
ER
SE
CO
ND
Appendix 4. Comparison of streamflow statistics computed using Log-Pearson distribution and regressionequations—Continued
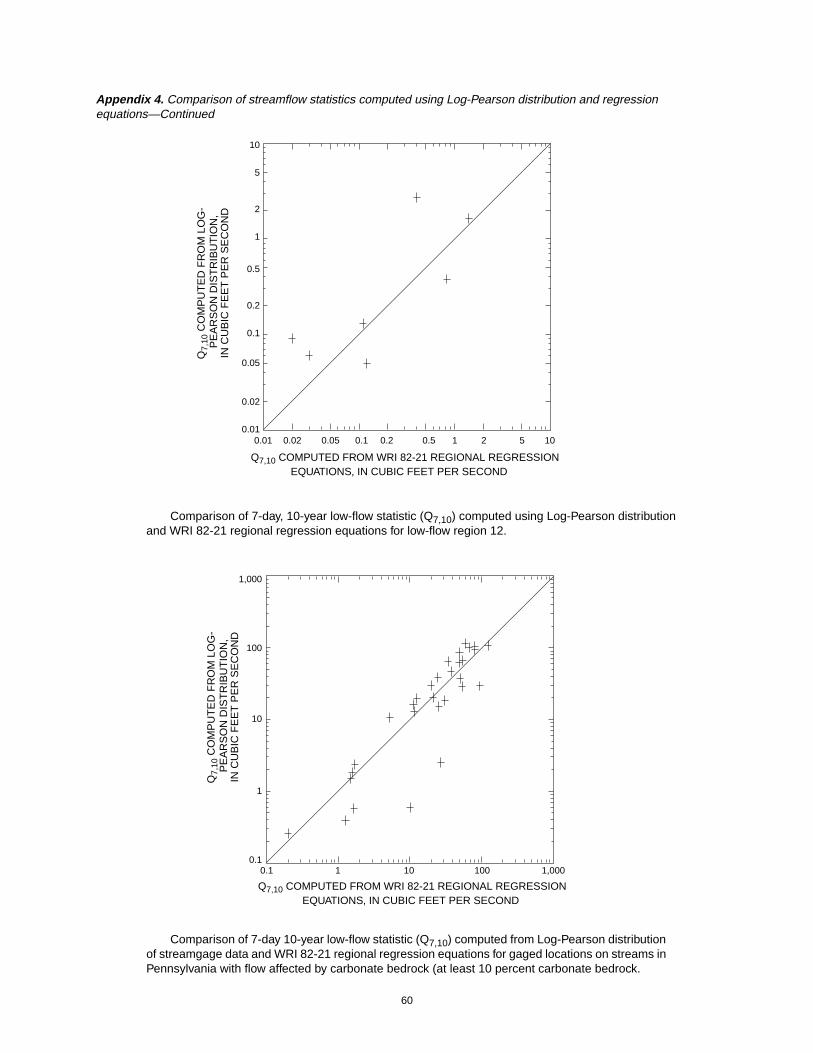
60
Comparison of 7-day, 10-year low-flow statistic (Q7,10) computed using Log-Pearson distributionand WRI 82-21 regional regression equations for low-flow region 12.
Q7,10 COMPUTED FROM WRI 82-21 REGIONAL REGRESSIONEQUATIONS, IN CUBIC FEET PER SECOND
Q7,
10 C
OM
PU
TE
D F
RO
M L
OG
-P
EA
RS
ON
DIS
TR
IBU
TIO
N,
IN C
UB
IC F
EE
T P
ER
SE
CO
ND
0.01 100.02 0.05 0.1 0.2 0.5 1 2 50.01
10
0.02
0.05
0.1
0.2
0.5
1
2
5
Q7,
10 C
OM
PU
TE
D F
RO
M L
OG
-P
EA
RS
ON
DIS
TR
IBU
TIO
N,
IN C
UB
IC F
EE
T P
ER
SE
CO
ND
0.1
1,000
1
10
100
Comparison of 7-day 10-year low-flow statistic (Q7,10) computed from Log-Pearson distributionof streamgage data and WRI 82-21 regional regression equations for gaged locations on streams inPennsylvania with flow affected by carbonate bedrock (at least 10 percent carbonate bedrock.
0.1 1 10 1,000100
Q7,10 COMPUTED FROM WRI 82-21 REGIONAL REGRESSIONEQUATIONS, IN CUBIC FEET PER SECOND
Appendix 4. Comparison of streamflow statistics computed using Log-Pearson distribution and regressionequations—Continued
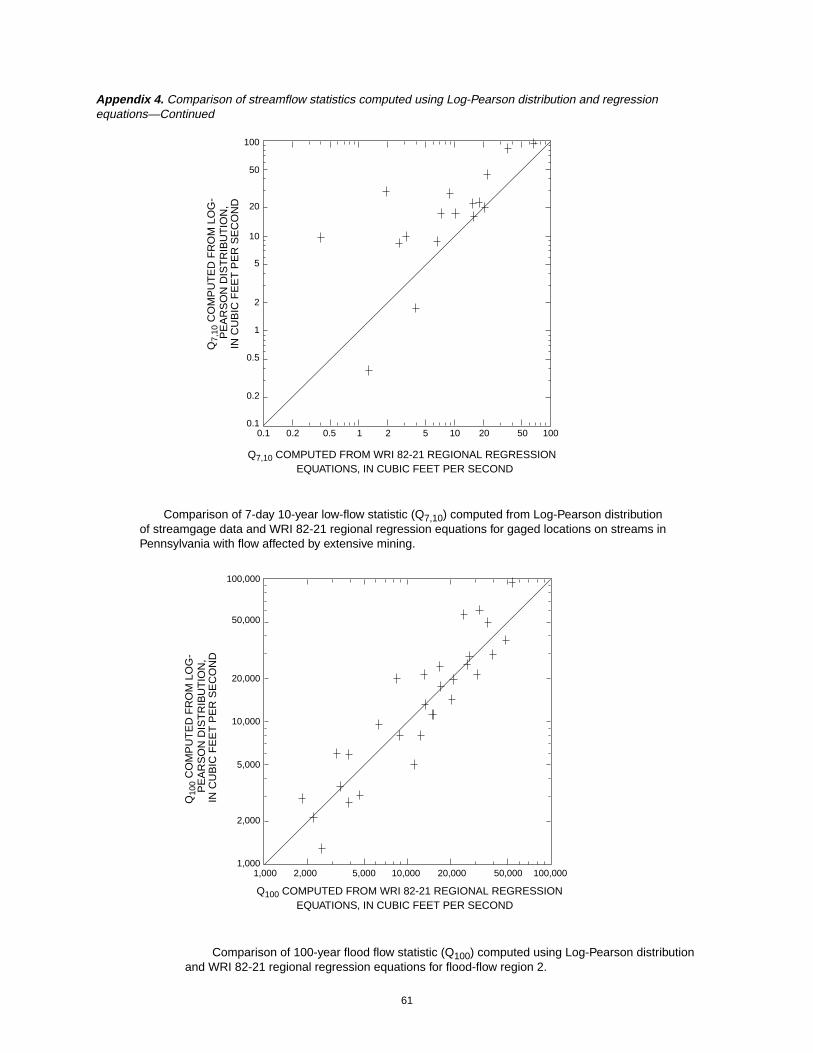
61
Comparison of 7-day 10-year low-flow statistic (Q7,10) computed from Log-Pearson distributionof streamgage data and WRI 82-21 regional regression equations for gaged locations on streams inPennsylvania with flow affected by extensive mining.
Q7,10 COMPUTED FROM WRI 82-21 REGIONAL REGRESSIONEQUATIONS, IN CUBIC FEET PER SECOND
Q7,
10 C
OM
PU
TE
D F
RO
M L
OG
-P
EA
RS
ON
DIS
TR
IBU
TIO
N,
IN C
UB
IC F
EE
T P
ER
SE
CO
ND
0.1
100
0.2
0.5
1
2
5
10
20
50
0.1 0.2 0.5 1 2 5 10 20 10050
1,000 100,0002,000 5,000 10,000 20,000 50,0001,000
100,000
2,000
5,000
10,000
20,000
50,000
Comparison of 100-year flood flow statistic (Q100) computed using Log-Pearson distributionand WRI 82-21 regional regression equations for flood-flow region 2.
Q10
0 C
OM
PU
TE
D F
RO
M L
OG
-P
EA
RS
ON
DIS
TR
IBU
TIO
N,
IN C
UB
IC F
EE
T P
ER
SE
CO
ND
Q100 COMPUTED FROM WRI 82-21 REGIONAL REGRESSIONEQUATIONS, IN CUBIC FEET PER SECOND
Appendix 4. Comparison of streamflow statistics computed using Log-Pearson distribution and regressionequations—Continued
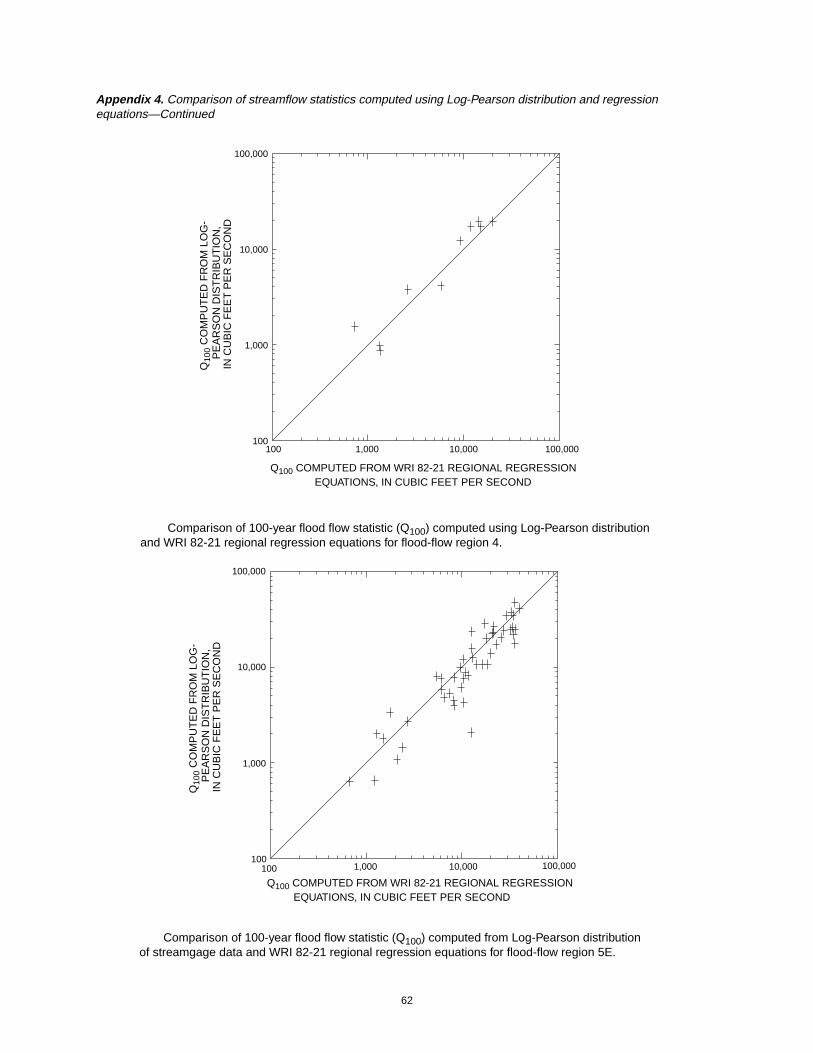
62
Q10
0 C
OM
PU
TE
D F
RO
M L
OG
-P
EA
RS
ON
DIS
TR
IBU
TIO
N,
IN C
UB
IC F
EE
T P
ER
SE
CO
ND
Comparison of 100-year flood flow statistic (Q100) computed using Log-Pearson distributionand WRI 82-21 regional regression equations for flood-flow region 4.
Q100 COMPUTED FROM WRI 82-21 REGIONAL REGRESSIONEQUATIONS, IN CUBIC FEET PER SECOND
100 100,0001,000 10,000100
100,000
1,000
10,000
Q10
0 C
OM
PU
TE
D F
RO
M L
OG
-P
EA
RS
ON
DIS
TR
IBU
TIO
N,
IN C
UB
IC F
EE
T P
ER
SE
CO
ND
Comparison of 100-year flood flow statistic (Q100) computed from Log-Pearson distributionof streamgage data and WRI 82-21 regional regression equations for flood-flow region 5E.
Q100 COMPUTED FROM WRI 82-21 REGIONAL REGRESSIONEQUATIONS, IN CUBIC FEET PER SECOND
100 100,0001,000 10,000100
100,000
1,000
10,000
Appendix 4. Comparison of streamflow statistics computed using Log-Pearson distribution and regressionequations—Continued

63
Q10
0 C
OM
PU
TE
D F
RO
M L
OG
-P
EA
RS
ON
DIS
TR
IBU
TIO
N,
IN C
UB
IC F
EE
T P
ER
SE
CO
ND
Comparison of 100-year flood flow statistic (Q100) computed using Log-Pearson distributionand WRI 82-21 regional regression equations for flood-flow region 5W.
Q100 COMPUTED FROM WRI 82-21 REGIONAL REGRESSIONEQUATIONS, IN CUBIC FEET PER SECOND
100 100,0001,000 10,000100
100,000
1,000
10,000
Comparison of 100-year flood flow statistic (Q100) computed using Log-Pearson distributionand WRI 82-21 regional regression equations for flood-flow region 6A.
Q100 COMPUTED FROM WRI 82-21 REGIONAL REGRESSIONEQUATIONS, IN CUBIC FEET PER SECOND
Q10
0 C
OM
PU
TE
D F
RO
M L
OG
-P
EA
RS
ON
DIS
TR
IBU
TIO
N,
IN C
UB
IC F
EE
T P
ER
SE
CO
ND
1,000 100,0002,000 5,000 10,000 20,000 50,0001,000
100,000
2,000
5,000
10,000
20,000
50,000
Appendix 4. Comparison of streamflow statistics computed using Log-Pearson distribution and regressionequations—Continued

64
Comparison of 100-year flood flow statistic (Q100) computed from Log-Pearson distributionof streamgage data and WRI 82-21 regional regression equations for flood-flow region 6B.
Q100 COMPUTED FROM WRI 82-21 REGIONAL REGRESSIONEQUATIONS, IN CUBIC FEET PER SECOND
100 10,000200 500 1,000 2,000 5,000100
10,000
200
500
1,000
2,000
5,000
Q10
0 C
OM
PU
TE
D F
RO
M L
OG
-P
EA
RS
ON
DIS
TR
IBU
TIO
N,
IN C
UB
IC F
EE
T P
ER
SE
CO
ND
Comparison of 100-year flood flow statistic (Q100) computed using Log-Pearson distributionand WRI 82-21 regional regression equations for flood-flow region 7A.
Q100 COMPUTED FROM WRI 82-21 REGIONAL REGRESSIONEQUATIONS, IN CUBIC FEET PER SECOND
Q10
0 C
OM
PU
TE
D F
RO
M L
OG
-P
EA
RS
ON
DIS
TR
IBU
TIO
N,
IN C
UB
IC F
EE
T P
ER
SE
CO
ND
1,000 100,0002,000 5,000 10,000 20,000 50,0001,000
100,000
2,000
5,000
10,000
20,000
50,000
Appendix 4. Comparison of streamflow statistics computed using Log-Pearson distribution and regressionequations—Continued
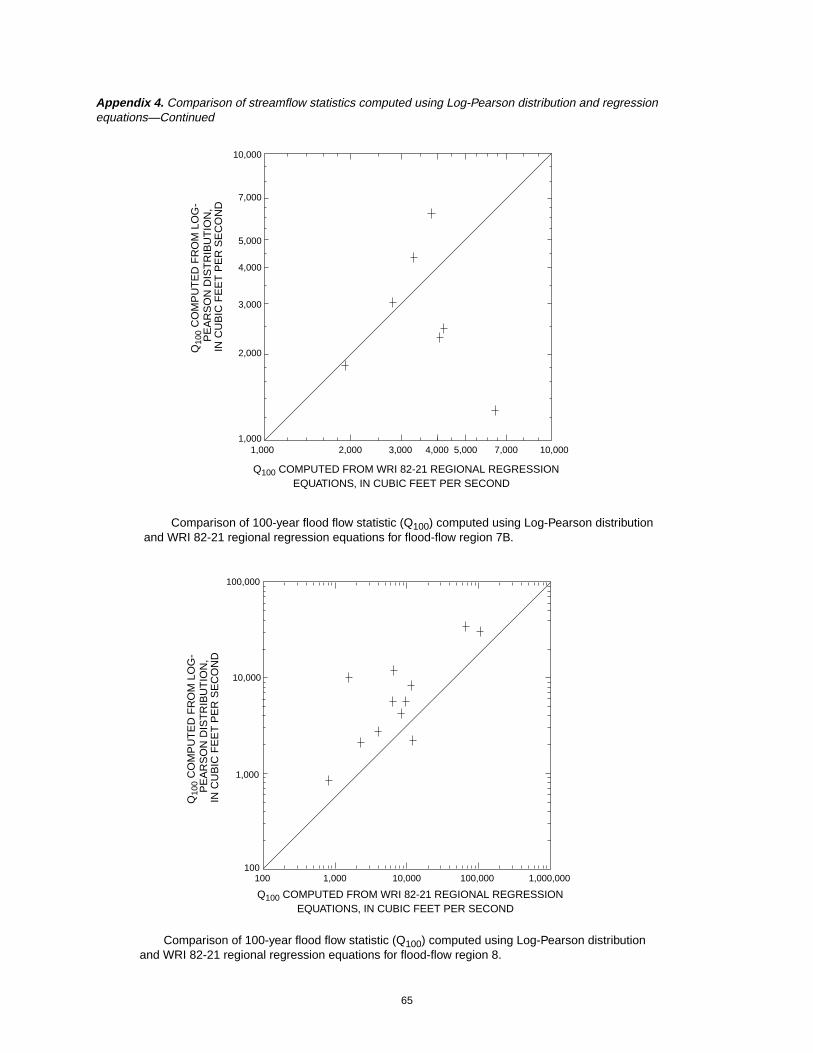
65
Q100 COMPUTED FROM WRI 82-21 REGIONAL REGRESSIONEQUATIONS, IN CUBIC FEET PER SECOND
Q10
0 C
OM
PU
TE
D F
RO
M L
OG
-P
EA
RS
ON
DIS
TR
IBU
TIO
N,
IN C
UB
IC F
EE
T P
ER
SE
CO
ND
Comparison of 100-year flood flow statistic (Q100) computed using Log-Pearson distributionand WRI 82-21 regional regression equations for flood-flow region 7B.
1,000 10,0002,000 3,000 4,000 5,000 7,0001,000
10,000
2,000
3,000
4,000
5,000
7,000
Q100 COMPUTED FROM WRI 82-21 REGIONAL REGRESSIONEQUATIONS, IN CUBIC FEET PER SECOND
Q10
0 C
OM
PU
TE
D F
RO
M L
OG
-P
EA
RS
ON
DIS
TR
IBU
TIO
N,
IN C
UB
IC F
EE
T P
ER
SE
CO
ND
100 1,000,0001,000 10,000 100,000100
100,000
1,000
10,000
Comparison of 100-year flood flow statistic (Q100) computed using Log-Pearson distributionand WRI 82-21 regional regression equations for flood-flow region 8.
Appendix 4. Comparison of streamflow statistics computed using Log-Pearson distribution and regressionequations—Continued
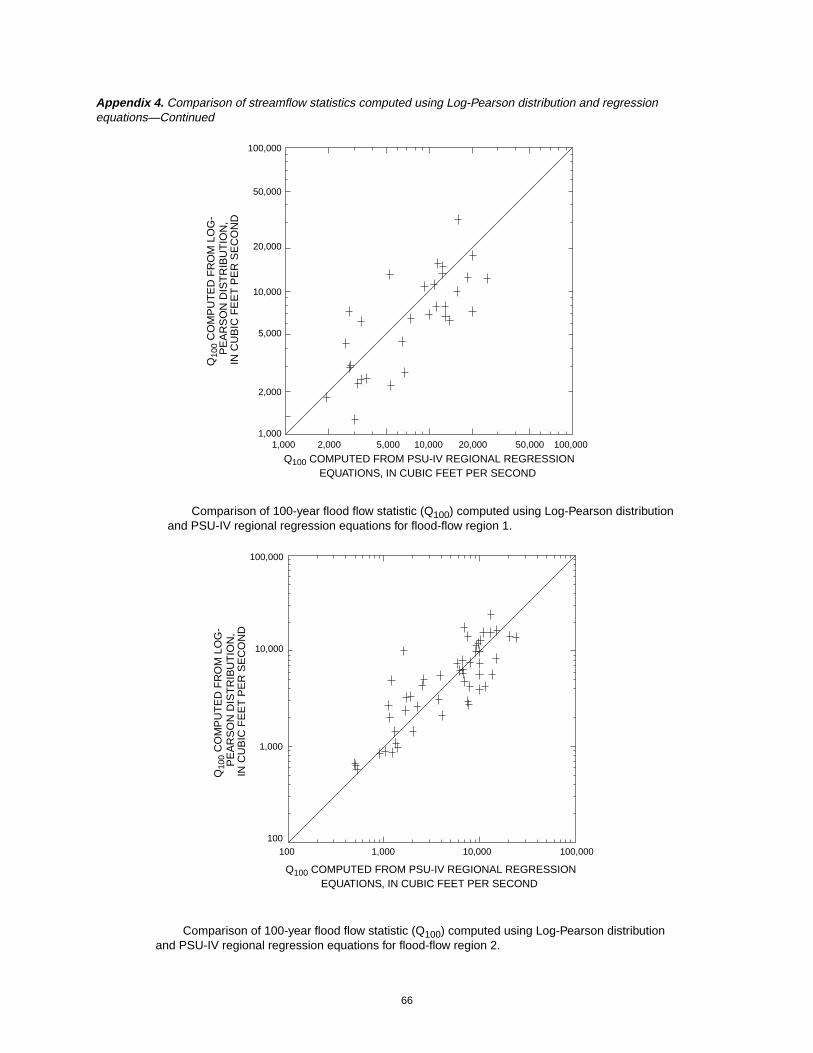
66
Comparison of 100-year flood flow statistic (Q100) computed using Log-Pearson distributionand PSU-IV regional regression equations for flood-flow region 1.
1,000 100,0002,000 5,000 10,000 20,000 50,0001,000
100,000
2,000
5,000
10,000
20,000
50,000
Q100 COMPUTED FROM PSU-IV REGIONAL REGRESSIONEQUATIONS, IN CUBIC FEET PER SECOND
Q10
0 C
OM
PU
TE
D F
RO
M L
OG
-P
EA
RS
ON
DIS
TR
IBU
TIO
N,
IN C
UB
IC F
EE
T P
ER
SE
CO
ND
Comparison of 100-year flood flow statistic (Q100) computed using Log-Pearson distributionand PSU-IV regional regression equations for flood-flow region 2.
Q100 COMPUTED FROM PSU-IV REGIONAL REGRESSIONEQUATIONS, IN CUBIC FEET PER SECOND
Q10
0 C
OM
PU
TE
D F
RO
M L
OG
-P
EA
RS
ON
DIS
TR
IBU
TIO
N,
IN C
UB
IC F
EE
T P
ER
SE
CO
ND
100 100,0001,000 10,000100
100,000
1,000
10,000
Appendix 4. Comparison of streamflow statistics computed using Log-Pearson distribution and regressionequations—Continued

67
Comparison of 100-year flood flow statistic (Q100) computed using Log-Pearson distributionand PSU-IV regional regression equations for flood-flow region 3.
100 100,0001,000 10,000100
100,000
1,000
10,000
Q100 COMPUTED FROM PSU-IV REGIONAL REGRESSIONEQUATIONS, IN CUBIC FEET PER SECOND
Q10
0 C
OM
PU
TE
D F
RO
M L
OG
-P
EA
RS
ON
DIS
TR
IBU
TIO
N,
IN C
UB
IC F
EE
T P
ER
SE
CO
ND
Comparison of 100-year flood flow statistic (Q100) computed using Log-Pearson distributionand PSU-IV regional regression equations for flood-flow region 4.
Q100 COMPUTED FROM PSU-IV REGIONAL REGRESSIONEQUATIONS, IN CUBIC FEET PER SECOND
Q10
0 C
OM
PU
TE
D F
RO
M L
OG
-P
EA
RS
ON
DIS
TR
IBU
TIO
N,
IN C
UB
IC F
EE
T P
ER
SE
CO
ND
100 100,0001,000 10,000100
100,000
1,000
10,000
Appendix 4. Comparison of streamflow statistics computed using Log-Pearson distribution and regressionequations—Continued

68
Appendix 5. Flood-flow statistics computed from Log-Pearson distribution of streamflow data and WRI 82-21 regional regression equations for gaged locations onstreams in Pennsylvania
[WRI 82-21 refers to Flippo, 1982b; ft3/s, cubic feet per second; mi2, is square miles; water year, 12-month period October 1 - September 30]
U.S.Geological
Surveystreamflow-
gaging station
Period ofrecord(wateryear)
Station nameDrainage
area(mi2)
50-year floodflowcomputed
from Log-Pearson
distribution(ft3/s)
50-year floodflow computed
fromWRI 82-21regressionequations
(ft3/s)
Absolutevalue of
percentagedifference
100-year floodflow computed
from Log-Pearson
distribution(ft3/s)
100-year floodflow computed
from WRI 82-21regressionequations 1
(ft3/s)
Absolutevalue of
percentagedifference
Flood-flow region 201428750 1975-96 West Branch Lackawaxen River near Aldenville 40.6 4,850 7,520 55 5,440 9,330 7201429000 1945-60 West Branch Lackawaxen River at Prompton 59.7 6,990 10,100 44 8,030 12,400 5401429500 1944-59 Dyberry Creek near Honesdale 64.6 16,600 10,700 36 21,500 13,100 3901430000 1949-59 Lackawaxen River near Honesdale 164 20,700 19,500 5.8 25,000 26,000 4.001430500 1922-38 Lackawaxen River at West Hawley 206 18,000 23,100 28 21,500 30,700 4301431000 1945-85 Middle Creek near Hawley 78.4 9,260 12,400 34 11,200 15,100 3501431500 11909-96 Lackawaxen River at Hawley 290 24,200 32,800 36 29,600 39,400 3301440400 1957-96 Brodhead Creek at Analomink 65.9 11,000 10,900 .90 13,300 13,300 001442500 1951-96 Brodhead Creek at Minisink Hills 259 38,600 30,200 22 49,700 36,300 2701447500 1944-96 Lehigh River at Stoddardtsville 91.7 13,200 13,900 5.3 17,700 17,000 4.001447720 1962-96 Tobyhanna Creek near Blakeslee 118 11,900 16,800 41 14,300 20,400 4301450500 1940-96 Aquashicola Creek at Palmerton 76.7 9,080 12,200 34 11,300 14,900 3201516350 1977-96 Tioga River near Mansfield 153 42,400 20,400 52 56,100 24,700 5601516500 1955-96 Corey Creek near Mainesburg 12.2 4,450 3,110 30 5,870 3,900 3401517000 1955-78 Elk Run near Mainesburg 10.2 2,740 2,720 .73 3,520 3,390 3.701518500 1954-74 Crooked Creek at Tioga 122 15,600 17,200 10 19,700 20,900 6.101518862 1984-96 Cowanesque River at Westfield 90.6 19,800 13,800 30 24,500 16,800 3101532000 1914-96 Towanda Creek near Monroetown 215 47,200 26,300 44 60,700 31,700 4801532850 1960-79 Middle Branch Wyalusing Creek Tributary near
Birchardsville5.67 1,770 1,760 .56 2,150 2,210 2.8
01533500 1941-58 North Branch Mehoopany Creek near Lovelton 35.2 14,800 6,830 54 20,000 8,410 5801533950 1961-78 South Branch Tunkhannock Creek near Montdale 12.6 2,320 3,180 37 2,700 3,890 4401534000 1914-96 Tunkhannock Creek near Tunkhannock 383 33,500 40,400 21 37,400 48,400 2901537500 1940-90 Solomon Creek at Wilkes-Barre 15.7 2,470 3,750 52 3,070 4,650 5101549500 1941-96 Blockhouse Creek near English Center 37.7 6,560 7,190 9.6 7,960 8,840 1101549780 1960-78 Larrys Creek at Cogan House 6.8 1,040 2,010 93 1,300 2,520 9401550000 1914-96 Lycoming Creek near Trout Run 173 23,700 22,300 5.9 28,800 27,000 6.3

69
01552000 11926-96 Loyalsock Creek at Loyalsock 443 77,200 45,000 42 94,500 53,800 4301552500 1941-96 Muncy Creek near Sonestown 23.8 7,660 5,110 33 9,600 6,310 3401553600 1960-78 East Branch Chillisquaque Creek near Washingtonville 9.48 4,550 2,580 43 5,970 3,210 4601553700 1980-96 Chillisquaque Creek at Washingtonville 51.3 4,560 9,040 98 5,030 11,100 12004213075 1986-96 Brandy Run near Girard 4.45 2,380 1,470 38 2,900 1,840 36
Flood-flow region 301439500 1909-96 Bush Kill at Shoemakers 117 8,010 8,700 8.6 10,300 10,800 4.9
Flood-flow region 403015280 1963-79 Jackson Run near North Warren 12.8 812 1,200 48 861 1,340 5603015500 1910-96 Brokenstraw Creek at Youngsville 321 15,600 13,700 12 17,100 15,200 1103017500 1938-79 Tionesta Creek at Lynch 233 15,200 10,800 29 17,300 12,000 3103019000 11910-40 Tionesta Creek at Nebraska 469 17,800 18,300 2.8 19,400 20,300 4.603020500 1910-96 Oil Creek at Rouseville 300 17,500 13,100 25 19,600 14,500 2603022540 1975-95 Woodcock Creek at Blooming Valley 31.1 3,320 2,350 29 3,780 2,620 3103023000 1911-38 Cussewago Creek near Meadville 90.2 3,610 5,260 46 4,130 5,850 4203025000 1933-79 Sugar Creek at Sugarcreek 166 11,200 8,344 26 12,200 9,270 2403025200 1961-78 Patchel Run near Franklin 5.69 1,210 651 46 1,560 728 5303029400 1960-78 Toms Run at Cooksburg 12.6 866 1,190 37 972 1,330 37
Flood-flow region 5E
01441000 1911-38 McMichaels Creek at Stroudsburg 65.3 3,770 9,680 160 4,260 12,400 19001446600 1961-76 Martins Creek neat East Bangor 10.4 2,120 2,080 1.9 2,700 2,710 .3701448000 1917-59 Lehigh River at Tannery 322 36,000 29,100 19 47,700 35,800 2501448500 1949-95 Dilldown Creek near Long Pond 2.93 540 1,030 91 660 1,220 8501449500 1941-58 Wild Creek at Hatchery 16.8 3,280 3,520 7.3 4,340 4,610 6.201451800 1967-95 Jordan Creek near Schnecksville 53 8,160 7,590 7.0 9,960 9,640 3.201452000 1945-95 Jordan Creek at Allentown 75.8 12,300 10,000 19 15,600 12,700 1901460000 11884-1913 Tohickon Creek at Point Pleasant 107 10,500 10,600 .95 12,500 13,100 4.801467500 11948-94 Schuylkill River at Pottsville 53.4 6,140 8,160 33 7,580 10,400 37
Appendix 5. Flood-flow statistics computed from Log-Pearson distribution of streamflow data and WRI 82-21 regional regression equations for gaged locations onstreams in Pennsylvania—Continued
[WRI 82-21 refers to Flippo, 1982b; ft3/s, cubic feet per second; mi2, is square miles; water year, 12-month period October 1 - September 30]
U.S.Geological
Surveystreamflow-
gaging station
Period ofrecord(wateryear)
Station nameDrainage
area(mi2)
50-year floodflowcomputed
from Log-Pearson
distribution(ft3/s)
50-year floodflow computed
fromWRI 82-21regressionequations
(ft3/s)
Absolutevalue of
percentagedifference
100-year floodflow computed
from Log-Pearson
distribution(ft3/s)
100-year floodflow computed
from WRI 82-21regressionequations 1
(ft3/s)
Absolutevalue of
percentagedifference

70
01468500 1973-96 Schuylkill River at Landingville 133 11,400 16,000 40 14,000 20,100 4401469500 1920-96 Little Schuylkill River at Tamaqua 42.9 5,270 7,610 44 6,200 9,870 5901470500 1948-95 Schuylkill River at Berne 355 34,500 32,400 6.1 40,800 40,000 2.001470720 1962-80 Maiden Creek Tributary at Lenhartsville 7.46 2,600 1,400 46 3,340 1,790 4601470756 1973-95 Maiden Creek at Virginville 159 16,300 14,700 10 19,900 18,100 9.001470853 1983-95 Furnace Creek at Robesonia 4.18 766 776 1.3 894 992 4701470960 1965-78 Tulpehocken Creek at Blue Marsh Damsite near Reading 175 21,100 17,500 17 26,800 21,600 1901471000 1951-78 Tulpehocken Creek near Reading 211 14,600 18,800 29 17,200 23,000 3401534500 1940-59 Lackawanna River at Archbald 108 9,000 14,700 63 10,600 18,700 7601535500 1914-28 Lackawanna River at Moosic 264 15,300 28,700 88 17,900 35,900 10001536000 1960-96 Lackawanna River at Old Forge 332 20,700 29,400 42 24,600 36,000 4601538000 1920-96 Wapwallopen Creek near Wapwallopen 43.8 4,050 5,240 29 4,810 6,530 3601539000 1939-96 Fishing Creek near Bloomsburg 274 28,900 23,800 18 34,900 29,100 1701539500 1941-58 Little Fishing Creek at Eyers Grove 56.5 4,100 6,770 65 4,510 8,270 8301540000 1914-31 Fishing Creek at Bloomsburg 355 33,000 27,200 18 37,800 33,000 1301540200 1959-79 Trexler Run near Ringtown 1.77 457 505 11 638 670 5.001541000 1913-96 West Branch Susquehanna River at Bower 315 21,200 26,600 25 24,900 32,500 3101541308 1968-79 Bradley Run near Ashville 6.77 912 1,600 75 1,070 2,100 9601541500 1914-60 Clearfield Creek at Dimeling 371 19,200 28,600 49 21,800 34,600 5901542000 1941-93 Moshannon Creek at Oceola Mills 68.8 3,670 8,360 130 4,270 10,500 15001546000 1911-28 North Bald Eagle Creek at Milesburg 119 20,200 10,400 49 23,800 12,600 4701547200 1957-96 Bald Eagle Creek below Spring Creek at Milesburg 265 18,800 17,800 5.3 22,800 21,200 7.001547500 1955-69 Bald Eagle Creek at Blanchard 339 10,800 9,500 12 12,200 10,300 1601547700 1956-96 Marsh Creek at Blanchard 44.1 6,120 4,450 27 7,940 5,450 3101547800 1959-81 South Fork Beech Creek near Snow Shoe 12.2 1,180 1,890 60 1,440 2,390 6601547950 1968-96 Beech Creek at Monument 152 8,910 12,500 40 10,700 14,400 3501548005 1911-65 Bald Eagle Creek near Beech Creek Station 562 23,400 29,300 25 26,100 34,200 3101553130 1968-81 Sand Spring Run near White Deer 4.93 1,440 999 31 2,000 1,290 36
Appendix 5. Flood-flow statistics computed from Log-Pearson distribution of streamflow data and WRI 82-21 regional regression equations for gaged locations onstreams in Pennsylvania—Continued
[WRI 82-21 refers to Flippo, 1982b; ft3/s, cubic feet per second; mi2, is square miles; water year, 12-month period October 1 - September 30]
U.S.Geological
Surveystreamflow-
gaging station
Period ofrecord(wateryear)
Station nameDrainage
area(mi2)
50-year floodflowcomputed
from Log-Pearson
distribution(ft3/s)
50-year floodflow computed
fromWRI 82-21regressionequations
(ft3/s)
Absolutevalue of
percentagedifference
100-year floodflow computed
from Log-Pearson
distribution(ft3/s)
100-year floodflow computed
from WRI 82-21regressionequations 1
(ft3/s)
Absolutevalue of
percentagedifference

71
01554500 1940-93 Shamokin Creek near Shamokin 54.2 3,190 6,640 110 3,940 8,310 11001555000 1930-95 Penns Creek at Penns Creek 301 20,000 22,800 14 24,500 27,500 1201555500 1930-95 East Mahantango Creek near Dalmatia 162 21,800 14,200 35 28,900 17,300 4001556000 1917-95 Frankstown Branch Juniata River at Williamsport 291 17,800 19,900 12 20,500 25,800 2601556500 1946-81 Little Juniata River at Tipton 93.7 7,580 8,860 17 8,780 10,800 2301557500 1940-95 Bald Eagle Creek at Tyrone 44.1 4,540 5,930 31 5,350 7,490 4001558000 1939-95 Little Juniata River at Spruce Creek 220 18,300 17,200 6.0 22,600 20,800 8.001559500 1930-58 Standing Stone Creek near Huntingdon 128 7,010 9,720 39 8,210 11,700 4301562500 1930-57 Great Trough Creek near Marklesburg 84.6 6,290 6,890 10 7,770 8,300 6.801565000 11940-95 Kishacoquillas at Reedsville 164 8,870 13,400 51 10,700 16,300 5201565700 1960-81 Little Lost Creek at Oakland Mills 6.52 1,330 1,170 12 1,780 1,500 1601566500 1930-58 Cocolamus Creek near Millertown 57.2 6,740 5,600 17 7,700 6,050 2101572000 1920-32 Lower Little Swatara Creek at Pine Grove 34.3 4,700 4,850 3.2 5,820 6,140 5.501573000 1919-95 Swatara Creek at Harper Tavern 337 28,600 28,300 1.0 34,500 34,600 .30
Flood-flow region 5W
03034500 1940-95 Little Mahoning Creek at McCormick 87.4 6,350 8,180 29 6,930 9,460 3703035000 1917-40 Mahoning Creek at Dayton 321 17,200 21,900 27 19,700 25,100 2703038000 1936-96 Crooked Creek at Idaho 191 13,500 14,800 10 15,700 17,000 8.303039000 1910-39 Crooked Creek at Crooked Creek Dam 278 19,800 19,600 1.0 21,700 22,600 4.103039200 1961-78 Clear Run near Buckstown 3.68 401 744 86 470 877 8703040000 1914-36 Stonycreek River at Ferndale 451 38,600 28,300 27 48,400 32,500 3303041000 1940-61 Little Conemaugh River at East Conemaugh 183 14,000 14,300 2.1 15,700 16,500 5.103042000 1952-96 Blacklick Creek at Josephine 192 24,200 14,800 39 30,000 17,100 4303042200 1961-78 Little Yellow Creek near Strongstown 7.36 2,360 1,260 47 3,120 1,480 5303042500 1952-68 Two Lick Creek at Graceton 171 12,900 13,600 5.4 14,800 15,700 6.103043000 1905-51 Blacklick Creek at Blacklick 390 36,800 25,400 31 44,700 29,100 3503045000 1940-84 Loyalhanna Creek at Kingston 172 19,700 13,700 30 24,100 15,700 3503045500 11920-40 Loyalhanna Creek at New Alexandria 265 28,300 18,900 33 35,100 21,800 38
Appendix 5. Flood-flow statistics computed from Log-Pearson distribution of streamflow data and WRI 82-21 regional regression equations for gaged locations onstreams in Pennsylvania—Continued
[WRI 82-21 refers to Flippo, 1982b; ft3/s, cubic feet per second; mi2, is square miles; water year, 12-month period October 1 - September 30]
U.S.Geological
Surveystreamflow-
gaging station
Period ofrecord(wateryear)
Station nameDrainage
area(mi2)
50-year floodflowcomputed
from Log-Pearson
distribution(ft3/s)
50-year floodflow computed
fromWRI 82-21regressionequations
(ft3/s)
Absolutevalue of
percentagedifference
100-year floodflow computed
from Log-Pearson
distribution(ft3/s)
100-year floodflow computed
from WRI 82-21regressionequations 1
(ft3/s)
Absolutevalue of
percentagedifference
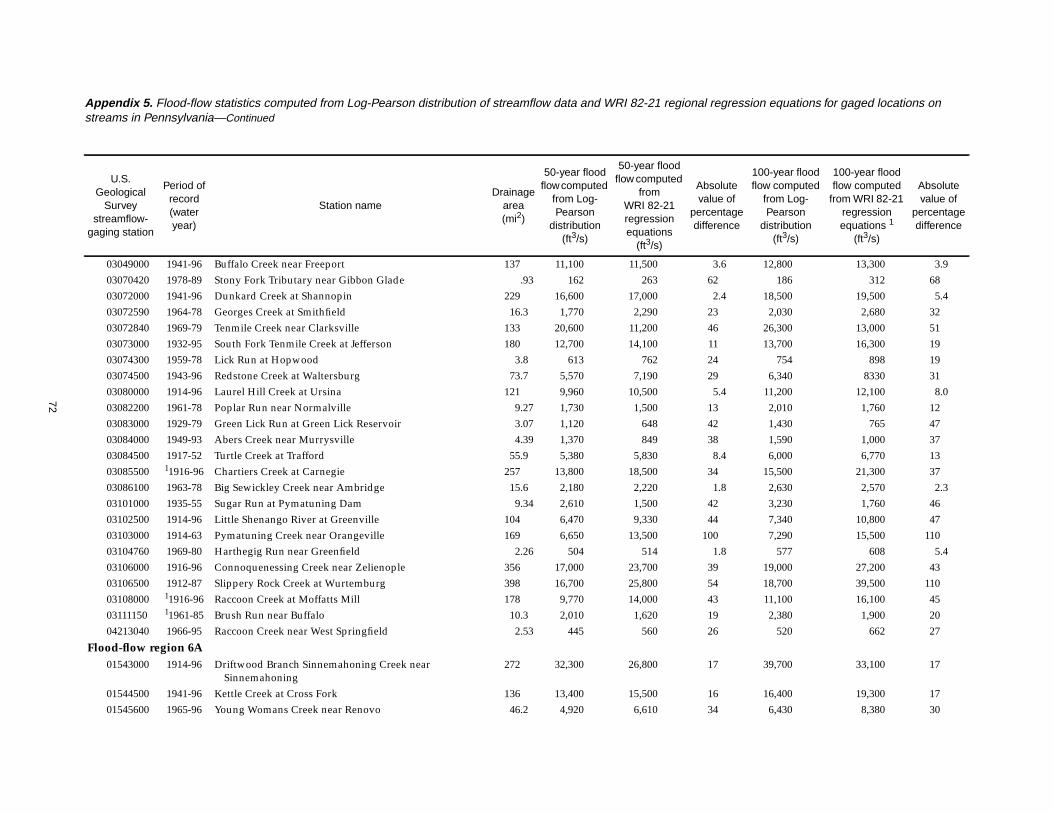
72
03049000 1941-96 Buffalo Creek near Freeport 137 11,100 11,500 3.6 12,800 13,300 3.903070420 1978-89 Stony Fork Tributary near Gibbon Glade .93 162 263 62 186 312 6803072000 1941-96 Dunkard Creek at Shannopin 229 16,600 17,000 2.4 18,500 19,500 5.403072590 1964-78 Georges Creek at Smithfield 16.3 1,770 2,290 23 2,030 2,680 3203072840 1969-79 Tenmile Creek near Clarksville 133 20,600 11,200 46 26,300 13,000 5103073000 1932-95 South Fork Tenmile Creek at Jefferson 180 12,700 14,100 11 13,700 16,300 1903074300 1959-78 Lick Run at Hopwood 3.8 613 762 24 754 898 1903074500 1943-96 Redstone Creek at Waltersburg 73.7 5,570 7,190 29 6,340 8330 3103080000 1914-96 Laurel Hill Creek at Ursina 121 9,960 10,500 5.4 11,200 12,100 8.003082200 1961-78 Poplar Run near Normalville 9.27 1,730 1,500 13 2,010 1,760 1203083000 1929-79 Green Lick Run at Green Lick Reservoir 3.07 1,120 648 42 1,430 765 4703084000 1949-93 Abers Creek near Murrysville 4.39 1,370 849 38 1,590 1,000 3703084500 1917-52 Turtle Creek at Trafford 55.9 5,380 5,830 8.4 6,000 6,770 1303085500 11916-96 Chartiers Creek at Carnegie 257 13,800 18,500 34 15,500 21,300 3703086100 1963-78 Big Sewickley Creek near Ambridge 15.6 2,180 2,220 1.8 2,630 2,570 2.303101000 1935-55 Sugar Run at Pymatuning Dam 9.34 2,610 1,500 42 3,230 1,760 4603102500 1914-96 Little Shenango River at Greenville 104 6,470 9,330 44 7,340 10,800 4703103000 1914-63 Pymatuning Creek near Orangeville 169 6,650 13,500 100 7,290 15,500 11003104760 1969-80 Harthegig Run near Greenfield 2.26 504 514 1.8 577 608 5.403106000 1916-96 Connoquenessing Creek near Zelienople 356 17,000 23,700 39 19,000 27,200 4303106500 1912-87 Slippery Rock Creek at Wurtemburg 398 16,700 25,800 54 18,700 39,500 11003108000 11916-96 Raccoon Creek at Moffatts Mill 178 9,770 14,000 43 11,100 16,100 4503111150 11961-85 Brush Run near Buffalo 10.3 2,010 1,620 19 2,380 1,900 2004213040 1966-95 Raccoon Creek near West Springfield 2.53 445 560 26 520 662 27
Flood-flow region 6A01543000 1914-96 Driftwood Branch Sinnemahoning Creek near
Sinnemahoning272 32,300 26,800 17 39,700 33,100 17
01544500 1941-96 Kettle Creek at Cross Fork 136 13,400 15,500 16 16,400 19,300 1701545600 1965-96 Young Womans Creek near Renovo 46.2 4,920 6,610 34 6,430 8,380 30
Appendix 5. Flood-flow statistics computed from Log-Pearson distribution of streamflow data and WRI 82-21 regional regression equations for gaged locations onstreams in Pennsylvania—Continued
[WRI 82-21 refers to Flippo, 1982b; ft3/s, cubic feet per second; mi2, is square miles; water year, 12-month period October 1 - September 30]
U.S.Geological
Surveystreamflow-
gaging station
Period ofrecord(wateryear)
Station nameDrainage
area(mi2)
50-year floodflowcomputed
from Log-Pearson
distribution(ft3/s)
50-year floodflow computed
fromWRI 82-21regressionequations
(ft3/s)
Absolutevalue of
percentagedifference
100-year floodflow computed
from Log-Pearson
distribution(ft3/s)
100-year floodflow computed
from WRI 82-21regressionequations 1
(ft3/s)
Absolutevalue of
percentagedifference
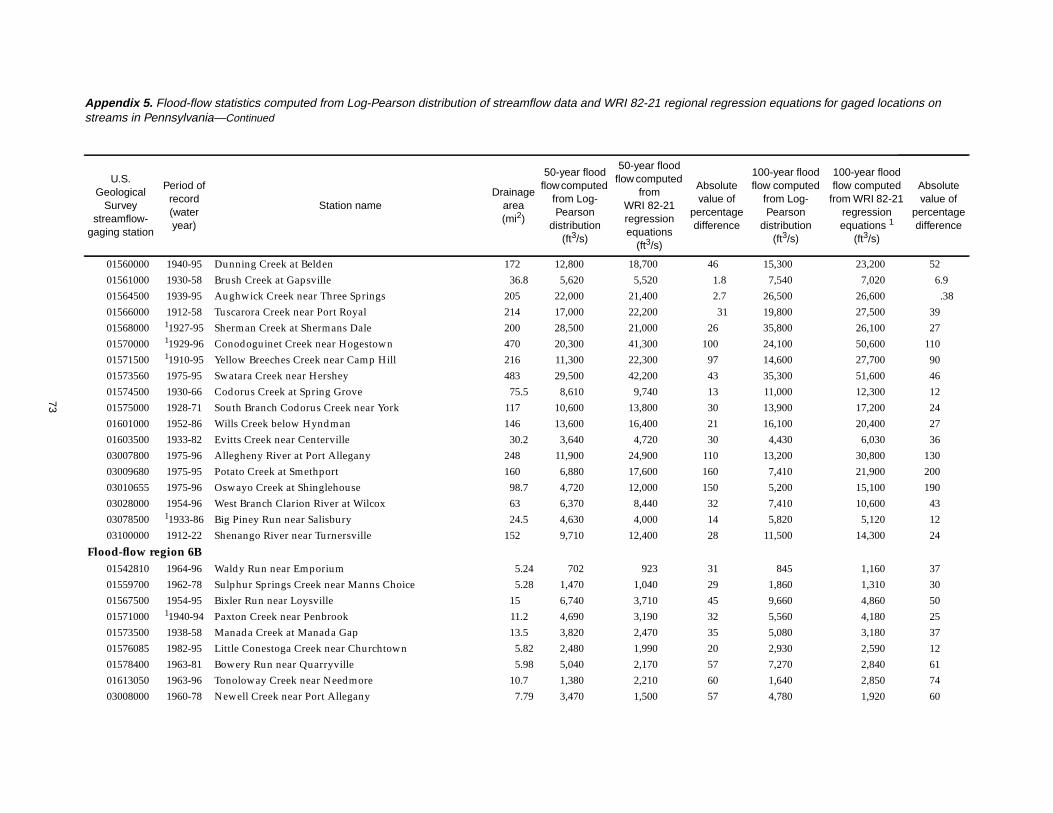
73
01560000 1940-95 Dunning Creek at Belden 172 12,800 18,700 46 15,300 23,200 5201561000 1930-58 Brush Creek at Gapsville 36.8 5,620 5,520 1.8 7,540 7,020 6.901564500 1939-95 Aughwick Creek near Three Springs 205 22,000 21,400 2.7 26,500 26,600 .3801566000 1912-58 Tuscarora Creek near Port Royal 214 17,000 22,200 31 19,800 27,500 3901568000 11927-95 Sherman Creek at Shermans Dale 200 28,500 21,000 26 35,800 26,100 2701570000 11929-96 Conodoguinet Creek near Hogestown 470 20,300 41,300 100 24,100 50,600 11001571500 11910-95 Yellow Breeches Creek near Camp Hill 216 11,300 22,300 97 14,600 27,700 9001573560 1975-95 Swatara Creek near Hershey 483 29,500 42,200 43 35,300 51,600 4601574500 1930-66 Codorus Creek at Spring Grove 75.5 8,610 9,740 13 11,000 12,300 1201575000 1928-71 South Branch Codorus Creek near York 117 10,600 13,800 30 13,900 17,200 2401601000 1952-86 Wills Creek below Hyndman 146 13,600 16,400 21 16,100 20,400 2701603500 1933-82 Evitts Creek near Centerville 30.2 3,640 4,720 30 4,430 6,030 3603007800 1975-96 Allegheny River at Port Allegany 248 11,900 24,900 110 13,200 30,800 13003009680 1975-95 Potato Creek at Smethport 160 6,880 17,600 160 7,410 21,900 20003010655 1975-96 Oswayo Creek at Shinglehouse 98.7 4,720 12,000 150 5,200 15,100 19003028000 1954-96 West Branch Clarion River at Wilcox 63 6,370 8,440 32 7,410 10,600 4303078500 11933-86 Big Piney Run near Salisbury 24.5 4,630 4,000 14 5,820 5,120 1203100000 1912-22 Shenango River near Turnersville 152 9,710 12,400 28 11,500 14,300 24
Flood-flow region 6B01542810 1964-96 Waldy Run near Emporium 5.24 702 923 31 845 1,160 3701559700 1962-78 Sulphur Springs Creek near Manns Choice 5.28 1,470 1,040 29 1,860 1,310 3001567500 1954-95 Bixler Run near Loysville 15 6,740 3,710 45 9,660 4,860 5001571000 11940-94 Paxton Creek near Penbrook 11.2 4,690 3,190 32 5,560 4,180 2501573500 1938-58 Manada Creek at Manada Gap 13.5 3,820 2,470 35 5,080 3,180 3701576085 1982-95 Little Conestoga Creek near Churchtown 5.82 2,480 1,990 20 2,930 2,590 1201578400 1963-81 Bowery Run near Quarryville 5.98 5,040 2,170 57 7,270 2,840 6101613050 1963-96 Tonoloway Creek near Needmore 10.7 1,380 2,210 60 1,640 2,850 7403008000 1960-78 Newell Creek near Port Allegany 7.79 3,470 1,500 57 4,780 1,920 60
Appendix 5. Flood-flow statistics computed from Log-Pearson distribution of streamflow data and WRI 82-21 regional regression equations for gaged locations onstreams in Pennsylvania—Continued
[WRI 82-21 refers to Flippo, 1982b; ft3/s, cubic feet per second; mi2, is square miles; water year, 12-month period October 1 - September 30]
U.S.Geological
Surveystreamflow-
gaging station
Period ofrecord(wateryear)
Station nameDrainage
area(mi2)
50-year floodflowcomputed
from Log-Pearson
distribution(ft3/s)
50-year floodflow computed
fromWRI 82-21regressionequations
(ft3/s)
Absolutevalue of
percentagedifference
100-year floodflow computed
from Log-Pearson
distribution(ft3/s)
100-year floodflow computed
from WRI 82-21regressionequations 1
(ft3/s)
Absolutevalue of
percentagedifference
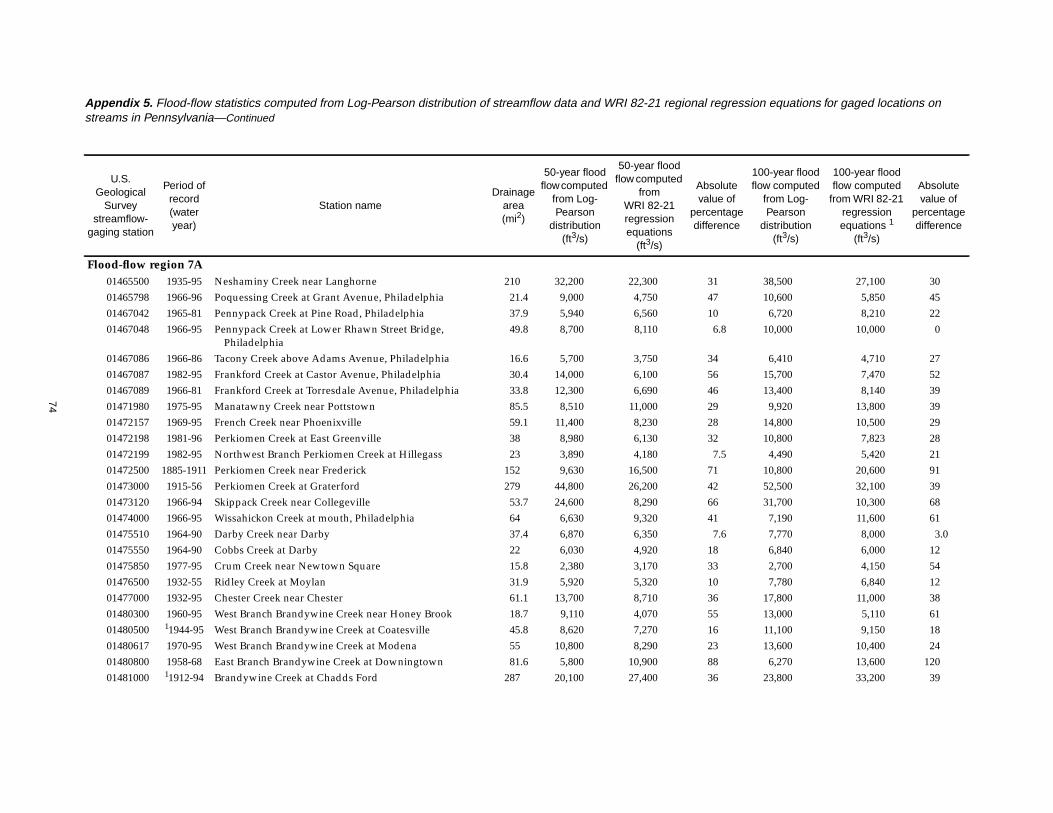
74
Flood-flow region 7A01465500 1935-95 Neshaminy Creek near Langhorne 210 32,200 22,300 31 38,500 27,100 3001465798 1966-96 Poquessing Creek at Grant Avenue, Philadelphia 21.4 9,000 4,750 47 10,600 5,850 4501467042 1965-81 Pennypack Creek at Pine Road, Philadelphia 37.9 5,940 6,560 10 6,720 8,210 2201467048 1966-95 Pennypack Creek at Lower Rhawn Street Bridge,
Philadelphia49.8 8,700 8,110 6.8 10,000 10,000 0
01467086 1966-86 Tacony Creek above Adams Avenue, Philadelphia 16.6 5,700 3,750 34 6,410 4,710 2701467087 1982-95 Frankford Creek at Castor Avenue, Philadelphia 30.4 14,000 6,100 56 15,700 7,470 5201467089 1966-81 Frankford Creek at Torresdale Avenue, Philadelphia 33.8 12,300 6,690 46 13,400 8,140 3901471980 1975-95 Manatawny Creek near Pottstown 85.5 8,510 11,000 29 9,920 13,800 3901472157 1969-95 French Creek near Phoenixville 59.1 11,400 8,230 28 14,800 10,500 2901472198 1981-96 Perkiomen Creek at East Greenville 38 8,980 6,130 32 10,800 7,823 2801472199 1982-95 Northwest Branch Perkiomen Creek at Hillegass 23 3,890 4,180 7.5 4,490 5,420 2101472500 1885-1911 Perkiomen Creek near Frederick 152 9,630 16,500 71 10,800 20,600 9101473000 1915-56 Perkiomen Creek at Graterford 279 44,800 26,200 42 52,500 32,100 3901473120 1966-94 Skippack Creek near Collegeville 53.7 24,600 8,290 66 31,700 10,300 6801474000 1966-95 Wissahickon Creek at mouth, Philadelphia 64 6,630 9,320 41 7,190 11,600 6101475510 1964-90 Darby Creek near Darby 37.4 6,870 6,350 7.6 7,770 8,000 3.001475550 1964-90 Cobbs Creek at Darby 22 6,030 4,920 18 6,840 6,000 1201475850 1977-95 Crum Creek near Newtown Square 15.8 2,380 3,170 33 2,700 4,150 5401476500 1932-55 Ridley Creek at Moylan 31.9 5,920 5,320 10 7,780 6,840 1201477000 1932-95 Chester Creek near Chester 61.1 13,700 8,710 36 17,800 11,000 3801480300 1960-95 West Branch Brandywine Creek near Honey Brook 18.7 9,110 4,070 55 13,000 5,110 6101480500 11944-95 West Branch Brandywine Creek at Coatesville 45.8 8,620 7,270 16 11,100 9,150 1801480617 1970-95 West Branch Brandywine Creek at Modena 55 10,800 8,290 23 13,600 10,400 2401480800 1958-68 East Branch Brandywine Creek at Downingtown 81.6 5,800 10,900 88 6,270 13,600 12001481000 11912-94 Brandywine Creek at Chadds Ford 287 20,100 27,400 36 23,800 33,200 39
Appendix 5. Flood-flow statistics computed from Log-Pearson distribution of streamflow data and WRI 82-21 regional regression equations for gaged locations onstreams in Pennsylvania—Continued
[WRI 82-21 refers to Flippo, 1982b; ft3/s, cubic feet per second; mi2, is square miles; water year, 12-month period October 1 - September 30]
U.S.Geological
Surveystreamflow-
gaging station
Period ofrecord(wateryear)
Station nameDrainage
area(mi2)
50-year floodflowcomputed
from Log-Pearson
distribution(ft3/s)
50-year floodflow computed
fromWRI 82-21regressionequations
(ft3/s)
Absolutevalue of
percentagedifference
100-year floodflow computed
from Log-Pearson
distribution(ft3/s)
100-year floodflow computed
from WRI 82-21regressionequations 1
(ft3/s)
Absolutevalue of
percentagedifference
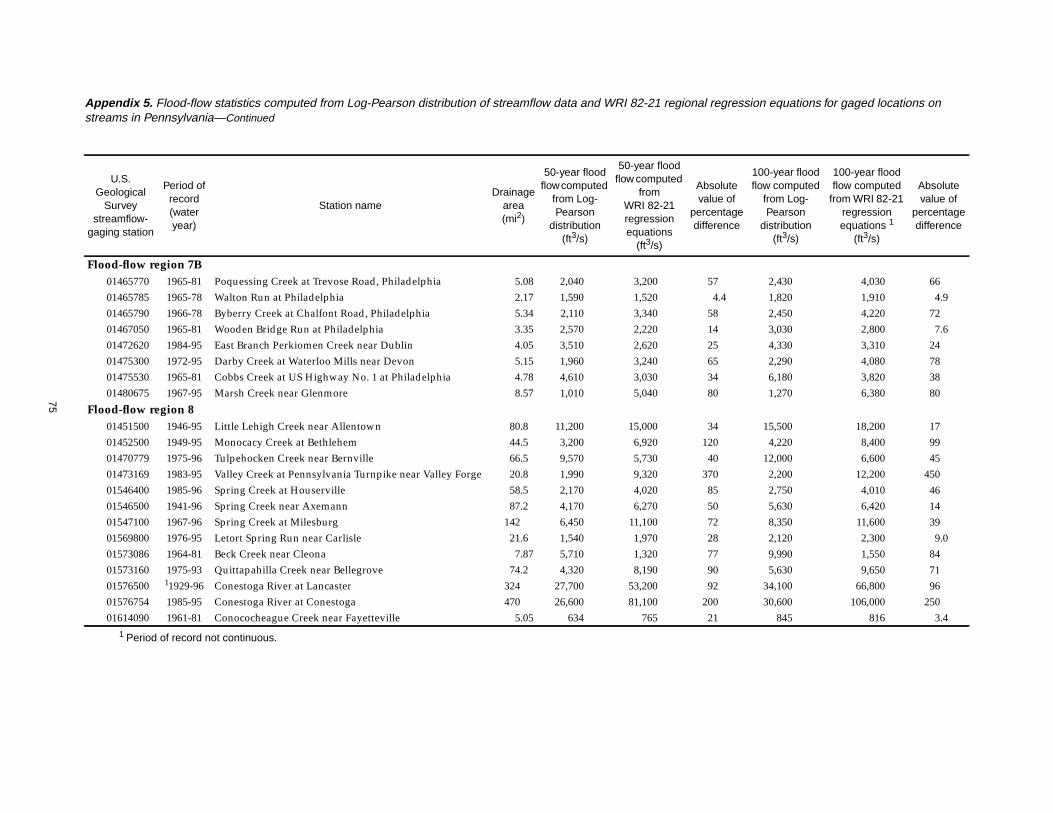
75
Flood-flow region 7B01465770 1965-81 Poquessing Creek at Trevose Road, Philadelphia 5.08 2,040 3,200 57 2,430 4,030 6601465785 1965-78 Walton Run at Philadelphia 2.17 1,590 1,520 4.4 1,820 1,910 4.901465790 1966-78 Byberry Creek at Chalfont Road, Philadelphia 5.34 2,110 3,340 58 2,450 4,220 7201467050 1965-81 Wooden Bridge Run at Philadelphia 3.35 2,570 2,220 14 3,030 2,800 7.601472620 1984-95 East Branch Perkiomen Creek near Dublin 4.05 3,510 2,620 25 4,330 3,310 2401475300 1972-95 Darby Creek at Waterloo Mills near Devon 5.15 1,960 3,240 65 2,290 4,080 7801475530 1965-81 Cobbs Creek at US Highway No. 1 at Philadelphia 4.78 4,610 3,030 34 6,180 3,820 3801480675 1967-95 Marsh Creek near Glenmore 8.57 1,010 5,040 80 1,270 6,380 80
Flood-flow region 801451500 1946-95 Little Lehigh Creek near Allentown 80.8 11,200 15,000 34 15,500 18,200 1701452500 1949-95 Monocacy Creek at Bethlehem 44.5 3,200 6,920 120 4,220 8,400 9901470779 1975-96 Tulpehocken Creek near Bernville 66.5 9,570 5,730 40 12,000 6,600 4501473169 1983-95 Valley Creek at Pennsylvania Turnpike near Valley Forge 20.8 1,990 9,320 370 2,200 12,200 45001546400 1985-96 Spring Creek at Houserville 58.5 2,170 4,020 85 2,750 4,010 4601546500 1941-96 Spring Creek near Axemann 87.2 4,170 6,270 50 5,630 6,420 1401547100 1967-96 Spring Creek at Milesburg 142 6,450 11,100 72 8,350 11,600 3901569800 1976-95 Letort Spring Run near Carlisle 21.6 1,540 1,970 28 2,120 2,300 9.001573086 1964-81 Beck Creek near Cleona 7.87 5,710 1,320 77 9,990 1,550 8401573160 1975-93 Quittapahilla Creek near Bellegrove 74.2 4,320 8,190 90 5,630 9,650 7101576500 11929-96 Conestoga River at Lancaster 324 27,700 53,200 92 34,100 66,800 9601576754 1985-95 Conestoga River at Conestoga 470 26,600 81,100 200 30,600 106,000 25001614090 1961-81 Conococheague Creek near Fayetteville 5.05 634 765 21 845 816 3.4
1 Period of record not continuous.
Appendix 5. Flood-flow statistics computed from Log-Pearson distribution of streamflow data and WRI 82-21 regional regression equations for gaged locations onstreams in Pennsylvania—Continued
[WRI 82-21 refers to Flippo, 1982b; ft3/s, cubic feet per second; mi2, is square miles; water year, 12-month period October 1 - September 30]
U.S.Geological
Surveystreamflow-
gaging station
Period ofrecord(wateryear)
Station nameDrainage
area(mi2)
50-year floodflowcomputed
from Log-Pearson
distribution(ft3/s)
50-year floodflow computed
fromWRI 82-21regressionequations
(ft3/s)
Absolutevalue of
percentagedifference
100-year floodflow computed
from Log-Pearson
distribution(ft3/s)
100-year floodflow computed
from WRI 82-21regressionequations 1
(ft3/s)
Absolutevalue of
percentagedifference
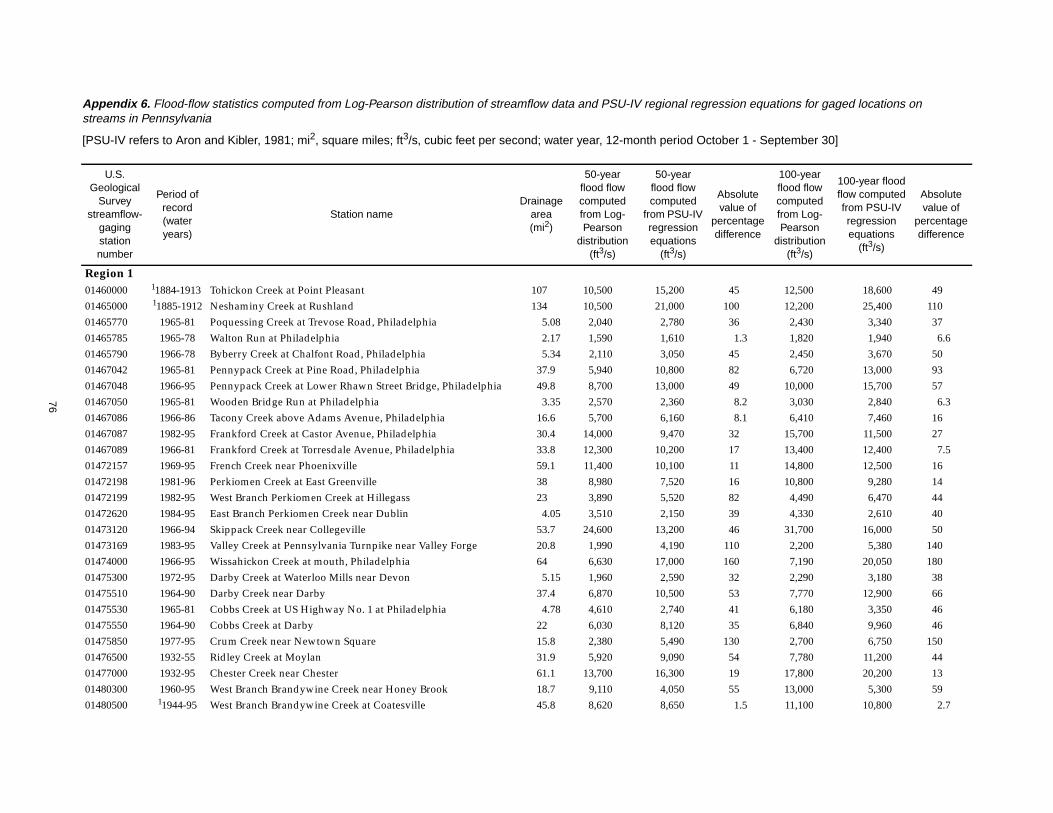
76
Appendix 6. Flood-flow statistics computed from Log-Pearson distribution of streamflow data and PSU-IV regional regression equations for gaged locations onstreams in Pennsylvania
[PSU-IV refers to Aron and Kibler, 1981; mi2, square miles; ft3/s, cubic feet per second; water year, 12-month period October 1 - September 30]
U.S.Geological
Surveystreamflow-
gagingstationnumber
Period ofrecord(wateryears)
Station nameDrainage
area(mi2)
50-yearflood flowcomputedfrom Log-Pearson
distribution(ft3/s)
50-yearflood flowcomputed
from PSU-IVregressionequations
(ft3/s)
Absolutevalue of
percentagedifference
100-yearflood flowcomputedfrom Log-Pearson
distribution(ft3/s)
100-year floodflow computedfrom PSU-IVregressionequations
(ft3/s)
Absolutevalue of
percentagedifference
Region 101460000 11884-1913 Tohickon Creek at Point Pleasant 107 10,500 15,200 45 12,500 18,600 4901465000 11885-1912 Neshaminy Creek at Rushland 134 10,500 21,000 100 12,200 25,400 11001465770 1965-81 Poquessing Creek at Trevose Road, Philadelphia 5.08 2,040 2,780 36 2,430 3,340 3701465785 1965-78 Walton Run at Philadelphia 2.17 1,590 1,610 1.3 1,820 1,940 6.601465790 1966-78 Byberry Creek at Chalfont Road, Philadelphia 5.34 2,110 3,050 45 2,450 3,670 5001467042 1965-81 Pennypack Creek at Pine Road, Philadelphia 37.9 5,940 10,800 82 6,720 13,000 9301467048 1966-95 Pennypack Creek at Lower Rhawn Street Bridge, Philadelphia 49.8 8,700 13,000 49 10,000 15,700 5701467050 1965-81 Wooden Bridge Run at Philadelphia 3.35 2,570 2,360 8.2 3,030 2,840 6.301467086 1966-86 Tacony Creek above Adams Avenue, Philadelphia 16.6 5,700 6,160 8.1 6,410 7,460 1601467087 1982-95 Frankford Creek at Castor Avenue, Philadelphia 30.4 14,000 9,470 32 15,700 11,500 2701467089 1966-81 Frankford Creek at Torresdale Avenue, Philadelphia 33.8 12,300 10,200 17 13,400 12,400 7.501472157 1969-95 French Creek near Phoenixville 59.1 11,400 10,100 11 14,800 12,500 1601472198 1981-96 Perkiomen Creek at East Greenville 38 8,980 7,520 16 10,800 9,280 1401472199 1982-95 West Branch Perkiomen Creek at Hillegass 23 3,890 5,520 82 4,490 6,470 4401472620 1984-95 East Branch Perkiomen Creek near Dublin 4.05 3,510 2,150 39 4,330 2,610 4001473120 1966-94 Skippack Creek near Collegeville 53.7 24,600 13,200 46 31,700 16,000 5001473169 1983-95 Valley Creek at Pennsylvania Turnpike near Valley Forge 20.8 1,990 4,190 110 2,200 5,380 14001474000 1966-95 Wissahickon Creek at mouth, Philadelphia 64 6,630 17,000 160 7,190 20,050 18001475300 1972-95 Darby Creek at Waterloo Mills near Devon 5.15 1,960 2,590 32 2,290 3,180 3801475510 1964-90 Darby Creek near Darby 37.4 6,870 10,500 53 7,770 12,900 6601475530 1965-81 Cobbs Creek at US Highway No. 1 at Philadelphia 4.78 4,610 2,740 41 6,180 3,350 4601475550 1964-90 Cobbs Creek at Darby 22 6,030 8,120 35 6,840 9,960 4601475850 1977-95 Crum Creek near Newtown Square 15.8 2,380 5,490 130 2,700 6,750 15001476500 1932-55 Ridley Creek at Moylan 31.9 5,920 9,090 54 7,780 11,200 4401477000 1932-95 Chester Creek near Chester 61.1 13,700 16,300 19 17,800 20,200 1301480300 1960-95 West Branch Brandywine Creek near Honey Brook 18.7 9,110 4,050 55 13,000 5,300 5901480500 11944-95 West Branch Brandywine Creek at Coatesville 45.8 8,620 8,650 1.5 11,100 10,800 2.7

77
01480675 1967-95 Marsh Creek near Glenmore 8.57 1,010 2,440 140 1,270 3,020 14001480800 1958-68 East Branch Brandywine Creek at Downingtown 81.6 5,800 11,100 91 6,270 13,900 12001576085 1982-95 Little Conestoga Creek near Churchtown 5.82 2,480 2,180 12 2,930 2,800 4.401578400 1963-81 Bowery Run near Quarryville 5.98 5,040 2,130 58 7,270 2,770 62
Region 201446600 1961-76 Martins Creek neat East Bangor 10.4 2,120 931 56 2,700 1,120 5901447500 1944-96 Lehigh River at Stoddardtsville 91.7 13,200 5,600 58 17,700 6,870 6101447680 1965-96 Tunkhannock Creek near Long Pond 18.0 771 996 29 861 1,210 4101447720 1962-96 Tobyhanna Creek near Blakeslee 118 11,900 6,130 48 14,300 7,480 4801448500 1949-95 Dilldown Creek near Long Pond 2.93 540 405 25 660 495 2501449360 1967-96 Pohopoco Creek at Kresgeville 49.9 2,600 6,200 140 2,930 7,540 16001449500 1941-58 Wild Creek at Hatchery 16.8 3,280 2,050 38 4,340 2,520 4201450500 1940-96 Aquashicola Creek at Palmerton 76.7 9,080 7,580 17 11,300 9,250 1801451500 1946-95 Little Lehigh Creek near Allentown 80.8 11,200 8,530 24 15,500 11,000 2901451800 1967-95 Jordan Creek near Schnecksville 53 8,160 7,320 10 9,960 9,150 8.101452000 1945-95 Jordan Creek at Allentown 75.8 12,300 10,400 15 15,600 13,100 1601452500 1949-95 Monocacy Creek at Bethlehem 44.5 3,200 6,600 110 4,220 11,500 17001467500 11948-94 Schuylkill River at Pottsville 53.4 6,140 6,250 1.8 7,580 7,950 4.901468500 1973-96 Schuylkill River at Landingville 133 11,400 16,300 43 14,000 20,700 4801469500 1920-96 Little Schuylkill River at Tamaqua 42.9 5,270 4,940 6.3 6,200 6,220 .301470720 1962-80 Maiden Creek Tributary at Lenhartsville 7.46 2,600 1,520 42 3,340 1,900 4301470779 1975-96 Tulpehocken Creek near Bernville 66.5 9,570 7,170 25 12,000 9,680 1901470853 1983-95 Furnace Creek at Robesonia 4.18 766 810 5.7 894 1,030 1501471980 1975-95 Manatawny Creek near Pottstown 85.5 8,510 7,930 6.8 9,920 9,960 .501537500 1940-90 Solomon Creek at Wilkes-Barre 15.7 2,470 3,060 24 3,070 3,760 2201538000 1920-96 Wapwallopen Creek near Wapwallopen 43.8 4,050 5,620 39 4,810 6,960 4501540200 1959-79 Trexler Run near Ringtown 1.77 457 396 13 638 506 2101541308 1968-79 Bradley Run near Ashville 6.77 912 1,090 20 1,070 1,320 24
Appendix 6. Flood-flow statistics computed from Log-Pearson distribution of streamflow data and PSU-IV regional regression equations for gaged locations onstreams in Pennsylvania—Continued
[PSU-IV refers to Aron and Kibler, 1981; mi2, square miles; ft3/s, cubic feet per second; water year, 12-month period October 1 - September 30]
U.S.Geological
Surveystreamflow-
gagingstationnumber
Period ofrecord(wateryears)
Station nameDrainage
area(mi2)
50-yearflood flowcomputedfrom Log-Pearson
distribution(ft3/s)
50-yearflood flowcomputed
from PSU-IVregressionequations
(ft3/s)
Absolutevalue of
percentagedifference
100-yearflood flowcomputedfrom Log-Pearson
distribution(ft3/s)
100-year floodflow computedfrom PSU-IVregressionequations
(ft3/s)
Absolutevalue of
percentagedifference
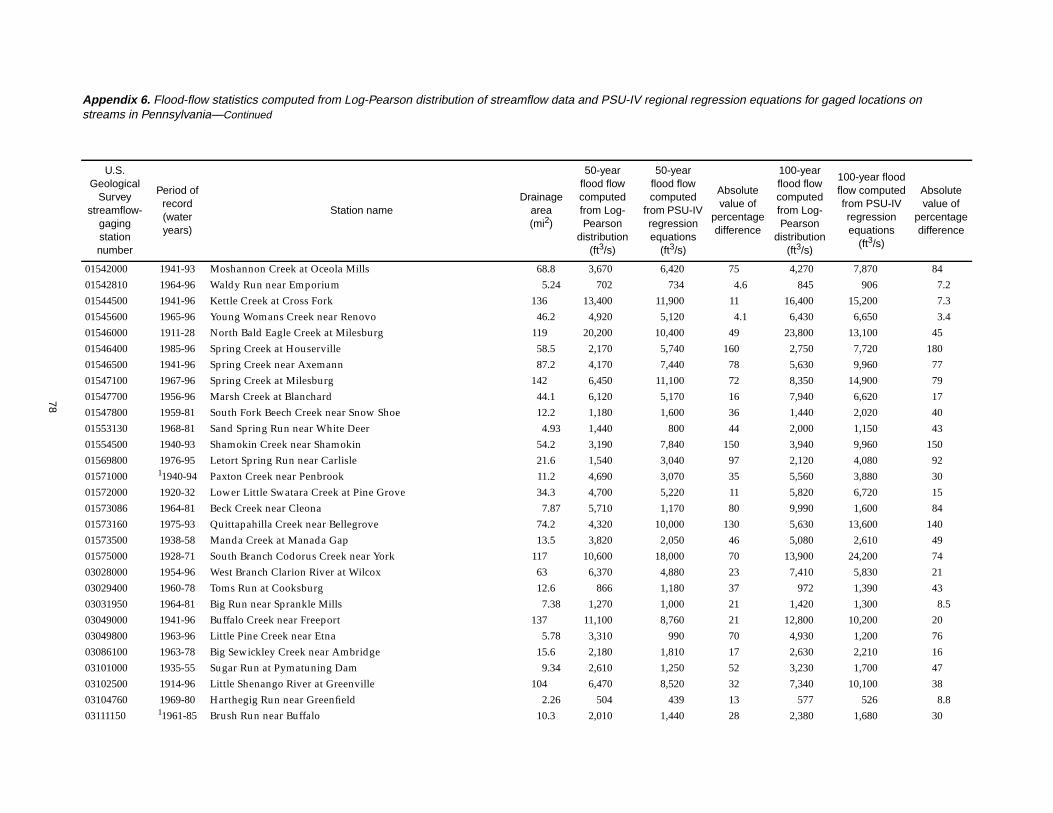
78
01542000 1941-93 Moshannon Creek at Oceola Mills 68.8 3,670 6,420 75 4,270 7,870 8401542810 1964-96 Waldy Run near Emporium 5.24 702 734 4.6 845 906 7.201544500 1941-96 Kettle Creek at Cross Fork 136 13,400 11,900 11 16,400 15,200 7.301545600 1965-96 Young Womans Creek near Renovo 46.2 4,920 5,120 4.1 6,430 6,650 3.401546000 1911-28 North Bald Eagle Creek at Milesburg 119 20,200 10,400 49 23,800 13,100 4501546400 1985-96 Spring Creek at Houserville 58.5 2,170 5,740 160 2,750 7,720 18001546500 1941-96 Spring Creek near Axemann 87.2 4,170 7,440 78 5,630 9,960 7701547100 1967-96 Spring Creek at Milesburg 142 6,450 11,100 72 8,350 14,900 7901547700 1956-96 Marsh Creek at Blanchard 44.1 6,120 5,170 16 7,940 6,620 1701547800 1959-81 South Fork Beech Creek near Snow Shoe 12.2 1,180 1,600 36 1,440 2,020 4001553130 1968-81 Sand Spring Run near White Deer 4.93 1,440 800 44 2,000 1,150 4301554500 1940-93 Shamokin Creek near Shamokin 54.2 3,190 7,840 150 3,940 9,960 15001569800 1976-95 Letort Spring Run near Carlisle 21.6 1,540 3,040 97 2,120 4,080 9201571000 11940-94 Paxton Creek near Penbrook 11.2 4,690 3,070 35 5,560 3,880 3001572000 1920-32 Lower Little Swatara Creek at Pine Grove 34.3 4,700 5,220 11 5,820 6,720 1501573086 1964-81 Beck Creek near Cleona 7.87 5,710 1,170 80 9,990 1,600 8401573160 1975-93 Quittapahilla Creek near Bellegrove 74.2 4,320 10,000 130 5,630 13,600 14001573500 1938-58 Manda Creek at Manada Gap 13.5 3,820 2,050 46 5,080 2,610 4901575000 1928-71 South Branch Codorus Creek near York 117 10,600 18,000 70 13,900 24,200 7403028000 1954-96 West Branch Clarion River at Wilcox 63 6,370 4,880 23 7,410 5,830 2103029400 1960-78 Toms Run at Cooksburg 12.6 866 1,180 37 972 1,390 4303031950 1964-81 Big Run near Sprankle Mills 7.38 1,270 1,000 21 1,420 1,300 8.503049000 1941-96 Buffalo Creek near Freeport 137 11,100 8,760 21 12,800 10,200 2003049800 1963-96 Little Pine Creek near Etna 5.78 3,310 990 70 4,930 1,200 7603086100 1963-78 Big Sewickley Creek near Ambridge 15.6 2,180 1,810 17 2,630 2,210 1603101000 1935-55 Sugar Run at Pymatuning Dam 9.34 2,610 1,250 52 3,230 1,700 4703102500 1914-96 Little Shenango River at Greenville 104 6,470 8,520 32 7,340 10,100 3803104760 1969-80 Harthegig Run near Greenfield 2.26 504 439 13 577 526 8.803111150 11961-85 Brush Run near Buffalo 10.3 2,010 1,440 28 2,380 1,680 30
Appendix 6. Flood-flow statistics computed from Log-Pearson distribution of streamflow data and PSU-IV regional regression equations for gaged locations onstreams in Pennsylvania—Continued
[PSU-IV refers to Aron and Kibler, 1981; mi2, square miles; ft3/s, cubic feet per second; water year, 12-month period October 1 - September 30]
U.S.Geological
Surveystreamflow-
gagingstationnumber
Period ofrecord(wateryears)
Station nameDrainage
area(mi2)
50-yearflood flowcomputedfrom Log-Pearson
distribution(ft3/s)
50-yearflood flowcomputed
from PSU-IVregressionequations
(ft3/s)
Absolutevalue of
percentagedifference
100-yearflood flowcomputedfrom Log-Pearson
distribution(ft3/s)
100-year floodflow computedfrom PSU-IVregressionequations
(ft3/s)
Absolutevalue of
percentagedifference

79
Region 301428750 1975-96 West Branch Lackawaxen River near Aldenville 40.6 4,850 4,720 2.7 5,440 5,620 3.301429000 1945-60 West Branch Lackawaxen River at Prompton 59.7 6,990 6,610 5.4 8,030 7,880 1.901429500 1944-59 Dyberry Creek near Honesdale 64.6 16,600 6,570 60 21,500 7,810 6401431000 1945-85 Middle Creek near Hawley 78.4 9,260 6,280 32 11,200 7,650 3201439500 1909-96 Bush Kill at Shoemakers 117 8,010 9,030 13 10,300 10,800 4.901440400 1957-96 Brodhead Creek at Analomink 65.9 11,000 7,050 36 13,300 8,520 3601441000 1911-38 McMichaels Creek at Stroudsburg 65.3 3,770 8,770 130 4,260 10,600 15001516500 1955-96 Corey Creek near Mainesburg 12.2 4,450 2,460 45 5,870 3,000 4901517000 1955-78 Elk Run near Mainesburg 10.2 2,740 2,090 24 3,520 2,540 2801518500 1954-74 Crooked Creek at Tioga 122 15,600 15,200 2.6 19,700 18,400 6.601518862 1984-96 Cowanesque River at Westfield 90.6 19,800 12,200 38 24,500 14,800 4001532850 1960-79 Middle Branch Wyalusing Creek Tributary near Birchardsville 5.67 1,770 1,110 37 2,150 1,330 3801533500 1941-58 North Branch Mehoopany Creek near Lovelton 35.2 14,800 5,520 63 20,000 6,850 6601533950 1961-78 South Branch Tunkhannock Creek near Montdale 12.6 2,320 2,110 9.1 2,700 2,530 6.301534500 1940-59 Lackawanna River at Archbald 108 9,000 9,880 9.8 10,600 11,800 1101539500 1941-58 Little Fishing Creek at Eyers Grove 56.5 4,100 9,760 140 4,510 12,400 17001549500 1941-96 Blockhouse Creek near English Center 37.7 6,560 5,720 13 7,960 7,110 1101549780 1960-78 Larrys Creek at Cogan House 6.8 1,040 1,770 41 1,300 1,850 4201551000 1940-53 Grafius Run at Williamsport 3.14 1,240 1,000 19 1,500 1,300 1301552500 1941-96 Muncy Creek near Sonestown 23.8 7,660 3,860 50 9,600 4,840 5001553600 1960-78 East Branch Chillisquaque Creek near Washingtonville 9.48 4,550 2,580 43 5,970 3,280 4501553700 1980-96 Chillisquaque Creek at Washingtonville 51.3 4,560 10,700 130 5,030 13,600 17003008000 1960-78 Newell Creek near Port Allegany 7.79 3,470 1,640 53 4,780 2,050 5703011800 1966-96 Kinzua Creek near Guffey 46.4 5,340 5,470 2.4 6,500 6,610 1.703015280 1963-79 Jackson Run near North Warren 12.8 812 1,470 81 861 1,660 9303021350 1975-96 French Creek near Wattsburg 92 7,530 9,550 27 8,110 11,200 3803021410 1975-94 West Branch French Creek near Lowville 52.3 7,690 6,210 19 8,870 7,340 17
Appendix 6. Flood-flow statistics computed from Log-Pearson distribution of streamflow data and PSU-IV regional regression equations for gaged locations onstreams in Pennsylvania—Continued
[PSU-IV refers to Aron and Kibler, 1981; mi2, square miles; ft3/s, cubic feet per second; water year, 12-month period October 1 - September 30]
U.S.Geological
Surveystreamflow-
gagingstationnumber
Period ofrecord(wateryears)
Station nameDrainage
area(mi2)
50-yearflood flowcomputedfrom Log-Pearson
distribution(ft3/s)
50-yearflood flowcomputed
from PSU-IVregressionequations
(ft3/s)
Absolutevalue of
percentagedifference
100-yearflood flowcomputedfrom Log-Pearson
distribution(ft3/s)
100-year floodflow computedfrom PSU-IVregressionequations
(ft3/s)
Absolutevalue of
percentagedifference
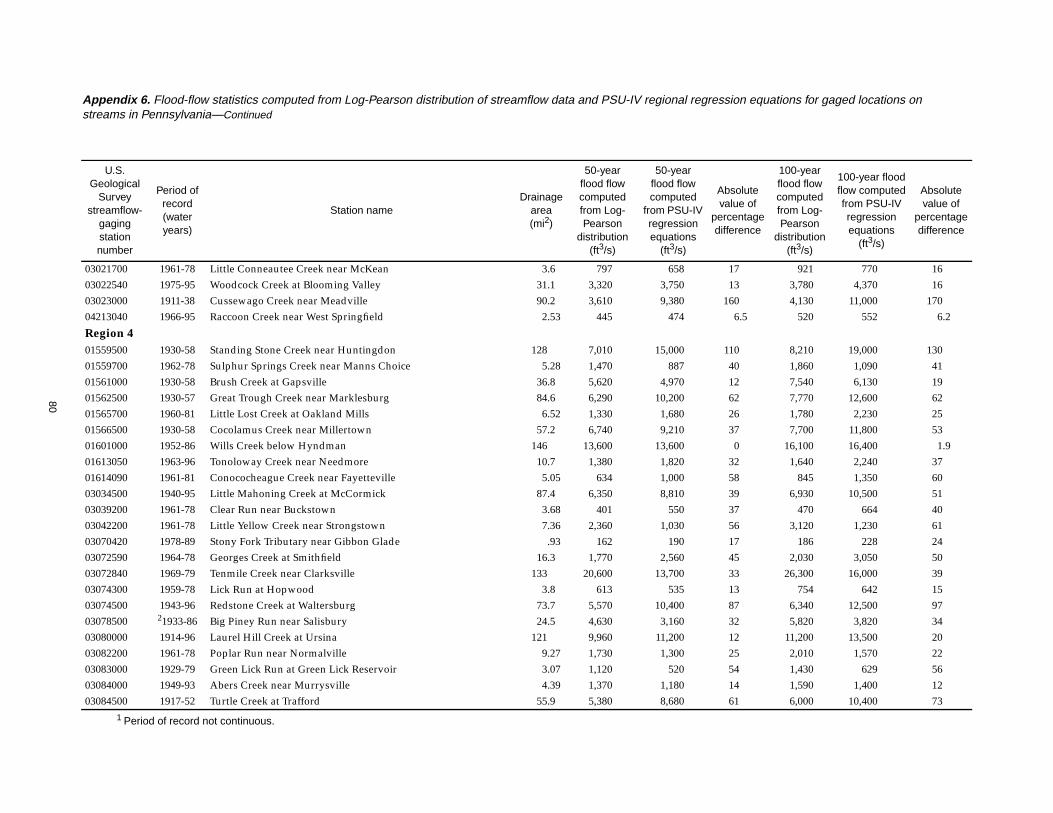
80
03021700 1961-78 Little Conneautee Creek near McKean 3.6 797 658 17 921 770 1603022540 1975-95 Woodcock Creek at Blooming Valley 31.1 3,320 3,750 13 3,780 4,370 1603023000 1911-38 Cussewago Creek near Meadville 90.2 3,610 9,380 160 4,130 11,000 17004213040 1966-95 Raccoon Creek near West Springfield 2.53 445 474 6.5 520 552 6.2
Region 401559500 1930-58 Standing Stone Creek near Huntingdon 128 7,010 15,000 110 8,210 19,000 13001559700 1962-78 Sulphur Springs Creek near Manns Choice 5.28 1,470 887 40 1,860 1,090 4101561000 1930-58 Brush Creek at Gapsville 36.8 5,620 4,970 12 7,540 6,130 1901562500 1930-57 Great Trough Creek near Marklesburg 84.6 6,290 10,200 62 7,770 12,600 6201565700 1960-81 Little Lost Creek at Oakland Mills 6.52 1,330 1,680 26 1,780 2,230 2501566500 1930-58 Cocolamus Creek near Millertown 57.2 6,740 9,210 37 7,700 11,800 5301601000 1952-86 Wills Creek below Hyndman 146 13,600 13,600 0 16,100 16,400 1.901613050 1963-96 Tonoloway Creek near Needmore 10.7 1,380 1,820 32 1,640 2,240 3701614090 1961-81 Conococheague Creek near Fayetteville 5.05 634 1,000 58 845 1,350 6003034500 1940-95 Little Mahoning Creek at McCormick 87.4 6,350 8,810 39 6,930 10,500 5103039200 1961-78 Clear Run near Buckstown 3.68 401 550 37 470 664 4003042200 1961-78 Little Yellow Creek near Strongstown 7.36 2,360 1,030 56 3,120 1,230 6103070420 1978-89 Stony Fork Tributary near Gibbon Glade .93 162 190 17 186 228 2403072590 1964-78 Georges Creek at Smithfield 16.3 1,770 2,560 45 2,030 3,050 5003072840 1969-79 Tenmile Creek near Clarksville 133 20,600 13,700 33 26,300 16,000 3903074300 1959-78 Lick Run at Hopwood 3.8 613 535 13 754 642 1503074500 1943-96 Redstone Creek at Waltersburg 73.7 5,570 10,400 87 6,340 12,500 9703078500 21933-86 Big Piney Run near Salisbury 24.5 4,630 3,160 32 5,820 3,820 3403080000 1914-96 Laurel Hill Creek at Ursina 121 9,960 11,200 12 11,200 13,500 2003082200 1961-78 Poplar Run near Normalville 9.27 1,730 1,300 25 2,010 1,570 2203083000 1929-79 Green Lick Run at Green Lick Reservoir 3.07 1,120 520 54 1,430 629 5603084000 1949-93 Abers Creek near Murrysville 4.39 1,370 1,180 14 1,590 1,400 1203084500 1917-52 Turtle Creek at Trafford 55.9 5,380 8,680 61 6,000 10,400 73
1 Period of record not continuous.
Appendix 6. Flood-flow statistics computed from Log-Pearson distribution of streamflow data and PSU-IV regional regression equations for gaged locations onstreams in Pennsylvania—Continued
[PSU-IV refers to Aron and Kibler, 1981; mi2, square miles; ft3/s, cubic feet per second; water year, 12-month period October 1 - September 30]
U.S.Geological
Surveystreamflow-
gagingstationnumber
Period ofrecord(wateryears)
Station nameDrainage
area(mi2)
50-yearflood flowcomputedfrom Log-Pearson
distribution(ft3/s)
50-yearflood flowcomputed
from PSU-IVregressionequations
(ft3/s)
Absolutevalue of
percentagedifference
100-yearflood flowcomputedfrom Log-Pearson
distribution(ft3/s)
100-year floodflow computedfrom PSU-IVregressionequations
(ft3/s)
Absolutevalue of
percentagedifference
Copyright © 2022 FDOKUMEN