Multivariate streamflow forecasting using independent component analysis
Upload
khangminh22Category
view
0download
0
Journal
Journal of Hydrology 199 (1997) 360-377
Streamflow responses to afforestation with EucaZypfus grundis and Pinus putuZu and to felling in the Mokobulaan experimental
catchments, South Africa
David F. Scott*, W. Lesch Jonkershoek Foresrry Research Centre, CUR, PO Box 320, Stellenbosch 7599, South Africa
Received 26 June 1996,‘accepted 3 December 19%
The reductions in streamiIow following the afforestation of grassland with Eucalyptus grands and Pinus pun& in the Mokobulaan research catchments on the Mpumalanga escarpment, and the subsequent response in streamflow to cleat-felling of the eucalypts are presented. Afforestation with eucalypts of an entire catchment with a virgin annual runoff of 236 mm, caused a statistically significant decrease in streamflow in the third year after planting and the stream dried up completely in the ninth year after planting. The eucalypts were clearfelled when 16 years old but full perennial streamflow did not return until five years later. Afforestation with pines of an entire catchment with a virgin annual runoff of 217 mm, produced a significant decrease in streamflow in the fourth year after planting and caused the stream to dry up completely in the twelfth year after planting.
The drying up of the streams was not altogether surprising as the annual runoff was lower than the expected reductions owing to complete afforestation. The delayed return of streamflow in the clearfelled catchment is surprising though, and is attributed to the desiccation of deep, soil-water stores by the eucalypts. These stores had to be replenished before the streams could return to normal behaviour. Q 1997 Elsevier Science B.V.
Keywords: Afforestation; Eucalyptus grandis; Pinus pat&; Streamflow; Clearfelled catchment
1. Introduction
Catchment experiments in a range of climatic zones around the world have shown that forests use more water than short vegetation on the same site. For pine and eucalypt forests this difference has been estimated to be 300400 mm yr-’ (Bosch and Hewlett, 1982).
* Corresponding author. Tel.: +27 21 8875101; fax: +27 21 8875142, e-mail: [email protected]
0022-1694/97/S17.00 0 1997- Elsevier Science B.V. All rights reserved PII SOO22-1694(96)03336-7

D.F. Scott, W. LescW.loumai of Hydrology 199 (1997) 360-377 361
Rejwblic of South Aftica
Mokobuhan
- - - Catchment Boundary - Se-Road Y Weir a Rain Gauge w** Indigenous Forest
Fig. 1. The location of the Mokobulaan research Wchments.

362 D.F. Scott, W. LescWJoumal of Hydrology 199 (1997) 360-377
South Africa is dependent for its wood on artificially established pine and eucalypt planta- tions that are restricted to the limited parts of the country where rainfall exceeds 700 mm yr-‘. The effect of afforestation on water yields from these humid uplands puts forestry in competition with downstream water users and this competition is an important water resource issue in the country. Consequently, the water-use characteristics of timber plantations have received considerable research attention this century.
The afforestation experiment at Mokobulaan was initiated in 1956 to provide informa- tion on the comparative effects of afforestation with pine and eucalypts on water supplies on the subtropical eastern escarpment of South Africa. It serves as a supplement to similar long-term hydrological studies in the Western Cape Province (Jonkershoek), KwaZulu- Natal Province (Cathedral Peak) and Northern Province (Westfalia). Wicht (1976) and Van Lill et al. (1980) reported early results of the Mokobulaan experiments using data up to and including the hydrological year of 1976/1977. This study complements the study of Van Lill et al. (1980) and brings this experiment up to date, looking at the relative effects of the two timber species and at the clearfelling of the eucalypts on the streamflow.
2. Description of the experimental area
The Mokobulaan research catchments (25“17’S, 30’34’E) are in the Uitsoek State Forest on the Drakensberg escarpment, 48 km west-northwest of Nelsptuit (Fig. 1). Full descriptions of the climate, geology, soils, vegetation and treatments are given in NBnni (1971). The climate is subtropical with more that 80% of the average annual rainfall of 1167 mm falling within the summer months of October to March. Mean annual A-pan evaporation at the nearby Uitsoek forest station is 1723 mm (Midgley et al., 1994). Streams draining from the experimental area flow into the Houtbosloop River, which is a tributary of the Crocodile River. The average runoff to rainfall ratio is 0.18 for the research area. The relationship between the annual rainfall and runoff for the untreated catchment is illustrated in Fig. 2.
B 7W1
Fig. 2. ‘I%e recorded annual rainfall and runoff in the control catchment, Catchment C, Mokobulaan (hydrological year is Cktober to September).

D.F. Scott, W. LescWJoumal of Hydrology 199 (1997) 360-377 363
Basal shales from the Daspoort Formation of the Pretoria Group (Early Proterozoic Transvaal Supergroup) underlie the experimental area. The shales in the catchments are highly arenaceous, with bands of sandstone and quart&e grading into shale. A number of diabase dykes run across the catchments with a predominant strike of northeast to south- west. The shale beds dip gently 2-4” west. The bedrock is generally broken, semi- weathered and permeable to roots and water. This is necessary for plant growth for the soil is only a few centimetres deep (N&nni, 197 1). Deep drilling in Mokobulaan revealed that the shales are broken to 30 m below the surface and rooting is thought to be possible for much of this depth (Dye and Poulter, 1991).
The original vegetation of the catchments is sub-climax grassland, Acocks’ (Acocks, 1975) Veld Type 8, North-Eastern Mountain Sourveld, maintained by regular burning and grazing. This excludes strips or patches along each stream where evergreen, indigenous forest communities have developed. Some physical features of the catchments are given in Table 1.
3. Treatments
The Mokobulaan experiment was established in 1956 with the measurement of rainfall and streamflow in three gauged catchments. The study was designed as a paired catchment experiment, where the hydrology of a treated catchment is compared to that of an adjacent control catchment with similar physical characteristics.
In February 1969, the planting of Catchment A to Eucalyptus grands at a density of 1370 stems per hectare was completed. The entire catchment was afforesmd, including the riparian zone. Trees were planted by establishing transplants in pits dug at 2.7 m intervals (Van Lill et al., 1980). The trees were thinned to 750 stems per hectare in 1974,418 stems per hectare in 1979 and 250 stems per hectare in 1983. The catchment was clear-felled 16 years after planting, the felling being completed in December 1985. The aim following clearfelling was to return the catchment to grassland by keeping regrowth and self-sown eucalypts cut. This could not always be achieved because of vigorous coppicing of the cut stumps, until 1988 when the stumps were poisoned.
Table 1 physical features of the three aautted catchments at Mokobulaan
Catchment AlEa (ha)
Meall elevation (m)
Slope’ MAPb MAR’ (mm) (mm)
A (eucalypts) 26.2 1354 0.23, 1135 244 B (pines) 34.6 13% 0.22 1135 217 C (control) 36.9 1427 0.26 1186 143
The type of afforestation treatment for each catchment is given in parentheses (from Van Lill et al., 1980) ‘Slope is ULYA where I is contour interval (m), L is total length of contour in catchment (m), and A is
catchment area (m’). bMAP is mean annual precipitation; hydrological year is October-September, 1%2- 1991. ‘MAR is mean annual runoff; hydrological year is October-September, A, 1%2-l*, B, 1962-1970; C,
1962-1991.

364 D.F. Scott, W. LescWJoumal of Hydrology 199 (1997) 360-377
Catchment B was afforested to Pinus purulu in January 1971 with the same density and methods as Catchment A, and thinned to 650 stems per hectare in 1979. Here too, the entire cat&rent was afforested. To date, the trees have not been cleat-felled. Catchment C was retained as a grassed control catchment which, until 1970, was grazed by sheep and burnt on an approximately four-year cycle. After the grazing ceased it was burnt biennially in about June. Both land-uses maintained a healthy short grassland, and the water balance of the control would not have been significantly affected by the change in practice.
4. Data collection and analysis
Rainfall was measured at eight sites in the research area, one gauge (no. 7) is at the weather station while six am within the three catchments: numbers 1 and 2 in Catchment A, 3 and 4 in Catchment B, and 5 and 6 in Catchment C. Rain-gauge 8 was erected later
Table 2 Recorded annual rainfall and streamfiow totals (mm) for hydrological years (October-September) in the experi- mental catchments of Mokobulaan
Hydrological Rainfall by rain-g&e number Catchmer;t streamflow Y=
1 2 4 5 6 A B C
1956/57-1971n2’ Mean 1028.2 SD 318.8
1973l74 1350.4 1444.7 1312.0 1327.3 1405.0 %.22 392.46 319.57 1974i75 1171.6 1206.3 1173.5 1201.8 1234.2 23.55 208.06 238.67 1975/76 1527.7 1563.2 1507.4 1453.4 1556.8 61.71 297.44 329.38 1976n7 1257.3 1332.2 1318.3 1289.4 1329.5 -4.12 130.03 193.61 1977rla 1262.5 1368.8 1281.2 1294.8 1386.8 13.76 208.6 1 300.93 197ai79 1051.6 1113.5 1099.3 1033.6 1076.3 0.01 49.16 73.05 1979l80 1072.6 1057.4 1104.1 1079.8 1086.7 0.81 36.51 97.25 1980/81 1180.4 1253.0 1283.1 1233.1 1300.7 0.03 47.45 104.49 1981i82 927.9 966.2 950.6 954.1 1016.1 0.0 19.23 81.56 1982/83 793.1 823.5 796.9 790.9 794.6 0.0 0.0 17.44 1983P34 1344.5 1360.2 1424.3 1392.89 1428.3 0.0 0.0 55.46 1984l85 963.9 967.4 1046.8 1029.3 1080.2 0.0 0.0 51.88 1985l86 1180.8 1227.0 1244.6 1155.2 1179.9 0.0 0.0 32.48 1986l87 1116.5 1163.2 1161.4 1164.1 1158.7 0.0 0.0 11.31 1987188 1194.1 1210.7 1288.7 1299.9 1333.8 0.0 0.0 33.00 1988l89 1043.6 1079.0 1094.9 1082.6 1133.3 0.0 0.0 80.40 1989i90 1174.8 1262.4 1266.9 1193.0 1202.4 8.29 0.0 115.07 199Ol91 1390.4 1411.6 1409.6 1306.7 1002.1 204.5 1 0.0 167.92
Mean 1170.5 1214.7 1207.0 1183.7 1210.3 24.51 84.90 129.32 SD 174.2 184.2 170.6 161.3 181.8 51.15 121.54 102.76
1125.1 1126.8 1163.2 1188.5 236.2 217.3 156.0 186.95 182.2 204.6 201.2 109.4 113.7 95.9
Rain-gauges 1 and 2 are in Catchment A, gauge 4 is in Catchment B and gauges 5 and 6 are in Catchment C ’ From Van Lill et al. (1980)

D.F. Scort, W. LeschlJoumal of Hydrology 199 (1997) 360-377 365
below the weir at Catchment B to replace gauge 3. As the records for neither gauge 3 nor gauge 8 are complete, these are omitted from Table 2. Rainfall depths from three of these gauges (3.4 and 8) were derived from charts generated by Casella recording rain-gauges. Rain-gauge 4 was gauged electronically from 1989. The other gauges were manual gauges, read weekly at first, then after 1989, monthly. Gaps in the rainfall record were patched, where necessary, by using correlations between rain-gauges.
Stream stage heights through sharp-crested compound 90” V-notch weirs were monitored continuously with autographic Belfort water level recorders. After 1986, stage heights were monitored with electronic recorders. Streamllow charts were digitized and streamflow volumes calculated for monthly periods and converted to rainfall equiva- lents (mm). A summary of annual rainfall and streamflow is given by the hydrological year of October-September (Table 2).
Sttearnflow in the treated catchments (A and B) was calibrated against the control Cat&rent C over the pre-afforestation periods: August 1961 -January 1969 for Catchment A and September 1961-December 1970 for Catchment B. Three calibration equations were developed for each treated catchment using monthly streamflow in Catchment C to predict monthly streamflow for annual, wet season (October-March) and dry season (April-September) periods.
Regression models were fitted using the SAS statistical package (SAS Institute, 1985). Predictor variables were monthly streamflow in the control catchment and an index of catchment antecedent wetness. The antecedent wetness index for any month I(AWi) was calculated from monthly rainfall as A Wi = 0.80 (A W&l) + P where P is the monthly rainfall for the catchment, and A Wi_1 is the wetness index for the previous month. The decay factor
Table 3 Details of the calibration models used in the analysis of the monthly streamflow data-sets
Dependent variable
Model Intercept Regression F (00) coefficients
P>F R2
Catchment A Annual sueamflow Wet season streamflow Dry== streamflow Catchment B Annual stIeamflow Wet season streamflow Dry season streamflow
T=Bo+B,C+82
AW
T=t3o+B,C+82
AW
T=Bo+B,C
T=Bo+B,C+82
AW T=Bo+BIC+~~
AW
T=Bo+B,C
4.948 I .363 @ ,) 322.0 0.0001 0.88 0.019 (82)
-13.512 I .322 @ ,) 126.6 O.cKKIl 0.86 0.036 (192)
1.332 1.507 @I) 811.8 O.txJOl 0.95
1.685 0.862 (81) 456.3 O.oool 0.89 0.013 (82)
-1.445 0.817 (81) 160.3 0.0001 0.86 0.020 (82)
5.586 1.106 (81) 711.2 0.0001 0.93
T is streamflow (mm) from treated Catchment (A and B) C is corresponding streamflow (mm) from control Catchment (C) A W is antecedent wetness in&x &J-& are fitted regression coefficients

366 D.F. Scott, W. LescWJoumal of Hydrology 199 (1997) 360-377
of 0.8 was chosen arbitrarily to produce an index that fluctuated around a long term mean and gave a good reflection of seasonal wetness. Monthly rainfall in the treated catchment was also tested, but did not add to the predictive abilities of the models.
There. were two major treatments for Catchment A, one being the period following afforestation (1%9- 1985), and the second the period following clear-felling of the eucalypts (1985-1992). The only treatment analysed at Catchment B was the afforestation with pines (1971-1992).
The dummy variable method was used to test for treatment effects. The F test for the extra sum of squares explained by the resulting full model relative to the reduced model (without the dummy variable and its factors) is a test of the treatment. This method is described fully in Hewlett and Doss (1984) and Hewlett and Bosch (1984). The f-test for entry of the associated predictor term into the model can be shown to be the equivalent of an F-test for the extra sum of squares owing to entry of an additional term into the model (Kleinbaum and Kupper, 1978). Details of the fitted regression models for the calibration period are given in Table 3.
The calibration regression models were used to predict streamflow values for Catchment A for the post&forestation and post-clearfelling periods, and for the post&forestation period in Catchment B. The difference between these predicted (or expected) values and the actual measured values, i.e. the deviations from the calibration relationship,
7Wl 76l77 82l63 Hydrological years
-125 W89
/ m Deviations (mm) ??Deviations (%) 1
Fig. 3. Deviations in annual streamflow abut the calibration model for the eucalypt-afforested Catchment A. The hydrological year is from October to September.

D. F. Scott, W. LescW.loumal of Hydrology 159 (I 997) 360-377 361
??Dewiations (mm) ??Chiations (%)
Fig. 4. Deviations in annual streamflow about the calibration model for the pine-afforested Catchment B. The hydrological year is from October to September.
were plotted as time series and quantified to indicate streamflow response to the treat- ments. Plots of the deviations in annual streamflow for each treated catchment show the treatment-induced changes over time (Figs. 3 and 4).
5. Results
5.1. Afforestation with eucalypts
Afforestation with eucalypts had a definite influence on annual, wet season and dry season streamflow (Figs. 3,5-7). The reduction in streamflow was significant (P < 0.05) from 1971, the third year after afforestation, for both the wet and dry seasons. Van Lill et al. (1980) noted this “observable influence from about the third year after afforesta- tion”. Significant reductions were aiso found for low flows from the thiid year following afforestation (Smith and Scott, 1992). Our analyses show that during the first six years following afforestation, average monthly st.mamilow was reduced (from the. predicted) by 12.5 mm (51%) during the wet season, and 7.4 mm (52%) during the dry season. The reductions in low flow reached a maximum when the stream dried up during parts of the dry season in the sixth year after treatment (Smith and Scott, 1992). The stream virtually

100 SO 1
0
-so P
D.F. Scott, w. hdd~0~nral of H+oi0fl199 (1997) 360-377
-I
-100 - -1 so .’
-200 -
-260 -
-300 -
-360 -
-400 -
460 -
-soo-. I I I I I I I I I I I I I I -1 I I I I I. I I I I I I I I 61102 6SiSO ?Ofrl 76176 aote1 85/66 OOlQl
Years
Fig. 5. A time-trend plot of the deviations about the calibration regression mode4 for annual streamflow in the eucalypt-afforested Catchment A.
Fig. 6. A time-and plot of the deviations about the calibration regression model for wet-season streamflow in eucalypt-afforested Catchment A.

D. F. Scott, W. LcscWJoumal of Hydrology I99 (1997) 360-377 369
40 - 20 -
E E
o- E -20 - ‘J 40- ii -6o- L 3 S 60- 3 -100 - % -120 -140 - -
.o
2 zj,,r * ,,,,,,, ,,,,,,,,,,,,,,,,,,,,
elm2 6St66 ton1 75176 eom1 8sme 90181
Fig. 7. A time-trend plot of the deviations about the calibration regression model for dry-season streamflow in the eucalypt-afforested Catchmcnt A.
stopped running altogether in April 1978, just over nine years after planting. Van Lill et al. (1980) calculated the maximum reduction in annual flow owing to the afforestation with E. grundis to be between 300 and 380 mm yr-‘. In this analysis, peak reductions of 470 mm yr-’ were calculated in both the seventh and ninth years of the rotation, which were particularly wet years. The relative reductions in flow obviously peaked at 100% from the ninth year after planting.
The actual reductions in streamflow are very variable (Fig. 5), and are dependent on age of plantation but more so on the rainfall in that year. It is clear that during the drier years of the 1980s (Fig. 2) the size of actual flow reductions was much smaller than during the wetter spell of the mid-1970s (Figs. 5-7). Thus, the observed flow reduction is strongly linked to the available water in the catchment.
Expressing the flow reductions as a percentage of the expected flow removes much of the variability which results from year by year fluctuations in rainfall. This produces a clear pattern of progressive desiccation of the catchment with increasing age of the trees, as illustrated in the plot of percentage flow reduction over time (Figs. 3 and 4). A sig- moidal equation of percentage tlow reductions as a function of age best fits these percen- tage flow reduction points for eucalypts [Y = lOlS/(l + 225 AgeA.“); R* = 0.94; df= 10; where Y is the percentage reduction in annual flow].
5.2. Aflorestation with pines
The atforestation of Catchment B with pines also had a marked effect on streamflow (Figs. 4,8-10). Reductions in total and wet season streamflow became significant (P C 0.05)

370 D.F. Scott, W. LescWJoumal of Hydrology 199 (1997) 360-377
Fig. 8. A time-trend plot of the deviations about the calibration regression model for annual streamllow in the pine-at&Wed Catchment B.
in the fourth year after treatment. The streamflow during the dry season decreased sig- nificantly from the fifth year after treatment (1975). This agrees with the results from low flow studies in this catclunent (Smith and Scott, 1992) and can be seen in the deviations from the predicted values (Fig. 10). Catchment B stopped flowing completely in May 1982, in the twelfth year after afforestation.
Thinnrd
40 20
0 -20 40 -60 -so
.L
-100 -120 -140 -100 -100 -2ooJ.....,......,..,....... ,,,,,,,,
61102 es/se 70171 Tw76 eom1 05ms 80191 Years
Fig. 6. A the-trend plot of the deviations about the calibration regression model for the wet-season streamflow in the pine-afforested Catklunent B.

D.F. Scott, W. L.eschUoumal of Hydrology 199 (1997) 360-377 371
The highest estimated flow reduction following afforestation with pine was 257 mm in the twentieth year of the rotation, though high reductions of between. 140 and 160 mm yr-’ were recorded in the wetter years between the sixth and tenth years of the rotation. As with the eucalypts, the size of the reductions are related to the availability of water: once the crop is mature the highest reductions can be expected in the wettest years. The percentage flow reductions give a smoother trend (Fig. 4) and a sigmoid equation fits these points reasonably well [Y = 101.5/(1 + 11372 Age-4.%3); R* = 0.90; df = 13; where Y. is the percentage reduction in annual flow 1.
5.3. Felling
The eucalypts in Catchment A were clearfelled in 1985 at an age of 16 years but the stteam did not flow again until 1988, and then only as an ephemeral response to the largest storms. Streamflow totals during 1988 and 1989 are not available owing to instrument malfunction, but the volumes were reported as being negligible by field staff. By 19901 1991 streamflow was again perennial (Fig. 3). but the 205 mm recorded in that year, whilst close to the annual pm&forestation average of 236 mm (Table 2), was still significantly lower (95 mm) than predicted by the calibration relationship (Fig. 3). A serious drought that persisted in the area from the end of 1991 through 1992, caused the streams in both catchments A and C to dry up early in 1992. The streamilow in Catchment C had dried up previously in a drought, in July 1970 (NW, 1971).
Although this analysis did not set out to test the effect of the heavy thinnings on streamfiow, the results do not show any apparent effect by these treatments, or at least no effect likely to be detectable by the current methods. The downward trend in streamilow
Affommtod Thlnnrd
-
Fig. 10. A timead plot of the deviations about the calibration rqrcssion mode4 for the dry-season streamflow in the pine-afforested Catchtnent B.

372 D.F. Scott. W. LescldJoumal of Hydrology 199 (1597) 360-377
after afforestation is fairly consistent and the thinnings make no apparent impact on this general pattern. The deviations from expected streamflow after the thinnings in Catchment A (Figs. 5-7). either up or down, are thought to reflect the wetness of the year rather than any treatment effect. Van der Zel (1970) found a positive streamflow response to the thinning of P. radiata in Jonkershoek, by looking at the change in volume represented by diurnal dips in the dry season hydrographs. It is likely that a similar, more refined approach would be needed to detect any response to thimrings at Mokobulaan. It is possible that the streams might have dried up sooner were it not for the thinnings.
6. Discussion
Afforestation with eucalypts caused a quicker reduction in streamflow than did afforestation with pines; first effects being noticeable in the third and fifth years after planting, and streamflow ceasing in the ninth and twelfth years, respectively. In the case of the eucalypts, the adoption of a shorter rotation is unlikely to have made up the difference in effect between the species, as streamflow did not recover for a full five years after clearfelling.
The fact that the streams in the two fully afforested Mokobulaan catchments dried up is not really surprising. The pre-treatment streamfiow (MAR (mean annual runoff) of 236 and 2 17 mm yr-‘) from these catchments was lower than the annual streamflow reductions expected following afforestation with pines and eucalypts (Nilnni, 1970; Bosch and Hewlett, 1982). Given the deep nature of the substrate and the fact that the entire catch- ments were planted, the cessation of streamflow in all but major storms was to be expected.
6.1. Partitioning of the hydrologic impact of trees
Grassland interception in this climatic zone is estimated to be 1.5 mm per rain-day (G. du T. De Villiers, 1975, unpublished data; Schulze, 1981), though taking account of the effect of biennial winter burns it might be better estimated at an average 1.2 mm per rain-day. In a ten-year record of daily rainfall at Mokobulaan rain-gauge 4, there are an average of 82 rain-days per year where rainfall equals or exceeds 1.2 mm. In addition, an average of 18 mm of rain falls on days where rainfalls is less than i .2 mm. Therefore, interception in the grassland control catchment (and the other catchments prior to afforestation) would be of the order of 115 mm yr-‘.
A study of interception in a nearby I?. grandis plantation, with a near peak leaf area index of 4, found that cumulative canopy interception was 6.2% of gross rainfall or 0.5 mm per event (Dye and Versfeld, 1991; Dye, 1993). In a separate study in the same district, Dye (1993) found canopy interception in a ten-year-old P. panda plantation to average 13% of gross rainfall over 125 events. To these figures of canopy interception litter interception would need to be added, which has been estimated under similar con- ditions on the Mpumalanga escarpment to be 4.3 and 2.8% of gross rainfall for E. grandis and P. patula respectively (Dye and Mostert, 1994). The estimation of evaporative losses from litter interception is not straightforward though. Litter biomass and thickness is very variable between sites and with age: active rooting takes place through much of the litter;

D.F. Scott, W. LeschlJoumal of Hydrology I99 (1997) 360-377 373
drying of the litter is slow and intercepted water is liable to be displaced by subsequent rainstorms, especially during the wet season when 80% of the rain falls.
Using the above figures, however, afforestation with eucalypts at Mokobulaan would have been associated with small increases in interception relative to grassland (canopy plus litter interception is unlikely to exceed 11% or 130 mm yr-I). Afforestation with pines can be expected to have increased canopy interception from around 10% of rainfall to 13% (an average increase of about 35 mm yr-’ at Mokobulaan), and litter interception would be an additional 2.8% or roughly 33 mm yr-‘. Based on these estimates of interception, it must be concluded that, in this climatic regime, the reduction in stream8ow following a change in vegetation from grassland to eucalypt or pine plantation is caused primarily by greatly increased transpiration, and particularly so in the case of eucalypts. Specifically, it is the winter transpiration rates of the trees that are thought to compose the major differ- ence between the water use of grassland and plantations (P.J. Dye, personal communica- tion, 1996).
6.2. Dekzyed recovery of streamjlow afer clearfelling
Some of the delay in the recovery of streamflow in Catchment A following clearfelling can be attributed to the profuse growth of coppice shoots from the stumps of the well- established eucalypts. However, the coppice was cut periodically following the clear- felling, until finally being poisoned in 1988, and at no time resembled a plantation. No specific measurements were taken of leaf area in the clearfelled site however, and actual transpiration could have been higher than the canopy height might have led one to expect. The effect of the regrowth on the site was thought to be minor and the working hypothesis was that the cause of the continued failure of streamflow was the original eucalypt crop.
The clearfelling of a pine plantation at the nearby Witklip research catchment also on the Mpumalanga escarpment, led to an immediate streamflow increase of 280 mm yr-‘, amounting to 54 mm for each 10% of the catchment cleared of forest over four post- clearfelling years (Smith, 1991). Similarly, cleat-felling of mature P. radiata plantation in the Western Cape Province led to streamflow increases which were noticeable once a third of the plantation had been cleared and were sustained for five years (Scott, 1997). These results agree with many from other countries (Bosch and Hewlett, 1982). Thus, the failure of the Mokobulaan Catchment A to respond to clearfelling is rather surprising, and points to something exceptional in either the catchment or the eucalypts, or both.
One explanation for the delayed response in Catchment A is that the eucalypts had tapped deep soil-water reserves, desiccating the catchment to a wetness level below that necessary to generate streamflow. It is apparent from attempts to correlate rainfall and streamflow in these catchments that they have a large storage capacity and show a delayed response to rainfall: annual flow in the control catchment is weakly correlated with annual rainfall (r = 0.57) but the correlation is much improved if the current and previous years rainfall is used (r = 0.72). Deep drilling within the catchment showed that the shale substrate was weathered and carried water reserves to depths of up to 45 m below the surface, without being saturated, i.e. without being below a water table (Dye and Poulter, 1991). Citing several studies that record eucalypt rooting at depths from 5.6 to 28 m, these authors postulated that eucalypt roots were able to penetrate the fractured substrate of the

374 D.F. Scott, W. LescWJoumal of Hydrology 199 (1997) 360-377
Mokobulaan catchment to considerable depths below the normal soil profile, and tap the deep, unsaturated soil-water reserves. These deep soil-water stores would have to be replenished before the catchment could be restored to its pre-afforestation hydrological behaviour.
In the five years between clearfelling and resumption of almost normal streamflow (September 198%October 1990), rainfall in Catchment A was 5826mm (Table 2). Under grassland cover, the expected difference between annual rainfall and streamflow in Catchment A would have been 5194 mm (estimated using the calibration relationship). Assuming post-cleatfelling water use by vegetation to have been similar to that of grass- land, then roughly 632 mm of the total rainfall would have been used to replenish water stores. If one further assumes that the broken shales have a porosity of 15% (volume for volume), a permanent wilting point of 5% wetness and a field capacity of 10% then this 632 mm of “surplus” water would have recharged the shale substrates to field capacity to a depth of 12.6 m or to saturation to a depth of 6.3 m. The drilling results of Dye and Poulter (1991) indicate that actual depths of available storage may well exceed such depths. It is also feasible, judging by Australian studies of eucalypt rooting (Dye and Poulter, 1991) and the results of local root studies (Dye, 1996), that eucalypts have been drawing water from such depths.
An alternative or additional explanation is that the change from short grassland to deep- rooting eucalypts has changed the mode of soil-water movement in the catchment. In Western Australia, root channels beneath eucalypt forest provided conduits for the pene- tration of rain water to a depth of 12 m, whilst rainwater on wheat lands in the same area had penetrated no deeper than 2.5 m (Allison and Hughes, 1983). Soils beneath eucalypts may be particularly water repellent, thus inhibiting infiltration and channelling water to preferential flow paths (Burch et al., 1989; Scott, 1991). In addition, soils in South African eucalypt plantations have shown changes in physical and hydraulic properties that lead to enhanced deep drainage (J.W. Musto, 1994, unpublished data). With more water penetrat- ing to greater depths in the profile there is a chance that more could be leaking from the catchment than may have done so previously.
It is stressed that the afforestation practices used here are experimental and are not strictly representative of those used currently in the South African forest industry. Cur- rently, riparian zones would not be planted but would be kept open under indigenous vegetation, and seldom would more than 75% of a single large catchment be afforested. The function of these experimental treatments is to indicate the potential effects of afforestation, and the results are not directly transferable to standard forestry situations.
The Mokobulaan experimental results contradict a widely held supposition that no crop can stop all streamflow, at least not during the bigger rainstorms that can be expected in any one year (e.g. N&nni, 1970). During the period that the streams in either Catchment A or B were completely dry, annual rainfalls were generally below average, but some very large storms did occur (Table 4) and daily rainstorm totals of up to 175 mm were recorded with maximum intensities of as much as 68 mm in 2 h. Clearly, the catchments had been desiccated to the extent that there was adequate storage capacity in the soils for the highest rainfalls experienced and infiltration and percolation rates were generally not limiting. At least while the catchments are in a moist to dry condition, streamflow is not generated by surface runoff during rainstorms of high intensity nor by rapid subsurface flow. This result
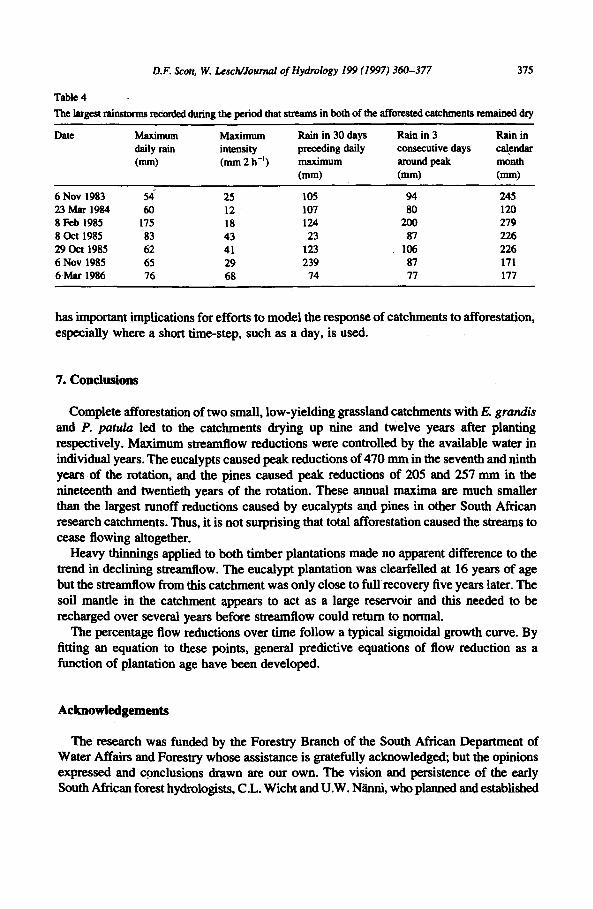
D.F. Scott, W. L.esch/Joumal of Hydrology 199 (1997) 360-377 315
Table4 The largest rainstotms worded during the period that streams in both of the afforested catchments remained dry
Date
6 Nov 1983 23 Mar 1984 8 Feb 1985 8 Ckt 1985 29 Ott 1985 6 Nov 1985 6Mar1986
Maximum Maximum daily fain intensity (mm) (mm2 h-‘)
54r 25 60 12
175 18 83 43 62 41 65 29 76 68
Rain in 30 days Rainin Rain in preceding daily consecutive days cal+ar maximum around peak month (mm) (mm) (mm)
105 94 245 107 80 120 124 200 279 23 87 226
123 106 226 239 87 171
74 71 177
has important implications for efforts to model the response of catchments to afforestation, especially whema short time-step, such as a day, is used.
7. Conclusions
Complete afforestation of two small, low-yielding grassland catchments with E. grundis and P. path led to the catchments drying up nine and twelve years after planting respectively. Maximum streamflow reductions were controlled by the available water in individual years. The eucalypts caused peak reductions of 470 mm in the seventh and ninth years of the rotation, and the pines caused peak reductions of 205 and 257 mm in the nineteenth and twentieth years of the rotation. These annual maxima are much smaller than the largest runoff reductions caused by eucalypts and pines in other South African research catchments. Thus, it is not surprising that total atforestation caused the streams to cease flowing altogether.
Heavy thinmngs applied to both timber plantations made no apparent difference to the trend in declining streamflow. The eucalypt plantation was clearfelled at 16 years of age but the streamflow from this catchment was only close to full recovery five years later. The soil mantle in the catchment appears to act as a large reservoir and this needed to be recharged over several years before streamflow could return to normal.
The percentage flow reductions over time follow a typical sigmoidal growth curve. By fitting an equation to these points, general predictive equations of flow reduction as a function of plantation age have been developed.
Acknowledgements
The research was funded by the Forestry Branch of the South African Department of Water Affairs and Forestry whose assistance is gratefully acknowledge& but the opinions expressed and conclusions drawn are our own. The vision and persistence of the early South African forest hydrologists, C.L. Wicht and U.W. NZinni, who planned and established
376 D.F. Scott, W. LescWJoumal of Hydrology 199 (1997) 360-377
these experiments, and the many technicians who maintained the equipment and collected the data over the years is acknowledged. Special thanks are extended to Godfrey Moses for draughting the figures, and Peter Dye, Dirk Versfeld and anonymous reviewers for help in improving the paper.
References
Acocks. J.P.H., 1975. Veld types of South Africa. In: Killick, D.J.B. (Ed.), Memoirs of the Botanical Survey of South Africa, No. 40,2nd ed. National Botanical Institute, Kirstenbosch. S.A.
Allison, G.B., Hughes, M.W., 1983. The use of natural tracers as indicators of soil-water movement in a temperate semi-arid mgion. Journal of Hydrology 60, 157-173.
Bosch, J.M., Hewlett, J.D., 1982. A review of catchment experiments to determine the effect of vegetation changes on water yield and evapotranspiration. Journal of Hydrology 55.3-23.
Butch, G.J.. Moore. I.D., Bums, J.. 1989. Soil hydrophobic effects on infiltration and catchment runoff. Hydm- logical Pmcesses 3,21 l-222.
Dye, P.J., 1993. Development of generalized models of rainfall intemeption by Eucalyptus gmn& and Pirms pati PlantaIhS. Contract report, For-Dea 623, to the Department of Water Affairs and Forestry, Pretoria. On file at CSlR Division of Forest Science and Technology, Pretoria.
Dye, P.J., 1996. Response of Eucalyptus gmndis trees to soil water deficits. Tree Physiology 16,233-238. Dye, P.J., Poulter, A.G., 1991. An investigation of sub-soil water penetration in the Mokobulaan research
catchmemts, Soutbcastcrn Transvaal. Soutb African Forestry Journal 161.31-34. Dye, P.J., Versfeld, D.B., 1991. Rainfall interception by Eucalytptus grandis canopies: a pmposed mcdelling
procedure for use in cat&tent water balance simulations. Contract report, For-Dea 369, to the Department of Water Affairs and Forestry, Pretoria. On file at CSIR Division of Forest Science and Technology, Pretoria.
Dye. P.J.. Mostert, G., 1994. Quantifying litter interception in forest stands. Contract report, For-Des 757. to the Department of Water Affairs and Forestry, Pmtoria. Gn file at CSIR Division of Forest Science and Tech- nology, Pretoria.
Hewlett, J.D., Bosch, J.M., 1984. The dependence of storm flows on rainfall intensity and vegetal cover in South Africa. Journal of Hydrology 75.365-381.
Hewlett. J.D., Doss, R, 1984. Forests, floods, and erosion: a watershed experiment in the southeastern Piedmont. Forest Science 34424-434.
Kleinbaum. D.G.. Kupper, L.L.. 1978. Applied Regression Analysis and Other Multivariable Methods. Duxbury, North Scituate, MA, USA, 556 pp.
Midgley, D.C., Pitman, W.V., Middleton, B.J., 1994. The surface water resources of South Africa 1990, 1st ed., vol. 6, Appendices. WRC Report 298/6.1/94. Water Research Commission, Pretoria.
N1Lnni. U.W., 1970. Trees water and perspective. South African Fomstry Journal 75.9-17. N&u& U.W., 1971. The Mokobulaan research catchments. South African Forestry Journal 78,5-13. SAS Institute 1985. SAS Users Guide, Statistics, version 5 ed. SAS Institute, Gary, NC. Schulxe. R.E., 1981. The land use component in hydrological modelling: an evaluation. In: Maaren, H. (Ed.),
Workshop on the effect of rural land use and catchment management on water resoumes. Department of Water Affairs, Pretoria, Technical Report TR 113.34-61.
Scott. D.F., 1991. Tbe influence of eucalypts on soil wettability. IX Schonau. A.P.G. (Ed.), Pmceedings of the. lUFR0 Symposium on Intensive Forestry: The Role of Eucalypts. Durban, September 1991, vol. 2. Southern African Institute of Forestry, Pretoria, pp. 1044-1056.
Scott, D.F., 1997. ‘Ihe contrasting effects of wildfire and clearfelling on the hydrology of a small catchment. Hydrological Processes, in press.
Smith, R.E., 1991. Effect of clearfelling pines on water yield in a small Eastem Transvaal catchment, South Africa. Water SA 17.217-224.
Smith, R.E.. Scott, D.F., 1992. The effects of afforestation on low flows in various mgions of South Africa. Water SA 18. 185-194.
Van der 2~1, D.W., 1970. The effect of a thinning on flow in a Jonkershoek stream. Fotestry in South Africa 11. 41-44.

D.F. Scott, W. LescNJoutnal of Hydtology 199 (1997) 360-377 317
Van Lill, W.S., Kruger, F.J., Van Wyk, D.B., 1980. The effect of afforestation with Eucalyptus gmndis Hill ex Maiden and Pinw patula Schlecht et. Cham. on streamflow from experimental catchments at Mokobulaan, Transvaal. Journal of Hydrology 48,107-l 18.
Wicht, C.L., 1976. Die uitwerking van bebossing met Eucalyptus gmndis en Pinus patula op jaarlikse stroomvloei uit eksperimentele opvanggebiede van Mokobulaan, Uitscek-Staatsbos. Suid-Transvaalse Bosstreek. Report on file at Jonkershoek Forestry Research Centre, Stellenbosch.
Copyright © 2022 FDOKUMEN