Geochemical response to variable streamflow conditions in contaminated and uncontaminated streams
14
Geochemical response to variable streamflow conditions in contaminated and uncontaminated streams Sonia A. Nagorski, 1 Johnnie N. Moore, and Temple E. McKinnon 2 Department of Geology, University of Montana, Missoula, Montana, USA David B. Smith U.S. Geological Survey, Denver, Colorado, USA Received 11 February 2002; revised 10 September 2002; accepted 10 September 2002; published 28 February 2003. [1] Seasonal variations in stream inorganic geochemistry are not well documented or understood. We sampled two mining-impacted and two relatively pristine streams in western Montana over a 12-month period, collecting samples every 4 weeks, with supplemental sampling (at least weekly) during spring runoff. We analyzed all samples for dissolved (operationally defined as <0.2 mm) and total recoverable concentrations. Generally, the trace elements (Al, As, Cu, Fe, Mn, and Zn) did not correlate linearly with streamflow, while the major elements (e.g., Ca, K, and Mg) did. Suspended sediment, total recoverable metals, and H + followed clockwise hysteresis rotations, driven by short-term flushing events during the very early stages of spring runoff. Mining-impacted sites had higher concentrations of many trace elements than did relatively pristine sites. One of the mining impacted sites exhibited strong geochemical responses to spring rain events in the basin. The results underscore the need to sample streams frequently during changing hydrologic and climatic conditions in order to accurately monitor surface water quality and to determine solute and particulate loads (both contaminant and noncontaminant). INDEX TERMS: 1806 Hydrology: Chemistry of fresh water; 1860 Hydrology: Runoff and streamflow; 1871 Hydrology: Surface water quality; 1803 Hydrology: Anthropogenic effects; 1065 Geochemistry: Trace elements (3670); KEYWORDS: hysteresis, runoff, trace metals, suspended sediment, water quality, spring flushing Citation: Nagorski, S. A, J. N. Moore, T. E. McKinnon, and D. B. Smith, Geochemical response to variable streamflow conditions in contaminated and uncontaminated streams, Water Resour. Res., 39(2), 1044, doi:10.1029/2001WR001247, 2003. 1. Introduction [2] Designing effective management strategies for the regulation of pollution sources and the restoration of rivers requires a rigorous approach to water quality sampling. This not only includes an adherence to modern sampling and analytical techniques (i.e., ‘‘clean’’ or ‘‘ultraclean methods’’ as described by Horowitz et al. [1994] and Benoit [1994]) to minimize contamination, but also an understanding of spatial and temporal variability. Of the studies that have incorporated both spatial and temporal measurements of water quality [e.g., McKnight and Bencala, 1990; Carroll et al., 1998; Clow and Mast, 1999; Meixner et al., 2000; Holloway and Dahlgren, 2001], few have sampled for trace metals using ultraclean techniques. This approach is now recognized as being critical to the accurate assessment of trace element concentrations in both pristine and contami- nated waters [Shiller and Boyle, 1987; Ahlers et al., 1990; Windom et al., 1991; Horowitz et al., 1994; Benoit, 1994; Taylor and Shiller, 1995]. Of the published papers based on data generated using clean methods, many have looked at either spatial patterns or temporal dynamics of aqueous geochemistry, but not both. [3] There is also a particularly acute lack of under- standing of how mining-impacted and relatively pristine watersheds respond to processes driving variability, from seasonal changes in runoff to short-term responses to storms and diel fluctuations. Understanding whether or not mining-impacted watersheds have more dynamic tem- poral variations than do their unmined counterparts has important implications for the design of monitoring studies and the determination of long-term effects of past, present and future mining operations on water quality. This is especially true for mountainous regions where winter snowpacks create large streamflow surges in the spring and where there are numerous streams contaminated by mining wastes. [4] Runoff dilution is commonly thought to be a domi- nant control on much of the variability of the composition of surface waters. However, researchers are increasingly documenting complex hysteresis patterns, elemental con- centrations along the rising limb of a hydrograph peak differing from those along the falling limb [Johnson and East, 1982; Williams, 1989; Campbell et al., 1995; Evans and Davies, 1998]. For example, the initial stages of spring runoff may be characterized by a surge of the dissolved major ion concentrations. This phenomenon has been 1 Also at U.S. Geological Survey, Denver, Colorado, USA. 2 Now at Texas Water Development Board, Austin, Texas, USA. Copyright 2003 by the American Geophysical Union. 0043-1397/03/2001WR001247$09.00 HWC 1- 1 WATER RESOURCES RESEARCH, VOL. 39, NO. 2, 1044, doi:10.1029/2001WR001247, 2003
-
Upload
independent -
Category
Documents
-
view
5 -
download
0
Transcript of Geochemical response to variable streamflow conditions in contaminated and uncontaminated streams

Geochemical response to variable streamflow conditions in
contaminated and uncontaminated streams
Sonia A. Nagorski,1 Johnnie N. Moore, and Temple E. McKinnon2
Department of Geology, University of Montana, Missoula, Montana, USA
David B. Smith
U.S. Geological Survey, Denver, Colorado, USA
Received 11 February 2002; revised 10 September 2002; accepted 10 September 2002; published 28 February 2003.
[1] Seasonal variations in stream inorganic geochemistry are not well documented orunderstood. We sampled two mining-impacted and two relatively pristine streams inwestern Montana over a 12-month period, collecting samples every 4 weeks, withsupplemental sampling (at least weekly) during spring runoff. We analyzed all samples fordissolved (operationally defined as <0.2 mm) and total recoverable concentrations.Generally, the trace elements (Al, As, Cu, Fe, Mn, and Zn) did not correlate linearly withstreamflow, while the major elements (e.g., Ca, K, and Mg) did. Suspended sediment, totalrecoverable metals, and H+ followed clockwise hysteresis rotations, driven byshort-term flushing events during the very early stages of spring runoff. Mining-impactedsites had higher concentrations of many trace elements than did relatively pristine sites.One of the mining impacted sites exhibited strong geochemical responses to springrain events in the basin. The results underscore the need to sample streams frequentlyduring changing hydrologic and climatic conditions in order to accurately monitor surfacewater quality and to determine solute and particulate loads (both contaminant andnoncontaminant). INDEX TERMS: 1806 Hydrology: Chemistry of fresh water; 1860 Hydrology:
Runoff and streamflow; 1871 Hydrology: Surface water quality; 1803 Hydrology: Anthropogenic effects;
1065 Geochemistry: Trace elements (3670); KEYWORDS: hysteresis, runoff, trace metals, suspended sediment,
water quality, spring flushing
Citation: Nagorski, S. A, J. N. Moore, T. E. McKinnon, and D. B. Smith, Geochemical response to variable streamflow conditions in
contaminated and uncontaminated streams, Water Resour. Res., 39(2), 1044, doi:10.1029/2001WR001247, 2003.
1. Introduction
[2] Designing effective management strategies for theregulation of pollution sources and the restoration of riversrequires a rigorous approach to water quality sampling. Thisnot only includes an adherence to modern sampling andanalytical techniques (i.e., ‘‘clean’’ or ‘‘ultraclean methods’’as described by Horowitz et al. [1994] and Benoit [1994]) tominimize contamination, but also an understanding ofspatial and temporal variability. Of the studies that haveincorporated both spatial and temporal measurements ofwater quality [e.g., McKnight and Bencala, 1990; Carroll etal., 1998; Clow and Mast, 1999; Meixner et al., 2000;Holloway and Dahlgren, 2001], few have sampled for tracemetals using ultraclean techniques. This approach is nowrecognized as being critical to the accurate assessment oftrace element concentrations in both pristine and contami-nated waters [Shiller and Boyle, 1987; Ahlers et al., 1990;Windom et al., 1991; Horowitz et al., 1994; Benoit, 1994;Taylor and Shiller, 1995]. Of the published papers based ondata generated using clean methods, many have looked at
either spatial patterns or temporal dynamics of aqueousgeochemistry, but not both.[3] There is also a particularly acute lack of under-
standing of how mining-impacted and relatively pristinewatersheds respond to processes driving variability, fromseasonal changes in runoff to short-term responses tostorms and diel fluctuations. Understanding whether ornot mining-impacted watersheds have more dynamic tem-poral variations than do their unmined counterparts hasimportant implications for the design of monitoring studiesand the determination of long-term effects of past, presentand future mining operations on water quality. This isespecially true for mountainous regions where wintersnowpacks create large streamflow surges in the springand where there are numerous streams contaminated bymining wastes.[4] Runoff dilution is commonly thought to be a domi-
nant control on much of the variability of the compositionof surface waters. However, researchers are increasinglydocumenting complex hysteresis patterns, elemental con-centrations along the rising limb of a hydrograph peakdiffering from those along the falling limb [Johnson andEast, 1982; Williams, 1989; Campbell et al., 1995; Evansand Davies, 1998]. For example, the initial stages of springrunoff may be characterized by a surge of the dissolvedmajor ion concentrations. This phenomenon has been
1Also at U.S. Geological Survey, Denver, Colorado, USA.2Now at Texas Water Development Board, Austin, Texas, USA.
Copyright 2003 by the American Geophysical Union.0043-1397/03/2001WR001247$09.00
HWC 1 - 1
WATER RESOURCES RESEARCH, VOL. 39, NO. 2, 1044, doi:10.1029/2001WR001247, 2003

explained as a flushing of ions that have accumulated onsnow crystals, in the soils, and in the groundwater over arelatively long winter residence period [Stottlemyer andToczydlowski, 1990; Harrington and Bales, 1998; Marshand Pomeroy, 1999]. Such flushing events have beenreported in several hysteresis studies from alpine regions[Williams et al., 1993; Campbell et al., 1995; Stottlemyer etal., 1997]. These events cause clockwise hysteresis patterns,in which solute concentrations are higher along the risinglimb than on the falling limb. Other research from similarregions has shown that some solutes can exhibit counter-clockwise hysteresis patterns as well [Stoddard, 1987;Bhangu and Whitfield, 1997]. These researchers haveexplained these trends by the volumetric dominance ofdilute snowmelt over contributions from groundwater andsoil water during the early stages of runoff. The identifica-tion of such hysteresis patterns in surface waters is impor-tant for designing monitoring studies, for making moreinformative comparisons among watersheds, and for evalu-ating the timing and nature of chemical sources to streams[Hooper et al., 1990; Droppo and Jaskot, 1995; Sokolovand Black, 1996].[5] Most of the studies discussed above on seasonal
variation have considered only major ions but not tracemetals. From the limited research using ultraclean meth-ods, the relationship between streamflow and trace elementconcentrations appears to be much more variable from siteto site than that found for major ions. For example, Shaferet al. [1997] report 1- to 5-fold increases in filterable metalconcentrations (and up to 17-fold increases in particulatemetals) in two Wisconsin rivers during high flow eventscompared to base flow. Similarly, Sherrell and Ross [1999]found highly significant positive correlations betweendischarge and dissolved metals in four acidic New Jerseystreams. In contrast, Sullivan and Drever [2001] report thatmost solute metals in Peru Creek, CO, were relatively lowduring maximum snowmelt, although their results werebased on only a few sampling events. Finally, Shiller[1997] found that the dissolved metal concentrations inthe Mississippi River do not correlate with discharge at all.[6] This wide range in results shows that a much deeper
understanding of stream response to seasonal fluctuations isneeded to elucidate seasonal patterns in discharge versustrace metal relationships at the watershed scale. The purposeof this study is to document temporal variability in tracemetal and major element geochemistry of both mining-impacted and uncontaminated streams and to evaluate thegeochemical changes occurring during spring runoff. Weshow that major differences exist among study sites in bothoverall concentration values as well as in the seasonaltiming of the concentration variations, and that detailedresponses to flow events must be considered when planningany water quality monitoring program.
2. Methods
2.1. Sampling Design
2.1.1. Spatial Design[7] We chose four sites in the Clark Fork watershed of
western Montana (USA) for this study (Figure 1). Two sitesare relatively small, moderately high elevation (1450 m)streams and the other two are lower elevation (1000 m and
1200 m) sites on much higher-order streams draining 20-times the land area of the smaller streams. One of the twosites from each size category drains a region impacted bymining contamination, while the other drains a relativelypristine area.[8] The two low-order streams are in the upper Blackfoot
River watershed. The Landers Fork (LF) is a major tributaryto the upper basin, and the site along the Blackfoot Rivernear Hogum Creek (BH) is 6 km upstream of the Blackfoot-Landers Fork confluence. The Landers Fork drains 350km2, and the Blackfoot at BH drains 254 km2. Site BH is ca.20 km downstream from the historic Heddleston miningdistrict. Site LF is located 1 km upstream from the con-fluence with the Blackfoot and is immediately adjacent tothe undisturbed McDonald gold deposit. The Landers Forkdrains the mountainous Scapegoat Wilderness area, receivesmore snowmelt than does site BH, and its streamflow levelsare typically several times larger than at BH.[9] The two higher-order stream sites are on the lower
Blackfoot River (near Bonner, site ‘‘BFB’’) and on theClark Fork River (near Bearmouth and Drummond, site‘‘CFBM’’). They were selected due to the presence ofUSGS gaging stations (gaging station 12340000 at BFBand gaging station 12331800 at CFBM) as well as theirsimilar discharges at base flow conditions. We acknowledgethe potential lack of independence for site BFB due to itslocation downstream of BH and LF. However, BFB is 187km downstream from the headwater sites, and its flowduring the study period was on average 10 times largerthan the headwaters streams combined. Studies on thegeochemistry of the watershed [Spence, 1975; Moore etal., 1991; Nagorski et al., 2002] indicate that the impacts ofthe headwater mines are not detectable in the solute phaseby about 20–30 km downstream of the headwaters. Themajor tributaries feeding the Blackfoot River between theupper basin sites and the lower basin site drain largeportions of wilderness areas, and there are no large-scaleindustrial or urbanized areas.[10] In contrast, site CFBM is approximately 130 km
downstream from Butte, the setting for one of the world’slargest historical metal mining operations. Over a hundredyears of mining and smelting in the upper Clark Forkbasin have contaminated the river to the extent that theriver’s approximately 200 km stretch between Butte andMissoula is the largest Superfund complex in the USA.[Moore and Luoma, 1990]. Although CFBM is located farfrom the major mining contamination, it is chronicallyimpacted by metal pollution from the tailings on thefloodplain, elevated metals in the streambed sediments,and other nonpoint sources [Moore and Luoma, 1990;Nimick and Moore, 1991].2.1.2. Temporal Design[11] We sampled the sites on a monthly basis with
supplemental high flow sampling during spring runoff.Robertson and Roerish [1999] found that such a designwas highly effective for one-year studies aiming to estimateloads in small streams. Our monthly sampling started on arandomly chosen weekend in February 2000, followed bysampling at four-week intervals from then on, throughJanuary 2001. The four-week rule was given an allowanceof ±2 days in order to deal with adverse winter weather orother logistical inconveniences.
HWC 1 - 2 NAGORSKI ET AL.: GEOCHEMICAL RESPONSE TO VARYING STREAMFLOW

[12] During spring runoff from mid-April through mid-June, we collected samples once or twice per week in orderto capture as much flow variability and as many spring rainevents as possible. Frequent site visitation was particularlyimportant for sites BH and LF, as real-time streamflow datawere unavailable. We visited all 4 sites for each event,except for one supplemental sampling event (on 14 April2000) when we sampled only at BFB and CFBM. As aresult, BFB and CFBM had a total of 24 sampling events,while BH and LF had a total of 23. We sampled each site atapproximately the same time of day in order to minimizeconfounding any seasonal trends with diel trends.
2.2. Streamflow Measurement
[13] We obtained streamflow (Q) values at BFB andCFBM from the USGS gaging stations at the sites. Theestimated error of the Q measurements is 5% (M. White,USGS, personal communication, 2001). From the end ofNovember through the end of the study period in January,Q measurements at BFB were unavailable due to ice at thesite.[14] We measured Q manually at BH and LF using a
Price AA current meter or a pygmy meter, according tostandard USGS protocol [Rantz, 1982]. Our reproducibility
of the Q measurements (determined by making multiplemeasurements per site visit) at site BH averaged 7%, but thehighest error of 17% was made during the low flow periodin December. At LF the mean measurement reproducibilitywas 3%, with the largest error at 7%.[15] At LF, daily Q values were estimated from the nearest
USGS gaging station on the Blackfoot River, 71 km down-stream from LF. Despite the distance from LF, there was agood linear relationship between Q measurements we madeat LF and the Q reported at the gaging station (R2 = 0.96).Hence, we could monitor the approximate Q at site LF. SiteBH did not correlate well with the USGS gaging station, andso we have no estimations of Q at BH on days betweensampling events.
2.3. Sampling Protocol
[16] We precleaned all sample bottles (made of high- orlow-density polyethylene) by washing them in a 6N HClbath for 2 hours and a 1% trace-metal grade HNO3 bathfor 24 hours, with multiple Milli-Q deionized water rinsesbefore and after each cleaning stage. Wearing clean,unpowdered nitrile gloves at all stages, we double-baggedall sample bottles in Class 100 laminar flow hoods andremoved each bottle from its bags only moments before
Figure 1. Site location map. Sites: BFB, Blackfoot River at Bonner; CFBM, Clark Fork River nearBearmouth; LF, Landers Fork; BH, Blackfoot River near Hogum Creek.
NAGORSKI ET AL.: GEOCHEMICAL RESPONSE TO VARYING STREAMFLOW HWC 1 - 3

sampling. We collected three width- and depth-integratedwater chemistry samples from each site on each samplingevent (however, site BFB was too deep to wade safely, soall BFB samples were collected from the northern half ofthe channel only). Immediately following collection, wesealed the samples back into their double bags and putthem on ice, where they remained until filtration in the lab.The triplicate samples were never composited and wereput through handling and analysis procedures independ-ently. Following collection of the water chemistry samples,we took samples for total suspended sediment (TSS) andmeasured pH, dissolved oxygen (D.O.), and stream tem-perature in situ from the same areas from where wecollected the water samples.
2.4. Laboratory Protocol
[17] All sample processing and analysis took place at theMurdock Environmental Biogeochemistry Laboratory at theUniversity of Montana. Wearing clean nitrile gloves, wefiltered all samples within 24 hours of sample collectionunder the Class 100 laminar flow hood. To check forpossible chemical changes in the sample bottles prior tofiltration, on one occasion we filtered samples from theClark Fork River and Blackfoot River sites over a variety oftime spans, from 2 hours to 100 hours postcollection. Therewere no detectable changes in chemical concentrations inthe first 48 hours postcollection.[18] Before collecting a filtered sample (at <0.2 mm,
operationally defined as the ‘‘dissolved’’ phase), we purgedthe syringe, filter (Gelman Sciences Serum Acrodiscs), andbottle with 50 mL of sample in order to reduce the filters’effective pore size [Taylor and Shiller, 1995; Horowitz etal., 1996]. Following filtration and acidification of thesample with ultra-pure HCl to pH < 2, we decanted 100mL for alkalinity measurement. Then we preserved theremaining unfiltered sample with 3 mL of 6N trace metalgrade HNO3 per liter of sample for total recoverableelement analysis. Total recoverable digests were performedwithin 2 months of sample collection according to EPAMethod 200.2 [U.S. Environmental Protection Agency,1991]. Samples were digested under laminar flow hoodsand in molded plastic digestion vessels cleaned in the samemanner as the sample bottles. The resulting concentrationsin the digested samples are called ‘‘total’’ concentrations inthis report.[19] We quantified the TSS within 1 week, but usually
within 1 day, of sample collection by weighing the mass ofparticulates retained on a 0.2 mm filter following a vac-uum-driven filtration of at least 300 mL (mean = 1.5 liters)of sample. We measured dissolved inorganic carbon (DIC)using a Shimadzu Carbon Analyzer within two weeks anddetermined alkalinity by titration with sulfuric acid to pH4.5 within 3 days of sample collection. We measured Asconcentrations on a HGAAS and all other elements usingultrasonic nebulization with an ICP (Jarrel-Ash ICAPES-IRIS) according to EPA Method 200.15 [Martin et al.,1994].
2.5. Laboratory QA/QC
[20] On the ICP we ran acidified blanks, fortifiedblanks, USGS Standards T143 and T145, sample analysisduplicates, and sample spikes at regular intervals so that
40–60% of the total analysis consisted of QA/QC eval-uations. On the HGAAS, we analyzed at least one samplespike, one sample analysis duplicate, one checks of theUSGS standards, a blank, and all 5 calibration standardswith each set of 10 samples. When analyzing DIC, weagain had at least one sample duplicate, one blank, andall 3 calibration standards with each set of 10 samples.Practical Quantifiable Limits (PQLs) are provided inTable 1.[21] Both lab-constructed and filtered field blanks had
rare and insignificant concentrations of measured elements.An exception is that one field blank had 0.73 mM Fe, whichwas substantially above its PQL of 0.09 mM. Sodium’smaximum field blank concentration of 0.03 mM likelyaccounts for some of the noise in Na concentrations at sitesLF, BFB, and BH, where Na concentrations were typicallyless than 0.17 mM; Na data at these sites were thereforeexcluded. Processing blanks through the digestion proce-dure resulted in some significant contamination for Cr, Ni,and Zn, and so these elements were discarded from the totalrecoverable data set.[22] Mean concentrations of all analytes in laboratory
standards were within 8% (most within 5%) of theconstructed value on all instruments. Mean concentrationsof all elements (except Si, which was about 12% low) inunaltered and digested USGS standards T-143 and T-145analyzed on the ICP and HGAAS fell within the reportedacceptable ranges. The mean percent difference betweensamples measured twice on all instruments was <6% forall elements. The only exception was for the TSS sam-ples, for which the mean percent difference betweensamples was 26%. The mean percent difference betweendigest duplicates was <6% as well, except for Al, As, Fe,and P (average % differences = 11%, 8%, 7%, and 11%,
Table 1. Practical Quantifiable Limits (PQLs)
Element PQL
Al 0.37 mMAs 0.003 mMBa 0.004 mMBe 0.01 mMCa 0.002 mMCda 0.01 mMCoa 0.05 mMCu 0.05 mMFe 0.090 mMK 0.005 mMLi 0.29 mMMg 0.004 mMMn 0.009 mMMo 0.03 mMNa 0.008 mMNi 0.02 mMP 0.32 mMPba 0.10 mMS 0.22 mMSi 0.71 mMSna 0.02 mMSr 0.006 mMTi 0.10 mMVa 0.10 mMZn 0.015 mM
aThese elements were detectable in no samples.
HWC 1 - 4 NAGORSKI ET AL.: GEOCHEMICAL RESPONSE TO VARYING STREAMFLOW

respectively). Mean spike recoveries on all detectableelements were between 97% and 111%, except for Li,whose mean recovery was 84%.
2.6. Data Analysis
[23] Due to the nonnormality of the concentration data,the presence of outliers for numerous parameters, hetero-geneity of the sample variances, and the failure of datatransformations to correct these problems, nonparametricstatistical methods were used to analyze the data in SPSS.Krukal-Wallis tests were done using SPSS to comparegeochemical distributions among sites. (The Kruskal-Wallis test compares the distributions of the data sets,not the concentration values themselves, because the testis based on ranked data). Calculations of nonparametricmultiple comparisons by simultaneous test procedures(STP) were done manually according to Sokal and Rohlf[1995].
3. Results and Discussion
3.1. Streamflow Variation
[24] Late spring-early summer peak runoff occurred atsites BFB, LF, and BH (Figures 2a, 2c, and 2d). At BFBand LF, runoff lasted between April and July. At BH,runoff peaked early relative to BFB and LF. There was ahighly unusual runoff pattern at CFBM during the studyyear (Figure 2b). Instead of being characterized by thetypical snowmelt runoff peak, discharge decreased fromApril through August. As a result, the hydrograph wasapproximately inverted. Streamflow averages for Marchthrough August were the lowest in the 8-year site record,and 31 July 2000 marked the lowest Q (2180 L/s) everrecorded at the site. The low discharge was caused bybelow normal snowpack and precipitation levels in theregion, and by an unknown amount of irrigation with-drawal in the Clark Fork valley.
3.2. Geochemical Comparisons Among Sites
[25] Comparisons among sites (using the Kruskal-Wallis test) showed that pH, water temperature, andD.O. concentration were the only parameters whosedistributions were not significantly different among the4 study sites. All sites had pH values between 7.8–8.5;water temperature between 0.0–18.1�C, and D.O. valuesof 72–121% saturation. Nonparametric multiple compar-isons by STP identified the significant (p < 0.05) differ-ences between sites for the rest of measured parameters,as listed in Table 2. Not included in the analysis wereelements that were entirely or mostly below detection atall four sites.[26] The concentration distributions of most measured
parameters (alkalinity, DIC, and dissolved (d) and total (t)As, Ca, Cu, K, Li, Mg, Mn, Mo, P, S, Si, and Sr) werehighest at site CFBM. Site CFBM was lowest only forBad and Bat. The high-order stream sites (CFBM andBFB) had higher TSS, Alt, Asd, and Lit concentrationdistributions and lower Bad and Bat concentration distri-butions than the low-order sites (LF and BH). Themining-impacted sites (CFBM and BH) had higher dis-tributions of Fed, Mnd, Sd, St, Sid, Sit, Srd, and Srtconcentrations than the relatively pristine sites (BFB and
LF). While BFB and BH had similar distributions ofalkalinity, DIC, Cad, Cat, Kd, Kt, Fet, Mgd, Mnt, and Ptconcentrations, CFBM and LF had heterogeneous concen-tration distributions for all elements. This indicates thatthese two sites with the largest differences in land use andsize also had the least in common in terms of geo-chemical concentrations.
3.3. Relationships Between TSS andTotal Recoverable Concentrations
[27] Pearson’s correlations of TSS against the totalrecoverable elemental concentrations reveal that total Al,Fe, and Mn are strongly correlated (r � 0.88, p < 0.01)with TSS at each site (except for Fe and Mn at LF,where they are below the PQL and so correlations couldnot be calculated) (Table 3). Total Cu was also positivelycorrelated (r = 0.95, p < 0.01) with TSS at CFBM, whileit was below the PQL at the other 3 sites. Strongcorrelations indicate that the total recoverable concentra-tions of the aforementioned metals could be reasonablywell estimated using TSS at all these sites. While itwould be necessary to periodically check the validity ofthe relationship at each site, this recognition could sparemuch money, time, and effort because TSS is far easierand less expensive to measure than total recoverablemetal concentrations.[28] Not all elements correlated uniformly with TSS
across the sites. For example, Ast was poorly correlatedwith TSS (r = 0.38, p = 0.07; and �0.30, p = 0.16) atthe two minimally contaminated sites (BFB and LF), butit correlated reasonably well (r = 0.78, p < 0.01; and0.81, p < 0.01) at the two mining-impacted sites (CFBMand BH). That is, when there were higher particulatelevels at CFBM and BH, the Ast concentrations increasedaccordingly, perhaps indicating a more uniformly avail-able source of As at the mining-impacted sites. Incontrast, the lack of a relationship between TSS and Asat BFB and LF suggests that changes in As concentra-tions at the uncontaminated sites occurred independentlyof TSS fluctuations.[29] Another way of evaluating whether or not the
mining-impacted sites had higher metal concentrationsthan the relatively pristine sites is to compare the totalrecoverable geochemistry. If rivers with similar TSSconcentrations drain areas with similar physical and geo-chemical characteristics, the rivers should also have sim-ilar total recoverable metal concentrations. The medianTSS distributions at the two high-order stream sites (BFBwith 5.5 mg/L and CFBM with 6.8 mg/L) were notstatistically different (Wilcoxon Signed Rank Test, p <0.05); nor were the median TSS distributions different atthe two low-order stream sites (BH with 1.3 mg/L and LFwith 1.7 mg/L). Therefore one would expect that theconcentrations of the total recoverable elements at the 2high-order stream sites and the 2 low-order stream sites tobe similar as well.[30] However, total recoverable concentrations differed
between the mining-impacted and unmined sites in eachstream size category. Whereas Alt, which is commonlyused as a correction factor for grain size variations, hadstatistically identical median concentrations and concen-tration distributions at CFBM and BFB, median Ast, Fet,
NAGORSKI ET AL.: GEOCHEMICAL RESPONSE TO VARYING STREAMFLOW HWC 1 - 5

and Mnt, concentrations were 13, 1.6, and 4.7, timeshigher, respectively, at CFBM than at BFB. Total Cuwas at least 4.3 times higher at CFBM than at BFB(exact enrichment factors can not be calculated because
Cut was below detection at BFB). Although median Altwas twice as high at LF than at BH, median Fet andMnt were 2.8, and 4.8 times higher, respectively, at BHthan at LF. Therefore both mining-impacted rivers were
Figure 2. Hydrographs for the four study sites: (a) BFB (from USGS station 12340000), (b) CFBM(from USGS station 12331800), (c) LF, and (d) BH. The approximated hydrograph at LF is derived fromdata at a downstream gaging station on the Blackfoot River (USGS Station 12335100) where Q wasstrongly correlated (R2 = 0.96) with Q measurements at LF. Sample dates are those when water qualitysamples were taken.
HWC 1 - 6 NAGORSKI ET AL.: GEOCHEMICAL RESPONSE TO VARYING STREAMFLOW

enriched in some total-recoverable elements over theirunmined counterparts.
3.4. Was Streamflow A Predictor ofGeochemical Concentrations?
[31] Streamflow had strong, significant, and inverse cor-relations (Pearson’s r < �0.80; p < 0.01) with dissolved andtotal Ca, Mg, and Sr at all four sites (Table 4). On a site-specific basis, strong inverse correlations (r < �0.80; p <0.01) with Q were present also for alkalinity, DIC, Asd, Bad,Bat, Lid, and Lit at BFB; for Lid and Lit at CFBM; foralkalinity, DIC, Asd, Bad, Bat, Kd, Kt, St, Sid, and Sit at LF;and for alkalinity, DIC, Bad, Bat, and Lit at BH. Statisticallysignificant positive correlations with Q were present onlyfor TSS, Mnd, Mnt, Fet, Znd at site BH.[32] According to these results, the general pattern
emerges that the major elements, Ba, and Sr were moder-ately well and inversely correlated with Q, while TSS andmany of the trace elements were poorly or positivelycorrelated with Q. Hence, the processes controlling themajor element concentrations in these streams were differ-ent from those controlling the occurrence of trace metals. A
probable explanation for the behavior of the major elementsis that in general, they were chemically conservative andwere simply diluted by snowmelt during runoff [Whitfieldand Clark, 1982; Bencala et al., 1987; Bhangu and Whit-field, 1997].[33] In contrast, the temporal controls of trace element
concentrations are likely chemical, as suggested by the lack
Table 2. Summary of Results of Nonparametric Multiple Comparison Among Sitesa
Parameter Order
Q BFB > CFBM > LF > BHTSS, Alt BFB = CFBM > LF = BHAlk, Cat CFBM > BFB = BH; BFB = LF, CFBM > LF, LF > BHDIC, Cad, (Cud), (Cut), Lid, Mgt, (Mod), Mot, Pd CFBM > BFB = LF = BHAsd CFBM > BFB > LF > BHBad, Bat LF = BH > BFB > CFBMFed CFBM = BH > BFB > LFKd, Kt, Mnt, Nad, Nat CFBM > BFB = BH > LFMgd CFBM > BH > BFB; BFB = LF, CFBM > LF, BH = LFMnd, Sd, St, Sid, Sit, Srd, Srt CFBM > BH > BFB > LFAst CFBM > BFB = LF > BHFet BFB = CFBM > LF; BFB = BH, CFBM > BH, BH = LFLit CFBM > BFB > LF = BHPt CFBM > BFB = BH; BFB > LF, CFBM > LF, BH = LF
aSites: BFB, Blackfoot River at Bonner; CFBM, Clark Fork River near Bearmouth; LF, Landers Fork; BH, Blackfoot River nearHogum Cr. Elements that were above the PQL only at site CFBM are in parentheses.
Table 3. Pearson’s Correlations of TSS Versus Total Metal
Concentrations
TSS Versus BFB CFBM LF BH
Alt 0.89a 0.97a 0.99a 0.88a
Ast 0.38 0.78a �0.30 0.81a
Bat �0.67a 0.31 �0.70a �0.76a
Bet (BPQL) 0.83a (BPQL) (BPQL)Cat �0.64a �0.50b �0.66a �0.77a
Cut (BPQL) 0.95a (BPQL) (BPQL)Fet 0.91a 0.95a 0.95a 0.98a
Kt 0.03 �0.60 �0.33 �0.22Lit �0.45b �0.53a �0.53a �0.64a
Mgt �0.67a �0.45b �0.70a �0.77a
Mnt 0.92a 0.88a 0.99a 0.98a
Nat �0.39 �0.37 �0.54a �0.67a
Pt 0.78a 0.89a 0.05 0.35St �0.24 �0.58a �0.11 0.35Sit 0.38 0.26 �0.50b �0.29Srt �0.55a �0.48b �0.69a �0.71a
Tit 0.81a 0.97a (BPQL) (BPQL)
aCorrelation is significant at the 0.01 level (2-tailed).bCorrelation is significant at the 0.05 level (2-tailed).
Table 4. Pearson’s Correlations Between Q and TSS, Dissolved
(d) Elements, and Total Recoverable (t) Elements at All Sitesa
Site BFB Site CFBM Site LF Site BH
Q versus TSS 0.67b 0.64b 0.66b 0.85b
Q versus alkalinity �0.96b �0.77b �0.91b �0.95b
Q versus DIC �0.95b �0.55b �0.96b �0.93b
Q versus Alt 0.48c 0.70b 0.58b 0.66b
Q versus Asd �0.82b �0.40c �0.81b �0.48c
Q versus Ast �0.27 0.37 �0.68b 0.56b
Q versus Bad �0.91b �0.48c �0.96b �0.95b
Q versus Bat �0.94b �0.21 �0.95b �0.96b
Q versus Cad �0.96b �0.89b �0.94b �0.95b
Q versus Cat �0.96b �0.82b �0.93b �0.95b
Q versus Cut BPQL 0.66b BPQL BPQLQ versus Fed 0.01 0.58b �0.25 0.01Q versus Fet 0.52b 0.68b 0.55c 0.88b
Q versus Kd �0.71b �0.69b �0.95b �0.70b
Q versus Kt �0.59b �0.66b �0.85b �0.62b
Q versus Lid �0.92b �0.89b �0.69b �0.75b
Q versus Lit �0.85b �0.91b �0.75b �0.81b
Q versus Mgd �0.94b �0.80b �0.94b �0.94b
Q versus Mgt �0.96b �0.80b �0.93b �0.96b
Q versus Mnd 0.14 0.25 0.45c 0.88b
Q versus Mnt 0.56b 0.39c 0.65b 0.85b
Q versus Nad �0.84b �0.68b �0.79b �0.77b
Q versus Nat �0.86b �0.74b �0.89b �0.90b
Q versus Sd �0.75b �0.73b �0.68b 0.39Q versus St �0.75b �0.78b �0.41 0.34Q versus Sid �0.70b �0.38 �0.94b �0.70b
Q versus Sit �0.28 �0.15 �0.91b �0.66b
Q versus Srd �0.94b �0.93b �0.97b �0.92b
Q versus Srt �0.93b �0.90b �0.96b �0.93b
Q versus Tit 0.26 0.71b BPQLQ versus Znd �0.30 0.10 BPQL 0.91b
aUnlisted elements lacked strong and significant correlations with Q atany site. Here n = 23 at LF and BH; n = 24 at CFBM; and n = 21 at BFB.(On 3 dates BFB had no Q measurements due to ice at gage.) BPQL isbelow practical quantifiable limit.
bCorrelation is significant at the 0.01 level (2-tailed).cCorrelation is significant at the 0.05 level (2-tailed).
NAGORSKI ET AL.: GEOCHEMICAL RESPONSE TO VARYING STREAMFLOW HWC 1 - 7

of predictability of their concentrations by Q, the mostdominant physical factor. Natural weathering and dissolu-tion of minerals in the soils, alluvium, bedrock, and minewastes (if present) likely play dominant roles in the timingand magnitude of trace element releases into the dissolvedphase of the stream water. The reactive nature of the traceelements makes them more sensitive to changing pH, redox,and temperature conditions, biological activity, and varyingavailability of complexing agents in the basin source areasand in the channel [Forstner and Wittmann, 1979; Cossa etal., 1990; Shiller, 1997]. The lack of correlation between Qand dissolved trace elements at most sites is in generalagreement with the highly scattered Q concentration rela-tionships found in the Mississippi River by Shiller [1997],who speculated that seasonal variations in dissolved metalswere most likely controlled by redox processes in the basinsource areas and in the river itself.[34] The poor association between Q and dissolved trace
elements such as As, Cu, Fe, Mn, Zn was most pronouncedat site CFBM. The major sources for the dissolved traceelements in the Clark Fork are the mining and smeltingcontaminated floodplain soils and streambed sedimentsalong most of the river corridor [Nimick and Moore,1991; Axtmann and Luoma, 1991]. For example, tracemetals that were immobilized in reducing zones such assulfide mineral complexes in the floodplain or in stagnantwater areas may have become oxidized and displaced intothe water column at higher flows, where they temporarilyremained out of equilibrium with Fe- or Mn-oxides/oxy-hydroxides [Shotyk, 1998; Wetherbee and Kimball, 1991;Shiller, 1997]. They also may have been released into theriver by the transport of reduced bed sediments, fromhydrologic flushing of the hyporheic zone [Nagorski andMoore, 1999], or surface runoff that washed metal-rich saltsoff the floodplain [Lucy, 1996].[35] Additionally, the lack of trends in the dissolved trace
metal concentrations over time may be a product of interfer-ence by colloids. Because colloids can pass through 0.2 mmfilters [Horowitz et al., 1996; Ross and Sherrell, 1999], oursamples may not represent the truly dissolved portion in thefirst place, if such a phase actually exists. Hence, anyrelationships between truly dissolved concentrations and Qmay be obscured by varying colloidal contributions to themeasured filtered geochemistry [Schemel et al., 2000]. Forexample, at site BH, where 2 ‘‘dissolved’’ metals (Mn andZn) correlated strongly and positively with Q, it is notpossible to know from our data whether these metals weretruly present at higher dissolved concentrations duringhigher flows, whether they were transported by colloids thatwere abundant during high flows and passed through thefilters, or a combination of both. Noting that both dissolvedand total recoverable Mn and Zn concentrations had positive,approximately linear relationships with Q at BH, it appearsmore likely that the ‘‘dissolved’’ concentrations in factincluded colloids as well.[36] Finally, the mobilization of TSS and some total
recoverable trace metals during higher flows, as indicatedby the positive association between TSS, Mnt, and Fet withQ at site BH, may be due to simple physical processes.Physical mobilization of sediments from the streambed andfloodplain may occur with high Q events because the higherstage and velocity of the river can entrain more bottom
sediments and access broader areas of the floodplain [Brad-ley, 1984; Whitfield and Clark, 1982; Droppo and Jaskot,1995]. Yet, the chemical characteristics and availability ofdifferent sized sediments can vary substantially as well[Bradley and Lewin, 1982; Bird, 1987; Hatch et al.,1999]. Therefore the size of the flow event may notnecessarily correlate with the sediment and associated metalconcentrations, as was the case at BFB, CFBM, and LF.
3.5. Streamflow-Concentration Patternsat BFB, LF, and BH
3.5.1. Hysteresis[37] At BFB, LF, and BH, water temperature was the only
parameter that followed counter-clockwise hysteresis,meaning that it was lower along the rising limb of thehydrograph than on the falling limb (Figure 3a). Thispattern charts the transition from the period of cooler airtemperatures and the abundance of fresh snowmelt earlier inthe spring to the increasing influences of warmer airtemperature, rain, and contributions from warmer soil waterand groundwater in the receding portion of spring runoff.[38] Rotating in the other direction, H+, dissolved oxy-
gen, TSS, Alt, Ast, Kd, Kt, Fet, Mnt, Sd, St, and Srt followedclockwise hysteresis patterns at sites BFB, LF, and BH(Figures 3b–3f ). The clockwise rotation of H+ concentra-tion indicates that earlier runoff was more acidic than laterrunoff, which presumably had more opportunity to becomebuffered by soils and saturated zone materials in the water-shed en route to the water channel. Acidic ‘‘flushes’’ at thestart of snowmelt have long been identified by numerousresearchers, who have attributed these events both to thedilution of buffering compounds by meltwater [Stoddard,1987] and to the early, preferential release of atmospheri-cally derived acidic anions from the snowpack [Davies etal., 1982; Tsiouris et al., 1985; Tranter et al., 1988].[39] Clockwise hysteresis rotations for dissolved ele-
ments may be explained by snowmelt-driven displacementinto the stream channel of relatively highly concentrated soilwater and/or by ionic flushing from the early snowmeltitself [Stottlemyer and Troendle, 1992;Williams et al., 1993;Marsh and Pomeroy, 1999]. Clockwise rotations for TSSand total recoverable elements have been reported by manyother researchers, who attribute the pattern to a physicalwashing out and subsequent depletion of sediments andother particulate matter in the channel and floodplain at theonset of high flow conditions [Williams, 1989; Droppo andJaskot, 1995; Sokolov and Black, 1996; Moog and Whiting,1998; Pierson et al., 2001].[40] At BFB, dissolved and total As, K, Li, Mn, S, Si, and
Sr surged in concentration on 29 March 2000 at BFB, whenQ was at the very early stages of increasing spring runoff(Figures 4a and 4b). These early runoff increases are largelyresponsible for creating the clockwise-rotating hysteresisloops seen for many of these parameters on the seasonalscale. Of these elements, Ast, and total and dissolved K, S,and Si were higher on 29 March 2000 than on any otherdate during the study. The unusually high value for S on thisone date in the early spring opened a clockwise loop in whatwould otherwise have been a linear relationship between Qand S concentration (Figure 3f ). Total Al, Fe, Mn, and Ti,all of which showed clockwise hysteresis, generally fol-lowed TSS patterns by peaking in concentration on 14 April
HWC 1 - 8 NAGORSKI ET AL.: GEOCHEMICAL RESPONSE TO VARYING STREAMFLOW

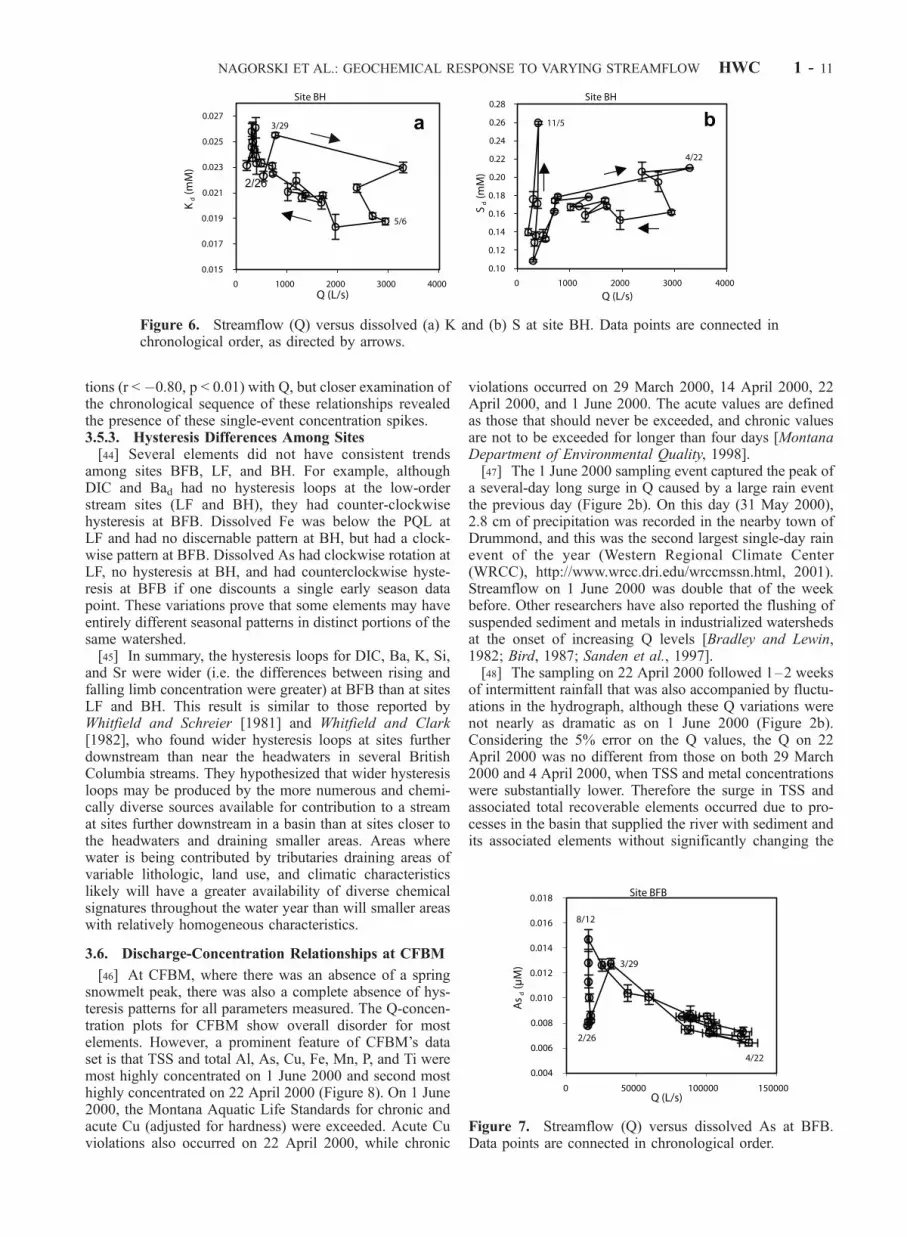
2000, following the sharpest hydrograph rise of the springrunoff event (Figures 4c and 4d). Similarly, at site LF therewere two main early-runoff peaks for TSS, Alt, Fet, Mnt,and Mnd that controlled the formation of their clockwisehysteresis loops (Figure 5).[41] At BH, spring flushing of K and S created clockwise
hysteresis loops for these elements (Figure 6). Dissolved Kconcentrations increased by 10% on 29 March 2000 com-pared with 26 February 2000, even though discharge hadalso increased (from 540 to 770 L/s). Concentrationsremained high through the end of April, after which theybegan to drop with decreases in Q. Potassium has beenidentified as being particularly mobile and easily leachablefrom organic materials; hence, flushing of Kd may haveoccurred due to a disproportionate amount of K being
transported out of adjacent soils at the early stages ofsnowmelt [Stottlemyer and Toczydlowski, 1990; Stottlemyerand Troendle, 1999]. Similarly, Sd dropped sharply afterrising with Q though 22 April 2000. It remained at relativelylow levels during much of the summer, when most othermajor ions were at their highest. Its largest concentrationpeak was in early November for unknown reasons. Interest-ingly, spring flushing of S was also observed at the samesite in 1998 by Nagorski et al. [2001]. Although S flushinghas been widely reported in the literature as occurring inwatersheds draining snowpacks with atmospherically-derived S [Schemenauer et al., 1985; Campbell et al.,1991], S flushing was observed at BH and not at nearbyLF in both study years. This indicates that the upstreamsulfur-rich mining sources, and not atmospheric inputs, in
Figure 3. Streamflow (Q) versus (a) water temperature at LF, (b) H+ at BFB, (c) TSS at BFB, (d)dissolved K at LF, (e) total recoverable Fe at BH, and (f ) dissolved S at BFB, all showing hysteresisrotation. Data points are connected in chronological order, as directed by arrows. The number ‘‘1’’indicates the first sampling date, for reference. Error bars represent the 95% confidence interval of themean value of the triplicate samples taken on each sampling event.
NAGORSKI ET AL.: GEOCHEMICAL RESPONSE TO VARYING STREAMFLOW HWC 1 - 9

the Blackfoot River basin were likely driving the S surgesduring high flow events.3.5.2. No Hysteresis[42] Alkalinity, Bad, Bat, Cad, Cat, Mgd, Mgt, and Srd
generally lacked open hysteresis loops at the sites. Thislack means that the rising and falling limb concentrationswere not distinct from one another or that there werecross-over patterns. Linear relationships without hystere-sis loops indicate that concentration variations are simplyin phase with Q variations. Such relationships can formwhen the different geochemical sources (e.g., soil water,groundwater and overland-flow water) mixing with baseflow contributions have indistinguishable chemical signa-tures, or when the same sources are regulating the solutechemistry in similar proportions on both the falling andrising limbs of the hydrograph [Evans and Davies, 1998].Cross-over patterns are formed by a few data pointsdisrupting an otherwise open loop pattern by residing
with the opposite set of rising limb or falling limb datapoints.[43] A lack of clear hysteresis patterns for some elements
at site BFB is explained by one or two data points from theearly stages of runoff that defy otherwise discernablepatterns. Specifically, Asd, Cad, Cat, Mgd, Mgt, and Srd atsite BFB would have had open counter-clockwise hysteresisloops if a single early event data point is not considered(Figure 7). These samples, which are characterized by adisproportionately large increase in concentration with theinitial rise in Q are evidence of spring flushing. Theyprobably indicate that significant portions of the meltwaterdid not enter the stream unaltered, but were first routedthrough mineral-rich soil zones, which presumably wereespecially concentrated following the winter months [Wil-liams and Melack, 1991; Campbell et al., 1995; Stottlemyeret al., 1997; Stottlemyer and Troendle, 1999]. It is importantto note that these elements had good overall linear correla-
Figure 4. Date versus (a) As, (b) S, (c) Fe, and (d) Mn at BFB, with peak concentrations specified bydate.
Figure 5. Streamflow (Q) versus (a) TSS and (b) total recoverable Fe at LF. Data points are connectedin chronological order, as directed by arrows.
HWC 1 - 10 NAGORSKI ET AL.: GEOCHEMICAL RESPONSE TO VARYING STREAMFLOW
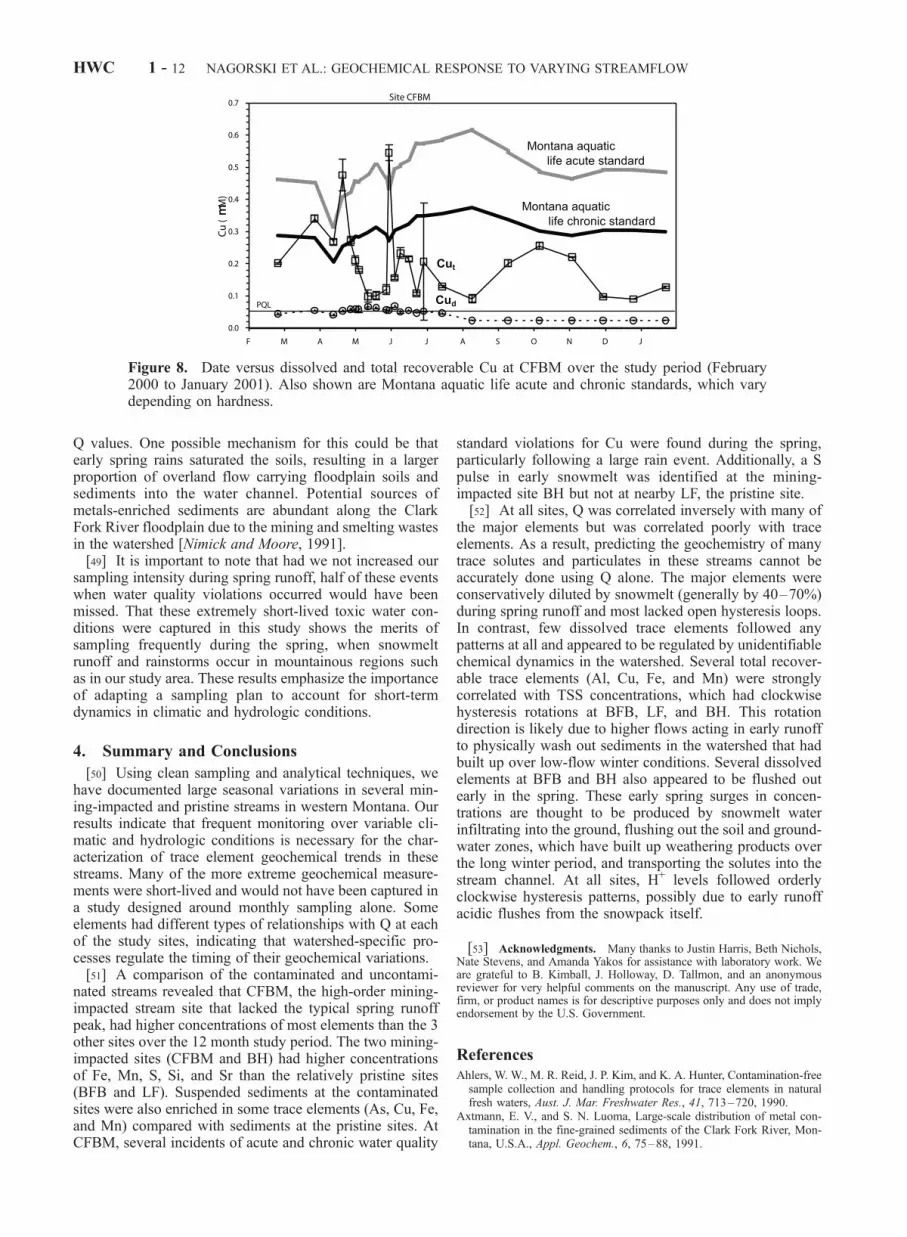
tions (r < �0.80, p < 0.01) with Q, but closer examination ofthe chronological sequence of these relationships revealedthe presence of these single-event concentration spikes.3.5.3. Hysteresis Differences Among Sites[44] Several elements did not have consistent trends
among sites BFB, LF, and BH. For example, althoughDIC and Bad had no hysteresis loops at the low-orderstream sites (LF and BH), they had counter-clockwisehysteresis at BFB. Dissolved Fe was below the PQL atLF and had no discernable pattern at BH, but had a clock-wise pattern at BFB. Dissolved As had clockwise rotation atLF, no hysteresis at BH, and had counterclockwise hyste-resis at BFB if one discounts a single early season datapoint. These variations prove that some elements may haveentirely different seasonal patterns in distinct portions of thesame watershed.[45] In summary, the hysteresis loops for DIC, Ba, K, Si,
and Sr were wider (i.e. the differences between rising andfalling limb concentration were greater) at BFB than at sitesLF and BH. This result is similar to those reported byWhitfield and Schreier [1981] and Whitfield and Clark[1982], who found wider hysteresis loops at sites furtherdownstream than near the headwaters in several BritishColumbia streams. They hypothesized that wider hysteresisloops may be produced by the more numerous and chemi-cally diverse sources available for contribution to a streamat sites further downstream in a basin than at sites closer tothe headwaters and draining smaller areas. Areas wherewater is being contributed by tributaries draining areas ofvariable lithologic, land use, and climatic characteristicslikely will have a greater availability of diverse chemicalsignatures throughout the water year than will smaller areaswith relatively homogeneous characteristics.
3.6. Discharge-Concentration Relationships at CFBM
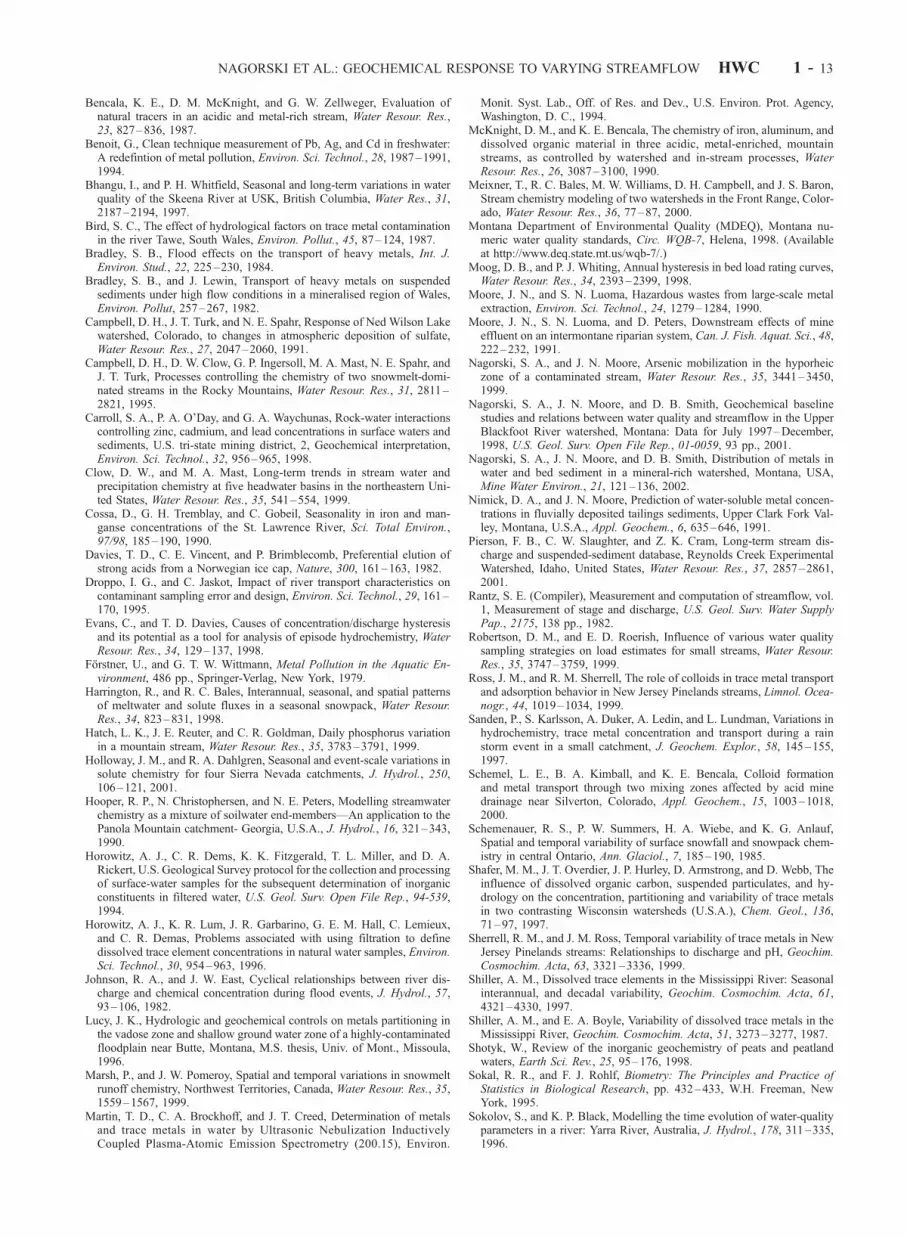
[46] At CFBM, where there was an absence of a springsnowmelt peak, there was also a complete absence of hys-teresis patterns for all parameters measured. The Q-concen-tration plots for CFBM show overall disorder for mostelements. However, a prominent feature of CFBM’s dataset is that TSS and total Al, As, Cu, Fe, Mn, P, and Ti weremost highly concentrated on 1 June 2000 and second mosthighly concentrated on 22 April 2000 (Figure 8). On 1 June2000, the Montana Aquatic Life Standards for chronic andacute Cu (adjusted for hardness) were exceeded. Acute Cuviolations also occurred on 22 April 2000, while chronic
violations occurred on 29 March 2000, 14 April 2000, 22April 2000, and 1 June 2000. The acute values are definedas those that should never be exceeded, and chronic valuesare not to be exceeded for longer than four days [MontanaDepartment of Environmental Quality, 1998].[47] The 1 June 2000 sampling event captured the peak of
a several-day long surge in Q caused by a large rain eventthe previous day (Figure 2b). On this day (31 May 2000),2.8 cm of precipitation was recorded in the nearby town ofDrummond, and this was the second largest single-day rainevent of the year (Western Regional Climate Center(WRCC), http://www.wrcc.dri.edu/wrccmssn.html, 2001).Streamflow on 1 June 2000 was double that of the weekbefore. Other researchers have also reported the flushing ofsuspended sediment and metals in industrialized watershedsat the onset of increasing Q levels [Bradley and Lewin,1982; Bird, 1987; Sanden et al., 1997].[48] The sampling on 22 April 2000 followed 1–2 weeks
of intermittent rainfall that was also accompanied by fluctu-ations in the hydrograph, although these Q variations werenot nearly as dramatic as on 1 June 2000 (Figure 2b).Considering the 5% error on the Q values, the Q on 22April 2000 was no different from those on both 29 March2000 and 4 April 2000, when TSS and metal concentrationswere substantially lower. Therefore the surge in TSS andassociated total recoverable elements occurred due to pro-cesses in the basin that supplied the river with sediment andits associated elements without significantly changing the
Figure 6. Streamflow (Q) versus dissolved (a) K and (b) S at site BH. Data points are connected inchronological order, as directed by arrows.
Figure 7. Streamflow (Q) versus dissolved As at BFB.Data points are connected in chronological order.
NAGORSKI ET AL.: GEOCHEMICAL RESPONSE TO VARYING STREAMFLOW HWC 1 - 11
Q values. One possible mechanism for this could be thatearly spring rains saturated the soils, resulting in a largerproportion of overland flow carrying floodplain soils andsediments into the water channel. Potential sources ofmetals-enriched sediments are abundant along the ClarkFork River floodplain due to the mining and smelting wastesin the watershed [Nimick and Moore, 1991].[49] It is important to note that had we not increased our
sampling intensity during spring runoff, half of these eventswhen water quality violations occurred would have beenmissed. That these extremely short-lived toxic water con-ditions were captured in this study shows the merits ofsampling frequently during the spring, when snowmeltrunoff and rainstorms occur in mountainous regions suchas in our study area. These results emphasize the importanceof adapting a sampling plan to account for short-termdynamics in climatic and hydrologic conditions.
4. Summary and Conclusions
[50] Using clean sampling and analytical techniques, wehave documented large seasonal variations in several min-ing-impacted and pristine streams in western Montana. Ourresults indicate that frequent monitoring over variable cli-matic and hydrologic conditions is necessary for the char-acterization of trace element geochemical trends in thesestreams. Many of the more extreme geochemical measure-ments were short-lived and would not have been captured ina study designed around monthly sampling alone. Someelements had different types of relationships with Q at eachof the study sites, indicating that watershed-specific pro-cesses regulate the timing of their geochemical variations.[51] A comparison of the contaminated and uncontami-
nated streams revealed that CFBM, the high-order mining-impacted stream site that lacked the typical spring runoffpeak, had higher concentrations of most elements than the 3other sites over the 12 month study period. The two mining-impacted sites (CFBM and BH) had higher concentrationsof Fe, Mn, S, Si, and Sr than the relatively pristine sites(BFB and LF). Suspended sediments at the contaminatedsites were also enriched in some trace elements (As, Cu, Fe,and Mn) compared with sediments at the pristine sites. AtCFBM, several incidents of acute and chronic water quality
standard violations for Cu were found during the spring,particularly following a large rain event. Additionally, a Spulse in early snowmelt was identified at the mining-impacted site BH but not at nearby LF, the pristine site.[52] At all sites, Q was correlated inversely with many of
the major elements but was correlated poorly with traceelements. As a result, predicting the geochemistry of manytrace solutes and particulates in these streams cannot beaccurately done using Q alone. The major elements wereconservatively diluted by snowmelt (generally by 40–70%)during spring runoff and most lacked open hysteresis loops.In contrast, few dissolved trace elements followed anypatterns at all and appeared to be regulated by unidentifiablechemical dynamics in the watershed. Several total recover-able trace elements (Al, Cu, Fe, and Mn) were stronglycorrelated with TSS concentrations, which had clockwisehysteresis rotations at BFB, LF, and BH. This rotationdirection is likely due to higher flows acting in early runoffto physically wash out sediments in the watershed that hadbuilt up over low-flow winter conditions. Several dissolvedelements at BFB and BH also appeared to be flushed outearly in the spring. These early spring surges in concen-trations are thought to be produced by snowmelt waterinfiltrating into the ground, flushing out the soil and ground-water zones, which have built up weathering products overthe long winter period, and transporting the solutes into thestream channel. At all sites, H+ levels followed orderlyclockwise hysteresis patterns, possibly due to early runoffacidic flushes from the snowpack itself.
[53] Acknowledgments. Many thanks to Justin Harris, Beth Nichols,Nate Stevens, and Amanda Yakos for assistance with laboratory work. Weare grateful to B. Kimball, J. Holloway, D. Tallmon, and an anonymousreviewer for very helpful comments on the manuscript. Any use of trade,firm, or product names is for descriptive purposes only and does not implyendorsement by the U.S. Government.
ReferencesAhlers, W. W., M. R. Reid, J. P. Kim, and K. A. Hunter, Contamination-freesample collection and handling protocols for trace elements in naturalfresh waters, Aust. J. Mar. Freshwater Res., 41, 713–720, 1990.
Axtmann, E. V., and S. N. Luoma, Large-scale distribution of metal con-tamination in the fine-grained sediments of the Clark Fork River, Mon-tana, U.S.A., Appl. Geochem., 6, 75–88, 1991.
Figure 8. Date versus dissolved and total recoverable Cu at CFBM over the study period (February2000 to January 2001). Also shown are Montana aquatic life acute and chronic standards, which varydepending on hardness.
HWC 1 - 12 NAGORSKI ET AL.: GEOCHEMICAL RESPONSE TO VARYING STREAMFLOW
Bencala, K. E., D. M. McKnight, and G. W. Zellweger, Evaluation ofnatural tracers in an acidic and metal-rich stream, Water Resour. Res.,23, 827–836, 1987.
Benoit, G., Clean technique measurement of Pb, Ag, and Cd in freshwater:A redefintion of metal pollution, Environ. Sci. Technol., 28, 1987–1991,1994.
Bhangu, I., and P. H. Whitfield, Seasonal and long-term variations in waterquality of the Skeena River at USK, British Columbia, Water Res., 31,2187–2194, 1997.
Bird, S. C., The effect of hydrological factors on trace metal contaminationin the river Tawe, South Wales, Environ. Pollut., 45, 87–124, 1987.
Bradley, S. B., Flood effects on the transport of heavy metals, Int. J.Environ. Stud., 22, 225–230, 1984.
Bradley, S. B., and J. Lewin, Transport of heavy metals on suspendedsediments under high flow conditions in a mineralised region of Wales,Environ. Pollut, 257–267, 1982.
Campbell, D. H., J. T. Turk, and N. E. Spahr, Response of Ned Wilson Lakewatershed, Colorado, to changes in atmospheric deposition of sulfate,Water Resour. Res., 27, 2047–2060, 1991.
Campbell, D. H., D. W. Clow, G. P. Ingersoll, M. A. Mast, N. E. Spahr, andJ. T. Turk, Processes controlling the chemistry of two snowmelt-domi-nated streams in the Rocky Mountains, Water Resour. Res., 31, 2811–2821, 1995.
Carroll, S. A., P. A. O’Day, and G. A. Waychunas, Rock-water interactionscontrolling zinc, cadmium, and lead concentrations in surface waters andsediments, U.S. tri-state mining district, 2, Geochemical interpretation,Environ. Sci. Technol., 32, 956–965, 1998.
Clow, D. W., and M. A. Mast, Long-term trends in stream water andprecipitation chemistry at five headwater basins in the northeastern Uni-ted States, Water Resour. Res., 35, 541–554, 1999.
Cossa, D., G. H. Tremblay, and C. Gobeil, Seasonality in iron and man-ganse concentrations of the St. Lawrence River, Sci. Total Environ.,97/98, 185–190, 1990.
Davies, T. D., C. E. Vincent, and P. Brimblecomb, Preferential elution ofstrong acids from a Norwegian ice cap, Nature, 300, 161–163, 1982.
Droppo, I. G., and C. Jaskot, Impact of river transport characteristics oncontaminant sampling error and design, Environ. Sci. Technol., 29, 161–170, 1995.
Evans, C., and T. D. Davies, Causes of concentration/discharge hysteresisand its potential as a tool for analysis of episode hydrochemistry, WaterResour. Res., 34, 129–137, 1998.
Forstner, U., and G. T. W. Wittmann, Metal Pollution in the Aquatic En-vironment, 486 pp., Springer-Verlag, New York, 1979.
Harrington, R., and R. C. Bales, Interannual, seasonal, and spatial patternsof meltwater and solute fluxes in a seasonal snowpack, Water Resour.Res., 34, 823–831, 1998.
Hatch, L. K., J. E. Reuter, and C. R. Goldman, Daily phosphorus variationin a mountain stream, Water Resour. Res., 35, 3783–3791, 1999.
Holloway, J. M., and R. A. Dahlgren, Seasonal and event-scale variations insolute chemistry for four Sierra Nevada catchments, J. Hydrol., 250,106–121, 2001.
Hooper, R. P., N. Christophersen, and N. E. Peters, Modelling streamwaterchemistry as a mixture of soilwater end-members—An application to thePanola Mountain catchment- Georgia, U.S.A., J. Hydrol., 16, 321–343,1990.
Horowitz, A. J., C. R. Dems, K. K. Fitzgerald, T. L. Miller, and D. A.Rickert, U.S. Geological Survey protocol for the collection and processingof surface-water samples for the subsequent determination of inorganicconstituents in filtered water, U.S. Geol. Surv. Open File Rep., 94-539,1994.
Horowitz, A. J., K. R. Lum, J. R. Garbarino, G. E. M. Hall, C. Lemieux,and C. R. Demas, Problems associated with using filtration to definedissolved trace element concentrations in natural water samples, Environ.Sci. Technol., 30, 954–963, 1996.
Johnson, R. A., and J. W. East, Cyclical relationships between river dis-charge and chemical concentration during flood events, J. Hydrol., 57,93–106, 1982.
Lucy, J. K., Hydrologic and geochemical controls on metals partitioning inthe vadose zone and shallow ground water zone of a highly-contaminatedfloodplain near Butte, Montana, M.S. thesis, Univ. of Mont., Missoula,1996.
Marsh, P., and J. W. Pomeroy, Spatial and temporal variations in snowmeltrunoff chemistry, Northwest Territories, Canada, Water Resour. Res., 35,1559–1567, 1999.
Martin, T. D., C. A. Brockhoff, and J. T. Creed, Determination of metalsand trace metals in water by Ultrasonic Nebulization InductivelyCoupled Plasma-Atomic Emission Spectrometry (200.15), Environ.
Monit. Syst. Lab., Off. of Res. and Dev., U.S. Environ. Prot. Agency,Washington, D. C., 1994.
McKnight, D. M., and K. E. Bencala, The chemistry of iron, aluminum, anddissolved organic material in three acidic, metal-enriched, mountainstreams, as controlled by watershed and in-stream processes, WaterResour. Res., 26, 3087–3100, 1990.
Meixner, T., R. C. Bales, M. W. Williams, D. H. Campbell, and J. S. Baron,Stream chemistry modeling of two watersheds in the Front Range, Color-ado, Water Resour. Res., 36, 77–87, 2000.
Montana Department of Environmental Quality (MDEQ), Montana nu-meric water quality standards, Circ. WQB-7, Helena, 1998. (Availableat http://www.deq.state.mt.us/wqb-7/.)
Moog, D. B., and P. J. Whiting, Annual hysteresis in bed load rating curves,Water Resour. Res., 34, 2393–2399, 1998.
Moore, J. N., and S. N. Luoma, Hazardous wastes from large-scale metalextraction, Environ. Sci. Technol., 24, 1279–1284, 1990.
Moore, J. N., S. N. Luoma, and D. Peters, Downstream effects of mineeffluent on an intermontane riparian system, Can. J. Fish. Aquat. Sci., 48,222–232, 1991.
Nagorski, S. A., and J. N. Moore, Arsenic mobilization in the hyporheiczone of a contaminated stream, Water Resour. Res., 35, 3441–3450,1999.
Nagorski, S. A., J. N. Moore, and D. B. Smith, Geochemical baselinestudies and relations between water quality and streamflow in the UpperBlackfoot River watershed, Montana: Data for July 1997–December,1998, U.S. Geol. Surv. Open File Rep., 01-0059, 93 pp., 2001.
Nagorski, S. A., J. N. Moore, and D. B. Smith, Distribution of metals inwater and bed sediment in a mineral-rich watershed, Montana, USA,Mine Water Environ., 21, 121–136, 2002.
Nimick, D. A., and J. N. Moore, Prediction of water-soluble metal concen-trations in fluvially deposited tailings sediments, Upper Clark Fork Val-ley, Montana, U.S.A., Appl. Geochem., 6, 635–646, 1991.
Pierson, F. B., C. W. Slaughter, and Z. K. Cram, Long-term stream dis-charge and suspended-sediment database, Reynolds Creek ExperimentalWatershed, Idaho, United States, Water Resour. Res., 37, 2857–2861,2001.
Rantz, S. E. (Compiler), Measurement and computation of streamflow, vol.1, Measurement of stage and discharge, U.S. Geol. Surv. Water SupplyPap., 2175, 138 pp., 1982.
Robertson, D. M., and E. D. Roerish, Influence of various water qualitysampling strategies on load estimates for small streams, Water Resour.Res., 35, 3747–3759, 1999.
Ross, J. M., and R. M. Sherrell, The role of colloids in trace metal transportand adsorption behavior in New Jersey Pinelands streams, Limnol. Ocea-nogr., 44, 1019–1034, 1999.
Sanden, P., S. Karlsson, A. Duker, A. Ledin, and L. Lundman, Variations inhydrochemistry, trace metal concentration and transport during a rainstorm event in a small catchment, J. Geochem. Explor., 58, 145–155,1997.
Schemel, L. E., B. A. Kimball, and K. E. Bencala, Colloid formationand metal transport through two mixing zones affected by acid minedrainage near Silverton, Colorado, Appl. Geochem., 15, 1003–1018,2000.
Schemenauer, R. S., P. W. Summers, H. A. Wiebe, and K. G. Anlauf,Spatial and temporal variability of surface snowfall and snowpack chem-istry in central Ontario, Ann. Glaciol., 7, 185–190, 1985.
Shafer, M. M., J. T. Overdier, J. P. Hurley, D. Armstrong, and D. Webb, Theinfluence of dissolved organic carbon, suspended particulates, and hy-drology on the concentration, partitioning and variability of trace metalsin two contrasting Wisconsin watersheds (U.S.A.), Chem. Geol., 136,71–97, 1997.
Sherrell, R. M., and J. M. Ross, Temporal variability of trace metals in NewJersey Pinelands streams: Relationships to discharge and pH, Geochim.Cosmochim. Acta, 63, 3321–3336, 1999.
Shiller, A. M., Dissolved trace elements in the Mississippi River: Seasonalinterannual, and decadal variability, Geochim. Cosmochim. Acta, 61,4321–4330, 1997.
Shiller, A. M., and E. A. Boyle, Variability of dissolved trace metals in theMississippi River, Geochim. Cosmochim. Acta, 51, 3273–3277, 1987.
Shotyk, W., Review of the inorganic geochemistry of peats and peatlandwaters, Earth Sci. Rev., 25, 95–176, 1998.
Sokal, R. R., and F. J. Rohlf, Biometry: The Principles and Practice ofStatistics in Biological Research, pp. 432–433, W.H. Freeman, NewYork, 1995.
Sokolov, S., and K. P. Black, Modelling the time evolution of water-qualityparameters in a river: Yarra River, Australia, J. Hydrol., 178, 311–335,1996.
NAGORSKI ET AL.: GEOCHEMICAL RESPONSE TO VARYING STREAMFLOW HWC 1 - 13

Spence, L. E., Upper Blackfoot River Study: A preliminary inventory ofaquatic and wildlife resources, 86 pp., Mont. Dep. of Fish and Game,Environ. and Inf. Div., Helena, 1975.
Stoddard, J. L., Alkalinity dynamics in an unacidified alpine lake, SierraNevada, California, Limnol. Oceanogr., 32, 825–839, 1987.
Stottlemyer, R., and D. Toczydlowski, Pattern of solute movement fromsnow into an upper Michigan stream, Can. J. Fish. Aquat. Sci., 47,290–300, 1990.
Stottlemyer, R., and C. A. Troendle, Nutrient concentration patterns instreams draining alpine and subalpine catchments, Fraser ExperimentalForest, Colorado, J. Hydrol., 140, 179–208, 1992.
Stottlemyer, R., and C. A. Troendle, Effect of subalpine canopy removal onsnowpack, soil solution, and nutrient export, Fraser Experimental Forest,CO, Hydrol. Process., 13, 2287–2299, 1999.
Stottlemyer, R., C. A. Troendle, and D. Markowitz, Change in snow-pack, soil water, and streamwater chemistry with elevation during1990, Fraser Experimental Forest, Colorado, J. Hydrol., 195, 14–136, 1997.
Sullivan, A. B., and J. I. Drever, Spatiotemporal variability in stream chem-istry in a high-elevation catchment affected by mine drainage, J. Hydrol.,252, 237–250, 2001.
Taylor, H. E., and A. M. Shiller, Mississippi River methods comparisonstudy: Implications for water quality monitoring of dissolved trace ele-ments, Environ. Sci. Technol., 29, 1313–1317, 1995.
Tranter, M., P. W. Abrahams, I. L. Blackwood, P. Brimblecombe, and T. D.Davies, The impact of a single black snowfall on streamwater chemistryin the Scottish Highlands, Nature, 332, 826–829, 1988.
Tsiouris, S., C. E. Vincent, T. D. Davies, and P. Brimblecombe, The elutionof ions through field and laboratory snowpacks, Ann. Glaciol., 7, 196–201, 1985.
U. S. Environmental Protection Agency, Methods for the determinationof metals in environmental samples, revision 2.3, EPA/6004-91/010,Washington, D. C., June 1991.
Wetherbee, G. A., and B. A. Kimball, Use of environmental variables toestimate metal loads in streams, upper Arkansas River basin, Colorado,in U.S. Geological Survey Toxic Substances Hydrology Program: Pro-ceedings of the Technical Meeting, Monterey, CA, March 1-15, 1991,edited by G. E. Mallard and D. A. Aronson, Water Resour. Invest. Rep.,91-4034, 398–406, 1991.
Whitfield, P. H., and M. J. R. Clark, Patterns of water quality in the RockyMountains of British Columbia, in Science and the Management of Pro-tected Areas, edited by J. H. M. Wilson et al., pp. 391–409, Elsevier Sci.,New York, 1982.
Whitfield, P. H., and H. Schreier, Hysteresis relationshps between dischargeand water chemistry in the Fraser River basin, British Columbia, Limnol.Oceanogr., 26, 1179–1182, 1981.
Williams, G. P., Sediment concentration versus water discharge duringsingle hydrologic events in rivers, J. Hydrol., 111, 89–106, 1989.
Williams, M. W., and J. M. Melack, Solute chemistry of snowmelt andrunoff in an alpine basin, Sierra Nevada, Water Resour. Res., 27,1575–1588, 1991.
Williams, M. W., R. C. Bales, A. D. Brown, and J. M. Melack, Geochem-ical and hydrologic controls on the composition of surface water in ahigh-elevation basin, Sierra Nevada, California, Limnol. Oceanogr., 38,775–797, 1993.
Windom, H. L., J. T. Byrd, G. Smith, and F. Huan, Inadequacy of NAS-QAN data for assessing trace metal trends in the nation’s rivers, Environ.Sci. Technol., 25, 1137–1142, 1991.
����������������������������T. E. McKinnon, Texas Water Development Board, P.O. Box 13231,
Austin, TX 78711-3231, USA.
J. N. Moore and S. A. Nagorski, Department of Geology, University ofMontana, Missoula, MN 59812, USA. (gl_ [email protected])
D. B. Smith, U.S. Geological Survey, Denver, CO 80203, USA.
HWC 1 - 14 NAGORSKI ET AL.: GEOCHEMICAL RESPONSE TO VARYING STREAMFLOW