Study of acoustic cavitation near metal surfaces contaminated ...
214
HAL Id: tel-02282007 https://tel.archives-ouvertes.fr/tel-02282007 Submitted on 9 Sep 2019 HAL is a multi-disciplinary open access archive for the deposit and dissemination of sci- entific research documents, whether they are pub- lished or not. The documents may come from teaching and research institutions in France or abroad, or from public or private research centers. L’archive ouverte pluridisciplinaire HAL, est destinée au dépôt et à la diffusion de documents scientifiques de niveau recherche, publiés ou non, émanant des établissements d’enseignement et de recherche français ou étrangers, des laboratoires publics ou privés. Study of acoustic cavitation near metal surfaces contaminated by uranium Ran Ji To cite this version: Ran Ji. Study of acoustic cavitation near metal surfaces contaminated by uranium. Other. Université Montpellier, 2018. English. NNT : 2018MONTS131. tel-02282007
-
Upload
khangminh22 -
Category
Documents
-
view
1 -
download
0
Transcript of Study of acoustic cavitation near metal surfaces contaminated ...

HAL Id: tel-02282007https://tel.archives-ouvertes.fr/tel-02282007
Submitted on 9 Sep 2019
HAL is a multi-disciplinary open accessarchive for the deposit and dissemination of sci-entific research documents, whether they are pub-lished or not. The documents may come fromteaching and research institutions in France orabroad, or from public or private research centers.
L’archive ouverte pluridisciplinaire HAL, estdestinée au dépôt et à la diffusion de documentsscientifiques de niveau recherche, publiés ou non,émanant des établissements d’enseignement et derecherche français ou étrangers, des laboratoirespublics ou privés.
Study of acoustic cavitation near metal surfacescontaminated by uranium
Ran Ji
To cite this version:Ran Ji. Study of acoustic cavitation near metal surfaces contaminated by uranium. Other. UniversitéMontpellier, 2018. English. �NNT : 2018MONTS131�. �tel-02282007�

Rapport de gestion
2015
THÈ SE POUR OBTENIR LE GRADE DE DOCTEUR
DE L’UNIVERSITÉ DE MONTPELLIER
En Chimie Sé parative - Maté riaux et Procé dé s
É cole doctorale Sciences Chimiques Balard (ED 459)
Unité de recherche Institut de Chimie Sé parative de Marcoule (UMR 5257)
Pré senté e par Ran JI
Le 13 novembre 2018
Sous la direction de Sergueï NIKITENKO
Devant le jury composé de
[Jean-Franç ois DUFÊ CHE, Prof, Université Montpellier]
[Jean-Yves HIHN, Prof, Université de Franche-Comté ]
[Laurie BARTHE, MCF, INP Toulouse]
[Sergueï NIKITENKO, DR, CNRS Montpellier]
[Claire LE NAOUR, CR, Université Paris Saclay]
[Micheline DRAYE, Prof, Université Savoie Mont Blanc]
[Rachel PFLIEGER, CR, CEA Marcoule]
[Matthieu VIROT, CR, CEA Marcoule]
[Pascal PILUSO, CR, CEA Cadarache]
[Pré sident]
[Rapporteur]
[Rapporteur]
[Directeur de Thè se]
[Examinateur]
[Examinateur]
[Encadrant]
[Encadrant]
[Invité ]
Study of Acoust ic Cavitat ion near Metal Surfaces
Contaminated by Uranium


“The unity of inner knowledge and action”
[Wang Yangming]


Acknowledgements
i
Acknowledgements
The doctoral study of the past three years has greatly enriched my experience in academic and personal
life. I would like to express my gratitude to my supervisors, colleagues, friends and family. Without
their advice, assistance and support, the present work would not have been accomplished. I am also very
grateful to all the jury members of my thesis defense for their comments and suggestions.
First and foremost, I would like to give my appreciation to my supervisor: Dr. Sergey Nikitenko, and
my co-supervisors: Dr. Rachel Pflieger and Dr. Matthieu Virot. I am very fortunate and grateful to have
such an opportunity to work on this topic under their guidance. Each of my publications and
presentations has their invaluable contributions on countless discussions and encouragements. Without
their insight and in-depth knowledge, this work could never have reached its present form.
I would like to thank my colleague Dr. Tony Chave for his patience in explaining the use of laboratory
equipment and the meaning of many French words. I owe my thanks to Dr. Renaud Podor, Dr. Joseph
Lautru and Xavier le Goff, who helped me with SEM, EDX analysis and 3D reconstruction
measurements.
I appreciate all the people I met at ICSM during the past few years. It is a pleasure to work with them in
such a good atmosphere. I am especially grateful to Danwen Qin, Elodie Dalodiere, Lauréanne Parizot,
Témim Ouerhani and Laura Bonato for their kind help, friendship and amusement. We have had a lot
of good times together, especially the countless and delicious dinners with Danwen (the best Chinese
cuisine master in Avignon).
Finally, my ultimate and special thanks must be attributed to my mother, my father and my girlfriend,
for their love, unconditional support and unwavering confidence.

ii

Résumé
iii
Résumé
Le démantèlement des réacteurs et usines de l’industrie nucléaire produit un grand volume de matériaux
métalliques contaminés. Parmi ceux-ci, les alliages à base de magnésium issus des réacteurs UNGG sont
connus pour être des métaux hautement réactifs présentant un risque élevé de corrosion et pouvant
générer de l'hydrogène gazeux qui peut causer de graves dommages pendant le stockage. Afin de réduire
le volume d’effluents radioactifs générés et de déclasser les déchets nucléaires, la sonochimie peut être
considérée comme une alternative efficace pour la décontamination des surfaces métalliques. La
sonochimie traite des effets des ondes ultrasonores sur les réactions chimiques en solution. Les effets
observés en sonochimie proviennent du phénomène de cavitation acoustique, qui comprend la
nucléation, croissance et effondrement implosif et rapide de microbulles remplies de gaz et de vapeur
de solvant. Des espèces excitées ainsi que des radicaux peuvent être générés lors de son implosion. Le
plasma formé au cœur de la bulle permet l’émission de lumière se propageant de l’UV au proche IR
(sonoluminescence). Lorsque l’effondrement des bulles a lieu à proximité d'une surface solide étendue,
la formation d’ondes de choc violentes et de micro-jets dirigés vers la surface contribue fortement au
nettoyage, à la dépassivation et à la décontamination de surfaces métalliques.
Cette étude cible la décontamination de surfaces métalliques à base de magnésium sous irradiation
ultrasonore. Après une synthèse bibliographique permettant de faire un état de l’art sur le traitement de
surfaces métalliques par ultrasons de puissance, les outils expérimentaux et techniques analytiques
utilisés dans ce travail sont décrits. La partie résultats et discussion est ensuite présentée selon trois
chapitres distincts visant : 1) une étude fondamentale de sonoluminescence à 100 kHz permettant la
caractérisation du phénomène de cavitation acoustique à proximité de surfaces solides étendues ; 2)
l’étude de la structuration de surfaces de Mg sous irradiation ultrasonore ; 3) le traitement ultrasonore
de surfaces métalliques radioactives contaminées au laboratoire avec de l’uranium naturel.
Ce travail met en évidence le fort impact de la fréquence ultrasonore sur l'activité sonochimique, sa
distribution spatiale et sur les effets générés sur des échantillons de magnésium. Une répartition spatiale
homogène de l'activité sonochimique est observée aux fréquences ≥ 100 kHz. Les résultats confirment
que l'effondrement asymétrique des bulles est susceptible de se produire à proximité des surfaces solides
étendues. La formation d’une structure allongée semblable à une balle de golf est observée pour des
fréquences comprises entre 100 et 362 kHz. De telles architectures résultent de la dissolution
sonochimique contrôlée de la surface de Mg. Il est probable que la nucléation hétérogène assurée par la
création de défauts sous ultrasons combiné à la libération de gaz H2 soient à l'origine de cette
structuration. Les essais réalisés sur un alliage Mg-Zr montrent un comportement similaire permettant
de simuler le comportement d’une gaine de réacteur UNGG. La décontamination rapide et totale de ces

Résumé
iv
différents matériaux est observée en milieu oxalique dilué à 20°C. Un faible et lent processus de
recontamination des matériaux à base de Mg est observé du fait de l'adsorption d’uranyle par la brucite
formée sur les surfaces. Les essais réalisés sur des échantillons à géométrie complexe permettent
également de souligner le fort potentiel de la sonochimie pour la décontamination efficace de surfaces
à base de Mg.

Abstract
v
Abstract
The dismantling of UNGG reactors produces large volumes of contaminated metallic materials. Among
these, magnesium-based alloys which are known as highly reactive metals, have a high risk of corrosion
and can generate hydrogen gas that can cause serious damages during storage. In order to reduce the
volume of generated radioactive effluents and downgrade nuclear wastes, sonochemistry can be
considered as an original and efficient alternative for metallic surface decontamination. Sonochemistry
deals with the effects of ultrasound waves on chemical reactions in solution. The effects observed in
sonochemistry originate from the acoustic cavitation phenomenon, which is the nucleation, growth and
rapid implosive collapse of gas and vapor filled microbubbles. Excited species and radicals can be
generated in the formed plasma and light (sonoluminescence) is emitted. When the bubble collapse takes
place in the vicinity of a solid surface, it produces violent shock waves and microjets directed towards
the surface. These physical effects strongly contribute in ultrasonic cleaning, surface depassivation and
decontamination.
This study focuses on the decontamination of magnesium metal surfaces under ultrasonic irradiation.
After a bibliographic synthesis making a state of the art on the treatment of metallic surfaces by
ultrasonic power, the experimental tools and analytical techniques used in this work are described. The
results and discussion section are then presented in three separate chapters: 1) a fundamental 100 kHz
sonoluminescence study for the characterization of the acoustic cavitation phenomenon in solution and
near extended solid surfaces; 2) a study of the structuring of Mg-based surfaces under ultrasonic
irradiation; 3) Ultrasonic treatment of radioactive metal surfaces contaminated in the laboratory with
natural uranium.
This work highlights the strong impact of ultrasonic frequency on sonochemical activity, its spatial
distribution and the effects generated on magnesium samples. A homogeneous spatial distribution of
sonochemical activity is observed at frequencies ≥ 100 kHz. The results confirm that asymmetrical
bubble collapse is likely to occur near extended solid surfaces. The formation of an elongated structure
similar to a golf ball is observed for frequencies between 100 and 362 kHz. Such architectures result
from controlled sonochemical dissolution of the Mg surface. It is likely that the heterogeneous
nucleation provided by the creation of ultrasonic flaws combined with the release of H2 gas is at the
origin of this structuring. The tests carried out on a Mg-Zr alloy show a similar behavior making it
possible to simulate the behavior of a UNGG reactor cladding. Rapid and total decontamination of these
different materials is observed in dilute oxalic medium at 20°C. A low and slow recontamination process
of Mg-based materials is observed due to uranyl adsorption by brucite formed on the surfaces. Tests on
samples with complex geometry also highlight the high potential of sonochemistry for effective
decontamination of Mg-based surfaces.

Abstract
vi
Foreword
vii
Foreword
The work presented in this thesis manuscript has been the subject of several scientific communications
detailed hereinafter:
Award
Best oral presentation award from the Asia-Oceania Sonochemical Society (AOSS-3), Structuration of
Magnesium Surface by Acoustic Cavitation, September 14th to 16th 2017, Kattankulathur, Chennai, India.
Publications
R. Ji, R. Pflieger, M. Virot, and S. I. Nikitenko, Multibubble Sonochemistry and Sonoluminescence at
100 kHz: The Missing Link between Low- and High-Frequency Ultrasound The Journal of Physical
Chemistry B 122 (2018) 6989–6994.
R. Ji, M. Virot, R. Pflieger, R. Podor, X. Le Goff, S. I. Nikitenko, Controlled “Golf Ball Shape”
Structuring of Mg Surface under Acoustic Cavitation Ultrasonics Sonochemistry 40 (2017) 30-40.
Communications (talks)
Acoustic Cavitation at Intermediate Frequency (100 kHz) Ultrasound, 16th Meeting of the European
Society of Sonochemistry (ESS 16th), April 15th to 19th 2018, Besançon, France.
Structuration of Magnesium Surface by Acoustic Cavitation, 3rd Asia - Oceania Sonochemical Society
conference (AOSS-3rd), September 14th to 16th 2017, Kattankulathur, Chennai, India.
Structuration of Magnesium Surface by Acoustic Cavitation, Journées Scientifiques Ultrasons et
Procédés (JSUP IV), July 4th to 5th 2017, Toulouse, France.
Poster presentations
R. Ji, M. Virot, R. Pflieger, S. I. Nikitenko, Mg Surface Decontamination by Power Ultrasound in
Aqueous Solution, Journées scientifiques de Marcoule, 2018, Bagnols sur Cèze, France.
R. Ji, M. Virot, R. Pflieger, S. I. Nikitenko, Structuration of Magnesium Surface by Acoustic Cavitation,
Journées scientifiques de Marcoule, 2017, Bagnols sur Cèze, France.
R. Ji, M. Virot, R. Pflieger, S. I. Nikitenko, Acoustic Cavitation near Metal Surfaces Contaminated with
Radionuclides, XVèmes Journées Nationales de Radiochimie et de Chimie Nucléaire, September 8th to
9th 2016, Nice, France.
R. Ji, M. Virot, R. Pflieger, S. I. Nikitenko, Acoustic Cavitation near Metal Surfaces Contaminated with
Radionuclides, Journées scientifiques de Marcoule, 2016, Bagnols sur Cèze, France.

Foreword
viii

Contents
ix
Contents
ACKNOWLEDGEMENTS ..................................................................................................................................... I
RESUME .......................................................................................................................................................... III
ABSTRACT ........................................................................................................................................................ V
FOREWORD .................................................................................................................................................... VII
CONTENTS ....................................................................................................................................................... IX
TABLE OF FIGURES ........................................................................................................................................ XIII
LIST OF TABLES ............................................................................................................................................ XXIII
INTRODUCTION ................................................................................................................................................ 1
CHAPTER I. BIBLIOGRAPHY ........................................................................................................................ 3
I.1 ULTRASOUND AND SONOCHEMISTRY ................................................................................................................... 5
I.1.1 Ultrasound ......................................................................................................................................... 5
I.1.2 Acoustic cavitation ............................................................................................................................ 6
I.1.3 Sonochemistry ................................................................................................................................. 12
I.1.4 Sonoluminescence ........................................................................................................................... 13
I.1.5 Dependence of sonochemistry and sonoluminescence on various factors...................................... 16
I.2 ULTRASONIC MODIFICATION AND CLEANING OF SOLID SURFACES ............................................................................ 21
I.2.1 Ultrasonic modification of solid surfaces ........................................................................................ 22
I.2.2 Ultrasonic cleaning of solid surfaces ............................................................................................... 26
I.3 DECONTAMINATION OF UNGG RADIOACTIVE STRUCTURE MATERIALS ..................................................................... 27
I.3.1 UNGG reactors ................................................................................................................................ 27
I.3.2 Nuclear reactor cladding material: Mg-Zr alloy and stainless steel ................................................ 35
I.3.3 Radioactive waste and decontamination method .......................................................................... 40
CHAPTER II. MATERIALS AND METHODS .................................................................................................. 51
II.1 MATERIALS ............................................................................................................................................. 53
II.2 PREPARATION OF CONTAMINATED METALLIC SURFACES .................................................................................... 54
II.3 APPARATUS ............................................................................................................................................. 54
II.4 CALIBRATION AND CHARACTERIZATION OF THE SONOREACTORS ......................................................................... 57
II.4.1 Calorimetric method ........................................................................................................................ 57
II.4.2 Formation of H2O2 by water sonolysis ............................................................................................. 59
II.5 CHARACTERIZATION METHOD ...................................................................................................................... 60
II.5.1 Solid characterization ...................................................................................................................... 60

Contents
x
II.5.2 Solution characterization ................................................................................................................ 66
II.5.3 Gas characterization ....................................................................................................................... 66
II.5.4 Cavitation characterization ............................................................................................................. 67
CHAPTER III. ACOUSTIC CAVITATION BEHAVIOR AT 100 KHZ AND IN THE VICINITY OF A SOLID BOUNDARY
69
III.1 INTRODUCTION ........................................................................................................................................ 71
III.2 SONOCHEMISTRY AND SONOLUMINESCENCE IN AQUEOUS SOLUTION AT 100 KHZ .................................................. 71
III.2.1 Sonochemical activity and SCL at different ultrasonic frequencies ............................................. 72
III.2.2 Sonoluminescence photos and spectra at different ultrasonic frequencies ................................ 74
III.3 SONOCHEMISTRY AND SONOLUMINESCENCE IN THE VICINITY OF A SOLID BOUNDARY .............................................. 80
III.3.1 Fixed stainless steel plate ............................................................................................................ 81
III.3.2 Mobile stainless steel plate and Mg disc .................................................................................... 86
III.4 CONCLUSION ........................................................................................................................................... 91
CHAPTER IV. METALLIC SURFACE STRUCTURATION BY ULTRASOUND ....................................................... 93
IV.1 INTRODUCTION ........................................................................................................................................ 95
IV.2 STRUCTURATION OF MG-BASED MATERIAL SURFACES BY ULTRASOUND................................................................ 95
IV.2.1 Characterization of native Mg surfaces ...................................................................................... 95
IV.2.2 Frequency effect on Mg surface sonication ................................................................................ 97
IV.2.3 Solutions effect on Mg surface sonication ................................................................................ 103
IV.2.4 Stirring velocity effect on Mg surface sonication ...................................................................... 112
IV.2.5 Evolution of Mg surfaces sonicated at 200 kHz in oxalic acid ................................................... 113
IV.2.6 Sonication of Mg-Zr surfaces .................................................................................................... 116
IV.3 CONCLUSION ......................................................................................................................................... 121
CHAPTER V. METALLIC SURFACE DECONTAMINATION BY ULTRASOUND ................................................ 123
V.1 INTRODUCTION ...................................................................................................................................... 125
V.2 MG BASED MATERIAL SURFACES DECONTAMINATION BY ULTRASOUND .............................................................. 125
V.2.1 Characterization of UNGG cladding material and the contaminates on Mg based surfaces ........ 125
V.2.2 Ultrasonic decontamination results .............................................................................................. 133
V.3 STAINLESS STEEL SURFACES DECONTAMINATION BY ULTRASOUND ..................................................................... 142
V.3.1 Characterization of stainless steel and the contaminates on stainless steel surfaces .................. 142
V.3.2 Ultrasonic decontamination results .............................................................................................. 144
V.4 CONCLUSION ......................................................................................................................................... 148
GENERAL CONCLUSION ................................................................................................................................ 151
REFERENCES ................................................................................................................................................. 155
Contents
xi
APPENDIXES ................................................................................................................................................. 175
APPENDIX A: CALORIMETRIC RESULTS ...................................................................................................................... 175
APPENDIX B: MOLAR EXTINCTION COEFFICIENT DETERMINATION ................................................................................ 178
APPENDIX C: H2 FORMATION DETERMINATION DURING MS MEASUREMENT ................................................................... 179
APPENDIX D: SPECTRAL WAVELENGTH CALIBRATION AND QUANTUM EFFICIENCIES OF GRATINGS AND CCD ........................... 180
APPENDIX E: SIMULATION OF SL SPECTRA WITH SPECAIR SOFTWARE ............................................................................. 180
APPENDIX F: SL EMISSION ABSORPTION BY H2O2 ....................................................................................................... 181
APPENDIX G: MG SURFACE TOPOGRAPHY TREATED AT 665 KHZ ................................................................................... 182
APPENDIX H: SCL PHOTOS .................................................................................................................................... 182
APPENDIX I: INFRARED AND RAMAN BANDS .............................................................................................................. 183
APPENDIX J: ALPHA SPECTRA OF MG-ZR SURFACE DECONTAMINATION .......................................................................... 185

xii
Table of figures
xiii
Table of figures
Figure I-1 Ultrasound frequency category.[3] ......................................................................................... 5
Figure I-2 Acoustic cavitation generation and collapse.[11] .................................................................... 7
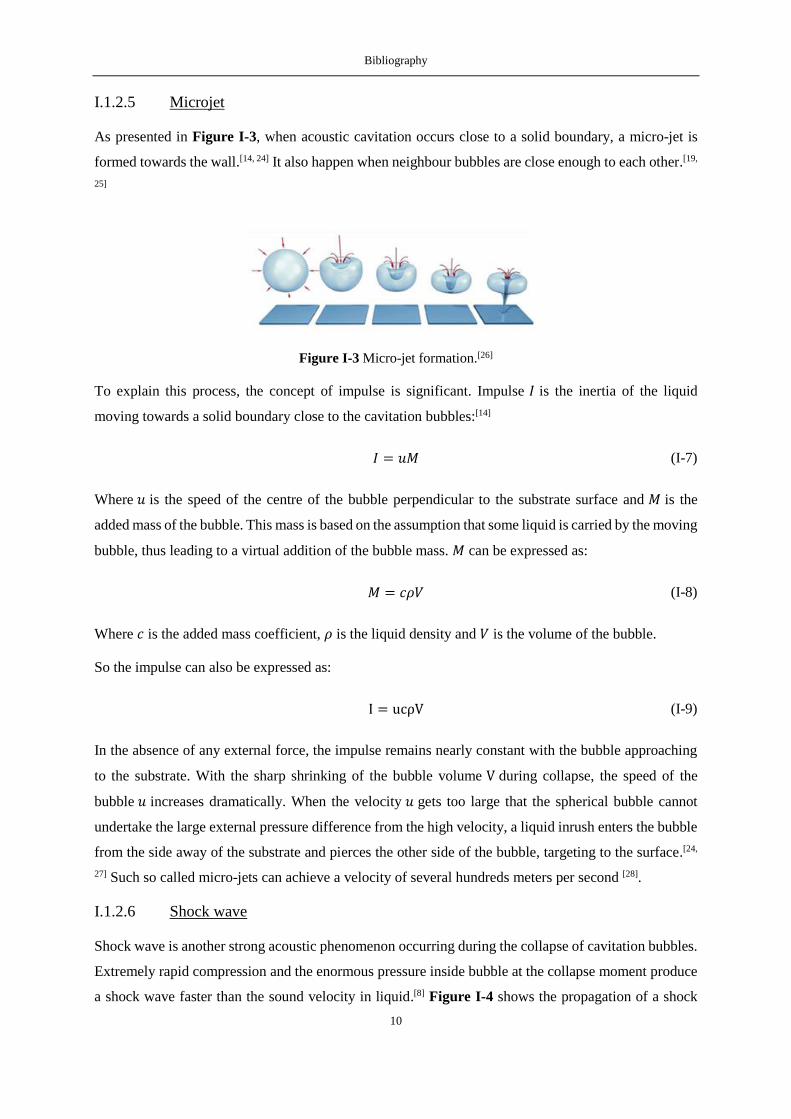
Figure I-3 Micro-jet formation.[26] ........................................................................................................ 10
Figure I-4 Shock wave from a trapped sonoluminescing bubble produced by ultrasound at 21.4 kHz,
pressure amplitude of 132 kPa, frame interval 30 ns.[29] ....................................................................... 11
Figure I-5 Sonoluminescence generation from a cavitation bubble.[58] ................................................ 14
Figure I-6 Comparison of MBSL and SBSL spectra in 1 M NaCl solution.[62] ................................... 15
Figure I-7 Size distribution of chemically active bubbles at different ultrasonic frequencies in 0.01 M
luminol solution saturated by air.[56] ...................................................................................................... 16
Figure I-8 Schema of a resonant standing wave: pressure variation (black) and displacement variation
(grey). .................................................................................................................................................... 20
Figure I-9 Surface roughness of ABS versus etching time in the presence and absence of ultrasound.[110]
............................................................................................................................................................... 22
Figure I-10 Erosion of fused silica glass sonicated 180 min in distilled water at 25°C by 20 kHz
ultrasound at 49 W.cm-2.[32] ................................................................................................................... 23
Figure I-11 SEM images of metallic surfaces sonicated at 20 kHz in pure water (40°C, 40 W.cm-2): (a)
Al sonicated during 4 min; (b) Cu sonicated during 10 min; (c) Ag sonicated during 10 min and (d) Zn
sonicated during 10 min.[120] .................................................................................................................. 24
Figure I-12 SEM images of metallic surfaces sonicated at 20 kHz in pure water (65°C, 57 W.cm-2): (a)
Al; (b) Mg alloys; (c) stainless steel; and (d) in 5 M NaOH solution (60°C, maximum 200 W.cm-2) Ti.[115,
122] .......................................................................................................................................................... 25
Figure I-13 Ultrasonic cleaning application as a function of frequency.[127] ........................................ 26
Figure I-14 Cleaning of microstructures with high aspect ratio: without (left) and with megasonics
(right).[129] .............................................................................................................................................. 27
Figure I-15 Location of the 9 French UNGG reactors.[132] ................................................................... 28
Figure I-16 Scheme of a UNGG reactor (type SLA2).[132] ................................................................... 31
Figure I-17 Scheme of a UNGG fuel tube (type SLA2).[132, 135] ........................................................... 32

Table of figures
xiv
Figure I-18 UNGG fuel element evolution.[136] .................................................................................... 33
Figure I-19 a) UNGG graphite pile in construction (CHA3, 1965);[133] b) UNGG fuel tube;[2] c) UNGG
graphite brick (type SLA2).[137] ............................................................................................................. 34
Figure I-20 Element melting temperatures versus neutron absorption cross-sections.[139] ................... 36
Figure I-21 Galvanic corrosion in the case of graphite deposited on Mg surface.[2] ............................ 39
Figure I-22 Mg structural waste stored in wet silos at Marcoule: a) Entire Mg alloy claddings; b) sheared
fragments.[1] ........................................................................................................................................... 42
Figure I-23 Inactive simulated Mg claddings in 223 L stainless steel container: a) before grouting; b)
geopolymer material grouting; c) profile view after cutting the grouted package.[1] ............................ 42
Figure I-24 Radioactivity evolution of an ILW-LL package.[161] ......................................................... 43
Figure I-25 Contaminates classification: free contamination, loose contamination, fixed contamination
in cracks and in oxides. ......................................................................................................................... 44
Figure I-26 a) Ultrasonic fuel-cleaning technology scheme and b) video inspection of fuel assembly
from USA Callaway plant before and after cleaning.[168] ...................................................................... 46
Figure I-27 Ultrasonic cleaning equipment for VVER fuel assemblies in Russia.[169] ......................... 46
Figure I-28 a) Ultrasonic bath MO-42 for fuel assembly cladding decontamination and fuel assembly
waste fragment from submarine: b) before treatment, c) after treatment.[169] ....................................... 48
Figure I-29 MO-21 ultrasonic bath (left) and a remotely controlled ultrasonic module (right).[169] .... 48
Figure I-30 Underwater ultrasonic generators in decontamination tanks at La Hague: a) type AD1-BDH
and b) type R7 for dismantling of vitrification plant [courtesy of Sinaptec]......................................... 49
Figure II-1 UNGG cladding tube fragment used for sonication experiments. The Figure clearly shows
the complexity of the sample and the chemical composition differences (inside vs. outside). ............. 53
Figure II-2 Mg-Zr disc contamination procedure. ............................................................................... 54
Figure II-3 Mg ribbon contaminated with a 0.02 M UO2(NO3)2 aqueous solution a) after heating, b)
bent in the form of a cylinder to simulate a sample with a complex geometry. .................................... 54
Figure II-4 Schematics of the reactors used for the sonication of the various metallic surfaces at (a) high
and (b) low frequency ultrasound. Both set-ups enable the control of temperature, the sampling of
solution, and the control of the sample position in the cell. .................................................................. 56
Figure II-5 Tea mesh filter used for samples with a complex geometry. ............................................. 56
Figure II-6 Sonoluminescence and sonochemiluminescence apparatus schematic. ............................ 57

Table of figures
xv
Figure II-7 Example of the temperature variation of pure water (250 mL) sonicated at 100 kHz (Ar, 100
rpm stirring). .......................................................................................................................................... 58
Figure II-8 UV-vis absorption spectra of the peroxotitanium(IV) complex formed by mixing sonicated
pure water (100 kHz, Pac= 40 W, 20°C, Ar, 100 rpm stirring) with TiOSO4 solution. ......................... 60
Figure II-9 X-ray diffraction.[183].......................................................................................................... 62
Figure II-10 Surface wetting: a) Wenzel model; b) Cassie–Baxter model.[188] .................................... 64
Figure II-11 Energy level diagram of Raman scattering.[189] ............................................................... 65
Figure II-12 SL spectrometer schematic (SP 2356i, Roper Scientific) ................................................ 68
Figure III-1 H2O2 yields in pure water sonicated at 20 kHz (Pac= 33 W), 100 kHz (Pac= 40 W), 200 kHz
(Pac= 45 W), 362 kHz (Pac= 43 W) and 612 kHz (Pac= 61 W) under 100 mL.min-1 Ar (blue) and Ar/(20
vol.%)O2 (red) flow, at 18°C, 100 rpm mechanical stirring (except at 20 kHz); insert: ratio of H2O2
yields for Ar/(20 vol.%)O2 and Ar. ....................................................................................................... 72
Figure III-2 Photographs of 0.01 M luminol solution (pH = 11, Na2CO3) submitted to 20 kHz (Pac= 33
W), 100 kHz (Pac= 40 W) and 362 kHz (Pac= 43 W) under 100 mL.min-1 Ar and Ar/(20 vol.%)O2 flow
at 18°C; exposure 10 s. .......................................................................................................................... 73
Figure III-3 Photographs of 0.01 M luminol solution (pH= 11, Na2CO3) submitted to a) 100 kHz (Pac=
40 W) from glass wall side and b) 362 kHz (Pac= 43 W) from optical window side, under 100 mL.min-1
Ar/(20 vol.%)O2 flow, at 18°C; exposure 10 s. ..................................................................................... 74
Figure III-4 Photographs of water SL at 20 kHz (Pac= 33 W), 100 kHz (Pac= 40 W) and 362 kHz (Pac=
43 W) under 100 mL.min-1 Ar and Ar/(20 vol.%)O2 flow, at 18°C; exposure 60 s. ............................. 74
Figure III-5 SL spectra of pure water sonicated at 20 kHz (Pac= 33 W), 100 kHz (Pac= 40 W) and 362
kHz (Pac= 43 W) under 100 mL.min-1 Ar and Ar/(20 vol.%)O2 flow, at 18°C. The apparent broad peak
around 400-475 nm at 362 kHz is an artefact due to 2nd order light emission of the strong SL UV part.
............................................................................................................................................................... 76
Figure III-6 Normalization of higher resolution SL spectra (after subtraction of a linear baseline) and
their simulation (Specair) curves for water at 20 kHz (Pac= 33 W), 100 kHz (Pac= 40 W) and 362 kHz
(Pac= 43 W) under 100 mL.min-1 Ar (blue) and Ar/(20 vol.%)O2 (red) flow, 18°C. ............................. 77
Figure III-7 SL spectra of pure water submitted to 20 kHz (blue, Pac= 33 W), 100 kHz (red, Pac= 40 W)
and 362 kHz (green, Pac= 43 W) at 18°C under 100 mL.min-1 Ar/(20 vol.%)N2 flow. ......................... 79
Figure III-8 SL spectra of 1 M NaCl solution sonolysis at 362 kHz (Pac= 43 W) under 100 mL.min-1 Ar
flow, 14°C. ............................................................................................................................................ 81
Figure III-9 Fixed stainless steel plate in the reactor ........................................................................... 82

Table of figures
xvi
Figure III-10 SL intensity of Na* (589 nm) as a function of the observation position in the presence of
a fixed stainless steel plate in 1 M NaCl solution sonicated at 362 kHz (Pac= 43 W) under 100 mL.min-
1 Ar flow, at 14°C. ................................................................................................................................. 83
Figure III-11 SL intensity of continuum (500 nm) as a function of the observation position in the
presence of a fixed stainless steel plate in 1 M NaCl solution sonicated at 362 kHz (Pac= 43 W) under
100 mL.min-1 Ar flow, at 14°C. ............................................................................................................ 83
Figure III-12 Scheme of the observation positions made through the quartz window correlated to 3
different zones ....................................................................................................................................... 84
Figure III-13 SL intensity ratio between Na* (589 nm) and continuum (500 nm) emission as a function
of the observation position in the presence of a fixed stainless steel plate in 1 M NaCl solution sonolysis
at 362 kHz (Pac= 43 W) under 100 mL.min-1 Ar flow, at 14°C. ............................................................ 84
Figure III-14 Photographs of SL in pure water submitted to 100 kHz (Pac= 20 W) under 110 mL.min-1
Ar flow, at 18°C, exposure 120 s: a) free surface and b) stainless steel plate (on the top of the quartz
window); photographs of SCL in 0.01 M luminol solution (pH= 11, Na2CO3) submitted to 100 kHz (Pac=
20 W) under 100 mL.min-1 Ar/(20 vol.%)O2 flow, at 17°C, exposure 60 s) free surface and d) stainless
steel plate ............................................................................................................................................... 85
Figure III-15 SL spectra in the presence of a stainless steel plate in 1 M NaCl solution at 362 kHz (Pac=
43 W) under 100 mL.min-1 Ar flow, 18°C, at resonant mode (red) and non-resonant mode (green)
distances ................................................................................................................................................ 89
Figure III-16 SL spectra in the presence of Mg surface in the mixture solution of 1 M NaCl and 0.001
M oxalic acid at 362 kHz (Pac= 43 W) under 100 mL.min-1 Ar flow, at 18°C: free surface (blue), “anti-
resonant” mode (red) and “resonant” mode (green) distances .............................................................. 91
Figure IV-1 Photo and SEM observation of a native Mg surface. ....................................................... 95
Figure IV-2 3D reconstruction of a native Mg surface (insert: image of water contact angle). ........... 96
Figure IV-3 Photos of Mg surfaces treated for 1 hour in 0.01 M oxalic acid solution (Ar, 18°C): a) under
silent condition, stirring; b) at 20 kHz, Pac= 20 W; c) at 200 kHz, Pac= 20 W, stirring; d) at 1 MHz Pac=
40 W, stirring. ........................................................................................................................................ 97
Figure IV-4 Mg surface treated at 20 kHz, Pac= 20 W for 1 hour in 0.05 M oxalic acid solution (Ar,
17°C): a) photo; b) and c) SEM observations. ...................................................................................... 97
Figure IV-5 SEM observations of Mg surfaces treated for 1 hour in 0.01 M oxalic acid solution, (Ar,
18°C, stirring 200 rpm): under silent condition; at 20 kHz, Pac= 20 W, no stirring; at 200 kHz, Pac= 20
W; at 1 MHz Pac= 40 W. ....................................................................................................................... 99

Table of figures
xvii
Figure IV-6 Crater structures on Mg surface treated for 1 hour in 0.01 M oxalic acid solution (Ar, 18°C):
a) and b) SEM observation with a 65° tilt angle at 200 kHz, Pac= 20 W; c) 3D reconstruction at 100 kHz,
Pac= 20 W. ........................................................................................................................................... 100
Figure IV-7 3D reconstruction of Mg surfaces treated for 1 hour in 0.01 M oxalic acid solutions, Ar,
18°C stirring 200 rpm: a) under silent condition; b) 20 kHz, Pac= 20 W, no stirring; c) 200 kHz, Pac= 20
W, stirring; d) 1 MHz Pac= 40 W, (insert: images of water contact angle). ........................................ 101
Figure IV-8 3D reconstruction of Mg surface treated at 20 kHz, Pac= 20 W for 1 hour in 0.05 M oxalic
acid solution (Ar, 17°C). The insert shows an image of water contact angle. .................................... 102
Figure IV-9 Solid surface wetting: a) Young contact angle; b) Wenzel model; c) Cassie-Baxter
model.[224] ............................................................................................................................................ 102
Figure IV-10 SEM observations of Mg surfaces treated at 200 kHz, Pac= 20 W, stirring, Ar, 18°C for 1
hour in: water, 0.01 M sodium oxalate solution and 0.001 M oxalic acid solution. ........................... 104
Figure IV-11 Mg surfaces treated at 200 kHz (Pac= 20 W, stirring, Ar, 18°C) for 1 hour in water, 0.001
M and 0.01 M oxalic acid solutions: a) water contact angle evolution; SEM image of Mg surface after
30 min treatment in b) 0.01 M oxalic acid solution and c) 0.001 M oxalic acid. ................................ 105
Figure IV-12 Dissolution of Mg surfaces treated at 200 kHz (Pac= 20 W, stirring, Ar, 18°C) for 1 hour
in water, 0.01 M sodium oxalate solution, 0.001 M and 0.01 M oxalic acid solutions. ...................... 107
Figure IV-13 Raman spectra of the white precipitate obtained in solution after Mg surface sonication
at 20 kHz, Pac= 20 W for 1 hour in 0.05 M oxalic acid solution (Ar, 17°C) and glushinskite standard as
reference .............................................................................................................................................. 107
Figure IV-14 X-ray diffraction pattern of the white precipitate obtained in solution after Mg surface
sonication at 20 kHz, Pac= 20 W for 1 hour in 0.05 M oxalic acid solution (Ar, 17°C) (standard patterns
of MgC2O4 JCPDS 00-028-0625 and MgC2O4•2H2O JCPDS 00-026-1223) ...................................... 108
Figure IV-15 SEM observations of the secondary phases on Mg surfaces treated at 200 kHz (Pac= 20
W, Ar, 18°C) for 1 hour in 0.01 M oxalic acid solution...................................................................... 109
Figure IV-16 ATR-FTIR spectra of native Mg surface and of Mg surfaces treated at 200 kHz (Pac= 20
W, stirring, Ar, 18°C) for 1 hour in water, 0.01 M sodium oxalate solution and 0.01 M oxalic acid
solution. ............................................................................................................................................... 110
Figure IV-17 SEM-EDX analysis of secondary phases on Mg surface treated at 200 kHz (Pac= 20 W
for 1 hour in 0.01 M oxalic acid solution, Ar, 18°C). A shadowing effect can be noted on Mg map due
to the position of the detector. Mg X-ray counts on the oxides are lower than bulk Mg explaining the
color intensity differences for this map. .............................................................................................. 111

Table of figures
xviii
Figure IV-18 SEM observations of Mg surfaces treated at 200 kHz (Pac= 20 W, stirring, Ar, 20°C) for
1 hour in 0.01 M oxalic, sulfamic and nitric acid solutions. ............................................................... 111
Figure IV-19 Dissolution of Mg surfaces in 0.01 M oxalic acid solution, Ar, 20°C for 30 minutes by
immersion, stirring (100 rpm and 200 rpm) and sonicated at 345 kHz, Pac= 40 W with stirring (100 rpm).
............................................................................................................................................................. 112
Figure IV-20 Iterative SEM observations of a crater structure formation on Mg surface treated at 100
kHz, Pac= 20 W for 1.5 hours in 0.001 M oxalic acid solution (Ar, 18°C): a) 10 min; b) 30 min; c) 60
min and d) 90 min. .............................................................................................................................. 113
Figure IV-21 Scheme of pitting corrosion on Mg surface ................................................................. 114
Figure IV-22 SEM observations of crater structures at grain boundaries on Mg surface treated at 345
kHz (Pac= 40 W, Ar, 20°C) for 1 hour in 0.01 M oxalic acid solution. ............................................... 115
Figure IV-23 Photo and SEM observation of a native Mg-Zr surface. .............................................. 116
Figure IV-24 3D reconstruction of a native Mg-Zr surface (insert: image of water contact angle). .. 117
Figure IV-25 Mg-Zr surface treated at 345 kHz, Pac= 40 W, stirring for 1 hour in 0.01 M oxalic acid
solution (Ar, 20°C): a) photo; b) and c) SEM observations. ............................................................... 118
Figure IV-26 3D reconstruction of Mg-Zr surface treated at 345 kHz, Pac= 40 W for 1 hour in 0.01 M
oxalic acid solution (Ar, 20°C). The insert is an image of the water contact angle. ........................... 118
Figure IV-27 Mg-Zr surfaces treated at 100 kHz, Pac= 20 W, stirring, Ar, 20°C for 2 hours in 0.001 M
oxalic acid (insert: SEM images at 30 minutes and 2 hours). ............................................................. 119
Figure IV-28 Mg-Zr surface treated at 345 kHz, Pac= 40 W for 1 hour in 0.01 M oxalic acid solution,
Ar, 20°C: a) zone with secondary phase; b) zone without secondary phase. ...................................... 119
Figure IV-29 Dissolution of pure Mg and Mg-Zr surfaces treated at 345 kHz, Pac= 40 W, stirring, Ar,
20°C for 1 hour in 0.01 M oxalic acid solution. .................................................................................. 121
Figure IV-30 SEM observations of Mg surface treated for 1 hour in 0.01 M oxalic acid solution, (Ar/(20
vol.%)O2, 20°C, stirring 100 rpm) at 345 kHz Pac= 40 W. .................................................................. 122
Figure V-1 Non-irradiated UNGG cladding tube fragment: a) photo; SEM BSE images of b) fin side
and c) carbon side. ............................................................................................................................... 126
Figure V-2 X-ray diffraction pattern of the outer side (fin side) of a non-irradiated UNGG cladding tube
fragment, in comparison with standard patterns of Mg JCPDS 00-035-0821, MgO JCPDS 01-080-4185
and Mg(OH)2 JCPDS 01-078-3952). .................................................................................................. 127

Table of figures
xix
Figure V-3 X-ray diffraction pattern of the inner side (carbon side) of a non-irradiated UNGG cladding
tube fragment, in comparison with standard patterns of Mg JCPDS 01-089-5003, carbon JCPDS 01-
075-0444 and Mg(OH)2 JCPDS 01-078-3952). ................................................................................. 127
Figure V-4 FTIR spectra of a non-irradiated UNGG cladding tube fragment (fin side and carbon side),
and non-contaminated areas of as-prepared pure Mg and Mg-Zr samples ......................................... 128
Figure V-5 Raman spectra of a non-irradiated UNGG cladding tube fragment (fin side and carbon side),
and non-contaminated area of as-prepared pure Mg and Mg-Zr samples. .......................................... 128
Figure V-6 Contaminated Mg-Zr surface prepared by calcination at 500°C under Ar atmosphere of Mg-
Zr surface on which 70 µL of 0.1 M UO2(NO3)2 were homogenously deposited. The right side of the
figure shows a SEM image of the contamination. ............................................................................... 129
Figure V-7 Photos of: a) U3O8 produced by heating ammonium diuranate;[250] b) β-UO3 powder; c) γ-
UO3 powder[251] and d) as-prepared contaminated Mg-Zr surface (0.1 M UO2(NO3)2 70 μL). .......... 130
Figure V-8 X-ray diffraction pattern of the fin side of a UNGG cladding tube fragment contaminated
with 70 µL of 0.1 M UO2(NO3)2 in comparison with standard patterns of Mg (JCPDS 00-035-0821),
MgU3O10 (JCPDS 00-034-0985) and UO3 (JCPDS 00-015-0201). .................................................... 131
Figure V-9 FTIR spectra of as-prepared contaminated Mg-Zr (0.1 M UO2(NO3)2, 70 μL) ............... 132
Figure V-10 Raman spectra of as-prepared contaminated Mg-Zr (0.1 M UO2(NO3)2 70 μL) ........... 132
Figure V-11 Photos and SEM images of Mg-Zr surfaces contaminated with U (0.1 M UO2(NO3)2, 70
μL) decontaminated under silent conditions (a and b) and by 345 kHz ultrasound, Pac= 40 W (c and d)
in 0.01 M oxalic acid, Ar, stirring 100 rpm, 20°C, 90 min ................................................................. 134
Figure V-12 α-radioactivity evolution of Mg-Zr surfaces contaminated with U (0.1 M UO2(NO3)2, 70
μL) decontaminated by 345 kHz ultrasound, Pac= 40 W (blue) and under silent conditions (red) in 0.01
M oxalic acid, Ar, stirring 100 rpm, 20°C, 90 min ............................................................................. 135
Figure V-13 Photos of a contaminated Mg ribbon (0.1 M UO2(NO3)2, 50 μL) wound in a complex
geometry before and after 345 kHz sonication (Pac= 40 W) during 90 min in 0.01 M oxalic acid, Ar,
stirring 100 rpm, 20°C. ........................................................................................................................ 136
Figure V-14 α-radioactivity evolution of the inner side of a contaminated Mg ribbon (0.1 M UO2(NO3)2,
50 μL) wound in a complex geometry sonicated during 90 min at 345 kHz in 0.01 M oxalic acid, Ar,
stirring 100 rpm, 20°C, Pac= 40 W (insert: SEM image after treatment). ........................................... 136
Figure V-15 Photos of an as-prepared contaminated UNGG cladding fin side sample (0.1 M UO2(NO3)2,
30 μL) before and after 345 kHz sonication (Pac= 40 W) during 90 min in 0.01 M oxalic acid, Ar, stirring
100 rpm, 20°C. .................................................................................................................................... 137

Table of figures
xx
Figure V-16 α-radioactivity evolution of contaminated UNGG cladding fin side sample (0.1 M
UO2(NO3)2, 30 μL) decontaminated by 345 kHz (Pac= 40 W) during 90 min in 0.01 M oxalic acid, Ar,
stirring 100 rpm, 20°C (insert: SEM image after treatment) ............................................................... 138
Figure V-17 Photos of the inner side of a UNGG cladding fragment showing the presence of carbon a)
before and b) after 1 hour treatment in 0.01 M oxalic acid (345 kHz ultrasound, Ar, stirring 100 rpm,
20°C, Pac= 40 W (note: both samples are different). ........................................................................... 138
Figure V-18 SEM observations of the inner carbon side of a UNGG cladding fragment a) before and b)
after 1 h sonication (345 kHz) in 0.01 M oxalic acid (Ar, stirring 100 rpm, 20°C, Pac= 40 W). ........ 139
Figure V-19 SEM-EDX analyses of the secondary phases observed on the fin side of a contaminated
UNGG cladding fragment (0.1 M UO2(NO3)2, 30 μL) sonicated at 345 kHz during 90 min in 0.01 M
oxalic acid (Ar, stirring 100 rpm, 20°C, Pac= 40 W). .......................................................................... 140
Figure V-20 ATR-FTIR spectra of contaminated Mg surfaces (0.1 M UO2(NO3)2, 70 μL) sonicated at
345 kHz during 1 hour in 0.01 M oxalic acid (Ar, stirring 100 rpm, 20°C, Pac= 40 W). .................... 141
Figure V-21 Schematic representation of metal ions Mn+ adsorbed in Brucite structure.[253] ........... 141
Figure V-22 Contaminated stainless steel surface prepared by calcination at 500°C under Ar atmosphere
of a stainless steel surface on which 70 µL of 0.1 M UO2(NO3)2 were homogenously deposited. The
right side of the figure shows a SEM image of the contamination ...................................................... 143
Figure V-23 X-ray diffraction pattern of an as-prepared contaminated stainless steel surface (0.1 M
UO2(NO3)2, 70 μL) (standard patterns of UO3 JCPDS 00-031-1416, U3O8 JCPDS 01-076-1851 and
CrFe7C0.45 JCPDS 03-065-9781). ........................................................................................................ 143
Figure V-24 FTIR spectra of as-prepared contaminated stainless steel surface (0.1 M UO2(NO3)2, 70
μL) ....................................................................................................................................................... 144
Figure V-25 Raman spectra of as-prepared contaminated stainless steel surface (0.1 M UO2(NO3)2, 70
μL) ....................................................................................................................................................... 144
Figure V-26 Radioactivity evolution of contaminated stainless steel surfaces (0.1 M UO2(NO3)2 70 μL)
treated in 0.01 M oxalic acid, Ar, stirring 100 rpm, 20°C, for 90 minutes under silent condition (red) and
by 345 kHz ultrasound, Pac= 40 W (blue). .......................................................................................... 145
Figure V-27 Photos and SEM images of stainless steel surfaces contaminated with U (0.1 M UO2(NO3)2,
70 μL) treated under silent conditions (a and b) and by 345 kHz ultrasound, Pac= 40 W (c and d) in 0.01
M oxalic acid, Ar, stirring 100 rpm, 20°C, 90 min ............................................................................. 146

Table of figures
xxi
Figure V-28 Radioactivity evolution of contaminated stainless steel surfaces (0.1 M UO2(NO3)2 70 μL)
treated in 1 M nitric acid, Ar, stirring 100 rpm, 20°C, for 90 minutes under silent condition (red) and by
345 kHz ultrasound, Pac= 40 W (blue) ................................................................................................ 147
Figure V-29 Photos and SEM images of stainless steel surfaces contaminated with U (0.1 M UO2(NO3)2,
70 μL) decontaminated under silent conditions (a and b) and by 345 kHz ultrasound, Pac= 40 W (c and
d) in 1 M nitric acid, Ar, stirring 100 rpm, 20°C, 90 min ................................................................... 148

xxii

List of tables
xxiii
List of tables
Table I-1 Rovibronic temperatures estimated from the simulations of molecular emissions in
sonoluminescence spectra from aqueous solutions.[18, 21, 23] .................................................................... 9
Table I-2 Characteristics of the 9 UNGG reactors implemented in France.[132, 133] .............................. 29
Table I-3 Composition of the coolant gas used in a UNGG reactor (SLA1 and SLA2).[132] ................ 34
Table I-4 French radioactive waste classification.[132] .......................................................................... 41
Table II-1 Calorimetric results obtained at 100 kHz (250 mL water, Ar, stirring at 100 rpm). ........... 59
Table III-1 Ratios (between Ar-20%O2 and Ar) of OH peak height taken at 309 nm and of SL continuum
at 500 nm at different ultrasonic frequencies: 20 kHz (Pac= 33 W), 100 kHz (Pac= 40 W) and 362 kHz
(Pac= 43 W), 18°C. ................................................................................................................................ 76
Table III-2 Estimated vibrational (Tv) and rotational (Tr) temperatures of OH (A2Σ+) in water sonolysis
by 20 kHz (Pac= 33 W), 100 kHz (Pac= 40 W) and 362 kHz (Pac= 43 W) under 100 mL.min-1 Ar and
Ar/(20 vol.%)O2 at 18°C. ...................................................................................................................... 78
Table III-3 Photographs of SCL in 0.01 M luminol solution (pH= 11, Na2CO3) and SL in 1 M NaCl
solution in the presence of a stainless steel plate submitted to 362 kHz (Pac= 43 W) under 100 mL.min-
1 Ar flow, at 18°C, exposure 20 s. ......................................................................................................... 88
Table III-4 Photographs of SL in the presence of Mg surface in solution of 1 M NaCl and 0.001 M
oxalic acid mixture submitted to 362 kHz (Pac= 43 W) under 100 mL.min-1 Ar flow, at 18°C, exposure
20 s. ....................................................................................................................................................... 90
Table IV-1 Chemical composition of a native Mg surface by EDX analysis....................................... 96
Table IV-2 acoustic bubble resonance radius and estimated crater size of Mg surfaces treated for 1 hour
in 0.01 M oxalic acid solution (Ar, 18°C, stirring 100 rpm): 20 kHz, Pac= 20 W; 100 kHz, Pac= 20 W ;
200 kHz, Pac= 20 W; 345 kHz Pac= 40 W; 1 MHz, Pac= 40 W. ........................................................... 100
Table IV-3 Estimated roughness for Mg surfaces treated during 1 hour in 0.01 M oxalic acid solutions
(Ar, 18°C, stirring 100 rpm): silent condition; 20 kHz, Pac= 20 W, no stirring; 100 kHz, Pac= 20 W; 200
kHz, Pac= 20 W; 345 kHz Pac= 40 W; 1 MHz Pac= 40 W. ................................................................... 101
Table IV-4 Weight loss of Mg surfaces treated for 1 hour in 0.01 M oxalic acid solution (Ar, 18°C):
under silent condition; at 20 kHz, Pac= 20 W; at 200 kHz, Pac= 20 W, stirring; at 1 MHz Pac= 40 W,
stirring 200 rpm. .................................................................................................................................. 103

List of tables
xxiv
Table IV-5 Water contact angles obtained for Mg surfaces treated at 200 kHz (Pac= 20 W, stirring, Ar,
18°C) for 1 hour in water, 0.01 M sodium oxalate solution and 0.001 M oxalic acid solution. ......... 104
Table IV-6 Dissolution rate and H2 maximal formation rate of Mg surfaces treated at 200 kHz (Pac= 20
W, stirring, Ar, 18°C) for 1 hour in water, 0.01 M sodium oxalate solution, 0.001 M and 0.01 M oxalic
acid solutions. ...................................................................................................................................... 109
Table IV-7 Chemical composition of a native Mg-Zr surface by EDX analysis. .............................. 117
Table IV-8 Chemical composition of Mg-Zr surface treated at 345 kHz, Pac= 40 W for 1 hour in 0.01
M oxalic acid solution, Ar, 20°C, by EDX analysis. ........................................................................... 120

Introduction
1
Introduction
The natural uranium graphite-gas (UNGG) reactors were the first generation of nuclear reactors
developed in France. They used graphite moderator, gas (air or carbon dioxide) coolant and natural
uranium metal as fuel. Since 1956, in total 9 UNGG reactors have been built and put into operation in
France. Until the last unit at Bugey was decommissioned in 1994, a large amount of nuclear wastes of
various kinds, including spent fuel, graphite bricks, radioactive gases and metal structural wastes, have
been generated during commission and dismantling processes of UNGG reactors. Among the
radioactive metal wastes, large quantities of magnesium alloy, which has been used as fuel cladding
tubes and plugs, are temporarily stored at La Hague and Marcoule, and wait for conditioning and
transportation to long-term disposals. The large amounts of Mg cladding wastes take a huge volume of
storage and present a risk of radioactive leakage, as well as great costs of conditioning and disposal.[1]
Moreover, as an active metal, Mg is easily corroded and can produce hydrogen gas, which can result in
the risk of radioactive material leakage during long-term storage of these UNGG cladding wastes.[2] As
a result, it is necessary to reduce the volume of these cladding wastes by removing radioactive
contaminants on their surfaces, thereby reducing their radiation level to a lower storage category or even
to allow them to be unconditionally released or reused. One of the potentially efficient approaches for
the decontamination of the UNGG Mg alloy cladding wastes is ultrasonic cleaning.
Ultrasound has been applied as a cleaning tool since the 1950s. Compared to other conventional cleaning
methods, ultrasonic cleaning has the advantages of not being limited by complex shapes, fewer process
stages, use of less or non-hazardous aqueous solutions, a wider range of substrate surfaces to be treated
and milder operating conditions.[3] In fact, it is not the ultrasound wave itself, but the acoustic cavitation
phenomenon which interacts with treated surfaces in a liquid medium and removes contaminants.
Acoustic cavitation results from the nucleation, growth and rapid implosive collapse of gas and vapor
filled microbubbles in liquids exposed to an ultrasonic wave. In the vicinity of a solid boundary, the
bubble collapse produces violent shock waves and micro-jets directed towards the substrate surface.
Thanks to the combination of the in-situ generation of chemically active species with the enhancement
of mass transfer by acoustic streaming on the treated surface, an efficient cleaning by power ultrasound
can be achieved. However, though ultrasonic cleaning has been widely studied and used in various fields,
the behavior of cavitation in liquid in the presence of a solid boundary is still unclear. Meanwhile, the
impacts of cavitation on metal surfaces and the ultrasonic cleaning efficiency on radioactive materials
are of great interest in material science and for the nuclear industry.
The manuscript is outlined in the following 6 chapters:

Introduction
2
The first chapter is a literature review. In this part the general principles of acoustic cavitation, including
sonochemistry and sonoluminescence, and some application examples of ultrasonic modification and
cleaning of solid surfaces are reported. Besides, the conceptions of UNGG reactors and current state of
storage of Mg cladding wastes in France, as well as some examples of ultrasonic decontamination are
described later.
The second chapter is devoted to the description of the experimental techniques and methods. The
sample surfaces and experimental set-ups used in this study are described in detail, as well as the
corresponding characterization tools.
Chapter III aims to determine the effect of ultrasonic frequency on sonochemical activity and
sonoluminescence intensity, especially in the range of the less studied intermediate frequency (100 kHz).
It also allows to identify cavitation bubble activity and distribution in the presence of a solid surface in
liquid, including the cavitation behavior at different distances to the surface and in different acoustic
standing wave fields induced by the reflection on the surface. This study is accomplished by chemical
measurements (H2O2 yields and sonochemiluminescence of luminol) and spectroscopic probes
(multibubble sonoluminescence of OH*, NH*, Na* and continuum).
Investigations on how sonication affects extended Mg and Mg-Zr alloy surfaces are presented in chapter
IV. The evolution of surfaces treated at different ultrasonic frequencies in different solutions is
characterized by surface roughness, morphology, dissolution rate, hydrogen generation rate and
evolution of chemical composition. The formation of an original and unprecedented golf-ball shape
microstructure on Mg based sample surfaces sonicated at ultrasonic frequencies in the range of 100 to
345 kHz is discussed in detail. The way it affects surface properties is studied via roughness and
wettability measurements.
Chapter V is dedicated to the assessment of the efficiency of ultrasonic decontamination of metal
surfaces contaminated by natural uranium to simulate real UNGG cladding materials. It considers
samples of Mg, Mg-Zr alloy, non-irradiated UNGG cladding fragments and stainless steel.
Finally, general conclusions and perspectives for a future work are given.
This study has been carried out at Marcoule Institute for Separation Chemistry (ICSM) and was
supported by the Division of Nuclear Energy (DEN) of the French Alternative Energies and Atomic
Energy Commission (CEA).

Bibliography
3
Chapter I. Bibliography

4

Bibliography
5
I.1 Ultrasound and sonochemistry
I.1.1 Ultrasound
Ultrasound is the inaudible sound wave with frequency above 16 kHz, higher than the upper limit of
human hearing range. In nature, animals like bats and dolphins, echolocate quarries or obstacles by
producing ultrasound. For human beings, the first research about the effects of ultrasound or cavitation
was done by Thornycroft and Barnaby, when they were trying to explain the observation of submarine
propeller erosion in 1895.[3] And the first purposeful application of ultrasound was developed by
Langevin in 1917. Again for submarine, Langevin had designed an underwater detector, which can emit
ultrasonic waves in water and collect echoes form certain objects to identify their distances. Such device
is now well known under the name of sonar.[3-5]
There are several basic properties of ultrasound: frequency 𝑓 and acoustic power 𝑃𝑎𝑐, the latter includes
acoustic power density 𝑃𝑎𝑐,𝑉 and power intensity 𝐼𝑎𝑐.
I.1.1.1 Ultrasonic frequency
The ultrasound frequency 𝑓 (Hz) is given by:
𝑓 = 𝑐 𝜆⁄ (I-1)
Where 𝑐 (m·s-1) is the ultrasound wave velocity in a considered medium and λ (m) is the wavelength of
the ultrasound.
Figure I-1 Ultrasound frequency category.[3]
According to its frequency, ultrasound can be divided into three frequency domains, namely power
ultrasound (16 – 100 kHz), high frequency ultrasound (100 kHz or sometimes 200 kHz – 1 MHz), and
diagnostic ultrasound (> 1 MHz), as presented in Figure I-1. Power ultrasound and high frequency
ultrasound are widely applied in ultrasonic cleaning and sonochemistry, where chemical and physical
effects caused by acoustic cavitation bubbles are desired.[6]

Bibliography
6
I.1.1.2 Acoustic power
The absorbed acoustic power 𝑃𝑎𝑐 (W) is the power transmitted to the medium by ultrasound. Normally
for better controlling and comparing between different experimental conditions, parameters such as
acoustic power density 𝑃𝑎𝑐,𝑉 (W·mL-1) and acoustic power intensity 𝐼𝑎𝑐 (W·cm-2) are used.
𝑃𝑎𝑐,𝑉 = 𝑃𝑎𝑐𝑉
(I-2)
Where 𝑉 (mL) is the volume of irradiated liquid.
𝐼𝑎𝑐 =𝑃𝑎𝑐𝑆
(I-3)
Where 𝑆 (cm2) is the area normal to the direction of ultrasonic wave propagation, e.g. for a horn type
ultrasonic transducer tip, 𝑆 is the surface of the probe tip.
Based on ultrasonic intensity, ultrasound can also be classified into power ultrasound and diagnostic
ultrasound. The acoustic intensity of power ultrasound should be higher than a certain intensity to
produce violent acoustic cavitation collapse, which is known as the Blake threshold.[7] The Blake
threshold is closely related to ultrasonic frequency, for example: 0.49 W·cm-2 at 20 kHz, 0.88 W·cm-2
at 140 kHz and 3 W·cm-2 at 1 MHz.[8] Thus for non-destructive medical imaging at a frequency over 1
MHz, acoustic power intensity is limited to 1 W·cm-2 or less to avoid cavitation.
By changing the ultrasonic frequency or acoustic power, the effect of ultrasound can be completely
different. Fundamentally, the ultrasonic effect difference arises from changes in the behavior of acoustic
cavitation.
I.1.2 Acoustic cavitation
Acoustic cavitation is the process of the formation, growth and implosive collapse of bubbles in liquids
irradiated by ultrasound, accompanied by a series of physical and chemical phenomena and effects:
sonoluminescence, sonochemiluminescence, generation of excited species and radicals, formation of
H2O2, shock waves, microjets, micro-streaming and etc.[9]
I.1.2.1 Cavitation mechanism
When a liquid is exposed to ultrasound, alternating rarefaction and compression cycles are propagated
by the ultrasonic waves, as shown in Figure I-2. In compression cycles, liquid molecules are pressed
together by a locally positive force. In rarefaction phase, it is in the opposite that a negative force draws
the liquid molecules apart. In fact, this force comes from the difference between ambient pressure in
liquid and acoustic pressure from ultrasonic wave. And in rarefaction phase, if the local acoustic pressure

Bibliography
7
is larger than ambient pressure, a negative force can be produced. When this negative force exceeds the
liquid tensile strength in the rarefaction phase, tiny gas or vapor filled bubbles appear. For a pure
degassed liquid, its tensile strength is too strong to easily form bubbles. However, in real situations,
there are usually inhomogeneities such as dissolved gases in liquid, which can reduce the tensile strength
and play as nuclei of bubbles.[6, 10]
Figure I-2 Acoustic cavitation generation and collapse.[11]
These bubbles continue to expand in rarefaction phase, until their sizes arrive to the maximum when the
pressure on the bubble wall is no more negative. If the bubble oscillates between rarefaction and
compression phases for several cycles around an equilibrium radius, this process is called stable
cavitation. Since there is no significant change in bubble size, stable cavitation does not strongly involve
in physical or chemical effects of ultrasound. However, if the bubble exists for only a few cycles and
grows rapidly to a maximum size (tens or hundreds times the initial bubble diameter) with a following
violent implosion, transient cavitation happens. Extreme temperature and pressure are created during
the implosion in a transient cavitation bubble, which leads to obvious physical and chemical effects:
sonoluminescence light emission and sonochemical reactions. Besides, stable cavitation can resolve
itself into transient cavitation. After the collapse of transient cavitation bubbles, the generated daughter
bubbles can also perform as nuclei of stable cavitation. There are some bubbles exhibiting both stable
and transient cavitation characteristics, such as bubbles with a long lifetime as well as strong
physical/chemical effects.[9, 10, 12]
I.1.2.2 Cavitation mathematical model
Rayleigh’s mathematical formulation was the first basic model formulated for the collapse of an empty
cavitation bubble.[13] If one assumes that the cavity is an adiabatic bubble filled with an ideal gas,
Rayleigh-Plesset equation can be expressed as:[4]

Bibliography
8
𝑅�̈� +
3
2�̇�2 =
(𝑃0 +2𝜎𝑅0) (𝑅0𝑅 )
3𝛾
−2𝜎𝑅 −
4𝜇�̇�𝑅 − 𝑝∞
𝜌
(I-4)
Where 𝑅 is the radius of the cavitation bubble, one and two dots are the first and second order time
derivatives of bubble radius, 𝑅0 is the bubble radius at equilibrium, 𝑃0 is the hydrostatic (ambient)
pressure, 𝑝∞ is the liquid pressure in the bulk of liquid, 𝛾 is the specific heat ratio of the gas in bubble,
𝜎 is the surface tension, 𝜇 is the liquid viscosity and 𝜌 is the density of the liquid.
However, due to the complexity and instability of the collapse of bubbles (especially in multibubble
systems), there were more dynamical equations and numerical analysis developed from Rayleigh-
Plesset equation.[14]
I.1.2.3 Hot spot theory
A widely accepted theory to explain most cavitation effects is the hot spot theory.[9, 12, 15] According to
the first law of thermodynamics:
∆𝑈 = 𝑄 −𝑊 (I-5)
With ∆𝑈 the change in internal energy of a closed system, 𝑄 the heat transferred to the system and 𝑊
the work done by the system
When compressing a gas:
𝑊 = 𝑝∆𝑉 (I-6)
Where 𝑝 is the pressure and ∆𝑉 is the volume change (negative). Compression introduces energy to the
system. In a very simple approximation, one may consider an adiabatic system during the bubble violent
collapse, because the temperature increase of the gas inside a bubble is too fast for an important heat
transport to happen (𝑄 ≅ 0). A localized transient hot spot is created in the bubble, with an average gas
temperature and pressure up to 5,000 K and 500 atm, and a fast cooling rate of 109 to 1010 K·s-1.[16-18]
This hot spot is believed to be the origin of sonoluminescence and sonochemistry.[12, 19]
I.1.2.4 Non-equilibrium model
It was recently shown that the hot spot theory is not sufficient to take into account the complex
conditions in cavitation: quasi-adiabatic bubble compression, water vapor at the bubble wall, intrabubble
chemical reactions and gas molecules ionization. Therefore, a non-equilibrium model has been
developed. As presented in Table I-1, spectroscopic studies of OH (A2Σ+-X2Π), NH (A3Π-X3Σ-) and C2
Swan bands emissions from multibubble system in aqueous solutions proved evidence for non-
equilibrium plasma formation inside the collapsing bubbles.[20, 21] Such non-equilibrium plasma cannot

Bibliography
9
be characterized by a single gas temperature, but by multiple temperatures of different particles and
degrees of freedom in the plasma: electron (Te), vibrational (Tv), rotational (Tr) and translational (T0)
temperatures. These temperatures in a plasma far from thermodynamic equilibrium follow the inequality
Te > Tv > Tr ≈ T0.[22]
Table I-1 Rovibronic temperatures estimated from the simulations of molecular emissions in
sonoluminescence spectra from aqueous solutions.[18, 21, 23]
Solution Gas
Ultrasonic
frequency
(kHz)
Transition Tv (K) Tr (K) Reference
Benzene
10-3 M
Ar 20
C2 Swan
(d3Πg–
a3Πu)
4300 ± 200 - [18]
tert-butanol
0.05-0.4 M
Ar 20
C2 Swan
(d3Πg–
a3Πu)
6300 ± 1000 4800 ± 1000
[23]
tert-butanol
1·10-3 – 5·10-3 M
Ar 204 / 362 /
613
C2 Swan
(d3Πg–
a3Πu)
5800 / 8000 /
5000 (± 1000)
5800 / 4000 /
4000 (± 1000)
tert-butanol
0.12 M
Xe 20
C2 Swan
(d3Πg–
a3Πu)
14000 ± 1000 2500 ± 1000
Ammonia
0.1 M
Ar 20
OH (A2Σ+-
X2Π) 9000 ± 1000 5000 ± 500
[21]
NH (A3Π-
X3Σ-) 7000 ± 1000 4000 ± 500
Ammonia
0.1 M
Ar 359
OH (A2Σ+-
X2Π) 13000 ± 2000 6000 ± 1000
NH (A3Π-
X3Σ-) 10000 ± 1000 2200 ± 500
Bibliography
10
I.1.2.5 Microjet
As presented in Figure I-3, when acoustic cavitation occurs close to a solid boundary, a micro-jet is
formed towards the wall.[14, 24] It also happen when neighbour bubbles are close enough to each other.[19,
25]
Figure I-3 Micro-jet formation.[26]
To explain this process, the concept of impulse is significant. Impulse 𝐼 is the inertia of the liquid
moving towards a solid boundary close to the cavitation bubbles:[14]
𝐼 = 𝑢𝑀 (I-7)
Where 𝑢 is the speed of the centre of the bubble perpendicular to the substrate surface and 𝑀 is the
added mass of the bubble. This mass is based on the assumption that some liquid is carried by the moving
bubble, thus leading to a virtual addition of the bubble mass. 𝑀 can be expressed as:
𝑀 = 𝑐𝜌𝑉 (I-8)
Where 𝑐 is the added mass coefficient, 𝜌 is the liquid density and 𝑉 is the volume of the bubble.
So the impulse can also be expressed as:
I = ucρV (I-9)
In the absence of any external force, the impulse remains nearly constant with the bubble approaching
to the substrate. With the sharp shrinking of the bubble volume V during collapse, the speed of the
bubble 𝑢 increases dramatically. When the velocity 𝑢 gets too large that the spherical bubble cannot
undertake the large external pressure difference from the high velocity, a liquid inrush enters the bubble
from the side away of the substrate and pierces the other side of the bubble, targeting to the surface.[24,
27] Such so called micro-jets can achieve a velocity of several hundreds meters per second [28].
I.1.2.6 Shock wave
Shock wave is another strong acoustic phenomenon occurring during the collapse of cavitation bubbles.
Extremely rapid compression and the enormous pressure inside bubble at the collapse moment produce
a shock wave faster than the sound velocity in liquid.[8] Figure I-4 shows the propagation of a shock

Bibliography
11
wave from a trapped sonoluminescing bubble driven by low frequency ultrasound. The tiny black spot
in the center is the acoustic bubble and the ring is the shock wave.[29]
Figure I-4 Shock wave from a trapped sonoluminescing bubble produced by ultrasound at 21.4 kHz,
pressure amplitude of 132 kPa, frame interval 30 ns.[29]
The high velocity (1,000 to 4,000 m s-1) and pressure (GPa) of the shock wave make it destructive,
though it is a very localized impact due to the fast attenuation of wave energy in the medium.[30, 31]
For both micro-jet and shock wave occuring in the vicinity of a solid boundary, an important parameter
to be considered is the stand-off distance γ:[32, 33]
γ =𝐿
𝑅𝑚𝑎𝑥 (I-10)
Where 𝐿 is the distance between solid substrate and bubble center, and 𝑅𝑚𝑎𝑥 is the bubble radius at its
maximum expansion.
Obvious effects from micro-jets and shock waves on a solid surface can be observed only with a stand-
off distance γ ≤ 2 .[34, 35] These two phenomena are considered to be the principle mechanisms
responsible for surface damage, modification and cleaning.
I.1.2.7 Acoustic streaming
In an intense ultrasonic field, the acoustic wave propagation is attenuated due to the liquid viscosity.[36]
This attenuation produces a gradient of radiation pressure in liquid, which generates a steady motion of
fluid, hence an acoustic streaming.[8, 36] Two different types of acoustic streaming exist: i) Eckart
streaming in the bulk of a liquid, which accelerates fluid in the direction of acoustic traveling wave
propagation; ii) vortex-like Rayleigh streaming at the solid boundary due to the local viscous stress.[8, 37]
Acoustic streaming can significantly enhance convective heat exchange in an irradiated liquid and
accelerate the mass transfer in a heterogeneous system, thus increases sonochemical reaction rate and
ultrasonic cleaning efficiency.[38, 39]
When near a small bubble or particle, a similar but localized fluid motion caused by viscous dissipation
happens at a small length scale, named microstreaming.[8] It is a typically circulation flow with a velocity

Bibliography
12
of several millimeters per second.[40] Microstreaming can also change the processes of heat and mass
diffusion of cavitation bubbles, thus alter the phenomenon of sonochemistry and sonoluminescence.[40]
I.1.3 Sonochemistry
In general, sonochemistry is the use of acoustic cavitation to achieve chemical reactions or chemical
process. From a historical point of view, Richards and Loomis first reported the chemical effects of
power ultrasound in 1927.[41] Sonochemistry is different from the other conventional chemical processes,
due to its special cavitation bubble collapse: extreme local temperature and pressure with exceptional
cooling rate. By applying ultrasound, high energy chemical interactions can be generated in mild
conditions. The applications of sonochemistry are diverse in the domains of chemical synthesis, catalysis,
material science (nanomaterial and biomaterial) etc. Depending on the reaction environment, ultrasonic
chemical effects can be categorized into homogeneous sonochemistry of liquid systems and
heterogeneous sonochemistry at liquid-liquid or liquid-solid interfaces.[3, 4, 9, 42, 43]
I.1.3.1 Homogeneous sonochemistry
The use of ultrasound in aqueous solutions results in the production of different intermediates such as
H·, HO·, HO2· and of primary products such as H2 and H2O2. Reactions (I-11) to (I-18) present the
sonolysis of water in the presence of argon and oxygen:[4, 44]
H2O)))→ H⋅ + HO⋅ (I-11)
𝐻⋅ +𝐻𝑂⋅ → 𝐻2𝑂 (I-12)
2𝐻⋅ → 𝐻2 (I-13)
2 𝐻𝑂⋅ → 𝐻2𝑂2 (I-14)
𝐻⋅ + 𝑂2 → 𝐻𝑂2⋅ (I-15)
𝐻⋅ +𝐻𝑂2⋅ → 𝐻2𝑂2 (I-16)
2𝐻𝑂2⋅ → 𝐻2𝑂2 +𝑂2 (I-17)
𝐻2𝑂 + 𝐻𝑂⋅ → 𝐻2𝑂2 +𝐻
⋅ (I-18)
If the cavitation energy is high enough, for example in the case of Ar saturated water exposed to high
frequency ultrasound, the dissociation of diatomic gas or volatile molecules, such as oxygen and
nitrogen, can happen at bubble collapse:[45, 46]

Bibliography
13
𝑂2)))→ 2𝑂⋅ (I-19)
𝑁2)))→ 2𝑁⋅ (I-20)
The produced oxygen and nitrogen radicals can react with radicals and molecules:
𝑂⋅ +𝐻2𝑂 → 2𝐻𝑂⋅ (I-21)
𝑂⋅ +𝐻⋅ → 𝐻𝑂⋅ (I-22)
𝑁⋅ +𝐻⋅ → 𝑁𝐻⋅ (I-23)
𝑁⋅ +𝐻𝑂⋅ → 𝑁𝑂𝐻⋅ (I-24)
The key of sonochemical reactions is the radicals formed during sonolysis of water. For example, 𝐻𝑂⋅
and 𝐻2𝑂2 are strong oxidants which can react with solutes in the liquid surrounding the cavitation
bubbles. Meantime, it is found that an artificial introduction of cavitation nuclei is important for an
efficient homogeneous sonochemical process.[9]
I.1.3.2 Heterogeneous sonochemistry
Thanks to the mechanical effects of cavitation bubble collapse, sonochemistry in heterogeneous systems
is more efficient than in homogeneous systems and has been widely studied and applied for decades.
Micro-jets, shock waves and micro-streaming strongly enhance the mass transfer and significantly
accelerate the chemical reactions in the heterogeneous systems.[4, 9, 47, 48]
In liquid-liquid system, power ultrasound can form very fine emulsions, which is applied to increase the
combustion efficiency of petrol, and decrease the so-produced pollution as well.[49]
At liquid-solid interfaces, the erosion and deformation from micro-jets and shock waves is obvious.[50]
This property is widely used for ultrasonic cleaning and decontamination.[3, 51] Other studies and
applications in the fields of solid catalysts, material crystallization and electrochemistry also present the
enhancements and benefits of ultrasound in chemical process.[52-55]
More detail investigations and applications of power ultrasound in heterogeneous system will be
discussed later.
I.1.4 Sonoluminescence
The light emitted from liquid irradiated by ultrasound is called sonoluminescence (SL) or
sonochemiluminescence (SCL). The difference between SL and SCL is the origin of light emission: SL
is light emitted directly by the acoustic cavitation bubbles, as shown in Figure I-5, while SCL is

Bibliography
14
chemiluminescence from chemical reactions, e.g. luminol with oxidants (𝐻𝑂⋅and 𝐻2𝑂2) created by
cavitation.[8] Cavitation bubbles can have both activities of sonochemistry and SL, but it is believed that
SL bubbles are larger than sonochemical bubbles at certain ultrasonic frequency and power conditions.[56,
57]
Figure I-5 Sonoluminescence generation from a cavitation bubble.[58]
SL was first observed by Frenzel and Schultes in 1934.[9] The mechanism of SL is still unclear, though
different theories tried to explain it.[31, 42] One of the hypotheses is that the origin of SL is the
chemiluminescence from the plasma inside collapsing bubbles, which is similar to a flame plasma.[12]
Such plasma is created during the compression cycle or the implosion moment, when the intrabubble
gas temperature is extremely high. At such high temperature, gas and volatile molecules insides bubbles
can be degraded and excited.[17, 18] However, recent studies revealed non-equilibrium plasma as SL
source in cavitation, which indicates multiple temperatures characterization of SL emissions: lifetime
of this plasma is not long enough to allow equilibration.[22]
There are two types of SL: multibubble sonoluminescence (MBSL) and single-bubble
sonoluminescence (SBSL).[8, 9] In general conditions of liquid exposed to ultrasound, MBSL can be
observed with large numbers of interacting cavitation bubbles and bubble clusters.[59, 60] SBSL is from a
specially produced stable cavitation bubble in a standing wave of an ultrasonically irradiated and
degassed liquid.[61] Both MBSL and SBSL spectra in water present continuum emissions, which are
originated of Bremsstrahlung (electron-atom or electron-ion Bremsstrahlung) and radiative
recombination (electron-ion or 𝐻⋅-𝐻𝑂⋅radical recombination).[8, 62] For MBSL in water, a peak around
310 nm is present in spectra from excited radical of 𝐻𝑂⋅.[9, 62, 63] Emission lines of some nonvolatile
metal ions such as Na and K were also reported in MBSL spectra in aqueous solutions of NaCl and KCl
respectively (see Figure I-6).[62, 64, 65] But for SBSL, only in some typical solutions such as sulfuric acid
(Ar, Xe dissolved) or at very low acoustic pressure in water, emission lines of gas molecules like Ar,
Xe or 𝐻𝑂⋅ radicals can be observed.[8, 66]

Bibliography
15
Figure I-6 Comparison of MBSL and SBSL spectra in 1 M NaCl solution.[62]
The disparity of MBSL and SBSL spectra most probably arises from the symmetry of cavitation
compression and collapse.[8, 9, 62] For SBSL, the stable bubble compression cycle and collapse are almost
spherical, which means that much less nonvolatile particles can enter bubbles, but a featureless emission
exists in bubbles.[61] This makes it difficult to characterize the intrabubble conditions in a single bubble.
Xu and Suslick observed strong emission from excited 𝐻𝑂⋅ radicals in a single bubble produced in Ar
saturated phosphoric acid irradiated by 20 kHz ultrasound and provided an estimated rovibronic
temperature of almost 10,000 K.[67] For MBSL in phosphoric acid solution saturated by helium, the same
group observed two distinct spectroscopic temperatures of 𝐻𝑂⋅ (4000 K) and 𝑃𝑂⋅ (9500 K) emissions,
indicates both symmetrical and asymmetrical collapses occur in irradiated solution.[68] The unstable
transient bubbles and the interaction between bubbles in bubble cloud lead to the asymmetrical
collapses.[59, 62, 66] Those asymmetrical collapses can introduce ions, atoms and molecules directly into
bubbles by jetting and misting (small droplets).[66] Thus emissions from excited-state injected ions,
atoms and radicals are observed in MBSL spectra, especially the nonvolatile metal radicals (Na, K). At
the same time, the estimated temperature of the non-spherical bubbles is lower than that of the spherical
ones, due to the energy transfer by excitation and dissociation of the injected particles.[69, 70]
The SL spectroscopy provides an indirect but efficient way to determine the intrabubble conditions.[22,
58, 63] The presence of diatomic or polyatomic gas and molecules in irradiated liquid can lead to specific
emission bands in MBSL spectra, and the corresponding rotational and vibrational temperatures can be
estimated by modelling these emissions.[45]

Bibliography
16
I.1.5 Dependence of sonochemistry and sonoluminescence on various
factors
I.1.5.1 Ultrasonic frequency
Frequency of ultrasound strongly affects the initial growth and the population (number, size and
distribution) of cavitation bubbles, especially the SL and sonochemical active bubbles.[56, 57] Generally,
more nucleation and production of bubbles occur in high frequency acoustic field. The mean diameter
of cavitation bubbles and its radius distribution range decreases with an increase in ultrasonic frequency
(Figure I-7), thus a higher surface-to-volume ratio for mass transfer.[56, 71, 72] Meanwhile, in a high
frequency ultrasonic field, acoustic streaming drives bubbles away from the transducer by radiation
force, which leads to a relatively homogeneous distribution of acoustic field compared to low frequency
ultrasound.[73] So considering the size, cycle duration and stability of cavitation bubble and collapse
violence, low frequency ultrasound generates predominantly transient cavitation, whereas in high
frequency acoustic field stable cavitation is majority.[74, 75]
Figure I-7 Size distribution of chemically active bubbles at different ultrasonic frequencies in 0.01 M
luminol solution saturated by air.[56]
These changes of cavitation bubble population induced by frequency difference are ultimately reflected
in sonochemistry and SL. A strong but not linear correlation between frequency and sonochemical
activity or efficiency was previously found in different works.[74, 76-80] An important mechanical or
physical effect is expected from low frequency ultrasound, while in high frequency acoustic field, the
radical or chemical effect dominates the degradation or oxidation reactions.[81, 82] Such opposite tendency

Bibliography
17
has been proved by Protenlanger and Heusinger [81] and Petrier et al.[80] The former found the strongest
degradation of dextranes by the mechanical effect of ultrasound at 35 kHz than at frequencies over 500
kHz, while the latter observed an enhanced oxidation of iodide ions due to the more significant chemical
effect at 514 kHz than at 20 kHz. For each application, no matter in homogeneous or in heterogeneous
system, an optimal ultrasonic frequency exists. Under certain conditions, a combination of both
chemical and physical effects of ultrasound can significantly enhance the sonochemical reaction rate.
For example, in homogeneous system, the most efficient ultrasonic frequency for formation of H2O2 in
water was found around 360 kHz.[45, 74] In heterogeneous system, 40 kHz produced a better modification
of polystyrene surface in the frequency range from 20 kHz to 1 MHz,[82] and for synthesis of gold
nanoparticles, 213 kHz acoustic cavitation was found to be the most efficient from 20 kHz to 1 MHz.[77]
Such trend of optimum frequency also depends on acoustic power.[83]
In the case of MBSL, from a theoretical point of view, SL intensity is strongly linked to the maximum
gas temperature Tmax reached during bubble collapse, which highly depends on ultrasonic frequency.[31]
On the other hand, the number of active cavitation bubbles was believed to increase with ultrasonic
frequency, contributing to an enhancement of MBSL intensity.[74] As a result of these multiple effects,
the mechanism of frequency effect on sonoluminescence intensity is still unclear. Kanthale et al.
observed in the sonolysis of degassed water at a given acoustic power (exceeding Blake threshold), that
the SL intensity measured by a photomultiplier tube decreased with an increase in ultrasonic frequency,
in the order 213 > 355 > 647 > 1056 kHz.[78] But the first low-resolution MBSL spectra obtained by
Beckett and Hua demonstrated an optimum frequency (358 kHz) for the maximum MBSL intensity in
Ar saturated water.[74] A similar trend was confirmed by Pflieger et al.: a much stronger MBSL emission
in water saturated by Ar was observed at 362 kHz than at 20 kHz, and an enhancement of MBSL
intensity in the presence of Ar/20%O2 gas mixture happened at 362 kHz.[84]
Nevertheless, from both theoretical calculations and experimental observations, high frequency acoustic
cavitation mainly shows the emission from plasma continuum, while both plasma continuum and intense
lines of excited radicals (𝐻𝑂⋅) or nonvolatile ions (Na) are present in low frequency MBSL spectra.[45,
84-86]
I.1.5.2 Acoustic power
By changing acoustic power, the acoustic pressure in liquid will be changed.[42] Generally, no matter at
what frequency, an increase in acoustic power can increase acoustic pressure amplitude in liquid. As a
result, in between the upper and lower threshold of acoustic pressure amplitude, the temperature of
bubble collapse and the number of active bubbles also increase, thus improve the sonochemical yield
and the SL intensity.[44] When the pressure exceeds the upper threshold, a further increase in power will
lead to the opposite impact, which is explained by the formation of bubble clusters in the irradiated
solution.[56, 78, 85, 87] An optimum acoustic intensity or power density was observed for sonochemical

Bibliography
18
reactions in H2O2 yield,[78] oxidation of iodide,[88] decomposition of carbonyl[89] and corrosion of
stainless steel.[83] As for sonoluminescence, the enhancement by increasing acoustic power is found to
be much stronger than for sonochemistry,[78] and similarly to H2O2 yield, a maximum in SL intensity
exists,[90-92] though sometimes it cannot be detected due to the amplifier limitation.[85] It was also noticed
that an increase in acoustic power decreases the ratio of sodium line emission against continuum
emission in the sonolysis of a NaCl aqueous solution.[85] As a result, it is critical to select a proper
acoustic power for specific research or application.
I.1.5.3 Irradiated liquid
Cavitation is favored in liquids with low viscosity, low surface tension and high vapor pressure.[4, 6, 42]
A high acoustic pressure is needed for cavitation bubble nucleation and growth in a liquid with high
viscosity and high surface tension. Bubble stability, which is very important for SBSL, can be increased
in a higher viscosity liquid, such as sulfuric acid.[44] By changing the liquid from basic to acid solution
as well as the evolution of liquid pH during sonolysis may also influence sonochemical reaction rate [44]
and SL quenching.[93]
I.1.5.4 Dissolved gas
Dissolved gases in an ultrasonically irradiated liquid play as nucleation sites of cavitation, as well as the
important composition of gas phase in acoustic bubbles.[4, 6] Gases having higher solubility can increase
the size and number of cavitation bubbles, but lower the violence of bubble collapse as more gas
molecules diffuse into bubbles.[4, 6, 44] The heat specific ratio and thermal conductivity of the dissolved
gas, as well as the number of atoms in the gas molecule (monatomic or polyatomic) and gas ionization
potential, can also affect acoustic bubble collapse and intrabubble conditions, hence sonochemistry
activity and sonoluminescence intensity.[23, 63, 65, 84, 94] Considering their properties for violent collapses,
noble gases like argon and xenon are widely used in studies of sonochemistry and sonoluminescence.[44]
To compensate the degassing effect of sonication, continuous gas bubbling is usually used in
experiments in order to facilitate cavitation. By studying the impact of the gas inlet position on
sonochemical activity, Pflieger et al. showed that it is a combined effects of dissolved gas concentration
and number of cavitation nuclei (introduced by continuous gas bubbling) that control the extent of
sonochemical reactions.[95]
Some other investigations in a gas mixture like Ar/O2 or Ar/N2 found an optimum mix content for
sonochemical reactions (H2O2 yield) and SL intensity.[4, 44-46, 84] These observations indicate that a certain
content of diatomic gases in monoatomic gases can accelerate the generation and recombination of free
radicals during aqueous solution sonolysis.[4, 44]

Bibliography
19
I.1.5.5 Ambient temperature and pressure
Increasing ambient temperature reduces the cavitation threshold, but lowers the collapse violence at the
same time.[4, 44] As a result, unlike most of the chemical processes, in a sonochemical system, a higher
temperature leads to a slower reaction rate and a dimmer SL intensity. This effect is much pronounced
if the reactant is more volatile, since vapor diffusion into bubble becomes easier under high
temperature.[6, 44]
High ambient pressure reduces the liquid vapor pressure thus cavitation becomes more difficult. As long
as the acoustic pressure exceeds the threshold of the high ambient pressure, cavitation collapse intensity
can be enhanced, thus increasing sonochemical activity and SL intensity.[4, 6]
I.1.5.6 Transducer type
Based on the inverse piezoelectric effect, an ultrasonic transducer converts AC electric energy into the
vibration of a piezoelectric material and then propagates sound wave into contacted media.[8] According
to the geometric shape, two types of transducer are used: horn and plate.
A horn type transducer is normally designed to generate low frequency ultrasonic waves, which
primarily produce transient bubbles with large size and violent collapse in a local conical zone adjoining
the horn tip. However, due to the agglomeration of dense bubbles at the horn tip, an attenuation of the
cavitation efficiency exists.[44, 96] Moreover, the diameter of horn tip can influence the sonochemical
activity. Enterzari and Kruus [97] observed an increase of iodide oxidation rate with the increasing horn
tip size, and explained it by an increasing number of bubbles and less bubble coalescence or
agglomeration. However, the contrary trend with H2O2 yield in sonolyzed water was found by Nikitenko
et al.[98] and explained by the different acoustic power intensity. An optimum horn tip diameter might
exist for specific applications.
A plate type transducer, on the contrary, can be designed for both low- and high-frequency ultrasound.
For a low-frequency plate transducer, usually a standing wave is formed and active acoustic bubbles are
mainly trapped at the pressure antinodes.[44] For a high-frequency plate transducer, the standing wave is
attenuated by acoustic streaming. Therefore, traveling wave becomes dominant in the liquid at high
frequency, which drives bubbles towards the liquid surface. Hence a large cavitation active region is
expected.[44, 99] Simultaneously, the traveling wave produced by a high-frequency transducer also hinders
bubble clusters formation and enhances the mass transfer in the irradiated liquid.[100]
I.1.5.7 Reflection from a liquid surface or a solid plate
A free liquid surface or a reflective solid plate in the reactor can affect cavitation activity by modifying
the wave predominance distributed in irradiated liquid.[101-103] At low acoustic power, a free liquid
surface can reflect ultrasonic wave efficiently, which can generate a resonant standing wave in liquid if

Bibliography
20
the distance between liquid surface and the transducer plate equals to an odd multiple of 𝜆 4⁄ (Figure
I-8).[72] Such standing wave can influence cavitation activity and distribution for both sonochemistry
and SL.[8, 44, 104] When the acoustic power increases, vibration of the liquid surface becomes strong, hence
such standing wave resonance becomes unstable and weak.[104] But if a rigid solid exists in the liquid
and acts as a reflective plate, the standing wave pattern can become more dominant and stable, which
significantly impacts SL and SCL intensity and distribution in liquid.[44]
Figure I-8 Schema of a resonant standing wave: pressure variation (black) and displacement variation
(grey).
I.1.5.8 Reactor geometry
Different types of ultrasonic reactors have been designed for various studies and applications.
Thangavadivel et al.[102] observed the dependence between sonochemical efficiency and the diameter
ratio of a reactor to a 200 kHz transducer, and found a maximal sonochemical yield at the ratio equals
1.45. Kim et al. revealed that a bottom plate attached to the ultrasonic transducer at 334 kHz is more
efficient for energy transfer if their dimensions are close.[105] Other previous studies did not found
obvious effect on sonochemical activity by changing the diameter of ultrasonic reactor or vessel.[44, 98]
I.1.5.9 Mechanical stirring
An in-situ mechanical stirring is often applied during experiments, which can introduce an artificial flow
in the acoustic field. This addition of fluid motions can either increase or decrease active cavitation
activity and distribution in liquid, dependent on applied ultrasonic frequency, power, stirring speed,
Bibliography
21
reactor configuration etc.[44] Previously, Bussemaker and Zhang observed an increase of H2O2 yield with
increasing stirring speed at low frequency ultrasound (40 kHz), because the agitation flow prevents
bubble coalescence.[106] At high frequencies, a traveling wave is already present in the irradiated liquid.
Based on the sonication conditions, an artificial stirring can impact it in a positive or negative way.
Bussemaker and Zhang found a decrease of sonochemical activity and SCL distribution in high-
frequency acoustic fields (376, 995 and 1179 kHz) at low power in the presence of mechanical stirring,
and explained it by the agitation distortion of acoustic wave propagation and standing wave
formation.[106] However, a higher sonochemical activity was observed at high frequencies (204 and 613
kHz) with an agitation speed of 370 rpm, besides a more homogeneous active bubble distribution in
liquid irradiated, by Pflieger et al.[84] Therefore, depending on sonication conditions, the mechanical
stirring, the size and position of stirrer and its speed should be carefully selected if possible for a better
application.[44]
I.1.5.10 Ultrasonic duration
By controlling the ultrasonic treatment duration, sonochemical reaction rate and ultrasonic cleaning
effect can be influenced. Mahbubul et al. obtained a more stable and lower viscosity nanofluid by
extending the ultrasonic treatment duration over 90 minutes. 105 Another group of Kaltsa et al. also found
that by increasing sonication time, more stable emulsions with smaller size oil droplets can be
produced.[107] Other studies of extraction efficiency,[108] catalytic reaction rate,[109] surface modification
and structuration [42, 110] also proved the importance to control the duration of ultrasound in order to
obtain an effective treatment.
I.2 Ultrasonic modification and cleaning of solid surfaces
As described before, it has been proved that within a short distance between a collapsing bubble and a
solid substrate, the combined impact of microjets and shockwaves from the bubble collapse, besides the
extreme local temperature and pressure, can strongly modify the physical morphology and chemical
composition of the substrate surface.[50] On the one hand, this effect may induce unwanted erosion
damages on surfaces, such as the erosion of ship propellers and turbine blades. On the other hand, it can
be an efficient method for surface cleaning and for special functional surfaces formation to meet
industrial requirements. Macro- and micro-scale applications of power ultrasound devoted to the
modification and cleaning of extended surfaces, e.g. organic polymers, inorganic solids or metallic
alloys, have been developed for over 50 years already.[3, 4, 42, 50, 111] Compared to other conventional
techniques, ultrasonic surface modification and cleaning have the advantages of easier access to narrow
areas, fewer process stages, use of less or non-hazardous aqueous solutions, a wider range of substrate
surfaces to be treated and milder operating conditions.[3]

Bibliography
22
I.2.1 Ultrasonic modification of solid surfaces
I.2.1.1 Polymer
Polymers like acrylonitrile butadiene styrene (ABS), polyvinyl chloride (PVC) and polyethylene
initially have an inert surface, which is hard for adhesion or coating. In order to improve their
functionality, polymer surfaces usually have to be modified to increase the roughness and wettability,
so that compounds like dyes, metal ions and hydrophilic monomers can be grafted to the treated
surfaces.[111] To achieve a better adhesion, power ultrasound can be joined with conventional wet
chemical treatments to significantly accelerate the polymer material surface functionalization process:
(1) microjets increase the roughness, thus expanding the contact surface; (2) locally high temperatures
and pressures reached by collapsing bubbles break chains and bonds on surfaces; (3) generated radicals
may chemically oxidize material surfaces.[3] The chemical etching of ABS surface was compared by
Zhao et al. in the presence or absence of power ultrasound.[110] Figure I-9 illustrates the stronger and
faster surface roughness increase observed under ultrasound irradiation in comparison to conventional
etching in the presence of chromic acid. Generally, the sonochemical enhancement of polymer surface
coating properties depends on the type of polymer substrates, the initial polymer surface condition, the
processing solution, the operation temperature, and the ultrasound properties including the frequency,
saturating atmosphere and applied power intensity. For example, it was observed that for sonochemical
surface modification of a polymer named Noryl (polyphenylene/polyester) in water, a much higher
weight loss and a more significant change of surface morphology were observed at 20 kHz ultrasound,
than at 40 kHz and at high frequencies (582, 863 and 1142 kHz). Besides, an obvious increase of
sonicated polymeric surface oxidation in the order from 20 kHz to 863 kHz indicated a stronger
sonochemical effect by high-frequency ultrasound.[82]
Figure I-9 Surface roughness of ABS versus etching time in the presence and absence of ultrasound.[110]

Bibliography
23
I.2.1.2 Inorganic solids
For layered inorganic solids, such as sulfides and oxides (ZrS2, TaS2, MoS2, MoO3, V2O5), adsorption
of organic, organometallic and inorganic compounds between their layered microstructure may
significantly change their catalytic, electronic and optical properties. Such materials have been highly
used for the preparation of batteries, lubricants and catalysts.[112] To produce these materials, routine
synthetic techniques normally require long treatment duration and high operational temperature. When
combined with high-intensity ultrasound, the intercalation rate of molecules into layered inorganic solids
was found to be dramatically improved.[111, 112] Suslick et al. examined the effect of 20 kHz ultrasound
with high intensity (20 W.cm-2) on inorganic solids of TaS2, MoO3, and found strong erosion with solid
particle size reduction from 60 to 5 μm, and also significant aggregation of inorganic particles after 30
minutes sonication.
Some hard inorganic surfaces such as ceramics and glasses may also be modified under ultrasound
irradiation in order to modify the physico-chemical properties of their surfaces. Virot et al. studied the
effect of acoustic cavitation at the water-glass interface with two different types of glass materials: soda
lime and fused silica.[32] Their experimental results clearly indicated that glass surface sonicated by 20
kHz ultrasound was not only eroded physically as illustrated in Figure I-10. Chemical analyses of the
post-sonicated solutions evidenced an acceleration of the leaching of the glass material components
during sonication. Similar strong erosion effects were previously observed by Cobley and Mason on
ceramic surface materials sonicated in pure water.[113] The same group also found that ceramic surface
modification level does not correspond to their glass transition temperatures (Tg) or their surface
chemical composition, which means that chemical attack is not as important as the physical damages
for such ceramic/glass material surfaces.[114]
Figure I-10 Erosion of fused silica glass sonicated 180 min in distilled water at 25°C by 20 kHz ultrasound
at 49 W.cm-2.[32]
I.2.1.3 Metals and metallic alloys
For metals and their alloys, ultrasound irradiation has been widely applied for surface structuration,
crystallization, finishing, coating, etc.[50] Several authors showed that sonication processing allows metal

Bibliography
24
surfaces to be highly functionalized with a superhydrophobic feature, to show excellent electrostatic
properties, to possess a good adhesion for anticorrosion coating, or to exhibit metal hydride layers for
hydrogen-storage.[50, 115-117]
Chiu et al. has identified three stages of surface roughness evolution for metal alloys based on stainless
steel, titanium and copper.[113] They initially observed an almost linear increase of the roughness,
followed by its slight decrease in a second stage, until a stable roughness is observed in a final stage.
This evolution is well correlated to the acoustic cavitation erosion periods of incubation, acceleration
and maximum saturation observed by other authors, for instance for aluminum and glass materials.[32,
118]
Due to the ductility and reactivity of some metallic materials, both physical and chemical effects of
acoustic cavitation may play a predominant role during surface modifications.[50, 119] Microjets and shock
waves resulting from the cavitation bubble collapses may directly deform metallic surface. For instance,
Verdan et al. have done series of ultrasonic tests with aluminum, copper, silver and zinc surfaces at 20
kHz in water.[120] They found that on the surface after a very short sonication time, pits and craters are
the most common microscopic deformation structures observed (see Figure I-11). At the same time,
similar increasing trend of surface roughness with the sonication duration was observed for each
examined metal, for example aluminum surface roughness raised from an initial 5 μm to about 30 μm
after 4 minutes treatment. These ultrasonically modified metal surfaces can be used in industry to
enhance coating adherence for specific applications.[120]
Figure I-11 SEM images of metallic surfaces sonicated at 20 kHz in pure water (40°C, 40 W.cm-2): (a) Al
sonicated during 4 min; (b) Cu sonicated during 10 min; (c) Ag sonicated during 10 min and (d) Zn
sonicated during 10 min.[120]
Meanwhile, some results suggested that for low melting point metals, the high bubble collapsing
temperatures may locally melt some surface compounds and then recrystallize them due to fast cooling
rates[50]. A smaller grain size and a refined surface structure can be expected during recrystallization
processes. Even if the temperature reached during bubble collapses is not high enough to melt metallic

Bibliography
25
surfaces, the stressed induced solid-state diffusion may also result in the formation of a porous structure
at the metal surface.[121] For example, the formation of mesoporous structures on different metallic
surfaces was noticed by Skorb et al. They applied low frequency ultrasound (20 kHz) at high power
intensity (57 and 200 W.cm-2) to material of aluminum, magnesium, stainless steel in water and titanium
surfaces in 5 M sodium hydroxide solution respectively. As presented in Figure I-12, highly modified
surfaces with similar porous structures on these 4 different metals were produced after 15 to 40 minutes
sonication, which represented a strong hydrophilic property.[115, 122] Such specific nanostructures can
potentially be applied for the development of superhydrophilic or superhydrophobic surfaces, which are
of great interest in the fields of automotive, aerospace and biomaterial.[115, 122]
Figure I-12 SEM images of metallic surfaces sonicated at 20 kHz in pure water (65°C, 57 W.cm-2): (a) Al;
(b) Mg alloys; (c) stainless steel; and (d) in 5 M NaOH solution (60°C, maximum 200 W.cm-2) Ti.[115, 122]
In addition, the sonochemical reactions triggered in heterogeneous systems can also lead to the
formation of new phases at metal surfaces. Reactive radicals produced during bubble collapses may
react with the unprotected surface through oxidative or reductive processes.[50, 117] For example, a
sponge-like structure, composed of porous metal stabilized by an oxide layer, was observed by Skorb et
al. with chemically reactive metal particles, including Zn, Mg, Al and their alloys, sonicated at 20 kHz
in water. Such novel metal sponges are of great interest to form nanocomposites, nanocatalysts and
corrosion-resistant surfaces for applications in material science, chemistry and biomedical science.[123]
However, the ultrasonic aid on the formation of these mesoporous structures is not evident, since similar
oxide microstructures was observed with various metals (Mg, Al, Ni) after hot water treatment
(75°C).[124]

Bibliography
26
I.2.2 Ultrasonic cleaning of solid surfaces
Ultrasound has been applied as a tool for surface cleaning since 1950s.[125] Nowadays, it is widely used
in daily life (glasses, watches and jewelry washing), electronics (cleaning of printed circuit boards),
optics (decontamination of optical instruments), pharmaceutical industry (cleaning of medicine bottles),
laboratory (descaling of experimental devices), machinery (removal of corrosion layers), metal industry
(cleaning of metal wires) and many other fields.[125, 126]
Cleaning or removal of dirt and contaminants from the target surfaces can be accomplished by either
chemical dissolution by solvents or physical erosion by external forces.[127] In case of ultrasonic cleaning,
two primary factors drive the cleaning process in both physical and chemical approaches: i) the non-
symmetric collapse in the vicinity of a solid surface, which can directly damage the adhered dirt and
contaminants; ii) the acoustic streaming in ultrasonic field, which can reduce the thickness of
hydrodynamic boundary on the surface and enhance the mass transfer at the interface of contaminant
and solvent.[51]
The biggest advantage of ultrasonic cleaning is that it has much less limit of the shape and size of objects
and it can easily get access to small cavities and blind spaces in treated materials that are not accessible
for other conventional cleaning approaches. As described before, cavitation bubble size is inversely
related to ultrasonic frequency. As a result, depending on the size of contaminants, different frequencies
are applied in ultrasonic cleaning as presented in Figure I-13.
Figure I-13 Ultrasonic cleaning application as a function of frequency.[127]
In general, most ultrasonic cleaning systems are based on frequency from approximately 20 to 200
kHz.[127] Approximately, 20 to 40 kHz is suitable for industrial machine metals cleaning, while
frequencies of 60 to 80 kHz are often used for more precise cleaning applications. Intermediate to high
frequency (100 to 200 kHz) ultrasonic systems are introduced for very delicate parts cleaning, such as
medical and optical instruments. Some systems also provide the option of multiple frequencies within a
single ultrasonic cleaning tank. In semiconductor production, megasonic cleaning is used in order to
minimize the cavitation damage on the fragile silicon wafers (see Figure I-14).[128]

Bibliography
27
Megasonic cleaning has a range from 350 kHz to 2 MHz, which is efficient in removal of sub-micron
particles.[51] In contrast with conventional ultrasonic cleaning at low frequency, where surface cleaning
is from both physical and chemical effects from cavitation, at megasonic frequencies fluid motion
(acoustic streaming and micro streaming) is dominant in decontamination.[127] As a result, contaminants
on surface are swept and cleaned by shear forces of the megasonic fluid flow, which will not attack the
substrates. However, megasonic cleaning is not suitable for complex structures or in blind corners.[128]
Figure I-14 Cleaning of microstructures with high aspect ratio: without (left) and with megasonics
(right).[129]
After several decades of progress in both theory and application technology, various ultrasonic cleaning
systems have been developed to meet the different cleaning purposes of solid surfaces with different
sizes, geometries, chemical compositions and physical properties. These systems include high frequency
ultrasonic cleaning, focused ultrasonic cleaning, multi-frequency ultrasonic cleaning and sweep
frequency ultrasonic cleaning.[130]
Besides, in addition to these specially designed cleaning systems and equipment, the control of the
operational conditions (including the ultrasonic frequency, intensity, temperature, detergent solution and
surfactant, etc.) is essential for an efficient cleaning of material surfaces. Usually, a combination of
ultrasound with other thermal or chemical cleaning techniques is also attractive for a better cleaning
result.[51, 131]
I.3 Decontamination of UNGG radioactive structure
materials
I.3.1 UNGG reactors
I.3.1.1 UNGG reactor development history in France
After the Second World War, France decided to develop its own capability of nuclear power, both in
military and civilian fields. However, even with sufficient deposits of uranium ore, the lack of industrial
scale facilities for enrichment of uranium limited the available possibility of choice for French
government at that time. To skip the step of enrichment and to directly apply natural uranium in nuclear

Bibliography
28
reactors, moderators characterized with a small absorption cross-section and a large scattering cross-
section were essential. Though heavy water was the best candidate as a moderator, its production
technology was not mastered by France yet. To meet these limitations, purified graphite, as a mature
developed industrial product, replaced heavy water to be the neutron moderator. It has a low neutron
capture cross-section and good mechanical resistance to neutron flux and temperature. Carbon dioxide
was chosen as the coolant due to its good properties for heat transfer and neutron cross section, as well
as its easy access, cheap price and chemical stability with graphite, cladding material and uranium
fuel.[132]
As soon as the design of such a gas-cooled nuclear reactor was decided, the construction of the natural
uranium graphite-gas (UNGG) reactors in France started rapidly. In total, 9 UNGG reactors were built
in France as located in Figure I-15 and 1 in Spain (Vandellos unit 1). The first three UNGG reactors
(G1, G2 and G3) were built in Marcoule by CEA between 1956 and 1960, in order to supply plutonium
for the manufacture of nuclear weapons. Then six other reactors were commissioned between 1963 and
1972 for the thermal and electrical power generation. Table I-2 summarizes the basic characteristics of
those 9 reactors.
Figure I-15 Location of the 9 French UNGG reactors.[132]

Bibliography
29
Table I-2 Characteristics of the 9 UNGG reactors implemented in France.[132, 133]
UNGG
reactor G1 G2 G3 CHA1 CHA2 CHA3 SLA1 SLA2 BUA1
Site Marcoule Chinon St-Laurent-des-Eaux Bugey
Manager CEA EDF
Commission
time
01/1956
10/1968
07/1958
02/1980
06/1959
06/1984
06/1963
04/1973
02/1965
06/1985
08/1966
06/1990
03/1969
04/1990
08/1971
04/1992
04/1972
05/1994
Thermal
power 46 250 250 300 850 1560 1650 1700 1920
Electrical
power 2 38 38 70 210 365 480 515 540
Graphite mass
(t) 1200 1300 1300 1120 1650 2350 2572 2440 2039
Operation
temp. (°C) 30-230 140-400 150-360 190-290 240-410 230-430 240-440 220-530
Piling mode horizontal vertical
Coolant Air CO2
Pressure (bar) 1 15 25 26 27 29 43
Gas flow Longitudinal upward downward
Heat
exchanger non-integrated non-integrated integrated
Cladding
nature Mg-Zr alloy
I.3.1.2 Principle of nuclear fission in UNGG reactors
In a thermal nuclear reactor, such as UNGG units, fission reactions occur between neutrons and fissile
material such as 233U, 235U, 239Pu and 241Pu. And 235U is the most common and used nuclear fuel. Each
fission reaction leads to the creation of two fission fragments which are ejected at a high speed, and may
locally warm up the fuel matrix. Electricity is converted from thermal energy generated by fission
Bibliography
30
reactions in nuclear reactors. In the nuclear fission reaction of 235U, approximately 2.3 high-energy
neutrons (with an average energy of 2.1 MeV) are produced and continuously interact with other 235U
isotopes to maintain the chain reaction (I-25). A parallel phenomenon of activation of 238U produces
plutonium (I-26), which can be used for military applications and MOX fuel fabrication. The created
neutrons arising from nuclear fissions have a very high energy/speed. However, nuclear fission reactions
of 235U has a much higher effective cross-section with neutrons at low energy (0.025 eV), so called
thermal neutrons. Hence a neutron moderator is necessary to slow down those fast neutrons to thermal
level and therefore maintain the chain reaction.[132]
U + 𝑛01 → 𝑈92
236 → 𝐹𝑃1 + 𝐹𝑃2 + 𝑘 𝑛01
92235 (I-25)
U + 𝑛01 → 𝑈92
239 + 𝛾 →92238 𝑁𝑝 + 𝑒 + 𝜐 → 𝑃𝑢94
239 + 𝑒−10 +−1
093239 𝜐 (I-26)
With, 𝑛, the neutron, 𝐹𝑃1 and 𝐹𝑃2 , the fission products ( 𝐾𝑟3685 , 𝑆𝑟38
80 , 𝑇𝑐4389 , 𝐼53
128 , 𝐶𝑠55137 , etc.), 𝑘, the
average number of emitted fast neutrons (𝑘 ≅ 2.3).
To maintain the critical state in a thermal reactor, the multiplication factor k should be equal to 1, which
means that a steady state is observed for the neutron population. The latter is function of the rate of
neutron production (due to fission processes) and the rate of neutron losses (due to non-fission
absorption mechanisms and leakage from the system). Therefore, a proper distance between 235U
isotopes (fuel concentration) in fuel, an efficient moderator in the reactor and an appropriate distribution
of absorption material (control rods) are essential conditions for nuclear chain reaction to happen and
be maintained. Furthermore, a coolant flow (liquid or gas) with good thermal specific capacity is also
important for heat transfer. Combining all of these factors, different types of nuclear power plant were
designed and developed for civil and military applications. One of the initial and important nuclear
power plant designed for the development of nuclear industry in France was the UNGG reactor.[134]
I.3.1.3 UNGG reactor conception
UNGG is the first generation of nuclear reactors in France. These reactors used metallic natural uranium
(0.7% 235U) as fuel, graphite as moderator and gas as coolant for their operation. Presented in Figure
I-16, a UNGG reactor (type SLA2) consists of four main elements:[132]
— The reactor core contains the metallic natural uranium fuel, the graphite moderator and the
control rods. The entire reactor core is confined inside a steel reactor vessel acting as a heat
insulator.
— The primary circuit, which contains the heat-transfer coolant, a gas composed of over 97%
volume CO2 (except air for the first reactor G1). The role of heat transfer is provided by the gas
which allows transporting the heat produced by the nuclear chain reactions to the heat exchanger
between the primary and secondary circuit. The earlier units in Marcoule and Chinon had heat

Bibliography
31
exchangers outside the reactor vessel. Later units (Saint-Laurent, Bugey and Vandellos) moved
the heat exchangers into the vessel. These first two elements are placed in a concrete building
used as a radiation shield.
— The secondary circuit contains the water that drives the movement of the turbines. The water is
heated and converted into steam in the heat exchanger in contact with the primary circuit. The
steam is then used to drive the turbine connected to the alternator which allows the production
of electricity.
— The water vapor of the secondary circuit is condensed by a cooling circuit connected to a source
of cold water from a river or a sea.
Figure I-16 Scheme of a UNGG reactor (type SLA2).[132]
As the main components of the reactor core, the fuel, the moderator and the coolant were specially
optimized for UNGG reactor’s specific technology and configuration.

Bibliography
32
I.3.1.3.1 Fuel element
The fuel tube used in UNGG reactor of SLA2 is shown as an example in Figure I-17. Considering the
low 235U concentration of unenriched natural uranium, UNGG fuel was packed in the form of thin
cylinders of metallic natural uranium to provide a sufficient 235U density for the maintenance of the
chain reaction in the reactor core. Natural metallic uranium fuel was then introduced into Mg-Zr (~0.5
wt.% Zr) alloy cladding tube sealed with two Mg-Mn (~1.2 wt.% Mn) plug ends before being inserted
in a graphite shell.[132] The fins structure present on the outside part of the cladding allows turbulence of
the coolant gas and expands the heat transfer surface between fuel and gas. The fuel tubes were replaced
during the operation at a rate of about 2 to 3 channels per day.[134]
Figure I-17 Scheme of a UNGG fuel tube (type SLA2).[132, 135]
In fact, during the development of UNGG reactors, an evolution of fuel element can be seen in Figure
I-18. The early fuel elements (G1, G2 and G3) were designed as simple bars with longitudinal fin
structures on the outside of their claddings, and were loaded in a horizontal direction in reactors. With
the change in operation conditions and the improvement of power generation capacity in the later-built
reactors, obvious modifications of dimensions and shapes of fuel elements are observed. The later
additions of graphite core and shell, as well as the chevron fin structures, optimized the fission yield,
mechanical resistance and heat exchange inside reactors. The fuel loading mode also became vertical
for the later EDF reactors.[133]

Bibliography
33
Figure I-18 UNGG fuel element evolution.[136]
I.3.1.3.2 Moderator
The primary function of a moderator is to slow down the fast neutrons into thermal neutrons, thus
allowing effective chain reactions. Owing to its low neutron absorption cross-section and good
mechanical resistance in the environment of strong radiation and high temperature in reactor core,
graphite was used as moderator in forms of piles for UNGG reactors, which consisted of large number
of arranged graphite bricks. According to different reactors, the geometries of graphite bricks (hollow
or hexagonal) evolved with the shape of the fuel elements. The early reactors of CEA (G1, G2 and G3)
had horizontal channel moderator piles, while the later ones belonging to EDF had vertical channel
piles.[133]
An example of graphite piles in construction for a UNGG reactor (type CHA3) is illustrated in Figure
I-19.a. One piece of graphite brick (type SLA2) is presented as an example in Figure I-19.c. Fuel tubes
(Figure I-19.b) or control rods can be inserted in the cylindrical channels of the graphite bricks. The
moderator cannot be replaced during the operating of the reactor. Thus its lifetime (between 10 and 24
years) is the same as that of the reactor. Due to the poor neutron slow-down efficiency of graphite, the
volume of moderator should be sufficiently large in order to achieve significant power levels. After
decades of service, different radionuclides were present in the moderation graphite, coming from the
neutron activation of impurities, fragments of the fuel and the fission products of uranium. The most
common radionuclides are short-lived 3H, 60Co, 133Ba and 137Cs, and long-lived 14C and 36Cl (half-life
period > 31 years).[133]
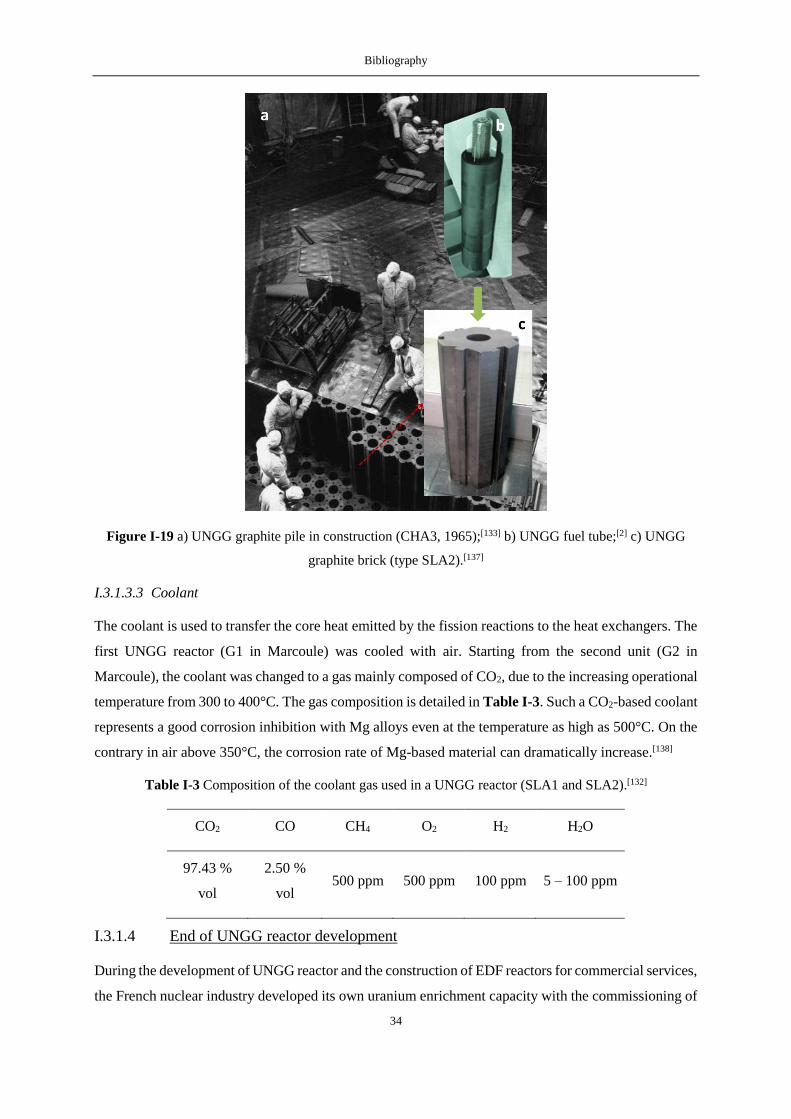
Bibliography
34
Figure I-19 a) UNGG graphite pile in construction (CHA3, 1965);[133] b) UNGG fuel tube;[2] c) UNGG
graphite brick (type SLA2).[137]
I.3.1.3.3 Coolant
The coolant is used to transfer the core heat emitted by the fission reactions to the heat exchangers. The
first UNGG reactor (G1 in Marcoule) was cooled with air. Starting from the second unit (G2 in
Marcoule), the coolant was changed to a gas mainly composed of CO2, due to the increasing operational
temperature from 300 to 400°C. The gas composition is detailed in Table I-3. Such a CO2-based coolant
represents a good corrosion inhibition with Mg alloys even at the temperature as high as 500°C. On the
contrary in air above 350°C, the corrosion rate of Mg-based material can dramatically increase.[138]
Table I-3 Composition of the coolant gas used in a UNGG reactor (SLA1 and SLA2).[132]
CO2 CO CH4 O2 H2 H2O
97.43 %
vol
2.50 %
vol 500 ppm 500 ppm 100 ppm 5 – 100 ppm
I.3.1.4 End of UNGG reactor development
During the development of UNGG reactor and the construction of EDF reactors for commercial services,
the French nuclear industry developed its own uranium enrichment capacity with the commissioning of

Bibliography
35
the enrichment plant in Pierrelatte in 1964. Therefore, EDF modified its research strategy towards Light
Water Reactors (LWR), using light water as both moderator and coolant. It became widely agreed that
LWR was much more efficient and economic than UNGG reactors, since the upper power limit of a
UNGG reactor was restricted by the volume of graphite moderator and in turn the high capital cost. As
a result, in 1968, the last designed UNGG power plant in Fessenheim was abandoned during its
construction. Since then, the safer and more economical LWRs have occupied the nuclear industry in
France and in the world.[132, 134]
I.3.2 Nuclear reactor cladding material: Mg-Zr alloy and stainless steel
I.3.2.1 Nuclear fuel cladding
In a reactor core, the first and important barrier to avoid the radioactive elements of fuel and its fission
products entering the primary circuit and environment is the fuel cladding. Considering that the cladding
is exposed to the most severe conditions in a reactor during operation, cladding material selections are
restricted. Multiple prerequisites should be taken into account: high neutron transparency, good neutron
radiation resistance, sufficient maximum service temperature, acceptable melting temperature, excellent
thermal conductivity, low thermal expansion, good creep resistance, suitable mechanical strength, high
corrosion resistance, stable chemical compatibility with fuel materials, coolant, moderator and fissile
products, etc. The neutron capture cross-section versus melting temperature for different elements is
present in Figure I-20.[139, 140] The low neutron absorption of magnesium combined to its other intrinsic
properties allowed this metal to be considered as an appropriate base for the nuclear fuel cladding alloys
in the first generation of reactors.

Bibliography
36
Figure I-20 Element melting temperatures versus neutron absorption cross-sections.[139]
I.3.2.2 Mg alloys cladding
I.3.2.2.1 Mg and its alloys
Magnesium, as the fourth most abundant element in the Earth (13 % mass of our planet after iron, oxygen
and silicon), makes itself easy access and cheap for industrial applications.[141] Pure Mg is a shiny grey
metal, with a low density of 1.738 kg.m-3 at 20°C.[142] Crystalline Mg exhibits a hexagonal structure with
a c/a ratio equals to 1.623 (parameters of mesh a = 0.32093 nm and c = 0.52099 nm). With a low melting
point at 650°C and a low boiling point at 1090°C under atmospheric pressure, Mg is very ductile with
temperature increase and can be readily casted and welded.[143, 144] As one of the second column (alkaline
earth metals) of the periodic table, Mg is very reactive both in air and aqueous medium even at room
temperature. When coupled or precipitated with other metallic elements, Mg can be damaged even more
strongly by galvanic corrosion. Nevertheless, such corrosion of Mg can be slowed down or stopped by
the formation of a protective film of oxide or hydroxide on the Mg surface.[142]
Considering the high chemical reactivity, as well as the low mechanical properties and flammability of
pure Mg, this metal is commonly alloyed with other metallic elements including aluminum, zinc, cerium,
silver, thorium, yttrium or zirconium. Mg alloys normally have good flowability due to their high fluidity
in the liquid state and their machinability is also excellent. However, these alloys can have a high
microporosity as well as a large grain size resulting from fabrication processes which are detrimental to
their mechanical properties. By adding zirconium elements, the grain size can be refined and the

Bibliography
37
formation of microporosities can be prevented, which significantly improves the mechanical properties
of Mg alloys. In the light of the similar low neutron absorption cross-section of zirconium (see Figure
I-20), Mg-Zr alloy was applied as the nuclear cladding material for UNGG reactors.[142, 145]
I.3.2.2.2 Mg alloys in UNGG
In fact, the first UNGG reactor G1 used commercial magnesium, and not Mg-Zr alloys, as the material
for fuel cladding. Though such claddings worked properly under its operational temperature below
300°C in air, some corrosion was observed after their service. At the same time, laboratory experiments
had proven that in CO2 gas environment, Mg and its alloys performed a good corrosion resistance even
for temperatures around 450°C, which was higher than the operational temperature selected (400°C) for
the next designed UNGG reactors (G2 and G3). In addition, most of the Mg alloys can not meet the
criterions required for the new reactors excepted for Mg-Zr alloy. Thanks to their finer grain size and
lower microporosity, even after long irradiations at high temperatures, Mg-Zr alloy claddings still
maintained a low thermal expansion, a good creep resistance and a high mechanical strength. Hence,
the decision to adopt Mg-Zr alloy as a cladding material became logical.[145] As described above, the
plug ends of fuel elements were composed of Mg-Mn (~1.2 wt.%) alloys. Similar to that of Zr with Mg,
a small amount of Mn can also refine Mg grains, but better than Zr.[146] Though the physical properties
of Mg-Mn alloys were found not far from that of Mg-Zr alloys,[147] Mg-Mn alloys exhibit a better thermal
conductivity, besides a higher strain-dependent damping,[146] which made it more suitable as cladding
plugs.
With the development of nuclear reactors, a higher primary circuit temperature was required to increase
the thermal efficiency of the reactors. Mg-Zr alloy operational temperature was restricted to
approximately 500°C due to its creep and corrosion resistance. Meanwhile, long-term storage in spent
fuel pools was impossible for Mg-Zr alloy because of its high corrosion rate in water. As the LWR
replaced UNGG reactors in France, there was no reason to use Mg-Zr alloys in the light water primary
circuit environment. Instead, stainless steel and Zr alloys became the main fuel cladding material.[134, 139,
140]
I.3.2.2.3 Characteristic of Mg-Zr claddings after service and during storage
During the lifetime of fuel element in a core, irradiation can result in the diffusion of radioactive fission
products in the inner wall of the cladding including 90Sr, 137Cs, 60Co, 63Ni, 239Pu, 240Pu, 241Pu and 241Am.
This diffusion process was found as deep as 20 μm, which significantly reduced the ductility of the
material. 35 To solve this problem, a graphite barrier named aquadag was coated on the inner side of
UNGG cladding to keep the diffusion depth within a few microns.[2, 140]
Within the service period of fuel rods, corrosion of the Mg based cladding material can happen at the
high in-core operational temperature. Considering the negligible quantity of zirconium in Mg-Zr

Bibliography
38
cladding, corrosion mainly occurred with chemically active magnesium. In air coolant, impurities such
as hydrocarbons and water vapor played the main harmful role in the slow corrosion reactions with
claddings, and this complicated process can be strongly accelerated with the temperature increase. For
example, the maximum corrosion thickness formed on a pure Mg surface can reach 250 mm per year in
dry air at 575°C under atmospheric pressure, while this value was just 5 mm per year at 475°C. Yet, in
dry CO2 the corrosion layer formation was ignorable (< 10-2 mm per year for Mg-Zr alloys). The possible
chemical reactions between Mg and O2, CO2 are listed below (reactions (I-27 to (I-31):[138]
1 2⁄ 𝑂2 +𝑀𝑔 → 𝑀𝑔𝑂 (I-27)
𝐶𝑂2 +𝑀𝑔 → 𝑀𝑔𝑂 + 𝐶𝑂 (I-28)
𝐶𝑂 +𝑀𝑔 → 𝑀𝑔𝑂 + 𝐶 (I-29)
𝐶𝑂2 + 2𝑀𝑔 → 2𝑀𝑔𝑂 + 𝐶 (I-30)
𝐶𝑂2 +𝑀𝑔𝑂 → 𝑀𝑔𝐶𝑂3 (I-31)
According to the (I-27) to (I-31) reactions, one can expect the formation of a thin corrosion layer
enriched in MgO, MgCO3 and carbon on the metal at the real operational temperature. However, the
formation kinetics for these corrosion products was found to be lower with Mg-Zr alloys.[138]
Furthermore, after the operating cycle, corrosion of Mg-Zr cladding of the discharged fuel rods did not
stop, but continued and even became severe during the storage in spent fuel pools and cement matrix
packages.[2, 148] In fact, most of the corrosion of Mg-Zr claddings occurred after their service in reactors,
producing large amounts of magnesium hydroxide and hydrogen.[149] The corrosion process of Mg in
moist air or water is presented in the following reaction (I-32):[2]
𝑀𝑔 + 2𝐻2𝑂 → 𝑀𝑔(𝑂𝐻)2 +𝐻2 (I-32)
The overall reaction can be expressed into the anodic and cathodic partial reactions and the formation
of precipitates expressed in reactions (I-33) to (I-35):[2]
Anodic reaction: 𝑀𝑔 → 𝑀𝑔2+ + 2𝑒− (I-33)
Cathodic reaction: 2𝐻2𝑂 + 2𝑒− → 𝐻2 + 2𝑂𝐻
− (I-34)
Precipitation: 𝑀𝑔2+ + 2𝑂𝐻− → 𝑀𝑔(𝑂𝐻)2 (I-35)
In the spent fuel pools, the temperature increase caused by the decay of the used fuel may enhance the
corrosion reaction between Mg and water. Besides, the existence of chloride ions (impurities in graphite)
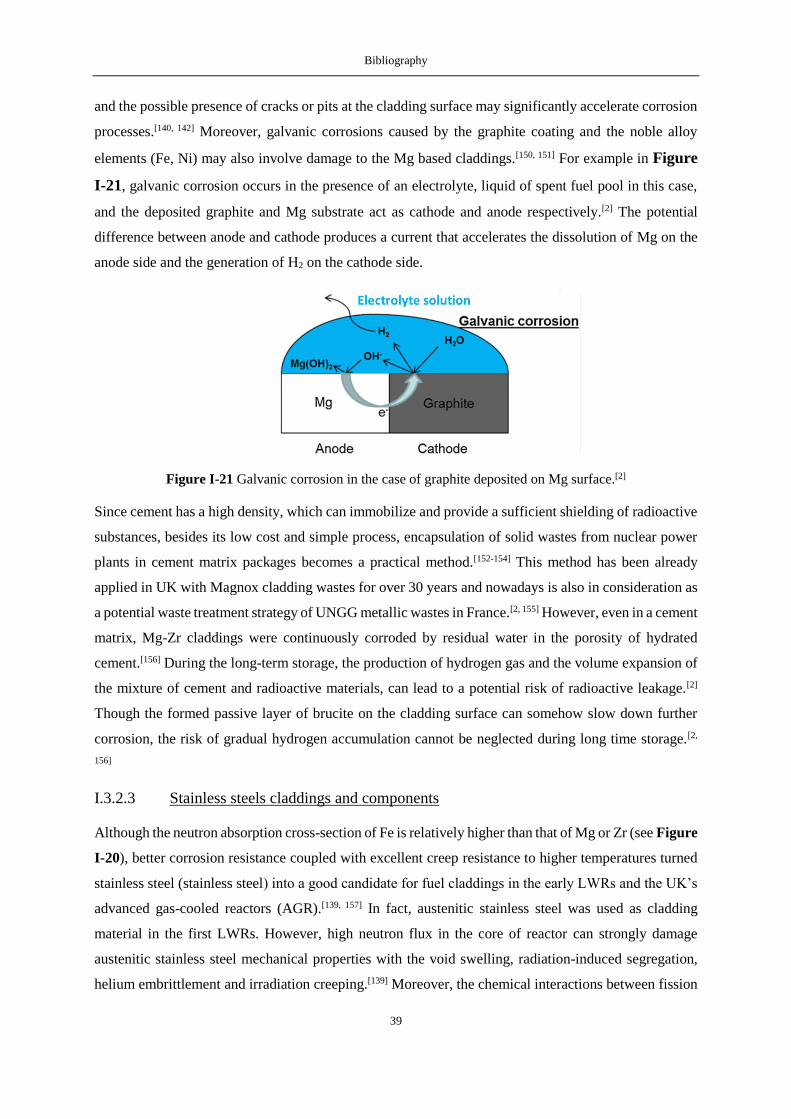
Bibliography
39
and the possible presence of cracks or pits at the cladding surface may significantly accelerate corrosion
processes.[140, 142] Moreover, galvanic corrosions caused by the graphite coating and the noble alloy
elements (Fe, Ni) may also involve damage to the Mg based claddings.[150, 151] For example in Figure
I-21, galvanic corrosion occurs in the presence of an electrolyte, liquid of spent fuel pool in this case,
and the deposited graphite and Mg substrate act as cathode and anode respectively.[2] The potential
difference between anode and cathode produces a current that accelerates the dissolution of Mg on the
anode side and the generation of H2 on the cathode side.
Figure I-21 Galvanic corrosion in the case of graphite deposited on Mg surface.[2]
Since cement has a high density, which can immobilize and provide a sufficient shielding of radioactive
substances, besides its low cost and simple process, encapsulation of solid wastes from nuclear power
plants in cement matrix packages becomes a practical method.[152-154] This method has been already
applied in UK with Magnox cladding wastes for over 30 years and nowadays is also in consideration as
a potential waste treatment strategy of UNGG metallic wastes in France.[2, 155] However, even in a cement
matrix, Mg-Zr claddings were continuously corroded by residual water in the porosity of hydrated
cement.[156] During the long-term storage, the production of hydrogen gas and the volume expansion of
the mixture of cement and radioactive materials, can lead to a potential risk of radioactive leakage.[2]
Though the formed passive layer of brucite on the cladding surface can somehow slow down further
corrosion, the risk of gradual hydrogen accumulation cannot be neglected during long time storage.[2,
156]
I.3.2.3 Stainless steels claddings and components
Although the neutron absorption cross-section of Fe is relatively higher than that of Mg or Zr (see Figure
I-20), better corrosion resistance coupled with excellent creep resistance to higher temperatures turned
stainless steel (stainless steel) into a good candidate for fuel claddings in the early LWRs and the UK’s
advanced gas-cooled reactors (AGR).[139, 157] In fact, austenitic stainless steel was used as cladding
material in the first LWRs. However, high neutron flux in the core of reactor can strongly damage
austenitic stainless steel mechanical properties with the void swelling, radiation-induced segregation,
helium embrittlement and irradiation creeping.[139] Moreover, the chemical interactions between fission
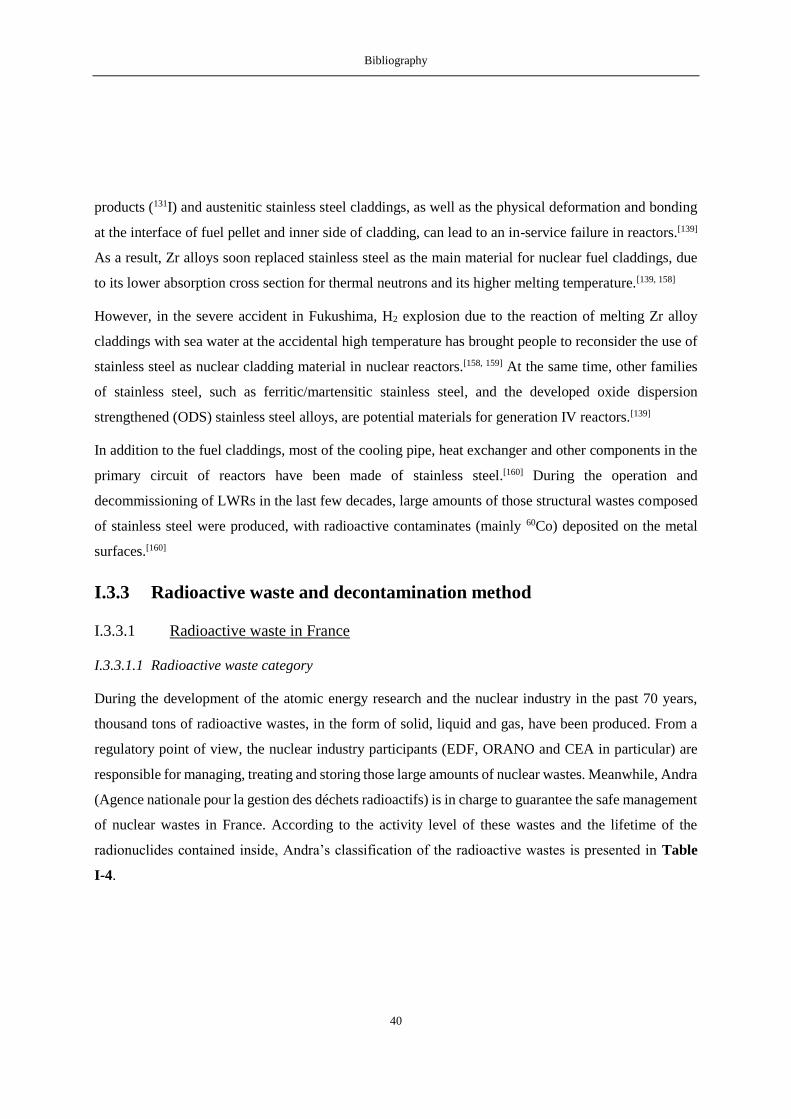
Bibliography
40
products (131I) and austenitic stainless steel claddings, as well as the physical deformation and bonding
at the interface of fuel pellet and inner side of cladding, can lead to an in-service failure in reactors.[139]
As a result, Zr alloys soon replaced stainless steel as the main material for nuclear fuel claddings, due
to its lower absorption cross section for thermal neutrons and its higher melting temperature.[139, 158]
However, in the severe accident in Fukushima, H2 explosion due to the reaction of melting Zr alloy
claddings with sea water at the accidental high temperature has brought people to reconsider the use of
stainless steel as nuclear cladding material in nuclear reactors.[158, 159] At the same time, other families
of stainless steel, such as ferritic/martensitic stainless steel, and the developed oxide dispersion
strengthened (ODS) stainless steel alloys, are potential materials for generation IV reactors.[139]
In addition to the fuel claddings, most of the cooling pipe, heat exchanger and other components in the
primary circuit of reactors have been made of stainless steel.[160] During the operation and
decommissioning of LWRs in the last few decades, large amounts of those structural wastes composed
of stainless steel were produced, with radioactive contaminates (mainly 60Co) deposited on the metal
surfaces.[160]
I.3.3 Radioactive waste and decontamination method
I.3.3.1 Radioactive waste in France
I.3.3.1.1 Radioactive waste category
During the development of the atomic energy research and the nuclear industry in the past 70 years,
thousand tons of radioactive wastes, in the form of solid, liquid and gas, have been produced. From a
regulatory point of view, the nuclear industry participants (EDF, ORANO and CEA in particular) are
responsible for managing, treating and storing those large amounts of nuclear wastes. Meanwhile, Andra
(Agence nationale pour la gestion des déchets radioactifs) is in charge to guarantee the safe management
of nuclear wastes in France. According to the activity level of these wastes and the lifetime of the
radionuclides contained inside, Andra’s classification of the radioactive wastes is presented in Table
I-4.

Bibliography
41
Table I-4 French radioactive waste classification.[132]
Radioactive period
Very short lived
(< 100 days)
Short lived
(≤ 31 years)
Long lived
(> 31 years)
Act
ivit
y l
evel
Very low level
(VLL)
< 100 Bq.g-1
Natural radioactive
decay on
production site
Surface storage (CIRES)
VLLW
Low level (LL)
0.1 – 100 kBq.g-1 Surface disposal
(CSA)
LILW-SL
Subsurface
disposal (research
ongoing)
LLW-LL
Intermediate level
(IL)
0.1 – 100 MBq.g-1
ILW-LL
High level (HL)
≥ 100 MBq.g-1
Reversible deep geological disposal
(research ongoing)
HLW
Concerning this current study, the metal structural elements that stayed in nuclear reactors, particularly
Mg-Zr alloy claddings, belong to the ILW-LL presented in Table I-4. Such type of wastes represents
3% of the total volume of radioactive wastes and 4 % of their whole activity in France. Depending on
their nature, ILW-LL can be conditioned by cementing, asphalting or vitrification, before being
packaged in stainless steel containers, and stored at their production site waiting for transportation to
deep storage on site Cigéo in Bure (Meuse).
I.3.3.1.2 UNGG structural wastes statement and conditioning
Nowadays in France, the main structural wastes coming from UNGG used fuels, including the graphite
shells (VLLW type) and the Mg alloy claddings (ILW-LL type), have been treated and stored in La
Hague and Marcoule, waiting for their packaging and subsequent deep deposit. In La Hague, 1,905 m3
of such structural wastes resulting from UNGG reactors are stored at Silo 115 and 130, with a total
activity of 2.50 1017 Becquerels. In Marcoule, 1,616 tons of Mg structural wastes, including Mg-Zr (0.5 %
mass) claddings and Mg-Mn (1.2-1.5 % mass) plug ends, are stored in 17 water filled silos. 1,119 tons
of them are ILW-LL wastes (β/γ decay ≈ 70 MBq.g-1 and α decay ≈ 0.7 MBq.g-1). They are in the form
of bulk, or sheared into small pieces without fuel (Figure I-22).[1]

Bibliography
42
Figure I-22 Mg structural waste stored in wet silos at Marcoule: a) Entire Mg alloy claddings; b) sheared
fragments.[1]
The treatment and conditioning strategy for those Mg based structural wastes are currently under study.
One of the potential solutions is to encapsulate those wastes into a mineral hydraulic binder, normally
Portland cement or geopolymer (aluminosilicate material). The sheared fragments are first compacted
to form a pancake and placed in a stainless steel container with a volume of 223 liters. Then Portland
cement or geopolymer is grouted into the container (see Figure I-23) before the latter is encapsulated
and sent to Cigéo. Each package is planned to contain 150 kg of compacted Mg claddings, and about
7,500 of such packages are needed for all of the Mg structural waste in Marcoule.[1, 2]
Figure I-23 Inactive simulated Mg claddings in 223 L stainless steel container: a) before grouting; b)
geopolymer material grouting; c) profile view after cutting the grouted package.[1]
For such an ILW-LL package holding compacted cladding wastes from spent fuel reprocessing, the
activity evolution follows a general decreasing pattern presented in Figure I-24. The average thermal
output of an ILW-LL waste package is initially about 20 W, but decreases by a factor of 10 every 100
years.[161]

Bibliography
43
Figure I-24 Radioactivity evolution of an ILW-LL package.[161]
As mentioned before, the corrosion of Mg alloys will not stop in the cement or geopolymer material
during storage. Some laboratory experiments have proven a very low release of hydrogen: less than 2
liters per package per year within Na–geopolymer package.[162] Such slow corrosion effect will be
accumulated in the long storage duration and can still lead to potential leakages of radioactive wastes.[1]
For this reason, reducing the volume of Mg structural waste (or the number of ILW-LL packages)
appears necessary and significant for long-term storage. Several proposals were brought forward, such
as using nitric acid or carbonic acid to dissolve the Mg alloy structural components, then separating
dissolved Mg and radioelements by filtration, extraction or heating processes. The final produced solid
wastes, containing radioelements or Mg precipitations, would be immobilized by cementation or
vitrification. However, such dissolution methods consume large amounts of solution and energy, and
produce at the same time notable secondary radioactive liquid and gaseous wastes.[163, 164]
Another possible solution consists in an additional surface decontamination before packaging those Mg
structural wastes. By removing the radioactive contamination on the metal surfaces, their radiation level
becomes lower, so the later treatment process and storage strategy can be simplified. Some efficient
decontamination methods can also limit the secondary waste volumes.
I.3.3.2 Decontamination methods
I.3.3.2.1 Definition of decontamination
Decontamination is the process which allows to remove radioactive contaminates from surfaces of
components, structures or equipment in nuclear facilities, by chemical, physical and other methods. The
objectives of decontamination are: to reduce the radiation exposure (dose level), to reduce the activity
level to a lower category, to reduce the volume of radioactive waste for storage and to recycle or reuse
components and materials.[165]

Bibliography
44
Figure I-25 Contaminates classification: free contamination, loose contamination, fixed contamination in
cracks and in oxides.
In a nuclear reactor system, contaminates are the deposits of radioelements which can be neutron
activated particles, dissolved compounds in coolant, leaked fuel fragments or fission products from a
failure of fuel cladding. As presented in Figure I-25, different states of contaminates can exist: free
contamination, loose contamination and fixed contamination in cracks and in oxides.[166] Both free and
loose contaminates can be readily removed by simple cleaning techniques whereas fixed contamination
involves deposits that adhere tightly in oxidation layer or migrate deeply in cracks. Such contaminated
materials require more aggressive decontamination methods with removal of surface layers.[166] In order
to remove as much radiations as possible, especially those fixed contaminates that accumulated during
service and long-term storage, destructive decontamination is allowed to damage the base materials
during decommissioning and waste treatment.[167]
The efficiency of decontamination is usually evaluated by a decontamination factor (DF), defined as:[167]
𝐷𝐹 =𝑖𝑛𝑖𝑡𝑖𝑎𝑙 𝑎𝑐𝑡𝑖𝑣𝑖𝑡𝑦
𝑟𝑒𝑠𝑖𝑑𝑢𝑎𝑙 𝑎𝑐𝑡𝑖𝑣𝑖𝑡𝑦 (I-36)
I.3.3.2.2 Decontamination techniques
Various techniques are applied for different targets of decontamination in nuclear industry. Based on
the media type, decontamination techniques can be classified into: non-chemical methods, including
liquid flushing, ultrasonic cleaning, dry ice blasting, and laser cleaning; chemical methods, including
gels, foams, pastes and other chemical agents; and electrochemical or electropolishing methods.[167]
However, the secondary waste is a trouble with all decontamination techniques. An efficient
decontamination of solid wastes may also produce a large amount of radioactive liquid wastes. This
problem is more prominent for chemical decontamination processes. As a result, it is often preferred a
selection of chemical methods combined with electropolishing or ultrasound, rather than solely chemical
decontamination.[166]

Bibliography
45
I.3.3.2.3 Ultrasonic decontamination
In the world, ultrasonic cleaning is one of the first and most widely used techniques for decontamination
in nuclear industry.[166] It has the advantages of decontaminating a variety of objects with complex
configurations and different sizes.[166] Even in a mild environment without addition of aggressive
chemical agents, ultrasound can play an efficient role on the decontamination of radioactive surfaces
with a controlled destructive effect on the base material. Based on the different purposes, ultrasonic
decontamination effects should be different when applied in-service or in decommissioning. As
described before, in-service decontamination or cleaning should be non-destructive, while
decontamination for decommissioning is aimed to lower the radiation as much as possible.[166, 167]
Before- and in-service decontamination with ultrasound has been studied and applied in nuclear industry
globally. For example, tests of an ultrasonic fuel-cleaning technology (UFC) were done by EPRI (USA)
with reloaded Zr alloy fuel assemblies in 1999 in order to solve the problem of crud deposition on fuel
rods, which can distort heat distribution in the reactor core and accelerate corrosion and failure of the
rods.[167, 168] This advanced technique was developed to hold an entire fuel assembly in a cylinder canister,
with 16 high-energy ultrasonic transducers of 25 kHz placed along the wall as presented in Figure I-26.a.
After only 5 minute treatment in 40°C water flow, the majority of the crud was loosened and removed
efficiently by cavitation bubbles and the whole reloaded fuel assembly was well cleaned for the next
fuel cycle (see Figure I-26.b). Due to the excellent performance in a series of tests, UFC technology
has been licensed and widely applied in the United States.[168] Similar technologies for preliminary
cleaning and removal of defective fuel elements and deposits on the surface of fuel rod of fuel assemblies
of VVERs (Russian water-water energetic reactors) before service have also been developed in Russia
(see Figure I-27).[169] Recently, another ultrasonic cleaning system was designed and tested in India
for removal of loose contaminates present on the outer surface of nuclear fuel pins during fabrication.[170]
After 5 to 30 minutes sonication by 38 kHz ultrasound in water at room temperature, 45°C and 65°C,
an efficient decontamination of fuel pins was proven.

Bibliography
46
Figure I-26 a) Ultrasonic fuel-cleaning technology scheme and b) video inspection of fuel assembly from
USA Callaway plant before and after cleaning.[168]
Figure I-27 Ultrasonic cleaning equipment for VVER fuel assemblies in Russia.[169]
In the case of decommissioning and nuclear waste treatment, ultrasonic decontamination also represents
an important approach. From an historical point of view, ultrasonic cleaning was studied for the
decontamination of nuclear radioactive components by different groups in many countries.

Bibliography
47
Between 1950 and 1960 in Springfield UK, laboratory tests on ultrasonic decontamination with a wide
range of materials, such as stainless steel and Magnox cladding samples, were done at low frequencies
(20 and 36 kHz) in different solutions at 25 and 70°C. In comparison with non-ultrasound treatment, a
more effective decontamination factor was obtained for stainless steel after 2 minutes of sonication,
especially in 1% sulphuric acid (487 times more than non-ultrasound). It was also found that the
ultrasonic enhancement of decontamination was more important at room temperature than at 70°C, and
that an appropriate decontamination solution should be chosen for different contaminates and substrate
materials.[171]
In France, similar but more systematic studies about the ultrasonic decontamination of stainless steel,
mild steel and cotton fabric were reported by Cerre et al. in 1962.[172] They examined the
decontamination effects in different conditions, including ultrasonic frequency from 16.5 kHz to 3 MHz
and acoustic intensity from 0.35 to 6 W.cm-2. After 2 minutes sonication in 0.05 M sulfuric acid, an
optimal decontamination result appeared at 80 kHz, 4 W.cm-2 for stainless steel and at 22 kHz for mild
steel. In the case of cotton, however, no ultrasonic aid was observed. The same group also investigated
ultrasonic decontamination on contaminated copper and brass samples, and similar conclusions were
made as on stainless steel.[173]
In USA, decontamination of radioactive items from a nuclear facility was implemented in an ultrasonic
bath at 300 kHz in different solutions by Cortlett and Kolb in 1955. They observed an acceleration of
decontamination by factors of 2 or 3 in the presence of ultrasound. Another sonication test with a
contaminated heat-exchanger piping was done by Henry in 1957. He compared the decontamination
effect of low- (20 kHz) and high- (300 kHz to 1 MHz) frequency ultrasound, and found sonication at 20
kHz was more efficient in removal of contaminates.[171]
In the 1990s, Borioli et al. tested decontamination effectiveness of different mechanical, chemical and
electrical methods with radioactive metal scraps from three different nuclear reactors in Italy, including
one Magnox reactor, one boiling water reactor and one pressurized water reactor. Ultrasonic
decontamination was operated in a 40 kHz ultrasonic tank filled with water at room temperature for 60
minutes. A joint ultrasonic and chemical decontamination was also applied within a mixture of 3%
hydrofluoric and 15% formic acid. Comparing to a single mechanical or chemical approach, the joint
ultrasonic and chemical decontamination was much more efficient with about 85% contaminations
removal.[174] In order to increase the efficiency of the reaction and shorten the treatment time, such
synergy between the effect of ultrasound and the chemical effect is very common in decontamination
process.[166]
Recently, development of new cleaning units has attracted more research on decontamination of nuclear
wastes. For example experimental tests on the decontamination of small-size radioactive metal
components were implemented in South Korea. Researchers had optimized their device by introducing
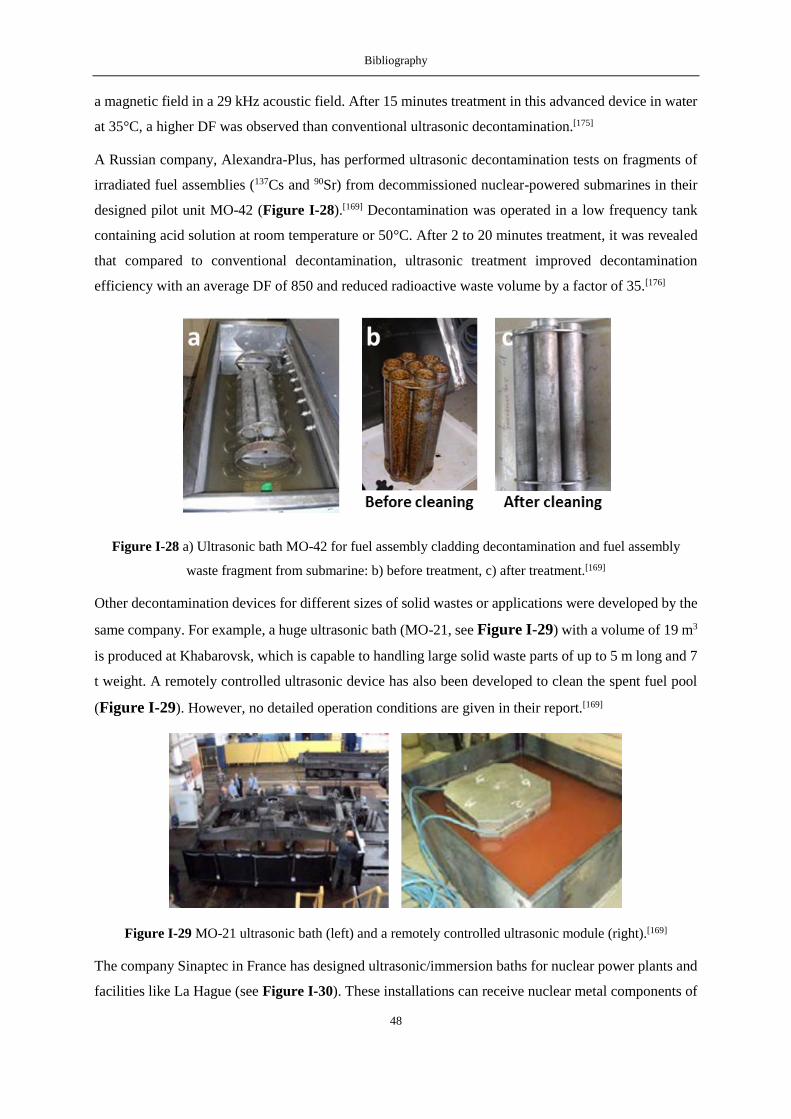
Bibliography
48
a magnetic field in a 29 kHz acoustic field. After 15 minutes treatment in this advanced device in water
at 35°C, a higher DF was observed than conventional ultrasonic decontamination.[175]
A Russian company, Alexandra-Plus, has performed ultrasonic decontamination tests on fragments of
irradiated fuel assemblies (137Cs and 90Sr) from decommissioned nuclear-powered submarines in their
designed pilot unit MO-42 (Figure I-28).[169] Decontamination was operated in a low frequency tank
containing acid solution at room temperature or 50°C. After 2 to 20 minutes treatment, it was revealed
that compared to conventional decontamination, ultrasonic treatment improved decontamination
efficiency with an average DF of 850 and reduced radioactive waste volume by a factor of 35.[176]
Figure I-28 a) Ultrasonic bath MO-42 for fuel assembly cladding decontamination and fuel assembly
waste fragment from submarine: b) before treatment, c) after treatment.[169]
Other decontamination devices for different sizes of solid wastes or applications were developed by the
same company. For example, a huge ultrasonic bath (MO-21, see Figure I-29) with a volume of 19 m3
is produced at Khabarovsk, which is capable to handling large solid waste parts of up to 5 m long and 7
t weight. A remotely controlled ultrasonic device has also been developed to clean the spent fuel pool
(Figure I-29). However, no detailed operation conditions are given in their report.[169]
Figure I-29 MO-21 ultrasonic bath (left) and a remotely controlled ultrasonic module (right).[169]
The company Sinaptec in France has designed ultrasonic/immersion baths for nuclear power plants and
facilities like La Hague (see Figure I-30). These installations can receive nuclear metal components of
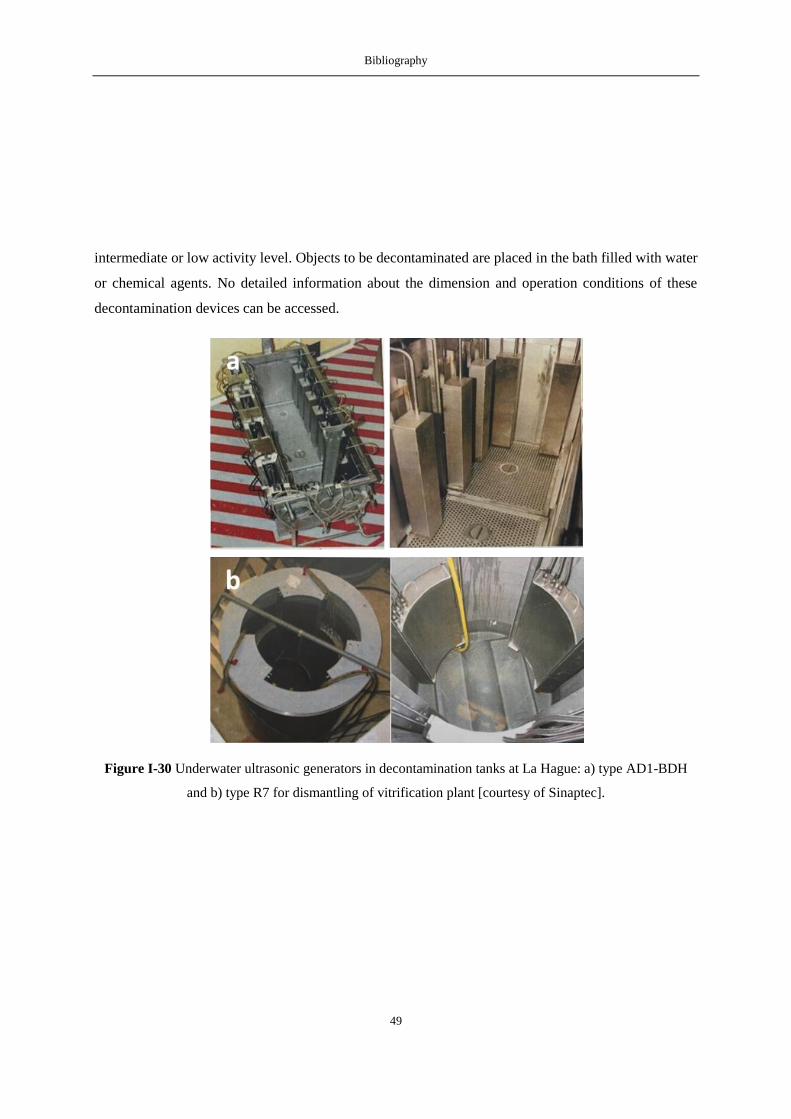
Bibliography
49
intermediate or low activity level. Objects to be decontaminated are placed in the bath filled with water
or chemical agents. No detailed information about the dimension and operation conditions of these
decontamination devices can be accessed.
Figure I-30 Underwater ultrasonic generators in decontamination tanks at La Hague: a) type AD1-BDH
and b) type R7 for dismantling of vitrification plant [courtesy of Sinaptec].

Bibliography
50
Materials and Methods
51
Chapter II. Materials and Methods

52

Materials and Methods
53
II.1 Materials
Magnesium (99.9% purity) and stainless steel (Fe 70.75, Cr 18.42, Ni 8.58, C 1.63, Si 0.45 and Mo 0.25
wt.%) discs with a diameter of 25 mm and a thickness of 0.5 mm were purchased from Goodfellow
(UK). Magnesium/zirconium alloys (99.5/0.5 wt.%, 99.95% purity) discs with a diameter of 25 mm and
a thickness of 1 mm were obtained from Neyco (France). Magnesium sheets (99.9% purity, 100 mm x
100 mm, 0.5 mm thickness) were supplied by Goodfellow. The compositions of all the received
materials were analyzed and in agreement with EDX measurement. The metallic discs were used as
received (without polishing or chemical pretreatment) whereas the Mg sheets were cut into small ribbons
(about 45 mm x 20 mm) before bending them in a cylindrical shape to simulate materials with a complex
geometry.
A genuine and non-irradiated UNGG cladding tube fragment (Figure II-1) was provided by DTCD
department from CEA Marcoule. This material has been stored during decades and a passive layer is
formed at the surface. The fragment was cut into small pieces from different sides (external fin and
internal graphite parts) in order to obtain samples with a flat and homogeneous rectangular shape for
treatment. The weight composition of UNGG cladding has been previously described in the literature:[162]
Mg 99.49, Zr 0.49 and Mn 0.016 wt.%, which was found to be in agreement with EDX measurements.
These claddings also display a graphite-based coating named “aquadag” on their internal side (black
part presented in Figure II-1.b).[2]
For all of those samples, their surface characteristics were analyzed by different characterization
techniques before and after treatment (as described later).
Figure II-1 UNGG cladding tube fragment used for sonication experiments. The Figure clearly shows the
complexity of the sample and the chemical composition differences (inside vs. outside).
All chemicals and reagents were of analytical grade and were purchased from Sigma-Aldrich (France
and Japan). Gases were provided by Air Liquide (99.9999% purity). The various solutions were prepared
with milli-Q water having a resistivity higher than 18.2 MΩ.cm at 25°C. The two most used aqueous
solutions applied in the experiments were composed of dilute oxalic acid and nitric acid, which have

Materials and Methods
54
been widely used in the decontamination of metal wastes during nuclear sites decommissioning, for
example in chemical processes or electrochemical decontaminations.[165, 167]
II.2 Preparation of contaminated metallic surfaces
Discs of magnesium, magnesium/zirconium alloy and stainless steel, or ribbons of magnesium were
contaminated with 0.1 M uranyl nitrate (UO2(NO3)2) aqueous solutions (natural U with 238U 99.27 (at.%),
235U 0.72 (at.%) and 234U 0.005 (at.%)).[177] Each disc was contaminated with fine droplets of
approximately 10 µL which were homogeneously distributed onto the surface (Mg-Zr disc as an
example in Figure II-2). The total volume of deposited solution reached 70 μL, corresponding to
approximately 1.67 mg U. For magnesium ribbons, 5 droplets of 10 μL (1.19 mg U) were linearly
distributed along the entire length of the samples with a uniform interval (Figure II-3.a). After
contamination, the discs or ribbons were put in a fume hood for more than 12 hours to let them dry and
were then calcined at 500°C for 2 hours under an argon gas flow in a tubular oven (Figure II-2, heating
from room temperature with a rate at 10°C·min-1). After calcination, all the contaminated samples were
characterized by α spectrometry, XRD and SEM. To simulate real samples, complex geometries were
simulated by bending Mg ribbons into cylindrical shapes as shown in Figure II-3.b.
Figure II-2 Mg-Zr disc contamination procedure.
Figure II-3 Mg ribbon contaminated with a 0.1 M UO2(NO3)2 aqueous solution a) after heating, b) bent in
the form of a cylinder to simulate a sample with a complex geometry.
II.3 Apparatus
Sonication treatments were implemented in a cylindrical homemade glass reactor (14.4 cm height and
6.2 cm inner diameter) connected to a cryostat (Huber Unistat Tango) allowing the circulation of a

Materials and Methods
55
cooling fluid (water/ethanol) inside its double jacket for the control of the solution temperature which
was maintained at 20°C. Several entries were designed on the cell to allow: (i) the measurement of the
in-situ experimental temperature with a thermocouple inserted in the solution; (ii) the bubbling of a
saturating gas which was controlled by a volumetric flowmeter (stainless steel float, 100 mL·min-1); (iii)
the collection of liquid sample aliquots during experiments; (iv) the on-line analysis of the emitted gases
during sonication (through a connected mass spectrometer).
For intermediate (100 kHz) and high (200, 345, 362 and 1057 kHz) frequency ultrasound, the cylindrical
reactor was mounted on top of a piezoelectric transducer.[178] The transducers are made of stainless steel
and were purchased from SinapTec (effective acoustic surface 88 cm2 for 100 kHz) or ELAC Nautik
(acoustic surface 25 cm2 for the other frequencies). They were connected to a generator having a
maximum electrical power of 120 W for 100 kHz (SinapTec Lab500) and 125 W (T & C Power
Conversion, Inc.) for the other frequencies. For low frequency (20 kHz) ultrasound, the bottom side of
the reactor was connected to a tight Teflon part which was held on a heavy and stable metallic base.
Ultrasound was provided on the top of the cell with a horn type transducer (Vibracell) having a 1 cm2
emitting surface made out of Ti6Al4V alloy (750 W Sonics).
Opposite to the ultrasound emission, tight Teflon stoppers were fitted with sample holders that allowed
the reproducible control of the distance between the sample holder and the ultrasound transducer plate
(6.5 cm) or horn tip (1.2 cm). The tightness of the set-ups was ensured by different O-rings and machined
Teflon stoppers. Metallic samples were fixed onto the Teflon sample holder with microscopy carbon
tabs. To avoid the accumulation of bubbles and their cushioning effect at the surface of the high
frequency sonicated samples, a mechanical agitation was provided on top of the reactor by rotating the
stick holding the sample. Controlled experiments were carried out in similar conditions without
ultrasound. Decontamination experiments were carried out with similar devices. Complex geometry
samples were sonicated in a stainless steel tea mesh filter which fits the inside of the reactor (Figure
II-5). The duration of each experiment was comprised between 10 and 90 min. In order to follow the
evolution of the sample surfaces topography, some experiments were suspended every 10 or 20 minutes
for sending the surface to SEM, drop shape analyzer and alpha spectrometer (decontamination). In-situ
analysis was also done with mass spectrometer and ICP-AES (Inductively Coupled Plasma Atomic
Emission Spectrometry) to obtain gas generation speeds and surface dissolution rates.
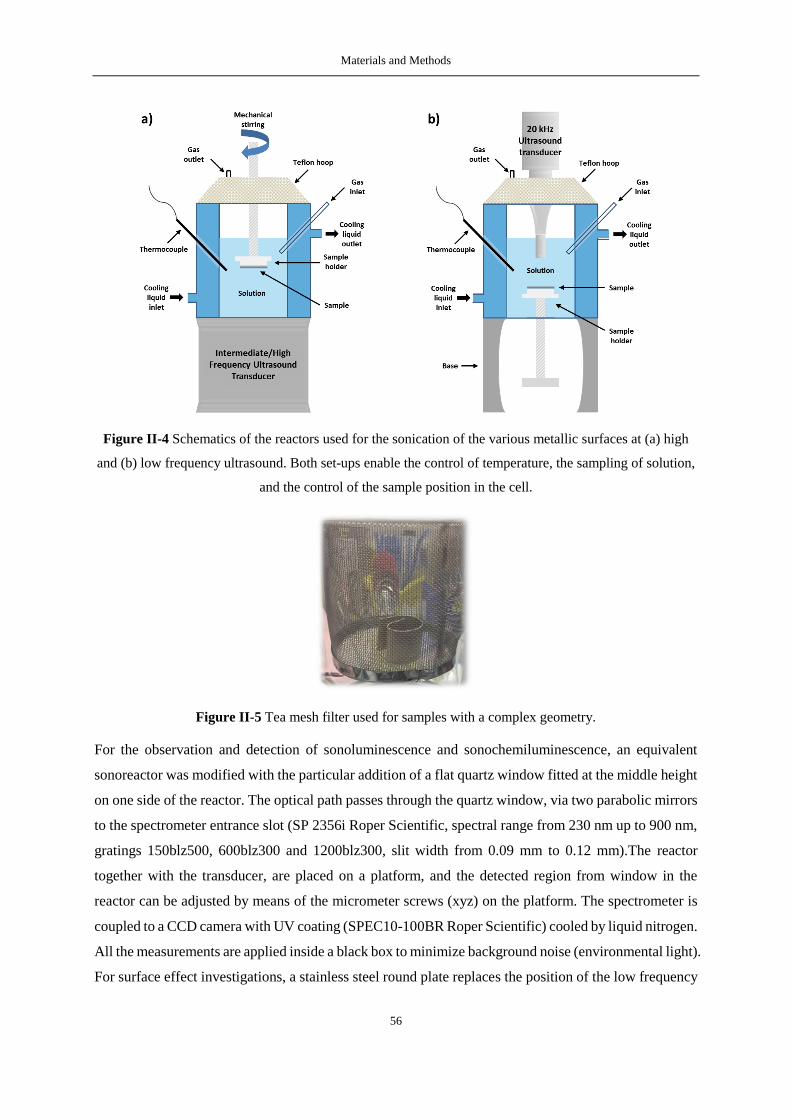
Materials and Methods
56
Figure II-4 Schematics of the reactors used for the sonication of the various metallic surfaces at (a) high
and (b) low frequency ultrasound. Both set-ups enable the control of temperature, the sampling of solution,
and the control of the sample position in the cell.
Figure II-5 Tea mesh filter used for samples with a complex geometry.
For the observation and detection of sonoluminescence and sonochemiluminescence, an equivalent
sonoreactor was modified with the particular addition of a flat quartz window fitted at the middle height
on one side of the reactor. The optical path passes through the quartz window, via two parabolic mirrors
to the spectrometer entrance slot (SP 2356i Roper Scientific, spectral range from 230 nm up to 900 nm,
gratings 150blz500, 600blz300 and 1200blz300, slit width from 0.09 mm to 0.12 mm).The reactor
together with the transducer, are placed on a platform, and the detected region from window in the
reactor can be adjusted by means of the micrometer screws (xyz) on the platform. The spectrometer is
coupled to a CCD camera with UV coating (SPEC10-100BR Roper Scientific) cooled by liquid nitrogen.
All the measurements are applied inside a black box to minimize background noise (environmental light).
For surface effect investigations, a stainless steel round plate replaces the position of the low frequency

Materials and Methods
57
ultrasonic probe (without stirring). A schematic of the whole experimental set-up is shown in Figure
II-6.
Figure II-6 Sonoluminescence and sonochemiluminescence apparatus schematic.
Spectra acquisition was done by using the spectrometer-specific Winspec software developed by the
manufacturer. It allows a spectroscopic measurement from UV to the near IR. To obtain a complete
sonoluminescence spectrum at certain conditions, at least 5 spectra were measured in stationary state
before being averaged. The signal corresponding to the background noise was also measured at the
beginning or at the end of the experiments. Then the noise was subtracted from the averaged spectrum
and the resulting spectrum was corrected for the sensitivities of the CCD camera and gratings.
To take the sonoluminescence and sonochemiluminescence photos, a digital camera (Canon, EOS 100D,
exposure 10-60 s, ISO 3200) was also placed in front of the quartz window. Obviously, the digital
camera was removed when measuring spectra.
II.4 Calibration and characterization of the sonoreactors
II.4.1 Calorimetric method
The calorimetric method allows to quantify the energy transmitted to the fluid subjected to ultrasound
in the form of heat, assuming an adiabatic system.[179] The temperature evolution of a sonicated volume
of water is measured by varying the ultrasound amplitude or frequency. For selected conditions, the
effective power absorbed by the media can be defined using the equation (II-1):

Materials and Methods
58
𝑃 = 𝑚 𝐶𝑝(𝑑𝑇 𝑑𝑡⁄ ) (II-1)
Where 𝑃 (W) is the effectively absorbed acoustic power; 𝑚 (kg) is the mass of liquid exposed to
ultrasound; 𝐶𝑝 (kJ·kg-1·K-1) is the heat capacity of the liquid under isobaric conditions (4.18 kJ·kg-1·K-1
for water); and 𝑑𝑇 𝑑𝑡⁄ is the slope reflecting the temperature increase of the medium over time (K·s-1).
The calorimetric experiments were carried out in the sonochemical reactors described in Figure II-6
with 250 mL of milli-Q water and an empty (air filled) jacket for better heat insulation. A slow
mechanical stirring (100 rpm) was added for intermediate and high frequency sonolysis systems to
obtain a homogeneous temperature distribution in the reactor. Each experiment was performed during 3
minutes and was repeated three times. The temperature increase was found to be linear in the chosen
experimental domain. An example of the calorimetric results observed under 100 kHz sonication is
presented in Figure II-7 and Table II-1 (other calorimetric results are reported in Appendix A).
Figure II-7 Example of the temperature variation of pure water (250 mL) sonicated at 100 kHz (Ar, 100
rpm stirring).

Materials and Methods
59
Table II-1 Calorimetric results obtained at 100 kHz (250 mL water, Ar, stirring at 100 rpm).
Electrical
power
Pe (W)
Slope
dT/dt (K·s-1)
Absorbed
acoustic power
Pac(W)
Acoustic power
density
Pac,V (W·L-1)
Acoustic power
intensity
Iac (W·cm-2)
24 0.006 6.7 26.75 0.08
48 0.018 18.3 73.15 0.21
72 0.037 39.0 155.91 0.44
96 0.041 43.2 172.63 0.49
II.4.2 Formation of H2O2 by water sonolysis
To characterize the sonochemical activity of the used sonoreactors (Figure II-4) at certain conditions
(ultrasound frequency, acoustic power, temperature, sparging gas, etc.), the formation rate of H2O2
resulting from pure water sonolysis was measured.[180] 250 mL of milli-Q water were sonicated during
180 minutes at selected conditions. During sonication, 0.5 mL of solution was sampled each 20 min,
and diluted with a previously prepared TiOSO4 solution (2·10-2 M, prepared in 0.5 M H2SO4).[181] The
as-formed peroxotitanium(IV) complex exhibiting an orange-yellow color was then analyzed by a UV-
Visible absorption spectrophotometer. The formation rate of H2O2 during sonication was deduced with
the absorption peak standing at about 411 nm (Figure II-8) and the Beer-Lambert law described in
equation (II-2).
𝐴 = 𝜀 𝑙 𝑐 (II-2)
Where 𝐴 (unitless) is the absorbance; 𝜀 (mol-1·L·cm-1) is the molar extinction coefficient; 𝑙 (cm) is the
pass length of the light in the liquid container and 𝑐 (mol·L-1) is the concentration of the measured
species (here is peroxotitanium(IV) complex).
The molar extinction coefficient 𝜀 of the peroxotitanium(IV) complex was previously determined for
the prepared TiOSO4 solution by mixing it with a commercial H2O2 standard solution. An external
calibration curve is shown in Appendix B.

Materials and Methods
60
Figure II-8 UV-vis absorption spectra of the peroxotitanium(IV) complex formed by mixing sonicated
pure water (100 kHz, Pac= 40 W, 20°C, Ar, 100 rpm stirring) with TiOSO4 solution.
II.5 Characterization method
Several analytical methods were used to characterize the effects of the acoustic cavitation phenomenon
nearby the various solid surfaces. The used techniques, methods and procedures are described below.
II.5.1 Solid characterization
II.5.1.1 Scanning electron microscopy
Scanning electron microscopy (SEM) allows the generation of three-dimensional images of high-
resolution of a sample by scanning its surface with a focused beam of electrons. Based on the interactions
between electrons and atoms in the sample, SEM provides its topography, morphology and composition
characteristics. A VEGA3 SEM from Tescan (France) and an environmental SEM (Quanta 200 ESEM)
were used to characterize the samples and study the evolution of their surface morphology (oxide layers,
deformations, secondary phases and precipitations, etc.), to realize 3D reconstructions, to analyze the
sample compositions and follow the decontamination progress. Two different modes were applied in
SEM depending on the studied samples:
— Secondary Electron (SE) mode: by inelastic scattering interactions between beam electrons (10
– 15 keV) and surface atoms, secondary electrons (< 50 eV) are ejected. Due to their low energy,
these electrons are emitted within a few nanometers from the sample surface inducing a good
image resolution and 3D appearance.
— Back-Scattered Electron (BSE) mode: by elastic scattering interactions between incidental
electrons and specimen atoms, back-scattered electrons are reflected backwards with the

Materials and Methods
61
information of sample elements and compositions. Areas of the surface that contain atoms with
a high atomic number will emit more electrons than atoms having a lower atomic number. A
greater brilliance of these areas will be observed on the images. Although topographic
information can be obtained using a BSE detector, its image resolution is lower than what
observed in an SE image.
Energy Dispersive X-ray spectroscopy (EDX) can also be coupled with SEM. This technique allows to
collect photons related to transitions of electrons from a higher to a lower level that have an energy
characteristic of the atom exposed to the beam electrons. The nature and relative abundance of the
chemical elements composing the samples can be defined. The concentration and distribution of
chemical elements can be determined in a region of interest at the surface of a sample.[182]
II.5.1.2 3D reconstruction with MeX software
3D reconstruction MeX software (Alicona, Austria) allows to convert SEM pictures into 3D surfaces
which give topographic information about the studied sample, including the profile, surface morphology,
roughness, etc. 3 or 5 images were taken at the same eucentric point with different tilt angles (0°, ±10°,
±15°, etc.) but with a similar working distance, magnification, brightness and contrast. 3D
reconstruction of the surface was then performed by the software from those accumulated and tilted
SEM images. Measurements can then be directly made on the reconstructed surfaces.
The surface roughness (𝑅) and mass loss (∆𝑀) can for instance be calculated with the reconstructed
surfaces by following the evolution of the topography at certain region of interest on the sample in
agreement with equations (II-3) and (II-5).
𝑅 =∑ |𝑧𝑖|𝑁𝑖=1
𝑁 (II-3)
Where 𝑅 (mm) is the surface roughness; 𝑁 is the total number of analyzed points and |𝑧𝑖| (mm) is the
absolute value of the height distance between the analyzed point i and the mean plane found by the
software.
∆𝑚𝑖,𝑖+1 = 𝜌𝑑𝜋𝐷2
4 (II-4)
∆𝑀 =∑ ∆𝑚𝑖,𝑖+1𝑖=1
(II-5)
Where ∆𝑚𝑖,𝑖+1 (g) is the estimated mass difference between two adjacent 3D reconstructions i and i+1;
𝜌 (g·mm-3) is the density of material; 𝑑 (mm) is the average height difference between two consecutive
measurements by superimposing their 3D measurements; 𝐷 (mm) is the diameter of the sample surface
and ∆𝑀 (g) is the total estimated mass loss.

Materials and Methods
62
II.5.1.3 X-ray diffraction
X-ray diffraction (XRD) provides detailed information on the crystallographic structure and nature of
the studied samples. This technique relies on X-ray diffraction when they encounter a crystal. The
diffraction takes place in a precise direction for each family of lattice planes according to Bragg law:
2𝑑 𝑠𝑖𝑛 𝜃 = 𝑛 ∙ 𝜆 (II-6)
Where 𝑑 (nm) is the distance between two reticular planes; 𝜃 (°) is the angle of incidence of X-rays; 𝑛
(unitless) is the order of reflection and 𝜆 (nm) is the wavelength of the X-ray beam (Figure II-9).
If the incident X-ray wavelength is similar with the spacing in a crystal, a significant diffraction appears
in the pattern. The nature of the crystallographic structure for the studied samples can be identified by
comparing the obtained diffraction patterns with references.[182]
Figure II-9 X-ray diffraction.[183]
All the samples were first analyzed as received, after contamination and after treatment. For surfaces
contaminated with uranium or carbon (graphite), direct measurement did not provide enough signals for
crystallographic structure qualification, since the substrates were not flat and the contamination was too
low. As a result, contaminants were scratched off the surfaces to form a powder suitable for XRD
analysis.
II.5.1.4 Alpha spectrometry
Alpha spectroscopy was used to detect radioactive contaminants based on the alpha particles (He2+)
emitted in the decay process. The activity (Becquerel/sample) of the contaminated samples was
characterized by alpha spectrometry (CANBERRA Model 7401) by acquiring and analyzing energy
spectra with Genie 2000 software. This technique allows to identify and quantify the nature of the
various radionuclides contaminating the surface of the studied samples with a low detection limit, and
therefore evaluate the efficiency of the decontamination procedures used in this work. It should be noted
that alpha radiation is composed of a heavy and positively charged He2+ nucleus that can be easily
stopped by few centimeters of air or skin. Preliminary studies found that when preparing the
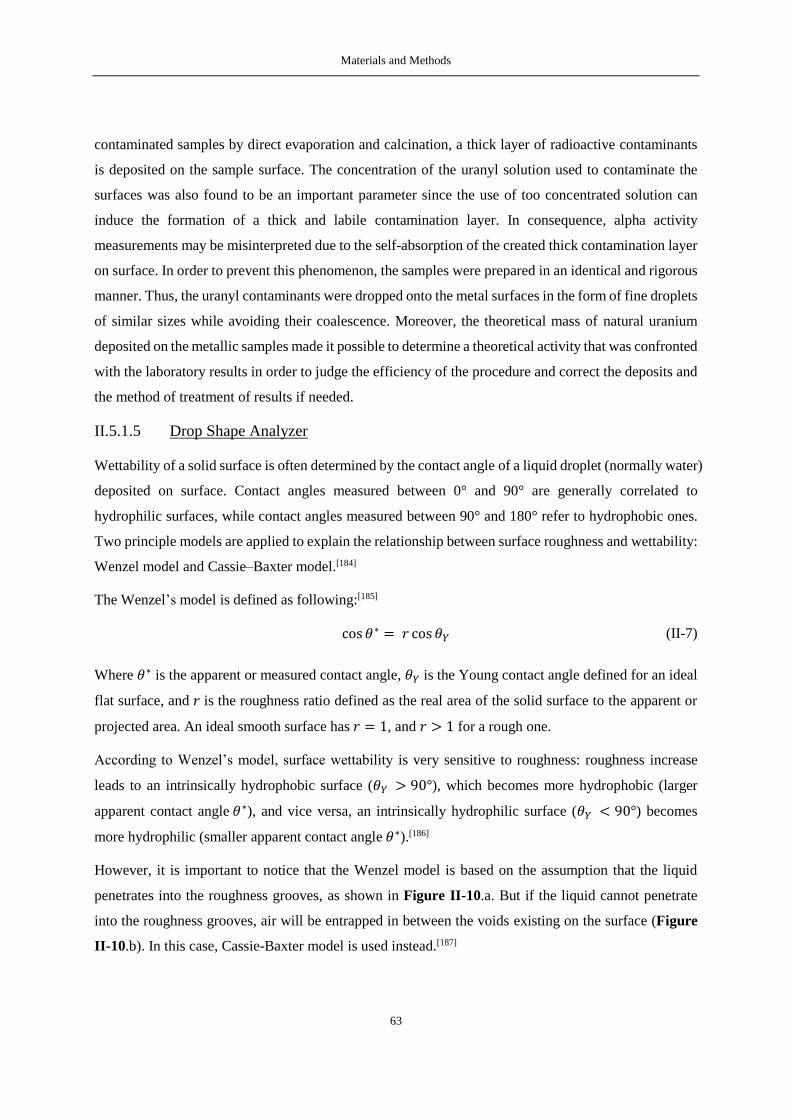
Materials and Methods
63
contaminated samples by direct evaporation and calcination, a thick layer of radioactive contaminants
is deposited on the sample surface. The concentration of the uranyl solution used to contaminate the
surfaces was also found to be an important parameter since the use of too concentrated solution can
induce the formation of a thick and labile contamination layer. In consequence, alpha activity
measurements may be misinterpreted due to the self-absorption of the created thick contamination layer
on surface. In order to prevent this phenomenon, the samples were prepared in an identical and rigorous
manner. Thus, the uranyl contaminants were dropped onto the metal surfaces in the form of fine droplets
of similar sizes while avoiding their coalescence. Moreover, the theoretical mass of natural uranium
deposited on the metallic samples made it possible to determine a theoretical activity that was confronted
with the laboratory results in order to judge the efficiency of the procedure and correct the deposits and
the method of treatment of results if needed.
II.5.1.5 Drop Shape Analyzer
Wettability of a solid surface is often determined by the contact angle of a liquid droplet (normally water)
deposited on surface. Contact angles measured between 0° and 90° are generally correlated to
hydrophilic surfaces, while contact angles measured between 90° and 180° refer to hydrophobic ones.
Two principle models are applied to explain the relationship between surface roughness and wettability:
Wenzel model and Cassie–Baxter model.[184]
The Wenzel’s model is defined as following:[185]
cos 𝜃∗ = 𝑟 cos 𝜃𝑌 (II-7)
Where 𝜃∗ is the apparent or measured contact angle, 𝜃𝑌 is the Young contact angle defined for an ideal
flat surface, and 𝑟 is the roughness ratio defined as the real area of the solid surface to the apparent or
projected area. An ideal smooth surface has 𝑟 = 1, and 𝑟 > 1 for a rough one.
According to Wenzel’s model, surface wettability is very sensitive to roughness: roughness increase
leads to an intrinsically hydrophobic surface (𝜃𝑌 > 90°), which becomes more hydrophobic (larger
apparent contact angle 𝜃∗), and vice versa, an intrinsically hydrophilic surface (𝜃𝑌 < 90°) becomes
more hydrophilic (smaller apparent contact angle 𝜃∗).[186]
However, it is important to notice that the Wenzel model is based on the assumption that the liquid
penetrates into the roughness grooves, as shown in Figure II-10.a. But if the liquid cannot penetrate
into the roughness grooves, air will be entrapped in between the voids existing on the surface (Figure
II-10.b). In this case, Cassie-Baxter model is used instead.[187]

Materials and Methods
64
Figure II-10 Surface wetting: a) Wenzel model; b) Cassie–Baxter model.[188]
Cassie equation is used to describe the chemically heterogeneous surface. For a two-chemical-
component system, it is defined as:
cos𝜃∗ = 𝑓1 cos𝜃𝑌1 + 𝑓2 cos𝜃𝑌2 (II-8)
Where 𝑓1 and 𝑓2 are the fraction area of the components 1 and 2 contacted with liquid (𝑓1 + 𝑓2 = 1),
and 𝜃𝑌1 and 𝜃𝑌2 are the Young contact angle of pure component ideal surface respectively. If the
secondary component is air, as described in Figure II-10.b, considering the air/liquid contact angle is
almost 180° (cos 𝜃𝑌2 = −1), the equation can be written as:
cos 𝜃∗ = 𝑓1(cos𝜃𝑌1 + 1) − 1 (II-9)
This equation is known as the Cassie-Baxter equation. With the fraction area of the substrate material
𝑓1 decreasing by surface roughness increasing and air trapping, apparent contact angle 𝜃∗ can be much
larger than the Young contact angle 𝜃𝑌1. As a result, it is possible to change an instinctive hydrophilic
surface into a superhydrophobic one by specially designing its surface roughness.[187]
Contact angle measurements were achieved with a Drop Shape Analyzer (DSA100S, KRÜSS). Several
(𝑛) sessile drops were formed at random position on the sample surface by dosing 5 μL of pure water
with an automated syringe situated on the top of the surface. An image of each drop was recorded by a
camera and transferred to the software which fits the contour of the drop shape with a geometrical model.
The contact angle (𝜃𝑖) is given by the angle created between the calculated droplet shape function (shape
line) and the sample surface (baseline). The given contact angle (𝜃) was calculated in agreement with
the equation (II-10) as an average value (𝑛 > 8) of all the sessile drops deposited on the surface. The
variability of the measured data was evaluated from the standard deviation of these droplets.
𝜃 =∑ 𝜃𝑖𝑛𝑖=1
𝑛 (II-10)
II.5.1.6 ATR-FTIR spectroscopy
Attenuated Total Reflection Fourier Transform InfraRed (ATR-FTIR) spectroscopy is a simple, fast and
non-destructive chemical analytical technique. The infrared radiation interacts with crystals or

Materials and Methods
65
molecules in samples through series of standing waves called evanescent waves. Some of the energy of
the evanescent waves is absorbed by the sample and reflected radiation is returned to the detector. The
effective path length for this interaction depends on several parameters and is typically a fraction of the
wavelength. This penetration depth is in the range of microns, which is ideal for sample surface
analysis.[182] In our study, ATR-FTIR spectroscopy was carried out with a PerkinElmer Spectrum 100.
Spectra (8 acquisitions per sample) were acquired between 4000 and 380 cm-1 by direct measurement
of the surface without any additional treatment. All the samples were first analyzed as received, after
contamination and after treatment.
II.5.1.7 Raman spectroscopy
Raman spectroscopy is a vibrational spectroscopy technique used to characterize the molecular
composition and external structure of a material. By radiation of the sample with a laser beam, a
molecule is excited to a (virtual) higher energy state and then returns to its original energy state with the
emission of a photon with a certain energy or wavelength. When the photon released has the same energy
or wavelength as the incident radiation, it is known as elastic or Rayleigh scattering. When a produced
photon exhibits less energy or more energy than the incident laser radiation, it is an inelastic scattering
called Stokes Raman scattering or anti-Stokes Raman scattering (Figure II-11). By rejecting the
dominant Rayleigh scattering with a filter, the rest of the released photons are collected and analyzed
by a CCD camera. The obtained Raman spectrum, as a chemical fingerprint, permits identifying
molecules and chemical bonding, because different chemical bonds and symmetries correspond to
different vibrational modes (energy or wavelength).[182]
Figure II-11 Energy level diagram of Raman scattering.[189]
The Raman apparatus used in this study was a LabRAM ARAMIS Jobin-Yvon, equipped with a laser
source (532 nm), and coupled with a motorized XYZ stage. An optical fiber probe is attached to the

Materials and Methods
66
spectrometer and allows to perform in vitro analyses. The instrument was calibrated before each set of
experiments using the 520.7 cm-1 peak of a silicon standard. All Raman spectra were collected between
100 and 3000 cm-1. All the samples were first analyzed as received, after contamination and after
treatment. For surfaces contaminated with uranium or carbon (graphite), contaminant particles, besides
some precipitations generated during treatment, were also deposited onto glass slides for Raman analysis.
II.5.2 Solution characterization
II.5.2.1 UV-Visible absorption spectrophotometry
UV-Visible absorption spectrophotometry consists in studying the interactions between matter and
electromagnetic radiations. Different molecules absorb radiations of different wavelengths. An
absorption spectrum will show a number of absorption bands corresponding to structural groups within
the molecule. According to Beer-Lambert law (II-2), a quantitative determination of different analytes
can be obtained. A Thermo Scientific Evolution 220 spectrophotometer was used to determine H2O2
formation rates during the sonolysis of water based on different sonochemical parameters as described
earlier. The samples were analyzed in 1 cm quartz cuvettes.
II.5.2.2 ICP-AES
Inductively Coupled Plasma Atomic Emission Spectrometry (ICP-AES) is a chemical analysis
technique based on the principle of atomic emission spectrometry. It allows precise identification and
quantitative analysis of the chemical elements present in solution, with a low detection limit. During the
sonication procedures, samples of approximately 1.5 mL were taken every 10 or 15 minutes. These
samples were then filtered (PTFE filters, 0.2 µM) and dilute by 10 or 20 with HNO3 at 2% by mass (0.3
M) in order to remain within the calibration range prepared beforehand (ranging from 0.5 to 15 mg·L-1,
standards provided by SCP SCIENCE). In the context of this study, ICP-AES was used to study the
release in solution of the elements Mg, Zr, and U and to determine dissolution rates (mg·L-1·min-1) of
magnesium in particular.
II.5.3 Gas characterization
II.5.3.1 Mass spectrometry
Mass spectrometry (MS, Thermo Scientific, Prima BT Mass Spectrometer) was used for the analysis of
gases and vapors generated during sonication. The gas sample is introduced via a stream selector and a
pressure reduction system, comprised of a capillary and molecular leak that transmits a small portion of
the gas into the ion source which operates under high vacuum. Using an electron emitting filament, the
ionization chamber converts the sample molecules into ions which are positively charged molecules or
parts of molecules. These ions are then separated according to their mass by a variable magnetic field.

Materials and Methods
67
The different mass ions are then quantified by the detector in accordance with the intensity of the signals
at these masses.
In our study, an in-situ measurement by MS was implemented during sonication. A constant gas flow
was ensured 30 minutes before and during the MS analysis. Molecular sieves (Aldrich, 3 Å) were placed
between the sonoreactor gas outlet and the mass spectrometer gas inlet to trap water vapor. A multiple-
ion monitoring mode was employed to follow the evolution of various gases (Ar, O2, H2, N2, CO2, H2O,
etc.) during sonication. A special attention has been given to hydrogen gas (H2) because of its known
release during the sonolysis of aqueous solutions and the reactivity of magnesium surfaces. Emitted H2
gas was compared to an external calibration curve previously prepared with standards (Appendix C).
After sonolysis, the bubbling of gas and the acquisition of the mass spectrometer continued for an extra
30 minutes or more in order to observe a return to zero for the emitted gases.
II.5.4 Cavitation characterization
II.5.4.1 Sonoluminescence and sonochemiluminescence photography
Sonoluminescence (SL) and sonochemiluminescence (SCL) emitted from the sonoreactor during
sonolysis of aqueous solutions were observed by a digital camera (Canon EOS 100D) through the quartz
window (Figure II-6). In order to get the best quality for the photos (high signal-to-noise ratio), an
exposure of 10 to 60 seconds with an ISO 3200 were selected for the camera settings. All the photos
were treated by ImageJ software for the results of cavitation activity field, light intensity and color
(radical) distribution.
II.5.4.2 Sonoluminescence spectrometry
As shown in Figure II-12, the SL spectra were recorded in the range 230-900 nm using a spectrometer
(SP 2356i, Roper Scientific; a triple-grating turret: 150 grooves mm-1 blazed at 500 nm, 600 grooves
mm-1 and 1200 grooves mm-1 blazed at 300 nm) coupled to a liquid-nitrogen cooled CCD camera
(SPEC10-100BR with UV coating, Roper Scientific). Optical filters were used to avoid second order
light. Spectral calibration was performed using an Hg (Ar) pen-ray lamp (LSP035, LOT-Oriel). Spectra
acquisition was started after reaching the steady-state temperature. Each given spectrum is an average
of at least five 300 s spectra corrected by background noise and the quantum efficiencies of gratings and
CCD. (Spectral calibration and quantum efficiencies of gratings and CCD are presented in Appendix D)
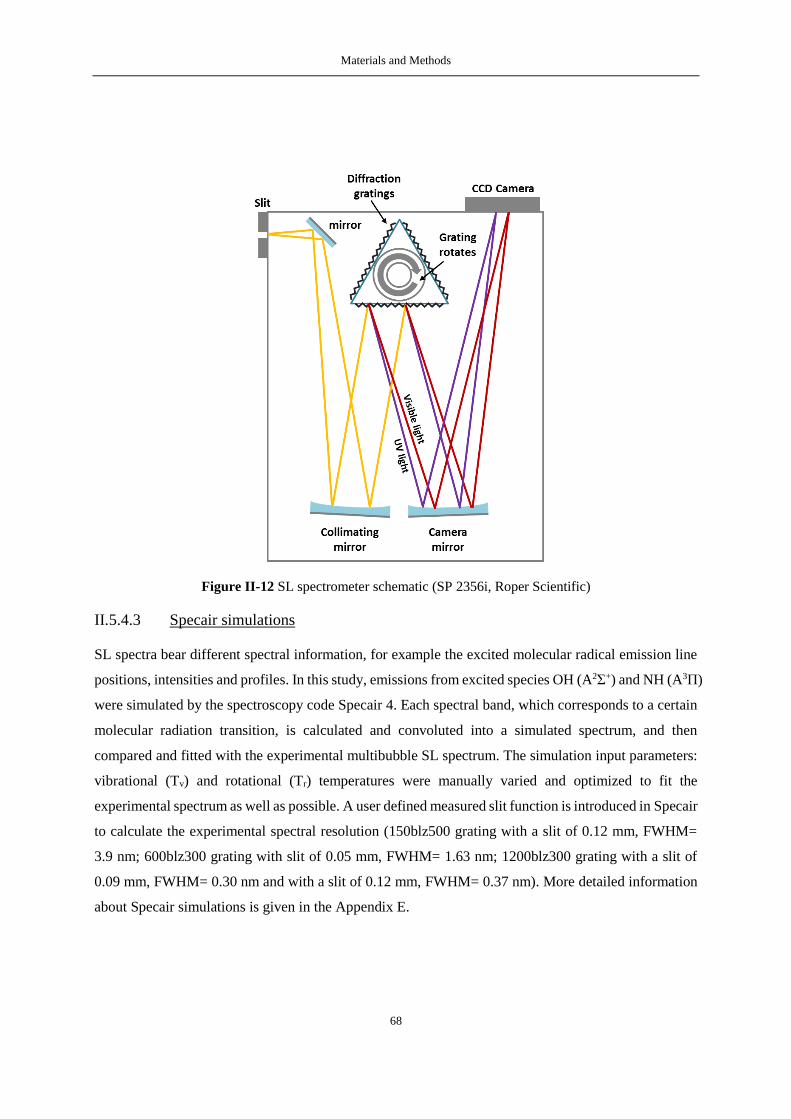
Materials and Methods
68
Figure II-12 SL spectrometer schematic (SP 2356i, Roper Scientific)
II.5.4.3 Specair simulations
SL spectra bear different spectral information, for example the excited molecular radical emission line
positions, intensities and profiles. In this study, emissions from excited species OH (A2Σ+) and NH (A3Π)
were simulated by the spectroscopy code Specair 4. Each spectral band, which corresponds to a certain
molecular radiation transition, is calculated and convoluted into a simulated spectrum, and then
compared and fitted with the experimental multibubble SL spectrum. The simulation input parameters:
vibrational (Tv) and rotational (Tr) temperatures were manually varied and optimized to fit the
experimental spectrum as well as possible. A user defined measured slit function is introduced in Specair
to calculate the experimental spectral resolution (150blz500 grating with a slit of 0.12 mm, FWHM=
3.9 nm; 600blz300 grating with slit of 0.05 mm, FWHM= 1.63 nm; 1200blz300 grating with a slit of
0.09 mm, FWHM= 0.30 nm and with a slit of 0.12 mm, FWHM= 0.37 nm). More detailed information
about Specair simulations is given in the Appendix E.

Acoustic cavitation behavior at 100 kHz and in the vicinity of a solid boundary
69
Chapter III. Acoustic cavitation
behavior at 100 kHz and in the
vicinity of a solid boundary

70

Acoustic cavitation behavior at 100 kHz and in the vicinity of a solid boundary
71
III.1 Introduction
Conventional ultrasonic cleaning is normally based on low frequency ultrasound due to its strong
mechanical effect. Increasing the ultrasonic frequency from 20 kHz to 1 MHz allows the lifetime and
the average size of acoustic bubbles decrease and the chemical characteristics of cavitation become more
important than its mechanical effects.[87, 190] Therefore, low and high frequencies appear almost as two
different domains of acoustic cavitation. It is of great interest to identify the characteristics of cavitation
at intermediate frequencies comprised between 80 and 150 kHz, which still remain poorly understood,
especially their SL spectral behaviors (the only report on SL spectroscopy at an intermediate frequency
of 90 kHz is that of Cairos et al.[85]).
Meantime, before the study of cavitation effect on metal surfaces and the latter ultrasonic
decontamination tests, it is necessary to identify cavitation behavior in the vicinity of a solid boundary
in the selected conditions.
This chapter first describes cavitation at 100 kHz in aqueous solution in comparison with low frequency
(20 kHz) and high frequency (362 kHz) by different approaches: sonochemical activity (H2O2 yields)
and spatial distribution of sonochemiluminescence (SCL photos); MBSL spatial distribution (SL photos)
and spectra (OH, NH, Na* and continuum). The effects of a solid boundary (stainless steel and Mg
surface) on SCL and SL are then discussed in the second part.
III.2 Sonochemistry and sonoluminescence in aqueous
solution at 100 kHz
Different approaches, including sonochemical activity (H2O2 yields), spatial distribution of
sonochemiluminescence (SCL photos), MBSL spatial distribution (SL photos) and spectra, were applied
to characterize the behaviors of cavitation bubbles generated by 100 kHz ultrasound and to compare
them with what observed at low- and high-frequency ultrasound. Experiments were carried out in 250
mL of distilled water or 0.01 M luminol solution (pH=11 adjusted with Na2CO3), saturated with Ar,
Ar/(20 vol.%)O2 or Ar/(20 vol.%)N2.
It is known that many parameters do affect the characterizations of sonochemistry and
sonoluminescence, including ultrasonic frequency, acoustic power and power intensity which condition
the number of bubbles and their behaviors. An ideal investigation on the effect of ultrasonic frequency
would be based on a constant number of active bubbles (SL or sonochemically active), which is
impossible due to the bubble number being unknown. We have chosen to work at approximately
constant absorbed acoustic power and constant solution volume (thus also approximately constant power
density) and to compare chemical yields (that are independent from the acoustic power in the considered

Acoustic cavitation behavior at 100 kHz and in the vicinity of a solid boundary
72
range). The absorbed acoustic power was determined by conventional thermal probe method: Pac= 33
W at 20 kHz, 40 W at 100 kHz and 43 W at 362 kHz. As a result of the distinct transducer acoustic
surfaces, the power intensity equals to 33 W cm−2, 0.45 W cm−2 and 1.6 W cm−2 respectively.
III.2.1 Sonochemical activity and SCL at different ultrasonic frequencies
The sonolysis of water leads to H2O2 formation, according to reactions (I-11) to (I-18). Figure III-1
presents H2O2 yields measured under Ar and Ar/(20 vol.%)O2 at different ultrasonic frequencies in pure
water. For both gases, the maximum value occurs at 362 kHz, in agreement with the literature.[74, 191-193]
Despite the much lower power intensity at 100 kHz, its corresponding H2O2 yields lie well in between
20 kHz and 200 kHz, which validates the choice of comparing ultrasonic frequencies at approximately
constant acoustic power.
Upon addition of oxygen in the argon flow, H2O2 yield is enhanced for all ultrasonic frequencies as
previously reported.[84] This is due to two new reaction pathways leading to H2O2 formation. First,
oxygen molecule can scavenge H• and form HO2• that recombine in H2O2 (reactions (I-15) and (I-17) in
bibliography). This scavenging of H• also leads to a lesser extent of H + OH recombination, resulting in
a higher remaining balance of HO• radicals. Second, the dissociation of O2 molecules can also lead to
an increase in HO• radicals production by the recombination of O atoms with water or H atoms (reactions
(I-19), (I-21) and (I-22)).
Figure III-1 H2O2 yields in pure water sonicated at 20 kHz (Pac= 33 W), 100 kHz (Pac= 40 W), 200 kHz
(Pac= 45 W), 362 kHz (Pac= 43 W) and 612 kHz (Pac= 61 W) under 100 mL.min-1 Ar (blue) and Ar/(20
vol.%)O2 (red) flow, at 18°C, 100 rpm mechanical stirring (except at 20 kHz); insert: ratio of H2O2 yields
for Ar/(20 vol.%)O2 and Ar.

Acoustic cavitation behavior at 100 kHz and in the vicinity of a solid boundary
73
The insert plot in Figure III-1 shows the ratio of H2O2 yields obtained for Ar/(20 vol.%)O2 and for Ar.
This ratio is much lower at 20 kHz compared to intermediate and high frequencies, while the latter are
approximately at the same level. This phenomenon is illustrated by SCL visualization in Figure III-2.
Figure III-2 Photographs of 0.01 M luminol solution (pH = 11, Na2CO3) submitted to 20 kHz (Pac= 33 W),
100 kHz (Pac= 40 W) and 362 kHz (Pac= 43 W) under 100 mL.min-1 Ar and Ar/(20 vol.%)O2 flow at 18°C;
exposure 10 s.
Light emission from a sonicated luminol solution arises from luminol oxidation by OH• radicals and is
thus closely correlated to H2O2 yields. In Figure III-2, the SCL pictures were taken in the same
conditions as H2O2 monitoring. For all frequencies, SCL photos are brighter in the presence of O2;
however the change in luminosity between Ar and Ar/(20 vol.%)O2 appears more important at 100 and
362 kHz than at 20 kHz.
This discrepancy in the effect of O2 addition can be easily explained considering the different pathways
leading to H2O2 formation. At all studied ultrasonic frequencies, H2O2 can be produced by water
sonolysis and H• scavenging with O2. On the contrary, the extent of reaction (I-19) strongly depends on
frequency. Indeed, a previous work [84] showed that 20 kHz ultrasound cannot provide enough energy to
break the bond of O2 molecule (5.15 eV) due to the less extreme conditions reached at bubble collapse,
contrary to high frequency. The comparison of H2O2 yields under Ar and Ar/(20 vol.%)O2 brings to light
the similarity of 100 kHz with the high frequency, inasmuch as the possibility of O2 dissociation is
considered. This indicates more extreme conditions in bubbles at 100 kHz than at 20 kHz, similar to
high frequency ones.
In Figure III-2 the various SCL distributions are due to the different cavitation fields and also to the
different types of apparatus. In comparison to the localized character of the low frequency cavitation
field when a horn is used, at intermediate and high frequencies it is expended in the entire reactor as
presented in Figure III-3. The nature of the saturating gas (Ar or Ar/(20 vol.%)O2) has no effect on
SCL distributions. In addition, the spacing between the bright layers at 100 and 362 kHz (~6 mm and

Acoustic cavitation behavior at 100 kHz and in the vicinity of a solid boundary
74
~1.5 mm respectively) corresponds to the half ultrasonic wavelength at each frequency (~7 mm and ~2.1
mm respectively). Previous studies [194, 195] reported similar observations at low frequency and high
frequency ultrasound systems. Taking into account the saturation of pixels and the complex reactor
geometry, SCL intensity of photos cannot be directly used for comparison between different frequencies.
The same conclusion is also true for SL intensity, and is described later. To better understand the
evolution of the sonochemical plasma with frequency and to characterize it, SL spectroscopy was
implemented in our study.
Figure III-3 Photographs of 0.01 M luminol solution (pH= 11, Na2CO3) submitted to a) 100 kHz (Pac= 40
W) from glass wall side and b) 362 kHz (Pac= 43 W) from optical window side, under 100 mL.min-1 Ar/(20
vol.%)O2 flow, at 18°C; exposure 10 s.
III.2.2 Sonoluminescence photos and spectra at different ultrasonic
frequencies
Figure III-4 presents SL photos of water sonicated at different frequencies under Ar and Ar/(20
vol.%)O2 atmospheres. As already published [84], at 20 kHz, SL is dimmer under Ar/(20 vol.%)O2 than
under Ar, contrary to 362 kHz and 100 kHz which both exhibit a similar trend.
Figure III-4 Photographs of water SL at 20 kHz (Pac= 33 W), 100 kHz (Pac= 40 W) and 362 kHz (Pac= 43
W) under 100 mL.min-1 Ar and Ar/(20 vol.%)O2 flow, at 18°C; exposure 60 s.
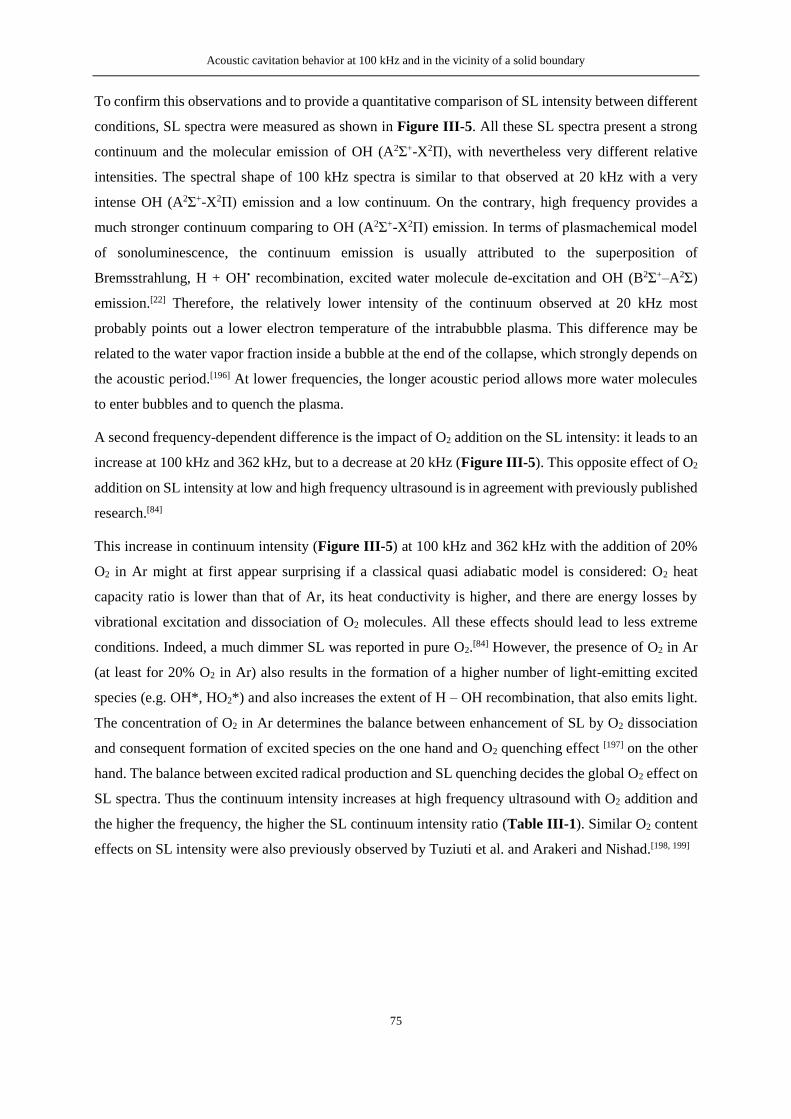
Acoustic cavitation behavior at 100 kHz and in the vicinity of a solid boundary
75
To confirm this observations and to provide a quantitative comparison of SL intensity between different
conditions, SL spectra were measured as shown in Figure III-5. All these SL spectra present a strong
continuum and the molecular emission of OH (A2Σ+-X2Π), with nevertheless very different relative
intensities. The spectral shape of 100 kHz spectra is similar to that observed at 20 kHz with a very
intense OH (A2Σ+-X2Π) emission and a low continuum. On the contrary, high frequency provides a
much stronger continuum comparing to OH (A2Σ+-X2Π) emission. In terms of plasmachemical model
of sonoluminescence, the continuum emission is usually attributed to the superposition of
Bremsstrahlung, H + OH• recombination, excited water molecule de-excitation and OH (B2Σ+–A2Σ)
emission.[22] Therefore, the relatively lower intensity of the continuum observed at 20 kHz most
probably points out a lower electron temperature of the intrabubble plasma. This difference may be
related to the water vapor fraction inside a bubble at the end of the collapse, which strongly depends on
the acoustic period.[196] At lower frequencies, the longer acoustic period allows more water molecules
to enter bubbles and to quench the plasma.
A second frequency-dependent difference is the impact of O2 addition on the SL intensity: it leads to an
increase at 100 kHz and 362 kHz, but to a decrease at 20 kHz (Figure III-5). This opposite effect of O2
addition on SL intensity at low and high frequency ultrasound is in agreement with previously published
research.[84]
This increase in continuum intensity (Figure III-5) at 100 kHz and 362 kHz with the addition of 20%
O2 in Ar might at first appear surprising if a classical quasi adiabatic model is considered: O2 heat
capacity ratio is lower than that of Ar, its heat conductivity is higher, and there are energy losses by
vibrational excitation and dissociation of O2 molecules. All these effects should lead to less extreme
conditions. Indeed, a much dimmer SL was reported in pure O2.[84] However, the presence of O2 in Ar
(at least for 20% O2 in Ar) also results in the formation of a higher number of light-emitting excited
species (e.g. OH*, HO2*) and also increases the extent of H – OH recombination, that also emits light.
The concentration of O2 in Ar determines the balance between enhancement of SL by O2 dissociation
and consequent formation of excited species on the one hand and O2 quenching effect [197] on the other
hand. The balance between excited radical production and SL quenching decides the global O2 effect on
SL spectra. Thus the continuum intensity increases at high frequency ultrasound with O2 addition and
the higher the frequency, the higher the SL continuum intensity ratio (Table III-1). Similar O2 content
effects on SL intensity were also previously observed by Tuziuti et al. and Arakeri and Nishad.[198, 199]

Acoustic cavitation behavior at 100 kHz and in the vicinity of a solid boundary
76
Figure III-5 SL spectra of pure water sonicated at 20 kHz (Pac= 33 W), 100 kHz (Pac= 40 W) and 362 kHz
(Pac= 43 W) under 100 mL.min-1 Ar and Ar/(20 vol.%)O2 flow, at 18°C. The apparent broad peak around
400-475 nm at 362 kHz is an artefact due to 2nd order light emission of the strong SL UV part.
Table III-1 Ratios (between Ar-20%O2 and Ar) of OH peak height taken at 309 nm and of SL continuum
at 500 nm at different ultrasonic frequencies: 20 kHz (Pac= 33 W), 100 kHz (Pac= 40 W) and 362 kHz (Pac=
43 W), 18°C.
Frequency (kHz) OH peak ratio Continuum ratio
20 0.24 ± 0.03 0.25 ± 0.04
100 3.5 ± 0.5 3.1 ± 0.5
362 3.4 ± 0.5 4.3 ± 0.6

Acoustic cavitation behavior at 100 kHz and in the vicinity of a solid boundary
77
To explain the different behaviors between SL and sonochemistry (H2O2 yield and SCL), it should be
noted that not all sonochemically active bubbles do emit light.[84] SL emission occurs only if the plasma
energy is high enough to form electronically excited species (radicals, molecules, ions, etc.). Obviously,
the energy threshold for excited species production during the bubble collapse is much higher than that
for radical formation.[56, 200] Considering for instance OH• radicals, the presence of O2 enhances their
production and the subsequent formation of H2O2 whatever the frequency, as observed in Figure III-1
and Figure III-2, but not all of those produced radicals are excited. The proportion of these depends on
the applied acoustic frequency. The more violent the collapse, the more molecules and formed radicals
can be excited, the higher SL intensity can be detected.
The intra-bubble conditions at different ultrasonic frequencies were studied by simulating spectra
(Figure III-6) with the spectroscopic software Specair [201] to estimate vibrational (Tv) and rotational (Tr)
temperatures of OH (A2Σ+). It is usually considered that the vibrational temperature is a lower estimate
of the plasma electron temperature and the rotational temperature is a higher estimate of the translational
temperature, i.e. of the gas temperature. Table III-2 summarizes all estimated temperatures.
Figure III-6 Normalization of higher resolution SL spectra (after subtraction of a linear baseline) and their
simulation (Specair) curves for water at 20 kHz (Pac= 33 W), 100 kHz (Pac= 40 W) and 362 kHz (Pac= 43
W) under 100 mL.min-1 Ar (blue) and Ar/(20 vol.%)O2 (red) flow, 18°C.

Acoustic cavitation behavior at 100 kHz and in the vicinity of a solid boundary
78
Table III-2 Estimated vibrational (Tv) and rotational (Tr) temperatures of OH (A2Σ+) in water sonolysis by
20 kHz (Pac= 33 W), 100 kHz (Pac= 40 W) and 362 kHz (Pac= 43 W) under 100 mL.min-1 Ar and Ar/(20
vol.%)O2 at 18°C.
Rovibronic
Temperature
20 kHz 100 kHz 362 kHz
Ar Ar/O2 Ar Ar/O2 Ar Ar/O2
Tv (K) 5750 ± 250 6000 ± 500 6500 ± 500 7250 ± 250 8000 ±
1000
(7500 ±
500)*
Tr (K) 5250 ± 250 5000 ± 200 4750 ± 250 5200 ± 200 5250 ± 250 (3900 ±
100)*
* UV part of SL emission is partly absorbed by H2O2, especially at high frequency ultrasound, which
leads to an underestimation of Tv and Tr
The values in Table III-2 point out the absence of thermal equilibrium inside the collapsing bubble (Tv >
Tr) whatever the studied conditions, in agreement with previous SL studies in aqueous solution16, 29, 30.
According to the simulations, for both saturating gases, Tv increases with the ultrasonic frequency, while
Tr seems to be independent from it and to remain around 5000 K. It is however to be stressed that these
results may be somehow impacted by the fitting procedure [21] that suffers from the fact that existing
spectroscopic software does not take Stark effects into account.[21] Previous works comparing low and
high frequencies indicated (though they were much less accurate) more extreme intrabubble conditions
at higher frequency illustrated by higher vibrational temperatures.[20], [21], [202] The present simulations
highlight that OH (A2Σ+) rovibronic temperatures at 100 kHz lie well in between low and high frequency
ultrasound.
It may look surprising that both Tv and Tr determined at 362 kHz for water saturated with Ar/(20
vol.%)O2 are abnormally lower than for water saturated with Ar. As mentioned above, at high frequency
ultrasound, H2O2 production and accumulation is more important, especially in the presence of O2 in Ar.
Therefore, the determined lower Tv and Tr are to be explained by an artefact due to the absorption of the
cumulative H2O2 in solution (Appendix F).
Notwithstanding this artefact, it can be noted that Tv increases (though slightly) upon addition of O2 in
Ar. This difference can be explained by the existence of different OH formation pathways (reactions
(I-11), (I-21) and (I-22)), each leading to a given population distribution of vibrational and rotational
excited levels. It was not observed in previous works [84] due to their lower spectral resolution.
As noted above, O2 dissociation occurs at high frequency and 100 kHz, but hardly at 20 kHz. To further
study the energy available in 100 kHz cavitation bubbles and their ability to dissociate molecules, N2

Acoustic cavitation behavior at 100 kHz and in the vicinity of a solid boundary
79
was introduced in Ar gas. Indeed, a previous work [46] showed the much higher occurrence of N2
molecule dissociation under high frequency ultrasound compared to low frequency: the emission of NH
(A3Π-X3Σ-) bands was observed on SL spectra at high frequency (reactions (I-20), (I-23) and (I-24)),
but not at 20 kHz. Nitrogen molecule possesses a triple bond, i.e. it has much higher bond energy than
oxygen (9.79 eV against 5.15 eV for oxygen), and thus higher collapse energy is needed for its
dissociation.
Figure III-7 SL spectra of pure water submitted to 20 kHz (blue, Pac= 33 W), 100 kHz (red, Pac= 40 W)
and 362 kHz (green, Pac= 43 W) at 18°C under 100 mL.min-1 Ar/(20 vol.%)N2 flow.
Figure III-7 compares the SL spectra of pure water sonicated at 20, 100 and 362 kHz under Ar/(20
vol.%)N2 flow. NH (A3Π-X3Σ-) emission appears at both the intermediate and high frequencies,
indicating that electrons with an energy ≥ 9.79 eV are present in 100 kHz bubbles too. Unfortunately,
the NH peak at 100 kHz is too noisy to simulate with Specair, due to the low SL intensity at this
frequency.
According to the investigations above, properties of the intermediate ultrasonic frequency (100 kHz) is
specific, neither the same as high frequency nor completely similar to low frequency. The chemical
activity (H2O2 yield) of cavitation bubbles at 100 kHz presents a transitional behavior between low and
high frequencies. The active cavitation zone distributes in the whole sonicated volume irradiated by 100
kHz ultrasound, similarly to high frequency and much further than at 20 kHz. The spectral shape of 100
kHz spectra is similar to that at 20 kHz. On the other hand, the intermediate-frequency ultrasound
provides the dissociation of O2 and N2 molecules inside the bubble which is more typical for high
frequency ultrasound. This faculty can be explained by the more extreme conditions reached at collapse
of 100 kHz cavitation bubbles, compared to 20 kHz. And it is confirmed that at 100 kHz the estimated

Acoustic cavitation behavior at 100 kHz and in the vicinity of a solid boundary
80
rovibronic temperatures of OH (A2Σ+) excited radicals derived from spectroscopic simulations are
higher than that at low frequency.
III.3 Sonochemistry and sonoluminescence in the vicinity
of a solid boundary
In order to study the effect of a solid boundary on acoustic cavitation, in particular on
sonochemiluminescence and sonoluminescence, a stainless steel plate was placed inside the reactor
facing the planar transducers of 362 or 100 kHz. As described above, intermediate and high ultrasonic
frequencies enable a homogeneous sonochemistry distribution also strong emissions of SL and SCL
observed at 362 kHz in Figure III-2 and Figure III-4, facilitate the observation of a solid boundary
effect on ultrasonic cavitation. Luminol and NaCl solutions were used to characterize SCL and SL
distributions and intensities in the reactor in the presence of a solid boundary. In multibubble system,
considering the different types of bubble collapse, including symmetrical collapses and asymmetrical
collapses during bubble coalescence, in bubble clusters and in the vicinity of a solid boundary, MBSL
spectra can exhibit different shape and intensity.[67] As described in bibliography,[66] Na* emission can
be observed during the sonication of NaCl aqueous solutions. This Na* emission is attributed to the
asymmetrical bubble collapse, where droplet injection may happen. On the contrary, continuum and
OH• emissions are mainly resulting from the symmetrical bubble collapse.[64, 203] During sonolysis of a
NaCl solution, SL intensity of excited sodium ions and continuum as presented in Figure III-8 and the
ratio between them can provide a qualitative analysis of cavitation bubble population in solution with
the effect of a solid boundary.
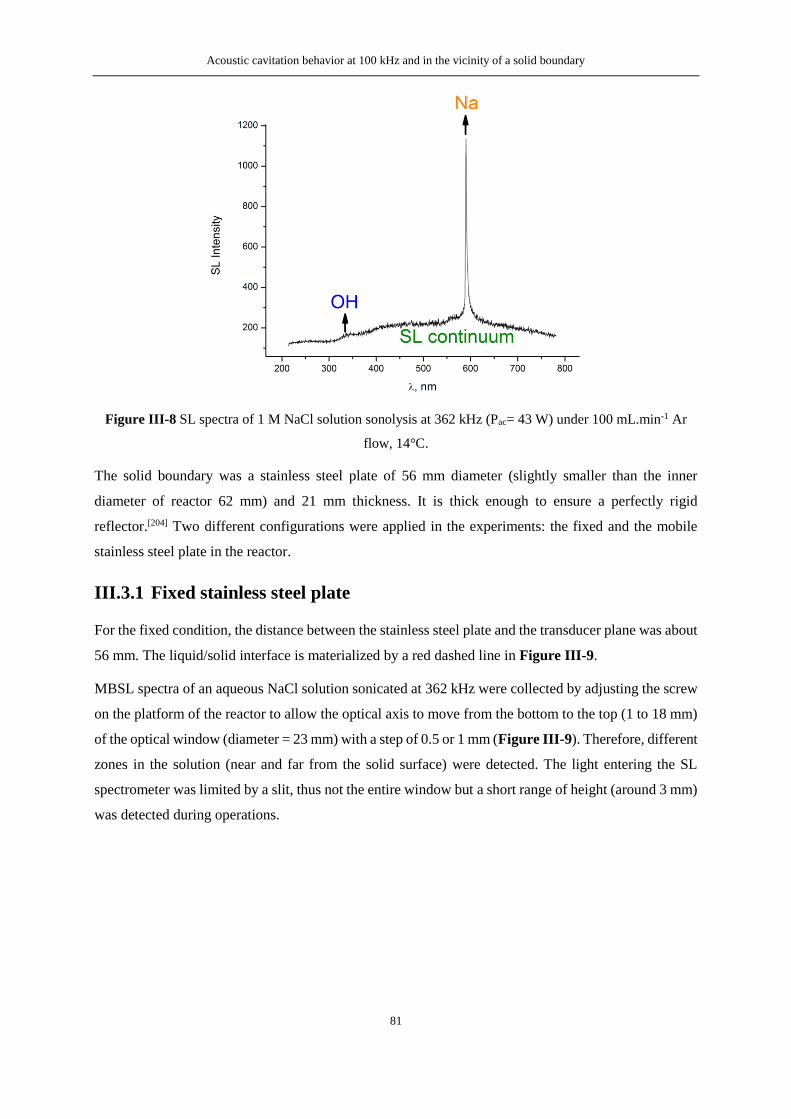
Acoustic cavitation behavior at 100 kHz and in the vicinity of a solid boundary
81
Figure III-8 SL spectra of 1 M NaCl solution sonolysis at 362 kHz (Pac= 43 W) under 100 mL.min-1 Ar
flow, 14°C.
The solid boundary was a stainless steel plate of 56 mm diameter (slightly smaller than the inner
diameter of reactor 62 mm) and 21 mm thickness. It is thick enough to ensure a perfectly rigid
reflector.[204] Two different configurations were applied in the experiments: the fixed and the mobile
stainless steel plate in the reactor.
III.3.1 Fixed stainless steel plate
For the fixed condition, the distance between the stainless steel plate and the transducer plane was about
56 mm. The liquid/solid interface is materialized by a red dashed line in Figure III-9.
MBSL spectra of an aqueous NaCl solution sonicated at 362 kHz were collected by adjusting the screw
on the platform of the reactor to allow the optical axis to move from the bottom to the top (1 to 18 mm)
of the optical window (diameter = 23 mm) with a step of 0.5 or 1 mm (Figure III-9). Therefore, different
zones in the solution (near and far from the solid surface) were detected. The light entering the SL
spectrometer was limited by a slit, thus not the entire window but a short range of height (around 3 mm)
was detected during operations.

Acoustic cavitation behavior at 100 kHz and in the vicinity of a solid boundary
82
Figure III-9 Fixed stainless steel plate in the reactor
Normalized SL intensity of Na* and continuum emissions as a function of the observation position (z)
are plotted in Figure III-10 and Figure III-11 respectively. For comparison, SL spectra were also
measured in the absence of the stainless steel surface (named as free surface in the following discussion).
In the case of free surface, both Na* and continuum emissions are weak at 18 mm. The weak emissions
can be attributed to the limitation of the observed range which may be out of the liquid/air interface or
the interference of a big gas bubble on the top of optical window (see in Figure III-9). No obvious Na*
intensity difference is found between 4 and 11 mm, while a higher value of continuum appeared at 11
mm. In comparison to free surface condition, at all the observation points (except for 14.5 mm), weaker
emissions of both Na* and continuum exhibit with stainless steel plate existence in solution. There are
three specific zones of SL intensity evolution when moving up the observation region towards the solid
boundary: i) cyclical fluctuations between 1 and 7 mm; ii) slight increase from 7 to 14.5 mm; iii) sharp
decrease from 14.5 to 16 mm. In the first zone, comparably far from the stainless steel plate, SL intensity
fluctuates with each cycle approximately corresponding to the half wavelength of 362 kHz ultrasound
(2.1 mm). When moving gradually towards the solid boundary, a slight increase of SL intensity
accompanied with fluctuations in the second zone indicates that the effect of the rigid surface became
stronger. Such reflection effect, or standing wave impact, will be discussed later. From 14.5 mm, with
continuous moving up of the view point, stainless steel plate starts to enter the observation range of SL
spectrometer (see Figure III-12). Besides the big gas bubble distortion, less and less light emissions of
Na* and continuum in solution are detected, which leads to the dramatic reduction of SL intensity in
Figure III-10 and Figure III-11.

Acoustic cavitation behavior at 100 kHz and in the vicinity of a solid boundary
83
Figure III-10 SL intensity of Na* (589 nm) as a function of the observation position in the presence of a
fixed stainless steel plate in 1 M NaCl solution sonicated at 362 kHz (Pac= 43 W) under 100 mL.min-1 Ar
flow, at 14°C.
Figure III-11 SL intensity of continuum (500 nm) as a function of the observation position in the presence
of a fixed stainless steel plate in 1 M NaCl solution sonicated at 362 kHz (Pac= 43 W) under 100 mL.min-1
Ar flow, at 14°C.

Acoustic cavitation behavior at 100 kHz and in the vicinity of a solid boundary
84
Figure III-12 Scheme of the observation positions made through the quartz window correlated to 3
different zones
Though both Na* and continuum emission intensities follow a similar trend when approaching the
stainless steel plate, the ratio of Na*/continuum intensities shows a different behavior (Figure III-13).
Without solid boundary in solution, this ratio is found to be independent from the observation position.
On the contrary, in the presence of the stainless steel plate, the ratio becomes rather high when measured
at the vicinity of the solid surface (15 to 16 mm). This higher ratio of Na*/continuum can be explained
by the relatively higher population of asymmetrical collapses in the vicinity of the stainless steel plate,
where droplet injection happen.[64, 203] However, this effect seems quite localized in a very short range
(≤1.5 mm) under stainless steel plate. From 0 to 14.5 mm, the Na*/continuum ratio remains at the same
level in agreement with what observed without the solid surface.
Figure III-13 SL intensity ratio between Na* (589 nm) and continuum (500 nm) emission as a function of
the observation position in the presence of a fixed stainless steel plate in 1 M NaCl solution sonolysis at
362 kHz (Pac= 43 W) under 100 mL.min-1 Ar flow, at 14°C.

Acoustic cavitation behavior at 100 kHz and in the vicinity of a solid boundary
85
As mentioned above, the cyclical fluctuations observed for SL intensity reveal that a standing wave is
formed in the solution by the reflection of stainless steel plate. In order to verify the existence of a
standing wave in the reactor, photos of SL and SCL in water and luminol solutions observed in the
absence of or in the presence of a stainless steel surface are compared in Figure III-14. Here, 100 kHz
ultrasound is used for this comparison because of its large wavelength (about 14 mm) and visible pattern
stripes. The bright and dark stripes shown in Figure III-14 confirm the presence of a standing wave in
the reactor, which is found to be more obvious in the presence of the stainless steel plate. The space
between bright stripes (~6 mm) is very close to the half wavelength of 100 kHz ultrasound (~7 mm). It
is believed that the brighter the zone, the more intense the cavitation activity. It is clear that in the
presence of a solid surface, both SL and SCL images are visually brighter. Simultaneously, SL and SCL
distributions become more homogeneous in the reactor with stainless steel plate. Similar uniform SL
and SCL distributions have been previously observed by Ashokkumar et al.[205] They detected that in a
propanol aqueous solution submitted to 440 kHz ultrasound, a more homogeneous distribution of
cavitation bubbles is generated by the reflection of a thin film placed on the liquid surface. In addition
to a solid boundary, Tuziuti et al. found that with the floating of some hydrophobic Teflon particles on
the free liquid surface of a luminol solution irradiated by 154 kHz ultrasound, the vibration amplitude
of the liquid/air interface was reduced, leading to a more luminous light emission.[206]
Figure III-14 Photographs of SL in pure water submitted to 100 kHz (Pac= 20 W) under 110 mL.min-1 Ar
flow, at 18°C, exposure 120 s: a) free surface and b) stainless steel plate (on the top of the quartz window);
photographs of SCL in 0.01 M luminol solution (pH= 11, Na2CO3) submitted to 100 kHz (Pac= 20 W)
under 100 mL.min-1 Ar/(20 vol.%)O2 flow, at 17°C, exposure 60 s) free surface and d) stainless steel plate

Acoustic cavitation behavior at 100 kHz and in the vicinity of a solid boundary
86
In fact, an ultrasonic field is a combination of both standing and traveling waves.[106] In the case of a
free surface, at low acoustic intensity, the liquid/air interface can reflect the sound wave and form a
standing wave. When the acoustic power increases, the instability of the liquid surface disturbs the
formation of a stable standing wave, and traveling wave becomes dominant.[207] Therefore violent
cavitation events mainly occur near the liquid surface, where standing wave proportion is still high.[105]
Besides, the vibration of the liquid surface consumes ultrasound energy, which also reduces the pressure
amplitude of the formed standing wave.[104] A solid reflector like a stainless steel plate, however, can
always act as a surface stabilizer that enhances standing wave proportion in an ultrasonic field, and then
increase acoustic pressure amplitude, which affects both SL and SCL.[44, 106] Since the extent of the
standing wave formation should strongly depend on the distance between a reflector and the transducer,
a more detailed study at different distances was implemented to investigate the effect of a solid surface
on the ultrasonic field in a sonoreactor.
III.3.2 Mobile stainless steel plate and Mg disc
The distance between a solid boundary and the transducer plate can influence the ultrasonic field in
solution, and in consequence, the SL and sonochemical activity.[207] In the previous study of Kauer et al.
an optimum reflector position was found to enable a uniform distribution of SCL in luminol solution
and of SL in NaCl solution purged with Ar irradiated by high-frequency ultrasound (≥ 580 kHz).[101] Lee
and Choi also observed the sensitivity of SL and SCL intensity as a function of the distance between a
stainless steel reflector and transducer plate during the sonolysis of water and luminol solution with 84
kHz ultrasound: a carefully adjusted position of the stainless steel plate was required to obtain the
maximum SL and SCL emissions.[91]
In the case of a mobile stainless steel plate, the position of the surface in the reactor was adjusted by
turning the screw on a rod, which was used to secure the stainless steel plate to the Teflon hoop. The
screw allows 1.24 mm z deviation per revolution. The distance between the plate and the transducer was
calculated based on the number of turns of the screw, and then was converted to the corresponding
multiple of one quarter of the ultrasound wavelength (λ/4). Theoretically, a distance equaling to the odd
multiple (2n + 1) of λ/4 can induce a standing wave with maximum pressure amplitude, also called a
resonant mode. For the even multiple (2n) of λ/4, an annihilation of ultrasonic wave propagation
generates the minimum acoustic pressure amplitude in irradiated solution, called anti-resonant mode.[72]
For distances of non-integer multiple of λ/4, a non-resonant mode exists, with acoustic pressure standing
between the maximum and minimum amplitude.
Photos of SCL in 0.01 M luminol solution and of SL in 1 M NaCl solution at different distances between
the transducer plate and the reflective stainless steel plate are present in Table III-3. Dim and bright
stripes are visually clear in both SCL and SL images in the presence of the stainless steel plate, but

Acoustic cavitation behavior at 100 kHz and in the vicinity of a solid boundary
87
exhibit blurred with free surface. This is consistent with the previous description that the solid reflector
can enhance the standing wave proportion in the ultrasonic field, while the reflection at the free liquid/air
surface is weakened by vibration itself. Stripes evenly space 2 mm apart, equals a half wavelength at
362 kHz (2.1 mm). According to literatures,[59, 100, 208] SL bubbles, which usually have a small size, are
favored to cluster at the pressure antinodes, where is the bright space in SL images. On the other hand,
the coalesced big bubbles preferentially occur at pressure nodes, where should be the dim narrow lines
in the pattern. As the stainless steel plate moves closer to the transducer, the apparent SCL and SL image
brightness and the spatial color distribution varied periodically. This periodic variation was again found
correlated to λ/4, indicating an alternation between resonant and anti-resonant wave modes in solution.
When the distance induces a resonant mode with high-pressure strong standing wave (25.5 and 29 turns),
visually brighter images are obtained for both SCL and SL. On the contrary, at the anti-resonant mode,
apparently dark SL and SCL images are observed. This can be explained by the lower pressure amplitude
in anti-resonant mode. This phenomenon is confirmed by the observation of a similar spectral shape but
more intensive SL emission at resonant mode than at non-resonant mode in the presence of stainless
steel plate in NaCl solution (Figure III-15).

Acoustic cavitation behavior at 100 kHz and in the vicinity of a solid boundary
88
Table III-3 Photographs of SCL in 0.01 M luminol solution (pH= 11, Na2CO3) and SL in 1 M NaCl
solution in the presence of a stainless steel plate submitted to 362 kHz (Pac= 43 W) under 100 mL.min-1 Ar
flow, at 18°C, exposure 20 s.
n
(turn)* free surface 25.5 26.5 28 29
D
(mm)** - 56.3 55.0 53.2 51.9
N
(λ/4)*** - 53.1 51.9 50.2 49.0
Pressure
mode - resonant anti-resonant anti-resonant resonant
SCL
image
in 0.01
M
luminol
SL
image
in 1 M
NaCl
* Number of turns of the screw (1.24 mm per revolution)
** Distance between stainless steel surface and transducer plate D = 87.9-1.24 n (mm)
*** Distance in terms of λ/4 (λ = 4.2 mm)

Acoustic cavitation behavior at 100 kHz and in the vicinity of a solid boundary
89
Figure III-15 SL spectra in the presence of a stainless steel plate in 1 M NaCl solution at 362 kHz (Pac= 43
W) under 100 mL.min-1 Ar flow, 18°C, at resonant mode (red) and non-resonant mode (green) distances
Moreover, in SL images of resonant mode standing wave in NaCl solution, blue and white light
emissions were mainly around pressure antinodes space, while the orange color mainly distributed at
pressure nodes narrow lines. It is believed that two different bubble populations exist in the ultrasonic
field in NaCl solution: i) sonochemically active bubbles, which emit Na* orange light; ii)
sonoluminescence active bubbles, which act as sources of SL emissions, including UV and visible light,
thus present white and blue colors.[64, 208] In a high pressure amplitude standing wave, stable cavitation
is dominant and the small bubbles accumulate at pressure antinodes by the primary Bjerknes force, and
contribute to the SL emissions.[59, 66] At the same time, secondary Bjerknes force results in bubble
coalescence and clustering, and the formed big bubbles or clusters are driven to pressure nodes by the
primary Bjerknes force.[59] These big size bubbles are unstable and more likely collapse asymmetrically
in the vicinity of pressure nodes in solution.[64] Therefore, as described in the previous section, more
Na* emission (orange) from these asymmetrical collapse appears near the pressure nodes.
However, in the anti-resonant mode, though the entire SL image brightness is significantly diminished,
an apparently orange diffusion in the right area of the optical window is observed. As can be seen in
Table III-3, big gas bubble glued on the right side below the stainless steel plate can be observed at
these two anti-resonant distances. Due to the interference of the glued gas bubbles, more unstable
bubbles and asymmetrical collapses occur in the right area of the reactor, leading to a heavier orange
color from excited Na* emission.
To be coherent with the latter study about Mg surface sonication, Mg disc was attached to the stainless
steel plate and sonicated in the same conditions. The distance between Mg disc and the transducer was
recalculated by considering of the thickness of Mg disc and the stickers. Small amount of oxalic acid

Acoustic cavitation behavior at 100 kHz and in the vicinity of a solid boundary
90
(0.001 M) was added in the 1M NaCl solution, so that H2 production existed during experiment. SCL
experiment was not implemented here, since luminol is not compatible in acid environment. SL images
and spectra at several selected distances are presented in Table III-4 and Figure III-16.
Like stainless steel plate, compared with the free surface case, the standing wave pattern is found to be
enhanced in the presence of the Mg surface. Since Mg is a chemically active material, in addition to the
sonolysis of water, more hydrogen gas bubbles are expected from reaction of Mg and oxalic acid.
According to the images in Table III-4, comparatively more bubbles are found to be glued on Mg
surface during sonolysis than with the stainless steel plate, especially at the later measured position n =
25 and 26. These formed gas bubbles created a liquid/gas interface at the Mg surface. Consequently,
irregular sound wave scattering or reflection from gas bubbles disturbs stable standing wave formation,
which leads to a chaotic ultrasonic field with more asymmetrical collapses in solution. That is why after
long time operation, the accumulated gas bubbles result in apparently more orange Na* emissions at the
later measured position n = 25 than the former one at n = 30, though both distances should be in the
resonant mode in the presence of a solid surface.
Table III-4 Photographs of SL in the presence of Mg surface in solution of 1 M NaCl and 0.001 M oxalic
acid mixture submitted to 362 kHz (Pac= 43 W) under 100 mL.min-1 Ar flow, at 18°C, exposure 20 s.
n (turn) free surface 25 26 27.5 30
D’
(mm)* - 56.2 54.9 53.1 50.0
N’ (λ/4) - 53.0 51.8 50.0 47.1
SL
image in
1 M
NaCl +
0.001 M
oxalic
acid
* Considering Mg disc and sticker thickness of 0.75 mm, distance between Mg surface and transducer plate D’ =
87.2-1.24 n (mm)
According to Figure III-16, in the presence of the Mg surface in solution, it is obvious that SL intensity
at the “anti-resonant” mode is much weaker than at “resonant” mode and free surface conditions. A
similar spectrum with slightly weaker Na* emission than in the free surface case was observed at
resonant mode. However, in consideration of the instability of the ultrasonic field, especially with the
gas bubble layer reflection below the Mg surface, SL spectra can vary temporally and spatially. Since

Acoustic cavitation behavior at 100 kHz and in the vicinity of a solid boundary
91
our SL spectroscopy focuses on a localized zone of around 3 mm height and width in the middle of
optical window, the obtained SL spectra may not exactly reflect the average SL intensity in the reactor.
As described in the literatures, various factors such as heterogeneous dissolved gas concentration in
solution,[209] gas bubbling position,[95] besides in this case interference of glued bubbles below solid
boundary and irregular inner surface of the reactor, can make unpredictable difference in local SL
intensity. Therefore, more precise study, for example a way to remove the glued gas bubbles, is expected
in the future study.
Figure III-16 SL spectra in the presence of Mg surface in the mixture solution of 1 M NaCl and 0.001 M
oxalic acid at 362 kHz (Pac= 43 W) under 100 mL.min-1 Ar flow, at 18°C: free surface (blue), “anti-
resonant” mode (red) and “resonant” mode (green) distances
III.4 Conclusion
This chapter presents the study of sonochemistry and SL in an intermediate ultrasonic frequency (100
kHz) field and the effect of a solid boundary on SCL and SL at 100 kHz and 362 kHz.
Investigations on the sonochemistry and SL at 100 kHz find that acoustic cavitation behavior at
intermediate frequency is approximately in between low and high frequency ultrasound. The H2O2 yield
in water under Ar regularly increases with ultrasonic frequency from 20 kHz to 362 kHz. The shape of
SL spectrum at 100 kHz is somewhat similar to that at 20 kHz. On the other hand, the rovibronic
temperatures of OH (A2Σ+) radicals in the nonequilibrium sonochemical plasma produced by 100 kHz
ultrasound are closer to high frequency rather than to 20 kHz. A 20% O2 addition to Ar leads to higher
H2O2 yields at all frequencies, and to higher SL intensity at intermediate and high frequencies. This
discrepancy was traced back to their higher collapse energy that enables O2 dissociation and subsequent
formation of more excited species, while at 20 kHz O2, mostly has a quencher effect on SL. Cavitation

Acoustic cavitation behavior at 100 kHz and in the vicinity of a solid boundary
92
bubbles at 100 kHz also share the ability of high frequency ones to dissociate N2 molecules. Thus, from
spectroscopic and chemical points of view, 100 kHz can be seen as a transition between low and high
frequencies.
Afterward, according to the SCL distribution in luminol and SL intensity in NaCl solutions irradiated
by ultrasound at 100 and 362 kHz in the presence of a reflective solid boundary, a strong standing wave
pattern occurs in ultrasonic field which leads to a more homogeneous distribution of SCL and SL, and
the correlation between the standing wave content and the distance between solid boundary and
transducer is revealed. In the proximity of a fixed solid surface, a higher ratio between Na* and
continuum emission intensity is observed from the MBSL spectrum of the NaCl solution. This
phenomenon can be explained by the asymmetrical collapses of cavitation bubbles in the vicinity of the
solid surface, which induce more Na* emission according to the droplet injection model. However, this
effect seems quite localized in a very short distance (≤ 1.5 mm) below the solid plate. By adjusting the
position of the solid surface, clear bright dim patterns with spacing of half ultrasound wavelength (λ/2)
indicate a resonant standing wave in the ultrasonic field when the distance between the reflector and the
transducer equals odd multiple (2n + 1) of a quarter ultrasound wavelength (λ/4). SCL apparent
brightness and MBSL intensity are found to be dependent on the standing wave resonance: brighter SCL
photos and stronger SL emissions are observed at the resonant distances. In the case of Mg surface used
as reflector in the ultrasonic field, as a result of the interference from the hydrogen bubbles that produced
from the reaction between Mg surface and acid, a chaotic wave pattern is observed in the SL photos
with apparently more intensive orange color. No precise conclusion can be given from the MBSL spectra
because of the interference and distortion of the experimental conditions.
Future study about cavitation at intermediate frequency with other experimental probes and by
simulation, and about its mechanical and chemical effects on ultrasonic cleaning and surface
modification can be of great interest. Besides, the controlling of the standing wave content in a high
frequency ultrasonic field and its effects on sonochemistry and SL should take more attentions and
investigations.
In addition to the solid surface impacts on cavitation behaviors (SL and SCL) described above, in turn,
the effect of acoustic bubble collapse on solid surfaces and the ultrasonic decontamination efficiency
are investigated and discussed in the next chapters.

Metallic surface structuration by ultrasound
93
Chapter IV. Metallic surface
structuration by ultrasound

94

Metallic surface structuration by ultrasound
95
IV.1 Introduction
As described in the previous chapter, asymmetrical bubble collapse is favored in the vicinity of a solid
boundary. The generated micro-jets and shock waves participate in surface erosion and micro-
deformation, fragmentation of grains, and depassivation of metallic surfaces.[32, 50, 210, 211] Most of the
researches dedicated to ultrasonic surface treatment are related to cleaning or erosion and mainly focus
on stainless steel, aluminum alloys and titanium,[122, 212-214] or glass and silicon wafers.[32, 215] Furthermore,
most of the related studies have been carried out at low frequency ultrasound (20-60 kHz) where
mechanical effects of ultrasound are generally said to be more efficient, so that high frequency domain
was neglected.[120, 122, 213, 216]
This chapter focuses on the behavior of Mg based surfaces (pure Mg and Mg-Zr alloy) in aqueous
solutions under ultrasonic irradiation. Several important parameters are investigated such as the
ultrasonic frequency (especially intermediate and high frequencies), duration of treatment, type and
concentration of solutes, mechanical stirring velocity, etc. An original approach carried out through 3D
reconstruction of sonicated surfaces is used to describe the surface evolutions. The evolution of the
surface morphology, wettability, and the correlation between them, besides the chemical composition
of the solutions are followed and discussed. Accordingly, a mechanism is proposed for the formation of
ultrasonically controlled microstructure on Mg based surfaces.
IV.2 Structuration of Mg-based material surfaces by
ultrasound
IV.2.1 Characterization of native Mg surfaces
Photo and SEM image of an as-received Mg sample are presented in Figure IV-1. Mg samples exhibit
a brownish color and a rust topography, implying the formation of an oxide layer on the native Mg
surface, in agree with the literature. [217] The chemical composition of a native Mg surface analyzed by
EDX is listed in Table IV-1.
Figure IV-1 Photo and SEM observation of a native Mg surface.

Metallic surface structuration by ultrasound
96
Table IV-1 Chemical composition of a native Mg surface by EDX analysis.
Element Mg O C
wt % 39.7 ± 3.6 44.5 ± 5.2 15.8 ± 2.7
As a reactive metal, Mg can slowly react with oxygen, water, carbon dioxide and some volatile organic
compounds in air at room temperature.[217] Oxygen can directly and easily react with Mg with the
formation of a thin film of MgO on the surface. Then water vapor and carbon dioxide can be adsorbed
by the formed MgO film and produce Mg(OH)2 and MgCO3.[150, 218] This corrosion process continues
with the growth of the oxide layer until it is thick enough to play as a protective layer to prevent further
corrosion. Previous studies had detected a mixed layer of MgO and complex magnesium carbonates
(x(MgCO3)·y(Mg(OH)2)·z(H2O)) which exists3 with a stable thickness of about 10 nm after 20 days
exposure in air.1 According to our EDX analyses summarized in Table IV-1, after long storage in the
laboratory atmosphere, the native Mg surfaces seem to be covered with a thin layer of MgO and
x(MgCO3)·y(Mg(OH)2)·z(H2O) mixtures.
Pure magnesium is a hydrophilic material exhibiting a native contact angle of about 40° or even less.[217,
219] After long storage, the formed complex oxide layer changes the surface energy and roughness. As
presented in Figure IV-2, a hydrophobic surface is formed on native Mg discs with a contact angle of
120 ± 4°. The estimated roughness from 3D reconstructions, including the average roughness of profile
(Ra) and the mean peak to valley height of roughness profile (Rz), equal 61.1 and 328.4 nm respectively.
The contact angle value is consistent with the previous measurement of pure Mg plates stored in ambient
atmosphere by Fotea et al.[217] They observed a water contact angle plateau of 113 ± 2° after 21 days
exposure of Mg in air.
In our experiments all Mg samples were directly treated without any pre-polishing. And we assume that
the characterization process just after the surface treatment is short that the new oxidation on the treated
surface can be neglected.
Figure IV-2 3D reconstruction of a native Mg surface (insert: image of water contact angle).

Metallic surface structuration by ultrasound
97
IV.2.2 Frequency effect on Mg surface sonication
Figure IV-3 compares photos of Mg surfaces treated during 1 hour in 0.01 M oxalic acid solutions at
18°C under silent condition (with only stirring) and at low- (20 kHz) and high- (200 kHz and 1 MHz)
frequency ultrasound. Notable differences between native Mg surface, surface treated under silent
condition and sonicated surfaces can be clearly pointed out with naked eyes. Under silent condition,
some dark residual areas can be observed though the majority of the brownish color disappeared. The
sonicated samples are found to be much brighter whatever the experimental conditions. As a function
of the applied acoustic frequency, different features are observed. The most dramatic effects are
generated at low frequency ultrasound (20 kHz) with the formation of several visible pits (the bright
tiny spots in Figure IV-3.b).
Figure IV-3 Photos of Mg surfaces treated for 1 hour in 0.01 M oxalic acid solution (Ar, 18°C): a) under
silent condition, stirring; b) at 20 kHz, Pac= 20 W; c) at 200 kHz, Pac= 20 W, stirring; d) at 1 MHz Pac= 40
W, stirring.
In comparison to the original material, the 200 kHz sonicated surface (0.01 M oxalic acid) is smooth
and presents a homogeneous coarse appearance of visible tiny pits on the surface (Figure IV-3.c). The
surface sonicated in 0.01 M oxalic acid at 1 MHz appears much smoother in comparison to the other
samples and does not show any other particular features (Figure IV-3.d). These observations can be
associated to a depassivation phenomenon of the magnesium surface, already reported in the literature
and attributed to the acoustic cavitation generated in the vicinity of the extended surfaces.[83, 119]
Figure IV-4 Mg surface treated at 20 kHz, Pac= 20 W for 1 hour in 0.05 M oxalic acid solution (Ar, 17°C):
a) photo; b) and c) SEM observations.

Metallic surface structuration by ultrasound
98
The sonication of Mg surface in a more concentrated oxalic acid solution (0.05 M) with similar other
conditions leads to a higher degree of surface erosion that can be noticed in Figure IV-4.a. In these
conditions, the surface exhibits large holes that completely cross the sample initially measuring 0.5 mm
in depth.
SEM investigations related to the frequency effects on the surface are illustrated in Figure IV-4.b and
c. and Figure IV-5.
Under silent condition, the stirred surface is partly devoid of the complex oxide film and exhibits a
different morphology (Figure IV-5). The oxidation film is indeed replaced by large flakes of more than
100 µm in diameter which are heterogeneously distributed and appear very loose and fragile. In such
conditions, corrosion most probably occurs from the edge of the grain boundaries with Mg material
peeling off, also known as lamellar or exfoliation corrosion.[220, 221] This behavior can be related to a
local oxidation of magnesium into magnesium hydroxide which is thermodynamically more stable in
such conditions and is known to exhibit a higher molar volume in comparison to pure magnesium (24.9
cm3.mol-1 for Mg(OH)2 against 14.0 cm3.mol-1 for pure Mg).[222] Such transformation occurring at
localized areas can therefore weaken and stress the surface film and favor the departure of large
flakes.[150, 221]
The 20 kHz experiment performed in 0.01 M oxalic acid shows a heterogeneous surface with the
presence of small pits combined with large and polydispersed cavities (or “craters”). The craters are
heterogeneously dispersed on the surface and have a size comprised between 100 and 300 µm. One of
them is visible in Figure IV-5. If the oxalic acid concentration increases to 0.05 M, these craters are
found to grow as big holes of about 1 mm diameter, as presented in Figure IV-4.b. It is also interesting
to note that 20 kHz sonication also leads to the formation of channels and fluctuating undulations which
are more obvious in 0.05 M oxalic acid solution (Figure IV-4.c). Such features can be attributed to the
acoustic pressure field and streamings generated on the surface during sonication.[42]
In agreement with Figure IV-5, the experiments carried out at 1 MHz do not reveal the presence of
craters on the surface which is found smoother and much more homogeneous. Similar surface
topography is also observed on Mg sample treated at 665 kHz (Appendix G). Meantime, these sonication
treatments at very high ultrasonic frequencies also allow the Mg material grains to be revealed.

Metallic surface structuration by ultrasound
99
Figure IV-5 SEM observations of Mg surfaces treated for 1 hour in 0.01 M oxalic acid solution, (Ar, 18°C,
stirring 200 rpm): under silent condition; at 20 kHz, Pac= 20 W, no stirring; at 200 kHz, Pac= 20 W; at 1
MHz Pac= 40 W.
By contrast to the other applied ultrasonic frequencies, 200 kHz sonication leads to an unpreceded
microstructure characterized by a homogeneous surface where a monodispersed distribution of craters
can be noticed (Figure IV-5). When tilted, this surface exhibits a “golf ball” shape structuration that
can be observed in Figure IV-6.a and b. More generally, the increase of the ultrasonic frequency from
20 kHz to 200 kHz favors the homogeneous distribution of the craters on the surface.[223] Higher

Metallic surface structuration by ultrasound
100
ultrasonic frequencies (≥ 665 kHz), which are known to provide smaller bubbles, does not lead to crater
formation. Golf ball shape microstructures generated at 200 kHz therefore result from a fine tuning of
the applied acoustic frequency coupled to an appropriate solute. Furthermore, it is important to note that
the procedure allows the homogeneous structuring of a large area of material which can be of potential
interest for technological surface and alloy structuring and engineering (Figure IV-6.a).
Figure IV-6 Crater structures on Mg surface treated for 1 hour in 0.01 M oxalic acid solution (Ar, 18°C):
a) and b) SEM observation with a 65° tilt angle at 200 kHz, Pac= 20 W; c) 3D reconstruction at 100 kHz,
Pac= 20 W.
At the same time, we notice the presence of small particles on the surface (secondary phases). More
details about the precipitation and the crater formation mechanism will be described later in this chapter.
Similar crater structures can be observed on Mg surfaces treated by 100 kHz (Figure IV-6.c) and 345
kHz (not shown here) ultrasound. According to Table IV-2, the crater diameter and depths are found to
decrease with the increasing ultrasonic frequency in agreement with the decreasing resonance radius of
the collapsing resonant bubbles going from 150 µm at 20 kHz to 8.7 µm at 345 kHz.[56, 223]
Table IV-2 acoustic bubble resonance radius and estimated crater size of Mg surfaces treated for 1 hour in
0.01 M oxalic acid solution (Ar, 18°C, stirring 100 rpm): 20 kHz, Pac= 20 W; 100 kHz, Pac= 20 W ; 200
kHz, Pac= 20 W; 345 kHz Pac= 40 W; 1 MHz, Pac= 40 W.
Frequency 20 kHz 100 kHz 200 kHz 345 kHz 1 MHz
Bubble resonance radius (µm)[56] 150 30 15 8.7 3.0
Crater diameter (µm) 100 - 300 110 ± 13 85 ± 7 40 ± 4 -
Crater depth (µm) -* 60 ± 7 34 ± 5 18 ± 4 -
* At 20 kHz, 3D reconstructions of the big craters did not allow to access to effective depth values
Figure IV-7 summarizes the reconstructed 3D surfaces with the corresponding water contact angle
measurements obtained for the Mg surfaces sonicated in 0.01 M oxalic acid at different ultrasonic
frequencies besides under silent condition. Their corresponding estimated roughness from 3D
reconstructions are listed in Table IV-3.

Metallic surface structuration by ultrasound
101
Figure IV-7 3D reconstruction of Mg surfaces treated for 1 hour in 0.01 M oxalic acid solutions, Ar, 18°C
stirring 200 rpm: a) under silent condition; b) 20 kHz, Pac= 20 W, no stirring; c) 200 kHz, Pac= 20 W,
stirring; d) 1 MHz Pac= 40 W, (insert: images of water contact angle).
Table IV-3 Estimated roughness for Mg surfaces treated during 1 hour in 0.01 M oxalic acid solutions (Ar,
18°C, stirring 100 rpm): silent condition; 20 kHz, Pac= 20 W, no stirring; 100 kHz, Pac= 20 W; 200 kHz,
Pac= 20 W; 345 kHz Pac= 40 W; 1 MHz Pac= 40 W.
Frequency Original Silent 20 kHz 100 kHz 200 kHz 345 kHz 1 MHz
Ra (nm) 61.1 ± 1.2 43.9 + 0.9 40.3 ± 4.1 162.3 ± 2.4 169.6 ± 3.4 211.5 ± 4.2 39.4 ± 0.8
Rz (nm) 328.4 ± 5.6 260.4 ± 4.7 185.0 ± 8.7 634.8 ± 7.8 582.7 ± 6.1 605.5 ± 5.5 257.8 ± 4.4
The contact angle values obtained on Mg samples treated under silent condition reaches 44 ± 2°, which
is lower than the original Mg surface and very close to a native Mg material without oxide layer (~ 40 °).
This result is expected, considering the incomplete removal of oxide layer and the absence of formation
of specific microstructures on the treated surface. However, the heterogeneous surface observed at 20
kHz (presence of fluctuating undulations, valleys, large craters and holes) also leads to a small contact
angle of 53 ± 4°. The areas surrounding the holes exhibit a lower roughness in comparison to the original
material. Similar observations have been reported during the laser structuring of Mg alloy material,[186]
the 20 kHz ultrasound treatment of aluminum and stainless steel in pure water,[115] and the 20 kHz
sonication of titanium alloys in 5 M sodium hydroxide.[122] For surface treated at 1 MHz, the measured
contact angle and roughness are very close to that obtained at 20 kHz, though the absence of surface
deformations and craters leads to a much smoother and homogeneous surface.
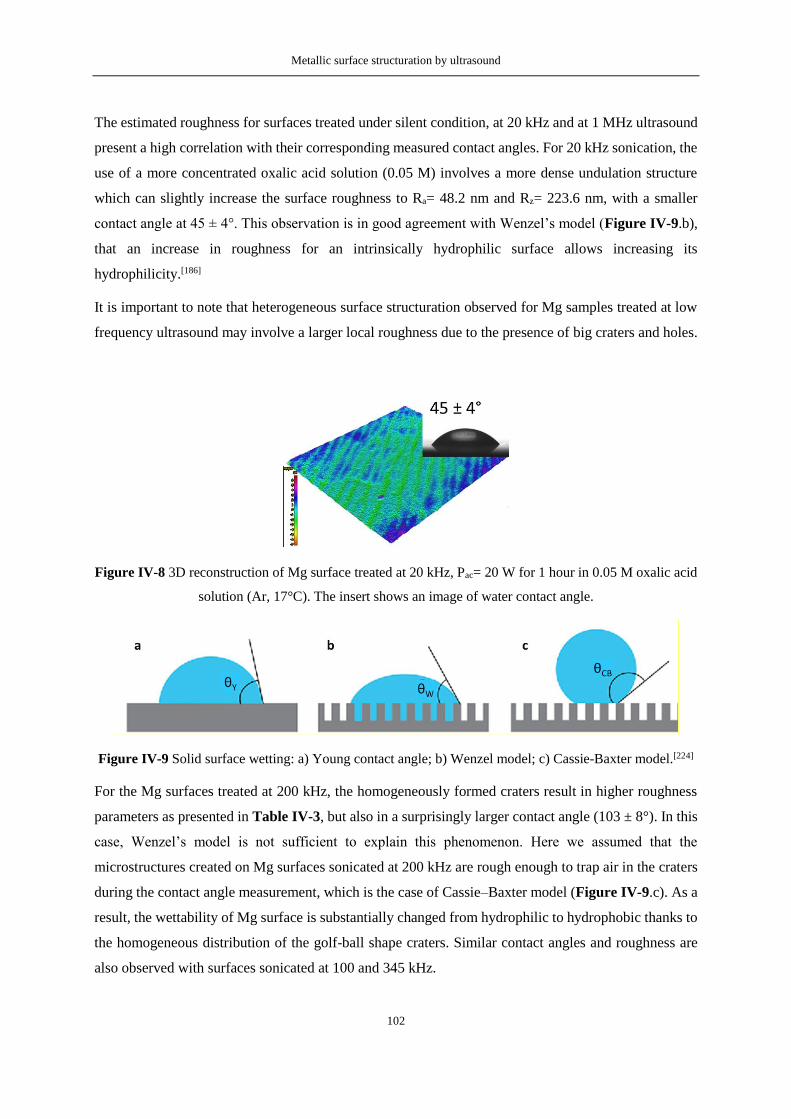
Metallic surface structuration by ultrasound
102
The estimated roughness for surfaces treated under silent condition, at 20 kHz and at 1 MHz ultrasound
present a high correlation with their corresponding measured contact angles. For 20 kHz sonication, the
use of a more concentrated oxalic acid solution (0.05 M) involves a more dense undulation structure
which can slightly increase the surface roughness to Ra= 48.2 nm and Rz= 223.6 nm, with a smaller
contact angle at 45 ± 4°. This observation is in good agreement with Wenzel’s model (Figure IV-9.b),
that an increase in roughness for an intrinsically hydrophilic surface allows increasing its
hydrophilicity.[186]
It is important to note that heterogeneous surface structuration observed for Mg samples treated at low
frequency ultrasound may involve a larger local roughness due to the presence of big craters and holes.
Figure IV-8 3D reconstruction of Mg surface treated at 20 kHz, Pac= 20 W for 1 hour in 0.05 M oxalic acid
solution (Ar, 17°C). The insert shows an image of water contact angle.
Figure IV-9 Solid surface wetting: a) Young contact angle; b) Wenzel model; c) Cassie-Baxter model.[224]
For the Mg surfaces treated at 200 kHz, the homogeneously formed craters result in higher roughness
parameters as presented in Table IV-3, but also in a surprisingly larger contact angle (103 ± 8°). In this
case, Wenzel’s model is not sufficient to explain this phenomenon. Here we assumed that the
microstructures created on Mg surfaces sonicated at 200 kHz are rough enough to trap air in the craters
during the contact angle measurement, which is the case of Cassie–Baxter model (Figure IV-9.c). As a
result, the wettability of Mg surface is substantially changed from hydrophilic to hydrophobic thanks to
the homogeneous distribution of the golf-ball shape craters. Similar contact angles and roughness are
also observed with surfaces sonicated at 100 and 345 kHz.

Metallic surface structuration by ultrasound
103
Table IV-4 compares the amount of dissolved material (weight loss) for the Mg surfaces sonicated at
different ultrasonic frequencies. Except for high frequency at 1 MHz, all of the results are in agreement
with photos, SEM observations and 3D reconstructions. For the surface treated by 1 MHz ultrasound,
the morphology change is not comparable with lower frequencies, which may be due to its weaker
physical effect and the smaller bubble sizes. The notable weight loss found at 1 MHz ultrasound, which
was even more than that observed at 200 kHz, probably relies on the higher used acoustic power.
Table IV-4 Weight loss of Mg surfaces treated for 1 hour in 0.01 M oxalic acid solution (Ar, 18°C): under
silent condition; at 20 kHz, Pac= 20 W; at 200 kHz, Pac= 20 W, stirring; at 1 MHz Pac= 40 W, stirring 200
rpm.
Frequency Silent 20 kHz 200 kHz 1 MHz
Weight loss (%) 1.08 ± 0.04 10.12 ± 0.17 5.18 ± 0.11 6.12 ± 0.06
The special structuring of the surfaces treated at ultrasonic frequencies ranging from 100 to 345 kHz
appears very interesting and has, to our knowledge, never been reported in the literature. Therefore, the
following studies were carried out within this range of frequency to focus on the formation of this “golf
ball” shape structure.
IV.2.3 Solutions effect on Mg surface sonication
SEM images of Mg surfaces sonicated at 200 kHz in water, 0.01 M sodium oxalate and 0.001 M oxalic
acid solutions are presented in Figure IV-10. According to previous studies on the sonication of oxalic
acid, the degradation of oxalic acid or oxalate group in solutions irradiated by ultrasound is negligible
even after several hours experiment.[225, 226] In comparison to the sample sonicated in similar conditions
with a higher oxalic acid concentration (0.01 M, see Figure IV-5), almost no depassivation effect is
observed on the Mg surfaces treated in water or in 0.01 M sodium oxalate solution. A dense distribution
of new phases appears on Mg sample treated in sodium oxalate which can be attributed to magnesium
hydroxide precipitation considering the sodium oxalate solution should be low alkalinity (pH ≈ 8), but
not magnesium oxalate precipitation due to its relatively higher solubility (solubility product constant
Ksp= 8.6·10-5, and for Mg(OH)2 Ksp= 5.61·10-12).[227, 228] This is confirmed by EDX analysis that almost
no carbon is observed on the treated surface. After 1 hour sonication in the dilute 0.001 M oxalic acid
solution, it is possible to observe the partial and complex removal of the oxide layer without any
formation of craters. Some pits and deformations can nevertheless be noticed. Prolongation of sonication
until 90 minutes leads to the formation of crater structures, which formation mechanism is described
later.

Metallic surface structuration by ultrasound
104
Figure IV-10 SEM observations of Mg surfaces treated at 200 kHz, Pac= 20 W, stirring, Ar, 18°C for 1
hour in: water, 0.01 M sodium oxalate solution and 0.001 M oxalic acid solution.
Table IV-5 compares the contact angle measurements obtained on the surfaces sonicated in the various
solutions. In water and 0.01 M Na2C2O4 solution, a slight decrease of the contact angle can be noted and
attributed to the low or partial removal of the native oxide layer. For Mg surface treated in a 0.001 M
oxalic acid solution, the contact angle decreases to about 20°, which agrees with the observed
depassivation of the metallic surface and what reported for pure Mg material. This huge differences
between Na2C2O4 and oxalic acid solutions should come from the presence of protons, which strongly
react and remove the oxide layer on Mg surfaces. However, there is a significant discrepancy between
the measured contact angles of Mg surfaces treated in the dilute 0.001 M and 0.01 M oxalic acid
solutions.
Table IV-5 Water contact angles obtained for Mg surfaces treated at 200 kHz (Pac= 20 W, stirring, Ar,
18°C) for 1 hour in water, 0.01 M sodium oxalate solution and 0.001 M oxalic acid solution.
Solution H2O 0.01 M Na2C2O4 0.001 M H2C2O4
Contact angle (°) 82.7 ± 4 84.8 ± 4 22.8 ± 4
By comparing the contact angle evolution of Mg surface sonicated at 200 kHz in three different solutions
(see Figure IV-11), the surface wettability is found to be directly correlated to the removal of the oxide
layer and the formation of craters. The contact angle of the sonicated Mg surface decreases linearly and
slowly in water which agrees with the very limited depassivation observed by SEM. With the departure
of the oxidation layer in 0.001 M oxalic acid, Mg surface contact angle rapidly decreases to less than

Metallic surface structuration by ultrasound
105
40° in 20 minutes and remains at the same level in the next 40 minutes treatment. Such strongly wetting
surface can refer to strong hydrophilicity in agreement with the literature.[229] SEM images of both
experiments in Figure IV-5 and Figure IV-10 do not present the formation of crater structures. However,
in 0.01 M oxalic acid, contact angle is over 80° after just 30 minutes sonication. This is not the same
situation as in water, since in oxalic acid the oxide layer is totally removed, and at the same time an
obvious distribution of craters already existed on the sonicated surface.
Figure IV-11 Mg surfaces treated at 200 kHz (Pac= 20 W, stirring, Ar, 18°C) for 1 hour in water, 0.001 M
and 0.01 M oxalic acid solutions: a) water contact angle evolution; SEM image of Mg surface after 30 min
treatment in b) 0.01 M oxalic acid solution and c) 0.001 M oxalic acid.
These results strengthen our previous observations and hypotheses where golf-ball shape craters formed
by ultrasound are assumed to strongly increase the roughness and the contact angle of Mg surface. The
formation of crater structures does not only depend on acoustic cavitation, but also on acidic
environment. For a much dilute acid, longer sonication duration or higher acoustic power intensity can
help the production of craters.
In water the dissolution of the oxide layer and the corrosion of Mg are very weak and slow (reaction
(I-32)). In oxalic acid, several chemical reactions ((IV-1) to (IV-4)) can take place due to the presence
of protons:
𝑀𝑔𝑂 + 2𝐻+ → 𝑀𝑔2+ +𝐻2𝑂 (IV-1)
𝑀𝑔(𝑂𝐻)2 + 2𝐻+ → 𝑀𝑔2+ + 2𝐻2𝑂 (IV-2)
𝑀𝑔𝐶𝑂3 + 2𝐻+ → 𝑀𝑔2+ +𝐻2𝑂 + 𝐶𝑂2 (IV-3)
𝑀𝑔 + 2𝐻+ → 𝑀𝑔2+ +𝐻2 (IV-4)

Metallic surface structuration by ultrasound
106
In the case of sodium oxalate solution, a weak alkaline environment is created by oxalate ligands
(reactions (IV-5) and (IV-6)). At the same time, 𝐻2𝑂 and the produced small amount of 𝐻𝐶2𝑂4− and
𝐻2𝐶2𝑂4 can dissolve the complex oxide layer on Mg surface and bring 𝑀𝑔2+ into solution, which will
precipitate as 𝑀𝑔(𝑂𝐻)2 in the weak alkaline system (reaction (IV-7)).
𝐶2𝑂42− +𝐻2𝑂 ⇌ 𝐻𝐶2𝑂4
− + 𝑂𝐻− (IV-5)
𝐻𝐶2𝑂4− +𝐻2𝑂 ⇌ 𝐻2𝐶2𝑂4 + 𝑂𝐻
− (IV-6)
𝑀𝑔2+ + 2𝑂𝐻− → 𝑀𝑔(𝑂𝐻)2 (IV-7)
Figure IV-12 and Table IV-6 compare Mg dissolution and hydrogen production kinetics observed for
the four different aqueous solutions sonicated at 200 kHz. In agreement with SEM investigations, Mg
is found to poorly accumulate in sonicated pure water, with an initial rate of 0.8 µM.min-1. This can be
explained by the low solubility of Mg(OH)2 (Ksp= 5.61·10-12) formed in pure water.[222] The presence of
0.01 M sodium oxalate significantly enhances Mg dissolution rate which reaches 5.8 µM.min-1. In
comparison to pure water, this rate can be again improved (11.3 µM.min-1) with the presence of protons
(H+) through the sonication of a 0.001 M oxalic acid solution thus confirming the ultrasonic dissolution
of Mg material with time. A dramatic increase of the dissolution kinetics can be further observed in the
presence of 0.01 M oxalic acid where the initial dissolution rate gains two orders of magnitude in
comparison to pure water and reaches 76.7 µM.min-1. These Mg dissolution differences confirm the
strong contribution of H+ in the microstructure formation process. Nevertheless, the contribution of
oxalate ligands cannot be totally neglected in the whole mechanism as evidenced by the higher
dissolution rates observed in the presence of sodium oxalate solutions in comparison to pure water.
For oxalic acid solutions, it is interesting to note an obvious slowdown of the Mg accumulation rate after
30 minutes of sonication in Figure IV-12. This phenomenon is easily perceptible for 0.01 M oxalic acid
solution and can be related to (i) the exhaustion of protons during dissolution, or (ii) the precipitation of
MgC2O4 which saturates the solution and the surface. According to the solubility constant for
magnesium oxalate (Ksp= 8.6·10-5) and the concentration of protons initially introduced, the maximal
dissolution yield estimated for Mg appears limited by the concentration of protons for 0.001 M oxalic
acid (24 mg.L-1 against 2 g.L-1 for Mg oxalate solubility). For higher oxalic acid concentration, both
protons and magnesium oxalate precipitation can limit Mg dissolution (240 mg.L-1 for protons against
206 mg.L-1 for the solubility). However, Mg oxalate precipitates were not noticed in solution (in contrast
to 0.05 M experiments) supporting a mechanism driven by H+ consumption.

Metallic surface structuration by ultrasound
107
Figure IV-12 Dissolution of Mg surfaces treated at 200 kHz (Pac= 20 W, stirring, Ar, 18°C) for 1 hour in
water, 0.01 M sodium oxalate solution, 0.001 M and 0.01 M oxalic acid solutions.
It is important to note that experiments carried out at 20 kHz in 0.05 M oxalic acid results in a strong H2
gas release (177.7 µM.min-1) as well as a high concentration of solubilized Mg in solution. Furthermore,
these conditions involved the formation of Mg oxalate precipitate (or glushinskite, Ksp= 4.83·10-6)[227]
which was characterized by Raman spectroscopy and XRD measurements in Figure IV-13 and Figure
IV-14 respectively.
Figure IV-13 Raman spectra of the white precipitate obtained in solution after Mg surface sonication at 20
kHz, Pac= 20 W for 1 hour in 0.05 M oxalic acid solution (Ar, 17°C) and glushinskite standard as reference

Metallic surface structuration by ultrasound
108
Figure IV-14 X-ray diffraction pattern of the white precipitate obtained in solution after Mg surface
sonication at 20 kHz, Pac= 20 W for 1 hour in 0.05 M oxalic acid solution (Ar, 17°C) (standard patterns of
MgC2O4 JCPDS 00-028-0625 and MgC2O4•2H2O JCPDS 00-026-1223)
Furthermore, according to Table IV-6, on-line mass spectrometry experiments confirmed that
sonication of Mg surfaces is accompanied with the generation of hydrogen (H2) gas. The measured H2
flow rate is observed to increase from 0.5 µM.min-1 in pure water to 31.7 µM.min-1 in 0.01 M oxalic
acid solution. Generally, due to the amount of oxalate ligands and H+ concentration addition, the
increasing tendency of hydrogen gas release is correlated to Mg accumulation in solution. However, the
amounts of dissolved Mg ions and released hydrogen gas for the various studied solutions do not
correspond if we consider the reactions previously described ((I-33), (I-34) and (IV-4)). Hydrogen gas
generation indeed represents only about half or less of the dissolved Mg amount while they should be
approximately equal. This phenomenon has been already observed by other authors and has been
attributed to the dissolution of hydrogen atoms in the Mg metal matrix.[230, 231] The initial oxide layer
dissolution (no hydrogen production, reactions (IV-1) to (IV-3)) and the possible inevitable leakage of
gas during experiments may also partly contribute to this inconsistency between Mg dissolution and
hydrogen production. Nevertheless, it is important to emphasize that the kinetics of Mg ion accumulation
in solutions and the evolution of hydrogen gas are correlated to the structuration progress reported for
Mg surfaces. These observations confirm that the surface microstructure formations result from a
controlled dissolution process driven by ultrasound.

Metallic surface structuration by ultrasound
109
Table IV-6 Dissolution rate and H2 maximal formation rate of Mg surfaces treated at 200 kHz (Pac= 20 W,
stirring, Ar, 18°C) for 1 hour in water, 0.01 M sodium oxalate solution, 0.001 M and 0.01 M oxalic acid
solutions.
Solution
Mg dissolution rate
(µM.min-1)
H2 maximal formation rate
(µM.min-1)
H2O 0.8 ± 0.1 0.5 ± 0.1
0.01 M Na2C2O4 5.8 ± 0.3 3.6 ± 0.1
0.001 M H2C2O4 11.3 ± 0.3 5.7 ± 0.2
0.01 M H2C2O4 76.7 ± 2.5 31.7 ± 1.1
As a function of the experimental conditions, Mg surface dissolution is accompanied with the formation
and deposition of new structures on the surface of the sample. These secondary phases can be observed
in Figure IV-15. They exhibit a spherical shape with a diameter generally comprised from few µm to
around 20 µm. The experiments showed that they can be formed whatever the dissolution conditions
and appear favored with the dissolution progress and an increased concentration of oxalic acid.
Figure IV-15 SEM observations of the secondary phases on Mg surfaces treated at 200 kHz (Pac= 20 W,
Ar, 18°C) for 1 hour in 0.01 M oxalic acid solution.
ATR-FTIR investigations carried out on a native Mg surface and other three samples sonicated at 200
kHz in pure water, sodium oxalate, and oxalic acid are summarized in Figure IV-16. In comparison to
the original Mg sample, all of the treated surfaces exhibit a sharp IR band at 3695 cm-1 that can refer to
the stretching band mode reported for hydroxyl groups of Mg(OH)2.[232] A band standing at 1650 cm-1
can be observed on the three treated surfaces and can be attributed to both surface-adsorbed water, and
the antisymmetric stretching vibration mode for oxalate groups.[233, 234] Furthermore, a small band
observed at 1320 cm-1 can also be attributed to the symmetric stretching vibration of oxalate groups in

Metallic surface structuration by ultrasound
110
agreement with the literature.[233, 234] XRD experiments did not allow to conclude on the nature of these
secondary phases present on the surface film. The entire sample showed the diffraction peaks
characteristic from pure Mg.
SEM-EDX measurements performed on these secondary phases confirmed the presence of oxygen and
magnesium and the absence of carbon (Figure IV-17). Although the presence of oxalate groups
adsorbed on the Mg surface cannot be totally excluded, it is unlikely that these secondary phases be
composed of magnesium oxalate. Mg(OH)2 deposition on surface has been already observed by other
authors and can be attributed to an alkalization effect.[150] Such phenomenon can result from the time
required by species to migrate away from the surface after reaction. Mg surface can locally become
more alkaline than the solution after H+ consumption therefore resulting in the deposition of Mg(OH)2
on the surface. Studies showed that local pH adjacent to the surface can be higher than 10 even in acidic
solutions suggesting its formation in our conditions.[150]
Figure IV-16 ATR-FTIR spectra of native Mg surface and of Mg surfaces treated at 200 kHz (Pac= 20 W,
stirring, Ar, 18°C) for 1 hour in water, 0.01 M sodium oxalate solution and 0.01 M oxalic acid solution.

Metallic surface structuration by ultrasound
111
Figure IV-17 SEM-EDX analysis of secondary phases on Mg surface treated at 200 kHz (Pac= 20 W for 1
hour in 0.01 M oxalic acid solution, Ar, 18°C). A shadowing effect can be noted on Mg map due to the
position of the detector. Mg X-ray counts on the oxides are lower than bulk Mg explaining the color
intensity differences for this map.
Figure IV-18 SEM observations of Mg surfaces treated at 200 kHz (Pac= 20 W, stirring, Ar, 20°C) for 1
hour in 0.01 M oxalic, sulfamic and nitric acid solutions.

Metallic surface structuration by ultrasound
112
Figure IV-18 compares Mg surfaces treated by 200 kHz ultrasound during 1 h in the presence of other
mineral acids. Both 0.01 M sulfamic and 0.01 M nitric acid solutions allow the formation of
microstructures that can be compared to those previously described in the presence of oxalic acid. These
solutions also allow the formation of craters on their surface which are nevertheless characteristic from
the used mineral acid and different from what observed in oxalic acid. The nature of the counter ions
appears therefore essential for the surface structuring. It is also important to note the presence of
secondary phases on the surface of the various samples thus strengthening the hypothesis related to
Mg(OH)2 precipitation and confirming a mechanism driven by H+ consumption.
IV.2.4 Stirring velocity effect on Mg surface sonication
In our investigation, an in-situ stirring was always applied (except for 20 kHz) to prevent the
accumulation of produced gas bubbles (hydrogen) on the sample surface and favor more homogeneous
sonication effects. Preliminary experiments showed the presence of bubbles during sonication that can
cushion the cavitation effect and dramatically decrease the treatment efficiency. In order to identify the
effect of stirring and its speed during sonication of Mg surfaces, several experiments were carried out.
In Figure IV-19, the evolution of Mg surface dissolution in 0.01 M oxalic acid by only immersion, by
100 rpm stirring, and by sonication at 345 kHz ultrasound together with 100 rpm stirring is compared.
The treatment only lasted for 30 minutes to minimize the impact of H+ consumption.
Figure IV-19 Dissolution of Mg surfaces in 0.01 M oxalic acid solution, Ar, 20°C for 30 minutes by
immersion, stirring (100 rpm and 200 rpm) and sonicated at 345 kHz, Pac= 40 W with stirring (100 rpm).
According to Figure IV-19, it is obvious that Mg dissolution rate can dramatically increase in the
combined presence of ultrasound and stirring. Dissolution rates follow: ultrasound + stirring > stirring >
immersion. In-situ stirring accelerates Mg dissolution rate but is not as effective as ultrasound. By

Metallic surface structuration by ultrasound
113
increasing the stirring velocity from 100 rpm to 200 rpm, Mg dissolution rate can be slightly increased.
The SCL photos of a luminol solution irradiated by 100 kHz ultrasound at different stirring speeds also
confirm a more chaotic distribution of sonochemical activity at 200 rpm than at 100 rpm, which is
believed to accelerate Mg dissolution (Appendix H).
IV.2.5 Evolution of Mg surfaces sonicated at 200 kHz in oxalic acid
In order to understand the mechanism of Mg surface structuration, especially the golf-ball shape crater
formation process as well as the surface wettability evolution, the formation kinetics was decreased by
using a more dilute (0.001 M) oxalic acid solution, a slower stirring speed of 100 rpm, and a longer
sonication duration.
Figure IV-20 Iterative SEM observations of a crater structure formation on Mg surface treated at 100 kHz,
Pac= 20 W for 1.5 hours in 0.001 M oxalic acid solution (Ar, 18°C): a) 10 min; b) 30 min; c) 60 min and d)
90 min.
Iterative SEM pictures taken at the same position on the sample surface after ultrasound treatment
intervals show the crater growth and bulk area structuring (Figure IV-20). In agreement with silent
experiments, the microstructure evolution involves the progressive removal of the native oxide film in
less than 30 min (Figure IV-20.a and b). After 30 min, sonication leads to grain boundary apparition
superimposed with the formation of numerous intercalated tiny pits of about 5 µm forming an undulated
surface typical from plastic deformation already reported in the literature.[235] By contrast to the stirred

Metallic surface structuration by ultrasound
114
surface under silent condition, ultrasonic corrosion is not solely occurring at grain boundaries but
appears homogeneously distributed on the surface as evidenced by the presence of small corrosion pits.
In Figure IV-20.b after 30 min treatment, it is possible to observe the outline of a crater formation with
a much smoother surface in comparison to the rest of the sample. In addition, grain boundaries are far
less defined inside this crater. Further sonication leads to a slight enlargement of the crater diameter as
evidenced by Figure IV-20.c and d. Interestingly, the rest of the surface is poorly evolving suggesting
that this crater is a preferential area of cavitation. This hypothesis is strengthened by the formation of
smaller (5 to 20 µm) cavities surrounding the original crater after 90 minutes sonication (Figure
IV-20.d).
At the same time, crater growth can also be accelerated by pitting corrosion, which is known as an
extremely localized damage that leads to the creation of tinny pits or holes in metals. In fact, it is an
autocatalytic galvanic corrosion process: a local depassivation of a small area (the exposed Mg by
cavitation attack) becomes anodic and the vast areas (oxidation MgO or Mg(OH)2) becomes cathodic.
As presented in Figure IV-21, the electrochemical potential between Mg and MgO/Mg(OH)2
continuously drives the galvanic corrosion, including Mg dissolution at anodes and H2 generation
besides Mg(OH)2 precipitation at cathodes.[236] As a result, during this pitting process, along with
cavitation, small pits are formed, which grow into large craters in the anode locations. While at the vast
areas, the formed Mg(OH)2 precipitation cannot remain on the surface and will dissolve in acid.
Meantime the generated H2 gas bubbles on the vast areas will also play as cavitation nuclei, which can
aid the depassivation and removal of oxidation and precipitation. It is assumed that with the removal of
oxidation layer on the surface, the electrical coupling between anode and cathode will become weak,
thus the pitting corrosion effect will become less important.
Figure IV-21 Scheme of pitting corrosion on Mg surface
Another type of crater formation mechanism can be deduced from Figure IV-22. Obviously, most of
the deformations are located along the grain boundaries and the craters preferentially occur at the triple
junctions. In this case, at beginning the grain boundaries may act as anodes and the grains as cathodes,

Metallic surface structuration by ultrasound
115
thus galvanic corrosion happens which involves the dissolution of Mg from the anodic grain boundaries.
Those primary damages made by electrochemical erosion usually form at the vicinity of initial cracks,
defects and grain boundaries, especially at the triple junctions of grain boundary where electrochemical
potential is generally high.[213, 237] Meantime, those initial deformations can in turn become the nuclei of
cavitation bubbles, hence enhancing the deformation and corrosion of grain boundaries and the local
formation of craters, as in Figure IV-22.
Figure IV-22 SEM observations of crater structures at grain boundaries on Mg surface treated at 345 kHz
(Pac= 40 W, Ar, 20°C) for 1 hour in 0.01 M oxalic acid solution.
In summary, the golf-ball architectures can be clearly attributed to ultrasound and its related acoustic
cavitation phenomenon. The help of the initial damages from galvanic corrosion, besides the
reinforcement of pitting corrosion, can also play a significant role. At the Mg/solution interface, severe
transient conditions are reached during bubble collapse involving, among other phenomena, the
formation of shock waves and micro-jets that have been already pointed out during erosion and
structuration studies.[27, 238] Pure magnesium exhibits a hardness comprised between 44 and 260 MPa.[222]
Micro-jets are likely to be formed in the vicinity of solid surfaces and then directly imping the surface
with a peak pressure estimated at about 225 MPa.[239] Shock waves generated by the spherical collapse

Metallic surface structuration by ultrasound
116
of acoustic bubbles may have an impact pressure ranging from 1 to 10 GPa.[32, 239] These events are
known to dramatically decrease diffusion layers and increase surface erosion, grain fracturation, and
mass transfer. Small plastic deformations observed on the main surface can in consequence result from
a combination of micro-jet impingement and chemical dissolution (such observations were not reported
during Mg surface sonicated in pure water).
According to SEM investigations, the formation of the craters is assumed to result from a localized and
favored dissolution area that can be attributed to heterogeneous nucleation for electrochemical corrosion
and cavitation bubbles. Nucleation for electrochemical reactions always has a high electrochemical
potential such as surface scratches, particles of a second phase emerging on the metal surface,
dislocations and grain boundaries. Nucleation of bubbles partly coincides with that of electrochemical
corrosion, and may indeed be promoted by the presence of weak points (grain boundaries), surface
defects and dissolved gases at the solid/liquid interface.[50, 120, 240] Local differences in surface energy
(hydrophobic/hydrophilic balance) may also play a significant role in such processes as showed for
instance by Belova et al.[186, 241] Mg is a very reactive material which can release H2 gas bubbles due to
local oxidation or dissolution. Such gas generation in combination to ultrasonically-induced surface
defects favors the nucleation of acoustic bubbles that may implode in turn at the vicinity of their
formation sites. This phenomenon has been already noticed during the sonication of extended glass,[32]
aluminum and silicon surfaces.[50, 240] All of these factors drive the initial damages and the following
formation of craters on the sonicated Mg surfaces.
IV.2.6 Sonication of Mg-Zr surfaces
In addition to pure Magnesium, Mg-Zr alloys (0.5 wt.%) were studied as models or surrogates of the
real Mg-Zr cladding material. Same experimental conditions as that of Mg surfaces were selected for
Mg-Zr surfaces except the ultrasonic frequency: 345 kHz. Considering the similar surface structuration
and dissolution rates for 200 and 345 kHz in the sonication of Mg samples, we believed that the
discrepancy caused by different frequencies is insignificant in this range.
IV.2.6.1 Characterization of native Mg-Zr surface
Figure IV-23 Photo and SEM observation of a native Mg-Zr surface.

Metallic surface structuration by ultrasound
117
The native Mg-Zr samples show a homogeneous distribution of initial oriented scratches on their surface
(Figure IV-23) which can be attributed to material fabrication process. The metallic silver color is
indicative of a low oxidation of Mg-Zr surface. The chemical composition of a native Mg-Zr surface
analyzed by EDX is listed in Table IV-7.
Table IV-7 Chemical composition of a native Mg-Zr surface by EDX analysis.
Element Mg Zr O C
wt % 85.3 ± 4.6 - 13.2 ± 2.0 1.5 ± 0.3
In contrast to pure Mg, EDX analysis of Mg-Zr surface exhibits a higher magnesium and lower oxygen
content which is consistent with its apparent lower oxidation. Addition of Zr in Mg alloys can
significantly refine the grain size, and as a result, improve the corrosion resistance. 41 At the same time,
all of the Mg-Zr samples were stored in sealed plastic bags which can also slowdown surface
corrosion.[217] Zirconium element was not detected in these samples most probably because of its very
low amount coupled to the sensitivity of EDX detector.
Figure IV-24 3D reconstruction of a native Mg-Zr surface (insert: image of water contact angle).
Without the existence of a thin oxide layer, surface roughness of Mg-Zr samples mainly presents initial
scratches resulting in a much higher roughness (Ra= 271.2 nm and Rz= 1.31 μm) than what observed for
pure Mg (Ra= 61.1 nm and Rz= 328.4 nm). The contact angle of Mg-Zr surface is small with a value of
81 ± 3° (against 120 ± 4° for pure Mg).
IV.2.6.2 Mg-Zr surface sonication at 345 kHz in oxalic acid
Similarly to pure Mg samples, Mg-Zr surfaces were sonicated (345 kHz, Pac= 40 W) in 0.01 M oxalic
acid. The photo and SEM pictures presented in Figure IV-25 show the formation of an dense
distribution of craters (30 to 40 μm diameter) in these conditions. According to 3D reconstruction
(Figure IV-26), the denser craters on the sonicated Mg-Zr surfaces leads to a much higher roughness
(Ra= 370.9 nm and Rz= 1.79 μm) in comparison to the sonicated pure Mg (Ra= 211.5 nm and Rz= 605.5
nm). According to Cassie–Baxter model, a higher roughness brings a larger contact angle, which is
consistent with the difference observed between the sonicated Mg (about 100°) and Mg-Zr surfaces

Metallic surface structuration by ultrasound
118
(about 110°). Note that in these conditions, the initial scratches present on the surface may act as nuclei
for cavitation and starting sites of electrochemical corrosion, and therefore accelerate the formation of
crater structures on Mg-Zr surfaces.
Figure IV-25 Mg-Zr surface treated at 345 kHz, Pac= 40 W, stirring for 1 hour in 0.01 M oxalic acid
solution (Ar, 20°C): a) photo; b) and c) SEM observations.
Figure IV-26 3D reconstruction of Mg-Zr surface treated at 345 kHz, Pac= 40 W for 1 hour in 0.01 M
oxalic acid solution (Ar, 20°C). The insert is an image of the water contact angle.
In dilute 0.001 M oxalic acid, Mg-Zr surface modification is slow in agreement with the observation
made on pure Mg surface. As shown in Figure IV-27, the measured contact angle rapidly decreases in
the first 10 minutes and then remains at about 45° during approximately 60 minutes. After 75 minutes
sonication, Mg-Zr surface contact angle starts to rise again and reaches 80° after 2 hours of treatment.
This evolution trend again confirms the strong correlation between the formation of craters and surface
wettability.

Metallic surface structuration by ultrasound
119
Figure IV-27 Mg-Zr surfaces treated at 100 kHz, Pac= 20 W, stirring, Ar, 20°C for 2 hours in 0.001 M
oxalic acid (insert: SEM images at 30 minutes and 2 hours).
IV.2.6.3 Secondary phase
Secondary phases with different sizes and shapes are also found to be distributed on Mg-Zr surface after
sonication in agreement with what observed on pure Mg with however different features (Figure IV-28).
Mg/Zr samples allow the observation of big aggregates around poorly dissolved regions (Figure IV-28.a)
while regions with high concentration of craters (Figure IV-28.b) show the presence of spherical
particles having a smaller size (less than 10 μm diameter). The chemical identification of the two SEM
images in Figure IV-28, made by EDX analysis, is listed in Table IV-8.
Figure IV-28 Mg-Zr surface treated at 345 kHz, Pac= 40 W for 1 hour in 0.01 M oxalic acid solution, Ar,
20°C: a) zone with secondary phase; b) zone without secondary phase.
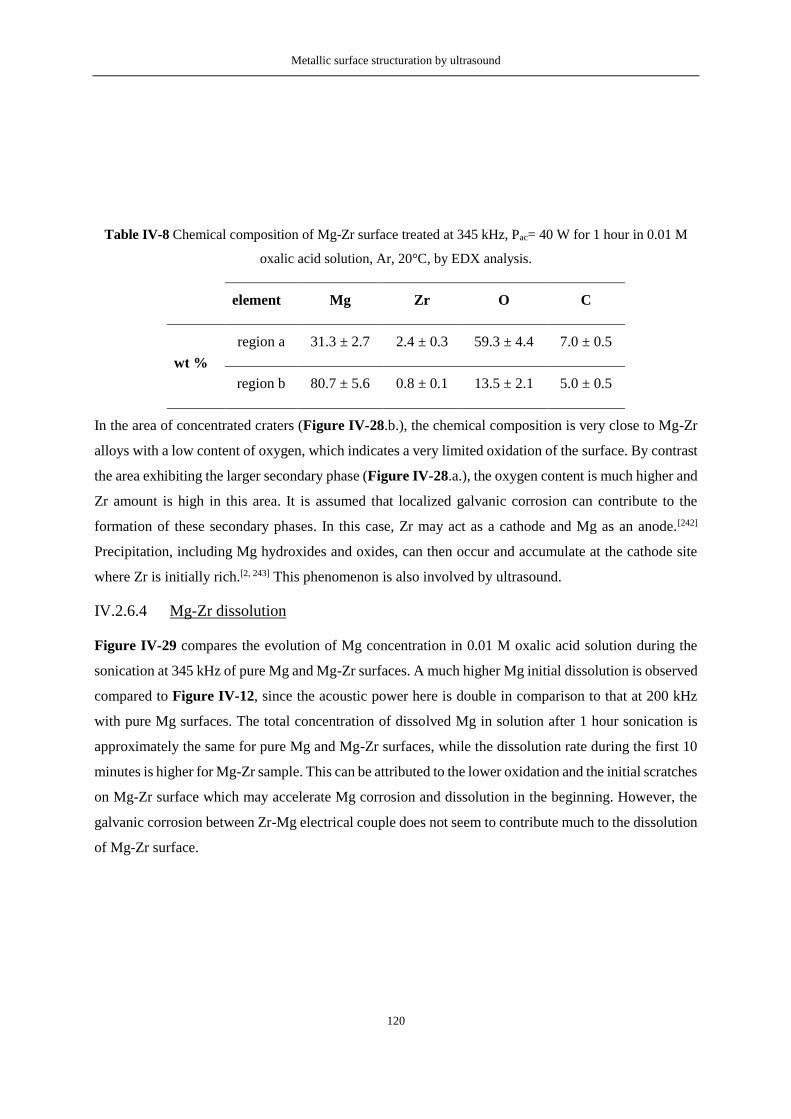
Metallic surface structuration by ultrasound
120
Table IV-8 Chemical composition of Mg-Zr surface treated at 345 kHz, Pac= 40 W for 1 hour in 0.01 M
oxalic acid solution, Ar, 20°C, by EDX analysis.
element Mg Zr O C
wt %
region a 31.3 ± 2.7 2.4 ± 0.3 59.3 ± 4.4 7.0 ± 0.5
region b 80.7 ± 5.6 0.8 ± 0.1 13.5 ± 2.1 5.0 ± 0.5
In the area of concentrated craters (Figure IV-28.b.), the chemical composition is very close to Mg-Zr
alloys with a low content of oxygen, which indicates a very limited oxidation of the surface. By contrast
the area exhibiting the larger secondary phase (Figure IV-28.a.), the oxygen content is much higher and
Zr amount is high in this area. It is assumed that localized galvanic corrosion can contribute to the
formation of these secondary phases. In this case, Zr may act as a cathode and Mg as an anode.[242]
Precipitation, including Mg hydroxides and oxides, can then occur and accumulate at the cathode site
where Zr is initially rich.[2, 243] This phenomenon is also involved by ultrasound.
IV.2.6.4 Mg-Zr dissolution
Figure IV-29 compares the evolution of Mg concentration in 0.01 M oxalic acid solution during the
sonication at 345 kHz of pure Mg and Mg-Zr surfaces. A much higher Mg initial dissolution is observed
compared to Figure IV-12, since the acoustic power here is double in comparison to that at 200 kHz
with pure Mg surfaces. The total concentration of dissolved Mg in solution after 1 hour sonication is
approximately the same for pure Mg and Mg-Zr surfaces, while the dissolution rate during the first 10
minutes is higher for Mg-Zr sample. This can be attributed to the lower oxidation and the initial scratches
on Mg-Zr surface which may accelerate Mg corrosion and dissolution in the beginning. However, the
galvanic corrosion between Zr-Mg electrical couple does not seem to contribute much to the dissolution
of Mg-Zr surface.

Metallic surface structuration by ultrasound
121
Figure IV-29 Dissolution of pure Mg and Mg-Zr surfaces treated at 345 kHz, Pac= 40 W, stirring, Ar, 20°C
for 1 hour in 0.01 M oxalic acid solution.
IV.3 Conclusion
This chapter clearly demonstrates that ultrasound can significantly modify an extended surface and
participate, in combination to an appropriate solute, in the formation of an original and unprecedented
microstructure. Golf-ball shape microstructures are observed on pure Mg surfaces after sonication at
100 to 345 kHz in dilute oxalic acid, and big holes and undulations channels are present at 20 kHz, while
no specific microstructure but a flat surface with grain boundaries appears on surface treated at 1 MHz.
The accumulation of Mg2+ in solution combined to the generation of H2 gas during treatment confirm
the ultrasound-controlled dissolution of metallic Mg.
An original approach resulting in the 3D reconstruction of sonicated surfaces allows to investigate the
formation mechanism of these extended surfaces. The formation of microstructures is convincingly
correlated to the chosen acoustic frequency, the proton activity and the nature of the counter ions. Most
probably, ultrasound allows the generation of surface defects which are then used as nucleation sites
that favor the crater formation. The craters may increase in diameter and depth with sonication time with
heterogeneous nucleation. In addition, pitting corrosion is assumed to be involved in the growth of
craters. H2 gas release in the localized area may also be used as nucleation for cavitation. The sonicated
surface wettability is also found to be strongly correlated to the formation of craters, and a high
hydrophobicity is expected with a surface covered by a homogeneously formed craters.
Dissolution progress is found to be accompanied by the formation of new spherical micrometric
structures formed on the Mg surface and attributed to Mg(OH)2. The formation of these secondary

Metallic surface structuration by ultrasound
122
phases is most probably related to local alkalization effect induced by Mg dissolution and is found to be
lowered under ultrasound in comparison to conventional dissolution procedure.
Such observations open new routes of investigation for other alloy and metal-based materials and new
alternatives of potential interest for applications in many fields including industry, medicine, and
nanotechnology. For example, this golf-ball shape structure can be of potential interest for biomedical
materials where wettability properties are required to improve the adhesion of surface coatings.
The results observed with Mg-Zr surfaces are very close to that of pure Mg, which indicates that both
pure Mg and Mg-Zr alloy can be used probably as good surrogates for reals UNGG claddings. The
ultrasonic decontamination effects on the contaminated pure Mg, Mg-Zr alloy and UNGG cladding
fragments are investigated and discussed in the next chapter.
In addition, at the frequency of 345 kHz, an inhomogeneous erosion distribution is observed on the
sonicated Mg surfaces in repeated experiments. The pattern of the treated surfaces presents a series of
concentric pentagons where the crater structures are concentrated in certain areas: either on the corners
or on the side of pentagons (see Figure IV-30). Such cymatical star shape is very similar to the
observations of the standing gravity waves on silicon oil surface by vertically vibrating the container at
a very low frequency of 8 Hz.[244] It was found that this specific star shape is dependent on the vibrational
amplitude and frequency. It will be of great interest for future study to understand the formation
mechanism of this structure by using experimental probes and simulation methods, especially in the case
of high frequency ultrasound.
Figure IV-30 SEM observations of Mg surface treated for 1 hour in 0.01 M oxalic acid solution, (Ar/(20
vol.%)O2, 20°C, stirring 100 rpm) at 345 kHz Pac= 40 W.

Metallic surface decontamination by ultrasound
123
Chapter V. Metallic surface
decontamination by ultrasound

124

Metallic surface decontamination by ultrasound
125
V.1 Introduction
This chapter is dedicated to the application of power ultrasound at 345 kHz in the decontamination of
metal surfaces contaminated by uranium. The treatment of two different types of contaminated materials
is discussed: i) Mg-based surfaces, including pure Mg, Mg-Zr alloy surrogates and genius but non-
irradiated UNGG cladding fragments; ii) stainless steel, which is widely used in nuclear industry, and
is here studied to evaluate ultrasonic application in another material field. Uranium contaminants on the
as-prepared samples surfaces are characterized by XRD, ATR-FTIR and Raman spectrometry. For Mg-
based material, only dilute oxalic acid is used, and the decontamination effect on a complex geometry
Mg sample is compared with disc samples. Stainless steel surfaces are treated in both dilute oxalic acid
and strong nitric acid. The decontamination effect is determined by the evolution of surface morphology
(photos and SEM images) and α radioactivity.
V.2 Mg based material surfaces decontamination by
ultrasound
V.2.1 Characterization of UNGG cladding material and the contaminates
on Mg based surfaces
V.2.1.1 UNGG cladding material
Figure V-1.a shows both the external fin side and internal graphite side of a non-irradiated UNGG
cladding tube fragment that was used during this study. SEM pictures related to the outer side
characterization of the cladding tube is present in Figure V-1.b. Two distinct grey levels can be noticed
on these figures. EDX analyses carried out in the bright zone evidence a local enrichment of Zr up to ~3
wt.% while approximately 0.5 wt.% are measured in the surrounding dark area which is consistent with
the literature.[162] The bright zones present elongated shapes that can be attributed to the precipitation of
metastable Mg-Zr solid solutions during the controlled annealing in fabrication process.[245] Such
structure is believed to improve the ductility of Mg alloys by reducing the nucleation, growth and
coalescence of cracks and voids at grain boundaries.[246, 247] A similar morphology was observed on
Magnox ZR55 alloys (0.45 - 0.65 wt.% Zr) and aluminum alloys.[148, 248] In general, about 35 wt.%
oxygen and 15 wt.% carbon were detected on the Mg substrates possibly indicating a complex oxidation
layer composed of MgO, Mg(OH)2 and MgCO3 which is in agreement with the previous EDX analysis
of the oxidation layer on pure Mg. The presence of carbon may also come from the exfoliated graphite
particles observed on the internal side of the cladding.
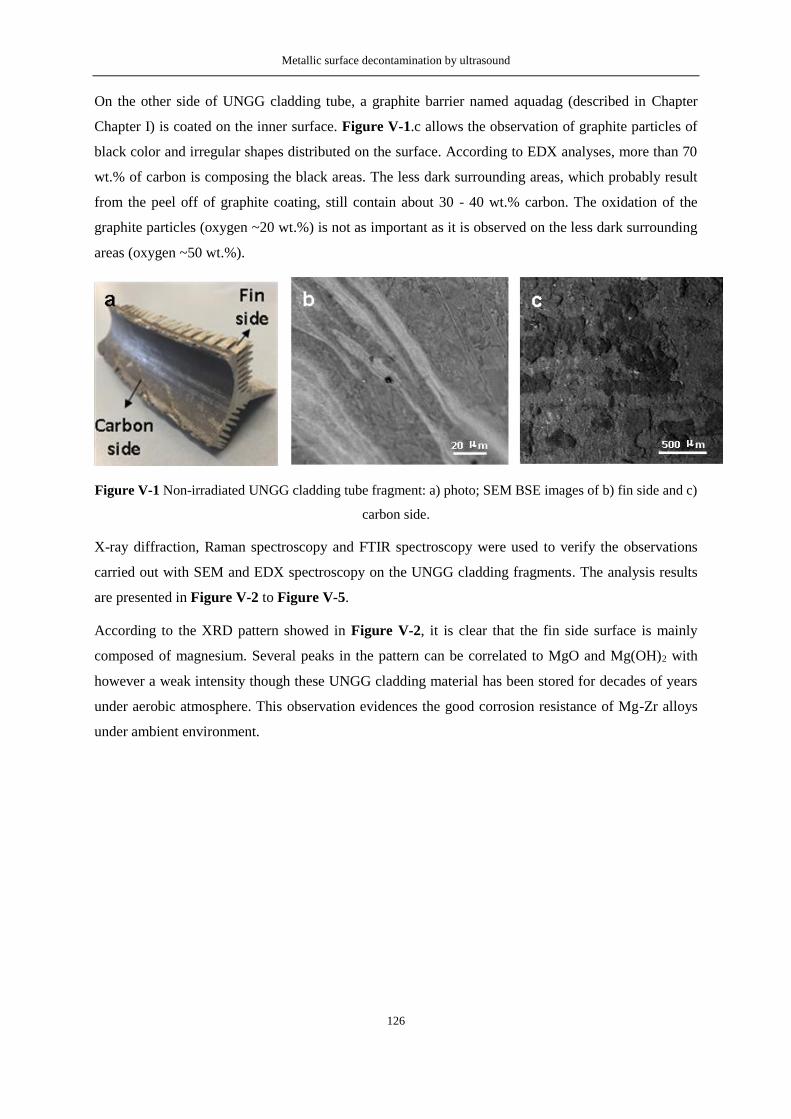
Metallic surface decontamination by ultrasound
126
On the other side of UNGG cladding tube, a graphite barrier named aquadag (described in Chapter
Chapter I) is coated on the inner surface. Figure V-1.c allows the observation of graphite particles of
black color and irregular shapes distributed on the surface. According to EDX analyses, more than 70
wt.% of carbon is composing the black areas. The less dark surrounding areas, which probably result
from the peel off of graphite coating, still contain about 30 - 40 wt.% carbon. The oxidation of the
graphite particles (oxygen ~20 wt.%) is not as important as it is observed on the less dark surrounding
areas (oxygen ~50 wt.%).
Figure V-1 Non-irradiated UNGG cladding tube fragment: a) photo; SEM BSE images of b) fin side and c)
carbon side.
X-ray diffraction, Raman spectroscopy and FTIR spectroscopy were used to verify the observations
carried out with SEM and EDX spectroscopy on the UNGG cladding fragments. The analysis results
are presented in Figure V-2 to Figure V-5.
According to the XRD pattern showed in Figure V-2, it is clear that the fin side surface is mainly
composed of magnesium. Several peaks in the pattern can be correlated to MgO and Mg(OH)2 with
however a weak intensity though these UNGG cladding material has been stored for decades of years
under aerobic atmosphere. This observation evidences the good corrosion resistance of Mg-Zr alloys
under ambient environment.

Metallic surface decontamination by ultrasound
127
Figure V-2 X-ray diffraction pattern of the outer side (fin side) of a non-irradiated UNGG cladding tube
fragment, in comparison with standard patterns of Mg JCPDS 00-035-0821, MgO JCPDS 01-080-4185 and
Mg(OH)2 JCPDS 01-078-3952).
XRD investigations shown in Figure V-3 confirm that the majority of the inner part of the cladding
material is covered by carbon and magnesium hydroxides. Most probably, magnesium observation
results from the partial stripping of the graphite coating. The hydroxylation of UNGG cladding carbon
side is found to be more significant than what observed on the fin side which may be due to the galvanic
corrosion between electrical couples of graphite and exposed substrate of Mg on the internal surface.
Figure V-3 X-ray diffraction pattern of the inner side (carbon side) of a non-irradiated UNGG cladding
tube fragment, in comparison with standard patterns of Mg JCPDS 01-089-5003, carbon JCPDS 01-075-
0444 and Mg(OH)2 JCPDS 01-078-3952).

Metallic surface decontamination by ultrasound
128
The infrared spectra showed in Figure V-4 are found to be in agreement with XRD analyses. On the fin
side surface, both hydroxyl and organic groups (C-O, C=O and C-O-C), besides Mg-O and Mg-O-C
bands exist; while for carbon side, the hydroxyl and Mg-O bands are not observed. Raman spectra
presented in Figure V-5 are in agreement with the observations noticed on XRD patterns and infrared
spectra: on the UNGG cladding external fin surface, chemical compositions of metal magnesium and its
hydroxides are detected; while only graphite bands are identified by Raman spectrometer on the carbon
side (bands information in Appendix I).
Figure V-4 FTIR spectra of a non-irradiated UNGG cladding tube fragment (fin side and carbon side), and
non-contaminated areas of as-prepared pure Mg and Mg-Zr samples
Figure V-5 Raman spectra of a non-irradiated UNGG cladding tube fragment (fin side and carbon side),
and non-contaminated area of as-prepared pure Mg and Mg-Zr samples.

Metallic surface decontamination by ultrasound
129
To be noted here, the vibration band situated at 1580 cm-1 refers to crystalline graphite (G), and the
vibration band at 1350 cm-1 to crystalline defects or disorder (D) in graphite structure. The ratio between
D and G band intensities indicates the degree of disorder in graphite crystals and is found to be inversely
proportional to the average graphite crystalline size La:[249]
L𝑎 = 2.4 × 10⁻¹⁰ × 𝜆𝑙𝑎𝑠𝑒𝑟
4 × 𝐼𝐺 𝐼𝐷⁄ (V-1)
Where λ𝑙𝑎𝑠𝑒𝑟 is the incident laser beam wavelength, 𝐼𝐺 and 𝐼𝐷are the intensities of D and G bands. With
values of λ𝑙𝑎𝑠𝑒𝑟 = 532 nm 𝑎𝑛𝑑 𝐼𝐺 𝐼𝐷⁄ = 0.754, the crystal size of the graphite particles coated on the
UNGG cladding internal side can be calculated to be approximately 14.5 nm.
Generally, UNGG cladding fragment shows the chemical compositions of Mg matrix and an oxidations
(MgO, Mg(OH)2 and MgCO3) on its external fin side, which is similar to that of the pure Mg and Mg-
Zr alloy samples. The internal side is mainly composed of graphite, exposed Mg substrate and the
produced oxidation (Mg(OH)2 and MgCO3).
V.2.1.2 Contaminants on Mg based surfaces and UNGG cladding material
Figure V-6 illustrates the morphology of Mg-Zr sample used as an example which was contaminated
according to the procedure described in materials and methods. Uranyl contamination is present as large
exfoliated and polydispersed micrometric particles (from 20 µm to 500 µm) adhering to the metallic
surface. EDX analyses show that these contaminates are mainly composed of magnesium (~35 wt.%),
oxygen (~25 wt.%) and uranium (~40 wt.%). It is supposed that a complex non-stoichiometric MgxUyOz
contamination is generated on the prepared surfaces in agreement with the literature.[250]
Figure V-6 Contaminated Mg-Zr surface prepared by calcination at 500°C under Ar atmosphere of Mg-Zr
surface on which 0.1 M UO2(NO3)2 were homogenously deposited. The right side of the figure shows a
SEM image of the contamination.
Considering the sample preparation temperature at 500°C, the decomposition reaction of UO2(NO3)2
may be described by:[251]

Metallic surface decontamination by ultrasound
130
𝑈𝑂2(𝑁𝑂3)2500 °𝐶→ 𝑈𝑂3(𝛾 + 𝛽) + 2𝑁𝑂2 + 1 2⁄ 𝑂2 (V-2)
Both β and γ structural forms of UO3 can exist as decomposition products of UO2(NO3)2. However, UO3
is not stable at high temperature; its transformation into U3O8 was reported to begin from 400°C, but
was found to be not complete until the temperature approaches about 650°C.[252] Reaction (V-3) shows
the conversion reaction from UO3 into U3O8:
3𝑈𝑂3400−650 °𝐶→ 𝑈3𝑂8 + 1 2⁄ 𝑂2 (V-3)
As a result, in our sample preparation conditions, both UO3 and U3O8 should exist in the contaminated
areas. According to the photos of U3O8 and UO3 powders illustrated in Figure V-7, U3O8 has an olive
green to black color, while UO3 displays an orange (β-UO3) or yellow (γ-UO3) color. Some of our
contaminated samples, such as the Mg-Zr surface presented in Figure V-7.d, show both the black and
orange colors, indicating the presence of both U3O8 and UO3 oxidation products after calcination at
500°C in Ar flow for 2 hours. In addition, the electropositive Mg may also reduce U6+ into U4+ or U3+
and leads to the formation of the non-stoichiometric MgxUyOz compositions after calcination.[253] It is
interesting to note that not all the sample surfaces present both colors (see for example the Mg-Zr sample
in Figure V-6) which can be attributed to an inhomogeneous heating in the tubular oven.
Figure V-7 Photos of: a) U3O8 produced by heating ammonium diuranate;[254] b) β-UO3 powder; c) γ-UO3
powder[255] and d) as-prepared contaminated Mg-Zr surface (0.1 M UO2(NO3)2).
To verify the presence of UO3, U3O8 and non-stoichiometric MgxUyOz on the contaminated surfaces, X-
ray diffraction, FTIR and Raman spectroscopies were applied. To be noticed, no significant difference
between the contaminated UNGG cladding fin side, Mg and Mg-Zr alloys surfaces is observed in the
XRD patterns, so as their Raman and infrared spectra. So here only the XRD result of contaminated
UNGG cladding fin side and the Raman and infrared spectra of contaminated Mg-Zr surfaces are shown
and discussed.
Figure V-8 shows the X-ray diffraction pattern observed on a UNGG cladding fin side surface
contaminated with 0.1 M UO2(NO3)2. The sharp diffraction peaks are attributed to Mg matrix of the
non-contaminated area. Several broad peaks can also be observed on the XRD pattern and can refer to

Metallic surface decontamination by ultrasound
131
MgU3O10 and UO3. U3O8 standard pattern is not present here, since it is almost coincident with the UO3
pattern (see Figure V-23).
Figure V-8 X-ray diffraction pattern of the fin side of a UNGG cladding tube fragment contaminated with
0.1 M UO2(NO3)2 in comparison with standard patterns of Mg (JCPDS 00-035-0821), MgU3O10 (JCPDS
00-034-0985) and UO3 (JCPDS 00-015-0201).
In fact, XRD is not that sensitive for detecting the phases of UO system and for determining the ratio of
U/O.[256] To better identify the black and orange contaminations on surfaces, different spots on surfaces
were analyzed by FTIR and Raman spectroscopies (Figure V-9 and Figure V-10).
Figure V-9 shows the FTIR spectra of a contaminated Mg-Zr surface; the low wavenumber region of
the spectra (< 2000 cm-1) for the two different color spots on surface consists of several peaks assigned
to O-H, C-O, C-O-C, C=O, Mg-O, Mg-O-C, UO3 and U3O8. No vibration band characteristic from UO3
is observed in the black contaminated spots, while both UO3 and U3O8 bands are noted in the orange
spots (bands information in Appendix I).
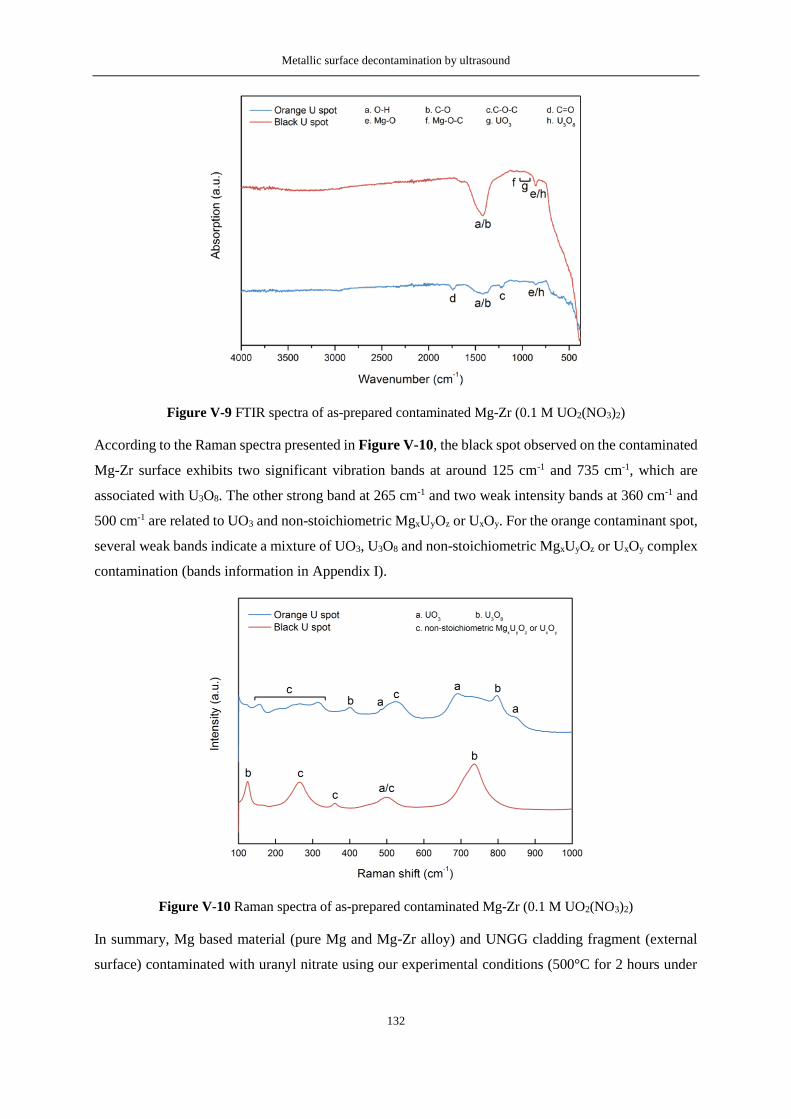
Metallic surface decontamination by ultrasound
132
Figure V-9 FTIR spectra of as-prepared contaminated Mg-Zr (0.1 M UO2(NO3)2)
According to the Raman spectra presented in Figure V-10, the black spot observed on the contaminated
Mg-Zr surface exhibits two significant vibration bands at around 125 cm-1 and 735 cm-1, which are
associated with U3O8. The other strong band at 265 cm-1 and two weak intensity bands at 360 cm-1 and
500 cm-1 are related to UO3 and non-stoichiometric MgxUyOz or UxOy. For the orange contaminant spot,
several weak bands indicate a mixture of UO3, U3O8 and non-stoichiometric MgxUyOz or UxOy complex
contamination (bands information in Appendix I).
Figure V-10 Raman spectra of as-prepared contaminated Mg-Zr (0.1 M UO2(NO3)2)
In summary, Mg based material (pure Mg and Mg-Zr alloy) and UNGG cladding fragment (external
surface) contaminated with uranyl nitrate using our experimental conditions (500°C for 2 hours under

Metallic surface decontamination by ultrasound
133
Ar atmosphere) allows the observation of a mixture of UO3, U3O8 and non-stoichiometric MgxUyOz or
UxOy.
V.2.2 Ultrasonic decontamination results
V.2.2.1 Decontamination of Mg-based surfaces and UNGG cladding material
V.2.2.1.1 Decontamination of Mg-Zr surface
Both Mg and Mg-Zr surfaces contaminated with uranyl nitrate were sonicated by 345 kHz ultrasound
in 0.01 M oxalic acid solution with an in-situ stirring of 100 rpm. A decontamination procedure was
also applied as reference in similar conditions but without ultrasound. The decontamination kinetics of
Mg-Zr surfaces was characterized with α-spectroscopy (an example of the measured α spectra in
Appendix J) and SEM microscopy after 90 minutes of treatment. The results obtained under ultrasound
and silent conditions are illustrated in Figure V-11 and 错误!未找到引用源。.
From the pictures given in Figure V-11, some residual contamination areas (dark zones) are still visible
on the Mg-Zr surface after treatment under silent conditions while ultrasonic treatment visually allows
the complete decontamination of the surface. In agreement with the preliminary studies reported for
non-contaminated Mg-Zr samples in this manuscript, the oxidation layer of the material is completely
removed under sonication. We can also clearly notice the presence of “golf ball” shape craters in
agreement with previous observations (with similar shape and size). Under stirring only, it is interesting
to note that some residual contaminates are still observed for some areas in addition to the initial
oxidation. According to EDX analyses, the ultrasonic decontamination leads to less than 2 wt.% uranium
left at the initial contaminated spot after 90 minutes treatment, which is much more efficient than that
observed under only stirring in the same conditions (about 35 wt.% uranium residue).

Metallic surface decontamination by ultrasound
134
Figure V-11 Photos and SEM images of Mg-Zr surfaces contaminated with U (0.1 M UO2(NO3)2)
decontaminated under silent conditions (a and b) and by 345 kHz ultrasound, Pac= 40 W (c and d) in 0.01
M oxalic acid, Ar, stirring 100 rpm, 20°C, 90 min
According to Figure V-12, Mg-Zr surface radiation level decreases linearly under silent conditions with
a final DF equals to 3.2. By contrast, ultrasonic decontamination leads to a rapid radioactivity drop
within the first 20 minutes with a maximum DF equals to 133 which is 40 times higher than what
observed under silent conditions. After 20 min of sonication, a slow increase of the radioactivity can be
noticed reaching 5.6 Bq after 90 minutes sonication. The rapid decrease of the surface radioactivity
within the first 20 minutes can be attributed to the strong diffusion and mass transfer driven by acoustic
cavitation phenomenon at the interface between the contaminated surface and the acidic solution
(microjets, shockwaves and microstreaming). Such ultrasonic process is known to significantly
accelerate the chemical reaction rates and mechanical damages on the contaminated surfaces, hence
improving the decontamination efficiency. Previous decontamination tests performed at Beloyarsk
nuclear power plant allowed to observe comparable decontamination effect under ultrasound: the
radioactive metal waste with an initial radioactivity of over 4000 Bq.g-1 was decontaminated by
ultrasonic operation in less than 3 hours to achieve a remarkable high DF of over 17,000. Without
ultrasound, more than 110 hours were required to reach a 10 times lower DF of 1700.[169]

Metallic surface decontamination by ultrasound
135
Figure V-12 α-radioactivity evolution of Mg-Zr surfaces contaminated with U (0.1 M UO2(NO3)2)
decontaminated by 345 kHz ultrasound, Pac= 40 W (blue) and under silent conditions (red) in 0.01 M oxalic
acid, Ar, stirring 100 rpm, 20°C, 90 min
V.2.2.1.2 Decontamination of Mg ribbon having a complex geometry
In order to simulate a real industrial surface exhibiting a complex shape and structure, an Mg ribbon
was contaminated with uranyl nitrate and then rolled into an approximate cylinder shape with the
contamination on the internal surface as showed in Figure V-13. Ultrasonic decontamination was
applied for 90 minutes in 0.01 M oxalic acid by 345 kHz ultrasound with an in-situ stirring. In Figure
V-13, the ultrasound-assisted decontamination of the internal side of the Mg ribbon is characterized by
a metallic bright surface without any visual trace of contaminate or residual oxidation layer. SEM image
in Figure V- reveals the formation of “golf ball” shape craters on the internal surface of the bent ribbon,
which have already been noticed on disc samples, and the craters are more developed at the edge of the
Mg ribbon, which indicates that the complex geometry does not prevent cavitation bubble to access to
the inner side of the Mg ribbon and to collapse in the vicinity of the surface.

Metallic surface decontamination by ultrasound
136
Figure V-13 Photos of a contaminated Mg ribbon (0.1 M UO2(NO3)2) wound in a complex geometry
before and after 345 kHz sonication (Pac= 40 W) during 90 min in 0.01 M oxalic acid, Ar, stirring 100 rpm,
20°C.
According to the corresponding surface α-activity evolution presented in Figure V-14, surface activity
follows a fast reduction within the first 40 min of sonication before increasing slightly during the rest of
the treatment, in agreement with what previously observed on Mg-Zr surfaces. Comparing to disc
samples, the decontamination of a complex and geometrical sample takes more time to be achieved. In
addition, the lowest radioactivity level characterized by a maximum DF value of 51 in these conditions
is less important than what observed on disc samples. These discrepancies can be related to active bubble
diffusion difficulty in the complex sample and to a larger sample surface to be treated. However, these
observations strengthen the potential of the sonochemical decontamination of industrial metallic
samples in comparison to conventional approaches.
Figure V-14 α-radioactivity evolution of the inner side of a contaminated Mg ribbon (0.1 M UO2(NO3)2)
wound in a complex geometry sonicated during 90 min at 345 kHz in 0.01 M oxalic acid, Ar, stirring 100
rpm, 20°C, Pac= 40 W (insert: SEM image after treatment).

Metallic surface decontamination by ultrasound
137
V.2.2.1.3 Decontamination of UNGG cladding material - fin side
The decontamination of the external fin side of a UNGG cladding fragment was implemented in the
same conditions. From the pictures in Figure V-15, the contaminants appears to have been completely
removed and the sample surface is strongly eroded after 90 minutes sonication in oxalic acid. A similar
trend of decontamination evolution can indeed be observed in Figure V-16. The α-activity of the surface
follows a rapid decrease reaching a value of 0.7 Bq after 20 min of sonication. A very slow increase of
the activity, reaching a final value of 1.2 Bq after 90 min sonication, can be noticed. After the experiment,
the sonicated surface appears very rough without any visual trace of contamination or residual oxidation
layer. The SEM image displays an intense concentration of “golf ball” shape craters similarly to what
observed on the surrogates and non-contaminated UNGG fin samples (with similar shape and size).
EDX analyses confirmed the decontamination effect by measuring a uranium content lower than 2 wt.%
(instead of over 40 % before sonication).
To be noted that for UNGG cladding fin sample, the DF value (DF= 82) is relatively lower than that of
Mg-Zr disc sample decontamination (DF= 132.8). This may be caused by the sensitivity of the α-
spectrometer, which cannot give a precise measurement of surface radioactivity when it is lower than 1
Bq. As a result, the DF value becomes smaller when the initial radiation level is lower.
Figure V-15 Photos of an as-prepared contaminated UNGG cladding fin side sample (0.1 M UO2(NO3)2)
before and after 345 kHz sonication (Pac= 40 W) during 90 min in 0.01 M oxalic acid, Ar, stirring 100 rpm,
20°C.

Metallic surface decontamination by ultrasound
138
Figure V-16 α-radioactivity evolution of contaminated UNGG cladding fin side sample (0.1 M
UO2(NO3)2) decontaminated by 345 kHz (Pac= 40 W) during 90 min in 0.01 M oxalic acid, Ar, stirring 100
rpm, 20°C (insert: SEM image after treatment)
V.2.2.1.4 Decontamination of UNGG cladding material - carbon side
Ultrasound treatment of the non-irradiated graphite coating situated on the inner side of UNGG cladding
fragment was carried out in similar conditions. Since no radioactive contaminates was deposited on the
carbon side, sonication effect was demonstrated by comparison of photos (Figure V-17), SEM images
(Figure V-18) and EDX analyses before and after treatment.
Figure V-17 Photos of the inner side of a UNGG cladding fragment showing the presence of carbon a)
before and b) after 1 hour treatment in 0.01 M oxalic acid (345 kHz ultrasound, Ar, stirring 100 rpm, 20°C,
Pac= 40 W (note: both samples are different).
In these conditions, effective removal of the carbon layer can be clearly observed by naked eye as
illustrated in Figure V-17. The 1 hour sonicated (345 kHz) sample shows a clean, bright and metallic
surface with only a small amount of residual graphite coating. According to EDX analyses performed
on areas deprived of graphite residue, the carbon composition decreases as low as 2 wt.% in comparison
to the initial state. As shown on Figure V-18, it is interesting to notice an initially regular distribution

Metallic surface decontamination by ultrasound
139
of parallel grooves on the graphite coated surface. Most probably, these grooves result from the
manufacture of the claddings, they probably act as nucleation sites for acoustic cavitation which lead to
the formation of a parallel distribution of craters on the sonicated surface. Note that the formation of
these craters is once again in agreement with the previous observations made on cladding metallic
surrogates (with similar shape and size).
Figure V-18 SEM observations of the inner carbon side of a UNGG cladding fragment a) before and b)
after 1 h sonication (345 kHz) in 0.01 M oxalic acid (Ar, stirring 100 rpm, 20°C, Pac= 40 W).
V.2.2.2 Secondary phase on decontaminated samples
In agreement with the previous decontamination experiments carried out on Mg-based materials and
UNGG cladding fragments, a large amount of secondary phases is generated with the treatment of the
different surfaces. As previously described, these secondary phases can be associated to Mg(OH)2. EDX
analyses illustrated on Figure V-19 nevertheless allowed to measure locally high contents of uranium
(10 to 20 wt.%) associated with these secondary phases while the surrounding area does not show
significant amount of uranium (≤ 2 wt.%).

Metallic surface decontamination by ultrasound
140
Figure V-19 SEM-EDX analyses of the secondary phases observed on the fin side of a contaminated
UNGG cladding fragment (0.1 M UO2(NO3)2) sonicated at 345 kHz during 90 min in 0.01 M oxalic acid
(Ar, stirring 100 rpm, 20°C, Pac= 40 W).
To confirm that this local uranium enrichment does not result from the initial contamination of the
surface (residual and non-removed contamination), a non-contaminated Mg surface was sonicated by
345 kHz ultrasound for 30 minutes in 0.01 M oxalic acid before 70 μL of a 0.1 M uranyl nitrate solution
was added. Further 30 minutes sonication of this system allowed to observe locally more than 15 wt.%
of uranium on the formed secondary phases while the areas without secondary phases generally showed
a uranium with 3 wt % in general. Infrared spectra shown in Figure V-20 confirm the existence of
O=U=O bands on the treated Mg surface. As a result, uranium present some affinities with Mg and is
preferentially adsorbed in the area presenting Mg(OH)2 secondary phases.

Metallic surface decontamination by ultrasound
141
Figure V-20 ATR-FTIR spectra of contaminated Mg surfaces (0.1 M UO2(NO3)2) sonicated at 345 kHz
during 1 hour in 0.01 M oxalic acid (Ar, stirring 100 rpm, 20°C, Pac= 40 W).
Brucite structure can be described as layers of Mg(OH)2 consisting in double-planes of OH groups and
a plane of Mg2+ sandwiched in between (Figure V-21).[257] Due to a weak interlayer force, the space
between Mg(OH)2 layers is quite large, leading to a high sorption property of brucite.[258] Previous study
published by Pushkaryova et al. proved that brucite can efficiently adsorb metal ions including Cu, Zn,
Cd, Co, etc.[259]
Figure V-21 Schematic representation of metal ions Mn+ adsorbed in Brucite structure.[257]

Metallic surface decontamination by ultrasound
142
Previous study of Cao et al. demonstrated that nano-Mg(OH)2 has an excellent adsorption ability for
uranyl in aqueous solutions.[260, 261] Besides, Bochkarev and Pushkareva found that an ultrasonic
treatment at low frequency (22 to 35 kHz) can significantly accelerate the diffusion process of metal
ions towards the sorbent surface, hence improving the brucite sorption rate of metal ions like copper and
nickel.[262, 263]
Therefore, a hypothesis can be proposed concerning the ultrasound decontamination process described
in this work. Two principal parameters dominate the surface radioactivity: i) the ultrasound-controlled
dissolution of the Mg surface, which efficiently removes the uranium contamination on surfaces; and ii)
the formation of Mg(OH)2 which acts as adsorbents for uranyl ions dissolved in solution. During the
early stage of ultrasound decontamination (within 20 or 40 minutes), the former parameter is dominant
and a rapid reduction of the surface α-activity is observed as already presented in 错误!未找到引用
源。, Figure V- and Figure V-. As the decontamination process continues, the dissolution effect
becomes less efficient and the concomitant accumulation of secondary phases at the metallic surface
allows the adsorption of uranium from the solution. Note that this process may be reinforced with the
consumption of protons in solution and the subsequent solution pH increase which involves the
precipitation of more secondary phases on sonicated surface. The adsorption of uranium by brucite may
also be accelerated by ultrasound in this case.
V.3 Stainless steel surfaces decontamination by
ultrasound
V.3.1 Characterization of stainless steel and the contaminates on stainless
steel surfaces
As present in Figure V-22, the contaminated stainless steel surface prepared by calcination at 500°C
under Ar atmosphere exhibits a dark blue-violet color on the substrate material (the tempering color of
a thin oxidation layer on the calcined stainless steel surface),[264] while the uranium areas show an olive-
green color (close to the color of U3O8). SEM image show some zones with adhering contaminants
having a porous structure everywhere.
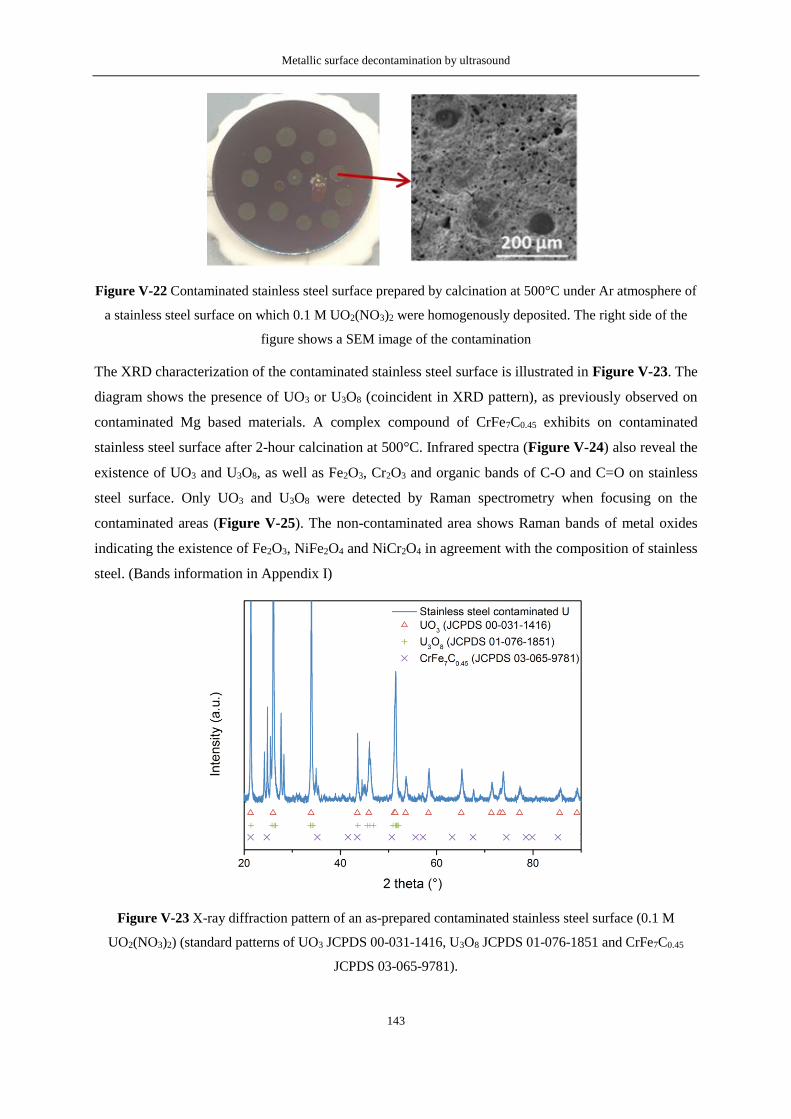
Metallic surface decontamination by ultrasound
143
Figure V-22 Contaminated stainless steel surface prepared by calcination at 500°C under Ar atmosphere of
a stainless steel surface on which 0.1 M UO2(NO3)2 were homogenously deposited. The right side of the
figure shows a SEM image of the contamination
The XRD characterization of the contaminated stainless steel surface is illustrated in Figure V-23. The
diagram shows the presence of UO3 or U3O8 (coincident in XRD pattern), as previously observed on
contaminated Mg based materials. A complex compound of CrFe7C0.45 exhibits on contaminated
stainless steel surface after 2-hour calcination at 500°C. Infrared spectra (Figure V-24) also reveal the
existence of UO3 and U3O8, as well as Fe2O3, Cr2O3 and organic bands of C-O and C=O on stainless
steel surface. Only UO3 and U3O8 were detected by Raman spectrometry when focusing on the
contaminated areas (Figure V-25). The non-contaminated area shows Raman bands of metal oxides
indicating the existence of Fe2O3, NiFe2O4 and NiCr2O4 in agreement with the composition of stainless
steel. (Bands information in Appendix I)
Figure V-23 X-ray diffraction pattern of an as-prepared contaminated stainless steel surface (0.1 M
UO2(NO3)2) (standard patterns of UO3 JCPDS 00-031-1416, U3O8 JCPDS 01-076-1851 and CrFe7C0.45
JCPDS 03-065-9781).

Metallic surface decontamination by ultrasound
144
Figure V-24 FTIR spectra of as-prepared contaminated stainless steel surface (0.1 M UO2(NO3)2)
Figure V-25 Raman spectra of as-prepared contaminated stainless steel surface (0.1 M UO2(NO3)2)
V.3.2 Ultrasonic decontamination results
Similar experimental conditions used for Mg based surfaces were applied for the decontamination of
the prepared stainless steel surfaces. Experiments carried out in the absence of ultrasound (silent
conditions) were implemented as references.
According to Figure V-26, the decrease of stainless steel surface α-radioactivity in 0.01 oxalic acid
present a similar trend to what observed with Mg-Zr surface (see for instance 错误!未找到引用源。).
A fast decrease of the surface activity is indeed observed during the first 20 min of sonication, while a
lower, but significant and linear, decontamination effect is observed from 20 in to 90 min of treatment.

Metallic surface decontamination by ultrasound
145
The DF factor reaches 14.8 in these conditions. A stronger decontamination effect is noted under
ultrasound in comparison to silent conditions where contaminants are observed (Figure V-27) to
strongly remain on the surface after 90 min treatment. The surface activity follows a linear reduction
with a DF value of only 1.4 at the end of the experiment. It is important to note that in these conditions,
the recontamination of the surface is not observed (opposite to Mg-based materials) even in the case of
an extended sonication. Indeed, ultrasonic decontamination carried out during 180 min allowed to reach
a surface activity of about 10 Bq (DF= 26.6, in comparison to initial activity of 266 Bq) without any
increase of the surface contamination.
In comparison to decontaminated Mg-based samples, the final radiation level measured on the treated
stainless steel surfaces is higher whatever the treatment conditions. This is in agreement with the photos
and SEM observations illustrated in Figure V-27. Whatever the conditions, the color of the substrate
remains blue-violet which can be attributed to the good corrosion resistance of stainless steel material.
Under silent condition, no obvious change of the contaminants is observed; the initial porous structure
is still observed after treatment. For the surface treated under ultrasound, uranium contaminants are
found to be strongly damaged with the formation of intensive pits grown from the initial pores, but not
yet completely removed. No crater structure is produced in the contaminated or non-contaminated areas.
Figure V-26 Radioactivity evolution of contaminated stainless steel surfaces (0.1 M UO2(NO3)2) treated in
0.01 M oxalic acid, Ar, stirring 100 rpm, 20°C, for 90 minutes under silent condition (red) and by 345 kHz
ultrasound, Pac= 40 W (blue).

Metallic surface decontamination by ultrasound
146
Figure V-27 Photos and SEM images of stainless steel surfaces contaminated with U (0.1 M UO2(NO3)2)
treated under silent conditions (a and b) and by 345 kHz ultrasound, Pac= 40 W (c and d) in 0.01 M oxalic
acid, Ar, stirring 100 rpm, 20°C, 90 min
Considering the lower reactivity of stainless steel material and the apparently better adhesion of uranium
contaminant on its surface, 1 M nitric acid was chosen as decontamination medium. In 1 M nitric acid,
Figure V-28 shows that the stainless steel surface activity decreases to about 10 Bq after 90 min
treatment in both silent and ultrasonic decontaminations. Comparing to 0.01 M oxalic acid, especially
in the case of silent treatment, a stronger decontamination effect is observed in 1 M nitric acid which
can be attributed to the higher concentration of protons in solution and the stronger corrosive property
of this acid. Ultrasound irradiation does not improve significantly the final DF result (DF value of 28.8
in comparison to 23.4 under silent condition) although the ultrasonic acceleration effect is still obvious
in the first 10 minutes.

Metallic surface decontamination by ultrasound
147
Figure V-28 Radioactivity evolution of contaminated stainless steel surfaces (0.1 M UO2(NO3)2) treated in
1 M nitric acid, Ar, stirring 100 rpm, 20°C, for 90 minutes under silent condition (red) and by 345 kHz
ultrasound, Pac= 40 W (blue)
From Figure V-29, it is obvious that the color of the metallic substrate changes from dark blue-violet
to a burnished metallic color for both treatment conditions, which is close to the original stainless steel
color observed before calcination and indicates the removal of the thin oxidation layer on stainless steel
surface. Though the contamination areas can still be observed, a much more eroded morphology can be
noticed for the contaminants with SEM investigations.
Generally, stainless steel has a good corrosion resistance to organic acid like oxalic acid. But in a
concentrated nitric acid, stainless steel erosion is efficient and the contamination besides oxidation layer
is significantly removed. Again, ultrasound here accelerates the decontamination process (in the first 10
to 20 minutes) in both oxalic acid and nitric acid. Therefore, for stainless steel and similar corrosion
resistant metal materials, an efficient ultrasonic decontamination is necessary to carry out in a strongly
acidic solution, such as concentrated nitric acid.
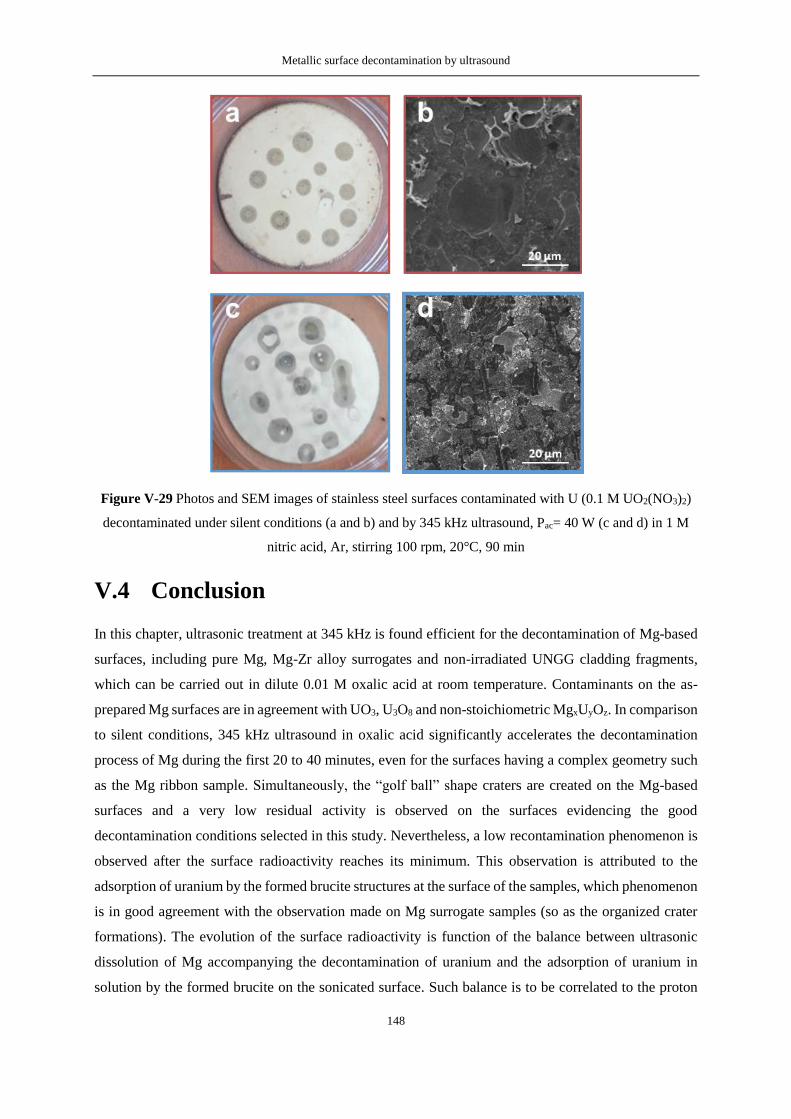
Metallic surface decontamination by ultrasound
148
Figure V-29 Photos and SEM images of stainless steel surfaces contaminated with U (0.1 M UO2(NO3)2)
decontaminated under silent conditions (a and b) and by 345 kHz ultrasound, Pac= 40 W (c and d) in 1 M
nitric acid, Ar, stirring 100 rpm, 20°C, 90 min
V.4 Conclusion
In this chapter, ultrasonic treatment at 345 kHz is found efficient for the decontamination of Mg-based
surfaces, including pure Mg, Mg-Zr alloy surrogates and non-irradiated UNGG cladding fragments,
which can be carried out in dilute 0.01 M oxalic acid at room temperature. Contaminants on the as-
prepared Mg surfaces are in agreement with UO3, U3O8 and non-stoichiometric MgxUyOz. In comparison
to silent conditions, 345 kHz ultrasound in oxalic acid significantly accelerates the decontamination
process of Mg during the first 20 to 40 minutes, even for the surfaces having a complex geometry such
as the Mg ribbon sample. Simultaneously, the “golf ball” shape craters are created on the Mg-based
surfaces and a very low residual activity is observed on the surfaces evidencing the good
decontamination conditions selected in this study. Nevertheless, a low recontamination phenomenon is
observed after the surface radioactivity reaches its minimum. This observation is attributed to the
adsorption of uranium by the formed brucite structures at the surface of the samples, which phenomenon
is in good agreement with the observation made on Mg surrogate samples (so as the organized crater
formations). The evolution of the surface radioactivity is function of the balance between ultrasonic
dissolution of Mg accompanying the decontamination of uranium and the adsorption of uranium in
solution by the formed brucite on the sonicated surface. Such balance is to be correlated to the proton

Metallic surface decontamination by ultrasound
149
concentration and pH of solution. Meantime, the graphite coating on the inner side of UNGG cladding
samples, which is problematic during storage, can be successfully removed by ultrasound in oxalic
medium. Contaminants on the as-prepared stainless steel surfaces only present UO3 and U3O8. The
efficient ultrasonic decontamination of stainless steel surfaces can also be observed in 1 M nitric acid.
No recontamination process is monitored during stainless steel surface decontamination; however, it is
found that a stronger and more concentrated nitric acid solution is required for efficient decontamination
of this metallic surface. Also, the ultrasound formation of structures is not observed for this material,
probably because of its lower reactivity and higher strength.

Metallic surface decontamination by ultrasound
150

General Conclusion
151
General Conclusion
In general, this thesis is divided into 3 major axes: 1) a fundamental study of sonochemistry and
sonoluminescence in aqueous solution submitted at 100 kHz ultrasound followed by the characterization
of the acoustic cavitation field in the vicinity of an extended solid surface; 2) the study of the behavior
and structuring of Mg-based surfaces under ultrasonic irradiation; 3) the ultrasonic treatment of
radioactive Mg-based materials contaminated with natural uranium as surrogates for UNGG claddings.
The first section of this study is dedicated on sonochemistry and sonoluminescence at 100 kHz. It is
shown that the characteristics of acoustic cavitation at intermediate frequencies are in between those at
low- and high-frequency ultrasound. H2O2 yield in water under Ar regularly increases with ultrasonic
frequency from 20 kHz to 362 kHz. On the one hand, the shape of the SL spectrum at 100 kHz is similar
to that at 20 kHz. On the other hand, the rovibronic temperatures of OH (A2Σ+) radicals in the non-
equilibrium sonochemical plasma produced by 100 kHz ultrasound are closer to high frequency rather
than to 20 kHz. A 20% O2 addition to Ar leads to higher H2O2 yield at all frequencies, and to higher SL
intensity at intermediate and high frequencies. This discrepancy was traced back to their higher collapse
energy that enables O2 dissociation and subsequent formation of more excited species, while at 20 kHz
O2 mostly has a quenching effect on SL. Cavitation bubbles at 100 kHz also share the ability of high
frequency ones to dissociate N2 molecules, which requires a high energy. Thus, from spectroscopic and
chemical points of view, 100 kHz can be seen as a transition between low and high frequency.
Then, the impact of the presence of a solid surface on SL and SCL was studied in luminol and NaCl
solutions. With close proximity to the solid surface, a higher ratio between Na* and continuum emission
intensity is observed from the MBSL spectrum of the NaCl solution, which is due to the asymmetrical
collapses of cavitation bubbles in the vicinity of the stainless steel plate. This effect seems quite localized
in a very short distance (≤1.5 mm) under the solid plate. Reflection of the ultrasonic wave leads to the
formation of a standing wave in liquid and it is found that SL and SCL (thus sonochemical activity)
distribution and intensity are strongly dependent on the position of the reflective surface: a well-defined
distance (resonant mode) between solid surface and transducer leads to brighter SCL photos and stronger
SL emissions. When a chemically active Mg surface is used as a reflector, no direct reflection is
observed since the produced hydrogen bubbles form a gas layer below the solid surface which interfere
with the formation of a standing wave in the solution.
The next section focuses on the sonication of Mg-based surfaces. It is found that ultrasound can activate
extended surfaces and participate, in combination to an appropriate solute, to the formation of original
and unprecedented microstructures. “Golf-ball” shape microstructuration is observed on pure Mg and
Mg-Zr alloy surfaces after sonication in dilute oxalic acid at 100 to 345 kHz at 20°C. The tuning of the

General Conclusion
152
applied acoustic frequency in combination to a relevant solute can lead to dramatic changes at the
material surface. Big holes and undulation channels can be observed on Mg surface treated at 20 kHz,
while no specific microstructure but flat surface and grain boundaries appear on a surface treated at 1
MHz.
The accumulation of Mg2+ in solution combined to the generation of H2 gas during the treatment
confirms the ultrasound-controlled dissolution of metallic Mg. An original approach resulting in the 3D
reconstruction of sonicated surfaces allowed to investigate the formation mechanism of these extended
surfaces. Most probably, ultrasound allows the generation of surface defects which are then used as
nucleation sites that favor the crater formation. The crater increases in diameter and depth with
sonication time due to the heterogeneous nucleation of cavitation bubbles, accompanying the pitting
corrosion which accelerates the growth of craters. H2 gas release in the localized area may also serve as
nucleation of cavitation. The surface wettability is also found to be strongly correlated to the formation
of craters, and a high hydrophobicity is expected with a surface of homogeneously formed craters. This
property can be of potential interest for industrial applications, for instance for biomedical materials,
where wettability properties are required to improve the adhesion of surface coatings. Mg surface
dissolution progress is found to be accompanied by the formation of new spherical micrometric
structures formed at the Mg surface and attributed to Mg(OH)2. The formation of these secondary phases
is related to local alkalization effect induced by Mg dissolution and is found to be lowered under
ultrasound in comparison to conventional dissolution procedure.
These observations open new routes of investigation for other alloy and metal-based materials and new
alternatives of potential interest for applications in many fields including industry, medicine, and
nanotechnology.
Ultrasonic decontamination of Mg-based materials contaminated with uranium (and stainless steel
surfaces in a less extent) was investigated in the last chapter of this thesis. The ultrasonic frequency
fixed at 345 kHz is found to be very efficient though rarely used in conventional ultrasonic cleaning.
The ultrasonic decontamination effect is highly different whether it is performed on Mg-based materials
or stainless steel surfaces. Mg-based materials can be efficiently decontaminated leading to surface
activities lower than 1 Bq within 20 minutes in dilute oxalic acid solution within the experimental
domain studied. Although significant, stainless steel surfaces require a stronger and more concentrated
acid solution (HNO3) which leads to a remaining radioactivity of about 10 Bq after 3 hours sonication.
A slow recontamination process is observed during the decontamination of Mg-based surfaces after 20
minutes treatment which is explained by the adsorption of uranium ions by the formed Mg(OH)2 on the
surface. Such layer structures are known to exhibit excellent ability in adsorption of heavy ions like
uranyl. The successful decontamination of Mg standing in a complex geometry can also be achieved

General Conclusion
153
under ultrasound irradiation thus confirming the potential of sonochemistry for the treatment of such
kind of materials.
The various investigations confirmed that Mg and Mg-Zr samples used in this study can be considered
as good surrogates to study the behavior of UNGG cladding samples. The homogeneous “golf-ball”
shape structuration and efficient decontamination of this material can indeed be observed under
ultrasound in similar conditions. Moreover, a remarkable removal of the graphite coating situated on the
inner side of UNGG cladding sample strengthen the possibility of using high-frequency ultrasound as a
tool for Mg cladding wastes decontamination in France.

154

References
155
References
1. DEN. Technical report. Etat d'avancement de la caractérisation des déchets MAVL produits avant 2015 - Programmes d'étude du conditionnementdes déchets 2015. CEA. CEA Saclay.
2. Chartier, D., Muzeau, B., Stefan, L., Sanchez-Canet, J., and Monguillon, C., Magnesium alloys and graphite wastes encapsulated in cementitious materials: Reduction of galvanic corrosion using alkali hydroxide activated blast furnace slag. Journal of Hazardous Materials, 2017. 326: p. 197-210.
3. Chen, D., Sharma, S.K., and Mudhoo, A., eds. Handbook on applications of ultrasound : Sonochemistry for sustainability. 2012, CRC Press: Boca Raton, FL.
4. Thompson, L.H. and Doraiswamy, L.K., Sonochemistry: Science and engineering. Industrial & Engineering Chemistry Research, 1999. 38(4): p. 1215-1249.
5. Leong, T., Ashokkumar, M., and Kentish, S., The fundamentals of power ultrasound - a review. Acoustics Australia, 2011. 39(2): p. 54-63.
6. Wu, T.Y., Guo, N., The, C.Y., and Wen Hay, J.X., Advances in ultrasound technology for environmental remediation. SpringerBriefs in Molecular Science. 2012, Netherlands: Springer.
7. Harkin, A., Nadim, A., and Kaper, T.J., On acoustic cavitation of slightly subcritical bubbles. Physics of Fluids, 1999. 11(2): p. 274-287.
8. Yasui, K., Acoustic cavitation and bubble dynamics. 2018: Springer international publishing.
9. Suslick, K.S. Sonoluminescence and sonochemistry. in 1997 IEEE Ultrasonics symposium proceedings. 1997. Toronto, Ont., Canada: IEEE. p. 523-532.
10. Ashokkumar, M., Lee, J., Kentish, S., and Grieser, F., Bubbles in an acoustic field: An overview. Ultrasonics Sonochemistry, 2007. 14(4): p. 470-475.
11. Vinatoru, M., Mason, T.J., and Calinescu, I., Ultrasonically assisted extraction (UAE) and microwave assisted extraction (MAE) of functional compounds from plant materials. Trends in analytical chemistry : TRAC, 2017. 97: p. 159-178.
12. Suslick, K.S., Doktycz, S.J., and Flint, E.B., On the origin of sonoluminescence and sonochemistry. Ultrasonics, 1990. 28(5): p. 280-290.
13. Louisnard, O. and González-García, J., Acoustic cavitation, in Ultrasound technologies for food and bioprocessing, H. Feng, G. Barbosa-Canovas, and J. Weiss, Editors. 2011, Springer: New York. p. 13-64.
14. Van Wijngaarden, L., Mechanics of collapsing cavitation bubbles. Ultrasonics Sonochemistry, 2016. 29: p. 524-527.
15. Suslick, K.S., Hammerton, D.A., and Cline, R.E., The sonochemical hot-spot. Journal of the American Chemical Society, 1986. 108(18): p. 5641-5642.
16. Suslick, K.S., Sonochemistry. Science, 1990. 247(4949): p. 1439-1445.

References
156
17. Suslick, K.S., McNamara, W.B., and Didenko, Y., Hot spot conditions during multi-bubble cavitation, in Sonochemistry and sonoluminescence, L.A. Crum, et al., Editors. 1999, Springer: Dordrecht. p. 191-204.
18. Didenko, Y.T., McNamara, W.B., and Suslick, K.S., Hot spot conditions during cavitation in water. Journal of the American Chemical Society, 1999. 121(24): p. 5817-5818.
19. Cairos, C. and Mettin, R., Simultaneous high-speed recording of sonoluminescence and bubble dynamics in multibubble fields. Physical Review Letters, 2017. 118(6): p. 064301.1-064301.5.
20. Ndiaye, A.A., Pflieger, R., Siboulet, B., Molina, J., Dufreche, J.F., and Nikitenko, S.I., Nonequilibrium vibrational excitation of OH radicals generated during multibubble cavitation in water. Journal of Physical Chemistry A, 2012. 116(20): p. 4860-4867.
21. Pflieger, R., Ouerhani, T., Belmonte, T., and Nikitenko, S.I., Use of NH (A3P-X3S-) sonoluminescence for diagnostics of nonequilibrium plasma produced by multibubble cavitation. Physical Chemistry Chemical Physics, 2017. 19(38): p. 26272-26279.
22. Nikitenko, S.I. and Pflieger, R., Toward a new paradigm for sonochemistry: Short review on nonequilibrium plasma observations by means of MBSL spectroscopy in aqueous solutions. Ultrasonics Sonochemistry, 2017. 35(B): p. 623-630.
23. Pflieger, R., Ndiaye, A.A., Chave, T., and Nikitenko, S.I., Influence of ultrasonic frequency on Swan band sonoluminescence and sonochemical activity in aqueous tert-butyl alcohol solutions. The Journal of Physical Chemistry B, 2015. 119(1): p. 284-290.
24. Brujan, E.A., Keen, G.S., Vogel, A., and Blake, J.R., The final stage of the collapse of a cavitation bubble close to a rigid boundary. Physics of Fluids, 2002. 14(1): p. 85-92.
25. Bremond, N., Arora, M., Dammer, S.M., and Lohse, D., Interaction of cavitation bubbles on a wall. Physics of Fluids, 2006. 18(12): p. 150501-150510.
26. Mason, T. and Lorimer, J.P., Applied sonochemistry: The uses of power ultrasound in chemistry and processing. 2002, Weinheim: Wiley VCH.
27. Lauterborn, W. and Bolle, H., Experimental investigations of cavitation-bubble collapse in neighborhood of a solid boundary. Journal of Fluid Mechanics, 1975. 72(2): p. 391-399.
28. Sugimoto, Y., Yamanishi, Y., Sato, K., and Moriyama, M., Measurement of bubble behavior and impact on solid wall induced by fiber-holmium: YAG laser. Journal of Flow Control, Measurement & Visualization, 2015. Vol.03(No.04): p. 135-143.
29. Lauterborn, W., Kurz, T., Mettin, R., and Ohl, C.D., Experimental and theoretical bubble dynamics, in Advances in Chemical Physics, P. I. and R.S. A., Editors. 1999. p. 295-380.
30. Supponen, O., Obreschkow, D., Kobel, P., Tinguely, M., Dorsaz, N., and Farhat, M., Shock waves from nonspherical cavitation bubbles. Physical Review Fluids, 2017. 2(9): p. 360101-360120.
31. Young, F.R., Sonoluminescence. 2004: CRC Press.

References
157
32. Virot, M., Chave, T., Nikitenko, S.I., Shchukin, D.G., Zemb, T., and Mohwald, H., Acoustic cavitation at the water-glass interface. Journal of Physical Chemistry C, 2010. 114(30): p. 13083-13091.
33. Reuter, F. and Mettin, R., Mechanisms of single bubble cleaning. Ultrasonics Sonochemistry, 2016. 29: p. 550-562.
34. Brujan, E.A., Ikeda, T., and Matsumoto, Y., On the pressure of cavitation bubbles. Experimental Thermal and Fluid Science, 2008. 32(5): p. 1188-1191.
35. Philipp, A. and Lauterborn, W., Cavitation erosion by single laser-produced bubbles. Journal of Fluid Mechanics, 1998. 361: p. 75-116.
36. Piercy, J.E. and Lamb, J., Acoustic streaming in liquids. Proceedings of the Royal Society of London. Series A. Mathematical and Physical Sciences, 1954. 226(1164): p. 43-50.
37. Karlsen, J.T., Qiu, W., Augustsson, P., and Bruus, H., Acoustic Streaming and Its Suppression in Inhomogeneous Fluids. Physical Review Letters, 2018. 120(5): p. 054501.1-054501.6.
38. Legay, M., Gondrexon, N., Le Person, S., Boldo, P., and Bontemps, A., Enhancement of heat transfer by ultrasound: Review and recent advances. International Journal of Chemical Engineering, 2011. 2011(2): p. 1-17.
39. Trinh, E.H. and Gopinath, A. Acoustic streaming and heat and mass transfer enhancement. in Third Microgravity Fluid Physics Conference. 1996. p. 791-796.
40. Brennen, C., Cavitation and bubble dynamics. Vol. 44. 1995, New York: Oxford University Press.
41. Richards, W.T. and Loomis, A.L., The chemical effects of high frequency sound waves I. A preliminary survey. Journal of the American Chemical Society, 1927. 49(12): p. 3086-3100.
42. Pokhrel, N., Vabbina, P.K., and Pala, N., Sonochemistry: Science and engineering. Ultrasonics Sonochemistry, 2016. 29: p. 104-128.
43. Lepoint, T. and Mullie, F., What Exactly is Cavitation Chemistry. Ultrasonics Sonochemistry, 1994. 1: p. S13-S22.
44. Wood, R.J., Lee, J., and Bussemaker, M.J., A parametric review of sonochemistry: Control and augmentation of sonochemical activity in aqueous solutions. Ultrasonics Sonochemistry, 2017. 38: p. 351-370.
45. Ji, R., Pflieger, R., Virot, M., and Nikitenko, S.I., Multibubble sonochemistry and sonoluminescence at 100 khz: The missing link between low- and high-frequency ultrasound. Journal of Physical Chemistry B, 2018. 122(27): p. 6989-6994.
46. Ouerhani, T., Pflieger, R., Ben Messaoud, W., and Nikitenko, S.I., Spectroscopy of sonoluminescence and sonochemistry in water saturated with N2-Ar mixtures. Journal of Physical Chemistry B, 2015. 119(52): p. 15885-15891.
47. Hagenson, L.C. and Doraiswamy, L.K., Comparison of the effects of ultrasound and mechanical agitation on a reacting solid-liquid system. Chemical Engineering Science, 1998. 53(1): p. 131-148.

References
158
48. Serpone, N. and Colarusso, P., Sonochemistry I. Effects of Ultrasounds On Heterogeneous Chemical Reactions - a Useful Tool To Generate Radicals and To Examine Reaction Mechanisms. p. 635-679.
49. Dooher, J., Genberg, R., Moon, S., Gilmartin, B., Jakatt, S., Skura, J., and Wright, D., Combustion studies of water-oil emulsion on a commercial boiler using number 2 oil and low and high sulfur number 6 oil. Fuel, 1980. 59(12): p. 883-892.
50. Shchukin, D.G., Skorb, E., Belova, V., and Mohwald, H., Ultrasonic cavitation at solid surfaces. Advanced Materials, 2011. 23(17): p. 1922-1934.
51. Mason, T.J., Ultrasonic cleaning: An historical perspective. Ultrasonics Sonochemistry, 2016. 29: p. 519-523.
52. Banerjee, S., Kumar, R., and Gandhi, K.S., Analysis of ultrasonically enhanced hydrogen evolution for Zn-NiCl2 system. Chemical Engineering Science, 1995. 50(15): p. 2409-2418.
53. Domingos, R.N., Vollet, D.R., and Bucalon, A.J., Structural changes induced by ultrasound during aging of the boehmite phase. Ultrasonics Sonochemistry, 1997. 4(4): p. 321-323.
54. Mason, T.J., Lorimer, J.P., and Walton, D.J., Sonoelectrochemistry. Ultrasonics, 1990. 28(5): p. 333-337.
55. Compton, R.G., Eklund, J.C., and Marken, F., Sonoelectrochemical processes: A review. Electroanalysis, 1997. 9(7): p. 509-522.
56. Brotchie, A., Grieser, F., and Ashokkumar, M., Effect of power and frequency on bubble-size distributions in acoustic cavitation. Physical Review Letters, 2009. 102(8): p. 084302.1-084302.4.
57. Babgi, B., Zhou, M.F., Aksu, M., Alghamdi, Y., and Ashokkumar, M., Initial growth of sonochemically active and sonoluminescence bubbles at various frequencies. Ultrasonics Sonochemistry, 2016. 29: p. 55-59.
58. Dake. Sonoluminescence. 2005 [cited 2015 November 03]; Available from: https://fr.wikipedia.org/wiki/Sonoluminescence.
59. Hatanaka, S., Yasui, K., Kozuka, T., Tuziuti, T., and Mitome, H., Influence of bubble clustering on multibubble sonoluminescence. Ultrasonics, 2002. 40(1-8): p. 655-660.
60. Krefting, D., Mettin, R., and Lauterborn, W., High-speed observation of acoustic cavitation erosion in multibubble systems. Ultrasonics Sonochemistry, 2004. 11(3-4): p. 119-123.
61. Brenner, M.P., Hilgenfeldt, S., and Lohse, D., Single-bubble sonoluminescence. Reviews of Modern Physics, 2002. 74(2): p. 425-484.
62. Matula, T.J., Roy, R.A., Mourad, P.D., McNamara Iii, W.B., and Suslick, K.S., Comparison of multibubble and single-bubble sonoluminescence spectra. Physical Review Letters, 1995. 75(13): p. 2602-2605.
63. Didenko, Y.T. and Pugach, S.P., Spectra of water sonoluminescence. Journal of Physical Chemistry, 1994. 98(39): p. 9742-9749.

References
159
64. Abe, S. and Choi, P.K., Spatiotemporal separation of Na-atom emission from continuum emission in sonoluminescence. Japanese Journal of Applied Physics, 2009. 48(7): p. 07GH02.1-07GH02.3.
65. Hayashi, Y. and Choi, P.K., Effects of rare gases on sonoluminescence spectrum of the K atom. Journal of Physical Chemistry B, 2012. 116(27): p. 7891-7897.
66. Choi, P.K., Sonoluminescence and acoustic cavitation. Japanese Journal of Applied Physics, 2017. 56(7): p. 07JA01.1-07JA01.9.
67. Xu, H. and Suslick, K.S., Molecular emission and temperature measurements from single-bubble sonoluminescence. Physical Review Letters, 2010. 104(24): p. 244301.1-244301.4.
68. Xu, H., Glumac, N.G., and Suslick, K.S., Temperature Inhomogeneity during Multibubble Sonoluminescence. Angewandte Chemie International Edition, 2010. 49(6): p. 1079-1082.
69. Flannigan, D.J. and Suslick, K.S., Temperature Nonequilibration during Single-Bubble Sonoluminescence. Journal of Physical Chemistry Letters, 2012. 3(17): p. 2401-2404.
70. McNamara, W.B., Didenko, Y.T., and Suslick, K.S., Sonoluminescence temperatures during multi-bubble cavitation. Nature, 1999. 401(6755): p. 772-775.
71. Merouani, S., Ferkous, H., Hamdaoui, O., Rezgui, Y., and Guemini, M., A method for predicting the number of active bubbles in sonochemical reactors. Ultrasonics Sonochemistry, 2015. 22: p. 51-58.
72. Laborde, J.L., Bouyer, C., Caltagirone, J.P., and Gerard, A., Acoustic cavitation field prediction at low and high frequency ultrasounds. Ultrasonics, 1998. 36(1-5): p. 581-587.
73. Ashokkumar, M., Lee, J., Iida, Y., Yasui, K., Kozuka, T., Tuziuti, T., and Towata, A., Spatial distribution of acoustic cavitation bubbles at different ultrasound frequencies. Chemphyschem, 2010. 11(8): p. 1680-1684.
74. Beckett, M.A. and Hua, I., Impact of ultrasonic frequency on aqueous sonoluminescence and sonochemistry. Journal of Physical Chemistry A, 2001. 105(15): p. 3796-3802.
75. Tronson, R., Ashokkumar, M., and Grieser, F., Comparison of the effects of water-soluble solutes on multibubble sonoluminescence generated in aqueous solutions by 20- and 515-kHz pulsed ultrasound. Journal of Physical Chemistry B, 2002. 106(42): p. 11064-11068.
76. Asakura, Y., Nishida, T., Matsuoka, T., and Koda, S., Effects of ultrasonic frequency and liquid height on sonochemical efficiency of large-scale sonochemical reactors. Ultrasonics Sonochemistry, 2008. 15(3): p. 244-250.
77. Yusof, N.S.M. and Ashokkumar, M., Sonochemical synthesis of gold nanoparticles by using high intensity focused ultrasound. Chemphyschem, 2015. 16(4): p. 775-781.
78. Kanthale, P., Ashokkumar, M., and Grieser, F., Sonoluminescence, sonochemistry (H2O2 yield) and bubble dynamics: Frequency and power effects. Ultrasonics Sonochemistry, 2008. 15(2): p. 143-150.

References
160
79. Cum, G., Galli, G., Gallo, R., and Spadaro, A., Role of frequency in the ultrasonic activation of chemical reactions. Ultrasonics, 1992. 30(4): p. 267-270.
80. Petrier, C., Jeunet, A., Luche, J.L., and Reverdy, G., Unexpected frequency-effects on the rate of oxidative processes induced by ultrasound. Journal of the American Chemical Society, 1992. 114(8): p. 3148-3150.
81. Portenlänger, G. and Heusinger, H., The influence of frequency on the mechanical and radical effects for the ultrasonic degradation of dextranes. Ultrasonics Sonochemistry, 1997. 4(2): p. 127-130.
82. Mason, T.J., Cobley, A.J., Graves, J.E., and Morgan, D., New evidence for the inverse dependence of mechanical and chemical effects on the frequency of ultrasound. Ultrasonics Sonochemistry, 2011. 18(1): p. 226-230.
83. Whillock, G.O.H. and Harvey, B.F., Ultrasonically Enhanced Corrosion of 304L Stainless Steel: 2. The Effect of Frequency, Acoustic Power and Horn to Specimen Distance. Ultrasonics Sonochemistry, 1997. 4(1): p. 33-38.
84. Pflieger, R., Chave, T., Vite, G., Jouve, L., and Nikitenko, S.I., Effect of Operational Conditions on Sonoluminescence and Kinetics of H2O2 Formation during the Sonolysis of Water in the Presence of Ar/O2 Gas Mixture. Ultrasonics Sonochemistry, 2015. 26: p. 169-175.
85. Cairos, C., Schneider, J., Pflieger, R., and Mettin, R., Effects of argon sparging rate, ultrasonic power, and frequency on multibubble sonoluminescence spectra and bubble dynamics in NaCl aqueous solutions. Ultrasonics Sonochemistry, 2014. 21(6): p. 2044-2051.
86. Yasui, K., Influence of ultrasonic frequency on multibubble sonoluminescence. Journal of the Acoustical Society of America, 2002. 112(4): p. 1405-1413.
87. Merouani, S., Hamdaoui, O., Rezgui, Y., and Guemini, M., Effects of Ultrasound Frequency and Acoustic Amplitude on the Size of Sonochemically Active Bubbles - Theoretical Study. Ultrasonics Sonochemistry, 2013. 20(3): p. 815-819.
88. Gutierrez, M. and Henglein, A., Chemical action of pulsed ultrasound - observation of an unprecedented intensity effect. Journal of Physical Chemistry, 1990. 94(9): p. 3625-3628.
89. Sivakumar, M. and Gedanken, A., Insights into the sonochemical decomposition of Fe(CO)5: theoretical and experimental understanding of the role of molar concentration and power density on the reaction yield. Ultrasonics Sonochemistry, 2004. 11(6): p. 373-378.
90. Didenko, Y.T., Gordeychuk, T.V., and Koretz, V.L., The effect of ultrasound power on water sonoluminescence. Journal of Sound and Vibration, 1991. 147(3): p. 409-416.
91. Lee, H.B. and Choi, P.K., Acoustic power dependences of sonoluminescence and bubble dynamics. Ultrasonics Sonochemistry, 2014. 21(6): p. 2037-2043.
92. Sunartio, D., Ashokkumar, M., and Grieser, F., The influence of acoustic power on multibubble sonoluminescence in aqueous solution containing organic solutes. Journal of Physical Chemistry B, 2005. 109(42): p. 20044-20050.

References
161
93. Ashokkumar, M., Mulvaney, P., and Grieser, F., The effect of pH on multibubble sonoluminescence from aqueous solutions containing simple organic weak acids and bases. Journal of the American Chemical Society, 1999. 121(32): p. 7355-7359.
94. Okitsu, K., Suzuki, T., Takenaka, N., Bandow, H., Nishimura, R., and Maeda, Y., Acoustic multibubble cavitation in water: A new aspect of the effect of a rare gas atmosphere on bubble temperature and its relevance to sonochemistry. Journal of Physical Chemistry B, 2006. 110(41): p. 20081-20084.
95. Pflieger, R., Gravier, L., Guillot, G., Ashokkumar, M., and Nikitenko, S.I., Inverse effects of the gas feed positioning on sonochemistry and sonoluminescence. Ultrasonics Sonochemistry, 2018. 46: p. 10-17.
96. Yasui, K., Iida, Y., Tuziuti, T., Kozuka, T., and Towata, A., Strongly interacting bubbles under an ultrasonic horn. Physical Review E, 2008. 77(1): p. 016609.1-016609.10.
97. Entezari, M.H. and Kruus, P., Effect of frequency on sonochemical reactions II. Temperature and intensity effects. Ultrasonics Sonochemistry, 1996. 3(1): p. 19-24.
98. Nikitenko, S.I., Le Naour, C., and Moisy, P., Comparative study of sonochemical reactors with different geometry using thermal and chemical probes. Ultrasonics Sonochemistry, 2007. 14(3): p. 330-336.
99. Calvisi, M.L., Lindau, O., Blake, J.R., and Szeri, A.J., Shape stability and violent collapse of microbubbles in acoustic traveling waves. Physics of Fluids, 2007. 19(4): p. 047101.1-047101.15.
100. Lee, J., Ashokkumar, M., Yasui, K., Tuziuti, T., Kozuka, T., Towata, A., and Iida, Y., Development and optimization of acoustic bubble structures at high frequencies. Ultrasonics Sonochemistry, 2011. 18(1): p. 92-98.
101. Kauer, M., Belova-Magri, V., Cairos, C., Schreier, H.J., and Mettin, R., Visualization and optimization of cavitation activity at a solid surface in high frequency ultrasound fields. Ultrasonics Sonochemistry, 2017. 34: p. 474-483.
102. Thangavadivel, K., Okitsu, K., Owens, G., Lesniewski, P.J., and Nishimura, R., Influence of sonochemical reactor diameter and liquid height on methyl orange degradation under 200 kHz indirect sonication. Journal of Environmental Chemical Engineering, 2013. 1(3): p. 275-280.
103. De La Rochebrochard, S., Suptil, J., Blais, J.F., and Naffrechoux, E., Sonochemical efficiency dependence on liquid height and frequency in an improved sonochemical reactor. Ultrasonics Sonochemistry, 2012. 19(2): p. 280-285.
104. Tuziuti, T., Yasui, K., Kozuka, T., and Towata, A., Influence of liquid-surface vibration on sonochemiluminescence intensity. Journal of Physical Chemistry A, 2010. 114(27): p. 7321-7325.
105. Kim, E., Cui, M., Jang, M., Park, B., Son, Y., and Khim, J., Investigation of sonochemical activities at a frequency of 334 kHz: The effect of geometric parameters of sonoreactor. Ultrasonics Sonochemistry, 2014. 21(4): p. 1504-1511.
106. Bussemaker, M.J. and Zhang, D., A phenomenological investigation into the opposing effects of fluid flow on sonochemical activity at different frequency and power settings. 1. Overhead stirring. Ultrasonics Sonochemistry, 2014. 21(1): p. 436-445.

References
162
107. Kaltsa, O., Gatsi, I., Yanniotis, S., and Mandala, I., Influence of ultrasonication parameters on physical characteristics of olive oil model emulsions containing xanthan. Food and Bioprocess Technology, 2014. 7(7): p. 2038-2049.
108. Falleh, H., Ksouri, R., Lucchessi, M.E., Abdelly, C., and Magne, C., Ultrasound-assisted extraction: Effect of extraction time and solvent power on the levels of polyphenols and antioxidant activity of mesembryanthemum edule l. Aizoaceae shoots. Tropical Journal of Pharmaceutical Research, 2012. 11(2): p. 243-249.
109. Leong, S.X., Mayorga-Martinez, C.C., Sofer, Z., Luxa, J., Tana, S.M., and Pumera, M., A study of the effect of sonication time on the catalytic performance of layered WS2 from various sources. Physical Chemistry Chemical Physics, 2017. 19(4): p. 2768-2777.
110. Zhao, Y., Bao, C., Feng, R., and Li, R., A new method of etching ABS plastic for plating by ultrasound. Plating and Surface Finishing, 1998. 85(9): p. 98-100.
111. Suslick, K.S. and Price, G.J., Applications of ultrasound to materials chemistry. Annual Review of Materials Science, 1999. 29(1): p. 295-326.
112. Suslick, K.S., Casadonte, D.J., Green, M.L.H., and Thompson, M.E., Effects of high-intensity ultrasound on inorganic solids. Ultrasonics, 1987. 25(1): p. 56-59.
113. Cobley, A. and Mason, T., The evaluation of sonochemical techniques for sustainable surface modification in electronic manufacturing. Circuit World, 2007. 33(3): p. 29-34.
114. Cobley, A., Mason, T., and Robinson, J., Sonochemical surface modification: A route to lean, green and clean manufacturing? Journal of Applied Surface Finishing, 2008. 3(4): p. 190-196.
115. Skorb, E.V., Shchukin, D.G., Mohwald, H., and Andreeva, D.V., Ultrasound-driven design of metal surface nanofoams. Nanoscale, 2010. 2(5): p. 722-727.
116. Hutli, E., Nedeljkovic, M.S., Bonyar, A., Radovic, N.A., Llic, V., and Debeljkovic, A., The ability of using the cavitation phenomenon as a tool to modify the surface characteristics in micro- and in nano-level. Tribology International, 2016. 101: p. 88-97.
117. Skorb, E.V., Mohwald, H., and Andreeva, D.V., Effect of cavitation bubble collapse on the modification of solids: Crystallization aspects. Langmuir, 2016. 32(43): p. 11072-11085.
118. Zhou, Y.K. and Hammitt, F.G., Cavitation erosion incubation period. Wear, 1983. 86(2): p. 299-313.
119. Rivas, D.F., Verhaagen, B., Seddon, J.R.T., Zijlstra, A.G., Jiang, L.M., van der Sluis, L.W.M., Versluis, M., Lohse, D., and Gardeniers, H., Localized removal of layers of metal, polymer, or biomaterial by ultrasound cavitation bubbles. Biomicrofluidics, 2012. 6(3): p. 034114.1-034114.20.
120. Verdan, S., Burato, G., Comet, M., Reinert, L., and Fuzellier, H., Structural changes of metallic surfaces induced by ultrasound. Ultrasonics Sonochemistry, 2003. 10(4-5): p. 291-295.

References
163
121. Kollath, A., Cherepanov, P.V., and Andreeva, D.V., Controllable manipulation of crystallinity and morphology of aluminium surfaces using high intensity ultrasound. Applied Acoustics, 2016. 103: p. 190-194.
122. Zhukova, Y., Ulasevich, S.A., Dunlop, J.W.C., Fratzl, P., Mohwald, H., and Skorb, E.V., Ultrasound-driven titanium modification with formation of titania based nanofoam surfaces. Ultrasonics Sonochemistry, 2017. 36: p. 146-154.
123. Skorb, E.V., Fix, D., Shchukin, D.G., Mohwald, H., Sviridov, D.V., Mousa, R., Wanderka, N., Schaferhans, J., Pazos-Perez, N., Fery, A., and Andreeva, D.V., Sonochemical formation of metal sponges. Nanoscale, 2011. 3(3): p. 985-993.
124. Saadi, N.S., Hassan, L.B., and Karabacak, T., Metal oxide nanostructures by a simple hot water treatment. Scientific Reports, 2017. 7(1): p. 7158.
125. Bulat, T.J., Macrosonics in industry .3. Ultrasonic cleaning. Ultrasonics, 1974. 12(2): p. 59-68.
126. Crum, L.A. and Ferrell, G.W., The role of acoustic cavitation in megasonic cleaning. Acustica, 1996. 82(S): p. 132-132.
127. Fuchs, F.J., Ultrasonic cleaning and washing of surfaces, in Power ultrasonics, J.A. Gallego-Juárez and K.F. Graff, Editors. 2015, Woodhead Publishing: Oxford. p. 577-609.
128. Barbara, K. and Ed, K. Ultrasonics vs megasonics. [cited 2018 April 19]; Available from: https://electroiq.com/2002/07/ultrasonics-vs-megasonics/.
129. Sonosys. MEMS (microelectromechanical systems) / LIGA technology. [cited 2015 Octorber 15]; Available from: https://sonosys.de/en/mems-liga-technology.html.
130. Li, Y.L., Ultrasonic cleaning principle and application. Cleaning World, 2006. 22(7): p. 31-35.
131. Yusof, N.S.M., Babgi, B., Alghamdi, Y., Aksu, M., Madhavan, J., and Ashokkumar, M., Physical and chemical effects of acoustic cavitation in selected ultrasonic cleaning applications. Ultrasonics Sonochemistry, 2016. 29: p. 568-576.
132. Galy, N., Behavior of 14C in irradiated nuclear graphite : effects of irradiation and decontamination by steam reforming. 2016, Université de Lyon.
133. Vende, L., Nuclear graphite waste’s behaviour under disposal conditions : Study of the release and repartition of organic and inorganic forms of carbon 14 and tritium in alkaline media. 2012, Ecole des Mines de Nantes.
134. ANZIEU, p., BONIN, B., and Pradel, P., Gas-cooled nuclear reactors. 2006: CEA Saclay; Groupe Moniteur.
135. Cannes, C., Matrices de confinement pour les déchets nucléaires : corrosion des métaux dans les conditions de stockage. 2018, CS IPNO: Orsay, Paris, France.
136. Barre, B., Anzieu, P., Lenain, R., and Thomas, J.-B., Nuclear reactor systems - a technical, historical and dynamic approach. 2016, Les Ulis (France): EDP Sciences.
137. Pageot, J., Study of a nuclear graphite waste 14C decontamination process by CO2 gasification. 2014, Université Paris Sud - Paris XI.

References
164
138. Caillat, R. and Darras, R. Technical report. Corrosion du magnésium et de certains de ses alliages dans les piles refroidies par gaz 1958. CEA Saclay.
139. Azevedo, C.R.F., Selection of fuel cladding material for nuclear fission reactors. Engineering Failure Analysis, 2011. 18(8): p. 1943-1962.
140. Pugh, S.F., Harris, J.E., Raraty, L.E., Wareing, J., Burras, G.A., Antill, J.E., Mott, B.W., and Busk, R.S., Magnesium alloy cladding for nuclear fuels. Journal of the British Nuclear Energy Society, 1972. 11(4): p. 313-330.
141. Neelameggham, R., Primary production of magnesium, in Fundamentals of Magnesium Alloy Metallurgy, M.O. Pekguleryuz, K.U. Kainer, and A. Arslan Kaya, Editors. 2013, Woodhead Publishing. p. 1-32.
142. Juers, C., Corrosion and surface treatments for magnesium alloys used for aeronautical applications. 2008, Université Henri Poincaré - Nancy 1.
143. Polmear, I., StJohn, D., Nie, J.-F., and Qian, M., Magnesium alloys, in Light alloys (fifth edition), I. Polmear, et al., Editors. 2017, Butterworth-Heinemann: Boston. p. 287-367.
144. Mordike, B.L. and Ebert, T., Magnesium - properties - applications - potential. Materials Science and Engineering A, 2001. 302(1): p. 37-45.
145. Caillat, R., Herenguel, J., Salesse, M., and Stohr, J., Raisons du choix de l'alliage Mg-Zr pour le gainage des éléments combustibles. Journal of Nuclear Materials, 1963. 8(1): p. 1-2.
146. Gu, J., Grain refinement of Mg-Zn and Mg-Mn alloys by SiC inoculation. 2017, Clausthal University of Technology.
147. Rendu, M. Sicral F1 graphite-core fuel element behavior in power reactors 1987. CEA. CEA Cadarache.
148. Hallam, K.R., Minshall, P.C., Heard, P.J., and Flewitt, P.E.J., Corrosion of the alloys Magnox AL80, Magnox ZR55 and pure magnesium in air containing water vapour. Corrosion Science, 2016. 112: p. 347-363.
149. Gregson, C.R., Goddard, D.T., Sarsfield, M.J., and Taylor, R.J., Combined electron microscopy and vibrational spectroscopy study of corroded Magnox sludge from a legacy spent nuclear fuel storage pond. Journal of Nuclear Materials, 2011. 412(1): p. 145-156.
150. Song, G.L., Corrosion electrochemistry of magnesium (Mg) and its alloys, in Corrosion of magnesium alloys. 2011, Woodhead Publishing. p. 3-65.
151. Zeng, R.C., Zhang, J., Huang, W.J., Dietzel, W., Kainer, K.U., Blawert, C., and Ke, W., Review of studies on corrosion of magnesium alloys. Transactions of Nonferrous Metals Society of China, 2006. 16: p. S763-S771.
152. Joyce, M., Radioactive waste management and disposal, in Nuclear engineering: A conceptual introduction to nuclear power, M. Joyce, Editor. 2018, Butterworth-Heinemann. p. 357-378.
153. Efremenkov, V.M., Radioactive waste management at nuclear power plants. International Atomic Energy Agency Bulletin, 1989. 31(4): p. 37-42.

References
165
154. Atkins, M. and Glasser, F.P., Application of portland cement-based materials to radioactive waste immobilization. Waste Management, 1992. 12(2): p. 105-131.
155. Fairhall, G.A. and Palmer, J.D., The encapsulation of Magnox Swarf in cement in the United Kingdom. Cement and Concrete Research, 1992. 22(2): p. 293-298.
156. Rooses, A., Lambertin, D., Chartier, D., and Frizon, F., Galvanic corrosion of Mg-Zr fuel cladding and steel immobilized in Portland cement and geopolymer at early ages. Journal of Nuclear Materials, 2013. 435(1-3): p. 137-140.
157. Strasser, A., Santucci, J., Lindquist, K., Yario, W., Stern, G., Goldstein, L., and Joseph, L. Evaluation of stainless steel cladding for use in current design LWRs. Final report 1982. EPRI. New York (USA).
158. Abe, A., Giovedi, C., Gomes, D., and Silva, A., Revisiting stainless steel as pwr fuel rod cladding after fukushima daiichi accident. Journal of Power and Energy Engineering, 2013. 1(6): p. 323-329.
159. Pino, E., Abe, A., and Giovedi, C., The quest for safe and reliable fuel cladding materials, in 2015 International nuclear atlantic conference. 2015, Associacao Brasileira de Energia Nuclear (ABEN): São Paulo, SP, Brazil. p. 4847-4854.
160. Leontyev, A., Laser decontamination and cleaning of metal surfaces : modelling and experimental studies. 2011, Université Paris Sud - Paris XI.
161. ANDRA. Intermediate-level waste (ILW-LL). [cited 2018 January 17]; Available from: http://www.radioactivity.eu.com/site/pages/ML_LLW.htm.
162. Lambertin, D., Frizon, F., and Bart, F., Mg-Zr alloy behavior in basic solutions and immobilization in Portland cement and Na-geopolymer with sodium fluoride inhibitor. Surface & Coatings Technology, 2012. 206(22): p. 4567-4573.
163. Agullo, J.L., Alain., Etude de la faisabilité du traitement et du confinement des effluents issus de la dissolution dans l'acide nitrique des déchets magnésiens. 2018: CEA Marcoule.
164. OTND, Étude de faisabilité du procédé de dissolution carbonique sur des déchets magnésiens du dégainage - définition du procédé de dissolution carbonique. 2015: CEA Marcoule.
165. NEA. Decontamination techniques used in decommissioning activities 1999. N.T. Group. Belgium.
166. Kaul, A. and Lasch, M., Decontamination, in Radiological Protection, A. Kaul and D. Becker, Editors. 2005, Springer: Berlin, Heidelberg. p. 259-294.
167. Kinnunen, P. ANTIOXI - Decontamination techniques for activity removal in nuclear environments 2008. VTT. Finland.
168. Moser, T. and Carr, T. Pressurized Water Reactor Fuel Cleaning Using Advanced Ultrasonics 2000. E.P.R.I. (EPRI). United States.
169. Lebedev, N., Krasilnikov, D., Vasiliev, A., Dubinin, G., and Yurmanov, V. Development and application of the ultrasonic technologies in nuclear engineering. in NPC 2012: Nuclear Plant Chemistry Conference, International Conference on Water Chemistry of Nuclear Reactor Systems. 2012. France.

References
166
170. Kumar, A., Bhatt, R.B., Behere, P.G., and Afzal, M., Ultrasonic decontamination of prototype fast breeder reactor fuel pins. Ultrasonics, 2014. 54(4): p. 1052-1056.
171. Wells, H., Radioactive decontamination by ultrasonics. Ultrasonics, 1966. 4(1): p. 29-34.
172. Cerre, P., Mestre, E., and de Kerdelleau, J. Decontamination of Surfaces by Ultrasonics 1962. CEA.
173. Courtault, J., de Kerdelleau, J., and Mestre, E. The ultrasonic copper and brass decontamination study 1965. CEA.
174. Borioli, E., Bregani, F., and Garofalo, A. Effectiveness of different decontamination techniques on metallic scraps arising from decommissioned power plants 1998. IAEA.
175. Hong, Y.-H., Park, S.-R., Han, S.-W., and Kim, B.-J., Smart decontamination device for small-size radioactive scrap metal waste : Using abrasion pin in rotating magnetic field and ultrasonic wave cleaner. Journal of Nuclear Fuel Cycle and Waste Technology, 2014. 12(1): p. 79-88.
176. Vasilyev, A.P., Lebedev, N.M., Savkin, A.E., and Karlina, I.E. Experimental Tests of Ultrasonic Decontamination of Metal Radioactive Waste. in 2009 Waste Management Symposium - WM2009/WM'09: HLW, TRU, LLW/ILW, Mixed, Hazardous Wastes and Environmental Management - Waste Management for the Nuclear Renaissance. 2009. United States.
177. Rosman, K.J.R. and Taylor, P.D.P. Isotopic compositions of the elements 1997 1998. IUPAC. United Kingdom.
178. Jaffe, H. and Berlincourt, D.A., Piezoelectric transducer materials. Proceedings of the IEEE, 1965. 53(10): p. 1372-1386.
179. Wells, P.N.T., Bullen, M.A., Follett, D.H., Freundlich, H.F., and James, J.A., The dosimetry of small ultrasonic beams. Ultrasonics, 1963. 1(2): p. 106-110.
180. Gong, C.L. and Hart, D.P., Ultrasound induced cavitation and sonochemical yields. Journal of the Acoustical Society of America, 1998. 104(5): p. 2675-2682.
181. Dalodiere, E., Virot, M., Moisy, P., and Nikitenko, S.I., Effect of ultrasonic frequency on H2O2 sonochemical formation rate in aqueous nitric acid solutions in the presence of oxygen. Ultrasonics Sonochemistry, 2016. 29: p. 198-204.
182. Amelinckx, S., Dyck, D.v., Landuyt, J.v., and Tendeloo, G.v., eds. Handbook of microscopy. Applications in materials, science, solid-state physics and chemistry. Food / Nahrung. 1997, VCH Verlagsgesellschaft mbH: Weinheim.
183. Epp, J., X-ray diffraction (XRD) techniques for materials characterization, in Materials Characterization Using Nondestructive Evaluation (NDE) Methods, G. Hübschen, et al., Editors. 2016, Woodhead Publishing. p. 81-124.
184. Quéré, D., Rough ideas on wetting. Physica A: Statistical Mechanics and its Applications, 2002. 313(1): p. 32-46.
185. Wenzel, R., Resistance of Solid Surfaces to Wetting by Water. Industrial & Engineering Chemistry, 1936. 28(8): p. 988-994.

References
167
186. Demir, A.G., Furlan, V., Lecis, N., and Previtali, B., Laser surface structuring of AZ31 Mg alloy for controlled wettability. Biointerphases, 2014. 9(2): p. 029009.1-029009.10.
187. Sigmund, W.M. and Hsu, S.-H., Cassie–Baxter Model, in Encyclopedia of Membranes, E. Drioli and L. Giorno, Editors. 2016, Springer Berlin Heidelberg: Berlin, Heidelberg. p. 310-311.
188. Shimanovich, D.L., Vorobjova, A.I., Tishkevich, D.I., Trukhanov, A.V., Zdorovets, M.V., and Kozlovskiy, A.L., Preparation and morphology-dependent wettability of porous alumina membranes. Beilstein Journal of Nanotechnology, 2018. 9: p. 1423-1436.
189. Aina, A., In situ monitoring of pharmaceutical crystallisation. 2012, University of Nottingham.
190. Brotchie, A., Grieser, F., and Ashokkumar, M., Characterization of acoustic cavitation bubbles in different sound fields. Journal of Physical Chemistry B, 2010. 114(34): p. 11010-11016.
191. Merouani, S., Hamdaoui, O., Rezgui, Y., and Guemini, M., Sensitivity of free radicals production in acoustically driven bubble to the ultrasonic frequency and nature of dissolved gases. Ultrasonics Sonochemistry, 2015. 22: p. 41-50.
192. Koda, S., Kimura, T., Kondo, T., and Mitome, H., A standard method to calibrate sonochemical efficiency of an individual reaction system. Ultrasonics Sonochemistry, 2003. 10(3): p. 149-156.
193. Mark, G., Tauber, A., Rudiger, L.A., Schuchmann, H.P., Schulz, D., Mues, A., and von Sonntag, C., OH-radical formation by ultrasound in aqueous solution - part II: Terephthalate and fricke dosimetry and the influence of various conditions on the sonolytic yield. Ultrasonics Sonochemistry, 1998. 5(2): p. 41-52.
194. Suslick, K.S., Didenko, Y., Fang, M.M., Hyeon, T., Kolbeck, K.J., McNamara, W.B., Mdleleni, M.M., and Wong, M., Acoustic cavitation and its chemical consequences. Philosophical Transactions of the Royal Society A: Mathematical, Physical and Engineering Sciences, 1999. 357(1751): p. 335-353.
195. Price, G.J., Harris, N.K., and Stewart, A.J., Direct observation of cavitation fields at 23 and 515 kHz. Ultrasonics Sonochemistry, 2010. 17(1): p. 30-33.
196. Yasui, K., Tuziuti, T., Kozuka, T., Towata, A., and Iida, Y., Relationship between the bubble temperature and main oxidant created inside an air bubble under ultrasound. Journal of Chemical Physics, 2007. 127(15): p. 154502.1-154502.9.
197. Slanger, T.G. and Copeland, R.A., Energetic oxygen in the upper atmosphere and the laboratory. Chemical Reviews, 2003. 103(12): p. 4731-4766.
198. Tuziuti, T., Hatanaka, S., Yasui, K., Kozuka, T., and Mitome, H., Influence of dissolved oxygen content on multibubble sonoluminescence with ambient-pressure reduction. Ultrasonics, 2002. 40(1-8): p. 651-654.
199. Arakeri, V.H. and Nishad, K.P., Influence of argon content on intensity of multibubble sonoluminescence, in IEEE 3rd International conference on communication software and networks. 2011, IEEE Xi'an, China. p. 353-355.
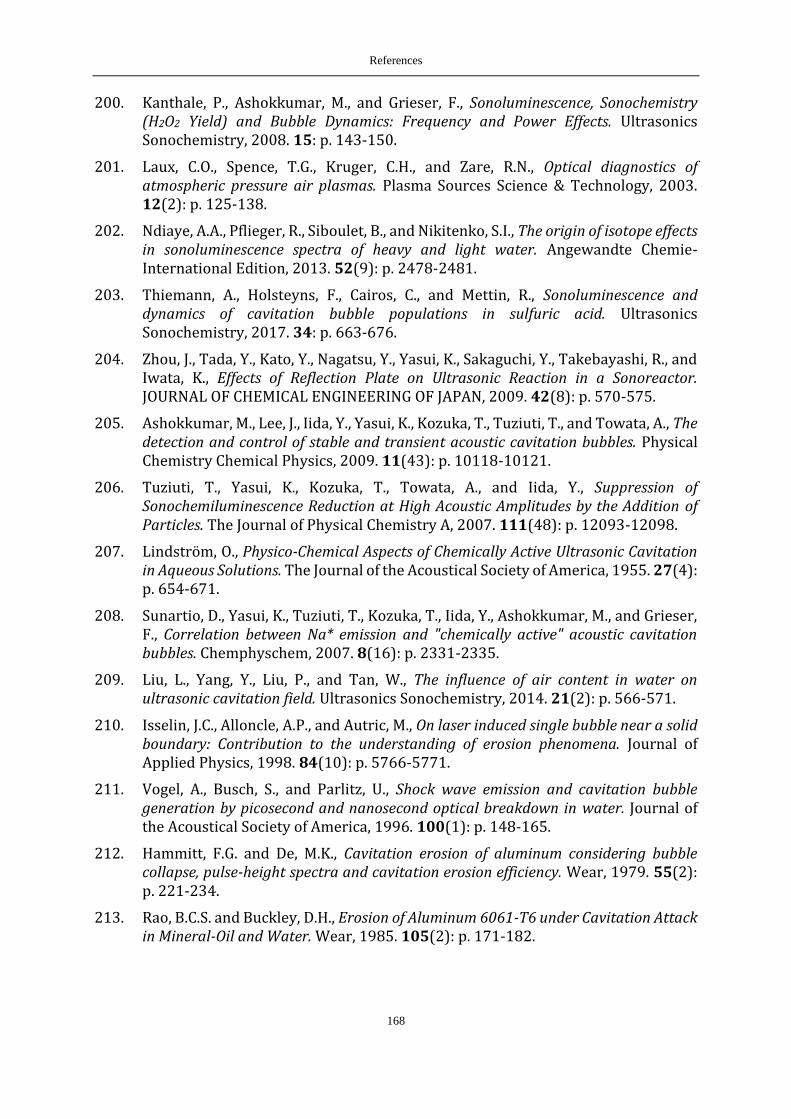
References
168
200. Kanthale, P., Ashokkumar, M., and Grieser, F., Sonoluminescence, Sonochemistry (H2O2 Yield) and Bubble Dynamics: Frequency and Power Effects. Ultrasonics Sonochemistry, 2008. 15: p. 143-150.
201. Laux, C.O., Spence, T.G., Kruger, C.H., and Zare, R.N., Optical diagnostics of atmospheric pressure air plasmas. Plasma Sources Science & Technology, 2003. 12(2): p. 125-138.
202. Ndiaye, A.A., Pflieger, R., Siboulet, B., and Nikitenko, S.I., The origin of isotope effects in sonoluminescence spectra of heavy and light water. Angewandte Chemie-International Edition, 2013. 52(9): p. 2478-2481.
203. Thiemann, A., Holsteyns, F., Cairos, C., and Mettin, R., Sonoluminescence and dynamics of cavitation bubble populations in sulfuric acid. Ultrasonics Sonochemistry, 2017. 34: p. 663-676.
204. Zhou, J., Tada, Y., Kato, Y., Nagatsu, Y., Yasui, K., Sakaguchi, Y., Takebayashi, R., and Iwata, K., Effects of Reflection Plate on Ultrasonic Reaction in a Sonoreactor. JOURNAL OF CHEMICAL ENGINEERING OF JAPAN, 2009. 42(8): p. 570-575.
205. Ashokkumar, M., Lee, J., Iida, Y., Yasui, K., Kozuka, T., Tuziuti, T., and Towata, A., The detection and control of stable and transient acoustic cavitation bubbles. Physical Chemistry Chemical Physics, 2009. 11(43): p. 10118-10121.
206. Tuziuti, T., Yasui, K., Kozuka, T., Towata, A., and Iida, Y., Suppression of Sonochemiluminescence Reduction at High Acoustic Amplitudes by the Addition of Particles. The Journal of Physical Chemistry A, 2007. 111(48): p. 12093-12098.
207. Lindström, O., Physico‐Chemical Aspects of Chemically Active Ultrasonic Cavitation in Aqueous Solutions. The Journal of the Acoustical Society of America, 1955. 27(4): p. 654-671.
208. Sunartio, D., Yasui, K., Tuziuti, T., Kozuka, T., Iida, Y., Ashokkumar, M., and Grieser, F., Correlation between Na* emission and "chemically active" acoustic cavitation bubbles. Chemphyschem, 2007. 8(16): p. 2331-2335.
209. Liu, L., Yang, Y., Liu, P., and Tan, W., The influence of air content in water on ultrasonic cavitation field. Ultrasonics Sonochemistry, 2014. 21(2): p. 566-571.
210. Isselin, J.C., Alloncle, A.P., and Autric, M., On laser induced single bubble near a solid boundary: Contribution to the understanding of erosion phenomena. Journal of Applied Physics, 1998. 84(10): p. 5766-5771.
211. Vogel, A., Busch, S., and Parlitz, U., Shock wave emission and cavitation bubble generation by picosecond and nanosecond optical breakdown in water. Journal of the Acoustical Society of America, 1996. 100(1): p. 148-165.
212. Hammitt, F.G. and De, M.K., Cavitation erosion of aluminum considering bubble collapse, pulse-height spectra and cavitation erosion efficiency. Wear, 1979. 55(2): p. 221-234.
213. Rao, B.C.S. and Buckley, D.H., Erosion of Aluminum 6061-T6 under Cavitation Attack in Mineral-Oil and Water. Wear, 1985. 105(2): p. 171-182.

References
169
214. Chen, H.S., Li, J., Chen, D.R., and Wang, J.D., Damages on Steel Surface at the Incubation Stage of the Vibration Cavitation Erosion in Water. Wear, 2008. 265(5-6): p. 692-698.
215. Virot, M., Pflieger, R., Skorb, E.V., Ravaux, J., Zemb, T., and Mohwald, H., Crystalline Silicon under Acoustic Cavitation: From Mechanoluminescence to Amorphization. Journal of Physical Chemistry C, 2012. 116(29): p. 15493-15499.
216. Skorb, E.V. and Mohwald, H., Ultrasonic Approach for Surface Nanostructuring. Ultrasonics Sonochemistry, 2016. 29: p. 589-603.
217. Fotea, C., Callaway, J., and Alexander, M.R., Characterisation of the surface chemistry of magnesium exposed to the ambient atmosphere. Surface and Interface Analysis, 2006. 38(10): p. 1363-1371.
218. Ogawa, S., Niwa, H., Nakanishi, K., Ohta, T., and Yagi, S., Influence of CO2 and H2O on Air Oxidation of Mg Nanoparticles Studied by NEXAFS. Journal of Surface Analysis, 2011. 17(3): p. 319-323.
219. Wang, Y., Wang, W., Zhong, L., Wang, J., Jiang, Q., and Guo, X., Super-hydrophobic surface on pure magnesium substrate by wet chemical method. Applied Surface Science, 2010. 256(12): p. 3837-3840.
220. Mitrovicscepanovic, V. and Brigham, R.J., Localized corrosion initiation on magnesium alloys. Corrosion, 1992. 48(9): p. 780-784.
221. Berziou, C., Remy, K., Billard, A., and Creus, J., Corrosion behaviour of dc magnetron sputtered Fe1−xMgx alloy films in 3 wt% NaCl solution. Corrosion Science, 2007. 49(11): p. 4276-4295.
222. Lide, D.R., CRC Handbook of Chemistry and Physics. 84th ed. 2003: Taylor & Francis.
223. Hauptmann, M., Struyf, H., De Gendt, S., Glorieux, C., and Brems, S., Importance of bubble size control in ultrasonic surface cleaning by pulsed high-frequency sound fields. Electrochemical Society Journal of Solid State Science and Technology, 2014. 3(1): p. N3032-N3040.
224. Jain, R. and Pitchumani, R., Fractal model for wettability of rough surfaces. Langmuir : the ACS journal of surfaces and colloids, 2017. 33(28): p. 7181-7190.
225. Chave, T., Navarro, N.M., Pochon, P., Perkas, N., Gedanken, A., and Nikitenko, S.I., Sonocatalytic degradation of oxalic acid in the presence of oxygen and Pt/TiO2. Catalysis Today, 2015. 241: p. 55-62.
226. Dükkancı, M. and Gündüz, G., Ultrasonic degradation of oxalic acid in aqueous solutions. Ultrasonics Sonochemistry, 2006. 13(6): p. 517-522.
227. CRC Handbook of Chemistry and Physics. 86th Edition ed. Journal of the American Chemical Society, ed. D.R. Lide. Vol. 128. 2006, Boca Raton: American Chemical Society. 5585.
228. Hasty, E., Chemistry, The Central Science. Third Edition ed. Journal of Chemical Education, ed. T.L.L. Brown, Eugene, Jr. Vol. 64. 1987: American Chemical Society. A173.
229. Drelich, J. and Chibowski, E., Superhydrophilic and Superwetting Surfaces: Definition and Mechanisms of Control. Langmuir, 2010. 26(24): p. 18621-18623.

References
170
230. Nogita, K., Ockert, S., Pierce, J., Greaves, M.C., Gourlay, C.M., and Dahle, A.K., Engineering the Mg-Mg2Ni eutectic transformation to produce improved hydrogen storage alloys. International Journal of Hydrogen Energy, 2009. 34(18): p. 7686-7691.
231. Zainal Abidin, N.I., Atrens, A.D., Martin, D., and Atrens, A., Corrosion of High Purity Mg, Mg2Zn0.2Mn, ZE41 and AZ91 in Hank’s Solution at 37 °C. Corrosion Science, 2011. 53(11): p. 3542-3556.
232. Jung, H.S., Lee, J.K., Kim, J.Y., and Hong, K.S., Crystallization Behaviors of Nanosized MgO Particles from Magnesium Alkoxides. Journal of Colloid and Interface Science, 2003. 259(1): p. 127-132.
233. Valouma, A., Verganelaki, A., Maravelaki-Kalaitzaki, P., and Gidarakos, E., Chrysotile Asbestos Detoxification with a Combined Treatment of Oxalic Acid and Silicates Producing Amorphous Silica and Biomaterial. Journal of Hazardous Materials, 2016. 305: p. 164-170.
234. Rozalen, M. and Huertas, F.J., Comparative Effect of Chrysotile Leaching in Nitric, Sulfuric and Oxalic Acids at Room Temperature. Chemical Geology, 2013. 352: p. 134-142.
235. Chen, H.S. and Liu, S.H., Inelastic Damages by Stress Wave on Steel Surface at the Incubation Stage of Vibration Cavitation Erosion. Wear, 2009. 266(1-2): p. 69-75.
236. Frankel, Pitting corrosion of metals: A review of the critical factors. Journal of the Electrochemical Society, 1998. 145(6): p. 2186-2197.
237. Zhang, R., Qiu, Y., Qi, Y., and Birbilis, N., A closer inspection of a grain boundary immune to intergranular corrosion in a sensitised Al-Mg alloy. Corrosion Science, 2018. 133: p. 1-5.
238. Benjamin, T.B. and Ellis, A.T., The Collapse of Cavitation Bubbles and Pressures Thereby Produced Against Solid Boundaries. Philosophical Transactions of the Royal Society of London Series a-Mathematical and Physical Sciences, 1966. 260(1110): p. 221-240.
239. Tinguely, M., The Effect of Pressure Gradient on the Collapse of Cavitation Bubbles in Normal and Reduced Gravity, in Faculté des sciences et techniques de l'ingénieur. 2013, École polytechnique fédérale de Lausanne EPFL.
240. Borkent, B.M., Gekle, S., Prosperetti, A., and Lohse, D., Nucleation Threshold and Deactivation Mechanisms of Nanoscopic Cavitation Nuclei. Physics of Fluids, 2009. 21(10): p. 1-9.
241. Belova, V., Krasowska, M., Wang, D.Y., Ralston, J., Shchukin, D.G., and Mohwald, H., Influence of Adsorbed Gas at Liquid/Solid Interfaces on Heterogeneous Cavitation. Chemical Science, 2013. 4(1): p. 248-256.
242. Lambertin, D., Rooses, A., and Frizon, F., Galvanic Corrosion of Mg-Zr Alloy and Steel or Graphite in Mineral Binders, in Magnesium Technology 2013, N. Hort, et al., Editors. 2016, Springer International Publishing: Cham. p. 153-155.
243. Su, Y., Lin, J., Su, Y., Zai, W., Li, G., and Wen, C., Investigation on composition, mechanical properties, and corrosion resistance of Mg-0.5Ca-X(Sr, Zr, Sn) biological alloy. Scanning, 2018. 2018: p. 1-10.

References
171
244. Rajchenbach, J., Clamond, D., and Leroux, A., Observation of Star-Shaped Surface Gravity Waves. Physical Review Letters, 2013. 110(9): p. 094502.
245. Brady, M.P., Ievlev, A.V., Fayek, M., Leonard, D.N., Frith, M.G., Meyer, H.M., Ramirez-Cuesta, A.J., Daemen, L.L., Cheng, Y., Guo, W., Poplawsky, J.D., Ovchinnikova, O.S., Thomson, J., Anovitz, L.M., Rother, G., Shin, D., Song, G.-L., and Davis, B., Rapid Diffusion and Nanosegregation of Hydrogen in Magnesium Alloys from Exposure to Water. ACS Applied Materials & Interfaces, 2017. 9(43): p. 38125-38134.
246. Sun Fangfang, L.N.G., Li Qunying, Liu Enzuo, He Chunnain, Shi Chunsheng, Zhao Naiqin, Effect of Sc and Zr additions on microstructures and corrosion behavior of Al-Cu-Mg-Sc-Zr alloys. Journal of Materials Science & Technology, 2017. 33(9): p. 1015-1022.
247. Wen, L.H., Ji, Z.S., Hu, M.L., and Ning, H.Y., Microstructure and mechanical properties of Mg–3.0Nd–0.4Zn–0.4Zr magnesium alloy. Journal of Magnesium and Alloys, 2014. 2(1): p. 85-91.
248. Mikhaylovskaya, A.V., Mochugovskiy, A.G., Levchenko, V.S., Tabachkova, N.Y., Mufalo, W., and Portnoy, V.K., Precipitation behavior of L12 Al3Zr phase in Al-Mg-Zr alloy. Materials Characterization, 2018. 139: p. 30-37.
249. Cançado, L., Takai, K., Enoki, T., Endo, M., Kim, Y., Mizusaki, H., Jorio, A., Coelho, L., Paniago, R., and Pimenta, M., General equation for the determination of the crystallite size La of nanographite by raman spectroscopy. Applied Physics Letters, 2006. 88(16): p. 163106.1-163106.3.
250. Haag, R.M. and MUNCY, C.R., Studies in the system MgUO3—MgUO4. Journal of the American Ceramic Society, 1964. 47(1): p. 34-36.
251. Ondrejcin, R.S. and Garrett, T.P., The thermal decomposition of anhydrous uranyl nitrate and uranyl nitrate dihydrate1. The Journal of Physical Chemistry, 1961. 65(3): p. 470-473.
252. Thein, S.M. and Bereolos, P.J. Thermal stabilization of 233UO2, 233UO3 and 233U3O8 2000. United States.
253. Rodden, C.J., Uranium. 1964: Technical Information Center, Oak Ridge, TN (United States); New Brunswick Lab., AEC, N.J. (United States). Medium: ED.
254. Leiem. Triuranium octoxide. 2014 [cited 2018 May 24]; Available from: https://en.wikipedia.org/wiki/Triuranium_octoxide.
255. Sweet, L.E., Reilly, D.D., Abrecht, D.G., Buck, E.C., Meier, D.E., Su, Y.-F., Brauer, C.S., Schwantes, J.M., Tonkyn, R.G., Szecsody, J.E., Blake, T.A., and Johnson, T.J. Spectroscopic studies of the several isomers of UO3. in SPIE Security + Defence. 2013. SPIE. p. 7.
256. Faêda, K.C.M., Machado, G.C., and Lameiras, F.S., Characterization of UO2 by infrared spectroscopy, in 2011 International Nuclear Atlantic Conference - INAC 2011. 2011, Associao Brasileira De Energia Nuclear - Aben: Belo Horizonte,MG, Brazil.
257. Nakagaki, S., Mantovani, K., Sippel Machado, G., Dias de Freitas Castro, K., and Wypych, F., Recent Advances in Solid Catalysts Obtained by Metalloporphyrins Immobilization on Layered Anionic Exchangers: A Short Review and Some New Catalytic Results. Molecules, 2016. 21(3): p. 291.

References
172
258. Makkos, E., Kerridge, A., Austin, J., and Kaltsoyannis, N., Ionic adsorption on the brucite (0001) surface: A periodic electrostatic embedded cluster method study. The Journal of Chemical Physics, 2016. 145(20): p. 204708.1-204708.36.
259. Pushkaryova, G.I., Sorption extraction of metals from mono- and multicomponent solutions using brucite. Journal of Mining Science, 1999. 35(6): p. 660-663.
260. Cao, Q., Huang, F., Zhuang, Z., and Lin, Z., A study of the potential application of nano-Mg(OH)2 in adsorbing low concentrations of uranyl tricarbonate from water. Nanoscale, 2012. 4(7): p. 2423-2430.
261. Chen, Z., Zhuang, Z., Cao, Q., Pan, X., Guan, X., and Lin, Z., Adsorption-Induced Crystallization of U-Rich Nanocrystals on Nano-Mg(OH)2 and the Aqueous Uranyl Enrichment. ACS Applied Materials & Interfaces, 2014. 6(2): p. 1301-1305.
262. Bochkarev, G.R. and Pushkareva, G.I., Intensification of sorption properties of brucite. Journal of Mining Science, 2005. 41(4): p. 380-384.
263. Pushkareva, G.I. and Bobyleva, S.A., Influence of Ultrasound on the Sorption Properties of Brucite. Journal of Mining Science, 2003. 39(6): p. 616-620.
264. Higginson, R.L., Jackson, C.P., Murrell, E.L., Exworthy, P.A.Z., Mortimer, R.J., Worrall, D.R., and Wilcox, G.D., Effect of thermally grown oxides on colour development of stainless steel. Materials at High Temperatures, 2015. 32(1-2): p. 113-117.
265. Levin, D.A., Laux, C.O., and Kruger, C.H., A General Model for the Spectral Calculation of OH Radiation in the Ultraviolet. Journal of Quantitative Spectroscopy & Radiative Transfer, 1999. 61(3): p. 377-392.
266. Hydrogen Peroxide Ultraviolet Absorption Spectrum. [cited 2018 January 18]; Available from: http://www.h2o2.com/technical-library/physical-chemical-properties/radiation-properties/default.aspx?pid=65.
267. Zhu, Y., Wu, G., Zhang, Y.-H., and Zhao, Q., Growth and characterization of Mg(OH)2 film on magnesium alloy AZ31. Applied Surface Science, 2011. 257(14): p. 6129-6137.
268. Bera, M., Chandravati, Gupta, P., and Maji, P.K., Facile One-Pot Synthesis of Graphene Oxide by Sonication Assisted Mechanochemical Approach and Its Surface Chemistry. Journal of Nanoscience and Nanotechnology, 2018. 18(2): p. 902-912.
269. Gourley, J.T. and Runciman, W.A., Multiphonon infrared absorption spectra of MgO and CaO. Journal of Physics C: Solid State Physics, 1973. 6(3): p. 583-592.
270. Wozniak, N., Spectroscopic Signatures of Uranium Speciation for Forensics. 2017, University of Nevada. p. 238.
271. Poncet, F., Valdivieso, F., Gibert, R., and Pijolat, M., In situ infrared spectroscopic study on uranium oxides during UO3 carboreduction. Materials Chemistry and Physics, 1999. 58(1): p. 55-57.
272. Nicholas, W., Spectroscopic signatures of uranium speciation for forensics, in Chemistry and Biochemistry. 2017, University of Nevada.
273. Honda, K., Atake, T., and Saito, Y., Infrared spectra of oxide films on SUS430 stainless steel formed at temperatures between 473 and 1073 K. Journal of Materials Research, 2016. 7(1): p. 80-84.

References
173
274. Braterman, P.S. and R., C.T., Vibrational spectroscopy of brucite: A molecular simulation investigation. American Mineralogist, 2006. 91(7): p. 1188-1196.
275. Merlen, A., Buijnsters, J., Gerardus, and Pardanaud, C., A guide to and review of the use of multiwavelength raman spectroscopy for characterizing defective aromatic carbon solids: From graphene to amorphous carbons. Coatings, 2017. 7(10): p. 1-55.
276. Kawashima, Y. and Katagiri, G., Fundamentals, overtones, and combinations in the Raman spectrum of graphite. Physical Review B, 1995. 52(14): p. 10053-10059.
277. Palacios, M.L. and Taylor, S.H., Characterization of Uranium Oxides Using in Situ Micro-Raman Spectroscopy. Applied Spectroscopy, 2000. 54(9): p. 1372-1378.
278. Allen, G.C., Butler, I.S., and Nguyen Anh, T., Characterisation of uranium oxides by micro-Raman spectroscopy. Journal of Nuclear Materials, 1987. 144(1): p. 17-19.
279. Allen, G.C. and Griffiths, A.J., Vibrational spectroscopy of alkaline-earth metal uranate compounds. Journal of the Chemical Society, Dalton Transactions, 1979(2): p. 315-319.
280. Thierry, D., Persson, D., Leygraf, C., Boucherit, N., and Hugot-le Goff, A., Raman spectroscopy and XPS investigations of anodic corrosion films formed on FeMo alloys in alkaline solutions. Corrosion Science, 1991. 32(3): p. 273-284.
281. Maslar, J.E., Hurst, W.S., Jr., W.J.B., and Hendricks, J.H., In Situ Raman Spectroscopic Investigation of Stainless Steel Hydrothermal Corrosion. CORROSION, 2002. 58(9): p. 739-747.

174
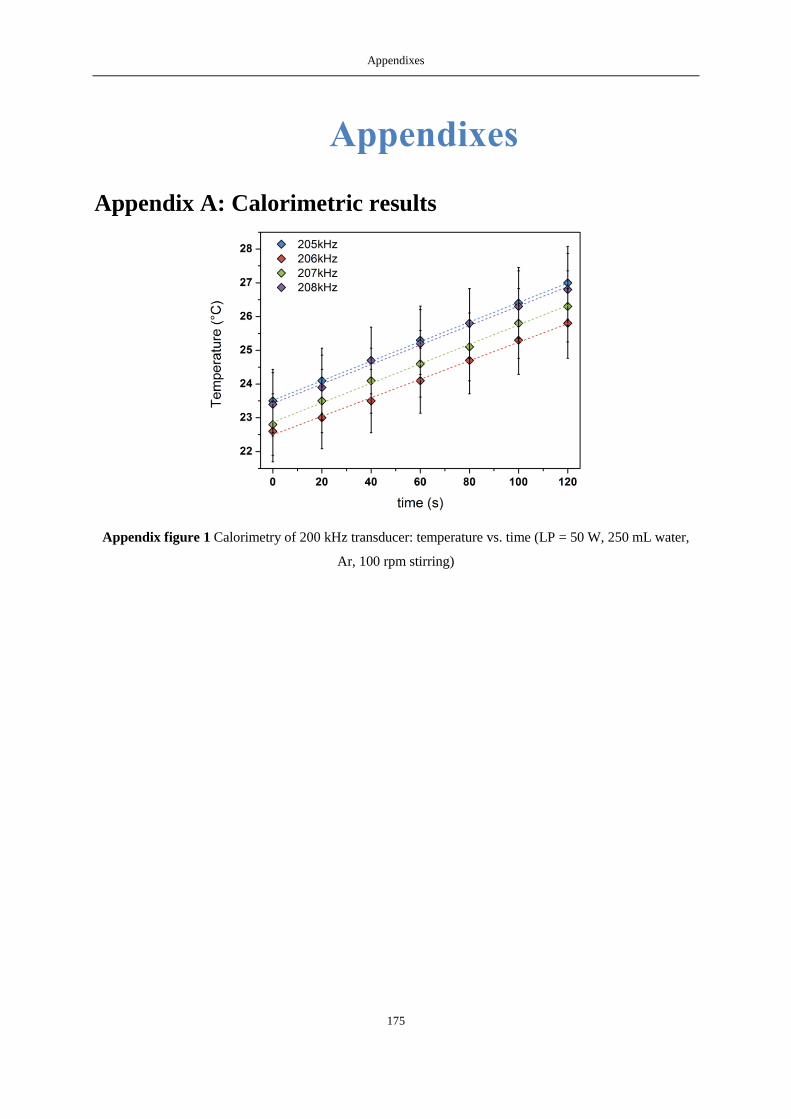
Appendixes
175
Appendixes
Appendix A: Calorimetric results
Appendix figure 1 Calorimetry of 200 kHz transducer: temperature vs. time (LP = 50 W, 250 mL water,
Ar, 100 rpm stirring)
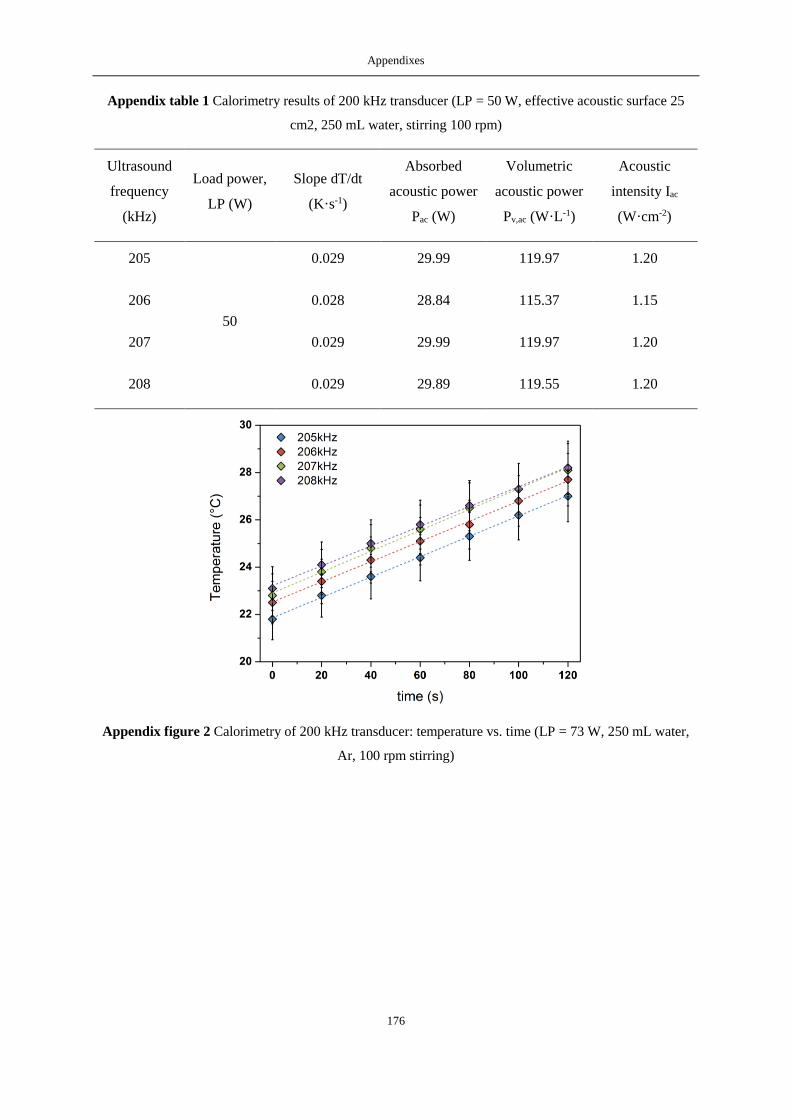
Appendixes
176
Appendix table 1 Calorimetry results of 200 kHz transducer (LP = 50 W, effective acoustic surface 25
cm2, 250 mL water, stirring 100 rpm)
Ultrasound
frequency
(kHz)
Load power,
LP (W)
Slope dT/dt
(K·s-1)
Absorbed
acoustic power
Pac (W)
Volumetric
acoustic power
Pv,ac (W·L-1)
Acoustic
intensity Iac
(W·cm-2)
205
50
0.029 29.99 119.97 1.20
206 0.028 28.84 115.37 1.15
207 0.029 29.99 119.97 1.20
208 0.029 29.89 119.55 1.20
Appendix figure 2 Calorimetry of 200 kHz transducer: temperature vs. time (LP = 73 W, 250 mL water,
Ar, 100 rpm stirring)
Appendixes
177
Appendix table 2 Calorimetry results of 200 kHz transducer (LP = 73 W, effective acoustic surface 25
cm2, 250 mL water, stirring 100 rpm)
Ultrasound
frequency
(kHz)
Load power,
LP (W)
Slope dT/dt
(K·s-1)
Absorbed
acoustic power
Pac (W)
Volumetric
acoustic power
Pv,ac (W·L-1)
Acoustic
intensity Iac
(W·cm-2)
205
73
0.043 45.14 180.58 1.81
206 0.043 44.52 178.07 1.78
207 0.043 45.35 181.41 1.81
208 0.041 42.43 169.71 1.70
Appendix figure 3 Calorimetry of 300 kHz transducer: temperature vs. time (LP = 55 W for 345 kHz and
LP = 60 W for 362 kHz, 250 mL water, Ar, 100 rpm stirring)

Appendixes
178
Appendix table 3 Calorimetry results of 300 kHz transducer: temperature vs. time (LP = 55 W for 345
kHz and LP = 60 W for 362 kHz, 250 mL water, Ar, 100 rpm stirring)
Ultrasound
frequency
(kHz)
Load power,
LP (W)
Slope dT/dt
(K·s-1)
Absorbed
acoustic power
Pac (W)
Volumetric
acoustic power
Pv,ac (W·L-1)
Acoustic
intensity Iac
(W·cm-2)
345 55 0.045 46.61 186.43 1.86
362 60 0.037 38.67 154.66 1.55
Appendix B: Molar extinction coefficient determination
The molar extinction coefficient for the prepared TiOSO4 solution is determined by mixing an equal
volume of TiOSO4 solution with a commercial H2O2 standard solution (diluted from 0 to 5·10-3 M) and
then calibrating with its UV-Visible absorption spectra.
Appendix figure 4 UV-vis absorption spectra of the peroxotitanium(IV) complex formed by mixing
sonicated dilute standard H2O2 solutions with TiOSO4 solution.
The maximum absorbance at 411 nm is selected and multiplied by 2 to plot Appendix figure 5. By
fitting the points, the slope of the linear line equals to 814.34.
ε = A
l × C =
𝑑𝐴
𝑑(l × C) =
𝑑𝐴
𝑙 × 𝑑C
Since l = 1 cm in our case, so 814.34 mol-1·L·cm-1.

Appendixes
179
Appendix figure 5 Calibration curve for the determination of molar extinction coefficient ε.
Appendix C: H2 formation determination during MS
measurement
The relation between mass spectrometer measurement and the concentration of H2 in gas flow (Ar) is
calibrated with standard Ar and Ar/(500 ppm)H2 gases in Appendix table 4, and the coefficient slope 𝑘
is calculated to be 1718.
Appendix table 4 calibration of H2 measurement in mass spectrometer
H2 (ppm) 0 500
H2/Ar 7.3·10-2 0.291
The hydrogen generation rate 𝐶𝐻2 (mol/s) is given by:
𝐶𝐻2 = 𝑘𝑅𝑄 × 10−6/𝑉𝑚
Where 𝑅 is the measured H2/Ar ratio by mass spectrometer, 𝑄 is the Ar gas volumetric flow rate (L/s)
calculated from the volumetric flowmeter measurement and 𝑉𝑚 is the gas molar volume (here we assume
it equals 24 L/mol, as an ideal gas at 1 atmosphere at 25°C).
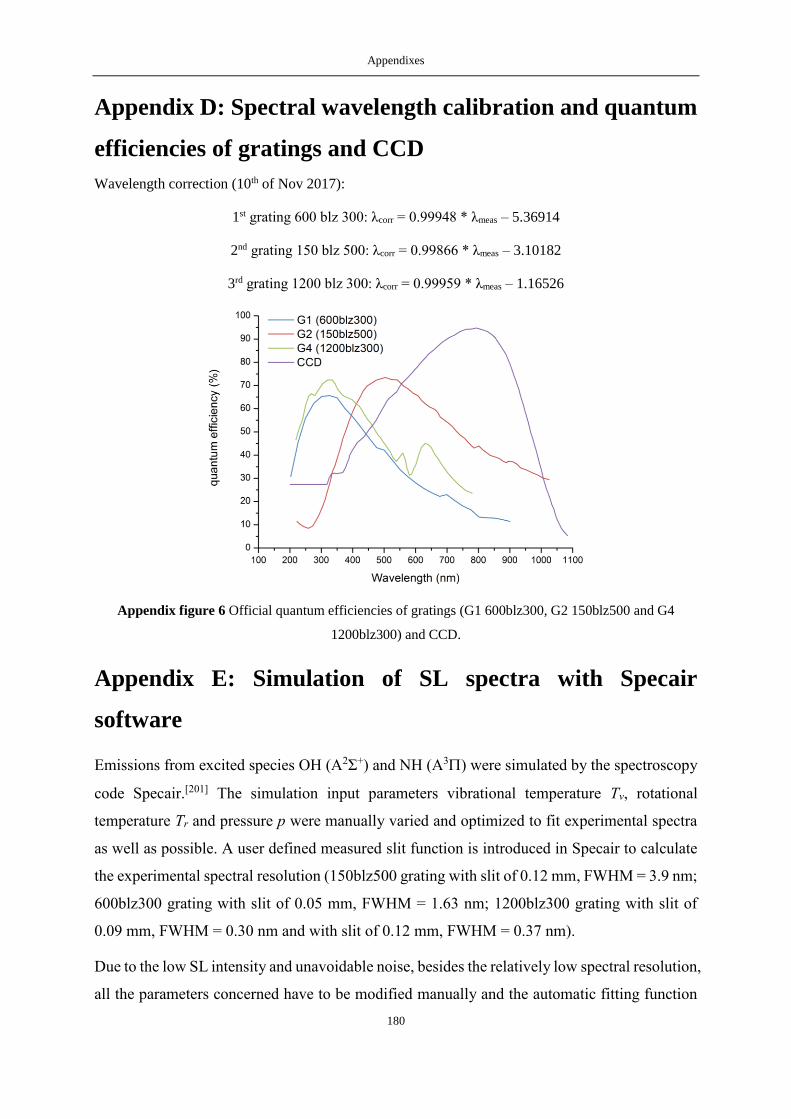
Appendixes
180
Appendix D: Spectral wavelength calibration and quantum
efficiencies of gratings and CCD
Wavelength correction (10th of Nov 2017):
1st grating 600 blz 300: λcorr = 0.99948 * λmeas – 5.36914
2nd grating 150 blz 500: λcorr = 0.99866 * λmeas – 3.10182
3rd grating 1200 blz 300: λcorr = 0.99959 * λmeas – 1.16526
Appendix figure 6 Official quantum efficiencies of gratings (G1 600blz300, G2 150blz500 and G4
1200blz300) and CCD.
Appendix E: Simulation of SL spectra with Specair
software
Emissions from excited species OH (A2Σ+) and NH (A3) were simulated by the spectroscopy
code Specair.[201] The simulation input parameters vibrational temperature Tv, rotational
temperature Tr and pressure p were manually varied and optimized to fit experimental spectra
as well as possible. A user defined measured slit function is introduced in Specair to calculate
the experimental spectral resolution (150blz500 grating with slit of 0.12 mm, FWHM = 3.9 nm;
600blz300 grating with slit of 0.05 mm, FWHM = 1.63 nm; 1200blz300 grating with slit of
0.09 mm, FWHM = 0.30 nm and with slit of 0.12 mm, FWHM = 0.37 nm).
Due to the low SL intensity and unavoidable noise, besides the relatively low spectral resolution,
all the parameters concerned have to be modified manually and the automatic fitting function

Appendixes
181
is not usable. For example, for OH the relative intensities of the two peaks at about 307 and 309
nm depend on Tr and p; the spectrum shape at wavelengths between 310 and 315 nm is sensitive
to both Tr and Tv (contributions from both 0-0 and 1-1 transitions). The pressure also decides
the broadness of the transition lines.[265] As discussed recently[201] in SL spectra the pressure is
not the only parameter determining the broadening of the emissions, but strong Stark effects
also occur. Unfortunately, they are not taken into account in existing spectroscopy software.
Thus, the pressure value was increased to reproduce the broadening, and this parameter should
be considered as an “effective pressure” combining pressure and Stark effects.
Appendix F: SL emission absorption by H2O2
Appendix figure 7 H2O2 absorption spectrum.[266]
Appendix figure 8 H2O2 absorption effect: comparison of the first and last measurements of H2O SL
spectra at 362 kHz ultrasound (43W, 18°C) under 100 mL.min-1 Ar-20%O2 flow.
Appendix figure 7 and Appendix figure 8 show that the SL emission absorption by H2O2 accumulation
is important after certain duration (1 hour). This absorption decreases the SL emission. Thus the
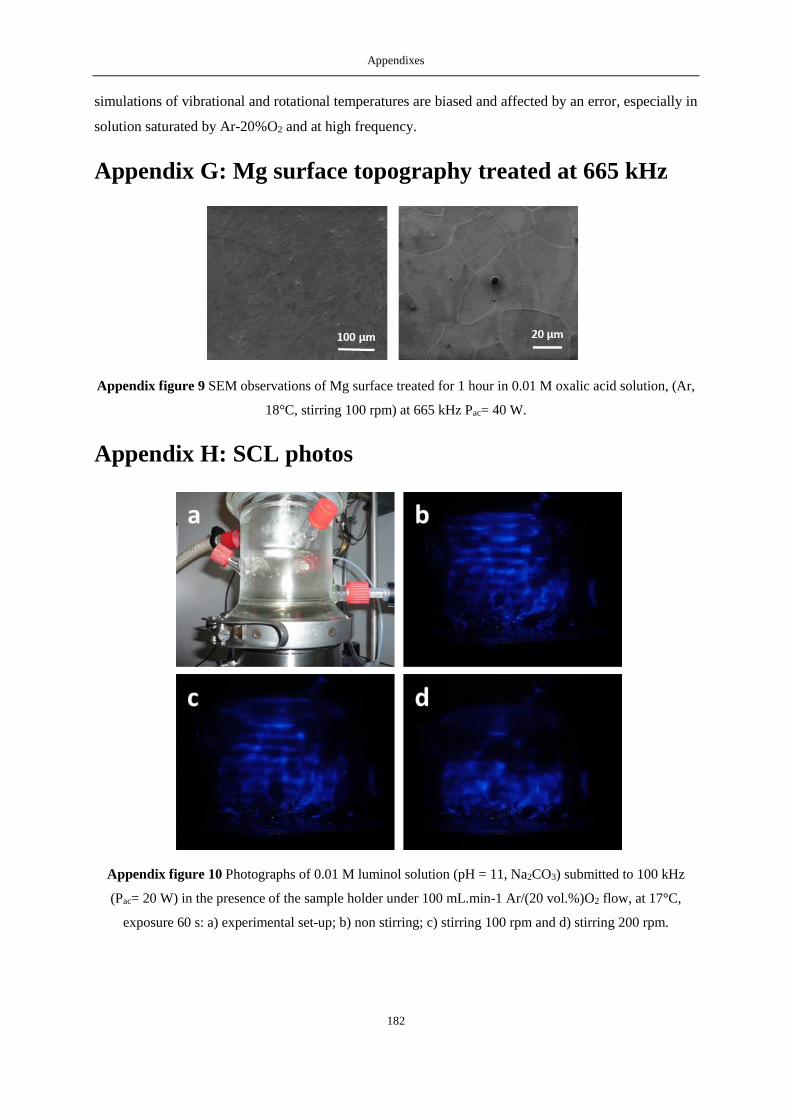
Appendixes
182
simulations of vibrational and rotational temperatures are biased and affected by an error, especially in
solution saturated by Ar-20%O2 and at high frequency.
Appendix G: Mg surface topography treated at 665 kHz
Appendix figure 9 SEM observations of Mg surface treated for 1 hour in 0.01 M oxalic acid solution, (Ar,
18°C, stirring 100 rpm) at 665 kHz Pac= 40 W.
Appendix H: SCL photos
Appendix figure 10 Photographs of 0.01 M luminol solution (pH = 11, Na2CO3) submitted to 100 kHz
(Pac= 20 W) in the presence of the sample holder under 100 mL.min-1 Ar/(20 vol.%)O2 flow, at 17°C,
exposure 60 s: a) experimental set-up; b) non stirring; c) stirring 100 rpm and d) stirring 200 rpm.
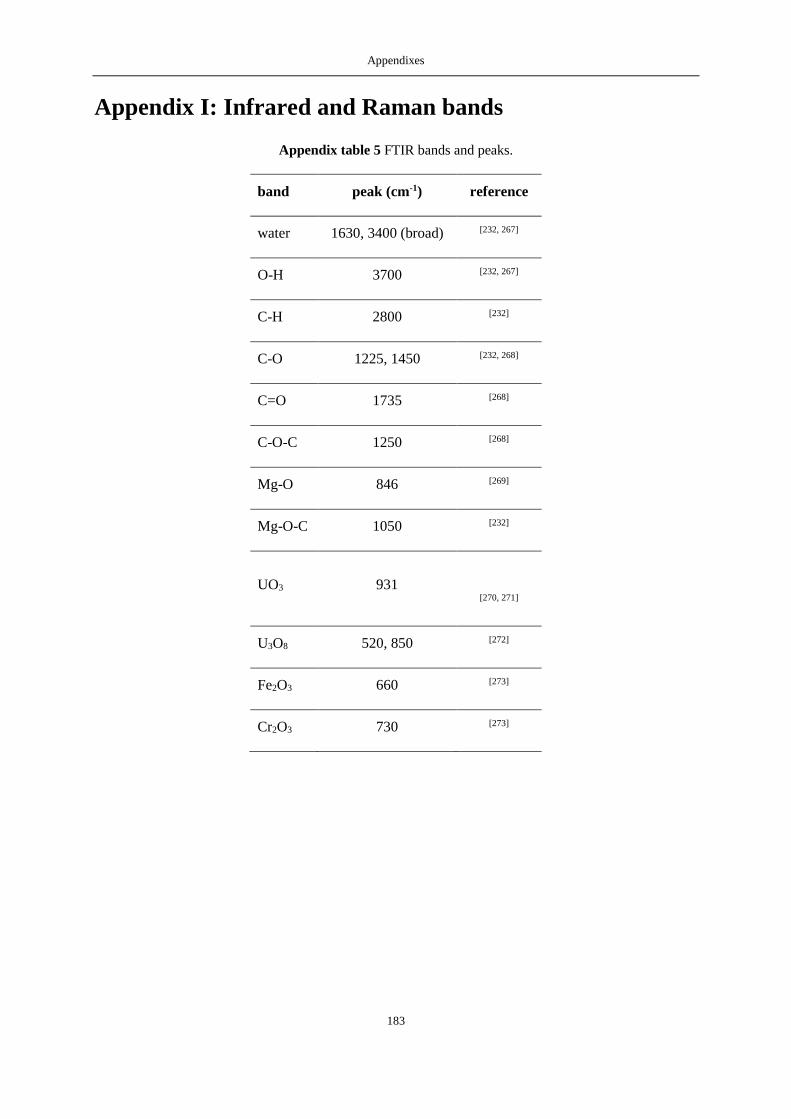
Appendixes
183
Appendix I: Infrared and Raman bands
Appendix table 5 FTIR bands and peaks.
band peak (cm-1) reference
water 1630, 3400 (broad) [232, 267]
O-H 3700 [232, 267]
C-H 2800 [232]
C-O 1225, 1450 [232, 268]
C=O 1735 [268]
C-O-C 1250 [268]
Mg-O 846 [269]
Mg-O-C 1050 [232]
UO3 931
[270, 271]
U3O8 520, 850 [272]
Fe2O3 660 [273]
Cr2O3 730 [273]

Appendixes
184
Appendix table 6 Raman bands and peaks.
band peak (cm-1) reference
Mg-OH 700 - 1000 [274]
C=C 1350, 1580 [275, 276]
UO3 846 [277]
U3O8 342, 412, 483, 738, 798 [277, 278]
non-stoichiometric
MgxUyOz
250, 282, 365, 525,
535, 747
[279]
Fe2O3 225, 247, 299 [280]
NiFe2O4 665, 1345 [281]
NiCr2O4 512, 616 [281]

Appendixes
185
Appendix J: Alpha spectra of Mg-Zr surface
decontamination
Appendix Figure 11 α spectra of Mg-Zr surfaces contaminated with U (0.1 M UO2(NO3)2)
decontaminated by 345 kHz ultrasound, Pac= 40 W in 0.01 M oxalic acid, Ar, stirring 100 rpm, 20°C, from
0 min to 90 min