Hydrodynamic cavitation for sonochemical effects
13
Ultrasonics Sonochemistry 6 (1999) 53–65 Hydrodynamic cavitation for sonochemical e ects V.S. Moholkar*, P. Senthil Kumar, A.B. Pandit Chemical Engineering Division, University Department of Chemical Technology, University of Bombay, Matunga, Bombay – 400 019, India Abstract A comparative study of hydrodynamic and acoustic cavitation has been made on the basis of numerical solutions of the Rayleigh–Plesset equation. The bubble/cavity behaviour has been studied under both acoustic and hydrodynamic cavitation conditions. The e ect of varying pressure fields on the collapse of the cavity (sinusoidal for acoustic and linear for hydrodynamic) and also on the latter’s dynamic behaviour has been studied. The variations of parameters such as initial cavity size, intensity of the acoustic field and irradiation frequency in the case of acoustic cavitation, and initial cavity size, final recovery pressure and time for pressure recovery in the case of hydrodynamic cavitation, have been found to have significant e ects on cavity/bubble dynamics. The simulations reveal that the bubble/cavity collapsing behaviour in the case of hydrodynamic cavitation is accompanied by a large number of pressure pulses of relatively smaller magnitude, compared with just one or two pulses under acoustic cavitation. It has been shown that hydrodynamic cavitation o ers greater control over operating parameters and the resultant cavitation intensity. Finally, a brief summary of the experimental results on the oxidation of aqueous KI solution with a hydrodynamic cavitation set-up is given which supports the conclusion of this numerical study. The methodology presented allows one to manipulate and optimise of specific process, either physical or chemical. © 1999 Elsevier Science B.V. All rights reserved. Keywords: Acoustic cavitation; Bubble dynamics; Hydrodynamic cavitation; Sonochemistry 1. Introduction Hydrodynamic cavitation is the cheaper alternative for the above processes. Here, cavitation is generated Cavitation as a source of energy input for chemical by the flow of a liquid under controlled conditions processes is increasingly being studied owing to its through simple geometries such as venturi-tubes and ability to generate high temperatures and pressures (hot orifice plates. When the pressure at the throat falls spots) under nearly ambient conditions. The possibility below the vapor pressure of the liquid, the liquid flashes, of exploitation stems from the fact that millions of generating a number of cavities which subsequently cavities grow and collapse simultaneously at di erent collapse when pressure recovers downstream of the locations. Until now, ultrasound was the only tool used mechanical constriction. Although the phenomenon has for the generation of cavities that has been studied been extensively studied in the past decade, the main extensively in the past. In this method ultrasound gener- e ort was concentrated on the suppression of cavitation ates, grows and collapses the cavities. The whole process due to its destructive nature in liquid transportation. of generation, growth and collapse of cavities occurs in Our e ort is to use the conditions generated by hydrody- an extremely short period of time, of the order of few namic cavitation for beneficial purposes. A number of microseconds. In spite of extensive research, there is studies made earlier, such as hydrolysis of fatty oils [1] hardly any chemical processing carried out on an indu- cell disruption [2] and polymerization/depolymerization strial scale owing to the lack of expertise required in of aqueous polymeric solutions [3], proved the process such diverse fields as material science, acoustics, chemi- to be more energy-e cient than its counterpart. cal engineering, etc., for scaling up successful lab-scale In the following work, we have made an attempt to processes. analyze acoustic and hydrodynamic cavitation by study- ing the bubble behavior in both types of cavitation and tried to develop an analogy between the two. Also, the * Corresponding author. Present address: Department of Chemical possibility of using hydrodynamic cavitation as a surro- Engineering, University of Twente, P.O. Box 217, 7500 AE Enschede, The Netherlands. e-mail: [email protected]. gate for acoustic cavitation has been discussed. 1350-4177/99/$ – see front matter © 1999 Elsevier Science B.V. All rights reserved. PII: S1350-4177(98)00030-3
Transcript of Hydrodynamic cavitation for sonochemical effects
Ultrasonics Sonochemistry 6 (1999) 53–65
Hydrodynamic cavitation for sonochemical effectsV.S. Moholkar*, P. Senthil Kumar, A.B. Pandit
Chemical Engineering Division, University Department of Chemical Technology, University of Bombay, Matunga, Bombay – 400 019, India
Abstract
A comparative study of hydrodynamic and acoustic cavitation has been made on the basis of numerical solutions of theRayleigh–Plesset equation. The bubble/cavity behaviour has been studied under both acoustic and hydrodynamic cavitationconditions. The effect of varying pressure fields on the collapse of the cavity (sinusoidal for acoustic and linear for hydrodynamic)and also on the latter’s dynamic behaviour has been studied. The variations of parameters such as initial cavity size, intensity ofthe acoustic field and irradiation frequency in the case of acoustic cavitation, and initial cavity size, final recovery pressure andtime for pressure recovery in the case of hydrodynamic cavitation, have been found to have significant effects on cavity/bubbledynamics. The simulations reveal that the bubble/cavity collapsing behaviour in the case of hydrodynamic cavitation is accompaniedby a large number of pressure pulses of relatively smaller magnitude, compared with just one or two pulses under acousticcavitation. It has been shown that hydrodynamic cavitation offers greater control over operating parameters and the resultantcavitation intensity. Finally, a brief summary of the experimental results on the oxidation of aqueous KI solution with ahydrodynamic cavitation set-up is given which supports the conclusion of this numerical study. The methodology presented allowsone to manipulate and optimise of specific process, either physical or chemical. © 1999 Elsevier Science B.V. All rights reserved.
Keywords: Acoustic cavitation; Bubble dynamics; Hydrodynamic cavitation; Sonochemistry
1. Introduction Hydrodynamic cavitation is the cheaper alternativefor the above processes. Here, cavitation is generated
Cavitation as a source of energy input for chemical by the flow of a liquid under controlled conditionsprocesses is increasingly being studied owing to its through simple geometries such as venturi-tubes andability to generate high temperatures and pressures (hot orifice plates. When the pressure at the throat fallsspots) under nearly ambient conditions. The possibility below the vapor pressure of the liquid, the liquid flashes,of exploitation stems from the fact that millions of generating a number of cavities which subsequentlycavities grow and collapse simultaneously at different collapse when pressure recovers downstream of thelocations. Until now, ultrasound was the only tool used mechanical constriction. Although the phenomenon hasfor the generation of cavities that has been studied been extensively studied in the past decade, the mainextensively in the past. In this method ultrasound gener- effort was concentrated on the suppression of cavitationates, grows and collapses the cavities. The whole process due to its destructive nature in liquid transportation.of generation, growth and collapse of cavities occurs in Our effort is to use the conditions generated by hydrody-an extremely short period of time, of the order of few namic cavitation for beneficial purposes. A number ofmicroseconds. In spite of extensive research, there is studies made earlier, such as hydrolysis of fatty oils [1]hardly any chemical processing carried out on an indu- cell disruption [2] and polymerization/depolymerizationstrial scale owing to the lack of expertise required in of aqueous polymeric solutions [3], proved the processsuch diverse fields as material science, acoustics, chemi- to be more energy-efficient than its counterpart.cal engineering, etc., for scaling up successful lab-scale In the following work, we have made an attempt toprocesses. analyze acoustic and hydrodynamic cavitation by study-
ing the bubble behavior in both types of cavitation andtried to develop an analogy between the two. Also, the* Corresponding author. Present address: Department of Chemicalpossibility of using hydrodynamic cavitation as a surro-Engineering, University of Twente, P.O. Box 217, 7500 AE Enschede,
The Netherlands. e-mail: [email protected]. gate for acoustic cavitation has been discussed.
1350-4177/99/$ – see front matter © 1999 Elsevier Science B.V. All rights reserved.PII: S1350-4177 ( 98 ) 00030-3
54 V.S. Moholkar et al. / Ultrasonics Sonochemistry 6 (1999) 53–65
2. Mathematical modeling study of acoustic and hydrodynamic cavitation, such acomplication is not justified at this stage.
The first analysis of a problem in cavitation andbubble dynamics was made by Rayleigh [4], who solved
2.1. Analysis of acoustic cavitationthe problem of the collapse of the cavity in a large massof liquid. With the neglect of surface tension and viscos-
Acoustic cavitation is a result of pressure variationity and with the assumption of liquid incompressibility,in the liquid when ultrasound waves pass through it.Rayleigh showed from the momentum equation that theThe molecules of the cavitating medium under the actionbubble boundary R(t) obeyed the equation,of an acoustic field will vibrate about their mean posi-tions and an acoustic wave will be superimposed upon
Rd2R
dt2+
3
2 AdR
dt B2=P(R)−P2
r(1)
the already existing ambient pressure present in theliquid.
where r is the density of the liquid, P2
is the pressure During the compression cycle, the average distancein the liquid at infinity and P(R) is the pressure in the between the molecules is decreased while during theliquid at the bubble boundary. rarefaction cycle the distance increases. If a sufficiently
The pressure in the liquid is readily found to obey large negative pressure is applied to the liquid, such thatthe relation, the average distance between the molecules exceeds the
critical molecular distance necessary to hold the liquidP(R, t)=P
2+
R
r[P(R)−P
2] intact, the liquid will break down and voids or cavities
will be created – i.e., cavitation bubbles will be formed.Once produced, these cavities or bubbles may grow
+1
2r
R
r AdR
dt B2C1−AR
r B3D. (2) in size until the maximum negative pressure has beenreached. In the succeeding compression cycle of the
While Rayleigh neglected surface tension and liquid wave, however, they will be forced to contract, i.e.,viscosity and kept the pressure P
2constant, his dynami- decrease in volume, and some of them may even collapse.
cal equation can readily be extended to include these The shock waves produced on total collapse of theeffects. bubbles have been estimated to be of the order of several
For a spherical bubble the viscosity affects only the thousands of atmospheres.boundary conditions so that it becomes, Estimates of the acoustic pressure necessary to cause
cavitation in water has led to a value of approximately100 atm. In practice, cavitation occurs at considerablyP(R)=Pi−
2s
R−
4m
R AdR
dt B (3)lower values ( less than 20 atm) and this is undoubtedlydue to the presence of weak spots in the liquid thatwhere now Pi is the pressure in the bubble and P(R) aslower the liquid’s tensile strength.before is the pressure in the liquid at the bubble bound-
Here we attempt to study the acoustic cavitation inary. The surface tension constant and the coefficient ofthe air–water system, investigating the factors that affectviscosity are s and m, respectively. By allowing P
2to
acoustic cavitation with the help of numerical simula-be a function of time, one can find out the radius–timetions of the Rayleigh–Plesset equation.history of bubble oscillations.
With the inclusion of surface tension and viscosityeffects the equation of bubble dynamics becomes, 2.1.1. Mathematical modeling of acoustic cavitation
When an ultrasound wave of pressure amplitude PA andR
d2R
dt2+
3
2 AdR
dt B2= 1
r CPi−P2−
2s
R−
4m
R AdR
dt BD. frequency f passes through a cavitating medium, thepressure P in the liquid at any time is given as,
(4)P(t)=Po−PA sin(2pft). (5)
This equation, famous as the Rayleigh–Plesset equation,forms the basis of our analysis [5]. Now, in order to study the effect of such an oscillating
The current numerical scheme simulations of bubble field on bubble behavior, we can substitute P(t) as P2behavior were compared with those reported by Miksis in the Rayleigh–Plesset equation, and this equation can
and Ting [6 ] and found to be identical. later be solved by the Range–Kutta method to find theThe Rayleigh–Plesset equation is valid only up to the radius and pressure pulse history of bubble oscillation.
point when the bubble wall velocity is less than the The pressure amplitude of the sound field PA is asonic velocity in the cavitating medium. The equation function of the acoustic intensity and is given asdeveloped by Gilmore [7] can take into account theliquid incompressibility effects, but for a comparative PA=
E2IrC (6)
55V.S. Moholkar et al. / Ultrasonics Sonochemistry 6 (1999) 53–65
where r is the density of the cavitating medium and C 2.2.2. Mathematical modeling of hydrodynamiccavitationis the velocity of sound through the liquid.
As explained in the analysis of hydrodynamic cavita-tion, it is the result of a reduction in pressure down-2.2. Analysis of hydrodynamic cavitationstream of the orifice. In the present study, the basis forcalculation is the cavitation number as 1.25.Cavitation can also be achieved by throttling a valve
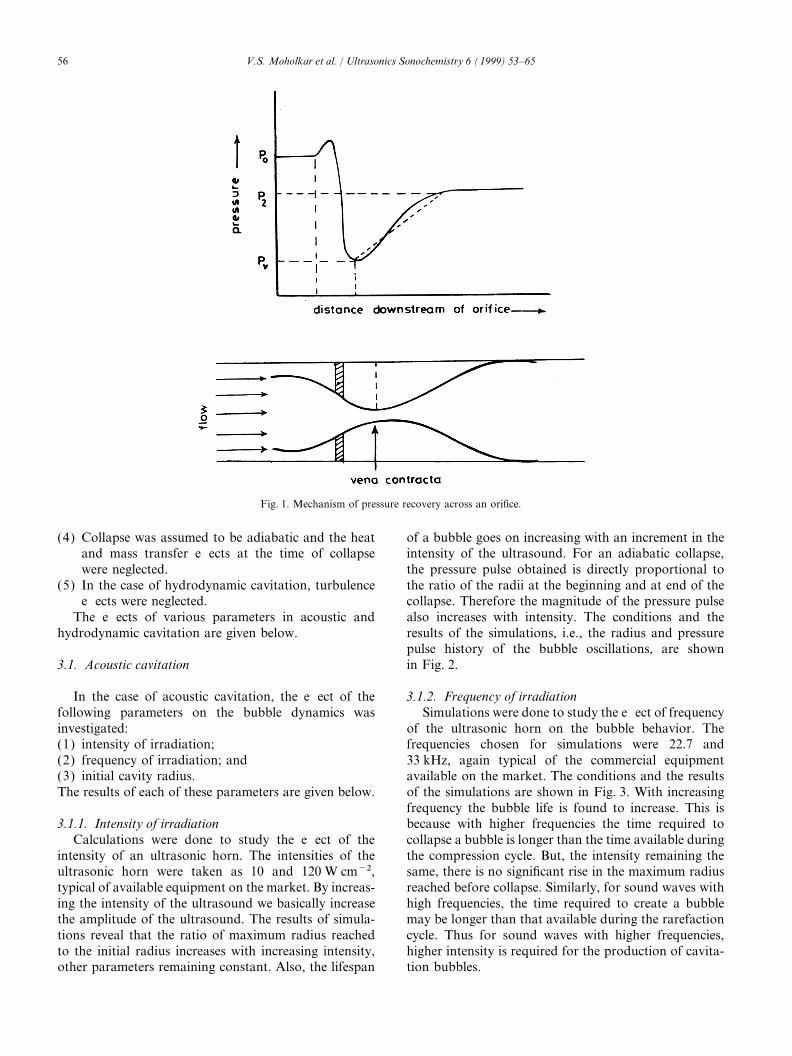
The pressure recovery profile downstream of thedownstream of a pump. This phenomenon can be eluci-orifice is assumed to be linear, and the experimentaldated as follows.measurements of Yan et al. [8] agree with this assump-If a liquid is flowing through an orifice, the reductiontion. A typical pressure recovery profile is shown inin cross-section of the flowing stream increases theFig. 1. The distance of the pressure recovery is usuallyvelocity head at the expense of the pressure head. Duringeight pipe diameters downstream of the orifice. The timethe re-expansion of the flow the fluid stream gets sepa-for pressure recovery is a function of orifice diameter,rated at the lower end of the orifice and eddies arepipe diameter, the ratio of orifice to pipe diameter,generated. Owing to this turbulence and the large frictiondischarge pressure of the cavitating pump and theloss generated by the eddies, a permanent pressure losscavitation number. A detailed calculation of the recoveryis inevitable and full pressure restoration does not taketime is described by Moholkar [9], and in this workplace. The static pressure at the vena contracta is lesstypical values of pressure recovery times have beenthan the bulk pressure downstream of the flow.taken for analysis.However, as velocity is increased, the pressure drop
Next, with the knowledge of the time of pressureacross the orifice increases and the pressure at the venarecovery (t), the linear pressure recovery profilecontracta decreases. At a particular velocity the pressurebecomes,may actually fall below the vapor pressure of the liquid
being pumped, thus causing partial vaporization of thecavitating fluid. P2=Pv+
(P2−Pv)
tt. (8)
Also with the reduction of pressure at the orificethere is liberation of the gases which are dissolved in
This value of P2
can now be substituted into thethe cavitating liquid. These gas bubbles also oscillateRayleigh–Plesset equation to determine the radius andand then give rise to the pressure and temperature pulses.pressure recovery pulse history of bubble dynamics inhydrodynamic cavitation.
2.2.1. Cavitation numberBefore we start discussing the mathematical modeling
of hydrodynamic cavitation, let us ponder over a dimen-sionless parameter called the cavitation number. The
3. Results and discussioncavitation number is generally used in hydrodynamiccavitation and is defined as
Simulations of the Rayleigh–Plesset equation for bothhydrodynamic and acoustic cavitations were carried out
Ci=
P2−Pv
1/2rV2(7) for conditions similar to an experiment. The effect of
various parameters on bubble behavior under bothacoustic and hydrodynamic cavitation was found out.where P2 is the downstream pressure, Pv is the vapor
pressure of water, r is the density of water and V is the The time interval for integration of the Rayleigh–Plessetequation has been selected so as not to exceed theaverage velocity near the orifice. According to this, the
pressure downstream of the orifice will fall below the computer memory. One might get the intermediatevalues of bubble behavior and a greater number ofvapor pressure of the liquid when the cavitation number
is 1 or lower. This is the cavitation inception number. pressure pulses by reducing the time interval of integ-ration, but they are certainly not more than what weThe characteristics of cavitation number are as fol-
lows [8]: have obtained.The following assumptions were made during(1) it is independent of the velocity in the pipe and
shows a dependence on the orifice size in the same analysis.(1) Only one bubble is considered at a time. The effectspipe;
(2) it increases linearly with the diameter ratio of orifice of collective oscillations of the bubble are neglected.(2) The liquid was assumed to be incompressible andto pipe; and
(3) cavitation inception occurs at Ci=1 to 2.5, depend- the iterations were stopped at the point where the
bubble wall velocity exceeded the velocity of sounding on the size of the constriction, and the severityof the cavitation increases with decreasing cavita- in water.
(3) There is no interference from dissolved gases.tion number.
56 V.S. Moholkar et al. / Ultrasonics Sonochemistry 6 (1999) 53–65
Fig. 1. Mechanism of pressure recovery across an orifice.
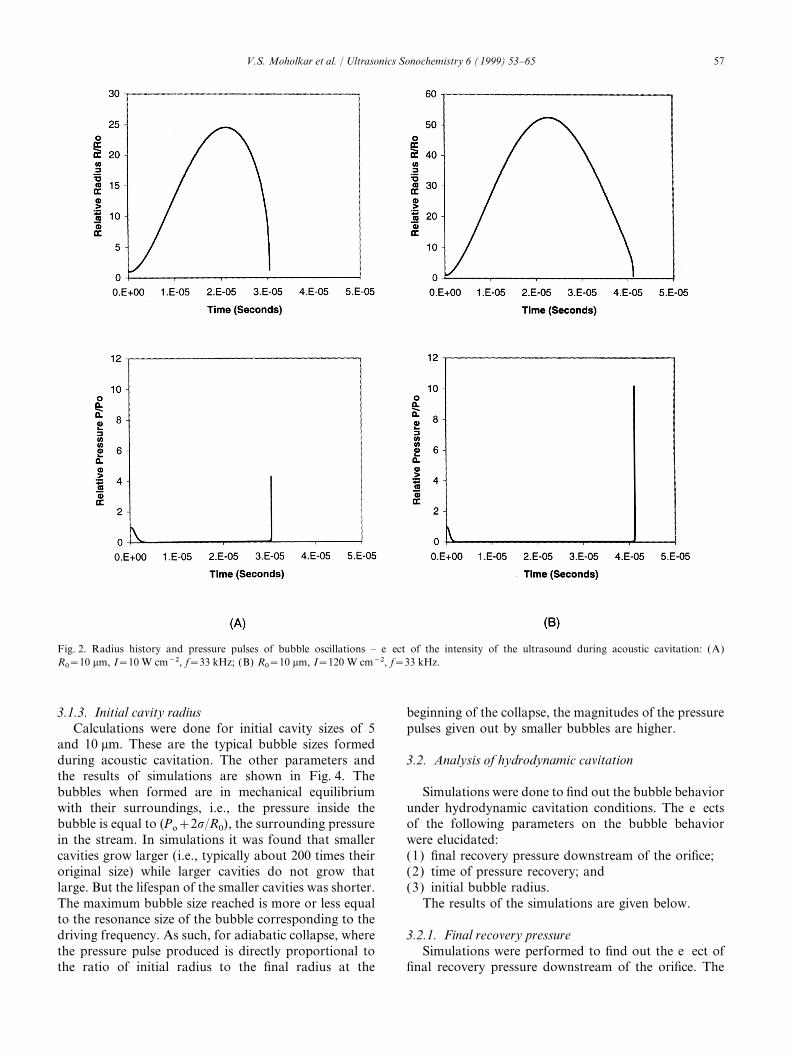
(4) Collapse was assumed to be adiabatic and the heat of a bubble goes on increasing with an increment in theintensity of the ultrasound. For an adiabatic collapse,and mass transfer effects at the time of collapse
were neglected. the pressure pulse obtained is directly proportional tothe ratio of the radii at the beginning and at end of the(5) In the case of hydrodynamic cavitation, turbulence
effects were neglected. collapse. Therefore the magnitude of the pressure pulsealso increases with intensity. The conditions and theThe effects of various parameters in acoustic and
hydrodynamic cavitation are given below. results of the simulations, i.e., the radius and pressurepulse history of the bubble oscillations, are shownin Fig. 2.3.1. Acoustic cavitation
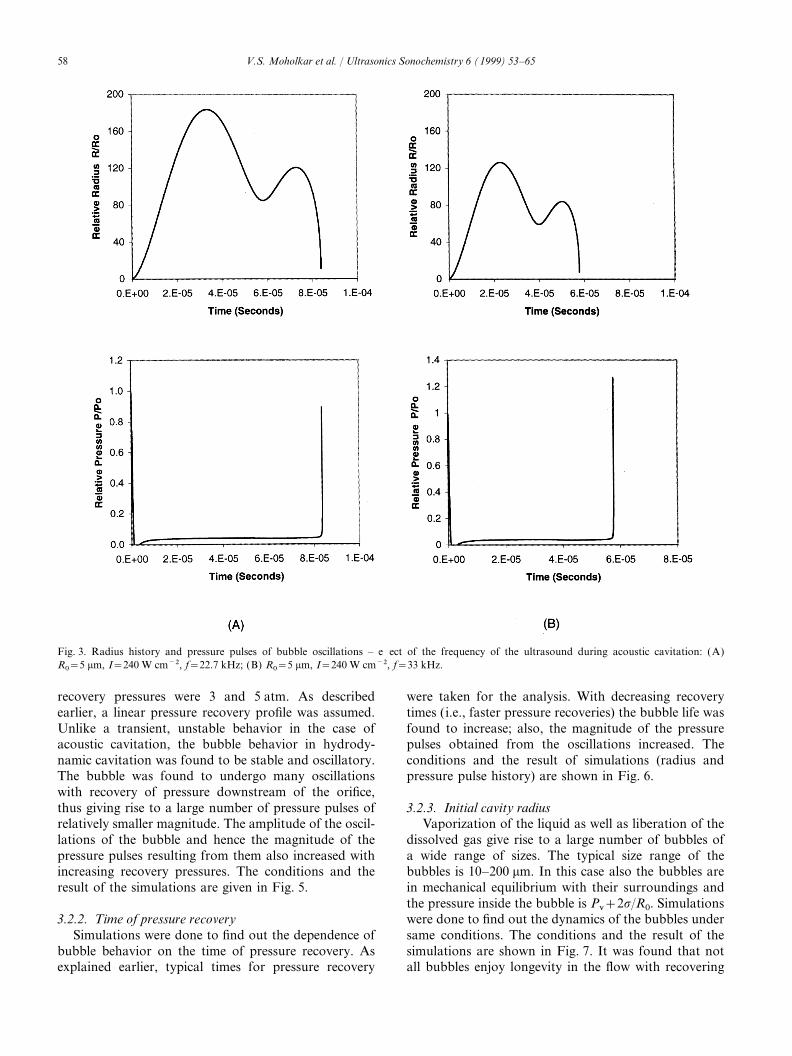
In the case of acoustic cavitation, the effect of the 3.1.2. Frequency of irradiationSimulations were done to study the effect of frequencyfollowing parameters on the bubble dynamics was
investigated: of the ultrasonic horn on the bubble behavior. Thefrequencies chosen for simulations were 22.7 and(1) intensity of irradiation;
(2) frequency of irradiation; and 33 kHz, again typical of the commercial equipmentavailable on the market. The conditions and the results(3) initial cavity radius.
The results of each of these parameters are given below. of the simulations are shown in Fig. 3. With increasingfrequency the bubble life is found to increase. This isbecause with higher frequencies the time required to3.1.1. Intensity of irradiation
Calculations were done to study the effect of the collapse a bubble is longer than the time available duringthe compression cycle. But, the intensity remaining theintensity of an ultrasonic horn. The intensities of the
ultrasonic horn were taken as 10 and 120 W cm−2, same, there is no significant rise in the maximum radiusreached before collapse. Similarly, for sound waves withtypical of available equipment on the market. By increas-
ing the intensity of the ultrasound we basically increase high frequencies, the time required to create a bubblemay be longer than that available during the rarefactionthe amplitude of the ultrasound. The results of simula-
tions reveal that the ratio of maximum radius reached cycle. Thus for sound waves with higher frequencies,higher intensity is required for the production of cavita-to the initial radius increases with increasing intensity,
other parameters remaining constant. Also, the lifespan tion bubbles.
57V.S. Moholkar et al. / Ultrasonics Sonochemistry 6 (1999) 53–65
Fig. 2. Radius history and pressure pulses of bubble oscillations – effect of the intensity of the ultrasound during acoustic cavitation: (A)R0=10 mm, I=10 W cm−2, f=33 kHz; (B) R0=10 mm, I=120 W cm−2, f=33 kHz.
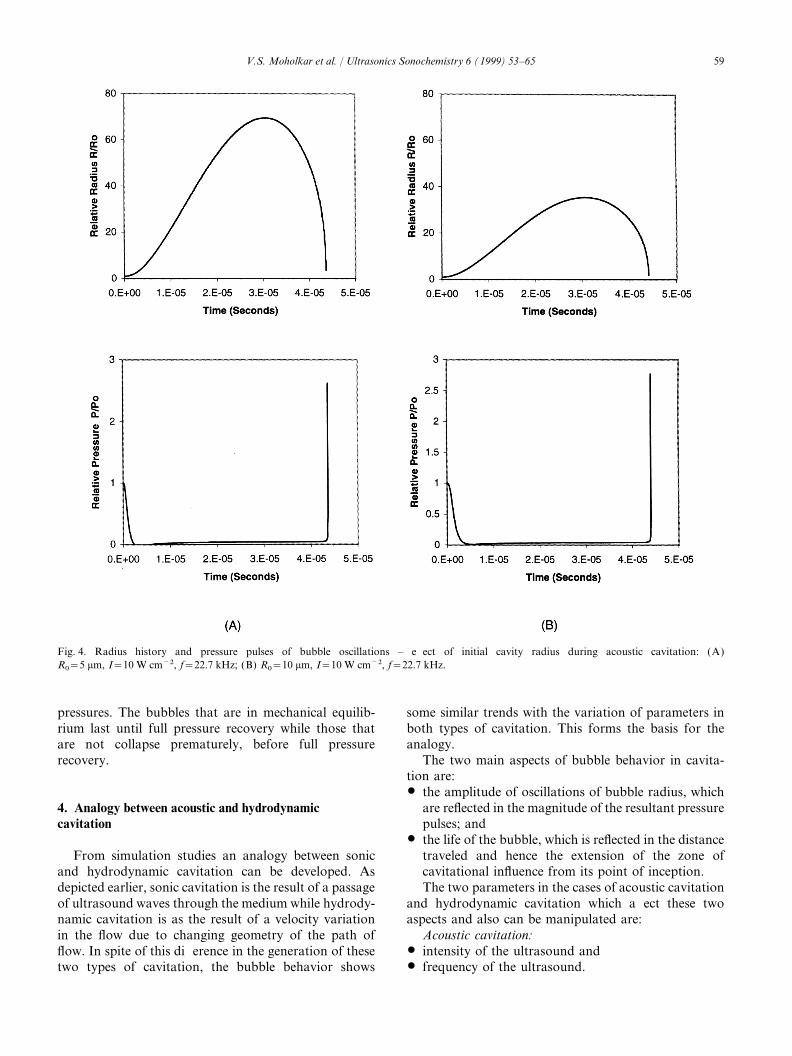
3.1.3. Initial cavity radius beginning of the collapse, the magnitudes of the pressurepulses given out by smaller bubbles are higher.Calculations were done for initial cavity sizes of 5
and 10 mm. These are the typical bubble sizes formedduring acoustic cavitation. The other parameters and 3.2. Analysis of hydrodynamic cavitationthe results of simulations are shown in Fig. 4. Thebubbles when formed are in mechanical equilibrium Simulations were done to find out the bubble behavior
under hydrodynamic cavitation conditions. The effectswith their surroundings, i.e., the pressure inside thebubble is equal to (Po+2s/R0), the surrounding pressure of the following parameters on the bubble behavior
were elucidated:in the stream. In simulations it was found that smallercavities grow larger (i.e., typically about 200 times their (1) final recovery pressure downstream of the orifice;
(2) time of pressure recovery; andoriginal size) while larger cavities do not grow thatlarge. But the lifespan of the smaller cavities was shorter. (3) initial bubble radius.
The results of the simulations are given below.The maximum bubble size reached is more or less equalto the resonance size of the bubble corresponding to thedriving frequency. As such, for adiabatic collapse, where 3.2.1. Final recovery pressure
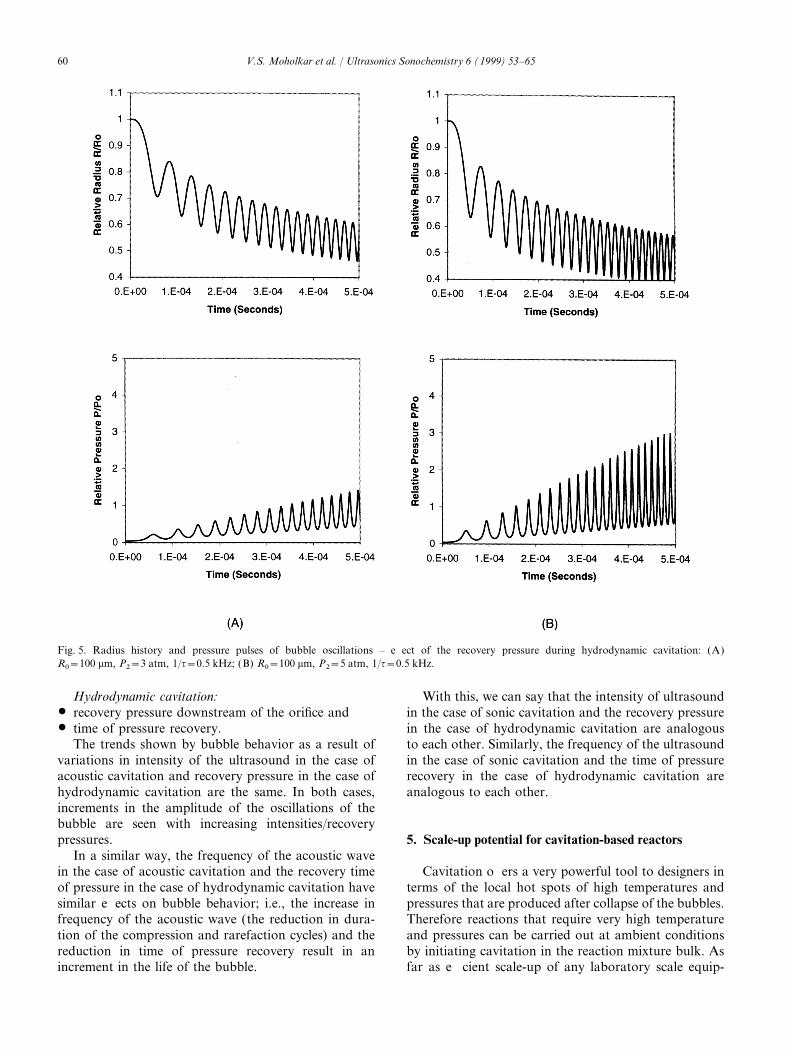
Simulations were performed to find out the effect ofthe pressure pulse produced is directly proportional tothe ratio of initial radius to the final radius at the final recovery pressure downstream of the orifice. The
58 V.S. Moholkar et al. / Ultrasonics Sonochemistry 6 (1999) 53–65
Fig. 3. Radius history and pressure pulses of bubble oscillations – effect of the frequency of the ultrasound during acoustic cavitation: (A)R0=5 mm, I=240 W cm−2, f=22.7 kHz; (B) R0=5 mm, I=240 W cm−2, f=33 kHz.
recovery pressures were 3 and 5 atm. As described were taken for the analysis. With decreasing recoverytimes (i.e., faster pressure recoveries) the bubble life wasearlier, a linear pressure recovery profile was assumed.
Unlike a transient, unstable behavior in the case of found to increase; also, the magnitude of the pressurepulses obtained from the oscillations increased. Theacoustic cavitation, the bubble behavior in hydrody-
namic cavitation was found to be stable and oscillatory. conditions and the result of simulations (radius andpressure pulse history) are shown in Fig. 6.The bubble was found to undergo many oscillations
with recovery of pressure downstream of the orifice,thus giving rise to a large number of pressure pulses of 3.2.3. Initial cavity radius
Vaporization of the liquid as well as liberation of therelatively smaller magnitude. The amplitude of the oscil-lations of the bubble and hence the magnitude of the dissolved gas give rise to a large number of bubbles of
a wide range of sizes. The typical size range of thepressure pulses resulting from them also increased withincreasing recovery pressures. The conditions and the bubbles is 10–200 mm. In this case also the bubbles are
in mechanical equilibrium with their surroundings andresult of the simulations are given in Fig. 5.the pressure inside the bubble is Pv+2s/R0. Simulationswere done to find out the dynamics of the bubbles under3.2.2. Time of pressure recovery
Simulations were done to find out the dependence of same conditions. The conditions and the result of thesimulations are shown in Fig. 7. It was found that notbubble behavior on the time of pressure recovery. As
explained earlier, typical times for pressure recovery all bubbles enjoy longevity in the flow with recovering
59V.S. Moholkar et al. / Ultrasonics Sonochemistry 6 (1999) 53–65
Fig. 4. Radius history and pressure pulses of bubble oscillations – effect of initial cavity radius during acoustic cavitation: (A)R0=5 mm, I=10 W cm−2, f=22.7 kHz; (B) R0=10 mm, I=10 W cm−2, f=22.7 kHz.
pressures. The bubbles that are in mechanical equilib- some similar trends with the variation of parameters inboth types of cavitation. This forms the basis for therium last until full pressure recovery while those that
are not collapse prematurely, before full pressure analogy.The two main aspects of bubble behavior in cavita-recovery.
tion are:$ the amplitude of oscillations of bubble radius, which
are reflected in the magnitude of the resultant pressure4. Analogy between acoustic and hydrodynamiccavitation pulses; and
$ the life of the bubble, which is reflected in the distancetraveled and hence the extension of the zone ofFrom simulation studies an analogy between sonic
and hydrodynamic cavitation can be developed. As cavitational influence from its point of inception.The two parameters in the cases of acoustic cavitationdepicted earlier, sonic cavitation is the result of a passage
of ultrasound waves through the medium while hydrody- and hydrodynamic cavitation which affect these twoaspects and also can be manipulated are:namic cavitation is as the result of a velocity variation
in the flow due to changing geometry of the path of Acoustic cavitation:$ intensity of the ultrasound andflow. In spite of this difference in the generation of these
two types of cavitation, the bubble behavior shows $ frequency of the ultrasound.
60 V.S. Moholkar et al. / Ultrasonics Sonochemistry 6 (1999) 53–65
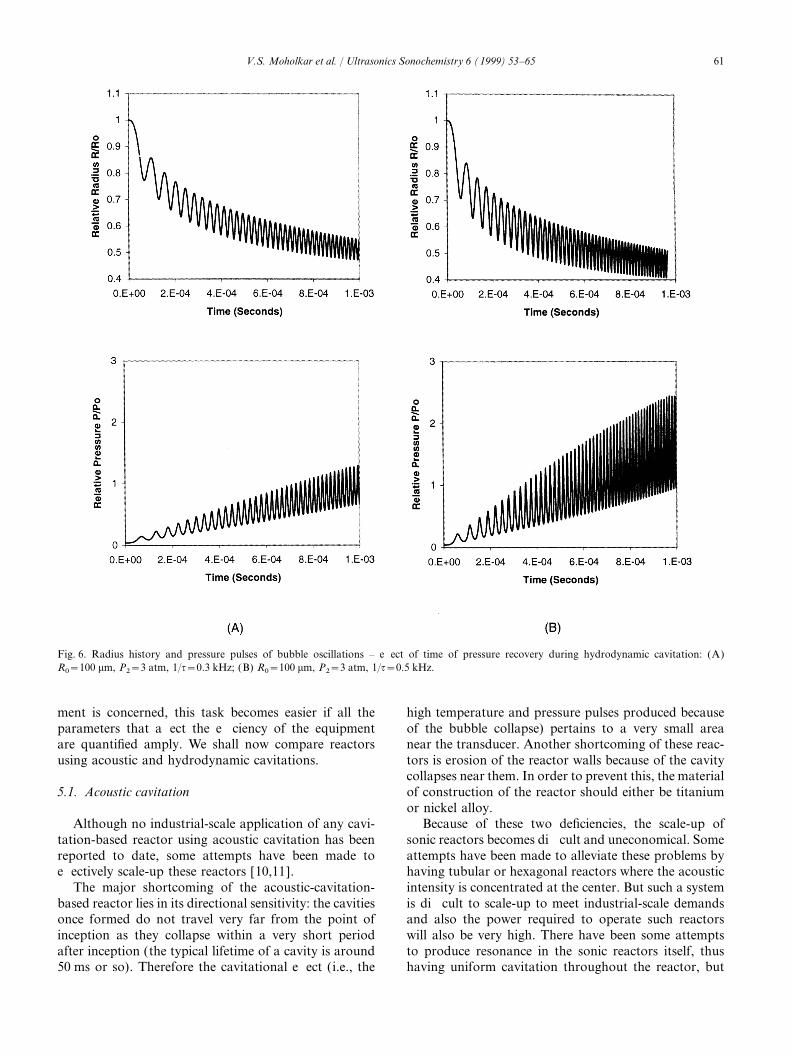
Fig. 5. Radius history and pressure pulses of bubble oscillations – effect of the recovery pressure during hydrodynamic cavitation: (A)R0=100 mm, P2=3 atm, 1/t=0.5 kHz; (B) R0=100 mm, P2=5 atm, 1/t=0.5 kHz.
Hydrodynamic cavitation: With this, we can say that the intensity of ultrasoundin the case of sonic cavitation and the recovery pressure$ recovery pressure downstream of the orifice and
$ time of pressure recovery. in the case of hydrodynamic cavitation are analogousto each other. Similarly, the frequency of the ultrasoundThe trends shown by bubble behavior as a result of
variations in intensity of the ultrasound in the case of in the case of sonic cavitation and the time of pressurerecovery in the case of hydrodynamic cavitation areacoustic cavitation and recovery pressure in the case of
hydrodynamic cavitation are the same. In both cases, analogous to each other.increments in the amplitude of the oscillations of thebubble are seen with increasing intensities/recoverypressures. 5. Scale-up potential for cavitation-based reactors
In a similar way, the frequency of the acoustic wavein the case of acoustic cavitation and the recovery time Cavitation offers a very powerful tool to designers in
terms of the local hot spots of high temperatures andof pressure in the case of hydrodynamic cavitation havesimilar effects on bubble behavior; i.e., the increase in pressures that are produced after collapse of the bubbles.
Therefore reactions that require very high temperaturefrequency of the acoustic wave (the reduction in dura-tion of the compression and rarefaction cycles) and the and pressures can be carried out at ambient conditions
by initiating cavitation in the reaction mixture bulk. Asreduction in time of pressure recovery result in anincrement in the life of the bubble. far as efficient scale-up of any laboratory scale equip-
61V.S. Moholkar et al. / Ultrasonics Sonochemistry 6 (1999) 53–65
Fig. 6. Radius history and pressure pulses of bubble oscillations – effect of time of pressure recovery during hydrodynamic cavitation: (A)R0=100 mm, P2=3 atm, 1/t=0.3 kHz; (B) R0=100 mm, P2=3 atm, 1/t=0.5 kHz.
ment is concerned, this task becomes easier if all the high temperature and pressure pulses produced becauseof the bubble collapse) pertains to a very small areaparameters that affect the efficiency of the equipment
are quantified amply. We shall now compare reactors near the transducer. Another shortcoming of these reac-tors is erosion of the reactor walls because of the cavityusing acoustic and hydrodynamic cavitations.collapses near them. In order to prevent this, the materialof construction of the reactor should either be titanium5.1. Acoustic cavitationor nickel alloy.
Because of these two deficiencies, the scale-up ofAlthough no industrial-scale application of any cavi-tation-based reactor using acoustic cavitation has been sonic reactors becomes difficult and uneconomical. Some
attempts have been made to alleviate these problems byreported to date, some attempts have been made toeffectively scale-up these reactors [10,11]. having tubular or hexagonal reactors where the acoustic
intensity is concentrated at the center. But such a systemThe major shortcoming of the acoustic-cavitation-based reactor lies in its directional sensitivity: the cavities is difficult to scale-up to meet industrial-scale demands
and also the power required to operate such reactorsonce formed do not travel very far from the point ofinception as they collapse within a very short period will also be very high. There have been some attempts
to produce resonance in the sonic reactors itself, thusafter inception (the typical lifetime of a cavity is around50 ms or so). Therefore the cavitational effect (i.e., the having uniform cavitation throughout the reactor, but
62 V.S. Moholkar et al. / Ultrasonics Sonochemistry 6 (1999) 53–65
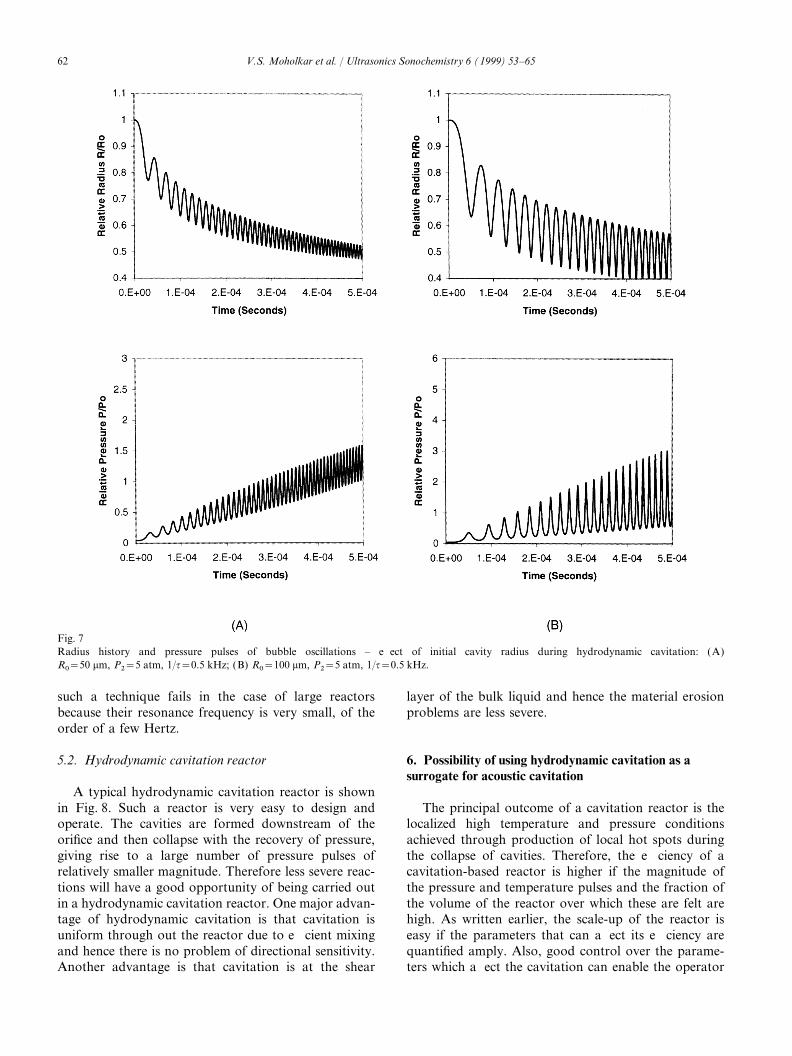
Fig. 7Radius history and pressure pulses of bubble oscillations – effect of initial cavity radius during hydrodynamic cavitation: (A)R0=50 mm, P2=5 atm, 1/t=0.5 kHz; (B) R0=100 mm, P2=5 atm, 1/t=0.5 kHz.
such a technique fails in the case of large reactors layer of the bulk liquid and hence the material erosionproblems are less severe.because their resonance frequency is very small, of the
order of a few Hertz.
5.2. Hydrodynamic cavitation reactor 6. Possibility of using hydrodynamic cavitation as asurrogate for acoustic cavitation
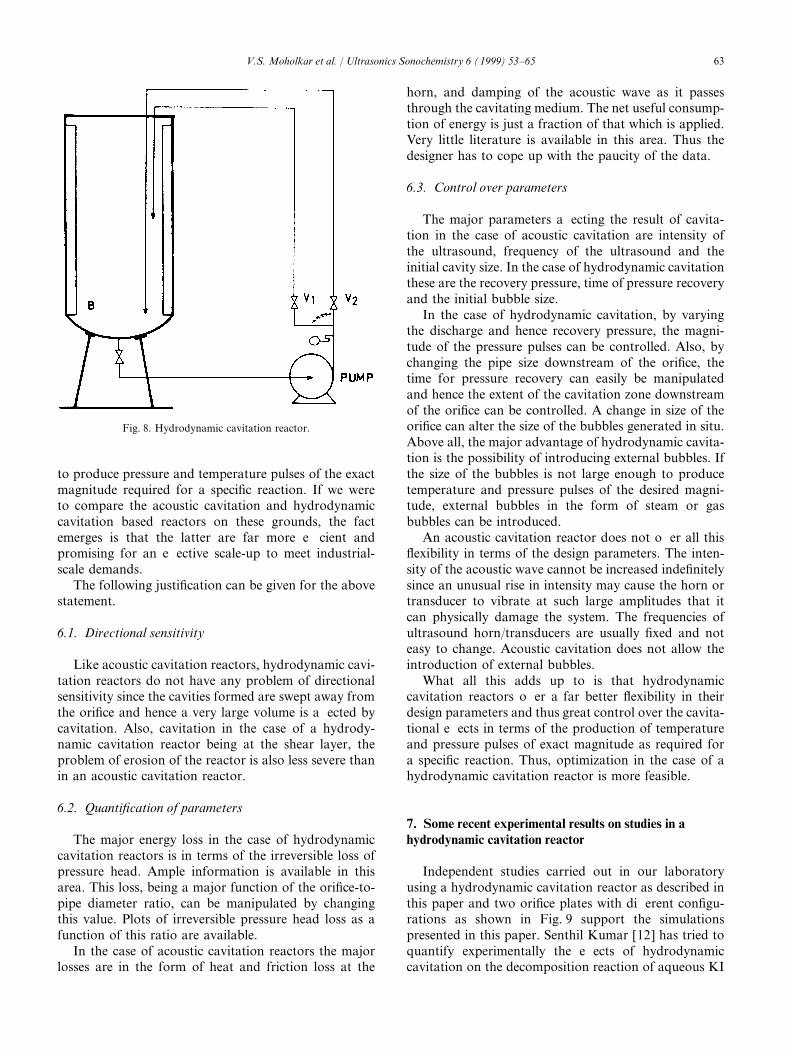
A typical hydrodynamic cavitation reactor is shownin Fig. 8. Such a reactor is very easy to design and The principal outcome of a cavitation reactor is the
localized high temperature and pressure conditionsoperate. The cavities are formed downstream of theorifice and then collapse with the recovery of pressure, achieved through production of local hot spots during
the collapse of cavities. Therefore, the efficiency of agiving rise to a large number of pressure pulses ofrelatively smaller magnitude. Therefore less severe reac- cavitation-based reactor is higher if the magnitude of
the pressure and temperature pulses and the fraction oftions will have a good opportunity of being carried outin a hydrodynamic cavitation reactor. One major advan- the volume of the reactor over which these are felt are
high. As written earlier, the scale-up of the reactor istage of hydrodynamic cavitation is that cavitation isuniform through out the reactor due to efficient mixing easy if the parameters that can affect its efficiency are
quantified amply. Also, good control over the parame-and hence there is no problem of directional sensitivity.Another advantage is that cavitation is at the shear ters which affect the cavitation can enable the operator
63V.S. Moholkar et al. / Ultrasonics Sonochemistry 6 (1999) 53–65
horn, and damping of the acoustic wave as it passesthrough the cavitating medium. The net useful consump-tion of energy is just a fraction of that which is applied.Very little literature is available in this area. Thus thedesigner has to cope up with the paucity of the data.
6.3. Control over parameters
The major parameters affecting the result of cavita-tion in the case of acoustic cavitation are intensity ofthe ultrasound, frequency of the ultrasound and theinitial cavity size. In the case of hydrodynamic cavitationthese are the recovery pressure, time of pressure recoveryand the initial bubble size.
In the case of hydrodynamic cavitation, by varyingthe discharge and hence recovery pressure, the magni-tude of the pressure pulses can be controlled. Also, bychanging the pipe size downstream of the orifice, thetime for pressure recovery can easily be manipulatedand hence the extent of the cavitation zone downstreamof the orifice can be controlled. A change in size of theorifice can alter the size of the bubbles generated in situ.Fig. 8. Hydrodynamic cavitation reactor.Above all, the major advantage of hydrodynamic cavita-tion is the possibility of introducing external bubbles. Ifthe size of the bubbles is not large enough to produceto produce pressure and temperature pulses of the exact
magnitude required for a specific reaction. If we were temperature and pressure pulses of the desired magni-tude, external bubbles in the form of steam or gasto compare the acoustic cavitation and hydrodynamic
cavitation based reactors on these grounds, the fact bubbles can be introduced.An acoustic cavitation reactor does not offer all thisemerges is that the latter are far more efficient and
promising for an effective scale-up to meet industrial- flexibility in terms of the design parameters. The inten-sity of the acoustic wave cannot be increased indefinitelyscale demands.
The following justification can be given for the above since an unusual rise in intensity may cause the horn ortransducer to vibrate at such large amplitudes that itstatement.can physically damage the system. The frequencies ofultrasound horn/transducers are usually fixed and not6.1. Directional sensitivityeasy to change. Acoustic cavitation does not allow theintroduction of external bubbles.Like acoustic cavitation reactors, hydrodynamic cavi-
tation reactors do not have any problem of directional What all this adds up to is that hydrodynamiccavitation reactors offer a far better flexibility in theirsensitivity since the cavities formed are swept away from
the orifice and hence a very large volume is affected by design parameters and thus great control over the cavita-tional effects in terms of the production of temperaturecavitation. Also, cavitation in the case of a hydrody-
namic cavitation reactor being at the shear layer, the and pressure pulses of exact magnitude as required fora specific reaction. Thus, optimization in the case of aproblem of erosion of the reactor is also less severe than
in an acoustic cavitation reactor. hydrodynamic cavitation reactor is more feasible.
6.2. Quantification of parameters7. Some recent experimental results on studies in ahydrodynamic cavitation reactorThe major energy loss in the case of hydrodynamic
cavitation reactors is in terms of the irreversible loss ofpressure head. Ample information is available in this Independent studies carried out in our laboratory
using a hydrodynamic cavitation reactor as described inarea. This loss, being a major function of the orifice-to-pipe diameter ratio, can be manipulated by changing this paper and two orifice plates with different configu-
rations as shown in Fig. 9 support the simulationsthis value. Plots of irreversible pressure head loss as afunction of this ratio are available. presented in this paper. Senthil Kumar [12] has tried to
quantify experimentally the effects of hydrodynamicIn the case of acoustic cavitation reactors the majorlosses are in the form of heat and friction loss at the cavitation on the decomposition reaction of aqueous KI
64 V.S. Moholkar et al. / Ultrasonics Sonochemistry 6 (1999) 53–65
found that the hydrodynamic cavitation was at leasttwo times more energy-efficient than acoustic cavitation.
8. Conclusions
Based on the above analysis the following conclusionscan be made.$ Cavitating conditions identical to acoustic cavitation
can be generated in hydrodynamic cavitation.$ Hydrodynamic cavitation offers better control over
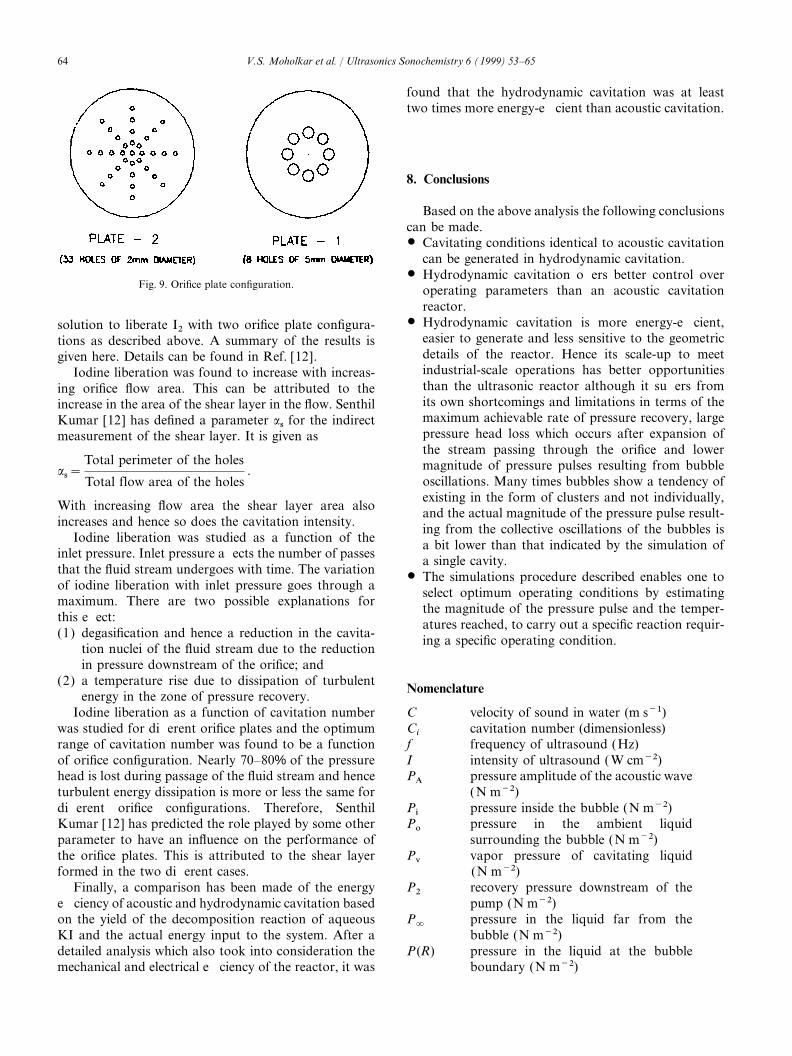
Fig. 9. Orifice plate configuration. operating parameters than an acoustic cavitationreactor.
$ Hydrodynamic cavitation is more energy-efficient,solution to liberate I2 with two orifice plate configura-easier to generate and less sensitive to the geometrictions as described above. A summary of the results isdetails of the reactor. Hence its scale-up to meetgiven here. Details can be found in Ref. [12].industrial-scale operations has better opportunitiesIodine liberation was found to increase with increas-than the ultrasonic reactor although it suffers froming orifice flow area. This can be attributed to theits own shortcomings and limitations in terms of theincrease in the area of the shear layer in the flow. Senthilmaximum achievable rate of pressure recovery, largeKumar [12] has defined a parameter as for the indirectpressure head loss which occurs after expansion ofmeasurement of the shear layer. It is given asthe stream passing through the orifice and lowermagnitude of pressure pulses resulting from bubbleas=
Total perimeter of the holes
Total flow area of the holes.
oscillations. Many times bubbles show a tendency ofexisting in the form of clusters and not individually,
With increasing flow area the shear layer area also and the actual magnitude of the pressure pulse result-increases and hence so does the cavitation intensity. ing from the collective oscillations of the bubbles is
Iodine liberation was studied as a function of the a bit lower than that indicated by the simulation ofinlet pressure. Inlet pressure affects the number of passes a single cavity.that the fluid stream undergoes with time. The variation
$ The simulations procedure described enables one toof iodine liberation with inlet pressure goes through a select optimum operating conditions by estimatingmaximum. There are two possible explanations for the magnitude of the pressure pulse and the temper-this effect: atures reached, to carry out a specific reaction requir-(1) degasification and hence a reduction in the cavita- ing a specific operating condition.
tion nuclei of the fluid stream due to the reductionin pressure downstream of the orifice; and
(2) a temperature rise due to dissipation of turbulent Nomenclatureenergy in the zone of pressure recovery.
Iodine liberation as a function of cavitation number C velocity of sound in water (m s−1)Ci
cavitation number (dimensionless)was studied for different orifice plates and the optimumrange of cavitation number was found to be a function f frequency of ultrasound (Hz)
I intensity of ultrasound ( W cm−2)of orifice configuration. Nearly 70–80% of the pressurehead is lost during passage of the fluid stream and hence PA pressure amplitude of the acoustic wave
(N m−2)turbulent energy dissipation is more or less the same fordifferent orifice configurations. Therefore, Senthil Pi pressure inside the bubble (N m−2)
Po pressure in the ambient liquidKumar [12] has predicted the role played by some otherparameter to have an influence on the performance of surrounding the bubble (N m−2)
Pv vapor pressure of cavitating liquidthe orifice plates. This is attributed to the shear layerformed in the two different cases. (N m−2)
P2 recovery pressure downstream of theFinally, a comparison has been made of the energyefficiency of acoustic and hydrodynamic cavitation based pump (N m−2)
P2
pressure in the liquid far from theon the yield of the decomposition reaction of aqueousKI and the actual energy input to the system. After a bubble (N m−2)
P(R) pressure in the liquid at the bubbledetailed analysis which also took into consideration themechanical and electrical efficiency of the reactor, it was boundary (N m−2)
65V.S. Moholkar et al. / Ultrasonics Sonochemistry 6 (1999) 53–65
cavitation on aqueous polymeric solutions, Ind. Chem. Engr. 35R bubble radius at any time t (m)(1993) 52–57.R0 initial cavity radius (m)
[4] Lord Rayleigh, On the pressure developed in a liquid during theb orifice-to-pipe diameter ratio collapse of spherical cavity, Philos. Mag. 34 (1917) 94–98.
(dimensionless) [5] M.S. Plesset, Dynamics of cavitating bubbles, J. Appl. Mech.,Trans. ASME 16 (1949) 277–282.c ratio of specific heats (dimensionless)
[6 ] M.J. Miksis, L.J. Ting, Nonlinear radial oscillations of bubblesr density of the cavitating liquidincluding thermal effects, J. Acoust. Soc. Am. 76 (1984) 897–899.(kg m−3)
[7] F.R. Gilmore, Hydrodynamic Laboratory Report 26-4, Californias surface tension (N m−1) Institute of Technology, 1954.t time of pressure recovery (s) [8] Y. Yan, R.B. Thorpe, A.B. Pandit, Cavitation noise and its sup-
pression by air in orifice flow, Proceedings of International Sym-v angular frequency of ultrasound (s−1)posium on Flow Induced Vibration and Noise, ASME, Chicago,IL, 1988.
[9] V.S. Moholkar, Studies in cavitation phenomena: design andReferences scale-up of the sonic and hydrodynamic cavitation reactors, M.Chem. Eng. thesis, University of Bombay, 1996.
[10] M.J. Berlan, T.J. Mason, Sonochemistry: from research laborato-[1] J.B. Joshi, A.B. Pandit, Hydrolysis of fatty oils: effect of cavita-tion, Chem. Eng. Sci. 48 (19) (1993) 3440–3442. ries to industrial plants, Ultrasonics 30 (1992) 203–212.
[11] P.D. Martin, L.D. Ward, Reactor design for sonochemical engi-[2] S.S Save, J.B. Joshi, A.B. Pandit, Microbial cell disruption inhydrodynamic cavitation, Chem. Eng. Res. Des. 75 (Part C) neering, Chem. Eng. Res. Des. 70 (A3) (1993) 296–299.
[12] P. Senthil Kumar, Studies in hydrodynamic cavitation, M. Chem.(1997) 41–49.[3] M.M. Chivate, A.B. Pandit, Effect of sonic and hydrodynamic Eng. thesis, University of Bombay, 1997.