
Paper G-2 333 - Visualization of cavitation and investigation of ...
16
Visualization of cavitation and investigation of cavitation erosion in a valve Dipl.-Ing. Dominik Krahl; Professor Dr.-Ing. Jürgen Weber Institut für Fluidtechnik (IFD), Technische Universität Dresden, Helmholtzstrasse 7a, 01069 Dresden, E-Mail: [email protected] Dipl.-Ing. Maik Fuchs Bürkert Werke GmbH, Systemhaus Dresden, Christian-Bürkert-Straße 2, 01900 Großröhrsdorf, E-Mail: [email protected] Abstract Avoiding cavitation and especially cavitation erosion are tasks, which have to be considered when working with hydraulics. State of the art is the assessment of the risk of erosion by component testing or to completely avoid cavitation by means of CFD. Another reliable method to assess the risk of cavitation erosion is until now not available. This paper deals with this problem and delivers comparative values for a later method development. In a first step the cavitation of a poppet valve, which controls a methanol flow, is visualized. The resulting three cavitation appearances are deeply examined. After that the results of long-term tests at different operation conditions are presented. A poppet surface analysis following each experiment has shown different types of surface attacks. As a result of this work it is shown that both cavitation appearance and surface attack are strongly influenced by the temperature dependent air solubility of the liquid. KEYWORDS: Cavitation visualization, cavitation erosion, poppet valve, methanol 1. Introduction Cavitation is a process which can be expected in many hydraulic components. A local pressure drop causes evaporation and/or degassing of the liquid. This process can be accompanied by mostly unwanted effects such as noise, vibrations, efficiency losses and erosion. Especially cavitation erosion has to be avoided, because it can cause damage of components. Not every occurrence of cavitation causes cavitation erosion and it is mostly not possible or not efficient to avoid cavitation in hydraulic components. Thus it is interesting for the design of components to know under which conditions erosion can occur with the absence of cavitation. It is also desirable for component Group G - Fundamentals | Paper G-2 333
-
Upload
khangminh22 -
Category
Documents
-
view
6 -
download
0
Transcript of Paper G-2 333 - Visualization of cavitation and investigation of ...
Visualization of cavitation and investigation of cavitation erosion in a valve
Dipl.-Ing. Dominik Krahl; Professor Dr.-Ing. Jürgen Weber Institut für Fluidtechnik (IFD), Technische Universität Dresden, Helmholtzstrasse 7a, 01069 Dresden, E-Mail: [email protected]
Dipl.-Ing. Maik Fuchs Bürkert Werke GmbH, Systemhaus Dresden, Christian-Bürkert-Straße 2, 01900 Großröhrsdorf, E-Mail: [email protected]
Abstract Avoiding cavitation and especially cavitation erosion are tasks, which have to be
considered when working with hydraulics. State of the art is the assessment of the risk
of erosion by component testing or to completely avoid cavitation by means of CFD.
Another reliable method to assess the risk of cavitation erosion is until now not
available. This paper deals with this problem and delivers comparative values for a
later method development. In a first step the cavitation of a poppet valve, which
controls a methanol flow, is visualized. The resulting three cavitation appearances are
deeply examined. After that the results of long-term tests at different operation
conditions are presented. A poppet surface analysis following each experiment has
shown different types of surface attacks. As a result of this work it is shown that both
cavitation appearance and surface attack are strongly influenced by the temperature
dependent air solubility of the liquid.
KEYWORDS: Cavitation visualization, cavitation erosion, poppet valve, methanol
1. Introduction Cavitation is a process which can be expected in many hydraulic components. A local
pressure drop causes evaporation and/or degassing of the liquid. This process can be
accompanied by mostly unwanted effects such as noise, vibrations, efficiency losses
and erosion. Especially cavitation erosion has to be avoided, because it can cause
damage of components. Not every occurrence of cavitation causes cavitation erosion
and it is mostly not possible or not efficient to avoid cavitation in hydraulic components.
Thus it is interesting for the design of components to know under which conditions
erosion can occur with the absence of cavitation. It is also desirable for component
Group G - Fundamentals | Paper G-2 333

manufacturers to have a tool or a model, that makes a prediction of erosion probability
and erosion position possible. This allows an optimization of components in the early
development stage.
This paper addresses the problem of cavitation erosion prediction. To reach the overall
objective of a predictive tool experiments are necessary in a first step. These should
clarify required conditions for cavitation erosion. The investigation of the erosion will be
done using a typical poppet valve. This valve type has a simple structure and
functionality, which makes the investigation and interpretation easier. Poppet valves
are also often used with a variety of liquids with some of them showing a high
cavitation tendency and thus higher risk of cavitation erosion.
To find the necessary conditions for cavitation erosion the first step of this work is the
visualization of cavitation under different operating conditions. In literature some
possibilities can be found to make cavitation visible. A good overview of three of them
is given by Mauger et al. /1/. The easiest possibilities are the shadowgraph-like imaging
methods, which can be split into the standard shadowgraph technique and the
shadowgraph-like arrangement. The very often used shadowgraph-like arrangements
let cavities appear dark as shown in /2/ and /3/. This technique can also be combined
with other optical flow measurement techniques as shown by Müller et al. with the
example of a combined PIV/LIF/Shadowgraphy measurement in a valve chamber /4/.
Other possibilities are the schlieren and interferometry techniques presented by
Mauger, which make density gradients and thus cavitation visible. After identifying
different cavitation intensities through visualization, long-term tests of cavitation erosion
at selected operating points will be presented. Different methods can be used to
assess the aggressiveness of cavitation erosion. Two methods requiring small effort
are weighing the mass loss as it was used by Chahine /5/ or to observe the eroded
surface, for example by a pit count as executed by Franc /6/. In a last step the results
of the erosion tests will be compared to the visualized cavitation appearances and
possible explanations for the effects will be given.
2. Basics of cavitation and cavitation erosion
2.1. Cavitation basics Cavitation is a phenomenon known for over 100 years, which is due to its complexity
still a topic of research. In general cavitation is a dynamic process of formation and
collapse of cavities in liquids. This cavities can contain, depending on the operation
conditions, gas and/or vapour. Depending on the expansion mechanism, three
334 10th International Fluid Power Conference | Dresden 2016

cavitation types can be distinguished: vapour-, gas- and pseudo-cavitation. For the
development of vapour cavitation, where the liquid is locally evaporating, a pressure
reduction to the temperature dependent vapour pressure is necessary. Caused by an
ensuing pressure increase the vapour condenses and the process is ending. The
whole vapour cavitation event is extremely transient and typically happens in the range
of microseconds /7/. Negative consequences such as pressure shocks, erosion, noise
or efficiency losses can occur due to vapour cavitation. Gas cavitation is also induced
by a pressure reduction. Based on the pressure drop the solubility of gas in the liquid is
reduced according to Henrys law. The resulting supersaturation leads to a diffusion of
gas out of the liquid. Gas cavitation is happening clearly slower than vapour cavitation.
The necessary pressure for gas cavitation can be, depending on the liquids history,
much higher than the vapour pressure. Pseudo cavitation is the pure expansion of
existing gas bubbles without diffusion. According to Schade, gas and pseudo cavitation
do not have such negative consequences as vapour cavitation, which can lead to a
failure of components. But noise and efficiency losses are also typical for them /8/. In
hydraulic systems a coexistence of all cavitation types is usual. Besides pressure
reduction the presence of cavitation nuclei is a basic requirement for all cavitation
types. The pressure reduction can be reached by high liquid velocities due to the
narrowing of the flow area. An estimation of the pressure drop at different positions is
possible by means of Bernoulli´s law for frictionless, incompressible flow:
(1)
Thus an increase of the velocity causes a smaller static pressure at the considered
position, which depends on liquid density . An estimation of the vapour cavitation risk
is possible using the cavitation number , which can be derived by equation (1):
(2)
The vapour pressure depends on the used liquid, but is also strongly influenced by
the temperature. At a cavitation inception must be expected. A cavitation number
stands for a high probability of vapour cavitation. The cavitation number may
not be used as only indicator for cavitation, because in reality there are many other
unconsidered influencing factors.
Group G - Fundamentals | Paper G-2 335

2.2. Cavitation erosion basics In general erosion is a strength problem. Thus both sides, material and load, have to
be considered, where the load is the cavitating liquid whose aggressiveness can be
described by quantities such as pressure, temperature, vapour fraction etc. More in
detail, a vapour bubble collapse close to wall can cause the formation of a micro jet.
This high velocity liquid jet, which is directed towards the wall, causes a pressure shock
in the moment of impingement. This water hammer pressure stresses the wall and in
case of a low cavitation erosion resistance, the wall can be damaged. The cavitation
resistance can´t be described directly by typical material properties such as tensile
strength, because the strain rate is more than seven orders higher in case of cavitation
stress than in the tensile test /5/. Thus these values are not valid for such a load.
Furthermore, the time behaviour of cavitation erosion is varying depending on a brittle
or ductile material behaviour /5/. The presented short overview of the cavitation erosion
basics should illustrate the complexity of this topic.
3. Poppet valve model and test rig This section presents the design of the selected valve and an overview of the test rig.
One first specialty of the presented work is the usage of methanol as test liquid. It is a
liquid often used in process technology, which has a significant higher vapour pressure
compared to the typical hydraulic liquids water and oil. Thus it is well suited for
cavitation and cavitation erosion investigations.
3.1. Poppet valve model In Figure 1 an overview of the poppet valve model and the detailed cross section are
shown. The design of the valve model was subjected to the following requirements:
Model of a typical process technology poppet valve
Visual accessibility for cavitation visualization
Possibilities of fast erosion tests and easy change of eroded components
Measurement of flow variables suited for validation
Exact gap adjustment with high spatial resolution
The chosen nominal diameter of the poppet valve model is dn=1 mm. The poppet and
the valve seat are made of grey cast iron EN-GJL-250. This group of materials is
known for the very low cavitation erosion resistance /9/. Thus fast erosion results can
be expected. Furthermore it is possible to screw the two cast iron components in.
Hence there is the opportunity to change eroded parts or to investigate modified
336 10th International Fluid Power Conference | Dresden 2016

designs. A direct connection between poppet and a moveable stem allows to vary the
gap height. For exact gap adjustment the step is connected to a linear stage, which is
moved by a high resolution micrometer screw. To meet the last requirement of the
valve model, which is the visual accessibility, the cuboid shaped cavitation chamber
has two parallel windows for optical examination.
Figure 1: Valve Model a) Overview; b) detailed cross section
3.2. Test rig As described in chapter 1, there are different possibilities to make cavitation visible. An
easy way for cavitation visualization is the back light imaging, also called “shadow-
graph-like arrangement” /1/. When using this technique, the valve model is positioned
between a light source and a camera. This setup is shown in the top of Figure 2. A
lens system is used to parallelize the light of a light-emitting diode (LED). In case of a
fully liquid filled cavitation chamber the whole light passes the valve model in a parallel
manner. Thus the complete fluid area appears equally illuminated. If cavitation occurs
in the chamber the light must pass the interfaces between liquid and gas or vapour.
This transition causes various effects on the interface passing light. Besides the
reflection and refraction of the light, in particular a ray deflection at the crooked
cavitation interface causes a dark appearance of the cavitation regions. In order to
capture these effects, a camera lens is focused onto the flow. For very fast events, as
typical for cavitation, it is recommended to use a high-speed camera. This enables high
capturing frame rates, for tracking the fast change of the cavitation regions, and allows
Group G - Fundamentals | Paper G-2 337
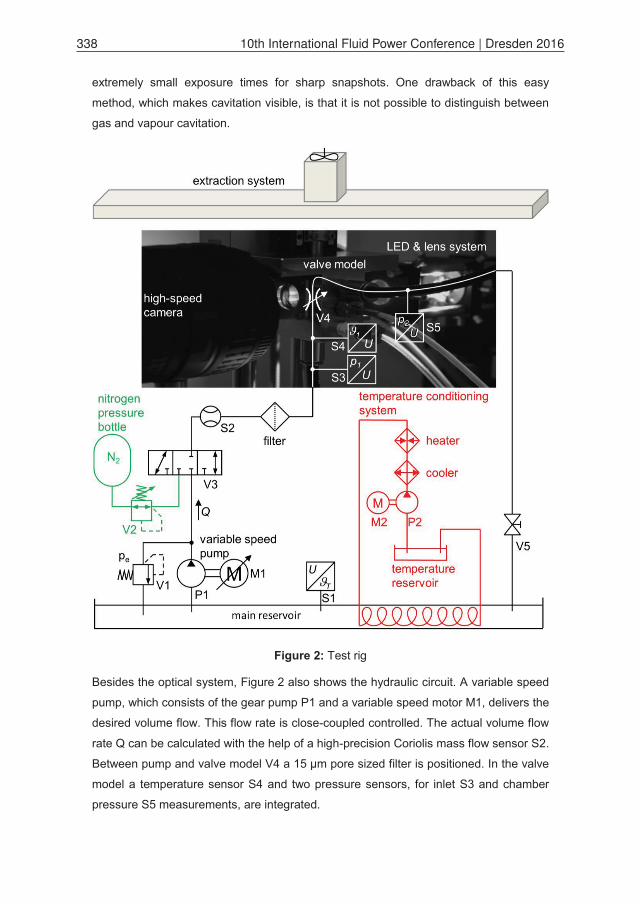
extremely small exposure times for sharp snapshots. One drawback of this easy
method, which makes cavitation visible, is that it is not possible to distinguish between
gas and vapour cavitation.
Figure 2: Test rig
Besides the optical system, Figure 2 also shows the hydraulic circuit. A variable speed
pump, which consists of the gear pump P1 and a variable speed motor M1, delivers the
desired volume flow. This flow rate is close-coupled controlled. The actual volume flow
rate Q can be calculated with the help of a high-precision Coriolis mass flow sensor S2.
Between pump and valve model V4 a 15 μm pore sized filter is positioned. In the valve
model a temperature sensor S4 and two pressure sensors, for inlet S3 and chamber
pressure S5 measurements, are integrated.
338 10th International Fluid Power Conference | Dresden 2016

By means of a temperature conditioning system it is possible to control the fluid
temperature of the main reservoir and thus the inlet temperature of the valve model.
The system consists of a separate open circuit, because a direct heating of the used
test-liquid methanol is too dangerous. Water, which is used as thermal fluid, is pumped
by the combination of a fixed displacement pump P2 and a constant speed motor M2.
The water temperature is controlled by a cooler and a heater. The heat transfer from
water to methanol takes place in the main reservoir through an integrated corrugated
pipe. The actual main reservoir temperature is measured by a temperature sensor S1.
For security reasons it is possible to connect the valve model to a nitrogen pressure
source via valve V3, which is controlled by the pressure-reducing valve V2. This makes
a flushing of the circuit with nitrogen possible to prevent the development of an
explosive methanol-oxygen mixture. Another safety measure, which is necessary due
to the risk of explosion and health hazard of methanol, is a positioning of the test rig in
a safety workbench with an included extraction system. In the workbench a gas
detector is located, which turns off the whole test rig in case of a risk. Last but not least
a pressure relief valve V1 and a stop valve V5 are installed.
4. Experimental procedure The presented test rig allows a variation of the three operating variables gap height g,
volume flow Q and methanol temperature . An overview of their possible operating
range is shown in Table 1. The desired inlet pressure p1 can be mainly adjusted by the
combination of gap height g and volume flow Q. A variation of the cavitation chamber
pressure p2 is not necessary for the first tests. It is sufficient to influence the cavitation
aggressiveness by varying the other conditions.
variable operating range gap height g 0 …150 μm
volume flow Q 0 … 20 l/h methanol temperature 10 … 50 °C
inlet pressure p1 1 … 8 bar cavitation chamber pressure p2 ≈ 1 bar
Table 1: Operating variables of the test rig
4.1. Cavitation visualization After first measurements of the valve flow characteristics, which are necessary for a
later comparison between experiments and CFD, it was the task to define a couple of
operating points for execution of cavitation erosion tests. The idea was to find at least
three different points with varying cavitation aggressiveness. Point one was intended to
Group G - Fundamentals | Paper G-2 339
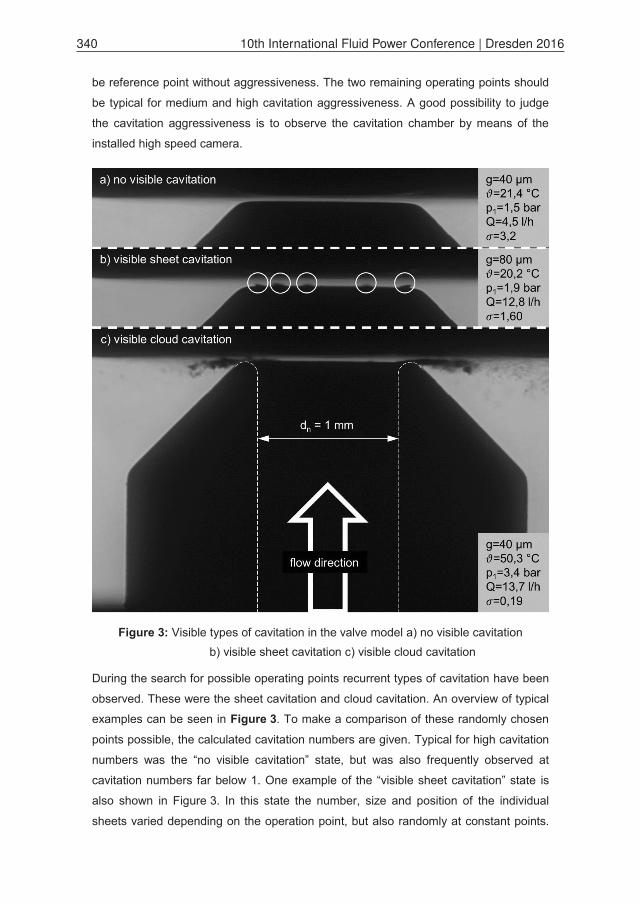
be reference point without aggressiveness. The two remaining operating points should
be typical for medium and high cavitation aggressiveness. A good possibility to judge
the cavitation aggressiveness is to observe the cavitation chamber by means of the
installed high speed camera.
Figure 3: Visible types of cavitation in the valve model a) no visible cavitation b) visible sheet cavitation c) visible cloud cavitation
During the search for possible operating points recurrent types of cavitation have been
observed. These were the sheet cavitation and cloud cavitation. An overview of typical
examples can be seen in Figure 3. To make a comparison of these randomly chosen
points possible, the calculated cavitation numbers are given. Typical for high cavitation
numbers was the “no visible cavitation” state, but was also frequently observed at
cavitation numbers far below 1. One example of the “visible sheet cavitation” state is
also shown in Figure 3. In this state the number, size and position of the individual
sheets varied depending on the operation point, but also randomly at constant points.
340 10th International Fluid Power Conference | Dresden 2016

Overall the sheet cavitation can be considered as quasi-stationary state. The cavitation
number was also scattered over a wide range. Visible cloud cavitation, which was the
third observed state, has a very unsteady appearance. Although partially recorded with
very high frame rates of up to 88,000 frames per second, allowing a time difference of
only 11 μs between two images, no one looks like the other. The cavitation number of
this third state was typically very low.
Looking at the cavitation numbers of the three randomly chosen operation points the
trend is obvious, that at cavitation numbers below 1 there is always cloud cavitation,
between 1 and 2 sheet cavitation occurs and above 2 there is no cavitation. But in
reality it is not so easy to describe. Operation points, which show a very high cloud
cavitation intensity over a long time are in the next moment completely free of visible
cavitation. This happens without changing any conditions and is then also stable over a
certain period. A comparable behaviour has been observed for sheet cavitation. A
possible hypothesis to describe this behaviour is a varying cavitation nuclei intensity.
As described in chapter 2.1, the development of cavitation is only possible with the
presence of cavitation nuclei.
4.2. Analysis of cavitation appearance Caused by this overlap of the different types and thus no reliable prediction of the
appearance in the valve model depending on the operation point, the next step was to
analyse the dependence of the type of cavitation on different physical quantities for all
recordings. In this process over forty operation points at varying gap heights, volume
flows and temperatures were evaluated. A varying cavitation nuclei intensity is also
very probable, because the evaluated measurements were scattered over weeks. A
meaningful chart to describe the probability of reaching a certain cavitation appearance
is presented in Figure 4. There are the three occurring cavitation types plotted over the
temperature and cavitation number of the evaluated operation points. Most obvious
is the occurrence of cloud cavitation, which is observed in the presented valve model
only at low cavitation numbers. In the analysed recordings cloud cavitation was only
possible over the whole temperature range by dropping below a cavitation number
=0.25. It seems that the cavitation number limit of cloud cavitation decreases with
increasing temperature, but for a reliable statement more measurements are
necessary.
Group G - Fundamentals | Paper G-2 341

Figure 4: Occurring types of cavitation depending on temperature and cavitation number
A next obvious point is, that the state of “no cavitation” is spread over the whole chart.
Especially at low cavitation numbers this is not the expected behaviour. But the
appearance of this fact at several points shows, that this is not untypical for valves.
Thus there is no operation point of the valve, where a continuous cloud cavitation is
presented. But at points with cavitation number below , there is a high
probability. Furthermore, the points where “sheet cavitation” occurs show a strong
dependency on temperature. At temperatures above round 30 °C there is no operation
point with this state, although there have been many measurementpoints.
A possible explanation of this phenomenon is the air solubility, which is not only
changing with the pressure, but also with the temperature. At room temperature and
ambient pressure methanol is able to solute 17 vol% of air /10/. This value is nearly ten
times higher than the solubility of air in water, thus it is not recommended to neglect
gas cavitation. In case of water, the air solubility decreases by increasing temperature.
Increasing from 20 to 40 °C causes air-solubility losses of round 24 % /11/. The
influence of temperature changes in case of methanol is not known, but a decreasing
solubility by increasing temperature is probable. Hence, at measurements above
ambient temperature the stationary air solubility in the main reservoir is lower than at
other points of the test rig. This is caused by the highest temperature in the main
reservoir, which is a result of the temperature losses between reservoir and valve
model. The liquid is degassing in the reservoir until the equilibrium solubility of air is
reached. Caused by the lower temperature in the pipe, the pumped liquid is an
undersaturated solution. To make further degassing possible a very low static pressure
342 10th International Fluid Power Conference | Dresden 2016

is necessary, which can locally only be reached by high liquid velocities according to
Bernoulli´s law (see chapter 2.1). High liquid velocities, which reach a maximum in the
valve model gap, stand for high Reynolds numbers and thus for turbulent flows. A
consequence of this high degree of turbulence is the appearance of cloud cavitation at
the presence of air and/or vapour. At high temperatures cloud cavitation occurs at
relatively constant cavitation numbers. Since the cavitation number does not refer to
gas cavitation, this indicates the presence of pure vapour cavitation. Thus at higher
temperatures the liquid evaporates in the gap before a further degassing is possible,
because the vapour pressure is higher than the required gas equilibrium pressure. The
described hypothesis of the phenomenon is confirmed by the fact, that sheet cavitation
is also possible at lower temperatures combined with cavitation numbers far above 1.
Thus this appearance especially at high cavitation numbers is solely gas cavitation. At
lower cavitation numbers and near room temperature a mix of gas and vapour
cavitation probably occurs. Caused by the associated high velocity and thus higher
turbulence, a decreasing cavitation number leads to a transition from sheet to cloud
cavitation.
5. Long-term tests and investigation of cavitation erosion After visualization and analysis of cavitation appearance, it was the task to provoke
cavitation erosion. To define promising operation points, the insights of the prior
chapter are used. Since the erosion behaviour and thus the required duration was
unknown, a duration of around one week was arbitrarily defined for each long-term test.
After each test the valve model was disassembled and the surfaces of valve seat and
poppet were examined under microscope. A detailed investigation of the erosion
especially of the poppet surface is possible, because the flat surface allows a level
illumination and a sharp illustration of the whole area. The resulting poppet surfaces of
the first three long-term tests are shown in Figure 5. For comparison, Figure 5 a)
shows the surface of the new poppet. The dark spots are graphite elements of the grey
cast iron. For a better orientation, the position of the valve models nominal diameter dn
is marked in all images. The first long-term test was executed at room temperature in
the field of typical sheet cavitation. A surface comparison shows no visible change.
Thus, this type of cavitation seems to have no erosive potential within the test duration.
In the next test the main reservoir was heated up to a temperature of 55 °C, which lies
10 K below the boiling temperature of methanol. Due to heat losses this results in a
liquid temperature at the valve inlet of 45 °C at the chosen volume flow. The cavitation
number was adjusted to a comparable dimension of test 1.
Group G - Fundamentals | Paper G-2 343

Figure 5: Poppet surfaces after several long-term tests a) new surface b) - d) surface after long-term test
A check of the surface after this second test clearly shows a change of the surface.
Over the whole area small pits can be identified, which are indicators for a surface
attack due to cavitation. This beginning process of damaging has its highest intensity
near the gap, as highlighted in Figure 5. Furthermore there are some locations with
circular annealing colours at the surface. These are distributed without apparent
structure. Annealing colours of metals are a consequence of an oxidation of the
surface. For these, high temperatures, typically above 200 °C, and the presence of
oxygen are necessary /12/. Since the required temperature lies far above the
measured liquid temperature, a local acting event must cause this temperature
increase. A possible explanation for this increase delivers the so called “micro-diesel
effect”, which is well known from cavitating oil /13/. Thereby a local rapid pressure
increase, which can be caused by a collapse of vapour bubbles, compresses small gas
bubbles. These are filled with a mixture of gas and flammable components. The bubble
temperature increases caused by the gas compression. By reaching the ignition
344 10th International Fluid Power Conference | Dresden 2016
temperature, combustion of the bubble mixture happens. This phenomenon is also very
probable for cavitating methanol, since the mixture of methanol and oxygen has a very
low ignition temperature of 470 °C. Reaching it within one single bubble can cause a
chain reaction of self ignition in other bubbles filled with a flammable mixture. These
events producing local high temperatures and causing annealing colours are possible.
The necessary oxygen can be delivered through degassing of dissolved air within the
methanol.
Figure 5 d) shows the result of the poppet surface after the third long-term test. In this
test the influence of small volume flow combined with high temperature was examined.
The inlet pressure was unchanged compared to the test before. Caused by the smaller
flow rate and thus higher temperature losses, the liquid temperature at the valve
models inlet reached only 35 °C. Nevertheless, the resulting poppet surface shows a
clear pattern. Around the valve models gap an annealing colours ring was arising.
Compared to the tests before, this is the first operation point with a not randomly
distributed surface attack. In comparison to the local small annealing colours of test 2,
a recurring “micro-diesel effect” was necessary to reach such a ring. In general
annealing colours should be avoided, because they weaken the surface. It is
conceivable that a further attack of the surface in the annealing ring area through the
“micro-diesel effect” can cause fatigue of the surface. A breakout of surface particles
and thus cavitation erosion of the surface will be the results. Erosion is especially
dangerous near the gap, because it influences the valve functions negatively.
A comparison of the three long-term tests, which were conducted at comparable
cavitation numbers shows the influence of air in the valve model. In test 1 a high
amount of free air through gas cavitation is probable (see also chapter 4.2), which is
possible damping vapour bubble collapses and thus prevents cavitation erosion. This
damping behaviour is also known from water /14/. Test 3 has no or a small amount of
free gas. Thus there is no damping effect and the surface is spread by pits caused by
“hard” vapour bubble collapses. A small amount of gas, as it is probable in long-term
test 2 can lead to the “micro-diesel effect”. This is a mainly thermal attack of the valve
material, which can result in a weakness of the surface and makes a further damage
more likely.
Group G - Fundamentals | Paper G-2 345
6. Conclusion and Outlook The investigated poppet valve shows three recurrently appearing types of cavitation in
combination with methanol. The analysis of these cavitation types reveals a coupled
dependency of the appearances on temperature and cavitation number. As main
reason for this dependency the behaviour of air solubility in methanol is suspected,
which decreases with increasing temperature. The investigation of the cavitation
erosion of the valve by means of long-term tests shows three states of surface attack.
These are besides no surface attack, a pit-spread surface and a thermal attack. These
types of attack seem to be also depending on the amount of air. Thus this work shows
the high influence of air solubility on cavitation appearance and the resulting surface
attack in case of methanol. Future works will be focused on simulation of the visualized
effects by means of CFD. This simulation, which should consider gas and vapour
cavitation, will later be used to make an assessment of cavitation erosion possible.
7. References /1/ Mauger, C. et. al.: Shadowgraph, Schlieren and interferometry in a 2D
cavitating channel flow. Experiments in Fluids, Vol. 53, Issue 6, pp. 1895-
1913, 2012
/2/ Walther, J.: Quantitative Untersuchungen der Innenströmung in kavitierenden
Dieseleinspritzdüsen. Dissertation. TU Darmstadt, 2002
/3/ Watanabe, R.: Shadowgraph Imaging of Cavitating Jet. Journal of Flow
Control, Measurement & Visualization, Vol. 3, pp. 106-110, 2015
/4/ Müller, L. et.al.: Messverfahren und numerische Modellierung von Kavitation in
einem ölhydraulischen Ventil. Ölhydraulik und Pneumatik, Vol. 2, pp. 20-26,
2013
/5/ Kim, K.; Chanine, G.; Franc, J.-P.; Karimi, A.: Advanced Experimental and
Numerical Techniques for Cavitation Erosion Prediction. Springer Verlag,
Heidelberg, 2014
/6/ Franc, J.-P.: Incubation Time and Cavitation Erosion Rate of Work-Hardening
Materials. Journal of Fluids Engineering, Vol. 131, pp. 021303/1-14, 2009
/7/ Wustmann, W.: Experimentelle und numerische Untersuchung der
Strömungsvorgänge in hydrostatischen Verdrängereinheiten am Beispiel von
Außenzahnrad- und Axialkolbenpumpen. dissertation. TU Dresden, 2009
346 10th International Fluid Power Conference | Dresden 2016

/8/ Schade, O.: Kavitation in oszillierenden Verdrängerpumpen. dissertation.
Universität Erlangen-Nürnberg, 2009
/9/ Sigloch, H.: Strömungsmaschinen. Grundlagen und Anwendungen. Hanser
Verlag, München, 2013
/10/ Vetter, G.: Handbuch Dosieren. 2. Auflage. Vulkan-Verlag, Essen, 2002
/11/ Weiss, R.: The solubility of nitrogen, oxygen and argon in water and seawater.
Deep-Sea Research, Vol. 17, pp. 721-735, 1970
/12/ Sommer, K.; Heinz, R.; Schöfer, J.: Verschleiß metallischer Werkstoffe.
Erscheinungsformen sicher beurteilen. 2. Auflage. Springer Vieweg,
Wiesbaden, 2014
/13/ Lohrentz, H.-J.: Mikro-Diesel Effekt als Folge der Kavitation in
Hydrauliksystemen. Ölhydraulik und Pneumatik 18, Nr. 3, pp. 175-180,1974
/14/ Auret, J. G. et. al.: The influence of water air content on cavitation erosion in
distilled water. Tribology International Vol. 26, Issue 6, pp. 431-433, 1993
8. Nomenclature
g Gap height μm
Absolute Pressure bar
Vapour Pressure bar
Q Volume flow l/h
Velocity m/s
Methanol temperature °C
Liquid density Kg/m3
Cavitation number -
Group G - Fundamentals | Paper G-2 347

348 10th International Fluid Power Conference | Dresden 2016
![Betty_Eng.ppt [\254\333\256e\274\322\246\241]](https://static.fdokumen.com/doc/165x107/6320bdd6aaa3e1b19f07a319/bettyengppt-254333256e274322246241.jpg)