Does the Sastry transition control cavitation in simple liquids?
10
J. Chem. Phys. 153, 184504 (2020); https://doi.org/10.1063/5.0023236 153, 184504 © 2020 Author(s). Does the Sastry transition control cavitation in simple liquids? Cite as: J. Chem. Phys. 153, 184504 (2020); https://doi.org/10.1063/5.0023236 Submitted: 27 July 2020 . Accepted: 27 October 2020 . Published Online: 12 November 2020 Caitlin M. Gish, Kai Nan, and Robert S. Hoy
-
Upload
khangminh22 -
Category
Documents
-
view
3 -
download
0
Transcript of Does the Sastry transition control cavitation in simple liquids?
J. Chem. Phys. 153, 184504 (2020); https://doi.org/10.1063/5.0023236 153, 184504
© 2020 Author(s).
Does the Sastry transition control cavitationin simple liquids?Cite as: J. Chem. Phys. 153, 184504 (2020); https://doi.org/10.1063/5.0023236Submitted: 27 July 2020 . Accepted: 27 October 2020 . Published Online: 12 November 2020
Caitlin M. Gish, Kai Nan, and Robert S. Hoy
The Journalof Chemical Physics ARTICLE scitation.org/journal/jcp
Does the Sastry transition control cavitationin simple liquids?
Cite as: J. Chem. Phys. 153, 184504 (2020); doi: 10.1063/5.0023236Submitted: 27 July 2020 • Accepted: 27 October 2020 •Published Online: 12 November 2020
Caitlin M. Gish, Kai Nan, and Robert S. Hoya)
AFFILIATIONSDepartment of Physics, University of South Florida, Tampa, Florida 33620, USA
a)Author to whom correspondence should be addressed: [email protected]
ABSTRACTWe examine the Sastry (athermal cavitation) transitions for model monatomic liquids interacting via Lennard-Jones as well as shorter- andlonger-ranged pair potentials. Low-temperature thermodynamically stable liquids have ρ < ρS except when the attractive forces are long-ranged. For moderate- and short-ranged attractions, stable liquids with ρ > ρS exist at higher temperatures; the pressures in these liquidsare high, but the Sastry transition may strongly influence their cavitation under dynamic hydrostatic expansion. The temperature T∗ atwhich stable ρ > ρS liquids emerge is ∼0.84ϵ/kB for Lennard-Jones liquids; T∗ decreases (increases) rapidly with increasing (decreasing)pair-interaction range. In particular, for short-ranged potentials, T∗ is above the critical temperature. All liquids’ inherent structures areisostructural (isomorphic) for densities below (above) the Sastry density ρS. Overall, our results suggest that the barriers to cavitation in mostsimple liquids under ambient conditions for which significant cavitation is likely to occur are primarily vibrational-energetic and entropicrather than configurational-energetic. The most likely exceptions to this rule are liquids with long-ranged pair interactions, such as alkalimetals.Published under license by AIP Publishing. https://doi.org/10.1063/5.0023236., s
I. INTRODUCTION
Repulsive forces dominate the structure of liquids over a widerange of pressures and temperatures, allowing many of their prop-erties to be understood using “universal” models.1 On the otherhand, attractive forces become increasingly important near freez-ing and vaporization transitions, particularly for dynamic phenom-ena.1–3 In general, varying the range and shape of the interatomicpair potential U(r) profoundly alters both the cluster-level struc-ture and the macroscopic properties of liquids.4 Such effects canbe understood in terms of the energy landscape (EL).5 Hard-core-like repulsions and short-range attractions produce rough ELs withmany basins, while softer repulsions and longer-range attractionsproduce opposite trends.6
One ubiquitous phenomenon for which the details of attrac-tive interactions are particularly important is cavitation, the for-mation of gas bubbles within liquids experiencing tensile stress.Cavitation is entirely absent in systems with purely repulsiveor short-range-attractive interactions because these systems lackdistinct liquid and gas phases. Classical nucleation theory (CNT)
performs particularly poorly for cavitation, typically underestimat-ing the bubble nucleation rate by many orders of magnitude. Oxtobyand Evans argued7 that the disagreement between CNT and non-classical nucleation theories (as well as experiments) gets pro-gressively worse as the range of interparticle attractions increasesbecause CNT’s assumption that bubbles are homogeneous (i.e.,have a uniform density and pressure) becomes increasingly inac-curate. However, few other studies have systematically examinedhow cavitation phenomenology varies with the range and shapeof U(r).
Cavitation under typical real-world conditions is inhomoge-neous; it tends to nucleate at impurities, especially gaseous impu-rities.8 Homogeneous cavitation commonly occurs in sonicated liq-uids9,10 and behind shock fronts.11 On the other hand, simulationshave suggested that even in macroscopically homogeneous systems,cavitation preferentially nucleates in regions with lower density12
and/or higher temperature.13 These results imply that accuratelypredicting inhomogeneity within the bulk liquid phase is a pre-requisite to developing quantitatively accurate microscopic theoriesof cavitation. Developing such theories is very difficult because it
J. Chem. Phys. 153, 184504 (2020); doi: 10.1063/5.0023236 153, 184504-1
Published under license by AIP Publishing
The Journalof Chemical Physics ARTICLE scitation.org/journal/jcp
requires detailed knowledge of liquids’ ELs’ topographies, which arechemistry-dependent.4
Accordingly, many of the recent advances in our theoreticalunderstanding of cavitation have come from particle-based sim-ulations. Most studies of homogeneous cavitation have employedLennard-Jones pair interactions.12–21 Some of these have focusedon comparison of equilibrium simulation results to various classicaland nonclassical theories, for various thermodynamic state points(various densities ρ and temperatures T).12–17 Others have exam-ined dynamic cavitation under hydrostatic expansion from a single(ρ, T).18–21
Sastry et al. demonstrated the existence of a cavitation transi-tion in liquids’ energy landscapes.12 The Sastry density ρS is the den-sity ρ at which the pressure PIS(ρ) within liquids’ inherent structures(IS) is minimal. For ρ > ρS, liquids’ IS are homogeneous and mechan-ically stable: ∂PIS/∂ρ > 0. For ρ < ρS, liquids’ IS consist of coexistingdense and void regions—i.e., they are cavitated—and are mechani-cally unstable: ∂PIS/∂ρ ≤ 0. Thus, by studying liquids’ Sastry tran-sitions, we can learn more about how their cavitation is influencedby their underlying ELs. Altabet et al. recently examined the Sastrytransition of model glass-forming liquids in much greater detail;22,23
see Sec. II. However, they did not study simple monatomic liquids,which readily crystallize and in which cavitation and crystallizationcan complete.
In this paper, we examine the Sastry transition in monatomicliquids with a wide variety of interaction potentials. We findthat in liquids with short- and moderate-ranged attractive forces,most ambient conditions for which cavitation is likely to occur—temperatures between the triple point and critical point, pres-sures between the stretched-liquid spinodal and atmospheric—correspond to densities that are well below ρS. In contrast, liquidswith long-ranged attractive forces, such as those formed by alkalimetals, have a broad region of thermodynamic phase space wherecavitation is likely to occur and ρ > ρS. Taken together, these resultssuggest that the barriers to cavitation in most (but not all) sim-ple monatomic liquids under ambient conditions for which signif-icant cavitation is likely to occur arise primarily from the vibrationalenergy and entropy rather than the configurational energy of the ELbasins they are most likely to occupy. We also find that all liquids’IS are isostructural (have nearly identical local structures away fromthe voided regions) for ρ < ρS but are isomorphic (exhibit a hiddenscale invariance24) for ρ > ρS.
II. THEORETICAL BACKGROUNDThe Sastry transition can be better understood by placing it
in context with CNT. Cavitation bubbles in stretched model liq-uids are typically empty or nearly empty.20 Consider nucleation ofan empty spherical bubble of radius R in a liquid with density ρand free-energy density f at temperature T. According to CNT,the free-energy barrier to nucleation of this bubble is ΔF(ρ, T)= −(4πR3/3)f (ρ, T) + 4πR2γ(ρ, T), where we allow the surface ten-sion γ to depend on ρ and T but not R. Writing f = u − Ts, whereu and s are the liquid’s potential energy and entropy densities, andbreaking ΔF(ρ, T) into its configurational and vibrational parts, onecan write5,25
ΔF(ρ,R,T)4πR2 = Δconf(ρ,R) + Δvib(ρ,R,T) − TΔent(ρ,R), (1)
where
Δconf(ρ,R) = γconf(ρ) − uconf(ρ)R3
,
Δvib(ρ,R,T) = γvib(ρ,T) − uvib(ρ,T)R3
,
Δent(ρ,R) = γs(ρ) − [sconf(ρ) + svib(ρ)]R3
.
(2)
Here, γs(ρ) is the entropic part of γ arising from (e.g.) changes in theordering of a liquid near a free surface. Thus, the free-energy bar-rier to cavitation has three components: configurational-energetic(Δconf), vibrational-energetic (Δvib), and entropic (−TΔent).
According to Sastry et al.’s picture,12 when ρ = ρS and T = 0,the sum of the first two terms in Eq. (1) goes to zero in the limit R→ 0. Liquids with ρ < ρS can cavitate by proceeding directly downthe same basin of their EL they currently occupy, whereas liquidswith ρ > ρS cannot; their cavitation must involve basin hopping. Theminimum of PIS(ρ) at ρ = ρS corresponds to an onset of mechan-ical instability under increasing tension that is (in principle) theathermal limit of the stretched-liquid spinodal, i.e., the T → 0 limitof the density ρc(T) at which the free-energy barrier to cavitationvanishes.
Altabet, Stillinger, and Debendetti recently showed22 that thesystem-size dependence of PIS(ρ) is consistent with finite-sizerounding of a first-order athermal phase transition. The transi-tion from cavitated to homogeneous IS at ρ = ρS is a featurethat is wiped out by the anharmonic intrabasin distortions thatoccur upon returning to the initial liquid thermodynamic state;this structure-obscuring behavior of intrabasin vibrational motionis consistent with the presence of a positive free-energy barrierfor cavitation in the liquid.26 They also argued that in the ther-modynamic limit, kinks in f conf(ρ, T) and f vib(ρ, T) at ρS, respec-tively, produce discontinuous decreases and increases in PIS(ρ) andPvib(ρ, T) as ρ exceeds ρS. Since the liquid-state pressure Pliq(ρ, T)= PIS(ρ) + Pvib(ρ, T) + ρkBT is continuous at ρS, these disconti-nuities must cancel. In Ref. 23, they showed that these phenom-ena are not universal. Strongly cohesive systems (i.e., systems withsufficiently deep and wide pair-potential wells) show the above-mentioned behavior. In these systems, the discontinuity in PIS(ρ)is in fact associated with a first-order athermal phase transitionbetween homogeneous and cavitated IS. Weakly cohesive systems,while still possessing the Sastry minimum in PIS(ρ), have a system-size-independent PIS(ρ) that suggests no such first-order transition ispresent.
To the best of our knowledge, Refs. 22 and 23 are the only twopublished particle-based simulation studies that have systematicallyexamined how varying the pair-interaction potential affects cavita-tion; see the Appendix for further details. However, neither of thesestudies isolated the effects of the attractive interactions’ range fromthe effects of their strength (i.e., the depth of the pair-potential well).Below, we will do so.
J. Chem. Phys. 153, 184504 (2020); doi: 10.1063/5.0023236 153, 184504-2
Published under license by AIP Publishing
The Journalof Chemical Physics ARTICLE scitation.org/journal/jcp
III. MODEL AND METHODSOne widely used generalization of the Lennard-Jones potential
is the “Mie” potential,
Un(r) = ϵ[(σr)
2n− 2(
σr)n]. (3)
Here, ϵ and σ are characteristic energy and length scales, and theexponent n characterizes the steepness of the repulsive and attractiveinteractions.Un(r) is a general repulsive–attractive potential that canbe used to model systems ranging from alkali metals (n ≃ 4) to noblegases (n ≃ 6) to colloids and buckyballs (n ≃ 16).27–29 Although theMorse potential Uα(r) = ϵ(exp[−2α(r − σ)] − 2 exp[−α(r − σ)])is probably a more accurate model for some of these systems,28,29
Lennard-Jones-type potentials are more widely used to model simpleliquids.
Typical dynamical simulations employ a truncated-and-shiftedversion of Un(r). Simulations including energy minimizations thatfind systems’ IS, however, require modifying Un(r) in such a waythat both Un(r) and ∂dUn/∂r go to zero at some cutoff radius.6
This modification is typically achieved by multiplying Un(r) by somefunction f that varies from 1 to zero over the range ri ≤ r ≤ ro,where ri and ro are inner and outer cutoff radii. We use the formof f developed by Mei et al.,30
f (x) =
⎧⎪⎪⎪⎪⎪⎨⎪⎪⎪⎪⎪⎩
1, x ≤ 0
(1 − x)3(1 + 3x + 6x2
), 0 ≤ x ≤ 1
0, x > 1
, (4)
where x = (r − ri)/(ro − ri). We choose an n-dependent ri using thecriterion Un[ri(n)] =−ϵ/100, which yields ri(n) = [1−
√99/10]−1/nσ
and ro(n) = 11ri(n)/10. Thus, the interaction potential employed inthis study is
U∗n (r) = Un(r)f [r − ri(n)
ro(n) − ri(n)]. (5)
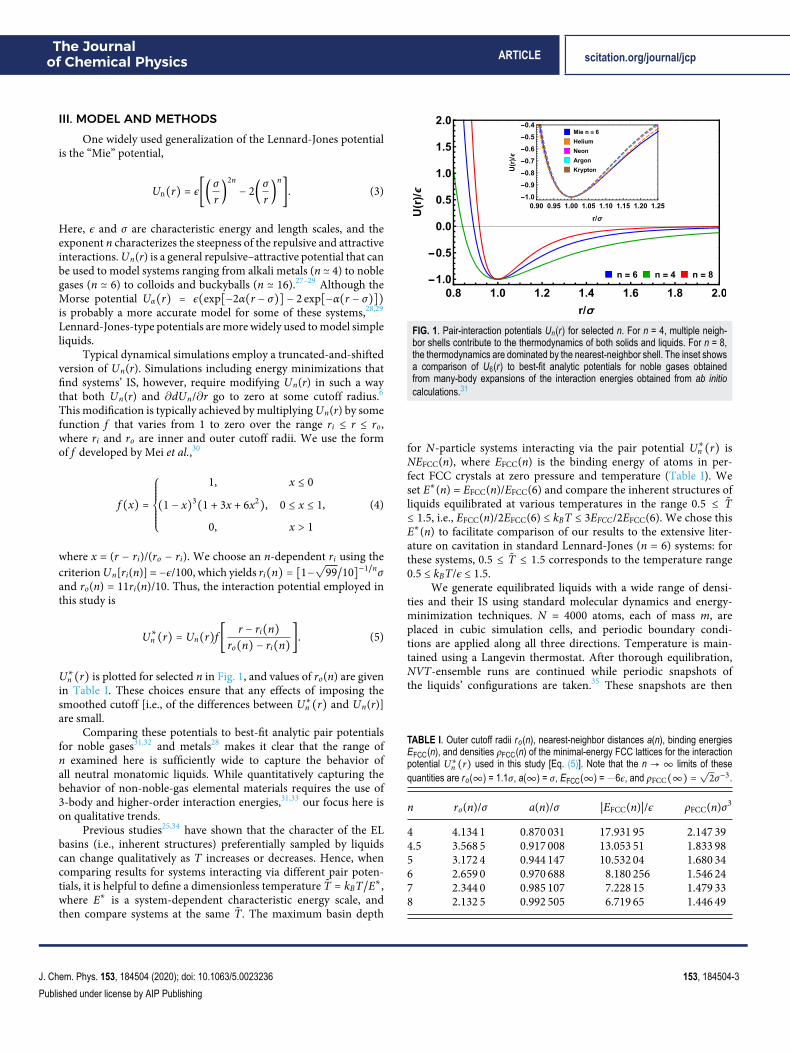
U∗n (r) is plotted for selected n in Fig. 1, and values of ro(n) are givenin Table I. These choices ensure that any effects of imposing thesmoothed cutoff [i.e., of the differences between U∗n (r) and Un(r)]are small.
Comparing these potentials to best-fit analytic pair potentialsfor noble gases31,32 and metals28 makes it clear that the range ofn examined here is sufficiently wide to capture the behavior ofall neutral monatomic liquids. While quantitatively capturing thebehavior of non-noble-gas elemental materials requires the use of3-body and higher-order interaction energies,31,33 our focus here ison qualitative trends.
Previous studies25,34 have shown that the character of the ELbasins (i.e., inherent structures) preferentially sampled by liquidscan change qualitatively as T increases or decreases. Hence, whencomparing results for systems interacting via different pair poten-tials, it is helpful to define a dimensionless temperature T̃ = kBT/E∗,where E∗ is a system-dependent characteristic energy scale, andthen compare systems at the same T̃. The maximum basin depth
FIG. 1. Pair-interaction potentials Un(r) for selected n. For n = 4, multiple neigh-bor shells contribute to the thermodynamics of both solids and liquids. For n = 8,the thermodynamics are dominated by the nearest-neighbor shell. The inset showsa comparison of U6(r) to best-fit analytic potentials for noble gases obtainedfrom many-body expansions of the interaction energies obtained from ab initiocalculations.31
for N-particle systems interacting via the pair potential U∗n (r) isNEFCC(n), where EFCC(n) is the binding energy of atoms in per-fect FCC crystals at zero pressure and temperature (Table I). Weset E∗(n) = EFCC(n)/EFCC(6) and compare the inherent structures ofliquids equilibrated at various temperatures in the range 0.5 ≤ T̃≤ 1.5, i.e., EFCC(n)/2EFCC(6) ≤ kBT ≤ 3EFCC/2EFCC(6). We chose thisE∗(n) to facilitate comparison of our results to the extensive liter-ature on cavitation in standard Lennard-Jones (n = 6) systems: forthese systems, 0.5 ≤ T̃ ≤ 1.5 corresponds to the temperature range0.5 ≤ kBT/ϵ ≤ 1.5.
We generate equilibrated liquids with a wide range of densi-ties and their IS using standard molecular dynamics and energy-minimization techniques. N = 4000 atoms, each of mass m, areplaced in cubic simulation cells, and periodic boundary condi-tions are applied along all three directions. Temperature is main-tained using a Langevin thermostat. After thorough equilibration,NVT-ensemble runs are continued while periodic snapshots ofthe liquids’ configurations are taken.35 These snapshots are then
TABLE I. Outer cutoff radii ro(n), nearest-neighbor distances a(n), binding energiesEFCC(n), and densities ρFCC(n) of the minimal-energy FCC lattices for the interactionpotential U∗n (r) used in this study [Eq. (5)]. Note that the n → ∞ limits of thesequantities are ro(∞) = 1.1σ, a(∞) = σ, EFCC(∞) = −6ϵ, and ρFCC(∞) =
√
2σ−3.
n ro(n)/σ a(n)/σ |EFCC(n)|/ϵ ρFCC(n)σ3
4 4.134 1 0.870 031 17.931 95 2.147 394.5 3.568 5 0.917 008 13.053 51 1.833 985 3.172 4 0.944 147 10.532 04 1.680 346 2.659 0 0.970 688 8.180 256 1.546 247 2.344 0 0.985 107 7.228 15 1.479 338 2.132 5 0.992 505 6.719 65 1.446 49
J. Chem. Phys. 153, 184504 (2020); doi: 10.1063/5.0023236 153, 184504-3
Published under license by AIP Publishing
The Journalof Chemical Physics ARTICLE scitation.org/journal/jcp
energy-minimized using the Polak–Ribiére conjugate gradient algo-rithm36 to find the liquids’ IS. All simulations are performed usingLAMMPS.37
We will compare systems’ Sastry densities ρS(n, T̃) to theirspinodal vaporization densities ρv(n, T̃) and their equilibrium crys-tallization densities ρx(n, T̃). We estimate ρv(n, T̃) as the density forwhich liquids’ P(ρ, T̃) are minimized, i.e., the density below whichthe liquid phase is mechanically unstable. No ρv values are reportedfor (n, T̃) that lack clear minima; estimating these systems’ vaporiza-tion densities is more difficult38,39 and is not essential here. We esti-mate ρx(n, T̃) using the Stevens–Robbins protocol.40 Specifically, westart from a perfect FCC crystal at a given ρ and equilibrate it at thegiven T̃ for 400τ. We then freeze half the system in place while equi-librating the other half at kinetic temperature 3T̃/2 for another 400τto create coexisting liquid and crystalline regions within the simu-lation cell. Finally, we unfreeze the crystalline half, reset the liquidhalf’s kinetic temperature to T̃, and integrate the system forward intime for at least another 104τ. Crystallization occurs over this periodif ρ ≥ ρx(n, T̃). Strictly speaking, ρx(n, T̃) is the density at which theHelmholtz free energies of the liquid and crystalline phases are equal.Note that the ρv(n, T̃) and ρx(n, T̃) obtained using these methodsare rather sensitive to both system size and the choice of potentialcutoff.38,39 However, our focus in this paper is on qualitative trends,and none of the results presented below would be altered by smallchanges in ρv or ρx.
IV. RESULTSWe begin by presenting results of 4 ≤ n ≤ 8 Mie liquids’ and
their inherent structures’ equations of state. All data in Figs. 2–4 and6 are averaged over 25 statistically independent samples. All densi-ties discussed below are in units of σ−3, and all pressures are in unitsof ϵσ−3.
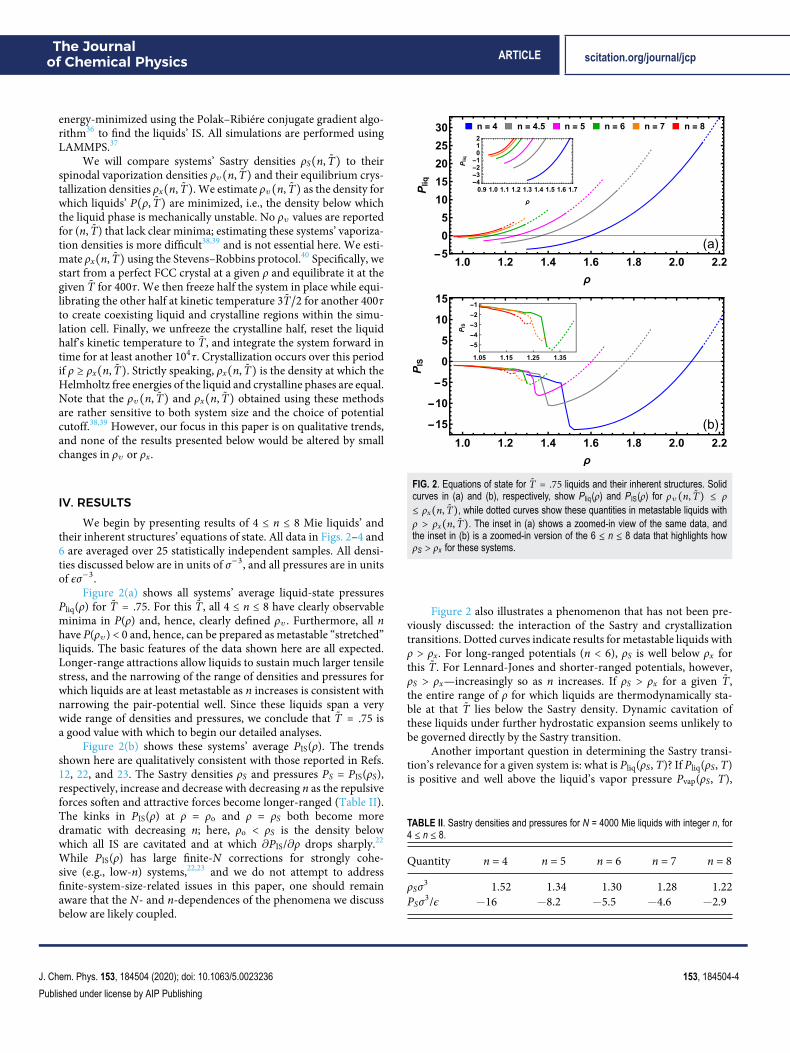
Figure 2(a) shows all systems’ average liquid-state pressuresPliq(ρ) for T̃ = .75. For this T̃, all 4 ≤ n ≤ 8 have clearly observableminima in P(ρ) and, hence, clearly defined ρv . Furthermore, all nhave P(ρv) < 0 and, hence, can be prepared as metastable “stretched”liquids. The basic features of the data shown here are all expected.Longer-range attractions allow liquids to sustain much larger tensilestress, and the narrowing of the range of densities and pressures forwhich liquids are at least metastable as n increases is consistent withnarrowing the pair-potential well. Since these liquids span a verywide range of densities and pressures, we conclude that T̃ = .75 isa good value with which to begin our detailed analyses.
Figure 2(b) shows these systems’ average PIS(ρ). The trendsshown here are qualitatively consistent with those reported in Refs.12, 22, and 23. The Sastry densities ρS and pressures PS = PIS(ρS),respectively, increase and decrease with decreasing n as the repulsiveforces soften and attractive forces become longer-ranged (Table II).The kinks in PIS(ρ) at ρ = ρo and ρ = ρS both become moredramatic with decreasing n; here, ρo < ρS is the density belowwhich all IS are cavitated and at which ∂PIS/∂ρ drops sharply.22
While PIS(ρ) has large finite-N corrections for strongly cohe-sive (e.g., low-n) systems,22,23 and we do not attempt to addressfinite-system-size-related issues in this paper, one should remainaware that the N- and n-dependences of the phenomena we discussbelow are likely coupled.
FIG. 2. Equations of state for T̃ = .75 liquids and their inherent structures. Solidcurves in (a) and (b), respectively, show Pliq(ρ) and PIS(ρ) for ρv(n, T̃) ≤ ρ≤ ρx(n, T̃), while dotted curves show these quantities in metastable liquids withρ > ρx(n, T̃). The inset in (a) shows a zoomed-in view of the same data, andthe inset in (b) is a zoomed-in version of the 6 ≤ n ≤ 8 data that highlights howρS > ρx for these systems.
Figure 2 also illustrates a phenomenon that has not been pre-viously discussed: the interaction of the Sastry and crystallizationtransitions. Dotted curves indicate results for metastable liquids withρ > ρx. For long-ranged potentials (n < 6), ρS is well below ρx forthis T̃. For Lennard-Jones and shorter-ranged potentials, however,ρS > ρx—increasingly so as n increases. If ρS > ρx for a given T̃,the entire range of ρ for which liquids are thermodynamically sta-ble at that T̃ lies below the Sastry density. Dynamic cavitation ofthese liquids under further hydrostatic expansion seems unlikely tobe governed directly by the Sastry transition.
Another important question in determining the Sastry transi-tion’s relevance for a given system is: what is Pliq(ρS, T)? If Pliq(ρS, T)is positive and well above the liquid’s vapor pressure Pvap(ρS, T),
TABLE II. Sastry densities and pressures for N = 4000 Mie liquids with integer n, for4 ≤ n ≤ 8.
Quantity n = 4 n = 5 n = 6 n = 7 n = 8
ρSσ3 1.52 1.34 1.30 1.28 1.22PSσ3/ϵ −16 −8.2 −5.5 −4.6 −2.9
J. Chem. Phys. 153, 184504 (2020); doi: 10.1063/5.0023236 153, 184504-4
Published under license by AIP Publishing
The Journalof Chemical Physics ARTICLE scitation.org/journal/jcp
TABLE III. Mean liquid-state pressures at the Sastry density: ⟨Pliq(ρS, T̃)⟩σ3/ϵ. Val-
ues for metastable supercooled liquids (systems with ρS > ρx ) are italicized, and “–”indicates that the liquid is unstable at this T̃. Note that Pliq(ρS, T) and Pliq(ρS, T̃) bothincrease with increasing n for 4 ≤ n ≤ 7, then decrease for n ≳ 7 as Un(r) approachesthe sticky-hard-sphere limit.41 The temperatures T̃0(n) for which Pliq(ρS, T̃) = 0are given in Table IV.
T̃ n = 4 n = 5 n = 6 n = 7 n = 8
0.5 −5.4 −1.0 0.34 . . . . . .0.75 −1.5 2.0 3.4 5.2 3.21.0 2.0 4.6 6.0 8.1 5.91.25 4.1 7.4 8.4 11 8.31.5 8.2 9.3 11 13 11
cavitation of liquids with ρ = ρS and temperature T is highly unlikely.On the other hand, if Pliq(ρS, T) ≲ Pvap(ρS, T), cavitation is farlikelier. For these systems, the energy barriers for cavitation atρ = ρS − δρ should be significantly smaller than those for cavita-tion at ρ = ρS + δρ is (where 0 < δρ ≪ ρS),22 so cavitation is likelyto be tightly coupled to—and effectively nucleated by—local densityor temperature fluctuations within the liquid.12,13
Table III lists values of Pliq(ρS, T̃) for selected n and T̃.Pliq(ρS, 0.5) is small or negative for all n; the Sastry transition is likelyto strongly influence cavitation in these liquids. However, T̃ = 0.5liquids are metastable for n ≥ 5. In these systems, local density fluc-tuations to ρ = ρS + δρ are likely to nucleate crystallization andlocal density fluctuations to ρ = ρS − δρ are likely to nucleate cav-itation; this competition gives rise to very complicated physics.14 AsT̃ increases, P(ρS) increases rapidly, but remains negative or smallfor a wider range of T̃ in systems with longer-ranged attractions.For T̃ ≳ 1, however, Pliq(ρS) is well above Pvap(ρS) for all n. It seemsunlikely that the Sastry transition has much influence on these liq-uids’ quiescent-state mechanical properties, but it may still stronglyinfluence their cavitation under dynamic hydrostatic expansion.
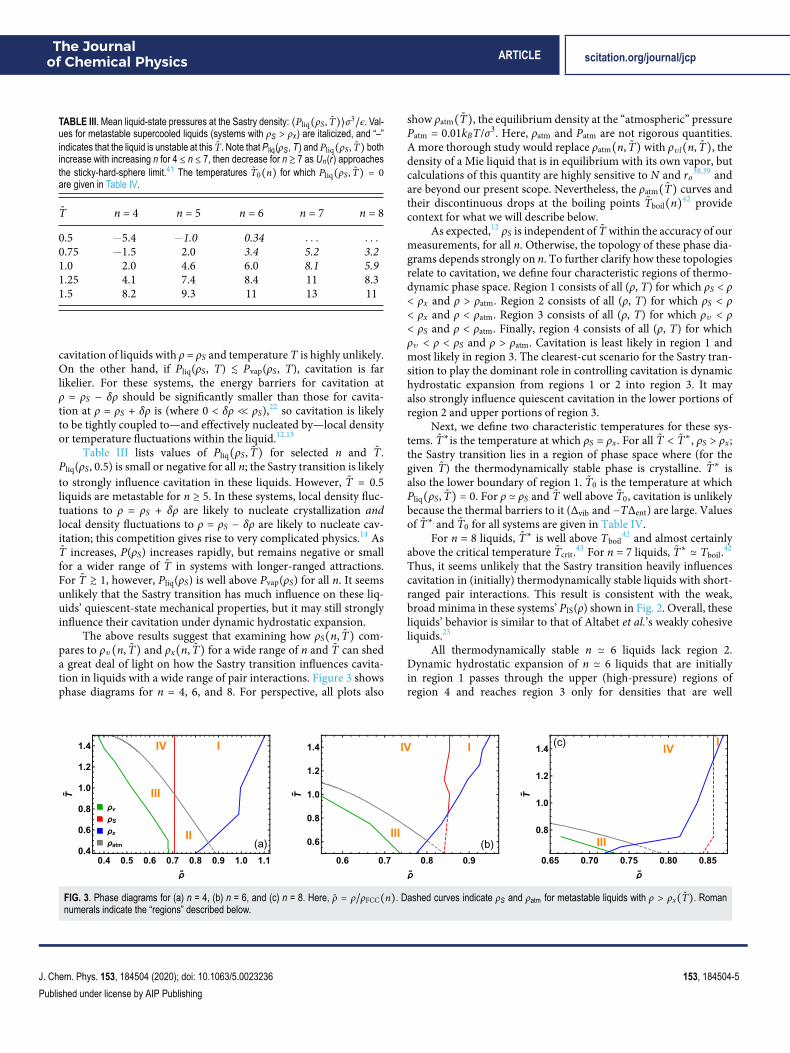
The above results suggest that examining how ρS(n, T̃) com-pares to ρv(n, T̃) and ρx(n, T̃) for a wide range of n and T̃ can sheda great deal of light on how the Sastry transition influences cavita-tion in liquids with a wide range of pair interactions. Figure 3 showsphase diagrams for n = 4, 6, and 8. For perspective, all plots also
show ρatm(T̃), the equilibrium density at the “atmospheric” pressurePatm = 0.01kBT/σ3. Here, ρatm and Patm are not rigorous quantities.A more thorough study would replace ρatm(n, T̃) with ρvl(n, T̃), thedensity of a Mie liquid that is in equilibrium with its own vapor, butcalculations of this quantity are highly sensitive to N and ro38,39 andare beyond our present scope. Nevertheless, the ρatm(T̃) curves andtheir discontinuous drops at the boiling points T̃boil(n)42 providecontext for what we will describe below.
As expected,12 ρS is independent of T̃ within the accuracy of ourmeasurements, for all n. Otherwise, the topology of these phase dia-grams depends strongly on n. To further clarify how these topologiesrelate to cavitation, we define four characteristic regions of thermo-dynamic phase space. Region 1 consists of all (ρ, T) for which ρS < ρ< ρx and ρ > ρatm. Region 2 consists of all (ρ, T) for which ρS < ρ< ρx and ρ < ρatm. Region 3 consists of all (ρ, T) for which ρv < ρ< ρS and ρ < ρatm. Finally, region 4 consists of all (ρ, T) for whichρv < ρ < ρS and ρ > ρatm. Cavitation is least likely in region 1 andmost likely in region 3. The clearest-cut scenario for the Sastry tran-sition to play the dominant role in controlling cavitation is dynamichydrostatic expansion from regions 1 or 2 into region 3. It mayalso strongly influence quiescent cavitation in the lower portions ofregion 2 and upper portions of region 3.
Next, we define two characteristic temperatures for these sys-tems. T̃∗is the temperature at which ρS = ρx. For all T̃ < T̃∗, ρS > ρx;the Sastry transition lies in a region of phase space where (for thegiven T̃) the thermodynamically stable phase is crystalline. T̃∗ isalso the lower boundary of region 1. T̃0 is the temperature at whichPliq(ρS, T̃) = 0. For ρ ≃ ρS and T̃ well above T̃0, cavitation is unlikelybecause the thermal barriers to it (Δvib and −TΔent) are large. Valuesof T̃∗ and T̃0 for all systems are given in Table IV.
For n = 8 liquids, T̃∗ is well above Tboil42 and almost certainly
above the critical temperature T̃crit.43 For n = 7 liquids, T̃∗ ≃ Tboil.42
Thus, it seems unlikely that the Sastry transition heavily influencescavitation in (initially) thermodynamically stable liquids with short-ranged pair interactions. This result is consistent with the weak,broad minima in these systems’ PIS(ρ) shown in Fig. 2. Overall, theseliquids’ behavior is similar to that of Altabet et al.’s weakly cohesiveliquids.23
All thermodynamically stable n ≃ 6 liquids lack region 2.Dynamic hydrostatic expansion of n ≃ 6 liquids that are initiallyin region 1 passes through the upper (high-pressure) regions ofregion 4 and reaches region 3 only for densities that are well
FIG. 3. Phase diagrams for (a) n = 4, (b) n = 6, and (c) n = 8. Here, ρ̃ = ρ/ρFCC(n). Dashed curves indicate ρS and ρatm for metastable liquids with ρ > ρx(T̃). Romannumerals indicate the “regions” described below.
J. Chem. Phys. 153, 184504 (2020); doi: 10.1063/5.0023236 153, 184504-5
Published under license by AIP Publishing
The Journalof Chemical Physics ARTICLE scitation.org/journal/jcp
TABLE IV. Characteristic reduced temperatures for Mie liquids. “. . . ” indicates thatT̃∗ is below our lowest simulated value (0.375 for n = 4) or that T̃0 is below thelowest T̃ for which these liquids are metastable.
Quantity n = 4 n = 5 n = 6 n = 7 n = 8
T̃∗ . . . 0.51 0.84 1.20 1.33T̃0 0.85 0.60 0.47 . . . . . .
below ρS. Thus, it also seems unlikely that the Sastry transitionheavily influences cavitation in (initially) thermodynamically stablemonatomic n ≃ 6 liquids such as noble liquids (Fig. 1). However,this result also indicates that the free-energy barriers to cavitation inthese systems are primarily vibrational-energetic and entropic ratherthan configurational-energetic, i.e., they are dominated by Δvib and−TΔent. Moreover, the Sastry transition may, indeed, play a majorrole in supercooled n ≃ 6 liquids, e.g., Lennard-Jones liquids withT̃ ≲ 0.6. As discussed above, these liquids occupy a large region ofthermodynamic phase space; note that Lennard-Jones liquids thatare metastable with respect to both crystallization and cavitation canbe prepared for T̃ as low as 0.35.14,15
For n = 4, regions 1 and 2 are both very large. There is alarge region of thermodynamic phase space where dynamic hydro-static expansion can take these liquids from region 1 through region2 into region 3, or directly from region two into region 3. Weexpect that the Sastry transition is likely to play a crucial role inthese systems, for both hydrostatic-expansion-driven cavitation anddensity-fluctuation-driven cavitation (particularly in region 2). ForT̃ < 0.85, these liquids have negative pressure at ρ = ρS. Thus, Sastryand Altabet et al.’s picture suggests that n = 4 stretched liquids are(meta)stabilized against cavitation by both vibrational-energetic andentropic barriers (Δvib and −TΔent, respectively).
Previous studies of Lennard-Jones systems have shown thatrather than continuing all the way down to T = 0, the stretched-liquid spinodal ρc(T) is interrupted either by the liquid–crystal coex-istence curve ρx(T),19 the Kauzmann curve ρK(T),44 or by a (poten-tially ideal) glass transition curve ρig(T)45,46 as T decreases. Ourresults for n ≥ 5 are consistent with those of Ref. 19, i.e., these liquids’
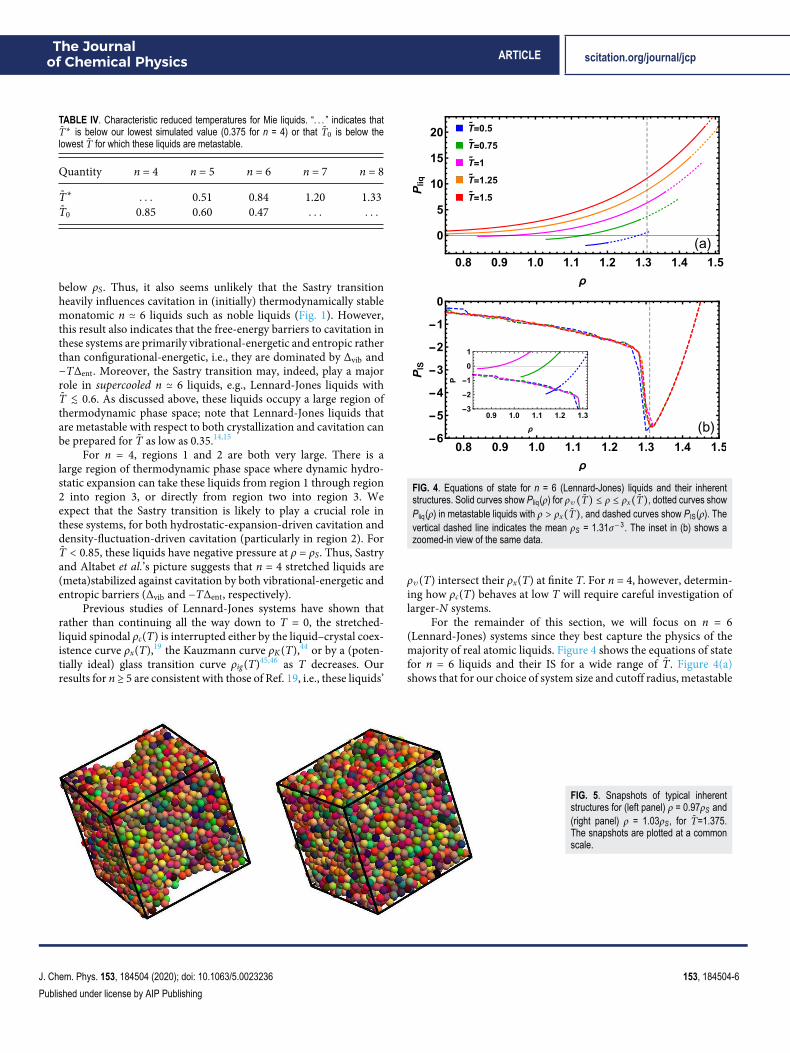
FIG. 4. Equations of state for n = 6 (Lennard-Jones) liquids and their inherentstructures. Solid curves show Pliq(ρ) for ρv(T̃) ≤ ρ ≤ ρx(T̃), dotted curves showPliq(ρ) in metastable liquids with ρ > ρx(T̃), and dashed curves show PIS(ρ). Thevertical dashed line indicates the mean ρS = 1.31σ−3. The inset in (b) shows azoomed-in view of the same data.
ρv(T) intersect their ρx(T) at finite T. For n = 4, however, determin-ing how ρc(T) behaves at low T will require careful investigation oflarger-N systems.
For the remainder of this section, we will focus on n = 6(Lennard-Jones) systems since they best capture the physics of themajority of real atomic liquids. Figure 4 shows the equations of statefor n = 6 liquids and their IS for a wide range of T̃. Figure 4(a)shows that for our choice of system size and cutoff radius, metastable
FIG. 5. Snapshots of typical inherentstructures for (left panel) ρ = 0.97ρS and(right panel) ρ = 1.03ρS, for T̃=1.375.The snapshots are plotted at a commonscale.
J. Chem. Phys. 153, 184504 (2020); doi: 10.1063/5.0023236 153, 184504-6
Published under license by AIP Publishing
The Journalof Chemical Physics ARTICLE scitation.org/journal/jcp
stretched liquids can be prepared for T̃ ≲ 1. It illustrates how liq-uids with ρ = ρS are metastable (supercooled) for T̃ < T̃∗ and alsohow the range of densities and pressures over which these liquidsare stable increases rapidly with increasing T̃. The Sastry transition ismost likely to be relevant when these liquids are isochorically cooled(for ρ < ρS) or dynamically hydrostatically expanded (from an ini-tial ρ > ρS). Figure 4(b) illustrates how these liquids’ IS’ equations ofstate depend on T̃. As expected for simple liquids, the T̃-dependenceof PIS(ρ) is very weak. The only exception to this trend—PIS(ρ) forT̃ = .5 is lower than it is for T̃ ≥ .75 for 1.26 ≳ ρσ3
≲ 1.31—lies in aregion of phase space where the liquid is metastable.
We conclude our analyses by switching our focus from theSastry transition’s macroscopic features to its microscopic features.Figure 5 shows snapshots for typical n = 6, T̃ = 1.375 inherentstructures for densities slightly below and above ρS. As reported inRefs. 12, 22, and 23, IS are inhomogeneous and cavitated for ρ < ρSbut homogeneous for ρ > ρS. The left-hand snapshot shows an IScontaining a single large void. It clearly has a significant degreeof short-ranged crystal-like order. This cannot arise in the bidis-perse mixtures employed in Refs. 22 and 23, which were designed tosuppress crystallization. The right-hand snapshot shows a homoge-neous IS. It also shows some signs of local structural order, e.g., thewell-defined second-nearest-neighbor shells that are often presentin dense simple liquids’ IS,47,48 but the degree of ordering present isunclear.
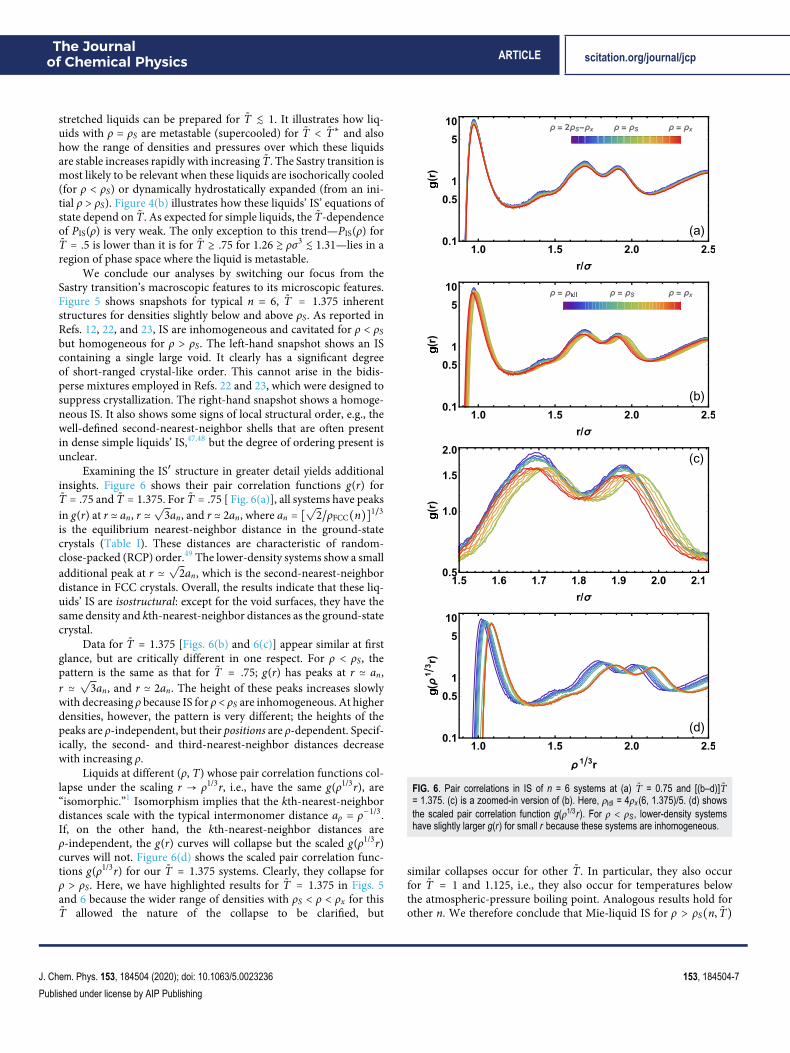
Examining the IS′ structure in greater detail yields additionalinsights. Figure 6 shows their pair correlation functions g(r) forT̃ = .75 and T̃ = 1.375. For T̃ = .75 [ Fig. 6(a)], all systems have peaksin g(r) at r ≃ an, r ≃
√3an, and r ≃ 2an, where an = [
√2/ρFCC(n)]1/3
is the equilibrium nearest-neighbor distance in the ground-statecrystals (Table I). These distances are characteristic of random-close-packed (RCP) order.49 The lower-density systems show a smalladditional peak at r ≃
√2an, which is the second-nearest-neighbor
distance in FCC crystals. Overall, the results indicate that these liq-uids’ IS are isostructural: except for the void surfaces, they have thesame density and kth-nearest-neighbor distances as the ground-statecrystal.
Data for T̃ = 1.375 [Figs. 6(b) and 6(c)] appear similar at firstglance, but are critically different in one respect. For ρ < ρS, thepattern is the same as that for T̃ = .75; g(r) has peaks at r ≃ an,r ≃√
3an, and r ≃ 2an. The height of these peaks increases slowlywith decreasing ρ because IS for ρ < ρS are inhomogeneous. At higherdensities, however, the pattern is very different; the heights of thepeaks are ρ-independent, but their positions are ρ-dependent. Specif-ically, the second- and third-nearest-neighbor distances decreasewith increasing ρ.
Liquids at different (ρ, T) whose pair correlation functions col-lapse under the scaling r → ρ1/3r, i.e., have the same g(ρ1/3r), are“isomorphic.”1 Isomorphism implies that the kth-nearest-neighbordistances scale with the typical intermonomer distance aρ = ρ−1/3.If, on the other hand, the kth-nearest-neighbor distances areρ-independent, the g(r) curves will collapse but the scaled g(ρ1/3r)curves will not. Figure 6(d) shows the scaled pair correlation func-tions g(ρ1/3r) for our T̃ = 1.375 systems. Clearly, they collapse forρ > ρS. Here, we have highlighted results for T̃ = 1.375 in Figs. 5and 6 because the wider range of densities with ρS < ρ < ρx for thisT̃ allowed the nature of the collapse to be clarified, but
FIG. 6. Pair correlations in IS of n = 6 systems at (a) T̃ = 0.75 and [(b–d)]T̃= 1.375. (c) is a zoomed-in version of (b). Here, ρldl = 4ρx (6, 1.375)/5. (d) showsthe scaled pair correlation function g(ρ1/3r). For ρ < ρS, lower-density systemshave slightly larger g(r) for small r because these systems are inhomogeneous.
similar collapses occur for other T̃. In particular, they also occurfor T̃ = 1 and 1.125, i.e., they also occur for temperatures belowthe atmospheric-pressure boiling point. Analogous results hold forother n. We therefore conclude that Mie-liquid IS for ρ > ρS(n, T̃)
J. Chem. Phys. 153, 184504 (2020); doi: 10.1063/5.0023236 153, 184504-7
Published under license by AIP Publishing
The Journalof Chemical Physics ARTICLE scitation.org/journal/jcp
are, indeed, isomorphic. They possess essentially the same order;the main ρ-dependence of this order is that the characteristic kth-nearest-neighbor distances are proportional to aρ = ρ−1/3.
“Isomorph” curves in (ρ, T) phase space along which a givensystem is isomorphic play a very important role in liquid-statephysics; for example, the freezing and melting lines of “Roskilde-simple” liquids are isomorphs.24 Dyre et al. have shown that onisomorphs, Roskilde-simple liquids have the same pressure–energycorrelations, dynamics, and excess entropy, as well as the same equa-tion of motion in the reduced coordinates ρ1/3 r⃗N .1,24 Although Miepotentials do not meet the formal criteria for Roskilde-simplicity,50
the fact that their liquids’ ρ > ρS IS are isomorphic suggests thattheir IS’ equation of state may also be an isomorph, albeit one ofa different character given that it is a curve ρ(P) rather than a curveρ(T) as is the case for freezing and melting lines. More generally,the sharp contrast between their ρ < ρS isostructural IS and theirρ > ρS isomorphic IS is further evidence that the Sastry transitionis a useful concept for improving our fundamental understanding ofcavitation.
V. DISCUSSION AND CONCLUSIONSIn this paper, we studied the Sastry transition in monatomic
Mie liquids. We showed that for short-ranged pair interactions (n≳ 7), thermodynamically stable liquids with ρ > ρS exist only atreduced temperatures T̃ where pressures are high, making cavitationunlikely. Indeed, the minimum T̃ for which such liquids are foundare above the liquids’ “atmospheric”-pressure boiling temperatures,and probably above their critical temperatures. The Sastry transitionis unlikely to a play a major role in the “weakly cohesive”23 liquids’physics.
Thermodynamically stable liquids with small or negative pres-sures and ρ > ρS exist only when the pair interactions are long-ranged(n ≲ 5). In these systems, local density fluctuations to ρ = ρS − δ arelikely to significantly enhance cavitation. More generally, the Sas-try transition likely plays a crucial role in these systems’ cavitationunder dynamic hydrostatic expansion. A prominent group of ele-ments with such long-ranged pair interactions is the alkali metals.CNT is particularly inaccurate for systems with long-ranged attrac-tive forces, but much of this inaccuracy results from the failure ofapproximations CNT typically makes, such as the assumptions thatcavities are uniform and have the same properties as the bulk gas,interfaces are atomically thin, and that γ does not depend on R or T.7
The n = 4 Mie potential studied here and the Morse potential withα ≃ 3.2 model alkali metals only roughly,27,28 but follow up stud-ies using realistic many-body potentials33 combined with analysesemploying theoretical models that relax CNT’s typical assumptions7
may lead to crucial insights into the nature of cavitation in thesesystems.
All thermodynamically stable Lennard-Jones (n = 6) liquidswith T̃ ≲ 0.84 have ρ < ρS, suggesting that the Sastry transi-tion is unlikely to heavily influence their cavitation under dynamichydrostatic expansion. The majority of previous simulation stud-ies of the cavitation of these liquids12–21 have explored this regime.However, this result also indicates the free-energy barriers to cavi-tation in these liquids are vibrational-energetic and entropic ratherthan configurational-energetic, i.e., that the barriers are dominated
by the Δvib − TΔent term in Eq. (1). This raises a fundamental ques-tion: are ρ < ρS liquids stabilized (or metastabilized) against cavita-tion primarily by Δvib or −TΔent? Δent is not easy to calculate andhence the ratio |Δvib/TΔent| has been little studied, but it can becalculated using state-of-the art methods;51 these calculations haveshown that the entropic term can be important even at moder-ate temperatures. Combining such calculations with a separation ofthese liquids’ equation of state P(ρ, T) into their configurational andvibrational contributions Pconf(ρ) and Pvib(ρ, T)22,52 might providethe data necessary to answer this question.
For T̃ ≳ 0.84, we showed that thermodynamically stableLennard-Jones liquids with ρ > ρS exist, but the ambient pressuresat ρ = ρS are high, indicating that cavitation at these temperatures islikely only for densities well below ρS. However, we also found thatmetastable supercooled n ≲ 6 liquids with ρ ≳ ρS and low ambientpressures P ≲ Patm occupy a broad region of thermodynamic phasespace, at least for the small system size considered here. In suchsystems, cavitation competes with crystallization, giving rise to com-plicated physics14 that is beyond our present scope. Again, it wouldbe very interesting to further examine the degree to which the Sastrytransition influences cavitation in this regime, using either coarse-grained or more realistic models. Our results suggest that it plays amajor role.
The Sastry transition is well-known to correspond to the tran-sition of IS′ macroscopic structure from cavitated to homogeneous.By studying model monatomic liquids, we found that it also cor-responds to a sharp transition in IS’ microscopic structure. IS forρ < ρS are isostructural: they have a locally RCP order, with kth-nearest-neighbor distances that are ρ-independent. In contrast, ISfor ρ > ρS are isomorphic: they also have a locally RCP order, butwith kth-nearest-neighbor distances that scale with the character-istic interparticle separation aρ ≡ ρ−1/3. The fact that this resultholds for all n we studied suggests that it may hold for the ISof most monatomic liquids that lack strongly directional interac-tions.1,24 At the very least, this isostructural–isomorphic dichotomymay be useful in developing novel EL-based microscopic theories ofcavitation.
ACKNOWLEGDEMENTSThe authors thank Frank H. Stillinger for helpful discussions.
APPENDIX: INTERACTION POTENTIALSEMPLOYED BY ALTABET ET AL.
References 22 and 23 employed Kob–Andersen53 and Wahn-ström54 glass-forming binary mixtures of particles interacting viaforce-shifted versions of the “n-6” pair potential,
UAn−6(r) =
ϵn − 6
[6 ⋅ 2n/6(σr)n− 2n(
σr)
6]. (6)
Their force-shifting protocol was
Ufs(r) = {UA
n−6(r) −UAn−6(rc) − (r − rc)U
′(rc), r < rc
0, r > rc.(7)
Reference 22 compared results for n = 7 and n = 12 systems withrc = 3.5σ and showed that differences between these systems were
J. Chem. Phys. 153, 184504 (2020); doi: 10.1063/5.0023236 153, 184504-8
Published under license by AIP Publishing
The Journalof Chemical Physics ARTICLE scitation.org/journal/jcp
primarily quantitative rather than qualitative. Reference 23 com-pared results for n = 7 systems with various 1.4σ ≤ rc ≤ 3.5σ andshowed that systems with rc < 1.7σ (rc > 1.7σ) are weakly (strongly)cohesive.
DATA AVAILABILITY
The data that support the findings of this study are availablefrom the corresponding author upon request.
REFERENCES1J. C. Dyre, J. Phys.: Condens. Matter 28, 323001 (2016).2L. Berthier and G. Tarjus, Phys. Rev. Lett. 103, 170601 (2009).3H. Tong and H. Tanaka, Phys. Rev. Lett. 124, 225501 (2020).4J. P. K. Doye and D. J. Wales, Science 271, 484 (1996).5F. H. Stillinger and T. A. Weber, Phys. Rev. A 25, 978 (1982).6D. J. Wales, Energy Landscapes: Applications to Clusters, Biomolecules and Glasses(Cambridge Molecular Science, 2004).7D. W. Oxtoby and R. Evans, J. Chem. Phys. 89, 7521 (1988).8R. E. Appel, J. Acoust. Soc. Am. 48, 1179 (1970).9R. D. Finch, R. Kagiwada, M. Barmatz, and I. Rudnick, Phys. Rev. 134, A1425(1964).10H. Maris and S. Balibar, Phys. Today 53(2), 29 (2000).11J. M. Dewey, in Blast Effects: Physical Properties of Shock Waves, edited byI. Sochet (Springer International Publishing, 2018), pp. 37–62.12S. Sastry, P. G. Debenedetti, and F. H. Stillinger, Phys. Rev. E 56, 5533 (1997).13Z.-J. Wang, C. Valeriani, and D. Frenkel, J. Phys. Chem. B 113, 3776 (2009).14V. G. Baidakov, K. Bobrov, and A. S. Teterin, J. Chem. Phys. 135, 054512 (2011).15V. G. Baidakov and K. S. Bobrov, J. Chem. Phys. 140, 184506 (2014).16V. G. Baidakov, J. Chem. Phys. 144, 074502 (2016).17R. Angélil, J. Diemand, K. K. Tanaka, and H. Tanaka, Phys. Rev. E 90, 063301(2014).18T. Kinjo and M. Matsumoto, Fluid Phase Equilib. 144, 343 (1990).19V. G. Baidakov and S. P. Protsenko, Phys. Rev. Lett. 95, 015701 (2005).20A. Y. Kuskin, G. E. Norman, V. V. Pisarev, V. V. Stegailov, and A. V. Yanilkin,Phys. Rev. B 82, 174101 (2010).21Y. Cai, J. Y. Huang, H. A. Wu, M. H. Zhu, W. A. Goddard III, and S. N. Luo,J. Phys. Chem. Lett. 7, 806 (2016).22Y. E. Altabet, F. H. Stillinger, and P. G. Debenedetti, J. Chem. Phys. 145, 211905(2016).23Y. E. Altabet, A. L. Fenley, F. H. Stillinger, and P. G. Debenedetti, J. Chem. Phys.148, 114501 (2018).24J. C. Dyre, J. Phys. Chem. B 118, 10007 (2014).
25P. G. Debenedetti and F. H. Stillinger, Nature 410, 259 (2001).26F. H. Stillinger, private communication (2020).27J. H. R. Clarke, W. Smith, and L. V. Woodcock, J. Chem. Phys. 84, 2290 (1986).28D. J. Wales, L. J. Munro, and J. P. K. Doye, J. Chem. Soc., Dalton Trans. 5, 611(1996).29F. Calvo, J. P. K. Doye, and D. J. Wales, Nanoscale 4, 1085 (2012).30J. Mei, J. W. Davenport, and G. W. Fernando, Phys. Rev. B 43, 4653 (1991).31P. Schwerdtfeger, N. Gaston, R. P. Krawczyk, R. Tonner, and G. E. Moyano,Phys. Rev. B 73, 064112 (2006).32O. R. Smits, P. Jerabek, E. Pahl, and P. Schwerdtfeger, Phys. Rev. B 101, 104103(2020).33Y. Li, E. Blaisten-Barojas, and D. A. Papaconstantopoulos, Phys. Rev. B 57,15519 (1998).34S. Sastry, P. G. Debenedetti, and F. H. Stillinger, Nature 393, 554 (1998).35The varying steepness of the potentials (Fig. 1) requires an n-dependent MDtimestep dt(n) for maximum efficiency. For T̃ ≤ 1, we choose the criterion
dt(n) = 6√
2/[125ω(n)], where ω(n) = σϵτ
ö2Un(r)
∂r2 ∣r=σ =√
2nτ is the char-
acteristic vibration frequency and τ =√
mσ2/ϵ is the Lennard-Jones time unit.The prefactor 6
√2/125 sets dt(n) = 6τ/(125n) [e.g., dt(6) = 0.008τ], which is suffi-
ciently small to obtain converged results for all n. For T̃ > 1, we use slightly smallertimesteps dt = 9τ/(250n).36E. Polak and G. Ribiére, Rev. Fr. Imformmat Rech. Opertionelle 3, 35 (1969).37S. Plimpton, J. Comput. Phys. 117, 1 (1995).38E. A. Mastny and J. J. de Pablo, J. Chem. Phys. 127, 104504 (2007).39S. Toxvaerd, Condens. Matter Phys. 18, 13002 (2015).40M. J. Stevens and M. O. Robbins, J. Chem. Phys. 98, 2319 (1993).41R. J. Baxter, J. Chem. Phys. 49, 2770 (1968).42The drops in ρatm(T̃) shown in Fig. 3 occur in liquids that are superheated; T̃boilmeasured in this way are above the equilibrium boiling temperatures.43J. M. Cailol, J. Chem. Phys. 109, 4885 (1998).44F. H. Stillinger, P. G. Debenedetti, and T. M. Truskett, J. Phys. Chem. B 105,11809 (2001).45S. Sastry, Phys. Rev. Lett. 85, 590 (2000).46S. S. Ashwin, G. I. Menon, and S. Sastry, Europhys. Lett. 75, 922 (2006).47D. S. Corti, P. G. Debenedetti, S. Sastry, and F. H. Stillinger, Phys. Rev. E 55,5522 (1997).48T. M. Truskett, S. Torquato, S. Sastry, P. G. Debenedetti, and F. H. Stillinger,Phys. Rev. E 58, 3083 (1998).49S. Torquato, T. M. Truskett, and P. G. Debenedetti, Phys. Rev. Lett. 84, 2064(2000).50T. B. Schrøder and J. C. Dyre, J. Chem. Phys. 141, 204502 (2014).51G. Menzi and C. Dellago, J. Chem. Phys. 145, 211918 (2016).52F. Sciortino, J. Stat. Mech.: Theory Exp. 2005, P05015.53W. Kob and H. C. Andersen, Phys. Rev. E 51, 4626 (1995).54G. Wahnström, Phys. Rev. A 44, 3752 (1991).
J. Chem. Phys. 153, 184504 (2020); doi: 10.1063/5.0023236 153, 184504-9
Published under license by AIP Publishing