LONI Visualization Environment
11
LONI Visualization Environment Ivo D. Dinov, 1,2 Daniel Valentino, 1,3 Bae Cheol Shin, 1 Fotios Konstantinidis, 1 Guogang Hu, 1 Allan MacKenzie-Graham, 1 Erh-Fang Lee, 1 David Shattuck, 1 Jeff Ma, 1 Craig Schwartz, 1 and Arthur W.Toga 1 Over the past decade, the use of informatics to solve complex neuroscientific problems has increased dramat- ically. Many of these research endeavors involve exam- ining large amounts of imaging, behavioral, genetic, neurobiological, and neuropsychiatric data. Superimpos- ing, processing, visualizing, or interpreting such a complex cohort of datasets frequently becomes a challenge. We developed a new software environment that allows investigators to integrate multimodal imag- ing data, hierarchical brain ontology systems, on-line genetic and phylogenic databases, and 3D virtual data reconstruction models. The Laboratory of Neuro Imaging visualization environment (LONI Viz) consists of the following components: a sectional viewer for imaging data, an interactive 3D display for surface and volume rendering of imaging data, a brain ontology viewer, and an external database query system. The synchronization of all components according to stereotaxic coordinates, region name, hierarchical ontology, and genetic labels is achieved via a comprehensive BrainMapper functional- ity, which directly maps between position, structure name, database, and functional connectivity informa- tion. This environment is freely available, portable, and extensible, and may prove very useful for neurobiolo- gists, neurogenetisists, brain mappers, and for other clinical, pedagogical, and research endeavors. KEY WORDS: Software, ontology, brain, atlas, visuali- zation, gene mapping INTRODUCTION General Contemporary brain mapping research 1 involves integrating imaging data with behavioral, genetic, neurobiological, and neuropsychiatric data. The complexity of the data introduces challenges in its modeling, computational processing, and visuali- zation. To address these problems, we developed the Laboratory of Neuro Imaging Visualization Environment (LONI Viz). This environment allows integration of multimodal imaging data, hierarchical brain ontology systems, on-line ge- netic and phylogenic databases, and 3D virtual data modeling. 2 There are four main components of LONI Viz: a (three-way cardinal projection) sectional viewer for imaging data, an interactive 3D display for surface and volume rendering of imaging data, a brain ontology viewer, and an external database query system. These compo- nents are synchronized using a BrainMapper, which directly maps between anatomical position, structure name, database, and functional connec- tivity information. The LONI Viz environment is useful for training and education purposes as well as for research and clinical applications requiring visual inspection and interrogation of multimodal, multidimensional and multiformat brain data. 1 From the Center for Computational Biology and Labora- tory of Neuro Imaging, Department of Neurology, UCLA, Los Angeles, CA 90095, USA. 2 From the Department of Statistics, UCLA, Los Angeles, CA 90095, USA. 3 From the Department of Radiology, UCLA, Los Angeles, CA 90095, USA. Correspondence to: Ivo D. Dinov, Ph.D., Center for Computational Biology, UCLA David Geffen School of Med- icine, 635 Charles Young Dr. South, Suite 225, Los Angeles, CA 90095, USA; tel: +1-310-2062101; fax: +1-310-2065518; e-mail: [email protected] Copyright * 2006 by SCAR (Society for Computer Applications in Radiology) Online publication 11 April 2006 doi: 10.1007/s10278-006-0266-8 148 Journal of Digital Imaging, Vol 19, No 2 (June), 2006: pp 148Y158
Transcript of LONI Visualization Environment

LONI Visualization Environment
Ivo D. Dinov,1,2 Daniel Valentino,1,3 Bae Cheol Shin,1 Fotios Konstantinidis,1 Guogang Hu,1
Allan MacKenzie-Graham,1Erh-Fang Lee,1David Shattuck,1Jeff Ma,1Craig Schwartz,1and Arthur W.Toga1
Over the past decade, the use of informatics to solvecomplex neuroscientific problems has increased dramat-ically. Many of these research endeavors involve exam-ining large amounts of imaging, behavioral, genetic,neurobiological, and neuropsychiatric data. Superimpos-ing, processing, visualizing, or interpreting such acomplex cohort of datasets frequently becomes achallenge. We developed a new software environmentthat allows investigators to integrate multimodal imag-ing data, hierarchical brain ontology systems, on-linegenetic and phylogenic databases, and 3D virtual datareconstruction models. The Laboratory of Neuro Imagingvisualization environment (LONI Viz) consists of thefollowing components: a sectional viewer for imagingdata, an interactive 3D display for surface and volumerendering of imaging data, a brain ontology viewer, andan external database query system. The synchronizationof all components according to stereotaxic coordinates,region name, hierarchical ontology, and genetic labels isachieved via a comprehensive BrainMapper functional-ity, which directly maps between position, structurename, database, and functional connectivity informa-tion. This environment is freely available, portable, andextensible, and may prove very useful for neurobiolo-gists, neurogenetisists, brain mappers, and for otherclinical, pedagogical, and research endeavors.
KEY WORDS: Software, ontology, brain, atlas, visuali-zation, gene mapping
INTRODUCTION
General
Contemporary brain mapping research1 involves
integrating imaging data with behavioral, genetic,
neurobiological, and neuropsychiatric data. The
complexity of the data introduces challenges in its
modeling, computational processing, and visuali-
zation. To address these problems, we developed
the Laboratory of Neuro Imaging Visualization
Environment (LONI Viz). This environment
allows integration of multimodal imaging data,
hierarchical brain ontology systems, on-line ge-
netic and phylogenic databases, and 3D virtual
data modeling.2 There are four main components
of LONI Viz: a (three-way cardinal projection)
sectional viewer for imaging data, an interactive
3D display for surface and volume rendering of
imaging data, a brain ontology viewer, and an
external database query system. These compo-
nents are synchronized using a BrainMapper,
which directly maps between anatomical position,
structure name, database, and functional connec-
tivity information. The LONI Viz environment is
useful for training and education purposes as well
as for research and clinical applications requiring
visual inspection and interrogation of multimodal,
multidimensional and multiformat brain data.
1From the Center for Computational Biology and Labora-
tory of Neuro Imaging, Department of Neurology, UCLA, Los
Angeles, CA 90095, USA.2From the Department of Statistics, UCLA, Los Angeles, CA
90095, USA.3From the Department of Radiology, UCLA, Los Angeles,
CA 90095, USA.
Correspondence to: Ivo D. Dinov, Ph.D., Center for
Computational Biology, UCLA David Geffen School of Med-
icine, 635 Charles Young Dr. South, Suite 225, Los Angeles,
CA 90095, USA; tel: +1-310-2062101; fax: +1-310-2065518;
e-mail: [email protected]
Copyright * 2006 by SCAR (Society for Computer
Applications in Radiology)
Online publication 11 April 2006
doi: 10.1007/s10278-006-0266-8
148 Journal of Digital Imaging, Vol 19, No 2 (June), 2006: pp 148Y158

Other Similar Efforts
Over the past several years, a number of new
software tools have surfaced that allow interac-
tive brain data filtering, visualization, and analy-
sis. Most of these packages prove extremely
practical for the specific applications they are
designed for (e.g., MultiTracer3). Few provide the
foundation for multiformat data integration, inter-
active modeling, data mining, and interfacing
external dynamic databases. Table 1 summarizes
the major software developments in the field
computational and graphics-based neuroscience
and brain mapping.
Brain Mapping
Contemporary brain-mapping studies involve
processing an increasingly large and complex data,
and utilization of advanced statistical techniques;
and require interactive real-time data integration,
presentation, and visual inspection. Brain data can
originate from multiple imaging modalities (e.g.,
MRI, immunohistochemistry), be stored in various
formats (e.g., volumetric, metadata) and interro-
gated by using different (studies/species specific)
processing protocols. For example, investigators
need to dynamically analyze, correlate, and visu-
alize white matter diffusion anisotropies, behav-
ioral/stress alterations, and genetic comorbidity
associated with specific regions in the mouse brain.
A number of software tools have been developed to
address individual needs in terms providing the
computational infrastructure to address one or
several of these challenges.4 Few attempts have
been instantiated into integrating brain atlas
construction,5,6 3D object modeling,7,8 neuroge-
netics, and biostatistics.9,10
Table 1. State-of-the-art software packages for data integration, processing and visualization
Software Institution URL Brief Description
FreeSurfer Harvard University http://surfer.nmr.mgh.harvard.edu/ 3D Surface modeling
& visualization
FisWidgets University of Pittsburgh http://neurocog.lrdc.pitt.edu/fiswidgets/ Java graphical
compute environment
SPM University College,
London
http://www.fil.ion.ucl.ac.uk/spm Suite of tools for stat
analysis and visualization
BrainVoyager Brain Innovation, Inc. http://www.brainvoyager.com/ Brain visualization,
simulation and analysis
BrainImagingToolbox MNI, McGill University http://www.bic.mni.mcgill.ca/software Brain data processing,
display and analysis
VisDB University of Munich http://www.dbs.informatik.uni-muenchen.
de/dbs/projekt/visdb/visdb.html
Visual data mining
Brainiac Medical Mutimedia
Systems
http://www.webcom.com/medmult/
brainiac.html
Interactive brain Atlas
MRIcro University of Nottingham http://www.psychology.nottingham.ac.uk/
staff/cr1/mricro.html
Versatile 3D modeling
& visualization environment
ImageJ NIH http://rsb.info.nih.gov/ij/ Image processing/visualization
IDL Research Systems, Inc. http://www.rsinc.com/idl/ Interactive data processing/viz
MRI3DX Aston University http://www.aston.ac.uk/lhs/
staff/singhkd/mri3dX/
Integrated tool for visualization
and analysis
Amira TGS, Inc. http://www.amiravis.com/ State-of-the-art visualization
and data modeling package
AVS Advanced Visual
Systems
http://www.avs.com/ Visualization application
and development environment
Khoros Khoral, Inc. http://www.khoral.com/khoros/toolboxes/ Information processing, data
exploration and visualization
MedX Sensor Systems, Inc. http://medx.sensor.com/ Multimodal image processing,
visualization and analysis
Vis5D University of Wisconsin http://vis5d.sourceforge.net/ Space/time/function 5D viewer
MultiTracer UCLA http://air.bmap.ucla.edu/MultiTracer/
MultiTracer.html
3D Viewing & delineation tool
LONI VISUALIZATION ENVIRONMENT 149

APPROACH AND METHODS
The type of brain visualization environment that we seek
requires a number of synchronized functions organized in a
graphical, user-friendly, platform-independent, and well-docu-
mented software package.11Y13 The LONI Viz environment
consists of several independent components, dynamically
linked via a functional wrapper called BrainMapper. Each of
these modules is described in detail below. We demonstrate the
functionality of the LONI visualization environment using the
LONI Mouse Brain Atlas.14 The atlas contains imaging data
(MRI, cryotomographic, Nissl stain, and labeled volume),15 a
BrainGraph model,16 and a BAMS relational database.17,18 The
latter contains genetic, referential, and contextual metadata,
which is used to establish communication between the imaging
displays, the BrainGraph viewer, and the external databases.
Sectional Image Viewer
This component of LONI Viz provides a standard radiologic
reference frame for displaying cardinal projection/section
planes of 3D data (e.g., structural and functional data as well
as statistical significance maps). Axial, sagittal, and coronal
views are simultaneously displayed and synchronously con-
trolled by the investigator by cursor drag-and-drop functional-
ity (Fig. 1). This framework allows the superposition of
multiple volumes, modalities, selection of stereotaxic coordi-
nates, and reports the regional ontology labels. Both voxel and
world-space coordinates as well as volume intensities and
histograms are provided in this component of the LONI Viz
environment. A number of image enhancing tools (e.g., battery
of color maps, zooming, panning, contrast/brightness filters,
etc.) are provided to aid the user in displaying and identifying
features of interest. This type of visualization is common for
most 3D imaging tools and we have designed our own to
address a number of issues in current software related to
limited file-format parsing, computer architectures and system
requirements, and static interfaces.
BrainGraph Ontology Viewer
Many neuroanatomical labeling schemes differ significantly
in their hierarchical nomenclature organization. There are
developmental cephalic organizations where the brain is separat-
ed, or tessellated, into anatomically disjoint regions based on the
cellular lineage.19 There also exist neurolabeling approaches
that systematically organize the hierarchy of structures based on
cytoarchitectonic,20 functional,21 or chemoarchitechtonic con-
nectivity.22 And there are variations within each of these
schemes, differences in naming between research groups and
studies.23 For example, an investigator devising a study that uses
the Paxinos labeling scheme24 may desire cross-validation with
studies utilizing Swanson hierarchical nomenclature.23
Initially, we developed a tree-based hierarchical data
structure, BrainTree, to address the need for linking anatom-
ical, functional, and contextual neuroscientific information.
The BrainTree approach was successfully used in conducting
both volumetric studies25 and functional activation studies26 in
Alzheimer’s disease neuroimaging data. The BrainTree data
Fig 1. LONI Viz Sectional Viewer shows cardinal projection planes in the axial, sagittal, and coronal orientation.
150 DINOV ET AL.
model introduced the following: graphical and interactive
organization of brain anatomy; a common coordinate-to-label
reference frame; linking neuroimaging, neurogenetic, neuro-
psychiatric, and contextual data; hierarchical representation of
neuroanatomical names in an accessible and user-friendly
manner; region anatomical location (containment by, and of,
other neighboring regions; an extremely conceptually and
computationally attractive data representation (tree structure).
In the original BrainTree, we used a tree-based, relational
data model because storing, retrieving, and manipulating tree
structures is well understood27 and computationally tractable.
Eventually, we found that the tree structure was limited in its
scope because in many situations different paths exist between
two remote structures that are not necessary descendants of
each other. To address these limitations, we extended the
BrainTree as a general, flexible, graph-based data model, and
the BrainGraph, which integrates, organizes, and provides
direct access to external structural, functional, histological,
genetic, and contextual brain information. Because pure
hierarchical organizations based on anatomical containment
are insufficient to represent complex circular, dynamic, and
study-specific interrelations between different regions in the
brain, the BrainGraph is required to provide this functionality
(Fig. 2). It allows the simultaneous storage of multiple ROI
labeling schemes, and provides study-specific graph traversal
schemes. In this system, each node (ROI) and each edge
(connection link) has a number of predefined (or user
specifiable) description categories (e.g., functional connectiv-
ity, anatomical relations to its neighbors, developmental
information, genetic information, literature references, and
other external contextual information).
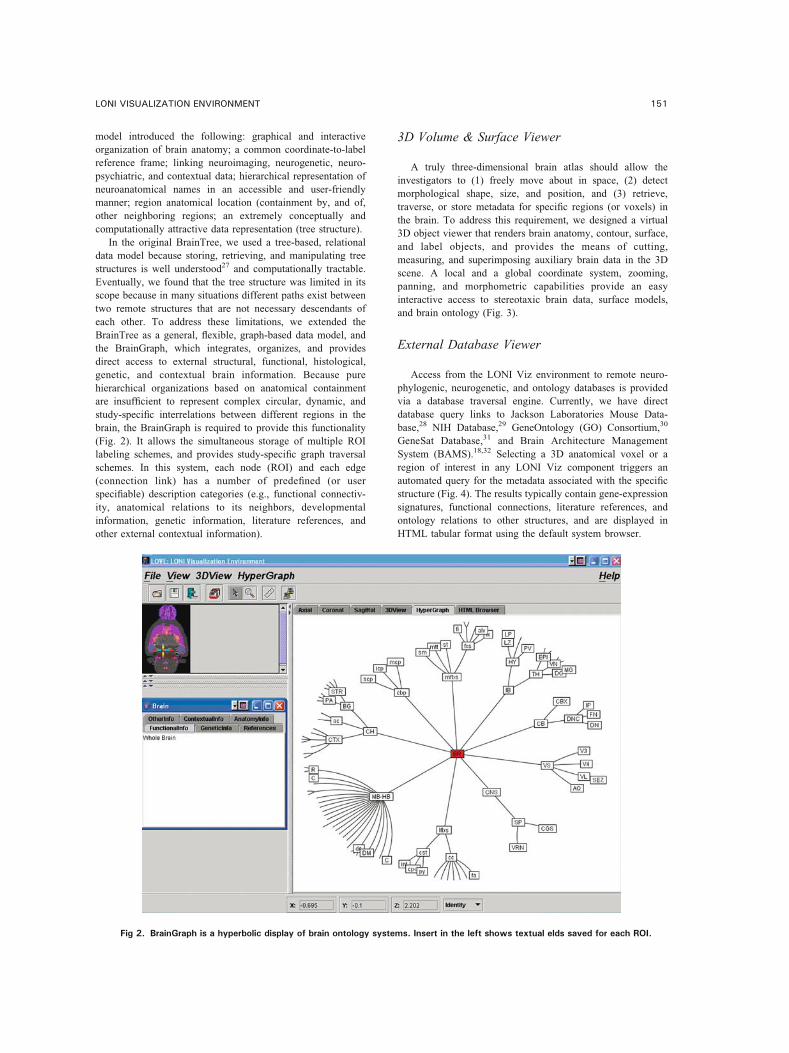
3D Volume & Surface Viewer
A truly three-dimensional brain atlas should allow the
investigators to (1) freely move about in space, (2) detect
morphological shape, size, and position, and (3) retrieve,
traverse, or store metadata for specific regions (or voxels) in
the brain. To address this requirement, we designed a virtual
3D object viewer that renders brain anatomy, contour, surface,
and label objects, and provides the means of cutting,
measuring, and superimposing auxiliary brain data in the 3D
scene. A local and a global coordinate system, zooming,
panning, and morphometric capabilities provide an easy
interactive access to stereotaxic brain data, surface models,
and brain ontology (Fig. 3).
External Database Viewer
Access from the LONI Viz environment to remote neuro-
phylogenic, neurogenetic, and ontology databases is provided
via a database traversal engine. Currently, we have direct
database query links to Jackson Laboratories Mouse Data-
base,28 NIH Database,29 GeneOntology (GO) Consortium,30
GeneSat Database,31 and Brain Architecture Management
System (BAMS).18,32 Selecting a 3D anatomical voxel or a
region of interest in any LONI Viz component triggers an
automated query for the metadata associated with the specific
structure (Fig. 4). The results typically contain gene-expression
signatures, functional connections, literature references, and
ontology relations to other structures, and are displayed in
HTML tabular format using the default system browser.
Fig 2. BrainGraph is a hyperbolic display of brain ontology systems. Insert in the left shows textual elds saved for each ROI.
LONI VISUALIZATION ENVIRONMENT 151
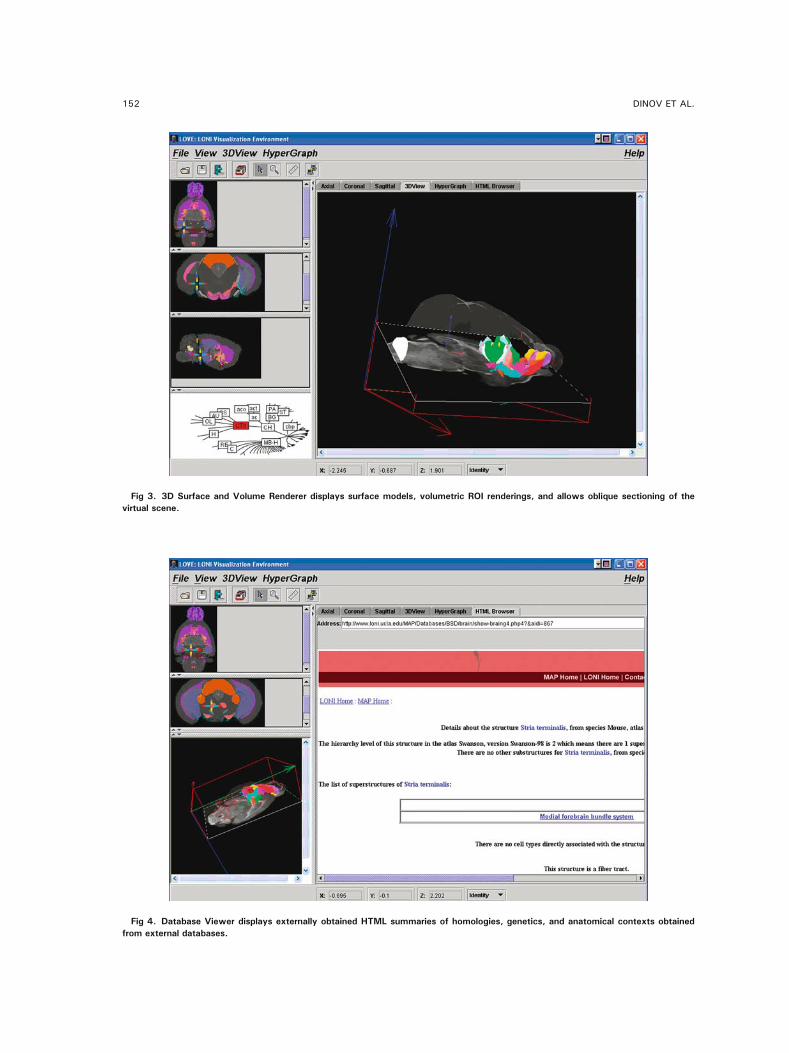
Fig 3. 3D Surface and Volume Renderer displays surface models, volumetric ROI renderings, and allows oblique sectioning of thevirtual scene.
Fig 4. Database Viewer displays externally obtained HTML summaries of homologies, genetics, and anatomical contexts obtainedfrom external databases.
152 DINOV ET AL.

Synchronization Component: BrainMapper
The four LONI Viz components described above are
designed and implemented as stand-alone brain imaging
applications. The entire suite of them, however, provides the
framework for dynamic data interrogation, complex visualiza-
tion, and multimodal data integration. The challenge of
establishing a robust link between these independent modules
was resolved by engineering a communication protocol
(BrainMapper) (Fig. 5). The main interaction messages relayed
between the individual components through the BrainMapper
consist of the quadruple vector of location, label, ontology, and
action. Every component is both a listener and an event
generator to send and react to messages specific to its
feasibility domain. The BrainMapper functionality uses prop-
ertyChange firing/listening mechanisms to establish synchro-
nization between different components and widgets.
LONI Atlas Transformation and Information Server
Often, medical images contain extremely high-resolution
data that may exceed 1 GB in size (e.g., cryotomographic and
immunohistochemistry data). This makes it impractical to
locally store the entire dataset at runtime. To accommodate
these needs, we have developed an atlas transformation and
information server (LATIS) that allows LONI Viz, and other
applications, to retrieve high-resolution imaging data over the
Internet. The server provides a flexible protocol for interfacing
and requesting small sections or volumes from a very high-
resolution dataset (an atlas) via a web-server HTTP. Figure 6
illustrates the functionality of the LATISYLONI Viz commu-
nication in providing additional high-resolution data from the
LATIS server to client (LONI Viz). The user manually selects a
rectangular region of interest in one of the cardinal projection
planes. The LATIS server sends a high-resolution image of the
region, which can further be magnified using LATIS services.
DISCUSSION AND FUTURE DIRECTIONS
Advantages of using LONI Viz
The LONI Viz environment is designed and
implemented as a lightweight Java interface to
multimodal brain data. It can be used for visual
and quantitative analysis of neuroscientific data
with or without an anatomical brain atlas. Most of
its functionality, however, is utilized when the full
spectrum of imaging and metadata are available.
The LONI Viz’s real-time 3D data display and
interactive synchronization between local and
remote neuroscience resources make it attractive
for researchers and educators, because at each
Fig 5. BrainMapper is a synchronizing agent that modulates the communication between the four main components of the LONI Vizenvironment. It ensures a match between stereotaxic coordinates, region labels, hierarchical representation, and databasecommunication.
LONI VISUALIZATION ENVIRONMENT 153

time and space location it provides the answers to
questions like such as: Where are we? What is
known about the region? What pathways pass
through the region? What gene patterns are known
for the region? Layer controls (Fig. 7) allow the
efficient juxtaposition of a multitude of data
volumes, labels, and ontology systems. With its
dynamic linking and expansion features, the LONI
Viz environment becomes a foundation for ad-
vanced neuroinformatics research based on the
direct access to imaging, genetics, homology, and
metadata.
Availability
The current version (v. 5.0) of the LONI
visualization environment is available as a plat-
form-independent Java binary package. We also
provide the source code on a collaborative basis.
It can be downloaded from our web page (http://
www.loni.ucla.edu/Software/Software_Detail.
jsp?software_id=7). On-line development tools,
class UML diagrams, user manuals, snapshots,
bug-tracking reports, and feedback forms are also
available at this page.
LONI Viz architecture
The LONI visualization environment is built
with a small kernel of core interfaces where
functionality is provided by plug-ins and object
extension. The entire package is purely implement-
ed in the Java programming language to ensure
maximum portability across hardware platforms.
Basic Java 1.4+ virtual machine, Java3D (both are
freely available from http://java.sun.com/), and
Internet connection are required for complete the
functionality of LONI Viz. A typical user will just
download and uncompress the zip archive from our
download page and run one of the JAR, BAT, or
CSH scripts to start the application. No installation
or configuration is required, provided the Java
virtual machine and Java 3D are properly installed
on the system. Some known problems include old
versions of Java on SGI IRIS and Apple Macintosh
systems. We strongly recommend 512 MB+ RAM
memory to best utilize the software in terms of
speed, performance, and functionality. The LONI
Viz system architecture is available on-line at
http://www.loni.ucla.edu/download/LOVE/
LOVE_UML.gif.
Fig 6. LATIS Server provides on-the-fly high-resolution neuroimaging data over HTML protocols to LONI Viz.
154 DINOV ET AL.

Neuroinformatics
Bioinformatics is the science of representation,
modeling, analysis, and interpretation of large
amounts of intricate biomedical data. Neuroinfor-
matics is the subfield restricting these studies to
the central nervous system. The LONI Viz
environment allows us to conduct neuroinfor-
matics studies by integrating neuroimaging, neu-
rogenetics, neuroontology data, and computational
modeling, and providing a brain mapping func-
tionality for associating changes in one dataset as
functions of changes in the others. The most
straightforward example is interrogating the ge-
notypic (e.g., gene expression rates), phenotypic
(e.g., cognitive tests, disease, age), and neuro-
imaging pathology in studying cortical thinning33
or alterations in neurometabolism34 in dementia.
Interactive In Situ registration
and 3D Reconstruction
It is a common challenge in neurobiology to
reference cytoarchitectonic and immunohistochem-
ical coordinates, gene expression maps (location,
intensity, and function), and remote neural networks
in the brain. To address this problem, we are
currently developing a semiautomated technique to
coregister an arbitrary-plane-of-section of an in situ
hybridization or stained 2D image slice to a fully
3D brain atlas. This will involve a two-stage
approach where the user first virtually positions the
raw slice into its approximate orientation, and then a
finer automated alignment completes the registra-
tion by minimizing a certain cost function.35 Such
functionality will eliminate the difficulty of con-
trasting and integrating data, atlases, and image
modalities obtained by using different image
acquisition protocols (e.g., different orientations,
variable slice thicknesses, contrasts, resolution).
Extensible Plug-in Architecture
The LONI Viz environment is designed in a
plug-in architecture (e.g., tools, color maps, vol-
ume parsers). Using a plug-in architecture, we are
currently designing a new interface to the LONI
Viz environment that would allow the efficient
development and deployment of new data- and
project-specific bioinformatics and data-mining
Fig 7. In LayerControls, different color maps are selected to enhance the distinction between the four different imaging modalitiessimultaneously loaded and superimposed in LONI Viz.
LONI VISUALIZATION ENVIRONMENT 155

tools. This will include length, area, and volume
calculators, temporal correlation analyses, methods
for linear modeling, and statistical inference. An
example of the image processing plug-in is an
image segmentation tool (Fig. 8). This tool utilizes
the expectation maximization estimation model,
available via the Statistics On-line Computational
Resource.36 It allows us to segment any free-
drawn shape interactively by fitting a mixture of
several Gaussian models for the different brain
tissue types. Areas of each tissue type may be
exported and saved in an external file for further
computational analysis (e.g., measuring hippo-
campal volume across subjects or time).
Contour/Surface Modeling
Some 3D brain display programs already allow
interactive region or cortical delineation or sur-
face reconstruction.37 Obtaining models of corti-
cal and limbic system objects and accurate
representations of sulcal and gyral anatomy is
crucial in identifying disease pathogens,38 devel-
opmental abnormalities (e.g., asymmetries, group
variabilities),39 and normal aging.40 We are
currently developing the LONI Viz infrastructure
for interactive delineation of structures, 3D curve
drawing, and statistical analysis of the resulting
shapes. A generic shape viewer is already devel-
oped and is currently configured as a display plug-
in for LONI Viz (http://www.loni.ucla.edu/CCB/
Software/Software_Detail.jsp?software_id=18).
4D Temporal Visualization
Temporal patterns and characteristics of func-
tional MRI and structural longitudinal MRI
studies are extremely important in identifying
neuronal networks,41 disease progression,42
growth,43 and atrophy44,45 in the brain. Visualiz-
ing such temporal effects is often times reduced to
tensor maps46 or other static displays.47 We are
developing the framework for dynamically inter-
rogating and viewing such 4D volumes and
correlating this imaging data with their corres-
ponding auxiliary neurodescriptions.
ACKNOWLEDGMENTS
Many individuals have contributed to the development effort
over the past several years that led to the design, implemen-
tation, debugging, and validation of the LONI Viz environ-
ment—most notably Seth W. Ruffins, Russell E. Jacobs,
Jianming Hu, Jason Landerman, and Hui Wang was invaluable
in the past four critical version releases. This research is
supported by grants from NIA P50 AG16570, K08 AG100784;
NLM R01 2R01 LM05639-06; NIH/NCRR 2 P41 RR13642
and NIH/NIMH 5 P01 MN52176, NSF DUE 0442992, NIH/
NCBC U52 RR021813.
Fig 8. An example of a LONI Viz tool plug-in: semiautomated segmentation of regions of interest using SOCR EM algorithm. Left: Themanual region outlining functionality and the resulting superposition of the result of the EM mixture modeling segmentation of the region.Right: Decomposition of the region intensity distribution to a mixture of three Gaussian densities (user has control over the mixtureparameters).
156 DINOV ET AL.

REFERENCES
1. Toga AW, Thompson PM: New approaches in brain
morphometry. Am J Geriatr Psychiatry 10(1):13Y23, 2002
2. Toga AW: Imaging databases and neuroscience. Neuro-
science 8(5):423Y436, 2002
3. Woods R: MultiTracer: a Java-based tool for anatomic
delineation of grayscale volumetric images. NeuroImage
19:1829Y1834, 2003
4. Rex DE, Ma, JQ, Toga AW: The LONI pipeline
processing environment. Neuroimage 19(3):1033Y1048, 2003
5. Toga AW, Thompson PM: Maps of the brain. Anat Rec
265(2):37Y53, 2001
6. Mazziotta J, et al: A probabilistic atlas and reference
system for the human brain: international consortium for brain
mapping (ICBM). Philos Trans R Soc Lond B Biol Sci 356
(1412):1293Y1322, 2001
7. Kling-Petersen T, Rydmark M: The BRAIN project: an
interactive learning tool using desktop virtual reality on personal
computers. Stud Health Technol Inform 39:529Y538, 1997
8. Caunce A, Taylor CJ: Building 3D sulcal models using
local geometry. Med Image Anal 5(1):69Y80, 2001
9. Ramos GG, Zenteno JFT: Current concepts in neuro-
genetics. Rev Invest Clin 55(2):207Y215, 2003
10. Developmental-behavior neurogenetics: early experi-
ence in inbred mice. FASEB J 175A1211Boone E, Jones B:
Developmental-behavior neurogenetics: early experience in
inbred mice. FASEB J 17(5):A1211, 2003
11. Sutherland I: A head-mounted three dimensional dis-
play. Fall Joint Computer Conference, AFIPS Conf Proc
33:757Y764, 1968
12. Cruz-Neira C: Virtual reality overview. SIGGRAPH’93
23:1.1Y1.18, 1993
13. Ba AM, et al: Multiwavelength optical intrinsic signal
imaging of cortical spreading depression. J Neurophysiol 88(5):
2726Y2735, 2002
14. MacKenzie-Graham A, Jones ES, Shattuck DW, Dinov
ID, Bota M, Toga AW: The informatics of a C57BL/6J mouse
brain atlas. Neuroinformatics 1(4):397Y410, 2003
15. Mackenzie-Graham A, et al: A multimodal, multidi-
mensional atlas of the C57BL/6 mouse brain. Soc Neurosci
Abstr 27(1):1226, 2001
16. Dinov I, Valentino D, Hu G, Felix J, Mega MS, Ruffins S,
Rex D, Toga AW: Construction and utilization of an interactive
graphical data model: braingraph. NeuroImage 13:433, 2002
17. Bota M, Dong, HW, Swanson LW: From gene networks
to brain networks. Nat Neurosci 6(8):795Y799, 2003
18. Bota M, Dong H, Swanson LW: Brain architecture
management system. Neuroinformatics 3(1):15Y48, 2005
19. Bard JBL, Kaufman MA, Dubreuil C, Brune RM,
Burger A, Baldock, RA, Davidson DR: An internet-accessible
database of mouse developmental anatomy based on a
systematic nomenclature. Mech Dev 74:111Y120, 1998
20. Riedel A, Hartig W, Seeger G, Gartner U, Brauer K,
Arendt T: Principles of rat subcortical forebrain organization: a
study using histological techniques and multiple fluorescence
labeling. J Chem Neuroanat 23:75Y104, 2002
21. Van Essen D, Drury HA, Joshi S, Miller MI: Functional
and structural mapping of human cerebral cortex: solutions are
in the surfaces. Proc Natl Acad Sci 95:788Y795, 1998
22. Colby C, Gattass R, Olson CR, Gross CG: Topographical
organization of cortical afferents to extrastriate visual area PO in
the macaque: a dual tracer study. J Comp Neurol 269:392Y413,
1988
23. Swanson LW: Brain Maps: Structure of the Rat Brain.
2nd ed. Amsterdam: Elsvier Science Publishers BV, 1998
24. Paxinos G, Watson CRR, Emson PC: Ache-stained
horizontal sections of the rat-brain in stereotaxic coordinates. J
Neurosci Methods 3(2):129Y149, 1980
25. Crabtree EC, Mesa MS, Linshield C, Dinov ID,
Thompson PM, Felix J, Cummings JL, Toga AW: Alzheimer
grey matter loss across time: unbiased assessment using a
probabilistic Alzheimer brain atlas. Soc Neurosci Abstr 26:294,
2000
26. Dinov ID, et al: Construction of the first rest-state
functional subvolume probabilistic atlas of normal variability
in the elderly and demented brain. Neurology 56(8):A248,
2001
27. Tinhofer G, Mayr E, Noletmeier H, Syslo MM Eds.:
Computational Graph Theory. New York: Springer-Verlag,
1990
28. JAX, http://www.informatics.jax.org/
29. Entrez, http://www.ncbi.nlm.nih.gov/Entrez/
30. GO, http://www.geneontology.org/#godatabase
31. GenSat, http://www.gensat.org/makeconnection.jsp
32. BAMS, http://brancusi.usc.edu/bkms/
33. Mega MS, Dinov ID, Thompson P, Manese M,
Lindshield C, Moussai J, Tran N, Olsen K, Felix J, Zoumalan
C, Woods RP, Toga AW, Mazziotta JC: Automated brain
tissue assessment in the elderly and demented population:
construction and validation of a sub-volume probabilistic brain
atlas. Neuroimage 26(4):1009Y1018, 2005
34. Mega MS, Dinov ID, Porter V, Chow G, Reback E,
Davoodi P, O’Connor S, Carter MF, Felix J, Amezcua H,
Cummings JL, Phelps ME, Toga AW: Metabolic patterns
associated with the clinical response to galantamine therapy: a
fludeoxyglucose F 18 positron emission tomographic study.
Arch Neurol 62:721Y728, 2005
35. Woods RP, et al: Creation and use of a Talairach-
compatible atlas for accurate, automated, nonlinear intersubject
registration, and analysis of functional imaging data. Hum
Brain Mapp 8(2Y3):73Y79, 1999
36. SOCR, http://www.socr.ucla.edu
37. Fischl B, Dale AM: Measuring the thickness of the
human cerebral cortex from magnetic resonance images. Proc
Natl Acad Sci U S A 97(20):11050Y11050, 2000
38. Mega MS, et al: Cerebral correlates of psychotic
symptoms in Alzheimer’s disease. J Neurol Neurosurg Psychi-
atry 69(2):167Y171, 2000
39. Blanton RE, et al: Mapping cortical asymmetry and
complexity patterns in normal children. Psychiatry Res 107(1):
29Y43, 2001
40. Bartzokis G, et al: White matter structural integrity in
healthy aging adults and patients with Alzheimer disease: a
magnetic resonance imaging study. Arch Neurol 60(3):393Y398,
200341. Bookheimer S: Functional MRI of language: new
approaches to understanding the cortical organization of
semantic processing. Annu Rev Neurosci 25:151Y188, 2002
42. Thompson PM, et al: Dynamics of gray matter loss in
Alzheimer’s disease. J Neurosci 23(3):994 Y1005, 2003
LONI VISUALIZATION ENVIRONMENT 157

43. Sowell ER, et al: Mapping continued brain growth and
gray matter density reduction in dorsal frontal cortex: inverse
relationships during postadolescent brain maturation. J Neuro-
sci 21(22):8819Y8829, 2001
44. Scahill RI, et al: A longitudinal study of brain volume
changes in normal aging using serial registered magnetic
resonance imaging. Arch Neurol 60(7):989Y994, 2003
45. Kasai K, et al: Progressive decrease of left Heschl gyrus
and planum temporale gray matter volume in first-episode
schizophrenia: a longitudinal magnetic resonance imaging
study. Arch Gen Psychiatry 60(8):766Y775, 2003
46. Thompson PM, et al: Growth patterns in the developing
brain detected by using continuum mechanical tensor maps.
Nature 404(6774):190Y193, 2000
47. Wright CI, et al: Novelty responses and differential
effects of order in the amygdala, substantia innominata,
and inferior temporal cortex. Neuroimage 18(3):660Y669,
2003
158 DINOV ET AL.