NetVisGame: Mobile Gamified Information Visualization of ...
10
NetVisGame: Mobile Gamified Information Visualization of Home Network Traffic Data Marija Schufrin 1 a , Katharina Kuban 2 , Arjan Kuijper 1,2 b and J ¨ orn Kohlhammer 1,2 c 1 Fraunhofer IGD, Germany 2 TU Darmstadt, Germany Keywords: Cyber-security Literacy, Network Traffic Analysis, Mobile Game, Information Visualization. Abstract: The awareness of everyday internet users for cyber security becomes ever more important considering the ubiquity of the Internet in everyday life. However, people usually lack the necessary understanding of this topic or the motivation to pay attention to the problem and its possible consequences. In this paper, we present the novel idea of combining visualization of one’s own personal data related to cyber-security literacy with a casual gaming approach. We therefore introduce our prototype, NetVisGame, in which we have implemented the idea for personal network traffic data based on a preliminary user study. The evaluation results of the first iteration of the user-centered design process supports the assumption that this approach is feasible to raise interest for and foster understanding of network traffic data and therefore could be a promising approach for data and technologies related to cyber-security literacy. 1 INTRODUCTION Users play a significant role in preventing cyber at- tacks (Bradley et al., 2015). Therefore, approaches to support cyber-security awareness (Bada et al., 2019) of average internet users are important. While it is common practice for experts to periodically monitor events in the network (Ghafir et al., 2016) or ana- lyze recent network traffic (Shiravi et al., 2011), most non-experts do not even think about this possibility and intruders can remain largely undetected (Feam- ster, 2010) There are mainly two barriers that a user is confronted with when it comes to network analy- sis. First, the concepts and data of network traffic are abstract and hard to grasp. Second, there is a lack of motivation to invest time to gain the necessary under- standing. Recent work applies concepts of informa- tion visualization to make abstract data more accessi- ble to users (Shiravi et al., 2011). However, this still falls short of the second barrier, creating the need for additional incentives (Schufrin et al., 2018). Our ap- proach is to embed the visualization of personal data into a game, following the success of games being used as educational tools (Alotaibi et al., 2016). Com- mon game approaches are mostly based on general a https://orcid.org/0000-0003-4642-5605 b https://orcid.org/0000-0002-6413-0061 c https://orcid.org/0000-0003-1706-8979 explanatory data. We argue that using real-life per- sonal data as a basis has multiple benefits for raising awareness. In this paper, we present NetVisGame, our prototypical mobile application, where we have ap- plied the novel concept to recorded traffic data from home networks. We further argue that this approach is applicable to different types of data and to a wide range of use cases for improving other areas of cyber- security awareness. To identify the needs of the tar- geted user group we conducted a user study with 41 participants and derived three representative personas. We then used these personas to design NetVisGame following a UCD process (ISO 9241-210, 2010). Our contributions are: (1) A novel concept combining a gaming approach with information visualization for the exploration of real-world router network data; (2) The description of the design process for the develop- ment of a gamified information visualization for real data related to cyber-security literacy. (3) A set of de- rived personas based on a preliminary user study as well as the characterization of the relevant problem space; (4) NetVisGame: An implemented prototypi- cal mobile game for gamified network analysis as a result of the first user-centered design iteration; Schufrin, M., Kuban, K., Kuijper, A. and Kohlhammer, J. NetVisGame: Mobile Gamified Information Visualization of Home Network Traffic Data. DOI: 10.5220/0010778800003124 In Proceedings of the 17th International Joint Conference on Computer Vision, Imaging and Computer Graphics Theory and Applications (VISIGRAPP 2022) - Volume 3: IVAPP, pages 129-138 ISBN: 978-989-758-555-5; ISSN: 2184-4321 Copyright c 2022 by SCITEPRESS – Science and Technology Publications, Lda. All rights reserved 129
-
Upload
khangminh22 -
Category
Documents
-
view
0 -
download
0
Transcript of NetVisGame: Mobile Gamified Information Visualization of ...
NetVisGame: Mobile Gamified Information Visualization of HomeNetwork Traffic Data
Marija Schufrin1 a, Katharina Kuban2, Arjan Kuijper1,2 b and Jorn Kohlhammer1,2 c
1Fraunhofer IGD, Germany2TU Darmstadt, Germany
Keywords: Cyber-security Literacy, Network Traffic Analysis, Mobile Game, Information Visualization.
Abstract: The awareness of everyday internet users for cyber security becomes ever more important considering theubiquity of the Internet in everyday life. However, people usually lack the necessary understanding of thistopic or the motivation to pay attention to the problem and its possible consequences. In this paper, we presentthe novel idea of combining visualization of one’s own personal data related to cyber-security literacy with acasual gaming approach. We therefore introduce our prototype, NetVisGame, in which we have implementedthe idea for personal network traffic data based on a preliminary user study. The evaluation results of the firstiteration of the user-centered design process supports the assumption that this approach is feasible to raiseinterest for and foster understanding of network traffic data and therefore could be a promising approach fordata and technologies related to cyber-security literacy.
1 INTRODUCTION
Users play a significant role in preventing cyber at-tacks (Bradley et al., 2015). Therefore, approaches tosupport cyber-security awareness (Bada et al., 2019)of average internet users are important. While it iscommon practice for experts to periodically monitorevents in the network (Ghafir et al., 2016) or ana-lyze recent network traffic (Shiravi et al., 2011), mostnon-experts do not even think about this possibilityand intruders can remain largely undetected (Feam-ster, 2010) There are mainly two barriers that a useris confronted with when it comes to network analy-sis. First, the concepts and data of network traffic areabstract and hard to grasp. Second, there is a lack ofmotivation to invest time to gain the necessary under-standing. Recent work applies concepts of informa-tion visualization to make abstract data more accessi-ble to users (Shiravi et al., 2011). However, this stillfalls short of the second barrier, creating the need foradditional incentives (Schufrin et al., 2018). Our ap-proach is to embed the visualization of personal datainto a game, following the success of games beingused as educational tools (Alotaibi et al., 2016). Com-mon game approaches are mostly based on general
a https://orcid.org/0000-0003-4642-5605b https://orcid.org/0000-0002-6413-0061c https://orcid.org/0000-0003-1706-8979
explanatory data. We argue that using real-life per-sonal data as a basis has multiple benefits for raisingawareness. In this paper, we present NetVisGame, ourprototypical mobile application, where we have ap-plied the novel concept to recorded traffic data fromhome networks. We further argue that this approachis applicable to different types of data and to a widerange of use cases for improving other areas of cyber-security awareness. To identify the needs of the tar-geted user group we conducted a user study with 41participants and derived three representative personas.We then used these personas to design NetVisGamefollowing a UCD process (ISO 9241-210, 2010). Ourcontributions are: (1) A novel concept combining agaming approach with information visualization forthe exploration of real-world router network data; (2)The description of the design process for the develop-ment of a gamified information visualization for realdata related to cyber-security literacy. (3) A set of de-rived personas based on a preliminary user study aswell as the characterization of the relevant problemspace; (4) NetVisGame: An implemented prototypi-cal mobile game for gamified network analysis as aresult of the first user-centered design iteration;
Schufrin, M., Kuban, K., Kuijper, A. and Kohlhammer, J.NetVisGame: Mobile Gamified Information Visualization of Home Network Traffic Data.DOI: 10.5220/0010778800003124In Proceedings of the 17th International Joint Conference on Computer Vision, Imaging and Computer Graphics Theory and Applications (VISIGRAPP 2022) - Volume 3: IVAPP, pages129-138ISBN: 978-989-758-555-5; ISSN: 2184-4321Copyright c© 2022 by SCITEPRESS – Science and Technology Publications, Lda. All rights reserved
129
2 RELATED WORK
In this section we show that there is no compara-ble approach that combines methods from informa-tion visualization and game design for the explorationof network data. We first look at general approachesto increase cyber security awareness, followed by ap-proaches for the visual analysis of network data andexisting gamified approaches to teach cyber security.
Cyber Security Awareness. The challenge of in-creasing the awareness for cyber security is notnew (Furnell et al., 2007; Lebek et al., 2014;Nthala and Flechais, 2018). Different approaches areknown(Abawajy, 2014) ranging from conventionalapproaches such as electronic and paper resources,over instructor-led and online approaches to video-based, simulation-based and game-based approaches.There are several studies examining the users’ percep-tion and attitude towards privacy and security (Fur-man et al., 2011; Nthala and Flechais, 2018; Busseet al., 2019). Network security is a relevant sub-domain of cyber security (Nthala and Flechais, 2018).This area is especially interesting with respect to theemerging trend of smart homes and the internet ofthings (Barbosa et al., 2020; Cobb et al., 2020).
Visual Analysis of Network Data. Inspecting andanalyzing network traffic data is a common task inthe area of IT and cyber security. Experts, however,often use the console or powerful analysis tools likewireshark (Ndatinya et al., 2015) that only provide alist-based presentation of data, though. Several ap-proaches aim at applying information visualizationmethods (Card et al., 2009) to support the analysisof network data, as for example summarized by Shi-ravi et al. (Shiravi et al., 2011) or also newer ap-proaches such as (Ulmer et al., 2019; Guerra et al.,2019; Krokos et al., 2018; Arendt et al., 2015; Arendtet al., 2016). Unfortunately, all of these approachesare mostly suitable for users with expert knowledge.As the survey of Huang et al. (Huang et al., 2014)shows, personal visualizations for cyber security arequite rare. Nevertheless, there have been attempts todesign information visualization for IT-network anal-ysis for laypersons, e.g. by Legg et al. (Legg, 2016)or Ulmer et al. (Ulmer et al., 2018). Unfortunately,it is not enough to visualize the data, if there is nomotivation to use the visualization in the first place.Schufrin et al. (Schufrin et al., 2018) therefore ar-gue for a stronger focus on the user experience de-sign, when it comes to information visualizations incontext of cyber security for non-experts. They alsopresented a comparable approach in (Schufrin et al.,
2020). In contrast to this paper, we propose a com-bination of information visualization embedded in amobile game with a purpose. This type of games arealso known as serious games (Dorner et al., 2016).
Games for Cyber Security Awareness. Seriousgames with the goal of behaviour change and user en-gagement can be found in different contexts. Susi cat-egorizes them into military, government, educational,corporate and healthcare (Susi et al., 2007). Our ap-proach fits into the category educational. There areespecially successful examples for serious games inthe context of fitness and physical activities (Dutzet al., 2014), as the popularity of Wii Fit seems toshow, which was first released at the end of 2007(Goble et al., 2014). Looking at the parallels of fitnessor healthcare to personal cyber security, there is muchto be learned from these established approaches. An-other concept, that is proven to motivate and possi-bly change behaviour is gamification (Simoes et al.,2013; Deterding et al., 2011; Berengueres et al.,2013). Gamification aims to apply concepts fromvideo games to non-gaming contexts. There are in-deed a number of gaming approaches for the purposeof increasing awareness for cyber security, which aresummarized by Hendrix et al. (Hendrix et al., 2016)and Alotaibi et al. (Alotaibi et al., 2016). Some se-lected recent examples are Passworld (Jayakrishnanet al., 2020), Anti Phishing Phil (Sheng et al., 2007)and many others (Tupsamudre et al., 2018; CJ et al.,2018; Seitz and Hussmann, 2017; Giannakas et al.,2015; Denning et al., 2013; Thompson and Irvine,2011). These examples show that a gaming approachcan be applied to different issues related to cyber se-curity to support users’ engagement and increase theeffectiveness of training. Nevertheless, none of theseapproaches use real user data as the educational basisfor the game. Also, none of the approaches present acombination of information visualization and gaming.Closest to our work is the approach by Schweitzer andBrown (Schweitzer and Brown, 2009), in which infor-mation visualization is actually applied to cyber secu-rity education. However, it is rather a simulation thana game, no personal data is used, and the approach isdesigned to be used in class rather than as a personal,let alone mobile, application.
3 USER STUDY
We conducted an online user study with 41 partic-ipants (16m, 25f) from Germany. The participantswere volunteers who we have invited from differentcommunities. The main goals of the study were to ex-
IVAPP 2022 - 13th International Conference on Information Visualization Theory and Applications
130
IT‐knowledge general
16
10
1
12
2
none average high
(a) general IT knowledge
16
9
12
2 2
none average high
IT knowledge ‐ privacy
(b) internet privacy
3
78
2
21
none average high
(c) IT security
7
19
8
5
1
none average high
(d) network data
performed activities never rareley sometimes often very oftenAccessed my router's settings 24% 22% 24% 10% 15%Dealt with network data 37% 34% 17% 7% 2%Looked up my own IP-address 27% 34% 22% 5% 10%Looked up the IP-address of another website 63% 20% 10% 2% 2%Paid attention to the encryption of the website I visited 37% 29% 15% 5% 15%Used a VPN service 39% 12% 17% 7% 7%
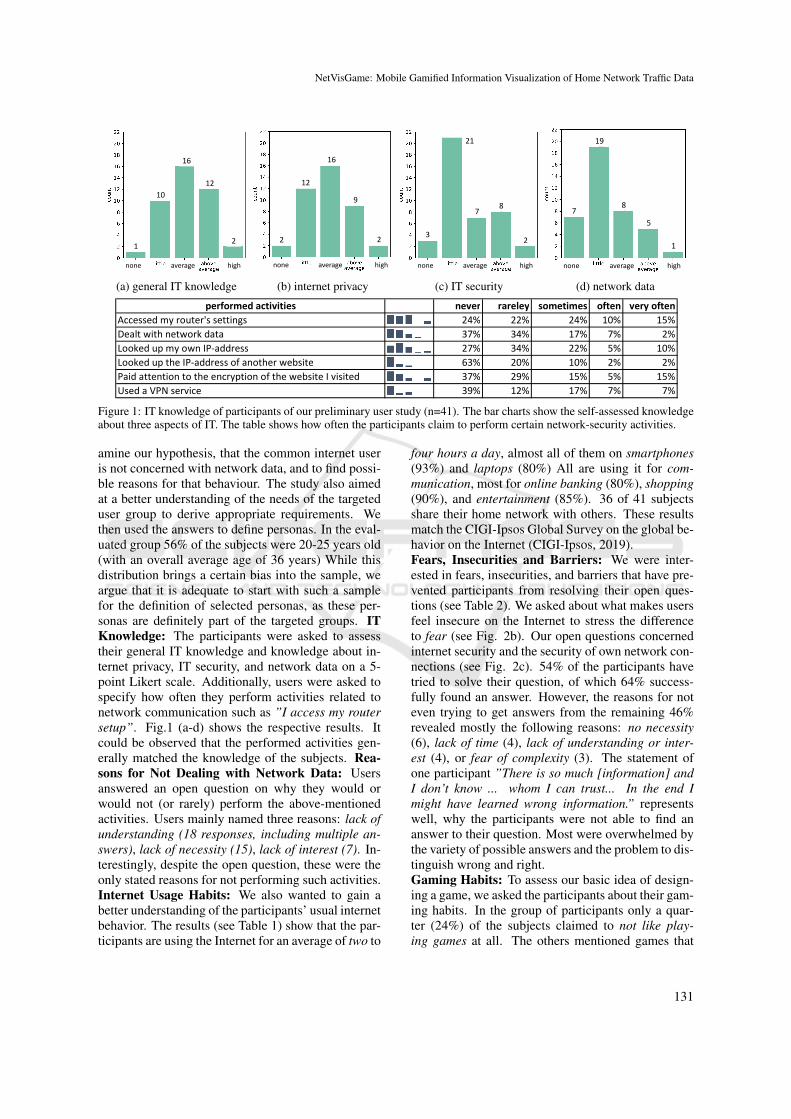
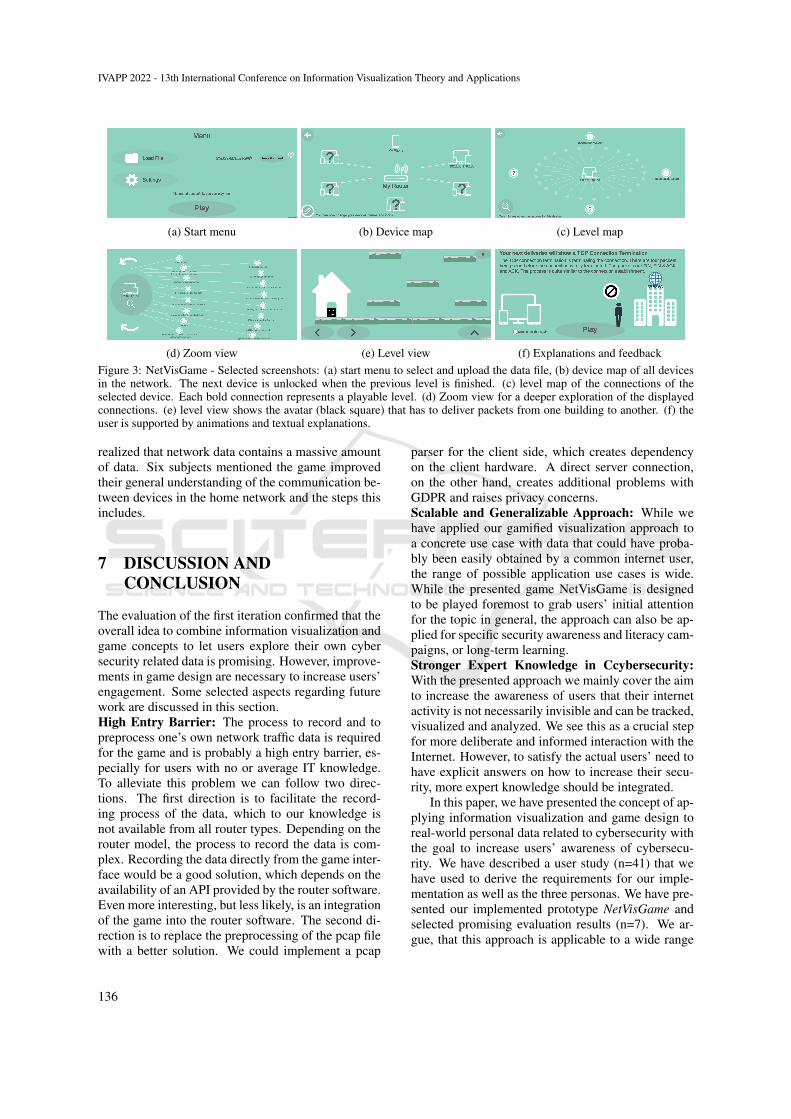
Figure 1: IT knowledge of participants of our preliminary user study (n=41). The bar charts show the self-assessed knowledgeabout three aspects of IT. The table shows how often the participants claim to perform certain network-security activities.
amine our hypothesis, that the common internet useris not concerned with network data, and to find possi-ble reasons for that behaviour. The study also aimedat a better understanding of the needs of the targeteduser group to derive appropriate requirements. Wethen used the answers to define personas. In the eval-uated group 56% of the subjects were 20-25 years old(with an overall average age of 36 years) While thisdistribution brings a certain bias into the sample, weargue that it is adequate to start with such a samplefor the definition of selected personas, as these per-sonas are definitely part of the targeted groups. ITKnowledge: The participants were asked to assesstheir general IT knowledge and knowledge about in-ternet privacy, IT security, and network data on a 5-point Likert scale. Additionally, users were asked tospecify how often they perform activities related tonetwork communication such as ”I access my routersetup”. Fig.1 (a-d) shows the respective results. Itcould be observed that the performed activities gen-erally matched the knowledge of the subjects. Rea-sons for Not Dealing with Network Data: Usersanswered an open question on why they would orwould not (or rarely) perform the above-mentionedactivities. Users mainly named three reasons: lack ofunderstanding (18 responses, including multiple an-swers), lack of necessity (15), lack of interest (7). In-terestingly, despite the open question, these were theonly stated reasons for not performing such activities.Internet Usage Habits: We also wanted to gain abetter understanding of the participants’ usual internetbehavior. The results (see Table 1) show that the par-ticipants are using the Internet for an average of two to
four hours a day, almost all of them on smartphones(93%) and laptops (80%) All are using it for com-munication, most for online banking (80%), shopping(90%), and entertainment (85%). 36 of 41 subjectsshare their home network with others. These resultsmatch the CIGI-Ipsos Global Survey on the global be-havior on the Internet (CIGI-Ipsos, 2019).Fears, Insecurities and Barriers: We were inter-ested in fears, insecurities, and barriers that have pre-vented participants from resolving their open ques-tions (see Table 2). We asked about what makes usersfeel insecure on the Internet to stress the differenceto fear (see Fig. 2b). Our open questions concernedinternet security and the security of own network con-nections (see Fig. 2c). 54% of the participants havetried to solve their question, of which 64% success-fully found an answer. However, the reasons for noteven trying to get answers from the remaining 46%revealed mostly the following reasons: no necessity(6), lack of time (4), lack of understanding or inter-est (4), or fear of complexity (3). The statement ofone participant ”There is so much [information] andI don’t know ... whom I can trust... In the end Imight have learned wrong information.” representswell, why the participants were not able to find ananswer to their question. Most were overwhelmed bythe variety of possible answers and the problem to dis-tinguish wrong and right.Gaming Habits: To assess our basic idea of design-ing a game, we asked the participants about their gam-ing habits. In the group of participants only a quar-ter (24%) of the subjects claimed to not like play-ing games at all. The others mentioned games that
NetVisGame: Mobile Gamified Information Visualization of Home Network Traffic Data
131
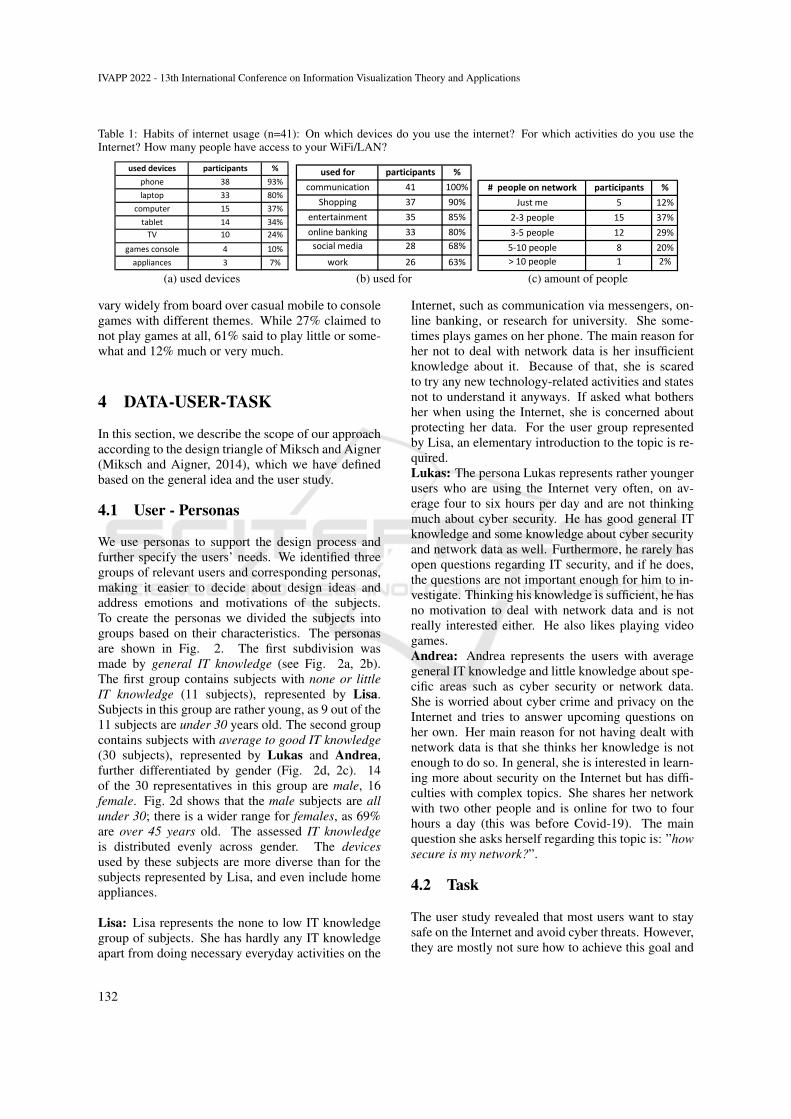
Table 1: Habits of internet usage (n=41): On which devices do you use the internet? For which activities do you use theInternet? How many people have access to your WiFi/LAN?
used devices participants %phone 38 93%laptop 33 80%
computer 15 37%tablet 14 34%
TV 10 24%
games console 4 10%appliances 3 7%
(a) used devices
used for participants %communication 41 100%
Shopping 37 90%entertainment 35 85%online banking 33 80%
social media 28 68%
work 26 63%
(b) used for
# people on network participants %Just me 5 12%
2-3 people 15 37%3-5 people 12 29%
5-10 people 8 20%> 10 people 1 2%
(c) amount of people
vary widely from board over casual mobile to consolegames with different themes. While 27% claimed tonot play games at all, 61% said to play little or some-what and 12% much or very much.
4 DATA-USER-TASK
In this section, we describe the scope of our approachaccording to the design triangle of Miksch and Aigner(Miksch and Aigner, 2014), which we have definedbased on the general idea and the user study.
4.1 User - Personas
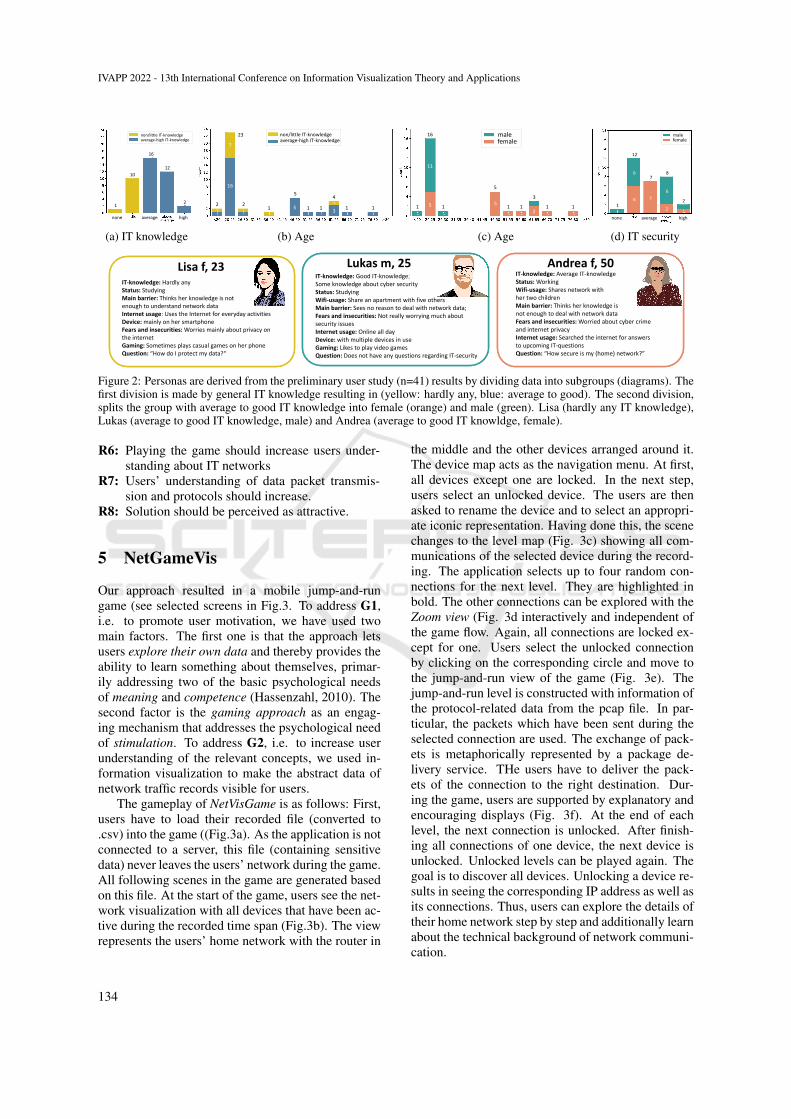
We use personas to support the design process andfurther specify the users’ needs. We identified threegroups of relevant users and corresponding personas,making it easier to decide about design ideas andaddress emotions and motivations of the subjects.To create the personas we divided the subjects intogroups based on their characteristics. The personasare shown in Fig. 2. The first subdivision wasmade by general IT knowledge (see Fig. 2a, 2b).The first group contains subjects with none or littleIT knowledge (11 subjects), represented by Lisa.Subjects in this group are rather young, as 9 out of the11 subjects are under 30 years old. The second groupcontains subjects with average to good IT knowledge(30 subjects), represented by Lukas and Andrea,further differentiated by gender (Fig. 2d, 2c). 14of the 30 representatives in this group are male, 16female. Fig. 2d shows that the male subjects are allunder 30; there is a wider range for females, as 69%are over 45 years old. The assessed IT knowledgeis distributed evenly across gender. The devicesused by these subjects are more diverse than for thesubjects represented by Lisa, and even include homeappliances.
Lisa: Lisa represents the none to low IT knowledgegroup of subjects. She has hardly any IT knowledgeapart from doing necessary everyday activities on the
Internet, such as communication via messengers, on-line banking, or research for university. She some-times plays games on her phone. The main reason forher not to deal with network data is her insufficientknowledge about it. Because of that, she is scaredto try any new technology-related activities and statesnot to understand it anyways. If asked what bothersher when using the Internet, she is concerned aboutprotecting her data. For the user group representedby Lisa, an elementary introduction to the topic is re-quired.Lukas: The persona Lukas represents rather youngerusers who are using the Internet very often, on av-erage four to six hours per day and are not thinkingmuch about cyber security. He has good general ITknowledge and some knowledge about cyber securityand network data as well. Furthermore, he rarely hasopen questions regarding IT security, and if he does,the questions are not important enough for him to in-vestigate. Thinking his knowledge is sufficient, he hasno motivation to deal with network data and is notreally interested either. He also likes playing videogames.Andrea: Andrea represents the users with averagegeneral IT knowledge and little knowledge about spe-cific areas such as cyber security or network data.She is worried about cyber crime and privacy on theInternet and tries to answer upcoming questions onher own. Her main reason for not having dealt withnetwork data is that she thinks her knowledge is notenough to do so. In general, she is interested in learn-ing more about security on the Internet but has diffi-culties with complex topics. She shares her networkwith two other people and is online for two to fourhours a day (this was before Covid-19). The mainquestion she asks herself regarding this topic is: ”howsecure is my network?”.
4.2 Task
The user study revealed that most users want to staysafe on the Internet and avoid cyber threats. However,they are mostly not sure how to achieve this goal and
IVAPP 2022 - 13th International Conference on Information Visualization Theory and Applications
132
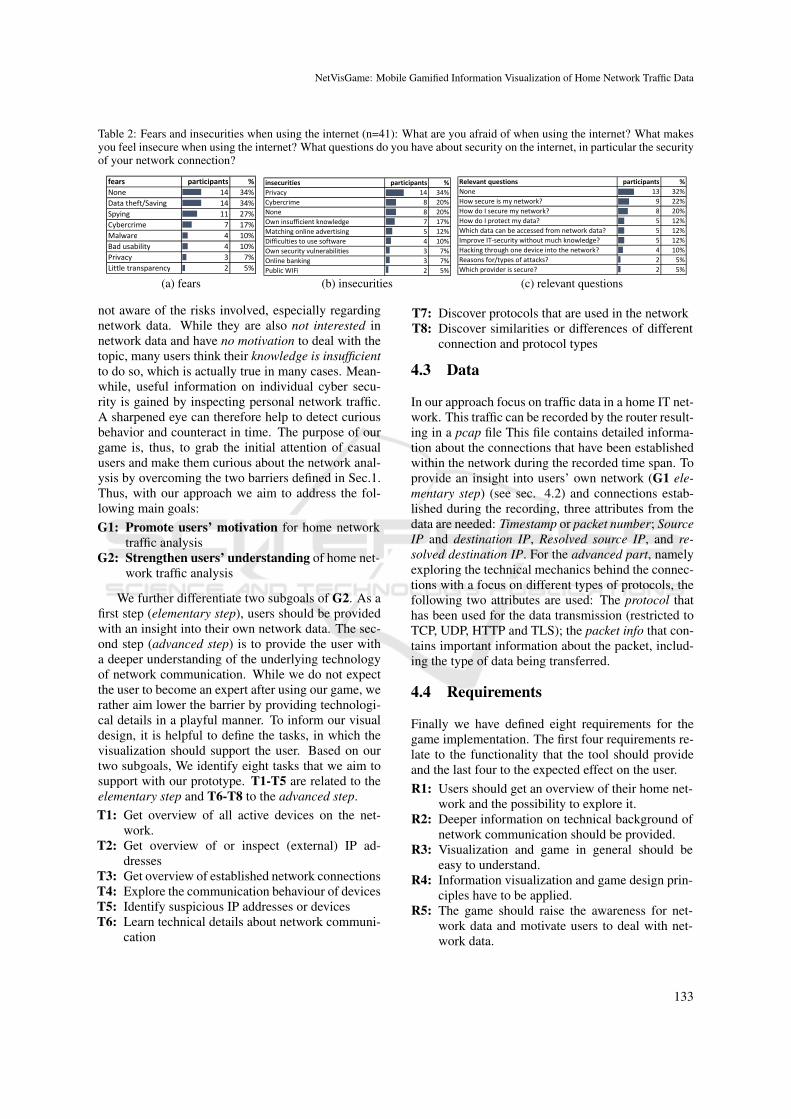
Table 2: Fears and insecurities when using the internet (n=41): What are you afraid of when using the internet? What makesyou feel insecure when using the internet? What questions do you have about security on the internet, in particular the securityof your network connection?
fears participants %None 14 34%Data theft/Saving 14 34%Spying 11 27%Cybercrime 7 17%Malware 4 10%Bad usability 4 10%Privacy 3 7%Little transparency 2 5%
(a) fears
insecurities participants %Privacy 14 34%Cybercrime 8 20%None 8 20%Own insufficient knowledge 7 17%Matching online advertising 5 12%Difficulties to use software 4 10%Own security vulnerabilities 3 7%Online banking 3 7%Public WIFi 2 5%
(b) insecurities
Relevant questions participants %None 13 32%How secure is my network? 9 22%How do I secure my network? 8 20%How do I protect my data? 5 12%Which data can be accessed from network data? 5 12%Improve IT-security without much knowledge? 5 12%Hacking through one device into the network? 4 10%Reasons for/types of attacks? 2 5%Which provider is secure? 2 5%
(c) relevant questions
not aware of the risks involved, especially regardingnetwork data. While they are also not interested innetwork data and have no motivation to deal with thetopic, many users think their knowledge is insufficientto do so, which is actually true in many cases. Mean-while, useful information on individual cyber secu-rity is gained by inspecting personal network traffic.A sharpened eye can therefore help to detect curiousbehavior and counteract in time. The purpose of ourgame is, thus, to grab the initial attention of casualusers and make them curious about the network anal-ysis by overcoming the two barriers defined in Sec.1.Thus, with our approach we aim to address the fol-lowing main goals:G1: Promote users’ motivation for home network
traffic analysisG2: Strengthen users’ understanding of home net-
work traffic analysis
We further differentiate two subgoals of G2. As afirst step (elementary step), users should be providedwith an insight into their own network data. The sec-ond step (advanced step) is to provide the user witha deeper understanding of the underlying technologyof network communication. While we do not expectthe user to become an expert after using our game, werather aim lower the barrier by providing technologi-cal details in a playful manner. To inform our visualdesign, it is helpful to define the tasks, in which thevisualization should support the user. Based on ourtwo subgoals, We identify eight tasks that we aim tosupport with our prototype. T1-T5 are related to theelementary step and T6-T8 to the advanced step.T1: Get overview of all active devices on the net-
work.T2: Get overview of or inspect (external) IP ad-
dressesT3: Get overview of established network connectionsT4: Explore the communication behaviour of devicesT5: Identify suspicious IP addresses or devicesT6: Learn technical details about network communi-
cation
T7: Discover protocols that are used in the networkT8: Discover similarities or differences of different
connection and protocol types
4.3 Data
In our approach focus on traffic data in a home IT net-work. This traffic can be recorded by the router result-ing in a pcap file This file contains detailed informa-tion about the connections that have been establishedwithin the network during the recorded time span. Toprovide an insight into users’ own network (G1 ele-mentary step) (see sec. 4.2) and connections estab-lished during the recording, three attributes from thedata are needed: Timestamp or packet number; SourceIP and destination IP, Resolved source IP, and re-solved destination IP. For the advanced part, namelyexploring the technical mechanics behind the connec-tions with a focus on different types of protocols, thefollowing two attributes are used: The protocol thathas been used for the data transmission (restricted toTCP, UDP, HTTP and TLS); the packet info that con-tains important information about the packet, includ-ing the type of data being transferred.
4.4 Requirements
Finally we have defined eight requirements for thegame implementation. The first four requirements re-late to the functionality that the tool should provideand the last four to the expected effect on the user.R1: Users should get an overview of their home net-
work and the possibility to explore it.R2: Deeper information on technical background of
network communication should be provided.R3: Visualization and game in general should be
easy to understand.R4: Information visualization and game design prin-
ciples have to be applied.R5: The game should raise the awareness for net-
work data and motivate users to deal with net-work data.
NetVisGame: Mobile Gamified Information Visualization of Home Network Traffic Data
133
average‐high IT‐knowledgenon/little IT‐knowledge
10
16
12
21
none average high
(a) IT knowledge
2 21
5
1 1
4
1 1
23
7
16
5 3
average‐high IT‐knowledgenon/little IT‐knowledge
(b) Age
16
1 1
5
1
3
1 1 1
11
5 52
femalemale
(c) Age
Security knowledge
12
femalemale
78
21
6
6
76
2
none average high
(d) IT security
IT‐knowledge: Hardly anyStatus: Studying Main barrier: Thinks her knowledge is not enough to understand network data Internet usage: Uses the Internet for everyday activities Device: mainly on her smartphone Fears and insecurities: Worries mainly about privacy on the internet Gaming: Sometimes plays casual games on her phone Question: “How do I protect my data?“
Lisa f, 23 Lukas m, 25IT‐knowledge: Good IT‐knowledge;Some knowledge about cyber securityStatus: StudyingWifi‐usage: Share an apartment with five others Main barrier: Sees no reason to deal with network data; Fears and insecurities: Not really worrying much about security issuesInternet usage: Online all day Device: with multiple devices in useGaming: Likes to play video games Question: Does not have any questions regarding IT‐security
Andrea f, 50IT‐knowledge: Average IT‐knowledgeStatus: Working Wifi‐usage: Shares network with her two childrenMain barrier: Thinks her knowledge is not enough to deal with network dataFears and insecurities: Worried about cyber crime and internet privacyInternet usage: Searched the internet for answers to upcoming IT‐questions Question: “How secure is my (home) network?”
Figure 2: Personas are derived from the preliminary user study (n=41) results by dividing data into subgroups (diagrams). Thefirst division is made by general IT knowledge resulting in (yellow: hardly any, blue: average to good). The second division,splits the group with average to good IT knowledge into female (orange) and male (green). Lisa (hardly any IT knowledge),Lukas (average to good IT knowledge, male) and Andrea (average to good IT knowldge, female).
R6: Playing the game should increase users under-standing about IT networks
R7: Users’ understanding of data packet transmis-sion and protocols should increase.
R8: Solution should be perceived as attractive.
5 NetGameVis
Our approach resulted in a mobile jump-and-rungame (see selected screens in Fig.3. To address G1,i.e. to promote user motivation, we have used twomain factors. The first one is that the approach letsusers explore their own data and thereby provides theability to learn something about themselves, primar-ily addressing two of the basic psychological needsof meaning and competence (Hassenzahl, 2010). Thesecond factor is the gaming approach as an engag-ing mechanism that addresses the psychological needof stimulation. To address G2, i.e. to increase userunderstanding of the relevant concepts, we used in-formation visualization to make the abstract data ofnetwork traffic records visible for users.
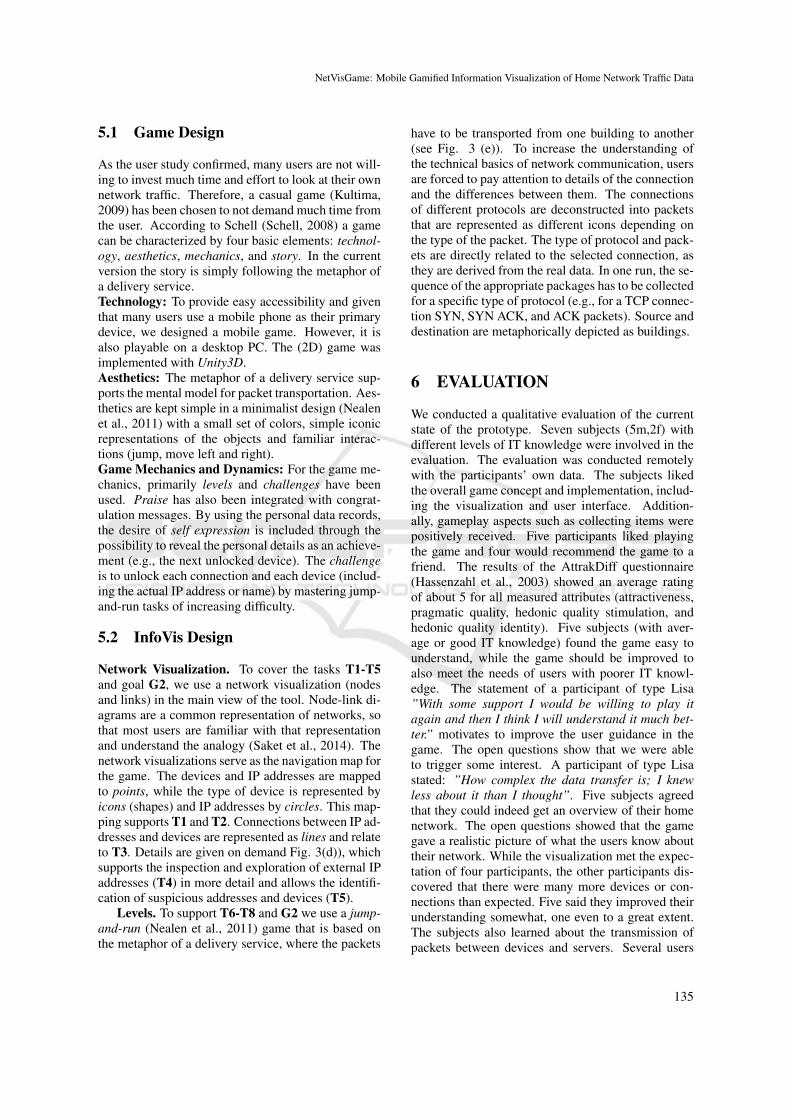
The gameplay of NetVisGame is as follows: First,users have to load their recorded file (converted to.csv) into the game ((Fig.3a). As the application is notconnected to a server, this file (containing sensitivedata) never leaves the users’ network during the game.All following scenes in the game are generated basedon this file. At the start of the game, users see the net-work visualization with all devices that have been ac-tive during the recorded time span (Fig.3b). The viewrepresents the users’ home network with the router in
the middle and the other devices arranged around it.The device map acts as the navigation menu. At first,all devices except one are locked. In the next step,users select an unlocked device. The users are thenasked to rename the device and to select an appropri-ate iconic representation. Having done this, the scenechanges to the level map (Fig. 3c) showing all com-munications of the selected device during the record-ing. The application selects up to four random con-nections for the next level. They are highlighted inbold. The other connections can be explored with theZoom view (Fig. 3d interactively and independent ofthe game flow. Again, all connections are locked ex-cept for one. Users select the unlocked connectionby clicking on the corresponding circle and move tothe jump-and-run view of the game (Fig. 3e). Thejump-and-run level is constructed with information ofthe protocol-related data from the pcap file. In par-ticular, the packets which have been sent during theselected connection are used. The exchange of pack-ets is metaphorically represented by a package de-livery service. THe users have to deliver the pack-ets of the connection to the right destination. Dur-ing the game, users are supported by explanatory andencouraging displays (Fig. 3f). At the end of eachlevel, the next connection is unlocked. After finish-ing all connections of one device, the next device isunlocked. Unlocked levels can be played again. Thegoal is to discover all devices. Unlocking a device re-sults in seeing the corresponding IP address as well asits connections. Thus, users can explore the details oftheir home network step by step and additionally learnabout the technical background of network communi-cation.
IVAPP 2022 - 13th International Conference on Information Visualization Theory and Applications
134
5.1 Game Design
As the user study confirmed, many users are not will-ing to invest much time and effort to look at their ownnetwork traffic. Therefore, a casual game (Kultima,2009) has been chosen to not demand much time fromthe user. According to Schell (Schell, 2008) a gamecan be characterized by four basic elements: technol-ogy, aesthetics, mechanics, and story. In the currentversion the story is simply following the metaphor ofa delivery service.Technology: To provide easy accessibility and giventhat many users use a mobile phone as their primarydevice, we designed a mobile game. However, it isalso playable on a desktop PC. The (2D) game wasimplemented with Unity3D.Aesthetics: The metaphor of a delivery service sup-ports the mental model for packet transportation. Aes-thetics are kept simple in a minimalist design (Nealenet al., 2011) with a small set of colors, simple iconicrepresentations of the objects and familiar interac-tions (jump, move left and right).Game Mechanics and Dynamics: For the game me-chanics, primarily levels and challenges have beenused. Praise has also been integrated with congrat-ulation messages. By using the personal data records,the desire of self expression is included through thepossibility to reveal the personal details as an achieve-ment (e.g., the next unlocked device). The challengeis to unlock each connection and each device (includ-ing the actual IP address or name) by mastering jump-and-run tasks of increasing difficulty.
5.2 InfoVis Design
Network Visualization. To cover the tasks T1-T5and goal G2, we use a network visualization (nodesand links) in the main view of the tool. Node-link di-agrams are a common representation of networks, sothat most users are familiar with that representationand understand the analogy (Saket et al., 2014). Thenetwork visualizations serve as the navigation map forthe game. The devices and IP addresses are mappedto points, while the type of device is represented byicons (shapes) and IP addresses by circles. This map-ping supports T1 and T2. Connections between IP ad-dresses and devices are represented as lines and relateto T3. Details are given on demand Fig. 3(d)), whichsupports the inspection and exploration of external IPaddresses (T4) in more detail and allows the identifi-cation of suspicious addresses and devices (T5).
Levels. To support T6-T8 and G2 we use a jump-and-run (Nealen et al., 2011) game that is based onthe metaphor of a delivery service, where the packets
have to be transported from one building to another(see Fig. 3 (e)). To increase the understanding ofthe technical basics of network communication, usersare forced to pay attention to details of the connectionand the differences between them. The connectionsof different protocols are deconstructed into packetsthat are represented as different icons depending onthe type of the packet. The type of protocol and pack-ets are directly related to the selected connection, asthey are derived from the real data. In one run, the se-quence of the appropriate packages has to be collectedfor a specific type of protocol (e.g., for a TCP connec-tion SYN, SYN ACK, and ACK packets). Source anddestination are metaphorically depicted as buildings.
6 EVALUATION
We conducted a qualitative evaluation of the currentstate of the prototype. Seven subjects (5m,2f) withdifferent levels of IT knowledge were involved in theevaluation. The evaluation was conducted remotelywith the participants’ own data. The subjects likedthe overall game concept and implementation, includ-ing the visualization and user interface. Addition-ally, gameplay aspects such as collecting items werepositively received. Five participants liked playingthe game and four would recommend the game to afriend. The results of the AttrakDiff questionnaire(Hassenzahl et al., 2003) showed an average ratingof about 5 for all measured attributes (attractiveness,pragmatic quality, hedonic quality stimulation, andhedonic quality identity). Five subjects (with aver-age or good IT knowledge) found the game easy tounderstand, while the game should be improved toalso meet the needs of users with poorer IT knowl-edge. The statement of a participant of type Lisa”With some support I would be willing to play itagain and then I think I will understand it much bet-ter.” motivates to improve the user guidance in thegame. The open questions show that we were ableto trigger some interest. A participant of type Lisastated: ”How complex the data transfer is; I knewless about it than I thought”. Five subjects agreedthat they could indeed get an overview of their homenetwork. The open questions showed that the gamegave a realistic picture of what the users know abouttheir network. While the visualization met the expec-tation of four participants, the other participants dis-covered that there were many more devices or con-nections than expected. Five said they improved theirunderstanding somewhat, one even to a great extent.The subjects also learned about the transmission ofpackets between devices and servers. Several users
NetVisGame: Mobile Gamified Information Visualization of Home Network Traffic Data
135
(a) Start menu (b) Device map (c) Level map
(d) Zoom view (e) Level view (f) Explanations and feedbackFigure 3: NetVisGame - Selected screenshots: (a) start menu to select and upload the data file, (b) device map of all devicesin the network. The next device is unlocked when the previous level is finished. (c) level map of the connections of theselected device. Each bold connection represents a playable level. (d) Zoom view for a deeper exploration of the displayedconnections. (e) level view shows the avatar (black square) that has to deliver packets from one building to another. (f) theuser is supported by animations and textual explanations.
realized that network data contains a massive amountof data. Six subjects mentioned the game improvedtheir general understanding of the communication be-tween devices in the home network and the steps thisincludes.
7 DISCUSSION ANDCONCLUSION
The evaluation of the first iteration confirmed that theoverall idea to combine information visualization andgame concepts to let users explore their own cybersecurity related data is promising. However, improve-ments in game design are necessary to increase users’engagement. Some selected aspects regarding futurework are discussed in this section.High Entry Barrier: The process to record and topreprocess one’s own network traffic data is requiredfor the game and is probably a high entry barrier, es-pecially for users with no or average IT knowledge.To alleviate this problem we can follow two direc-tions. The first direction is to facilitate the record-ing process of the data, which to our knowledge isnot available from all router types. Depending on therouter model, the process to record the data is com-plex. Recording the data directly from the game inter-face would be a good solution, which depends on theavailability of an API provided by the router software.Even more interesting, but less likely, is an integrationof the game into the router software. The second di-rection is to replace the preprocessing of the pcap filewith a better solution. We could implement a pcap
parser for the client side, which creates dependencyon the client hardware. A direct server connection,on the other hand, creates additional problems withGDPR and raises privacy concerns.Scalable and Generalizable Approach: While wehave applied our gamified visualization approach toa concrete use case with data that could have proba-bly been easily obtained by a common internet user,the range of possible application use cases is wide.While the presented game NetVisGame is designedto be played foremost to grab users’ initial attentionfor the topic in general, the approach can also be ap-plied for specific security awareness and literacy cam-paigns, or long-term learning.Stronger Expert Knowledge in Ccybersecurity:With the presented approach we mainly cover the aimto increase the awareness of users that their internetactivity is not necessarily invisible and can be tracked,visualized and analyzed. We see this as a crucial stepfor more deliberate and informed interaction with theInternet. However, to satisfy the actual users’ need tohave explicit answers on how to increase their secu-rity, more expert knowledge should be integrated.
In this paper, we have presented the concept of ap-plying information visualization and game design toreal-world personal data related to cybersecurity withthe goal to increase users’ awareness of cybersecu-rity. We have described a user study (n=41) that wehave used to derive the requirements for our imple-mentation as well as the three personas. We have pre-sented our implemented prototype NetVisGame andselected promising evaluation results (n=7). We ar-gue, that this approach is applicable to a wide range
IVAPP 2022 - 13th International Conference on Information Visualization Theory and Applications
136

of use cases and data and can even be extended to pro-vide deeper IT knowledge than the current work.
ACKNOWLEDGEMENTS
This research work has been funded by the GermanFederal Ministry of Education and Research and theHessian Ministry of Higher Education, Research, Sci-ence and the Arts within their joint support of theNational Research Center for Applied CybersecurityATHENE.
REFERENCES
Abawajy, J. (2014). User preference of cyber securityawareness delivery methods. Behaviour & Informa-tion Technology, 33(3):237–248.
Alotaibi, F., Furnell, S., Stengel, I., and Papadaki, M.(2016). A review of using gaming technologyfor cyber-security awareness. Int. J. Inf. Secur.Res.(IJISR), 6(2):660–666.
Arendt, D., Best, D., Burtner, R., and Paul, C. L. (2016).Cyberpetri at cdx 2016: Real-time network situationawareness. In 2016 IEEE Symposium on Visualizationfor Cyber Security (VizSec), pages 1–4. IEEE.
Arendt, D. L., Burtner, R., Best, D. M., Bos, N. D., Gersh,J. R., Piatko, C. D., and Paul, C. L. (2015). Ocelot:user-centered design of a decision support visualiza-tion for network quarantine. In 2015 IEEE Symposiumon Visualization for Cyber Security (VizSec), pages 1–8. IEEE.
Bada, M., Sasse, A. M., and Nurse, J. R. (2019). Cybersecurity awareness campaigns: Why do they fail tochange behaviour? arXiv preprint arXiv:1901.02672.
Barbosa, N. M., Zhang, Z., and Wang, Y. (2020). Do pri-vacy and security matter to everyone? quantifyingand clustering user-centric considerations about smarthome device adoption. In Sixteenth Symposium onUsable Privacy and Security ({SOUPS} 2020), pages417–435.
Berengueres, J., Alsuwairi, F., Zaki, N., and Ng, T. (2013).Gamification of a recycle bin with emoticons. In 20138th ACM/IEEE International Conference on Human-Robot Interaction (HRI), pages 83–84. IEEE.
Bradley, N., Alvarez, M., Kuhn, J., and McMillen, D.(2015). Ibm 2015 cyber security intelligence index.
Busse, K., Schafer, J., and Smith, M. (2019). Replication:no one can hack my mind revisiting a study on ex-pert and non-expert security practices and advice. InFifteenth Symposium on Usable Privacy and Security({SOUPS} 2019).
Card, S., Mackinlay, J., and Shneiderman, B. (2009). Infor-mation visualization. Human-computer interaction:Design issues, solutions, and applications, 181.
CIGI-Ipsos (2019). 2019 cigi-ipsos global survey on in-ternet security and trust. https://www.cigionline.org/internet-survey-2019. Accessed: 2021-02-25.
CJ, G., Pandit, S., Vaddepalli, S., Tupsamudre, H., Ba-nahatti, V., and Lodha, S. (2018). Phishy-a seri-ous game to train enterprise users on phishing aware-ness. In Proceedings of the 2018 annual symposiumon computer-human interaction in play companion ex-tended abstracts, pages 169–181.
Cobb, C., Surbatovich, M., Kawakami, A., Sharif, M.,Bauer, L., Das, A., and Jia, L. (2020). How riskyare real users’{IFTTT} applets? In Sixteenth Sym-posium on Usable Privacy and Security ({SOUPS}2020), pages 505–529.
Denning, T., Lerner, A., Shostack, A., and Kohno, T.(2013). Control-alt-hack: the design and evaluationof a card game for computer security awareness andeducation. In Proceedings of the 2013 ACM SIGSACconference on Computer & communications security,pages 915–928.
Deterding, S., Dixon, D., Khaled, R., and Nacke, L. (2011).From game design elements to gamefulness: defin-ing” gamification”. In Proceedings of the 15th inter-national academic MindTrek conference: Envisioningfuture media environments, pages 9–15.
Dorner, R., Gobel, S., Effelsberg, W., and Wiemeyer, J.(2016). Serious Games. Springer.
Dutz, T., Hardy, S., Knoll, M., Gobel, S., and Steinmetz,R. (2014). User interfaces of mobile exergames. InInternational Conference on Human-Computer Inter-action, pages 244–255. Springer.
Feamster, N. (2010). Outsourcing home network security.In Proceedings of the 2010 ACM SIGCOMM work-shop on Home networks, pages 37–42.
Furman, S., Theofanos, M. F., Choong, Y.-Y., and Stanton,B. (2011). Basing cybersecurity training on user per-ceptions. IEEE Security & Privacy, 10(2):40–49.
Furnell, S. M., Bryant, P., and Phippen, A. D. (2007). As-sessing the security perceptions of personal internetusers. Computers & Security, 26(5):410–417.
Ghafir, I., Prenosil, V., Svoboda, J., and Hammoudeh, M.(2016). A survey on network security monitoring sys-tems. In 2016 IEEE 4th International Conference onFuture Internet of Things and Cloud Workshops (Fi-CloudW), pages 77–82. IEEE.
Giannakas, F., Kambourakis, G., and Gritzalis, S. (2015).Cyberaware: A mobile game-based app for cyber-security education and awareness. In 2015 Interna-tional Conference on Interactive Mobile Communica-tion Technologies and Learning (IMCL), pages 54–58.IEEE.
Goble, D. J., Cone, B. L., and Fling, B. W. (2014). Using thewii fit as a tool for balance assessment and neuroreha-bilitation: the first half decade of “wii-search”. Jour-nal of neuroengineering and rehabilitation, 11(1):1–9.
Guerra, J. L., Veas, E., and Catania, C. A. (2019). A studyon labeling network hostile behavior with intelligentinteractive tools. In 2019 IEEE Symposium on Visual-ization for Cyber Security (VizSec), pages 1–10. IEEE.
Hassenzahl, M. (2010). Experience design: Technology forall the right reasons. Synthesis lectures on human-centered informatics, 3(1):1–95.
Hassenzahl, M., Burmester, M., and Koller, F.(2003). Attrakdiff: Ein fragebogen zur messung
NetVisGame: Mobile Gamified Information Visualization of Home Network Traffic Data
137
wahrgenommener hedonischer und pragmatischerqualitat. In Mensch & computer 2003, pages 187–196.Springer.
Hendrix, M., Al-Sherbaz, A., and Bloom, V. (2016). Gamebased cyber security training: are serious games suit-able for cyber security training? International Journalof Serious Games, 3(1).
Huang, D., Tory, M., Aseniero, B. A., Bartram, L., Bate-man, S., Carpendale, S., Tang, A., and Woodbury, R.(2014). Personal visualization and personal visual an-alytics. IEEE Transactions on Visualization and Com-puter Graphics, 21(3):420–433.
ISO 9241-210 (2010). Iso 9241-210: Ergonomics ofhuman-system interaction –part 210: Human-centreddesign for interactive systems.
Jayakrishnan, G. C., Sirigireddy, G. R., Vaddepalli, S., Ba-nahatti, V., Lodha, S. P., and Pandit, S. S. (2020). Pass-world: A serious game to promote password aware-ness and diversity in an enterprise. In Sixteenth Sym-posium on Usable Privacy and Security ({SOUPS}2020), pages 1–18.
Krokos, E., Rowden, A., Whitley, K., and Varshney, A.(2018). Visual analytics for root dns data. In 2018IEEE Symposium on Visualization for Cyber Security(VizSec), pages 1–8. IEEE Computer Society.
Kultima, A. (2009). Casual game design values. In Pro-ceedings of the 13th international MindTrek confer-ence: Everyday life in the ubiquitous era, pages 58–65.
Lebek, B., Uffen, J., Neumann, M., Hohler, B., and Bre-itner, M. H. (2014). Information security awarenessand behavior: a theory-based literature review. Man-agement Research Review.
Legg, P. A. (2016). Enhancing cyber situation awareness fornon-expert users using visual analytics. In 2016 Inter-national Conference On Cyber Situational Awareness,Data Analytics And Assessment (CyberSA), pages 1–8. IEEE.
Miksch, S. and Aigner, W. (2014). A matter of time: Ap-plying a data–users–tasks design triangle to visual an-alytics of time-oriented data. Computers & Graphics,38:286–290.
Ndatinya, V., Xiao, Z., Manepalli, V. R., Meng, K., andXiao, Y. (2015). Network forensics analysis usingwireshark. International Journal of Security and Net-works, 10(2):91–106.
Nealen, A., Saltsman, A., and Boxerman, E. (2011). To-wards minimalist game design. In Proceedings of the6th International Conference on Foundations of Digi-tal Games, pages 38–45.
Nthala, N. and Flechais, I. (2018). Informal support net-works: an investigation into home data security prac-tices. In Fourteenth Symposium on Usable Privacyand Security ({SOUPS} 2018), pages 63–82.
Saket, B., Simonetto, P., Kobourov, S., and Borner, K.(2014). Node, node-link, and node-link-group dia-grams: An evaluation. IEEE Transactions on Visual-ization and Computer Graphics, 20(12):2231–2240.
Schell, J. (2008). The art of game design: A book of lenses.2008. Burlington, MA: Elsevier.
Schufrin, M., Sessler, D., Reynolds, S. L., Ahmad, S.,Mertz, T., and Kohlhammer, J. (2020). Information
visualization interface on home router traffic data forlaypersons. In Proceedings of the International Con-ference on Advanced Visual Interfaces, pages 1–3.
Schufrin, M., Ulmer, A., Sessler, D., and Kohlhammer,J. (2018). Towards bridging the gap between visualcybersecurity analytics and non-experts by means ofuser experience design. In 2019 IEEE Symposium onVisualization for Cyber Security (VizSec).
Schweitzer, D. and Brown, W. (2009). Using visualizationto teach security. Journal of Computing Sciences inColleges, 24(5):143–150.
Seitz, T. and Hussmann, H. (2017). Pasdjo: quantifyingpassword strength perceptions with an online game.In Proceedings of the 29th Australian Conference onComputer-Human Interaction, pages 117–125.
Sheng, S., Magnien, B., Kumaraguru, P., Acquisti, A., Cra-nor, L. F., Hong, J., and Nunge, E. (2007). Anti-phishing phil: the design and evaluation of a game thatteaches people not to fall for phish. In Proceedings ofthe 3rd symposium on Usable privacy and security,pages 88–99.
Shiravi, H., Shiravi, A., and Ghorbani, A. A. (2011). Asurvey of visualization systems for network secu-rity. IEEE Transactions on visualization and computergraphics, 18(8):1313–1329.
Simoes, J., Redondo, R. D., and Vilas, A. F. (2013). A socialgamification framework for a k-6 learning platform.Computers in Human Behavior, 29(2):345–353.
Susi, T., Johannesson, M., and Backlund, P. (2007). Seriousgames: An overview.
Thompson, M. and Irvine, C. (2011). Active learning withthe cyberciege video game.
Tupsamudre, H., Wasnik, R., Biswas, S., Pandit, S., Vad-depalli, S., Shinde, A., Gokul, C., Banahatti, V., andLodha, S. (2018). Gap: A game for improving aware-ness about passwords. In Joint International Confer-ence on Serious Games, pages 66–78. Springer.
Ulmer, A., Schufrin, M., Lucke-Tieke, H., Kannanayikkal,C. D., and Kohlhammer, J. (2018). Towards visualcyber security analytics for the masses. In EuroVA@EuroVis, pages 55–59.
Ulmer, A., Sessler, D., and Kohlhammer, J. (2019). Net-capvis: Web-based progressive visual analytics fornetwork packet captures. In 2019 IEEE Symposiumon Visualization for Cyber Security (VizSec), pages 1–10. IEEE.
IVAPP 2022 - 13th International Conference on Information Visualization Theory and Applications
138