Ubiquitous knowledge-based framework for RFID semantic discovery in smart u-Commerce environments

Visualization for Knowledge Discovery Georges Grinstein, John C. Sieg, Jr., Stuart Smith, and Marian G. Williams University of Massachusetts at Lowell, Lowell, Massachusetts 01854
Although the fields of data visualization and automated knowledge discovery (AKD) share many goals, workers in each field have been reluctant to adopt the tools and methods of the other field. Many AKD researchers discourage the use of visualization tools because they believe that dependence on human steering will impede the develop- ment of numerical or analytical descriptions of complex data. Many visualization re- searchers are concerned that their present platforms are being pushed to the limits of their performance by the most advanced visualization techniques and are therefore unwilling to incur the perceived overhead of having a database system mediate access to the data. We argue that these attitudes are somewhat short-sighted and that the techniques of these two communities are complementary. We discuss a specific visualiza- tion system that we have developed and describe the obstacles that must be overcome in integrating it into an AKD system. 0 1992 John Wiley & Sons, Inc.
I. INTRODUCTION
Both the visualization and the automated-knowledge-discovery (AKD) communities have had some success in supporting the discovery of knowledge buried in large databases. We shall argue in this article that the techniques of these two communities are complementary and that tomorrow’s knowledge discovery (KD) systems should take advantage of general-purpose visualization components. We plead for better communication between the visualization and AKD communities. As a first step toward better communication, we shall describe the “Exvis” visualization system developed at the University of Mas- sachusetts at Lowell.’ We shall describe obstacles to integrating Exvis into an AKD system and suggest ways to overcome these obstacles.
11. OVERVIEW OF EXVIS
The human brain has enormous computational power devoted to the pro- cessing and interpretation of sensory input. The visual and auditory systems have evolved over millions of years into superb analytical machines. We have developed “Exvis”-the Exploratory Visualization System-to harness this natural computational power in the service of data exploration. The Exvis
INTERNATIONAL JOURNAL OF INTELLIGENT SYSTEMS, VOL. 7, 637-648 (1992) 0 1992 John Wiley & Sons, Inc. CCC 0884-8173/92/070637-12$04.00
63 8 GRINSTEIN ET AL.
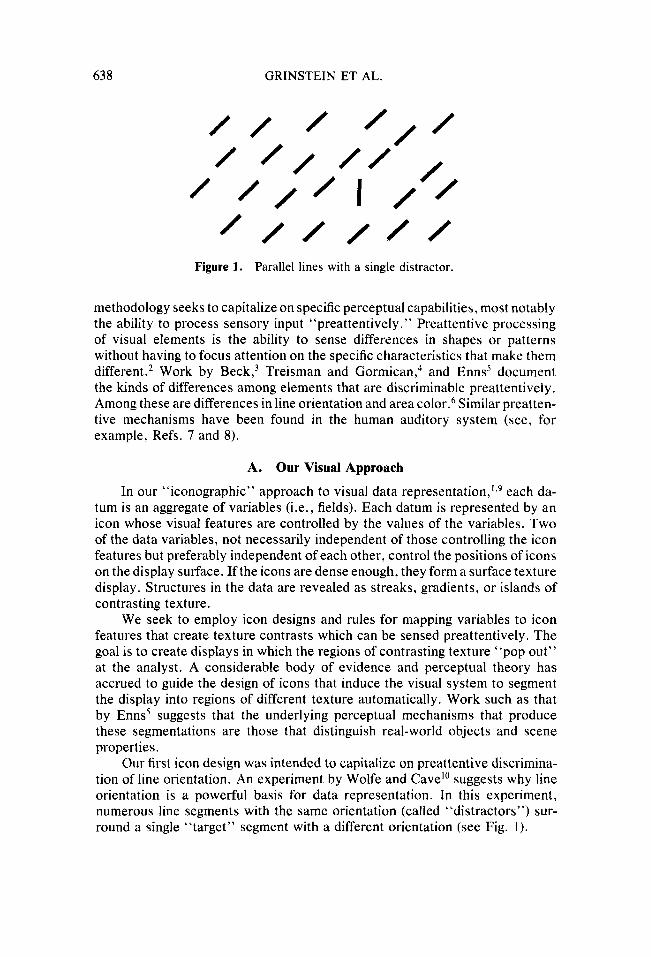
Figure 1. Parallel lines with a single distractor.
methodology seeks to capitalize on specific perceptual capabilities, most notably the ability to process sensory input “preattentively.” Preattentive processing of visual elements is the ability to sense differences in shapes or patterns without having to focus attention on the specific characteristics that make them different.’ Work by Beck,3 Treisman and G ~ r m i c a n , ~ and Enns’ document the kinds of differences among elements that are discriminable preattentively. Among these are differences in line orientation and area color.6 Similar preatten- tive mechanisms have been found in the human auditory system (see, for example, Refs. 7 and 8).
A. Our Visual Approach
In our “iconographic” approach to visual data repre~entation,’,~ each da- tum is an aggregate of variables (i.e., fields). Each datum is represented by an icon whose visual features are controlled by the values of the variables. Two of the data variables, not necessarily independent of those controlling the icon features but preferably independent of each other, control the positions of icons on the display surface. If the icons are dense enough, they form a surface texture display. Structures in the data are revealed as streaks, gradients, or islands of contrasting texture.
We seek to employ icon designs and rules for mapping variables to icon features that create texture contrasts which can be sensed preattentively. The goal is to create displays in which the regions of contrasting texture “pop out” at the analyst. A considerable body of evidence and perceptual theory has accrued to guide the design of icons that induce the visual system to segment the display into regions of different texture automatically. Work such as that by Enns’ suggests that the underlying perceptual mechanisms that produce these segmentations are those that distinguish real-world objects and scene properties.
Our first icon design was intended to capitalize on preattentive discrimina- tion of line orientation. An experiment by Wolfe and Cave’” suggests why line orientation is a powerful basis for data representation. In this experiment, numerous line segments with the same orientation (called “distractors”) sur- round a single “target” segment with a different orientation (see Fig. 1).

KNOWLEDGE DISCOVERY 639
Figure 2. Exvis stick-figure icon family.
The experimental subject's task is to find the single target. It was shown that the time to find the target is independent of the number of such distractors, implying that this feature selection is done in parallel."
Figure 2 shows a family of Exvis stick-figure icons that exploit the percep- tion of line orientation. The five-limbed stick-figure icons shown in Figure 2 are an extension of the linear icons of glyphs often used in psychophysical studies and in plots of scientific data. Variations of these icons have been used to display vector fields, flow fields, and many other forms of application information. In these icons, the angles, lengths, and intensities of the five limbs are used as icon features. This allows the mapping of up to 17 dimensions of data to each icon: (x,y) screen location plus the angle, length, and intensity of each of the five limbs.
Figure 3 uses one of the members of the stick-figure icon family (icon #12 in Fig. 2) to display the solution of a partial differential equation that describes a reaction inside an inductively coupled plasma chemical reactor. Five of the equation's 22 solution parameters are displayed simultaneously at each point in the two-dimensional display space. Five of the 22 parameters at each solution point are mapped redundantly to the limb angles and limb lengths of the icons in this picture. There are two obvious features in the picture: a V- or L-shaped feature near the upper left, where the plasma enters the picture, and another feature at the center of the right side, where the plasma flow is drawn by an electromagnet. Another, more subtle feature appears in the upper left corner of

640 GRINSTEIN ET AL.
Figure 3. Partial differential equation solution.
the picture. The slight thickening in the parallel lines formed by the icons indicates a gas jet entering the reactor.
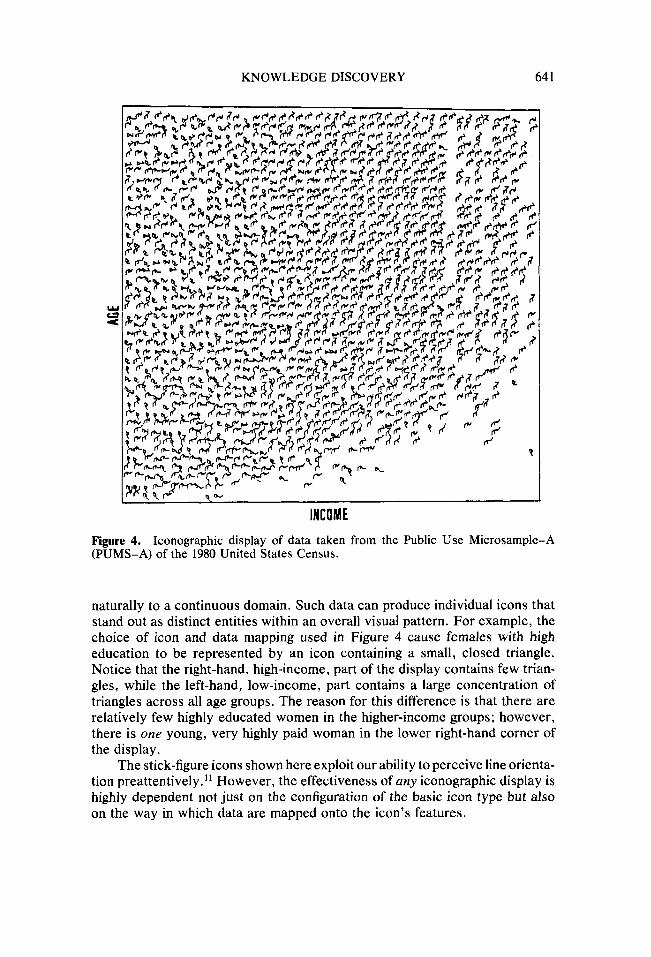
Figure 4 shows an inconographic display representing census data taken from the Public Use Microsample-A (PUMS-A) of the 1980 United States Census. This data set contains information on individuals classified as scientists, engineers, or technicians. Each icon in the picture represents one scientist, engineer, or technician. Each icon is positioned on the screen according to the person’s age and income. Age is the vertical axis, income is the horizontal axis. The data fields represented by each icon are sex, occupation, marital status, level of education, and birthplace. Data sets such as this are particularly interest- ing because some of the fields contain discrete data values, which may not map
KNOWLEDGE DISCOVERY 64 1
Figure 4. Iconographic display of data taken from the Public Use Microsample-A (PUMS-A) of the 1980 United States Census.
naturally to a continuous domain. Such data can produce individual icons that stand out as distinct entities within an overall visual pattern. For example, the choice of icon and data mapping used in Figure 4 cause females with high education to be represented by an icon containing a small, closed triangle. Notice that the right-hand, high-income, part of the display contains few trian- gles, while the left-hand, low-income, part contains a large concentration of triangles across all age groups. The reason for this difference is that there are relatively few highly educated women in the higher-income groups; however, there is one young, very highly paid woman in the lower right-hand corner of the display.
The stick-figure icons shown here exploit our ability to perceive line orienta- tion preattentively . " However, the effectiveness of any iconographic display is highly dependent not just on the configuration of the basic icon type but also on the way in which data are mapped onto the icon's features.

642 GRINSTEIN ET AL.
B. Our Auditory Approach
Auditory perception provides a perceptual domain orthogonal to the visual domain. Consequently, investigators seeking alternatives to visual display or ways to increase the dimensionality of visual data representations have tried to develop effective methods for encoding quantitative information in sound. ‘*-I7 Auditory data representation maps a data variable to a property of a sonic event. The measure on each variable of the data sample determines the value of the corresponding sound property of the event. The values of all the measures together determine the overall character of the event. For example, if the event is a simple tone, one data dimension could be mapped to pitch, another to loudness, and a third to duration. The same approach can be used with sounds more complex than tones and with bursts of band-limited noise.
A variety of auditory data displays can be created, depending on the kind of data and the kind of analysis to be conducted. Bly,I2 for example, presented data as individual tones and had her subjects classify each one; Mezrich et a/.14 presented simultaneous sequences of tones and had subjects detect correlations among the sequences; and Mansur et a/. , ’8 for example, used a continuously varying pitch to represent the dependent variable in x-y plots of mathematical functions.
Our basic approach to auditory data representation is an extension of the textured-picture approach we have been developing for data visualization. Bregman” has speculated on the existence of auditory grain analyzers capable of segregating “streams” of sound on the basis of texture differences. Bregman defines an auditory stream as the perceptual unit that represents a single happen- ing (Ref. 19, p. 10). The stream plays the same role in auditory mental experience that the object plays in visual experience. Citing the work of Warren and Verbrugge (Ref. 20, p. 121), Bregman concludes that “a granular analysis might provide a perceptually relevant description of the sounds of events that can be considered iterations of multiple small events. ” Warren and Verbrugge show that the auditory system, on the basis of texture differences, can easily distin- guish the sound of a bottle bouncing on a resilient surface from that of a bottle breaking against a hard surface. Bregman cautions that it may not be practical to use granularity statistics to create a sharp boundary between streams because the auditory system might need a temporally extended sample in order to assess the statistical properties of each granularity.
The use of sound in our present visualization environment is consistent with Bregman’s line of thinking on auditory texture. By sweeping the mouse cursor over an image in an Exvis display, users can trigger an auditory data representation consisting of multiple small and partially overlapping sonic events, such as tones or noise bursts. Among the sound attributes under data control are pitch, attack rate, decay rate, and loudness. The textural character of the sound produced can change audibly when the statistics of the data controlling the sound change. Because we use sound to support visual analysis, it is not necessary that the sounds establish a sharp boundary between regions.

KNOWLEDGE DISCOVERY 643
It is necessary only that they call attention to a boundary and to indicate its approximate location.
C. Evaluation of Integrated VisuaUAuditory Data Representation
Williams, Smith, and Pecelli2'~** conducted an experiment with an early version of the Exvis system. Subjects were asked to classify patches of visual texture created with single-limb stick-figure icons. During a brief training ses- sion, subjects were shown examples belonging to both textures to be used in the experiment. The subjects then performed the classification task twice: once using only the visual texture of the patches and a second time using the icons' auditory attributes as well. The subjects' performance in making the classifica- tion of patches was significantly better with sound than without.
D. Interactive Exploration
The computational costs of Exvis displays have impeded real-time interac- tion on even high-performance workstations. After selecting the desired display parameters a researcher must wait for the display to be updated. One recent development in the Exvis project, driven by the realization that exploratory data visualization can be truly effective only if it is interactive, is the use of a massively parallel processor, a Thinking Machines Corporation CM-2 Connec- tion Machine.23 The Connection Machine Exvis implementation provides a set of interactive controls that transform all of the icons in a display in real time. These transformations do not affect the mapping of data onto the attributes of icons. Rather, they affect the characteristics of the icons themselves, such as their base orientation. Interactive controls in the Connection Machine imple- mentation of Exvis permit the analyst to fine-tune the physical representation of the data. Being able to observe continuous change lets the analyst discover evolving segmentations. The result is that the analyst can converge on a mean- ingful physical representation of the data faster than by noninteractive means. The interactive controls have permitted Exvis researchers to discover informa- tion not discovered through noninteractive displays.
E. Color Icons
A second recent development is that color coding is being integrated with the geometric codings of Exvis. Icons (or pixels, in the degenerate case) can have data-driven hue, saturation, and lightness parameters. Moreover, colored areas within icons can overlap, forming new colors by in t e rpo la t i~n .~~ It is anticipated that increased contrast resulting from the incorporation of color coding with geometric coding will result in the increased conspicuousness of structures, and therefore will enhance the analyst's ability to classify structures.

644 GRINSTEIN ET AL.
111. WHY VISUALIZATION IS NEEDED FOR
Some knowledge-discovery researchers encourage the elimination of visu- alization tools within AKD systems simply to discourage a dependence on human capabilities. They suggest that a dependence on human steering will impede the achievement of numerical or analytical descriptions of complex data. We believe that there is little to be gained by the elimination of the human in the loop and that an increase in interactive visualization is important in AKD systems for three reasons:
KNOWLEDGE DISCOVERY
(1) Current AKD systems are primitive. Humans are still much better than machines at recognizing complex structures in noisy data. Though automated AKD tools may eventually replace human interaction in many cases, we cannot postpone until then knowledge discovery in, say, medical databases. Automatic knowl- edge discovery tools have not evolved to the point that we can afford to abandon human interaction.
(2) Visualization does help in the discovery of analytical solutions. In our experi- ence, discoveries often occur through the use of visual support tools. Most natural languages use the term see to mean detecting some pattern in perceived data, or a solution to some problem, or even a lead toward some solution. We commonly visualize a process in our minds and envision an approximation to the process. We visualize the results of the process or, in some lucky cases, the process itself, and we iterate toward discovery. Imagine studying models without drawings. Even with imprecise drawings, the human mind filters out the imper- fection and retains the essential elements and is able to generalize to more accurate and precise models.
(3) Although human oversight and participation may not guarantee that ethical and moral issues will be dealt with in data exploration and analysis, such issues may not even be considered without human participation.
As we become more proficient at developing automatic solutions to the data exploration process we will actually increase our need for visualization: the processes of discovery will surely become more complex. We feel that visualization and AKD are largely complementary approaches to the KD prob- lem and that effective KD environments must take advantage of both ap- proaches. We urge collaboration between the AKD and the visualization com- munities.
IV. INTEGRATING EXVIS INTO A KNOWLEDGE DISCOVERY SYSTEM
Exvis has not been integrated into any automated knowledge discovery system. In this section we describe obstacles to such integration and suggest how these obstacles might eventually be overcome.
A. No Common Data Model
At present there is no standard data model for visualization systems and AKD systems. The lack of a common data model implies the following obstacles to integration:

KNOWLEDGE DISCOVERY 645
0 Users are forced to understand two models rather than one. The users may also be held responsible for managing the translation of objects in one model to objects in the other. The problems of managing two models is well known to the relational database community, who continue to deal with the incompatibility of relational query languages with the programming languages in which they are often em- bedded. The system incurs an overhead to translate objects in one model to objects in the other. Indeed, we expect early implementations to be loosely integrated. That is, the communication between the AKD components and the visualization compo- nents will not support efficient processing in either.
0 Extensibility of the integrated KD system is impeded. If every new component of the KD system, for example, requires an interface to every visualization component, new components will not get written.
Though we have specified a data model for Exvis and similar visualization systems,2s this model is not one the AKD community is likely to find acceptable. One standard for data model and language that may gain acceptance is the relational model and SQL. This would be a pity, for the data we must explore often is more naturally-and efficiently-modeled by arrays, sequences, and so forth, and not by relations. A somewhat more hopeful sign is the attempts by IBM and others with influence on the SQL standardization committees to increase the modeling and computational power of SQL.26
B. Ineffective Use of Database Services
Visualization systems often-and AKD systems sometimes-make inef- fective use of database system services. It is the responsibility of the database community to figure out how to manage large amounts of sharable, persistent data. The AKD community has close links to the database community and need not be preached to about the advantages of using database systems. But much of the visualization community has avoided the perceived overhead of having a database system mediate access to the data.
AKD and visualization systems, whether or not they are integrated, will make new demands of database systems. Fortunately, the database community is giving us a new generation of more flexible systems. Unfortunately, neither the AKD nor the visualization communities has informed the database commu- nity of their special needs. We mention two of these special needs.
First, both a visualization system and an AKD system need to turn off or selectively apply database services. An AKD system often updates rules rather than data. Thus rule-recovery will probably be a more generally used service than data recovery. Similarly, users of an AKD system usually do not care about serializability with respect to data. On the other hand, an AKD system that inserts rules into a knowledge base needs consistency enforcement. The difficulty of determining when rules interfere makes rule-consistency enforce- ment an interesting problem.
Second, both a visualization system and an AKD system need to communi- cate some of the semantics upon which they are based to the database system.

646 GRINSTEIN ET AL.
We mention two database-system components that can effectively use this semantics: the buffer manager and the query evaluation system.
Effective buffer management is crucial to efficient implementation of knowledge discovery. An AKD/Visualization system working in automatic mode will repeatedly access the same data in testing hypotheses, forming clus- ters, evaluating statistical measures, and so forth. We expect that AKD re- searchers will design access methods that support iterative access to very large relations and that include effective use of buffer pools that, as in the early days of database systems, are an order of magnitude or more smaller than the database.
An AKD/Visualization system working in interaction mode will make dif- ferent demands of the database backend. The visualization system will need to communicate a small knowledge base to the database system. The buffer man- ager will use this knowledge base to make prefetch decisions. This knowledge base will include a model of the user’s focus and intentions, that can be effec- tively used to prefetch relevant data. If, for example, a database relation is mapped onto the two dimensions of a graphics display, and the use is probing along one of those dimensions, the buffer manager can substantially decrease response time by use of that knowledge.
The query evaluation system in AKD/Visualization systems will need to be much more flexible than that of conventional database systems. We expect that interpretive query optimizers, that is, ones that interleave plan generation with plan execution, will make a comeback to support AKD/Visualization environments. A “query” that invokes automatic knowledge discovery can run for many hours; a poor initial plan will be disastrous. The dynamic query plans of Graefe and Ward27 support some run-time decision-making. We expect that AKD environments will demand plans that include the ability to decide whether to reinvoke the optimizer.28
C. Lack of Representation Techniques for Discoveries Made Through Visualization
We have already addressed the communication of data between the AKD components and visualization components of an integrated system. Communi- cating knowledge is another matter. We expect that many of the AKD communi- ty’s knowledge representation techniques can easily be used by an intelligent visualization system. But what about the knowledge acquired by a human explorer using the visualization component?
We expect that new languages will have to be designed, based in part on gestures (such as “click and drag”). The language will have to support unconventional ways of communicating knowledge:
When the human explorer using the visualization component has discovered a place on the graphics display with, say, an interesting texture, he/she may circle it using the mouse to inform the KD system that there is something interesting there.

KNOWLEDGE DISCOVERY 647
The human explorer has discovered a rule, but has insufficient experience to formulate a rule in the AKD system’s rule-language. The explorer may understand that certain images displayed by the visualization system correspond to certain real-world objects. The explorer may then go through a training session to teach a neural network the correspondence.
V. CONCLUSION
We have given an example of a novel approach to the exploration of data and have advocated a strong and central participation by the user in KD systems. We emphasize the need for the database and visualization communities to explore and develop database systems with visualization support. It is time to develop environments that incorporate human perceptual capabilities at the core of this discovery process.
1 .
2.
3.
4.
5 .
6.
7.
8.
9.
10.
1 1 .
12.
13.
14.
References
G. Grinstein, R.M. Pickett, and M.G. Williams, “EXVIS: An exploratory visualiza- tion environment,” Graphics Interface ’89, London, Ontario, 1989. B. Julesz and J.R. Bergen, “Textons the fundamental elements in preattentive vision and perception of texture,” Bell System Technical Journal, 62(6), 1619-1645 (1983). J. Beck, “Textural segmentation,” In Organization and Representation in Percep- tion, J. Beck (Ed.), Erlbaum, Hillsdale, NJ, pp. 285-317. A. Treisman and S. Gormican, “Feature analysis in early vision: Evidence from search asymmetries,” Psychological Review, 95, 15-48 (1988). J.T. Enns, “Three-dimensional features that pop out in visual search,” In Visual Search, D. Brogan (Ed.), Taylor and Francis, London, 1990a, pp. 37-45. A. Treisman, “Features and objects in visual processing,” Scientijk American, 255,
A. Bregman and A. Rudnicky, “Auditory segregation: Stream or streams?” Journal 106-115 (1986).
of Experimental Psychology: Human Perception and Performance, 1, 263-267, (1975). R.M. Warren, ‘Auditory Perception: A New Synthesis. ” Pergamon, New York, 1982. R.M. Pickett, “Visual analyses of texture in the detection and recognition of ob- jects,’’ In Picture Processing and Psycho-Pictorics, B.S. Lipkin and A. Rosenfeld, Academic Press, New York, 1970. J.M. Wolfe and K.R. Cave, “Deploying visual attention: The guided search model,” In AI and the Eye, A. Blake and T. Troscianko (Eds.), Wiley, Chichester, West Sussex, England, 1990. R.M. Pickett and G.G. Grinstein, “Iconographic displays for visualizing multidimen- sional data,” Proceedings of the 1988 IEEE Conference on Systems, Man and Cybernetics, Beijing and Shenyang, People’s Republic of China, 1988. S.A. Bly, “Presenting information in sound,” Proceedings of the CHI ’82 Confer- ence on Human Factors in Computer Systems, 1982, pp. 371-375. D. Lunney and R.C. Morrison, “Auditory presentation of experimental data,” Proceedings of the SPIEISPSE Conference on Electronic Imaging, 1259, 140-146 (1990). J . J . Mezrich, S. Frysinger, and R. Slivjanovski, “Dynamic representation of multi- variate time series data,” Journal of the American Statistical Association, 79(385), 34-40 (1 984).

648 GRINSTEIN ET AL.
15. C. Scaletti, “Using sound to extract meaning from complex data,” Proceedings of the SPIEISPSE Conference on Electronic Imaging, 1459, 207-219 (1991).
16. S. Smith, R.D. Bergeron, and G. Grinstein, “Stereophonic and surface sound genera- tion for exploratory data analysis,” Proceedings of CHI ’90, Seattle, WA, 1990.
17. E.S. Yeung, “Pattern recognition by audio representation of multivariate analytical data,” Analytical Chemistry, (52)7, 1120-1123 (1980).
18. D.L. Mansur, M.M. Blattner, and K.I. Joy, “Sound graphs: A numerical data analysis method for the blind,” Journal of Medical Systems, 9(3), 163-174 (1985).
19. A.S. Bregman, Auditory Scene Analysis, MIT Press, Cambridge, MA, 1990. 20. W.H. Warren and R.R. Verbrugge, “Auditory perception of bouncing and breaking
events: A case study in ecological acoustics,” Journal of Experimental Psychology,
21. M.G. Williams, S. Smith, and G. Pecelli, “Experimentally driven visual language design: Texture perception experiments for inconographic displays,” Proceedings of the IEEE 1989 Visual Languages Workshop, Rome, Italy, pp. 62-67.
22. M.G. Williams, S. Smith, and G . Percelli, “Computer-human interface issues in the design of an intelligent workstation for scientific visualization,” ACM SICCHI Bulletin, (21)4, 44-49 (1990).
23. S. Smith, G. Grinstein, and R.D. Bergeron, “Interactive data exploration with a supercomputer,” Proceedings of Visualization ’91, San Diego, CA, 1991.
24. H. Levkowitz, “Color icons: Merging color and texture perception for integrated visualization of multiple parameters,” Proceedings of ACM Visualization ’91, San Diego, CA, October 1991, pp. 164-170.
25. R.D. Bergeron and G.G. Grinstein, “A reference model for the visualization of multi-dimensional data,” Eurographics 1989, 393-399 (1989).
26. L.M. Haas, J.C. Freytag, G.M. Lohman, and H. Pirahesh, “Extensible query processing in Starburst,” ACM SIGMOD International Conference on the Manage- ment of Data, Portland, OR, 1989, pp. 377-388.
27. G. Graefe and K. Ward, “Dynamic query evaluation plans,” ACM SIGMOD Inter- national Conference on the Management ofData , Portland, OR, 1989, pp. 358-366.
28. E. Sciore and J.C. Sieg, “Modular rule-based query optimization,” unpublished manuscript, 1991.
(10)5, 704-712.
Copyright © 2022 FDOKUMEN