Direct visualization of volume data
9
Direct Visualization of Volume Data Terry S. Yoo, Ulrich Neumann, Henry Fuchs, Stephen M. Pizer, Tim Cullip, John Rhoades, and Ross Whitaker University of North Carolina at Chapel Hill A combinatioir of segmeirtation tools and fast voliriizc semlevess provides an intcsactiuc exp 1 o sa t ion cii v iron mcii t fo Y U 0 lir mc u isu a 1 i za t ioiz .
Transcript of Direct visualization of volume data

Direct Visualization of Volume Data Terry S. Yoo, Ulrich Neumann, Henry Fuchs, Stephen M. Pizer,
Tim Cullip, John Rhoades, and Ross Whitaker University of North Carolina at Chapel Hill
A combinatioir of segmeirtation tools and fast voliriizc semlevess provides an intcsactiuc exp 1 o sa t ion cii v iron mcii t fo Y U 0 lir mc u isu a 1 i za t ioiz .

double-buffered
Figure 1. Pixel-Planes 5 system components.
Interactive classification We distinguish two early stages in volume visualization as
segnzenttrfion and clussific~irion. By segincntation we mean the division of a data set into often nonoverlapping subvol- umes that have somc cohesive meaning unto themselves. Classification. on the other hand. is the process of labeling the various portions of an image by type. In many cases. data must be segmented into cohesive regions before labeling. If classification happens at the voxel level with each voxel la- beled by type (in the case of medical data. by tissue type). the data has been segmented down to the individual voxels. the smallest cohesive regions possible.
Segmentation and classification a re often performed to- gether in a preprocessing stage. but i t is possible to do them separately in different stages. Our system provides a power- ful segmentation preprocessing stage and then allows the user to control classification interactively while viewing the data with a volume renderer. By giving the user classification and labeling control at rendering time. we provide a flexible means of specifying the visualization.
In addition to the distinction between segmentation and classification. we distinguish two types of classification: ,s>v- tactic and sermintic. Syntactic classification uses only the in- fo rma t ion con ta ined within the da t a set t o pe r fo rm the segment a t i on o r c 1 assi f i e a t i o n . Av a i 1 a b I e i t i io rm a t i o t i i n - cludes voxel intensity. local gradient information. and con- nectivity.
Local properties of the data often do not rcveal informa- tion regarding morphological features within the imagc. and geometric tools are sometimes unwieldy. Therefore. it is use-
ful to apply some semantic groupings of a given data set to isolate features of form. Se- lecting regions on a voxel-by-voxel basis is not practical for defining features of 3 D data. so our system gathers voxels of similar na- ture into primitive collcctions that then be- c o m e t h e basis of t h e shape -d r iven classification. The user performs classifica- tion in a second pass by collecting these I-e- gion primitives into coherent volumes that encompass features in the data set. The way these primitive groupings relate to global structure is most effectively dcterniined by a knowledgeable usei-. who requires ;I graphi- cal language of scnsiblc fundamental regions and a means to interact with them.
We contend that effective volume visual- ization requircs this level of control. Control of the labeling should rest in thc hands of ex- pert users who apply their knowledge of the information in the visualiration. Effective vi- sualization is possible only when the usci- who explores thc data controls the view.
D isp I ay Researchers exploring advanced graphics architectures at
thc University of North Carolina a t Chapel Hill provided us with a platform for our research. Completed in the summer of 1990. Pixel-Planes 5 ' is a heterogeneous graphics architec- ture using both MIMD and SIMD parallelism.
As Figure 1 shows, the Pixel-Planes 5 system bas multiple i8ihO-based Graphics Processors and multiple S I M D pixcl- processor arrays called Renderers. Each Renderer is a 128 x 128 array of pixel processors capable of executing a general- purpose instruction set. Graphics Processors send Renderers operation-code strcams that arc executed in SIMD fashion. Renderers also have a quadratic expression evaluator that can be configured to occupy any screen position. Special op- eration codes evaluate the function
in thc Rendei-er for each pixel's unique .Y. 1, location. The co- efficients A through F arc part of thc instruction stream trom the graphics processors.
The Graphics Processors. 1he Renderers. a frame buffer. and a workstation host communicate over an eight-channel one-dimensional ring network whose aggregate bandwidth is 5.12 Gbits per second. Renderers supplement their working memory with a secondary memory or backing store that may contain large quantit ies of user data as well a s completed rendered images. Renderci-s also have backing store ports that allow data inovement in and out of secondary memorv under Graphics Procesaor control.
64 IEEE ('omputcr (;raphic\ Kr Applications

Volume renderers A fundamental operation in a n y volume renderer is the re-
construction of ;I continuous function f r o m discrete siiinplcs. T h e elficiency with Lvhich this is done h a s 21 direct impact on
render ing speed. One aspect o f o u r cur ren t research is ;I coinparati \e ;inalysis of the speed and quality of multipass shear. splatting. and trilinear reconstruction techniques.
1'21 r ;I I 1 c I ;I pp i-o;i ch cs t o \'o I u 111 e re ii de r i n g ii re coni pl i ca t e d by the fact t h a t data d is t r ibu ted throughout t he system's memory \p;iecs must he coitihiiied in depth order during iin- age renderin!:. This partial \or t ing o f potentially large \ 0 1 - urnes of data can t a x the communic;itions network. resulting i 11 p o o r pel- form ;I n ce , A 11 i mpcirt ;i i i I e I c 111 c n t i 11 mi 11 i ni izi n g the expense of this operation is the data distribution itself.
'l'his section describes t h e evolution ot ;I parallel alporithm both fast update rates itnd
l h e final algorithm is the culniination o f forts. Each inci-emcntccl cffort resulted i n :I product whose pel-formance i n some \\:I> fell sho r t o l t h e pe l - formance needcd tor t h e vi\Lialiration describecl in this ai-ticlc.
VRN
V R N . o n e ol the first applic:itionx to r u n on Pixel-Planes 5 . is a n iriiplementation of multi\aluccl cl;issified \ olume rem clercrs. I t s unique aspect i \ its exploitation of t h e Render- ers ' S l M D pal-allelism to pet-form t h e clas\i t ication a n d Phong \hading o t the \ o\el.;. The algorithm distribute\ data among t h e Kendcrcrs' hacking store inemor!. T h e Render- ers perform elernentar! \hading and s! ntactic classification. and tranmiit shaded b locks o f da t a t o t h c <;rapliic\ Proces- sor\ f o r ray casting on ;I dcniand h;isi\. ,\ designated master proce\\oi- ci-catcs ;I tilock hit list that allo\\s thc \ending ot shatled blocks t o all the (;i-aphics Proccsvirs t h a t handle rays passing through that hlock--\vIiethei- 01- not the pi-occssors h;ive ;ilrcnd! requested them. V R N incorpora te \ \
techniqucs4 to speed the ray ca\ting on the <iraphic\ f'roces- WI-S: alpha c ti toll. adapt i \a inpli rig. ;I nd i iicrciiieii t a l oc-
t rees.
, 4 1 1 undesirable aspect o f this appi-oath i s the latcnc! i n ;I
Graphics Proce\\or's access t o the d a t a needed fo r ii r a y . M~icti of the data set must be transmittcd o \ e r the communi- cations net v, 01-k e\'cr) frame . L ~ ) x l i m ha I ;i l ice among ( i riipli- ics Proccssoi-s is significant and difficult to col-rect. These shor tcomings (among others ) limit t h e \peed o f t h i \ a p
proiich to ahout three l r : i i ne i per second for ;I 12s x 12s x 1 3 d a t a set using 20 (irapliics I'roccssor\ a n c l eight Render- ers.
' i
VOL, Splat, and DIVO Researcher\ a t (IN(. made several incremental s t e p t o -
nard impro\ed volume rendering on our multiconiputcr ;II--
chi t ec t u IC . '1.11 c ctto r t cc n t e re c l :I r o U 11 cl o\ e I-coni i 11 g t tic bottlenecks i n the V R N algoi-ithm I?! ra! casting i n t o uii- shacled \oluiiies and perl'orming shading at ircnclcring t i m e .
Figure 2. Volume rendering with Splat.
T h e voluine renderers kno\ \n as VOL. Splat . and D I V O d e n i o n ~ t r a t e ad\,ances in aceelcrated shading. reconstruction o f ininges from ;I minimal number of samples. and I-ay casting in a distributed data environment.
V O L cii-cum\ ented t h e clatii distribution pruhleni h y clupl i - cating the full data set a t each processing node and attacked t ii st s h ad i ng . T h i s program m i 11 e I f o r t de itio 11 st rated t hc c t ti - ciency of l o o k u p table techniques to specd shading opera- t ion\ . V O L pe r fo rm\ s! n tac t ic classification a n d Phoiig shadinp by using lookup tahlc\ indexed h! the I;IM data. I t s
gradient. and gradient magnitudc.
reconstructioii from \o lume data . I t i \ basecl 011 splatting. 21
feed-for\\ ard mechanism riither t h a n ;I r;i>-castiiig approach to \ ,oIumc rt.ndei-ing.' Ncurnann constructed ;I paraIIeI imple- menta t ion of \p la t t ing on Pixcl-Planes 5 i n t he \priiig o f IO9 I ." This volumc renderer uses t h e Rendei-er quadratic ex- pression cviiluator t o ctficiently generate the reconstruction filter kernels riectled for splatting. Figure 2 she\+ s e x a m p l e output from Splat. This approach demonstrated a n ellicient scrccii interpolation method later used in I I IVO and suhse- cjrrent volume renclcrers.
It data is di.;trihutecl and ra! casting is parallcli/ed ainong separate <ii-aphic\ Processors. the s y s t e m must r e c m s t i - u c t thc ra!' st:gment\ i n t o cohercnt rays. DIVO was a n atrcmpt t (> ;iddress t h e issues surrounding data distribution and r a y rcconstriictioii. 1 1 introduced the idea of pipclinins by assign- ing ray casting t o one proup of Graphics Processor\ ;ili<l a\-
s ign i I I g coni 130s i t i iig i i n cl se r e c 11 I n t e r p o I ii 1 io 11 to ;I 11 ot h c r . I ) I V O d is t r ibu tes the d a t a hlocks a m o n g the ra!-ca\ting
Splat generated techniques f o r 1x11-allcl screen s p
(i I-;lphlcs Proces.;ol-s.

~~
Figure 3. I hrec different intensity cla\$ification\ of a CT wan: skin wrface (a), musculature (b), bone (c).
I n DIVO. ;I \uhset of the Graphics Proces\ors casts ra!s on a regular screen grid through the Graphic\ Processot-s' data blocks. Each (iraphics Processor computes ;in <RGL3u> t u - ple for the ra! fraytnents through its data block. T h e tuple arrays are written t o the Renderers' data memory. The Ken- dercrs composite the many fragments and distribute the final ray color\ to the interpolntion Graphics Processors. A binary space-parti t ion t ree de te rmines the pi-oper o r d e r for c o n - positing. l ' h e interpolation Graphics Proces\ors use e i ther software o r ;I modified \platting technique :rnd the Render- ers t o do \crcen interpolation, T h e advant;igcs o f u\ing the Renderet-s are that this approach is actually faster than bilin- ear intct-polation o n the Graphics Processors. :incl higher or- d e r fi l ter k e r n e l s can be used. p r o d u c i n g le \ \ o l fcns ive artifacts for the coarsely sampled images generated while the u w r navigate\ through the data w t . Kinetic depth ixrception is much hetter u\ing splatting because of the le\\ objection- ah1 e ar t i facts.
DIVO accommodates large data \e t \ (greater than 256 x 256 x 256). The sy\tem performs \+ell. except that the ray- casting Graphic.; Processors are n o t e\ enly loaded tiecause t h e d a t a cubes h a \ c varying a m o u n t \ of n o n ~ c ~ r o data in them.
VVEVOL The VVEVOI . renderer is t h e culmination of the ideas
a n d techniques deve loped in the fou r earlier approaches . VVEVOL. uses the lookup table method tor syntactic classi- f i c ; ~ t ion a t i d Ph o 11 g shading. I t pe 1-10 I' ins progre ssi \. c re t i ne - nicnt from ii coarse density o f one Ira) per S x S screen pisels t o ii final density of one ray per pisel. O n e set of Graphics Processors supports pipelined ray casting. and another sup- p o r t s c o m p o si t i n g ;in cl i n t e r p o I ;I t i o n . .I'll e coin po si t in s Graphics Proce\sors assemble r a y fraymcnts into 21 iinal I-ay color. Finally. the Renderers tran\l;itc the t-a!..; into splat kcr- tiel4 using the Kenderer quadt-atic expression c \ a l u n t o r \ to
ics Processor within a group has the same slab subwt o f thc whole volume. thus allowing the system t o assign rows o f rays t o Graphics Proccssot-s o n a demand basis. Within a group. therefore. the Graphics Processor loads are bal;inced. T h e imbalance be tween groups is typically small because u s u d l y there are only a f c a gt-oups. Memory a n d da ta set \i7c dictate the number o f group\.
V V E V O L can render shaded images from 128 x 12s x 56 Lolume data a t 20 frames pet- second. and 192 x 192 x 12s \ olutne data a t 1 1 frames pet- \econd. Semantically selected regions specified by the uset- are rendered 21s sut-face\ within t tie voI unic . '. '
T h e evolution o f volume renderers o n Pixel-Planes 5 has generated nem thoughts about the trade-offs made in \am- pling and image ireconstruction. a\ \vel1 21s the sortiny and clis- tribution of w l u m e data throughout ;I parallel architecture. W e have analyzed the costs of communication and the i n - portance of load balancing in ;I generic M l M D architecture with local memory a t each computing node. Schroder and Salem. i n their discussion of memory motion o n the C'onnec- tion machine.s eniphasi7e that these arc concerns throughout all para1 le I arc ti i t ec t urcs ;I t i d me r i t furt h e r i n ves t iga t i on .
~~
Classification Irc h h ;I n d les cl assi fica t i o n both s y n t ac t i ca 1 I y ;I n d
semantically. Many volume renderers are equippcd with gra- die n t mag nit ude ;I I id i n t e nsi t y mag n i t ude e I assi fi c;i t i o n t 001s that u l l o u the user t o select and display various data set ele- ments t h a t have consistent properties. TWO of the volume renderers described in the previous section allou alternate data input for connection with \emantic visualiation inter- faces. adding user-supervised semantic classification t o their capabilities.
Syntactic classification: One pass pe 1- form pa ral le I sc ree t i i t i t e rpol i i t io 11. We implement syntactic classification in t w o forms. In the
first. i i wries of linear ( o r other parametric) matching func- tions let\ the user m a p inten\it!, values to display parameters. Gradient mapping is widely used in ~ L I I - systems: we rcfet- t o this class of methods ;is ramp classification. The second type o f classification i \ purely geometrical and involves i n its s i m
I t E E <'ompuicr (irapliic\ & Appiicaiions
Dynamic load balancing o f the ray-castin? Ciraphics Pro- 'ors i \ accompli\hed by dividing them into se\~ei-:il gt-otips.
T h e data \et is divided among groups ;IS approximately eclual slabs. Each group of Graphics Processors is responsible for a
ful l scrcen of r a y cast thr-ough the y r o u p ' ~ \lab. Each (;t-apti-
hh

Figure 4. Gwnietric wulpting a4 c la4 f i - ration.
Figure 5. Two conceptualiiation4 of' ;I 21) irnagr.
117

shows a 2D image with variable intensity at each pixel. I f we consider the image as a surface of variable height (shown on the r ight) . ra ther than a plane with variablc intensity (as shown on the left). we see the image as an intensity mountain range. with peaks, ridges. valleys. and saddle-shaped gaps di- viding the ranges of peaks.
I n previous research with 2D images. we generated these region hierarchies using one of many techniques." These methods characterize a 2D image as an intensity surface and define regions based on the geometric nature of the ridges and valleys in that surface. In our current work we extend these ideas for segmentation to three dimensions. We can treat a volume image as a _?-manifold i n 4-space. and analyze ridges and valleys in the 3-manifold.
Reverse-gravity watershed techniques Consider a (/-dimensional image as a function I : R" 3 K .
say /(.\-). where .Y E R". Let /1.I be the set of critical paints >'
for which I ( y ) is a relative maximum. Given J' E M . the re- wrsc-grnviiy ivtrfershrtl corresponding to y is the set of points xi, E R such that there is a path of steepest ascent from (.riI3 I(.\-,,)) to (y. I (y) j along the graph of I . Intuitively. if we place a droplet of water on the intensity surface and allou. i t t o flow against gravity. then the droplet will follow a steepest ascent path to a local peak on the surface. A concise mathe- matical description for such a region is the following: A point xil i s in the reverse-gravity Watershed of ?' if there is a 7' > 0 such that the solution s ( r ) to the differential equation
satisfies x ( 7 J = y. Here V is the gradient operator and I1 I1 de- notes the length of a vector. The right-hand side of the differ- ential equation is the unit gradient vector for I . which points in the direction of steepest ascent.
Sometimes the following hierarchy-generation technique is called the prtrk-,f/ow ~ i e f l i o d . We can partition the domain for I into reverse-gravity watersheds a5 a method of segmen- tation. A critical point yielding a relatiLC minimum is arbi- trarily assigned to a watershed on which it borders. Given this collection of primitive regions. we construct a hierarchy from it. The method we use is based on the concepts of blur- ring and scale space. T h e original image is blurred via a Gaussian kernel of standard deviation .s. called a h c d e . The blurred image ./(x% s ) is a solution to the partial differential equation
r lJ( . \ - .S) 7
= sV-/(X.s). s > 0 rls
with initial data J ( s . 0) = I(.\-). The operator V' ii; the Lapla- cian. As scale increases. the relative maxima of .I(.\-. 5 ) are ann ih - lated. In fact. at the limit. a s scale becomes infinite. the im-
68
aye becomes constant . Annihi la t ion occurs when two o r more relative maxima merge into a single such point. In the region hierarchy. the watersheds associated with merging rel- ative maxima are linked as siblings of a common parent. As scale increases. more mergings occur and more tree links are set. When the blurred image is finally constant. the final par- ent nodes of the hierarchy are linked t o a single root.
Ridge-flow techniques We are developing a more sophisticated hierarchy-genera-
tion technique called the rid,ye-fk)it, n i d i o t f . Instead of iden- tifying regions associated with relative maxima, we construct
d on the ridges of the intensity surface. For the intensity function I(.\-). .\- E R". we define ridge poirz is to be those points xiI such that the curvature of the level set de- fined by /(.\-) = /(.q,j has a relative maximum at xiI.
I t is difficult to work with the level sets of I . so i n the im- plementation we have a measure of curvature at a point .Y
without reference to level sets. The measure is
where 0 is the standard tensor product between vectors. The tensor product yields a matrix. and C(.\-) is the trace (sum of diagonal elements) of the matrix. We threshold this curva- ture measure to get a candidate set of ridge points. which i n turn we thin to the appropriate size using methods of mathe- matical morphology.
Each connected component of the ridge structure for the intensity surface is either an isolated point or a continuum of points that we can partition into curvilinear segments. Each such segment has an associated reverse-gravity watershed re- gion. just as before. I n this case. however, paths of steepest ascent are traversed until a ridge point is encountered. We also obtain some finer segmentat ions by par t i t ioning the ridges at points where the intensity surface has a local mini- mum along the direction of the ridge.
The hierarchy-generation technique we use for this seg- mentation r e1 i e s o n identifying ridge - f l a n k and ridge - ri dge relationships. If a ridge lies on the flank of a larger ridge. then we create B parent-child link from the region of the large ridge to the region of the small ridge. I f three or more ridges meet at a single junction. then we create the hierarchy links on the basis of collinearity of the joined ridges. For ex- ample. if three ridges are joined. we identify the two ridges that are nearly collinear (while traversing the ridges) as sib- lings. We consider their parent to be a sibling of the remain- ing ridge. The resultinp hierarchy will be a forest of trees.
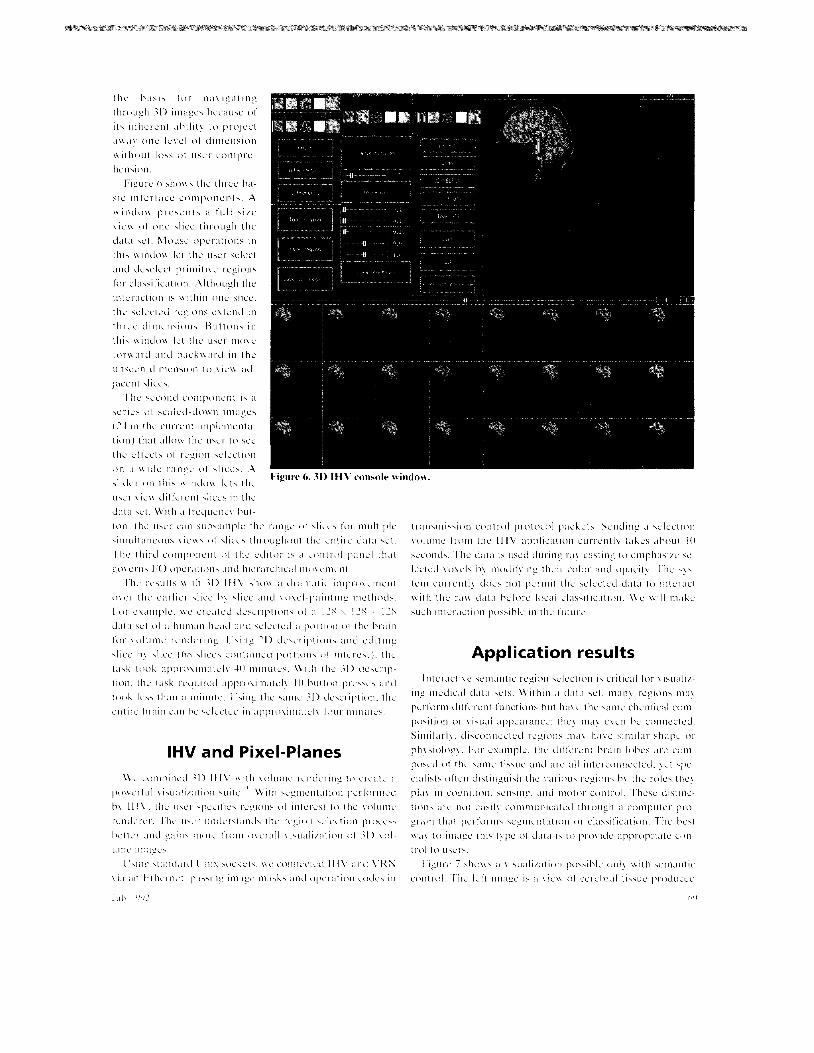
Navigating the hierarchy Our system lets users manipulate the regions of an image
hierarchy. The 3 D interactive hierarchy viewer (3D IHV) permits mouse-based interactions and provides a view of the multiple slices of the data set. We chose a slice paradigm as
IEEE ( 'omputer Graphic\ & Applications
IHV and Pixel-Planes
Conclusions
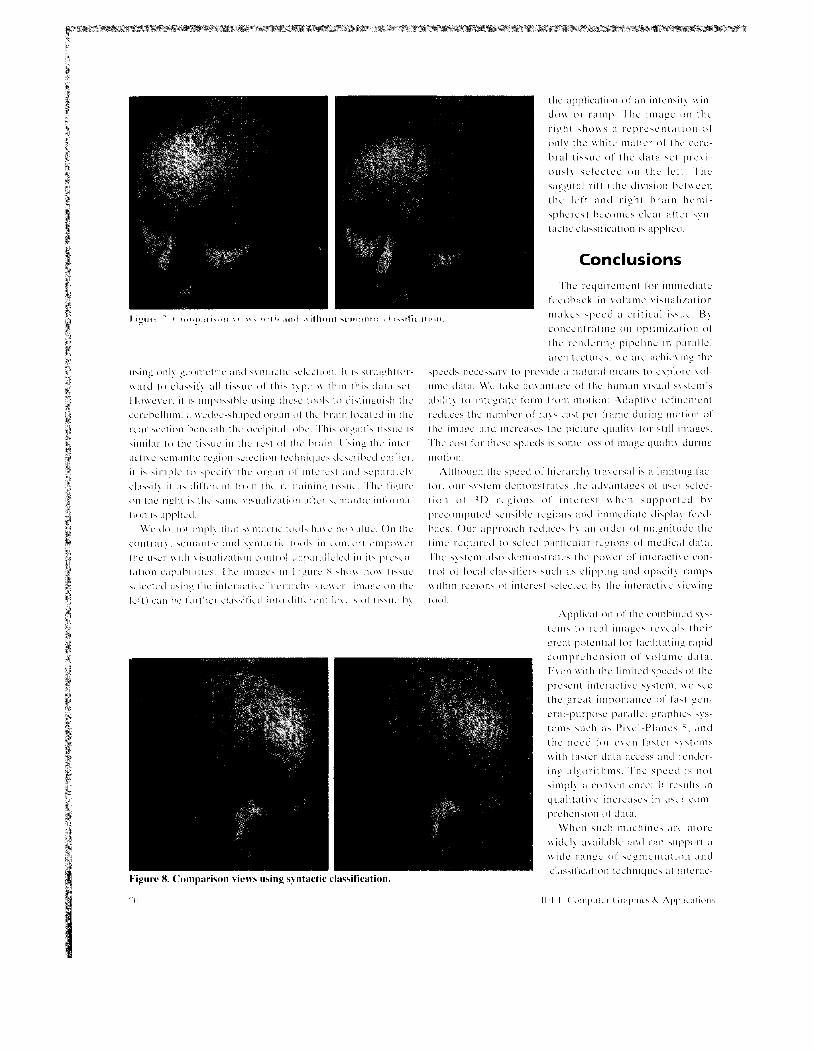
Figure 8. ('omparison Fiews uGng s? ntactic I clahsitication.

tive rates of up to 30 frames per second, volume visualization will be a much more powerful approach. When interactive semantic region definition with volume visualization can be achieved in real time on affordable platforms, we think it will
U be the standard means for viewing 3 D data.
Acknowledgments We thank Bill Oliver and Julian Rosenman for their ex-
pert advice and the physician’s point of view. We are also in- debted t o Jeff But terworth, Marc Levoy, Qin Fang, Dave Eberly, and John Poulton for both their input and the signifi- cant contribution that their research represents.
This research has been funded in part by D A R P A ISTO contract 7510, NSF grant MIP-9000894, NIH grant no. PO1 CA47982, NSF cooperat ive agreement ASC-8920219, and Vistanet cooperat ive agreement NCR-8919038 ( D A R P A , NSF, GTE Labs, Bell South, CNRI) .
1.
2.
3.
4.
5.
6.
I.
8.
9.
10.
References H. Fuchs et al.. “Pixel-Planes 5: A Heterogeneous Multiprocessor Graphics System Using Processor-Enhanced Memories,” Computer Graphics (Proc. Siggraph), Vol. 23, No. 3, July 1989, pp. 79-88. R. Drebin. L. Carpenter. and P. Hanrahan, “Volume Rendering,” Compi t e r Graphics (Proc. Siggraph), Vol. 22. No. 4, Aug. 1988, pp. 65-74. M. Levoy. “Display of Surfaces from Volume Data,” IEEE C G & A , Vol. 8, No. 3, May 1988, pp. 29-37. M. Levoy. ”Efficient Ray Tracing of Volume Data,“ A C M Trans. Graphics, Vol. 9, No. 3, July 1990, pp. 245-261. L. Westover. Splatring: A Partrllrl Feed-Forward Voliime Rendering Algori thm, doctoral dissertation (also Dept. of Computer Science Tech. Report TR91-029). Univ. of North Carolina. Chapel Hill, N.C., 1991. U. Neumann, ”Interactive Volume Rendering on a Multicomputer,” Proc. 1992 Symp. Interactive 30 Graphics, Cambridge, Mass., pp. 95- 100. W. Lorensen and H. Cline. “Marching Cubes: A High Resolution 3D Surface Reconstruction Algorithm,” Computer Grupliics (Proc. Sig- graph), Vol. 21, No. 4. July 1987, pp. 163-169. P. Schroder and J. Salem, “Fast Rotation of Volume Data on Data Parallel Architectures,” Proc. Visualization 91, IEEE CS Prcss, Los Alamitos, Calif., 1991. pp. 3-57. S. Pizer, T. Cullip, and R. Fredericksen, “Toward lnteractivc Object Definition in 3D Scalar Images,” 30 Imaging in Medicine, NATO AS1 Series F, Vol. 60, Springer-Verlag. Berlin. 1990, pp. 83-105. T. Yo0 et al., “Achieving Direct Volume Visualization with Interac- tive Semantic Region Selection,” Proc. Visiruliiution 91, IEEE CS Press. Los Alamitos, Calif., 1991, pp. 58-67.
Terry S. Yo0 is a doctoral student in computer science at the University of North Carolina at Chapel Hill, where his research interests are in medical image processing. He worked for BBN Laboratories, AT&T Technologies, and MCNC before beginning the PhD program.
Yo0 received his BA in biology from Harvard University in 1985 and his MS in computer sci- ence from the University of North Carolina in 1990. He is a site coordinator for the NSF Science
and Technology Center for Computer Graphics and Scientific Visual- ization.
July 1992
Ulrich Neumann is a doctoral studcnt in com- puter science at the University of North Carolina. His research interests include computer graphics, image processing, and parallel systems. H e worked and consulted in industry for nine years before enrolling at the University of North Car- olina in 1988.
Neumann received his BSEE and MSEE from the State University of New York at Buffalo in 1977 and 1979 He is a member of the ACM and IEEE Henry Fuchs is Federico GiI professor of com- puter science and an adjunct professor of radia- tion oncology at the University of North Carolina He is project leader for several reaearch groups in high-performance graphics hardware, 3D medical imaging, and head-mounted display and virtual environments
Fuchs received a BA in information and com- puter science from the University of California at Santa Cruz in 1970 and a PhD in computer sci-
ence from the University of Utah in 1975 He recently received the 1992 NCGA Academic Award
Stephen Pier is Kenan professor of computer sci- ence and adjunct professor, radiation oncology, radiology, and biomedical engineering at the Uni- versity of North Carolina He heads the multide- partmental Medical Image Display Research Group His research interests include human and computer vision, interactive 3D graphics, and contrast enhancement
Pizer received a BA in applied mathematics from Brown University in 1963 and an MA and
PhD in computer sciencc from Harvard University in 1964 and 1967, respectively He is an associate editor of IEEE Transactions on Medi- cal Imaging and a senior member of the IEEE
Timothy J. Cullip works in the Radiation Oncol- ogy Department of University of North Carolina Hospitals. His research interests include interac- tive rendering of dynamic volume data and real- time radiation dose computation.
Cullip received his BS in mathematics and MS in radiological physics from San Diego State Uni- versity in 1979 and 1981. He received his MS in computer science from the University of Central Florida in 1986. John S. Rhoades is a doctoral student in com- puter science at the University of North Carolina. His research interests include volume-rendering algorithms, texture algorithms, and modeling al- gorithms for curved surfaces. H e worked at the NASA Johnson Space Center on postflight data reduction for the space shuttle and in the Mission Planning and Analysis graphics laboratory before becoming a full-time graduate student.
Rhoades received hia BS in mathematics from Rice University in 1969 and his MA in mathemat- ics from thc University of Houston in 1976 Ross Whitaker is a doctoral studcnt in the Com- puter Science Department at the University of North Carolina He I\ currently working on tech- niques for image segmentation that use nonlinear diffusion He spent two years as a management consultant at the Boston Consulting group before enrolling in the graduate program at the Univer- sity of North Carolina
Whitaker reccivcd a BS in electrical engineer- ing summa cum laudc from Princeton University in 1986
The authors can be reached at the Department of Computer Sci- ence. llniversity of North Carolina, Chapel Hill. NC 27599-317s
71