Rethinking Map Legends with Visualization
10
Rethinking Map Legends with Visualization Jason Dykes, Jo Wood, Member, IEEE, and Aidan Slingsby Fig. 1. The Map is the Legend – Map Becomes Legend (Becomes Map...). Relationships between map and legend are explored in Prototype 1 with animated transitions between three ordered layouts: legend (1D categorical, left ), map (2D geospatial, center ) and mapped legend (2D geospatial, right ). c Crown Copyright/database right 2010. An Ordnance Survey/EDINA supplied service. Abstract—This design paper presents new guidance for creating map legends in a dynamic environment. Our contribution is a set of guidelines for legend design in a visualization context and a series of illustrative themes through which they may be expressed. These are demonstrated in an applications context through interactive software prototypes. The guidelines are derived from cartographic literature and in liaison with EDINA who provide digital mapping services for UK tertiary education. They enhance approaches to legend design that have evolved for static media with visualization by considering: selection, layout, symbols, position, dynamism and design and process. Broad visualization legend themes include: The Ground Truth Legend, The Legend as Statistical Graphic and The Map is the Legend. Together, these concepts enable us to augment legends with dynamic properties that address specific needs, rethink their nature and role and contribute to a wider re-evaluation of maps as artifacts of usage rather than statements of fact. EDINA has acquired funding to enhance their clients with visualization legends that use these concepts as a consequence of this work. The guidance applies to the design of a wide range of legends and keys used in cartography and information visualization. Index Terms—Cartography, design, Digimap service, legend, online web mapping, visualization. 1 I NTRODUCTION Information visualization is concerned with spatial mappings of data that are not “inherently spatial” [29]. These should be “cognitively useful” when applied to well-defined tasks in combination with dy- namic and interactive techniques that support a process of data ex- ploration [29]. Yet the degree to which data, or the spatial mappings derived from them to amplify cognition, are “inherently spatial” is far from unequivocal. We explore this uncertainty to enhance map leg- ends specifically and spatial information visualization more generally. All cartographic projections transform data about positions on the Earth’s surface to a plane, resulting in the loss of important character- istics of space [54]. Some emphasize the aspatial aspects of data at the expense of geospatial properties for good reason [16, 56]. Equally, geospatial orderings in 1D (e.g. distance) and 2D can be usefully added to established mappings of aspatial data [11, 62]. The degree to which space is fundamental to information also varies across the map in its broadest sense. Wood and Fels [61] draw attention to the paramap – “the production surrounding a map” [34]. This consists of perimap – including titles, photographs, illustrations and credits and the epimap • Jason Dykes, Jo Wood and Aidan Slingsby are at the giCentre in the Department of Information Science, City University London, E-Mail: j.dykes jwo sbbb717 @soi.city.ac.uk, Web: http://gicentre.org/. Manuscript received 31 March 2010; accepted 1 August 2010; posted online 24 October 2010; mailed on 16 October 2010. For information on obtaining reprints of this article, please send email to: [email protected]. – accompanying articles, advertisements, marketing copy, letters and details on how the map was produced. This information has a power- ful role in conveying authority and affirming the status of the map as an objective reference object [61]. Certain elements of the paramap have geographic characteristics that may be reflected through spatial mappings (cartography). In some cases spatial layout can be used to show aspatial relationships (information visualization), whilst other elements do not seem inherently spatial or would not benefit from spa- tial representation. Here we focus on an important component of the perimap: the legend – a mapping of data that uses space and so ben- efits from methods from information visualization and cartography in which layout represents information or geospatial structure. We do so for four related reasons: 1. the legend is an influential component of the paramap [61]; 2. an effective legend seems key to a cognitively useful map; 3. there is scope for using dynamism to achieve this; 4. cartography texts provide little guidance on the paramap [61]. Our work is undertaken in response to a request by EDINA to “re- imagine” the legend in the context of visualization. 50,000 active users from 150 UK tertiary education institutions access 1TB of geospatial data through EDINA’s Digimap service [55]. Eighteen web mapping clients combine and present national data sets of varying theme, con- tent, scale and format (including products from Great Britain’s map- ping agency, Ordnance Survey) in user-defined maps. Six of these clients contain legends, which fulfill multiple roles in terms of map comprehension, customisation and exploration. They can be bulky 890 1077-2626/10/$26.00 © 2010 IEEE Published by the IEEE Computer Society IEEE TRANSACTIONS ON VISUALIZATION AND COMPUTER GRAPHICS, VOL. 16, NO. 6, NOVEMBER/DECEMBER 2010
-
Upload
independent -
Category
Documents
-
view
0 -
download
0
Transcript of Rethinking Map Legends with Visualization

Rethinking Map Legends with Visualization
Jason Dykes, Jo Wood, Member, IEEE, and Aidan Slingsby
Fig. 1. The Map is the Legend – Map Becomes Legend (Becomes Map...). Relationships between map and legend are explored inPrototype 1 with animated transitions between three ordered layouts: legend (1D categorical, left), map (2D geospatial, center ) andmapped legend (2D geospatial, right). c©Crown Copyright/database right 2010. An Ordnance Survey/EDINA supplied service.
Abstract—This design paper presents new guidance for creating map legends in a dynamic environment. Our contribution is a set ofguidelines for legend design in a visualization context and a series of illustrative themes through which they may be expressed. Theseare demonstrated in an applications context through interactive software prototypes. The guidelines are derived from cartographicliterature and in liaison with EDINA who provide digital mapping services for UK tertiary education. They enhance approaches tolegend design that have evolved for static media with visualization by considering: selection, layout, symbols, position, dynamismand design and process. Broad visualization legend themes include: The Ground Truth Legend, The Legend as Statistical Graphicand The Map is the Legend. Together, these concepts enable us to augment legends with dynamic properties that address specificneeds, rethink their nature and role and contribute to a wider re-evaluation of maps as artifacts of usage rather than statements offact. EDINA has acquired funding to enhance their clients with visualization legends that use these concepts as a consequence ofthis work. The guidance applies to the design of a wide range of legends and keys used in cartography and information visualization.
Index Terms—Cartography, design, Digimap service, legend, online web mapping, visualization.
1 INTRODUCTION
Information visualization is concerned with spatial mappings of datathat are not “inherently spatial” [29]. These should be “cognitivelyuseful” when applied to well-defined tasks in combination with dy-namic and interactive techniques that support a process of data ex-ploration [29]. Yet the degree to which data, or the spatial mappingsderived from them to amplify cognition, are “inherently spatial” is farfrom unequivocal. We explore this uncertainty to enhance map leg-ends specifically and spatial information visualization more generally.
All cartographic projections transform data about positions on theEarth’s surface to a plane, resulting in the loss of important character-istics of space [54]. Some emphasize the aspatial aspects of data atthe expense of geospatial properties for good reason [16, 56]. Equally,geospatial orderings in 1D (e.g. distance) and 2D can be usefully addedto established mappings of aspatial data [11, 62]. The degree to whichspace is fundamental to information also varies across the map in itsbroadest sense. Wood and Fels [61] draw attention to the paramap –“the production surrounding a map” [34]. This consists of perimap –including titles, photographs, illustrations and credits and the epimap
• Jason Dykes, Jo Wood and Aidan Slingsby are at the giCentre in theDepartment of Information Science, City University London,E-Mail: j.dykes jwo sbbb717 @soi.city.ac.uk, Web: http://gicentre.org/.
Manuscript received 31 March 2010; accepted 1 August 2010; posted online24 October 2010; mailed on 16 October 2010.For information on obtaining reprints of this article, please sendemail to: [email protected].
– accompanying articles, advertisements, marketing copy, letters anddetails on how the map was produced. This information has a power-ful role in conveying authority and affirming the status of the map asan objective reference object [61]. Certain elements of the paramaphave geographic characteristics that may be reflected through spatialmappings (cartography). In some cases spatial layout can be used toshow aspatial relationships (information visualization), whilst otherelements do not seem inherently spatial or would not benefit from spa-tial representation. Here we focus on an important component of theperimap: the legend – a mapping of data that uses space and so ben-efits from methods from information visualization and cartography inwhich layout represents information or geospatial structure. We do sofor four related reasons:
1. the legend is an influential component of the paramap [61];
2. an effective legend seems key to a cognitively useful map;
3. there is scope for using dynamism to achieve this;
4. cartography texts provide little guidance on the paramap [61].
Our work is undertaken in response to a request by EDINA to “re-imagine” the legend in the context of visualization. 50,000 active usersfrom 150 UK tertiary education institutions access 1TB of geospatialdata through EDINA’s Digimap service [55]. Eighteen web mappingclients combine and present national data sets of varying theme, con-tent, scale and format (including products from Great Britain’s map-ping agency, Ordnance Survey) in user-defined maps. Six of theseclients contain legends, which fulfill multiple roles in terms of mapcomprehension, customisation and exploration. They can be bulky
890
1077-2626/10/$26.00 © 2010 IEEE Published by the IEEE Computer Society
IEEE TRANSACTIONS ON VISUALIZATION AND COMPUTER GRAPHICS, VOL. 16, NO. 6, NOVEMBER/DECEMBER 2010
and difficult to navigate when comprehensive.Our objective is to explore possibilities for enhancing legends with
visualization – to see whether cartography and information visualiza-tion can be effectively applied to generate novel and cognitively plau-sible mappings of the spatial elements of the perimap. We do so in theDigimap context by exploring visualization design opportunities forDigimap data sets and establishing affect. This is achieved through aphased study based upon a formalised informal approach to multime-dia cartography praxis and evaluation [35, 36] in which participatoryapproaches are used to characterize the problem domain and determinegoals, formative evaluation is undertaken and impact established.
Phase 1 – Imagination Exercise: to characterize the problem do-main by establishing context, exchanging ideas and data andidentifying broad requirements; to develop broadly applicableguidance from existing practice, themes that inform design anddigital prototypes to demonstrate possibilities with data.
Phase 2 – Focussed Development: to evaluate themes and their im-plementation in digital prototypes, establish more specific re-quirements and generate more focussed and functional digitalprototypes with selected Digimap data sets.
Phase 3 – Impact: to evaluate views of the Digimap team and poten-tial for incorporating visualization legends into their services.
2 PROBLEM DOMAIN CHARACTERIZATION
Harrower contends that “Digital and Web cartography fails when wetry to reproduce paper maps on-screen” [24] and calls for a creativeapproach to design. Keates [33] bemoans the tragedy of cartographersto failing to think beyond existing norms. We required creative think-ing on visualization and legends and promoted this through a struc-tured imagination exercise. The problem domain was explored in adedicated workshop at EDINA. A loosely structured opening sessionallowed for lengthy discussion to ensure comprehensive common un-derstanding of the data, the user base and outstanding issues. ED-INA GeoSpatial Services and User Support (“EDINA”) described cur-rent approaches to legends and introduced data sets and user needs.Digimap clients, paper and digital prototypes that provide access to thecomprehensive Historic, Geology and Ordnance Survey collectionswere presented and their characteristics and usage discussed. ExistingDigimap legends have a dual role in supporting the visual interpre-tation of maps through lookup and as a means of map customisationby enabling the selection of data types for display. Discussions weremanually transcribed in parallel by participants, collated and approvedas an accurate and comprehensive record.
The creative activity began with a refresher session in which infor-mation visualization examples were presented to prompt discussion.The intention was to stimulate broad and creative thinking by distanc-ing the group from existing Digimap legends and ideas, whilst demon-strating the scope of visual solutions. Data collection followed withthree participatory exercises to establish views on Digimap legends.
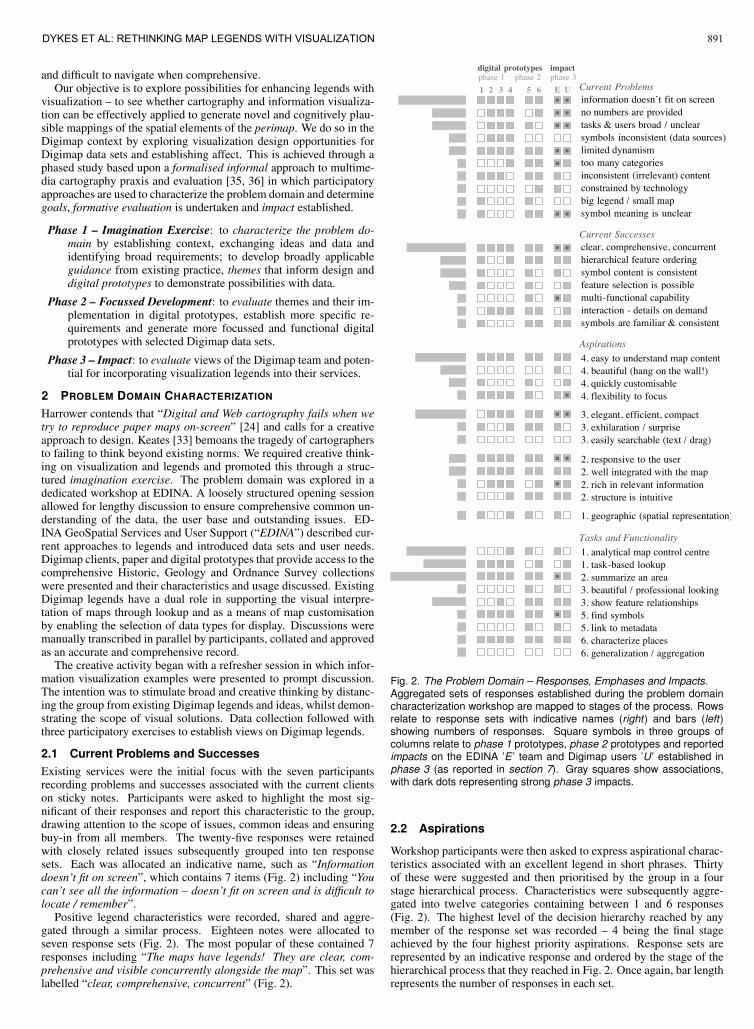
2.1 Current Problems and SuccessesExisting services were the initial focus with the seven participantsrecording problems and successes associated with the current clientson sticky notes. Participants were asked to highlight the most sig-nificant of their responses and report this characteristic to the group,drawing attention to the scope of issues, common ideas and ensuringbuy-in from all members. The twenty-five responses were retainedwith closely related issues subsequently grouped into ten responsesets. Each was allocated an indicative name, such as “Informationdoesn’t fit on screen”, which contains 7 items (Fig. 2) including “Youcan’t see all the information – doesn’t fit on screen and is difficult tolocate / remember”.
Positive legend characteristics were recorded, shared and aggre-gated through a similar process. Eighteen notes were allocated toseven response sets (Fig. 2). The most popular of these contained 7responses including “The maps have legends! They are clear, com-prehensive and visible concurrently alongside the map”. This set waslabelled “clear, comprehensive, concurrent” (Fig. 2).
digital prototypesphase 1 phase 2 phase 3
1 2 3 4 5 6
impact
E U Current Problemsinformation doesn’t fit on screenno numbers are providedtasks & users broad / unclearsymbols inconsistent (data sources)limited dynamismtoo many categoriesinconsistent (irrelevant) contentconstrained by technologybig legend / small mapsymbol meaning is unclear
Current Successesclear, comprehensive, concurrenthierarchical feature orderingsymbol content is consistentfeature selection is possiblemulti-functional capabilityinteraction - details on demandsymbols are familiar & consistent
Aspirations
4. easy to understand map content4. beautiful (hang on the wall!)4. quickly customisable4. flexibility to focus
3. elegant, efficient, compact3. exhilaration / surprise3. easily searchable (text / drag)
2. responsive to the user2. well integrated with the map2. rich in relevant information2. structure is intuitive
1. geographic (spatial representation)
Tasks and Functionality
1. task-based lookup2. summarize an area
3. show feature relationships
1. analytical map control centre
5. find symbols
6. characterize places
3. beautiful / professional looking
5. link to metadata
6. generalization / aggregation
Fig. 2. The Problem Domain – Responses, Emphases and Impacts.Aggregated sets of responses established during the problem domaincharacterization workshop are mapped to stages of the process. Rowsrelate to response sets with indicative names (right) and bars (left)showing numbers of responses. Square symbols in three groups ofcolumns relate to phase 1 prototypes, phase 2 prototypes and reportedimpacts on the EDINA ’E ’ team and Digimap users ’U ’ established inphase 3 (as reported in section 7). Gray squares show associations,with dark dots representing strong phase 3 impacts.
2.2 Aspirations
Workshop participants were then asked to express aspirational charac-teristics associated with an excellent legend in short phrases. Thirtyof these were suggested and then prioritised by the group in a fourstage hierarchical process. Characteristics were subsequently aggre-gated into twelve categories containing between 1 and 6 responses(Fig. 2). The highest level of the decision hierarchy reached by anymember of the response set was recorded – 4 being the final stageachieved by the four highest priority aspirations. Response sets arerepresented by an indicative response and ordered by the stage of thehierarchical process that they reached in Fig. 2. Once again, bar lengthrepresents the number of responses in each set.
891DYKES ET AL: RETHINKING MAP LEGENDS WITH VISUALIZATION
2.3 Tasks and FunctionalityFinally we asked participants to identify up to four important tasks thatDigimap legends should support or functionality that they should ex-hibit. Participants were then allocated to one of two discussion groups.Responses were presented to the group and aggregated into categoriesaccording to broad themes that emerged through discussion. Thirtycharacteristics were suggested and aggregated into twelve categories(six for each group). These were named and prioritised by group mem-bers as detailed in Fig. 2. The results for both groups are combined inFig. 2 where bar length shows how often a theme was identified andthe numbers show the highest priority amongst groups.
3 LEGEND DESIGN
Established guidance on legend design is very general, with occasionalexamples [53] and alternatives [13], but few principles – perhaps be-cause it is difficult to generalize between use cases and experimentalcontexts. As in cartography more generally, legend design seems torely on a subjective evaluation of design options informed by experi-ence, preference and knowledge in the context of particular use cases:“cartographers must rely on their best judgments” [15].
The focus is predominantly on static cartography but Lobben andPatton include a short section on legend design in their “Design Guide-lines for Digital Atlases” [40]. The suggestions are surprisingly con-servative, recommending replication of static legends or the use ofsymbols that reveal text when interrogated. The former of these seemsto contradict their earlier advice on ensuring graphic simplicity formaps that are designed for computer screens and is challenged by Har-rower [24] who draws particular attention to the need to minimise thedegree to which users divide their attention between map and legend.
A review of 47 cartographic texts, papers and digital resources leadsus to propose broad guidelines relating to six high-level characteristicsfor consideration in visualization legend design.
3.1 Selection – What to Include?Only show relevant information – include just what is required.Our domain characterization emphasized the cartographic tendencyfor comprehensive legends. However, effective selection of contentwill minimise cognitively expensive look-up tasks and reduce the ex-tent to which attention is divided between map and legend. It can beachieved by limiting to “all unknown or unique symbols used” [15],those that are “not self-explanatory” [53] or items “critical to readingthe map in question” [48]. Relevance changes over time, and accord-ing to task and user – thus requiring careful consideration. Visualmethods may be useful to highlight selected and de-emphasize non-selected items through binary or continuous symbolism. Updates maybe appropriate where legends are dynamic and visual de-emphasis maymaintain legend stability where selection changes. Input from the userand system use may be effective in determining what is required. Evi-dence suggests that legends are not necessary amongst some users forsome map tasks and a situation with no look-up and no legend maysometimes be a viable and effective objective [2].
3.2 Layout – How to Use Legend Space?Reflect meaningful geospatial or attribute structure by arranginglegend symbols in a relational manner.Legend layout “is worthy of careful attention” [48] and should exhibit“visual logic” [13] and “visual balance” [48] so that symbols are un-ambiguous, harmonious with the map and clear [15]. This may beachieved through 1D ordering of legend items [48] or more sophisti-cated use of the space. 2D layouts that represent information structurehave been shown to be effective in some circumstances [2, 14], sug-gesting that improvements in performance may result where the di-mensionality of a legend concurs with the dimensionality in the data.MacEachren [41] explains in terms of schemata – elements of long-term memory used to organise knowledge and frame future under-standing. For example, the abstract notion that closer in space meanscloser in kind is a spatial schema used advantageously in cartographyand information visualization [50, 51]. Any visual description of in-formation, such as a map or legend, will rely upon both the graphic
itself and the schemata used to view it – particularly in terms of theirappropriateness and completeness. Interpretations of legends are con-sidered as specific map schemata: “For cartographers and readers toshare interpretants for specific signs requires a common understand-ing of how sign-set variation is matched to data set variation and/oran explicit definition for a sign relationship” [41].
Legends that reflect the nature of relationships in the data are thuslikely to be most effective [41]. Aspects of layout may do this effec-tively through image schemata, which include center-periphery andcontainment: “While legends typically employ linguistic codes to pro-vide a link to propositional knowledge representations, presentationalcodes can also be used to link with analogical knowledge representa-tions and image schemata” [41].
Ordering legend items consistently with lower values at the bot-tom and high at the top [48], natural legends [14], and 2D legends[2, 3] may meet these criteria. Considering the planar dimensions asmappable space into which information that contains 1 and 2D orders,hierarchical relationships and categorical differences may be produc-tive – for example to represent category, age and regional variation ina geology map legend [22]. Doing so may also lead to new ideas forimproved legends that are based upon image schemata. The containerschema is not used frequently in legend design, but as an embodiedimage schema that is considered by some to have inherent meaning[38, 41] it may be effective when used in legend layout.
In short we recommend the legend be considered as a spatialrepresentation of information and thus the relative positions of ele-ments should be of primary concern as they are when developing amap or less inherently spatial graphic. Recent cartographic literaturemakes useful recommendations about visual groupings, meaningfulmetaphors and effective use of text [4, 53].
3.3 Symbols – How to Represent Features?Symbols in the legend must relate directly to those used on the map.Legends should be consistent with the maps they support. Symbolsshould relate: directly to the map with identical characteristics [48,53]; to each other (see section 3.2 above); to the mapped phenomenonof interest; to social and cultural expectation. Some evidence suggeststhat where quantitative estimation tasks are important, displaying arange of values may be effective in overcoming the non-linear natureof perception [12]. In such cases the zero lookup or empty legendobjective may not apply and advice on representation is available [30].Emerging technologies and contributed geo-referenced data sourcesprovide scope for innovation in terms of using ground truth to relatemaps and legends to mapped phenomena [8].
3.4 Position – Where or When to Show Legends?Ensure that when, where or how a legend is encountered, is task ap-propriate and matches expectation.The position or availability of the legend may vary according to priorknowledge, task and cultural expectation or norm but should be a keyelement of design. In the case of bivariate legends or unfamiliar sym-bolism it has been argued that the legend should be seen before themap [48]. When legends are expected to be used less frequently andas map use continues, this primacy may become less necessary.
3.5 Dynamism – Which Interactions and Animations?Supplement information and vary legend characteristics in informa-tive and relevant ways.Dynamism can overcome some issues associated with alternative de-sign decisions and change. In dynamic environments selection, layout,symbols and position can be varied to emphasize relationships and suitsituation, task and user. For example:
• varying selection – by geography, attribute, choice or experience:symbol transparency [49] may be used effectively here;
• varying layout – to reflect different orders of and relationshipsbetween symbols: if layout changes then it must be clear whythe change has occurred and what it represents;
• varying symbols – to reflect different (transient) design priorities.
892 IEEE TRANSACTIONS ON VISUALIZATION AND COMPUTER GRAPHICS, VOL. 16, NO. 6, NOVEMBER/DECEMBER 2010

Concepts and approaches useful in implementing these guidelines in-clude the active legend [46, 49], bi-directional highlighting [49], smartlegends acting as a central control unit for the map [49], animatedtransitions [28] and the application of styles [10, 31, 32, 43].
3.6 Design and Process – How to Proceed?Design the legend as you would a map or data graphic – considerthe legend as (spatial) information visualization.Overall legend design is an informed trade-off that should be under-taken in close association with map design using appropriate designprinciples. The cartographic literature lists various characteristics thatare indicative of good legend design that might be considered as aes-thetic and relational qualities. Aesthetic qualities include harmony,visual balance, clarity, and legends that are in keeping with the map.Relational qualities include visual logic, logical groupings and unam-biguous encoding. We might add functional qualities, which are re-lated and the subject of various experiments (e.g. [2, 12, 14, 20]).
These guidelines emphasize the informed and effective use of lay-out in legend design. As such, approaches used in information visual-ization and cartography are applicable. The seven controls on the mapdesign process may be a helpful starting point for spatial legends: pur-pose; reality (and mapped reality); available data (and its selectionor omission in the map); (map) scale; audience; conditions of use;technical limits (and opportunities?) [48]. The information visualiza-tion literature also contains a wealth of relevant knowledge with recentindications that interactive legends have positive effects in certain cir-cumstances [47]. Ultimately, design relies on a cartographer’s judg-ments in the light of experience and consideration of use. A creativeand open approach is important throughout the process [7, 24, 33, 42].Continual reflection, discussion, task-based evaluation and redesignshould be applied [35] as the designer “edits vigorously” [4].
4 LEGEND THEMES
Our characterization of the problem domain and development of de-sign guidelines provided impetus for a creative exercise in which broadvisualization legend themes were developed to frame ideas and guidesoftware development. Each describes a novel perspective on the leg-end that can be used with the guidelines to address the problem do-main. Themes are neither comprehensive nor mutually exclusive andmay be used individually or in combination to inspire visualizations.
4.1 The Map is the LegendThe roles of map (spatial representation of geographic setting) andlegend (spatial representation of map content and symbols) are blurredin this theme that emphasizes spatial layouts.
No Legend – Must a map always have a legend? If symbols areknown or map tasks do not require precise identification or ac-curate estimation then expensive map-to-legend references maybe removed by omitting the legend – the map sufficing as an in-dicator of content. The omission of many known symbols fromexisting legends (see [60]) could be extended to zero selectionif all symbols were known or “self-explanatory” [53]. In a dy-namic environment details on demand [40] may suffice and limitthe risks associated with no legend. They may also limit the in-terruptions associated with look-up assumed by the literature on(static) cartography. Transient legends are used in a number ofDigimap clients and offer possibilities.
Map Section – Legends with 2D spatial ordering. Natural legends oftopography, annotated and stylized indicative map sections re-lating symbol and referent, have significant positive effects forsome tasks [14]. This approach is used to an extent by the Ord-nance Survey in their paper map legends [44] (Fig. 3) and byDigimap with marine data sets. In both cases the features usedtend to occur in broadly linear arrangements. A stylized labeled2D map section is a viable and effective alternative [14].
Map Becomes Legend (Becomes Map...) – A dynamic map thattransforms from map to legend and vice versa may help relate
L
: l
WATER FEATURES
Bridge
Canal
Towpath
Aqueduct
Lake
Weir Normal tidal limit
Footbridge
Canal (dry)
CliffSlopesMarsh or salting
Lock Flat rock
SandDunes
Ford
Mud
Shingle
Beacon Lighthouse(in use)Lighthouse
(disused)Low water mark
High water mark
Fig. 3. The Map is the Legend – Map Section.An extract of the OS Landranger 1:50,000 map symbols sheet [44] con-taining a natural legend. Features are arranged in a linear fashion toshow indicative but fictitious geography. c©Crown Copyright 2002.
symbol and location effectively and reduce lookup activity byremoving the need to separate the representation of map and leg-end. Smooth animated transitions [28] may be beneficial. An-imating symbol locations between positions that are geospatial,spatially indicative and those that relate to aspatial feature char-acteristics such as order and hierarchy addresses this theme in aninnovative way (Figs. 1 and 9).
4.2 The Legend as Statistical Graphic
A graphical statistical summary of current map content and a dynamicquery filter for map exploration.
Layout and dynamism can be combined effectively to develop ac-tive legends [46] whereby graphical statistics summarise current mapcontent and act as a query filter or control center [49]. Map explo-ration is supported by linking views with bi-directional interactions[49]. This theme provides scope for a variety of 1 and 2D uni and bi-variate statistical graphics [19, 37] and draws upon a rich tradition ofcombining alternative views of data for exploration through dynamiclinking (e.g. [1, 17, 26, 27]). Interface elements containing graphicallyencoded information may be appropriate [59]. Requirements for ex-ploratory data analysis software [57] should be considered to supporttypical queries discussed at our workshops such as: Are there moreA or B-roads on this map? Where are the museums? What type oflandcover do windmills occur on? Does this vary in different places?
4.3 A Legend of Legends
Alternative styles are displayed and related using layout.The emergence of alternative symbolism schemes for maps through
expert systems [31] or crowd sourcing [10] poses an additional issue:how do we produce a legend of legends? Furthermore, in the context ofthe advice proffered here, how do we spatially arrange, or map, theselegends? Maps of symbolism styles arrange alternatives spatially sothat users can relate and navigate between alternative symbolism sets(Fig. 4) according to relevance determined by preference [10], usage,scale or geography [32].
4.4 The Relevant Legend
Selection includes only what is required, varying as this changes.Relevance is a key concept in considering selection and layout. This
changes over time, according to data and with use and user. The Rel-evant Legend shows only what is required. A geospatially RelevantLegend shows only what is on the map and addresses a common userconcern raised directly during our workshops: “I don’t want a legendthat is showing things that are not on the map”. A dynamic implemen-tation updates continually.
For example the content of a geological legend may be adjusted toshow particular aspects of the stratigraphy (Fig. 5) or to emphasizethe bedrock in a selected locality. This may involve limiting selec-tion (and thus changing layout), or specific emphasis with highlightor lowlight (maintaining consistent layout). The latter is advisable inthe geological case as the entire stratigraphic sequence is important inmap interpretation. This theme is easily combined with others and islikely to draw upon the active legend concept. Examples include:
893DYKES ET AL: RETHINKING MAP LEGENDS WITH VISUALIZATION
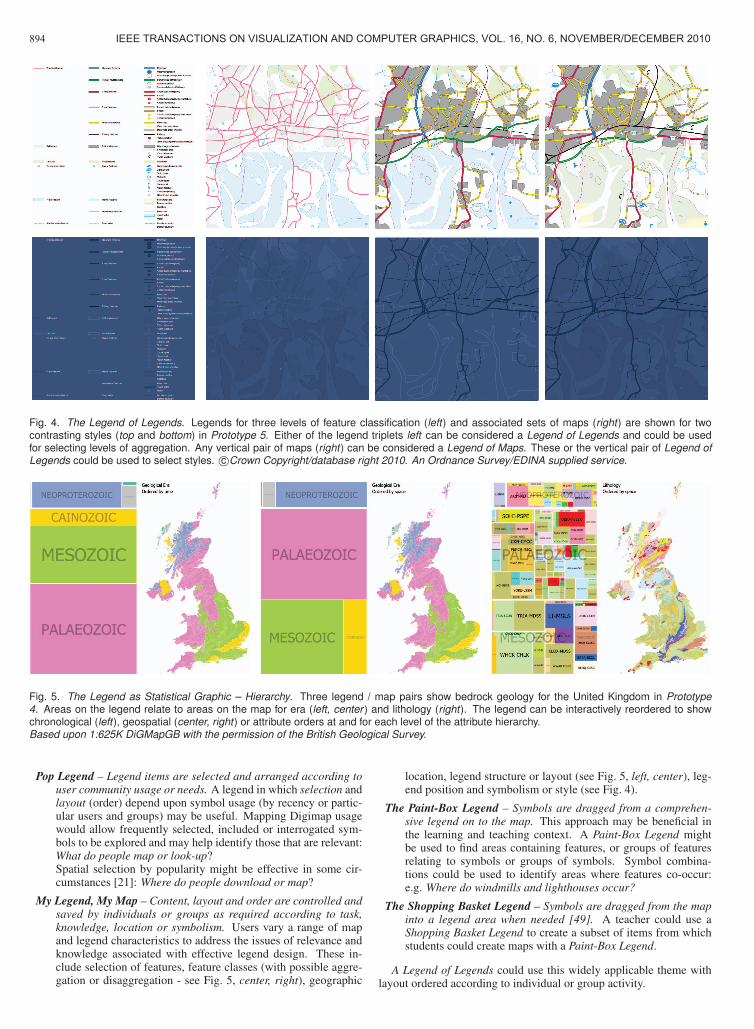
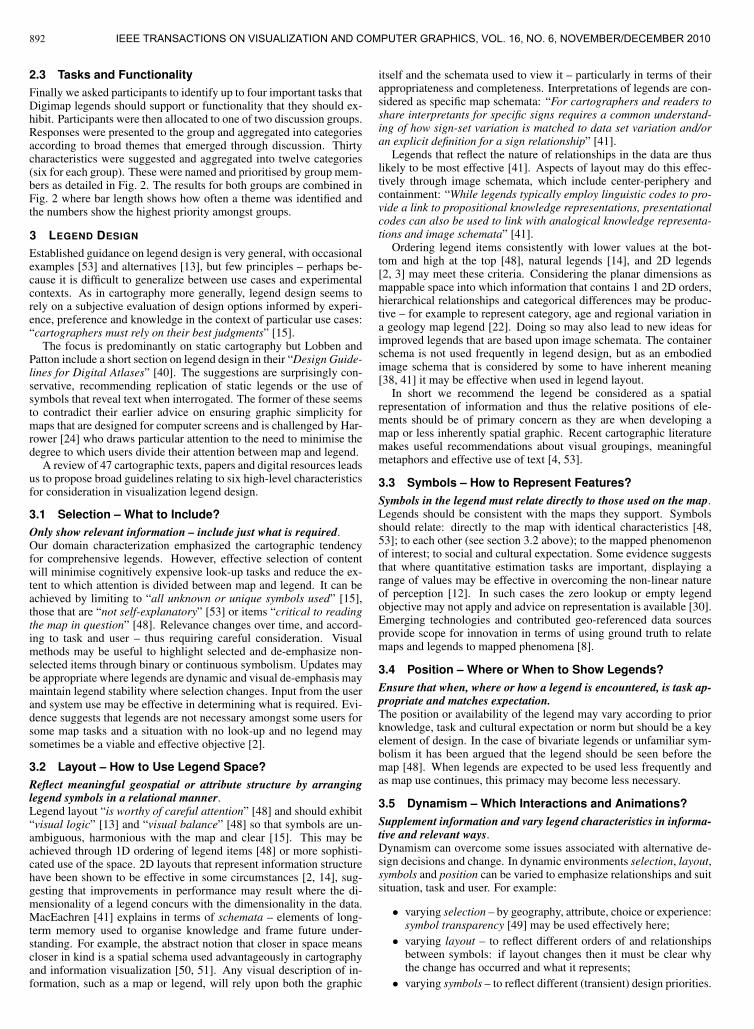
Fig. 4. The Legend of Legends. Legends for three levels of feature classification (left) and associated sets of maps (right) are shown for twocontrasting styles (top and bottom) in Prototype 5. Either of the legend triplets left can be considered a Legend of Legends and could be usedfor selecting levels of aggregation. Any vertical pair of maps (right) can be considered a Legend of Maps. These or the vertical pair of Legend ofLegends could be used to select styles. c©Crown Copyright/database right 2010. An Ordnance Survey/EDINA supplied service.
Fig. 5. The Legend as Statistical Graphic – Hierarchy. Three legend / map pairs show bedrock geology for the United Kingdom in Prototype4. Areas on the legend relate to areas on the map for era (left, center ) and lithology (right). The legend can be interactively reordered to showchronological (left), geospatial (center, right) or attribute orders at and for each level of the attribute hierarchy.Based upon 1:625K DiGMapGB with the permission of the British Geological Survey.
Pop Legend – Legend items are selected and arranged according touser community usage or needs. A legend in which selection andlayout (order) depend upon symbol usage (by recency or partic-ular users and groups) may be useful. Mapping Digimap usagewould allow frequently selected, included or interrogated sym-bols to be explored and may help identify those that are relevant:What do people map or look-up?Spatial selection by popularity might be effective in some cir-cumstances [21]: Where do people download or map?
My Legend, My Map – Content, layout and order are controlled andsaved by individuals or groups as required according to task,knowledge, location or symbolism. Users vary a range of mapand legend characteristics to address the issues of relevance andknowledge associated with effective legend design. These in-clude selection of features, feature classes (with possible aggre-gation or disaggregation - see Fig. 5, center, right), geographic
location, legend structure or layout (see Fig. 5, left, center), leg-end position and symbolism or style (see Fig. 4).
The Paint-Box Legend – Symbols are dragged from a comprehen-sive legend on to the map. This approach may be beneficial inthe learning and teaching context. A Paint-Box Legend mightbe used to find areas containing features, or groups of featuresrelating to symbols or groups of symbols. Symbol combina-tions could be used to identify areas where features co-occur:e.g. Where do windmills and lighthouses occur?
The Shopping Basket Legend – Symbols are dragged from the mapinto a legend area when needed [49]. A teacher could use aShopping Basket Legend to create a subset of items from whichstudents could create maps with a Paint-Box Legend.
A Legend of Legends could use this widely applicable theme withlayout ordered according to individual or group activity.
894 IEEE TRANSACTIONS ON VISUALIZATION AND COMPUTER GRAPHICS, VOL. 16, NO. 6, NOVEMBER/DECEMBER 2010

4.5 The Source Independent LegendData are integrated from multiple sources with conflicts resolved.Sources are identifiable but items grouped by other characteristics.
Legends frequently integrate data from multiple sources, theDigimap Carto and ROAM clients are examples with scales vary-ing across the Ordnance Survey collection. Feature classes, defini-tions and levels of uncertainty may differ between sources in a single‘mashed-up’ map. The Source Independent Legend address such con-flicts in a seamless and elegant manner, perhaps through hierarchicalordering. Origin should be evident in the legend but symbols shouldbe distinguishable and grouped according other characteristics – suchas feature class, task, users’ knowledge, popularity of use, or others.Varying imposed (false) hierarchies can help explore structure in a dataset [52] and this approach may be relevant here.
4.6 The Ground Truth LegendSymbols are augmented or replaced with (local, community con-tributed) imagery. The user community could determine relevance.
In traditional legends the relational link is between symbol and map.Various online communities provide access to geo-referenced imagerythat could be used to augment the links between location and realityafforded by traditional symbolism. A number of sophisticated andspatial designs use imagery in this way [8, 18, 23]. The theme could beenhanced by community contributions – with images tagged accordingto the degree to which they are representative of particular features orplaces. Queries that might be answered include:
Is there a photograph of this [feature]?What does this [feature] look like?Do all the [features] around here look the same?Where is the nearest photograph of this [feature]?Where are the most typical [features]?
Requests could also be combined:Where do typical cases of [feature1] occur
near to typical cases of [feature2]?Most of these questions could be usefully asked and answered bothlocally and globally to encourage consideration of spatial variations.
5 DIGITAL PROTOTYPES: IMAGINATION EXERCISE
The themes were used to design visualization legends for coreDigimap data sets identified in characterizing the problem domain.Four initial prototypes (numbered 1-4) were presented to EDINAalong with the guidelines and themes to demonstrate possibilities,communicate ideas and elicit further feedback in ways that are onlyfeasible with tangible artifacts containing real geospatial data [39].Each prototype is dominated by a particular theme, and named ac-cordingly, but influenced by others (Fig. 6). Variations on a theme aredifferentiated by graphic type. Characteristics of the problem domainaddressed by each prototype are tabulated in Fig. 2. The accompa-nying movie details the dynamic functionality of each prototype andshould be consulted in conjunction with these static figures.
5.1 The Map is the LegendWe use this theme to explore the relationships between geospatialand aspatial graphics of geographic information with three alternativecombinations of layout and selection for legend items (Fig. 1). Theidea is to create a legend that is as familiar as possible to users andyet to take advantage of alternative layouts that are available in a dy-namic medium. Prototype 1 uses the 1:50,000 Scale Colour RasterLandranger for a 20km2 tile with a broad range of inland and coastalfeatures (SU60). Vectors were acquired from the OS Meridian 2 prod-uct. Feature locations within the selected area were manually digi-tized from Landranger to relate locations with symbols and symbolcategories supplied by EDINA.
The legend view consists of a 1D ordered layout with a single caseof each feature (Fig. 1, left). This transforms into a map – a 2Dgeospatial layout of all features (Fig. 1, center). A third layout, themapped legend is a 2D geospatial ordering with a single case of eachfeature at an indicative location (Fig. 1, right). These are randomly se-lected in our prototype, but our emphasis on the importance of layout
digital prototypesphase 1 phase 2
1 2 3 4 5 6 Themes Addressed
The Map is the Legend
The Legend as Statistical Graphic
A Legend of Legends
The Relevant Legend
The Source Independent Legend
The Ground Truth Legend
Data Sets Used
OS 1:2,500 MasterMap
OS 1:50k Scale Colour Raster (Landranger)
OS 1:50k Vector Features (Meridian)
OS 1:250k Vector Features (Strategi)
OS 1:250k Scale Colour Raster
BGS 1:625K Onshore Bedrock Mapping (DiGMapGB)
Fig. 6. Themes and Data Sets Used in Developing Prototypes.The matrix shows associations (influenced by / demonstrates) betweentheme and prototype (top). Gray squares show associations, dots dom-inance. Data sets used in each prototype are also recorded (bottom).
suggests that locations should be selected in more meaningful ways.Smooth transitions animate between each view to relate locations ingeographic and attribute space. Selection updates as geospatial extentis varied through zoom and pan.
5.2 The Legend as Statistical Graphic – Bar Chart
Areal features and associated descriptive groups are the focus of Proto-type 2, which uses a subset of the OS MasterMap Topographic Layer.This high-resolution vector mapping product partitions Great Britaininto just under half a billion tessellating polygons corresponding tobuildings, fields and the geometry of roads and paths. Dynamic leg-end symbols summarise features in the current map view through a BarChart (Fig. 7). The planar coordinates of the legend show all featureclasses displayed in the map with a magnitude (horizontal axis) relat-ing to some statistical attribute of the class (e.g. number [37], area,perimeter). Bars are ordered by an appropriate characteristic (verti-
Fig. 7. The Legend as Statistical Graphic – Bar Charts.Bar charts (left) in Prototype 2 show characteristics of an area selectedwith zoom and pan (right). Feature areas (top, center ) and counts (bot-tom) are shown, with vertical ordering by alphabet (top) and magnitude(center, bottom). Bi-directional highlighting allows symbols or features tobe selected on demand with linked views. c©Crown Copyright/databaseright 2010. An Ordnance Survey/EDINA supplied service.
895DYKES ET AL: RETHINKING MAP LEGENDS WITH VISUALIZATION

cal axis). Map and statistical graphic exhibit consistent bi-directionalinteractions for selection and highlighting. Bar orders and lengthsupdate during navigation. The concurrent use of feature class labeland statistical graphic could be considered a ‘scented legend’ after the‘scented widgets’ of Willett et al. [59].
5.3 The Legend as Statistical Graphic – MatrixWe compare features of different geometry from different sources inPrototype 3 where geology and road data are combined in an interac-tive statistical graphic (Fig. 8). The BGS Rock Lexicon recorded inDiGMapGB [6] is used to classify the geology. This 1:625k data setcontains onshore bedrock polygons with information about rock ageand type. Road features are from OS Strategi, a vector version of the1:250k Scale Colour Raster that contains feature type, point and linegeometry and a rich set of attributes for roads, rivers and points ofinterest (see section 6).
A dynamic 2D visualization legend shows a feature class from oneof the sources in each dimension (Fig. 8, left). These are orderedby an appropriate characteristic: age in the case of bedrock (vertical)and capacity for roads (horizontal) and shaded to show co-occurrence.Secondary visual variables are used to show quantity in a heat map[58] – in this case the degree to which legend elements co-occur ge-ographically in the current map. Interactions relate visualization leg-end and map with mouseover-invoked details on demand supportinglookup tasks. This example shows ‘line in area’ relationships as re-quested in our workshops, but for data sets with limited likely asso-ciation in this case. The approach is applicable to other data sets andrelationships including: point in area, point within distance of line, andpoint within distance of point. Different configurations of layout andsymbolism in the legend could transform the matrix into a mosaic plotor fluctuation diagram. Dynamic functionality such as feature classre-ordering and aggregation could be applied within this theme.
5.4 The Legend as Statistical Graphic – HierarchyPrototype 4 consists of a dynamic, spatial legend in which the geo-graphic and hierarchical nature of the national bedrock geology classi-fication (see section 5.3) is depicted through a 2D spatial treemap [62].We built a 6-level classification hierarchy from the four hierarchicalgeological timescale units of Eon, Era, Period and Epoch, followed bythe BGS Rock Classification Scheme (RCS) and the BGS Rock Lex-icon entry (LEX). Established color schemes were used for the lattertwo levels [5]. We allocated ColorBrewer [25] Set1, Set2 and Set3schemes to Eon, Era and Period and random colors to the 30 Epoch
Fig. 8. The Legend as Statistical Graphic – Matrix.A matrix legend allows co-occurring features to be explored in Prototype3. Here the matrix shows bedrock (vertical) vs. roads (horizontal) withcolors indicating relative co-occurrence for each road type (column). Al-ternative scalings by bedrock (row) or global values (area) are available.The matrix values update as the map is navigated with zoom and pan.Bi-directional highlighting relates map and legend with textual detailsprovided on demand. c©Crown Copyright/database right 2010. An Ord-nance Survey/EDINA supplied service. Based upon 1:625K DiGMapGBwith the permission of the British Geological Survey.
categories. In Fig. 5 the treemaps are at the level of Era (left, center)and rock lexicon (right). Chronological (left) and geospatial (center,right) layouts of legend categories are shown hierarchically. The leg-end can also be ordered by area. Other 1 or 2D orders could be added –relevance ordering would address the Relevant Legend theme. Smoothanimations are used to transition between layouts. Bi-directional in-teractions relate map and legend with details on demand supportinglookup tasks – any category being selectable in map or legend.
6 DIGITAL PROTOTYPES: FOCUSSED DEVELOPMENT
A Possibilities Report containing the legend guidelines and themes,along with the four initial prototypes demonstrating how these couldbe applied imaginatively to Digimap products, formed the basis ofa second round of more focussed discussion. The objectives of theimagination exercise involved collectively exploring and communicat-ing possibilities and generating more specific requirements for furtherdevelopment. Responses were positive. Discussion about the ideasand their applicability to the various data holdings and utility to usergroups was broad initially, but constructive and animated – the pro-totypes stimulated plenty of ideas. EDINA suggested various ways ofapplying the themes in a variety of use cases with a range of additionaldata sets, demonstrating their utility in communicating possibilities.These included a wireframe of The Ground Truth Legend with com-munity contributed styles and locally relevant photographs. EDINAtook time to evaluate the possibilities before establishing priorities formore constrained and functional prototypes. These included:
• a focus on the Strategi data set [45];
• applying 2D layouts to the rich Strategi feature class hierarchy;
• enhancing prototypes with styles, layout options and more fea-tures for bi-directional interaction.
OS Strategi feature descriptions are very specific (e.g. Motorway, un-der construction) and we used EDINA’s existing interpretation of thethree-level Ordnance Survey hierarchy [45] to group features with 8,46 and 210 categories at each level. Two of the digital prototypes wereenhanced accordingly in line with the design guidelines. Prototypes 5and 6 resulted and are illustrated in Figs. 9 and 10 and through theaccompanying movies.
6.1 The Map is The Legend – Strategi
We applied The Map is the Legend to Strategi and further spatializedthe legend view with 2D ordered layouts containing a single case ofeach feature structured according to feature class. Navigation throughthe legend hierarchy in Prototype 5 is supported through interactivecontrols to select levels. The richer feature set required a number ofdesign issues to be considered. The traditional legend no longer fit-ted on screen if viewed with a large (familiar) font and a number offeatures selected. Interactive controls over item size and spacing wereadded to provide a continuum between ‘visible’ and ‘not visible’ de-pending on the importance of the legend view at any time. To reinforcethe continuum between map and legend views, togglable feature classselection and highlighting was added in all views to allow features tobe selected geospatially or thematically (see Fig. 9). Multiple legendorderings reinforce the notion that the traditional legend is simply oneof many possible views of the data. Three orderings are available:by theme, alphabet (for finding a symbol of known named type) anddrawing order (related to the Strategi feature code order). Other ordersare possible, for example to address The Relevant Legend theme.
Allowing selection and display of features in any layout reinforcesthe way in which we disassociate the data being shown from the modeof display in this theme. An alternative approach is to apply differentsymbolization styles to the same data. Two example styles were imple-mented in Prototype 5 (see Fig. 4). The default Strategi style matchesthe standard 1:250k Scale Colour Raster map (Fig. 4, top). An alter-native gray-blue style derived from a contribution to CloudMade [10]can be applied to all views of the data (Fig. 4, bottom).
896 IEEE TRANSACTIONS ON VISUALIZATION AND COMPUTER GRAPHICS, VOL. 16, NO. 6, NOVEMBER/DECEMBER 2010

Fig. 9. The Map is the Legend – Strategi. Symbols move between geospatial and thematic layout in Prototype 5. The map-to-legend transition isshown for the all features (top) and a selection (bottom). c©Crown Copyright/database right 2010. An Ordnance Survey/EDINA supplied service.
Fig. 10. The Legend as Statistical Graphic – Strategi.In Prototype 6, containment reflects the hierarchy of point, line and areafeatures in Strategi. Legend symbols show relative occurrences for eachgeometry type through size (national) and color (local). The area southof Berwick (top) is characterised by level crossings, minor roads andrivers and foreshore features in comparison to the Barmouth area (bot-tom) where coastline and railway stations feature more than at nationallevel. Camping sites are expected in coastal regions with low propor-tions of urban area but the predominance of picnic sites and trails in onelocation versus museums and golf courses in the other suggests differ-ent functions and recreational possibilities. Raster maps are generalizedin Prototype 6 to ensure rapid response. c© Crown Copyright/databaseright 2010. An Ordnance Survey/EDINA supplied service.
6.2 The Legend as Statistical Graphic – StrategiIn Prototype 6 the treemap legend acts as a 2D statistical graphic show-ing Strategi feature occurrence for three feature geometries at twogeospatial extents: national occurrence with areas relating to counts,total length and total area for point, line and area features respectively;and local occurrence through color schemes showing relative frequen-cies for each geometry in the current view (Fig. 10). 2D ordering inthe legend emphasizes different characteristics of the global data set orthe local selection including: geography, occurrence, relevance. Pointcount, line length and area are not directly comparable characteristicsof features with varying geometry – the same area is thus allocated toeach geometric type in the default treemaps. Features in the treemapscan alternatively be sized equally, as in conventional legends, or ac-cording to local occurrence. These different orderings and emphasesmay draw attention to particular characteristics of the area summarizedby the legend and address or inspire particular research questions [52].Animated transitions morph between views whenever layout changes.Map and legend are closely linked and highly interactive with the leg-end updated according to geospatial selection through zoom and pan.
7 IMPACT
This study involved ongoing communication between the designersand EDINA. Feedback was regular and largely informal. Reactions ata third workshop to Prototypes 5 and 6 were very positive and some-times effusive: “Even my Mum would understand that!”
In line with the formalized informal approach to cartographic praxis[35, 36] we solicited views on the degree to which the Digimap visual-ization legends had achieved impact in EDINA. A lightweight evalua-tion structured responses around the issues identified in domain char-acterization (Fig. 2). Two key contacts at EDINA were asked to con-sider whether the two-phase process of Imagination Exercise and Fo-cussed Development had or were likely to have a valuable impact on:
• them as individuals – through their thinking about legends
• the service – through plans to deploy any knowledge acquired
Responses are summarized below and in Fig. 2 where designers’ inten-tions for each of the six prototypes are listed against reported impacts.
7.1 Current Problems and SuccessesResponses indicate that many of the problems identified were ad-dressed and many of the successes built upon both in terms of theindividuals’ viewpoints and potential for use by Digimap subscribers.Design intentions were achieved in most cases with an emphasis on
897DYKES ET AL: RETHINKING MAP LEGENDS WITH VISUALIZATION
the high ranking successes and problems, indicating that the exerciseenhanced the way in which clear, comprehensive and logically struc-tured legends are applied to Digimap data in limited screen real estate.The case of too much space being given over to legend at the expenseof map is the only issue in which the prototypes were designed to havean impact, but none was recorded – an ongoing priority.
7.2 AspirationsA valuable impact on achieving aspirations was reported, with par-ticular emphasis on elegance, flexibility, richness and responsiveness(Fig. 2) – key characteristics of the information visualization approachemphasized in our designs. The issue of text-related search was not ad-dressed. Whilst not originally identified as a high priority, our themesand guidelines provide scope for additional designs through whichsearch could be supported. Aesthetic is important in cartography andhas been shown to have a measurable effect on usability in informa-tion visualization [9]. Perhaps our most challenging aspiration was toproduce a solution “so beautiful [that] the user prints the legend andputs it on their wall!” Positive feedback on this was encouraging.
7.3 Tasks and FunctionalityResponses to the impact evaluation emphasize the way that visualiza-tion legends summarize and characterize an area effectively in waysthat static legends do not, show relationships between features and canhelp users find and relate symbols (Fig. 2) – key tasks associated withmap use. The evaluators also indicated that visualization legends canmake digital maps look more professional – an important role of theparamap to which visualization can contribute. EDINA respondentsdid not report a valuable impact on their thinking about legends interms of providing support for communicating symbol meaning acrossa range of tasks (task-based lookup response set in Fig. 2). Theydid however acknowledge a likely impact upon users of the servicein lookup tasks through the planned adoption of the ideas.
7.4 Other ReactionsViews expressed in free text indicated that the exercise helped ED-INA investigate alternate approaches to visualization and consider howthese might be applied in the various clients. The work was regarded as“inspirational” by one respondent who indicated that “Exciting timeslie ahead”. The most significant achievements were deemed to be:
• the opportunity to think about legends in new ways and incorpo-rate these ideas in the new generation of mapping clients;
• demonstration that legends can be more information rich andfunctional by providing more than an explanation of symbolmeaning and through higher levels of user interaction that sup-port a number of tasks involved in understanding data;
• raising awareness of possibilities for improving the presentationof other sorts of [aspatial] digital content delivered by EDINA.
The responses link closely to our objectives and the issues raised inestablishing the problem domain. They can be considered as evidenceof success. The first achievement is particularly important as EDINAhas secured financial support for this activity on the basis of the valueof the work undertaken – the Joint Information Systems Committee(JISC) is funding a 12-month service enhancement project to developActive Bi-directional Legends in Digimap clients. This will includea new Geology Mapper and a plan for active legend functionality inother clients. EDINA regard this as “a major step forward for Digimapin approaching how we tackle legend visualization” and describe thevisualization legend work as “making us realise that we had an ex-citing opportunity to do something innovative and beneficial both forthe service and the user’s experience”. A satisfying outcome beyondthe original scope of our rethinking exercise is the suggestion that up-grades to non-GeoSpatial EDINA services may result – supporting ourcontention that the work is of broad relevance.
Reported disappointments included operating within the technolog-ical constraints associated with national service delivery, the realisa-tion that legend visualisation in existing clients was lacking and the
time that will be needed to realize the ideas. Happily, the funding se-cured on the basis of the successes will help with some of these issues.Neither the inconsistency of symbolism between products and data ofdifferent scales, nor possibilities for aggregation / generalization func-tionality were addressed (Fig. 2) – but neither were all themes wereutilised (Fig. 6). The same is true of issues relating to paper legends,which are important in a large number of Digimap use cases. Theseremain open issues requiring creative solutions.
8 CONCLUSION
The paramap makes a significant contribution to geospatial visualiza-tion and other para-information is important in information visualiza-tion. We have argued here that the principles and guidance governinggood map design should also direct good paramap design and we ex-tend this argument to keys, legends and meta-information associatedwith other data graphics that are less “inherently spatial”. This con-tention is explored here with respect to map legends for a national dig-ital data provider through a series of priorities and ideas that emergedfrom users and an assessment of good practice described in the carto-graphic literature. The high-level principles and broad themes devel-oped have shaped design decisions and enable us to use principles andguidance for map design in legend design. We explored the themes andprinciples through data prototypes and suggest that this approach maybe widely beneficial in information visualization where understandingdata is intrinsically linked with understanding data representation.
The various impacts and omissions reported in section 7 indicatethat there is scope for further work to apply, enhance and evaluate thevarious concepts and to extend and enhance the application of visu-alization legends. The general nature of the themes and guidelinesleaves ample room for interpretation and refinement. We need to ex-plore the design space partially described by the concepts presentedhere and address many of the open questions raised regarding use oflegend space as we react to this re-thinking of legends. This work mayinclude: designing and evaluating interactions and controls that sup-port the kinds of dynamism presented here; evaluating legend designsto build on reports of positive effects under certain conditions [47]; un-derstanding, predicting and accounting for the effects of legend insta-bility (in for example the Relevant Legend); establishing meaningfullocations for the mapped legend; the possibility of a Legend Legend aslegend designs use layout and colour in more sophisticated ways.
Working with a large data provider serving mapping data that havetraditionally been considered static and often paper-based has providedsome interesting challenges. We found conducting the imagination ex-ercises highly valuable in this context where opportunities offered byinformation visualization can allow radically different approaches tolegend construction and use. Our prototypes that implemented theseapproaches have with favourable responses from the data provider andhave resulted in new funded activity to implement novel forms of leg-end for end users. This should allow more task-based evaluation andthe approach to be applied, enhanced and evaluated in a wider rangeof data visualization contexts and activities.
Ultimately, design in both cartography and information visualiza-tion involves informed human decision-making, as does effective us-age of the artifacts each discipline produces. We draw attention to theneed to design spatially, whatever the degree of spatiality in a particu-lar data set, or view of it. We hope that a focus on legend design willresult in more cognitively useful and explicitly spatial maps, graphicsand associated para-information to support those using visualization.
ACKNOWLEDGMENTS
This work was supported by the EDINA National Data Centre throughits small-scale development budget. Data were provided by Ord-nance Survey GB and the British Geological Survey. Jackie Clark,James Crone, Fiona Hemsley-Flint, David Medyckyj-Scott, Lasma Si-etinsone, Emma Sutton, Tim Urwin and others at EDINA Geodata Ser-vices and User Support made significant contributions through theiractive involvement in three legends workshops. Four anonymous re-viewers provided detailed and constructive comments – their insightsare appreciated and have helped improve the final manuscript.
898 IEEE TRANSACTIONS ON VISUALIZATION AND COMPUTER GRAPHICS, VOL. 16, NO. 6, NOVEMBER/DECEMBER 2010
REFERENCES
[1] G. Andrienko and N. Andrienko. Interactive maps for visual data explo-
ration. Int. J. Geog. Inf. Science (IJGIS), 13(4):355–374, 1999.
[2] H. R. Aspaas and S. J. Lavin. Legend designs for unclassed, bivari-
ate, choropleth maps. Cart. & Geog. Inf. Science (CAGIS), 16(4):257–
268(12), 1989.
[3] C. A. Brewer. Color use guidelines for mapping and visualization. In
A. M. MacEachren and D. Taylor, editors, Visualization in Modern Car-tography, pages 123–147. Elsevier, Tarrytown, NY, 1994.
[4] C. A. Brewer. Designing Better Maps; A Guide for GIS Users. ESRI
Press, Redlands, CA, 2005.
[5] British Geological Survey. Colour on geological maps.
http://bit.ly/d57FXe, 2010.
[6] British Geological Survey. DiGMapGB - 1:625 000 scale data.
http://bit.ly/dph5vb, undated.
[7] B. Bucher, E. Buard, L. Jolivet, and A. Ruas. The need for web leg-
end services. In G. E. Ware, J. Mark; Taylor, editor, Web and WirelessGeographical Information Systems, Lecture Notes in Computer Science
4857, pages 44–60. Springer, 2007.
[8] W. Cartwright. Extending the map metaphor using web delivered multi-
media. Int. J. Geog. Inf. Science (IJGIS), 13(4):335–353, 1997.
[9] N. Cawthon and A. Vande Moere. The effect of aesthetic on the usability
of data visualization. In IEEE Int. Conf. Info Vis (IV’07), Zurich, Switzer-land, pages 637–648, 2007.
[10] CloudMade. CloudMade makes maps differently.
http://maps.cloudmade.com/, 2010.
[11] C. Collins, F. B. Viegas, and M. Wattenberg. Parallel tag clouds to explore
faceted text corpora. In Proc. of IEEE Symp. VAST, pages 91–98, 2009.
[12] C. W. Cox. Anchor effects and the estimation of graduated circles and
squares. The American Cartographer, 3(1):65–74, 1976.
[13] D. J. Cuff and M. T. Mattson. Thematic Maps: Their Design and Pro-duction. Methuen, New York, NY, 1982.
[14] A. DeLucia and D. Hiller. Natural legend design for thematic maps. TheCartographic Journal, 19(1):46–52, 1982.
[15] B. D. Dent. Cartography: Thematic Map Design. Wm. C. Brown,
Dubuque, IA, second edition, 1990.
[16] D. Dorling, A. Barford, and M. Newman. Worldmapper: The world
as you’ve never seen it before. IEEE Trans. Vis. Comp. Graphics,
12(5):757–764, 2006.
[17] J. A. Dykes. Exploring spatial data representation with dynamic graphics.
Computers & Geosciences, 23(4):345–370, 1997.
[18] J. A. Dykes. An approach to virtual environments for visualization us-
ing linked geo-referenced panoramic imagery. Comp., Env. & Urb. Syst.(CEUS), 24(2):127–152, 2000.
[19] S. Egbert and T. A. Slocum. EXPLOREMAP: an exploration system for
choropleth maps. Ann. Assoc. Am. Geog. (AAAG), 82(2):275–288, 1992.
[20] E. A. Ellehoj and M. R. Coulson. Legend design for soil maps: An ex-
periment. Cart. & Geog. Inf. Syst. (CAGIS), 17(3):225–235, 1990.
[21] D. Fisher. Hotmap: Looking at geographic attention. IEEE Trans. Vis.Comp. Graphics, 13(6):1184–1191, 2007.
[22] J. Floyd, R. Addison, D. Reay, A. Leslie, T. Pharaoh, A. Myers,
P. Turner, J. Arbon, and I. Cooke. A new edition of the bedrock geol-
ogy map of the United Kingdom. In A. Smith, editor, Journal of Maps10.4113/jom.2009.1109, pages 232–252. 2009.
[23] Google Inc. Street View: Explore the world at street level.
http://bit.ly/aCpt2c, 2010.
[24] M. Harrower. Tips for designing effective animated maps. CartographicPerspectives, 44:63–65, 2003.
[25] M. Harrower and C. Brewer. Colorbrewer.org: an online tool for selecting
colour schemes for maps. The Cartographic Journal, 40(1):27–37, 2003.
[26] J. Haslett, R. Bradley, P. Craig, A. Unwin, and G. Wills. Dynamic graph-
ics for exploring spatial data with application to locating global and local
anomalies. The American Statistician, 45(3):234–242, 1991.
[27] J. Haslett, G. Wills, and A. Unwin. SPIDER - an interactive statistical
tool for the analysis of spatial data. Int. Jour. Geog. Inf. Syst. (IJGIS),4(3):285–296, 1990.
[28] J. Heer and G. Robertson. Animated transitions in statistical data graph-
ics. IEEE Trans. Vis. Comp. Graphics, 13(6):1240–1247, 2007.
[29] IEEE Computer Society V>C. VisWeek 2010: InfoVis Welcome.
http://bit.ly/bcUR19, 2010.
[30] B. Jenny, E. Hutzler, and L. Hurni. Self-Adjusting legends for propor-
tional symbol maps. Cartographica, 44(4):301–304, 2009.
[31] L. Jolivet. On-demand map design based on user-oriented specifications.
In Proc. AutoCarto 08, Shepherdstown, WV, 2008. CAGIS.
[32] L. Jolivet. Characterizing maps to improve on-demand cartography - the
example of european topographic maps. In Proc. of the 17th GIS ResearchUK Annual Conference, Durham, UK, 2009. University of Durham.
[33] J. Keates. Some reflections on cartographic design. The CartographicJournal, 30(2):199–201, 1993.
[34] R. Kitchin. The practices of mapping. Cartographica, 43(3):211–215,
2008.
[35] J. Krygier. Cartographic multimedia and praxis in human geography and
the social sciences. In W. Cartwright, M. Peterson, and G. Gartner, edi-
tors, Multimedia Cartography, pages 245–256. Springer, 1999.
[36] J. Krygier, C. Reeves, D. DiBiase, and J. Cupp. Design, implementation
and evaluation of multimedia resources for geography and earth science
education. J. Geog. in Higher Ed. (JGHE), 21(1):17–39, 1997.
[37] N. Kumar. Frequency histogram legend in the choropleth map: A
substitute to traditional legends. Cart. & Geog. Inf. Science (CAGIS),31(4):217–236, 2004.
[38] G. Lakoff. Women, Fire, and Dangerous Things: What Categories Revealabout the Mind. University of Chicago Press, Chicago, IL, 1987.
[39] D. Lloyd. Evaluating human-centered approaches for geovisualization.
PhD thesis, City University London, 2010.
[40] A. Lobben and D. K. Patton. Design guidelines for digital atlases. Car-tographic Perspectives, 44:51–62, 2003.
[41] A. MacEachren. How Maps Work: Representation, Visualization andDesign. Guildford Press, New York, NY, 1995.
[42] B. Medynska-Gulij. PointSymbols: investigating principles and original-
ity in cartographic design. Cartographic Journal, 45(1):62–67, 2008.
[43] Open Geospatial Consortium, Inc. Styled Layer Descriptor.
http://bit.ly/64hWjy, 2010.
[44] Ordnance Survey. OS Landranger (1:50,000 scale) map symbols.
http://bit.ly/d4N4RJ, 2002.
[45] Ordnance Survey. Strategi user guide and technical specification: v6.3.
http://bit.ly/9VUCwz, 2006.
[46] M. Peterson. Active legends for interactive cartographic animation. Int.J. Geog. Inf. Science (IJGIS), 13(4):375–383(9), 1999.
[47] N. H. Riche, B. Lee, and C. Plaisant. Understanding interactive legends:
a comparative evaluation with standard widgets. Computer Graphics Fo-rum, 29(3):1193–1202, 2010.
[48] A. H. Robinson, J. L. Morrison, P. C. Muehrcke, A. J. Kimerling, and
S. C. Guptill. Elements of Cartography. Wiley, New York, NY, 1995.
[49] R. Sieber, C. Schmid, and S. Wiesman. Smart Legend - Smart Atlas. In
Proc. XXII Int. Carto Conf. (ICC2005), 2005.
[50] A. Skupin. From metaphor to method: Cartographic perspectives on in-
formation visualization. In Proc. IEEE Symp. Information Visualization2000, pages 91–97, 2000.
[51] A. Skupin and S. Fabrikant. Spatialization methods: A cartographic
research agenda for non-geographic information visualization. Cart. &Geog. Inf. Science (CAGIS), 30(2):99–120, 2003.
[52] A. Slingsby, J. Dykes, and J. Wood. Configuring hierarchical layouts to
address research questions. IEEE Trans. Vis. Comp. Graphics, 15(6):977–
984, 2009.
[53] T. A. Slocum, R. B. McMaster, F. C. Kessler, and H. H. Howard. The-matic Cartography & Geovisualization. Series in Geographic Informa-
tion Science. Prentice Hall, Upper Saddle River, NJ, third edition, 2009.
[54] J. P. Snyder. Map Projections: A Working Manual Edition. USGS Pro-
fessional Paper. US Geological Survey, 1987.
[55] E. Sutton, D. Medyckyj-Scott, and T. Urwin. The EDINA Digimap Ser-
vice 10 Years On. The Cartographic Journal, 44(3):268–275, 2007.
[56] W. Tobler. Thirty five years of computer cartograms. Ann. Assoc. Am.Geog. (AAAG), 94(1):58–73, 2004.
[57] A. Unwin. Requirements for interactive graphics software for exploratory
data analysis. Computational Statistics, 14(1):7–22, 1999.
[58] L. Wilkinson and M. Friendly. The history of the cluster heat map. TheAmerican Statistician, 63(2):179–184, 2009.
[59] W. Willett, J. Heer, and M. Agrawala. Scented widgets: Improving
navigation cues with embedded visualizations. IEEE Trans. Vis. Comp.Graphics, 13(6):1129–1136, 2007.
[60] D. Wood. The Power of Maps. The Guilford Press, New York, NY, 1992.
[61] D. Wood and J. Fels. The natures of maps: Cartographic constructions of
the natural world. Cartographica, 43(3):189–202, 2008.
[62] J. Wood and J. Dykes. Spatially ordered treemaps. IEEE Trans. Vis.Comp. Graphics, 14(6):1348–1355, 2008.
899DYKES ET AL: RETHINKING MAP LEGENDS WITH VISUALIZATION