Information dissemination framework for context-aware products
Upload
khangminh22Category
view
0download
0
CAVISAP: CONTEXT-AWARE
VISUALIZATION OF AIR
POLLUTION WITH IOT PLATFORMS
Nurgazy Meruyert
Computer Science and Engineering, master's level
2019
Luleå University of Technology
Department of Computer Science, Electrical and Space Engineering

This thesis is prepared as part of a European Erasmus Mundus programme
PERCCOM - Pervasive Computing & COMmunications for sustainable
development.
This thesis has been accepted by partner institutions of the consortium (cf. UDL-DAJ,
no1524, 2012 PERCCOM agreement).
Successful defence of this thesis is obligatory for graduation with the following national
diplomas:
• Master in Complex Systems Engineering (University of Lorraine)
• Master of Science in Technology (LUT University)
• Master in Pervasive Computing and Communications for Sustainable Development
(Luleå University of Technology)

ii
ABSTRACT
LUT University
School of Engineering Science
Erasmus Mundus Master’s Program in Pervasive Computing & Communications for Sustainable Development (PERCCOM)
Meruyert Nurgazy
CAVISAP: Context-aware visualization of air pollution with IoT platforms
Master’s Thesis
2019
95 pages, 31 figures, 22 tables, 1 appendix
Examiners: Professor Eric Rondeau (University of Lorraine) Professor Jari Porras (LUT University)
Associate Professor Karl Andersson (Luleå University of Technology)
Keywords: context-aware, data visualization, air pollution, Internet of Things
Air pollution is a severe issue in many big cities due to population growth and the rapid
development of the economy and industry. This leads to the proliferating need to monitor
urban air quality to avoid personal exposure and to make savvy decisions on managing the
environment. In the last decades, the Internet of Things (IoT) is increasingly being applied
to environmental challenges, including air quality monitoring and visualization. In this
thesis, we present CAVisAP, a context-aware system for outdoor air pollution visualization
with IoT platforms. The system aims to provide context-aware visualization of three air
pollutants such as nitrogen dioxide (NO2), ozone (O3) and particulate matter (PM2.5) in
Melbourne, Australia and Skellefteå, Sweden. In addition to the primary context as
location and time, CAVisAP takes into account users’ pollutant sensitivity levels and
colour vision impairments to provide personalized pollution maps and pollution-based
route planning. Experiments are conducted to validate the system and results are discussed.

iii
ACKNOWLEDGEMENTS
I would like to thank PERCCOM consortium and partners for selecting me to be a part of
such an excellent program and for providing an opportunity to grow both professionally
and personally.
I would like to express my sincere gratitude to Prof. Arkady Zaslavsky for his continuous
supervision and support. Thanks to Dr. Prem Jayaraman, Dr. Sylvain Kubler, Dr. Karan
Mitra and Dr. Saguna Saguna for their help and guidance during different phases of the
research. Moreover, I would like to thank Deakin University and Lulea University of
Technology for provided facilities and financial aid to successfully accomplish this thesis.
I am thankful to all PERCCOM mates for incredible two years of journey together. Special
thanks to Caroline for her continuous support.
Last but not least, I would like to express my deepest gratitude to my family and friends for
their unconditional love and infinite support.
Melbourne, 11 April 2019
Meruyert Nurgazy

4
TABLE OF CONTENTS
1 INTRODUCTION .............................................................................................. 9
1.1 RESEARCH MOTIVATION ........................................................................................ 11
1.2 PROBLEM DEFINITION ............................................................................................ 12
1.2.1 Research Aim, Questions and Objectives .................................................... 13 1.2.2 Research Methodology ................................................................................ 13
1.3 RESEARCH SCOPE .................................................................................................. 14
1.4 CONTRIBUTION ...................................................................................................... 14
1.5 IT FOR SUSTAINABILITY ........................................................................................ 15
1.6 THESIS OUTLINE .................................................................................................... 16
2 THEORETICAL BACKGROUND AND RELATED WORK ............................ 17
2.1 THE INTERNET OF THINGS ..................................................................................... 17
2.1.1 IoT Architecture ........................................................................................... 17 2.1.2 IoT Platforms ............................................................................................... 20 2.1.3 IoT Application Areas .................................................................................. 23
2.2 CONTEXT-AWARE COMPUTING ............................................................................. 25
2.2.1 Defining Context .......................................................................................... 25 2.2.2 Context Spaces Theory ................................................................................ 27
2.3 DATA VISUALIZATION ........................................................................................... 28
2.3.1 Context-driven Visualization ....................................................................... 29 2.3.2 GIS Data Visualization ................................................................................ 30
2.4 AMBIENT AIR POLLUTION ..................................................................................... 31
2.4.1 Air Pollution Monitoring ............................................................................. 32 2.4.2 The Role of Air Pollution Monitoring .......................................................... 35
2.5 STATE-OF-THE-ART ON CONTEXT-AWARE AIR POLLUTION VISUALIZATION ......... 37
2.6 SUMMARY .............................................................................................................. 42
3 CONTEXT-AWARE AIR POLLUTION VISUALIZATION MODEL ................ 44
3.1 CONTEXT MODELLING ........................................................................................... 44
3.2 SITUATION REASONING ......................................................................................... 48
3.3 SUMMARY .............................................................................................................. 52
4 SYSTEM ARCHITECTURE AND IMPLEMENTATION .................................. 53

5
4.1 SYSTEM ARCHITECTURE AND COMPONENTS ......................................................... 53
4.2 DATA ACQUISITION AND STORAGE ........................................................................ 54
4.3 DATA PROCESSING ................................................................................................ 55
4.4 DATA VISUALIZATION ........................................................................................... 57
4.5 SUMMARY .............................................................................................................. 62
5 EXPERIMENTS, RESULTS AND DISCUSSION ........................................... 63
5.1 EXPERIMENTS AND RESULTS ................................................................................. 63
5.2 SUSTAINABILITY ANALYSIS ................................................................................... 70
6 CONCLUSIONS AND FUTURE RESEARCH ................................................ 75
6.1 CONCLUSIONS ........................................................................................................ 75
6.2 FUTURE RESEARCH DIRECTIONS ........................................................................... 76
7 REFERENCES ............................................................................................... 77

6
LIST OF FIGURES Figure 1. UN Sustainability Development Goals. [12] ........................................................ 11 Figure 2. CAVisAP motivating scenario illustration. .......................................................... 12 Figure 3. DSRM methodology. [16] .................................................................................... 14 Figure 4. CAVisAP positioning in the sustainability triangle. ............................................ 15 Figure 5. IoT Architecture versions: a) Three-layered; [28] b) Five-layered; [30] c) CISCO reference model. [31] ........................................................................................................... 19 Figure 6. A Reference Architecture for IoT. [34] ................................................................ 20 Figure 7. Building blocks of IoT platform [36] ................................................................... 21 Figure 8. Context Space illustration. [70] ............................................................................ 28 Figure 9. The role of monitoring in air quality management. [5] ........................................ 36 Figure 10. Application Space example based on CST. ........................................................ 45 Figure 11. The CAVisAP layered system architecture. ....................................................... 53 Figure 12. System Architecture and Components. .............................................................. 54 Figure 13. Screenshots from ThingsBoard: a) Virtual sensors; b) Latest telemetry data. ... 55 Figure 14. Example question to define pollutant sensitivity levels. .................................... 56 Figure 15. Example of user profile information. ................................................................. 56 Figure 16. Query to find devices in a proximity radius. ...................................................... 57 Figure 17. NodeRED workflow. .......................................................................................... 58 Figure 18. Initialization of map object. ................................................................................ 59 Figure 19. Different visualization methods applied for the same dataset: a) heat map; b) pollution spots map; c) pinpoints; d) pinpoints with indices. .............................................. 60 Figure 20. Set of colour hues used for visualization: a) multi-hue; b) single-hue. .............. 60 Figure 21. Function to calculate distance between coordinates. .......................................... 61 Figure 22. Pollution-safe route visualization implementation. ............................................ 61 Figure 23. Visualization of context-aware route planning: a) for healthy person; b) for pollutant-sensitive person. ................................................................................................... 62 Figure 24. Location of the stations in the first experiment. ................................................. 64 Figure 25. Visualization of the same air pollution data for users with different sensitivity levels: a) neutral; b) low; c) moderate; d) high e) extremely high ...................................... 65 Figure 26. Visualization colour schemes: a) default; b) colour-blind safe. ......................... 66 Figure 27. Route alternatives from origin to destination. .................................................... 67 Figure 28. Context-aware pollution-safe route suggestions for: a) Alice; b) Bob; c) Jack. 70 Figure 29. Conceptual framework of influence of data visualization on policy-making. ... 71 Figure 30. Data compact. [142] ........................................................................................... 72 Figure 31. CAVisAP five-dimensional sustainability analysis. .......................................... 72

7
LIST OF TABLES
Table 1. IoT platforms comparison. ..................................................................................... 22 Table 2. AQI values, meaning and actions to protect health. [88] ...................................... 32 Table 3. AQI pollutant-specific categories. [88] ................................................................. 34 Table 4. European AQI standards. [89] ............................................................................... 34 Table 5. Australian AQI standards. [90] .............................................................................. 35 Table 6. A taxonomy to compare the state-of-the-art. ......................................................... 37 Table 7. The state-of-the-art literature comparison. ............................................................ 39 Table 8. A list of selected context attributes. ....................................................................... 46 Table 9. Context attributes, their value types and ranges. ................................................... 47 Table 10. Situation Spaces of the proposed model. ............................................................. 51 Table 11. Colour schema for CAVisAP data visualization. ................................................ 51 Table 12. Pollutant sensitivity levels of users. ..................................................................... 63 Table 13. AQI values at each station. .................................................................................. 64 Table 14. Situation Reasoning at each station. .................................................................... 64 Table 15. Sensitivity to NO2, O3 and PM2.5. ........................................................................ 65 Table 16. Air quality at each station. ................................................................................... 66 Table 17. Simulated user profiles for pollution-safe route suggestions experiment. .......... 66 Table 18. Air quality at each station. ................................................................................... 67 Table 19. Distance of stations from the route alternatives. ................................................. 68 Table 20. Situations along the route alternatives. ................................................................ 68 Table 21. Situation reasoning at each route alternative. ...................................................... 69 Table 22. Immediate, enabling and structural effects of CAVisAP .................................... 73

8
LIST OF SYMBOLS AND ABBREVIATIONS
AMQP Advanced Message Queuing Protocol
AQI Air Quality Index
AWS Amazon Web Services
CoAP Constrained Application Protocol
CST Context Spaces Theory
DDS Data Distribution Service
ECSTRA Enhanced Context Spaces Theory Based Reasoning Architecture
EEA European Environmental Protection Agency
GIS Geographical Information Systems
GPLv3 GNU General Public License, version 3
HTTP Hypertext Transfer Protocol
HTTPS Hypertext Transfer Protocol Secure
IERC Internet of Things European Research Cluster
IoT Internet of Things
LGPLv3 GNU Lesser General Public License, version 3
MQTT Message Queue Telemetry Transport
M2M Machine to Machine
NFC Near-field Communication
REST Representational State Transfer
UN United Nations
XMPP Extensible Messaging and Presence Protocol
CO Carbon Monoxide
CO2 Carbon Dioxide
NO2 Nitrogen Dioxide
O3 Ozone
PM Particulate Matter
SO2 Sulphur Dioxide

9
1 INTRODUCTION
Air pollution is a rapidly evolving concern in the past decades with the growth of pollution
sources worldwide. According to the European Environment Agency (EEA) pollutants are
released to the air from a wide range of sources including transport, agriculture, industry,
waste management and households [1]. Rapid urbanization and industrial growth
exacerbate the problem and the pressure felt severely in big cities. However, air pollution
does not respect borders. Air pollutants and heavy metals are carried by wind,
contaminating water and soil far from the origin [2]. Therefore, air pollution is not a
problem of solely industrial regions but a global burden which affects all parts of society.
According to the World Health Organization (WHO), 92% of population in our planet lives
in the areas that exceed ambient air quality limits. In addition, the report states that air
pollution is the largest environmental risk to health, being responsible to each ninth deaths
per year. Moreover, statistics show that outdoor air pollution alone is a cause of 3 million
deaths annually [3].
Human exposure to air pollution may cause different health issues depending on the
duration of exposure, type of pollutant and the toxicity level of the pollutant. The WHO
present air quality guidelines to explain in details health effects of various pollutants [4].
The health effects of air pollution can vary from difficulty in breathing, nausea or skin
irritation to cancer. The most widespread health effects observed by different
investigations include reduced lung functioning, asthma attacks, development of
respiratory diseases and premature death [5].
Atmospheric environmental protection, including air quality management, response
policies, health impact and risk assessment as well as air pollution modelling would be
impossible without quantitative description of air quality with measurable quantities. The
aim of the air quality management is to keep the ambient air clean enough so that it is safe
for the public health and the environment. In order to assess status of the air, current air
quality must be monitored. Public awareness of air pollution can contribute to both
reducing emission levels and decreasing exposure. Moreover, the air quality information is
required by scientists, regional and national policy-makers and planners to enable them to
make savvy decisions on managing the environment. Air quality monitoring provides
necessary scientific basis for developing policies, setting objectives and planning

10
enforcement actions [5]. Despite the importance of measurements, in many cases,
monitoring alone may be insufficient for the purpose of fully defining population exposure
in the environment. Therefore, monitoring often needs to be combined with other objective
assessment techniques, including modelling, personalization and visualization of
measurements. Traditionally air quality monitoring is based on air quality stations operated
by national environmental protection agencies. These stations provide highly accurate
measurements; however, the coverage area is limited. Therefore, numerous new
approaches are emerging in order to provide highly resolved air quality visualization [6].
In the last decades Internet of Things (IoT) is increasingly being applied to environmental
challenges, including air quality monitoring, visualization and prediction. [7] defines IoT
as “an interconnection of sensing and actuating devices providing the ability to share
information across platforms through a unified framework.” Introducing IoT into the field
of environmental monitoring provides opportunity to get more accurate data in near real-
time [6]. However, there are numerous challenges in adopting IoT for environmental
issues. According to CISCO’s report, in 2017 there were 18 billion Internet-connected
smart devices, their forecasted number by 2022 is 28.5 billion [8]. This leads to the
generation of an enormous amount of data that has to be stored, computed and visualized
in an easily interpretable and efficient form.
Data generated by billions of devices might not have any value unless it is processed and
interpreted. Numerous data collection, modelling and reasoning techniques are evolved to
add a value to raw data coming from IoT devices [9]. One of the fields which gained
increased significance on processing raw data is context-aware computing. Context-aware
approach deals with raw information to provide meaningful context information which can
characterize the user’s situation and provide personalized services. Location, time, user and
activity can be considered as primary context types. Systems which use context in order to
provide service are considered as context-aware [10].
Application of the context-aware approach to outdoor air pollution monitoring enable
systems to understand user’s needs and provide relevant information. Consequently,
context-aware computing enables to process data efficiently and store only meaningful
information which is crucial in the era of billions of smart connected devices and big data.

11
1.1 Research Motivation
In September 2015, countries around the world adopted global Sustainable Development
Goals (SDGs) defined by United Nations (UN). The set of goals are aimed to end poverty
and hunger, protect the planet and resources and increase the quality of life and others as
presented in Figure 1. Sustainable Development Goal 3, target 3.9 focuses on ensuring
well-being and good health for world population considering substantially reducing the
number of illnesses and deaths caused by air pollution by 2030 [11].
Figure 1. UN Sustainability Development Goals. [12]
The 2009/10 Global Information Technology Report from World Economic Forum’s
(WEF) stated that “information and communication technologies meant to play important
role to enable sustainable growth”. The 2019 WEF IoT for Sustainable Development
project analysis found that 84% of IoT deployments are currently addressing, or have the
potential to address, the SDGs as defined by the UN [13].
The main motivation of this thesis is to apply IoT to create public awareness on outdoor air
pollution. Creating knowledge and awareness of air quality status which citizens can view
and personalize is critically important, because it affects health and well-being [14]. The
study aims to use context-aware approach to provide personalized and task-relevant
information on air quality which enables citizens and policy-makers to take immediate
actions and avoid polluted sites.
Motivating scenario. Consider the following example illustrating the necessity for real-
time visualization of outdoor air pollution according to user context. Alice and Jack live in

12
the same neighbourhood in Skellefteå. They both work downtown and commute to there
by bike. Figure 2 illustrates possible routes from their neighbourhood to the work.
Figure 2. CAVisAP motivating scenario illustration.
Jack has extremely high sensitivity to small particles; therefore, he always needs to be
cautious about air pollution. However, Alice is a healthy person. The same level of
pollution exposure can affect them differently.
The illustration shows three routes A, B and C with low, moderate and high levels of
particulate matter pollution respectively. For Jack even moderate level of particulate matter
is critical and his overall AQ situation is poor at route B and C. Therefore, Jack needs to
take route A. Even though high level of particulate matter is critical for Alice, she is
tolerant for the moderate level. Therefore, Alice can take route B which is shorter but more
polluted than route A. Conventional navigation systems such as Google Maps [15] do not
consider user’s context when providing route alternatives. Therefore, there is a need to
build a context-aware system which enable walkers and bikers to avoid polluted areas.
1.2 Problem Definition
The core problem of this work is to incorporate context-awareness to IoT data visualization
in outdoor air pollution use case. The same levels of air pollution data streams received

13
from IoT devices might have different meaning for users with different pollution
sensitivity levels. Therefore, data visualization must be personalized according to the user
context.
1.2.1 Research Aim, Questions and Objectives
The research aim of this thesis is to model, build and validate a real-time IoT-enabled
context-aware visualization system applied for outdoor air pollution use case.
To address this aim, we define the following research questions:
1. What is the state-of-the-art in the literature applied for IoT-based context-aware
air pollution visualisation?
2. How to build a context-aware model to personalize air pollution visualisation?
3. How to implement and validate the proposed context-aware system for air pollution
visualisation?
In order to answer to each of the research questions the research objectives are defined.
Each objective tackles a research question in respective order.
1. To investigate the state-of-the art literature applied for IoT-based context-aware
air pollution visualisation.
2. To define personalization criteria and develop a generic model for context-aware
visualisation of air pollution maps.
3. To implement and validate the system prototype in a real-life scenario.
1.2.2 Research Methodology
It is important to follow a predefined methodology to perform a reliable research. A type of
methodology chosen for a research is defined by objectives. This study aims to create an
artefact to solve a real-life problem, therefore, Design Science Research Methodology
(DSRM) introduced in [16] is chosen as a methodology. The DSRM consists of six steps as
shown in Figure 3. The first step is problem identification and motivation. A state-of-the-
art literature review must be conducted in order identify research gaps. The next step is

14
defining objectives of the research. At this stage a novel contribution of the study must be
investigated. The next step is design and development. A model of the solution must be
designed, then implemented. At the demonstration and evaluation steps solution of the
problem must be experimented and validated. The last step is communication where results
of the research must be published and shared with the research community.
Figure 3. DSRM methodology. [16]
1.3 Research Scope
This thesis is concerned with efficient visualization of air pollution heatmaps for outdoor
environments and providing users with pollution-based route planning. The scope of the
project covers IoT enabled smart objects with air quality sensing capabilities and open air
quality data collection, preliminary processing and aggregation in the IoT platform-based
prototype system.
1.4 Contribution
The thesis contribution can be listed as follows
• to propose a model to define user context and provide personalized situation
reasoning based on outdoor air pollution;
• to develop a system prototype to illustrate personalized outdoor air pollution
visualization and pollution-safe route planning;
• to evaluate the developed system in real-life scenario;

15
• Moreover, two research papers, containing findings of this thesis were submitted
and accepted for publication in the 2019 International Conference on High
Performance Computing & Simulation (HPCS 2019) and the 9th International
Conference on the Internet of Things [17] [18].
1.5 IT for Sustainability
Numerous definitions for sustainability are given, but the most common one is from United
Nations (UN) [19] which states that sustainability is “a development that meets the needs
of the present without compromising the ability of future generations to meet their own
needs”. As a part of PERCCOM program [20], [21] this thesis aims to use ICT capabilities
to solve global sustainability issues.
The most popular framework to evaluate sustainability of a system is a triple-bottom-line
perspective which considers economic, environmental and social aspects. This thesis
considers air pollution use case. Moreover, provision of personalized air pollution
heatmaps prevents citizens from inhalation of polluted air. Therefore, the thesis can be
considered more as a social project than financial. The three-dimensional sustainability
positioning of the CAVisAP system illustrated in Figure 4.
Figure 4. CAVisAP positioning in the sustainability triangle.
Creating awareness on air pollution can contribute to both reducing exposure and
decreasing emission levels. Moreover, the air quality information is required by scientists,
regional and national planners and policy-makers to support them in taking savvy decisions
on managing and controlling the environment. Air quality monitoring provides necessary

16
scientific basis for developing policies, setting objectives and planning enforcement
actions [5].
The sustainability aspect of the thesis lies on creating awareness on environmental
problems by harnessing potential of IoT to sense pollution and providing context-aware
visualization which can help citizens to avoid pollution exposure and governments to make
informed decisions. At the discussions section a detailed sustainability analysis of the
thesis is provided.
1.6 Thesis Outline
The remainder of the thesis is structured as follows.
Chapter 2 – Theoretical Background and Related Work. The second chapter presents
state-of-the-art literature review and background knowledge in context-aware air quality
monitoring and visualization. Related existing systems were analyzed according to a
predefined criterion. The research gaps were identified. The conclusion of this chapter sets
up a foundation for the proposed thesis.
Chapter 3 – Context-Aware Air Pollution Visualization Model. In the third chapter we
present Context-Spaces Theory (CST)-based context modelling. Algorithms to define user
context in terms of pollutant sensitivity, situation reasoning and pollution-safe route
building is presented.
Chapter 4 - System Architecture and Implementation. The fourths section demonstrates
system architecture, its components and presents system implementation process.
Chapter 6 - Experiments, Results and Discussion. In the sixth chapter the outcome of
system testing in real life scenario is presented and model validation is illustrated.
Chapter 7 - Conclusion and Future Research. The last chapter concludes the results of
the research and discusses the future work.

17
2 THEORETICAL BACKGROUND AND RELATED WORK
This chapter introduces the theoretical background work and related literature analysis of
the thesis.
2.1 The Internet of Things A term Internet of Things (IoT) was first introduced by Kevin Ashton in 1999 on supply
chain management [22]. According to ITU, IoT is a major enabler of ubiquitous computing
which provides a connectivity anytime, anywhere, by anyone and anything [23]. As
identified by [24] IoT can be considered as a result of convergence of three paradigms such
as Internet-oriented vision(middleware), things-oriented vision(sensors) and semantic-
oriented vision(knowledge).
Despite small differences on defining IoT, the vision of IoT has been massively
strengthened by statistics and forecasts. Gartner states that there will be 20 billion devices
connected to the Internet by 2020 [25]. 98% of survey respondents conducted by
McKinsey report that majority of companies in their sector consider IoT initiatives in their
roadmap. Moreover, the same source claims that IoT has a potential to generate about $4
billion to $11 trillion in economic value by 2025 [26]. The reason of such huge figures to
be forecasted is that connectivity and communication in the IoT paradigm enables its
application in many domains. As an example, IoT Analytics group shortlisted the most
popular IoT application areas including industry, smart city, energy, agriculture, e-health
and supply chain [27].
2.1.1 IoT Architecture
As it was mentioned, the term IoT was coined only two decades ago. Therefore, the
paradigm is relatively new to have a single standardized architecture for IoT system.
Numerous proposals were made by different research groups. The most simplistic model is
three-layered architecture consisting of the Application, Network and Perception layers
presented in [28], [29]. Moreover, in [30] authors illustrate extended version of this
architecture overall consisting of five layers: Perception, Network, Middleware,

18
Application and Business layers. Since five-layer architecture comprises the one with three
layers, we give a brief description of a former one:
1. Perception layer consists of all physical devices such as sensors and actuators and
connects physical and virtual worlds.
2. Network layer handles communication between devices and data transmission to
the processing layer.
3. Middleware layer or processing layer covers device services management, data
storage, filtering and processing.
4. Application layer is responsible for global management of a system based on the
object information processed in the lower level. Examples of services in this layer
can be smart home or e-health applications.
5. Business layer handles complete management of an IoT system. Business layer
builds business models and defines future strategies depending on the data provided
by application layer.
These proposals give a basic idea on building blocks of IoT; however, they are limited to
describe holistic system architecture of IoT. Therefore, there is a need for a reference
model, which could provide a more descriptive overview of the system in a greater level of
abstraction. There were several attempts to establish a reference model by numerous
research groups. Cisco presented a seven-layer IoT reference model at IoT World Forum in
2014 [31]. The main difference of Cisco’s model from the five-layered IoT architecture is
introduction of Edge Computing as a layer. Moreover, the model divided middleware layer
into two separate layers of Data Accumulation and Data Abstraction, where former is
responsible for data storage and latter for data filtering and processing. Figure 5 illustrates
three-layered and five-layered IoT architectures as well as Cisco’s IoT reference model.

19
Figure 5. IoT Architecture versions: a) Three-layered; [28] b) Five-layered; [30] c) CISCO
reference model. [31]
The same year with Cisco, WSO2 and year later IoT-A demonstrated their versions of
reference models for IoT [32], [33]. Overall architecture of the WSO2 model consists of
five layers as Devices, Communications (MQTT, HTTP), Aggregation (Enterprise Shared
Bus and Message Broker), Event Processing and Analytics and Client/External
Communications (Web Portal, Dashboard, APIs), which can be correlated with five-layer
architecture. However, by introducing cross-cutting layers as Device Manager and Identity
and Access Management the model differentiated itself from traditional IoT architectures.
Device management layer maintains the list of device identities and map thesis into
owners. Identity and Access Management layer handles token issuing and validation,
policy management for access control and manages directory of users. More extended
version of WSO2 reference model was developed by authors in [34]. The model extended
by Service Layer between data aggregation and event processing layer. The layer consists
of Resources Management and Service Repository and Discovery services. In addition,
to enhance security and privacy in different layers authors introduced a vertical layer
which enables to uniquely identify objects and control access to them. Figure 6 presents a
visual illustration of a reference architecture proposed in [34].

20
Figure 6. A Reference Architecture for IoT. [34]
2.1.2 IoT Platforms
Having in mind a clear picture of IoT architecture from the previous chapter now we are
able to analyse IoT platforms. The IoT platforms consist of a huge number of objects
distributed all around the world. It connects edge devices and gateways to cloud services
and applications. Indeed, IoT Platform is a central piece in the IoT ecosystem that connects
physical world with virtual world. Nowadays, IoT platform functional blocks are a
trending field of research. Authors in [7] define three major IoT components such as
hardware, middleware and presentation which basically covers the three-layer IoT
architecture discussed at the previous section. Another research states that fully functional
IoT system should have six main elements such as sensing, communication, computation,
services, semantics and identification [35]. In addition, IoT Analytics group proposes a
detailed overview of IoT Platform, which consists of 8 major building blocks [36] which is
present in Figure 7.

21
Figure 7. Building blocks of IoT platform [36]
Nowadays a number of IoT platforms is rising rapidly. It is hard to state exact figures;
however, different research and analytic groups attempt to identify approximate number of
platforms in the market. The most up to date information from IoT Analytics group
presents a list of 450 IoT Platforms worldwide operating in different sectors [37]. The
same source marks a 25% increase compared to the previous year. Several surveys are
conducted by various research groups to assess different aspects of these IoT platforms. It
is a time-consuming job to compare all existing platforms in the market, in addition, there
is no unified standards to evaluate all platforms. Therefore, researchers select certain
amount of the IoT platforms to review according to their pre-defined comparison criterion.
Authors in [38] present a survey of 28 platforms according to their application domain.
Another research group summarizes 14 publicly available IoT platforms against pre-
defined metrics [35]. A survey of platforms for massive IoT is presented in [39], which
takes into account metrics such as device management and integration, security,
communication protocols, data analytics type and support for visualization. A
comprehensive survey and gap analysis of IoT platforms is conducted by researchers in
[40] which review around 40 IoT platforms with respect to the support for heterogeneous
devices, security and privacy, data processing and data sharing capabilities, support to

22
developers, maturity of an IoT ecosystem, and the availability of dedicated IoT
marketplaces.
Taking into account findings from the discussed surveys we shortlisted the most popular
platforms which are a subject of review in most of the papers. Table 1 presents shortlisted
10 platforms which are discussed in the majority of related work.
Table 1. IoT platforms comparison.
Platform Open- source Architecture Device
communication Security Last update
Developer support
AWS IoT [41] no cloud-based MQTT,
HTTP1.1
Link Encryption, Authentication (SigV4, X.509)
May 2019 ***
Carriots no cloud-based MQTT unknown unknown ***
IBM Watson
[42] no cloud-based MQTT, HTTPS
Link Encryption, Authentication,
Identity management
Jun 2018 ***
KAA Apache license
2.0 unknown MQTT, CoAP unknown Oct 2016 **
MS Azure [43]
no cloud-based HTTP, AMQP, MQTT
Link Encryption (SSL/TSL)
May 2019 ***
OpenIoT LGPLv3 decentralized X-GSN
OAuth 2.0 authentication,
permissions and roles
Nov 2015 *
Things Board
Apache license
2.0 cloud-based CoAP, HTTP,
MQTT Authentication, token request
May 2019 ***
Thing Speak no centralized/
cloud-based MQTT,
WebSocket 2-level
authentication April 2019 *
Thing Worx no cloud-based
WebSocket, AMQP, MQTT, XMPP, CoAP,
DDS
Identity Management,
Standards (ISO 27001),
Jan 2019 *
Xively no
(except libraries)
cloud-based
Sockets/ WebSocket,
HTTP, HTTPS, MQTT
Link Encryption (SSL/TSL) Sep 2018 **
Commercial IoT platforms provided by world-known companies such as Amazon, IBM
and Microsoft are definitely of high standard and excellent support for developers.
However, their services come with price and are not within delimitations of this research
[41]–[43]. After several years of open availability platforms such as ThingSpeak and
ThingWorx are turned into commercial projects [44], [45]. Xively is now part of the

23
Google Cloud Platform [46]. Another former open-source platform Carriots is acquired by
Altair global technology company [47]. OpenIoT open source IoT platform had a huge
vision at the start of the project, however, the last release was four years ago [48]. Majority
of the dependencies of the platform are outdated and developer support is in a poor level.
KAA is one of the popular IoT platforms which has both commercial and open-source
versions [49]. However, the open-source version was last updated in 2016 and developer
support of the project is in a moderate level. ThingsBoard is relatively new platform which
is gaining increased popularity in the recent years in open source community and among
researchers [50]–[52]. The platform provides near to real-time developer support and
constant releases. In addition, quick installation process, easy-to-use administration
interface makes the platform desirable to use for any IoT solution. Taking into account the
comparison results, for this research ThingsBoard is selected as an IoT platform of choice.
2.1.3 IoT Application Areas
Potential applications of the IoT are various and diverse, spreading out to all intents and
purposes of every-day life of people, businesses and society as an entire. European
Research Cluster for Internet of Things (IERC) has a vision of “the major application fields
for IoT are the creation of smart environments/spaces and self-aware things for climate,
food, energy, mobility, digital society and health applications” [53] Authors in [24] state
that a wide range of IoT application domains can be grouped into Transportation and
Logistics, Healthcare, Smart Environment and Personal and Social domain. However,
IERC has defined a more extended version of IoT application fields which consists of
Smart Planet, Smart Cities, Smart Energy, Smart Buildings, Smart Transport, Smart
Industry, Smart Health and Smart Living [53]. In [54] IERC researchers presented a list of
the most trending IoT application scenarios in 12 different domains:
1. Smart city is relatively more popular domain where IoT is applied to create
awareness on status of different buildings, visualize traffic congestion and urban
noise as well as to monitor availability of parking spaces. Moreover, waste
management, street lights and transportation systems are optimized by adoption of
IoT.

24
2. Smart environment is another key area where IoT enables air pollution monitoring
and control, forest fire detection, soil moisture detection and earthquake early
detection.
3. Smart water is an area where IoT is applied for studies of water quality in rivers
and sea as well as for pipe water leakages and river floods detection.
4. Smart metering area enhanced by IoT with energy consumption monitoring and
management in smart grids, solar energy plants control, silos stock calculation and
other.
5. Security & Emergencies area applies IoT for access control to restricted areas,
liquid detection in data centers and other sensitive buildings, to assess radiation
levels and detect explosive and hazardous gases.
6. Retail domain utilizes IoT for NFC payments, smart shopping applications and
smart warehouse management.
7. Logistics domain applies IoT for monitoring item location, shipment conditions and
storage incompatibility detection.
8. Industrial Control harnesses IoT for indoor air quality and temperature monitoring,
automation of vehicle control in mining fields, and etc.
9. Smart Agriculture is enhanced by IoT with soil moisture control, green houses
micro-climate control, monitoring of meteorological conditions, and control of
compost humidity.
10. Smart Animal Farming applies IoT for offspring care and health anomalies
detection, animal tracking and study of ventilation in farms.
11. Home Automation: IoT is applied for monitoring of utility resources consumption,
remote control of appliances and home security, and good preservation in
museums.
12. eHealth is one the critical areas where IoT can be applied for fall detection of
disabled people, control conditions of medical fridges, monitoring of sportsmen
health in high performance centres or patients conditions in hospitals as well as to
detect ultraviolet radiation and warn people about peak hours [54].
This work lies within the bound of Smart Environment domain and focuses on monitoring
and visualizing outdoor air pollution.

25
To summarize, this section discussed the notion of IoT, reviewed existing reference
architectures and surveyed major IoT platforms. Moreover, application areas of IoT and
the most trending domains are presented. The most important takeover of the chapter is the
chosen IoT platforms as a result of the survey. A specific list of criteria was defined in
order to select the most appropriate platform for this research. The next section reviews
context-aware computing, which enables optimal processing of the raw data from the IoT
devices.
2.2 Context-Aware Computing
Currently many web, mobile, desktop applications use context-aware approach to the
Internet of Things. The ultimate goal of the context-aware computing is to support the
appropriate response to the users and the environment. Therefore, the context-aware
applications have an ability to adapt to the user’s situation without the user being
distracted. The context-aware computing has been widespread after the introduction of the
term ubiquitous computing by Mark Weiser in 1991 [55]. A paper by Schilit and Theimer
used the term context-aware computing for the first time in 1994 [56]. The research focus
is on providing context-aware location information of administrative entities.
In order to implement context-driven applications as mentioned above, it is crucial to
understand context and its evolution. The following section presents definitions of context
and its different characteristics.
2.2.1 Defining Context
Numerous researchers attempt to define context in their work. In the definition given by
Ryan et al. [57] context can be seen as user’s identity, current location, environment, and
time. Dey et al. [58] consider as context information as the user’s emotional state, location,
orientation, date, time and surrounding objects. Some papers use synonyms of the context
such as an environment or a situation [59]–[62].
Abowd et al. [10] present a review of these definitions and discuss weaknesses. With
highlighted limitations of the previous attempt the researchers present a broader definition
for context as following:
26
“Context is any information that can be used to characterize the situation of an entity. An
entity is a person, place, or object that is considered relevant to the interaction between a
user and an application, including the user and applications themselves [10].”
In this research we accept definition of the context by Abowd et al. since it is more
generalized definition that can be found in the literature. After clarifying the definition of
the term context, now we are able to determine what is context awareness.
Schilit and Theimer were the first to introduce the term context-awareness [56]. Numerous
researchers refer to context-aware applications as the ones that based on the context of the
user and application itself dynamically adapt their behaviour [63]–[66]. Abowd et al. [10]
present a review of papers which refer to context-aware by synonyms such as reactive,
adaptive, situated, responsive, context-sensitive and environment-directed. Abowd claims
that definition provided earlier are too specific and restrictive to identify context awareness
of applications. Therefore, they propose the following definition: “A system is context-
aware if it uses context to provide relevant information and/or services to the user, where
relevancy depends on the user’s task [10].” Researchers in [67] define context-awareness’
five major elements such as context acquisition, modelling, reasoning, dissemination and
context adaptation. The main focus of context acquisition is on context data collection
from different types of sensors, then this context data is converted to a machine-readable
form with context modelling. Next, context reasoning is used to reason high level situation
awareness from a low-level context. Afterwards, context is presented to a user or an
environment via context dissemination. Lastly, context adaptation focuses on selection of
relevant services for a user according to the context.
A more simplified context lifecycle is presented in [68], which is based on a review of the
previous works and contains all essential phases. The proposed context lifecycle consists
of four phases including context acquisition, context modelling, context reasoning and
context dissemination. The phases have the same focus as in [67], however, context
adaptation phase is not considered.
A good context modelling reduces the complexity of an application and enables to provide
relatively accurate context-aware service. Moreover, context modelling is necessary to
have a common picture of a system and its components. In addition, context modelling
helps to deal with mobility and heterogeneity of the context sources. Many context
modelling approaches has been proposed over the last decades with evolvement of the

27
context-aware computing. The survey in [68] illustrates six most widespread context
modelling techniques such as mark-up schemes, key-value, logic based, object-based,
graphical based, and ontology-based modelling. The paper presents a comparison of these
approaches as well. However, there is no standard for context modelling and choice of
approach is subjective decision. [69] claims that all context models have their strength and
weaknesses. For this research Context Spaces Theory is used to model a context. The
definition, main components and benefits of the model are discussed in the following
section.
2.2.2 Context Spaces Theory
Context Spaces Theory (CST) is a conceptual framework for context-aware systems
introduced by Padovitz et al. [70]. The main idea of the approach is to represent context as
a multidimensional space. In order to understand the CST, it is necessary to introduce the
following set of new terms.
A context attribute (denoted as ai) is any type of data that is used to reason a context. A
context attribute can be a reading from sensors or derived from other context attributes. For
example, readings from a temperature sensor can be a context attribute.
An application space (denoted as R) is a multidimensional space that is composed of an
entire set of relevant context attributes. Each context attribute is an axis of the application
space and a specific value on the axis is referred as a context attribute value.
A context state (denoted as Ci) is a collection of all relevant context attribute values at
specific time t. A context state can be illustrated as a point or subspace in space.
Ci = (a1V, a2V, a3V, … , anV)
For example, a context state can be made up from context attributes such as light
level(a1V), temperature(a2V) and humidity(a3V).
A situation space is a subspace of application space and represents a reallife situation
(denoted as Si). Situation space is a subspace of application space and contains a set of
regions of context attribute values.
Si = (a1R, a2R, a3R, … , anV)
For example, if we assume a situation space for a comfortable indoor environment,
acceptable region of values for a room temperature can be between 22℃ to 24℃ and the

28
range of values for relative humidity can vary from 40% to 60%. Figure 8 shows a visual
illustration of context space and its elements.
Figure 8. Context Space illustration. [70]
The CST provides an abstraction which enables to achieve a coherent context
representation. In addition to the aim of comprehensively and insightfully representing
context, the theory addresses challenges of reasoning about context in uncertain
environment [71]. Since this thesis aims to implement context aware system which uses
uncertain raw environmental data as one of the data sources, the use of the CST can help
with accurate context modelling.
To sum up, this section discussed a briefly context-aware computing, highlighted different
definitions of context and context-awareness, reviewed context lifecycle as well as
introduced CST on the basis of which the thesis will be implemented. As it was stated
before the main focus of this thesis is to implement a context-aware visualization system
for outdoor air pollution use case. With the well-presented big picture of the context-aware
system we transit to the background review of data visualization at the next section.
2.3 Data Visualization
Data visualization has an ultimate goal of making data more understandable and
interpretable for humans. According to authors in [72] data visualization is defined as “the
representation and presentation of data that exploits our visual perception abilities in order

29
to amplify cognition.” As it was mentioned before [8], [25], there are billions of devices
that are connected to the Internet and the number is growing exponentially. The amount of
data generated by the smart devices already reached a huge extent [73] and mostly cannot
be interpreted without adequate data visualization methods. A report by researchers in [74]
presents a significance of the data visualization for decision-making, improved information
sharing, provision of self-service capabilities to end users and other. On the other hand,
results in [75] prove that the resulting image of different data presentation techniques
applied to the same data might differ vastly. Therefore, relevant techniques have to be
applied depending on the current context or situation.
2.3.1 Context-driven Visualization
The variety of existing visualization techniques and their endless configuration options
makes it a hard and tedious procedure to choose the most suitable representation approach
even for experts.
Several studies attempt to apply context-aware approach for the data visualization. A
comprehensive system for the context-driven data presentation is implemented by Eissele
et al. [76], where authors consider device performance and connectivity as a context to
provide visual data. Authors in [77] demonstrate a visualization framework for context-
aware systems, which focuses on efficient communication and parallel processing. The
researchers claim that mobile devices lack a computational power to perform complex
tasks and provide context-aware services. However, with the use of stream processing
which supports parallel computation on distributed and shared memory multiprocessors
authors demonstrate effective context-aware visualization approach. Another work in [78]
illustrates a framework for smart cars, which enables to interpret and disseminate context
to provide context-aware visualization. Context-aware approach is used to visualize traffic
accidents in [79], where focus was not on the user interface but the content of data to be
visualized. The primary challenges of context-aware visualization services implementation
are discussed in [80]. The paper points out run-time issues of the correlation of context
elements changes and simultaneous reconfiguration of the user interfaces, interoperability
of heterogeneous visualization services, information sharing throughout different services
and integration of separate services into one homogenous view. As a solution of the
aforementioned problems, the authors present a framework called visualization mosaics

30
(ViMos), which generates user interfaces dynamically. The framework applies context-
awareness to visualize adapted interfaces. The generation of user interfaces comprises of
several steps such as acquisition of the context, selection of candidate data, selection of
candidate design pattern and information pieces and finally incorporation of all awareness
elements.
To summarize, some of the previous studies attempt to adapt their content according to the
user interface and device characteristics, while others provide dynamically changing
interfaces. However, all studies agree that there are a great number of issues to be
considered, when implementing context-aware visualization solutions, such as user
preferences, user’s current task and surrounding environment status.
2.3.2 GIS Data Visualization
The previous section discussed different aspects of context-aware visualization. Since this
thesis focuses on context-aware visualization of air pollution maps, it is necessary to
review previous works on location-based systems.
Recently Geographical Information Systems (GIS) is increasingly being applied for
various geospatial disciplines. According to Aronoff [81], GIS is a computer-based system
that provides the following four capabilities to handle georeferenced data such as (i) data
capture and preparation, (ii) data management, (iii) data manipulation and analysis, and
(iv) data presentation. Georeferenced data or spatial data mean data that contains position
values, such as (x,y) coordinates [82].
GIS is applied to visualize spatial data in different fields. Example giving, in [83] authors
use GIS to visualize statistical information on population density distributed
geographically. The study proposes a model of 3D space, where two dimensions are used
for coordinates and one for population density. An investigation of 3D visualization of GIS
data based on context-sensitive middleware is presented in [84]. However, the study can be
considered as a preliminary discussion of context-aware approach adoption for the GIS
data visualization due to the minimum consideration of a context. Another study presents
GIS data visualization in the field of Augmented Reality [85]. This research aims to use
GIS for outdoor air pollution visualization as it is a perfect fit for the temporal and spatial
data representation.

31
In conclusion, this section presented the subject of data visualization, its theoretical
definitions and practical approaches. Moreover, as important areas related to this research,
context-driven visualization proposals and GIS data visualization methods are reviewed.
The research utilizes GIS to visualize spatial and temporal data. A gap on context-driven
visualization is identified and this thesis aims to contribute to it with adopting user
preferences as a context for the data visualization. With a background reviewed on context-
aware data visualization, now we can discuss about environmental data. The next section
presents a state-of-the-art in the air pollution monitoring and application of context-aware
computing and IoT to environmental monitoring.
2.4 Ambient Air Pollution This section of paper discusses dynamics and trends of air quality, health and
environmental risks caused by ambient air pollution as well as benefits of visualizing and
creating awareness on pollution. Methods to monitor and assess air pollution levels are also
reviewed.
Air pollution is a rapidly evolving concern in the past decades with the growth of pollution
sources worldwide. According to the European Environment Agency (EEA) pollutants
released to the air from a wide range of sources including transport, agriculture, industry,
waste management and households [1]. Rapid urbanization and industrial growth
exacerbate the problem and the pressure felt severely in big cities. However, air pollution
does not respect borders. Air pollutants and heavy metals are carried by wind,
contaminating water and soil far from the origin [2]. Therefore, air pollution is not a
problem of solely developing countries but a global burden which affects all parts of
society.
According to the World Health Organization (WHO), 92% of population in our planet lives
in the areas that exceed ambient air quality limits. In addition, the report states that air
pollution is the largest environmental risk to health, being responsible to each ninth deaths
per year. Moreover, statistics show that outdoor air pollution alone is a cause of 3 million
deaths annually [3], [86]. Taking into consideration statistics on ambient air pollution
mortality and health risks, air pollution has been defined as a health priority and has been
included to the Sustainable Development Agenda [12].

32
2.4.1 Air Pollution Monitoring
The previous section discusses the importance of creating an awareness on air pollution.
Environmental agencies around the world making attempts to provide air quality
information in an easily understandable form as the weather forecast. The most generic
approach in this effort is Air Quality Index (AQI). The AQI is utilized to provide air
quality information and health risks for different levels of pollution [87].
The US Environmental Protection Agency (EPA) has established AQI value range from 0
to 500 as a standard for reporting daily air quality. With the higher AQI values the greater
is the air pollution level and health risks. The values of AQI are classified into 6 categories
such as good, moderate, unhealthy for sensitive groups, unhealthy, very unhealthy and
hazardous. Table 2 illustrates the AQI values, categories, their meaning and respective
action to be taken in order to protect public health as well as colour codes used to indicate
different air pollution levels.
Table 2. AQI values, meaning and actions to protect health. [88]
Category AQI Meaning Actions to Protect Health
Good 0 to 50 Satisfactory air quality None
Moderate 51 to 100 Acceptable air quality Limited outdoor activities for
extremely sensitive groups
Unhealthy for
Sensitive Groups
101 to 150
Sensitive groups feel discomfort
People with lung diseases, children and elder adults should limit outdoor
exertion
Unhealthy 151 to
200
Everyone experiences discomfort, sensitive groups might have
health issues
People with lung diseases, children and elder adults should limit outdoor
exertion
Very Unhealthy
201 to 300
Emergency conditions
People with lung diseases, children and elder adults should avoid
outdoor exertion.
Hazardous 301 to
500
Hazardous emergency conditions
Everyone should avoid outdoor activites

33
The EPA developed standard formula to calculate AQI from raw measurements. AQI of a
pollutant is calculated by the following formula:
, (1)
where is the air quality index for pollutant , is the truncated concentration of
pollutant ;
and are the concentration breakpoints that are greater than or equal to and less
than or equal to respectively; and are the AQI values corresponding to and
respectively. First we calculate AQI for each pollutant and then the highest AQI value
is used as an overall AQI. The formula below shows the calculation of overall AQI:
(2)
where is an overall AQI and is an AQI of a specific pollutant.
Table 3 illustrates the values of major air pollutants such as carbon monoxide (CO),
nitrogen dioxide (NO2), ozone (O3), particulate matter (PM2.5) and sulphur dioxide (SO2)
and respective to the AQI categories.
Sensitive groups to O3 include people with lung disease, older adults, children, people who
work actively outdoors. PM2.5 is hazardous for people with lung or heart disease, children,
older adults, and people of lower socioeconomic status are the groups most at risk. NO2
and SO2 are harmful for children, older adults and people with asthma. For high
concentrations of CO is dangerous for people with heart diseases [88].
Even though AQI standards presented by US EPA are well-known and widely used in
different countries, there exists a variety of other standards adopted in national or regional
scales. For example, in 2017 European Environment Agency (EEA) launched a new
European Air Quality Index [89]. EEA takes measurements of five key air pollutants such
as nitrogen dioxide, ozone, sulphur dioxide and two types of particulate matter particulate
matter. The levels of pollution are classified into five categories including good, fair,
moderate, poor and very poor. Table 4 demonstrates the values of pollutant according to
the classification and colours used to differentiate the pollution levels.

34
Table 3. AQI pollutant-specific categories. [88] Category AQI O3 PM2.5 CO SO2 NO2
(ppm)
8-hour
(µm/m3)
24-hour
(ppm)
8-hour
(ppm)
1-hour
(ppm)
1-hour
Good 0-50 0.000-0.054 0.0-12.0 0.0-4.4 0-0.035 0-0.053
Moderate 51-
100
0.055-0.070 12.1-35.4 4.5-9.4 0.036-
0.075
0.054-
0.100
Unhealthy for
Sensitive Groups
101-
150
0.071-0.085 35.5-55.4 9.5-12.4 0.076-
0.185
0.101-
0.360
Unhealthy 151-
200
0.086-0.105 55.5-150.4 12.5-
15.4
0.186-
0.304
0.361-
0.649
Very Unhealthy 201-
300
0.106-0.200 150.5-
250.4
15.5-
30.4
0.305-
0.604
0.605-
1.249
Hazardous 301-
500
>0.200 250.5-
500.4
30.5-
1004
0.605-
1.004
1.250-
2.049
Table 4. European AQI standards. [89] PM2.5
(µm/m3)
PM10
(µm/m3)
NO2
(µm/m3)
O3
(µm/m3)
SO2
(µm/m3)
Good 0-10 0-20 0-40 0-80 0-100
Fair 10-20 20-35 40-100 80-120 100-200
Moderate 20-25 35-50 100-200 120-180 200-350
Poor 25-50 50-100 200-400 180-240 350-500
Very poor 50-800 100-1200 400-1000 240-600 500-1250
Since a part of our experiments is held in Melbourne, we have reviewed standards in
Australia. We use national ambient air quality standards are defined by Australian National
Environment Protection Council [90]. Table 5 presents information on Australian AQI
categories, value ranges and interpretation of categories.

35
Table 5. Australian AQI standards. [90]
Category AQI range
Description
Very good
0-33 Very good air quality, no health risks
Good 34-66 Good air quality, little or no health risks Fair 67-99 Acceptable air quality. A little health concern for sensitive groups Poor 100-
149 Unhealthy air quality for sensitive groups
Very poor
>150 Unhealthy air quality for everyone
EPA claims that AQI is an essential way of carrying scientific and medical advice to the
public in a very interpretable form [87]. Indeed, AQI provides a comprehensive way to
create awareness on air pollution. Therefore, in this research we will use AQI for context
modelling. All three AQI standards discussed above, namely Australian, European and US
are considered as the system adopts context-awareness. The next section discusses the
value of creating awareness on air pollution and how it can contribute for sustainable
development.
2.4.2 The Role of Air Pollution Monitoring
In the previous sections we discussed statistics on air pollution and possible ways to
measure the pollution levels. This section reviews importance of air quality monitoring and
its benefits.
Human exposure to air pollutant may cause different health issues depending on the type of
pollutant, duration of exposure and the toxicity level of the pollutant. The WHO air quality
guidelines for Europe explicitly explain health effects of various pollutants [4]. The study
in [91] presents a review of works focused on adverse effects of air pollutant to respiratory,
cardiovascular, nervous, urinal and digestive systems of a human organism. The most
widespread health effects observed by different investigations include: asthma attacks,
reduced lung functioning, development of respiratory diseases and premature death [5].
Along with the human health effects air pollution contributes to deterioration of
environment. The environmental effects of air pollution include eutrophication, acid rain,
ozone depletion, crop damages and global climate change and others. Smog is a

36
widespread term referred to variety of air pollution events mainly in large cities. Acid rain
is another adverse effect of the air pollutants. Acid rain affects forested landscapes, soil
and aquatic ecosystems. Sulphur dioxide and ozone are the main contributors of smog
formation. The most crucial result of air pollution is the climate change which is caused by
carbon dioxide which causes the greenhouse has effect and contributes global warming
[92]. Major sources of air pollution vary depending on the region, typical local industry
and size of the population. For example, in China major pollution comes from industrial
coal, transportation, residential biomass burning and other, while in India the major
sources of outdoor air pollution are residential biomass burning and anthropogenic dust
[93]. The major source of outdoor air pollution addressed in Europe is transportation [94].
Atmospheric environmental protection, response policies, health impact and risk
assessment as well as air pollution modelling is impossible without the quantitative
information of air quality. The aim of air quality management is to monitor and control
ambient air quality so that it is safe for the public health and environment. In order to
assess status of the air, current air quality must be monitored. Creating awareness on air
pollution can contribute to both reducing exposure and decreasing emission levels.
Moreover, the air quality information is required by scientists, regional and national
planners and policy-makers to support them in taking savvy decisions on managing and
controlling the environment. Air quality monitoring provides the necessary scientific basis
for developing policies, setting objectives and planning enforcement actions [5]. Figure 9
presents the role monitoring in air quality management.
Figure 9. The role of monitoring in air quality management. [5]
Despite the importance of measurements, in many cases, monitoring solely is not enough
for the purpose of fully identifying population exposure in the environment. Therefore, as

37
mentioned before, monitoring needs to be supported by other assessment techniques such
as modelling, context-awareness and visualization of the measurements. The next section
of the thesis reviews state-of-the-art in the existing context-aware air pollution
visualization solutions.
2.5 State-of-the-art on Context-Aware Air Pollution Visualization
With the knowledge on importance of monitoring air quality and creating awareness on
pollution levels, this section aims to review the existing proposals applied for indoor and
outdoor air pollution monitoring. Numerous researches are conducted in the area of air
quality monitoring and for this study 20 state-of-the-art literature are selected to review
and identify open research questions. In order to compare existing air quality monitoring
and visualization solutions a taxonomy is developed. Table 6 illustrates the taxonomy for
evaluation and gives a brief description on each property.
Table 6. A taxonomy to compare the state-of-the-art.
Taxonomy Description
1 Environment type (ET) Indoor(I), Outdoor(O)
2 Physical Air Properties (PAP)
Air Exchange Rate (AER), Humidity(H), Temperature (T), Relative Pressure (RP), Wind (W)
3 Chemical Air Properties (CAP)
CO, CO2, H2S, NO2, O3, PM, PM2.5, PM10, SO2, Not Specified(N/S)
4 Data Acquisition (DA) Sensors, Meteorological Station (MS), Pollution Monitoring Station (PMS), Datasets, Crowd-sensing, Images, Application Programming Interfaces (APIs)
5 Data Processing (DP) Humidex (Hx), Air Quality Index (AQI), Other (specify)
6 Context attributes (CA) Location, Time, Environment, Activity, User Profile, Data Visualization, Other (specify)
7 Data Visualization (DV) Charts, Numbers, Maps, Other (specify)
First of all, each solution is developed for a certain environment type such as indoor,
outdoor or both. Emissions are affected by meteorological conditions, a number of

38
chemical and physical properties. Therefore, different existing works consider a variety of
physical air properties such as temperature, humidity, relative pressure, air exchange rate
and ventilation and wind speed and others. The chemical air properties (air pollutants)
considered in the existing literature also vary depending on the importance of pollutant in
the investigation area or availability of an infrastructure. After defining which physical and
chemical characteristics are considered, it is important to know the data acquisition
method. Some solutions set up their infrastructure and use live data coming from sensors
and sensor networks, while others might use available data from national meteorological
stations or even open dataset from the Internet. Data processing techniques in the literature
are highly heterogenous, therefore, adding it to the taxonomy also gives a valuable
information on similarities and differences between the existing works and our solution.
Since this thesis aims to adopt context-aware approach, list of context attributes considered
in the studies also included in the taxonomy. However, not all solutions specify their
context-awareness by using this term. Nevertheless, most of the systems are, at least,
location and time-aware. Some systems even consider user’s health issues. Therefore, we
decided to identify context attributes considered in the works, rather than binarizing it by
saying the system is either context-aware or not. Moreover, this thesis focuses on context-
driven data visualization. Therefore, if any system considers user or device characteristics
as a context for data visualization, we will show data visualization as a context attribute.
Lastly, as one of the key areas for this thesis, we compare data visualization approaches
considered in the existing studies. Table 7 presents a comparison of 20 state-of-the art
literature according to the aforementioned taxonomy.
A. Environment type
According to [95] average person spends 80% of their time indoors. Therefore, many of
the existing studies focus on indoor air quality monitoring. For example, [96]–[99] and
[100] present different solutions for indoor air quality monitoring, prediction and control.
However, recent statistics from WHO on air pollution illnesses and mortality show that
number of deaths caused by outdoor air pollution is more than 3 million [86]. The number
roughly is the same as the household pollution mortality rate.

39
Table 7. The state-of-the-art literature comparison. Research ET PAP CAP CA DA DP DV [101] O - O3, PM - crowd-
sensing N/S heatmap
[102] I, O - - - crowd-sensing
AQI heatmap, AQI indices
[103] I, O H, T 12 pollutants (N/S)
- sensors AQI AQI indices
[96] I AER CO2 User profile sensors AQI AQI indices [104] O H, T,
RP, W
CO, NO2, O3, PM2.5, PM10, SO2
User profile MS, PMS AQI red coloured pollution areas
[105] O - N/S - datasets bidirectional route traversal
pollution-based routes
[106] O - N/S - MS, PMS N/S Coloured pollution levels
[107] O H, T CO, NO2, H2S, O3
- PMS AQI Pollution indices
[108] I, O H, T, RP
CO, NO2, O3
User profile crowd-sensing
N/S Charts, coloured pollution levels and indices
[109] - CO, NO2, O3, PM2.5, PM10, SO2
- PMS N/S Pie charts
[110] I, O N/S PM - sensors, PMS
AQI Line graph, AQI indices and colours
[97] I AER, H, T
CO2 + sensors Linear regression
Coloured pollution levels and indices
[111] O H, T, VOC
CO2 - sensors - Line graph
[98] I H, T CO, CO2, NO2, O3, PM, SO2, VOC
location, time, user profile, pollutant type
sensors AQI, heuristics, calibration
Time-series charts
[99] I H, T PM location, time, user profile
sensors AQI, situation reasoning
AQI indices
[100] I H, T, AER
- environment, location, time
sensors - -
[112] O - N/S location sensors smart-mapReduce
3D pollution maps
[113] O H, T NO2, SO2 location datasets ANN pollution hot spots [114] I, O - CO, NO2,
PM2.5 user profile crowd-
sensing, sensors
calibration pollution maps
[115] I, O H, T PM2.5 location, time
crowd-sensing, sensors, APIs
Gaussian Process, Bayesian Methods
heatmap, charts, pollution-based routes

40
Numerous works propose systems to monitor and predict ambient air pollution. Studies in
[104], [105], [111] demonstrate various solutions for outdoor air quality, while other
papers such as [103], [108], [114] and [115] consider both environment types.
B. Physical Air Properties
In addition to air pollutants different air quality characteristics can affect pollution levels of
environment. For example, air exchange rate inside a room or wind outside enable air
movement, consequently, decrease concentration of pollutants of an area. Moreover, [99]
considers temperature and humidity to calculate humidex introduced in [116] which is an
approach to estimate human discomfort due to heat and humidity levels. From the
reviewed literature [96] considers air exchange rate (AER) and [113] takes into account
room ventilation to calculate indoor air quality, whereas [104] considers wind speed when
measuring outdoor air pollution rate.
C. Chemical Air Properties
In order to accurately measure air pollution rate, a range of pollutants must be considered.
For example, US Environmental Protection Agency (EPA) covers six main pollutants to
calculate Air Quality Index (AQI) and sets its limits on human health [117]. European
Environment Agency proposes European Air Quality Index which is based on five major
pollutants that harm people's health and the environment such as nitrogen dioxide (NO2),
ground-level ozone (O3), particulate matter (PM2.5 and PM10), and sulphur dioxide (SO2)
[118]. [104], [109] and [98] cover majority of the pollutants mentioned in the above
standards, while [112] consider 12 pollutants. However, pollutant types are not specified in
several studies such as [105], [106] and [100]. Overall, findings from review show that
majority of the studies consider carbon oxides or particulate matter which demonstrate
significance and widespread nature of the pollutants.
D. Context-Awareness
Increasing number of IoT devices and their computing capacity bring a new benchmark for
smart devices. Nowadays, devices are expected to give relevant information according to
user’s current situation. This is the main task of context-aware applications. In spite of the
fact that a huge number of solutions proposed in the area of environmental monitoring,

41
only few consider context-aware approach. Most papers consider basic context information
such as current location, time and pollutant type. [112] and [113] provide only location-
based information, while [115] considers time. [98]–[100] consider more context
information such as environment and user’s personal health features, however, all three
researches oriented on indoor air quality.
Assessment of exposure to air pollutants is a reasonable measure of health risks. However,
the same dose of pollution may affect each person differently. Therefore, they may
experience dissimilar health effects. Review findings show that a few papers consider
user’s health problems and age when providing air quality status for indoor environments.
However, there is still a research gap on applying context-aware approach to outdoor air
pollution monitoring. Moreover, user’s visual perception context such as eyesight
impairments, colour-blindness and others are not considered for data visualization.
E. Data Acquisition
Variety of data acquisition methods are used in different studies. The most common
practice is instalment of different gas sensors or sensor nodes with several built-in sensors.
For example, in [103] sensor node with 12 built-in sensors is equipped, while authors in
[96] and [99] use individual pollutant sensors. [105], [106] and [113] work with historical
air pollution datasets and [106] further considers traffic datasets to estimate more accurate
pollution rates. Crowd-sensing is another widespread approach to monitor air pollution.
For example, authors in [101], [102] collect data from participants, whereas [114] collects
data from both, sensors and crowd. Open-source data, national weather and pollution
monitoring centers and internet-connected monitoring stations are other forms of data
sources in the literature [104], [106], [107], [115].
F. Data Processing
Calculation of Air Quality Index (AQI) is the most common approach to process air
pollution data and provide human-readable interpretation of raw values [96], [102]–[104].
[96] to estimate air quality value uses Bayesian room localization model. [115] presents a
cloud-based air quality analytics engine with inference and calibration models. [98]
introduces a smoothing algorithm which prevents sensor errors and uses an aggregation
algorithm which enables less power consumption and decreases network traffic.

42
G. Data Visualization
Many researches already proven importance of data visualization to understand trends and
make decision over a given dataset. For example, in [75] authors use datasets with identical
statistical parameters to generate dissimilar graphs and demonstrate importance of
graphical representation method. There is no single standard visualization approach for air
quality data, therefore, methods vary from study to study. Majority of papers present
numeric indices for air quality [96], [103], [104], where several of them illustrate severity
of pollution with respective colours (i.e. good-green, bad-red) [97], [110]. Moreover, in
[106] authors provide additional meaning by using descriptive words such as “good”,
“non-critical”, “warning”, “alert”, or “alarm”. [101], [102] and [115] visualizes data with
pollution heatmaps. [105] and [115] provide pollution-based routes from origin to
destination. [109]–[111] and [98] visualize real-time and historical data with line charts.
Review findings show that diversity of visualization methods can be used to present air
pollution data, however, there is a little justification of the methods chosen. Moreover,
user’s preferences and vision impairments are not considered when providing visualization
services. Even though there is an attempt of applying context-aware approach in the field
of data visualization as discussed in the previous sections, there are still open research
areas on adopting user context when visualizing environmental data.
2.6 Summary
This chapter of the thesis discussed IoT paradigm, presented common IoT architecture and
reference models and reviewed popular IoT application areas. Moreover, comparison of
IoT platforms was conducted to justify IoT platform of choice for this thesis. The chapter
also reviewed definition of context and context-aware computing as well as introduced
CST, context modelling approach chosen for this thesis. Definition of data visualization
and common practices also presented. Context-driven visualization and spatial data
visualization were discussed. Since the thesis focuses on air pollution use case, an
extensive review of air pollution causes, and effects was conducted. The role of air quality
monitoring was studied. Moreover, state-of-the-art literature review was presented in the
area of context-aware air pollution visualization. Based on the results of the of the
assessment of the related work several conclusions were made. First, there is a small

43
consideration of user context in data visualization. Fewer papers apply context-aware
approach for air pollution monitoring and visualization. There is a small justification of
data visualization method chosen for air pollution data illustration. Applications proposing
air pollution-safe routes do not consider user context to reason situation at each route but
are based on main air pollution standards for healthy people. To address these issues in the
state-of-the-art literature, we attempt to provide a generic context model to fill the research
gaps on incorporating context-aware air pollution visualization and providing users with
personalized pollution-safe routes. Our context model reasons current situation that include
AQ parameters such as particulate matter and other toxic gases and user profile data such
as heart and lung diseases.

44
3 CONTEXT-AWARE AIR POLLUTION VISUALIZATION MODEL
This chapter presents a model of a context-aware air pollution visualization system and its
context modelling and situation reasoning aspects.
3.1 Context Modelling
The conclusions evolved as the result of the literature review demonstrate a research gap
on air pollution visualization adopting context-aware approach.
The main objective of this research is to implement a context-aware system for outdoor air
pollution visualization. As it was discussed in the previous chapter, in order to implement a
context-aware system, first of all, context needs to be modelled. There exists variety of
context modelling approaches, however, for the specifications of this thesis Context Spaces
Theory (CST) was chosen [70]. The CST provides an abstraction which enables to achieve
a coherent context representation. In addition to the aim of comprehensively and
insightfully representing context, the theory addresses challenges of reasoning about
context in uncertain environments. Therefore, for the environmental monitoring use case,
where uncertainty of sensor data is relatively high, using the CST for context modelling is
a reasonable choice.
The building blocks and main definitions of CST such as context attribute, application
space, situation space and context state are reviewed in the previous chapter. In order to
build a context-aware model for air pollution visualization we first define context attributes
of the system which are used to reason a context. The next, we identified application
space, which is an entire set of relevant context attributes. Afterwards, situation spaces
were defined which represent real-life situations. Situation reasoning is based on the
context state which comprises of all relevant context attribute values at this specific time.
Figure 10 presents an example of application space which considers context attributes such
as CO2, PM2.5, distance and user id.

45
Figure 10. Application Space example based on CST.
The illustration presents two situation spaces where major context is user’s sensitivity to
PM2.5. For the user with id 001, who is not sensitive to PM2.5, shortest route with moderate
PM2.5 value is proposed. However, the user with id 002 is sensitive to PM2.5, therefore,
route with longer distance but low PM2.5 pollution levels is suggested.
The next section present context attributes of the proposed context-aware system for air
pollution visualization.
In order to model context using CST, first of all, context attributes must be defined. The
context attributes of this research are classified into four categories such as general, air
quality, data visualization and user profile. Table 8 illustrates a list of context attributes and
their respective category.
Next, we give a description of each category and related context attributes.
A. Generic context attributes give general description on user’s current situation such
as time and location.
• Current location. This attribute represents current location of the user’s query for
air pollution information. Current location is defined by coordinates of latitude and
longitude, however, using additional APIs user is provided via comprehensive
location names. For example, user can show Deakin University as his current
location, but system converts it to -37.848063 latitude and 145.114903 longitude.

46
• Destination. This attribute represents the destination, where user wants to arrive.
The destination also defined with latitude and longitude values. Destination also
can be shown using user-friendly names as on the example of the current location.
• Time. This attribute represents current time of the user’s query for air pollution
information. This attribute is important to acquire up to date information and
provide real-time context updates.
Table 8. A list of selected context attributes.
Category Context attributes Generic
1. Current Location 2. Destination 3. Time
Air Quality 1. AQI 2. Pollutant type 3. Pollutant value
User Profile
1. User ID 2. Age 3. Pollutant sensitivity level
Data Visualization 1. Colour blindness
B. Air Quality context attributes describe air quality in the user’s current environment.
• AQI. In order to identify health concern of user to air pollution levels AQI needs to
be calculated from the readings of gas sensors.
• Pollutant type. Since this research is considering more than one pollutant in order
to identify pollution levels, pollutant type it is important to consider pollutant type
as an attribute.
• Pollutant value. This attribute provides information on the last available reading of
the respective pollutant type.
C. User Profile context attributes provide personal information about user’s age,
sensitivity to each pollutant type as well as pre-defined unique id.
• User ID. This context attribute is necessary to store user specific data and provide
context aware service to the user.
• Pollutant sensitivity level. This attribute defines user’s personal sensitivity to each
pollutant.

47
• Age. This attribute is used to identify sensitivity of a user to the pollution levels.
According to EPA, less than 18 year old children and elderly over 65 years are
treated as sensitive groups to air pollution [119].
D. Data Visualization context attributes describe user’s specific needs for different
data visualization techniques.
• Colour Blindness. This context attribute provides information on user’s ability to
differentiate colours assigned for AQI levels. In case, if user has colour vision
deficiency, specific colours should be used in order to provide user with
meaningful information.
Table 9 provides a detailed information on context attribute value types, a range of all
possible values and presents examples.
Table 9. Context attributes, their value types and ranges.
Context attribute Value type Value range Example
Current Location
Pair<Double, Double> Pair <[-90,90], [-180,180]> <-37.5, 145.11>
Destination Pair<Double, Double> Pair <[-90,90], [-180,180]> <-37.82, 144.58>
Time Datetime 23 Jan 2019 11:08 – current time 23 Jan 2019 11:08 AQI Integer [0, +Inf] 102
Pollutant type String Predefined set of pollutants CO2 Pollutant value Double [0; +Inf] 51.04
User ID String Predefined set of strings Alice, Bob Age Integer [0,120] 78
Pollutant sensitivity level
Pair<String, String>
Pair <[Predefined set of pollutants], [Neutral, Low,
Moderate, High, Extremely high]>
<CO2, High>
Colour blindness Boolean True, False True
Defining the necessary context attributes and their value ranges for the model enables us to
consider all possible situations that user can experience. The next section describes the
situation reasoning of the proposed model.

48
3.2 Situation Reasoning The previous section presented a detailed description of the context attributes to be used
for the system’s context modelling with the Context Space Theory (CST). As it was
discussed in the literature review, the CST uses Situation Spaces for real life situation
representations. Context State is the input data used for the reasoning. The context state is
a collection of all relevant context attribute values at a certain time.
In order to obtain context attributes such as user’s age, pollutant sensitivity level to
pollutants and colour vision impairments a simple set of questions is developed. The full
list of questions attached at the appendices section. As it was mentioned in the previous
chapter, carbon monoxide (CO), nitrogen dioxide (NO2), ozone (O3), particulate matter
(PM2.5) and sulphur dioxide (SO2) are the main air pollutants. Different studies found that
older adults, children and people with lung diseases are sensitive to all five pollutants,
while people with heart diseases tend to be also sensitive to PM2.5 and CO. Moreover,
active people of all ages who exercise or work outdoors are more sensitive to O3. Since
sensitive groups to SO2 and NO2 are similar, therefore, we consider only one of them.
Moreover, due to similarity of sensitive groups to CO and PM2.5 we consider only one of
them. In summary, three pollutants are selected such as NO2, O3 and PM2.5 [120].3 A set of
20 questions based on a number of research studies introduced in [121]–[128]. The set
contains wide variety of questions related to social status, age, lifestyle and habits of a
user. Questions have multiple answers. The answers have weighted value from 0 to 4
which relates to the sensitivity levels for each pollutant such as neutral, low, moderate,
high and extremely high and further used to identify sensitivity level. Weights are assigned
according to the relevancy of a question to a pollutant and severity of its effects. For
example, if question is “Do you have asthma?” and for answer “yes” NO2 sensitivity
weight is 4. If question is “How often do you work outdoors?” then O3 sensitivity weight
can be 3 if answer is “frequently” and 1 if answer is “rare”.
After getting responses, weights for each pollutant are collected into arrays. Then number
of weights are counted. If there is at least one answer with sensitivity weight 4, then
sensitivity level is defined as extremely high. Because, usually weight 4 is assigned to
answers which confirm that user has a lung or heart diseases and they are extremely
sensitive to pollutants. Next, if there are more than three answers with weight 3 then

49
sensitivity level is again extremely high and in case if this number is between zero and
three then the level is considered to be high and so on. Algorithm I presents the full version
of the algorithm to define sensitivity level to each pollutant.
Algorithm I: Pollutant sensitivity levels calculation
INPUT: responses to the set of questions, pollutant pollutantSensitivityWeight: sensitivity weights of each answer (0,1,2,3,4), pollutantType: pollutant types (NO2, O3, PM2.5) OUTPUT: pollutant sensitivity level (neutral, low, moderate, high, extremely high)
PARAMETERS: WeightsArray: pollutant sensitivity weights array METHOD: for each element of responses do { for each pollutantType do push pollutantSensitivityWeight to WeightsArray } for each element of WeightsArray do { for each pollutantSensitivityWeight do count number of pollutantSensitivityWeight; } for each pollutantType do{ if (number of pollutantSensitivityWeight (4) > 0) {return extremely high;} else { if(number of pollutantSensitivityWeight (3) > 3) { return extremely high; } else if (0 < number of pollutantSensitivityWeight (3) <= 3) { return high; } else{ if(number of pollutantSensitivityWeight (2) > 5) { return high; } else if ( 0< number of pollutantSensitivityWeight (2) <= 5) { return moderate; } else { if(number of pollutantSensitivityWeight (1) > 7) { return moderate; } else if ( 0< number of pollutantSensitivityWeight (1) <= 7) { return low; } else { return neutral; }}}}}
Algorithm I. Pollutant sensitivity levels calculation.
However, the identified sensitivity levels are used as a proof of concept and cannot be
utilized as a reference to relate to actual sensitivity of a person to a pollutant.
After defining the sensitivity levels, the sensitivity level to each pollutant is considered to
define user’s current situation.
The situation spaces defined for this thesis are based on the levels of health concern
presented in [88], depending on the values of AQI. However, several changes are made
due to the introduction of additional context attributes. In this research, we defined
following five situation spaces to represent current ambient air quality conditions:
1. Good Air Quality
Air pollution has a little or no health risk and air quality is considered satisfactory.
2. Unhealthy Air Quality
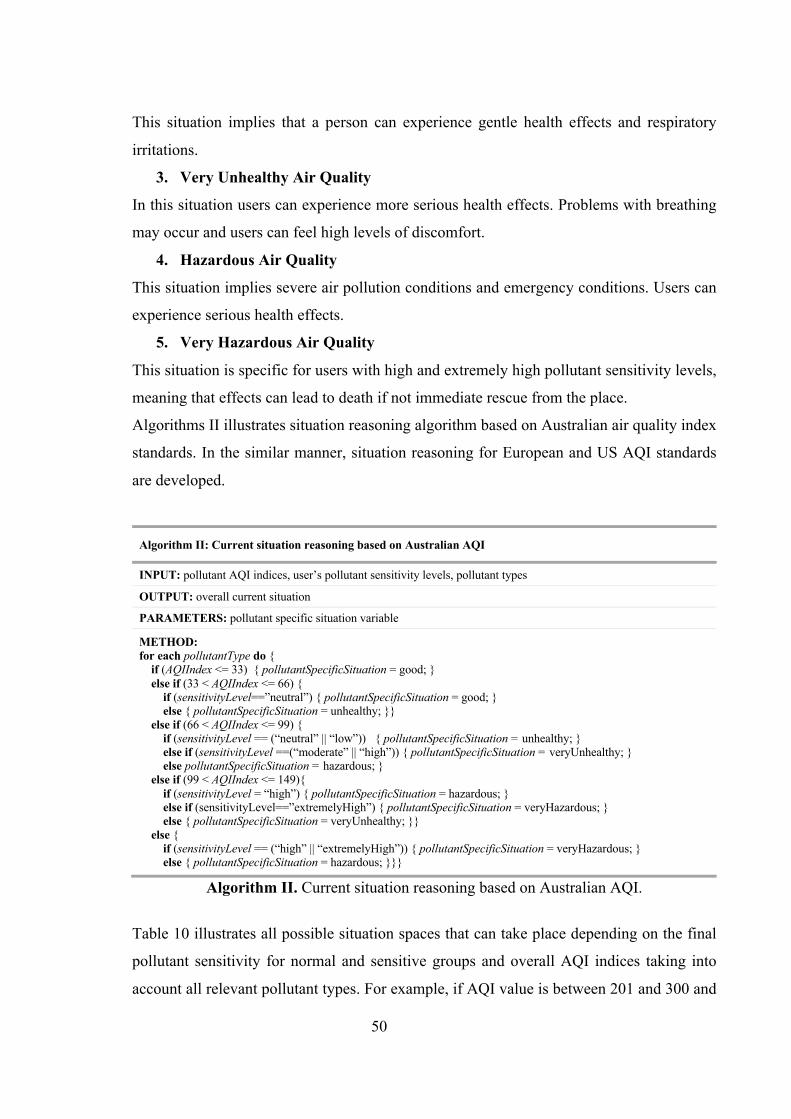
50
This situation implies that a person can experience gentle health effects and respiratory
irritations.
3. Very Unhealthy Air Quality
In this situation users can experience more serious health effects. Problems with breathing
may occur and users can feel high levels of discomfort.
4. Hazardous Air Quality
This situation implies severe air pollution conditions and emergency conditions. Users can
experience serious health effects.
5. Very Hazardous Air Quality
This situation is specific for users with high and extremely high pollutant sensitivity levels,
meaning that effects can lead to death if not immediate rescue from the place.
Algorithms II illustrates situation reasoning algorithm based on Australian air quality index
standards. In the similar manner, situation reasoning for European and US AQI standards
are developed.
Algorithm II: Current situation reasoning based on Australian AQI
INPUT: pollutant AQI indices, user’s pollutant sensitivity levels, pollutant types
OUTPUT: overall current situation
PARAMETERS: pollutant specific situation variable
METHOD: for each pollutantType do { if (AQIIndex <= 33) { pollutantSpecificSituation = good; } else if (33 < AQIIndex <= 66) { if (sensitivityLevel==”neutral”) { pollutantSpecificSituation = good; } else { pollutantSpecificSituation = unhealthy; }} else if (66 < AQIIndex <= 99) { if (sensitivityLevel == (“neutral” || “low”)) { pollutantSpecificSituation = unhealthy; } else if (sensitivityLevel ==(“moderate” || “high”)) { pollutantSpecificSituation = veryUnhealthy; } else pollutantSpecificSituation = hazardous; } else if (99 < AQIIndex <= 149){ if (sensitivityLevel = “high”) { pollutantSpecificSituation = hazardous; } else if (sensitivityLevel==”extremelyHigh”) { pollutantSpecificSituation = veryHazardous; } else { pollutantSpecificSituation = veryUnhealthy; }} else { if (sensitivityLevel == (“high” || “extremelyHigh”)) { pollutantSpecificSituation = veryHazardous; } else { pollutantSpecificSituation = hazardous; }}}
Algorithm II. Current situation reasoning based on Australian AQI.
Table 10 illustrates all possible situation spaces that can take place depending on the final
pollutant sensitivity for normal and sensitive groups and overall AQI indices taking into
account all relevant pollutant types. For example, if AQI value is between 201 and 300 and

51
user’s pollutant sensitivity level is neutral, then user’s current situation is very unhealthy.
The same values of AQI for the high sensitivity level makes the situation hazardous, while
for extremely high sensitivity level, the situation is very hazardous.
Table 10. Situation Spaces of the proposed model.
Australian AQI range
European AQI range
User’s pollutant sensitivity
level US AQI
Neutral Low Moderate High Extremely high
0-33 Good 0-50 Good Good Good Good Good 34-66 Fair 51-150 Good Unhealthy Unhealthy Unhealthy Unhealthy 67-99 Moderate 151-200 Unhealthy Unhealthy Very
Unhealthy Very
Unhealthy Hazardous
100-149 Poor 201-300 Very Unhealthy
Very Unhealthy
Very Unhealthy
Hazardous Very Hazardous
>150 Very Poor
301-500 Hazardous Hazardous Hazardous Very Hazardous
Very Hazardous
For users without any colour vision impairments, green to red gradient colours are used to
represent from good to hazardous situations, while black colour refers to very hazardous
situation. Table 11 presents the colours for normal vision given at the first column.
Table 11. Colour schema for CAVisAP data visualization. normal
vision colours
colour blind vision colours
Deuteranopia Protanopia Tritanopia Monochromacy
Good #00FF00 #FEE5D9 Unhealthy #FEFF00 #FB6A4A Very Unhealthy
#FF7F00 #DE2D26
Hazardous #FF0000 #A50F15 Very Hazardous
#000 #000
However, if the user has any type of colour deficiency, we use colours at the second
column of the Table 11, which can be distinguished by people with different colour
impairments. In addition, the table gives an illustration on how these colours are perceived
by people with different types of colour blindness such as deuteranopia, protanopia,
tritanopia and monochromacy. Colours for blindness safe visualization are chosen using a

52
tool called ColorBrewer [129]. Information on how people with colour vision impairments
see the selected colours are obtained via Sim Daltonism [130] simulation tool.
3.3 Summary This chapter presented a CST-based model for outdoor air pollution visualization. Firstly,
we define context attributes of the system. Then value types and ranges of each context
attribute were defined. We presented pollutant sensitivity level calculation algorithm.
Following this, we define situation spaces which represent real-life situations according to
the context attributes values. The next current situation reasoning algorithm was presented.
Following this we presented context-aware data visualization scheme which considers on
colour vision impairments of users. The next step of the research is to implement the
context aware system for outdoor air pollution visualization.

53
4 SYSTEM ARCHITECTURE AND IMPLEMENTATION
This chapter of the thesis illustrates the proposed system architecture. In addition, internal
and external system components are illustrated. Moreover, the chapter demonstrates
context acquisition and situation reasoning algorithms as well as implementation of data
acquisition and storage and data visualization layers.
4.1 System Architecture and Components
This section presents the description of the system architecture and system’s components.
The system comprises of four layers such as Data Acquisition, Data Collection and
Storage, Data Processing and Data Visualization. Figure 11 illustrates interaction between
the layers.
Figure 11. The CAVisAP layered system architecture.
The data acquisition layer is responsible for outdoor air pollution data collection from
sensing devices and external data sources. The data collection and storage layer provides a
service for aggregation and storage of historic data. Data processing layer is responsible for
context information retrieval, situation reasoning, and data sharing. Finally, data
visualization layer provides a user interface and up-to-date visualization of air pollution
data. Figure 12 shows the overall architecture of the system with details on tools and
software used during development process.

54
Figure 12. System Architecture and Components.
The following sections provide comprehensive description on implementation of each
layer of the system.
4.2 Data Acquisition and Storage
Location is one of the primary contexts of any context-aware system. Therefore, as a proof
of concept this system was developed for two different regions such as Australia and
Europe. Data for Australian air pollution was obtained from web service provided by the
Environment Protection Authority of Victoria [131]. The agency provides open access to
air quality measurements for all operating sites in the Victoria state. The APIs provide
information on the hourly readings as well as historical data for a range of pollutants such
as CO, O3, NO2, SO2, PM2.5 and PM10. Data for Europe is obtained from open-source
project OpenAQ [132]. In addition, sensor data provided by Lulea University of
Technology (LTU) is used for a use case scenario in the Skelleftea city, Sweden.
The next, all data collected from the above-mentioned sources is ingested into the open-
source IoT platform called ThingsBoard. The platform allows to process incoming data
with rule chains based on message content or entity attributes [133].
We installed open source edition of ThingsBoard IoT platform into an Amazon Web
Services (AWS) [134] Elastic Cloud Computing instance provided by LTU. In the
ThingsBoard platform we created virtual devices representing actual stations. Each device
adopts attributes such as name, latitude and longitude from a real-world air pollution

55
monitoring station. Moreover, air pollution data obtained from stations is ingested to the
respective virtual device.
Figure 13 illustrates an example of virtual devices created for Melbourne city, Australia.
(a) (b)
Figure 13. Screenshots from ThingsBoard: a) Virtual sensors; b) Latest telemetry data.
ThingsBoard provides APIs for server-side applications to control devices. The platform
supports protocols such as MQTT, CoAP, and HTTP which are standard IoT protocols. In
order to bind data streams from the real-world stations to the virtual devices we used
MQTT protocol.
The platform supports various database options such as SQL, NoSQL and hybrid database
and provides possibility to select the storage for main entities and where to store timeseries
data. In our implementation, SQL database is used to store both main entities and
timeseries data. After obtaining data from aforementioned sources and storing them in the
IoT platform we need to process it and get value from the raw data. The next section
describes implementation of the data processing layer.
4.3 Data Processing
Data processing layer comprises of two parts. First, defining user profile in order to further
define user context. Second, situation reasoning based on user context and timeseries data
streaming from IoT platform. Data processing layer is implemented in Node.js, which is an
open source development platform for executing JavaScript code server-side [135].
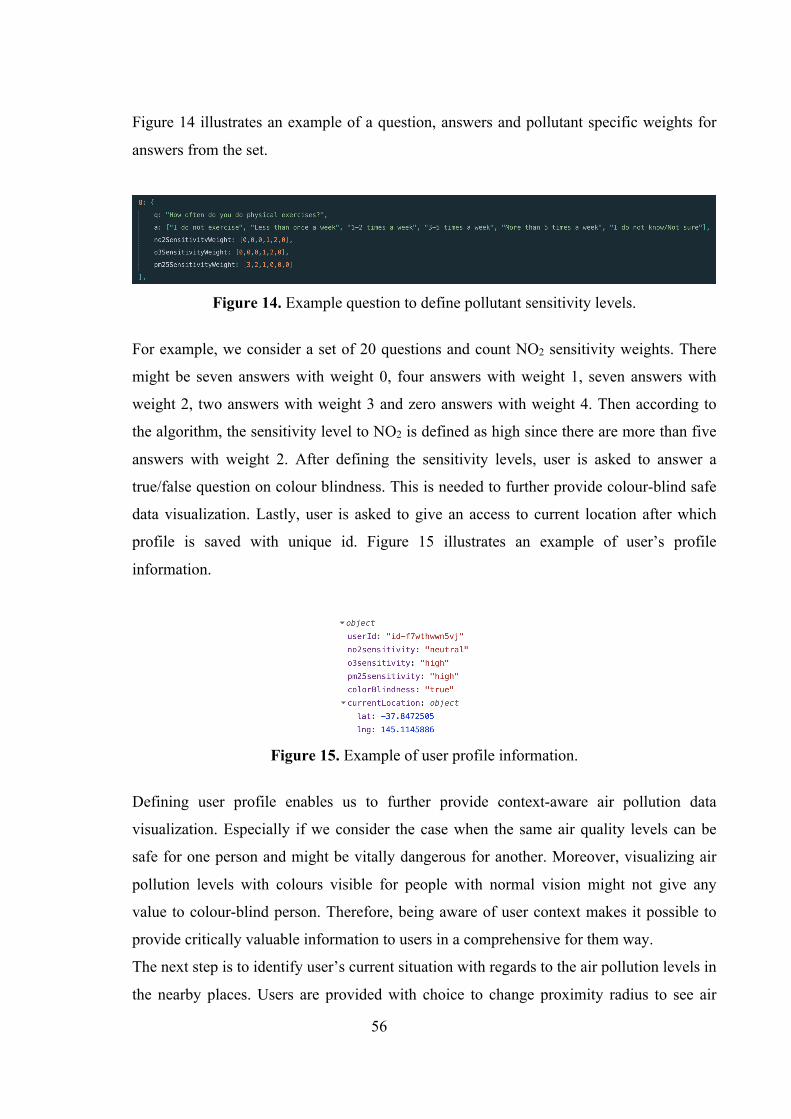
56
Figure 14 illustrates an example of a question, answers and pollutant specific weights for
answers from the set.
Figure 14. Example question to define pollutant sensitivity levels.
For example, we consider a set of 20 questions and count NO2 sensitivity weights. There
might be seven answers with weight 0, four answers with weight 1, seven answers with
weight 2, two answers with weight 3 and zero answers with weight 4. Then according to
the algorithm, the sensitivity level to NO2 is defined as high since there are more than five
answers with weight 2. After defining the sensitivity levels, user is asked to answer a
true/false question on colour blindness. This is needed to further provide colour-blind safe
data visualization. Lastly, user is asked to give an access to current location after which
profile is saved with unique id. Figure 15 illustrates an example of user’s profile
information.
Figure 15. Example of user profile information.
Defining user profile enables us to further provide context-aware air pollution data
visualization. Especially if we consider the case when the same air quality levels can be
safe for one person and might be vitally dangerous for another. Moreover, visualizing air
pollution levels with colours visible for people with normal vision might not give any
value to colour-blind person. Therefore, being aware of user context makes it possible to
provide critically valuable information to users in a comprehensive for them way.
The next step is to identify user’s current situation with regards to the air pollution levels in
the nearby places. Users are provided with choice to change proximity radius to see air

57
pollution in their current location. After getting the proximity radius, query is made to the
IoT platform to get locations of the devices. Figure 16 illustrates SQL command which is
used to filter the devices within proximity radius.
Figure 16. Query to find devices in a proximity radius.
After getting the nearby device details, we query ThingsBoard for the latest telemetry data
from each of the stations. Then AQI for each pollutant is calculated depending on the
region where user is located currently. Next, we calculate user’s current situation taking
into account their sensitivity to each pollutant and respective pollutant AQI value. As it
was introduced in the previous thesis chapter, we use Algorithm II to reason user situation.
4.4 Data Visualization
To provide context-aware visualization, the first user profile needs to be obtained. Users
are given an opportunity to select their pollutant sensitivity levels when registering to the
system. For this purpose, login and registration interfaces are developed. In addition to the
simple registration form where users can select from dropdown menu sensitivity levels
(neutral, low, moderate, high and extremely high), we provide a link to the set of questions
that can help users to define their sensitivity to NO2, O3, and PM2.5. Further users are
transferred into the main interface of the system which contains a personalized air
pollution map in the current location of the user. The map uses different colours to provide
the same level of pollution for users with different sensitivity levels as defined in the
context model. Moreover, the set of colours differs for colour-blind and users with normal
vision. A number of techniques are used to visualize air pollution levels such as heat maps,
coloured air pollution spots maps, pinpoints and pinpoints with indices. The data
processing layer and data visualization layer are implemented in NodeRED [136].
NodeRED is a flow-based development tool for visual programming. The NodeRED

58
allows interconnecting physical input/output, databases, cloud-based systems, and API’s.
The Node-RED is based on flow-based programming and the flows are managed by the
different type of “nodes”, where each node has a well-defined function; the node receives
data, then processes the data, and then it passes that data on to the next node in the flow or
completes the data processing. The tool is implemented in JavaScript and the majority of
nodes have pre-built configuration, which requires minimum programming skills.
However, specific nodes provide an interface to write scripts for more complex solutions.
Figure 17 shows a screenshot of workflow in NodeRED.
Figure 17. NodeRED workflow.
To provide context-aware visualization, the first user profile needs to be obtained. Users
are given an opportunity to select their pollutant sensitivity levels when registering to the
system. For this purpose, login and registration interfaces are developed. In addition to the
simple registration form where users can select from dropdown menu sensitivity levels
(neutral, low, moderate, high and extremely high), we provide a link to the set of questions
that can help users to define their sensitivity to NO2, O3, and PM2.5. Further users are
transferred into the main interface of the system which contains a personalized air
pollution map in the current location of the user. The map uses different colours to provide
the same level of pollution for users with different sensitivity levels as defined in the

59
context model. Moreover, the set of colours differs for colour-blind and users with normal
vision. A number of techniques are used to visualize air pollution levels such as heat maps,
coloured air pollution spots maps, pinpoints and pinpoints with indices. The interfaces of
the system are implemented using dashboard nodes in NodeRED which enable the
extension of pre-build interface functionality. We use Google Maps JavaScript API for
places, routes and locations [15]. The Maps JavaScript API allows to customize maps with
additional content and imagery for display on web pages and mobile devices and features.
Figure 18 illustrates an initial callback function initMap() called by Google Maps API
which creates the Map object. After creating the initial map object, we call
showInitialHeatmap() function, which adds heatmap layer for air quality data obtained
from IoT platform.
Figure 18. Initialization of map object.
In addition to heatmaps, we provide a number of visualization methods such as coloured
air pollution maps, pinpoints and pinpoints with indices which helps users personalize their
experience. Figure 19 shows different visualization techniques applied for the same data.

60
(a) (b)
(c) (d)
Figure 19. Different visualization methods applied for the same dataset: a) heat map; b) pollution spots map; c) pinpoints; d) pinpoints with indices.
According to the values user context on colour blindness we provide different set of colour
hues for pollution visualization. Figure 20 shows an example of multi-hue colours which
are provided for users with normal vision and single-hue colours which are colour-blind
safe.
(a) (b)
Figure 20. Set of colour hues used for visualization: a) multi-hue; b) single-hue.
After implementing the air pollution visualization of current location, we implemented the
functionality which provides users with context-aware pollution-safe routes planning. First,
we receive origin and destination as an input from the front-end, then call Google Maps

61
Routes API to get all alternative routes. After getting the route alternatives, we query
ThingsBoard to receive information for all the devices in the proximity radius. Further, we
find nearby stations to each route. Figure 21 shows the distance calculation function
according to geographical coordinates.
Figure 21. Function to calculate distance between coordinates.
After getting the list of stations along each route alternative, we reason situation according
to user context at each station. The overall situation of the route is equated to the situation
of the station with the highest air pollution rate. Further, we compare situations on all route
alternatives and get the index of the safest route. According to the situation at the chosen
route, we get the visualization colour. Further, we call Google Maps directions rendered
function by passing safest route index and route colour. Figure 22 shows the code snippet
of visualizing the safest route.
Figure 22. Pollution-safe route visualization implementation.

62
Figure 23 presents how visualization changes for users with different levels of pollutant
sensitivity despite the same levels of pollution.
(a) (b)
Figure 23. Visualization of context-aware route planning: a) for healthy person; b) for pollutant-sensitive person.
The next chapter present experiments and results to validate our context-aware
visualization model and system implementation.
4.5 Summary
This chapter presented CAVisAP architecture which aims to provide context-aware
visualization of outdoor air pollution maps and routes. The architecture consists of four
layers: data acquisition, data aggregation, data processing and data visualization. Further,
the chapter illustrated implementation of each layers of the system, technologies and tools
used. Main source of data was public APIs provided by municipalities in Melbourne and
Skelleftea cities. For data aggregation and storage ThingsBoard IoT platform was used.
The data processing layer was implemented in Node.js. The data visualization was
developed in NodeRED IoT wiring tool with integration of Google Maps API. The next
section present experiments held and review the obtained results as well as discuss
sustainability value of the proposed system.

63
5 EXPERIMENTS, RESULTS AND DISCUSSION
This chapter presents different testing scenarios of CAVisAP system and discusses
obtained results. Moreover, it presents sustainability analysis of the system from
individual, social, environmental, financial and technical perspectives.
5.1 Experiments and Results
In order to evaluate the developed system, we simulate different users’ profiles with
different sensitivity levels. Moreover, since the real-life data streams obtained for Victoria
and Skelleftea show relatively good levels of air pollution, we create extra virtual devices
with generated data. These devices are used to test the system for severe air pollution
levels. In the first set of experiments, we test the difference in visualization of the same
AQI for users with different sensitivity levels. We create five user profiles with different
sensitivity levels to PM2.5 and neutral sensitivity to NO2 and O3. Table 12 illustrates the
user profiles.
Table 12. Pollutant sensitivity levels of users.
Users Sensitivity levels NO2 sensitivity O3 sensitivity PM2.5 sensitivity
Alice neutral neutral neutral Bob neutral neutral low John neutral neutral moderate Jack neutral neutral high Rita neutral neutral extremely high
In the first experiment we consider five stations with good to very hazardous AQI levels.
Table 13 shows the details on station names and respective PM2.5 and AQI values at each
station.

64
Table 13. AQI values at each station.
Stations Address PM2.5 value AQI st_1 Woolworths Burwood 10.2 25.5 st_2 Lundgren Reserve 14.9 37.25 st_3 St Scholastica 30.9 77.25 st_4 Hawthorn Art Centre 45.8 114.5 st_5 Unity of Melbourne 67.5 168.75
Figure 24 shows locations of the stations on the map and situation at each node for a user
with neutral sensitivity for all pollutants. Table 14 presents situation reasoning for all five
users calculated with aforementioned algorithm.
Figure 24. Location of the stations in the first experiment.
Table 14. Situation Reasoning at each station.
Users Stations st_1 st_2 st_3 st_4 st_5
Alice good good unhealthy very unhealthy hazardous
Bob good unhealthy unhealthy very unhealthy hazardous
John good unhealthy very unhealthy
very unhealthy hazardous
Jack good unhealthy very unhealthy hazardous very
hazardous
Rita good unhealthy hazardous very hazardous
very hazardous
Figure 25 presents visualization of the air pollution data for the first set of experiments. As
it can be seen, situation at Woolworth Burwood remains good for all five users, while at

65
Lundgren Reserve its unhealthy for all users which have at least low level of sensitivity to
PM2.5. Moreover, situation at St Scholastica changes from unhealthy to hazardous and at
Hawthorn Art Centre from very unhealthy to very hazardous depending on the users’
pollutant sensitivity levels.
a) b) c)
c) d)
Figure 25. Visualization of the same air pollution data for users with different sensitivity levels: a) neutral; b) low; c) moderate; d) high e) extremely high
At the second experiment we consider only one user, Alan with different sensitivity levels
to all three pollutants, NO2, O3 and PM2.5. Table 15 presents the user profile.
Table 15. Sensitivity to NO2, O3 and PM2.5.
Users Sensitivity levels NO2 sensitivity O3 sensitivity PM2.5 sensitivity
Alan neutral moderate Extremely high
At the second scenario, we consider five stations with different situations depending on
pollutant type. For example, at the station Unity of Melbourne station air quality is good
regarding NO2 and O3 values. However, the level of particulate matter is very hazardous.
Hence, overall situation of Alan is very hazardous. Moreover, at Deakin Burwood Co.
user’s situation is unhealthy with regards to particulate matter but there is very unhealthy
ozone level for moderate sensitivity groups. Therefore, situation of Alan is very unhealthy
at the node. Table 16 provides full information on pollutant measurements at each of the
stations and pollutant-specific situation and overall situation of Alan at each station.

66
Table 16. Air quality at each station.
Stations Deakin Uni.
Benn. Reserve
Deakin Burwood Co.
The Settlers Shelter
Unity of Melbourne
NO2 value 45 39.5 84.9 82.7 0.7 NO2 situation good good unhealthy unhealthy Good
O3 value 25.6 12.1 78.9 78.3 0.6 O3 situation good good very
unhealthy very
unhealthy good
PM2.5 value 11.8 24.1 10.8 35.1 67.5 PM2.5 situation good unhealthy unhealthy hazardous very
hazardous Overall situation
good unhealthy very unhealthy
hazardous very hazardous
Further, we test the CAVisAP to differentiate visualization depending on the users’ colour
vision impairments in order to provide meaningful information in a readable form. Figure
26 illustrates the change of colour scheme for colour-blind users.
a) b)
Figure 26. Visualization colour schemes: a) default; b) colour-blind safe. The next experiment is to test air pollution-based route planning. In this experiment we
simulate three user profiles Alice, Bob and Jack who has different sensitivity levels to NO2
and PM2.5. Table 17 illustrates the sensitivity levels of users.
Table 17. Simulated user profiles for pollution-safe route suggestions experiment.
NO2 sensitivity PM2.5 sensitivity Alice 0 4 Bob 1 4 Jack 4 1

67
Alice, Bob and Jack want to bike from Villagatan 32 to Kanalgatan 46B in Skelleftea city.
Figure 27 illustrates route alternatives from the origin to destination suggested by Google
Maps.
Figure 27. Route alternatives from origin to destination.
We have created 7 virtual stations in ThingsBoard for Skelleftea city. Two of the virtual
stations stream real-life data for the provided by LTU. However, the air pollution levels in
Skelleftea are good and are not enough to test our system for reasoning the severe air
pollution situations. Therefore, we have used simulated air pollution data for the remaining
5 stations. Table 18 illustrates the station names and air pollution data at each station. The
stations which stream real-life data have [Live] tag.
Table 18. Air quality at each station.
NO2 value NO2 AQI PM2.5 value PM2.5 AQI Brogatan 86 Fair 12.5 Fair Skellefteå Bryggeri 45 Good 15 Fair Data Ductus [Live] 0.2 Good 0.33 Good ICA Supermarket 0.4 Good 0.6 Good LTU Leif’s office [Live] 0.03 Good 0 Good MAX 125 Moderate 27 Moderate Skelleftea Nygatan 0 Good 22.7 Moderate

68
To get overall situation at each route alternative for each user, we have considered air
pollution monitoring stations within 70m proximity distance along the route. Table 19
presents the distance of stations from each route alternative.
Table 19. Distance of stations from the route alternatives.
Route A Route B Route C
Brogatan 16m Skellefteå Bryggeri 35m Data Ductus 20m ICA Supermarket 27m LTU Leif’s office 66m 66m MAX 49m Skelleftea Nygatan 25m
There are three stations along the route A, two along the route B, one along the route C and
one is close to both routes B and C. The next we reason situation at each route alternative
according to the user context. Overall air quality of the route is equal to the data of the
station with the highest pollution rate. From the received air quality values and distance of
the stations, we obtain that Route A has fair levels of NO2 and PM2.5. Route B has good
levels of NO2 and moderate levels of PM2.5. The route C has moderate levels of both
pollutants. Table 20 presents overall air quality status at each of the routes.
Table 20. Situations along the route alternatives.
NO2 PM2.5 Route A fair fair Route B good moderate Route C moderate moderate
Getting the air quality information along each route enables us to validate system’s
situation reasoning. As it was illustrated before the same levels of air quality might affect
differently users with different sensitivity levels. Table 21 presents situation reasoning at
each route alternative for each of the users.

69
Table 21. Situation reasoning at each route alternative.
Alice Bob Jack Route A NO2-based situation Good Unhealthy Unhealthy
PM2.5 -based situation Good Good Good Overall situation Good Unhealthy Unhealthy
Route B NO2-based situation Good Good Good PM2.5 -based situation Hazardous Hazardous Unhealthy Overall situation Hazardous Hazardous Unhealthy
Route C NO2-based situation Unhealthy Unhealthy Hazardous PM2.5 -based situation Hazardous Hazardous Unhealthy Overall situation Hazardous Hazardous Hazardous
Alice is highly sensitive to PM2.5 but she is tolerant to NO2. Routes B and C show high
levels of particulate matter pollution. Route A has unhealthy levels of NO2. Since she is
tolerant to NO2, for Alice situation at the route A remains good, therefore, biking via route
A is the safest option. Figure 28a shows the context-aware route planning visualization for
Alice.
Bob also has high sensitivity to PM2.5. As for Alice, situations at the routes B and C are
hazardous for him. However, in contrast, with Alice, Bob has low sensitivity to NO2.
Therefore, situation at the route A is unhealthy for Bob. Since, the other routes are
hazardous, route A is the safest option for Bob. CAVisAP suggests the same route for Bob
and Alice, however, they are provided with different colours for visualization depending
on their context. Figure 28b presents context-aware route suggestions visualization for
Bob.
Jack is extremely sensitive to NO2. Therefore, route A is not safe for him. Moreover, he
has low sensitivity to PM2.5. Therefore, his situation at the route B and C is unhealthy.
Since, the route C is longer than route B, the system suggests Jack to take route B. Figure
28c context-aware route suggestion visualization for Jack.

70
Figure 28. Context-aware pollution-safe route suggestions for: a) Alice; b) Bob; c) Jack.
The experiments show how adopting user context can change reasoning of air quality.
Personalization of air pollution-based route planning provided users with an ability to
choose the safest route.
5.2 Sustainability Analysis
Creating awareness on air pollution can contribute to both reducing exposure and
decreasing emission levels. Moreover, the air quality information is required by scientists,
regional and national planners and policy-makers to support them in taking savvy decisions
on managing and controlling the environment. Air quality monitoring provides necessary
scientific basis for developing policies, setting objectives and planning enforcement
actions [5]. We have reviewed different air pollution related studies which could support
our system’s sustainability contribution.
A study in [137] found that in the absence of a toll during the national holidays in China,
the amount of vehicles on the road exceeded the socially optimal number and outdoor air
pollution escalated by about 20%, while the amount of particulate matter rise by 26%.
Authors in [138] present a survey of major stakeholders involved in environmental policy
development in Scotland and found that the invisibility of the problem both in health and
economic terms cause the lack of progress in reducing air pollution. The study concludes
that to tackle this challenge real-time air pollution and its health impact information must
be widely available. Another research held in Beijing in 2018 illustrates the influence of air

71
pollution on cycling behaviour of citizens. The authors found that during highly polluted
days the number of cyclists significantly decline, and people tend to switch to other travel
modes. Since cycling is a well-established eco-friendly mode of transportation, the study
provides an evidence that sustainable transportation requires environmental protection and
healthy air conditions for open-air travel [139]. Moreover, findings in [140] show that
visualization interfaces, located in public spaces can contribute to social awareness
increase and lead to sustainable behaviour change of citizens as well as can influence
meaningful participation of citizens to locally relevant topics.
The study in [141] presents qualitative analysis of the role of visualization techniques used
to create and distribute information on the process of public policymaking. The study
findings show that the visualization tools and methods used to create a visual information
increases transparency and significantly influences policy. Figure 29 present the
conceptual framework of how data visualization could affect the policy-making process.
Figure 29. Conceptual framework of influence of data visualization on policy-making.
Researchers in [142] present a “data compact,” – a communication model for scientists and
policymakers that could support the translation of environmental monitoring data into
knowledge that can be used for policy-making illustrated in Figure 30. The study presents
two use cases of data compact where scientific data is used to control ozone exhausting
substances and the potential reasons for the disconnected utilization of major scientific
research reports in managing corrosive precipitation antecedents.

72
Figure 30. Data compact. [142]
Taking into account analysis of the role of air pollution monitoring and visualization, we
present a five-dimensional sustainability analysis of CAVisAP system according to the
framework presented in [143][144]. Figure 31 illustrates the sustainability analysis
pentagon.
Figure 31. CAVisAP five-dimensional sustainability analysis.

73
Table 22 contains full version of sustainability analysis and presents immediate, enabling
and structural effects of CAVisAP in five dimensions such as social, individual,
environmental, economic and technical.
Table 22. Immediate, enabling and structural effects of CAVisAP Immediate effect Enabling effect Structural effect Social • Social
awareness on polluted areas
• Social awareness on effects of pollution • Engagement on air quality regulations
• Better social health and well-being • Decrease social health inequality • Clean air for society • Subsidies for eco-friendly vehicle acquisition
Individual • Individuals avoid pollution exposure • Individuals are informed of pollution sources
• Less risks to get respiratory diseases • Increased knowledge on pollution causes • Engagement to local air quality regulations
• Informed change of transport mode • Green mindset establishment
Environmental • Need for mitigation of pollution sources
• Change of traffic-related policies • Restrictions for industrial pollution
• Less emissions, less pollution • Promotion of eco-friendly transport modes • Increased funding for environmental activities
Economic • Less expenses on pollution caused health issues
• Increased demand on eco-friendly transportation • Increased demand on pollution monitoring devices and services
• Subsidies for eco-friendly vehicle production • Investments on pavements for walkers and bikers • Increased pollution related taxes
Technical • Compute and store only meaningful information
• Less storage, less processing time
• Less hardware usage
The framework enables to analyse our system’s immediate, enabling and structural effects
in individual, social, environmental, economic and technical aspect. Since the major focus
of our system is providing personalized air pollution maps and route-planning, CAVisAP

74
enables citizens to avoid polluted areas, which helps them to reduce pollution-related
health risks. This means users avoid possible health related expenses. Further, awareness
on environmental problems enable individuals and society to engage to policy-making
process and demand governments to take actions against environmental pollution.
Moreover, with an equipped knowledge on pollution causes, citizens might reconsider their
choice of transport and shift to environment-friendly cars, public transport or bike.
Visualization of invisible problem such as air pollution enables policy-makers to enact and
enforce the international, national and local air quality regulations. Moreover, governments
might promote environment-friendly transport modes and provide subsidies to individuals
and businesses to produce and utilize the eco-vehicles. From the technical aspect the
CAVisAP adopts context-aware computing approach, which enables to store and process
only meaningful information. Consequently, decreases the demand for hardware usage.
The pentagon in Figure 31 provides detailed connection between first, second and third
order effects of our proposed system.

75
6 CONCLUSIONS AND FUTURE RESEARCH
This chapter concludes the research findings and discusses future investigation directions.
6.1 Conclusions
This research aimed to propose, develop, implement and validate a real-time context-aware
visualization system using the widely used IoT paradigm applied for outdoor air pollution
use case. To achieve the aim, we first reviewed state-of-the-art literature in the areas of
IoT, context-aware computing, data visualization and air pollution monitoring. After
defining the research gaps on context-aware visualization of air pollution maps we
developed a CST-based model. The proposed model consists of algorithms to define
pollution sensitivity, context-aware situation reasoning and pollution-safe route planning.
The four layered system architecture comprising of data acquisition, data aggregation, data
processing and visualization layers was presented. Further, we present an implementation
of the context-aware system CAVisAP for personalized outdoor air pollution visualization
and route planning was presented. The system provides context-aware visualization of
three air pollutants such as nitrogen dioxide (NO2), ozone (O3) and particulate matter
(PM2.5) in the city of Melbourne, Australia and Skelleftea, Sweden. In addition to primary
context as location and time, CAVisAP takes into account users’ pollutant sensitivity
levels and colour vision impairments to provide personalized pollution maps. Moreover,
the system provides users with pollution-safe route planning. The developed system was
tested for a set of scenarios considering variety of user profiles with different pollutant
sensitivity levels. A set of questions was developed to identify users’ sensitivity levels to
NO2, O3 and PM2.5. The experiments justify the importance of considering user profile,
since the same level of air pollution is proven to be very hazardous for one user while
another can feel only a little discomfort. Moreover, CAVisAP attempt to provide a novel
approach to visualize air pollution data considering users’ colour vision impairments. This
is critically important, since misinterpreting of air pollution colours can lead to
uncompromising health issues. The sustainability analysis of the system was conducted
and first, second, third order effects were discussed. Since the major focus of our system is
providing personalized air pollution maps and route-planning, CAVisAP enables citizens

76
to avoid polluted areas, which helps them to reduce pollution-related health risks. This
means users avoid possible health related expenses. Further, awareness on environmental
problems enable individuals and society to engage to policy-making process and demand
governments to take actions against environmental pollution. Moreover, with an equipped
knowledge on pollution causes, citizens might reconsider their choice of transport and shift
to environment-friendly cars, public transport or bike. Visualization of invisible problem
such as air pollution enables policy-makers to enact and enforce the international, national
and local air quality regulations. Moreover, governments might promote environment-
friendly transport modes and provide subsidies to individuals and businesses to produce
and utilize the eco-vehicles. From the technical aspect the CAVisAP adopts context-aware
computing approach, which enables to store and process only meaningful information.
Consequently, decreases the demand for hardware usage.
6.2 Future Research Directions
This research findings can be extended in numerous ways. The first, the system could
incorporate context-aware prediction to enable users to plan their future trips and avoid
possible pollution exposure. Moreover, the system performance and efficiency can be
compared with existing solutions for pollution-based route planning proposals. The system
can be enhanced with considering additional context attributes which could affect
visualization method choice such as device profile and network connectivity. Lastly, user
experience tests can be conducted to identify the most suitable visualization methods.
Long-term qualitative studies can be conducted to identify behaviour change of users
which are provided with pollution-based route alternatives.

77
7 REFERENCES
[1] European Environment Agency, “Every breath we take - Improving air quality in
Europe,” Copenhagen, 2013.
[2] B. Gordon, R. Mackay, and E. Rehfuess, Inheriting the World: The Atlas of
Children’s Health and the Environment. Hong Kong: Phoenix Offset Limited, 2004.
[3] World Health Organization, “Ambient Air Pollution: A global assessment of
exposure and burden of disease,” Geneva, 2016.
[4] WHO Regional Office, “Air Quality Guidelines,” Air Qual. Guidel., vol. 22, no. 8,
pp. 1–8, 2000.
[5] D. Breuer, Ed., Monitoring ambient air quality for health impact assessment, no. 85.
Copenhagen: WHO Regional Publications, European Series, 1999.
[6] R. Khot and V. Chitre, “Survey on air pollution monitoring systems,” 2017 Int.
Conf. Innov. Information, Embed. Commun. Syst., pp. 1–4, 2017.
[7] J. Gubbi, R. Buyya, S. Marusic, and M. Palaniswami, “Internet of Things ( IoT ): A
vision, architectural elements, and future directions.,” Futur. Gener. Comput. Syst.,
vol. 29, no. 7, pp. 1645–1660, 2013.
[8] B. K. Wiederhold, G. Riva, and G. Graffigna, “Cisco Visual Networking Index:
Forecast and Trends, 2017–2022,” Annu. Rev. CyberTherapy Telemed., pp. 2017–
2022, 2019.
[9] E. Siow, T. Tiropanis, and W. Hall, “Analytics for the Internet of Things: A
Survey,” vol. 1, no. 1, pp. 1–35, 2018.
[10] G. D. Abowd, A. K. Dey, P. J. Brown, N. Davies, M. Smith, and P. Steggles,
“Towards a better understanding of context and context-awareness,” in Lecture
Notes in Computer Science (including subseries Lecture Notes in Artificial
Intelligence and Lecture Notes in Bioinformatics), 1999, vol. 1707, pp. 304–307.
[11] UN News Centre, “UN adopts new Global Goals, charting sustainable development
for people and planet by 2030,” United Nations Dep. Econ. Soc. Aff., 2015.
[12] “Sustainable Development Goals | United Nations Development Programme.”
[Online]. Available: http://www.undp.org/content/undp/en/home/sustainable-
development-goals.html. [Accessed: 23-Jan-2019].
[13] WEF, “Internet of Things Guidelines for Sustainability,” no. January, p. 20, 2018.

78
[14] J. A. Bernstein et al., “Health effects of air pollution,” J. Allergy Clin. Immunol.,
vol. 114, no. 5, pp. 1116–1123, Jan. 2004.
[15] “Google Maps.” [Online]. Available:
https://www.google.com/maps/@64.7386314,20.9887849,14z. [Accessed: 03-Jun-
2019].
[16] Ken Peffers, Tuure Tuunanen, Marcus A. Rothenberger, and Samir Chatterjee, “A
Design Science Research Methodology for Information Systems Research,” J.
Manag. Inf. Syst., vol. 24, no. 3, pp. 45–77, 2007.
[17] M. Nurgazy, A. Zaslavsky, P. P. Jayaraman, S. Kubler, K. Mitra, and S. Saguna,
“CAVisAP : Context-Aware Visualization of Outdoor Air Pollution with IoT
Platforms,” in 2019 International Conference on High Performance Computing &
Simulation (HPCS), 2019.
[18] D. Schürholz et al., “MyAQI: Context-aware Outdoor Air Pollution Monitoring
System,” in 9th International Conference on the Internet of Things, 2019.
[19] United Nations World Commission on Environment and Development, “Brundtland
Report: Our Common Future,” United Nations, 1987.
[20] A. Klimova, E. Rondeau, K. Andersson, J. Porras, A. Rybin, and A. Zaslavsky, “An
international Master’s program in green ICT as a contribution to sustainable
development,” J. Clean. Prod., vol. 135, pp. 223–239, 2016.
[21] J. Porras, A. Seffah, E. Rondeau, K. Andersson, and A. Klimova, “PERCCOM: A
master program in pervasive computing and COMmunications for sustainable
development,” in Proceedings - 2016 IEEE 29th Conference on Software
Engineering Education and Training, CSEEandT 2016, 2016, pp. 204–212.
[22] Kevin Ashton, “That ‘Internet of Things’ Thing,” RFID J., vol. 22, no. 7, p. 4986,
2010.
[23] International telecommunication Union, “The ITU new initiaties programme:
Ubiquitous Network Societies,” 2005.
[24] L. Atzori, A. Iera, and G. Morabito, “The Internet of Things: A survey,” Comput.
Networks, vol. 54, no. 15, pp. 2787–2805, 2010.
[25] Gartner Research, “Leading the IoT,” 2017.
[26] J. Diechmann, K. Heineke, T. Reinbacher, and D. Wee, “The Internet of Things:
How to capture the value of IoT,” 2018.

79
[27] J. Bartje, “The top 10 IoT application areas – based on real IoT projects,”
16.08.2016, 2016. [Online]. Available: https://iot-analytics.com/top-10-iot-project-
application-areas-q3-2016/. [Accessed: 24-Jan-2019].
[28] N. Lin and W. Shi, “The research on Internet of things application architecture
based on web,” Proc. - 2014 IEEE Work. Adv. Res. Technol. Ind. Appl. WARTIA
2014, pp. 184–187, 2014.
[29] Z. Yang, Y. Yue, Y. Yang, Y. Peng, X. Wang, and W. Liu, “Study and application
on the architecture and key technologies for IOT,” 2011 Int. Conf. Multimed.
Technol. ICMT 2011, pp. 747–751, 2011.
[30] R. Khan, S. U. Khan, R. Zaheer, and S. Khan, “Future internet: The internet of
things architecture, possible applications and key challenges,” Proc. - 10th Int. Conf.
Front. Inf. Technol. FIT 2012, pp. 257–260, 2012.
[31] Cisco, “The Internet of Things Reference Model,” Internet of Things World Forum,
pp. 1–12, 2014.
[32] P. Fremantle, “A reference architecture for the internet of things,” WSO2 White
Pap., p. 21, 2014.
[33] M. Bauer, N. Bui, C. Francois, and G. Pierpaolo, “Introduction to the Architectural
Reference Model (IoT-A / ARM) European FP7 Research Project IoT-A,” 2015.
[34] R. Buyya and A. V. Dastjerdi, Internet of Things: Principles and Paradigms. 2016.
[35] A. Al-Fuqaha, M. Guizani, M. Mohammadi, M. Aledhari, and M. Ayyash, “Internet
of Things: A Survey on Enabling Technologies, Protocols, and Applications,” IEEE
Commun. Surv. Tutorials, vol. 17, no. 4, pp. 2347–2376, 2015.
[36] K. Lasse Lueth and J. Kotzorek, “The central backbone for the Internet of Things,”
IoT Anal., no. November, 2015.
[37] IoT Analystics, “IoT Platform Company List 2017,” 2017. [Online]. Available:
https://iot-analytics.com/iot-platforms-company-list-2017-update/. [Accessed: 28-
Jan-2019].
[38] P. P. Ray, “A survey of IoT cloud platforms,” Futur. Comput. Informatics J., vol. 1,
no. 1–2, pp. 35–46, 2016.
[39] H. Hejazi, H. Rajab, T. Cinkler, and L. Lengyel, “Survey of platforms for massive
IoT,” 2018 IEEE Int. Conf. Futur. IoT Technol. Futur. IoT 2018, vol. 2018-Janua,
pp. 1–8, 2018.

80
[40] J. Mineraud, O. Mazhelis, X. Su, and S. Tarkoma, “A gap analysis of Internet-of-
Things platforms,” Comput. Commun., vol. 89–90, pp. 5–16, 2016.
[41] “IoT Device Management | Onboard, Organize & Remotely Update | AWS IoT
Device Management.” [Online]. Available: https://aws.amazon.com/iot-device-
management/. [Accessed: 25-May-2019].
[42] “Explore the Internet of Things (IoT) | IBM Watson IoT.” [Online]. Available:
https://www.ibm.com/internet-of-things. [Accessed: 25-May-2019].
[43] “Azure IoT | Microsoft Azure.” [Online]. Available: https://azure.microsoft.com/en-
us/overview/iot/. [Accessed: 25-May-2019].
[44] “IoT Analytics - ThingSpeak Internet of Things.” [Online]. Available:
https://thingspeak.com/. [Accessed: 19-Apr-2019].
[45] “ThingWorx Platform | Product Brief | PTC.” [Online]. Available:
https://www.ptc.com/en/resources/iot/product-brief/thingworx-platform. [Accessed:
19-Apr-2019].
[46] “IoT Platform for Connected Devices – Xively.” [Online]. Available:
https://xively.com/. [Accessed: 19-Apr-2019].
[47] “Altair Acquires Carriots IoT Platform > ENGINEERING.com.” [Online].
Available: https://www.engineering.com/IOT/ArticleID/15128/Altair-Acquires-
Carriots-IoT-Platform.aspx. [Accessed: 19-Apr-2019].
[48] M. (DERI-N. Serrano, “EU OpenIoT Project,” OpenIoT Consort., no. March, 2012.
[49] “Kaa Enterprise IoT platform.” [Online]. Available: https://www.kaaproject.org/.
[Accessed: 25-May-2019].
[50] L. T. De Paolis, V. De Luca, and R. Paiano, “Sensor data collection and analytics
with thingsboard and spark streaming,” EESMS 2018 - Environ. Energy, Struct.
Monit. Syst. Proc., pp. 1–6, 2018.
[51] P. Azaruddin and B. Arunakar, “Porting Modbus Stack to FreeRTOS on LPC1768,”
in 2017 IJSRST, 2017, vol. 3, no. 7, pp. 1022–1027.
[52] S. A. Alavi, A. Rahimian, and K. Mehran, “An IoT-Based Data Collection Platform
for Situational Awareness-Centric Microgrids,” in 2018 IEEE Canadian Conference
on Electrical & Computer Engineering (CCECE), 2018.
[53] European Research Cluster on the Internet of Things, “Internet of Things. Pan
European Research and Innovation Vision, European Research Cluster on the

81
Internet of Things,” 2011. [Online]. Available: http://www.internet-of-things-
research.eu/pdf/IERC_IoT-Pan European Research and Innovation
Vision_2011_web.pdf.
[54] N. Gershenfeld, R. Krikorian, and D. Cohen, “IERC - Internet of Things European
Research Cluster,” Sci. Am., 2004.
[55] M. Weiser, “The Computer of 21Th Century,” Sci. Am., vol. 265, no. 3, pp. 94–104,
1991.
[56] M. M. Theimer and B. N. Schilit, “Disseminating Active Map Information to
Mobile Hosts,” IEEE Netw., vol. 8, no. 5, pp. 22–32, 1994.
[57] N. Ryan, J. Pascoe, and D. Morse, “Enhanced Reality Fieldwork: the Context Aware
Archaeological Assistant,” in Archaeology in the Age of Internet. Computer
Applications and Quantitative Methods in Archaeology., 1999, pp. 269–274.
[58] A. K. Dey, “Context-Aware Computing: The CyberDesk Project,” AAAI Tech. Rep.
, pp. 51–54, 1998.
[59] K. Cheverst, N. Davies, A. Dix, and T. Rodden, “Exploiting Context in HCI Design
for Mobile Systems,” Work. Hum. Comput. Interact. with Mob. Devices, vol. pp, pp.
21–22, 1998.
[60] D. Franklin and J. Flachsbart, “All Gadget and No Representation Makes Jack a
Dull Environment Sensing,” in Proceedings of the Spring Symposium on Intelligent
Environments (SprSym’98), 1998.
[61] A. Ward, A. Jones, and A. Hopper, “A new location technique for the active office,”
IEEE Pers. Commun., vol. 4, no. 5, pp. 42–47, 1997.
[62] R. Hull, P. Neaves, and J. Bedford-Roberts, “Towards situated computing,” in
Digest of Papers. First International Symposium on Wearable Computers, 1997, pp.
146–153.
[63] N. Davies, K. Cheverst, G. Blair, and K. Mitchell, “Developing a Context Sensitive
Tourist Guide,” Dep. Comput. Lancaster Univ., no. February, pp. 1–5, 1998.
[64] G. Kortuem, Z. Segall, and M. Bauer, “Context-Aware, adaptive wearable
computers as remote interfaces to ‘intelligent’ environments,” in International
Symposium on Wearable Computers, Digest of Papers, 1998, vol. 1998-Octob, pp.
58–65.
[65] P. J. Brown, J. D. Bovey, and X. Chen, “Context-aware applications: From the

82
laboratory to the marketplace,” IEEE Pers. Commun., vol. 4, no. 5, pp. 58–64, 1997.
[66] B. Schilit, N. Adams, and R. Want, “Context-Aware Computing Applications,” in
First Workshop on Mobile Computing Systems and Applications, 1994, pp. 85–90.
[67] P. Temdee and R. Prasad, Context-Aware Communication and Computing:
Applications for Smart Environment. Cham: Springer International Publishing AG,
2018.
[68] C. Perera, A. Zaslavsky, P. Christen, and D. Georgakopoulos, “Context aware
computing for the internet of things: A survey,” IEEE Commun. Surv. Tutorials,
2014.
[69] T. Strang and C. Linnhoff-Popien, “A Context Modeling Survey,” in Proc.
Workshop on Advanced Context Modeling, 2004.
[70] A. Padovitz, S. W. Loke, and A. Zaslavsky, “Towards a theory of context spaces,”
in Proceedings - Second IEEE Annual Conference on Pervasive Computing and
Communications, Workshops, PerCom, 2004, pp. 38–42.
[71] A. Padovitz, “Context Management and Reasoning about Situations in Pervasive
Computing,” Science (80-. )., no. June, 2006.
[72] A. Kirk, S. Timms, A. Rininsland, and S. Teller, Data Visualization: Representing
Information on Modern Web. Birmingham: Packt Publishing Ltd., 2016.
[73] D. Reinsel, J. Gantz, and J. Rydning, “The Digitization of the World - From Edge to
Core,” 2018.
[74] IDG RESEARCH SERVICES, “Making Big Data Approachable and Valuable,”
2012.
[75] J. Matejka and G. Fitzmaurice, “Same Stats, Different Graphs,” in Proceedings of
the 2017 CHI Conference on Human Factors in Computing Systems - CHI ’17,
2017, pp. 1290–1294.
[76] M. Eissele, D. Weiskopf, and T. Ertl, “Interactive context-aware visualization for
mobile devices,” Lect. Notes Comput. Sci. (including Subser. Lect. Notes Artif.
Intell. Lect. Notes Bioinformatics), vol. 5531 LNCS, pp. 167–178, 2009.
[77] H. Sanftmann, N. Cipriani, and D. Weiskopf, “Distributed Context-Aware
Visualization,” pp. 251–256, 2011.
[78] J. Y. Lee and G. Rhee, “Context-aware 3D visualization and collaboration services
for ubiquitous cars using augmented reality,” Int. J. Adv. Manuf. Technol., vol. 37,

83
no. 5–6, pp. 431–442, 2008.
[79] X. Fan and P. Brezillon, “Context-Aware Big Data Analytics and Visualization for
City-Wide Traffic Accidents,” Knowl. Eng. Rev., vol. 13, no. 2, pp. 185–194, 2017.
[80] R. Hervás and J. Bravo, “Towards the ubiquitous visualization: Adaptive user-
interfaces based on the Semantic Web,” Interact. Comput., vol. 23, no. 1, pp. 40–56,
2011.
[81] S. Aronoff, “Geographic information systems: A management perspective,”
Geocarto Int., 1989.
[82] O. Huisman and R. A. By, “Principles of geographic information systems,” ITC
Educ. Textb. Ser., vol. 1, p. 490, 2009.
[83] A. Reveiu and M. Dârdala, “Techniques for Statistical Data Visualization in GIS,”
Inform. Econ., vol. 15, no. 3, pp. 72–79, 2011.
[84] G. Yan, Q. Du, L. Xu, and L. Zhu, “Research on Context-Sensitive 3D Web-GIS,”
in 2009 WRI World Congress on Computer Science and Information Engineering,
2009, vol. 6, pp. 190–193.
[85] S. Zollmann, G. Schall, S. Junghanns, and G. Reitmayr, “Comprehensible and
interactive visualizations of GIS data in augmented reality,” in Lecture Notes in
Computer Science (including subseries Lecture Notes in Artificial Intelligence and
Lecture Notes in Bioinformatics), 2012, vol. 7431 LNCS, no. PART 1, pp. 675–685.
[86] WHO, “World Health Statistics 2016: Monitoring Health for the SDGs,” 2016.
[87] Environmental Protection Agency, “Air Quality Index Reporting; Final Rule,” 1999.
[88] U.S. Environmental Protection Agency, “Air Quality Index: A Guide to Air Quality
and Your Health,” 2014.
[89] European Environment Agency, “European Air Quality Index : current air quality
information at your finger tips,” Copenhagen, 2017.
[90] National Environment Protection Council, “Air quality index | Australia State of the
Environment Report.” [Online]. Available:
https://soe.environment.gov.au/theme/ambient-air-quality/topic/2016/air-quality-
index. [Accessed: 12-Feb-2019].
[91] M. Kampa and E. Castanas, “Human health effects of air pollution,” Environ.
Pollut., no. 151, pp. 362–367, 2008.
[92] I. Lagzi, R. Meszaros, G. Gelybo, and A. Leelossy, Atmospheric Chemistry. Eötvös

84
Loránd University, 2013.
[93] State of Global Air, “What are the major sources of outdoor air pollution?” [Online].
Available: https://www.stateofglobalair.org/health/sources. [Accessed: 15-Feb-
2019].
[94] European Environment Agency, “Improving Europe’s air quality - measures
reported by countries,” pp. 1–7, 2018.
[95] US EPA, “Indoor Air Quality.” [Online]. Available: https://www.epa.gov/report-
environment/indoor-air-quality. [Accessed: 18-Apr-2019].
[96] Y. Jiang et al., “MAQS : A Mobile Sensing System for Indoor Air Quality,” Proc.
Int. Conf. Ubiquitous Comput. (UbiComp ’11), pp. 493–494, 2011.
[97] D. Lohani and D. Acharya, “SmartVent: A Context Aware IoT System to Measure
Indoor Air Quality and Ventilation Rate,” in 2016 17th IEEE International
Conference on Mobile Data Management (MDM), 2016, pp. 64–69.
[98] J. Y. Kim, C. H. Chu, and S. M. Shin, “ISSAQ: An integrated sensing systems for
real-time indoor air quality monitoring,” IEEE Sens. J., vol. 14, no. 12, pp. 4230–
4244, 2014.
[99] T. Belyakhina, A. Zaslavsky, K. Mitra, S. Saguna, and P. P. Jayaraman, “DisCPAQ:
Distributed context acquisition and reasoning for personalized indoor air quality
monitoring in IoT-based systems,” in Lecture Notes in Computer Science (including
subseries Lecture Notes in Artificial Intelligence and Lecture Notes in
Bioinformatics), 2017.
[100] B. Gateau, Y. Naudet, and J. Rykowski, “Ontology-based smart IoT engine for
personal comfort management,” Proc. - 11th Int. Work. Semant. Soc. Media Adapt.
Pers. SMAP 2016, pp. 35–40, 2016.
[101] J. J. Henriques, B. Bojarski, K. W. Byrd, and M. Von Wald, “Crowd-sourcing urban
air-quality in developing countries through open source technologies,” Proc. 3rd
IEEE Glob. Humanit. Technol. Conf. GHTC 2013, pp. 447–451, 2013.
[102] J. Dutta, F. Gazi, S. Roy, and C. Chowdhury, “AirSense: Opportunistic crowd-
sensing based air quality monitoring system for smart city,” in Proceedings of IEEE
Sensors, 2017, pp. 5–7.
[103] X. Yang, E. Xie, and L. Cuthbert, “Cluster segregation for indoor and outdoor
environmental monitoring system,” Proc. - 18th IEEE Int. Conf. High Perform.

85
Comput. Commun. 14th IEEE Int. Conf. Smart City 2nd IEEE Int. Conf. Data Sci.
Syst. HPCC/SmartCity/DSS 2016, pp. 1264–1269, 2017.
[104] R. Khasha, M. M. Sepehri, S. A. Mahdaviani, and T. Khatibi, “Mobile GIS-based
monitoring asthma attacks based on environmental factors,” J. Clean. Prod., vol.
179, pp. 417–428, 2018.
[105] K. Karuppanan, A. Manickam, E. Karthikeyan, and M. Narayanan, “Air Quality
based Optimal Path Search Model for Spatio-Temporal Data Set,” 2013 Int. Conf.
Adv. Comput. Commun. Informatics, pp. 73–78, 2013.
[106] E. Baralis, T. Cerquitelli, S. Chiusano, P. Garza, and M. R. Kavoosifar, “Analyzing
air pollution on the urban environment,” 2016 39th Int. Conv. Inf. Commun.
Technol. Electron. Microelectron. MIPRO 2016 - Proc., pp. 1464–1469, 2016.
[107] A. Kadri, E. Yaacoub, M. Mushtaha, and A. Abu-Dayya, “Wireless sensor network
for real-time air pollution monitoring,” 2013 1st Int. Conf. Commun. Signal Process.
Their Appl. ICCSPA 2013, 2013.
[108] E. Bales, N. Nikzad, N. Quick, C. Ziftci, K. Patrick, and W. G. Griswold, “Personal
pollution monitoring: mobile real-time air quality in daily life,” Pers. Ubiquitous
Comput., 2019.
[109] Z. Liao, Y. Peng, Y. Li, X. Liang, and Y. Zha, “A Web-Based Visual Analytics
System for Air Quality Monitoring Data,” in Proceedings - 2014 22nd International
Conference on Geoinformatics, Geoinformatics 2014, 2014.
[110] S. Kim, E. Paulos, and J. Mankoff, “inAir: A Longitudinal study of Indoor Air
Quality Measurements and Visualizations,” Proc. SIGCHI Conf. Hum. Factors
Comput. Syst. - CHI ’13, pp. 2745–2754, 2013.
[111] B. Braem, S. Latré, P. Leroux, P. Demeester, T. Coenen, and P. Ballon, “Designing
a smart city playground: Real-time air quality measurements and visualization in the
City of Things testbed,” IEEE 2nd Int. Smart Cities Conf. Improv. Citizens Qual.
Life, ISC2 2016 - Proc., pp. 1–2, 2016.
[112] J. W. Park, C. H. Yun, H. S. Jung, and Y. W. Lee, “Visualization of urban air
pollution with cloud computing,” Proc. - 2011 IEEE World Congr. Serv. Serv. 2011,
pp. 578–583, 2011.
[113] R. Gupta, N. Singh, and B. Singh, “Neural network based GIS application for air
quality visualization,” in Proceedings on 2016 2nd International Conference on

86
Next Generation Computing Technologies, NGCT 2016, 2017, no. October, pp.
169–172.
[114] K. Hu, V. Sivaraman, B. G. Luxan, and A. Rahman, “Design and Evaluation of a
Metropolitan Air Pollution Sensing System,” IEEE Sens. J., vol. 16, no. 5, pp.
1448–1459, 2016.
[115] Y. Cheng et al., “AirCloud: a cloud-based air-quality monitoring system for
everyone,” in Proceedings of the 12th ACM Conference on Embedded Network
Sensor Systems - SenSys ’14, 2014, pp. 251–265.
[116] J. Masterson and F. A. Richardson, Humidex, A Method of Quantifying Human
Discomfort Due to Excessive Heat and Humidity. 1979.
[117] US EPA, “Criteria Air Pollutants.” [Online]. Available:
https://www.epa.gov/criteria-air-pollutants. [Accessed: 18-Apr-2019].
[118] Y. Han, N. Zhu, N. Lu, J. Chen, and Y. Ding, “The Sources and Health Impacts of
Indoor Air Pollution,” 2010 4th Int. Conf. Bioinforma. Biomed. Eng., pp. 1–4, 2010.
[119] U.S. Environmental Protection Agency, “Patient Exposure and the Air Quality
Index,” EPA, 2017. [Online]. Available: https://www.epa.gov/pmcourse/patient-
exposure-and-air-quality-index#self. [Accessed: 04-Feb-2019].
[120] D. Mintz, “Technical Assistance Document for the Reporting of Daily Air Quality –
the Air Quality Index (AQI),” North Carolina, 2013.
[121] Urban Indian Heart Health Program, “Healthy Heart Questionnaire.” pp. 1–15.
[122] G. Healy et al., Reducing prolonged sitting in the workplace. An evidence review:
full report. 2012.
[123] K. K. ABOAGYE, “CARDIO-RESPIRATORY FUNCTION AMONG FEMALE
MOBILE FOOD VENDORS AT AGBOGBLOSHIE – A COMPARATIVE
ANALYSIS WITH ELECTRONIC WASTE WORKERS,” UNIVERSITY OF
GHANA, 2018.
[124] B. Ferris, “Epidemiology standardization project II: Recommended respiratory
disease questionnaires for use with adults and children in epidemiological research,”
Am. J. Respir. Crit. Care Med., vol. 118, pp. 7–53, 1978.
[125] K. Smallbone, “Individuals ’ Interpretation of Air Quality Information,” pp. 1–56,
2010.
[126] M. Sandmaier, Your Guide To A Healthy Heart. Betheda, MD: National Institutes of

87
Health, 2005.
[127] NATIONAL HEART FOUNDATION OF AUSTRALIA, “Heart disease fact sheet |
The Heart Foundation.” [Online]. Available:
https://www.heartfoundation.org.au/about-us/what-we-do/heart-disease-in-
australia/heart-disease-fact-sheet. [Accessed: 08-Apr-2019].
[128] Utah Department of Health, “Air Quality Index - Frequently Asked Questions.”
[Online]. Available: http://www.health.utah.gov/utahair/FAQ.html#What are the
health effects and who is most at risk from particle pollution. [Accessed: 08-Apr-
2019].
[129] “ColorBrewer: Color Advice for Maps.” [Online]. Available:
http://colorbrewer2.org/#type=sequential&scheme=Reds&n=6. [Accessed: 04-Feb-
2019].
[130] “Sim Daltonism: The color blindness simulator.” [Online]. Available:
https://michelf.ca/projects/sim-daltonism/. [Accessed: 04-Feb-2019].
[131] “Environment Protection Authority Victoria | EPA Victoria.” [Online]. Available:
https://www.epa.vic.gov.au/. [Accessed: 08-Apr-2019].
[132] “OpenAQ.” [Online]. Available: https://openaq.org/#/?_k=2r1z4e. [Accessed: 08-
Apr-2019].
[133] “ThingsBoard - Open-source IoT Platform.” [Online]. Available:
https://thingsboard.io/. [Accessed: 08-Apr-2019].
[134] “Amazon Web Services (AWS) - Cloud Computing Services.” [Online]. Available:
https://aws.amazon.com/. [Accessed: 06-Jun-2019].
[135] “Node.js.” [Online]. Available: https://nodejs.org/en/. [Accessed: 08-Apr-2019].
[136] “Node-RED. Flow-based programming for the Internet of Things.” [Online].
Available: https://nodered.org/. [Accessed: 30-Apr-2019].
[137] S. Fu and Y. Gu, “Highway toll and air pollution: Evidence from Chinese cities,” J.
Environ. Econ. Manage., vol. 83, pp. 32–49, 2017.
[138] J. Hyland and P. Donnelly, “Air pollution and health - The views of policy makers,
planners, public and private sector on barriers and incentives for change,” J. Transp.
Heal., vol. 2, no. 2, pp. 120–126, 2014.
[139] P. Zhao, S. Li, P. Li, J. Liu, and K. Long, “How does air pollution influence cycling
behaviour? Evidence from Beijing,” Transp. Res. Part D Transp. Environ., vol. 63,

88
no. July, pp. 826–838, 2018.
[140] N. Valkanova, S. Jorda, and A. Vande Moere, “Public visualization displays of
citizen data: Design, impact and implications,” Int. J. Hum. Comput. Stud., vol. 81,
pp. 4–16, 2015.
[141] R. Moody and V. Bekkers, “Visualizations, technology and the power to influence
policy,” Gov. Inf. Q., vol. 35, no. 3, pp. 437–444, 2018.
[142] J. A. Engel-Cox and R. M. Hoff, “Science-policy data compact: Use of
environmental monitoring data for air quality policy,” Environ. Sci. Policy, vol. 8,
no. 2, pp. 115–131, 2005.
[143] C. Becker et al., “Requirements: The Key to Sustainability,” IEEE Softw., vol. 33,
no. 1, pp. 56–65, Nov. 2015.
[144] L. Duboc et al., “Do we really know what we are building? Raising awareness of
potential Sustainability Effects of Software Systems in Requirements Engineering,”
in 27th IEEE International Requirements Engineering Conference, 2019.

APPENDIX A. A set of questions to personalize air pollution visualization and
pollutant-specific weights of answers.
AQ_QUESTIONS = {
1: {
q: "How do you commute to work?",
a: ["By own car", "By public transport", "By bike", "By walk", "None of the
options"],
no2Index: [0,1,2,2,0],
o3Index: [0,1,2,2,0],
pm25Index: [0,1,2,2,0]
},
2: {
q: "Is your age between 18 and 65?",
a: ["yes", "no"],
no2Index: [0,3],
o3Index: [0,3],
pm25Index: [0,3]
},
3: {
q: "Which proportion of your working/studying hours do you spend
outdoors?",
a: ["More than 75%", "Between 50% to 75%", "Less than 50%", "I do not
work/study", "I do not know/Not sure"],
no2Index: [0,0,0,0,0],
o3Index: [3,2,1,0,0],
pm25Index: [0,0,0,0,0]
},
4: {
q: "Which proportion of your working/studying hours do you spend in
sitting position?",

a: ["More than 75%", "Between 50% to 75%", "Less than 50%", "I do not
work/study", "I do not know/Not sure"],
no2Index: [2,1,0,0,0],
o3Index: [2,1,0,0,0],
pm25Index: [3,2,1,0,0]
},
5: {
q: "How often do you do physical exercises?",
a: ["I do not exercise", "Less than once a week", "1-2 times a week", "3-5
times a week", "More than 5 times a week", "I do not know/Not sure"],
no2Index: [0,0,0,1,2,0],
o3Index: [0,0,0,1,2,0],
pm25Index: [3,2,1,0,0,0]
},
6: {
q: "How often do you eat fast food?",
a: ["I do not eat fast food", "Less than once a week", "1-2 times a week", "3-
5 times a week", "More than 5 times a week", "I do not know/Not sure"],
no2Index: [0,0,0,1,2,0],
o3Index: [0,0,0,1,2,0],
pm25Index: [0,0,1,2,3,0]
},
7: {
q: "How often do you smoke?",
a: ["I do not smoke", "Less than once a day", "1-2 times a day", "3-5 times a
day", "More than 5 times a day", "I do not know/Not sure"],
no2Index: [0,0,1,2,3,0],
o3Index: [0,0,1,2,3,0],
pm25Index: [0,0,0,0,0,0]
},
8: {
q: "Does anyone in your family smoke?",

a: ["Yes, I live with a smoking person", "No, I live with non-smokers", "I
do not know/Not sure"],
no2Index: [2,0,0],
o3Index: [2,0,0],
pm25Index: [0,0,0]
},
9: {
q: "How often do you consume alcohol drinks?",
a: ["I do not drink alcohol", "Less than once a week", "1-2 times a week",
"3-5 times a week", "More than 5 times a week", "I do not know/Not sure"],
no2Index: [0,0,1,2,3,0],
o3Index: [0,0,1,2,3,0],
pm25Index: [0,0,1,2,3,0]
},
10: {
q: "How would you assess your health conditions in terms of
breathlessness?",
a: ["No breathlessness except with strenuous exercise", "Short of breath
when hurrying or walking up a slight hill", "Walk slower on flat ground than friends/have
to stop for breath when walking at your own pace", "Stop for breath after walking for a few
minutes on the flat", "Breathless when dressing/undressing or too breathless to leave the
house sometimes", "Breathless when sitting still"],
no2Index: [0,1,2,3,4,4],
o3Index: [0,1,2,3,4,4],
pm25Index: [0,1,2,3,4,4]
},
11: {
q: "Does anyone in your family have lung diseases?",
a: ["My parent(s)", "My sibling(s)", "My spouse", "My child(ren)", "No", "I
do not know/Not sure"],
no2Index: [1,1,1,0,0,0],
o3Index: [1,1,1,0,0,0],

pm25Index: [0,0,0,0,0,0]
},
12: {
q: "Does anyone in your family have heart diseases?",
a: ["My parent(s)", "My sibling(s)", "My spouse", "My child(ren)", "No", "I
do not know/Not sure"],
no2Index: [0,0,0,0,0,0],
o3Index: [0,0,0,0,0,0],
pm25Index: [1,1,1,0,0,0]
},
13: {
q: "The LAST time you had your blood pressure checked, was it normal or
high?",
a: ["High", "Normal", "I do not know/Not sure"],
no2Index: [0,0,0],
o3Index: [0,0,0],
pm25Index: [3,0,0]
},
14: {
q: "The LAST time you had your cholesterol checked, was it normal or
high?",
a: ["High", "Normal", "I do not know/Not sure"],
no2Index: [0,0,0],
o3Index: [0,0,0],
pm25Index: [3,0,0]
},
15: {
q: "Do you have asthma?",
a: ["Yes", "No", "I do not know/Not sure"],
no2Index: [4,0,0],
o3Index: [4,0,0],
pm25Index: [4,0,0]

},
16: {
q: "Do you have allergy to pollen?",
a: ["Yes", "No", "I do not know/Not sure"],
no2Index: [3,0,0],
o3Index: [3,0,0],
pm25Index: [3,0,0]
},
17: {
q: "Do you have diabetes?",
a: ["Yes", "No", "I do not know/Not sure"],
no2Index: [0,0,0],
o3Index: [0,0,0],
pm25Index: [3,0,0]
},
18: {
q: "Are you aware of any heart diseases (hypertension, coronary artery
disease, etc.) you have?",
a: ["Yes, I am aware. And I have heart diseases", "Yes, I am aware. And I
do not have any heart diseases", "I do not know/Not sure"],
no2Index: [0,0,0],
o3Index: [0,0,0],
pm25Index: [4,0,0]
},
19: {
q: "Are you aware of any lung diseases (chronic bronchitis, emphysema,
chronic obstructive pulmonary disease, etc.) you have?",
a: ["Yes, I am aware. And I have lung diseases", "Yes, I am aware. And I do
not have any lung diseases", "I do not know/Not sure"],
no2Index: [4,0,0],
o3Index: [4,0,0],
pm25Index: [4,0,0]
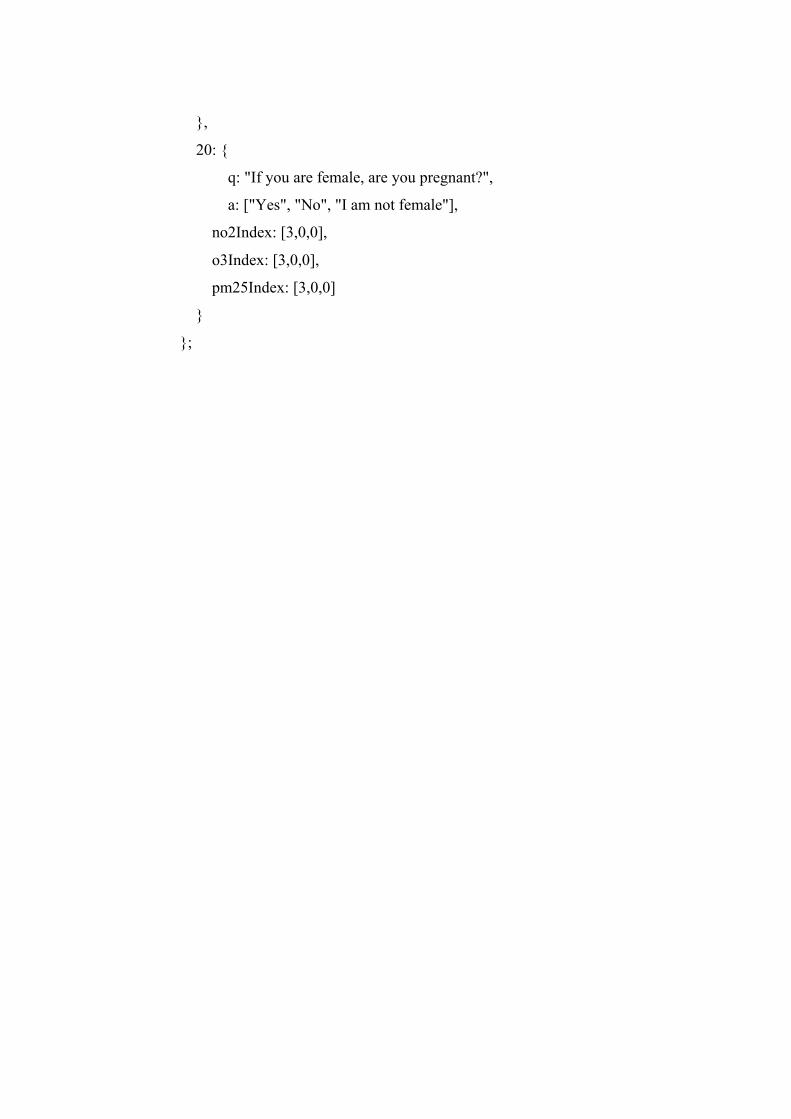
},
20: {
q: "If you are female, are you pregnant?",
a: ["Yes", "No", "I am not female"],
no2Index: [3,0,0],
o3Index: [3,0,0],
pm25Index: [3,0,0]
}
};
Copyright © 2022 FDOKUMEN