The Big See: Large Scale Visualization
14
The Big See: Large Scale Visualization Geoffrey Rockwell, Philosophy and Humanities Computing, University of Alberta Garry Wong, MA Program in Humanities Computing, University of Alberta Stan Ruecker, English and Humanities Computing, University of Alberta Megan Meredith-Lobay, Arts Resource Centre, University of Alberta Stéfan Sinclair, Communication Studies and Multimedia, McMaster University Introduction Display size and resolution has been increasing at a steady pace with the economies of scale of personal computing. Wall-sized displays, previously only seen in control centers like NASA’s, are now affordable and being used for information visualization. But what do we know about the constraints and opportunities for the design of information interaction for such Large Scale Information Displays (LSiDs)? How can we design text visualizations to take advantage of the large scale and public placement of an LSiD? In this paper we will: • Describe the variety of technologies being used to create LSiDs and discuss some example installations. • Discuss the literature about information design for LSiDs and some promising example visualizations. • Discuss two text visualization designs we have developed for LSiDs, and • Conclude with some design principles that we have drawn up to guide our work. LSiD Technologies What is an LSiD exactly? Typically an LSiD is designed for placement in a room rather than on a desktop. We can think of LSiDs as the digital equivalent to murals, large tapestries, and other analogue media designed for public spaces. See for example, the animated Bayeux tapestry, 1 which uses QuickTime VR since the tapestry is too long to see in any detail on a regular monitor. There is potentially interesting work to be done looking at the art history of murals and their design for public viewing. It is therefore larger and has more resolution than a commonly available desktop monitor. However, unlike high definition television, there is no specific metric that once reached will magically qualify a display as an LSiD. Arguably, a wall-sized display with the resolution of a standard desktop monitor could be considered an LSiD, but usually an LSiD is a tiling of multiple LCD panels that the computer can treat as one graphical space. What is important is that LSiDs are not meant for a single seated user at a desk, but for more public spaces. In terms of technology, many LSiDs have been projector-based, as rear-projections can be tiled without the borders visible between LCD displays. With affordable high-resolutions LCDs there has been a shift from projection-based systems to tiled LCDs, in part because they are economical and easier to retrofit into existing spaces. It does not really cost very much to set up three LCDs in a row in a meeting room. LCDs generate less heat, provide higher resolution per size, takes up less space, are easy to scale, provide better contrast, and there is no need for a specifically-designed projection surface. The JDHCS 2010 Volume 1 Number 2 URL: http://jdhcs.uchicago.edu / Published by: The Division of the Humanities at the University of Chicago Copyright: 2010 This work is licensed under a Creative Commons Attribution 3.0 Unported License 1 http://panograph.free.fr/BayeuxTapestry.html . (Thanks to Arno Bosse for this link.)
-
Upload
independent -
Category
Documents
-
view
4 -
download
0
Transcript of The Big See: Large Scale Visualization
The Big See: Large Scale VisualizationGeoffrey Rockwell, Philosophy and Humanities Computing, University of AlbertaGarry Wong, MA Program in Humanities Computing, University of AlbertaStan Ruecker, English and Humanities Computing, University of AlbertaMegan Meredith-Lobay, Arts Resource Centre, University of AlbertaStéfan Sinclair, Communication Studies and Multimedia, McMaster University
Introduction
Display size and resolution has been increasing at a steady pace with the economies of scale of personal computing. Wall-sized displays, previously only seen in control centers like NASA’s, are now affordable and being used for information visualization. But what do we know about the constraints and opportunities for the design of information interaction for such Large Scale Information Displays (LSiDs)? How can we design text visualizations to take advantage of the large scale and public placement of an LSiD? In this paper we will:
• Describe the variety of technologies being used to create LSiDs and discuss some example installations.
• Discuss the literature about information design for LSiDs and some promising example visualizations.
• Discuss two text visualization designs we have developed for LSiDs, and
• Conclude with some design principles that we have drawn up to guide our work.
LSiD Technologies
What is an LSiD exactly? Typically an LSiD is designed for placement in a room rather than on a desktop. We can think of LSiDs as the digital equivalent to murals, large tapestries, and other analogue media designed for public spaces. See for example, the animated Bayeux tapestry,1 which uses QuickTime VR since the tapestry is too long to see in any detail on a regular monitor. There is potentially interesting work to be done looking at the art history of murals and their design for public viewing. It is therefore larger and has more resolution than a commonly available desktop monitor. However, unlike high definition television, there is no specific metric that once reached will magically qualify a display as an LSiD. Arguably, a wall-sized display with the resolution of a standard desktop monitor could be considered an LSiD, but usually an LSiD is a tiling of multiple LCD panels that the computer can treat as one graphical space. What is important is that LSiDs are not meant for a single seated user at a desk, but for more public spaces. In terms of technology, many LSiDs have been projector-based, as rear-projections can be tiled without the borders visible between LCD displays. With affordable high-resolutions LCDs there has been a shift from projection-based systems to tiled LCDs, in part because they are economical and easier to retrofit into existing spaces. It does not really cost very much to set up three LCDs in a row in a meeting room. LCDs generate less heat, provide higher resolution per size, takes up less space, are easy to scale, provide better contrast, and there is no need for a specifically-designed projection surface. The
JDHCS 2010Volume 1 Number 2
URL: http://jdhcs.uchicago.edu/ Published by: The Division of the Humanities at the University of ChicagoCopyright: 2010This work is licensed under a Creative Commons Attribution 3.0 Unported License
1 http://panograph.free.fr/BayeuxTapestry.html. (Thanks to Arno Bosse for this link.)
designers of the HIPerWall, for instance, chose LCD technologies rather than projection systems for these reasons.2
While all LSiDs are relatively large (in size and resolution), there are other differences between systems. For example, a CAVE system is a room where the walls are displays arranged to surround the user in an immersive 3D visualization, while large wall displays like the HIPerWall are configured as a mural. There are also unique display facilities like the Allosphere3 at the California NanoSystems Institute at UC Santa Barbara that consists of a sphere in which images are projected around the viewers. Unlike CAVEs, the Allosphere allows multiple users to view the display at the same time without stereoscopic glasses. The Allosphere Research webpage highlights some of the uses of stereoscopic images displayed on a large display.
The size and placement of LSiDs means that they naturally lend themselves to be used by groups of individuals. While there are certain display systems that are intended to be used by single users or very small groups, such as CAVEs, most are designed to be used by groups, which leads to display control challenges.
Three example installations include LiveBoard, HIPerWall, and the Access Grid.
LiveBoard
An early and important implementation is the Liveboard developed at Xerox PARC in 1992. Elrod et al. developed the technology as a collaborative work space for use in meetings, during presentations, and teleconferencing.4 The system consisted of an LCD rear-projection screen and a cordless pen. The monochrome screen measured 64 x 32 inches with a resolution of 1120 x 780 pixels. The pen component of the system was a light-pen that allowed the user to control the screen not only when right up at the screen but also from a distance. In terms of software, the LiveBoard employed a proprietary user interface known as BoardWalk.
The system allowed users to collaborate and run meetings with a variety of applications including a whiteboard, slideshow, and a text-editor. The whiteboard application was in many ways the precursor to modern digital whiteboards; it allowed users to work on multiple sheets which could be then stored, retrieved, and printed. Slideshow allowed users to display PostScript files to the meeting group.
In an article titled “Liveboard: A Large Interactive Display Supporting Group Meetings, Presentations, and Remote Collaboration,” Elrod et al. report an informal internal survey among users of the LiveBoard. They found that the main issues that required improvement were image quality and pen accuracy. The main uses of the LiveBoard were for meetings, random drawing, and presenting something to a co-worker.
JDHCS 2010 Page 2Volume 1 Number 2
URL: http://jdhcs.uchicago.edu/ Published by: The Division of the Humanities at the University of ChicagoCopyright: 2010This work is licensed under a Creative Commons Attribution 3.0 Unported License
2 http://hiperwall.calit2.uci.edu/?q=node/1
3 http://www.allosphere.ucsb.edu/research.php
4 Elrod et al. 1992, 599-607.
HIPerWall
HIPerWall5 is a display technology created at the Calit2 lab at the University of California, Irvine. It is a tiled LCD display running at 100dpi. While it is possible to build HIPerWalls of varying sizes, the wall at Calit2 consists of 50 30-inch Apple Cinema Displays with a combined resolution of 25,600 x 8,000 pixels.
In terms of processing power, Calit2’s wall consists of 28 PowerMac G5 computers (11 of which are dual-core with the remaining being quad-core). HIPerWall has now been introduced as a commercial product produced by Samsung. The tiles created by Samsung each contain a computer with display software.
In contrast with PARC’s display and paired control mechanism approach, HIPerWall is simply a display. This allows different research teams the ability to display anything from large fMRI images to Guitar Hero on the screen. They also have specialized applications, like the TileViewer software developed at Calit2, which allows multiple large images to be displayed on the wall at the same time.
Of note to humanists is the HIPerWall installed at the University California, San Diego for the Software Studies Initiative led by Lev Manovich,6 who uses the HIPerWall to display a variety of his research projects in the field of cultural analytics.
AccessGrid
An existing technology that is found at many Canadian universities is AccessGrid.7 AccessGrid is a combination of software and commonly available hardware that supports video-conferencing and visualization. The AccessGrid at the University of Alberta is part of a network known as WestGrid which “encompasses 14 partner institutions across four provinces.”8 Usually, a system of projectors or high-resolution LCDs is set up with a small cluster of computers in order to facilitate collaborative work or many-to-many presentations. At the University of Alberta, the AccessGrid node consists of four computers and three tiled projectors. Each projector is running at a standard resolution of 1280 X 1024 pixels.
While this setup was intended for conferencing, the system is running Windows XP. As a result, we are able to test visualizations on this system. Such installations are important because they are accessible to many Canadian researchers in the humanities.Information Design for LSiDs
Much of the research around LSiDs focuses on the hardware display technology. It is only recently that research has focused on the design and usability of visualizations. Bezerianos and Balakrishnan
JDHCS 2010 Page 3Volume 1 Number 2
URL: http://jdhcs.uchicago.edu/ Published by: The Division of the Humanities at the University of ChicagoCopyright: 2010This work is licensed under a Creative Commons Attribution 3.0 Unported License
5 http://hiperwall.calit2.uci.edu/?q=node/1
6 http://lab.softwarestudies.com
7 http://www.accessgrid.org; http://www.ualberta.ca/CNS/RESEARCH/AccessGrid/equipment.html
8 http://www.westgrid.ca/about_westgrid

provide a nice overview of the challenges for interaction design for LSiDs, including: Remote Reaching, Space and Layout Management, and Aided Context Switching.9
Remote Reaching
When compared to a standard display, users of an LSiD cannot easily reach all items using traditional methods such as the mouse. The challenge is not only to provide ways to easily reach over the distances of the canvas but also to allow manipulation of on-screen items from a distance. For example, Nacenta et al. have developed a number of different control mechanisms for dealing with the problem of remote reaching.10 Each of these mechanisms utilize a small tablet PC in order to control objects that are out of reach on a larger screen. The most successful control strategy in their study was a “radar view,” where the user touches an object on the tablet to trigger a miniature representation of the object’s context, then drags the object to its new location. They found that among all the techniques they tested, the best ones employed a 1:1 user-movement to object-movement ratio compared to techniques that utilized exponential ratios.
Bezerianos and Balakrishnan in “The Vacuum: Facilitating the Manipulation of Distant Objects” describe a technique they refer to as a “vacuum and glyph,” which brings proxies of distant objects closer to the user.11 A user wishing to drag and drop an icon into a folder that is out of reach starts dragging the icon, which invokes a glyph that represents various destination folders. The user may then release the icon onto the representation of the selected destination folder rather than having to drag it all the way over to the original.
Bezerianos and Balakrishnan also outline a series of principles: the technique should have a low invocation and dismissal cost; it should require minimal physical movement of the user; and finally, it should be predictable, consistent, transparent, and flexible.
In testing, they found that the vacuum technique performed up to three times faster than regular dragging-and-dropping when on a large display. The vacuum technique also works well when selecting multiple targets, which is an improvement over a previous similar technique known as drag-and-pop developed by Baudisch et al.12
Space and Layout Management
When people stand up at an LSiD in any given position along the screen, areas of the LSiD may be outside of their focal range. Conversely, if they were to stand back, they might not see detail. The challenge is how to manage the layout of an LSiD, especially if there are borders between tiled screens.
JDHCS 2010 Page 4Volume 1 Number 2
URL: http://jdhcs.uchicago.edu/ Published by: The Division of the Humanities at the University of ChicagoCopyright: 2010This work is licensed under a Creative Commons Attribution 3.0 Unported License
9 Bezerianos and Balakrishnan 2005a, 40-41.
10 Nacenta et al. 2005.
11 Bezerianos and Balakrishnan 2005b, 361.
12 Baudisch et al. 2003, 58.
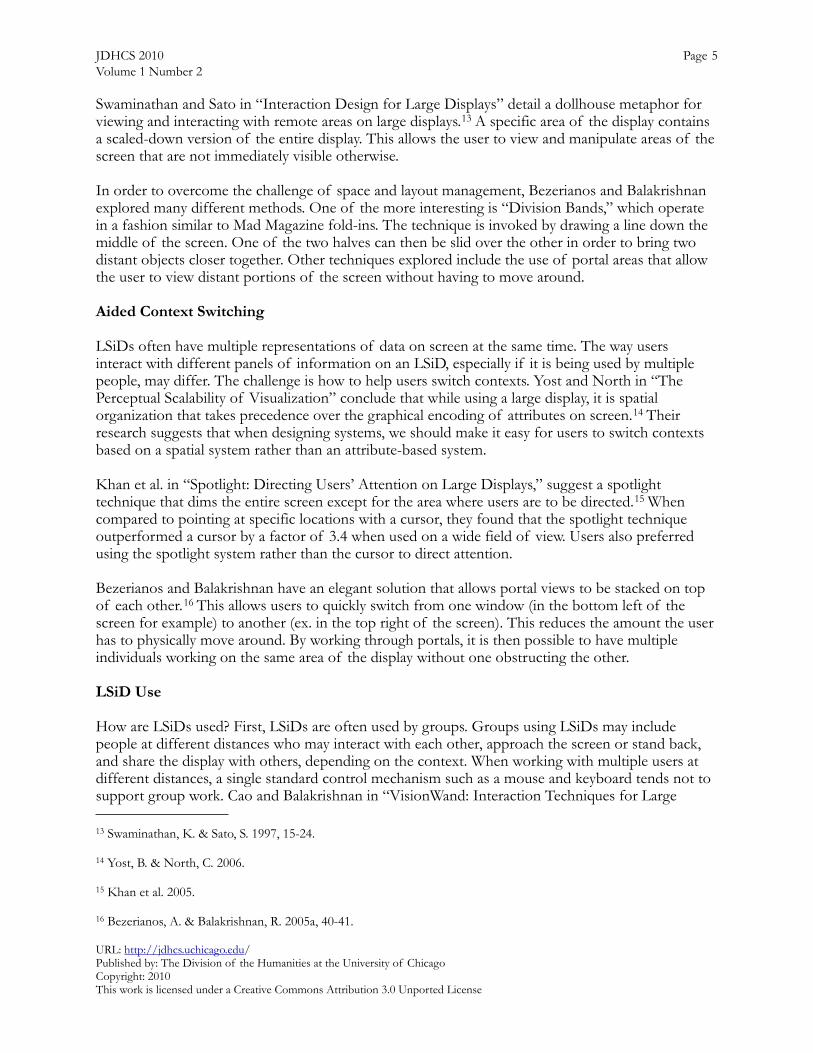
Swaminathan and Sato in “Interaction Design for Large Displays” detail a dollhouse metaphor for viewing and interacting with remote areas on large displays.13 A specific area of the display contains a scaled-down version of the entire display. This allows the user to view and manipulate areas of the screen that are not immediately visible otherwise.
In order to overcome the challenge of space and layout management, Bezerianos and Balakrishnan explored many different methods. One of the more interesting is “Division Bands,” which operate in a fashion similar to Mad Magazine fold-ins. The technique is invoked by drawing a line down the middle of the screen. One of the two halves can then be slid over the other in order to bring two distant objects closer together. Other techniques explored include the use of portal areas that allow the user to view distant portions of the screen without having to move around.
Aided Context Switching
LSiDs often have multiple representations of data on screen at the same time. The way users interact with different panels of information on an LSiD, especially if it is being used by multiple people, may differ. The challenge is how to help users switch contexts. Yost and North in “The Perceptual Scalability of Visualization” conclude that while using a large display, it is spatial organization that takes precedence over the graphical encoding of attributes on screen.14 Their research suggests that when designing systems, we should make it easy for users to switch contexts based on a spatial system rather than an attribute-based system.
Khan et al. in “Spotlight: Directing Users’ Attention on Large Displays,” suggest a spotlight technique that dims the entire screen except for the area where users are to be directed.15 When compared to pointing at specific locations with a cursor, they found that the spotlight technique outperformed a cursor by a factor of 3.4 when used on a wide field of view. Users also preferred using the spotlight system rather than the cursor to direct attention.
Bezerianos and Balakrishnan have an elegant solution that allows portal views to be stacked on top of each other.16 This allows users to quickly switch from one window (in the bottom left of the screen for example) to another (ex. in the top right of the screen). This reduces the amount the user has to physically move around. By working through portals, it is then possible to have multiple individuals working on the same area of the display without one obstructing the other.
LSiD Use
How are LSiDs used? First, LSiDs are often used by groups. Groups using LSiDs may include people at different distances who may interact with each other, approach the screen or stand back, and share the display with others, depending on the context. When working with multiple users at different distances, a single standard control mechanism such as a mouse and keyboard tends not to support group work. Cao and Balakrishnan in “VisionWand: Interaction Techniques for Large
JDHCS 2010 Page 5Volume 1 Number 2
URL: http://jdhcs.uchicago.edu/ Published by: The Division of the Humanities at the University of ChicagoCopyright: 2010This work is licensed under a Creative Commons Attribution 3.0 Unported License
13 Swaminathan, K. & Sato, S. 1997, 15-24.
14 Yost, B. & North, C. 2006.
15 Khan et al. 2005.
16 Bezerianos, A. & Balakrishnan, R. 2005a, 40-41.
Displays using a Passive Wand Tracked in 3D” reported on a gestural wand tracking system to control LSiDs from a distance using a passive wand and motion capture techniques.17 It is possible with their system for groups of users to use multiple wands.
Also, LSiDs are often placed in public spaces rather than in personal offices, such as at airports, bus terminals, or common areas at work. Individuals may simply be passing by rather than spending a long time working on the display. All of these factors affect the design of visualization controls on an LSiD. Ballagas et al. in “Sweep and Point & Shoot: Phonecam-Based Interactions for Large Public Displays” propose an interesting approach to controlling public displays.18 They present two techniques which could allow camera-equipped cellular telephones to control LSiDs in public spaces. While their technology was limited by the quality of telephone handsets available, it is a possible focal point of future research. More recently, new media teams have developed applications like Tentacles which allow multiple users to control a visual work with their iPhones.19
Visualizations for LSiDs
Data visualization is becoming more and more important as the amount of data that businesses work with increases. LSiDs promise effective ways for groups to negotiate understanding of large datasets through visualization. However, as in other areas of human-computer interaction and interface design, having a larger display changes the way that visualizations must be designed. The following are some examples of visualizations that we believe could be adapted to LSiDs.
Trendalyzer
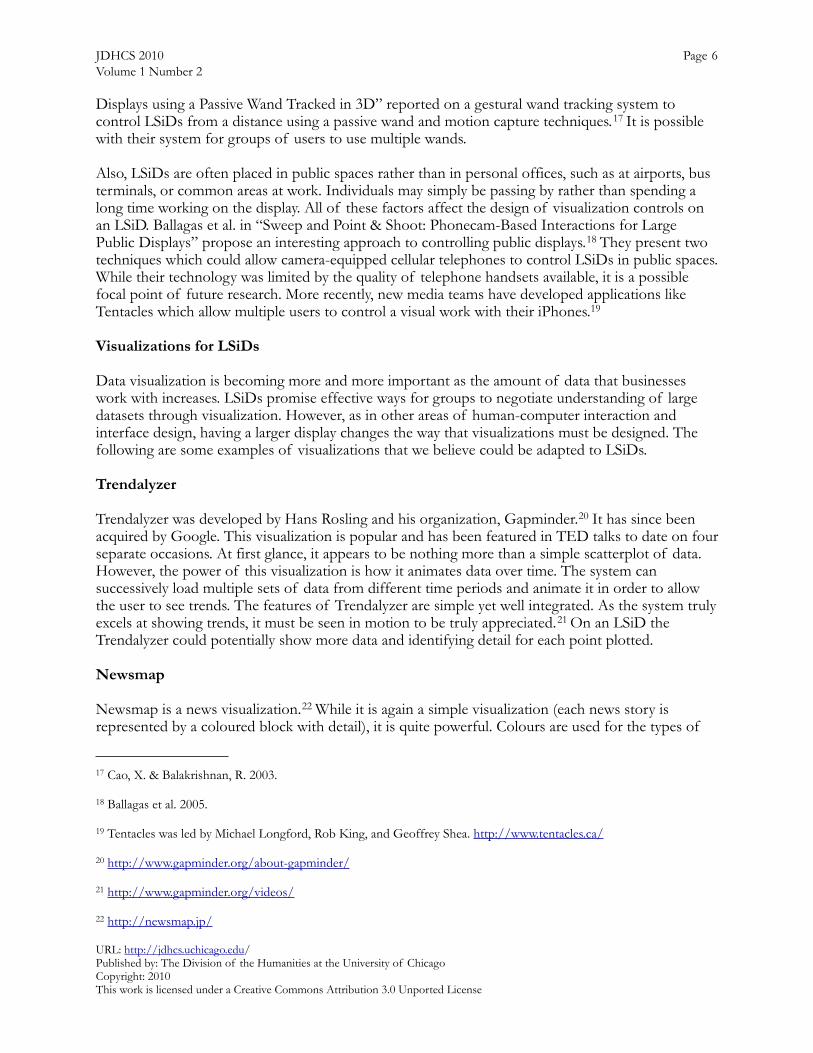
Trendalyzer was developed by Hans Rosling and his organization, Gapminder.20 It has since been acquired by Google. This visualization is popular and has been featured in TED talks to date on four separate occasions. At first glance, it appears to be nothing more than a simple scatterplot of data. However, the power of this visualization is how it animates data over time. The system can successively load multiple sets of data from different time periods and animate it in order to allow the user to see trends. The features of Trendalyzer are simple yet well integrated. As the system truly excels at showing trends, it must be seen in motion to be truly appreciated.21 On an LSiD the Trendalyzer could potentially show more data and identifying detail for each point plotted.
Newsmap
Newsmap is a news visualization.22 While it is again a simple visualization (each news story is represented by a coloured block with detail), it is quite powerful. Colours are used for the types of
JDHCS 2010 Page 6Volume 1 Number 2
URL: http://jdhcs.uchicago.edu/ Published by: The Division of the Humanities at the University of ChicagoCopyright: 2010This work is licensed under a Creative Commons Attribution 3.0 Unported License
17 Cao, X. & Balakrishnan, R. 2003.
18 Ballagas et al. 2005.
19 Tentacles was led by Michael Longford, Rob King, and Geoffrey Shea. http://www.tentacles.ca/
20 http://www.gapminder.org/about-gapminder/
21 http://www.gapminder.org/videos/
22 http://newsmap.jp/
news (sports, entertainment, world, etc.). Also, the size of each news block represents the number of related articles with larger blocks for the stories with more related articles. The controls allow for very quick and easy comparison of current events in two or more countries with regions of the display for each country. Rollovers provide detail.
This visualization is particularly interesting for LSiDs as it lends itself to a tiled wall display. It reminds us that for tiled displays we need to develop visual ideas that have rectangular regions that are coherent subsets. The details that you now see through rollovers could be included in an LSiD.
TextArc
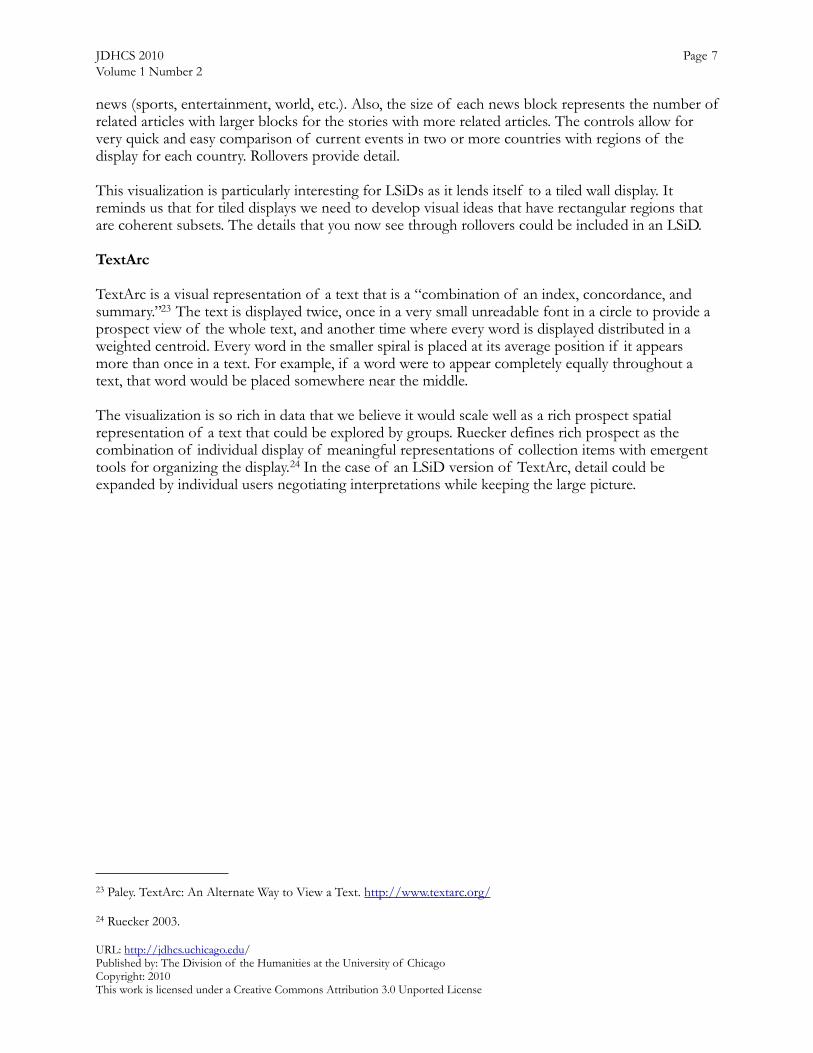
TextArc is a visual representation of a text that is a “combination of an index, concordance, and summary.”23 The text is displayed twice, once in a very small unreadable font in a circle to provide a prospect view of the whole text, and another time where every word is displayed distributed in a weighted centroid. Every word in the smaller spiral is placed at its average position if it appears more than once in a text. For example, if a word were to appear completely equally throughout a text, that word would be placed somewhere near the middle.
The visualization is so rich in data that we believe it would scale well as a rich prospect spatial representation of a text that could be explored by groups. Ruecker defines rich prospect as the combination of individual display of meaningful representations of collection items with emergent tools for organizing the display.24 In the case of an LSiD version of TextArc, detail could be expanded by individual users negotiating interpretations while keeping the large picture.
JDHCS 2010 Page 7Volume 1 Number 2
URL: http://jdhcs.uchicago.edu/ Published by: The Division of the Humanities at the University of ChicagoCopyright: 2010This work is licensed under a Creative Commons Attribution 3.0 Unported License
23 Paley. TextArc: An Alternate Way to View a Text. http://www.textarc.org/
24 Ruecker 2003.
Visual Hypotheses
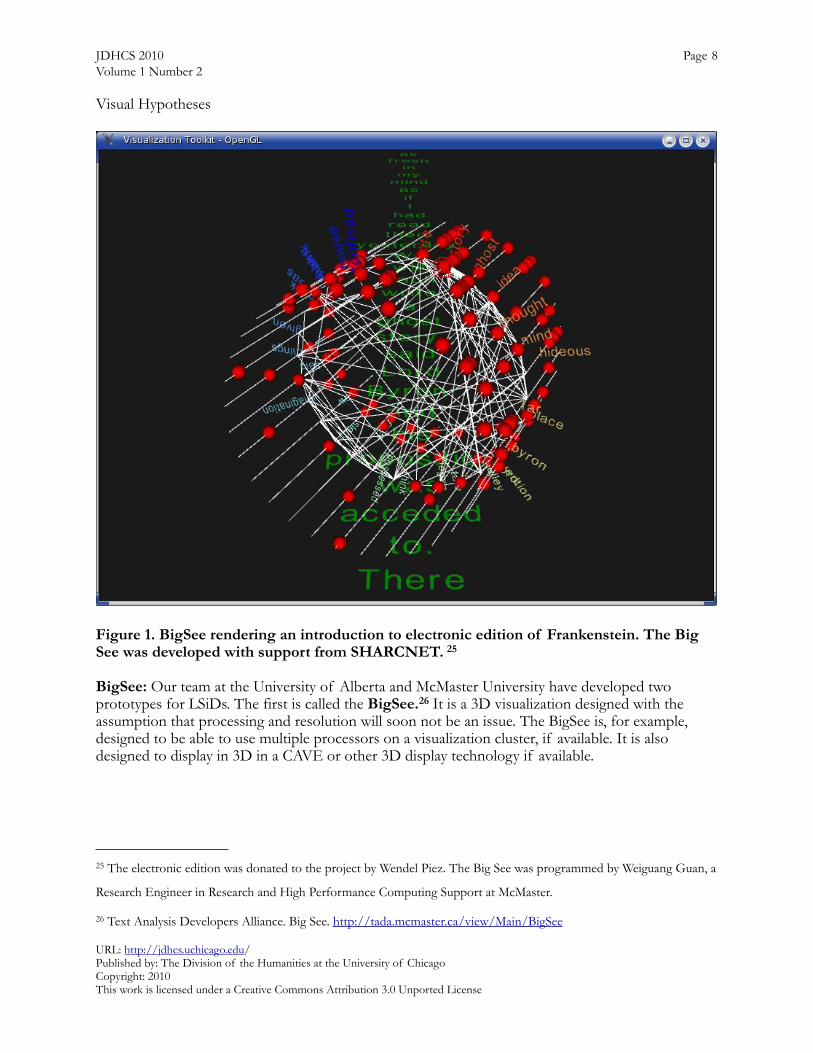
Figure 1. BigSee rendering an introduction to electronic edition of Frankenstein. The Big See was developed with support from SHARCNET. 25
BigSee: Our team at the University of Alberta and McMaster University have developed two prototypes for LSiDs. The first is called the BigSee.26 It is a 3D visualization designed with the assumption that processing and resolution will soon not be an issue. The BigSee is, for example, designed to be able to use multiple processors on a visualization cluster, if available. It is also designed to display in 3D in a CAVE or other 3D display technology if available.
JDHCS 2010 Page 8Volume 1 Number 2
URL: http://jdhcs.uchicago.edu/ Published by: The Division of the Humanities at the University of ChicagoCopyright: 2010This work is licensed under a Creative Commons Attribution 3.0 Unported License
25 The electronic edition was donated to the project by Wendel Piez. The Big See was programmed by Weiguang Guan, a
Research Engineer in Research and High Performance Computing Support at McMaster.
26 Text Analysis Developers Alliance. Big See. http://tada.mcmaster.ca/view/Main/BigSee
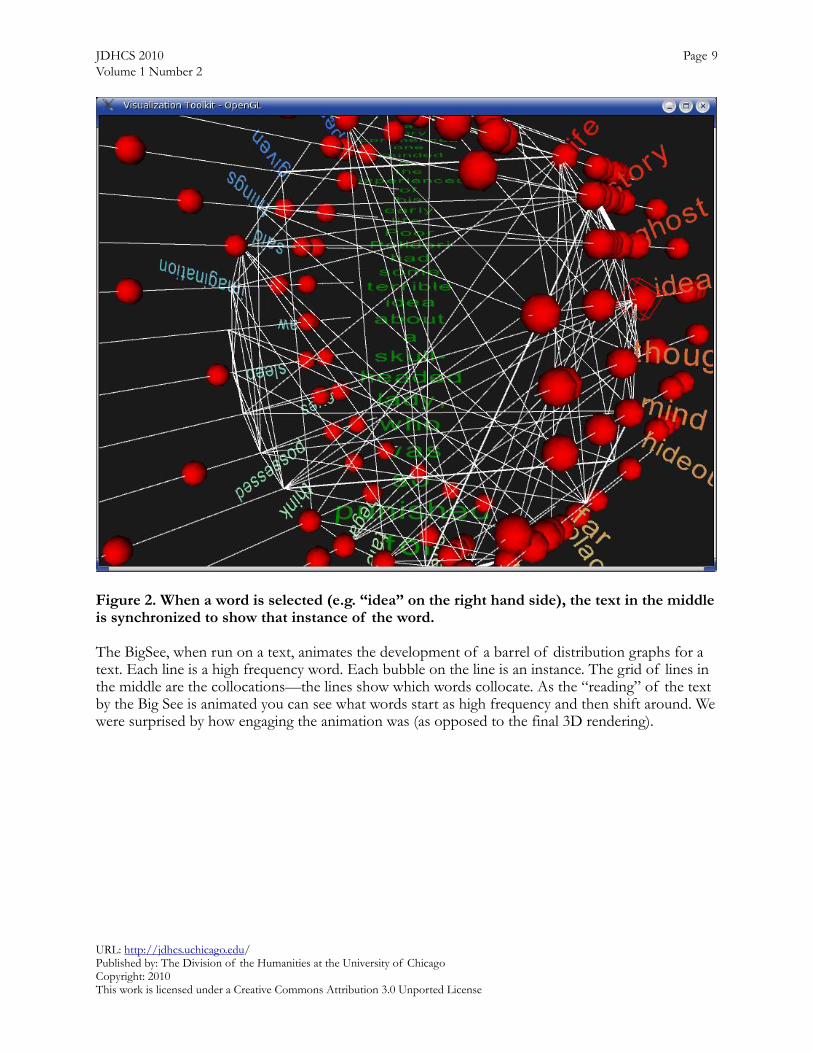
Figure 2. When a word is selected (e.g. “idea” on the right hand side), the text in the middle is synchronized to show that instance of the word.
The BigSee, when run on a text, animates the development of a barrel of distribution graphs for a text. Each line is a high frequency word. Each bubble on the line is an instance. The grid of lines in the middle are the collocations—the lines show which words collocate. As the “reading” of the text by the Big See is animated you can see what words start as high frequency and then shift around. We were surprised by how engaging the animation was (as opposed to the final 3D rendering).
JDHCS 2010 Page 9Volume 1 Number 2
URL: http://jdhcs.uchicago.edu/ Published by: The Division of the Humanities at the University of ChicagoCopyright: 2010This work is licensed under a Creative Commons Attribution 3.0 Unported License
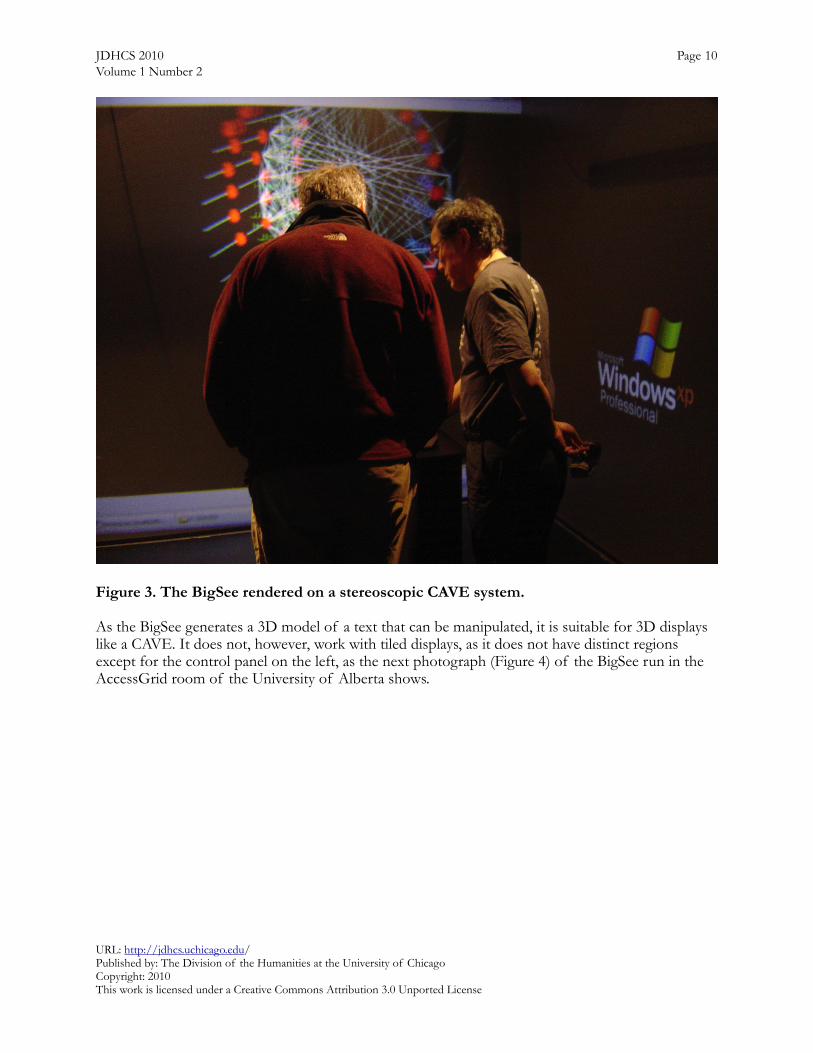
Figure 3. The BigSee rendered on a stereoscopic CAVE system.
As the BigSee generates a 3D model of a text that can be manipulated, it is suitable for 3D displays like a CAVE. It does not, however, work with tiled displays, as it does not have distinct regions except for the control panel on the left, as the next photograph (Figure 4) of the BigSee run in the AccessGrid room of the University of Alberta shows.
JDHCS 2010 Page 10Volume 1 Number 2
URL: http://jdhcs.uchicago.edu/ Published by: The Division of the Humanities at the University of ChicagoCopyright: 2010This work is licensed under a Creative Commons Attribution 3.0 Unported License
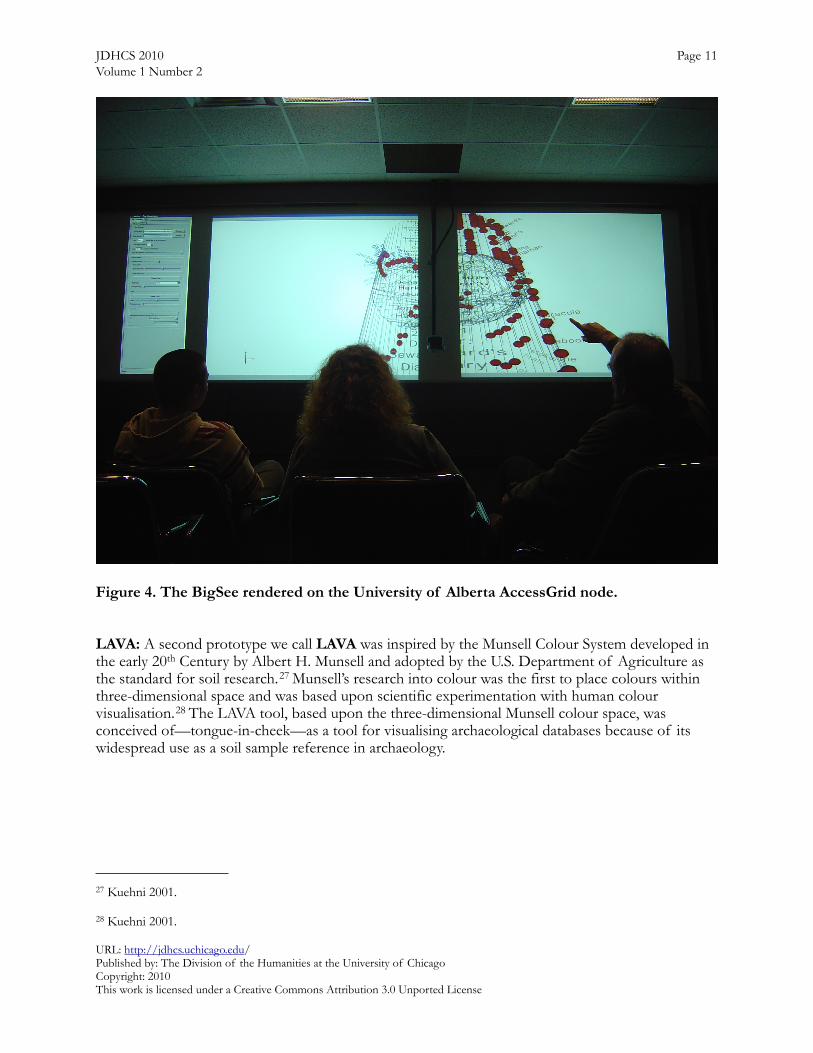
Figure 4. The BigSee rendered on the University of Alberta AccessGrid node.
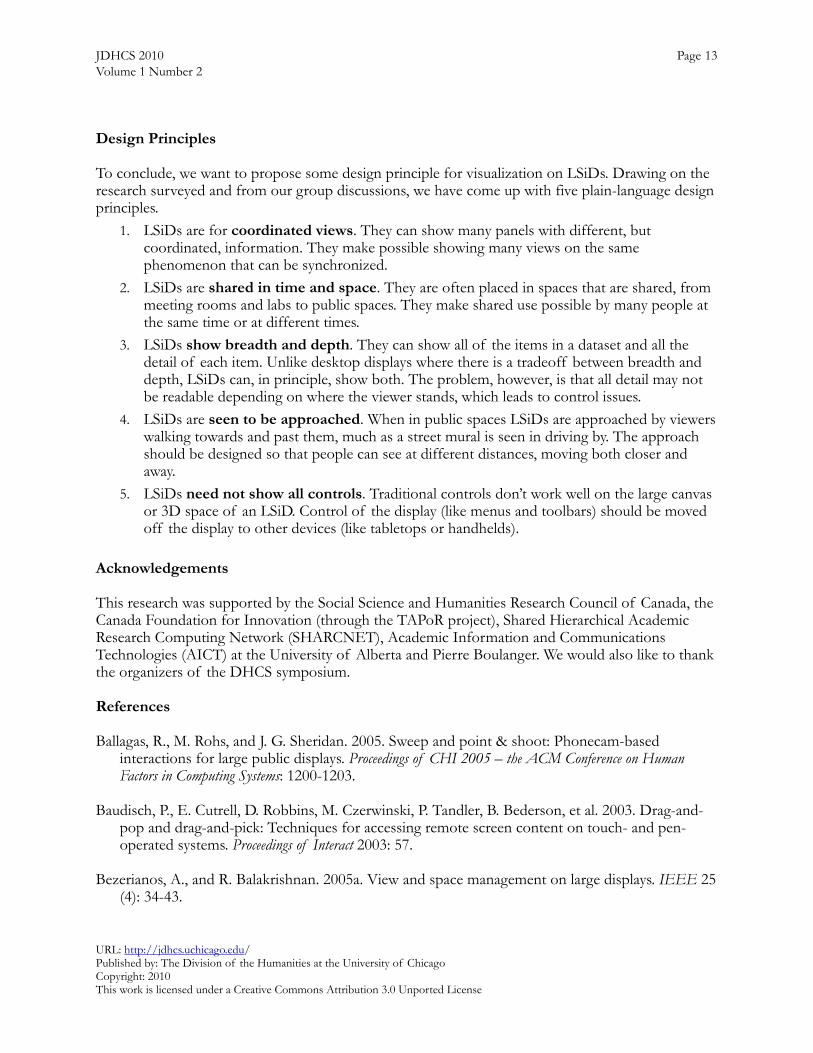
LAVA: A second prototype we call LAVA was inspired by the Munsell Colour System developed in the early 20th Century by Albert H. Munsell and adopted by the U.S. Department of Agriculture as the standard for soil research.27 Munsell’s research into colour was the first to place colours within three-dimensional space and was based upon scientific experimentation with human colour visualisation.28 The LAVA tool, based upon the three-dimensional Munsell colour space, was conceived of—tongue-in-cheek—as a tool for visualising archaeological databases because of its widespread use as a soil sample reference in archaeology.
JDHCS 2010 Page 11Volume 1 Number 2
URL: http://jdhcs.uchicago.edu/ Published by: The Division of the Humanities at the University of ChicagoCopyright: 2010This work is licensed under a Creative Commons Attribution 3.0 Unported License
27 Kuehni 2001.
28 Kuehni 2001.

Figure 5. LAVA rendering data from the Day of DH.
The LAVA tool works by visualising a database, allowing data to be stored and retrieved on spatial principles where each section on the central pillar can be expanded to a ring of keywords to include more data. The keywords are then expanded into pie-slice-shaped expansions of text chunks. In the images we are looking at, data is taken from the Day in the Life of Digital Humanities, where every segment in the rod is a participant. The pie shapes radiating out are high-frequency words, and the segments are passages with the keywords.29 The whole structure can be manipulated—rotated and zoomed—to explore different cuts through the data. Like the BigSee, LAVA does not tile well, but we hope to use this as a panel that can be used to navigate other tiled panels.
JDHCS 2010 Page 12Volume 1 Number 2
URL: http://jdhcs.uchicago.edu/ Published by: The Division of the Humanities at the University of ChicagoCopyright: 2010This work is licensed under a Creative Commons Attribution 3.0 Unported License
29 TAPoR at Alberta Wiki. Day in the Life of the Digital Humanities. http://tapor.ualberta.ca/taporwiki/index.php/
Day_in_the_Life_of_the_Digital_Humanities
Design Principles
To conclude, we want to propose some design principle for visualization on LSiDs. Drawing on the research surveyed and from our group discussions, we have come up with five plain-language design principles.
1. LSiDs are for coordinated views. They can show many panels with different, but coordinated, information. They make possible showing many views on the same phenomenon that can be synchronized.
2. LSiDs are shared in time and space. They are often placed in spaces that are shared, from meeting rooms and labs to public spaces. They make shared use possible by many people at the same time or at different times.
3. LSiDs show breadth and depth. They can show all of the items in a dataset and all the detail of each item. Unlike desktop displays where there is a tradeoff between breadth and depth, LSiDs can, in principle, show both. The problem, however, is that all detail may not be readable depending on where the viewer stands, which leads to control issues.
4. LSiDs are seen to be approached. When in public spaces LSiDs are approached by viewers walking towards and past them, much as a street mural is seen in driving by. The approach should be designed so that people can see at different distances, moving both closer and away.
5. LSiDs need not show all controls. Traditional controls don’t work well on the large canvas or 3D space of an LSiD. Control of the display (like menus and toolbars) should be moved off the display to other devices (like tabletops or handhelds).
Acknowledgements
This research was supported by the Social Science and Humanities Research Council of Canada, the Canada Foundation for Innovation (through the TAPoR project), Shared Hierarchical Academic Research Computing Network (SHARCNET), Academic Information and Communications Technologies (AICT) at the University of Alberta and Pierre Boulanger. We would also like to thank the organizers of the DHCS symposium.
References
Ballagas, R., M. Rohs, and J. G. Sheridan. 2005. Sweep and point & shoot: Phonecam-based interactions for large public displays. Proceedings of CHI 2005 – the ACM Conference on Human Factors in Computing Systems: 1200-1203.
Baudisch, P., E. Cutrell, D. Robbins, M. Czerwinski, P. Tandler, B. Bederson, et al. 2003. Drag-and-pop and drag-and-pick: Techniques for accessing remote screen content on touch- and pen-operated systems. Proceedings of Interact 2003: 57.
Bezerianos, A., and R. Balakrishnan. 2005a. View and space management on large displays. IEEE 25(4): 34-43.
JDHCS 2010 Page 13Volume 1 Number 2
URL: http://jdhcs.uchicago.edu/ Published by: The Division of the Humanities at the University of ChicagoCopyright: 2010This work is licensed under a Creative Commons Attribution 3.0 Unported License
Bezerianos, A., and R. Balakrishnan. 2005b. The Vacuum: Facilitating the manipulation of distant objects. Proceedings of CHI 2005 – the ACM Conference on Human Factors in Computing Systems: 361.
California NanoSystems Institute. 2009. About the AlloSphere. http://www.allosphere.ucsb.edu/about.php.
Calit2, n.d. About HIPerWall. http://hiperwall.calit2.uci.edu/?q=node/1.
Cao, X., and R. Balakrishnan. 2003. VisionWand: Interaction techniques for large displays using a passive wand tracked in 3D. Proceedings of UIST 2003 – the ACM Symposium on User Interface Software and Technology: 173.
Elrod, S., R. Bruce, R. Gold, D. Goldberg, F. Halasz, W. Janssen, et al. 1992. Liveboard: A large interactive display supporting group meetings, presentations, and remote collaboration. CHI ‘92: Proceedings of the SIGCHI Conference on Human Factors in Computing Systems: 599-607.
Khan, A., J. Matejka, G. Fitzmaurice, and G. Kurtenbach. 2005. Spotlight: Directing users’ attention on large displays. Proceedings of CHI 2005 – the ACM Conference on Human Factors in Computing Systems: 791.
Kuehni, R. G. 2001. The early development of the Munsell system. Color Research and Application 27(1): 20-27.
Manovich, L. 2009. Cultural Analytics. Plenary address presented at the Digital Humanities 2009 conference. June 22-25, University of Maryland.
Nacenta, M. A., D. Aliakseyeu, S. Subramanian, and C. Gutwin. 2005. A comparison of techniques for multi-display reaching. Proceedings of CHI 2005 – the ACM Conference on Human Factors in Computing Systems: 371.
Swaminathan, K., and S. Sato. 1997. Interaction design for large displays. Interactions 4(1): 15-24.
University of Alberta. 2007. AccessGrid node - Equipment detail. http://www.ualberta.ca/CNS/RESEARCH/AccessGrid/equipment.html.
WestGrid, n.d. About WestGrid. http://www.westgrid.ca/about_westgrid/.
Yost, B., and C. North. 2006. The perceptual scalability of visualization. IEEE Transactions of Vizualisation and Computer Graphics 12(5): 837-844.
JDHCS 2010 Page 14Volume 1 Number 2
URL: http://jdhcs.uchicago.edu/ Published by: The Division of the Humanities at the University of ChicagoCopyright: 2010This work is licensed under a Creative Commons Attribution 3.0 Unported License