Text block segmentation in comic speech bubbles - Archive ...
Upload
independentCategory
view
2download
0
Sonoporation from Jetting Cavitation Bubbles
Claus-Dieter Ohl,* Manish Arora,* Roy Ikink,* Nico de Jong,*y Michel Versluis,* Michael Delius,z
and Detlef Lohse**Faculty of Science and Technology, Physics of Fluids, University of Twente, Enschede, The Netherlands; yExperimental Echocardiography,Thoraxcentre, Erasmus Medisch Centrum, Rotterdam, The Netherlands; and zInstitute for Surgical Research, University of Munich, KlinikumGrosshadern, Munich, Germany
ABSTRACT The fluid dynamic interaction of cavitation bubbles with adherent cells on a substrate is experimentally investi-gated. We find that the nonspherical collapse of bubbles near to the boundary is responsible for cell detachment. High-speedphotography reveals that a wall bounded flow leads to the detachment of cells. Cells at the edge of the circular area of detachmentare found to be permanently porated, whereas cells at some distance from the detachment area undergo viable cell membraneporation (sonoporation). The wall flow field leading to cell detachment is modeled with a self-similar solution for a wall jet,together with a kinetic ansatz of adhesive bond rupture. The self-similar solution for the d-type wall jet compares very well withthe full solution of the Navier-Stokes equation for a jet of finite thickness. Apart from annular sites of sonoporation we also findmore homogenous patterns of molecule delivery with no cell detachment.
INTRODUCTION
Sonoporation—the rupture of cell membranes by acoustical
means—might allow novel strategies to noninvasively de-
liver large-sized molecules into cells for therapeutic applica-
tions (1,2). Gaining a better understanding of which physical
mechanisms are responsible for the rupture of the cell mem-
branes is crucial to increase the yield of treated cells. The
important finding that sonoporation (3–5) is drastically en-
hanced when bubbles are present during the acoustic exposure
hints that a fluid dynamic interaction between the pulsating
bubble and the cell is leading to membrane poration. Still, the
precise mechanisms of pore opening and the uptake of ex-
terior liquid are not determined in detail. Possible candidates
are shock waves (6,7) or acoustic transients emitted from the
bubble (8); extensional flow (9) straining the membrane
during expansion, shrinkage, or microstreaming (10); shear-
ing flow near no-slip boundaries (11); or a micro-jetting flow
that is excited when the bubble collapses aspherically (12).
In general, it can be distinguished between two acoustic
approaches to excite the bubble activity near to cells: Either
with a quasi-continuous ultrasound (1) or with a single in-
tensive wave (13). In quasi-continuous ultrasound applica-
tions, cells are exposed to many acoustic cycles. Then, bubbles
have enough time to grow by rectified diffusion (14–17)
from small nuclei to resonance size. In contrast, single wave
excitation causes nucleation and drives the bubble to a single
large volume oscillation. This can only be achieved for suf-
ficient amplitudes of the negative pressure. For this purpose,
shock wave generators, which are commonly used for the
fragmentation of renal stones (shock wave lithotripsy), have
proven to reach sufficient tensile stress. Other methods to
generate shock waves involve the use of lasers (6,18) or
shock tubes (19). In a recent experimental study, a laser-
induced cavitation bubble was generated near to a substrate
with adherent rat kidney cells (20). The authors concluded
that the shock wave launched from the cooling plasma at the
laser focus causes cell lysis and the lysis region is fully
developed within 1 ms after the laser pulse.
Here, we show that cavitation bubbles cause membrane
poration to cells plated on a substrate through a rather com-
plex sequence of events: Bubbles become nucleated and ex-
pand explosively. During the collapse of bubbles near to the
substrate, a jetting flow toward the substrate is excited. When
this jet flow impacts onto the boundary, it spreads out radi-
ally along the substrate. It is this flow which—together with
the no-slip velocity boundary condition at the wall covered
with cells—causes a strong gradient in the velocity compo-
nent parallel with the substrate. The resulting shear stress
acts on the cells attached to the boundary.
In this article we will first present a picture covering a
large area of cells treated with a single shock wave. Next,
fluorescence and electron micrographs distinguish locations
of permanent and viable sonoporation. Then the dynamics of
bubble-cell interaction is revealed with high-speed photog-
raphy. These observations are compared to a simple model
of wall-flow caused by the collapsing bubble. This simple
model reasonably agrees with the data. Note that we do not
present a full theoretical or numerical description of the wall
jet here. (Such a description has been done by Blake and co-
workers; see, e.g., (28,31,38,39,41).)
EXPERIMENTAL METHODS
Shock wave generation and high-speed imaging
The experimental setup, depicted in Fig. 1, consists of the shock wave
source, a 35 mm polystyrene petri dish (Fisher, ’s Hertogenbosch, Netherlands)
Submitted September 30, 2005, and accepted for publication August 18,
2006.
Address reprint requests to Dr. Claus-Dieter Ohl, Tel.: 31-53-489-5604;
E-mail: [email protected].
� 2006 by the Biophysical Society
0006-3495/06/12/4285/11 $2.00 doi: 10.1529/biophysj.105.075366
Biophysical Journal Volume 91 December 2006 4285–4295 4285

with adherent cells on the substrate facing the transducer, the imaging and
illumination devices, and digital delay lines. A single finite amplitude wave
is generated with a focused piezoelectric source; it is a slightly modified
commercial extracorporeal lithotripter Piezolith 3000 (Richard Wolf,
Knittlingen, Germany). The diameter of the shock wave source is 251 mm
and the focusing angle 94�. In the experiments presented here, only the
frontal of the two piezoelectric layers is operated at a moderately low
amplitude of 5 kV. The duration of the tensile wave is 2.5 ms and reaches an
amplitude of�4 MPa. The acoustic axis of the source is at an angle of 45� to
the horizontal plane. The transducer is located at the bottom of a stainless
steel container having glass windows on all three sides. The container is
filled with filtered, deionized, and degassed water (O2 concentration 3.3 mg/l
of water) at room temperature. The temperature of the lithotripter bath and
the cell medium is ;22�C.
Recordings are taken with a rotating mirror camera, Brandaris 128 (21),
at a frame rate of ;250 3 103 frames per second. It is equipped with 128
individual charge-coupled device cameras that are read out digitally. The
size of each frame is 500 3 292 pixels. Illumination is provided with a
continuous lamp connected to a flexible light guide, which is submerged in
the water and positioned close to the flask. A long distance microscope
(model No. K2, Infinity, Stuttgart, Germany) with a CF-3 objective (120 mm
working distance in air) images the scene. A field lens at the primary image
plane of the high-speed camera collects the illumination light (Kohler-type
illumination).
Cell assay and viability checks
Cervix cancer cells (HeLa) were grown at 37�C and 5% CO2 in Iscove’s
modified Dulbecco’s medium (Invitrogen, Breda, Netherlands) supple-
mented with 10% fetal bovine serum (Invitrogen) until they form a nearly
confluent monolayer. The medium was enriched with a solution of antibio-
tics and antimycotic (No. 15240-062, Gibco, Big Cabin, OK) with 100 units/
ml penicillin, 100 mg/ml streptomycin, and 0.25 mg/ml amphotericin B. The
cell density in the flask at the time of use was ;500 cells/mm2. The cells
were grown in 35-mm diameter petri dishes. Before the exposure with shock
waves, the petri dishes were attached to a holder with an imaging window
and filled completely with medium and 1 mg/ml of the cell impermeant
fluorophore Calcein (Merck, Darmstadt, Germany). Special threads into the
petri dish holder allowed filling and its closure such that no air bubbles
become trapped within. Then the holder was attached to a three-axis
translation stage and positioned at the focus of the sound field. Cell viability
was tested by adding ethidium bromide (Fluka, Zwijndrecht, Netherlands)
after shock wave exposure. By staining the cell culture at a final
concentrations of 5 mg/ml, ruptured cells appear red due to the intercalation
of ethidium bromide into their DNA.
Scanning electron microscopy andcell preparation
Cells after exposure to the shock wave and washing were fixed with a 5%
glutaraldehyde solution in PBS for 30 min. Dehydration was carried out in
graded series of ethanol (50%, 70%, 90%, 95%, and 100% for 20 min each).
Then the medium for the dehydrated cells was replaced by 50% mixture of
tetramethylsilane and ethanol (22). Finally, cells were immersed in 100%
tetramethylsilane for 10 min and air-dried at room temperature. All the speci-
mens were mounted on metal stubs with carbon-conducting tape and were
observed with a low-voltage scanning electron microscope (Gemini 1550
FEG, Leo Elektronenmikroskopie, Oberkochen, Germany) at voltages be-
tween 0.5 kV and 1.2 kV. Due to the low voltage operation mode it was not
necessary to deposit a conducting metal layer onto the specimen.
Large-scale fluorescence microscopy
After the application of a single shock wave, molecular uptake is scattered
over an area of typically .1 cm2. Simple imaging of the complete pattern
using a camera connected to the microscope is not feasible without the loss
of the details on the size of individual cells. Therefore, we applied a digital
image processing procedure named ‘‘image stitching,’’ where multiple
partly overlapping images of the substrate are taken. After suitable image
processing steps to equalize the image brightness of the individual images,
these are then combined into a single large-scale picture.
RESULTS AND DISCUSSION
Large-scale spatial distribution ofmolecular uptake
Fig. 2 b demonstrates the spatial pattern of molecular uptake
after a single shock-wave exposure. The image is constructed
from multiple stitched images covering an area of 9 3 22.4
mm2. The fluorescence picture is converted into grayscales,
where brighter pixels indicate drug uptake. Three partially
overlapping regions are nicely distinguishable in Fig. 2. In
region A, we find most prominent circular patterns. There,
mainly isolated bubbles collapse and detach disk-shaped
areas surrounded by an annular pattern of calcein uptake.
Similar patterns of uptake are found in region C, but far
fewer rings are found here. In contrast, region B being be-
tween regions A and C shows a more homogeneous pattern
of drug delivery spreading diffusively over an area of ;4 3
4 mm2.
We can correlate these regions with the bubble clusters
generated within the flask as sketched in Fig. 2 a (for details,
see (23,24)). The incoming wave creates a bubble cluster
with its major axis inclined under 45� to the front surface of
the petri dish. Some portion of the pressure wave (;30%) is
reflected at the back surface of the petri dish, and a second
bubble cluster separated in space from the primary one is
formed. Thus, near-surface bubble collapse takes place at
two separate areas on the petri dish, regions A and C.
FIGURE 1 Sketch of the experimental setup. Shock waves in the water
basin are generated with a piezoelectric transducer and are focused under an
angle of 45� to the horizontal. The adhering HeLa cells on the petri dish are
facing the shock-wave generator and are illuminated with a light guide.
Imaging of the cell layer is done with a long-working-distance microscope
connected to the high-speed framing system Brandaris 128.
4286 Ohl et al.
Biophysical Journal 91(11) 4285–4295

Region B is practically free of bubbles, although we find
molecular uptake at lower intensity levels of the fluorescence
emission. This region is closest to the center of the bubble
cluster generated within the petri dish. The collective col-
lapse of this cluster acts like a sink flow drawing fluid toward
its center. We speculate that it might be the shear flow gen-
erated by the violent cluster collapse that causes the drug
uptake in region B. This hypothesis would explain that the
homogeneous and diffuse pattern is only observed between
regions A and C being nearest to the center of the main
cavitation cluster.
Closeups of detachment sites
Two closeups with an additional viability staining from re-
gion A are depicted in Fig. 3. There, ethidium-bromide is
used to stain permanently porated cells red and viable calcein
uptake is indicated with green fluorescence. In general, we
find disk-shaped detachment sites with diameters of the order
of the maximum bubble diameter. The central cleared areas
are bordered with an inner annular ring of killed cells. A typ-
ical example is given in the left portion of Fig. 3. There, the
area of cell killing (red-stained cells) has a width of ;5 cell
diameters wide. These cells will eventually round-up due to
their loss of adhesion ability. In contrast, the cells in the outer
annular structure (stained green) stay adhesive.
We find when regions of detachment are close to each
other that the circular shape is disturbed. An interesting
pattern of molecular delivery is depicted in Fig. 3, right. The
upper cleared area possesses an egg shape, which narrows
toward the lower site of detachment. A plausible scenario
causing this pattern might be a translational movement of the
bubbles toward each other during the collapse dynamics.
Bubbles collapsing in phase are accelerated toward each
other (see, e.g., (25)). Thereby, the jet flow will not impact
perpendicular toward the substrate but under some angle.
The inclined jet flow might be responsible for the cusp shape
area of detachment observed in the upper site of drug de-
livery. In contrast, more isolated areas of detachment (i.e.,
lower bubble density) depict a more circular area of detach-
ment, which suggests that bubble-bubble interaction plays a
role in sonoporation.
As pointed out above, region B, Fig. 2, shows a much dif-
ferent uptake pattern. A closeup from region B with ethidium-
bromide staining is depicted in Fig. 4. We find a homogeneous
delivery pattern with ;15% of the cells showing permanent
poration (colored red). This observation can be explained
with a flow generated at a larger scale from the collapsing
cloud above the substrate. It will resemble to some extent the
flow from a large bubble collapsing at some distance from
the substrate. The area where cells are subjected to highest
shear rates from this flow pattern will be the one closest to
the center of the cloud. From geometrical considerations, this
area is located between regions A and region C in Fig. 2.
Cell membrane morphology
Scanning electron microscopy (SEM) reveals changes on much
smaller scales as compared to fluorescence light-microscopy.
FIGURE 2 (a) Sketch of the side view and top view of the bubble cluster.
The incoming wave enters under an angle of 45�. Two bubble clusters are
generated; one from the main wave, and a smaller one from the reflection at
the inner surface of the petri dish. The side view (right) depicts areas A and Cwhere bubble-collapse onto the adherent cells takes place. Area B is largely
free of bubbles. (b) Large-scale fluorescence microscope picture of the
substrate after the bubble collapse. Annular structures of molecular uptake
(bright cells) are found in regions A and C, where region B is covered with a
diffuse pattern. The white bar denotes a scale of 10 mm.
FIGURE 3 Closeup of typical cell detachment areas found in region A of
Fig. 2. Viable porated cells are colored green (calcein uptake) and red cells
are stained with ethidium bromide (permanent poration). The left image
depicts the detachment and sonoporation from a single bubble, and the right
image depicts two bubbles that have collapsed close to each other. The bar
denotes 0.5 mm.
Sonoporation from Jetting Bubbles 4287
Biophysical Journal 91(11) 4285–4295

Here, we apply SEM to study the morphological structure of
the cell membrane after the exposure to cavitation bubbles.
Fig. 5 depicts with increasing magnification cells at the
borderline between the area of detachment and attachment.
The leftmost frame in Fig. 5 shows a typical disk-shaped area
where single cavitation bubble collapse has taken place. By
increasing the magnification (Fig. 5 b), it is revealed that the
cells at the boundary have rounded up, whereas some cell-
diameter away, cells are unaffected and still have a flat shape.
In addition, cells at the boundary have piled up. At the
highest magnification (Fig. 5 c), structural damage indicated
with arrows of some of the rounded-up cells becomes evi-
dent. The shape and size of the lesions points to ruptured
adhesion sites with cytoskeleton attachment. The piling up of
the damaged cells can be explained that these cells have lost
not all of their junctions but remain partially connected to
neighboring cells. Thus, the flow has transported them on top
of the cells while remaining partly attached.
The diameter of the pores is ;1 mm. Most probably their
large size prevented a closure between shock-wave exposure
and fixation with glutaraldehyde, which was conducted
;5 min after shock-wave exposure. In contrast, smaller and
repairable pores close earlier (26). This explains why viable
porated cells and ‘‘untreated’’ cells far away from detach-
ment areas look essentially the same.
Cavitation-induced detachment dynamics
Fig. 6 depicts selected frames taken from a recording with
the framing camera Brandaris 128 (21) at 230,000 frames per
second. The numbers in the upper right display the time
passed from the start of the negative pressure wave in mi-
croseconds. The recording is taken perpendicular to the
substrate. Thus the dynamics is seen in a top view looking on
the blurry layer of cells. Two stages of the dynamics can be
distinguished, namely, the bubble oscillation and the process
of cell detachment.
At first, a mainly isolated bubble expands, reaches maxi-
mum size, and collapses at ;t � 154 ms. The time to col-
lapse an empty, spherical, isolated bubble of radius Rmax
to zero size is given by the Rayleigh collapse time
0:9Rmax
ffiffiffiffiffiffiffiffiffiffir=P0
p, where r and P0 in Eq. 1 are the density of
the liquid and the pressure far from the bubble, respectively.
As here the bubble is not isolated but close to a wall, we
allow for a prolongation factor a, which depends on the
distance of the bubble center from the rigid boundary and is
of order 1 (27,28). The collapse time then is
FIGURE 4 Closeup of typical cell detachment areas found in region B of
Fig. 2. Viable porated cells are colored green (calcein uptake) and red cells
are stained with ethidium bromide (permanent poration). Approximately
15% of the cells are permanently porated. The bar denotes 0.5 mm.
FIGURE 5 Three scanning electron microscopy (SEM) micrographs with
increasing magnification from left to right. The white bar denotes a length of
20 mm. (a) Overview of a disk-shaped detachment site. (b) Magnified view
of the grayed area in a showing rounded and piled-up cells at the border and
flat cells further away. (c) The rounded cells at the border reveal structural
damage on their membrane indicated with white arrows.
4288 Ohl et al.
Biophysical Journal 91(11) 4285–4295

Tc � a0:9Rmax
ffiffiffiffiffir
P0
r: (1)
For a ¼ 1, the measured collapse time of TC ¼ 77 ms
would correspond to a maximum bubble size of Rmax �0.85 mm. However, the presence of the boundary increases
the collapse time, i.e., a . 1 in Eq. 1. Therefore, the maxi-
mum bubble radius is slightly overestimated when taking
a ¼ 1. Indeed, the measured radius is slightly smaller,
namely 0.8 mm. The assumption of a Rayleigh collapse time
holds only for a bubble driven by a constant (ambient) pres-
sure. This condition is fulfilled in this experiment because
the duration of the tensile wave is only a few microseconds
and therefore negligible compared to duration of the first
oscillation cycle.
The bubble rebounces after the first collapse as a toroid
with a corrugated surface. This toroidal structure results from
the liquid jet flow toward the substrate. After the rebounce, a
second much weaker volume oscillation is observed before
the bubble finally disintegrates at t � 200 ms.
The second dynamical stage in Fig. 6 is the growth of the
cell-depleted area first visible at ;180 ms. Initially, the central
cleared area is surrounded by the remains of the toroidal bub-
ble. The initial size of the depleted area is comparable with the
size of the toroidal bubble. In the beginning, the depleted area
grows at a radial velocity of 2 m/s. Later it decreases within the
captured sequence to 0.4 m/s. Interestingly, no cell removal is
observed during the early phase of the bubble collapse.
Fig. 7 depicts the temporal evolution of the bubble radius
and the equivalent radius of the area cleared from cells. The
cleared area approaches an averaged radius of 0.95 mm as-
ymptotically. The most remarkable and important experimen-
tal finding is that, although the bubble has already disintegrated,
the growth of the cell depletion area still continues.
FIGURE 6 Detachment dynamics caused by the col-
lapse of a single bubble close to a layer of adherent cells
(shaded background). Here, selected frames from a
framing sequence taken at 230,000 frames per second are
depicted. The solid bar in the last frame denotes a scale of
1 mm. The numbers in the upper right of the frames
indicate the elapsed time in microseconds after the start of
the negative pressure. The bubble reaches maximum size at
;t ¼ 80 ms and shrinks to its smallest size at t ¼ 154 ms.
Then it reexpands as a corrugated toroidal bubble. From
time t ¼ 180 ms, the rim of the detached area becomes
visible. The area continuous to expand even after the bub-
ble has disintegrated.
FIGURE 7 Radius of the bubble (h) and the size of the detached area (s)
as a function of time. Zero time denotes the instant when the negative pres-
sure wave reaches the cells.
Sonoporation from Jetting Bubbles 4289
Biophysical Journal 91(11) 4285–4295
A similar pattern of cell removal has been observed by
Vogel et al. (29) after cavitation bubble dynamics at the cor-
neal endothelium. In this reference it has been argued that the
‘‘denudation of Descemet’s membrane. . .is probably caused
by the jet flow on the corneal surface directed radially out-
ward from the impact site.’’ This speculation is consistent with
our observations.
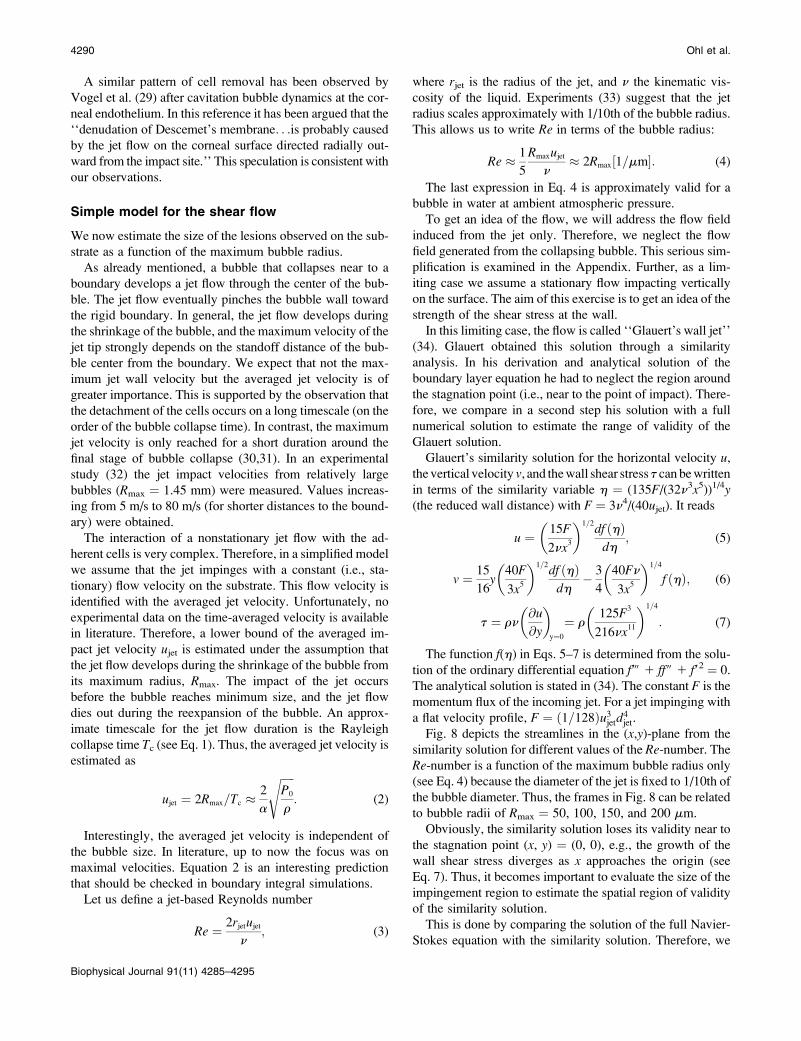
Simple model for the shear flow
We now estimate the size of the lesions observed on the sub-
strate as a function of the maximum bubble radius.
As already mentioned, a bubble that collapses near to a
boundary develops a jet flow through the center of the bub-
ble. The jet flow eventually pinches the bubble wall toward
the rigid boundary. In general, the jet flow develops during
the shrinkage of the bubble, and the maximum velocity of the
jet tip strongly depends on the standoff distance of the bub-
ble center from the boundary. We expect that not the max-
imum jet wall velocity but the averaged jet velocity is of
greater importance. This is supported by the observation that
the detachment of the cells occurs on a long timescale (on the
order of the bubble collapse time). In contrast, the maximum
jet velocity is only reached for a short duration around the
final stage of bubble collapse (30,31). In an experimental
study (32) the jet impact velocities from relatively large
bubbles (Rmax ¼ 1.45 mm) were measured. Values increas-
ing from 5 m/s to 80 m/s (for shorter distances to the bound-
ary) were obtained.
The interaction of a nonstationary jet flow with the ad-
herent cells is very complex. Therefore, in a simplified model
we assume that the jet impinges with a constant (i.e., sta-
tionary) flow velocity on the substrate. This flow velocity is
identified with the averaged jet velocity. Unfortunately, no
experimental data on the time-averaged velocity is available
in literature. Therefore, a lower bound of the averaged im-
pact jet velocity ujet is estimated under the assumption that
the jet flow develops during the shrinkage of the bubble from
its maximum radius, Rmax. The impact of the jet occurs
before the bubble reaches minimum size, and the jet flow
dies out during the reexpansion of the bubble. An approx-
imate timescale for the jet flow duration is the Rayleigh
collapse time Tc (see Eq. 1). Thus, the averaged jet velocity is
estimated as
ujet ¼ 2Rmax=Tc �2
a
ffiffiffiffiffiP0
r
s: (2)
Interestingly, the averaged jet velocity is independent of
the bubble size. In literature, up to now the focus was on
maximal velocities. Equation 2 is an interesting prediction
that should be checked in boundary integral simulations.
Let us define a jet-based Reynolds number
Re ¼ 2rjetujet
n; (3)
where rjet is the radius of the jet, and n the kinematic vis-
cosity of the liquid. Experiments (33) suggest that the jet
radius scales approximately with 1/10th of the bubble radius.
This allows us to write Re in terms of the bubble radius:
Re � 1
5
Rmaxujet
n� 2Rmax½1=mm�: (4)
The last expression in Eq. 4 is approximately valid for a
bubble in water at ambient atmospheric pressure.
To get an idea of the flow, we will address the flow field
induced from the jet only. Therefore, we neglect the flow
field generated from the collapsing bubble. This serious sim-
plification is examined in the Appendix. Further, as a lim-
iting case we assume a stationary flow impacting vertically
on the surface. The aim of this exercise is to get an idea of the
strength of the shear stress at the wall.
In this limiting case, the flow is called ‘‘Glauert’s wall jet’’
(34). Glauert obtained this solution through a similarity
analysis. In his derivation and analytical solution of the
boundary layer equation he had to neglect the region around
the stagnation point (i.e., near to the point of impact). There-
fore, we compare in a second step his solution with a full
numerical solution to estimate the range of validity of the
Glauert solution.
Glauert’s similarity solution for the horizontal velocity u,
the vertical velocity v, and the wall shear stress t can be written
in terms of the similarity variable h ¼ (135F/(32n3x5))1/4y(the reduced wall distance) with F ¼ 3n4/(40ujet). It reads
u ¼ 15F
2nx3
� �1=2df ðhÞ
dh; (5)
v ¼ 15
16y
40F
3x5
� �1=2df ðhÞ
dh� 3
4
40Fn
3x5
� �1=4
f ðhÞ; (6)
t ¼ rn@u
@y
� �y¼0
¼ r125F
3
216nx11
� �1=4
: (7)
The function f(h) in Eqs. 5–7 is determined from the solu-
tion of the ordinary differential equation f9$ 1 ff$ 1 f92 ¼ 0.
The analytical solution is stated in (34). The constant F is the
momentum flux of the incoming jet. For a jet impinging with
a flat velocity profile, F ¼ ð1=128Þu3jetd
4jet.
Fig. 8 depicts the streamlines in the (x,y)-plane from the
similarity solution for different values of the Re-number. The
Re-number is a function of the maximum bubble radius only
(see Eq. 4) because the diameter of the jet is fixed to 1/10th of
the bubble diameter. Thus, the frames in Fig. 8 can be related
to bubble radii of Rmax ¼ 50, 100, 150, and 200 mm.
Obviously, the similarity solution loses its validity near to
the stagnation point (x, y) ¼ (0, 0), e.g., the growth of the
wall shear stress diverges as x approaches the origin (see
Eq. 7). Thus, it becomes important to evaluate the size of the
impingement region to estimate the spatial region of validity
of the similarity solution.
This is done by comparing the solution of the full Navier-
Stokes equation with the similarity solution. Therefore, we
4290 Ohl et al.
Biophysical Journal 91(11) 4285–4295

make use of a finite element solver (FEMLAB, Comsol, Los
Angeles, CA) to calculate the flow field. We assume that the
jet flow caused by the collapsing bubble can be modeled by a
continuous discharge of a nozzle placed at a short distance
from the boundary. Fig. 9 sketches the axisymmetric
geometry (x,y) of the problem. The boundary conditions
are defined as following: along the exit plane AB, free inflow
with velocity v(x, y¼ h)¼ – vjet and u(x, y¼ h)¼ 0; on plane
BC, no-slip b.c. u(x ¼ djet/2, y) ¼ v(x ¼ djet/2, y) ¼ 0; on
planes CD and DE, free outflow p ¼ 0; on the rigid surface
EF, no-slip b.c. u(x, y¼ 0)¼ v(x, y¼ 0)¼ 0; and on the axis
of symmetry FA, symmetric b.c. uðx ¼ 0; yÞ ¼ 0; @v@y¼ 0.
The size of the computational domain is 15-jet-diameter
wide and 5-jet-diameter high. The calculations are performed
for the height h ¼ djet/2 of the jet from the rigid surface. The
convergence test with a double refined and double widened
unstructured mesh gave no noticeable deviation from the
results up to the Reynolds numbers reported here. Further-
more, the good agreement with the flow pattern and values of
the shear stress being reported in Deshpande and Vaishnav
(35) supports our confidence that adequate convergence has
been reached.
Fig. 10 depicts various streamlines; the solid square
denotes the position of the incoming flow. By comparing the
streamlines from the similarity solution, Fig. 8, and the full
solution, Fig. 10, we find similar streamlines in the far field.
In the near field there are, of course, deviations: In the full
solution, the fluid entering from the top close to the pipe is
sucked toward the jet and dragged under some angle to the
horizontal away from the wall. This difference in the flow
pattern can be attributed to the neglect of the impingement
region in the similarity solution. In the impingement region,
fluid is attracted toward the stagnation point leading to a
region with a negative horizontal velocity, u , 0. This
difference in flow pattern might render our approach invalid
FIGURE 8 Streamlines for the similarity solution from Glauert of the wall
jet for different values of the Re-number. The jet is flowing along the line
x ¼ 0 and impinging at the origin.
FIGURE 9 Sketch of the geometry to solve the Navier-Stokes equation in
axisymmetry. The jet with a diameter of djet is released at a distance of hjet
from the rigid wall.
FIGURE 10 Streamlines for the full Navier-Stokes solution of the wall jet.
The solid rectangle indicates the position of the incoming jet.
Sonoporation from Jetting Bubbles 4291
Biophysical Journal 91(11) 4285–4295

to adapt the similarity solution for modeling the strength of
the wall shear stress (Eq. 7). To double-check, we therefore
compare the magnitude of the wall shear stress from the
similarity solution with the solution of the full Navier-Stokes
equation.
Fig. 11 shows the horizontal velocity u ¼ u(x ¼ const, y)
for four different Re-numbers for various distances x/Rjet.
The solid line depicts the flow profile from Navier-Stokes
equation and the dashed line the similarity solution. The flow
profile is bell-shaped, and the velocity amplitude decreases
and moves upwards with distance from the stagnation point.
As expected, with larger distance both solutions approach
each other and a good representation of the flow profile
through the similarity solution is reached. For small Re-
numbers even around the origin x ¼ 0, the agreement is
good. The strongest deviations between the similarity solu-
tion and the direct numerical simulation results are obtained
for 0 , x/Rjet , 3 and for the largest Re-numbers. The wall
shear stress, which is proportional to the derivative of the
profile at y ¼ 0 of Fig. 11, is overestimated by the similarity
solution in that range.
The wall shear stress as a function of the distance is plotted
in Fig. 12 for the same range of Re-numbers. Note the loga-
rithmic scale on the y axis. The solution of the Navier-Stokes
equation (solid line) increases from zero at the stagnation
point, reaches a maximum at x/Rjet � 1.5 and drops again for
larger distances. In contrast, the similarity solution (dashedline in Fig. 12) starts from infinity (see Eq. 7) and approaches
the Navier-Stokes solution with increasing x/Rjet asymptot-
ically. From Fig. 12, it becomes evident that the similarity
solution allows for a very reasonable estimate of the wall
shear for normalized distances already from x/Rjet . 3 on.
Model for the detachment dynamics
Adherent cells on the substrate being exposed to a sufficient
wall shear stress become detached and are transported with
the flow. For an estimate of the size of the depleted area the
process of bond breaking between the cell membrane and the
substrate has to be evaluated. Here, we make use of a peeling
model for cell detachment derived by Garrivier et al. (36).
The process of detachment is described by a fracture process
of the bonds in the adhesive belt. Their model has been
validated experimentally in a planar shear-flow setup.
Let us rewrite the main model equations: The detachment
efficiency n after time t, i.e., the percentage of detached cells,
is given by the rate equation
n ¼ 1� expð�kðtÞtÞ; (8)
where k(t) is the shear-stress dependent detachment rate
defined through Eq. 9. The detachment rate constant k(t) is
therefore the inverse of the typical time needed to detach a
cell exposed to hydrodynamic shear stress t. It is expressed
as (36)
kðtÞ ¼ k0
expðffiffiffiffiffiffiffiffiffiffiffiffit=4t0
pÞ
ðt=4t0Þ1=4; (9)
where k0 and t0 are parameters of the cell type and substrate.
These two constants are estimated with values for Dictyos-telium discoideum on a glass substrate taken from Decave
et al. (37) with k0 ¼ 2 3 10�4 s�1 and t0 ¼ 0.08 Pa.
The critical shear stress tc to cause cell detachment can be
obtained by solving Eqs 8 and 9 for t. The time t in Eq. 8 is
the duration the shear stress lasts and can be identified with
the collapse time TC (see Eq. 1). For convenience, we iden-
tify full detachment with n ¼ nf¼ 99%. The shear stress as a
function of the distance from the stagnation point is given as
a monotonic function. Therefore, the critical shear stress tc
can be identified uniquely with the radius of detachment.
By considering the diameter of the jet as a function of the
bubble diameter and using the estimate for the constant jet
velocity from Eq. 2, we can numerically solve for the radius
of the detachment area, xc, as a function of the bubble radius.
Yet, an approximation of the critical shear stress can be
obtained analytically by inserting Eq. 9 into the rate Eq. 8,
solving for tc, and neglecting terms of the order log(t/t0).
This is justified for large wall shear stresses when tc=t0 �logðtc=t0Þ. The critical shear stress is thus approximated by
tc � 4t0 log�logð1� nfÞ
4k0TC
� �� �2
; (10)
with TC given by Eq. 1. Fig. 13 illustrates the radius of the
cell-depleted area, xc versus the maximum bubble radius.
The radius of the depleted area increases with increasing
FIGURE 11 Profiles of the horizontal flow velocity for the full solution
(solid lines) and the self-similar solution (dashed lines). For larger distances
Rjet from the origin, both models show good agreement.
4292 Ohl et al.
Biophysical Journal 91(11) 4285–4295

bubble radius. Here, the solid curve depicts the numerical
solution and the (hardly distinguishable) dashed curve de-
picts the solution using the approximation from Eq. 10. In
any case, bubbles in the range of 0.1–1 mm cause a depletion
area of 1.6–1.8 times their maximum bubble size.
Comparison experiment with theory
Now let us compare the predicted size of the detached area
from Fig. 13 for the measured maximum bubble radius of 0.8
mm: Fig. 13 suggests an detachment radius of 1.36 mm,
which should correspond to the asymptotic value in Fig. 7 of
0.95 mm. Although there is a discrepancy of 40%, we con-
sider this as a reasonable estimate while keeping in mind the
coarse simplifications introduced in the model. Two addi-
tional measurements from other runs of the high-speed photo-
graphy are depicted in Fig. 13 as solid squares. Still, more
measurements are necessary to strengthen the observation,
that smaller bubbles cause smaller areas of detachment. Yet,
the obtained data supports the trend of the model.
We mention that, when cavitation nuclei (ultrasound
contrast agent Levovist from Schering, Berlin, Germany
mixed at a concentration of 10 mg/ml) are added, many more
bubbles are nucleated. These, however, grow much less—
presumably due to the bubble-bubble interaction. Instead of
circular sites of detachment reported in this publication, we
find scattered sides of drug delivery with a few cells involved
and no detached cells.
SUMMARY
In summary, we demonstrate that cavitation bubbles and not
the shock wave itself is causing drug delivery for the experi-
mental conditions reported here. High-speed images capture
cells transported with a radial flow, which we explain with a
radial spreading flow. It is formed during the aspherical
collapse leading to a wall jet flow. The resulting boundary
layer flow makes the cells experience a strong shear, which
finally causes cell detachment. Cells lining the border of the
detached area are showing permanent poration due to large
lesions in the cell membrane. Cells further away show repair-
able poration and uptake of a non-membrane-permeant dye
(calcein).
FIGURE 12 The wall shear stress as a function of the
distance for the full solution (solid lines) and the self-
similar Glauert solution. For distances larger than ;3 Rjet
from the origin, good agreement is obtained.
FIGURE 13 Radius of the detachment area xc as a function of the
maximum bubble radius Rmax obtained from the numerical solution of Eq. 8
for tc (solid line) and through the approximation Eq. 10 (dotted line). The
solid squares denote measurements.
Sonoporation from Jetting Bubbles 4293
Biophysical Journal 91(11) 4285–4295

APPENDIX: COMMENT ON THE FLOW FIELD OFCOLLAPSING BUBBLES NEAR BOUNDARIES
In this Appendix we discuss in more detail the simplifying assumption of a
radial spreading wall jet: The jet flow from bubbles collapsing near bound-
aries impacts on the boundary before the bubble has reached its minimum
size. Because of that the outwards spreading wall jet flow eventually collides
with the radially inwards directed flow due to the still shrinking bubble
leading to liquid acceleration away from the wall (depicted, for example, in
Fig. 5 of (38)). This phenomenon has been termed ‘‘splash’’ by Tong et al.
(39). The splashing of liquid has been found for nondimensionalized stand-
off distances, g ¼ s/Rmax, between 0.6 and 1.2, where s is the initial distance
between the bubble center and the boundary. High-speed photography
(38–40) depicts the deformation of the bubble shape during the splash. At
later stage, the splash induces a toroidal vortex at the wall.
Potential flow calculations, e.g., those of Pearson et al. (41), are in ex-
cellent agreement with experimental observations. Therefore, one wonders if
a simple wall jet flow is able to model the essential flow field close to the
boundary. Here, we argue that although liquid from the wall jet is accel-
erated away from the boundary, the relevant fluid dynamics for the cell
detachment takes place in the boundary layer, which cannot be captured
within the potential flow framework and which was not studied in the above
cited experiments.
To obtain more insight on the competition between the outward spread-
ing flow (the wall jet) and the inward one (the sink flow), we compare their
magnitude for a typical case. The maximum velocity of the wall jet flow,
uout, can be readily calculated with Eq. 5 and the knowledge that the maxi-
mum of the function df(h)/dh, which is 0.32 (34). In contrast, a typical radial
inward velocity caused by the shrinking bubble is approximated with a sink
located at a distance l from a rigid boundary. From potential flow theory, the
inward velocity uin can be calculated with
uin ¼2R
2 _RRx
ðl21 x
2Þ3=2; (11)
where R is the bubble radius and _RR is the bubble wall velocity. We further
estimate an upper bound of uin by setting l ¼ 0 in Eq. 11. We find that the
velocity uin(x) for a typical case (see (38), Figs. 3 and 4, with g¼ 1.1, Rmax¼1.4 mm, _RR¼ 35 m/s, and ujet ¼ 60 m/s) is at least an order-of-magnitude
smaller than uout(x). Thus we argue that the boundary layer flow caused by
the jet is only weakly modified by the splashing phenomena. We also stress
that the splash lasts only for a few microseconds; see, e.g., the reversal of the
near-boundary velocity vectors in Fig. 5, b and c, of Brujan et al. (38).
Shortly after, the wall jet and the toroidal vortex flow induced by the splash
are oriented in the same direction.
Our argument of the importance of the wall jet is in full agreement with the
observation in our Fig. 6. Here, no cell removal is found during the collapse of
the bubble, thus the velocity gradients induced by the inward flow are too
weak. In contrast, the outwards-directed jet flow causes immediate detachment.
We are very thankful to Yvonne Kraan from the cell lab for her help with
the cell cultivation work. Further, we thank Gert-Wim Bruggert for con-
struction of various apparatus.
This work is financially supported through Stichting voor Fundamenteel
Onderzoek der Materie (FOM, The Netherlands), under grant No. 00PMT04.
C.D.O. acknowledges the support from the Nederlandse Organisatie voor
Wetenschappelijk Onderzoek (NWO, The Netherlands) through the VIDI grant.
REFERENCES
1. Miller, M. W., D. L. Miller, and A. A. Brayman. 1996. A review of invitro bioeffects of inertial ultrasonic cavitation from a mechanistic per-spective. Ultrasound Med. Biol. 22:1131–1154.
2. Ng, K., and Y. Liu. 2002. Therapeutic ultrasound: its application indrug delivery. Med. Res. Rev. 22:204–223.
3. Bao, S. P., B. D. Thrall, and D. L. Miller. 1997. Transfection of a re-porter plasmid into cultured cells by sonoporation in vitro. UltrasoundMed. Biol. 23:953–959.
4. Ward, M., J. R. Wu, and J. F. Chiu. 1999. Ultrasound-induced cell lysisand sonoporation enhanced by contrast agents. J. Acoust. Soc. Am. 105:2951–2957.
5. Stride, E., and N. Saffari. 2003. Microbubble ultrasound contrastagents: a review. Proc. Instn. Mech. Engrs. 217:429–447.
6. Lee, S., T. Anderson, H. Zhang, T. J. Flotte, and A. G. Doukas. 1996.Alteration of cell membrane by stress waves in vitro. Ultrasound Med.Biol. 22:1285–1293.
7. Lokhandwalla, M., and B. Sturtevant. 2001. Mechanical haemolysis inshock wave lithotripsy (SWL). I. Analysis of cell deformation due toSWL flow-fields. Phys. Med. Biol. 46:413–437.
8. Sundaram, J., B. R. Mellein, and S. Mitragotri. 2003. An experimentaland theoretical analysis of ultrasound-induced permeabilization of cellmembranes. Biophys. J. 84:3087–3101.
9. Lokhandwalla, M., J. A. McAteer, J. C. Williams, Jr., and B. Sturtevant.2001. Mechanical haemolysis in shock wave lithotripsy (SWL). II. Invitro cell lysis due to shear. Phys. Med. Biol. 46:1245–1264.
10. Wu, J., J. P. Ross, and J. F. Chiu. 2002. Reparable sonoporation gen-erated by microstreaming. J. Acoust. Soc. Am. 111:1460–1464.
11. Ohl, C. D., and B. Wolfrum. 2003. Detachment and sonoporation ofadherent HeLa-cells by shock wave-induced cavitation. Biochim.Biophys. Acta Gen. Subj. 1624:131–138.
12. Wolfrum, B., R. Mettin, T. Kurz, and W. Lauterborn. 2002. Observa-tions of pressure-wave-excited contrast agent bubbles in the vicinity ofcells. Appl. Phys. Lett. 81:5060–5062.
13. Lauer, U., E. Burgelt, Z. Squire, K. Messmer, P. H. Hofschneider,M. Gregor, and M. Delius. 1997. Shock wave permeabilization as anew gene transfer method. Gene Ther. 4:710–715.
14. Crum, L. A., and G. M. Hansen. 1984. Generalized equations for rec-tified diffusion. J. Acoust. Soc. Am. 72:1586–1592.
15. Fyrillas, M. M., and A. J. Szeri. 1994. Dissolution and growth ofsoluble spherical oscillating bubbles. J. Fluid Mech. 277:381–407.
16. Hilgenfeldt, S., D. Lohse, and M. Brenner. 1996. Phase diagram forsonoluminescing bubbles. Phys. Fluids. 8:2808–2826.
17. Brenner, M., S. Hilgenfeldt, and D. Lohse. 2002. Single bubble sono-luminescence. Rev. Mod. Phys. 74:425–484.
18. Sonden, A., B. Svenson, N. Roman, H. Ostmark, B. Brismar,J. Palmblad, and B. T. Kjellstrom. 2000. Laser-induced shock waveendothelial cell injury. Lasers Surg. Med. 26:364–375.
19. Kodama, T., M. R. Hamblin, and A. G. Doukas. 2000. Cytoplasmicmolecular delivery with shock waves: importance of impulse. Biophys.J. 79:1821–1832.
20. Rau, K. R., A. Guerra, A. Vogel, and V. Venugopalan. 2004. Inves-tigation of laser-induced cell lysis using time-resolved imaging. Appl.Phys. Lett. 84:2940–2942.
21. Chin, C. T., C. Lancee, J. Borsboom, F. Mastik, M. E. Frijink, N. deJong, M. Versluis, and D. Lohse. 2003. Brandaris 128: a digital 25million frames per second camera with 128 highly sensitive frames.Rev. Sci. Instr. 74:5026–5034.
22. Ting-Beall, H. P., D. V. Zhelev, and R. M. Hochmuth. 1995. Com-parison of different drying procedures for scanning electron micros-copy using human leukocytes. Microsc. Res. Tech. 32:257–361.
23. Junge, L., C. D. Ohl, B. Wolfrum, M. Arora, and R. Ikink. 2003. Celldetachment method using shock-wave-induced cavitation. UltrasoundMed. Biol. 29:1769–1776.
24. Arora, M., L. Junge, and C. D. Ohl. 2005. Cavitation cluster dynam-ics in shock-wave lithotripsy. 1. Free field. Ultrasound Med. Biol. 31:827–839.
25. Leighton, T. G. 1994. The Acoustic Bubble. Academic Press, London.
26. Kudo, N., T. Miyaoka, K. Okada, and K. Yamaoto. 2002. Study onmechanism of cell damage caused by microbubbles exposed toultrasound. IEEE Ultrasonics Symp. Proc. 2:1383–1386.
4294 Ohl et al.
Biophysical Journal 91(11) 4285–4295
27. Vogel, A., W. Lauterborn, and R. Timm. 1989. Optical and acousticinvestigations of the dynamics of laser-produced cavitation bubblesnear a solid boundary. J. Fluid Mech. 106:199–338.
28. Best, J. P., and J. R. Blake. 1994. An estimate of the Kelvin impulse ofa transient cavity. J. Fluid Mech. 261:75–93.
29. Vogel, A., P. Schweiger, A. Frieser, M. N. Asiyo, and R. Birngruber.1990. Intraocular Nd:YAG laser surgery: light-tissue interaction,damage range, and reduction of collateral effects. IEEE J. QuantumElectron. 26:2240–2260.
30. Lauterborn, W., and H. Bolle. 1975. Experimental investigations ofcavitation-bubble collapse in the neighborhood of a solid boundary.J. Fluid Mech. 72:391–399.
31. Blake, J. R., G. S. Keen, R. P. Tong, and M. Wilson. 1999. Acousticcavitation: the fluid dynamics of non-spherical bubbles. Philos. Trans.R. Soc. Lond. A. 357:251–267.
32. Philipp, A., and W. Lauterborn. 1998. Cavitation erosion by singlelaser-produced bubbles. J. Fluid Mech. 361:75–116.
33. Kodama, T., and K. Takayama. 1998. Dynamic behavior of bubblesduring extracorporeal shock-wave lithotripsy. Ultrasound Med. Biol.24:723–738.
34. Glauert, M. B. 1956. The wall jet. J. Fluid Mech. 1:625–643.
35. Deshpande, M. D., and R. N. Vaishnav. 1982. Submerged laminar jet
impingement on a plane. J. Fluid Mech. 114:213–236.
36. Garrivier, D., E. Decave, Y. Brechet, F. Bruckert, and B. Fourcade.
2002. Peeling model for cell detachment. Eur. Phys. J. E. 8:79–97.
37. Decave, E., D. Garrivier, Y. Brechet, B. Fourcade, and F. Bruckert.
2002. Shear flow-induced detachment kinetics of Dictyosteliumdiscoideum cells from solid substrate. Biophys. J. 82:2383–2395.
38. Brujan, E. A., G. S. Keen, A. Vogel, and J. R. Blake. 2002. The final
stage of the collapse of a cavitation bubble close to a rigid boundary.
Phys. Fluids. 14:85–92.
39. Tong, R. P., W. P. Schiffers, S. J. Shaw, J. R. Blake, and D. C.
Emmony. 1999. The role of ‘‘splashing’’ in the collapse of a laser-
generated cavity near a rigid wall. J. Fluid Mech. 380:339–361.
40. Lindau, O., and W. Lauterborn. 2003. Cinematographic observation of
the collapse and rebound of a laser-produced cavitation bubble near a
wall. J. Fluid Mech. 479:327–348.
41. Pearson, A., J. R. Blake, and S. R. Otto. 2004. Jets in bubbles. J. Eng.Math. 48:391–412.
Sonoporation from Jetting Bubbles 4295
Biophysical Journal 91(11) 4285–4295
Copyright © 2022 FDOKUMEN