Acoustic Measurements Bubbles in Biological Tiessure
18
47 2009,21(1): 47-64 DOI: 10.1016/S1001-6058(08)60118-3 ACOUSTIC MEASUREMENTS BUBBLES IN BIOLOGICAL TIESSURE * CHAHINE Georges L., TANGUAY Michel, LORAINE Greg DYNAFLOW, INC., 10621-J Iron Bridge Road, Jessup, Maryland 20794, USA, E-mail: [email protected] (Received October 18, 2008, Revised December 17, 2008) Abstract: An acoustic based instrument, the ABS Acoustic Bubble Spectrometer ®© (ABS), was investigated for the detection and quantification of bubbles in biological media. These include viscoelastic media (blood), materials of varying density (bone in tissue), non-homogenous distribution of bubbles (intravenous bubbly flow), and bubbles migrating in tissue (decompression sickness, DCS). The performance of the ABS was demonstrated in a series of laboratory experiments. Validation of the code was performed using a viscoelastic polymer solution, Polyox, in which the bubble size distribution and void fraction were determined by ABS measurements and with image analysis of high speed videos. These tests showed that the accuracy of the ABS was not significantly affected by viscoelasticity for bubbles smaller than 200 microns. The ABS detection and measurement of non-homogenous bubble distributions was demonstrated using a bubbly flow through a simulated vein surrounded by tissue. The scatter of acoustic signals due to bones in the acoustic pathway was also investigated. These in-vitro experiments were done using meat (beef) as a tissue simulant. Decompression experiments were done using beef meat which was held underwater at high pressure (9.9 atm) then rapidly decompressed. Bubble size distributions and void fraction calculations in these experiments were then validated using image analysis of high speed video. In addition, preliminary experiments were performed with the US Navy Medical Research Center, demonstrating the utility of the modified ABS system in detecting the evolution of bubbles in swine undergoing decompression sickness (DCS). These results indicate that the ABS may be used to detect and quantify the evolution of bubbles in-vivo and aid in the monitoring of DCS. Key words: ABS Acoustic Bubble Spectrometer ®© (ABS), biological tissue, decompression sickness (DCS) 1.Introduction This article describes a study conducted to develop a novel technique and instrument for non-invasive in-vivo detection and characterization of bubbles in biological fluids and tissues/organs. The detection of bubbles in the human body has a number of important applications in medical research and clinical practice including study of decompression sickness (DCS), monitoring of hyperbaric treatment, and detection of emboli [1-7] . The acoustic-based approach investigated here is based on our previous work concerned with the * Biography: CHAHINE Georges L. (1947-), Male, Ph. D. measurement of bubble distributions in liquids [8-11] . This method consists of emitting and receiving acoustic bursts at different frequencies and determining the sound speed and attenuation of the waves as functions of frequency. Tiny bubbles that form in the tissue and the body liquids after decompression act as small acoustic oscillators. These oscillators have natural frequencies that depend on the bubble sizes and the ambient pressure. The response of the oscillators to an external excitation varies with bubble size and the frequency of the excitation, and causes dispersion and attenuation of the sound waves in the medium. In order to apply the ABS Acoustic Bubble Spectrometer ®© (ABS) technique of bubble size distribution measurement to tissues or biofluids containing gas bubbles, the applicability of the model
-
Upload
independent -
Category
Documents
-
view
0 -
download
0
Transcript of Acoustic Measurements Bubbles in Biological Tiessure

47
2009,21(1): 47-64 DOI: 10.1016/S1001-6058(08)60118-3
ACOUSTIC MEASUREMENTS BUBBLES IN BIOLOGICAL TIESSURE*
CHAHINE Georges L., TANGUAY Michel, LORAINE Greg DYNAFLOW, INC., 10621-J Iron Bridge Road, Jessup, Maryland 20794, USA, E-mail: [email protected] (Received October 18, 2008, Revised December 17, 2008) Abstract: An acoustic based instrument, the ABS Acoustic Bubble Spectrometer®© (ABS), was investigated for the detection and quantification of bubbles in biological media. These include viscoelastic media (blood), materials of varying density (bone in tissue), non-homogenous distribution of bubbles (intravenous bubbly flow), and bubbles migrating in tissue (decompression sickness, DCS). The performance of the ABS was demonstrated in a series of laboratory experiments.
Validation of the code was performed using a viscoelastic polymer solution, Polyox, in which the bubble size distribution and void fraction were determined by ABS measurements and with image analysis of high speed videos. These tests showed that the accuracy of the ABS was not significantly affected by viscoelasticity for bubbles smaller than 200 microns.
The ABS detection and measurement of non-homogenous bubble distributions was demonstrated using a bubbly flow through a simulated vein surrounded by tissue. The scatter of acoustic signals due to bones in the acoustic pathway was also investigated. These in-vitro experiments were done using meat (beef) as a tissue simulant. Decompression experiments were done using beef meat which was held underwater at high pressure (9.9 atm) then rapidly decompressed. Bubble size distributions and void fraction calculations in these experiments were then validated using image analysis of high speed video. In addition, preliminary experiments were performed with the US Navy Medical Research Center, demonstrating the utility of the modified ABS system in detecting the evolution of bubbles in swine undergoing decompression sickness (DCS). These results indicate that the ABS may be used to detect and quantify the evolution of bubbles in-vivo and aid in the monitoring of DCS.
Key words: ABS Acoustic Bubble Spectrometer®© (ABS), biological tissue, decompression sickness (DCS)
1.IntroductionThis article describes a study conducted to
develop a novel technique and instrument for non-invasive in-vivo detection and characterization of bubbles in biological fluids and tissues/organs. The detection of bubbles in the human body has a number of important applications in medical research and clinical practice including study of decompression sickness (DCS), monitoring of hyperbaric treatment, and detection of emboli[1-7].
The acoustic-based approach investigated here is based on our previous work concerned with the
* Biography: CHAHINE Georges L. (1947-), Male, Ph. D.
measurement of bubble distributions in liquids[8-11]. This method consists of emitting and receiving acoustic bursts at different frequencies and determining the sound speed and attenuation of the waves as functions of frequency. Tiny bubbles that form in the tissue and the body liquids after decompression act as small acoustic oscillators. These oscillators have natural frequencies that depend on the bubble sizes and the ambient pressure. The response of the oscillators to an external excitation varies with bubble size and the frequency of the excitation, and causes dispersion and attenuation of the sound waves in the medium. In order to apply the ABS Acoustic Bubble Spectrometer®© (ABS) technique of bubble size distribution measurement to tissues or biofluids containing gas bubbles, the applicability of the model

48
and software for non-Newtonian rheological properties[12-15] as well as to complex geometries was investigated. The technique was tested in the laboratory using viscoelastic fluids, gels and meats, and the results were compared to those obtained from microphotography. Since the instrument was originally designed for the detection of bubbles for engineering applications such as in conduits and containers, this research focused on assessing the accuracy of the ABS in a biological environment. The studies were divided into four sections: viscoelastic media, soft tissue, wave scattering from hard tissue and preliminary in-vivo test.
The advantage of acoustic monitoring is that even at very small concentrations gas bubbles have a large impact on the overall compressibility of the medium. This is in contrast to scattering-based approaches (such as Doppler ultrasound) where the scattering signature of a bubble is difficult to distinguish from that of a solid scatterer[1,2]. This approach computes bubble size density distribution based on the acoustic transmission over a broad frequency spectrum unlike current Doppler ultrasound systems.
2. ABS background The ABS system employs a pair of acoustic
transducers. One transducer emits controlled sound bursts into the liquid while the second hydrophone senses the transmitted sound waves after they have traversed the bubble/liquid mixture (see Fig.1). The presence of bubbles modifies both the phase speed and the amplitude of the sound waves. The time of flight between the two transducers can be obtained from the time lag between the emitted and received signal and provides the sound speed, while the amplitude decay provides the attenuation. The details of the modification depend on the properties of the liquid, on the size, number, and distribution of the bubbles as well as on the frequency of the sound wave. By utilizing a set of discrete frequencies and the mathematical models developed in Ref.[8-11], information about the corresponding range of bubble sizes can be obtained.
Determination of the bubble distribution requires solution of an “inverse problem.” In such a problem, the input (emitted signal) and output (received signal) are known, while the characteristics of the system (here, the medium properties) that produce the resulting “output” are sought. The problem is mathematically “ill-posed”, i.e., the bubble distributions that are obtained from the measured output signals are very sensitive to changes in these measurements. In addition, noise in the system introduces a level of uncertainty in the measured inputs and outputs. Knowing the characteristics of
the emitted and received sound waves, the bubble distribution in the liquid is obtained using an inverse methods developed in Ref.[8]. Fig.1 Sketch ABS setup for bubble measurements 2.1 Bubble dynamics in iscoeiastic media
For a single spherical bubble oscillating in a Newtonian liquid with pressure field , the dynamic equation describing forced radial oscillations in a slightly compressible Newtonian liquid is given by
( )p t
[16,17]:
23 11 + 1 =2 3l l
R RRR RC c l
d 21+ + 4d b l
l l
R R Rp pc c t R R
(1)
where is the pressure inside the bubble and bp l ,
l and c are the liquid density, viscosity and the sound speed respectively.
l
is the surface tension. The bubble pressure is a function of the vapor pressure, the amount of non-condensable gas inside the bubble and the temperature field inside the bubble. It is important to note that irreversible heat transfer during bubble oscillation is one of the primary mechanisms for energy dissipation. Assuming that the gas pressure is approximately uniform, the rate of change of the pressure can be written as:
=
3= 1g gr R
Tp KR r
p R (2)

49
where is the thermal conductivity, K is the ratio /p vc c of the gas specific heats at constant pressure
and volume respectively, and the total bubble pressure is
= +b gp p pv (3) The temperature in the gas can be obtained by[18]:
1+ + 1
3 gg
T r Tp Kt p r r
=T
22
1+g
g p g p
p K Trc c r r r
(4) For small perturbations about the bubble
equilibrium size, this equation can be simplified to:
22 2
1= +g
g p g p
pT K yt c c R y y y
T,
0,1ryR
(5)
which can be solved in the frequency domain to provide:
2
2
isinh
ˆ ˆˆ , =i
sinh
g p
g g
g p g p g p
c Ry
Kp pRT rc r c c R
K
(6) where is the frequency.
In order to compute the rate of change of the gas pressure, we can write the temperature gradient at the bubble wall as:
=
ˆ ˆ1= g
g pr R
pTr R c
2 2i i
1 cothg p g pR c R cK K
(7)
and the pressure fluctuations, ˆ gp , can be related to
the radius fluctuations, , by the expressionR [18]:
=
3 ˆˆi = 1 i
.
g gr R
Tp KR r
p R
with
0
ˆˆ=g
g
p Rp R
,
3i i1 3 1 i coth 1
,
2g p
KR c
(8)
The above relationship between the pressure and
the bubble radius can be introduced in the linearized equation for the bubble motion (Eq.(1)):
20 2
ˆ1 i 2ˆ ˆ= (1+ )( +gl l
R RRR pc R R
R
ˆ
ˆ4i )lR pR
(9)
Assuming that the Mach number of the bubble
wall motion is much less than unity, the bubble motion can be represented by the following approximate expression:
ˆ/ lR C R C/ l
2 2i 1ˆ{1 + [( ) ]} =
l l
R RO RRC C
0 2
ˆ ˆ2 ˆ ˆ( + 4igR Rp R )l pR R R
(10)
The above expression can be cast in the form of a
second order harmonic oscillator:
2 2 ˆˆ2i =ol
pb RR
(11a)

50
022
2go
l l
p3R R
(11b)
2
02 2
2+ +2 2
g l
l l
p
l
RbR R C
(11c)
In order to address biological media of
viscoelastic nature such as tissue[12], the mathematical model for the description of a two-phase medium was modified to account for linearized viscoelasticity. The modified Rayleigh-Plesset model was generalized for an arbitrary fluid (viscous, elastic, viscoelastic)[19]. If we assume that the viscoelastic effects are limited to a region near the surface of the bubble where compressible effects are negligible, the resulting equation can be written as:
23 11 + 1 = 1+2 3l l l l
R R RRR RC C C
2 3 d +
dbl lR
Rp p r dR r C t
2
bp pR
(12)
where is the radial distance to the bubble center and
r is the radial stress. In the literature, a standard
model for the viscoelastic nature of blood is the Carreau-Yasuda fit[20-23]:
( 1) /
= 1+ ( )n aa
o
S ,
3= 12 10 Pa so , , 3= 1 10 Pa s
= 0.222a , , = 0.681n = 0.086s (13)
From this model, the effective viscosity of the
blood changes between 4 cp and 12 cp. However, this form is not readily applicable to a linearized formulation and only represents the viscous component of the stress tensor. Instead, by using a three-parameter linear Oldroyd model or the Jeffreys model[14,15,24-26] model for linear viscoelasticity, we were able to appropriately account for the changes in the bubbles natural frequency and damping factor. The three-parameter Oldroyd model can be written as:
1+ = 2 + SSt t2 (14)
where the shear rate in the radial direction is defined as:
= rrr
uSr
(15)
The dependency of on the radial position can
be found from Eq.(14) and the velocity field of the liquid around a spherical bubble (assuming that it is effectively incompressible in this region). The strain rate in the radial direction can be written as:
2 2
2
2= = =rrr
u3
R R RSr r r r
R (16)
For small perturbations about the bubble
equilibrium radius, the stress term can be expressed in the frequency domain as:
2
1 2 3
ˆˆ1+ i = 4 1+ i R Ri
r (17)
Consequently the integrated stress term of
Eq.(12) can be written in the linearized bubble dynamics model as:
20
ˆi 1ˆ(1 ) = [ +gl l
R RRR pC R
22
1
ˆ1+ i2 ˆ ˆ4i ( ) ]1+ i
RR pR R
(18)
where is the liquid viscosity at low frequency. It is important to note that this linear viscoelastic model exhibits shear thinning effects (reduction in viscous stress at high shear rate) with the transition between the low and high frequency viscosity occurring at a frequency near 21/ 2f . In the transition region, the stress term has a non-zero imaginary component that relates to the elastic nature of the fluid (that is generates stress in phase with the radial displacement instead of in phase with the radial velocity). Casting the result of Eq.(18) into the form of a damped second order oscillator, we can express the natural frequency and damping factor as a function of bubble size and the forcing frequency:

51
2
022 3 2
2 4+go
l l
pR R R l
2 12 2
11+ (19a)
2
0 1 22 2 2 2
1
1+2+2 1+
g
l l
pb
R R+
2
2 l
RC
(19b)
In order to assess the impact of viscoelasticity on
the model, the natural frequency and damping factor from Eq.(19) were computed for a viscoelastic model. For this calculation, the properties of blood were based on fitting the model of Eq.(14) to the Carreau- Yasuda correlation of Eq.(13) and resulted in the values shown below:
= 12cp , 11= s
200, 2
1= s600
,
3= 1060kg/m , C (20) l = 1584m/s
Using the above values, the blood becomes a
purely viscous fluid near an oscillating frequency of 1 kHz. Under these conditions, the maximum deviation of the value of the natural bubble frequency is 12% when compared against the viscosity of water. Moreover, if we base all computations on a fixed value of viscosity equal to the high frequency limit, the potential error in the frequency is less than 9%. Since the natural frequency is the main parameter in determining the bubble size, we can expect a shift of the order of 10% of the bubble size if we erroneously assume that the medium is water.
Similarly the damping factor exhibits a correction of less than 10% due to viscoelasticity. The influence of the damping factor is primarily in term of the population density of bubbles (all other factors being equal, twice the bubble density results in nearly twice the damping factor) thus considering the blood media as water could result at most in a 10% error in computing the quantity of bubbles (i.e., 10% error in the void fraction).
With respect to typical ABS operations, these errors are very small considering that the investigated bubble sizes range from 5 microns to 500 microns and the bubble population varies by over four orders of
magnitude. To further illustrate the impact of the difference between blood and water, the sound speed and attenuation for given bubble density distribution (Gaussian, centered at a radius of 10 microns) were calculated using the viscoelastic behavior of blood and then fed to the ABS inverse problem solver. The results shown in Fig.2 illustrate the difference in the computed bubble distribution if the viscoelastic nature of blood was ignored and the medium was treated as pure water. The errors in the mean bubble radius and the magnitude of the density reflect the corresponding error estimated above. Fig.2 Compairson of inverse problem solution soiution in a
viscoelastic media with and without viscoelastic correction
2.2 ABS validation experiments in Polyox
The ABS data was compared against optical measurements in water and polyethylene oxide polymer (Polyox WSR-301, average molecular weight 4 106) solutions of 500 mg/L and 5000 mg/L. The viscosities of these solutions were measured to be 1.0 cp, 1.4 cp and 19.8 cp for water, Polyox 500 mg/L, and 5000 mg/L, respectively. In comparison, the range of blood viscosity is 4 cp to 12 cp depending on the shear rate. Bubbles were generated using a multi-wire electrolysis grid. The video data was collected using a high speed video imaging system with frame rates up to 8000 frames/s. The images were analyzed using the Matlab Image Processing Toolbox. Each frame was saved as a jpeg image and the sequence was then processed by Matlab where the background was subtracted and thresholded, the outline of individual objects was traced, and continuous regions were filled solid. An equivalent radius for each object was computed based on its shaded area. There was relatively good agreement between the ABS and image analysis regardless of the viscoelastic properties of the fluid as illustrated in Fig.3 which shows a comparison between the ABS and image analysis results for the most viscous conditions (5000 mg/L Polyox). Based on these results and theoretical analysis, we concluded that the viscoelasticity of the media does not significantly impact the accuracy of

52
the ABS for bubbles smaller than 200 microns. Fig.3 Bubble density distribution of 5000 mg/L polyox using
ABS and image analysis 2.3 Sound propagation in gas saturated tissues
In order to assess the impact of the medium inhomogeneities (i.e., non-uniform bubble distribution and/or non-uniform tissue properties), a numerical model was implemented to represent the propagation of acoustic waves in an arbitrary two-phase medium. A continuum medium approach was used to model propagation of pressure waves in tissues containing gas bubbles [27-29]. Following this approach, the following main assumptions were considered:
(1) The medium consists of two phases: compressible bubbles and a slightly compressible liquid phase (tissue).
(2) The acoustic wavelength is much larger than the bubble size and the tissue small scale inhomogeneities (cells, capillary vessels, etc.), so that the medium can be considered as locally acoustically homogeneous.
(3) The characteristic time of bubble growth/ dissolution due to gas diffusion is much larger than the characteristic period of the acoustic waves imposed.
In addition, since we are interested in prevention, i.e., detection prior to the bubble void fraction becoming significant, we assumed that is much smaller than one. The effects of bubble coalescence/ fragmentation were neglected and bubbles were approximated by spheres. In the code multiple bubbles with different equilibrium conditions can be modelled. The void fraction can be calculated as the sum over the bubble size distribution N for each equilibrium size:
34, = , ,
3 i ii
t R t Nx x tx (21)
Following the assumption of low void fraction,
the effective conservation equation for mass and
momentum of the two-phase medium can be written in the form:
+ =t
0u (22a)
+ + =p Otu uu (22b)
where , p and are the medium pressure, density, and velocity respectively. The right-hand side of the momentum conservation equation includes terms proportional to the void fraction which are assumed to be negligibly small for the present computations. Given this simplification, the void fraction does not appear explicitly in Eq.(22). Instead, the coupling between the phases is manifested through the equation of state for the bubbly medium. For low void fractions, the pressure in the bubble laden tissue is approximately that of the liquid-tissue phase. The non-linear behavior of the tissue is represented here using an equation of state that expresses the pressure in terms of the linear and quadratic changes in density. This formulation is consistent with the modeling of ultrasonic wave propagation and data regarding the constants for different types of tissue is readily available
u
[30-32]. The non-linear equation of state for the two-phase media can be written as:
2 00 0 0
0
1= 1+2
ll
Bp p cA
(23a)
1l (23b)
where the parameter is a standard non-linearity coefficient found in the literature. The subscript “0” refers to undisturbed parameters for the tissue. It is important to note that in the model described above, all viscous stresses as well as all anisotropic elastic stresses have been neglected. This effectively prevents the formation and propagation of shear waves and focuses on capturing the acoustic propagation only. Additionally, based on the small amplitudes associated with acoustic propagation, the displacement of the interface between different tissue-
/B A
types is assumed to be negligible. 2.4 Sound propagation modelling in the forearm
In order to study scattering effects due to differences in tissue properties and bones, a model of a human forearm was studied. The forearm was selected since the geometry is similar to that of a pig forelimb which was tested during preliminary animal

53
experiments at NMRC. Since the precise modelling of the interface between various tissues is beyond the scope of this research, a simplified approach was adopted where the domain is a single material with spatially varying properties (i.e., initial density, sound speed, ). Since the material is assumed to exhibit negligible displacement during the course of the simulation, these properties are considered fixed with respect to the computational grid. In order to input the material properties of the various tissues, a rectangular matrix is read from file with a material indicator index. An image from Gray’s anatomy
/B A
[33]
was used for the cross-section of the forearm. Figure 4 shows a grey map with each tissue identified with a different intensity value and a rectangular section added to represent the receiving hydrophone of the ABS. The material properties of the piezo ceramics were used. The arrow at the bottom of the image indicates the emitting boundary. Following the dimensions of the actual hydrophones (red box in Fig.4), the emitting portion of the boundary is 1 inch wide for the 2-D calculations and 1 1 inch for the 3-D calculations. Although the receiving piezo- ceramic is shown to have some thickness, only the pressure at the contact surface with the skin (the red line in Fig.4) was used to determine the measured signal. The properties of the various tissues used are listed in Table 1.
Table 1 Material properties used in forearm simuiations
Material Density (g/cc)
Sound speed (m/s)
B/A Grey level
Air 0.30 300 0.0 White
Skin 1.09 1617 7.9
Dark grey
Muscle/ marrow
1.06 1580 7.1 Mediumgrey
Cortical
bone
1.92 3635 0.0 Black
Trabecular
bone
1.80 3300 0.0 Light grey
Hydrophone 3.55 3740 0.0
Darkest
grey
Fig.4 Forearm cross-section indicating different tissue types.
The left and images show 2 hydrophone configurations studied here
The two-phase medium is assumed to be at rest
initially. The acoustic signals are generated at the skin. The generated signal had a duration of 5 cycles at a given nominal frequency. The outer domain composed of air has a non-reflective boundary condition at the edge of the domain. The non-reflective boundary condition is based on a local decomposition into characteristic waves. Considering the mass and momentum conservation in vector form:
++ +
+
t x
u vu uu p uvv vu vv pw wu wv
+
y
= 0
+ z
wuwvw
ww p
(24)
we can decompose the flux vector into a matrix times the state vector. Let us consider the x-flux first:
2 2
0 1 0 0+ 2 0 0
= =0
0.
uuu p c u u u
vu uv v u vwu uw w u w
0 0 1 10 0 +0 11 0 +
uu c u c u
v v u cw w u c

54
0 0 10 1 0
+ 1 0 02 2
1 0 02 2
wv
uu cvc c
c u wc c
(25) Following the decomposition of the above matrix
into left and right eigenvectors, the governing equation can be written as:
0 0 10 1 0
+ 1 +0 02 2
1 0 02 2
t
wv
uu cvc c
c u wc c
+
uu
u cu c
0 0 10 1 0
+ 1 0 02 2
1 0 02 2
x
wv
uu cvc c
c u wc c
0 0 10 1 0
+ 1 0 02 2
1 0 02 2
wv
u cc c
c uc c
++
y z
v wuv uw
vv p vwwv ww p
In order exploit the characteristic propagation, we assume that the matrix of left eigenvector is approximately constant in the vicinity of the boundary (both spatially and temporally). This allows for the insertion of the matrix into the derivatives and to recast the state variable into left and right propagating waves:
0 0 10 1 0
+ 1 0 02 2
1 0 02 2
wv
uu cvc c
c u wc c
L (27a)
+
+
t x
uu
u cu c
L L
0 0 10 1 0
+ 1 0 02 2
1 0 02 2
wv
u cc c
c uc c
++
y z
v wuv uw
vv p vwwv ww p
(27b)
If we further assume that the right-hand side of
the above equation is approximately zero (i.e., wave with normal incidence to the boundary) and let
1
+=
2u u
uu
, then the non-reflective boundary
condition can be formulated as follows for the right boundary:
1
1= ,1
0
x
uu
xLL (26)

55
1
1
1
1
=1 1
01+
uu
u u
u c
u c
0 0 10 1 0
++ 1 0 02 2
1 0 02 2
wuv
uu pu cvuxc c
c u wuc c
(28)
The above expression relates the spatial
derivatives of the characteristic vector to the finite difference derivative of the flux vector while considering the outgoing waves only and assuming no inbound wave propagation. From this expression for the derivative, we rewrite the flux gradient in terms of the finite difference of the flux variable:
0 0 1 1+ 0 0 +
0 11 0x
uuu p u c u c
vu v vwu w w
,
+
x
uu
u cu c
L
1
1
0 0 1 10 0 +0 1 11 0 0
uu c u c u
v vw w
0 0 10 1 0
++ 1 ,0 02 2
1 0 02 2
wuv
uu pu cvuxc c
c u wuc c
2 2
1 1
1 1
+ 1 0 02 2
0 02 2( + )+ 0
2 2( + )+ 0
2 2
c uc c
u c c uc cc u v vvu u
c cc u v wwu u
c c
+u
uu pvuxwu
(29)
It is important to note that although the above
expression is not exact since the velocity is not constant as a function of space and time, it only introduces an error of the order of the Mach number ( ) and is therefore very robust. The main weakness of this approach is with respect to waves incident at some shallow angle. For such cases, the right hand side of Eq.(26) is no longer negligible. Consequently, the decomposition presented here is not fully representative of the true characteristics and results in a progressive deterioration of the non-reflective properties.
/u c
The spatial derivatives for this study were obtained using a compact high-order finite difference scheme where the derivatives at a given location are also a function of the neighbouring derivatives. The scheme used in this study is 6th order accurate and can be written as:
' ' ' +1 11 +1
1 1 14+ + = +3 3 9 2
i ii i i x

56
+2 219 4
i i
x (30)
To obtain the derivative of a variable, a
tri-diagonal matrix must be solved for each grid line (vertical and horizontal) in the domain. The derivative obtained from the boundary condition closes this problem. Once the spatial derivatives of the fluxes are calculated, the time derivatives of the state vector are integrated using a 4th order Runge-Kutta integration. Fig.5 Snapshot of acoustic simulation of 3-D wave propa-
gation in human arm model for 5 cycle forcing at 200 kHz
Fig.6 Comparison of received pressure between 2-D and 3-D
numerical model for signasl emitted at 200 kHz
The 2-D model described above was also extended to 3-D (see Fig.5). Since the height of the emitter in the model was roughly one quarter of the distance between the hydrophones, 3-D effects were minimal as seen in Fig.6. 2.5 Scattering analysis in presence of bone
The 2-D simulations (Fig.7 to Fig.10) indicated that the presence of bones in the acoustic pathway would attenuate the signals. These results were confirmed by comparing experimentally signals with and without a small bone (diameter~ 70 mm) present.
Two cases were considered: one with the bone submerged in water and one with a bone inserted between two slabs of meat (beef). As shown in Fig.11 the received signal is clearly altered by the presence of the bone insert.
Fig.7 Pressure contours from the simulation of the acoustic
propagation of 5 cycles at 150 kHz in a human forearm populated with 20 microns radius bubbles in the muscle tissue
Fig.8 Pressure measured at the receiving hydrophone Fig.9 Pressure contours for simulation of acoustic propa-
gation of 5 cycles at 150 kHz in a human forearm populated with 20 m radius bubbles in the muscle tissue
The inset in Fig.12 illustrates the different bone
locations that were tested. In Position 2 the bone was directly in between the two hydrophones. In Position 3 the bone was still between the hydrophones but was off-center, and in Position 4 the pathway was only partially obstructed. In addition to the acoustic measurements with the bone, a reference measurement was done with no bone present.
By normalizing the received amplitude with bone by the reference amplitude, much in the same way as

57
the damping due to bubble attenuation is calculated by the ABS,
Fig.10 Pressure measured at receiving hydrophone for second
configuration
= log2
water bone
gap reference
c AVfL A
(31)
we can plot an effective damping due to the presence of the bone and is shown in Fig.12 for different positions. Data was collected with 20 mm and 30 mm gaps between the hydrophones. Also shown in Fig.12, is the damping due to the bone but through meat rather than through water. Fig.11 Comparison of signal with and without bone insert for
80 kHz and 210 kHz forcing As can be seen in, Fig.12 the more central the
location of the bone, the larger the attenuation. The
attenuation was higher at Position 2 followed by Positions 3 or 4. In addition, the degree of attenuation decreases as the gap separating the hydrophones increases (solid lines and dashed lines in Fig.12).
Fig.12 Comparison of the damping due to scattering of a
bone. The damping is calculated relative to the signal strength without the bone present
Fig.13 Sound speed ratio and damping of bone insert. No
bubbles are present in this case The experimental set up was modified so that the
acoustic waves propagated through meat, a tissue simulant, rather than water. Signals were collected through 30 mm of beef with and without the bone present. The bone was located near the edge of the transducer (Position 3 of Fig.12). As can be seen in Fig.11 and Fig.13, the bone affected both the sound speed and the attenuation relative to meat only, as was

58
predicted by the numerical simulations. The impact of an acoustic scatterer such as bone
is of keen interest to the operation of the ABS. The software implicitly assumes that the acoustic path is a straight line between the emitter and receiver. Based on preliminary results such as Fig.13, we can anticipate that the scattering will introduce a frequency dependence on the effective acoustic path. For normal ABS operation both reference (no bubble) and test (with bubbles) measurements would be conducted with the bone present. The main assumption would be that any impact of the bone on the effective acoustic pathway would not be affected by the presence of bubbles. Therefore, the presence of the bone would not impact the measurement of the bubble population as long as its location and that of the hydrophone are fixed.
Fig.14 ABS bubble distribution and optical measurement for
bubble injection through meat with and without bone insert
Preliminary tests were conducted where bubbles
were injected in a vessel phantom inside the meat (similar to experiments presented below). ABS measurements were compared with and without a bone insert and against optical measurements inside the tube. In Fig.14, we can note that the bubble density distribution determined by the ABS matched closely with optical measurements over the range of validity of each approach (see Fig.14(a)). Also shown
are the results from the same experiment with a bone insert next to the vessel phantom (see Fig.14(b)). The bone insert did have an impact on the ability of the ABS to capture the presence of bubbles between 30 μm-100 μm but did not seem to impact measurements outside this range. This suggests that the ABS could be operated close to bone structures with the caveat that the instrument would be blind to a specific bubble size range. This limitation could be potentially lifted through additional analysis of the impact of the bone scatterer on the signals. 2.6 Non-homogeneous bubble distributions
In laboratory conditions, the bubble cloud to be measured by the ABS has typically a uniform distribution between the transducers. However, this is not necessarily the case in real-life scenarios. For example, bubbly flows such as in a blood vessel are of particular importance since they are the basis for the operation of current Doppler ultrasounds detectors[1,2]. In order to assess the performance of the ABS in spatially non-uniform bubble fields, we conducted tests where a bubbly mixture was injected in a limited volume of the space between the transducers through a plastic tube (see Fig.15). In a first instance, a proportionally lower density (conserving the total bubble volume in between the transducer) was assumed to be prevalent over the entire width between the two transducers. This was then compared to the actual bubble density applied only over a thin region between the transducer.
Fig.15 Experimental setup for measuring bubbly flows through
a tube If we consider the analytical expression for the
1-D propagation in a concentrated distribution, we can write the transfer function relating the measured voltage to the emitted one as:
i ( )ˆ = exp[ ]cloudreceived
liquid
L LVC

59
i ( i ) ˆexp[ ] ,cloud
emittedliquid
L u v VC
i [ + ( 1) i ]= exp{ }cloud cloud
liquid
L L u vLC
emittedV (32) where and are the sound speed ratio and damping due to the localized bubble cloud. For a uniform diluted bubble distribution, we can write the same transfer function as:
u v
i iˆ = exp e e
receivedliquid
L u vV
C
emittedV (33) where and are the effective sound speed ratio and damping due to the uniform bubble cloud. An “effective” cloud is obtained by spreading the bubbles over the entire region. It is equivalent to reducing the bubble density by the ratio of volumes (
eu ev
/cloudL L ). Using the fundamental expressions for the definition of the sound speed ratio and damping, we can express these effective values in terms of the original ones:
2 2i = 1+ 4e e liquidu v C
2 2 d+ 2i
uniform
o
RN RR
b (34a)
cloud
uniformLN R N R
L (34b)
Expanding the above expression, the effective
values of and can be written in terms of those from the original localized bubble distribution:
eu ev
2 2i = 1+ 4
.
cloude e liquid
Lu v CL
2 2 d+ 2io
RN RR
b (35a)
2 2
2 2i = 1+ 4 d+ 2iliquid
o
RN Ru v C R
b (35b)
2 2i = 1+ i 1cloud
e eLu v u v
L (35c)
iˆ = exp{ {1+ ( )cloud
receivedliquid
LLVC L
2 1/ 2 ˆ[( i ) 1]} } emittedu v V (35d)
At first glance, the transfer functions for the
concentrated (32) and uniformly diluted (35) distributions are not identical. However, if we consider a low void fraction case where 1u and
1v then the following approximate relationship holds:
21+ i 1 = +cloudcloud
LL u v LL
L
2i 1 i 1u v O u v ,
+cloud cloudL L L u vi (36)
which is approximately equal to the expression in Eq.(32) up to second order terms. Therefore, for the measurement of non-homogenous bubble density distribution at low void fraction, we can relate the density distribution measured by the ABS (homogeneous)) to the density observed by correcting by the geometrical factor /cloudL L . 2.7 Spatially non-uniform bubble distributions
Experiments were performed to test the ability of the ABS to measure spatially non-uniform bubble distributions akin to what would be expected in a biological media where bubbles would be carried away through the blood stream. To validate the ABS under this configuration, air bubbles were generated using a small in-line electrolysis system inside a nylon
60
tube (4.2 mm ID, 1.0 mm thick walls) with water pumped through it. Two one-inch ABS square transducers were placed 30 mm away from each other with the tube passing through the middle. The experimental setup is shown in.Fig.15. Bubble size distribution was determined by both ABS and high-speed video image analysis. The video images were taken as the bubbles exited the tube. The average flow rate in the tube generated by the pump was approximately 0.25 m/s. If we compare against typical flow rates in the arterial supply, the area and flow rate corresponds approximately to a large artery[34].
Since the bubble cloud is clearly non- homogenous in this case, the bubble density distribution measured by the video was corrected following the method discussed in the previous section. The void fraction within the tube, 1 is calculated using:
1 = gas
tube
VV
(37)
where gasV is the gas volume within the tube and
is the volume of the tube section between the two hydrophones. The void fraction between the two hydrophones,
tubeV
2 , is given by:
2 1= cylinder
transducer transducer
VA D
(38)
where is the area of the transducer face and
is the distance between the two transducers. transducerA
transducerDBubbles were injected into a flow of water
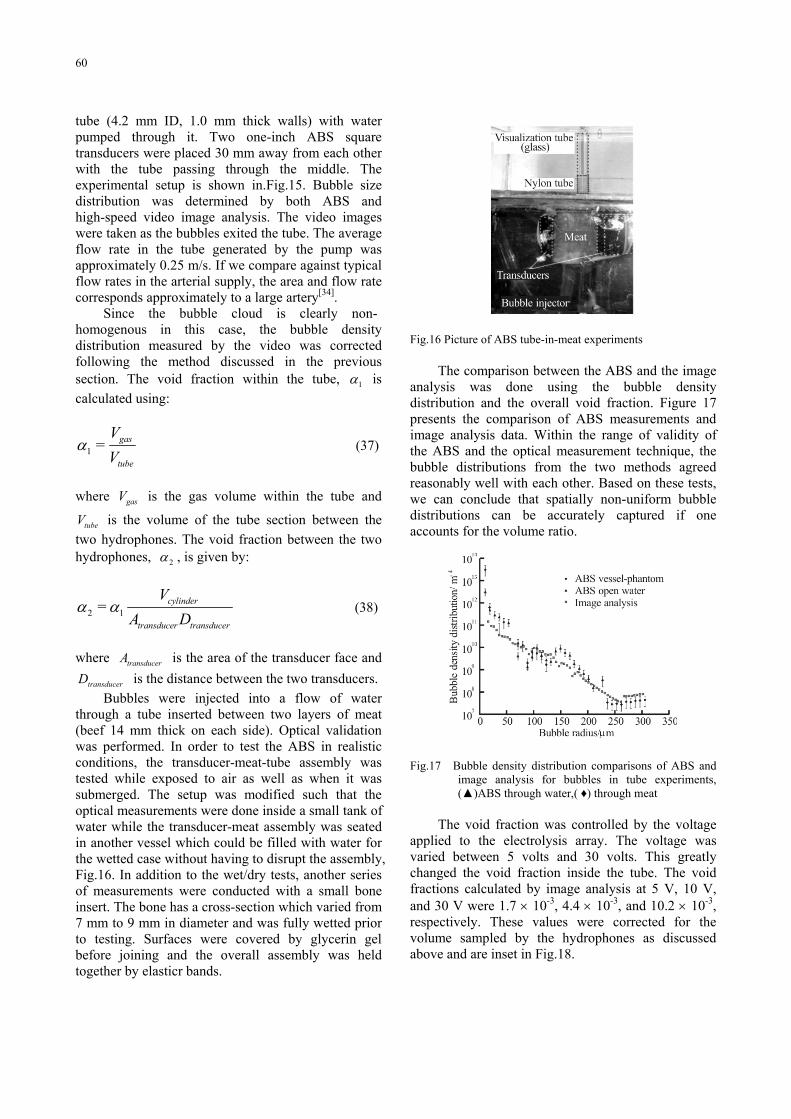
through a tube inserted between two layers of meat (beef 14 mm thick on each side). Optical validation was performed. In order to test the ABS in realistic conditions, the transducer-meat-tube assembly was tested while exposed to air as well as when it was submerged. The setup was modified such that the optical measurements were done inside a small tank of water while the transducer-meat assembly was seated in another vessel which could be filled with water for the wetted case without having to disrupt the assembly, Fig.16. In addition to the wet/dry tests, another series of measurements were conducted with a small bone insert. The bone has a cross-section which varied from 7 mm to 9 mm in diameter and was fully wetted prior to testing. Surfaces were covered by glycerin gel before joining and the overall assembly was held together by elasticr bands.
Fig.16 Picture of ABS tube-in-meat experiments
The comparison between the ABS and the image
analysis was done using the bubble density distribution and the overall void fraction. Figure 17 presents the comparison of ABS measurements and image analysis data. Within the range of validity of the ABS and the optical measurement technique, the bubble distributions from the two methods agreed reasonably well with each other. Based on these tests, we can conclude that spatially non-uniform bubble distributions can be accurately captured if one accounts for the volume ratio. Fig.17 Bubble density distribution comparisons of ABS and
image analysis for bubbles in tube experiments, ( )ABS through water,( ) through meat
The void fraction was controlled by the voltage
applied to the electrolysis array. The voltage was varied between 5 volts and 30 volts. This greatly changed the void fraction inside the tube. The void fractions calculated by image analysis at 5 V, 10 V, and 30 V were 1.7 10-3, 4.4 10-3, and 10.2 10-3, respectively. These values were corrected for the volume sampled by the hydrophones as discussed above and are inset in Fig.18.

61
Fig.18 Bubble density distributions of bubbly flow through
tube measured by the ABS through water and meat, and image analysis ( void fraction of 3.0 10-5, 30V )
These experiments indicate that the ABS is
capable of accurately measuring bubble sizes and void fractions in a vessel over a range of void fractions.
Fig.19 Diagrams illustrating the operation of the pressure cell
for decompression tests 2.8 Decompression experiments
The previous section discussed the capabilities of the ABS in detecting the presence of localized bubbles in a biological environment. However, the size and quantity of bubbles were controlled by the electrolysis voltage and the water flow through the tube. In order to achieve a good comparison in a more realistic environment, we conducted a series of experiments where the bubbles were generated by the rapid decompression of the testing chamber. A diagram of the experimental set-up is shown in.Fig.19. The pressure chamber consisted of a Plexiglas cylinder with 1.5 inch thick walls, and 1 inch steel plates on the ends held in place by compression. Coaxial cables for the hydrophones passed through the plates in bulkhead fittings and were epoxied into place. The vessel was
partially filled with water. Pressure was applied from a compressed air cylinder to a pressure of 9.9 atm (145 psi) above ambient pressure. The headspace gas was bubbled through the liquid using an electric micro-pump suspended from the lid of the pressure chamber to equilibrate gas concentration in the water.
After equilibrium was obtained (30 min), a valve was released and the pressure dropped rapidly to ambient. As the pressure decreased, the liquid became supersaturated with gas and bubbles formed and rose towards the surface.
In these experiments ABS readings were taken through meat. Thus, the bubbles detected were in the tissue itself not in the liquid as opposed to the previous tests discussed above (viscoelastic fluids and bubbly flow through tubes). To confirm the validity of the ABS measurements through the meat these results were compared to ABS measurements in water, and high speed video taken under the same conditions. The video images were taken directly above the meat in the bulk liquid. The bubble density distributions for two experiments are shown in Fig.20. The results were not as close here may be because the optical measurement did not give the meat bubble population. Fig.20 Bubble density distribution due to decompression in
meat, ABS measurements through meat, ABS in water, and image analysis
2.9 Preliminary animal experiments
We contributed to tests conducted at the Navy Medical Research Center (NMRC) on living animals exhibiting symptoms of decompression sickness in the course of an ongoing research study on the benefits of oxygen pre-breathe on decompression sickness conducted by Dr. Mahon’s group. The experiments involved two 70 kg swine which were subjected to a saturation dive and held at a pressure equivalent to 60 ft of seawater (1.8 ATA) for 22 h. The animals were then surfaced at a rate of 30 ft per minutes for two minutes. ABS data was collected on two animals prior to entering the hyperbaric chamber and after surfacing.
Data was collected at several locations on the animals, ears, tails, hind legs and fore legs. The

62
pre-dive data collected for the ears and tails of both animals showed good signal quality.
One animal, designated as “15467”, exhibited “skin bends” characterized by marbling of the skin, at 29 min after surfacing and was euthanized after 33 min. Prior to this, a set of data was collected through an ear from 20 min to 30 min after surfacing. Additional ABS measurements were taken post- mortem, at the ear, tail, and leg. The thickness of the ears, tail, and leg were measured with calipers at the location where the transducers were placed. This provided estimates for the distance between the hydrophones of 4 mm for the ears, 21 mm for the tail, and 32 mm for the hind leg. The other animal designated “15466”, survived for the entire duration of the experiment (over 90 min) and was later euthanized and analyzed post-mortem. Measurements were taken at several time periods from 24 min to 73 min after surfacing.
Fig.21 Comparison of signal damping as a function of
frequency for pig No. 15466 at various times after resurfacing
Fig.22 Comparison of sound speed ratio of pig No. 15466 as a
function of frequency for various post-dive times
In all post-dive measurements, pairs of data sets were collected within a few seconds of each other. Combining the pre- and post-dive data provided the attenuation and sound speed ratio for the each animal as a function of time. Results for sound speed ratio
and damping are shown in Fig.21and.Fig.22. The error bars on these figures are representative of the differences observed between the measurements.
The most interesting aspect of the results shown in Fig.23 is that the void fraction for pig number “15466”, which actually experienced successfully the dive, continuously decreased with post-dive time, probably indicating a positive slow return to pre-dive body bubble content. On the other hand, pig number “15467”, which was experiencing great post-dive difficulties, saw its bubble content or void fraction continue to increase post dive until the time it was euthanized. This correlates with the difficulties experienced by the animal. Post-mortem, void fraction dropped over 60 min. to the pre-dive level. Fig.23 Evolution of the void fraction as a function of time for
each animal. Note that the zero measurement is based on the pre-dive reference conditions only
The deduced bubble density distributions (Fig.24)
provide a picture of the changes in the bubble population with post-dive time. As shown in, Fig.24, the bubble density for pig number “15466” appears to shift from small bubbles to larger bubbles with time. The number of smaller bubbles decreases significantly with time, while the number of large bubbles remained at the same order. This could suggest that the animal succeeded in eliminating the smaller bubbles, while the larger one may require a longer time. The animal “15467” shows similar trends post-mortem with all bubble sizes reducing in number over time. There is a marked increase in the pre-mortem full bubble population between 20 min and 36 min.
These very limited animal tests provide significant observations in terms of void fraction and bubble population as a function of post-dive time. These can be summarized as follows:
(1) Changes in the void fraction as a function of time were observed in both animals, demonstrating the capability of the ABS to detect bubble generation during DCS.
(2) There seems to be a correlation between the

63
shape of the void fraction time history curve and the resistance of the animals to decompression. The “strong” pig started recovering fast after the post-dive and exhibited a continuous decay of the void fraction at the times of the tests. The “weak” pig showed a continued increase in void fraction until death.
(3) Bubble size distribution appears to indicate that smaller bubbles are desorbed faster.
Fig.24 Evolution of the computed bubble density distributions
for each animal 3. Conclusions
This study has demonstrated the feasibility of using the acoustically based detection system, the ABS, for the detection of microbubbles in biological media such as blood and other tissue. The algorithms used by the ABS to detect and quantify bubbles in water were modified so that the existing hardware system could be used in biological media. Several technical challenges associated with the acoustic measurement of gas bubbles in biological media were addressed. These included the effects of viscoelasticity on the response of bubbles in an acoustic field, scattering due to dense materials such as bone, non-homogenous distribution of bubbles in the blood vessels and tissues, and the effects of perfusion of bubbles through tissue during DCS and ischemia.
Acknowledgments This work was supported by the National
Institute of Health US Depterament of Health and Human Services. We would also like to thank Cmdr. Richard Mahon MD of the Navy Experimental Dive Unit, Naval Medical Research Center, US Navy.
References
[1] CRAWLEY F., STYGALL J. and LUNN S. et al. Comparison of microembolism detected by transcranial Doppler and neuropsychological sequelae of carotid surgery and percutaneous transluminal angioplasty[J]. Stroke, 2000, 3: 1329-1334.
[2] BUCKEY J., KNAUS D. and ALVARENGA D. et al. Dual-frequency ultrasound for detecting and sizing bubbles[J]. Acta Astron., 2005, 56: 1041-1047.
[3] NIINIKOSKI J. H. A., Clinical hyperbaric oxygen therapy, wound perfusion, and transcutaneous oximetry[J]. World J. Surgery, 2004, 28: 307-311.
[4] BALL R., HIMM J. and THALMANN E. D. Does the time course of bubble evolution explain decompression sickness risk?[J]. J. Undersea Hyper. Med., 1995, 22(3): 263-280.
[5] NEUMANN T. Arterial gas embolism and decom- pression sickness[J]. News Physiol. Sci., 2002, 17: 77-81.
[6] SHARMA K. C., KABINOFF G. and DUCHEINE Y. et al. Laparoscopic surgery and its potential for medical complications[J]. Heart Lung, 1997, 26: 52-64.
[7] SPEARS J. R., WANG B. and WU X. et al. A highly O2-supersaturated infusate for regional correction of hypoxemia and production of hyperoxemia[J]. Circulation, 1997, 96: 4385-4391.
[8] DURAISWAMI R., PRABHUKUMAR S. and CHA- HINE G. L. Bubble counting using an inverse acoustic scattering method[J]. J. Acoust. Soc. Am., 1998, 104: 2699-2717.
[9] Prabhukumar S., Duraiswami R. and CHAHINE G. L. Acoustic measurement of bubble size distributions: Theory and experiments[J]. ASME Cav. Multi. Flow F., 1996, 1: 509-514.
[10] CHAHINE G., KALUMUCK K. and CHENG J.-Y. et al. Validation of bubble distribution measurements of the ABS Acoustic Bubble Spectrometer with high speed video photography[C]. 4th Intern. Symp. Cav., CAV2001. Pasadena, CA, 2001.
[11] CHAHINE G., KALUMUCK K. Development of a near real-time instrument for nuclei measurement: The ABS Acoustic Bubble Spectrometer®[C]. Joint ASME/ JSME Fluids Engineering Conference. Honolulu, Hawaii, 2003.
[12] FUNG Y. C. Biomechanics: Mechanical properties of living tissues[M]. NY: Springer-Verlag, 1981.
[13] VINCENT J. F. Structural biomaterials[M]. Princeton, NJ: Princeton University Press, 1990.
[14] ALLEN J. S., ROY R. A. Dynamics of gas bubbles in viscoelastic fluids, I. Linear viscoelasticity[J]. J.Acoust. Soc. Am., 2000, 107(6): 3167-3178.
[15] ALLEN J. S., ROY R. A. Dynamics of gas bubbles in viscoelastic fluids, II. Nonlinear viscoelasticity[J]. J.Acoust. Soc. Am., 2000, 108(4): 1640-1650.

64
[16] KELLER J. B., MIKSIS M. Bubble oscillations of large amplitude[J]. J. Acoust. Soc. Am., 1980, 68: 628-633.
[17] GILMORE R. The growth and collapse of a spherical bubble in a viscous compressible liquid[R]. Technical Report No. 26-4, California Institute of Technology, 1952.
[18] PROSPERETTI A., CRUM L. A. and COMMANDER K. W. Nonlinear bubble dynamics[J]. J. Acoust. Soc. Am., 1988,83: 502-514.
[19] CHAHINE G. L. Etude locale du phénomène de cavitation: Analyse des facteurs régissant la dynamique des interfaces[D]. Thèse de doctorat d’état es sciences physiques, a l'université Pierre et Marie Curie Paris VI, 1979 (in France).
[20] CHO Y. I., KENSEY K. R. Effect of the non-newtonian viscosity of blood on flows in a diseased arterial vessel, Part1: Steady flows[J]. Biorheology, 1991, 28: 241-262.
[21] GIJSEN F. J. H., ALLANIC E. The influence of the non-Newtonian properties of blood on the flow in large arteries: Unsteady flow in a 900 curved tube[J]. J. Biomechanics, 1999, 32: 705-713.
[22] LOU Z., YANG W. J. A computer simulation of the non-Newtonian blood flow at the aortic bifurcation[J]. J. Biomechanics, 1993, 26: 37-49.
[23] SHEWAFERAW S., WILLIAM E. The rheology of blood flow in a branched arterial system[J]. Appl. Rheol., 2005, 15: 398-405.
[24] FOGLER H. S., GODDARD J. D. Collapse of spherical cavities in viscoelastic fluid[J]. Physics of Fluids, 1970, 13: 1135-1141.
[25] YING R. Y. Viscoelastic effect of polymers on single bubble dynamics[J]. AIChE, 1975, 21: 810-813.
[26] TANASAWA I., YANG W. J. Dynamic behavior of a gas bubble in viscoelastic liquid[J]. J. Applied Physics, 1970, 41: 4526-4531.
[27] NIGMATULIN R. I. Dynamics of multiphase media[M]. Hemisphere, 1991,1,2.
[28] GUMEROV N. A. On waves of the self-induced acoustic transparency in mixtures of liquid and vapor bubbles[C]. IUTAM Symposium on Waves in Liquid/Gas and Liquid/Vapour Two-Phase Systems. Kluwer, 1995, 77-86.
[29] Van WIGNGAARDEN L. One-dimensional flow of liquids containing small gas bubbles[J]. Ann. Rev. Fluid Mech., 1972, 4: 369-396.
[30] INTERNATIONAL COMMISSION ON RADIATION UNITS AND MEASUREMENTS. Tissue substitutes, phantoms and computational modeling in medical ultrasound[R]. ICRU Report 61, 1998.
[31] INTERNATIONAL COMMISSION ON RADIATION UNITS AND MEASUREMENTS. Phantoms and computational models in therapy, diagnosis and protection[R]. ICRU Report 48, 1992.
[32] MAST T. D. Empirical relationships between acoustic parameters in human soft tissues[J]. Acoustics Res. Let. Online, 2000, 1(2): 37-42.
[33] GRAY H. Anatomy of the human body[M]. 20th edition, NewYork: Bartleby, 2000.
[34] RODBARD S. Vascular caliber[J]. Cardiology, 1975, 60: 4-49.