
An inelastic neutron scattering study of dietary phenolic acids

Physics of the Earth and Planetary Interiors 143–144 (2004) 5–18
Application of inelastic X-ray scattering to the measurementsof acoustic wave velocities in geophysical materials
at very high pressure
G. Fiqueta,∗, J. Badroa, F. Guyota, Ch. Bellina, M. Krischb, D. Antonangelib,H. Requardtb, A. Mermetb, D. Farberc, C. Aracne-Ruddlec, J. Zhangd
a Laboratoire de Minéralogie Cristallographie, UMR CNRS 7590, Universités Paris VI et VII,Institut de Physique du Globe de Paris, 4 Place Jussieu, 75252 Paris, cedex 05, France
b European Synchrotron Radiation Facility, BP220, 38043 Grenoble, cedex, Francec Lawrence Livermore National Laboratory, Energy and Environment Directorate,
4000 East Ave., 94550 Livermore, CA USAd CHiPR and Department of Geosciences, SUNY Stony Brook, Stony Brook, NY 11794, USA
Received 17 January 2003; received in revised form 29 September 2003; accepted 3 October 2003
Abstract
Reference Earth global models used by geophysicists are mostly constrained by analysing seismic waves that travel in theEarth. The interpretation of these seismological models in terms of chemical composition and temperature thus relies on theknowledge of the chemical composition, structure and elastic properties of some candidate materials relevant to geophysics.We will describe some recent advances in experimental mineral physics which yield essential information on the elasticproperties of pertinent materials of Earth’s mantle and core. In particular, we show that inelastic X-ray scattering (IXS) provesto be a well suited spectroscopic technique for the study of phonon dispersion in materials under high pressure. Inelasticscattering experiments carried out on polycrystalline samples provide measurements of orientationally averaged longitudinalacoustic velocities whereas investigations on single crystals yield elastic moduli. Such a technique is thus highly interestingfor mineral physicists and offers a great potential in providing essential elastic data and their pressure and/or temperaturedependence on most compounds of geophysical interest.© 2004 Published by Elsevier B.V.
Keywords: Earth’s interior; Mineral physics; High pressure; Physical properties; Elasticity; Techniques
1. Introduction
Knowledge of the elasticity of minerals is essentialto the understanding and interpretation of seismic data,in particular radial average sound velocity profiles or
∗ Corresponding author. Tel.:+33-14427-5236;fax: +33-144-273785.E-mail address: [email protected] (G. Fiquet).
three dimensional images from tomographic studies.Successful interpretation of these seismic models interms of chemical composition, mineralogy, and tem-perature indeed requires information on the elasticityof deep Earth materials under high pressure and tem-perature conditions. The experimental determinationof elastic properties at extreme conditions is, how-ever, not an easy task. Still, numerous experimen-tal procedures have been developed during these last
0031-9201/$ – see front matter © 2004 Published by Elsevier B.V.doi:10.1016/j.pepi.2003.10.005
6 G. Fiquet et al. / Physics of the Earth and Planetary Interiors 143–144 (2004) 5–18
decades, which couple high-pressure apparatuses tovarious techniques such as static (at zero frequency),shock-wave compression, or dynamical acoustic vi-bration (ranging from MHz to GHz frequency range).Among them, we mention the following:
• Shock measurements: measurements of the com-pressional wave velocities under shock compres-sion along the Hugoniot in iron (Brown andMcQueen, 1986), forsterite to 150 GPa (Duffy andAhrens, 1992), periclase to 27 GPa (Duffy andAhrens, 1995) or molybdenum to 81 GPa (Duffyand Ahrens, 1994).
• Resonant ultrasound spectroscopy to study the be-haviour of minerals at extreme temperature androom pressure, e.g. single crystal periclase orforsterite to 1800 K (Isaak et al., 1989a,b).
• The implementation of ultrasonic interferomet-ric measurements using a 1000 tonnes uniaxialsplit-cylinder apparatus (seeLiebermann and Li,1998) with applications to polycrystalline olivineto 10 GPa and 1300 K (Li et al., 1998), wadsleyiteto 7 GPa and 873 K (Li et al., 2001) or MgSiO3perovskite to 8 GPa and 800 K (Sinelnikov et al.,1998).
• Optical probes using phonon–photon scatteringprocesses with stimulated Brillouin scattering in adiamond–anvil cell with measurements of singlecrystal elastic moduli of natural samples of olivine,orthopyroxene and garnet to 20 GPa (Brown et al.,1989; Zaug et al., 1993; Chai et al., 1997a,b;Abramson et al., 1999).
• The extension of pressure range using conventionalBrillouin spectroscopy with measurements on per-iclase to 55 GPa (Zha et al., 2000) or silica glassto 58 GPa (Zha et al., 1994). Data on periclase andsynthetic pyrope to 20 GPa (Sinogeikin and Bass,2000) as well as polycrystalline materials such asnatural majorite-pyrope solid solution under pres-sure (Sinogeikin and Bass, 2002).
Furthermore, first-principles methods have been ap-plied to the study of the high-pressure phases relevantto the Earth’s deep interior such as MgSiO3 perovskite(Karki et al., 2000; Oganov et al., 2001), hcp iron(Alfe et al., 2001; Steinle-Neumann et al., 2001) andhcp cobalt (Steinle-Neumann et al., 1999). The readeris invited to refer to the review articles byStixrudeet al. (1998)or Karki et al. (2001).
None of these methods provides unique answersto the standing long geophysical term requirement ofobtaining precise measurements of compressional ve-locities VP and shear velocitiesVS , at extreme pres-sures and temperatures in chemically and mineralog-ically complex materials over a large frequency andwavelength range. This is why any technique bring-ing new information in this field is valuable. Recently,the use of X-ray diffraction (XRD;Mao et al., 1998;Matthies et al., 2001) and of several inelastic scat-tering techniques such as nuclear resonance inelas-tic X-ray scattering (NRIXS) (Lubbers et al., 2000;Mao et al., 2001), inelastic neutron (INS) (Klotz andBraden, 2000) and inelastic X-ray scattering (IXS)(Fiquet et al., 2001), have provided new data on geo-physically relevant materials. In this paper, we willconcentrate on the method of inelastic X-ray scat-tering with very high energy resolution (�E/E =10−7) which has proven to be well suited for thedetermination of elastic properties of matter at highpressure (Krisch et al., 1997; Occelli et al., 2001)at THz frequencies. For geophysics, such high fre-quencies have the interest of getting close to the infi-nite frequency limit, in complementarity with the lowfrequency limit provided by radial X-ray diffractionmodeling. IXS has more potential in ultra-high pres-sure geophysics (e.g. lower mantle and core) than INSwhich requires larger samples. Such INS experimentsare therefore limited at present to pressures whichdo not exceed 10–15 GPa. Furthermore, INS tech-nique is restricted to measurements of relatively lowacoustic velocities in disordered or polycrystalline sys-tems. IXS cross section is proportional tof(Q)2Q2ρ/µwhereρ is the specific volume,µ the absorption co-efficient andQ the wave vector. The optimal signalfor DAC experiments is obtained if the absorptionlengtht = 1/µ is of the order of 10–40�m, typicallyspanning elements withZ between 30 and 50. How-ever, previous experiments have shown that studieson lowerZ (Occelli et al., 2001; Krisch et al., 2002)and higherZ materials (Loa et al., 2003) are as wellpossible. Finally, we note that higher order Brillouinzones can be explored in single crystals, where the sig-nal is enhanced byf(Q)2Q2. In the following, exam-ples of applications of IXS will be given for polycrys-talline iron, iron alloyed with light elements, MgSiO3perovskite, as well as one example of cobalt singlecrystal.
G. Fiquet et al. / Physics of the Earth and Planetary Interiors 143–144 (2004) 5–18 7
2. Experimental setup
The development of IXS with meV energy resolu-tion goes back to work at HASYLAB (Germany) in the1980s (seeBurkel et al. (1987)or Dorner et al., 1987).This method allows to study phonons and phonon-likeexcitations. The theoretical aspect will not be dis-cussed here and the reader is referred to the articlesof Schülke (1991)andBurkel (2000). The basic kine-matics of the inelastic scattering process is describedin Fig. 1. The incident photon of energy ¯hω1 and wavevector�k1 is scattered by the sample into a photon char-acterized by energy ¯hω2 and wave vector�k2, a processcorresponding to an energy transfer ¯hω = hω1 − hω2and the momentum transfer ¯h �Q = h�k1 − h�k2. In thecases investigated in this study, the energy transfersare of the order of meV, much smaller than the inci-dent photon energy of 15–25 keV, andQ is only con-trolled by the scattering angle theta, with the followingexpression:
Q = 2k1 sin
(θ
2
)(1)
At the ESRF (European Synchrotron RadiationFacility), two beamlines (ID16 and ID28) are dedi-cated to X-ray inelastic scattering spectroscopy. OnID28, the X-ray beam produced by three undulators
Fig. 1. Scattering geometry and kinematics of the inelastic scatter-ing process. The incident X-ray photon characterized by angularfrequencyω1 and wave vector�k1, and scattered photon by angu-lar frequencyω2 and wave vector�k2. As long as the transferredenergy is much smaller than the incident photon energy, the mo-mentum transferQ is simply connected with the geometry of theexperiment, i.e. the scattering angleθ.
is monochromatized by a cryogenically cooled silicon(1 1 1) crystal and a high-energy resolution siliconbackscattering monochromator (Verbeni et al., 1996).The backscattered beam is focused by a gold-coatedtoroidal mirror which provides a focal spot at thesample position of 250�m (horizontal) by 60�m(vertical) full-width-half-maximum. The scatteredphotons are analyzed by five analyzers mounted on aRowland circle at a distance of 650 cm from the sam-ple (Masciovecchio et al., 1996). The energy-analyzedphotons are subsequently detected by a Peltier-cooledfive element silicon diode detector positioned near thesample position 3 mm above the incident beam axis.According to Eq. (1), the momentum transferQ isselected by rotating the spectrometer arm in the hori-zontal scattering plane around a vertical axis passingthrough the scattering sample (seeFig. 2). The energyscans are performed by varying the monochromatortemperature while the temperature of the analyzers iskept fixed. With a linear thermal expansion of siliconat room temperatureα = 2.58× 10⁻⁶ K−1 and a con-version to the energy scale according to the relation:�E/E = α�T , a temperature scan over a few degreeswith mK resolution provides the necessary meV reso-lution in energy needed to probe phonon excitations.The sample orientation and scattering angle are keptfixed whereas the energy of the beam impinging onthe sample is changed by varying the monochromatortemperature in steps of 0.005–0.020 K over 1–4 K,corresponding to a scanning range of several 10 meVup to a few 100 meV.
In order to illustrate how data processing is made,a typical IXS spectrum is given inFig. 3 for poly-crystalline bcc iron at ambient conditions. On bothsides of the elastic line centered at zero-energy trans-fer, one can notice two excitations which correspondto the scattering of incident X-ray photons by longitu-dinal acoustic LA phonons in iron. These Stokes (en-ergy loss) and anti-Stokes (energy gain) inelastic in-teractions, corresponding to phonon creation and an-nihilation, respectively, are characterized by an energytransfer at a given momentum transferQ, which cor-responds to a particular location in the first Brillouinzone. The energy positions and the widths of the ex-citations are fitted by using a Lorentzian model func-tion, convoluted with an experimentally determinedenergy resolution function, by standardχ2 minimiza-tion (shown inFig. 3).

8 G. Fiquet et al. / Physics of the Earth and Planetary Interiors 143–144 (2004) 5–18
Fig. 2. Optical layout of ID28 beamline at ESRF (European Synchrotron Radiation Facility, Grenoble, France).
2.1. The example of iron and its implications for theEarth’s inner core
The knowledge of the elastic constants of the phasesof iron, which makes up 70–90 wt.% of planetarycores, is essential for comparison with global velocitymodels of Earth. The hcp (orε) high-pressure phaseis stable to at least 300 GPa at ambient temperature(Mao et al., 1990) and numerous experiments have
Fig. 3. Example of an inelastic X-ray scattering pattern ob-tained from a bcc iron foil at ambient conditions using the(8 8 8) monochromator reflection, providing an energy resolutionof 5.5 meV. Scanning time is 5 h.Q = 6.16 nm−1. The experi-mental data (open circles) are plotted with their error bars alongwith the corresponding fits.
been carried out in order to characterize the elasticproperties of iron phases, such as XRD (Mao et al.,1998; Matthies et al., 2001), NRIXS (Lubbers et al.,2000; Mao et al., 2001), or INS on the low pressurebcc phase (Klotz and Braden, 2000). As shown inFiquet et al. (2001), IXS provides a way to derive theacoustic velocity from the dispersion of the longitu-dinal acoustic phonon energy in iron. The results ofthis study are used here for illustrating how acousticvelocities are obtained from IXS data collected underhigh pressure.
In this experiment, a polycrystalline sample of ironwas loaded into the 120�m hole of a rhenium gas-ket and compressed without any pressure transmittingmedium between diamond anvils. In the following,only the Stokes part of the spectra has been collectedto save time. The peak centered at zero-energy trans-fer corresponds to the elastic contribution to the sig-nal, whereas two other peaks are visible at higher en-ergy transfer. The knowledge of the phonon disper-sion curves of iron (Minkiewicz et al., 1967) and dia-mond (Warren et al., 1967) allows an unambiguous as-signment of these features, which correspond to a LAphonon of iron and a transverse acoustic TA phononof diamond (seeFig. 4). With the five analyzers lo-cated in the horizontal plane at different scattering an-glesθ, it is possible to map the dispersion curves ofacoustic phonons across the first Brillouin zone. Due

G. Fiquet et al. / Physics of the Earth and Planetary Interiors 143–144 (2004) 5–18 9
Fig. 4. IXS pattern recorded on a powdered iron sample in the hcpphase, at 28 GPa in a diamond–anvil cell. No pressure transmittingmedium is used. The momentum transferQ is 4 nm−1. Dashedlines represent the inelastic contributions of the LA phonon branchfor iron and from a TA branch from diamond, the thin solid linerepresents the elastic contribution and the thick continuous lineshows the summation of individual contributions.
the polycrystalline nature of the sample, only modulusQ is defined, but not its direction. We consequentlyonly record an orientationally averaged LA velocity.Furthermore, the inelastic scattering cross section isproportional to the dot product( �Q�eq)
2 where �Q isthe momentum transfer and�eq is the phonon eigen-vector of modeq (e.g.Ashcroft and Mermin, 1976).Consequently, only modes whose eigenvectors have acomponent parallel toQ are visible in a coherent in-elastic scattering experiment. For momentum transferswithin the first Brillouin zone in polycrystalline sys-tems, these modes are predominantly of longitudinalcharacter (Burkel, 2000). However, transverse modescan be detected, though weaker in their intensity, dueto the fact that along an arbitrary crystalline direction,there can be a non-zero contribution of the transversephonon eigenvectors projected onto the momentumtransfer direction. Indeed, weak detection of TA modein iron is evidenced inFig. 5 for someQ values. Fur-thermore, in some directions, some LA–TA mixingmight occur, but as the intensity contribution of TAmodes is weak, this effect is most likely negligible.
As shown inFig. 5, different excitations correspond-ing to iron LA or TA phonons can be fitted at differentQ values. The TA phonon of diamond visible atQ =4 nm-1 disappears at higherQ values in the recordedenergy transfer region because of its high sound ve-locity. The LA iron phonon branch is recorded overthe entire momentum and pressure range explored, as
Fig. 5. IXS dispersion of the iron LA phonon recorded in the hcpphase of iron at 28 GPa. These patterns correspond to the signalrecorded on the whole analyser set, i.e. at five differentQ values.The LA phonons of iron are indicated by ticks. The excitationindicated by broken ticks forQ values at 8.31 and 10.46 nm−1
have been interpreted as a TA phonon in iron sample.
shown inFig. 6on the dispersion curves resulting fromthe fitted energy position of the phonon reported as afunction of the momentum transferQ. We notice thatthe high-pressure data are at energies well above thoseat ambient pressure, implying a significant increase ofthe sound velocity with increasing pressure, in the bccphase as well as in the hcp phase of iron. The velocityof longitudinal acoustic velocity (VP ) as well as theposition of the edge of the first Brillouin zoneQMAXcan be estimated by fitting the dispersion relation witha sine law, and by determining its slope in theQ = 0limit with the following expression:
E[meV] = 4.192× 10⁻⁴ VP [ms−1] × QMAX [ns−1]
× sin
[π
2
Q[ns−1]
QMAX [ns−1]
](2)

10 G. Fiquet et al. / Physics of the Earth and Planetary Interiors 143–144 (2004) 5–18
Fig. 6. Orientationally averaged dispersion curve of the longitudinalacoustic phonon branch of iron. The dashed line corresponds todata recorded in the bcc phase at 0.2 and 7 GPa, solid lines standfor fitted dispersion curves in the hcp phase of iron at pressuresof 19, 28, 45, 55, 64 and 110 GPa from bottom to top.
The first Brillouin zone is approximated here by asphere defined by radiusQMAX , which has been con-sidered as a free parameter in the fitting procedure.Within uncertainties, the observed values ofQMAXcalculated from XRD data by equating the volume ofthe reciprocal unit-cell to that of a sphere are in agree-ment with those obtained during the fit. Data recordedat four to five momentum transfers have been used ineach dispersion curve to constrainVP within an esti-mated error of 3%.
Our results for the low-pressure bcc structure agreewithin 1% with the ultrasonic data collected up to1 GPa and extrapolated up to 10 GPa (Guinan andBeshers, 1968), thus confirming the reliability of thesemeasurements (seeFig. 7). Results obtained in the hcpphase are given inTable 1and reported as a functionof pressure inFig. 8, along with previous measure-ments obtained with other techniques. At low pres-sures (below 40 GPa), we find an excellent agreementbetween our longitudinal acoustic velocityVP deter-mination and orientationally averaged ultrasonic data(data point at 26.5 GPa inMao et al., 1998). Up to100 GPa, our measurements are within error bars ingood agreement with radial X-ray diffraction (Maoet al., 1998) or NRIXS data (Mao et al., 2001), whereastheoretical calculations yield much higher velocities(Steinle-Neumann et al., 2001). In Fig. 9, we also showthat hcp iron follows a Birch law (seeBirch, 1963)for VP , namely a linear dependence between com-
Fig. 7. Acoustic sound velocity as a function of pressure for bcciron (solid squares) as compared to ultrasonics measurements andextrapolation byGuinan and Beshers (1968).
pressional sound velocity and density, which providesa convenient relationship for extrapolating our mea-surements to higher pressures. Furthermore, our mea-surements are in excellent agreement with the Hugo-niot shock data ofBrown and McQueen (1986)withinthe frame of the Birch’s plot. These shock data havebeen collected at high temperature whereas our mea-surements have been carried out at ambient temper-ature. The important point is that both experimentsyield the same observed acoustic velocity at a samegiven density, which is indeed the Birch assumption(Birch, 1963). It is striking to note that seismic data(Dziewonski and Anderson, 1981) does not fit the lin-ear extrapolation made from the combination of thetwo sets of data. This could be interpreted as if Earth’s
Table 1Longitudinal acoustic sound velocities (m/s) as a function of spe-cific mass (kg/m3)
VP Specific mass VP Specific mass
Iron FeO7055 9084 6150 57707363 9382 6850 60007802 9861 7400 63608032 10107 7930 66008222 10315 8430 71478804 11229 8910 7270
9160 7450
FeS2 FeSi8042 5010 7121 62398824 5277 8013 66309476 5492 9043 729310278 5757 9515 7507

G. Fiquet et al. / Physics of the Earth and Planetary Interiors 143–144 (2004) 5–18 11
Fig. 8. Longitudinal acoustic sound velocity for the hcp phase ofiron as a function of pressure (Fiquet et al., 2001: solid circles).Comparison is made with zero-frequency radial X-ray diffrac-tion measurements (Singh et al., 1998: crosses;Mao et al., 1998:crossed squares), ultrasonics measurements (Mao et al., 1998:empty circle), nuclear resonance inelastic X-ray scattering (Maoet al., 2001: empty squares), Hugoniot sound velocity measure-ments (Brown and McQueen, 1986: solid diamonds), theoreticalcalculations (Stixrude and Cohen, 1995; Söderlind et al., 1996;Laio et al., 2000: empty triangles;Steinle-Neumann et al., 2001:small crosses) and PREM (Dziewonski and Anderson, 1981: emptydiamonds).
inner core were 4–5% lighter than hcp iron, as previ-ously suggested byJephcoat and Olson (1987). Alter-natively, this might indicate the presence of anotherphase of iron or alloy with different physical proper-ties (e.g.Anderson, 1995). The comparison made withNRIXS data byMao et al. (2001)shows that the ex-trapolations of the trends outside of the actual mea-surement ranges yield different values ofVP at innercore conditions, as well as different conclusions on thepossible constitution of the inner core. In NRIXS ex-periments however, the determination of the averageLA velocity is less direct than using IXS. The aver-age Debye phonon velocity has to be extracted froma parabolic fit of the low-energy part of the density ofstates, and has to be converted intoVP and shear wavevelocity VS through an averaging scheme using inde-pendent determinations of bulk and shear moduli. Al-ternatively, such a difference between IXS and NRIXSresults might originate in the way preferred orienta-tions that develop at high pressure in diamond–anvil
Fig. 9. Birch plot (i.e. the longitudinal acoustic velocity is repre-sented as a function of specific mass) for hcp iron. Our inelasticX-ray scattering data (solid circles) and shock wave data (soliddiamonds) closely follow a Birch law, a linear dependence ofthe longitudinal acoustic sound velocity with the specific mass,depicted by the solid line. Empty squares represent the resultsobtained by NRIXS (Mao et al., 2001) and the dashed line theassociated Birch’s fit made from these results only. Experimentalobservations are plotted along recent theoretical calculations (dots)by Steinle-Neumann et al. (2001).
cells in iron are taken into account. On a polycrys-talline material, every single crystallite contributes tothe total average LA dispersion curve. The averageposition and the width of LA excitation result fromboth the intrinsic resolution of the spectrometer andthe sample texture. If orientation distribution is notrandom, the average might be biased toward velocitiesalong that preferred orientation. XRD measurementscarried out in parallel to our IXS study on the ID30ESRF beamline indeed show that thec axis of iron ispreferentially aligned with the compression axis of thediamond–anvil cell, in accordance with recently re-ported texture measurements (Wenk et al., 2000). Suchmeasurements proposed in addition a large anisotropyfor VP , with P-waves travelling 8% faster at 45◦ fromthec axis than either in theab plane or along thec axis.According to these texture measurements, our IXS ex-periment probes mainly LA phonons propagating intheab plane, since the momentum transfer lies approx-imately perpendicular to the incident X-ray beam andto thec axis. When anisotropy curves are consideredhowever (seeWenk et al., 2000), the orientationallyaveragedVP values we obtain from IXS are similarto the values corresponding to a predominant but notcomplete preferential orientation of thec axis.
12 G. Fiquet et al. / Physics of the Earth and Planetary Interiors 143–144 (2004) 5–18
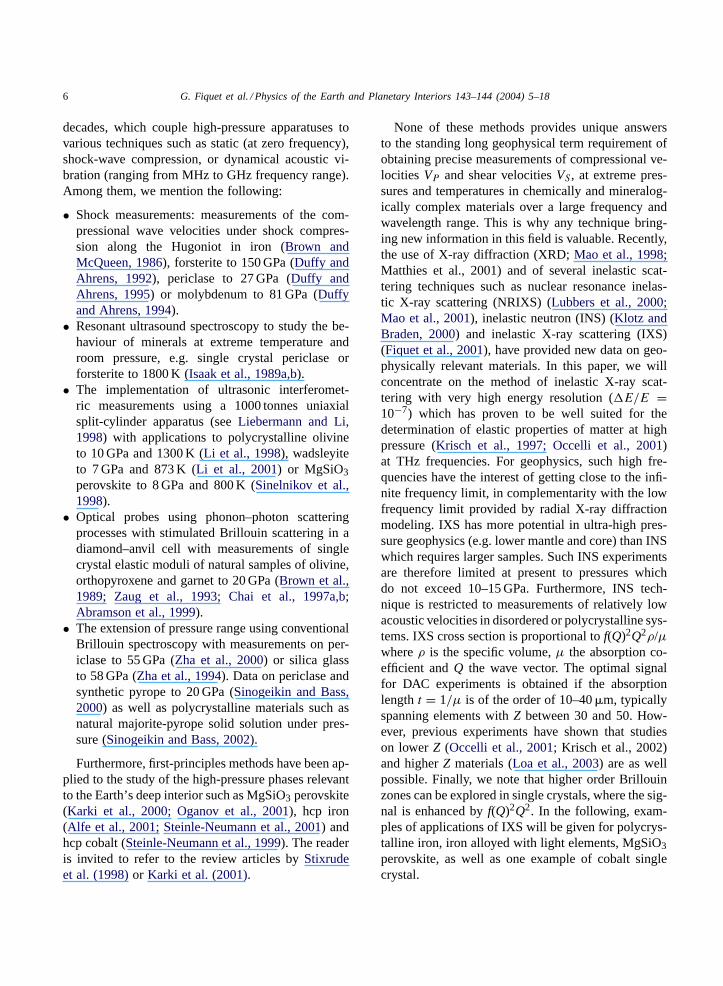
Fig. 10. Longitudinal acoustic sound velocity for iron-bearingcompounds at high pressure, as compared to pure iron and theinner core sound velocity (open diamonds). Solid squares: pyrite;hollow circles: iron silicide; solid circles: iron oxide. Dashed linesare Birch’s fits made to these observations.
In addition, we performed a series of measurementswhich show the influence of light elements such as sul-fur, silicon or oxygen on acoustic sound velocities ofiron alloys at high-pressure. The results are presentedin Table 1and reported as a function of specific massin Fig. 10. One notices that iron silicide, iron oxide aswell as pyrite closely follow a Birch’s law, which pro-vides an interesting way to extrapolate data at higherpressure and/or temperature and will therefore bringnew constraints to the determination of the light ele-ments content of the Earth’s inner core (Badro et al.,in preparation).
2.2. The investigation of the acoustic anisotropy ofhcp metals at high-pressure: the example of cobalt
Beyond studies of the bulk properties of the Earth’score, seismological studies show that the inner coreis elastically anisotropic (Woodhouse et al., 1986;Romanowicz et al., 1996; Song, 1997; Garcia andSouriau, 2000). The anisotropy has an axial symmetryand an amplitude of about 3%, with the fast directionoriented parallel to the Earth’s rotation axis. Sev-eral hypotheses have been proposed to explain thisfeature:Jeanloz and Wenk (1988)proposed that theanisotropy might be caused by the lattice preferredorientation of the hcp structure of iron due to plasticdeformation, whereasKarato (1993)invokes an in-
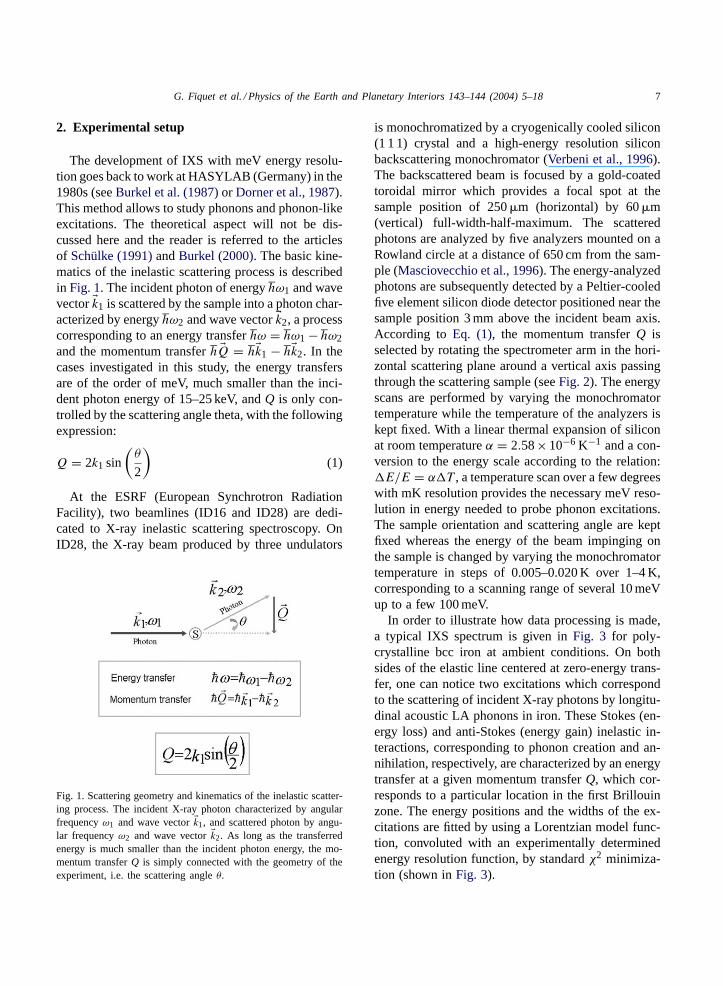
teraction of the Earth’s magnetic field with growingmagnetically anisotropic iron crystals. However, it isnot clear whether hcp iron is highly anisotropic at veryhigh pressure. Some theoretical results show a ratherlow intrinsic anisotropy, almost requiring a perfectalignment of iron hcp crystals in order to account forthe observed seismic anisotropy (Stixrude and Cohen,1995). More recent theoretical work shows that in-trinsic anisotropy in hcp iron is of the order of 12% atinner core conditions and that perfect texturing is notrequired by the theoretical results (Steinle-Neumannet al., 2001). Texture X-ray diffraction measurementsof iron at very high-pressure (Mao et al., 1998; Wenket al., 2000) indicate a large compressional-waveanisotropy which relieves the “perfect alignment”textural constraint. This is illustrated inFig. 11wherethe longitudinal acoustic wave velocity is shown as afunction of the direction of propagation for hcp iron.The anisotropy proposed by texture measurements(Mao et al., 1998), when compared to calculations(Stixrude and Cohen, 1995), is not only different inmagnitude, but as well in direction. Conversely, thedirection and magnitude of the anisotropy in another
Fig. 11. Calculation of the anisotropy of propagation of longitudi-nal acoustic velocity for hcp iron and cobalt. Iron: zero-frequencyradial X-ray diffraction measurements (solid squares) byMaoet al. (1998)compared at 39 GPa with first principles calculations(open squares) fromStixrude and Cohen (1995)and (crosses)from Steinle-Neumann et al. (2001). Cobalt: room pressure ultra-sonics measurements (solid diamonds) byGuinan and Steinberg(1974)plotted along theoretical calculations (open triangles) fromSteinle-Neumann et al. (1999). Calculations at 39 GPa are shownfor hcp cobalt (open diamonds).
G. Fiquet et al. / Physics of the Earth and Planetary Interiors 143–144 (2004) 5–18 13
metal with hcp structure such as cobalt compare well(Guinan and Steinberg, 1974) with iron theoreticalvalues.
In order to settle the above outlined discrepanciesbetween the various indirect experimental techniquesand theory, a direct experimental determination of theelastic constants of hcp iron and their evolution withpressure and temperature is needed. The key experi-ments would in fact be the direct comparison of sin-gle crystal and polycrystalline data in hcp-Fe. How-ever, obtaining single crystals of hcp-Fe at high pres-sure is currently not possible. In the next paragraphs,we present preliminary results obtained on cobalt toaddress the issues of elastic anisotropy. Unlike iron,hcp cobalt is stable at room temperature and ambientpressure to 105 GPa (Yoo et al., 2000). Cobalt is a 3dtransition metal located next to iron in the periodic ta-ble, and its bulk and thermal properties are close tothose of iron. Thus, cobalt makes a good proxy foriron at high-pressure, and single crystals as well aspowders can be obtained commercially. The example
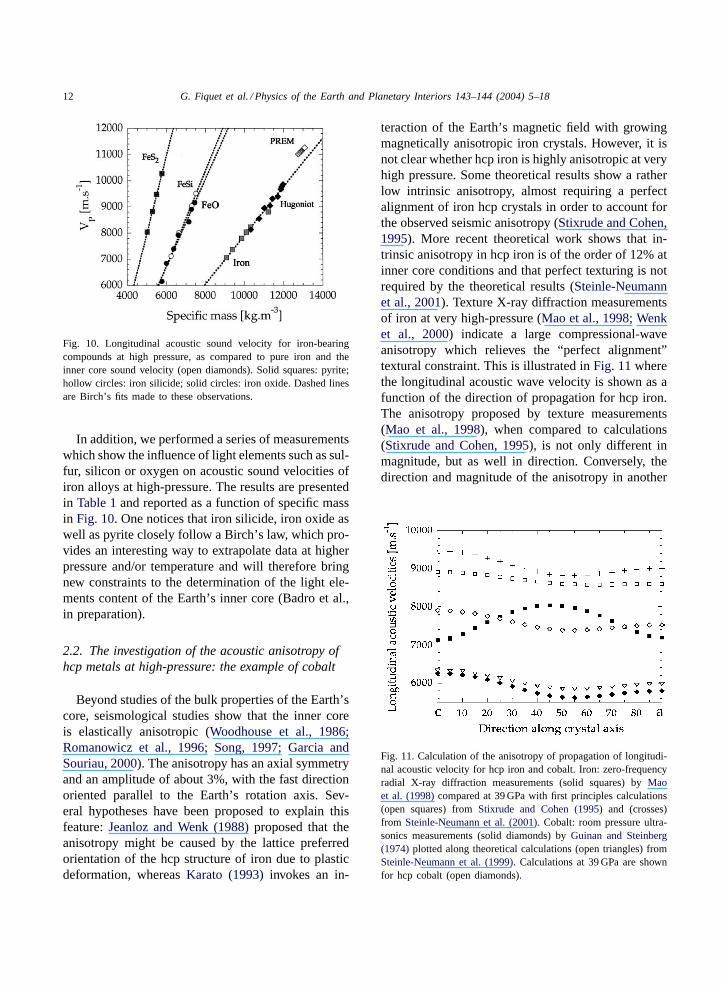
Fig. 12. IXS pattern collected on single crystal hcp cobalt at threedifferent pressures in a diamond-anvil cell. Helium is used aspressure transmitting medium: Squares: 3.3 GPa, circles: 6.5 GPa,triangles: 9.5 GPa. The energy position of the LA phonon is in-dicated by the arrow. A higher energy phonon can be assigned toan optical mode. Reduced-Q setting is 1.1 along [1 0 0] directionin hcp cobalt. The data were taken with an energy resolution of3 meV.
we present here is focused on the determination ofelastic moduli and their pressure derivatives. For thehcp structure there are five independent elastic moduli(C11, C33, C44, C12, C13). These can be derived fromthe LA and TA phonon dispersion, fitted as shown pre-viously with a sine function where the slope atQ = 0yields acoustic velocities along main directions cho-sen by orientating the crystal kept at high-pressure inthe diamond-anvil cell. With a single crystal with sur-face normal to [1 1 0], it is possible to get C11, C33,C44 and C66 which are simply related to LA [1 0 0],LA [0 0 1], TA [1 1 0]〈0 0 1〉 and TA [1 1 0]〈1 0 0〉, re-spectively, whereas C12 can be easily obtained fromC66 = (1/2)(C11 − C12) and C13 is a linear combi-
Fig. 13. Top: Dispersion curve of the longitudinal acoustic phononbranch along the [1 0 0] direction in hcp cobalt at 9.5 GPa. Bottom:pressure dependence of C11 elastic modulus (open circles). Ultra-sound measurements at room pressure (Landolt-Bornstein, 1966)appear as an open diamond whereas theoretical calculations bySteinle-Neumann et al. (1999)are represented by solid dots. Linesare linear fits to the data. The pressure derivative is 5.3 (4) andthe extrapolation to room pressure isC11 = 290± 2 GPa.
14 G. Fiquet et al. / Physics of the Earth and Planetary Interiors 143–144 (2004) 5–18
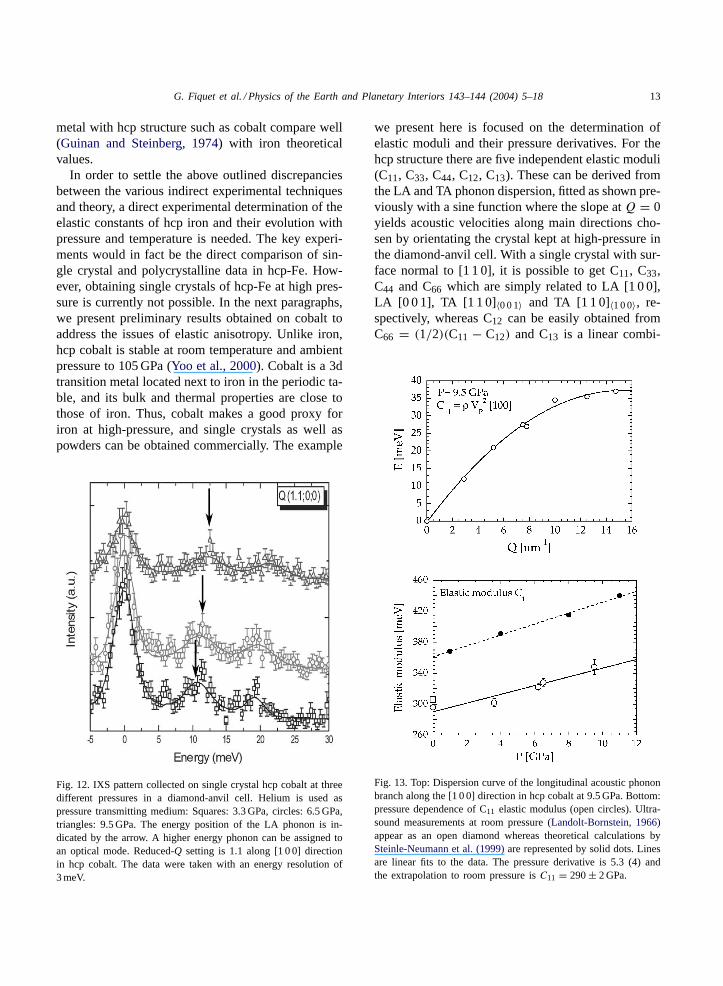
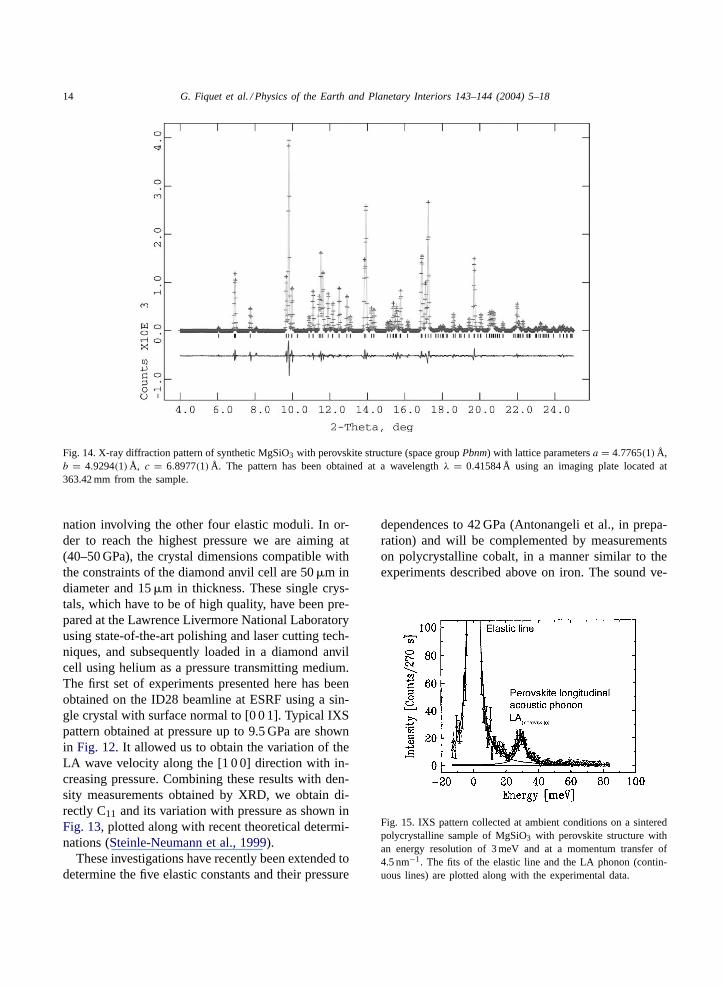
Fig. 14. X-ray diffraction pattern of synthetic MgSiO3 with perovskite structure (space groupPbnm) with lattice parametersa = 4.7765(1) Å,b = 4.9294(1) Å, c = 6.8977(1) Å. The pattern has been obtained at a wavelengthλ = 0.41584 Å using an imaging plate located at363.42 mm from the sample.
nation involving the other four elastic moduli. In or-der to reach the highest pressure we are aiming at(40–50 GPa), the crystal dimensions compatible withthe constraints of the diamond anvil cell are 50�m indiameter and 15�m in thickness. These single crys-tals, which have to be of high quality, have been pre-pared at the Lawrence Livermore National Laboratoryusing state-of-the-art polishing and laser cutting tech-niques, and subsequently loaded in a diamond anvilcell using helium as a pressure transmitting medium.The first set of experiments presented here has beenobtained on the ID28 beamline at ESRF using a sin-gle crystal with surface normal to [0 0 1]. Typical IXSpattern obtained at pressure up to 9.5 GPa are shownin Fig. 12. It allowed us to obtain the variation of theLA wave velocity along the [1 0 0] direction with in-creasing pressure. Combining these results with den-sity measurements obtained by XRD, we obtain di-rectly C11 and its variation with pressure as shown inFig. 13, plotted along with recent theoretical determi-nations (Steinle-Neumann et al., 1999).
These investigations have recently been extended todetermine the five elastic constants and their pressure
dependences to 42 GPa (Antonangeli et al., in prepa-ration) and will be complemented by measurementson polycrystalline cobalt, in a manner similar to theexperiments described above on iron. The sound ve-
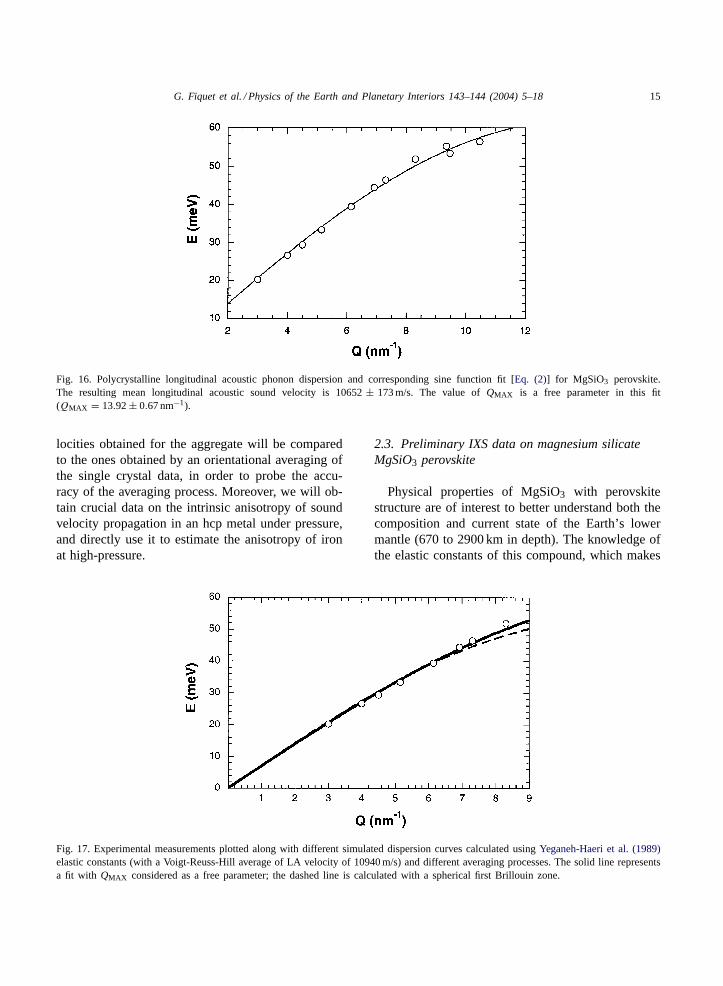
Fig. 15. IXS pattern collected at ambient conditions on a sinteredpolycrystalline sample of MgSiO3 with perovskite structure withan energy resolution of 3 meV and at a momentum transfer of4.5 nm−1. The fits of the elastic line and the LA phonon (contin-uous lines) are plotted along with the experimental data.
G. Fiquet et al. / Physics of the Earth and Planetary Interiors 143–144 (2004) 5–18 15
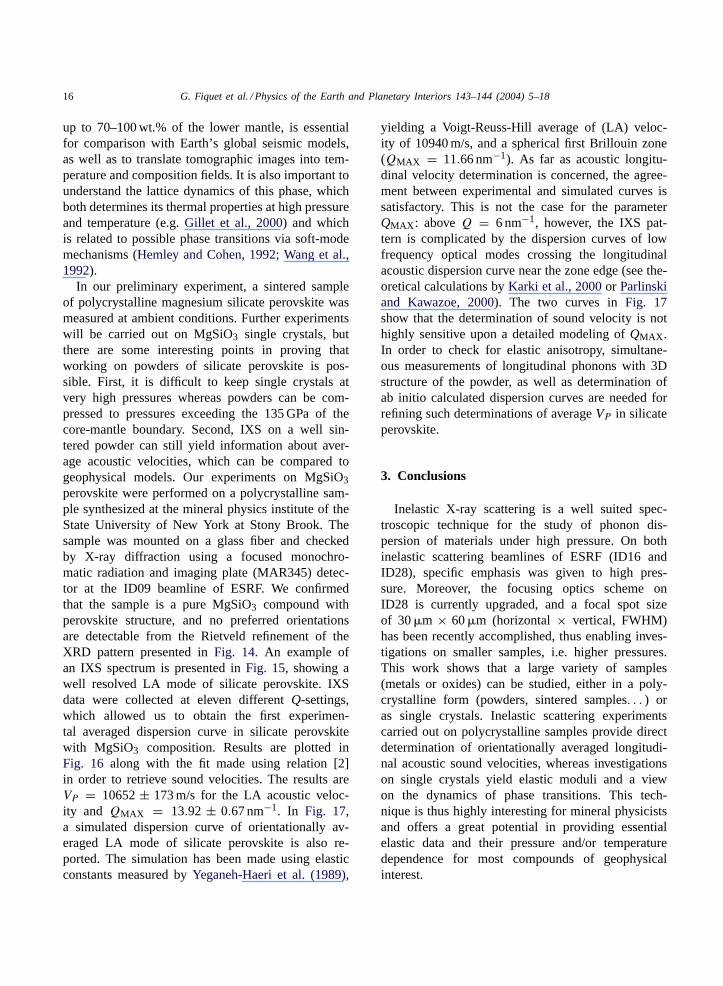
Fig. 16. Polycrystalline longitudinal acoustic phonon dispersion and corresponding sine function fit [Eq. (2)] for MgSiO3 perovskite.The resulting mean longitudinal acoustic sound velocity is 10652± 173 m/s. The value ofQMAX is a free parameter in this fit(QMAX = 13.92± 0.67 nm−1).
locities obtained for the aggregate will be comparedto the ones obtained by an orientational averaging ofthe single crystal data, in order to probe the accu-racy of the averaging process. Moreover, we will ob-tain crucial data on the intrinsic anisotropy of soundvelocity propagation in an hcp metal under pressure,and directly use it to estimate the anisotropy of ironat high-pressure.
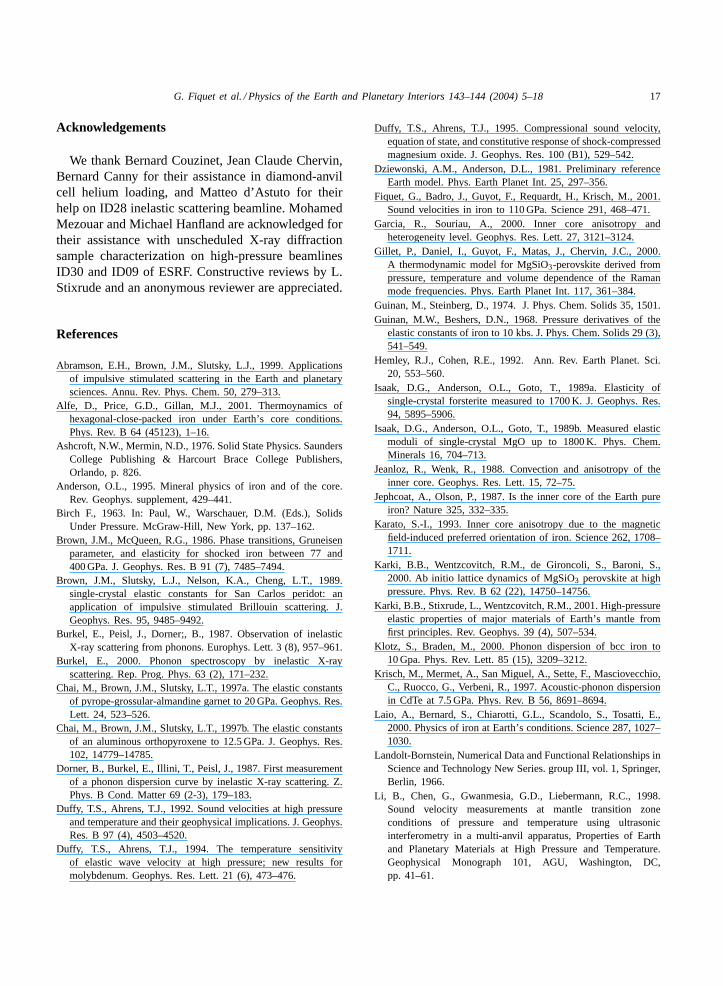
Fig. 17. Experimental measurements plotted along with different simulated dispersion curves calculated usingYeganeh-Haeri et al. (1989)elastic constants (with a Voigt-Reuss-Hill average of LA velocity of 10940 m/s) and different averaging processes. The solid line representsa fit with QMAX considered as a free parameter; the dashed line is calculated with a spherical first Brillouin zone.
2.3. Preliminary IXS data on magnesium silicateMgSiO3 perovskite
Physical properties of MgSiO3 with perovskitestructure are of interest to better understand both thecomposition and current state of the Earth’s lowermantle (670 to 2900 km in depth). The knowledge ofthe elastic constants of this compound, which makes
16 G. Fiquet et al. / Physics of the Earth and Planetary Interiors 143–144 (2004) 5–18
up to 70–100 wt.% of the lower mantle, is essentialfor comparison with Earth’s global seismic models,as well as to translate tomographic images into tem-perature and composition fields. It is also important tounderstand the lattice dynamics of this phase, whichboth determines its thermal properties at high pressureand temperature (e.g.Gillet et al., 2000) and whichis related to possible phase transitions via soft-modemechanisms (Hemley and Cohen, 1992; Wang et al.,1992).
In our preliminary experiment, a sintered sampleof polycrystalline magnesium silicate perovskite wasmeasured at ambient conditions. Further experimentswill be carried out on MgSiO3 single crystals, butthere are some interesting points in proving thatworking on powders of silicate perovskite is pos-sible. First, it is difficult to keep single crystals atvery high pressures whereas powders can be com-pressed to pressures exceeding the 135 GPa of thecore-mantle boundary. Second, IXS on a well sin-tered powder can still yield information about aver-age acoustic velocities, which can be compared togeophysical models. Our experiments on MgSiO3perovskite were performed on a polycrystalline sam-ple synthesized at the mineral physics institute of theState University of New York at Stony Brook. Thesample was mounted on a glass fiber and checkedby X-ray diffraction using a focused monochro-matic radiation and imaging plate (MAR345) detec-tor at the ID09 beamline of ESRF. We confirmedthat the sample is a pure MgSiO3 compound withperovskite structure, and no preferred orientationsare detectable from the Rietveld refinement of theXRD pattern presented inFig. 14. An example ofan IXS spectrum is presented inFig. 15, showing awell resolved LA mode of silicate perovskite. IXSdata were collected at eleven differentQ-settings,which allowed us to obtain the first experimen-tal averaged dispersion curve in silicate perovskitewith MgSiO3 composition. Results are plotted inFig. 16 along with the fit made using relation [2]in order to retrieve sound velocities. The results areVP = 10652± 173 m/s for the LA acoustic veloc-ity and QMAX = 13.92 ± 0.67 nm−1. In Fig. 17,a simulated dispersion curve of orientationally av-eraged LA mode of silicate perovskite is also re-ported. The simulation has been made using elasticconstants measured byYeganeh-Haeri et al. (1989),
yielding a Voigt-Reuss-Hill average of (LA) veloc-ity of 10940 m/s, and a spherical first Brillouin zone(QMAX = 11.66 nm−1). As far as acoustic longitu-dinal velocity determination is concerned, the agree-ment between experimental and simulated curves issatisfactory. This is not the case for the parameterQMAX : aboveQ = 6 nm−1, however, the IXS pat-tern is complicated by the dispersion curves of lowfrequency optical modes crossing the longitudinalacoustic dispersion curve near the zone edge (see the-oretical calculations byKarki et al., 2000or Parlinskiand Kawazoe, 2000). The two curves inFig. 17show that the determination of sound velocity is nothighly sensitive upon a detailed modeling ofQMAX .In order to check for elastic anisotropy, simultane-ous measurements of longitudinal phonons with 3Dstructure of the powder, as well as determination ofab initio calculated dispersion curves are needed forrefining such determinations of averageVP in silicateperovskite.
3. Conclusions
Inelastic X-ray scattering is a well suited spec-troscopic technique for the study of phonon dis-persion of materials under high pressure. On bothinelastic scattering beamlines of ESRF (ID16 andID28), specific emphasis was given to high pres-sure. Moreover, the focusing optics scheme onID28 is currently upgraded, and a focal spot sizeof 30�m × 60�m (horizontal× vertical, FWHM)has been recently accomplished, thus enabling inves-tigations on smaller samples, i.e. higher pressures.This work shows that a large variety of samples(metals or oxides) can be studied, either in a poly-crystalline form (powders, sintered samples. . . ) oras single crystals. Inelastic scattering experimentscarried out on polycrystalline samples provide directdetermination of orientationally averaged longitudi-nal acoustic sound velocities, whereas investigationson single crystals yield elastic moduli and a viewon the dynamics of phase transitions. This tech-nique is thus highly interesting for mineral physicistsand offers a great potential in providing essentialelastic data and their pressure and/or temperaturedependence for most compounds of geophysicalinterest.
G. Fiquet et al. / Physics of the Earth and Planetary Interiors 143–144 (2004) 5–18 17
Acknowledgements
We thank Bernard Couzinet, Jean Claude Chervin,Bernard Canny for their assistance in diamond-anvilcell helium loading, and Matteo d’Astuto for theirhelp on ID28 inelastic scattering beamline. MohamedMezouar and Michael Hanfland are acknowledged fortheir assistance with unscheduled X-ray diffractionsample characterization on high-pressure beamlinesID30 and ID09 of ESRF. Constructive reviews by L.Stixrude and an anonymous reviewer are appreciated.
References
Abramson, E.H., Brown, J.M., Slutsky, L.J., 1999. Applicationsof impulsive stimulated scattering in the Earth and planetarysciences. Annu. Rev. Phys. Chem. 50, 279–313.
Alfe, D., Price, G.D., Gillan, M.J., 2001. Thermoynamics ofhexagonal-close-packed iron under Earth’s core conditions.Phys. Rev. B 64 (45123), 1–16.
Ashcroft, N.W., Mermin, N.D., 1976. Solid State Physics. SaundersCollege Publishing & Harcourt Brace College Publishers,Orlando, p. 826.
Anderson, O.L., 1995. Mineral physics of iron and of the core.Rev. Geophys. supplement, 429–441.
Birch F., 1963. In: Paul, W., Warschauer, D.M. (Eds.), SolidsUnder Pressure. McGraw-Hill, New York, pp. 137–162.
Brown, J.M., McQueen, R.G., 1986. Phase transitions, Gruneisenparameter, and elasticity for shocked iron between 77 and400 GPa. J. Geophys. Res. B 91 (7), 7485–7494.
Brown, J.M., Slutsky, L.J., Nelson, K.A., Cheng, L.T., 1989.single-crystal elastic constants for San Carlos peridot: anapplication of impulsive stimulated Brillouin scattering. J.Geophys. Res. 95, 9485–9492.
Burkel, E., Peisl, J., Dorner;, B., 1987. Observation of inelasticX-ray scattering from phonons. Europhys. Lett. 3 (8), 957–961.
Burkel, E., 2000. Phonon spectroscopy by inelastic X-rayscattering. Rep. Prog. Phys. 63 (2), 171–232.
Chai, M., Brown, J.M., Slutsky, L.T., 1997a. The elastic constantsof pyrope-grossular-almandine garnet to 20 GPa. Geophys. Res.Lett. 24, 523–526.
Chai, M., Brown, J.M., Slutsky, L.T., 1997b. The elastic constantsof an aluminous orthopyroxene to 12.5 GPa. J. Geophys. Res.102, 14779–14785.
Dorner, B., Burkel, E., Illini, T., Peisl, J., 1987. First measurementof a phonon dispersion curve by inelastic X-ray scattering. Z.Phys. B Cond. Matter 69 (2-3), 179–183.
Duffy, T.S., Ahrens, T.J., 1992. Sound velocities at high pressureand temperature and their geophysical implications. J. Geophys.Res. B 97 (4), 4503–4520.
Duffy, T.S., Ahrens, T.J., 1994. The temperature sensitivityof elastic wave velocity at high pressure; new results formolybdenum. Geophys. Res. Lett. 21 (6), 473–476.
Duffy, T.S., Ahrens, T.J., 1995. Compressional sound velocity,equation of state, and constitutive response of shock-compressedmagnesium oxide. J. Geophys. Res. 100 (B1), 529–542.
Dziewonski, A.M., Anderson, D.L., 1981. Preliminary referenceEarth model. Phys. Earth Planet Int. 25, 297–356.
Fiquet, G., Badro, J., Guyot, F., Requardt, H., Krisch, M., 2001.Sound velocities in iron to 110 GPa. Science 291, 468–471.
Garcia, R., Souriau, A., 2000. Inner core anisotropy andheterogeneity level. Geophys. Res. Lett. 27, 3121–3124.
Gillet, P., Daniel, I., Guyot, F., Matas, J., Chervin, J.C., 2000.A thermodynamic model for MgSiO3-perovskite derived frompressure, temperature and volume dependence of the Ramanmode frequencies. Phys. Earth Planet Int. 117, 361–384.
Guinan, M., Steinberg, D., 1974. J. Phys. Chem. Solids 35, 1501.Guinan, M.W., Beshers, D.N., 1968. Pressure derivatives of the
elastic constants of iron to 10 kbs. J. Phys. Chem. Solids 29 (3),541–549.
Hemley, R.J., Cohen, R.E., 1992. Ann. Rev. Earth Planet. Sci.20, 553–560.
Isaak, D.G., Anderson, O.L., Goto, T., 1989a. Elasticity ofsingle-crystal forsterite measured to 1700 K. J. Geophys. Res.94, 5895–5906.
Isaak, D.G., Anderson, O.L., Goto, T., 1989b. Measured elasticmoduli of single-crystal MgO up to 1800 K. Phys. Chem.Minerals 16, 704–713.
Jeanloz, R., Wenk, R., 1988. Convection and anisotropy of theinner core. Geophys. Res. Lett. 15, 72–75.
Jephcoat, A., Olson, P., 1987. Is the inner core of the Earth pureiron? Nature 325, 332–335.
Karato, S.-I., 1993. Inner core anisotropy due to the magneticfield-induced preferred orientation of iron. Science 262, 1708–1711.
Karki, B.B., Wentzcovitch, R.M., de Gironcoli, S., Baroni, S.,2000. Ab initio lattice dynamics of MgSiO3 perovskite at highpressure. Phys. Rev. B 62 (22), 14750–14756.
Karki, B.B., Stixrude, L., Wentzcovitch, R.M., 2001. High-pressureelastic properties of major materials of Earth’s mantle fromfirst principles. Rev. Geophys. 39 (4), 507–534.
Klotz, S., Braden, M., 2000. Phonon dispersion of bcc iron to10 Gpa. Phys. Rev. Lett. 85 (15), 3209–3212.
Krisch, M., Mermet, A., San Miguel, A., Sette, F., Masciovecchio,C., Ruocco, G., Verbeni, R., 1997. Acoustic-phonon dispersionin CdTe at 7.5 GPa. Phys. Rev. B 56, 8691–8694.
Laio, A., Bernard, S., Chiarotti, G.L., Scandolo, S., Tosatti, E.,2000. Physics of iron at Earth’s conditions. Science 287, 1027–1030.
Landolt-Bornstein, Numerical Data and Functional Relationships inScience and Technology New Series. group III, vol. 1, Springer,Berlin, 1966.
Li, B., Chen, G., Gwanmesia, G.D., Liebermann, R.C., 1998.Sound velocity measurements at mantle transition zoneconditions of pressure and temperature using ultrasonicinterferometry in a multi-anvil apparatus, Properties of Earthand Planetary Materials at High Pressure and Temperature.Geophysical Monograph 101, AGU, Washington, DC,pp. 41–61.

18 G. Fiquet et al. / Physics of the Earth and Planetary Interiors 143–144 (2004) 5–18
Li, B., Liebermann, R.C., Weidner, D.J., 2001.P–V–VP–VS–Tmeasurements on wadsleyite to 7 GPa and 873 K: implicationsfor the 410 km seismic discontinuity. J. Geophys. Res.106 (B12), 30575–30591.
Liebermann, R.C., Li, B., 1998. In: Hemley, R.J. (Ed.), Elasticityat High Pressures and Temperatures. Reviews in Mineralogy,pp. 459–492.
Loa, I., Kunc, K., Syassen, K., Krisch, M., Mermet, A., Hanfland,M., 2003. Inelastic X-ray scattering in Cs under pressure. HighPressure Res. 23, 1–5.
Lubbers, R., Grünsteudel, H.F., Chumakov, A.I., Wortmann, G.,2000. Density of phonon states in iron at high pressure. Science287, 1250–1253.
Mao, H.K., Wu, Y., Chen, L.C., Shu, J., Jephcoat, A.P., 1990.Static compression of iron to 300 GPa and Fe0.8Ni0.2 alloy to260 GPa: implications for composition of the core. J. Geophys.Res. 95 (B13), 21737–21742.
Mao, H.K., Shu, J., Shen, G., Hemley, R.J., Li, B., Singh, A.K.,1998. Elasticity and rheology of iron above 220 GPa and thenature of the Earth’s inner core. Nature 396, 741–743; erratum:Nature 399, 280.
Mao, H.K., Xu, J., Struzhkin, V.V., Shu, J., Hemley, R.J., Sturhahn,W., Hu, M.Y., Alp, E.E., Vocadlo, L., Alfe, D., Price, G.D.,Gillan, M.J., Schwoerer-Böhning, M., Häusermann, D., Eng,P., Shen, G., Giefers, H., Lübbers, R., Wortmann, G., 2001.Phonon density of states of iron up to 153 GPa. Science 292,914–916.
Masciovecchio, C., et al., 1996. A perfect crystal X-ray analyzerwith meV energy resolution. Nucl. Instr. Methods. Phys. Res.B 111, 181.
Minkiewicz, V.J., Shirane, G., Nathans, R., 1967. Phonondispersion relation for iron. Phys. Rev. 162 (3), 528–531.
Occelli, F., Krisch., M., Loubeyre, P., Sette, F., LeToullec, R.,Masciovecchio, C., Rueff; J.P., 2001. Phonon dispersion curvesin an argon single crystal at high pressure by inelastic X-rayscattering. Phys. Rev. B 63, 224306, 1–8.
Oganov, A.R., Brodholt, J.P., Price, G.D., 2001. The elasticconstants of MgSiO3 perovskite at pressures and temperaturesof the Earth’s mantle. Nature 411, 934–937.
Parlinski, K., Kawazoe, Y., 2000. Ab initio study of phonons andstructural stabilities of the perovskite-type MgSiO3. Eur. Phys.J. B16, 49–58.
Romanowicz, B., Li X.D., Durek, J., 1996. Anisotropy in the innercore: could it be due to low order convection? Science 274,963–966.
Schülke, W., 1991. In: Brown, G., Moncton, D.E. (Eds.), Handbookon Synchrotron Radiation. North Holland Publishing Company.
Sinelnikov, Y.D, Chen, G., Neuville, D.R., Vaughan, M.T.,Liebermann, R.C., 1998. Ultrasonic shear wave velocities ofMgSiO3 perovskite at 8 GPa and 800 K and lower mantlecomposition. Science 281, 677–679.
Singh, A.K., Mao, H.K., Shu, J., Hemley, R.J., 1998. Estimationof single-crystal elastic moduli from polycrystalline X-raydiffraction at high pressure: application to FeO and iron. Phys.Rev. Lett. 80 (10), 2157–2160.
Sinogeikin, S.V., Bass, J.D., 2000. Single-crystal elasticity ofpyrope and MgO to 20 GPa by Brillouin scattering in thediamond cell. Phys. Earth Planet Int. 120, 43–62.
Sinogeikin, S.V., Bass, J.D., 2002. Elasticity of Majorite and aMajorite–Pyrope solid solution to high pressure: implicationsfor the transition zone. Geophys. Res. Lett. 29 (2), 52–55.
Söderlind, P., Moriarty, J.A., Wills, J.M., 1996. First-principlestheory of iron up to earth-core pressures: structural, vibrationaland elastic properties. Phys. Rev. B 53 (21), 14063–14072.
Song, X., 1997. Anisotropy of the Earth’s inner core. Rev.Geophys. 35 (3), 297–313.
Steinle-Neumann, G., Stixrude, L., Cohen, R.E., Gülseren, O.,2001. Elasticity of iron at the temperature of the Earth’s innercore. Nature 413, 57–60.
Steinle-Neumann, G., Stixrude, L., Cohen, R.E., 1999. First-principles elastic constants for the hcp transition metals Fe, Co,and Re at high pressure. Phys. Rev. B 60 (2), 791–799.
Stixrude, L., Cohen, R.E., 1995. High-pressure elasticity of ironand anisotropy of Earth’s inner core. Science 267, 1972–1975.
Stixrude, L., Cohen, R.E., Hemley, R.J., 1998. Theory of mineralsat high pressure. In: Hemley, R.J. (Ed.), Reviews in Mineralogy.vol. 37, pp. 639–671.
Verbeni, R., Sette, F., Krisch, M.H., Bergmann, U., Gorges, B.,Halcoussis, C., Martel, K., Masciovecchio, C., Ribois, J.F.,Ruocco, G., Sinn, H., 1996. X-ray monochromator with 2×10⁻⁸ energy resolution. J. Synchrotron Radiat. 3, 62.
Wang, Y., Guyot, F., Liebermann, R.C., 1992. Electron microscopyof (Mg,Fe)SiO3 perovskite: evidence for structural phasetransitions and implications for the lower mantle. J. Geophys.Res. 97 (B9), 12327–12347.
Warren, J.L., Yarnell, J.K., Dolling, G., Cowley, R.A., 1967. Phys.Rev. 158, 805.
Wenk, H.R., Matthies, S., Hemley, R.J., Mao, H.K., Shu, J., 2000.The plastic deformation of iron at pressures of the Earth’s innercore. Nature 405, 1044–1047.
Woodhouse, J.H., Giardini, D., Li, X.D., 1986. Evidence for innercore anisotropy from free oscillations. Geophys. Res. Lett. 13,1549–1552.
Yeganeh-Haeri, A., Weidner, D.J., Ito, E., 1989. Elasticity ofMgSiO3 in the perovskite structure. Science 243, 787–789.
Yoo, C.S., Cynn, H., Soderlind, P., Iota, V., 2000. Newbeta(fcc)-cobalt to 210 GPa. Phys. Rev. Lett. 84 (18), 4132–4135.
Zaug, J., Abramson, E.H., Brown, J.M., Slutsky, L.J., 1993. Soundvelocities in olivine at Earth mantle pressure. Science 260,1487–1489.
Zha, C.-S., Mao, H.K., Hemley, R.J., Duffy, T.S., Meade, C.,1994. Acoustic velocities and refractive index of SiO2 glassto 57.5 GPa by Brillouin scattering. Phys. Rev. B 50, 13105–13112.
Zha, C.-S., Mao, H.K., Hemley, R.J., 2000. Elasticity of MgOand a primary pressure scale to 55 GPa. Proc. Natl. Acad. Sci.U.S.A. 97 (25), 13494–13499.
Copyright © 2022 FDOKUMEN