CYCLIC INELASTIC BUCKLING OFTUBULARSTEELBRACES
206
REPORT NO. UCB/EERC-80/16 JUNE 1980 EARTHQUAKE ENGINEERING RESEARCH CENTER CYCLIC INELASTIC BUCKLING OF TUBULAR STEEL BRACES by VICTOR A. ZAYAS EGOR P. POPOV STEPHEN A. MAHIN Report to the National Science Foundation COLLEGE OF ENGINEERING UNIVERSITY OF CALIFORNIA • Berkeley, California REPRODUCED BY. NATIONAL TECHNICAL INFORMAnON SERVICE u.s. DEPARTMENT OF COMMERCE SPRIlIGfIHD, VA 22161 (Formerly NTIS-aS) .... .... - .. ....... _- ... _.
-
Upload
khangminh22 -
Category
Documents
-
view
3 -
download
0
Transcript of CYCLIC INELASTIC BUCKLING OFTUBULARSTEELBRACES
REPORT NO.
UCB/EERC-80/16
JUNE 1980
EARTHQUAKE ENGINEERING RESEARCH CENTER
CYCLIC INELASTIC BUCKLINGOF TUBULAR STEEL BRACES
byVICTOR A. ZAYAS
EGOR P. POPOV
STEPHEN A. MAHIN
Report to the National Science Foundation
COLLEGE OF ENGINEERING
UNIVERSITY OF CALIFORNIA • Berkeley, CaliforniaREPRODUCED BY.NATIONAL TECHNICALINFORMAnON SERVICE
u.s. DEPARTMENT OF COMMERCESPRIlIGfIHD, VA 22161
(Formerly NTIS-aS).... _-,.---~_ .... - .. ......._- ..._.


- i _ta
ABSTRACT
Experimental results are presented from tests on six individual brace members subjected
to severe inelastic cyclic loading. The tubular brace specimens considered are one-sixth scale
models of braces of the type used for offshore platforms. Each brace specimen is alternatively
subjected to cycles of compressive inelastic buckling followed by tensile stretching. Examined
are the effects resulting from different end fixity conditions (pinned vs. fixed), and from
different diameter-to-wall thickness ratios (33 vs. 48). Also, the behaviors of heat treated
braces are compared to the behavior of braces made from tubing as received from the manufac
turer. The inelastic responses of the braces are presented and interpreted, including axial load
axial displacement hysteretic loops; axial load-midspan lateral deflection hysteretic loops; brace
deflected shapes; brace energy dissipation; and inelastic axial strains, curvatures and rotations in
plastic regions.
Special attention is directed to the deterioration of buckling load with inelastic cycling.
Design code buckling formulas are for columns or braces that have not been previously yielded
and have initial cambers within the code allowances. Cyclic inelastic loadings cause changes in
the mechanical material properties of the braces which subsequently reduces the buckling load.
A method of predicting the reduction in buckling load is presented. The changes in material
properties are identified for a "critical section" within the plastic hinge of a brace and the
reduced buckling loads under repeated cyclic loadings are calculated. The results are examined
with respect to design procedures prescribed by the American Institute of Steel Construction
and the American Petroleum Institute.


- ii -
ACKNOWLEDGEMENTS
The work reported in this paper is a part of general investigation of Braced Steel Struc
tures which is one of the sub-projects supported by the National Science Foundation under
Grants ENV-76-04263 and PFR-79-08984. The authors are most grateful for the support which
made this work possible, and to Dr. S. C. Liu, the Project Manager for NSF.
A large staff was required for the completion of the experimental work, data reduction,
and report preparation. The authors are indebted to the several graduate students who assisted.
In particular the authors would like to thank Benson Shing, Keith Hjelmstad, Willy Yau, R.
Gary Black, Bruce Fong and Lawrence Oeth who contributed with personal effort and
enthusiasm to the project. Don Clyde of the technical staff set up and operated the test equip
ment. Leona Rambeau and Amy Pertschuk prepared the illustrations. Joy Kono typed the
report drafts, and Linda Garbesi did the Unix text preparation. The help of these people is
greatly appreciated.
Any opinions, findings, and conclusions or recommendations expressed in this report are
those of the authors and do not necessarily reflect the views of the National Science Founda
tion.


- iii -
TABLE OF CONTENTS
Abstract
Acknowledgements
Table of Contents
List of Symbols
Chapter 1. Introduction
Objectives and Scope
Chapter 2. Experimental Program
Experimental Setup
Instrumentation
Loading Procedure
Material Properties
Chapter 3. Overall Behavior of Strut Specimens Under Cyclic Loading
Hysteretic Behavior
Normalized Load vs. Axial Displacement
Deterioration of Buckling Loads
Deflected Shapes
Energy Dissipation
Chapter 4. Inelastic Behavior at Plastic Hinges - Annealed Struts
Basic Considerations of Brace Inelastic Buckling
Curvature in Plastic Hinge Regions
Inelastic Rotations
Cumulative Curvature and Centroidal Axial Strain
Occurrence of Local Buckling
Chapter 5. Prediction of Buckling Loads - Annealed Structs
A Generalized Tangent Modulus Procedure
Page
ii
iii
vi
3
5
6
7
8
8
11
11
15
16
16
18
21
22
23
26
27
28
32
34

- iv -
Prediction of First Buckling Load
Deterioration of Buckling Load
Chapter 6. Inelastic Behavior of the Unannealed Struts
Characteristics of the Material Properties
Prediction of Buckling Loads
Chapter 7. Conclusions
Recommendations for Future Research
References
Tables
Figures
Appendix
36
36
40
40
41
43
44
46
48
61
156

A
B
C
CIS
CY
D
E
EtF
G3
kLir
LB
LP
LVDT
MpP
PyST
I>
I>y
d
€
- v -
LIST OF SYMBOLS
Load Point - Zero Load Before Compression
Load Point - Maximum Compressive Load
Load Point -Maximum Compressive Displacement
Cumulative Inelastic Strain (Centroidal)
Cycle
Load Point - Zero Load After Compression
Load Point - Maximum Tensile Load
Tangent Modulus of Elasticity
Load Point- Zero Load After Tension
Strain Gage Number 3 (Typical)
Effective Slenderness Ratio
Local Buckling
Designation of Load Point
Linear Variable Differential Transformer
Plastic Moment
Axial Load
Yield Load
Designation for Strut
Axial Displacement
Axial Yield Displacement
Midspan Lateral Displacement
Strain
Stress
Yield Stress
Tube Section


CHAPTER 1
INTRODUCTION
The level of seismic forces that buildings located in regions of high seismic risk would be
required to resist, if designed on an elastic basis alone, would generally raise the cost of con
struction to nearly prohibitive levels. Fortunately, it is not necessary to design for these large
elastic forces, if ductile inelastic deformations can be permitted. Stresses beyond the elastic
limit will cause permanent deformations and localized damage, but a properly designed struc
ture will not collapse.
The concept of using braced frames in seismic-resistant design has received little attention
until very recently due to the belief that such framing is not sufficiently ductile to withstand
severe seismic disturbances. Consequently, the majority of large structural steel buildings in
seismically active regions are designed as moment-resisting frames. For buildings having wide
facades, such a structural system is economical and has been shown to be very satisfactory for
resisting lateral forces caused by earthquakes. However, in some instances moment-resisting
frames tend to be somewhat flexible, and although safe from collapse, during a severe earth
quake, can develop costly non-structural damage. Moreover, by using moment-resisting frames
alone, along a narrow width of a building, it may be very difficult, and economically impractical,
to develop the required stiffness and strength to resist the lateral forces. Recent experience has
shown that stiff buildings can behave well during major earthquakes [I]. For these reasons
increasing attention is being given to the possibility of employing a variety of bracing schemes
[2-8]. In these designs the braces can become subjected to severe cyclic axial loadings causing
the braces to sequentially buckle and stretch inelastically.
To supplement the scant data available on the behavior of braces subjected to cyclic ine
lastic loadings, an extensive experimental program is being carried out at the University of Cali
fornia, Berkeley. Some twenty-four hot rolled steel sections commonly used in the building
industry have already been tested [9]. All of these members conformed to the American Insti
tute of Steel Construction (AISC) requirements for compact sections [IO]. In order to

broaden the scope of these studies, tubular steel models representative of those employed in
offshore construction were also included in the investigation. This report presents the findings
from experimental tests on six tubular steel braces subjected to severe cyclic axial loadings.
Because of the stiffness and strength required to resist lateral forces due to the actions of
wind, waves and currents, offshore construction has traditionally employed braced frames as
standard design practice. Recent emphasis on seismic considerations in offshore construction
has brought attention to the inelastic cyclic behavior of these types of braced frames. Applica
ble offshore design criteria specify a strength design requirement based on an elastic approach,
and the levels, of seismic design forces considered are comparable to those used for onshore
structures. In addition, the 1977 and 1979 editions of the American Petroleum Institute (API)
Recommended Practice for Planning, Designing, and Constructing Fixed Offshore Platforms
each have stipulated ductility design requirements. The 1977 recommendations require
offshore braced frames to remain stable under rare and intense earthquake motions capable of
imposing displacements twice those of the strength design requirement. The 1979 recommen
dations require offshore platforms to be capable of absorbing at least four times the amount of
energy absorbed at the strength design requirement with the structure remaining stable. Very
little information is presently available regarding the inelastic cyclic behavior of tubular steel
braced frames, their ductility capabilities, and their ability to absorb energy.
The main element required to maintain the overall structural integrity of a braced frame
subjected to lateral forces is the brace. A typical load-deformation relationship of a brace sub
jected to a cycle of inelastic loading is schematically shown in Fig. 1.1. In stage A-B a plastic
hinge is formed in the brace while loading in compression. In stages C-F, the brace is com
pletely straightened by tensile stretching. Several simple macroscopic computer models hav~
been developed to account for this type of hysteretic behavior [2,3,5,12,13]. One such model,
implemented by Roeder and Popov [3], is illustrated in Fig. 1.2. The model approximates the
behavior of a brace by defining a sequence of linear segments. The stiffness of the model in
each segment must be selected on the basis of experimental results, or mathematical
2

formulations. At this time, accurate mathematical or numerical procedures for determining the
form of the hysteretic loops are not fully developed. Consequently, experimental data are
necessary, not only to assess current design procedures, but to obtain data with which analytical
models can be developed and verified.
Unfortunately, only little experimental information is currently available regarding the
hysteretic behavior of tubular brace members. An experimental investigation of brace
members was carried out by Jain, Goel and Hanson at the University of Michigan in 1978 [81.
Small square tube (and angle) specimens were subjected to large cyclic static and dynamic dis
placements. Experimental investigations of tubular beam-column and brace members made
from small diameter pipe are in progress at the University of Wisconsin-Milwaukee under the
direction of D. R. Sherman. Preliminary results of this investigation are reported in Ref 14.
Objectives and Scope
In this report, experimental results from tests on six tubular braces subjected to cyclic ine
lastic loading are presented and evaluated. The objectives are to present the experimental data
in a form which can later be utilized in analytical studies, and to interpret the experimental
observations.
The brace specimens are one-sixth scale models of bracing members used in offshore
structures. The dimensions of the test specimens were based on a representative X-braced
offshore platform designed according to wave and earthquake criteria applicable to Southern
California [15]. The response of specimens designed as semi-compact tubular braces, with a
diameter-to-thickness (D/t) ratio of 48, are compared to the response of specimens considered
fully compact with a diameter-to-thickness ratio of 33 [11]. The effects resulting from different
end fixity conditions are examined. Also, the behavior of heat treated braces is compared to
the behavior of braces made from tubing as received from the manufacturer. Experimental data
presented and interpreted for the brace specimens include: axial force vs. axial displacement
hysteretic loops; axial force vs. midspan lateral deflection hysteretic loops; brace deflected
3

shapes; brace energy dissipation; inelastic axial strains; and inelastic curvatures and rotations
within plastic hinges. The deterioration of buckling load capacity with cycles of loading is
accorded special attention and a method of predicting such deterioration is developed. The
results of the research reported herein are examined with respect to design procedures
prescribed by the AISCand API for axially loaded members.
4

CHAPTER 2
EXPERIMENTAL PROGRAM
The bracing member specimens were one-sixth scale models of braces· found in a
representative Southern California offshore platform (Fig. 2.1 a). At this scale the cross braces
were represented by 4-inch 002 mm) diameter steel tubing. Specimens of two dimensions
were fabricated: a first group with a diameter-to-thickness ratio of 33 and a second group with a
ratio of 48. The first group simulated fully compact A36 steel members able to maintain their
capacity through large inelastic deformations [I 1], whereas the second group modeled A36 steel
members capable of developing their full plastic load capacity without being able to withstand
large inelastic deformations.
To assess the effect of end restraint on brace behavior, two bounds on the possible end
conditions were considered: both ends pinned and both ends fixed. The ends of the first four
specimens were pinned and those of the remaining two specimens were fixed. The actual end
restraint of braces in a braced frame would depend on a variety of factors -- such as frame
configuration and loading, connection detailing, member slenderness and initial camber, joint
flexibility, and inelastic behavior of adjacent members -- and would ordinarily fall in the range
of restraint between the two bounds.
The pinned-end struts (Struts 1-4) were 74-3/8 in. 0.89 m) long, the distance between
the center of the intersection of the cross braces and the face of the jacket leg (Fig. 2.1 b) The
specimen length, from pin to pin, included heavy end support clevises that contained roller
bearings and attachment plates (Fig. 2.2). The effect of the heavy end sections on the buckling
load of the struts was calculated to be less than 3%. The fixed-end specimens (Struts 5 and 6)
were 70-114 in. 0.78 m) long between points of fixity, the distance between the face of the
jacket leg and a point within the thick-walled insert of the cross joint (Fig. 2.1b). The effective
slenderness ratios, kL/r, were 54 and 25 for the pinned-end and fixed-end specimens, respec
tively.
5

The test specimens were made of AISI 1020 mild steel tubing. (AISI 1020 is a mild steel
similar in carbon content and properties to A36.) Because of the drawing process used in its
manufacture, the material properties of this tubing in the as-received condition are considerably
different from the A36 steel welded pipe used in full scale construction. To achieve properties
in the test specimens closer to those encountered in full scale braces and to assess the effect of
material properties on test specimen behavior, four of the tubes used in the test specimens
were annealed by heating to 1600 0 F (870 0 C) and oven-cooling to 1000 0 F (538 0 C).
Full scale construction pipe will have initial residual stresses that differ from the annealed test
tubing; however, the effect of these initial residual stresses on cyclic inelastic buckling should
not be significant after the first inelastic cycle. Two specimens were not annealed in order that
the effect of the as received material properties on the structural response could be assessed.
The geometric properties, end restraint condition, heat treatment, and initial horizontal
and vertical cambers of individual specimens are summarized in Table 2.1.
Experimental Setup
The experimental apparatus used for the tests on the strut specimens is illustrated in Figs.
2.3 through 2.6. One end of the strut was either pinned or rigidly connected to a stiff braced
steel foot frame attached to a concrete reaction block. The other end of the strut was attached
to a double-acting hydraulic jack that was pin-connected to another concrete reaction block.
For the pinned-end specimens, the jack and specimen were connected by a head pin assembly
which was restrained horizontally by a single side arm. For the fixed-end specimens, the strut
was rigidly bolted to a head unit that was restrained against rotation and translation normal to
the axis of the specimen by means of two parallel side arms. Bolts in slotted holes were used to
restrain translation or rotation of the head unit in the vertical plane (Fig. 2.5a). Photogram
metric records verified to within .0016 rad. that in the fixed-end condition, the specimens
achieved full fixity.
6

The initial cambers present in the tubular specimens were carefully measured, and the
specimens were oriented so that initial buckling would be expected to occur in a horizontal
plane. The small frictional forces present in the test setup were measured so that they could be
accounted for when the data were reduced. The friction forces were found to be 0.4 kips 0.78
kN) and 0.8 kips 0.56 kN) for the pinned and fixed test setups, respectively.
Instrumentation
Linear variable differential transformers (LVDT's) were used to measure axial displace
ment and linear potentiometers were used to measure midspan horizontal lateral displacement
of the strut specimens (Fig. 2.2 and 2.7). Linear potentiometers were also used to measure
midspan vertical lateral displacement of the fixed-end specimens where a component of buck
ling could occur in the vertical plane. The axial load on the specimens was measured by a load
cell attached to the loading ram.
Photogrammetric instrumentation was used to determine the deflected shape of the struts.
Aluminum foil targets were evenly spaced longitudinally along the centerline of the members,
and the camera was stationed on an overhead crane approximately twenty feet above the speci
men. Glass plate film was used; pictures were taken at predetermined points in the loading
cycles. The plates were read on an X-Y comparator and the actual and normalized deflected
shapes were plotted by a CDC 6400 Cal Comp Plotter.
SR-4 strain gages were placed at strategic locations along each member. Strain gages were
concentrated where plastic hinges were expected to form. Reduced strain gage data provided
strain histories at specified points, cross-section curvature histories, and plastic hinge rotations.
Data from the load cell, LVDT's, linear potentiometers, and strain gages were recorded
on a Data General Nova Computer high speed data acquisition system. During the tests load
and displacement response parameters were also monitored on X-Y recorders and visual obser
vation records of local buckling phenomena and tearing were kept. (Fig. 2.8).
7

Loading Procedure
All specimens were subjected to quasi-static cycles of reversing axial displacement. These
cycles generally included compressive inelastic buckling followed by tensile stretching. The
prescribed displacement sequence was designed to represent ductility levels expected in braces
within the Southern California example structure subjected to severe seismic loading [I2]. The
same displacement history was designed for the early cycles of all six test struts. The history
prescribed for the first seven loading cycles was as follows. Axial displacement was uniformly
incremented 0.07 in. per cycle during cycles I through 5. On reaching ± 0.35 in. during the
fifth cycle, the imposed displacement was held constant until cycle 7. The loading for subse
quent cycles varied depending on the behavior of the individual struts.
The displacement pattern applied to each strut is illustrated in Figs. 2.9 through 2.14.
Struts 3 and 4, fabricated from the unannealed tubing, were unable to follow the prescribed dis
placement history. Both fractured during the tensile phase of cycle 3. These struts were
repaired and testing resumed with the tensile displacements limited to prevent fracture.
Load points within a cycle have been identified by a letter code system as illustrated for a
typical hysteretic loop in Fig. 2.l5a and from a loading schematic in Fig. 2.15b. This system of
identification is used throughout the report.
Material Properties
The material properties influence the brace behavior through the fundamental characteris
tics of yield point stress level, stress-strain curve shape, and elongation capacity. Differences in
yield points, if the yield points are in fact discernible, can, in part, be accounted for by normal
izing brace response parameters. This normalization is accomplished by dividing load (or dis
placement) levels in each strut by its respective yield load (or yield displacement). Neverthe
less, a similar yield point for the model and full scale brace is desirable in order to retain the
correct relationship between brace displacement ductility and frame displacements of the exam
ple structure. Also, to model inelastic behavior correctly it is important to have similar stress-
8

strain curve shape and elongation capacities.
Two material types were used to fabricate the specimens: annealed and unannealed (as
received) steel tubing. The effect of annealing is clearly indicated in the tensile stress-strain
curves plotted in Figs. 2.16 through 2.18 for coupons taken from each type of material. The
stress-strain curve for the annealed material is elastic-plastic, similar to that for A36 steel. The
average yield strength of the annealed material as measured from the coupon tests was 35 ksi
(242 MPa). Ultimate strengths of approximately 52 ksi (359 MPa) were typically obtained at
strains of about 14% and fractures occurred at strains of about 28%.
The yield strength of the unannealed material, based on a 0.2% strain offset, was consid
erably higher; equal to 92 ksi (635 MPa) for the tubing with an 0.083 in. (2.1 mm) wall thick
ness, and 74 ksi (511 MPa) for the tubing with an 0.120 in. (3.0 mm) wall thickness. No dis
cernible yield point and no plastic plateau appear in the unannealed material stress-strain
curves. The unannealed material coupons fractured at strains of less than 8%.
Material tests were also performed on full cross-sections of pipe. The tests were of two
types: compression stub test (Figs. 2.19 and 2.20) and cyclic tests (Figs. 2.21 and 2.22).
Stress-strain curves from compression stub tests were generally used for predicting first buck
ling loads of struts. The cyclic tests were used to quantify the extent of the Bauschinger effect
that results from inelastic yield and strain reversals. In all the material tests the unannealed
material behaved differently for specimens with 0.083 in. (2.1 mm) wall thickness and 0.120 in.
(3.0 mm) wall thickness, whereas there was no apparent wall thickness effect for the annealed
material. The average yield stress of the annealed material from the full cross-section material
tests was 31 ksi (214 MPa).
A summary of the initial yield stresses for the six test struts is presented in Table 2.2.
The initial yield stress for the unannealed struts is based on a 0.2% strain offset from the
coupon tests. The reported initial yield stress for the annealed struts is based on the first dis
cernible yield plateau, as averaged from the cyclic and compression stub tests. In general, the
coupon tests showed 4-5 ksi (31 MPa) higher yield stresses than the full section cyclic and
9

compression stub tests. The yield stresses observed in the test struts (reported in Chapter 3)
agree with the stresses observed in the cyclic and compression stub tests. The higher stresses
observed in the coupon tests could be a result of cutting out and machining the coupon speci
mens.
Based on the initial yield stress, initial axial yield loads (Py) and yield displacements (I)y)
were computed and are also listed in Table 2.2. These computed yield loads and yield displace
ments are used to normalize the brace hysteretic plots and energy dissipation data presented in
the following chapter.
10

CHAPTER 3
OVERALL BEHAVIOR OF STRUT SPECIMENS UNDER CYCLIC LOADING
The test struts were subjected to cyclic inelastic axial displacements. The principal param
eters monitored during the tests have been plotted in the form of hysteretic loops. These plots
are not only a valuable means of viewing the overall response history of the tested struts, but
they also lay the ground work for additional data reduction and subsequent development of
information related to deterioration of buckling loads, energy dissipation, and plastic hinge for
mation. Details of inelastic behavior within plastic hinge regions are discussed in Chapter 4.
Hysteretic Behavior
The axial load vs. axial displacement curves for the six strut specimens are shown in Figs.
3.1 through 3.14; the lateral deflections that correspond to the early loading cycles are shown in
Figs. 3.15 through 3.20. Maximum compressive and tensile loads attained in each cycle of
loading are reported in Table 3.1; maximum compressive and tensile displacements are reported
in Table 3.2.
Strut 1 was subjected to a preliminary compressive pulse when the load control system
was activated. Residual strains ranging from 0.006 in.lin. in compression to 0.004 in.lin. in
tension were recorded following the pulse. The initial camber of the strut, 0.12 in. (3.0 mm),
increased to 0.25 in. (6.4 mm) as a result of this preliminary loading. Thus, Strut 1 started
cycle 1 with previous inelastic straining and an initial camber larger than the other struts. As a
result, the cycle 1 buckling load attained was 25% lower than that predicted by AISC formulae
[to]. (The factor of safety has been removed from the AISI formulae for all AISC buckling
predictions made in this report.)
The buckling load of Strut 1 decreased significantly in each loading cycle subsequent to
cycle 1 (Fig. 3.1). The post-buckling compressive load of the strut decreased rapidly with
increasing displacement during each cycle. The axial stiffness for tension loading deteriorated
significantly with each cycle. Full tensile load is attained when all fibers within a cross-section
11

have yielded in tension. The greater the compressive displacement within a given cycle, the
greater are the resulting strains within the plastic hinge due to inelastic rotation. After unload
ing in compression, a residual inelastic rotation remains in the strut. When the .direction of
loading is reversed and the strut is loaded in tension, the tensile displacement required to
develop full tensile yielding depends on the prior compressive displacement and on the magni
tude of the residual inelastic rotation. While the full tensile capacity of Strut I was developed
during the first six cycles, the capacity was achieved at tensile displacements approximately
equal to the preceding compressive displacement applied.
Local buckling was observed at the middle of Strut I during cycle 3. Local buckles tended
to straighten out under tensile load, but reformed when compressive load was again applied.
Tears developed in the steel during cycle 5 owing to the large local strain reversals associated
with this behavior. Both strength and stiffness rapidly deteriorated during subsequent cycles
(Fig. 3.2).
The hysteretic curves for Strut 2 during cycles 1 through 5 (Fig. 3.3) are generally similar
to those for Strut 1. Since the diameter-to-thickness ratio of Strut 2 was smaller and the cross
sectional area 44% greater, the tensile and compressive load capacities of Strut 2 were greater.
A slight ovaling of the cross-section at the midspan of Strut 2 occurred during the fourth cycle.
Local buckling developed in this region during the fifth cycle and tearing of the steel initiated
during the tension portion of cycle 8 (Fig. 3.4). As a consequence of the smaller diameter-to
thickness ratio of Strut 2, local buckling was delayed and the strength of Strut 2 deteriorated
less than the strength of Strut 1 during later cycles.
The axial load vs. midspan lateral deflection curves for Struts 1 and 2 are given in Figs
3.15 and 3.16. These indicate that the initial camber in the two pinned-end specimens existing
prior to cycle 1 was nearly eliminated by tension yielding during the first cycle of loading.
Strut 3 was identical to Strut 1, except that the former was not annealed. Because the
yield strength of the material in the unannealed tube was very high, this specimen did not
buckle in cycle 1 (Fig. 3.5). First buckling of Strut 3 occurred in cycle 2, and the maximum
12
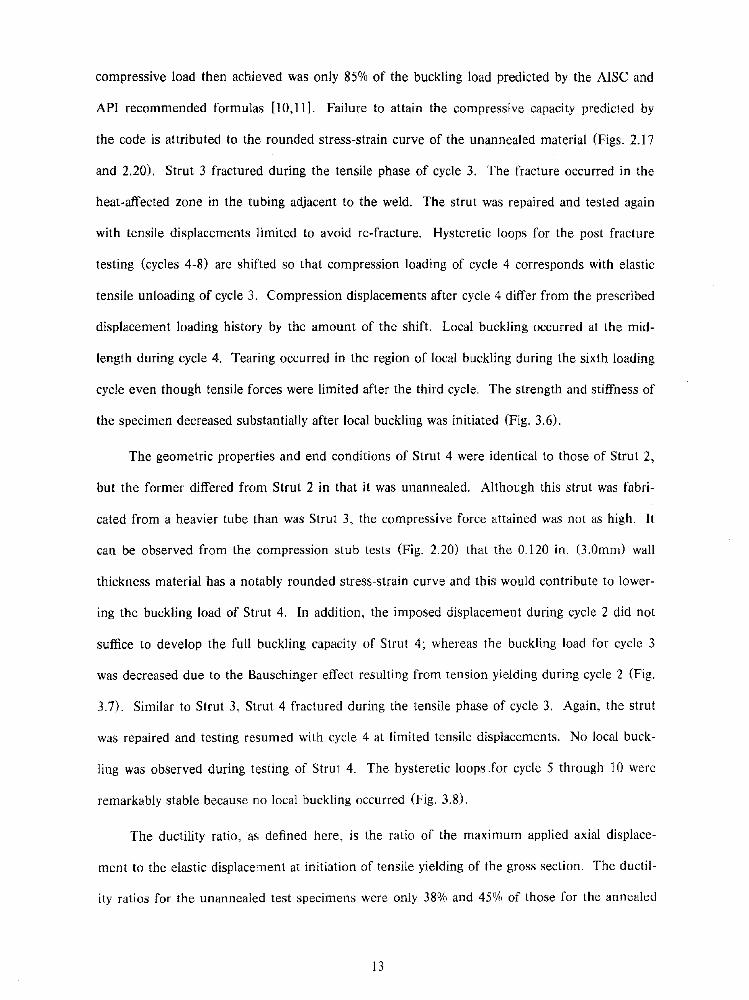
compressive load then achieved was only 85% of the buckling load predicted by the AISC and
API recommended formulas [10, Ill. Failure to attain the compressive capacity predicted by
the code is attributed to the rounded stress-strain curve of the unannealed material (Figs. 2.17
and 2.20). Strut 3 fractured during the tensile phase of cycle 3. The fracture occurred in the
heat-affected zone in the tubing adjacent to the weld. The strut was repaired and tested again
with tensile displacements limited to avoid re-fracture. Hysteretic loops for the post fracture
testing (cycles 4-8) are shifted so that compression loading of cycle 4 corresponds with elastic
tensile unloading of cycle 3. Compression displacements after cycle 4 differ from the prescribed
displacement loading history by the amount of the shift. Local buckling occurred at the mid
length during cycle 4. Tearing occurred in the region of local buckling during the sixth loading
cycle even though tensile forces were limited after the third cycle. The strength and stiffness of
the specimen decreased substantially after local buckling was initiated (Fig. 3.6).
The geometric properties and end conditions of Strut 4 were identical to those of Strut 2,
but the former differed from Strut 2 in that it was unannealed. Although this strut was fabri
cated from a heavier tube than was Strut 3, the compressive force attained was not as high. It
can be observed from the compression stub tests (Fig. 2.20) that the 0.120 in. (3.0mm) wall
thickness material has a notably rounded stress-strain curve and this would contribute to lower
ing the buckling load of Strut 4. In addition, the imposed displacement during cycle 2 did not
suffice to develop the full buckling capacity of Strut 4; whereas the buckling load for cycle 3
was decreased due to the Bauschinger effect resulting from tension yielding during cycle 2 (Fig.
3.7). Similar to Strut 3, Strut 4 fractured during the tensile phase of cycle 3. Again, the strut
was repaired and testing resumed with cycle 4 at limited tensile displacements. No local buck
ling was observed during testing of Strut 4. The hysteretic loops Jor cycle 5 through 10 were
remarkably stable because no local buckling occurred (Fig. 3.8).
The ductility ratio, as defined here, is the ratio of the maximum applied axial displace
ment to the elastic displacement at initiation of tensile yielding of the gross section. The ductil
ity ratios for the unannealed test specimens were only 38% and 45% of those for the annealed
13

specimens. Thus, the inelastic deformations of the unannealed specimens were less severe.
Moreover, tensile forces in Struts 3 and 4 were limited to avoid fracture at the welds. Because
of the reduced inelastic tensile stretching, the lateral displacement and inelastic rotation at the
midspan were less severe for the unannealed specimens. Local buckling of these struts was
delayed because of the lesser inelastic straining and therefore the deterioration of strength
differed from that of the annealed specimens.
Strut 5 was similar to Strut 1 except that its ends were fixed. The maximum compressive
load carried by this specimen, which occurred during load cycle 3, was within 2% of the value
predicted using the AISC formulas (Fig. 3.9). The deterioration of the buckling load and the
loss of energy dissipation capacities during subsequent loading cycles (Figs. 3.10 and 3.11) was
not as severe as exhibited by Strut 1. Local buckling was observed during cycle 5, first at the
foot and then at the midspan of the specimen. With additional cycling, the center hinge
deteriorated more quickly than that at the foot and eventually tore open in tension.
A pictorial history of the local buckling phenomenon is presented in Figs. 3.21 through
3.25 for Strut 5 as an example of the general local buckling behavior exhibited by all of the
struts. The overall buckled strut, depicted in Fig. 3.21, shows concentrations of rotations at the
locally buckled regions. Figures 3.22 through 3.25 show the evolution of local buckling,
straightening after tension, and eventual tearing in tension for the center and foot sections.
The maximum compressive load developed by the other fixed-end specimen, Strut 6, was
within 1% of the value predicted using the AISC formulas. When this compressive load was
reached during cycle 3, noticeable lateral buckling occurred, accompanied by a sudden loss of
about 5 kips (22.4 kN) (Fig. 3.12). Thereafter, the strength of the specimen deteriorated little
during cycles 4 through 10. During cycle 10, the specimen buckled locally at three locations:
first at the midspan, then at the head end, and finally at the foot. Continued loading through
cycle 16 resulted in deterioration of the compressive strength (Figs. 3.13 and 3.14).
The hysteretic curves for the fixed-end specimens differ considerably from those obtained
for the pinned-end specimens. The difference can be primarily attributed to the lower
14
slenderness ratio [8]. Both fixed-end specimens show larger enclosed areas and better energy
dissipation characteristics for the hysteretic curves as compared to those of the pinned-end
specimens. Post-buckling strength of the fixed-end specimens deteriorated less and the initial
stiffness for loading in tension were significantly higher.
The axial load vs. midspan lateral deflection curves for Struts 5 and 6 are given in Figs.
3.19 and 3.20. These midspan lateral deflections were about one-fifth of the values correspond
ing to pinned-end specimens (Figs. 3.15 and 3.16) with the same axial displacement. These
smaller lateral deflections, and, hence, smaller plastic hinge rotations, helped delay local buck
ling and maintain the strength of the fixed-end specimens during inelastic cycling. The
reported midspan lateral deflection for the fixed-end struts are displacement in the horizontal
plane. A vertical component of midspan lateral deflection also existed which measured approxi
mately 25% and 15% of the horizontal components for Struts 5 and 6, respectively. The magni
tude of vectorial sum of both components is approximated 3% and 1% higher than the magni
tude of the horizontal component alone for Struts 5 and 6, respectively.
Normalized Load vs. Axial Displacement
To clarify the differences in behavior of the six specimens the load vs. axial displacement
plots for cycles 1 through 5 have been normalized by dividing the load and displacement, by Py
and By, respectively. These plots, shown in Figs. 3.26-3.28 emphasize the lower displacement
ductility levels of the loading histories for the unannealed struts. The unannealed struts exhi
bited brittle behavior and could not sustain cycling at large tensile ductility levels. The reduced
compressive ductility levels for the unannealed struts are a consequence of the higher yield dis
placements (By) The applied compressive displacements were approximately equal for all struts.
15

Deterioration of Buckling Loads
The difference in cyclic performance between struts is in part exemplified by the
deterioration of buckling loads. The cyclic buckling loads have been listed in Table 3.1 and are
graphically presented in normalized form in Fig. 3.29. This figure illustrates the superior per
formance of the fixed-end struts over the pinned-end struts. Moreover, for each of three strut
pairs with D/t of 48 and 33, (pinned annealed, pinned unannealed, fixed annealed), the figure
shows that the struts with D/t=33 clearly outperformed the struts with D/t=48 in percentage
retainment of their original buckling load.
Deflected Shapes
The deflected shapes obtained from the photogrammetric data for the six struts are plotted
in Figs. 3.30 through 3.37. The deflections are deviations from the initial position at the begin
ning of a test. The lateral deflections have been exaggerated to emphasize the shape.
The buckled shape of Strut I during cycles I and 2 (Fig. 3.30a and b) was sinusoidal.
During the compression stage of cycle 3, curvature concentrated within the center plastic region
(Fig. 3.30c). The deflected shape that remained after unloading in compression is shown in
Fig. 3.30d. The residual curvature that remained in the center region and the reverse curvature
adjacent thereto that developed while the specimen was loaded in tension is illustrated by Fig.
3.30e. During cycles 4, 5, and 6, the buckled shape of Strut I deteriorated due to local buck
ling and residual curvature (Figs. 3.30f, g, h).
It was stated earlier that initial cambers were essentially removed by yielding in tension.
The small negative deflections seen in Fig. 3.3la for Strut 2, cycle 2, at load point A are due to
the removal of initial camber eccentricities by yielding in tension during the first loading cycle.
Although the deflected shape of Strut 2 during cycle 2 at load point C (Fig. 3.31 b) is
asymmetric, it gradually became symmetrical during cycles 3 and 4 (Figs. 3.31d and e). Resi
dual curvature and deflection were evident by cycle 5 at point A (Fig. 3.310. The deflected
shape of the specimen gradually became irregular during cycles 5 through 8 (Figs.3.3lg and h).
16

The deflected shapes of the unannealed struts (Figs. 3.32 and 3.33) did not show a discer
nible central plastic region in the early cycles. The deflected shape of Strut 3 was sinusoidal
until local buckling began (cycle 4), subsequently the curvature concentrated in the central
region (Fig. 3.33). The sinusoidal deflected shape of Strut 4 (Fig. 3.32) was remarkably regu
lar throughout the test since no local buckling occurred.
The deflected shapes for the fixed-end Struts 5 and 6 are presented in Fig. 3.34 and 3.35.
Strut 5 had a asymmetric buckled shape (Fig. 3.34) with maximum deflections occurring off
center, closer to the foot end. Consequently, less inelastic rotations resulted at the head plastic
hinge and thus, this hinge did not develop local buckling. Strut 6 illustrates a classic fixed-fixed
buckled shape (Fig. 3.35). There was little deterioration in the shape through the first nine
cycles, since local buckling did not occur until cycle 10. For both fixed-end struts plastic rota
tions can be noted at the ends of the members. These are plastic rotations occurring within the
member tubing. As mentioned previously, full fixity of the end plates was verified through
photogrammetric techniques.
The deflected shapes of individual specimens are compared in Fig. 3.36. The comparison
illustrates the following points:
a) For the same cycle and axial displacement, the deflected shape of the pinned-end,
thinner strut (D/t=48) shows a more irregular shape and greater concentrations of
plastic rotations than that of the thicker strut (D/t=33) (Fig. 3.36a).
b) The lateral deflection of the pinned-end specimen, Strut 2, was considerably greater
than that of the corresponding fixed-end specimen, Strut 6, at the same axial dis
placement (Fig. 3.36b).
c) For the same cycle and compressive axial displacement, the lateral displacements of
the unannealed specimen, Strut 4, was 30% of that for the similar annealed speci
men, Strut 2 {Fig. 3.36c).This is due to the lesser tensile stretching in the unan
nealed specimens.
17

d) The difference between the tensile stretching of the annealed and unannealed struts
can be accounted for by considering the total travel of compressive axial displace
ment from load point A to load point C. When plotted for equal amounts of total
compressive travel, the lateral deflections are approximately the same for both speci
mens (Fig. 3.36d).
Further comparisons for deterioration in deflected shape are illustrated in Fig. 3.37. To
facilitate comparisons of changes in shape, the lateral displacements have been normalized by
the maximum lateral displacement in each cycle. The normalized deflected shapes for four of
the struts, plotted for cycles 3 and 6, emphasize the change in shape that occurred during those
three cycles of loading.
Energy Dissipation
Energy dissipation is an important response parameter for inelastic cyclic loading. The
energy dissipated during all loading cycles was measured for each of the six test struts from
their axial load vs. axial displacement plots; these values are listed in Table 3.3. The energy
dissipated during each loading cycle Ei was normalized by dividing it by the energy dissipation
of a nonbuckling, rigid-perfectly plastic element, RPi, with the same yield load (Py) and cycled
through the same displacements (See Fig. 3.38 insert). For purposes of this discussion, Ej/RPi'
is defined to be the energy dissipation efficiency of a test strut. Displacements and yield loads
as parameters are thus de-emphasized, which facilitates comparisons of energy dissipation
between struts with different displacement histories or yield loads. Moreover, the energy dissi
pation of the rigid-perfectly plastic element represents the hypothetical maximum value for a
strut subjected to the same axial displacements. Thus, energy dissipation efficiencies are a
means of quantifying the deterioration of the capacity of a strut to dissipate energy with cycles.
The energy dissipation efficiency in each cycle (E/RPi) for the six test struts are listed in Table
3.3 as well as plotted in Fig. 3.38.
18

To facilitate comparisons of the energy dissipations, the cumulative sum of cycle dissipa
tion efficiencies vs. cycle number are plotted in Fig. 3.39. Since the energy dissipation
efficiency of a rigid-perfectly plastic strut is equal to unity in each cycle, the cumulative dissipa
tion efficiency is equal to the cycle number. In this way, the ordinate divided by the abscissa of
Fig. 3.39 represents the energy dissipation efficiency of the test struts cumulative over all
preceding cycles. The energy dissipation of the rigid-perfectly plastic element represents 100%
efficiency. The cumulative cycle dissipation efficiencies of an ideal elastic-perfectly plastic non
buckling element were also calculated and plotted in Fig. 3.39.
The elastic-perfectly plastic element is useful for comparison. However, observe that dur
ing early cycles of loading the test struts can dissipate more energy than the ideal elastic
perfectly plastic element. For instance, prior to reaching the axial yield load the ideal elastic
perfectly plastic nonbuckling element dissipates no energy. On the other hand, the test struts
may dissipate energy because of some inelastic material response or buckling.
The responses of the test struts with respect to efficiency of energy dissipation can be
grouped into three strut pairs with O/t of 48 and 33: pinned-unannealed, pinned-annealed,
and fixed-annealed (Fig.3.39). The response of each pair of specimens is similar until the later
loading cycles, at which time the specimens with a 0/t=48 prove less efficient. The cumula
tive efficiency (ordinate divided by abscissa) of Struts 3 and 4 (pinned-unannealed specimens)
were the poorest, less than 22%. The cumulative efficiency of Struts 1 and 2 (pinned annealed
specimens) in cycle 3 was approximately 47% and 49%, respectively, and decreased to 31 % and
36% by cycle 7. The cumulative efficiency of Struts 5 and 6 (fixed-end specimens) was 37%
and 41% during cycle 3 and increased to 47% by cycle 7. The cumulative efficiency of the ideal
elastic-plastic element was 53% in cycle 3 and 70% in cycle 7.
The best energy dissipation of all test specimens was shown by Strut 6. The superior per
formance of this strut is attributable to its fixed-ends and its lower O/t ratio. After nine cycles
of loading, the dissipation efficiency of Strut 6 was 65% of the efficiency of the ideal eJastic
plastic element.
19

The quantification of the efficiency of a brace element in dissipating energy allows com
parisons on the effectiveness of a braced frame to dissipate energy. As illustrated in Fig.3.38, a
properly detailed brace can absorb a significant amount of energy, although generally not as
efficiently as an ideal elastic-perfectly plastic element. A properly detailed beam in a moment
resisting frame can at best be expected to behave as an elastic-perfectly plastic element. How
ever, considering a braced frame and a moment resisting frame of similar geometry, and
designed for similar lateral loads, the braced frame will have the advantage of dissipating energy
at considerably lower values of frame lateral displacements.
20

CHAPTER 4
INELASTIC BEHAVIOR AT PLASTIC HINGES - ANNEALED STRUTS
For general structural design and analysis purposes, the overall behavior of the struts
described in Chapter 3 is of primary importance. Many of the aspects of this overall behavior
can be explained through study of the plastic hinge regions. In this chapter, data reduced from
the SR-4 strain gage readings will be examined and interpreted in an effort to gain insight into
variations in strain histories and local buckling phenomena.
Plots of several example strain gage readings are included in Appendix A (Figs. A.l
through A.22). Strain gage data have been reduced in a variety of ways in order to emphasize
certain aspects of response. The strains at a cross-section, for example, are reduced to cen
troidal axial strains, cross sectional curvatures and subsequently to rotations over a length. All
data reduced from strain gage readings are reported only up to the point where local buckling is
detected. After local buckling has occurred, the strain gage readings near the section of local
buckling can neither be related to the centroidal axial strains nor to the cross-sectional curva
tures. A knowledge of the inelastic strain history is important, because the material properties
of a strut and the development of local buckles are affected by the history of inelastic straining.
Local buckling is an extremely complex phenomenon. Data from tests on six strut speci
mens hardly suffices as the basis from which the local buckling problem can be conclusively
resolved. In this report, parameters thought to be of importance in the evolution of local buck
ling are analyzed. The underlying purpose is to present empirical data by which local buckling
can be estimated and, if possible, can later be incorporated into an analytical model of brace
behavior.
21

Basic Considerations of Brace Inelastic Buckling
The inelastic buckling of a strut results in the development of plastic hinges; that is,
regions where inelastic curvatures occur. The number of plastic hinges that will form in a given
strut is determined by the number of hinges required to form the collapse mechanism for that
strut. Thus, one plastic hinge forms in a pinned-end strut and three such hinges in a fixed-end
strut (Fig. 4.1). For purposes of these discussions, the center plastic hinge will be assumed to
consist of two equivalent plastic regions which extend from the section at which the inelastic
curvature is greatest to the sections where inelastic curvatures vanish. Using this definition, a
pinned-end strut may be said to have two equivalent plastic regions at the center (Fig. 4.1 a). At
the ends of a fixed-end strut, plastic regions are defined to extend from the specimen end plates
to those sections where inelastic curvatures have reduced to zero, and as for a pinned-end strut,
two more plastic regions can be identified at the center. On this basis a fixed-end strut may be
said to have four equivalent plastic regions (Fig. 4.1 b).
The static relationships between the axial force P, the fully plastic moment capacity Mp ,
and the midspan lateral deflection a for the ideal pinned-end and fixed-end struts are given in
Fig. 4.1. The plastic moment capacity Mp varies with the axial force P as given by the interac
tion curves shown in Fig. 4.2.
The superior axial load vs. axial displacement performance of the fixed-end struts com
pared to the pinned-end struts, noted in Chapter 3, can be explained with the aid of Figs. 4.1
and 4.2. According to the static equilibrium relationships, the PIMp ratio of a fixed-end strut is
double the PIMp ratio of a pinned-end strut, at equal midspan lateral deflections. For the same
size members with equal lateral displacement, the axial load capacity for a fixed-end strut is
larger than the axial load which can be carried by the pinned-end strut, but it is less than twice
as large because of the axial load-moment interaction (Fig. 4.2). The larger axial loads in the
fixed-end strut will cause an increase in the amount of compressive centroidal axial straining.
Increased compressive axial straining will result in a shorter centroidal axis length. If equal
compressive axial displacements are applied to both types of struts, the shorter centroidal axis
22

length of the fixed-end strut will result in lesser magnitudes of midspan lateral deflection for
this strut. Also, the reverse direction of curvature from the points of inflection to the ends of
the fixed-end strut, compared to the center portion of the strut (Fig. 4.1), will contribute to
lesser magnitudes of midspan lateral deflection. Consequently, the lesser midspan lateral
deflections that result when equal axial displacements are applied will further increase the axial
load capacity of the fixed-end strut relative to the pinned-end struct according to the static rela
tionship. In agreement with these considerations, the experimentally observed midspan lateral
deflections of the fixed-end struts (reported in Chapter 3) were approximately one-fifth of the
magnitudes corresponding to pinned-end struts with the same axial displacements. Moreover,
the load carried by the fixed-end struts was larger as evidenced by the shape of the hysteretic
loops.
Curvature in Plastic Hinge Regions
Curvatures at a cross-section were calculated from the strain gage readings, by dividing
the difference of two strain gage readings by the distance between the gages. Plots of curva
tures at a section are included in Appendix A, Figs. A.23 through A.59.
Strain readings were observed to differ up to 0.002 inlin. from an assumption of linear
strains within a cross-section. The variations from linear straining were investigated and attri
buted to local bending within the wall of the tube. The variations due to local bending should
not exist at the mid-thickness of the tube wall. For the gross behavior of a cross-section the
assumption of plane sections remaining plane appears to be valid.
The strain gages were externally mounted on the tubes (Fig. 2.2). It was found that for
curvatures computed from two diametrically opposed strain gages the variations due to local
bending would cancel. Centroidal axial strains computed from two strain gages could include
variations up to 0.002 in.lin. due to local bending effects. For centroidal axial strains computed
from four strain gages the variations due to local bending would cancel.
23

Once a strut buckled, lateral buckling in subsequent cycles always occurred in the same
direction. Curvatures as reported in this discussion are established as positive for the directions
that result when a strut is in the primary buckled deflected shape. The lengtbs of plastic
regions for each cycle are measured as the regions where positive inelastic curvatures develop at
maximum compressive displacement. Curvatures for Strut 1 within the center plastic regions
are plotted in Figs. 4.3 and 4.4 at the load points that correspond to maximum compressive and
maximum tensile displacements, respectively. (For definition of load points see Fig. 2.l5a).
Similar plots for Strut 2 are shown in Figs. 4.5 and 4.6. Note, that these two struts differed
only in their wall thickness. The plastic hinge in Strut 1 extended beyond the strain-gaged
region and permitted data reduction for only one of the center plastic regions. The center of
the plastic hinge was chosen as the section with maximum curvature during cycle 1. The
reported data for Strut 2 are based on an average of both center plastic regions.
The following points can be summarized from the curvature plots for Struts 1 and 2:
1) Local buckling occurred at or adjacent to sections of maximum curvature.
2) Plastic hinges in Strut 2 (D/t=33) were approximately 36% shorter than those for
Strut 1 (D/t=48).
3) The magnitude of curvature within individual cycles was larger for Strut 2 than for
Strut 1.
4) Maximum curvatures at the onset of local buckling were 61% smaller for Strut 1
than for Strut 2.
5) The residual curvatures at maximum tensile displacement were larger for Strut 2
than for Strut 1.
Curvatures for Strut 5 are plotted in Figs. 4.7 and 4.8 for the foot plastic hinge region.
Similar plots for Strut 6 are shown in Figs. 4.9 and 4.10. Curvatures at load points for max
imum compressive and tensile displacements are plotted for each cycle up to the load point of
local buckling. Foot hinge curvature results for Struts 5 and 6 can be summarized as follows:
24

1) Increased inelastic rotations are realized through a growth of plastic hinge length
rather than from greater curvature magnitudes.
2) Strut 6 (0/t=33) sustained maximum curvature excursions three times greater than
did Strut 5 (0/t=48) prior to local buckling.
3) For the first three loading cycles, Strut 5 did not buckle laterally, but did yield axi
ally. Curvatures recorded for these cycles were apparently caused by adjusting to a
difference in angle between the strut and the end plate. No such curvatures were
observed in Strut 6.
For ideal symmetrically buckled struts with constant plastic moment capacity M p , the
moment gradient of a fixed-end strut is double that of a pinned-end strut of the same length.
The higher moment gradient should result in shorter plastic hinges for the idealized fixed-end
strut. However, the length of the plastic hinges of the test fixed-end struts were as long as the
plastic hinges of the pinned-end struts. (Tables 4.1 through 4.4). This can be attributed to
axial load-moment interaction. The higher axial loads in the fixed-end struts cause a reduction
in the plastic moment Mp capacity. A reduction in plastic moment will cause a reduction in the
moment gradient. Thus, a fixed-end strut could have equal or even smaller moment gradients
than a similar pinned-end strut. The length of the plastic hinge that will develop in either strut
will depend both on the moment gradient and the moment difference between the fully plastic
and first yield interaction curves (Fig. 4.2).
Detailed strain data were obtained only at the foot hinges for Struts 5 and 6. For ideal
symmetrically buckled fixed-end struts, the head and both center plastic regions should have
the same distribution of curvature as the foot plastic region. The test specimen were, of
course, not perfectly uniform and symmetric; initial imperfections, asymmetric buckling, slight
differences in end restraints, and welding effects contribute to differences in the distribution of
curvature. Although the distribution of curvature at the head, foot, and both center regions are
not precisely the same, the general characteristics of the different plastic regions should be simi
lar.
25

Inelastic Rotations
Plastic hinge rotations were estimated from cross-section curvatures. The inelastic rota
tions were obtained by integrating the cross-section curvatures (Fig. 4.3 through 4.10) over the
lengths of the plastic regions. Rotations for maximum displacement load points C and E are
listed in Tables 4.1 through 4.4. Rotations calculated at load points C and E include small elas
tic rotations on the order of 0.003 rad./in. (0.118 rad/m.) as well as the inelastic rotations. The
magnitude of the elastic rotations is less than the accuracy of calculations (±0.005 rad.), thus
the inelastic rotations were taken equal to the total rotation.
The relation between inelastic rotation and maximum curvature is important in estimating
curvature when only rotation is known. The magnitude of rotation for maximum displacement
load points have been plotted against the maximum curvature within the plastic hinge (Fig.
4.1 1). Data from maximum tension and maximum compression load points have been
included in the same figure. While an accurate empirical relation cannot be developed from
these data, the plots serve to represent the rotation-curvature relation qualitatively.
The inelastic rotation excursion during a loading cycle is the difference between inelastic
rotations at load points C and E. Cumulative inelastic rotation is the sum of the absolute value
of the inelastic rotation excursions for both compressive and tensile loadings. The cumulative
rotation is a measure of the total flexural deformations at the plastic hinge. Cumulative inelas
tic rotations are also listed in Tables 4.1 and 4.4. Significance of these calculations may be sum
marized as follows:
1) Larger cumulative inelastic rotations occurred prior to local buckling for the plastic
regions of struts with a D/t=33 than for those of struts with a D/t=48.
2) Almost twice as much (190%) inelastic rotation was accumulated at the foot region
of fixed-end Strut 6 (D/t=33) than at the center region of pinned-end Strut 2
(D/t=33) before local buckling occurred.
26

3) At the foot region of fixed-end Strut 5 (D/t=48) the accumulated inelastic rotation
was 0.55 times that which occurred at the center hinge of pinned-end Strut 1
(D/t=48). This is an opposite trend to that in Struts 6 and 2, although in both
fixed-end struts local buckling occurs at a later cycle.
In summary, the cumulative inelastic rotations alone do not show a direct relation to the
occurrence of local buckling. One must conclude that other factors, such as curvatures and
strains, could be important parameters affecting the development of local buckling. These
parameters will be quantitatively examined in the following section.
Cumulative Curvature arud Centroidal Axial Strain
Cumulative inelastic curvature is defined as the sum of the absolute value of inelastic cur
vature excursions for both compressive and tensile loading. Cumulative inelastic centroidal
axial strain is defined in an analogous manner.
Centroidal axial strain and cross sectional curvature completely define the strain distribu
tion at a cross-section if it is assumed that plane sections remain plane. Accordingly, cumula
tive inelastic centroidal axial strain and cumulative inelastic curvature are a measure of the ine
lastic history for the entire cross-section. The material properties of the strut are affected by
inelastic straining and the inelastic strain history is important in the development of local buck
les.
Inelastic curvature excursions and inelastic centroidal axial strain excursions have been
summed from the initial load points up to the first occurrence of local buckling. Cumulative
inelastic curvatures within plastic hinges are plotted in Figs. 4.12 to 4.15. The cumulative ine
lastic centroidal axial strains along the lengths of the struts are plotted in Figs. 4.16 to 4.19.
The following observations can be made from these figures:
27
1) The axial strain along the struts was highly nonuniform; almost all inelastic axial
strain occurred in the plastic hinge regions.
2) In Struts 1 and 2 the section of maximum cumulative curvature at the center hinges
occurred near the centerline of the strut for all cycles, but varied Slightly in its loca
tion for different cycles. In Struts 5 and 6 for all cycles the cumulative curvature at
the foot hinges occurred at a section nearest to the end plate.
3) The section of maximum cumulative axial strain occurred at the same section as the
maximum cumulative curvature for 96% of the load points plotted.
4) Local buckling occurred at the section where cumulative curvature was the max
imum at some time during the loading history.
5) Inelastic curvatures can occur in early cycles near the end plates to accommodate
any slight initial difference in angle between the strut and the end plate. Such ine
lastic curvature may also induce axial straining of the strut centroidal axis near the
end plates. During early loading cycles, such curvatures and axial strains were noted
in Strut 5.
The similar pattern in the cumulative axial strain and curvature graphs can be explained
from considerations of static equilibrium. The greater the inelastic curvature, the smaller is the
available effective area for resisting applied axial load. Since the axial load is equal along the
strut length, at the sections where the curvature is highest a greater axial strain must take place.
Hence, the cumulative axial strain gives an indication of the extent of inelastic curvature that
has occurred at a section. The relationship between axial load capacity and moment capacity at
a cross-section was noted previously in the section on basic considerations.
Occurrence of Local Buckling
API Recommendations state that braces with a diameter-to-wall thickness ratio of less
than 1300/F, are fully compact sections capable of developing their full plastic capacity through
large inelastic deformations [11]. Struts 2 and 6, with a D/t ratio of 33, are compact section
28

under this definition, but during severe cyclic loading developed local buckling and lost capa
city. Criteria based on monotonic loading are not sufficient to preclude such local buckling of
braces under severe cyclic loading. According to API Recommendations, Struts 1 and 5, with a
O/t ratio of 48 should be capable of developing their full plastic load capacity, but only through
limited plastic rotations. These struts with a O/t of 48 did buckle locally before the similar
struts with O/t of 33. All of the annealed struts were able to develop their full plastic load
capacity prior to local buckling.
A summary of several parameters measured at the first occurrence of local buckling is
presented in Table 4.5. Cumulative inelastic curvature, axial strain, and compressive fiber
strain are reported for the four annealed struts at the section of local buckling. The location of
the compressive fiber is taken as the point where local buckling developed; the strain history for
this fiber is more severe than for any other fiber in the cross-section. Cumulative inelastic
strain and curvature are important parameters of strain history, but do not completely define it.
The magnitude of inelastic curvature excursions is also important. The maximum curvature
excursion is included in the table. The physical ramifications of this parameter imply that a
strut will respond differently to a few large cycles than it will to many small cycles, even if the
total cumulative inelastic deformation is the same. Also included in Table 4.5 are the strut
loads at the onset of local buckling and the cumulative energy dissipation. Conclusions which
can be reached from this table of strut parameters measured at the onset of local buckling are
as follows:
1) The struts with O/t of 48 buckled locally at approximately half the cumulative ine
lastic axial strain and compressive fiber strain compared to the struts with a O/t of
33.
2) Larger maximum curvature excursions result in lesser cumulative inelastic strains at
local buckling.
29

3) The fixed-end Struts 5 and 6 accumulated 112% and 170% more axial strain, respec
tively, than the corresponding pinned-end Struts 1 and 2.
4) The fixed-end Struts 5 and 6 dissipated 206% and 293% more energy, respectively,
than the corresponding pinned-end Struts 1 and 2. That the fixed-end struts dissi
pate more energy than the pinned-end struts could be expected from the fact that
they have 4 equivalent plastic regions versus 2 such plastic regions for the pinned
end struts. When only one-half of the total energy dissipation for the fixed-end
struts is considered, Struts 5 and 6 still dissipated 53% and 96% more energy than
the corresponding pinned-end Struts 1 and 2.
5) Struts 2 and 6 with O/t ratios of 33 dissipated 215% and 304% more energy, respec
tively, than the corresponding Struts 1 and 5 with O/t ratios of 48. Higher energy
dissipations are to be expected because of the higher yield loads. If the energy dissi
pations are divided by the yield load, thus removing yield load as a parameter, Struts
2 and 6 (0/t=33) still dissipated 119% and 183% more energy than Struts 1 and 5
(0/t=48).
From the information in the table it can be concluded that cumulative strain, cumulative
curvature, maximum curvature excursions, and energy dissipation are important in local buck
ling. These parameters could be used to estimate the onset of local buckling in braces of simi
lar cross-sections. However, not enough cases have been tested to adequately develop an
empirical relationship between local buckling and the parameters examined.
Once local buckling does occur, the deterioration of the brace capacity is controlled by the
local buckled region. Inelastic rotations after local buckling cause further deterioration in the
strength of the locally buckled section thereby reducing the strut capacity. Cumulative inelastic
rotations after local buckling were calculated from photogrammetric data. An empirical rela
tionship between compressive capacity and cumulative inelastic rotation for pinned-end struts is
indicated in Fig. 4.20. Such empirical relations can be used to model the strut capacities after
local buckling. The cumulative brace energy dissipations (Table 3.3) could also serve as a
30

similar empirical parameter for local buckling. An analytical method of predicting compressive
cyclic capacity of struts before the onset of local buckling is presented in the next chapter.
31

CHAPTER 5
PREDICTION OF BUCKLING LOADS - ANNEALED STRUTS
It was observed in the experiments that the buckling load capacity of a column
deteriorates with each successive inelastic load cycle. While design code formulas prediet the
first buckling loads of columns, an alternative formulation is required to predict the reduced
buckling loads of columns or braces which have experienced previous inelastic straining.
The basic theory for predicting the first inelastic buckling loads of a column may be
credited to Engesser who first proposed a solution to this problem in 1889 [17]. Current design
code formulas employing similar methods have been verified by numerous experiments and can
be used with confidence to compute the initial buckling load of a column or brace. It must be
recognized, however, that the code formulas are for columns which have not been previously
yielded and with initial camber within the code allowances. A structure subjected to severe
earthquake, wind, or wave loadings, may develop yielding or buckling in the braces and
columns. The capacities of such structures could significantly reduce during and following such
loadings.
A large residual camber, resulting from a previous buckling excursion, is one reason to
expect a reduced buckling capacity in a subsequent buckling cycle. Not as apparent, but equally
important, is the fact that previous inelastic straining of a member will alter the mechanical pro
perties of the material thereby causing a reduction in the compressive load carrying capacity. A
column that has experienced only tensile yielding or a buckled column that has been re
straightened by tensile yielding will exhibit a reduced buckling load capacity as a result of these
changes. The extent of the changes depends on the inelastic strain history to which the column
has been subjected. The changes in the material stress-strain relationship due to previous ine
lastic strains and strain reversals, commonly referred to as the Bauschinger effect, must be
accounted for in calculating the cyclic buckling capacity of columns. Development of cyclic
constitutive material property models for predicting changes in the material properties is a sub
ject of current active research I161.
32

The prediction of buckling loads specified by the AISC has its theoretical basis in the
tangent modulus concept. According to this approach [l7] a column of homogeneous material
exhibiting nonlinear stress-strain properties will experience bifurcation of the equilibrium state
when the average axial stress, P/ A, is equal to:
p rr 2 E,er('l = A = (kL/r)2 (S.l)
Where E" the tangent modulus, is the slope der/ de of the stress-strain curve at the stress er ('I'
In the elastic range of material behavior this equation results in the Euler column load.
The AISC provisions for columns are given by two formulas [lO].
F = 12 rr2E . f /or kL r ~ C"
a 23 (kL/r)2'(S.2a)
where
[1 _ (kL/ r )2]F'
2C} J
Fa = -------''-------=-------:-1 + ~ (kL/r) _1 (kL/r)3 '3 8 C" 8 C}
for kL/r < Cc (S,2b)
d[l + ~ (kL/r)
an 3 8 Cc
1 (kL / r ) 3]. . bl f f8 3' IS a vana e sa ety actor.C"
The first formula (Eq. S.2a) for columns with large slenderness ratios, is applicable in the
elastic range of material behavior; the other (Eq. S.2b), is a parabolic approximation for a solu-
tion based on a variable tangent modulus. This second formula is applicable to stockier
columns and is suitable for residual stress distributions and material stress-strain relationships
typical of steel column sections used in the building industry. When the residual stress distri-
bution or the material stress-strain properties differ from those assumed in AISC formulas, it is
more accurate to determine the true stress-strain properties and to use the tangent modulus
33

formula for predicting buckling loads. The stress-strain properties should realistically account
for the residual stresses. For a previously buckled or yielded column both the material proper
ties and the residual stress distribution differ from those assumed in the AISC formula. It will
be shown in the following section that a generalized tangent modulus approach can be
developed which will account for the degradation of compressive load capacity due to changes
in material properties of inelastically cycled columns, if a proper representation of the material
stress-strain relation is made.
A Generalized Tangent Modulus Procedure
The tangent modulus method assumes that the material of a column under consideration
is homogeneous. This assumption is not strictly true for an inelastically cycled column because
the inelastic strain history varies both within a cross-section and along the length of the
member and thus the material properties also vary. However, a critical section within the plas
tic hinge of the column can be chosen that has material properties which may be assumed to
control the buckling load. The deteriorating load capacity of a column can be reasonably well
estimated if the changing material properties that correspond to the critical section are taken
into account.
These changes in material properties are related to the Bauschinger effect. The Bausch
inger effect is an indication of the fact that the stress-strain curve becomes more rounded after
inelastic strain reversals (Fig. 2.2l). Within the rounded region, the tangent modulus of the
material at a given stress level is smaller when compared to that of the virgin material stress
strain curve. Since the critical buckling stress is, according to Eq. 5.1, directly proportional to
the tangent modulus (holding all other parameters constant), it too will decrease. Typically, the
more severe the inelastic straining to which a material has been subjected, the more rounded
the stress-strain curve will become, and a column of this material will buckle at lower axial
loads.
34

Once buckling occurs, the material properties of the plastic hinge would be expected to
control the buckling load since these sections experience the most severe strain histories.
Thus, the critical section would lie within the plastic hinge region. The critical section is
chosen as the one with the most severe centroidal axial strain history. A close relationship
between centroidal axial strain and cross-section curvature has been noted previously in Chapter
4.
Once the critical cross-section has been identified the most representative strain history
within the cross-section must be chosen. To do this it will be assumed that the amount of
Bauschinger effect that results in the material is related to the cumulative sum of the inelastic
strains. Consider, for example, the critical cross-section of Strut 2 (strain gages 9, 10, 11, and
12 - Figs. A.6 and A. 7). During the first four cycles gage 10 located at the extreme tensile fiber
accumulates 0.026 in./in. inelastic strain, and the extreme compressive fiber at gage 12 accumu
lates 0.112 in./in. inelastic strain. This strain pattern is similar to that for the plastic hinge
regions of the other struts tested -- that is, the compressive fibers experienced a more severe
strain history than the tensile fibers. Therefore, within the same member cross-section the
stress-strain curve for the compressive fiber would be more rounded than that for the tensile
fiber, and the compressive fiber would exhibit smal1er tangent moduli at equal stresses. The
centroidal fibers underwent an intermediate level of inelastic straining, 0.041 in./in. (average of
strain for gages 9 and 11).
Since the tangent modulus method considers only a single material relationship, the strain
history of the centroidal fiber (centroidal axial strain) is chosen to represent the material
behavior for the strut. The centroidal axial strain history represents an average of the material
properties for the critical cross-section. Moreover, for the purpose of applying the tangent
modulus theory of buckling, it is assumed in this treatment that the material properties at the
centroid of the critical section apply for the entire column.
The material properties used to determine the tangent modulus E, have been determined
from experimentally obtained stress-strain curves. The stress-strain curves from compression
35

tests on pipe stubs were used to predict the first buckling load of virgin struts. Stress-strain
curves from cyclic tests on short lengths of pipes were used to predict material properties and
buckling loads once the struts have undergone inelastic straining. Alternatively, the material
properties could be obtained by analytical means, if a comprehensive cyclic material constitutive
law with sufficient accuracy in predicting the first derivative is available.
Prediction of First Buckling Load
In Table 5.1, the first buckling loads as calculated by the tangent modulus method and by
AISC formulae are listed, along with the buckling loads observed during testing. The AISC
predicted loads do not include the customary safety factor, and Fr = 31 ksi was used as
obtained from the material tests on pipe stubs.
The tangent modulus predictions of the first buckling loads for the struts with no previous
inelastic straining are based on stress-strain curves from the compression tests of pipe stubs
(Fig. 2.19). These curves exhibit classic elastic-perfectly plastic behavior. This was also true
for the coupon tests (Fig. 2.16), and the first loading of the cyclic test (Fig. 2.2l)
As noted in Chapter 3, strut 1 experienced inelastic straining prior to cycle 1. The buck
ling load predicted for Strut 1 using the tangent modulus method (Table S.l) is based on the
stress-strain relationships for material with previous inelastic straining. The AISC formula,
which does not account for the effects of previous inelastic straining, predicted a higher load.
The method employed to estimate the reduction in buckling capacity because of changes in
material properties due to inelastic straining is discussed below.
Deterioration of Buckling Loads
As noted earlier, when inelastic strain reversals occur, a change in the stress-strain rela
tionship of the material results. Therefore, the first step in predicting the deterioration of buck·
ling loads under cyclic loading is to devise a means of determining the material properties as a
function of inelastic strain history.
36

A cyclic test on a short pipe specimen of annealed material provides the characteristic
stress-strain curves for inelasticity cycled material. However, since the strain history of each
individual strut was different from that of the cyclic material test, strut strain histories must
somehow be related to the cyclic material test. This was done by matching the amount of
cumulative inelastic straining.
The basic cyclic material test (Figs. 2.21 and 5. I) can be best utilized when considered as
three separate curves. The portion of the cyclic test identified in these figures as curve 1 is a
stress-strain curve for previously unyielded (virgin) material. Note, that the compression test
curve (Fig. 2.19) and the cyclic test curve 1 are essentially the same. Cyclic test curve 2 is a
stress-strain curve for a material which had a previous inelastic tensile strain excursion of
0.0056 in.lin.. Cyclic test curve 3 is a stress-strain curve for a material which had an inelastic
tensile strain excursion of 0.0056 in./in. and an inelastic compressive strain excursion of
0.0104in.lin. resulting in a previous cumulative inelastic strain of 0.0160 in.lin .. Each succes
sive curve corresponds to an increased cumulative inelastic strain (CIS) as well as to an increase
in the magnitude of strain excursion. In the experiments the struts were loaded such that the
maximum inelastic strain excursion in each successive cycle also increased. The increasing
magnitudes of strain excursions tend to accentuate the Bauschinger effect in each successive
cycle of either the strut loading, or material test.
The compression and cyclic test stress-strain relations for three different values of previ
ous cumulative inelastic strain are used to develop data for predicting cyclic buckling loads of
the struts. For this purpose, tangent moduli for the three available stress-strain curves are
determined and plotted versus the corresponding stresses (Fig. 5.2), and Eq. 5.1 is rearranged
to yield the critical slenderness ratio in terms of the corresponding stress and tangent modulus:
(5.3)
Using Eq. 5.3 and Fig.5.2 the column curves shown in Fig. 5.3 have been constructed. From
these curves three different values of critical stress, each corresponding to a different value of
37

cumulative inelastic strain, can be obtained for a given slenderness ratio kLir. In Figs. 5.4a and
5.4b the variation of the critical stress as predicted by the tangent modulus method is plotted
versus the cumulative inelastic strain for column slenderness ratios of 25 and 54, respectively.
The experimentally observed critical stresses for the struts with the same slenderness ratios are
also plotted in these figures.
Critical stresses for the struts for any given cycle of loading prior to local buckling are
estimated by entering Fig. 5.4 with the total inelastic strain accumulated during preceding
cycles. The predicted buckling loads are given in Table 5.2. The curves in Fig. 5.4 clearly show
that the critical stresses decrease with increasing cumulative inelastic strain. For the annealed
struts (Struts 1,2,5, and 6), the experimentally observed critical stresses are in reasonably good
agreement with the predicted values.
The experimental results clearly demonstrate that the compressive load capacity of struts
deteriorates with inelastic cycling. The conventional AISC formulas by which column buckling
loads are predicted do not account for this deterioration under inelastic cycling and therefore
should not be used to predict column response for such conditions. The cyclic buckling load of
struts determined using the generalized tangent modulus method were in good agreement with
experimental values. (Table 5.2).
Observations on predicting the buckling loads of struts subjected to inelastic cycling as
described in this report can be summarized as follows:
1) Accurate information on the material properties under inelastic cyclic loading is
essential.
2) The procedure described does not apply after local buckling occurs.
3) The tangent modulus concept assumes the material properties of the column are
homogeneous. The strain history used for determining the material properties is
taken from the section within the plastic hinge region that has undergone the most
severe straining.
38

4) The inelastic strain history that best represents the average material properties of the
critical cross-section is that of the centroidal fiber.
5) Inelastic axial strain is related to inelastic curvature at a section.
6) Inelastic axial strain varies considerably along the length of a column. The average
axial strain (total deformation divided by a total column length) is not sufficient to
define the material properties of the critical section.
The generalized tangent modulus procedure described above provides an estimate in the
reduction of the buckling capacity of a column due to changes in the material properties. The
buckling capacity of a column will also reduce due to a large residual camber. If there is a
significant residual camber after load applications a reduction in the buckling capacity for
camber must also be applied. The loading sequence of the experimental struts was such that
the residual cambers were relatively small in the early cycles. In each cycle, compressive loads
were followed by tension yielding excursions of sufficient magnitude to re-straighten the
member. The axial load vs. midspan lateral deflection plots are given in Figs. 3.15, 3.16, 3.19
and 3.20 for the annealed struts.
For cycles in which buckling load predictions were made, Struts 1 and 6 actually had less
residual camber in later cycles than they did prior to cycle 1. Struts 2 and 5 had maximum resi
dual cambers of 0.20 in. (5 mm) and 0.05 in. (l mm), respectively, for cycles in which buck
ling predictions were made. These residual cambers were considered small and a camber reduc
tion factor to the estimated buckling load was not applied. A method for estimating the reduc
tion factor for residual camber is given in Ref. 9.
The generalized tangent modulus procedure for estimating reductions in the buckling
capacity of columns due to changes in material properties is applicable up to the point of local
buckling. Since local buckling is a major concern in thin-walled pipes, the predictions of cyclic
buckling loads for the test struts had this limitation.
39

CHAPTER 6
INELASTIC BEHAVIOR OF THE UNANNEALED STRUTS
The inelastic behavior of the unannealed struts is sufficiently different from that of the
annealed ones to be treated separately. The mechanical properties of the unannealed material
significantly differed from those for the annealed material as is evident from the coupon tests
(Fig. 2.18). These material properties also differ significantly from those found in members
used in the building and offshore industries. Therefore, the behavior of these unannealed
struts is of limited interest and a detailed study of their inelastic behavior was not pursued.
Characteristics of the Material Properties
The Drawn-aver-Mandril process utilized in manufacturing the pipes used in the experi
ments imparts a high degree of work hardening into the steel. Some of the struts 0, 2, 5, and
6) were annealed to relieve this work hardening so that their material properties more closely
represent those of full scale structural members used in construction. The as received struts (3
and 4) were tested to evaluate the necessity of annealing the test specimens to be representa
tive of the behavior of large pipes. The structural inelastic responses of the unannealed struts
were found to be significantly different from those of the annealed struts (Figs. 3.26 and 3.27).
Using a 0.2% offset strain, the coupon tests of the unannealed material indicate (J'y was 92
ksi (635 MPa) for the 0.083 in. (2.1 mm) wall thickness, and 74 ksi (511 MPa) for the 0.0120
in. (3.0 mm) wall thickness. These are 197% and 139% higher than the yield strengths of the
annealed material.
Stress-strain curves for unannealed material coupons, cyclic stub specimens, and compres
sion stub tests are shown in Figs. 6.1 and 6.2. Because of the high degree of work hardening
already existing in the steel, the stress-strain curves differ with each pipe sample, type of test
employed and the direction of loading. For example, at a strain of 0.006 in.lin. on the thinner
walled pipe (Fig. 6.1) stresses from different tests range from 71 ksi (490 MPa) to 94 ksi (649
MPa). Therefore, a large scatter exists in the material stress-strain curves, both in stress and in
40

tangent modulus Et at any given strain level.
Prediction of Buckling Loads
As discussed in the previous chapter, estimations of the deterioration oT buckling loads
under cyclic loading depends on the ability to determine changes in material properties. For the
unannealed struts the increase in inelastic strain due to the applied cyclic strains is a small per
centage of the inelastic strain already induced by the manufacturing process. Nevertheless, the
generalized tangent modulus procedure was applied to the unannealed struts, and the results are
presented in Table 6.1.
Tangent modulus predictions of the first buckling loads are given in Table 6.1a along with
the actual buckling loads and the buckling loads given by the AISC formulae. (Note, first buck
ling of Struts 3 and 4 occurs in cycle 2.) The AISC load predictions are based on the yield
stresses determined by the 0.2% offset strain method for the coupon test results. The first
buckling loads for Struts 3 and 4 were 15% and 35%, respectively, below those given by the
AISC formulae.
As can be seen from Figs. 6.1 and 6.2, compression tests on the unannealed pipe show a
more rounded stress-strain curve and lower stress levels for a greater strain compared to the
coupon tensile tests. The tangent modulus method using the compression stub test stress-strain
curves predicts the first cycle buckling loads for Struts 3 and 4 to within 4% and 3% respec
tively, of the actual values. The full cross-section compression tests include residual stress
effects present in the unannealed material.
Estimates of buckling loads in later cycles are based on the material stress-strain curves
obtained from the unannealed cyclic stub tests. Column curves for predicting the critical
stresses, Figs. 6.3 and 6.4, were prepared in the same way as for the annealed struts. These
curves were used to predict cyclic buckling loads for Struts 3 and 4. For example, the amount
of cumulative inelastic strain for the cyclic stub test curve 3 was matched with a similar amount
of cumulative inelastic strain for a cycle of the strut tests (Table 6.1 b). The loads predicted
41

using the corresponding tangent modulus were not in agreement with the actual loads. For
Strut 4 the buckling load for cycle 5 predicted using the cyclic material test results was higher
than the predicted load for cycle 2 using the compression test. The reason is the higher yield
stresses of the cyclic test. Note that all three curves of the cyclic stub test for the thick walled
material show yielding at significantly higher stress levels than the compression stub test (Fig.
6.2). Also, cyclic curve 3 for tension loading shows yielding at higher stress levels than cyclic
curve 2 for compression loading. Thus, the scatter in the material stress-strain curves due to
different sample of pipe and directions of loading are greater than the changes in the material
properties resulting from the cyclic loading.
To properly apply the generalized tangent modulus procedure as presented in Chapter 5,
to the unannealed struts, a considerably more comprehensive cyclic material test program would
be required. Since it appears that the unannealed struts do not realistically represent actual
tubular members used in practice, such a further evaluation is not warranted.
42

CHAPTER 7
CONCLUSIONS
The struts discussed in this report are grouped into three different pairs: pinned-end
annealed, pinned-end unannealed, and fixed-end annealed. Each pair consists of one strut with
a D/t of 48 and one with a D/t of 33. Based on the reported experimental results and their
evaluation, several important conclusions can be reached. These can be summarized as follows:
1) For all three pairs, the struts with D/t of 33 clearly out performed the ones with D/t
of 48 in percentage retainment of their original buckling load.
2) Local buckling of thin walled pipes greatly contributes to their deterioration. The
onset of local buckling is followed by a rapid deterioration in the overall structural
response of a strut with continued cyclic loadings. For all three pairs, local buckling
occurred later in the struts with D/t of 33 than in the struts with D/t of 48. Hence,
in the design of tubular structures for seismically active regions, bracing members
with the lower D/t ratio are preferable for avoiding local failures under repeated
cyclic loadings.
3) Cyclic inelastic load applications can cause local buckling and loss of capacity of
tubular members that, under API recommendations, are considered to be adequate
for maintaining their capacity through substantial concentrated inelastic deformation
(D/t::::;; 1300/Fy)' Hence, API criteria, based on monotonic loading, do not neces
sarily preclude local buckling of tubular braces under severe cyclic loading.
4) Brace end conditions have a significant effect on the overall structural response of
strut members subjected to cyclic loadings. The responses of fixed-end pair of
braces showed less pinched hysteretic loops, slower deterioration of buckling capa
city, delayed onset of local buckling and improved efficiency in energy dissipation
compared to those of the pinned-end braces. The superior performance of the
fixed-end struts is attributed to their lower kUr ratio.
43

5) In simulating the behavior of real braces using reduced-scale models, the steel tubes
must be annealed before testing. In small tubes the steel in the as-received condi
tion may be highly work-hardened, and the stress-strain curves for such a material
bear little resemblance to the A36 steel used in the field. By annealing the speci
mens, the typical mechanical behavior for mild steel is restored. Although residual
stresses associated with manufacture of large diameter welded tubing are not
present, the annealed tubing are more realistic than the as received material. The
pair of braces tested in the as-received condition proved to be too brittle to sustain
cyclic loading at large inelastic ductility levels, and failed in the welded regions. The
difference in the mechanical material properties of the unannealed pair caused a
significant difference in their overall structural response. Normalized axial loads and
axial displacements obtained by dividing the loads and displacements by the yield
loads and the yield displacements, respectively, are not sufficient to account for the
observed difference in cyclic response caused by the difference in material proper
ties.
6) Cyclic inelastic loading causes changes in the mechanical properties of the material
in a strut which tend to reduce the strut's buckling load. If the changes in the
material properties can be adequately assessed, the reduction in the buckling load
can be estimated using the generalized tangent modulus procedure described in
Chapter 5. If the cyclic load applications result in increased residual brace cambers,
a camber reduction factor must also be applied [9].
Recommendations for Future Research
As previously stated, local buckling is a major concern for the thin-walled tubular braces
typical of those employed in braced steel structures. Local buckling can be expected in
members subjected to the large axial deformations which may be encountered during an excep
tionally severe earthquake. The phenomenon of local buckling has not been isolated in this
44

investigation, nor studied in sufficient detail to accurately estimate its onset and effect on subse
quent deterioration in brace capacity. Full size local buckling tests of tubular sections under
cyclic load application accompanied by analytical studies are suggested for investigating this
problem.
Realistic analytical models of brace elements are essential for accurate prediction of the
response of braced steel structures subjected to severe earthquake ground motions. Several
analytical models have previously been employed to represent the inelastic cyclic behavior of
bracing members [3, 5, 13, 151. In the light of new experimental data, these analytical models
should be re-examined and, if necessary, improved to better represent cyclic brace behavior.
Since the hysteretic response of a brace element is strongly dependent on the kL/r ratio, an
analytical model should account for this fact in a realistic manner. The reduction in buckling
load with cyclic load applications should be included in such a model.
45

REFERENCES
1. Sozen, M. A. and Roesset, J., "Structural Damage Caused by the 1976 Guatemala Earthquake," Structural Research Series No. 426, University of Illinois, Urbana, Champaign,March 1976.
2. Popov, E. P., Takanashi, K., and Roeder, C. W., "Structural Steel Bracing Systems:Behavior Under Cyclic Loading," EERC Report No. 76-17, Earthquake EngineeringResearch Center, University of California, Berkeley, June 1976.
3. Roeder, C. W., and Popov, E. P., "Inelastic Behavior of Eccentrically Braced FramesUnder Cyclic Loading," EERC Report No. 77-18, Earthquake Engineering ResearchCenter, University of California, Berkeley, CA, August 1977.
4. Popov, E. P., and Roeder, C. W., "A Structural Support System for Long Span Roofs inSeismic Regions," Proceedings, AISS Conference, Alma-Ata, USSR. Vol. 2, Mir Publishers, 1977, pp. 274-281.
5. Nilforoushan, R., "Seismic Behavior of Multi-Story K-Braced Frame Structures," Universityof Michigan Research Report UMEE 73R9, November, 1973.
6. Hanson, R. D., Goel, S. C., And Berg, G. V., "Seismic Behavior of Staggered TrussFraming Systems - Design Procedure for Earthquake Loading," University of MichiganResearch Report UMEEE No. 175, January 1973.
7. Shign, P., "Seismic Behavior of Braces and Braced Steel Frames," University of MichiganResearch Report UMEE 77R1, July 1977.
8. Jain, A. L., Goel, S. C., and Hanson, R. D., "Hysteresis Behavior of Bracing Membersand Seismic Response of Braced Frames with Different Proportions," University of Michigan Research Report UMEE 78R3, July 1978.
9. Popov, E. P., "Inelastic Behavior of Steel Braces Under Cyclic Loading," Proceedings, 2ndU.S. National Conference on Earthquake Engineering, Stanford University, CA, Aug. 1979.
10. American Institute of Steel Construction, Manual of Steel Construction, Seventh Edition,New York, 1970.
11. American Petroleum Institute, "Recommended Practice for Planning, Designing, andConstructing Fixed Offshore Platforms," Dallas, Texas, Ninth Edition, November, 1977;Tenth Edition, March 1979.
12. Gates, W. E., Marshall, P. W., and Mahin, S. A., "Analytical Methods for Determiningthe Ultimate Earthquake Resistance of Fixed Offshore Structures," Proceedings, OffshoreTechnology Conference, Houston, Texas, 1977.
46

13. Jain, A. K. and Goel, S. C., "Hysteresis Models for Steel Members Subjected to CyclicBuckling or Cyclic End Moments and Buckling," University of Michigan Research ReportUMEE 78R6, December 1978.
14. Sherman, D. R., "Cyclic Inelastic Behavior of Beam Columns and Struts," Preprint 3302,ASCE Convention and Exposition, Chicago, October 1978.
15. Marshall, P. W., Gates, William E., and Anagnostopoulos, Stavros, "Inelastic DynamicAnalysis of Tubular Offshore Structures," Proceedings, Offshore Technology Conference,Houston, Texas, 1977.
16 Popov, Egor P. and Ortiz, Miguel, "Macroscopic and Microscopic Cyclic Metal Plasticity,"Proceedings, Third Engineering Mechanics Specialty Conference, ASCE, Austin, Texas,September 1979.
17. Galambos, Theodore, Y., Structural Members and Frames, Prentice-Hall, 1968.
47
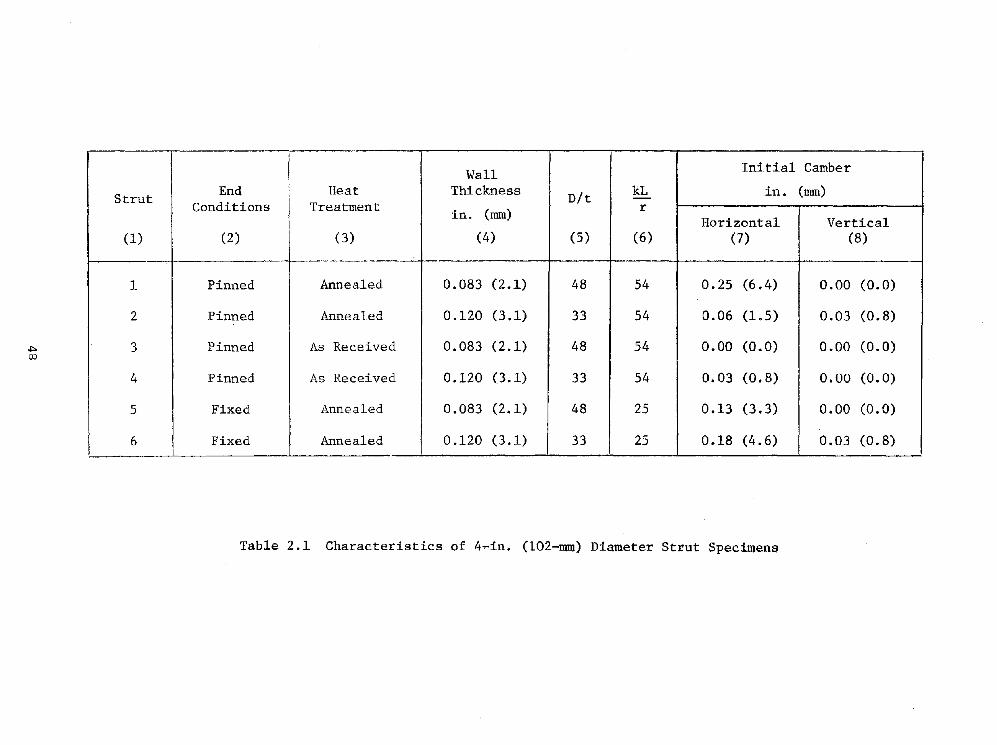
II::>OJ
Wall Initial Camber
Strut End Heat ThicknessDlt kL in. (rom)
Conditions Treatment in. (rrnn) rHorizontal Vertical
(1) (2) (3) (4) (5) (6) (7) (8)
1 Pinned Annealed 0.083 (2.1) 48 54 0.25 (6.4) 0.00 (0.0)
2 Pinned Annealed 0.120 (3.1) 33 54 0.06 (1.5) 0.03 (0.8)
3 Pinned As Received 0.083 (2.1) 48 54 o. 00 (0. 0) 0.00 (0.0)
4 Pinned As Received 0.120 (3.1) 33 54 0.03 (0.8) 0.00 (0.0)
5 Fixed Annealed 0.083 (2.1) 48 25 0.13 (3.3) 0.00 (0.0)
6 Fixed Annealed 0.120 (3.1) 33 25 0.18 (4.6) 0.03 (0.8)-
Table 2.1 Characteristics of 4~in. (102-rrnn) Diameter Strut Specimens

ay
Average Nominal LengthStrut Cross-Section P <5From of Tubing y yMaterial Area
Test(ksi) (in2) (in) (kips) (in)
1 31 1.02 55.38 31.6 0.058
2 31 1.46 55.38 45.3 0.058
3 92 1.02 55.38 93.8 0.173
4 74 1.46 55.38 108.0 0.139
5 31 1.02 70.25 31.6 0.074
6 31 1.46 70.25 45.3 0.074
Table 2.2 Strut Yield Loads PredictedFrom Material Test
(1 kip = 4.45 kN; 1 in. = 25.4 mm;1 ksi = 6.9 MFa)
49

lJ1o
CYCLE
Tal.1 2 3 4 5 6 7 8 9 10 11 12 13 14 (kips)
r-l * 19.5tp 23.0 21.5 16.2 13.8 10.8 4.1+-J Camp. Max.;::l ±0.5H+-J P 28.0 30.3 30.0 30.1 29.8 17.0 2.8tf.l Ten. Max.N * 23.5tp 43.7· 40.0 31. 3 27.5 22.0 16.8 14.0 6.0+-J Como. Max;::l ±0.5H+-J P 44.7 44.0 44.0 43.1 '43.0 38.6 33.0 19.0 6.0tf.l Ten. Max.C"'l * 44.8tp 51.0 60.4 46.9 24.0 19.2 13.7 6.6+-J Camp. Max.;::l ±0.5H+-J P 49.5 82.9 86.5 59.7 60.1 24.5 4.5 0.0tf.l Ten. Max.~ *P 40.7 57.5 54.5 55.7 41.9 38.9 37.6 . 38.4 38.4 39.0+-J Camp. Max.;::l ±0.5H+-J P 56.1 97.2 99.7 84.6 89.4 89.0 98.5 101.6 102.5 102.8tf.l Ten. Max.Lf') * 28.0t 12.0 i .9.8+-J
P 28.0 31.5 32.5 32.0 23.0 20.0 17.5 16.0 14.0 7.0Camp. Max.;::l ±1.0H 1+-J P 31.2 32.5 33.0 32.5 132.0 32.0 30.0 29.5 26.5 23.0 17.0 13.0 10.2tf.l Ten. Max.
'" 1(35.0t
+-Jp 28.0 42.0 44.5 40.0 38.5 37.5 37.0 36.5 35.5 34.5 i 30.5 28.0 27.0
;::l Camp. Max. ±1.0H+-J P 35.0 44.0 44.5 44.0 44.0 44.0 42.5 42.5 43.5 43.0 43.0 42.0 41.0 41.8tf.l Ten. Max.
*Cycle in which noticeable lateral buckling first occurred
tCycle in which local buckling first occurred
Table 3.1 Maximum Compressive and TensileLoads in Each Cycle
(1 kip = 4.45 kN)

U1i-'
CYCLE
1 2 3 4 5 6 7 8 9 10 11 12 13 14 TOL.(in. )
.-I0 -.212 -.367 -.369
.f-l Camp. Max -.072 -.142 -.282 -.356 -.367;::lH
0.f-l .076 .141 .210 .279 .346 .358 .359 .348til Ten. MaxN
cS -.073 -.140 -.216 -.282 -.357 -.358 -.363 -.360 -.350.f-l Camp. Max;::lH
cS .3451.f-l .074 .141 .209 .278 .350 .344 .341 .343til Ten. MaxC""l
0.f-l Camp. Max -.075 -.138 -.194 -.225 -.303 -.307 -.310 -.309;::lH
0 .082 1 I.f-l .072 .142 .170 .080 .067 .061 - itil Ten. Max-j
0 -.0701-.145 -.200 -.285 -.354 -.351 -.351 -.351 -.351 i-.351 i.f-l Camp. Max;::lH
0 .14- .164 .052 .112 .138 i.f-l .070 .065 .061 .100 .125til Ten. Max I I
Lr'l , ! ,0 -.068 -.144 -.218 -.284 -.358 -.354 -.356 -.403 -.454 -.500/-.553 -.668 -.703
.f-l Camp. Max;::lH
0 .062 .140 .210 .277 .347 .343 .346 .344 .343 .345 .346 .346.f-l .347til Ten. Max\0
0 -.065 -.143 -.213 -.286 -.358 -.367 -.416 -.473 -.527 -.578 -.627 -.674 -.680.f-l Camp. Max -.362;::lH
.394 .472 .576.f-l 0 .069 .142 .214 .282 .342 .338 .330 .330 .338 .372 .426til Ten. Max
Table 3.2 Maximum Compressive and TensileDisplacements in Each Cycle
(1 in. = 2.54 cm)

lJlN
CYCLES 1 2 3 4 5 6 7 8 9 10 11 12 13 14
E. 2.97 7.47 10.66 9.82 10.46 7.09 2.87~
Strut 1 RP. 6.95 14.50 23.19 31.92 40.67 44.05 44.94 E. =. energy absorbed i.n~
~ cycle i (kip-inch)Ei/RPi 0.43 0.52 0.46 0.31 0.26 0.16 0.06
E. 4.00 11.95 15.36 17.89 17.32 14.00 11.67 9.06 4.84 RPi =. energy absorbed in~
20.74 33.66ideal rigid-plastic
Strut 2 RP. 9.97 45.75 58.52 62.02 62.38 61.97 61. 38 element (kip-inch)~
E/RPi 0.40 0.58 0.46 0.39 0.30 0.23 0.19 0.15 0.08
Ei 0.56 9.18 15.00 12.59 8.45 7.29 3.21
Strut 3 RPi20.82 39.21 54.31 54.59 64.53 63.88 66.13
Ei/RPi0.03 0.23 0.28 0.23 0.13 0.11 0.05
E. 0.98 7.15 13.19 18.15 19.10 18.41 21.28 23.98 25.16~
Strut 4 RP i 22.68 46.44 60.05 67.72 79.27 77 .87 82.30 83.59 88.02,
Ei/RP i 0.04 0.15 0.22 0.27 0.24 0.24 0.26 0.29 0.29
E. 1.00 6.37 13.53 20.66 23.05 17.67 16.00 16.81 17.57 15.56 13.59 12.07 9.40~
Strut 5 RP. 6.26 13.52 22.69 30.87 39.72 41.87 41.87 44.94 48.13 51.00 54.42 i61. 68 63.611
Ei/RP i ' 0.16 0.47 0.60 0.67 0.58 0.42 0.38 0.37 0.37 0.31 i 0.150.25 ! 0.20I
Ei 0.82 9.30 15.24 24.22 32.33 33.59 32.87 34.92 38.59 39.36 44.18 43.07 43.51 46.47
Strut 6 RPi
9.01 19.39 31.26 43.94 56.31 59.34 59.16 63.28 68.81 75.56 82.94 90.01 97.85 105.14
E./RP . 0.09 0.48 0.49 0.55 0.57 0.57 0.56 0.55 0.56 0.52 0.53 0.48 0.44 0.44~ 1-
Table 3.3 Energy Absorption Per Cycle (1 kip-in =. 0.113 kN-m)

lJ1W
LoadLength of Inelastic Rotation Cum. Inelastic Max. Compo
PointsPlastic Region in Plastic Region Rotation in Plastic Region Load
±0.5 in (±12.7 mm) ±0.005 radian radians kips (kN)
lC 10.25 (260.3) 0.017 0.017 23.0 (102.3)
lE -0.006 0.040
2C 12.50 (317.5) 0.045 0.091 21.5 (95.7)
2E -0.005 0.141
3LB 13.00 (330.2) 0.057 0.203 19.5 (86.8)
Table 4.1 Plastic Region Inelastic Rotations - Strut 1

U1>!'>
Load Length of*
Inelastic Rotation Cum. Inelastic Max. Compo
PointsPlastic Region in Plastic Region Rotation in Plastic Region Load
iO.5 in (i12.7 mm) iO.005 radian radians kips (kN)
3C 8.25 (209.5) 0.060 0.060 31.5 (140.2)
3E 0.007 0.113
4C 8.75 (222.2) 0.093 0.199 27.5 (122.4)
4E 0.016 0.276
5LB 8.12 (206.2) 0.061 0.321 23.5 (104.6)
* t length of center plastic hinge.
Table ~.2 Plastic Region Inelastic Rotations ~ Strut 2

\Jl\Jl
LoadLength of Inelastic Rotation Cum. Inelastic Max. Compo
PointsPlastic Region in Plastic Region Rotation in Plastic Region Load
±0.5 in. (±12.7 rom) radians radians kips (kN)
1C 4 (101. 6) -0.0029 0.0029 28.0 (124.6)
IE -0.0087 0.0087
2C 6 (152.4) -0.0055 0.0119 31.5 (140.2)
2E -0.0165 0.0229
3C 10 (254.0) -0.0046 0.0348 32.5 (144.6)
3E -0.0145 0.0447
4C 10 (254.0) 0.0131 0.0723 32.0 (142.4)
4E -0.0135 0.0989
5LB 10 (254.0) -0.0014 0.1110 28.0 (124.6)
Table 4.3 Foot Plastic Region Inelastic Rotations - Strut 5

lJ1(J'I
Load Length of Inelastic Rotation Cum. Inelastic Max. Compo
PointsPlastic Region in Plastic Region Rotation in Plastic Region Load
±0.5 in. (±12.7 rom) radians radians kips (kN)
2E 0 0
3C 4 (101.6) 0.0135 0.0135 49.5 (220.3)
3E -0.0077 0.0347
4C 6 (152.4) 0.0217 0.0642 40.0 (178.0)
4E -0.0075 0.0935
5C 10 (254.0) 0.0372 0.1382 38.5 (171. 3)
5E 0.0005 0.1750
6C 10 (254.0) 0.0427 0.2172 37.5 (166.9)
6E -0.0042 0.2642
7C 10 (254.0) 0.0432 0.3117 37.0 (164.6)
7E -0.0037 0.3587
8C 10 (254.0) 0.0467 0.4092 36.5 (162.4)
8E 0.0005 0.4555
9C 10 (254.0) 0.0527 0.5077 35.5 (158.0)
9E I 0.0012 0.5592 II
10LB 10 (254.0) I 0.0580 0.6160 35.0 (155.7)
Table 4.4 Foot Plastic Region Inelastic Rotations - Strut 6

STRUT 1 STRUT 2 STRUT 5 STRUT 6
(D/t = 48) (D/t = 33) (D!t = 48) (D/t = 33)
Cycle at3 5 5 10Local Buckling
Load atLocal Buckling 12.2 17.8 28.0 30.6
(kips)
Cumulative InelasticCurvature 0.021 0.048 0.019 0.091
(radians/in. )
Cumulative InelasticAxial Strain 0.034 0.057 0.072 0.154
(in. /in.)
Cumulative Inelastic !Compressive Fiber 0.069 0.148 0.116 0.347Strain (in. /in.)
Maximum CurvatureExcursion 0.007 0.014 0.004 0.009
(radians/in.)
Cumulative InelaasticRotation 0.203 0.321 0.111 0.616(radians)
Cumulative EnergyDissipated 21.1 66.5 64.6* 261. 2 *
(kip-in. ) (32.3) (130.6)
Magnitude ofCurvature at L.B. 0.007 0.015 0.000 0.010
(radians/in.)
Magnitude ofCompressive Fiber -0.021 -0.039 -0.003 -0.038Strain at L.B.
(in. /in.)
* 12 total strut energy.
Table 4.5 Summary of Rotations, CurvaturesStrains, and Energy Dissipation atFirst Occurrence of Local Buckling
(1 kip = 4.45 kN, 1 in. = 25.4 mm)
57

Buckling LoadBuckling Load by
AISC FormulasStrut by Tangent (Without Factor of First Buckling
No. Hodulus Safety) Load from TestMethod(kips) (kips) (kips)
1 24.3 29.2 23
2 45.3 41. 7 43.7
5 31.6 31.1 31.5
6 45.3 44.5 44.5
Note: Tolerances of predicted loads are ±O.5 k due to curve plottingaccuracy limits.
Table 5.1 Predictions of FirstBuckling Loads-Annealed Struts
(1 kip = 4.45 kN)
58

Cumulative Predicted ActualInelastic Buckling BucklingCentroidalStrain* Load Load
(in/in) (kips) (kips)
CYI .00407 24.3 23.0
CY 2 .01017 20.0 21.5
Strut CY 3 .01815 19.4 19.51
CY 4 .03115 Beyond Local16.2Buckling
CY 5 .03979 Beyond Local 13.8Buckling
CY 1 0 45.3 43.7
CY 2 .0002 43.8 40.0
Strut CY 3 .01470 28.2 31.32
CY 4 .03070 26.0 27.5
CY 5 .04885 Beyond Local 23.5Buckling
CYI 0 31.6 Elastic Cycle;No Buckling
CY 2 - 0 31.6 31.5
Strut GY 3 - 0 31.6 32.55
CY 4 .00010 31.6 32.0
CY 5 .01591 27.9 28.0
CY 1 0 45.3 Elastic Cycle;No Buckling
CY 2 0 45.3 42.0
Strut CY 3 .00020 45.3 44.56
CY 4 .00119 43.1 40.0I !
CY 5 .01062 40.0 38.5
*Based on center hinge
Table 5.2 Predicted Buckling Loads for Annealed Struts (lkip = 4.45 kN)
59

Strut Tangent AISC Formulae Actual First
No. Modulus (Without Factor Buckling LoadMethod of Safety) in Test
(kips) (kips) (kips)
3 57.8 70.8 60.4
I4 59.5 88.0 57.5
(A) First Buckling Load
CumulativeCycle of Cumulative Predicted
Inelastic Strut Test Inelastic Buckling Actual
Strain in With Centroida1 Load Buckling
CyclicSimilar Strain From Load in
Cumulative Preceding Cyclic NotedMaterial Strain Strut Test Material Cycle
Test History Cycle Noted Test
(in/in) (in/in) (kips) (kips)
Strut 3 .017 4th .013 52.3 44.8
Strut 4 .020 5th .017 65.1 55.7
(B) Buckling Load in Later Cycle
Table 6.1 Predicted Buckling Loads for Unannealed Struts
(1 kip = 4.45 kN)
60

FIGURES
61

B
p
t , , t t t
("\ ( \ "\ 1t t t , , ,
O-A A-B B-C C-D D-E E-F
A) Hysteretic Behavior B) Zones of Behavior
Fig. 1.1 Typical load deformation Relationship of a Brace Member [2]
p
2
5
3
Fig. 1.2 Linearized Model of Post-Buckling Brace Behavior [3]
62

120"
4"¢I STRUTS I
I..., 120" ... 1
MSL
MUDLINE
It)
N
oo
+1
o10
olD
J~lD,
§~.
Nr-.
...Q
QUi"'Z,..-5~Q:", ...
..,0:)0oJ";:)
zeZN.. r-.
,- - - - roO'XIOO'- - ~ --II DECK MODULE II DL+ LL = 5000k II IL - -" - -,rr- - - -.::,- - T r - _...J I
1 I 'i<-36¢ .750........' I 1I 1/,/ FLD.INST. ""' 1::-1
/ ,j, " -,-=18'f .375-----.. '
"'Ii'
7 i4> 1.125-----.J
244> .500
24«> 1.00 I +---'
<YlW
a) Frame Elevation b) 1:6 Scale Model of a Braced Panel
Fig. 2.1 Southern California Example Structure (1 in. 25.4 nun)

4" 0Tubing
~DT 17
11
55.3a"
I
L-.A
o 0000o 0
SECTIONA-A
STRUTS 1,2
4" ellTubing
~DT
74.3."
End Plate
o 0)-1.3
0\)0o 0
SECTIONB-B
STRUTS 3,4
SECTIONC-C
nd Plete
4" 0T I
1144 '-- 70_._25_H -.,~
ub "g
L.P.
2.13u
15.38# 17.50" i7.S0H
7.38N ." .u
'~/,..... c..-- 2" .
1 5 II 13 17 ~~,~ .
}4~DT' " (!) 1IJ12 l' 20!M.-;!I
L.P.- 3 7 r 15 III 23 27 31-
'- C4- '-
STRUTS 5, 6
o . Itraln gag.
~ - linear potentiometer (L.P.)or LVDT (linear variabledifferential transformer)
Fig. 2.2 Test Specimens (1 in. 25.4 mm)
64

REACTIONFRAME
7'-0"
REACTIONBLOCK
7'-101/4"
7'-6"
SIDE ARM
LOAD TESTCELL SPECIMEN
6'- 2 3/8"
91/4"
22'- 3"
FOOT PIN
SPACER PLATES
5'-103/4"
4"
10" BEAM
REACTIONBLOCK
(a) PINNED- PINNED TEST LAYOUT
REACTIONFRAME
REACTIONBLOCK
PINCONNECTION
(TYP)
SIDE ARM
6" INITIALEXTENSION
7'-4"
1'-41/4"
HEADUNIT
2'-51/4"
16'-13/4"
~:::::::::::::::::::::::::::::::::::::::::::::::::::::::::::::::::::::::::
TESTSPECIMEN
6'-15/8"
10" BEAM
FOOT FRAME
4'-2"REACTION
BLOCK
(b) FIXED-FIXED TEST LAYOUT
Fig. 2.3 Experimental Test Set-Up (1 in. = 25.4 rom)
65

Fig. 2.4 Fixed-Fixed Experimental Setup
66

a) Head Unit
b) Specimen Connection to Foot Frame
Fig. 2.5 Fixed-Fixed Experimental Setup
67

a) Load Control Equipment
b) Clevis Used for Pin Connection
Fig. 2.6 Experimental Equipment
68

a) LVDT Used for Measuring Axial Displacement
b) Specimen with Strain Gages and LVDT
Fig. 2.7 Instrumentation
69

a) Data Feedback -- Continuous Recording on X-Y Plotters
b) Recording Visual Observations
Fig. 2.8 Data Recording
70

INITIAL YIELDDISP. (0= 0.06 IN.)
....zw~woec..Ia.~Q
..Iec)(ec
zoCDzw~
zoCDCDW0::a..~oo
0.4
0.2
Ol-----.--f--lr-+-+-+-+-I-+-+-+-+-+--I--+-+....L.....-----
0.2
0.4
CY I OY2 OY3 OY4 eY5 eY6 OV7 eve eyg cy 10I I I I I I I I I I I
CYCLE NUMBER
Fig. 2.9 Loading Sequence - Strut 1 (1 in.
71
25.4 mm)

0.4
Z0(J) 0.2Zwf-
a
.5
~Zw::Iw()c:r:....IQ.
~C
....Ic:r:><c:r:
zoen(J)w0:::a..~o()
0.2
0.4
INITIAL YIELDDISP. (6 = 0.06 IN.>
CYJ CY2 CY3 CY4 CY5 CY6 CY7 cye CY9 CYIO CY III I I I I I I I I I I I
CYCLE NUMBER
Fig. 2.10 Loading Sequence - Strut 2 (1 in.
72
25.4 mrn)

0.4
INITIAL YIELD/ DISP. <6= 0.17 IN.>
~ ~--FRACTURE
01----......-~\--I_4__++__I_\___I__+_++__+_!tr_r_-------
0.2
0.4
0.2
zo(J)zwI-
zo(J)(J)wa::Q.~oo
..J:!><ce
...zw~w()ce..J0.tnQ
CYI CY2 CY3 CY4 pY5 OY6 OY7 OYS Cyg OYIOI I I I I I I I I I I
CYCLE NUMBER
Fig. 2.11 Loading Sequence - Strut 3 (1 in. 25.4 rom)
73

0.4
Z0(Jj 0.2ZWI-
0
.S
...Zw:Ewoce..Ia..eno
..Ice><ce
zoU5(/)wa::a..Loo
0.2
0.4
,CY t ,CY2, CY3, CY4, CY5, Cye, CY7 ,eYe, CY9,CYIO,CYJI ,
CYCLE NUMBER
Fig. 2.12 Loading Sequence - Strut 4 (1 in.
74
25.4 mm)

0.6 I-
INITIAL YIELD~ DISP. ( <5 = 0.07 IN.>
0.4 ~
.E z ""0en 0.2 ~
~I- ZZ W ,
~w l- f-:::Iw ~~I\
0 0c(
V ~\....I
a. Z -en 02i en ,....I en 0.2 -c( W>< a::c( Q.
~0 0.4 -0
~
0.6 ~
~
eYI CY2 OY3 OY4 OY5 OY6 OY? oye Oyg CYIO OYII OVI2 OVI3I I I I tit I I I I I I I
CYCLE NUMBER
Fig. 2.13 Loading Sequence - Strut 5 (1 in.
75
25.4 rom)

0.6 INITIAL YIELDDISP. (<5 = 0.07 IN.>
0.4
.E Z0
~ en 0.2Z Zw w::E /-w0
0<..JQ.
~ Z0 0
U5 0.2..J en< w>< 0:::< a..
:::E0 0.40
0.6
CYI CY2 CY3 CY4 CYS CY6 CY7 CY8 CY9 CYID CYII CYI2 CYI3 CYI4 CYIS CYI6I I I I I I I I I I I I I I I I I
CYCLE NUMBER
Fig. 2.14 Loading Sequence - Strut 6 (1 in.
76
25.4 rom)

C-MAXIMUMCOMPRESSIVEDISPLACEMENT
a)
P (KIPS)
...,.-E- MAXIMUM. TENSILE
DISPLACEMENT
F-ZERO LOAD/I AFTER TENSION
\ 811NCHESI
A-ZERO LOADBEFORE COMPRESSION
(MAX'MUMCOMPRESSIVELOAD
Typical Hysteretic Response
STRUT
A+B
t
+C
t0(01
) E F (A OF NEXTCYCLE)
b) Loading Schematic
Fig. 2.15 Load Points on a Typical Cycle
77

OV'ELD =36 KS I40...-
en~
enen 20wa:I-en
0
AREA=0.083IN.2
0.002 0.004 0.006 0.008 0.010STRAIN (IN/IN)
(0) 0.083" WALL TH ICKNESS
40
enenw 20a:Ien
o0.002
"YIELD =35 KSI
~p
AREA =0.120IN.2
0.010
Fig. 2.16 Coupon Test Results - Annealed Material at Small Strains(1 ksi = 6.9 MPa)
78

120
cry (0.2 % OFFSET)= 92 KSI crULT = 97 KSI100
C/) 80 /~
C/)60 /
C/)
/wa::l- IC/) 40
20/
/0
0 .002 .004 .006 .008 .010 .012 .014 .016 .018 .020
STRAIN (IN/IN)
(0) 0.083" WALL THICKNESS
120
100 cry (0.2 % OFFSET) =74 KSI crULT =88 KSI
80C/)~
Cf) 60 /Cf)wa:: /I-
40C/)
/20 /
/0
0 .002 .004 .006 .008 .010 .012 .014 .016 .018 .020
STRAIN (IN/IN)
(b) 0.120" WALL THICKNESS
Fig. 2.17 Coupon Test Results - Unannealed Material at Small Strains(1 ksi = 6.9 MPa)
79

tP
100OULT =97 KSI AREA =
0.120 IN.2
80
UNANNEALED tp-CJ) MATERIAL CTULT = 58 KSI~~ 60-CJ)
CTYIELD =36 KSICJ)w
~0:: 40~CJ)
ANNEALED
20MATERIAL
o0.02 0.04 0.06 0.08 0.10 0.12
100
80
-CJ) 60~-CJ)CJ)W0:: 40~CJ)
20
STRAIN (INI IN)
(0) 0.083" WALL THICKNESS
~CTULT=88 KSI
&---- UNANNEALEDMATERIAL
ANNEALEDMATERIAL
AREA =20.082 IN.
OL.-__........__L-_---J__--L__---L__.........__~
0.02 0.04 0.06 0.08 0.10
STRAIN (IN liN)
( b) 0.120" WALL TH ICKNESS
0.12
Fig. 2.18 Coupon Test Results - Annealed & Unannea1ed at Large Strains(1 ksi = 6.9 MPa)
80

fPI 4 IN. 0.0.l/TUBEII
T,12" I-i l
c:::;:~
60
OVIELD =31 KSI
O------.L----...L-----.a.----.......---_....
- 40en~
enenw0:~ 20
0.002 0.004 0.006 0.008 0.010
STRAIN (IN/IN)
Fig. 2.19 Compression Test of Full Section - Annealed Material(1 ksi = 6.9 MPa)
81

80
60
~ 40wa:len
20
OL-----"-----L----L.---...L-----.J0.0200.0160.004 0.008 0.012
STRAIN (IN/IN)
(0) 0.083" WALL THICKNESS
80
60-en 40enwa:::l-en
20
0L-__--1i...-__......L -L. .L-__---J
0.0200.0160.004 0.008 0.012
STRAIN (IN/IN)
(b) 0.120" WALL THICKNESS
Fig. 2.20 Compression Test of Full Section - Unannealed Material(1 ksi = 6.9 :MFa)
82

OVIELD =31 KSI
ANNEALED PIPE(t=0.08311
)
20
30
40r-------------r---'-------------.
-30
-20
~ 0 1----....L--+---'----'---f-----''---.....1---f-'------i
W0:::~(f) -10
(f) 10~.......
-
-40'------'-----L.---'----'-----''---.....1-----'-----'
- 0.006 - 0.002 0 0.002 0.006
STRAIN (IN/IN)
. Fig. 2.21 Cyclic Test - Annealed Material(1 ksi = 6.9 MFa)
83

UNANNEALED PIPE
-80
-60
-40
-100' , I I I , I , ,
-0.004 00.004 0.008 0.012 0.016 0.020STRAIN (IN/IN)
100
80
60
40
--CJ) 20~-CJ)
0CJ)
IJJQ::I-CJ) -20
UNANNEALED PIPE
60
80
40
-40
-80
-60
100, ,I
-100" , I , I I I I
-0.016 -0.012 -0.008 -0.004 0 0.004 0.008STRAI N (IN/IN)
CJ) 20~-CJ) 0
(» CJ)
"'" WQ::I-CJ) -20
(a) 0.120" WALL THICKNESS (b) 0.083" WALL THICKNESS
Fig. 2.22 Cyclic Test - Unannealed Material(1 ksi = 6.9 MPa)

601, ------------r'----------i
40
STRUT I 411ep X 0.083
11
PINNED - PINNED END CONDITIONS
20
..-Cf)a..- 0::s:::-a..
-20
<XllJ1
-40
-60' I I I I I I , , , ,
-0.5 -0.4 -0.3 -0.2 -0.1 0 0.1 0.2 0.3 0.4 0.58 (IN)
Fig. 3.1 Axial Load vs. Axial Displacement - Strut 1, Cycles 1-5(1 kip = 4.45 kN; 1 in. = 25.4 rom)

,60. I
40
20
.--.(f)
0-~ 0........0-
OJ
-20
'"-40
7
STRUT 1 4"epxO.083"PINNED - PINNED END CONDITIONS
-60 1 I I I I I I I , I I , I
-0.5 -0.4 -0.3 -0.2 -0.1 o8 (IN)
0.1 0.2 0.3 0.4 0.5
Fig. 3.2 Axial Load vs. Axial Displacement - Strut 1, Cycles 6-8(1 kip = 4.45 kN; 1 in. = 25.4 rom)

STRUT 2 4'~ X 0.120"PINNED - PINNED END CONDITIONS
60, i i
40
20
-(J)a..~ 0-a..
(Xl
-201 C5
-....l
-40
0.50.40.30.20.1-0.2 -0.1-0.3-60' I I I I I I I I I I
-0.5 -0.4
Fig. 3.3 Axial Load vs. Axial Displacement - Strut 2. Cycles 1-5(1 kip = 4.45 kN; 1 in. = 25.4 rom)

60, I I
40
20
.-..if)(L
0~-(L
00 -2000
-40 STRUT 2 4"ep X 0.120"PINNED - PINNED END CONDITIONS
-60' I , I I , I , I I , I ,
-0.5 -0.4 -0.3 -0.2 -0.1 0 0.1 0.2 0.3 0.4 0.58 (IN)
Fig. 3.4 Axial Load vs. Axial Displacement - Strut 2. Cycles 6-9

STRUT 3 4''¢ X 0.083"PINNED- PINNED ENDCONDITIONS
3
60
40
-20
80
20
-60
-40
(J)a..~ 0 I ,::::>4 /' f I I.',',' I I I I-a..
CXJ\.D
0.40.30.2-0.1-0.2-0.3-80 1 I I I I I I I I
-0.4
Fig. 3.5 Axial Load vs. Axial Displacement - Strut 3. Cycles 1-5(1 kip = 4.45 kN; 1 in. = 25.4 mm)

100
80
60
40
L/20
-(/)~ a.. 00
~-a..
-20
-40
-60 STRUT 3 4"4> x 0.083"PINNED - PINNED END
-0.5
Fig. 3.6 Axial Load vs. Axial Displacement - Strut 3, Cycles 6-8(1 kip = 4.45 kN; 1 in. = 25.4 mm)

STRUT 4 41\p x0.120
PINNED - PINNED ENDCONDITIONS
100
60
-20
40
80
20
-60
-40
a..
(J)a..~ 01 I l '/ IIr (V /11 I
I I I\0I-'
-80' I I I I I I I ,
-0.4 -0.3 -0.2 -0.1 0 0.1 0.2 0.3 0.48 (IN)
Fig. 3.7 Axial Load vs. Axial Displacement - Strut 4, Cycles 1-5(1 kip = 4.45 kN; 1 in. = 25.4 mm)

100
80
60
40
--- 20if)Q..
~\.0~
tvQ.. 0
-20
-40
-60 STRUT 4 4"ep xO.12011
PINNED - PINNED END CONDITIONS
-0.5 -0.4 -0.3 0.4
Fig. 3.8 Axial Load vs. Axial Displacement - Strut 4, Cycles 6-10(1 kip = 4.45 kN; 1 in. = 25.4 mm)

GOr'--------,'---------.,
40
20
-0
enw
a..~ 0-a..
-20
-40STRUT 5 4"¢ x0.083"FIXED- FIXED END CONDITIONS
-GO' I I , , , , I I
-0.4 -0.3 -0.2 -0.1 0 0.1 0.2 0.3 0.48 (IN)
Fig. 3.9 Axial Load vs. Axial Displacement - Strut 5, Cycles 1-5(1 kip = 4.45 kN; 1 in. = 25.4 rom)

60
40
20
-Cf)a..~ 0-a..
1.0 -20o!'>
-40
-60 STRUT 5 41C/J X 0.083"
FIXED-FIXED END CONDITIONS
-0.6 -0.5 -0.4 -0.3 -0.2 -0.1 o 0.18 (IN)
0.2 0.3 0.4 0.5 0.6
Fig. 3.10 Axial Load vs. Axial Displacement - Strut 5, Cycles 6-10(1 kip = 4.45 kN; 1 in. = 25.4 rom)

'!lU1
20
~~O-a..
-20
- - ~J:i2~
I I I I I I I /1 I I-:;.-" .--
~
~ 14~ ~ dD I-
STRUT 5 4"<p x 0.08311
FIXED-FIXED END CONDITIONS
I I I I I I I I I I I I I-0.7 -0.6 -0.5 -0.4 -0.3 -0.2 -0.1 o 0.1
8 (IN)
0.2 0.3 0.4 0.5 0.6 0.7
Fig. 3.11 Axial Load vs. Axial Displacement - Strut 5, Cycles 11-13(1 kip = 4.45 kN; 1 in. = 25:4 mm)

80 I I I
60
40
20
-if)(L
~ 0---(L
'"' -20(J'I
-40
-60STRUT 6 4"ep X0.120FIXED-FIXED END CONDITIONS
-80 I I I I I I I I
-0.4 -0.3 -0.2 -0.1 0 0.1 0.2 0.3 0.48 (IN)
Fig 3.12 Axial Load vs. Axial Displacement - Strut 6, Cycles 1-5(1 kip = 4.45 kN; 1 in. = 25.4 rom)

60
40
20
-(f)a.. 0:lI:::-a..\.0
-...J
-20
-40
-60 STRUT 6 4" c/> X 0.12011
FIXED-FIXED END CONDITIONS
-0.6 -0.5 -0.4 -0.3 -0.2 o 0.18 (IN)
0.2 0.3 0.4 0.5 0.6 .
Fig. 3.13 Axial Load vs. Axial Displacement - Strut 6, Cycles 6-10(1 kip = 4.45 kN; 1 in. = 25.4 rom)

STRUT 6 4" ep X 0.120"FIXED-FIXED END CONDITIONS
60.---,-------------,'-----~~~~~-l'
40
20
-(f)(L- 0~~
(L
-20
'.0CD
-40
-0.7 -0.6 -0.5 0.5 0.6
Fig. 3.14 Axial Load vs. Axial Displacement - Strut 6~ Cycles 11-16(1 kip = 4.45 kN; 1 in. = 25.4 rom)

80r---------r-------------------,
60
-40STRUT I 41lp X 0.083"PINNED - PINNED END CONDITIONS
- 60 '--__.l--__.l..-.__.l..-.__...I--__-L-__-L-__....L-__....L.-_---'
-3 -2 -I 0 2 3 4 5 66, (IN)
Fig. 3.15 Axial Load vs. Lateral Displacement - Strut 1, Cycles 1-5(1 kip = 4.45 kN; 1 in. = 25.4 rom)
99

80r-----------------...-------------~
STRUT 2 4"ep)( 0.120"PINNED - PINNED ENDCONDITIONS
20
60
-20
40
-40
-ena..~Of----.l.-...:""e..-~--....L--+--.....L----+---lI-IHI-----L--...-.....l--.---JL-----J
a..
432o.6. (IN)
-I-2-3-4-5- 60~__-'---__-l..-__....L___.....L______'_______L.___...l..______.l_____lL..__ ____I
-6
Fig. 3.16 Axial Load vs. Lateral Displacement - Strut 2, Cycles 1-5(1 kip = 4.45 kN; 1 in. = 25.4 rom)
100

120r----------.-------------....,
100
2
STRUT 3 4''cp X 0.083"PINNED- PINNED ENDCONDITIONS
60
40
-20
80
20
-6J
-40
ena..0r---"-----"-----+r--+-L-.l-\---~:__-..L......--____l~
a..
432-I 0!::J. (IN)
-2- 80 '---__"---__"---_---'- "---__"---__.1--_---1
-3
Fig. 3.17 Axial Load vs. Lateral Displacement - Strut 3, Cycles 1-5(1 kip = 4.45 kN; 1 in. = 25.4 rom)
101

120 r------------,.--------------,
100 2
STRUT 4 411ep x 0.120
11
PINNED - PINNED ENDCONDITIONS
20
80
40
60
-20
-60
-40
a...
-ena...~Ot----...L...--~f'--f----"--t-+-'t--tt-----l------'-----''------j
432-I-2-3- 80 L...-__..L-.__--'---____"____---L-____l___---''---__'--_---'
-4
Fig. 3.18 Axial Load vs. Lateral Displacement - Strut 4, Cycles 1-5(1 kip = 4.45 kN; 1 in. = 25.4 rom)
102

80r-------------y------------.
60
40
20
(f)a..~ 0
a.. I,@-20
5
-40
-60STRUT 5 4
1:P X 0.083FIXED- FIXED END CONDITIONS
432olJ. (IN)
-I-2- 80 L--__.L..--__.L..--__"'-__.L-__.L.-__.L.-_---l
-3
Fig. 3.19 Axial Load vs. Lateral Displacement - Strut 5, Cycles 1-5(1 kip = 4.45 kN; 1 in. = 25.4 rom)
103

80...-----------,...------------.,
60
40
20
CJ)a..-0~-a..
-20
3-40
-60STRUT 6 4'<p )( O. 120"FIXED- FIXED END CONDITIONS
- 80 '--__"--__"--__L..--__~__~__~_---'
-3 -2 -I 0 2 3 46. (IN)
Fig. 3.20 Axial Load vs. Lateral Displacement ~ Strut 6, Cycles 1-5(1 kip = 4.45 kN; 1 in. = 25.4 rom)
104

Fig. 3.21 View of Overall Buckled Strut
105

.- fo'r
a) Orip,inal Local Buckle
b) Strai"htening After Tension
Fig. 3.22 Local Buckling at Selected Load Points forStrut 5 - Center Hinge
106

a) Severe Local Buckle
SPEC
E
cy 10b) Tearing in Tension
Fig. 3.23 Local Buckling at Selected Load Points forStrut 5 - Center Hinge
107
/

a) Severe Tearing in Tension
b) Post-Tearing Buckle
Fig. 3.24 Local Buckling at Selected Load Points forStrut 5 - Center Hinge
108

a) Severe Local Buckle
b) Tensile Tearing
Fig. 3.25 Local Buckling at Foot Hinge - Strut 5
109
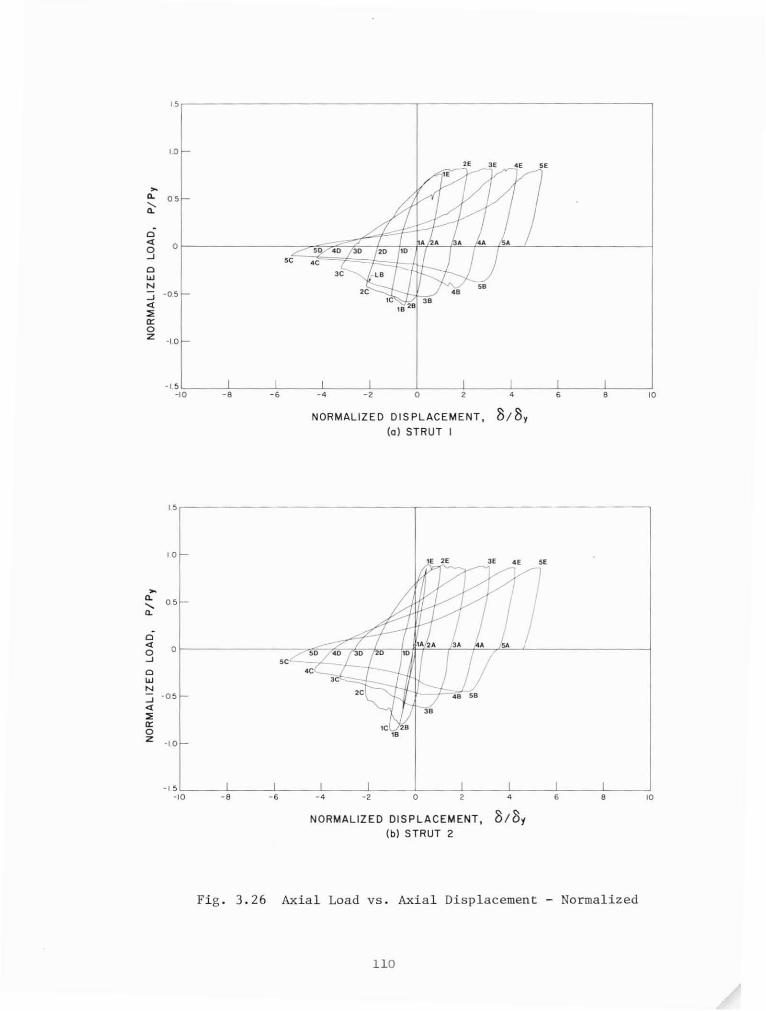
",------------------,------------------,
10
" " " "~.. 05
"'..0<l 00 .0 3D-' 'C <C0 3C..,N
-' -05<l
'"a:0z -10
-,.-10 -8 -. -4 -, 0 , 4 • 8 10
NORMALIZED DISPLACEMENT, 8/8,(0) STRUT I
15,------------------,-----------------,
/,'j""""~E~~--i3e 4E "~
~ 05.. I
Ior---------:7<lnili-;,f.,--Iro--1\DJfr-~"'-r_~'--'--------___\'"<l
'"-'
'"..,N...J -05<l
'"a:oz
-I ~1"0-----'8,------.':.----'-4'-----J,,----C0'----J,'----4L-----'.----8L-----',0
NORMALIZED DISPLACEMENT, 8/8,(b) STRUT 2
Fig. 3.26 Axial Load vs. Axial Displacement - Normalized
110

1.5.---------------------,r;--------------------,
-0.5
01---------------rT--HHf------------------l
1.03E2E
>-a. 0.5~
Qc(ooJ
oLLINoJc(::E
~Z -1.0
10
-1.5 '-__--':-__----': -':-__-..L__-----''-__...L______L L-__---L__---!
~ 0
NORMALIZED DISPLACEMENT, 8/8y(0) STRUT 3
1.5.------------------.--------------------,
1.0
-0.5
>-~ 0.5a.
01---------------f--fL-+-i'(--ffL-------------------IQc(
9oLLINoJc(
::E0::oZ -1.0
-I.:I'::-O--~:-----'::----L---~---!O:-----'::-------L---~--~----.JIO
NORMALIZED DISPLACEMENT, 8/8y(b) STRUT 4
Fig. 3.27 Axial Load vs. Axial Displacement - Normalized
111

5C
01----------+-+..L---1--..f--b-I.,..L---f---I--I--.L---------~
-0.5
1.5
••
1.0
,..0- 0.5Ci:'
oct9oI&JN-Ict:ia::oz -1.0
'C
-1·:ILO----'_S:----_...LS---_.L4---_2L-----lO---.l.----4.L---....JS-----lS-----l,o
NORMALIZED 01 SPLACEMENT, 8/8y(0) STRUT 5
1.5..--------------------,.------------------..,
1.0
,..0- 0.5
~
o~ OI------------+-....I-~..J__I__IIIc--+__J.-+__-----------_l
-I
oI&JN:::i -0.5ct:ia::oz -1.0
-1.5 L-__--.L__----l .l.-__---L__--',--__-'--__---.L__--'c--__-"-__---:"~o 0 2 4 S S ~
NORMALIZED DIS PLACEMENT, 8/8y
(b) STRUT 6
Fig. 3.28 Axial Load vs. Axial Displacement - Normalized
112

pinned, annealed, Dlt = 48pinned, annealed, Dlt = 33pinned, unannealed, D/t = 48pinned, unannlealed, Dlt = 33fixed. annealed, Dlt = 48fixed, annealed, Dlt = 33
Strut 1:Strut 2:Strut 3:Strut 4:Strut 5:Strut 6:
7 8 9 10 II 12 13 14 15 16CYCLE
653 42
., ~"''''''. \~\
\
'\ \ A _..A "'6......\ \ ~--~ A.......".\ ~ ~...... ........I::r--.u .. "-.... .. ......
X \ \ \::"" STRUT'\. '\. \ ••t>..••--l1--_-6-.-t>@*, '\. 0,. ' ....
'X ',- 0,....\'" --a '0............_..t~~~ \ ....0-.,'. " " '0..
X • ..lit. __ ,
• "'---"'lIl'r"-,~.-_••~. ~ 'b\ X \ "
+-•....,\ \ '''---o...--o®'\ ~~ -..e;~'• .ifi\\.!r '~
1.0
~ 0.99
0.80-J
0.7w->-....... 0.6
t-' 0t-' <l 0.5(.V
0-J
W> 0.4enen
0.3w0::a..::t 0.20u. 0.1x<l:E 0
Fig. 3.29 Deterioration of Buckling Loads
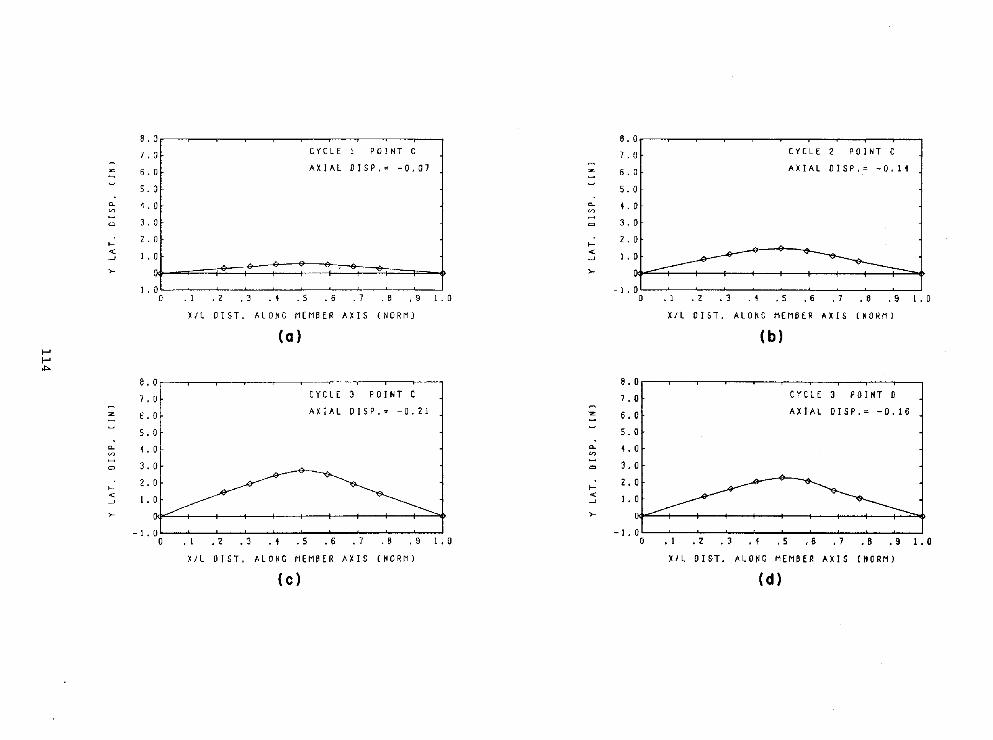
8. 0 8. 0
7.0 CYCLE 1 POINT C7 . 0t CYCLE 2 POINT C
AXIAL DISP.= -0.07~
AXIAL DISP.= -0.1'16. 0 z 6. 0-S. 0
~
S. 0c.. 4,0 c.. 4,0'" '"
3 . 0 - 3.0CJ
>- 2. 0>- 2. 0
<: 1.0 <: 1.0....J ....J
>- >- 0
-1.0 -1.00 .1 .2 .3 . i . 5 .6 . 7 . 8 .9 1.0 0 .1 .2 .3 . i .5 .6 . 7 .6 .9 1.0
XlL DIST. ALONG MEM8ER AXIS (NORM) X/L DIST. ALONG MEM8ER AXIS (N aRM)
(0) (b)t-'t-'
"""8. a 8 . 0
7 . 0 CYCLE 3 POINT C7.0t
CYCLE 3 POINT 0
AXIAL DIS P. = - 0.21~
AXIAL OISP.= -0.166.0 z- 6. 0
s. 0~ s. 0
c.. 4,0 Q. 4,0'" '"- 3.0 - 3.0CJ CJ
>- 2. 0 >-2.0
«: 1.0<: 1.0....J ....J
>- >-
-1.0 -1.00 .1 .2 .3 • 4 .5 .6 . 7 .8 .9 1.0 0 .1 .2 .3 • i .5 .6 .7 .6 .9 1.0
X/L 01 ST. ALONG MEMBER AXIS ( NORM) X/L 01 ST. ALONG MEMBER AXIS (NORM)
(C) (d)

8.0 8.0
7. 0 CYCLE 3 POINT E7. 0 ~ CYCLE 4 POINT C
A XI A L OISP.= +0.21 - AXIAL OISP.= -0.266. 0 z 6.0-5. 0
~
5.0
0- 1.0 0- 1.0V) V)- 3.0 - 3.0CJ Cl
I-2. 0 2.0
I-< 1.0 < 1.0--' --'
>- >-
-1.0 -1.00 .1 .2 • 3 • 4 .5 .6 • 7 .8 .9 1.0 0 .1 • 2 .3 • 4 • 5 .6 • 7 .6 .9 1.0
X/L 01 ST • ALONG MEM6ER AXIS (NORM) X/L 01 ST. ALONG MEM6ER AXIS (N 0 RM)
(e) (f)
I-' 8.0 8.0I-' CYCLE 5 POINT C
7 • 0 r CYCLE 6 POI NT CU1 7. 0- A X I A L OISP.= -0.35 - AXIAL OISP.= -0.35z 6. 0 z 6. 0-
5. 0~
5. 0
0- LD 0- 4.0V) V)- 3.0 - 3.0Cl <=>
I-2.0
I-2.0
< 1.0 "" 1 • 0--' --'
>- >- --1.0 -1.0
0 .1 .2 .3 • 4 .5 .6 • 7 • 8 .9 1.0 0 .1 • 2 .3 • 4 .5 .6 . 7 .6 .9 1.0
X/L 01 ST • ALONG MEM6ER AXIS (NORM) X/L OIST. ALONG MEM6ER AXIS (NORM)
(g) (h)
Fig. 3.30 Deflected Shapes - Strut 1 (1 in. 25.4 nun)

8.0 8. 0
7. 0 CYCLE 2 POINT A7. 0t
CYCLE 2 POINT C
AXIAL OISP.= +0.02~
AXIAL OISP,= -0.146. 0 z- 6. 0~
S. 05.0a- LO a- LO'" '"
3.0 - 3. 0c
2. 0 I-2. 0
I-< 1.0 <
I.°t~-I ...J
~>- >- o . .
- 1.0 -1.00 . I . 2 . 3 • 4 . 5 .6 . 7 . 8 .9 1.0 0 . I .2 .3 • 4 .5 .6 . 7 . 8 . 9 1.0
XIl 01 ST. ALONG MEMBER AXIS (NORM) XIl 01 ST. ALONG MEMBER AXIS (NORM)
f-'(a) (b)
f-'0'
8.0 8.0
7.0 CYCLE 2 POINT F7. 0 ~ CYCLE 3 POINT ~
AXIAL OISP.= +0.10~
AXIAL OISP.= -0.216.0 z 6.0-~ s. 05.0
Co. LO a- LO'" '"- 3.0 - 3.0c c
2.0 I-2.0
I-< 1.0 < 1.0...J -I
>- >-
-1.0 -1.00 • I .2 .3 • 4 .5 .6 . 7 .8 .9 1.0 0 .1 .2 .3 • 4 . 5 .6 . 7 .8 .9 1.0
XIl OIST. ALONG MEMBER AXIS (NORM) X/L DIST. ALONG MEMBER AXIS (NORM)
(c) (d)

8. 0 8. 0
7.0 CYCLE 4 POINT C 7,Or
CYCLE 5 POINT A
AXIAL DIS P . = - 0 . 28~
AXIAL DISP.= +0.23% 6. 0 " 6. 0-5. 0
~
5. 0a- 4 . 0 a- 4.0V> ''>- 3. 0 - 3. 0Cl Cl
>- 2. 0 >-2. 0
< I .0 <1. 0I...J ....J
. -~ ~
>- >- 0
-1. 0 -1.00 . I . 2 . 3 . 4 . 5 . 6 . 7 .8 .9 1.0 0 . I .2 .3 . 4 . 5 .6 . 7 .8 .9 1.0
X/L OIST. ALONG MEMBER AXI S (NORM) Xil OIST. ALONG MEMBER AXIS (N 0 RM)
(e) (f)
I--' 8. 0 8.0I--'
CYCLE 5 POINT C7. 0t
CYCLE POINT C-J 7. 0 8
AXI AL 01 S P . = - O. 35 ~
AXIAL DISP.= -0.356.0 z- 6.0
5. 0~
5. 0a- 4 . 0 a- 4.0V> V>
3.0 - 3.0Cl
>- 2.0 >-2.0
< 1 . 0 < 1.0...J ...J
>- >-
- I . 0 - I. 00 . I .2 . 3 .4 .5 .6 . 7 .8 .9 1.0 0 .1 .2 .3 . 1 .5 .6 .7 .8 .9 1.0
X/L OIST. ALONG MEMBER AXIS (NORM) X/L 01 ST. ALONG MEMBER AXIS (N 0 RM)
(g) (h)
Fig. 3.31 Deflected Shapes - Strut 2 (1 in. = 25.4 mm)

8. 0 8.0
7.0 CYCLE 3 POINT C7. 0t CYCLE 5 POINT C
AXIAL OISP.= - 0 . 20~
AXIAl OISP.= -0.35z 6.0 z 6.0-5. 0
~
5.00- 400 0- 400V) '"- 3 . 0 - 3.00 Cl
...... 2. 0 ...... 2.0< 1.0 <-' -' 1.0>- >-
-1.0 -1.00 . 1 .2 .3 • 1 .5 .6 .7 .8 .9 1.0 0 . 1 .2 .3 • 1 .5 .6 .7 .8 .9 1.0
X/L OIST. ALONG MEMBER AXIS (NORM) X/L OIST. ALONG MEM8ER AXIS (NORM)
(a) (b)
/-' 8. 0 8.0/-'00 7. 0 CYCLE 6 POINT A
7 . 0t CYCLE 6 POINT C~
AXIAL OISP.= - 0 . 05~
AXIAL OISP.= -0.35z 6. 0 z 6.0-5 . 0
~
5.00- 400 Q. 400V) V)
3.0 - 3. 0Cl
...... 2.0 ...... 2.0< 1.0 < 1.0-' -'
>- >-
- 1.0 -1.00 .1 .2 .3 • 1 .5 .6 . 7 .8 .9 1.0 0 . 1 .2 .3 . 1 .5 .6 .7 .8 .9 1 . 0
X/L 01 ST. ALONG MEMBER AXIS (NORM) X/L OIST. ALONG MEMBER AXIS (NORM)
(c) (d)

B. 0 8.0
7 . 0 CYC LE 6 POINT E7. 0 ~ CYCLE 6 POINT f
AXIAL OISP.= +0.05~
AXIAL 01 S P • = - O. 056. 0 . z 6.0-5. 0
~
5.00- 1.0 0- 4.0'" V)- :3. 0 - :3. 0Cl Cl
I-2 . 0 2.0
I-< 1.0 < 1.0--' --'
>- >-
-1.0 - 1.00 . I .2 .3 • 1 .5 .6 . 7 • B .9 1.0 0 . 1 .2 .3 • 1 .5 .6 .7 .8 .9 1.0
X/L 01 ST. ALONG MEMBER AXIS (N 0 RM) X/L OIST. ALONG MEMBER AXIS (N 0 RM)
(e) ( f )
8.0 8.0
I-' 7.0 CYCLE 7 POINT C7. 0 ~ CYCLE 9 POINT C
I-'~ ~
\.0 ~ 6. 0 AXIAL DISP.= -0.35 z 6.0AXIAL OISP.= -0.35-
5. 0~
5.0
0- 1.0 a. 4.0V) V)
:3. 0 - :3.0Cl
I-2.0
I-2. 0
< 1.0 < 1.0--' --'
>- >- v
- 1.0 -I. 00 .1 .2 .3 • 1 .5 .6 • 7 .8 .9 1.0 0 • 1 .2 .3 . 1 .5 .6 • 7 .8 .9 1.0
X/L OIST. ALONG MEMBER AXIS (NORM) X/L OIST. ALONG MEMBER AXIS (NORM)
(g) (h)
Fig. 3.32 Deflected Shapes - Strut 4 (1 in. = 25.4 rom)

8.0 8.0
7 . 0 CYCLE 3 POINT C7. 0t
CYCLE 5 POINT C
AXIAL OISP.~ -0.20~
AXIAL OISP.~ -0.30z 6.0 z 6. 0-~
5.05. 0Cl. i.0 C1. i.0V"l V"l
3. 0 - 3.0c
..... 2.0 ..... 2.0< I . 0 < 1.0...J ...J
>- >-
-1.0 -1.00 .1 . 2 .3 • 1 • 5 . 6 . 7 .8 .9 1.0 0 . I .2 .3 • 1 . 5 .6 . 7 .8 .9 1.0
XIL OIST. ALONG MEMBER AXIS (NORM) X/L 01 ST. ALONG MEMBER AXIS (NORM)
(a) (b)
I-' 8.0 8. 0N CYCLE 6 POINT A
7. 0tCYCLE 6 POINT C0 7 . 0
AXIAL OlSP.= +0.01~
AXIAL OISP.~ -0.306. 0 z- 6.0~
5.0S. 0C1. i.0 C1. i.0V"l V"l- 3. 0 - 3. 0"" ""
2.0 ..... 2.0.....< 1.0 < 1.0...J ...J
>- >-
-1.0 -1.00 .1 .2 . 3 • 1 . 5 .6 . 7 . 8 .9 1.0 0 • I .2 .3 • 1 .5 .6 .7 .8 .9 1.0
XIL OIST. ALONG MEMBER AXIS (NORM) X/L OIST. ALONG MEMBER AXIS (NORM)
(c) (d)
Fig. 3.33 Deflected Shapes - Strut 3 (1 in. = 25.4 rom)

B. a 8.0
7.0 CYCLE 1 POINT C7 . U~ CYCLE 5 POINT C
AXIAL DISP.= - 0 . 22~
AX I AL DIS P. = - O. 35z 6.0 z 6. 0-s. a - 5 . 0
c.. 1.0 c.. 1.0'" '"
3.0 - 3 . a'"f-
2. a ..... 2 • a<:
1. a <:1 . 0...J ...J
>- ~ >-
-1.0 - 1 • 00 .1 . 2 . 3 . 1 .5 . 6 . 7 . B • 9 1.0 0 .1 • 2 . 3 .1 . 5 .6 . 7 .8 .9 1.0
X/L DIS T. ALONG MEMBER AXIS (N DRM) X/L o[S T. ALONG MEMBER AXIS ( NORM)
(0 ) (b)
8 . 'J B. 0f-'
7 . 0 CYCLE 8 Pa I NT C 7.0~ CYCL E 10 POINT CNf-' ~
AXiAL 0; .') P . ~ ,0. 10~
AXIAL OJ SP. = - O. SO6.0 z 6. a-5. 0 - s. 0
a.. 1 . 0 ~ 1.0'" ""
1.0 - 3 . a-=>
f-l. 0 ,- 2. 0
< 1 . a < 1 . 0...J ~
>- >-
- 1 . 0 -,1 . 0a .1 • 2 .3 .1 • S • 6 . 7 . 8 . 3 I . 0 0 .1 . 2 • 3 . 1 • 5 . 6 . 7 . 9 . 9 1.0
XI L DIS T. ALONG MEMBER AXI" (N 0 RM) X/L oI ST. ALONG MEMBtR AXIS (N 0 RM)
(C) (d)
Fig. 3.34 Deflected Shapes - Strut 5 (1 in. 25.4 mm)

8.0 8.0
7.0 CYCLE 3 POINT C7.0t
CYCLE 5 POINT C
AXIAL OISP.= - 0.21~
AXIAL OISP.= -0.35z 6.0 z- 6.0
5.0~
5.00.. 1.0 0.. 1.0V) V)- 3.0 - 3.0'" '"I-
2.0I-
2.0< 1,0 <
I. Or-' -'
>- >- 0
-1.0 -1.00 .1 .2 .3 • 1 .5 .6 .7 .8 .9 1.0 0 .1 .2 .3 • 1 .5 .6 . 7 .8 .9 1.0
X/L 01 ST • ALONG MEMBER AXIS (NORM) X/L OIST. ALONG MEMBER AXIS (NORM)
(0 ) (b)~NN
8.0 8.0
7. 0 CYCLE 6 POINT C7 . 0t
CYCLE 6 POINT 0
AXIAL 01 SP. = - 0 . 35~
AXIAL OISP.= -0.26z 6. 0 z- 6.0
5. 0~
5.00.. 1.0 0.. 1.0V) V)- 3.0 - 3. 0'" '"I-
2.0I-
2 . 0< 1.0 < 1.0..J -'
>- >-
-1.0 -I. 00 .1 .2 .3 • 1 . 5 .6 .7 • 8 .9 1.0 0 .1 . 2 .3 . 1 . 5 .6 . 7 .8 • 9 1.0
X/L OIST. ALONG MEMBER AXIS (NORM) X/L OIST; ALONG MEM8ER AXIS (NORM)
(c) (d)

8.0 8.0
7.0 CYCLE 7 POINT A7.0t
CYCLE 7 POINT C
AXIAL DISP.= +0.26 ~ AXIAL OISP.= -0.35z 6.0 z 6.0-5.0 ~
5. 0"- LO "- LO"" ""- 3.0 -Q Q 3.0
to-2.0
to-2.0
< 1.0 <-J -J 1.0>- >-
-1.0 -1.00 .1 .2 .3 . 1 .5 .6 .7 .8 .9 1.0 0 .1 .2 .3 . 1 .5 .6 . 7 .8 .9 1.0
X/L OIST. ALONG MEMBER AXIS (/IORM) X/L OJ _ -;- . ALONG MEMBER AXIS (/IORM)
(e) ( f )
8.0 8.0
7.0 CYCLE 9 POINT C7. 0~ CYCLE 11 POINT C
AXIAL OISP.= -0.15~ AXIAL DISP.= -0.55I-' z 6.0 z 6.0tv - -w ~
5.0~
5.0"- 1 . 0 c.. LOV) V)- 3.0 - 3.0Q Q
to-2,0
to-2.0
< 1.0 < 1.0...... ......>- >-
-1.0 - 1.00 • I .2 .3 • 1 .5 .6 .7 .8 .9 1.0 0 .1 .2 .3 . 1 .5 .6 .7 .8 .9 1.0
XIl oI ST. ALONG MEM8ER AXIS (/IORM) X/L oI ST. ALONG MEM8ER AXIS (NORM)
(g) (h)
Fig. 3.35 Deflected Shapes - Strut 6 (1 in. = 2.54 rom)

8.0 8. 0
7.0 7.0~ -:z: 6.0 z
6. 0 [~ ~ \ STRUT 2, LP-4C
5.0STRUT 2, LP-4C - ( PINNED)(THICK WALL) 5. 0
a.. LO Q. LOV)
/----~V')
~
3.0~
3.0t::I 0
2.0y'" "if<....
2 0~ ~STRUT 6, LP-4C..... /Y~STRUT 1, LP-4C '-- ..... • (FIXED)< 1.0 // (THIN WALL) -.....;: «:
1.0 *--*-....J "" ....J
V "'" " ---~-~. . ~~~->- >-
-1.0 - 1 . 00 .1 • 2 .3 . 1 • 5 .6 . 7 .8 .9 1.0 0 . 1 . 2 .3 • 4 . 5 .6 • 7 • B • 9 1.0
XIL OIST. ALONG MEMBER AXIS (NORM) XIL 01 ST. ALONG MEMBER AXIS (N 0 RM)
(a) THICK WALL (ST. 2) YS. THIN WALL (ST. I) (b) PINNED (ST.2) VS. FIXED (ST.6)
8. 0 8. 0
I-' 7 • 0 7. 0t\.) - ->I:> :z: 6.0 z 6. 0
~ ~- 5. 05. 0
a.. 4 • 0STRUT 2, LP-3C Q. 4.0 STRUT 2, LP-4C
V) (ANNEALED) V') (ANNEALED)~
3. 0~
3.00
""-2 . 0 ..... 2. 0 ~.....
«:1 . 0 *-*--*-~ «:
1.0 ~....J _--¥- ....J
>- ---- >- 0,
- 1 • 0- 1 . 00 . I . 2 .3 • 4 .5 .6 . 7 . B .9 I . 0 0 • I . 2 .3 • 4 • 5 • 6 . 7 . B . 9 1 . 0
XIL [': CT. ALONG MEMBER AXI S ( NORM) X/L DIST. ALONG MEMBER AXIS ( NORM)
(c) ANNEALED (ST. 2) VS. UNANNEALED (ST.4) (d) ANNEALED (ST. 2) VS. UNANNEALED (ST. 4)
Fig. 3.36 Deflected Shapes - Comparisons between Struts(1 in. = 25.4 rom)

1.6 1.6~ ~
I: 1 • 4 I: 1 . 4a: a:0 0
1.2z 1 . 2 z~
1.0 1 • 0 LP-3Cc.. c.. LP-6CV)
· BV)
· B~ ~
0 0
~,· 6 .6 /'f-- f-- ')If
'-.:~< • 4 < · 4 /'-' ~ ...J /" ~)-. · 2
~ )-. • 2 ~ ~
~~
.1 . 2 . 3 • 4 . 5 .6 . 7 .8 . 9 1.0 0 .1 . 2 . 3 • 4 . 5 . 6 • 7 .8 .9 1.0
X/L DIST. ALONG MEMBER AXIS [N 0RM) X/l DIST. ALONG MEMBER AXIS [NORM)
(0) STRUT I (b) STRUT 2
1.6 1.6~ ~
I-' :E: 1 • 4 :E: 1 . 4N a: c:U1 0
1 • 20
1 .2z z~
1.0 1.0c.. LP-3C /" c..V)
· B r V) .8 LP-3C~ ~
0
V~LP-6C ~ 0
/~LP&.6 .6f--
~ "" f-- ~< · 4 < · 4...J 7' ...J.~
)-. .2 f" )-. · 2 "y~~, I . I I I
0 .1 • 2 . 3 • 4 .5 . 6 • 7 .8 .9 J • 0 0 .1 • 2 • 3 • 4 . 5 • 6 • 7 .8 • 9 1.0
X/L DIST. ALONG MEMBER AXIS [NORM) X/L DIST. ALONG MEMBER AXIS [NORM)
(C) STRUT 4 (d) STRUT 6
Fig. 3.37 Deflected Shapes - Comparisons between Cycles

8
1514
®
1312II10
RIDGID PLASTIC P~
ELEMENT~__ !lEi:
I: IPy :
t "Py I __I-*-- L + I 8
\-8Ci -I I-- Ai
Ej =STRUT ENERGY DISSIPATED IN CYCLE i
RPj= Py <8Ei + 28Ci +8Ai )
97 8CYCLE
+--+-+-+~+--+~ STRUT
+~+-+®
543
pinned, annealed, D/t = 48pinned, annealed. D/t = 33pinned, unannea1ed. D/t = 48pinned, unannealed. D/t = 33fixed. annealed. D/t = 48fixed, annealed. D/t = 33
2
Strut 1:Strut 2:Strut 3:Strut 4:Strut 5:Strut 6:
0' , I , I , , , I , , , , , , ,
o
1.0
>uzwU
LLLL 05w·za.....(feneno
wl~II
f-Jtv(j\
Fig. 3.38 Energy Dissipation Efficiencies per Cycle
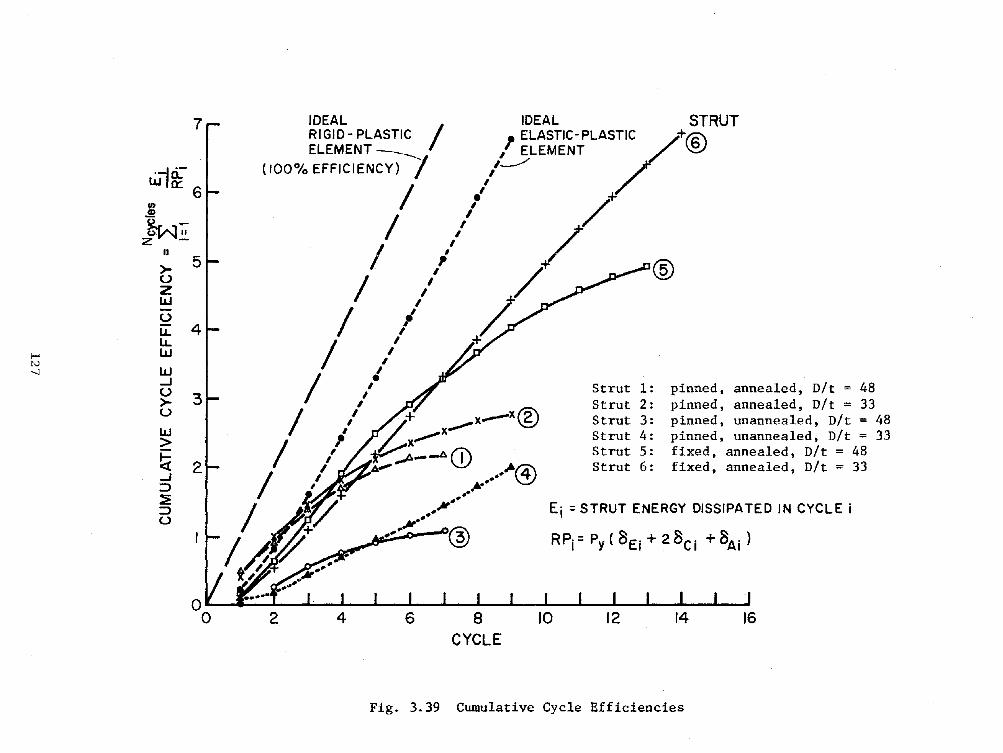
161412108CYCLE
642O· • ' , , , , , , , , , , , , , ,o
7 IUt:AL IDEAL STRUTr- _. _.- _.. -_. I 1 ELASTIC-PLASTIC /:t-@6
, ELEMENT
.-1 a:- {IUU-lot:t"t"Il.. It.NI.T} I /"---" /WIll:: /'6 ,*(/) , /~ I
JH~ /,/ /: 5 1,1 /:t= .-c@u /' ~~ / ~u IlL. 4 /,.J..: ;LL /' ~~ W ,
N ,~ W ,
d /,' Strut 1: pinned, annealed, D/t = 48G :3 , Strut 2: pinned, annealed, D!t = 33/ " Z·+ x--X
@Strut3:Pinned,unannealed,DIt=48~ /': x""""'"x Strut 4: pinned, unannea1ed, D!t = 33t- ,/ ~-..ACD Strut 5: fixed, annealed, D/t = 48« 2 I A"" Jt.@ Strut 6: fixed, annealed, D!t = 33~ /' /::::> , ....
~ / _~_.... E'I =STRUT ENERGY DISSIPATED IN CYCLE i" ......, JiI'.
-- -4fi'1 8 8 8-~ RPj = Py ( Ei + 2 Ci + Ai)
Fig. 3.39 Cumulative Cycle Efficiencies

CENTERPLASTICREGION #1
P = Mp~
P IMp =7: I~...---- L/2---.j
~--P
a) PINNED - END STRUT
HEADPLASTICREGION
y~
CENTERPLASTICREGION#I
PLASTIC
I...HINGE .1
POINTS OFINFLECTION
FOOTPLASTICREGION
~
2MpP=TP 2
Mp= /:1
-p~-M p I
b) FIXED - END STRUT
Fig. 4.1 Formation of Plastic Hinges
128

fL =~ cos (77 ~ )",,"""'\.
","'\.
I I "I I I I I '\.I I I I I •
//1.0
//
//
//
//
////
77=l/Py
1.0
~/
//
//
///
//
//
FULLY PLASTICINTERACTION CURVE
FIRST YEILDINTERACTION CURVE
t-'tv\D
Fig. 4.2 Axial Load-Bending Moment Interaction Curves forElastic-Perfectly Plastic Thin Tubular Pipe Section

3LB2C
3
SECTION OFLOCAL BUCKLING
CENTER OFPLASTIC HINGE
LENGTH OFPLASTIC REGION (d'JLOCAL BUCKLING
5 __ .-- __ ,,-.--- .:::.:::- /'" .A- -,-__ - """" __-/ .,..t-. __
.,.'.,.- ..".,.--- • - •__ """W'",;'. • .........., '.,. .,. ..".,.- . .--........... I .~"".,. .,. ......- . .----ok"":"'''' .,............ .--.• IC
i
£ f f f t f f f]17 15 13 10 7 5
GAGE LOCATIONS
15
10L. 13 IN.
~
'0)(-z-........
enz«-0«0::-f-'
W
W0
0:::::>
~>0:::::>u
Fig. 4.3 Curvatures within Plastic Hinge - Strut 1 (Load Points C)(1 in. = 25.4 rom)

rt)
'0)(
CENTER OF-ZPLASTIC REGION- 5.........
Ienz«
2E-0
"« 0 -
""e----_-e IEa:: --- -- -- --W
-;........
lSECTION OF
a::I-' ::>w J- -5I-' «
I LOCAL BUCKLING>a::::>
iU
b I I Itt t t d17 15 13 10 7
GAGE LOCATIONS5 3
Fig. 4.4 Curvatures within Plastic Hinge - Strut 1 (Load Point E)(1 in. = 25.4 mm)

20
/rt~,. "/ I~.""""'. '"/ .1'" ...........~
/ .T 'I ~.,/ ,-/ /' ,~._.,
//' ~3g~tE '--.. '-- "~. SECTION ~, '''.
,/ ) '" ~'/If "
/ /~ " ~ 3C, I '~~4C
I LENGTH OF PLASTIC HINGE (fY 4C = ISIN ~'.. 5LB... ~ ·1
~ f f f t f f f----~17 15 13 10 7 5 3
GAGE LOCATIONS
o
5
10
15
fC')
'0)(-z-'"(/)Z<t:-0<t:0::-
f-' Ww 0::N
:::>t-
~0:::::>U
Fig. 4.5 Curvatures within Plastic Hinge - Strut 2 (Load Points C)(1 in. = 25.4 mm)

35
t.
13 10 7
GAGE LOCATIONS
LOCALBUCKLESECTION
. ~,/r ', -/ .
~~I~I
II
5
0 1 '" I ~r ~ <
b f f f t f f f ~17 15
10
-5
rt>10)(-z-"'-enz<{-0<{a::-
I-' WLV a::LV
:::::>.....<{>0::::::>u
Fig. 4.6 Curvatures within Plastic Hinge - Strut 2 (Load Points E)(1 in. = 25.4 rom)

5
)(z 0
"(J)
z«o -520«Q: 5-
24 28
FOOTPLATE
IC
-- IE
32
-- 2C-- 2E
WQ::::>
~ 0.-.------.-~~~------1Q::::>U
-5 '--- ---I ....L.-__--L _
20 24 28 32GAGE LOCATION
Fig. 4.7 Curvatures within Foot Plastic Region - Strut 5(1 in. = 25.4 mm)
134

5FOOTPLATE
3228
......~-----
24
,-,----41,..---.... - -
-5 I20 24 28 32
GAGE LOCATION
)(
- 0 I-----~~:::::::~~-...",..----j:
wa:::::>
~ a t---:;;;;~7~?~~=~~-a:::>u
z
"enz<X:o -520<X:a: 5-
rt)
'0
Fig. 4.8 Curvatures within Foot Plastic Region - Strut 5(1 in. = 25.4 ~)
135

- 6C
FOOTPLATE
•••~--.._------'Itc--___I!!~ 6 E
!!~
5
5
~~~ 4C
111...o---.......-+-~-~::.:r4E
•••- 5 '-----'------''---'---
10
3E
:~: 5C
FOOTPLATE
- 3C5
It)
'0)(
0-z........enz« -5-0« 10a::-wa::::::>.- 5«>a::::::>u
0
-5 24 28 32 -5 24 28 32
GAGE LOCATION
Fig. 4.9 Curvatures within Foot Plastic Region - Strut 6(1 in. = 25.4 mm)
136

- LB
FOOTPLATE
,--...-- BC
5
5
o
-5 '----...1-_1...---1..__
- 9C
- 7C
FOOTPLATE
,',
.',
';:...... ..-of
5
5
o1-----7-----1
wa::::::>le::{
>a::::::>u
-
z"(f)
z 5« _ ~ ..L.-_I...---1..__
~ 10a:::
.'..'.::::::
'?o 111'.'
:. 0 I----~--~-_t!~! 7E
i
-5 2~ 28 3'2 -5 24 28 32
GAGE LOCATION
Fig. 4.10 Curvatures within Foot Plastic Region - Strut 6(1 in. = 25.4 mm)
137

I-'W00
20wa::::Jrt>~ 1015> )(a:: -::J Zu ::::
(/) 10~ Z::J «~ 0X « 5« a::~ -
Strut 1:Strut 2:Strut 5:Strut 6:
pinned, annealed, D/t = 48pinned, annealed, D/t = 33fixed, annealed, D/t = 48fixed, annealed, D/t = 33
10 20 30 40 50 60 70
INELASTIC ROTATION (RADIANS X 10-3)
80 90
Fig. 4.11 Maximum Curvature vs. Inelastic Rotation(1 in. = 25.4 mm)

wc::::::>
~40> SECTION OFc::
::::>", LOCALU'O BUCKLINGU-;~ _30enz«-..J'Wen ~ LOAD
I-' Z ~ 20 -. POINTw - -\.D
W 0 I ------- I
~ ~3LB>«_0: ~ ..-------- ~:3A~ - 10
2D..J::::>~
0 1 r:=:== ! t ~r r ----.... 2A::::> ,.. I DU
17 15 13 10 7 5 :3
GAGE LOCATIONS
Fig. 4.12 Cumulative Inelastic Curvatures with the Center Plastic Hinge - Strut 1(1 in. = 25.4 rom)

SECTION OF
w . - - ._ LOCAL BUCKLING
0:: 50::>.-~0:: 40::>UoU-;try Z 30<3:::::: .
~ ~'"LOAD...J en I IWz I ~ POINT
I-' Z « 20of:>, - ~ ~5LB0 wO>«
~i5A-0::
---------r-- 4D<3: 10...J:::::> I I I ~ ~4A~::>
0 1.
"'3DU I I I 1 I I17 15 13 /0 7 5 3
GAGE LOCATIONS
Fig. 4.13 Cumulative Inelastic Curvatures within the Center Plastic Hinge - Strut 2(1 in. = 25.4 mm)

",
·0)(
U -40- zI- SECTION OFCf) .......
rLOCAL BUCKLING<t Cf)
-J ZW <t 30Z -
0
W<t LOAD0::
> - 'POINT- 20I- w 5LB<t 0:: 5A-J :::> 4D:::> I-~ ~:::> 10 4AU 0:: 3D:::>
u 3A 2D2A
020 24 28 32
GAGE LOCATIONS
Fig. 4.14 Cumulative Inelastic Curvatures within the Foot PlasticRegion - Strut 5 (1 in. = 25.4 mm)
141

LOAO", SECTIONOF~ POINT·0
LOCAL 10LB)( 90 BUCKLING-z-" lOAenz 80<{ 90-0<{a:: 70- 9Awa::::J 80r- 60~
8Aa::::JU
50U 70r-en 7A<t....J 40w 60Z
w 6A> 30-r-<t 50....J::J 5A~ 20::J 40U
4A10
30
020 24 28 32
GAGE LOCATIONS
Fig. 4.15 Cumulative Inelastic Curvatures within the Foot PlasticRegion - Strut 6 (1 in. = 25.4 nun)
142

0
M
ol-I;jl-Iol-Itf.l
I
l=:T'lClll-I
(J)ol-Itf.l
0 It) Z M
0 Cll'r-!
0 10
~~
I'- tJ0 U 'r-!-., ---+- 0 ol-I0 0 CIl
CllIt) --I M
Q)
10 Wl=:
0 H
C> Q)
« :>I'- 'r-!
0 (!) ol-ICll
I I M
§<{ 0 <{ t.)
r() N N\0M.-::t
btlT'l~
w ~ N 0o 0 0 r-----1_--L_....
o 0 d(NI/NI) NI'i1~.LS 31\1.L'i1lnV\ln::>
143

<t
z....... 0.06z ,
50-z I 5A-«cr
~ 0.04 40-I.LJ>~ 4A-
t-'II:> ...JII:> :=)
~ 0.021 30-
:=)
1 3A-u
20-
t- 1° ' tt1tttj ~ +17 15 13 10 7 5 3
GAGE LOCATIONS
Fig. 4.17 Cumulative Inelastic Axial Strain - Strut 2

(f.0.10
-3D
-10
-3A
-60-6A-50-5A
-40enI-
-4A ~oa..cg.....J
-20
-2A
+I CENTER OF
$LASTIC HINGE60
6AI
50/
5A/
40/
4AI
3D/
3AI
20
o
0.08
0.02
0.06
0.04
z.......z
Z<t0:
Inw>~.....J::::>::!:::::>u
i-'
*'"1Jl
c c c c c c c c
4 8 12
GAGE LOCATIONS16 20 24 28 32
Fig. 4.18 Cumulative Inelastic Axial Strain - Strut 5

oc c c ccccc
2Atj;t ~
10
~I
0.10I
6D-\\ II
+ 0.08 -:2-"
I
:21 --0.06 :2
«£r60 ....en60
6A lLJ>
en
0.04 ....
.... 4A-
50 «
:2
....J
0
5A =>
I-'
~
"'" a.. 3D-
=>
(J\
0
40"",,- (,)
<t0
4A.0.02
....J "'2/\ _
4 8 12
GAGE LOCATIONS16 20 2428 32
Fig. 4.19 Cumulative Inelastic Axial Strain - Strut 6
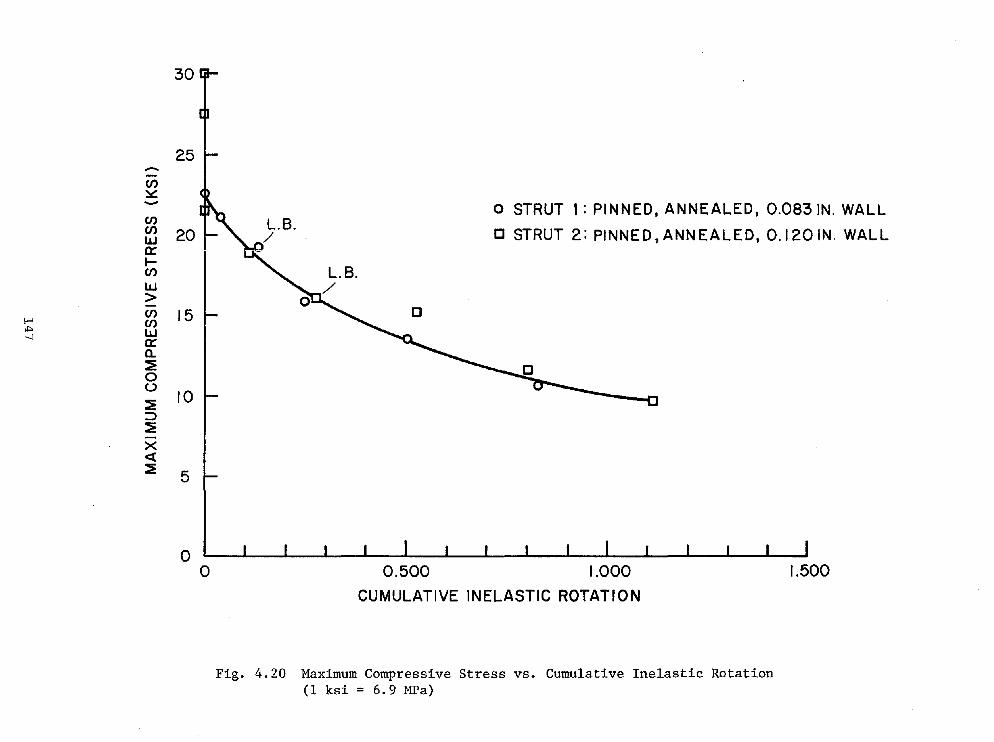
30
25-en~- o STRUT 1 : PINNED, ANNEALED, 0.083 IN. WALLen
20~ L.B.en [J STRUT 2: PINNED,ANNEALED, 0.120IN. WALLlIJ _/a::~enlIJ>- 15 L - "'- [Jen
f-' eno!'> lIJ-.J a:a..::?10u
10::?1:::>::?1-x<t::?1 5
oo 0.500 1.000
CUMULATIVE INELASTIC ROTATION
1.500
Fig. 4.20 Maximum Compressive Stress vs. Cumulative Inelastic Rotation(1 ksi = 6.9 }Wa)

40
COMPRESSION TEST (CYCLIC CURVE I)
30~ r -- -::::::-:=:::- . 12!±llJ $
.".,.. ..".,...- "",..,..- ".. .CYCLIC (j(f)
X~CYCLICCURVE 3~ TEST-(f) 20 I~/ CYCLIC CURVE 2(f) / ./
I-'w
..,. 0:: ~ ./ I , I ECD .- •(f) /
10 ./.
o r ! I I I I I COMPRESSION0.0 0.004 0.008 0.012 TEST
I I I I I I I
0.0056 0.0096 0.0136 0.0176 CYCLIC CURVE 2I I I I I I I
0.0160 0.0200 0.0240 0.0280 CYCLIC CURVE 3
CUMULATIVE INELASTIC STRAIN
Fig. 5.1 Stress-Strain Curves from Cyclic Test - Annealed Material(1 ksi = g.9 MPa)
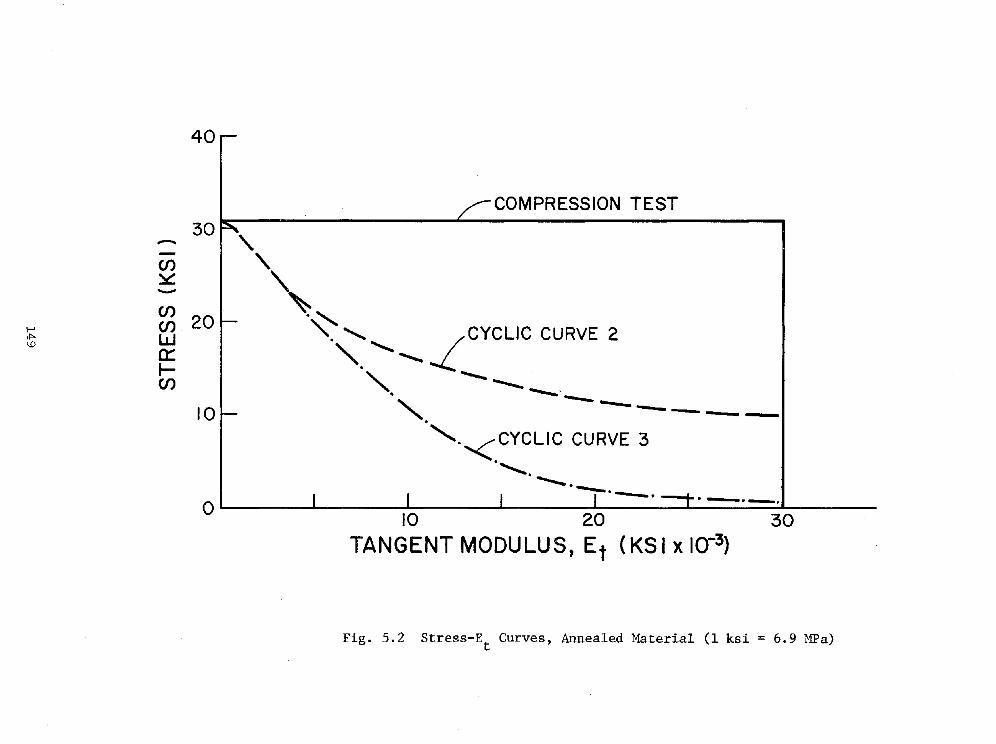
40..-
/COMPRESSION TEST
enen 20 I-W0::l-en
101-
en~
_ 30F,
'\
~.~
".". /CYCLIC CURVE 2" . ......... ,,--L...._" ------. --'--'" ------
·'.,<,CYCLIC CURVE 3
."""-...............--
01 1 I 1 I ·-·=j=°-·-·IL.- _10 20 30
TANGENT MODULUS, Et (KSI x 10-3)
-I-'
"'"\rJ
Fig. 5.2 Stress-Et
Curves, Annealed Material (1 ksi = 6.9 MPa)

40
KL/r =25 54 COMPRESSION TEST
30
--(/)~-
I-'(/) 20
U10
(/)wa::l-(/)
10
jCYCLIC CURVE 2~,.'..........." ""."...........~.; ------. ----........................... ----.--.
CYCLIC CURVE 3 --.---_._
o I 20 I 40 I 6'0 80 100 120 140 160 180
KL/r
Fig. 5.3 Stress-KL!r Curves, Annealed Material (1 ksi = 6.9 MFa)

x30
en 0en 0w 20a::I-en...J THEORETICAL<{u Kt/r =54I- 15a:: o BRACE Iu
[] BRACE 2
0.005 0.010 0.015 0.020
CUMULATIVE INELASTIC STRAIN (IN/IN)
o
THEORETICAL
0.005 0.010 0.015 0.020
CUMULATIVE INELASTIC STRAIN (IN/IN)
K t/r = 25
o STRUT 5
[J STRUT 6
o
30
enenwa::I-en 20...J<{U
I-a::u
-
Fig. 5.4 a VS. CIScr
(1 ksi = 6.9 MPa)
151
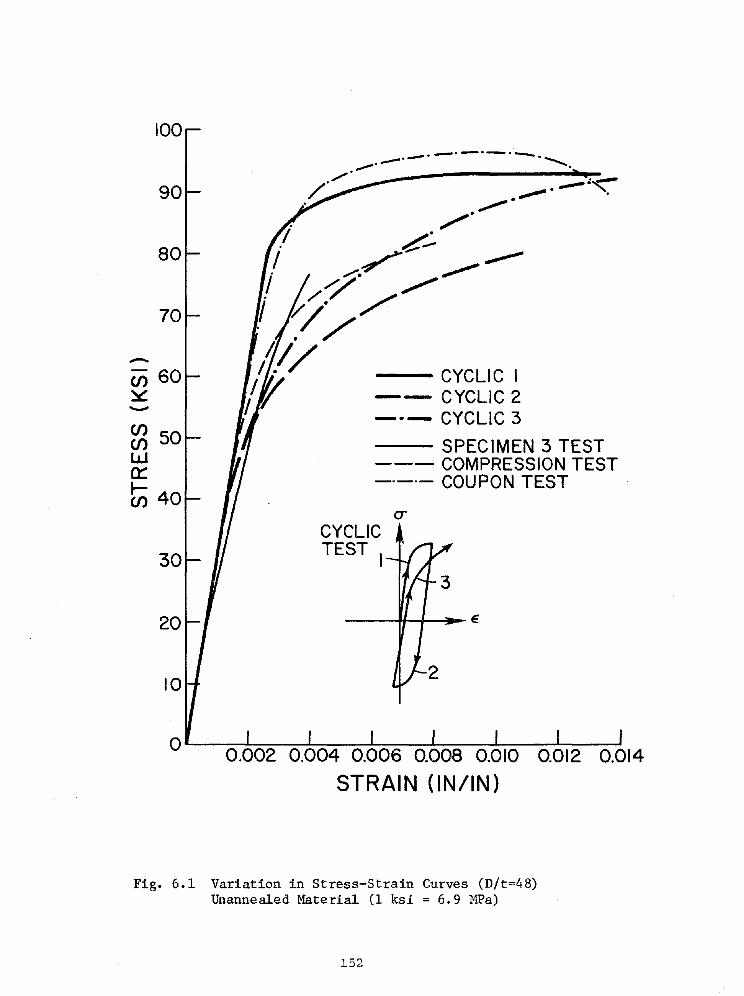
100
90
80
70
-en 60~-en 50enw0:::
~ 40
30
20
10
-- CYCLIC I-- CYCLIC 2--- CYCLIC 3
-- SPECIMEN 3 TEST-.-- COMPRESSION TEST_.-.- COUPON TEST
CYCLICTEST I
---ff--+--~ E
OIL..------..L...--..L-_--L-__....L.-_---'-__.....a...-_----'
0.002 0.012 0.014
Fig. 6.1 Variation in Stress-Strain Curves (D/t=48)Unannealed Material (1 ksi = 6.9 MPa)
152

90
80
70
60-en~ 50enenw 400:::Ien
30
20
10
.-. ---_.-.. -........ .........--.:..--."'" ~. -::;..;.-.." ~.~. "/;?""
P/,/
/ /' --- --- ---// ---
.'/ ...---# ,....---"'-'I //"",.... CYCLIC I
I~· / -- CYCLIC 2l' // _.- CYCLIC 3
.' / SPECIMEN 4 TEST~I/ --- COMPRESSION TESTV _._.- COUPON TEST
CYCLICTEST
3
-,..--+-+----:)1- E
2
O-----'---~----'---'---..&....-..:--~-----~----:"0.002
Fig. 6.2 Variation in Stress-Strain Curves (D/t=33)Unannealed Material (1 ksi = 6.9 MPa)
153

202020
COMPRESSION TEST--- CYCLIC 3
1001 100r 100
..--/~
80 I- ~ 80~\\ 80--en~
~ 60~ Ii 601- '\."'-. 60
enW
I-' 0:::U1~
~ 40~ I 401- ........ --, 40
0 0 I 0.004 I 0.008 I 0.012 I 00 10 20 30
TANGENT MODULUS, Et (KSIx 10-3 )
Fig. 6.3 Stress vs. Strain, Et
, L/r (0.083" w.t.), Unannealed Material(1 ksi = 6.9 MFa)

COMPRESSION TEST--- CYCLIC 3
IOO~100
IOO~---...-
"/' 80 '\80 / 80 \- / \ \- \en / \~ \~ 60 / 60 \ 60 \\en / \
I-' W \\U1 0:: \U1 t- \U) 40 40 , 40
~ :.\
20U 20L
~~. 20
, II I __ • __O· '-..2-. 1 _
o 00 10 20 30
TANGENT MODULUS, Et (KSIx 10-3 )
Fig. 6.4 Stress vs. Strain. E • L/r(1 ksi = 6.9 MFa) t
(0.120" w. to), Unannea1ed Material

50,------------,------------------..,------------,
IE 2E
Ie
2B
2E
IE
LB
OTUBING
7G 8G
20
30
40
-30
-20
~52 10
C 3A« 01-------/Y'----+ft"-'I:.:.A-----------------::::-':ltHl''------t-HL-L\--\-------j9.J~ -10
~
-40
0030.020.01o-0.01-0.020.020.01o-0.01-0.02-50 '------'-----'----"'--------'------'-----'------'-----'----"'--------'-----'
-003
STRAIN, INCHES I INCH
Fig. A.1 Strut 1 - Axial Load VB. Strain (Gages 7 and 8 - Cycles 1-5)
50,-------------.;------------------..,------------,
IB
2E
IB
0"""Gil20
40
30
-30
-20
ena.52 10
ci'« Of---------7Iy+tf'---,i/'t-t-'---------------'7I'c-"f--Jc--!f"''-+1I<c::-f---'--------j9.J~ -10
~
-40
0030020.01o-0.01-0.020.020.01o-0.01-0.02
-50 L-__--'- -'-- L-__--'- --'- -'--__--'- -'-- L-__-----'- -'
-0.03
STRAIN, INCHES liNCH
Fig. A.2 Strut 1 - Axial Load vs. Strain (Gages 9 and 11 - Cycles 1-5)
156

50
40 0'""'"lOG. 12G
2E 2E 3E 4E 5E30 IE IE
20
rnQ.
10~
0<l:
00
9 2...J~ -10X<l:
LB-20 2C4B
3BIB 2B
-30GAUGE 10 ~
-40
-50-0.03 -0.02 -0.01 0 0.01 0.02 -0.02 -0.01 0 0.01 0.02 0.03
STRAIN. INCHES / INC H
Fig. A.3 Strut 1 - Axial Load vs. Strain (Gages 10 and 12 - Cycles 1-5)
IEZE IE 2E 3E3E
'( I4E 4E'0IG 2G
- TUBING
-
-20
Ili~ l?iA ~~ /4A5A
It:3A 20/ /' '\ 5A
'" 403D 40
r- 3D 3A
I-
5B5B
13B
4BI- 48
36 GAUGE 2 GAUGE I
f-- 2826
I II
I I I IIB I I
50
40
30
20
rnQ.~ 10
oC3 0.::J
~ -10X<l:
-20
-30
-40
-50-0.03 -0.02 -0.01 o 0.01 0.02 -0.02 -0.01 o 0.01 0.02 003
STRAIN. INCHES / INCH
Fig. A.4 Strut 2 - Axial Load vs. Strain (Gages 1 and 2 - Cycles 1-5)
157

503E
3E4E 4E
40 0'"""7G 8G30
20
(J)a.~ 10
ci<t
09 3A 4A 3D SA....J<t -10 5CX<t
4C-20
4B 5B 4B-30
3B 3B
-40GAUGE B GAUGE 7
'"<:
-50-0,06 -0.05 -0,04 -0,03 -0.02 -001 0 0,01 -0.01 0 0.01 002 0.03
STRAIN,INCHES / INCH
Fig. A.5 Strut 2 - Axial Load vs. Strain (Gages 7 and 8 - Cycles 1-5)
50~----------.,.--------------------,-----------_,
4E
5A
3E
4B
38INITIAL
BUCKLING
5C
4A
5A
3E
4E
5B
Gil20
40
30
-30
-40
-20
~:;z 10
og ol-------------'ifC-----,H'k---------------+t'---7f-+------------j....J....Jg -10X<t
0,030,020.01o-0.01-0,020.020,01o-0,01-0.02
_50L.....__---l. --'- ..L...__----' --'- ...L...__----' --'- -'- -'--__--'
-0.03
STRAIN, INCHES / INCH
Fig. A.6 Strut 2 - Axial Load vs. Strain (Gages 9 and 11 - Cycles 1-5)
158

4E3E
3A 4A
4E3E
5B 4B
3B3B INITIAL
INITIAL BUCKLINGBUCKLING
GAUGE 12 GAUGE 10
-003 -002 -DOl 0 0.01 -0.01 0 0.01 0.02 0.03
50
40 0'""'"lOG 12G30
20
(/)a..:lo: 10
0octg 0
-oJoct -10Xoct
-20
-30
-40
-50-0.06 -0.05 -0.04
STRAIN ,INCHES I INCH
Fig. A.7 Strut 2 - Axial Load vs. Strain (Gages 10 and 12 - Cycles 1-5)
50
4E 3E 3E 4E
40 0'""'"13G 14G30
20
(/)a..:lo: 10
0 4D 4A
3 3A 4A0
3D-oJ 5Aoct -10Xoct
4C 3C-20
LB
3C 5B\B-30
3B3B
-40 GAUGE 14 GAUGE 13
-50-0.06 -005 -004 -003 -002 -DOl 0 0.01 -0.01 0 0.01 002 003
STRAIN, INCHES liNCH
Fig. A.8 Strut 2 _. Axial Load vs. Strain (Gages 13 and 14 - Cycles 1-5)
159
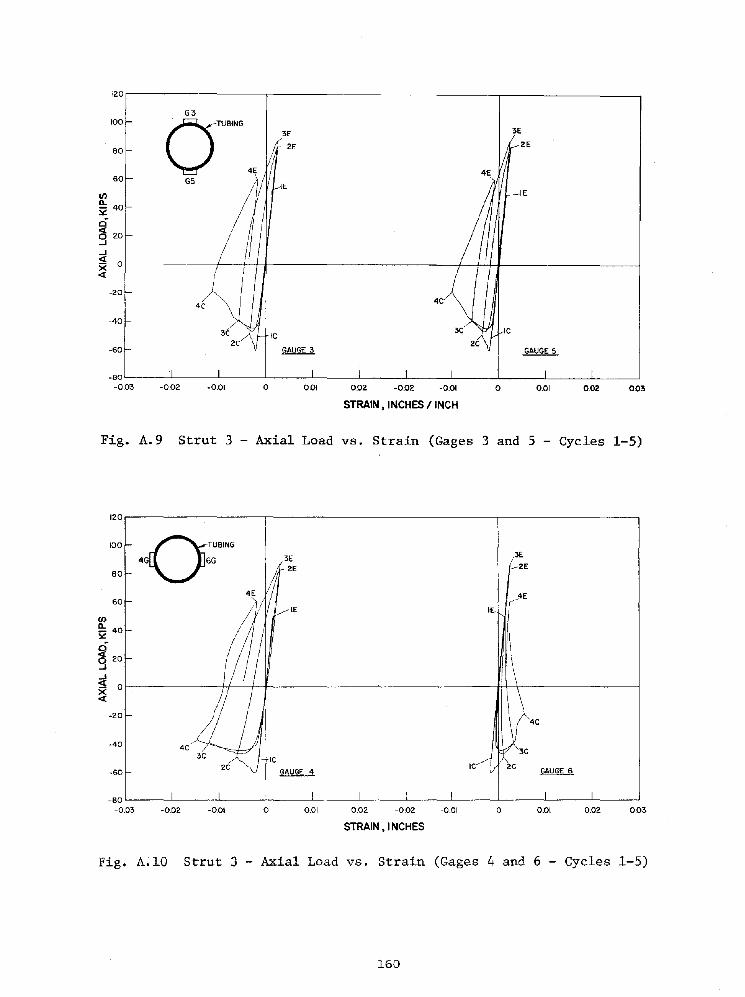
0.030.020.01o-0.01
4C
-0.020.020.01
3E
2E
o-0.01
4C
G5
G3
0"""
-0.02
120
100
80
60
(f)
~ 40lIl:0g 20
...J<l: 0X<l:
-20
-40
-60
-80-0.03
STRAIN t INCHES / INCH
Fig. A.9 Strut 3 - Axial Load vs. Strain (Gages 3 and 5 - Cycles 1-5)
120,-------------,------------------,------------,
4C
4E
3E
2E
IE
IC
IE
3E2E
4C
O TU81NG
4G 6G
60
80
-60
100
-40
-20
(f)
~ 40lIl:
o<l: 209...JS Of---------++--+--+-------~~-------___trr_r_-------_____jx<l:
0.030.02o-0.01-0.020.020.01o-0.01-0.02
-80 L-__-'-- L-__-'-- L-__-'-- L-__--'-__--' --'-__--' -'
-0.03
STRAIN t INCHES
Fig. A.10 Strut 3 - Axial Load vs. Strain (Gages 4 and 6 - Cycles 1-5)
160

4C GAUGE 52C
3CIC
120 G3
100
0,,",,"80
60
-60
-40
-20
C/)
~ 40~
og 20
..J<l OI---------I-+---+tIl------------------+-.jIL----------~
~
0.030.020.01o-0.01-0.020.02001o-001-0.02
_80'---__--'- --'- -'----__--'- -'--- -'---__----'- -'-- L-__----'- -l
-003
STRAIN. INCHES / INCH
Fig. A.ll Strut 4 - Axial Load vs. Strain (Gages 3 and 5 - Cycles 1-5)
0.030.02001o
IB
-0.01-002002
120
0"""" "100 3E4G 6G 6E
5E
804E
60 IE
C/)
~ 40~
0
~ 20..J..JS; 0X<l
-20
-40
-60 IGAUGE 6
2C
-80-003 -0.02 -001 0 001
STRAIN. INCHES / INC H
Fig. A.12 Strut 4 - Axial Load vs. Strain (Gages 4 and 6 - Cycles 1-5)
161

G9
-
O'""~ 4E 4Er---
(II-Gil
l-
I 'sA \A
I-
~Ul-
I--5C
GAUGE 9 GAUGE II
l-
I I I I I I I I
50
40
30
20
(J)0..~ 10
o<t 09...Jg -10
~-20
-30
-40
-50-003 -0.02 -0.01 o 0.01 0.02 -002 -0.01 o 0.01 0.02 003
STRAIN ,INCHES / INCH
Fig. A.13 Strut 5 - Axial Load vs. Strain (Gages 9 and 11 - Cycles 1-5)
0.030020.01o-0.01-0020.020.01o-0.01-0.02
I- 0'"""12G lOG 4E .......4Ey---.I--
r~I--
I-
'~ 5A
-
J--
5C- 58
GAUGE 10 GAUGE 12
-
I I I I I I I I
-40
-50-0.03
-20
(J)
~ 10
o<t 09...Jg -10X<t
20
30
-30
50
STRAIN. INCHES / INCH
Fig. A.14 Strut 5 - Axial Load vs. Strain (Gages 10 and 12 - Cycles 1-5)
162

50,------------,---------------------,-------------,
G29
O'""~3E 4E 3E 2E2E
IE IE
G31
IA3A 5A
4A 2A3A
-30
-40
-20
30
20
40
(f)
~ 10:l<::ci~ ol---------''iYf-++--+IJ+'-------------------''-'<t'':U+t'-I'-----;oif-+--------1...J...Jg -10XeX
0.030.020.01o-0.01-0.020.020.01o-0.01-0.02
_50'----__---'- ---'--- .L-__---' ---'-- --'-__--'- ---'--- -'-__-----' -'
-0.03
STRAIN, INCHES/ INCH
Fig. A.15 Strut 5 - Axial Load vs. Strain (Gages 29 and 31 - Cycles 1-5)
50
40
0'OO'~ 4E 3E 4E32G 30G 2E IE
30 IE
20
(f)Q. 10~
a ID
« 2D 2A
g 04A 3A
...Jg -10X«
-20 18
-30 Ie
-40
0.030.020.01o-0.01-0.020.020.01o-0.01-0.02
-50 L-__--'- -"- "--__--'- -L -'-__..-L ---'--- "--__---' -'
-0.03
STRAIN ,INCHES / INCH
Fig. A.16 Strut 5 - Axial Load vs. Strain (Gages 30 and 32 - Cycles 1-5)
163

G93E 5E 4EV;{--4E 5E
I- 0'"""I-
'" Ii (l-
I-
L/5A 1/6A
~1'-4A 5A3A
l-
I-
~ tJ'-., GAUGE 9 GAUGE III- 5C 2
4C
I I 3C 38I I I I I I
50
40
30
20
eng, 10~
oC3 0.=J....J~ -10
~-20
-30
-40
-50-0.03 -0.02 -0.01 o 0.01 0.02 -002 -0.01 o 0.01 0.02 0.03
STRAIN, INCHES II NCH
Fig. A.17 Strut 6 - Axial Load vs. Strain (Gages 9 and 11 - Cycles 1-5)
3[5 2E 3E 4E 5Ev 4 r----- ---< ~I- 0"-12G lOG
l-
I-
I-
3D 50 40, 4~ 50"
4A/ 6A5A f'SA;:;'6A
l-
I-
I- (5C- 4C" /58
I- 3(48
38~ 48 58GAUGE 12 GAUGE 10
I I I---I
I I I38
I--1-
50
40
30
20
~~ 10
~9 0
<J.- -10
~
-20
-30
-40
-50-0.06 -0.05 -0.04 -0.03 -0.02 -0.01 o 0.01 -0.01 o 0.01 0.02 0.03
STRAIN,INCHES liNCH
Fig. A.18 Strut 6 - Axial Load vs. Strain (Gages 10 and 12 - Cycles 1-5)
164

OW""3E~ 4E
~.2E
VE rP 3E
-
~-
- G30
-
6:\6A SA
\ I\A ~O '4A
- 4A
-
f---
5C iJ 1//f--- 5E"--- GAUGE 29
4C~~GAUGE 31
I I I I I36
II 1
50
40
30
20
~S2 10
ci<5 0...J...J~ -10
~-20
-30
-40
-50-0.03 -0.02 -001 o 0.01 002 -0.02 -0.01 o 0.01 0.02 003
STRAIN, INCHES / INCH
Fig. A.19 Strut 6 - Axial Load vs. Strain (Gages 29 and 31 - Cycles 1-5)
9EirE IOE
9E8E7EG29
7~6E -~ 6E
0""" I
(G31
1008010~
1/o9AI~g\
9A90 8A 70
60 70 \ 6A 80 6~0{ 6A
7A 7A
9~~ IOJ!)/ j8C ~
7C6c],1 68988676
50
40 f---
30 I-
20 I-
~ 10S20
~ 0...J...J~ -10X<l:
-20 -
-30 -
-40
-50-0.03
I-002
I-0.01 o
GAUGE 29
I0.01
I0.02
10C
9C
I
-0.02
I
-0.01 oI
0.01
I
002 003
STRAIN, INCHES/INCH
Fig. A.20 Strut 6 - Axial Load vs. Strain (Gages 29 and 31 - Cycles 6-10)
165

0/""&E 5~ 3E
1- 32G 30~ IF
l-
I-
I-
5A
/1 6A 1/4A
36 5614(
l-
I--
1/I--
5B
V GAUGE 30 GAUGE 32I--
3C 5C 4B4C
I I3B
I I I I I I
50
40
30
20
C/)Q.i: 10
o<t 09-lS -10
~-20
-30
-40
-50-003 -0.02 -0.01 o 0.01 0.02 -0.02 -0.01 o 0.01 0.02 003
STRAIN, INCHES / INCH
Fig. A.21 Strut 6 - Axial Load vs. Strain (Gages 30 and 32 - Cycles 1-5)
50,-----------------------,------------,---------------,
0.030.020.01o-0.010.01o-001-002-003-004-005
~TUBING
32G~30G
20
30
LB
40
-30
_50L-__-L .L...--__-L -'-__-L -'-__---' -'--__--'- -'--__-.l.__----'
-006
-20
-40
C/)Q.:s: 10
ci<t9 ol-------------71------:;"f------:;+--++---7I--7I-tr-k-k-:---------tttt------------j
<J.- -10
~
STRAIN ,INCHES / INCH
Fig. A.22 Strut 6 - Axial Load vs. Strain (Gages 30 and 32 - Cycles 6-10)
166

50
40 0"""3G 4G 2E30 IE
20
(/lQ.
10i;2c:i 2AoCt
9 0
...JoCt
-10 3CXoCt
-20
-30
-40
-50-0.010 -0.005 0 0.0050.005o-0.005
- 0"""IG 2G-
-
-
-
t-
t-
t-
I
-20
-10
50
20
10
o
40
30
-30
-40
-50-0.010
CURVATURE, RADIANS/INCH CURVATURE, RADIANS/INCH
Fig. A.23 Strut 1 - Axial Load vs.Section Curvature(Gages 1,2 - Cycles 1-5)
Fig. A.24 Strut 1 - Axial Load vs.Section Curvature(Gages 3,4 - Cycles 1-5)
50 50
40 0'""" 40 0'"""5G 6G 2E7G 8G
30 IE 30
20 20
(/l (/lQ.
10Q.
10i;2 i;2c:i c:ioCt
0oCt
09 9...J ...JoCt
-10oCt
-10X XoCt oCt
-20 -20
-30 -30
-40 -40
-50 -50-0.010 -0.005 0 0.005 -0.010 -0.005
2E
IE
o 0.005
CURVATURE, RADIANS/INCH CURVATURE, RADIANS /INCH
Fig. A.25 Strut 1 - Axial Load vs.Section Curvature(Gages 5,6 - Cycles 1-5)
Fig. A.26 Strut 1 - Axial Load vs.Section Curvature(Gages 7,8 - Cycles 1-5)
167

50 50
40 0""" 40
lOG 12G 2E 0 2E30 IE 30 IE
TUBING
20 20
C/) C/)Q.
10Q.
i2 i2 10
ci 3A ci 3A~
0 ~ 2A9 9 0
IA...J ...J~
-10 ~ 3CX -10~ ~
-20 -20
IB3B 2B
-30 -30
-40 -40
-50 -50-0.010 -0.005 0 0.005 -0.010 -0.005 0 0.005
CURVATURE, RADIANSIINCH CURVATURE, RADIANS liNCH
Fig. A.27 Strut 1 - Axial Load vs.Section Curvature(Gages 10,12 - Cycles 1-5)
Fig. A.28 Strut 1 - Axial Load vs.Section Curvature(Gages 7,8 - Cycles 1-5)
50 50
40 0'"'' 40 0"""15G 16G 2E 17G IBG 2E30 IE 30 IE
20 20
C/)~!l-
10 10i2 i2ci ci 3A
92A ~ 2A
0 9 0IA
...J ...J~ -10 3C ~
-10 3C
~ X~
-20 -20
IB 2BB
-30 -30
-40 -40
-50 -50-0.010 -0.005 0 0.005 -0.010 -0.005 0 0.005
CURVATURE, RADIANS liNCH CURVATURE, RADIANS/INCH
Fig. A.29 Strut 1 - Axial Load vs.Section Curvature(Gages 15,16 - Cycles 1-5)
Fig. A.30 Strut 1 - Axial Load vs.Section Curvature(Gages 17,18 - Cycles 1-5)
168

0.0150.010-0.005 0 0.005
CURVATURE, RADIANS/INCH-0.010
2E'' 3E,-4Eeo,"""IG 2G
f-
f-
f-
f-
f-
\1;8f--- 48
3B
f-28
18J I I I
-40
-50-0.015
-30
50
-20
20
30
40
~52 10
~ 0
..J~X -10~
Fig. A.3l Strut 2 - Axial Load vs. Section Curvature(Gages 1,2 - Cycles 1-5)
50,--------------------,--------------------,3E
40
30 O TU81NG
3G 4G
20
3C
303A
-20
Cf)ll..~ 10
~g ol------------:+--+-----\--'i\''--------------------i
..J
~ -K)
~
-3048 58
38
-40
0.0150.0100.005o-0.005-0.010
_50L- ---l --L -L J- --'- ----'
-0.015
CURVATURE, RADIANS/INCH
Fig. A.32 Strut 2 - Axial Load vs. Section Curvature(Gages 3,4 - Cycles 1-5)
169

4B
50
40 0'"""5 6G30
20
(/)a..~ 10
~9 0
...J«-10X«
-20
,30
-40
-50-0.015 -0.010
3B
-0.005 0 0.005
CURVATURE t RADIANS /1 NCH0.010
40
4C
0.015
Fig. A.33 Strut 2 - Axial Load vs. Section Curvature
(Gages 5.6 - Cycles 1-5)
50.-------------------,------------------,
3E 4E
40
30 OTUBING
7G 8G
20
3A
-20
-30
(/)a..~ 10
~9 of-----------------7Ic_--~c_-*---___\"''''--------l;H
...J«X -10«
3B
-40
0.0150.0100.005o-0.005-0.010_50'----------'-------'---------''-------'------..L-------'-0.015
CURVATURE, RADIANS/INCH
Fig. A.34 Strut 2 - Axial Load vs. Section Curvature(Gages 7,8 - Cycles 1-5)
170

-0.005 0 0.005
CURVATURE t RADIANS liNCH
50
40
30
20
UlQ.
~ 10
~9 0
..J<{
-10X<{
-20
-30
-40
-50-0.015
O. TUBING
lOG 12G
-0.010
3E
36
4E
4B
0.010 0.015
Fig. A.35 Strut 2- Axial Load vs. Section Curvature
(Gages 10,12 - Cycles 1-5)
50,-------,------------------------------,
,f'\~
TUBIY
4E
4B
4A
3E
3A
2E
20
40
30
-20
-30
UlQ.~ 10
ci~ 01---------+--+-------+:------71--"""'--------,1------------1..J..J
~ -10<{
36
-40
0.0250.0200.01500100.005o-50 '---------'-------'--------'--------'---------'---------'-0.005
CURVATURE, RADIANSIINCH
Fig. A.36 Strut 2-Axia1 Load vs. Section Curvature(Gages 13,14 - Cycles 1-5)
171

50r---------,----------~-----------------___,2E 3E 4E
5C
4C
TU81NGO
15G. 16G
L8
3C
58
4A
30
40
20
-20
enll.52 10
~ 01--------Ir---,,\-----~*____7~--------*-------_____i...J<lX -10 -<l
-30
38
-40
0.0250.0200.0150.0100.005o-50 L- --' ----'- -'-- ___'___ _L_ ___'
-0.005
CURVATURE, RADIANS/INCH
Fig. A.37 Strut 2 - Axial Load vs. Section Curvature(Gages 15,16- Cycles 1-5)
-20
-30
-4028
0.0150.010-0.005 0 0.005
CURVATURE, RADIANS/INCH-0.010
_50L...... ---.l -L ~ ___'___ _L_ ___'
-0.015
Fig. A.38 Strut 2-Axia1 Load vs. Section Curvature
(Gages 17,18 - Cycles 1-5)
172

120
100 0'"""804G G
60
ena-s;;: 40
0<t9 20
..J<t 0X<t
-20
-40
-60
-80-0.015 -0.010
3E
2E
IE
4C
IC2C
-0.005 0 0.005
CURVATURE, RADIANS/INCH0.010 0015
Fig. A.39 Strut 3 - Axial Load vs. Section Curvature(Gages 4 , 6 - Cycles 1-5)
12o...-------------------,-----------------,
3C2C
IC
OTUBING
4G 6G
80
-60
100
-20
-40
60ena-~ 40
o<t9 20
..J~o~---------------__+-H+-\_It\--...l\_-~'"""--------_fx<t
00150.010-0005 0 0.005
CURVATURE, RADIANS/INCH-0.010
_80L-------L-----...L-------'--------'---------''-------'-0.015
Fig. A.40 Strut 4 - Axial Load vs. Section Curvature(Gages 4,6 - Cycles 1-5)
173

0.0150.0100.005o-0.005-0.010
- om"," 4E12G lOG
-
-
-
["'sA-
-
)- /-
-
I I I I-50-0.015
-40
50
-30
-20
20
30
40
ffi;2 10
C«9 0
...J« -10
~
CURVATURE, RADIANS/INCH
Fig. A.41 Strut 5 - Axial Load vs. Section Curvature(Gages 10,12 - Cycles 1-5)
0.0150.010-0.005 0 0.005
CURVATURE, RADIANS/INCH-0.010
~ om,,",J~3E
16G 14Gf-
f-
-
./4A
5( \0-
- ..~,)\f-
4C 4Bf-
I I I I i-40
50
-30
-20
-50-0.015
20
40
~i;2 10
C«9 0
<J.- -10~
Fig. A.42 Strut 5- Axial Load vs. Section Curvature
(Gages 14,16 - Cycles 1-5)
174

0.0150.0100.005o-0.005-0.010
CO20G 18G 4E3J
I- TUBING
I-
-
~·'40 ~A3A 20SA 4A
-1\
- / I~ :::;.
3B- 3 58 4B 4C
(L.B.)
I I I I-50-0.015
-40
50
-30
-20
20
30
40
~~ 10
~9 0
...J<l: -10
~
CURVATURE, RADIANS/INCH
Fig. A.43 Strut 5-Axial Load vs. Section Curvature
(Gages 18,20-Cycles 1-5)
0.0150.0100.005o-0.005-0.010
Co""" 2\ ~~E24G 22GI-
'\l-
I-20
riA
3Aj:'--30 "'40
I- 5~/
I- iv
~~I-
3BI:z~ 4C4B
I- 3C
I I I I-50-0.015
-40
50
-30
-20
20
30
40
~~ 10
~9 0
...J<l:X -10<l:
CURVATURE, RADIANS/INCH
Fig. A.44 Strut 5 - Axial Load vs. Section Curvature(Gages 22,24-Cycles 1-5)
175

0.0150.0100.005o-0.005-0.010
:"'~"" 4E ~ E
~~TUBING
~e-
e-
~O /40
~ ~~~'-
- \ 2B
- b-.J(L.Bl5B
3B4~4C
3C,- 2C
I 1 I I
-40
-50-0.015
40
50
-20
-30
20
30
~52 10
~9 Q.
;;1X -10c(
CURVATURE, RADIANS/I NCH
Fig. A.45 Strut 5-Axial Load vs. Section Curvature(Gages 26,28- Cycles 1-5)
50r---------------~_.----------------_,
40-
O TUBING 2E 3E fE
32G 30G IE
~ :~ ~:~/'"9 o~------------/,H--\¥--_--Jk.~.hdf':...-3D-¥-----------------j
2"/ 5A 10;;1 ~ ~X -10-c(
-20 -
-30-
-40f-
0.015_50L-----l-I----il-------.l-----L-I----.L-1 ------'-0.015 -0.010 -0005 0 0.005 0.010
CURVATURE, RADIANS/INCH
Fig. A.46 Strut 5-Axia1 Load vs. Section Curvature(Gages 30,32 - Cycles 1-5)
176
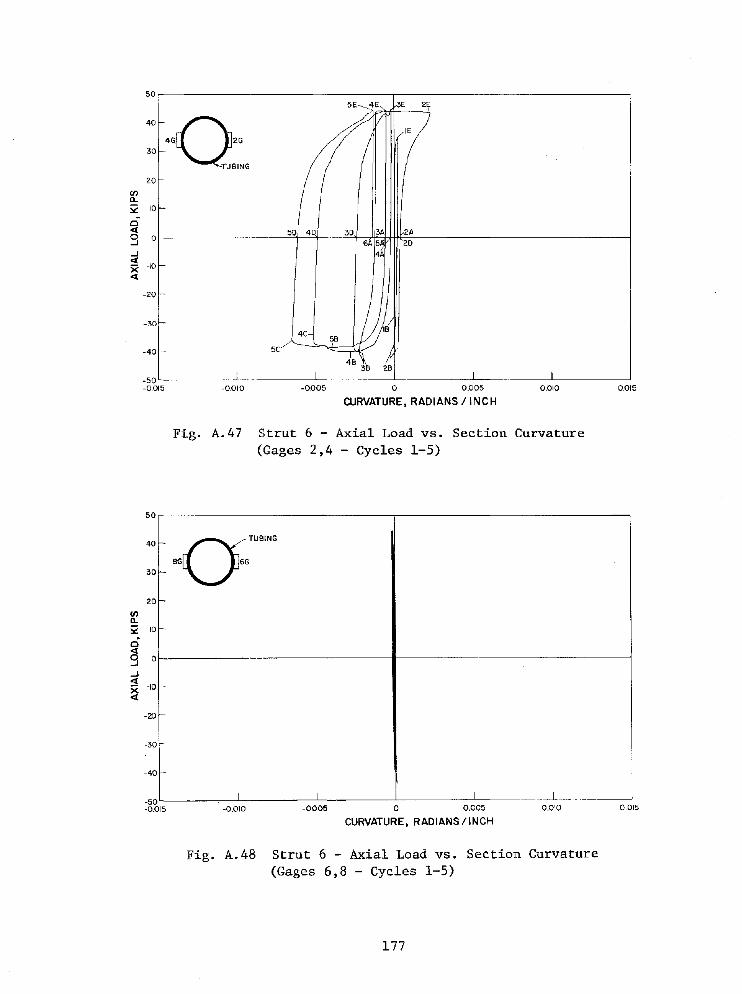
50r--------------------,-------------------
28
5C
-30
-40
-20
IIIa..~ 10
o<l:9 ol-------------.:::.~~---':3./____,_,IIH_,/_If~~--------------~
...J<l:X -10<l:
0.0150.0100.005o-0.005-0.010
-50 "-- --' ----'- -'-- -"- --'--- -----.J
-0.015
CURVATURE, RADIANS /INCH
Fig. A.47 Strut 6 - Axial Load vs. Section Curvature(Gages 2,4 - Cycles 1-5)
0.0150.010-0.005 0 0.005
CURVATURE, RADIANS/INCH-0.010
-0'"""8G 6G-
-
~
l-
I--
I--
I--
I I I I-50-0.015
-40
-30
50
-20
20
30
40
IIIa..~ 10
o<l:9 0
...J<l:X -10<l:
Fig. A.48 Strut 6 - Axial Load vs. Section Curvature(Gages 6,8 - Cycles 1-5)
177

0.0150.0100.005o-0.005-0.010
~4Ei-
~5E
0'""" \1\\\12G lOGl-
i-
f-
/501\~~
,k1\3D4A
-
\ ----i-
i 5B 5C3B 4C
I I I-50-0015
-40
50
-30
·20
20
30
40
~iii: 10
o<l:9 0
..J<l: -10
~
CURVATURE, RADIANS/INCH
Fig. A.49 Strut 6-Axia1 Load vs. Section Curvature(Gages 10,12 - Cycles 1-5)
0.0150.0100.005o-0.005-0.010
:~Q'"TUBING
l-
I-
i-
l-
i-
i-
I I I I-50-0.015
-40
50
-30
-20
20
30
40
ena..i: 10
ci~ 0..J
..J<l: -10
~
CURVATURE, RADIANS/ INCH
Fig. A.50 Strut 6-Axia1 Load vs. Section Curvature(Gages 14,16 - Cycles 1-5)
178
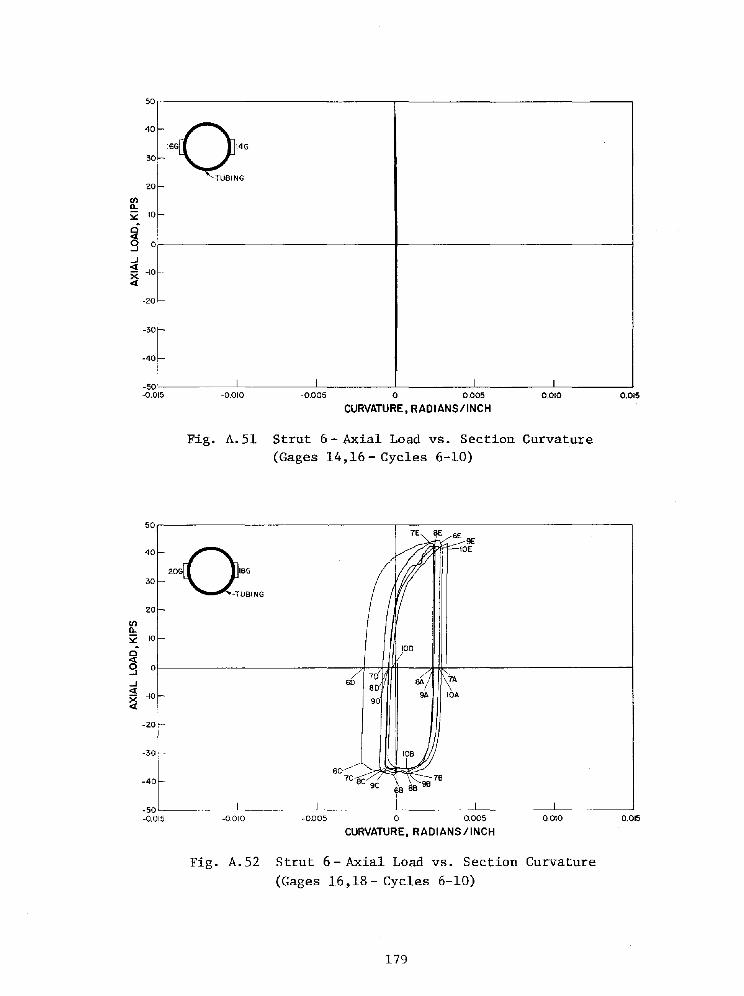
0.0150.010-0.005 0 0.005
CURVATURE, RADIANS/INCH-0.010
:"Q'"TUBINGf--
f--
f--
i-
i-
f--
I I I I
-30
40
20
50
-20
30
-50-0.015
-40
CIlll..:;0: 10
o«9 0
..J« -10
~
Fig. A.51 Strut 6-Axia1 Load vs. Section Curvature(Gages 14,16- Cycles 6-10)
-20
-30
-40
507E BE
6E 9E
40 10E,00Q"'30
TUBING
20
CIlll..:;0: 10
0100
«9 0
70..J 6D
BO«X -10
9D«
0.0150010-0.005 0 0.005
CURVATURE, RADIANS/INCH-0.010
-50'-----------'--------'------'---------'-------'-------'-0.015
Fig. A.52 Strut 6 - Axial Load vs. Section Curvature
(Gages 16,18-Cyc1es 6-10)
179

0.0150.010-0.005 0 0.005
CURVATURE, RADIANS/INCH-0.010
-=o~0-TUBING
-
-
-
-
f0-
e-
I I I I
-40
50
-30
-20
-50-0.015
20
3
40
(J)a.i2 10
o<tg 0
...J<tX -10<t
Fig. A.53 Strut 6 - Axial Load vs. Section Curvature(Gages 18,20- Cycles 1-5)
0.0150.0100.005o-0.005-0.010
v5E4E,-
-
,.,~"-
TUBING-
-
~ 1"-5A
I-5D
e-
e-
e- 5C 58
1 I [ I-50-0.015
-40
50
-30
-20
20
30
40
lri2 10
o<tg 0
...J<tX -10<t
CURVATURE I RADIANS/INCH
Fig. A.54 Strut 6 - Axial Load vs. Section Curvature(Gages 22,24- Cycles 1-5)
180

-0.005 0 0.005
CURVATURE, RADIANS/INCH
6A
9A7A
0.0150.010
6E7EBE9EIOE
lOA
GO
L.B.
9C:-:::::::ry;~~~--+9BBC
7C 6C
50
40
"'~'"30
TUBING20
(J)a.52 10
ci<t9 0
..J<t -10X<t
-20
-30
-40
-50-0.015 -0.010
Fig. A.55 Strut 6-Axia1 Load vs. Section Curvature(Gages 22,24 - Cycles 6-10)
0.0150.0100.005o-0.005-0.010
4E ......5E
cO'"""2BG 26G
I-
-
5/ \,.-
-
l- )4C----'
y5CI-
4B/r----3B
I I I I
40
20
50
-30
-50-0.015
30
-20
-40
(J)a.52 10
Cl<;(
9 0
<J.X -10<t
CURVATURE, RADIANS/INCH
Fig. A.56 Strut 6 - Axial Load vs. Section Curvature
(Gages 26,28 - Cycles 1-5)
181

6E
10E
100
28G06G
TUBING
20
40
30
50r--------------=7E=----,--------------------,
f£j;2 10
8AC ~~ ~9 OI----------7hf4k----'-=':":""::O~fI+==='''''+-----------------_I
...J~X -10~
-20
-30
-40
L.B.
9C8C 7C 6C
7889
68
0.0150.0100.005o-0.005-0.010-50'---------"'--------'----------'--------'-------'-------'-0.015
CURVATURE, RADIANS/INCH
Fig. A.57 Strut 6-Axial Load vs. Section Curvature(Gages 26,28 - Cycles 6-10)
5C
4C
504E 5E 3E
40 0'"""32G 30G
30
20
10
4A
-30
-20
enCl.
lS:
~9 ol-------------+-+--+---II-++---I"---------------i<i 3DX -10~
-403C 28
38
0.0150.010-0.005 0 0.005
CURVATURE, RADIANS/ INCH-0.010
_50'---------"'---------'----------'--------'-------'-------'-0.015
Fig. A.58 Strut 6-Axia1 Load vs. Section Curvature(Gages 30,30 - Cycles 1-5)
182

50,-----------------------r-------------------,10E 9E BE IE 6E
0.0150.010
6B
-0.005 0 0.005
CURVATURE, RADIANS liNCH-0.010
L.B.
~TUBING
32G~30G
20
40
-30
-50L--------'--------'---------'-------'---------'--------'-0.015
-20
-40
(/)n.:ll:: 10
ci 7A«9 0
..J 6A
«-10X«
Fig. A.59 Strut 6-Axial Load vs. Section Curvature
(Gages 30,32 - Cycles 6-10)
183


185
EARTHQUAKE ENGINEERING RESEARCH CENTER REPORTS
NOTE: Numbers in parenthesis are Accession Numbers assigned by the National Technical Information Service; these arefollowed by a price code. Copies of the reports may be ordered from the National Technical Information Service, 5285Port Royal Road, Springfield, Virginia, 22161. Accession Numbers should be quoted on order.s for reports (PB --- ---)and remittance must accompany each order. Reports without this information were not available at time of printing.Upon request, EERC will mail inquirers this information when it becomes available.
EERC 67-1
EERC 68-1
EERC 68-2
EERC 68-3
EERC 68-4
EERC 68-5
EERC 69-1
EERC 69-2
EERC 69-3
EERC 69-4
EERC 69-5
EERC 69-6
EERC 69-7
EERC 69-8
"Feasibility Study Large-Scale Earthquake Simulator Facility," by J. Penzien, J.G. Bouwkamp, R.W. Cloughand D. Rea - 1967 (PB 187 905)A07
Unassigned
"Inelastic Behavior of Beam-to-Col umn Subassemblages Under Repeated Loading," by V. V. Bertero - 1968(PB 184 888)A05
"A Graphical Method for Solving the Wave Reflection-Refraction Problem," by H.D. McNiven and Y. Mengi - 1968(PB 187 943) A03
"Dynamic Properties of McKinley School Buildings,lI by D. Rea, J.G. Bouwkamp and R.W .. Clough -1968(PB 187 902)A07
"Characteristics of Rock Motions During Earthquakes," by H.B. Seed, LM. Idriss and F.W. Kiefer -1968(PB 188 338) A03
"Earthquake Engineering Research at Berkeley," - 1969 (PB 187 906) All
"Nonlinear Seismic Response of Earth Structures," by M. Dibaj and J. Penzien-1969 (PB 187 904)A08
"Probabilistic Study of the Behavior of Structures During Earthquakes," by R. Ruiz and J. Penzien - 1969(PB 187 886) A06
"Numerical Solution of Boundary Value Problems in Structural Mechanics by Reduction to an Initial ValueFormulation," by N. Distefano and J. Schujman - 1969 (PB 187 942)A02
"Dynamic Programming and the Solution of the Biharmonic Equation," by N. Distefano - 1969 (PB 187 941)A03
"Stochastic Analysis of Offshore Tower Structures," by A. K. Malhotra and J. Penzien - 1969 (PB 187 903) A09
"Rock Motion Accelerograms for High Magnitude Earthquakes," by H.B. Seed and I.M. Idriss -1969 (PB 187 940)A02
"Structural Dynamics Testing Facilities at the University of California, Berkeley~" by R.M. Stephen,J.G. Bouwkamp, R.t-I. Clough and J. Penzien -1969 (PB 189 111)A04
EERC 69-9 "Seismic Response of Soil Deposits Underlain by Sloping Rock Boundaries," by H. Dezfulian and H.B. Seed1969 (PB 189 114)A03
EERC 69-10 "Dynamic Stress Analysis of ' Axisymmetric Structures Under Arbitrary Loading," by S. Ghosh and E.L. Wilson1969 (PB 189 026)AIO
EERC 69-11 "Seismic Behavior of Multistory Frames Designed by Different Philosophies," by J.C. Anderson andV. V. Bertero - 1969 (PB 190 662)AIO
EERC 69-12 "Stiffness Degradation of Reinforcing Concrete Members Subjected to Cyclic Flexural Moments," byV.V. Bertero, B. Bresler and H. Ming Liao -1969 (PB 202 942)A07
EERC 69-13 "Response of Non-Uniform Soil Deposits to Travelling Seismic Waves," by H. Dezfulian and H.B. Seed -1969(PB 191 023)A03
EERC 69-14 "Damping Capacity of a Model Steel Structure," by D. Rea, R.W. Clough and J.G.Bouwkamp-1969 (PB190663)A06
EERC 69-15 "Influence of Local Soil Conditions on Building l'lamage Potential during Earthquakes," by H.B. Seed andI.M. Idriss - 1969 (PB 191 036)A03
EERC 69-16 "The Behavior of Sands Under Seismic Loading Conditions," by M.L. Silver and H.B. Seed-1969 (AD714982)A07
EERC 70-1 "Earthquake Response of Gravity Dams," by A.K. Chopra - 1970 (AD 709 640)A03
EERC 70-2 "Relationships between Soil Conditions and Building Damage in the Caracas Earthquake of July 29, 1967," byH.B. Seed, LM. Idriss and H. Dezfulian -1970 (PB 195 762)A05
EERC 70-3 "Cyclic Loading of Full Size Steel Connections," by E.P. Popov and R.M. Stephen -1970 (PB 213 545)A04
EERC 70-4 "Seismic Analysis of the Charaima Building, Caraballeda, Venezuela," by Subcommittee of the SEAONC ResearchCommittee: V.V. Bertero, P.F. Fratessa, S.A. Mahin, J.H. Sexton, A.C. Scordelis, E.L. Wilson, L.A. Wyllie,H.B. Seed and J. Penzien, Chairman-1970 (PB 201 455)A06
Preceding page blank

EERC 70-5
EERC 70-6
EERC 70-7
186
"A Computer Program for Earthquake Analysis of Dams," by A.K. Chopra and P. Chakrabarti -1970 (AD 723 994)A05
"The Propagation of Love Waves Across Non-Horizontally Layered Structures," by J. Lysrner and L.A. Drake1970 (PB 197 896)A03
"Influence of Base Rock Characteristics on Ground Response," by J. Lysmer, H.B. Seed and P.B. Schnabel1970 (PB 197 897)A03
EERC 70-8 "Applicability of Laboratory Test Procedures for Measuring Soil Liquefaction Characteristics under CyclicLoading," by H.B. Seed and W.H. Peacock - 1970 (PB 198 016)A03
EERC 70-9 "A Simplified Procedure for Evaluating Soil Liquefaction Potential," by II. B. Seed and 1. M. Idriss - 1970(PB 198 009)A03
EERC 70-10 "Soil Moduli and Damping Factors for Dynamic Response Analysis," by H.B. Seed and 1.M. Idriss -1970(PB 197 869)A03
EEEC 71-1 "Koyna Earthquake of December 11, 1967 and the Performance of Koyna Dam," by A.K. Chopra and P. Chakrabarti1971 (AD 731 496lAOG
EERC 71-2 "Preliminary In-Situ Measurements of Anelastic Absorption in Soils Using a Prototype Earthquake Simulator,"by R.D. Borcherdt and P.W. Rodgers - 1971 (PB 201 454)A03
EERC 71-3 "Static and Dvnamic Analysis of Inelastic Frame Structures," by F.L. Porter and G.H. Powell-1971(PB 210 135) A06
EERC 71-4 "Research Needs in Limit Design of Reinforced Concrete Structures," by V.V. Bertero -1971 (PB 202 943)A04
EERC 71-5 "Dynamic Behavior of a High-Rise Diagonally Braced Steel Building," by D. Rea, A.A. Shah and C".G. Bouw]cawp1971 (PB 203 584)A06
EERC 71-6 "Dynamic Stress Analysis of Porous Elastic Solids Saturated with Compressible Fluids," by J. Ghaboussi andE. L. Wilson" 1971 (PB 211 396)A06
EERC 71-7 IIInelastic Behavior of Steel Beam-to-Column Subassemblages," by H. Krawinkler, V.V. Bertero and E.P. Popov1971 (PB 211 335)A14
EERC 71-8
EERC 72-1
EERC 72-2
"Modification of Seismograph Records for Effects of Local Soil Conditions," by P. Schnabel, H.B. Seed andJ. Lysmer - 1971 (PB 214 450)A03
"Static and Earthquake Analysis of Three Dimensional Frame and Shear Wall Buildings," by E.L. Wilson andH.H. Dovey-1972 (PB 212 904)A05
"Accelerations in Rock for Earthquakes in the Western United States," by P.B. Schnabel and H.B. Seed-1972(PB 213 100)A03
EERC 72-3 "Elastic-Plastic Earthquake Response of Soil-Building Systems," by T. Minami -1972 (PB 214 8(8)A08
EERC 72-4 "Stochastic Inelastic Response of Offshore 'rowers to Strong /olotion Earthquakes," by M.K. Kaul-1972(PB 215 713) ADS
EERC 72-5 "Cyclic Behavior of Three Reinforced Concrete Flexural Members with High Shear," by E.P. Popcv, V.V. Berteroand H. Krawinkler - 1972 (PB 214 555)A05
EERC 72-6 "Earthquake Response of Gravity Dams Including Reservoir Interaction Effects," by P. Chakrabarti andA.K. Chopra - 1972 (AD 762 330)A08
EERC 72-7 "Dynamic Properties of Pine Flat Dam," by D. Rea, C.Y. Liaw and A.K. Chopra-1972 (AD 763 928)A05
EERC 72-8 "Three Dimensional Analysis of Building Systems," by E.L. Wilson and H.H. Dovey -1972 (PB 222 438)A06
EERC 72-9 "Rate of Loading Effects on Uncracked and Repaired Reinforced Concrete Members," by S. Mahin, V.V. Bertero,
D. Rea and M. Atalay - 1972 (PB 224 520) A08
EERC 72-10 "Computer Program for Static and Dynamic Analysis of Linear Structural Systems," by E.L. Wilson, K.-J. Bathe,J,E. Peterson and H,H.Dovey-1972 (PB 220 437)A04
EERC 72-11 "Literature Survey - Seismic Effects on Highway Bridges," by T. Iwasaki, J. Penzien and R. W. Clough - 1972
(PB 215 613) A19
EERC 72-12 "SHAKE-A Computer Program for Earthquake Response Analysis of Horizontally Layered Sites," by P.B. Schnabeland J. Lysmer - 1972 (PB 220 207) AD6
EERC 73-1 "Optimal Seismic Design of Multistory Frames," by V.V. Bertero and H. Kamil-1973
EERC 73-2 "Analysis of the Slides in the San Fernando Dams During the Earthquake of February 9, 1971," by H.B. Seed,K.L. Lee, 1.M. Idriss and F. Makdisi -1973 (PB 223 402)A14

187
EERC 73-3 "Computer Aided Ultimate Load Design of Unbraced Multistory Steel Frames," by M.B. EI-Hafez and G.H. Powell1973 (PB 248 315)A09
EERC 73-4 "Experimental Investigation into the Seismic Behavior of Critical Re~ions of Reinforced Concrete Componentsas Influenced by Moment and Shear," by M. Celebi and J. Penzien - 1973 (PB 215 884) A09
EERC 73-5 "Hysteretic Behavior of Epoxy-Repaired Reinforced Concrete Beams," by M. Celebi and J. Penzien - 1973{PB 239 568)A03
EERC 73-6 "General Purpose Computer Program for Inelastic Dynamic Response of Plane Structures, II .by A. Kanaan andG.H. Powell- 1973 (PB 221 260)A08
EERC 73-7 "A Computer Program for Earthquake Analysis of Gravity Dams Including Reservoir Interaction, II byP. Chakrabarti and A.K. Chopra - 1973 (AD 766 271)A04
EERC 73-8 "Behavior of Reinforced Concrete Deep Beam-'Column Subassemblages Under Cyclic Loads," by O. Kiistii andJ.G. Bouwkamp-1973 (PB 246 117)A12
EERC 73-9 "Earthquake Analysis of Structure-Foundation Systems," by A.K. Vaish and ".K. Chopra -1973 (AD 766 272)A07
EERC 73-10 "Deconvolution of Seismic Response for Linear Systems," by R.B. Reimer -1973 (PB 227 179)A08
EERC 73-11 "SAP IV: A Structural Analysis Program for Static and Dynamic Response of Linear Systems," by K.-J. Ba the,E.L. Wilson and F.E. Peterson -1973 (PB 221 967)A09
EERC 73-12 "Analytical Investigations of the Seismic Response of Long, Multiple Span Highway Bridges," by W.S. Tsengand J. Penzien -1973 (PB 227 8l6)AlO
EERC 73-13 "Earthquake Analysis of Multi-Story Buildings Including Foundation Interaction," by A. K. Chopra andJ.A. GutiRrrez-1973 (PB 222 970)A03
EERC 73-14 "ADAP: A Computer Program for Static and Dynamic Analysis of Arch Dams," by R.W. Clough, J.M. Raphael andS. Mojtahedi -1973 (PB 223 763)A09
EERC 73-15 "Cyclic Plastic Analysis of Structural Steel Joints," by R.B. Pinkney and R.W. Clough -1973 {PB 226 843)A08
EERC 73-16 "Ql.'AD-4: A Computer Program for Evaluating the Seismic Response of Soil Structures by Variable DampingFinite Element Procedures," by LM. Idriss, J. Lysmer, R. Hwang and H.B. Seed -1973 {PB 229 424)A05
EERC 73-17 "Dynamic ,,.'havior of a Multi-Story Pyramid Shaped Building," by R.M. Stephen, J.P. Hollings andJ.G. Bouwkamp -1973 (PB 240 718)A06
EERC 73-18 "Effect of Different Types of Reinforcing on Seismic Behavior of Short Concrete Columns," by V.V. Bertero,J. Hollings, O. Kiis tii , R. M. Stephen and J. G. Bouwkamp - 1973
EERC 73-19 "Olive View Medical Center Materials Studies, Phase I," by B. Bresler and V.V. Bertero -1973 (PB 235 986)A06
EERC 73-~O "Linear and Nonlinear Seismic Analysis Computer Programs for Long Multiple-Span Highway Bridges," byW. S. Tseng and J. Penzien - 1973
EERC 73-21 "Constitutive Models for Cyclic Plastic Deformation of Engineering Materials," by eLM. Kelly ilnd P.P. Gillis1973 (PB 226 024)A03
EERC 73-22 "DRAIN - 2D User's Guide," by G.H. Powell-1973 (PB 227 016)A05
EERC 73-23 "Earthquake Engineering at Berkeley - 1973," (1'8 226 033)All
EERC 73-24 Unassigned
EERC 73-25 "Earthquake Response of Axisymmetric Tower Structures Surrounded by Water," by C.Y. Liaw and A.K. Chopra1973 (fiD 773 052)A09
EERC 73-'26 "Investigation of the Failures of the Olive View Stairtowers During the San Fernando Earthquake and TheirImplications on Seismic Design," by V.V. Bertero and R.G. Collins -1973 (PB 235 106)A13
EERC 73-27 IIFurther Studies on Seismic Behavior of Steel Beam-Column Subassemblages," by V. V. Bertero, H. Krawir.k lerand E.P. Popov-1973 (PB 234 172)A06
EERC 74-1 "Seismic Risk Analysis," by C.S. Oliveira -1974 (PB 235 920)A06
EERC 74-2 "Settlement and Liquefaction of Sands Under Multi-Directional Shaking," by R. Pyke, C.K. Chan and H.B. Seed1974
EERC 74-3
EERC 74-4
"Optimum Design of Earthquake Resistant Shear Buildings," by D. Ray, K. S. Pister and A. K. Chopra - 1974(PB 231 172)A06
"LUSH - A Computer Program for Complex ResponSe Analysis of Soil-Structure Systems," by J. Lysmer, T. Udaka,H.B. Seed and R. Hwang -1974 (PB 236 796)A05

EERC 74-5
188
"Sensitivity Analysis for Hysteretic Dynamic Systems: Applications to Earthquake Engineering," by D. Ray1974 (PB 233 2l3)A06
EERC 74-6 "Soil Structure Interaction Analyses for Evaluating Seismic Response," by H.B. Seed, J. Lysmer and R. Hwang1974 (PB 236 519)A04
EERC 74-7 Unassigned
EERC 74-8 "Shaking Table Tests of a Steel Frame - A Progress Report," by R.W. Clough and D. Tang -1974 (PB 240 8,,9)A03
EERC 74-9 "Hysteretic Behavior of Reinforced Concrete Flexural Members with Special Web Reinforcement," byV.V. Bertero, E.P. Popov and T.Y. Wang - 1974 (PB 236 797)A07
EERC 74-10 "Applications of Reliability-Based, Global Cost Optimization to Design of Earthquake Resistant Structures,"by E. Vitiello and K.S. Pister -1974 (PB 237 23l)A06
EERC 74-11 "Liquefaction of Gravelly Soils Under Cyclic Loading Conditions," by R.T. Wong, H.B. Seed and C.K. Chan1974 (PB 242 042)A03
EERC 74-12 "Site-Dependent Spectra for Earthquake-Resistant Design," by H.B. Seed, C. Ugas and J. Lysmer -1974(PB 240 953)A03
EERC 74-13 "Earthquake Simulator Study of a Reinforced Concrete Frame," by P. Hidalgo and R.W. Clough -1974(PB 241 9f4)A13
EERC 74-14 "Nonlinear Earthquake Response of Concrete Gravity Dams," by N. Pal - 1974 {AD/A 006 583)A06
EERC 74-15 "Modeling and Identification in Nonlinear Structural Dynamics - I. One Degree of Freedom Models," byN. Distefano and A. Rath -1974 (PB 241 548)A06
EERC 75-1 "Determination of Seismic Design Criteria for the Dumbarton Bridge Replacement Structure, Vol. I: Description,Theory and Analytical Modeling of Bridge and Parameters," by F. Baron and S. -H. Pang - 1975 (PB 259 407) A15
EERC 75-2
EERC 75-3
EERC 75-4
EERC 75-5
EERC 75-6
FERC 75-7
lIDetermination of Seismic Design Criteria for the Dumbarton Bridge Replacement Structure, Vol. II: NumericalStudies and Establishment of Seismic Design Criteria," by F. Baron and S. -H. Pang - 1975 (PB 259 408) All(For set of EERC 75-1 and 75-2 (PB 259 406»)
"Seismic Risk Analysis for a Site and a Metropolitan Area," by C.S. Oliveira -1975 (PB 248 134)A09
"Analytical Investigations of Seismic Response of Short, Single or Multiple-Span Highway Bridges," byM.-C. Chen and J. Penzien - 1975 (PB 241 454)A09
"An Evaluation of Some Methods for Predicting Seismic Behavior of Reinforced Concrete Buildings," by S.A.Mahin and V. V. Bertero - 1975 (PB 246 306) Al6
"Earthquake Simulator Study of a Steel Frame Structure, Vol. I: Experimental Results," by R.W. Clough andD.T. Tang - 1975 (PB 243 98l)A13
lIDynamic Properties of San Bernardino Intake Tower," by D. Rea, C.-Y. Liaw and A.K. Chopra-1975 (AD/A008406)AOS
EERC 75-8 "Seismic Studies of the Articulation for the Dumbarton Bridge Replacement Structure, Vol. I: Description,Theory and Analytical Modeling of Bridge Components," by F. Baron and R.E. Hamati -1975 (PB 251 539)A07
EERC 75-9 "Seismic Studies of the Articulation for the Dumbarton Bridge Replacement Structure, Vol. 2: NumericalStudies of Steel and Concrete Girder Alternates," by F. Baron and R.E. Hamati -1975 (PB 251 540)AIO
EERC 75-10 "Static and Dynamic Analysis of Nonlinear Structures," by D.P. Mondkar and G.H. Powell-1975 (PB 242 434)A08
EERC 75-11 "Hysteretic Behavior of Steel Columns," by E.P. Popov, V.V. Bertero and S. Chandramouli -1975 {PB 252 3(;S)All
EERC 75-12 "Earthquake Engineering Research Center Library Printed Catalog," - 1975 (PB 243 711)A26
EERC 75-13 "Three Dimensional Analysis of Building Systems {Extended Version)," by E.L. Wilson, J.P. Hollings andIl.H. Dovey - 1975 {PB 243 989)A07
EERC 75-14 "Determination of Soil Liquefaction Characteristics by Large-Scale Laboratory Tests," by P. De Alba,C.K. Chan and H.B. Seed -1975 (NUREG 0027)A08
EFRC 75-15 "A Literature Survey - Compressive, Tensile, Bond and Shear Strength of Masonry," by R.L. Mayes and R.W.Clough - 1975 {PB 246 292)A10
EERC 75-16 "Hysteretic Behavior of Ductile Moment Resisting Reinforced Concrete Frame Components," by V.V. Bertero andE. P. Popov - 1975 (PB 246 388) A05
EERC 75-17 "Relationships Between Maximum Acceleration, Maximum Velocity, Distance from Source, Local Site Conditionsfor Moderately Strong Earthquakes," by H.B. Seed, R. Murarka, J. Lysmer and I.M. Idriss-1975 {PB 248 l72)A03
EERC 75-18 "The Effects of Method of Sample Preparation on the Cyclic Stress-Strain Behavior of Sands," by J. Mulilis,C.K. Chan and H.B. Seed - 1975 (Summarized in EERC 75-28)

189
EERC 75-19 "The Seismic Behavior of Critical Regions of Reinforced Concrete Components as Influenced by Moment, Shearand Axial Force," by M.B. Atalay and J. Penzien -1975 (PB 258 842)All
EERC 75-20 "Dynamic Properties of an Eleven Story Masonry Building," by R.M. Stephen, J.P. Hollings, J .G. Bouwkamp andD. Jurukovski - 1975 (PB 246 945)A04
EERC 75-21 "State-of-the-Art in Seismic Strength of Masonry - An Evaluation and Review," by R.L. Mayes and R.W. Clough
1975 (PB 249 040)A07
EERC 75-22 "Frequency Dependent Stiffness Matrices for Viscoelastic Half-Plane Foundations," by A.K. Chopra,P. Chakrabarti and G. Dasgupta -1975 (PB 248 121)A07
EERC 75-23 "Hysteretic Behavior of Reinforced Concrete Framed Walls," by T. Y. Wong, V. V. Bertero and E.P. Popov - 1975
EERC 75-24 "Testing Facility for Subassemblages of Frame-Wall Structural Systems," by V. V. Bertero, E.P. Popov andT. Endo - 1975
EERC 75-25 IlInfluence of Seismic History on the Liquefaction Characteristics of Sands," by H.B. Seed, K. Mari andC.K. Chan -1975 (Summarized in EERC 75-28)
EERC 75-26 "The Generation and Dissipation of Pore Water Pressures during Soil Liquefaction," by H.B. Seed, P.P. Martinand J. Lysmer - 1975 (PB 252 648) A03
EERC 75-27 "Identification of Research Needs for Improving Aseismic Design of Building Structures," by V.V. Bertero1975 (PB 248 136)A05
EERC 75-28 "Evaluation of Soil Liquefaction Potential during Earthquakes," by H.B. Seed, 1. Arango and C.K. Chan -1975(!\''UREG 0026)A13
EERC 75-29 "Representation of Irregular Stress Time Histories by Equivalent Uniform Stress Series in LiquefactionAnalyses," by H.B. Seed, 1.M. Idriss, F. Makdisi and N. Banerjee -1975 (PB 252 635)A03
EERC 75-30 "FLUSH - A Computer Program for Approximate 3-D Analysis of Soil-Structure Interaction Problems," byJ. Lysmer, T. Udaka, C.-F. Tsai and H.B. Seed -1975 (PB 259 332)A07
EERC 75-31 "ALUSH - A Computer Program for Seismic Response Analysis of Axisymmetric Soil-Structure Systems," byE. Berger, J. Lysmer and H. B. Seed - 1975
EERC 75-32 "TRIP and TRAVEL - Computer Programs for Soil-Structure Interaction Analysis with Horizontally TravellingWaves, II by T .. Udaka, ,..1. Lvsmer and H. B. Seed - 1975
EERC 75-33 "Predicting the Performance of Structures in Regions of High Seismicity," by J. Penzien -1975 (PB 248 l30)A".;
EERC 75-34 "Efficient Finite Element Analysis of Seismic Structure -Soil- Direction, II by J. Lysmer, H.B. Seed, T. Udaka,R.N. Hwang and C.-F. Tsai -1975 (PB 253 570)A03
EERC 75-35 "The Dynamic Behavior of a First Story Girder of a Three-Story Steel Frame Subjected to Earthquake Loading,'by R.W. Clough and L.-Y. Li-1975 (PB 248 841)A05
EERC 75-36 "Earthquake Simulator Study of a Steel Frame Structure, Volume II -Analytical Results," by D.T. Tang -1975(PB 252 926) AID
EERC 75-37 "ANSR-I General Purpose Computer Program for Analysis of Non-Linear Structural Response," by D.P. Mondkarand G.H. Powell-1975 (PB 252 386)A08
EERC 75-38 "Nonlinear Response Spectra for Probabilistic Seismic Design and Damage Assessment of Reinforced ConcreteStructures," by M. Mu~akami and J. Penzien -1975 (PB 259 530)A05
EERC 75-39 "Study of a Method of Feasible Directions for Optimal Elastic Design of Frame Structures Subjected to Eacj,quake Loading," by N.D. Walker and K.S. Pister -1975 (PB 257 781)A06
EERC 75-40 "An Alternative Represent.ation of the Elastic-Viscoelastic Analogy,I' by IJ. Dasgupta and J.L. Sackman -1975(PB 252 173)A03
EERC 75-41 "Effect of Multi-Directional Shaking on Liquefaction of Sands," by H. B. Seed, R. Pyke and G. R. Martin - 19"1'"(PB 258 781) A03
EERC 76-1 "Strength and Ductility Evaluation of Existing Low-Rise Reinforced Concrete Buildings - Screening Meth()il .. " c"T. Okada and B. Bresler-1976 (PB 257 906)All
EERC 76-2 "Experimental and Analytical Studies on the Hysteretic Behavior of Reinforced Concrete Rectangular andT-Beams," by S.-Y.M. Ma, E.P. Popov and V.V. Bertero -1976 (PB 260 843)1'.12
EERC 76- 3 "Dynamic Behavior of a Multistory Triangular-Shaped Building I" by J. Petrovski, R. M. Stephen, E. GartenbaUII)and J.G. Bouwkamp-1976 (PB 273 279)A07
EERC 76-4 "Earthquake Induced Deformations of Earth Darns," by N. Serff, H.B. Seed, F.I. Makdisi & C.-Y. Chang - 1976(PB 292 065)A08

190
EERC 76-5 "Analysis and Design of Tube-Type Tall Buildinq Structures," by H. de Clercq and G.H. Powell -1976 (PB 252220)AIO
EERC 76-6 "Time and Frequency Domain Analysis of Three-Dimensional Ground Motions, San Fernando Earthquake," by T. Kuboand J. Penzien {PB 260 556)All
EERC 76-7 "Expected Performance of Uniform Building Code Design Masonry Structures," by R. L. Mayes, Y. Ornote, S .1-1. Chenand R.W. Clough -1976 (PB 270 098)A05
EERC 76-8 "Cyclic Shear Tests of Masonry Piers, Volume 1 - Test Results, II by R. L. Mayes, Y. Ornote I R. W.Clough - 1976 (PB 264 424) A06
EERC 76-9 "A Substructure Method for Earthquake Analysis of Structure - Soil Interaction," by J .A. Gutierrez andA.K. Chopra - 1976 (PB 257 783)A08
EERC 76-10 "Stabilization of Potentially Liquefiable Sand Deposits using Gravel Drain Systems," by H.B. Seed andJ. R. Booker - 1976 (PB 258 820) A04
EERC 76-11 "Influence of Design and Analysis Assumptions on Computed Inelastic Response of Moderately Tall Frames," byG. H. Powell and D. G. Row - 1976 (PB 271 409) A06
EERC 76-12 "Sensitivity Analysis for Hysteretic Dynamic Systems: Theory and Applications," by D. Ray, K.S. Pister andE. Polak-1976 (PB 262 859)A04
EERC 76-13 "Coupled Lateral Torsional Response of Buildings to Ground Shaking," by C.L. Kan and A.K. Chopra 1976 (PB 257 907)A09
EERC 76-14 "Seismic Analyses of the Banco de America," by V.V. Bertero, S.A. Mahin and J.A. Hollings - 1976
EERC 76-15 "Reinforced Concrete Frame 2: Seismic Testing and Analytical Correlation," by R.W. Clough andJ. Gidwani - 1976 (PB 261 323)A08
EERC 76-16 "Cyclic Shear Tests of Masonry Piers, Volume 2 - Analysis of Test Results," by R.L. Mayes, Y. Omoteand R.W. Clough - 1976
EERC 76-17 "Structural Steel Bracing Systems: Behavior Under Cyclic Loading," by E.P. Popov, K. Takanashi andC.W. Roeder - 1976 (PB 260 715)A05
EERC 76-18 "Experimental Model Studies on Seismic Response of High Curved Overcrossings," by D. Williams andW.G. Godden - 1976 (PB 269 548)A08
EERC 76-19 "Effects of Non-Uniform Seismic Disturbances on the Dumbarton Bridge Replacement Structure," byF. Baron and R.E. Hamati - 1976 (PB 282 98l)A16
EERC 76-20 "Investigation of the Inelastic Characteristics of a Single Story Steel Structure Using SystemIdentification and Shaking Table Experiments," by V.C. Matzen and H.D. McNiven - 1976 (PB 258 453)A07
EERC 76-21 "Capacity of Columns with Splice Imperfections," by E.P. Popov, R.M. Stephen and R. Philbrick - 1976(PB 260 378)A04
EERC 76-22 "Response of the Olive View Hospital Main Building during the San Fernando Earthquake," by S. A. Mahin,V.V. Bertero, A.K. Chopra and R. Collins - 1976 IPB 271 425)A14
EERC 76-23 "A Study on the Major Factors Influencing the Strength of Masonry Prisms," by N.M. Mostaghel,R.L. Mayes, R. W. Clough and S.W. Chen - 1976 (Not published)
EERC 76-24 "GADFLEA - A Computer Program for the Analysis of Pore Pressure Generation and Dissipation duringCyclic or Earthquake Loading," by J.R. Booker, M.S. Rahman and H.B. Seed - 1976 (PB 263 947)A04
EERC 76-25 "Seismic Safety Evaluation of a RiC School Building," by B. Bresler and J. Axley - 1976
EERC 76-26 "Correlative Investigations on Theoretical and Experimental Dynamic Behavior of a Model BridgeStructure," by K. Kawashima and J. Penzien - 1976 (PB 263 388)All
EERC 76-27 "EarthqUake Response of Coupled Shear Wall Buildings," by T. Srichatrapimuk - 1976 (PB 265 157) A07
EERC 76-28 "Tensile Capacity of Partial Penetration Welds," by E.P. Popov and R.M. Stephen - 1976 (PB 262 899)A03
EERC 76-29 "Analysis and Design of Numerical Integration Methods in Structural Dynamics," by H.M. Hilber - 1976{PB 264 410)A06
EERC 76-30 "Contribution of a Floor System to the Dynamic Characteristics of Reinforced Concrete Buildings," byL.E. Malik and V.V. Bertero - 1976 (PB 272 247)A13
EERC 76-31 "The Effects of Seismic Disturbances on the Golden Gate Bridge," by F. Baron, M. Arikan and R.E. Hamati _1976 (PB 272 279)A09
EERC 76-32 "Infilled Frames in Earthquake Resistant Construction," by R.E. Klingner and V. V. Bertero - 1976(PB 265 892)A13

191
UCB/EERC-77/0l "PLUSH - A Computer Program for Probabilistic Finite Element Analysis of Seismic soil-Structure Interaction," by M.P. Forno Organista, J. Lysmer and H.B. Seed - 1977
UCB/EERC-77/02 "Soil-Structure Interaction Effects at the Humboldt Bay Power Plant in the Ferndale Earthquake of June7, 1975," by J.E. Valera, H.B. Seed, C.F. Tsai and J. Lysmer - 1977 (PB 265 795)A04
UCB/EERC-77/03 "Influence of Sample Disturbance on Sand Response to Cyclic Loading," by K. Mori, H.B. Seed and C.K.Chan - 1977 (PB 267 352)A04
UCB/EERC-77 /04 "Seismological Studies of Strong Motion Records," by J. Shoja-Taheri - 1977 {PB 269 655)A10
UCB/EERC-77/05 "Testing Facility for Coupled-Shear Walls," by L. Li-Hyung, V.V. Bertero and E.P. Popov - 1977
UCB/EERC-77/06 "Developing Methodologies for Evaluating the Earthquake Safety of Existing Buildings," by No. 1 ~
B. Bresler; No.2 - B. Bresler, T. Okada and D. Zisling; No.3 - T. Okada and B. Bresler, No.4 - V.V.Bertero and B. Bresler - 1977 (PB 267 354)A08
UCB/EERC-77/07 "A Literature Survey - Transverse Strength of Masonry Walls," by Y. Ornote, R.L. Mayes, S.W. Chen andR.W. Clough - 1977 (PB 277 933)A07
UCB/EERC-77/08 "DRAIN-TABS: A Computer Program for Inelastic Earthquake Response of Three· Dimensional Buildings," byR. Guendelman-Israel and G.H. Powell - 1977 (PB 270 693)A07
UCB/EERC-77/09 "SUBWALL: A Special Purpose Finite Element Computer Program for Practical Elastic Analysis and Designof Structural Walls with Substructure Option," by D.Q. Le, H. Peterson and E.P. Popov - 1977(PB 270 567)A05
UCB/EERC-77/l0 "Experimental Evaluation of Seismic Design Methods for Broad Cylindrical Tanks," by D. P. Clough(PB 272 280)A13
UCB/EERC-77 /11 "Earthquake Engineering Research at Berkeley - 1976," - 1977 (PB 273 507) A09
UCB/EERC-77/l2 "Automated Design of Earthquake Resistant Multistory Steel Building Frames," by N.D. Walker, Jr. - 1977(PB 276 526)A09
UCB/EERC-77 /13 "Concrete Confined by Rectangular Hoops Subjected to Axial Loads," by J. Vallenas, V. V. Bertero andE.P. Popov - 1977 (PB 275 l65)A06
UCB/EERC-77/l4 "Seismic Strain Induced in the Ground During Earthquakes," by Y. Sugimura - 1977 (PB 284 20l)AD4
UCB/EERC-77/l5 "Bond Deterioration under Generalized Loading," by V.V. Bertero, E.P. Popov and S. Viwathanatepa - 1977
UCB/EERC-77/l6 "Computer Aided Optimum Design of Ductile Reinforced Concrete Moment Resisting Frames," by S.W.Zagajeski and V.V. Bertero - 1977 (PB 280 l37)A07
UCB/EERC-77 /17 "Earthquake Simulation Testing of a Stepping Frame with Energy-Absorbing Devices," by J. M. Kelly andD.F. Tsztoo - 1977 (PB 273 506)A04
UCB/EERC-77/18 "Inelastic Behavior of Eccentrically Braced Steel Frames under Cyclic Loadings," by C.W. Roeder andE.P. Popov - 1977 (PB 275 526)A15
UCB/EERC-77/l9 "A Simpli lied Procedure for Estimating Earthquake-Induced Deformations in Darns and Embankments," by F. 1.Makdisi and H.B. Seed - 1977 (PB 276 820)A04
UCB/EERC-77/20 "The Performance of Earth Darns during Earthquakes," by H.B. Seed, F.1. Makdisi and P. de Alba - 1977(PB 276 821)A04
UCB/EERC-77/21 "Dynamic Plastic Analysis Using Stress Resul tant Finite Element Formulation, II by P. Lukkunapvasi t andJ.M. Kelly - 1977 {PB 275 453)A04
UCB/EERC-77/22 "Preliminary Experimental Study of Seismic Uplift of a Steel Frame," by R.W. Clough and A.A. Huckelbridgc1977 (PB 278 769)A08
UCB/EERC-77 /23 "Earthquake Simulator Tests of a Nine-Story Steel Frame with Columns Allowed to Uplift," by A. A.Huckelbridge - 1977 (PB 277 944)A09
UCB/EERC-77/24 "Nonlinear Soil-Structure Interaction of Skew Highway Bridges," by M.-C. Chen and J. Penzien - 1977(PB 276 176)A07
UCB/EERC-77/25 "Seismic Analysis of an Offshore Structure Supported on Pile Foundations," by D.D.-N. Liou and J. Penzien1977 (PB 283 180)A06
UCB/EERC-77/26 "Dynamic Stiffness Matrices for Homogeneous Viscoelastic Half-Planes," by G. Dasgupta and A.K. Chopra 1977 (PB 279 654)A06
UCB/EERC-77/27 "A Practical Soft Story Earthquake Isolation System," by J. M. Kelly, J .~!. Eidinger and C. J. Derham 1977 (PB 276 814)A07
UCB/EERC-77/28 "Seismic Safety of Existing Buildings and Incentives for Hazard Mitigation in San Francisco: AnExploratory Study," by A.J. Meltsner - 1977 (PB 281 970)A05
UCB/EERC-77/29 "Dynamic Analysis of Electrohydraulic Shaking Tables," by D. Rea, S. Abedi-Hayati and Y. Takahashi1977 (PB 282 569)A04
UCB/EERC-77/30 IIAn Approach for Improving Seismic - Resistant Behavior of Reinforced Concrete Interior Joints," byB. Galunic, V.V. Bertero and E.P. Popov - 1977 (PB 290 870)A06

UCB/EERC-78/01
UCB/EERC-78/02
UCB/EERC-78/03
UCB/EERC-78/04
UCB/EERC-78/05
UCB/EERC-78/06
UCB/EERC-78/07
UCB/EERC-78/08
UCB/EERC-78/09
UCB/EERC-78/10
UCB/EERC-78/11
UCB/EERC-78/12
UCB/EERC-78/13
UCB/EERC-78/14
UCB/EERC-78/15
UCB/EERC-78/16
192
"The Development of Energy-Absorbing Devices for Aseismic Base Isolation Systems," by J.M. Kelly andD.E. Tsztoo - 1978 (PB 284 978)A04
"Effect of Tensile Prestrain on the Cyclic Response of Structural Steel Connections, by J.G. Bouwkampand A. Mukhopadhyay - 1978
"Experimental Results of an Earthquake Isolation System using Natural Rubber Bearings," by J.M.Eidinger and J.M. Kelly - 1978 (PB 281 686)A04
"Seismic Behavior of Tall Liquid Storage Tanks," by A. Niwa - 1978 (PB 284 017)A14
"Hysteretic Behavior of Reinforced Concrete Columns Subjected to High Axial and Cyclic Shear Forces,1Iby S.W. Zagajeski, V.V. Bertero and J.G. Bouwkamp - 1978 (PB 283 858)A13
"Inelastic Beam-Column Elements for the ANSR-I Program," by A. Riahi, D.G. Rowand G.H. Powell - 1978
"Studies of Structural Response to Earthquake Ground Motion, II by O.A. Lopez and A.K. Chopra - 1978(PB 282 790)A05
"A Laboratory Study of the Fluid-Structure Interaction of Submerged Tanks and Caissons in Earthquakes,"by R.C. Byrd - 1978 (PB 284 957)A08
"Model for Evaluating Damageability of Structures," by r. Sakamoto and B. Bresler - 1978
"Seismic Performance of Nonstructural and Secondary Structural Elernents,1I by T. Sakamoto - 1978
"Mathematical Hodelling of Hysteresis Loops for Reinforced Concrete Colwnns," by S .. Nakata, T .. Sprouland J. Penzien - 1978
"Damageability in Existing Buildings," by T. Blejwas and B. Bresler - 1978
"Dynamic Behavior of a Pedestal Base Multistory Building," by R.M. Stephen, E.L. Wilson, J.G. Bouwkampand M. Button - 1978 (PB 286 650)A08
"Seismic Response of Bridges - Case Studies, II by R.A. Irnbsen, V .. Nutt and J. Penzien - 1978(PB 286 503)A10
"A Substructure Technique for Nonlinear Static and Dynamic Analysis," by D.G. Rowand G.H. Powell 1978 (PB 288 077)A10
"Seismic Risk Studies for San Francisco and for the Greater San Francisco Bay Area," by C.S. Oliveira 1978
UCB/EERC-78/17 "Strength of Timber Roof Connections Subjected to Cyclic Loads," by P. Gulkan, R.L. Mayes and R.W.Clough - 1978
CCB EERC-78/18 "Response of K-Braced Steel Frame Models to Lateral Loads," by J .G. Bouwkamp, R.M. Stephen andE.P. Popcv - 1978
CCB/EERC-78/19 II Rational Design Methods for Light Equipment in Structures Subj ected to Ground Motion, II byJ.L. Sackman and J.M. Kelly - 1978 (PB 292 357)A04
CCB./EERC-78/20 IITesting of a Wind Restraint for Aseismic Base Isolation,11 by J .M. Kelly and D.E. Chitty - 1978(PB 292 833) A03
UCB/EERC-78/2l "APOLLO - A Computer Program for the Analysis of Pore Pressure Generation and Dissipation in HorizontalSand Layers During Cyclic or Earthquake Loading," by P. P. Martin and H.B. Seed - 1978 (PB 292 835) A04
UCB/EERC-78/22 "Optimal Design of an Earthquake Isolation System," by M.A. Bhatti, K.S. Pister and E. Polak - 1978(PB 294 735)A06
UCB/EERC-78/23 "MASH - A Computer Program for the Non-Linear Analysis of Vertically Propagating Shear Waves inHorizontally Layered Deposits," by P.P. Martin and H.B. Seed - 1978 (PB 293 lOl)A05
UCB/EERC-78/24 "Investigation of the Elastic Characteristics of a Three Story Steel Frame Using System Identification,"by I. Kaya and H.D. McNiven - 1978
UCB/EERC-78/25 "Investigation of the Nonlinear Characteristics of a Three-Story Steel Frame Using SystemIdentification," by I. Kaya and H.D. McNiven - 1978
UCB/EERC-78/26 "Studies of Strong Ground Motion in Taiwan," by Y.M. Hsiung, B.A. Bolt and J. Penzien - 1978
UCB/EERC-78/27 "Cyclic Loading Tests of Masonry Single Piers: Volume 1 - Height to Width Ratio of 2," by P.A. Hidalgo,R.L. Mayes, H.D. McNiven and R.W. Clough - 1978
UCB/EERC-78/28 "Cyclic Loading Tests of Masonry Single Piers: Volume 2 - Height to Width Ratio of 1," by S. -W. J. Chen,P.A. Hidalgo, R.L. Mayes, R.W. Clough and H.D. McNiven - 1978
UCB/EERC-78/29 "Analytical Procedures in Soil Dynamics," by J. Lysmer - 1978

193
UCB/EERC-79/01 "Hysteretic Behavior of Lightweight Reinforced ConcreteBeam-Colunm Subassemblages," by B. Forzani, E.P. Popov,and V.V. Bertero - 1979
UCB/EERC-79/02 "The Development of a Mathematical Model to Predict theFlexural Response of Reinforced Concrete Beams to CyclicLoads, Using System Identification," by J.F. Stanton andH.D. McNiven - 1979
UCB/EERC-79/03 "Linear and Nonlinear Earthquake Response of SimpleTorsionally Coupled Systems," by C.L. Kan andA.K. Chopra - 1979
UCB/EERC-79/04 "A Mathematical Model of Masonry for Predicting ItsLinear Seismic Response Characteristics," by Y. Mengiand H.D. McNiven - 1979
UCB/EERC-79/05 "Mechanical Behavior of Lightweight Concrete Confinedby Different Types of Lateral Reinforcement," byM.A. Manrique, V.V. Bertero and E.P. Popov - 1979
UCB/EERC-79/06 "Static Tilt Tests of a Tall Cylindrical Liquid StorageTank," by R.W. Clough and A. Niwa - 1979
UCB/EERC-79/07 "The Design of Steel Energy Absorbing Restrainers andTheir Incorporation Into Nuclear Power Plants forEnhanced Safety: Volume 1 - Summary Report," byP.N. Spencer, V.F. Zackay, and E.R. Parker - 1979
UCB/EERC-79/08 "The Design of Steel Energy Absorbing" Restrainers andTheir Incorporation Into Nuclear Power Plants forEnhanced Safety: Volume 2 - The Development of Analysesfor Reactor System Piping," "Simple Systems" byM.C. Lee, J. Penzien, A.K. Chopra, and K. Suzuki"Complex Systems" by G.H. Powell, E.L. Wilson,R.W. Cloughand D.G. Row - 1979
UCB/EERC-79/09 "The Design of Steel Energy Absorbing Restrainers andTheir Incorporation Into Nuclear Power Plants forEnhanced Safety: Volume 3 - Evaluation of CommericalSteels," by W.S. Owen, R.t-1.N. Pel1oux, R.O. Ritchie,M. Faral, T. Ohhashi, J. Toplosky, S.J. Hartman, V.F.Zackay, and E.R. Parker - 1979
UCB/EERC-79/10 "The Design of Steel Epergy Absorbing Restrainers andTheir Incorporation Into Nuclear Power Plants forEnhanced Safety: Volume 4 - A Review of Energy-AbsorbingDevices," by J.M. Kelly and M.S. Skinner - 1979
UCB/EERC-79/ll "Conservatism In Summation Rules for Closely SpacedModes," by J.M. Kelly and J.L. Sackman - 1979

UCB/EERC-79/12
UCB/EERC-79/13
UCB/EERC-79/14
UCB/EERC-79/1S
UCB/EERC-79/16
UCB/EERC-79/l7
UCB/EERC-79/18
UCB/EERC-79/19
UCB/EERC-79/20
UCB/EERC-79/21
UCB/EERC-79/22
UCB/EERC-79/23
UCB/EERC";79/24
UCB/EERC-79/25
194
"Cyclic Loading Tests of Masonry Single Piers Volume3 - Height to Width Ratio of 0.5," by P.A. Hidalgo,R.L. Mayes, H.D. McNiven and R.W. Clough - 1979
"Cyclic Behavior of Dense Coarse-Grained Materials inRelation to the Seismic Stability of Dams," by N.G.Banerjee, H.B. Seed and C.K. Chan - 1979
"Seismic Behavior of Reinforced Concrete Interior Beam-ColumnSubassemblages," by S. Viwathanatepa, E.P. Popov andV.V. Bertero - 1979
"Optimal Design of Localized Nonlinear Systems withDual Performance Criteria Under Earthquake Excitations,"by M.A. Bhatti - 1979
"OPTDYN - A General Purpose Optimization Program forProblems with or without Dynamic Constraints," byM.A. Bhatti, E. Polak and K.S. Pister - 1979
"ANSR-II, Analysis of Nonlinear Structural Response,Users Manual," by D.P. Mondkar and G.H. Powell - 1979
"Soil Structure Interaction in Different SeismicEnvironments," A. Gomez-Masso, J. Lysmer, J.-C. Chenand H.B. Seed - 1979
"ARMA Models for Earthquake Ground Motions," by M.K.Chang, J.W. Kwiatkowski, R.F. Nau, R.M. Oliver andK.S. Pister - 1979
"Hysteretic Behavior of Reinforced Concrete StructuralWalls," by J.M. Val1enas, V.V. Bertero and E.P.Popov - 1979
"Studies on High-Frequency Vibrations of Buildings I:The Column Effects," by J. Lub1iner - 1979
"Effects of Generalized Loadings on Bond Reinforcing BarsEmbedded in Confined Concrete Blocks," by S. Viwathanatepa,E.P. Popov and V.V. Bertero - 1979
"Shaking Table Study of Single-Story Masonry Houses,Volume 1: Test Structures 1 and 2," by P. Gulkan,R.L. Mayes and R.W. Clough - 1979
"Shaking Table Study of Single-Story t·1asonry Houses,Volume 2: Test Structures 3 and 4," by P. Gulkan,R.L. Mayes and R.W.Clough - 1979
"Shaking Table Study of Single-Story Masonry Houses,Volume 3: Summary, Conclusions and Recommendations,"by R.W. Clough, R.L. Mayes and P. Gulkan - 1979

195
UCB/EERC-79/26 "Recommendations for a U.S.-Japan Cooperative ResearchProgram utilizing Large-Scale Testing Facilities," byU.S.-Japan Planning Group - 1979
UCB/EERC-79/27 "Earthquake-Induced Liquefaction Near Lake Amatitlan,Guatemala," by H.B. Seed, 1. Arango, C.K. Chan,A. Gomez-Masso and R. Grant de Asco1i - 1979
UCB/EERC-79/28 "Infi11 Panels: Their Influence on Seismic Response ofBuildings," by J.W. Axley and V.V. Bertero - 1979
UCB/EERC-79/29 "3D Truss Bar Element (Type 1) for the ANSR-II Program,"by D.P. Mondkar and G.H. Powell - 1979
UCB/EERC-79/30 "20 Beam-Column Element (Type 5 - Parallel ElementTheory) for the ANSR-II Program," by D.G. Row, G.H. Powelland D. P. Mondkar
UCB/EERC-79/31 "3D Beam-Column Element (Type 2 - Parallel ElementTheory) for the ANSR-II Program," by A. Riahi, G.H. Powelland D.P. Mondkar - 1979
UCB/EERC-79/32 "On Response of Structures to Stationary Excitation," byA. Der Kiureghian - 1979
UCB/EERC-79/33 "Undisturbed Sampling and Cyclic Load Testing of Sands,"by S. Singh, H.B. Seed and C.K. Chan - 1979
UCB/EERC-79/34 "Interaction Effects of Simultaneous Torsional andCompressional Cyclic Loading of Sand," by P.M. Griffinand W.N. Houston - 1979
UCB/EERC-80/01 "Earthquake Response of Concrete Gravity Dams IncludingHydrodynamic and Foundation Interaction Effects," byA.K. Chopra, P. Chakrabarti and S. Gupta - 1980
UCB/EERC-80/02 "Rocking Response of Rigid Blocks to Earthquakes,"by C.S. Yim, A.K. Chopra and J. Penzien - 1980
UCB/EERC-80/03 "Optimum Inelastic Design of Seismic-Resistant ReinforcedConcrete Frame Structures," by S.W. Zagajeski and V.V.Bertero - 1980
UCB/EERC-80/04 "Effects of Amount and Arrangement of Wall-PanelReinforcement on Hysteretic Behavior of ReinforcedConcrete Walls," by R. Iliya and V.V. Bertero - 1980
UCB/EERC-80/05 "Shaking Table Research on Concrete Dam Models," byR.W. Clough and A. Niwa - 1980
UCB/EERC-80/06 "piping with Energy Absorbing Restrainers: ParameterStudy on Small Systems," by G.H. powell, C. Oughourlianand J. Simons - 1980

196
UCB/EERC-80/07 "Inelastic Torsional Response of Structures Subjectedto Earthquake Ground Motions," by Y. Yamazaki - 1980
UCB/EERC-80/08 "Study of X-Braced Steel Frame Structures UnderEarthquake Simulation," by Y. Ghanaat - 19BO
UCB/EERC-BO/09 "Hybrid Modelling of soil-Structure Interaction," byS. Gupta, T.W. Lin, J. Penzien and C.S. Yeh - 1980
UCB/EERC-80/10 "General Applicability of a Nonlinear Model of a OneStory Steel Frame," by B. I. Sveinsson and :a. McNiven - 1980
UCB/EERC-BO/ll "A Green-Function Method for Wave Interaction with aSubmerged Body," by W. Kioka - 1.9BO
UCB/EERC-BO/12 "Hydrodynamic Pressure and Added Mass for AxisymmetricBodies," by F. Nilrat - 1980
UCB/EERC-BO/13 "Treatment of Non-Linear Drag Forces Acting on OffshorePlatforms," by B. V. Dao and J. Penzien - 1980
UCB/EERC-BO/14 "2D plane/Axisynunetric Solid Element (Type 3 - Elasticor Elastic-Perfectly Plastic) for the ANSR-II Program,"by D.P. Mondkar and G.H. Powell - 1980
UCB/EERC-BO/15 "A Response Spectrum Method for Random Vibrations," byA. Der Kiureghian - 1980
UCB/EERC-BO/16 "Cyclic Inelastic Buckling of Tubular Steel Braces," byV.A. Zayas, E.P. Popov and S.A. Mahin - June 1980


![[Eng] Topic Training - Buckling lengths for steel 14.0](https://static.fdokumen.com/doc/165x107/63135415c72bc2f2dd03fc03/eng-topic-training-buckling-lengths-for-steel-140.jpg)