Effects of multiple earthquakes on inelastic structural response
10
This article appeared in a journal published by Elsevier. The attached copy is furnished to the author for internal non-commercial research and education use, including for instruction at the authors institution and sharing with colleagues. Other uses, including reproduction and distribution, or selling or licensing copies, or posting to personal, institutional or third party websites are prohibited. In most cases authors are permitted to post their version of the article (e.g. in Word or Tex form) to their personal website or institutional repository. Authors requiring further information regarding Elsevier’s archiving and manuscript policies are encouraged to visit: http://www.elsevier.com/authorsrights
Transcript of Effects of multiple earthquakes on inelastic structural response

This article appeared in a journal published by Elsevier. The attachedcopy is furnished to the author for internal non-commercial researchand education use, including for instruction at the authors institution
and sharing with colleagues.
Other uses, including reproduction and distribution, or selling orlicensing copies, or posting to personal, institutional or third party
websites are prohibited.
In most cases authors are permitted to post their version of thearticle (e.g. in Word or Tex form) to their personal website orinstitutional repository. Authors requiring further information
regarding Elsevier’s archiving and manuscript policies areencouraged to visit:
http://www.elsevier.com/authorsrights

Author's personal copy
Short communication
Effects of multiple earthquakes on inelastic structural response
L. Di Sarno ⇑University of Sannio, Department of Engineering, Piazza Roma, 21, 80121 Benevento, Italy
a r t i c l e i n f o
Article history:Received 19 November 2012Revised 1 April 2013Accepted 27 May 2013Available online 4 July 2013
Keywords:Multiple earthquakeSeismic responseReinforced concrete structuresDegrading systemsDuctilityEnergy dissipation
a b s t r a c t
The basic approach for seismic design of structures utilizes a single loading scenario and a single perfor-mance criterion; usually life-safety. In recent years, social and economic considerations have necessitatedthat more than one performance criterion is used, and also more than one level of earthquake intensity.This multiple load-and-limit state seismic design is the current best practice. There are a few locationsaround the world that warrant an alternative approach. These locations are affected by more than oneearthquake within a relatively short period of time due to their special seismo-tectonic setting. Few exist-ing studies simply assume that the first earthquake will impose the maximum damage. An opportunityhas presented itself to study the effect of multiple strong earthquakes on structures as a consequence tothe exceptionally rich set of records obtained from the earthquake sequence of Tohoku (Japan), startingon March 2011. In this technical note, five stations are selected to represent a set of sites subjected tomultiple earthquakes of varying magnitudes and source-to-site distances. From the tens of records cap-tured at these five sites, three are selected for each site to represent scenarios of leading and trailingstrong-ground motion. A leading set is where the first earthquake has the largest peak ground accelera-tion (PGA) in the sequence of three, while a trailing set has the second or third records as its highest PGAsignal. A short list of earthquake response parameters is selected, and the records are treated in two dif-ferent manners. Inelastic constant ductility spectra for acceleration response are examined, alongsideforce reduction factor spectra. The final part of the technical note is a reinforced concrete (RC) frame anal-ysis subjected to the same set of ground motions used for the response spectra. The inelastic responseand force reduction factor spectra, alongside the inelastic response of the RC frame, not only confirm thatmultiple earthquakes deserve extensive and urgent studies, but also give indications of the levels of lackof conservatism in the safety of conventionally-designed structures when subjected to multipleearthquakes.
� 2013 Elsevier Ltd. All rights reserved.
1. Introduction
There is substantial field evidence showing that the sequence ofseismic events characterized by an earthquake with moderateintensity, followed by aftershocks with comparable or even highermagnitude, may occur in several hazard-prone regions world-wide([7,8], among others), e.g. in California (Mammoth Lakes, 1980;Coalinga, 1983; Whittier Narrows, 1987; Northridge 1994), Italy(Friuli, 1976; Irpinia, 1980; Umbria-Marche, 1997; L’Aquila,2009), Japan (Kobe, 1995; Niigata, 2004; Tohoku, 2011), New Zea-land (Darfield, 2010; Christchurch, 2011) and Turkey (2011 VanEarthquakes,), among many others. Although researchers haveyet to agree on the fundamental differences in characteristics be-tween a main shock and major afore- and after-shocks [17], thereis a renewed interest in assessing the effects of seismic sequenceson the structural response of new and existing buildings andbridges. Early analytical investigations carried out by Mahin [18]
showed that the displacement ductility demand of elastic–per-fectly plastic single-degree-of-freedom (SDOF) systems mayslightly increase at the end of the aftershock with respect to themain shock. Similar results were found by Aschheim and Black[4]. They examined the effects of prior earthquake damage onSDOF stiffness degrading structures and concluded that prior duc-tility demand has a very minor influence on peak displacement re-sponse. It was, however, assumed that prior displacementdemands were less than those that would result if the structurewas initially undamaged. Elnashai et al. [10], assessing an updateddatabase of seismic records from Europe, California and Japan, ob-served that the ductility demand required by multiple earthquakeground motions can be remarkably higher than that required by asingle event. This finding has been confirmed lately by extensiveanalytical work on SDOF systems and multi-storey steel buildings[3,12]. However, the latter numerical studies were neither exhaus-tive nor conclusive, since they examined only one natural and twoartificial far-fault ground motions. More recently, extensive inelas-tic analyses have been carried out on a large ensemble of as-re-corded main- and after-shocks to investigate the effects of
0141-0296/$ - see front matter � 2013 Elsevier Ltd. All rights reserved.http://dx.doi.org/10.1016/j.engstruct.2013.05.041
⇑ Tel.: +39 0824305566; fax: +39 0824325246.E-mail address: [email protected]
Engineering Structures 56 (2013) 673–681
Contents lists available at SciVerse ScienceDirect
Engineering Structures
journal homepage: www.elsevier .com/ locate /engstruct
Author's personal copy
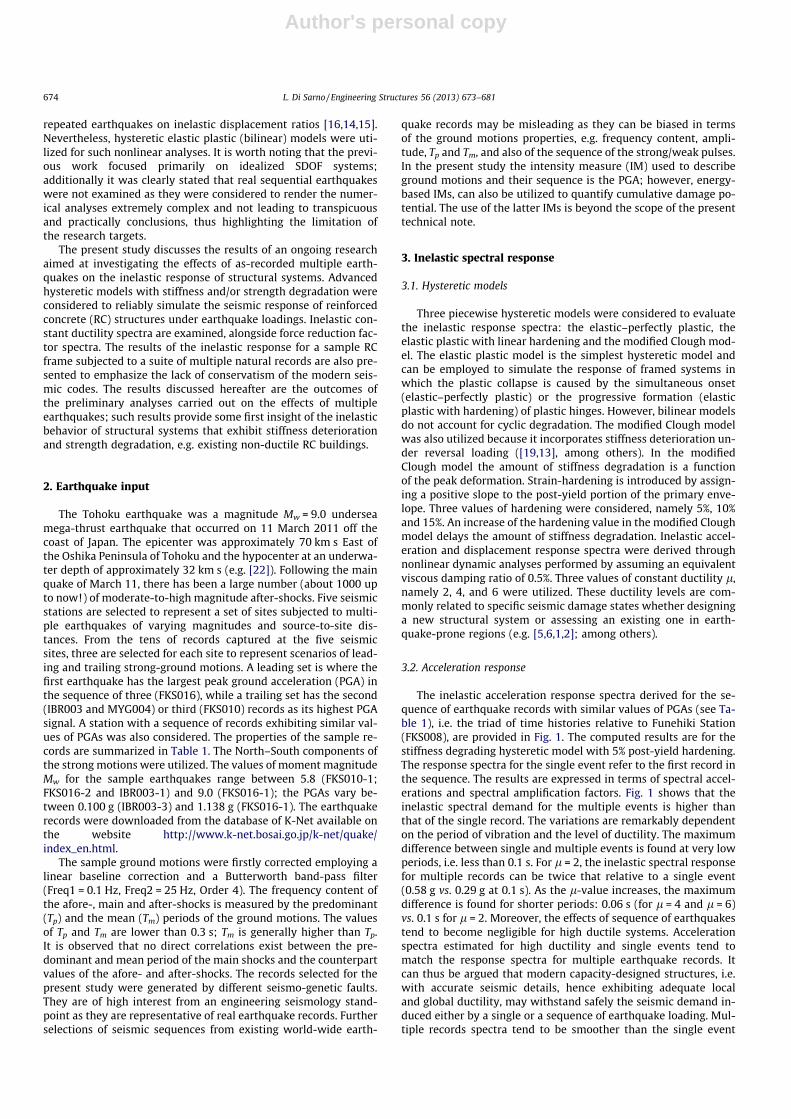
repeated earthquakes on inelastic displacement ratios [16,14,15].Nevertheless, hysteretic elastic plastic (bilinear) models were uti-lized for such nonlinear analyses. It is worth noting that the previ-ous work focused primarily on idealized SDOF systems;additionally it was clearly stated that real sequential earthquakeswere not examined as they were considered to render the numer-ical analyses extremely complex and not leading to transpicuousand practically conclusions, thus highlighting the limitation ofthe research targets.
The present study discusses the results of an ongoing researchaimed at investigating the effects of as-recorded multiple earth-quakes on the inelastic response of structural systems. Advancedhysteretic models with stiffness and/or strength degradation wereconsidered to reliably simulate the seismic response of reinforcedconcrete (RC) structures under earthquake loadings. Inelastic con-stant ductility spectra are examined, alongside force reduction fac-tor spectra. The results of the inelastic response for a sample RCframe subjected to a suite of multiple natural records are also pre-sented to emphasize the lack of conservatism of the modern seis-mic codes. The results discussed hereafter are the outcomes ofthe preliminary analyses carried out on the effects of multipleearthquakes; such results provide some first insight of the inelasticbehavior of structural systems that exhibit stiffness deteriorationand strength degradation, e.g. existing non-ductile RC buildings.
2. Earthquake input
The Tohoku earthquake was a magnitude Mw = 9.0 underseamega-thrust earthquake that occurred on 11 March 2011 off thecoast of Japan. The epicenter was approximately 70 km s East ofthe Oshika Peninsula of Tohoku and the hypocenter at an underwa-ter depth of approximately 32 km s (e.g. [22]). Following the mainquake of March 11, there has been a large number (about 1000 upto now!) of moderate-to-high magnitude after-shocks. Five seismicstations are selected to represent a set of sites subjected to multi-ple earthquakes of varying magnitudes and source-to-site dis-tances. From the tens of records captured at the five seismicsites, three are selected for each site to represent scenarios of lead-ing and trailing strong-ground motions. A leading set is where thefirst earthquake has the largest peak ground acceleration (PGA) inthe sequence of three (FKS016), while a trailing set has the second(IBR003 and MYG004) or third (FKS010) records as its highest PGAsignal. A station with a sequence of records exhibiting similar val-ues of PGAs was also considered. The properties of the sample re-cords are summarized in Table 1. The North–South components ofthe strong motions were utilized. The values of moment magnitudeMw for the sample earthquakes range between 5.8 (FKS010-1;FKS016-2 and IBR003-1) and 9.0 (FKS016-1); the PGAs vary be-tween 0.100 g (IBR003-3) and 1.138 g (FKS016-1). The earthquakerecords were downloaded from the database of K-Net available onthe website http://www.k-net.bosai.go.jp/k-net/quake/index_en.html.
The sample ground motions were firstly corrected employing alinear baseline correction and a Butterworth band-pass filter(Freq1 = 0.1 Hz, Freq2 = 25 Hz, Order 4). The frequency content ofthe afore-, main and after-shocks is measured by the predominant(Tp) and the mean (Tm) periods of the ground motions. The valuesof Tp and Tm are lower than 0.3 s; Tm is generally higher than Tp.It is observed that no direct correlations exist between the pre-dominant and mean period of the main shocks and the counterpartvalues of the afore- and after-shocks. The records selected for thepresent study were generated by different seismo-genetic faults.They are of high interest from an engineering seismology stand-point as they are representative of real earthquake records. Furtherselections of seismic sequences from existing world-wide earth-
quake records may be misleading as they can be biased in termsof the ground motions properties, e.g. frequency content, ampli-tude, Tp and Tm, and also of the sequence of the strong/weak pulses.In the present study the intensity measure (IM) used to describeground motions and their sequence is the PGA; however, energy-based IMs, can also be utilized to quantify cumulative damage po-tential. The use of the latter IMs is beyond the scope of the presenttechnical note.
3. Inelastic spectral response
3.1. Hysteretic models
Three piecewise hysteretic models were considered to evaluatethe inelastic response spectra: the elastic–perfectly plastic, theelastic plastic with linear hardening and the modified Clough mod-el. The elastic plastic model is the simplest hysteretic model andcan be employed to simulate the response of framed systems inwhich the plastic collapse is caused by the simultaneous onset(elastic–perfectly plastic) or the progressive formation (elasticplastic with hardening) of plastic hinges. However, bilinear modelsdo not account for cyclic degradation. The modified Clough modelwas also utilized because it incorporates stiffness deterioration un-der reversal loading ([19,13], among others). In the modifiedClough model the amount of stiffness degradation is a functionof the peak deformation. Strain-hardening is introduced by assign-ing a positive slope to the post-yield portion of the primary enve-lope. Three values of hardening were considered, namely 5%, 10%and 15%. An increase of the hardening value in the modified Cloughmodel delays the amount of stiffness degradation. Inelastic accel-eration and displacement response spectra were derived throughnonlinear dynamic analyses performed by assuming an equivalentviscous damping ratio of 0.5%. Three values of constant ductility l,namely 2, 4, and 6 were utilized. These ductility levels are com-monly related to specific seismic damage states whether designinga new structural system or assessing an existing one in earth-quake-prone regions (e.g. [5,6,1,2]; among others).
3.2. Acceleration response
The inelastic acceleration response spectra derived for the se-quence of earthquake records with similar values of PGAs (see Ta-ble 1), i.e. the triad of time histories relative to Funehiki Station(FKS008), are provided in Fig. 1. The computed results are for thestiffness degrading hysteretic model with 5% post-yield hardening.The response spectra for the single event refer to the first record inthe sequence. The results are expressed in terms of spectral accel-erations and spectral amplification factors. Fig. 1 shows that theinelastic spectral demand for the multiple events is higher thanthat of the single record. The variations are remarkably dependenton the period of vibration and the level of ductility. The maximumdifference between single and multiple events is found at very lowperiods, i.e. less than 0.1 s. For l = 2, the inelastic spectral responsefor multiple records can be twice that relative to a single event(0.58 g vs. 0.29 g at 0.1 s). As the l-value increases, the maximumdifference is found for shorter periods: 0.06 s (for l = 4 and l = 6)vs. 0.1 s for l = 2. Moreover, the effects of sequence of earthquakestend to become negligible for high ductile systems. Accelerationspectra estimated for high ductility and single events tend tomatch the response spectra for multiple earthquake records. Itcan thus be argued that modern capacity-designed structures, i.e.with accurate seismic details, hence exhibiting adequate localand global ductility, may withstand safely the seismic demand in-duced either by a single or a sequence of earthquake loading. Mul-tiple records spectra tend to be smoother than the single event
674 L. Di Sarno / Engineering Structures 56 (2013) 673–681

Author's personal copy
counterparts. As a result, structures subjected to a main event andseveral aftershocks seem to be less sensitive to the frequency con-tent of the input ground motion. The accumulation of local and glo-bal structural damage depends on the characteristics of the seismicmotions. The inelastic spectra computed for the Hitachi Station(IBR003), which include a set of records with the second havingthe highest PGA, are displayed in Fig. 2 for the hysteretic modelwith 5% hardening and ductility l = 2 and l = 6.
It is found that the inelastic demand due to the multiple earth-quakes is still higher than that of a single event. However, the vari-ations between the spectral acceleration amplifications are higherthan those computed for the Funehiki Station (FKS008). Such vari-ations may be attributed to the ratio of the PGA of the first and sec-ond record in the seismic sequence, i.e. 1.91 = 0.532/0.278. Theabove ratio is 1.22 = 0.279/0.229 for the multiple records used forFKS008. The spectral amplifications computed for IBR003 are high-er than FKS008 counterparts. At 0.12 s and low ductility, the ampli-fication for the seismic sequence of IBR003 is about 2.2; the valuefor the single event is about 25% lower. For FKS008 the amplifica-tions are on average 10%. For Hitachi Station, the presence of thesecond record in the sequence with the highest PGA has caused asignificant period elongation as also shown in Fig. 2, where theplots relative to the multiple earthquakes exhibit higher amplifica-tions at longer periods. For periods of vibration between 0.15 and0.45 s, the above elongation is on average about 40%, as shownby the lateral shifting of the response spectra for multiple recordsplotted of Fig. 2. The ductility level has a minor effect on such per-iod elongation. Significant variations in the acceleration spectralamplifications for the single and multiple events were also foundfor the case with the third record in the sequence with the highestacceleration. This observation is proved by the results computedfor Hirono (FKS010) Station provided in Fig. 3. However, as theductility increases, e.g. from l = 2 to l = 6, the afore-mentionedvariations become negligible.
From a structural design standpoint, it is worth comparing thenormalized strength g = Fy/M � PGA, where Fy is the yield forceand M the mass of the SDOF, for the sample single and multipleearthquakes. Fig. 4 provides the normalized strength ratios g�, de-fined as g� = gmultiple/gsingle, for Hitachi Station, i.e. the station withthe second record having the highest value of PGA in the seismicsequence. The results are for the stiffness degrading hystereticmodel with 5% and 10% hardening. It is observed that the normal-ized strength for multiple seismic events can be thrice that relativeto a single event and can be significantly influenced by the ductility
levels, especially for periods greater than 1.0 s. The ratio g� is great-er than 2 for low period systems, i.e. with periods lower than 1.0 s,and tends to the unity for long period structures for high ductilitylevels. The maximum value of g� computed for Hitachi Station is3.29 at 0.60 s; it refers to ductility 4% and 5% hardening. For higherhardening, e.g. 10%, the value of g� has a minor reduction (from3.29 to 3.08, see also Fig. 2); nevertheless, the maxima of g� arefound for shorter periods, e.g. 0.48 vs. 0.60 s relative to 5% and10% hardening, respectively.
3.3. Displacement response
The inelastic displacement response spectra for the samplestrong motions were computed for same levels of ductility andtypes of hysteretic model for the SDOF systems utilized the accel-eration spectra. Such response spectra were derived using the fol-lowing relationship:
c ¼ Sd;inel
Sd;elð1Þ
where Sd,inel and Sd,el are the inelastic and elastic spectral horizontaldisplacements, respectively. The inelastic displacements Sd,inel are afunction of the system ductility l.
The results of the performed analyses show that the applicationof seismic sequences leads consistently to higher inelastic defor-mation demands than single events. The extent of increase of theinelastic drift ratios varies between 1.5 and 4; the variation is afunction of the earthquake record and the hysteretic model. Theabove response is not significantly affected by the system ductilityand the period of vibration, especially in the range 0.5–2.5 s, whichcorresponds to the periods for most of new and existing structuresin practical applications. Fig. 5 illustrates, for example, the inelasticdrift ratios, i.e. the ratio of the inelastic displacement spectra, forthe Funehiki and Hitachi Stations for ductility 2 (low) and 6 (high).Hysteretic stiffness degrading models with 5% and 10% hardeningwere considered in the analyses. The maximum value of inelasticdrift ratio is found for Hitachi Station: about 4 for a SDOF systemwith a period of vibration of about 2.5 s. It should be noted thatthe triad of ground motions recorded in Funehiki have similar val-ues of PGAs (see also Table 1): they range between 0.229 g(FKS008-1) and 0.288 g (FKS008-3). The maximum inelastic driftratio computed for Funehiki is 1.9 at about 0.3 s. The values ofPGAs used for Hitachi Station range between 0.1 g (IBR003-3)and 0.532 g (IBR003-2), i.e. the maximum PGA in the sequence is
Table 1Seismic stations and earthquake records.
Station Earthquake
Site ID Record ID Lat. Long. Depth (km) Dep (km) Mw PGA (g) Tp (s) Tm (s)
Funehiki FKS008 FKS008-1 37.20 N 141.66 E 27 118 6.1 0.229 0.120 0.142FKS008-2 37.36 N 141.28 E 27 77 6.0 0.279 0.200 0.199FKS008-3 37.42 N 141.32 E 27 110 6.1 0.288 0.080 0.119
Hirono FKS010 FKS010-1 37.50 N 141.33 E 36 195 5.8 0.217 0.120 0.260FKS010-2 37.36 N 141.28 E 27 114 6.0 0.206 0.160 0.215FKS010-3 37.42 N 141.32 E 27 147 6.1 0.756 0.120 0.191
Shirakawa FKS016 FKS016-1 38.10 N 142.86 E 24 100 9.0 1.318 0.080 0.192FKS016-2 37.50 N 141.33 E 36 64 5.8 0.113 0.080 0.185FKS016-3 37.36 N 141.28 E 27 66 6.0 0.097 0.120 0.137
Hitachi IBR003 IBR003-1 37.50 N 141.33 E 36 41 5.8 0.278 0.100 0.200IBR003-2 36.11 N 141.26 E 43 28 7.7 0.532 0.100 0.159IBR003-3 37.42 N 141.32 E 27 35 6.1 0.100 0.100 0.144
Tsukidate MYG004 MYG004-1 39.84 N 142.70 E 32 259 7.4 0.113 0.160 0.254MYG004-2 39.03 N 142.28 E 36 109 6.5 0.230 0.280 0.242MYG004-3 38.73 N 141.02 E 24 100 6.7 0.110 0.120 0.207
Key: Dep = epicentral distance; Mw = moment magnitude; Tp = predominant period; Tm = mean period. The values of the peak ground acceleration for each seismic station arein bold.
L. Di Sarno / Engineering Structures 56 (2013) 673–681 675

Author's personal copy
twice that used for Funehiki. The IBR003-2 record corresponds to aMw = 7.7 seismic event; the FKS008-3 was registered for a Mw = 6.1earthquake. It can thus argued that the inelastic drift ratios are sig-nificantly affected also by the magnitude. The effects of the magni-tude and source-to-site distance should be, however, furtherinvestigated.
3.4. Force reduction factors
The force reduction factor ‘demand’ was computed as the ratioSaelastic/Sainelastic, where Saelastic and Sainelastic are the elastic andinelastic response spectral ordinates corresponding to a specificperiod T, respectively. The relationship between displacement duc-tility and ductility-dependent behavior factor has been extensivelystudied in the past decades (e.g. [11], for a detailed literature re-view). However, the previous studies focused primarily on a single
seismic event. More recently, Hatzigeorgiou [14,15] has investi-gated the effects of multiple earthquakes on force reduction fac-tors; nevertheless, the study did not account for hystereticmodels with stiffness and/or strength degradation. In general, elas-tic–plastic non-degrading SDOF systems exhibit higher energyabsorption and dissipation than degrading systems. Therefore, esti-mates of force reduction factors based on the former are some-times unconservative (i.e. they over-estimate R hence under-estimate the design force). Use of R-factors based on elastic–plasticresponse should therefore be treated with caution, especially forhigh levels of inelasticity. Utilizing the set of multiple earthquakerecords presented in Section 2 and different hysteretic models, itwas found that the reduction factors for multiple events can be sig-nificantly lower than those computed for a single record. For exam-ple, underestimations of 50–60% were computed for Funehiki andHitachi stations, for periods of about 0.3 s and about 2.0 s, respec-
0.0
0.2
0.4
0.6
0.8
1.0
0.0 0.2 0.4 0.6 0.8 1.0
Single Multiple
Period (seconds)
Spec
tral A
ccel
erat
ion
(g)
Ductility = 2 Kh / K = 5%
0.0
0.5
1.0
1.5
2.0
2.5
3.0
Single Multiple
Period (seconds)
Spec
tral A
mpl
ifica
tion
Fact
or (S
a/PG
A)
Ductility = 2 Kh / K = 5%
0.0
0.2
0.4
0.6
0.8
1.0
Single Multiple
Period (seconds)
Spec
tral A
ccel
erat
ion
(g)
Ductility = 4 Kh / K = 5%
0.0
0.5
1.0
1.5
2.0
2.5
3.0
Single Multiple
Period (seconds)
Ductility = 4 Kh / K = 5%Sp
ectra
l Am
plifi
catio
n Fa
ctor
(Sa/
PGA)
0.0
0.2
0.4
0.6
0.8
1.0
Single Multiple
Period (seconds)
Spec
tral A
ccel
erat
ion
(g)
Ductility = 6 Kh / K = 5%
0.0
0.5
1.0
1.5
2.0
2.5
3.0
Single Multiple
Period (seconds)
Ductility = 6 Kh / K = 5%
Spec
tral A
mpl
ifica
tion
Fact
or (S
a/PG
A)
0.0 0.2 0.4 0.6 0.8 1.0
0.0 0.2 0.4 0.6 0.8 1.0
0.0 0.2 0.4 0.6 0.8 1.0
0.0 0.2 0.4 0.6 0.8 1.0
0.0 0.2 0.4 0.6 0.8 1.0
Fig. 1. Inelastic response spectra for ductility 2 (top), ductility 4 (middle) and 6 (bottom) and Funehiki Station for the stiffness degrading hysteretic model with 5% hardening:spectral acceleration (left) and spectral amplification factors (right).
676 L. Di Sarno / Engineering Structures 56 (2013) 673–681

Author's personal copy
tively, as shown in Fig. 6 for low ductility level and hysteretic mod-el with stiffness degradation. The values of force reduction factorscorresponding to the formulation by Newmark and Hall [20] havealso been included in the figure as benchmark; their approxima-tion is acceptable for medium-to-long period systems. However,in the short-period range, e.g. for periods lower than 0.5 s, the forcereduction factors for single event are systematically higher thanthe multiple event counterparts.
Force reduction factor ratios, i.e. the ratio of the factors relativeto the seismic sequence and the single event, were also computedfor further investigate the conservatism, if any, of the existingforce-based methods for the design and assessment of structures.The results in Fig. 7 show the reduction factor ratios for Funehikiand Hitachi stations, for low-to-high value of ductility.
It is noted that the effect of ductility levels depend on the earth-quake and on the period of vibration. The force reduction ratiosvary significantly when the ductility increases from 2 to 6 for peri-ods ranging between 0.5 and 1.2 s for Funehiki and for periods be-tween 0.4 and 1.8 s for Hitachi. For the multiple earthquakes withthe intermediate records having the highest PGA the force reduc-tion factor ratios are the highest (see also Fig. 7).
4. Case study
4.1. Model description
The case study structure consists of a two-storey two-bay RCframe designed for gravity loads. The two bays are 2.55 m long;the interstorey heights are 3.5 m and 3.44 m for the first and sec-ond levels, respectively; the roof height is 7.65 m. The frame hasdeep beams, 0.3 m wide and 0.5 m deep; the columns have square
cross-sections (0.3 � 0.3 m). The compressive cylinder strength ofconcrete is 19.42 MPa. The steel yield strength is 330 MPa. The de-sign uniformly distributed loads are 20.33 kN/m and 13.58 kN/mfor the first and second floor, respectively. The seismic massesare 9.33 and 7.48 tons for the bottom and top storeys, respectively.The RC frame was tested experimentally without and with seismicretrofitting; further details can be found in Di Sarno and Manfredi[9]. The structural system was discretized with an advanced non-linear finite element model and implemented in the computerplatform IDARC2D [21]. The properties of the beams and columnswere computed by fiber models. The program IDARC2D was usedbecause it can trace the hysteretic response of RC sections andmembers of the sample frame. A piece-wise three linear skeletoncurve was employed to model the stiffness degradation, thestrength deterioration and pinching response. The trilinear yield-oriented curve was employed in the polygonal hysteretic model(PHM) to simulate the cyclic behavior. The PHM can thus accom-modate cracking in addition to yielding of the cross-sections andstructural members. The values for the hysteretic parameters ofthe PHM used in the simulations correspond to moderate degrad-ing effects, as also specified in [21]. Thus, the stiffness degradingparameter is 10.0, the strength degrading parameter (ductility-based) is 0.30, the strength degrading parameter (energy-con-trolled) is 0.15 and the slip or crack-closing parameter is 0.25.The PHM model employed for the simulation of the sample frameis consistent with the assumptions used to derive the inelastic re-sponse spectra in Section 3. Furthermore, it also accounts forstrength degradation which may occur in subsequent cycles.
A preliminary eigenvalue analysis was carried out to calibratethe numerical model with the available experimental data. Thefundamental period of vibration computed with the model imple-mented in IDARC2D is 0.35 s. The value of the natural period mea-
0.0
0.5
1.0
1.5
2.0
2.5
3.0
0.0 0.2 0.4 0.6 0.8 1.0
Single Multiple
Period (seconds)
Spec
tral A
ccel
erat
ion
(g)
Ductility = 2 Kh / K = 5%
0.0
0.5
1.0
1.5
2.0
2.5
3.0
Single Multiple
Period (seconds)
Spec
tral A
mpl
ifica
tion
Fact
or (S
a/PG
A)
Ductility = 2 Kh / K = 5%
0.0
0.5
1.0
1.5
2.0
2.5
3.0
Single Multiple
Period (seconds)
Spec
tral A
ccel
erat
ion
(g)
Ductility = 6 Kh / K = 5%
0.0
0.5
1.0
1.5
2.0
2.5
3.0
Single Multiple
Period (seconds)
Spec
tral A
mpl
ifica
tion
Fact
or (S
a/PG
A)
Ductility = 6 Kh / K = 5%
0.0 0.2 0.4 0.6 0.8 1.0 0.0 0.2 0.4 0.6 0.8 1.0
0.0 0.2 0.4 0.6 0.8 1.0
Fig. 2. Inelastic response spectra for ductility 2 (top) and 6 (bottom) and Hitachi Station for the stiffness degrading hysteretic model with 5% hardening: spectral accelerationspectra (left) and spectral amplification factors (right).
L. Di Sarno / Engineering Structures 56 (2013) 673–681 677

Author's personal copy
sured with on modal identification was 0.32 s; the difference be-tween numerical model and actual structure is about 9% and isacceptable for the aim of the present study.
4.2. Inelastic response analysis
A detailed collapse dynamic analysis was carried out on thesample RC frame subjected to the set of sample records. The sys-tem overstrength (X), global translation ductility (l) and (supply)force reduction factors (R) were computed. The latter structural re-sponse parameters were determined from the PGAs correspondingto the onset of the first yield and the formation of flexural failuremodes, namely storey and/or global mechanisms. R-factors canbe conveniently employed as all-encompassing response parame-
ters to quantify the energy absorption and dissipation capacity asthey account also for the effects of X and l. The hysteretic param-eters of the PHM utilized in the simulations correspond to moder-ate degrading effects; the adopted values were specified inSection 4.2. The results of the performed structural assessmentshow that R-factors for multiple seismic events can be significantlylower than those computed for single earthquake ground motions.The lower values of force reduction factors for the seismic se-quence depend primarily on the level of PGA characterizing the re-cords, the relative values of PGAs of the multiple records and theoccurrence of the event with the highest PGA in the sequence.For Hirono Station (FKS010) the R-factor for multiple events is56% lower than the single event counterpart: 3.74 vs. 2.40. This re-sponse may be due to the accumulated damage caused by the two
0.0
0.5
1.0
1.5
2.0
2.5
3.0
0.0 0.2 0.4 0.6 0.8 1.0
Single Multiple
Period (seconds)
Spec
tral A
ccel
erat
ion
(g)
Ductility = 2 Kh / K = 5%
0.0
0.5
1.0
1.5
2.0
2.5
3.0
Single Multiple
Period (seconds)
Spec
tral A
mpl
ifica
tion
Fact
or (S
a/PG
A)
Ductility = 2 Kh / K = 5%
0.0
0.5
1.0
1.5
2.0
2.5
3.0
Single Multiple
Period (seconds)
Spec
tral A
ccel
erat
ion
(g)
Ductility = 6 Kh / K = 5%
0.0
0.5
1.0
1.5
2.0
2.5
3.0
Single Multiple
Period (seconds)
Ductility = 6 Kh / K = 5%
Spec
tral A
mpl
ifica
tion
Fact
or (S
a/PG
A)
0.0 0.2 0.4 0.6 0.8 1.0 0.0 0.2 0.4 0.6 0.8 1.0
0.0 0.2 0.4 0.6 0.8 1.0
Fig. 3. Inelastic response spectra for ductility 2 (top) and 6 (bottom) and Hirono Station for the stiffness degrading hysteretic model with 5% hardening: spectral accelerationspectra (left) and spectral amplification factors (right).
0
1
2
3
4
Ductility = 2 Ductility = 4 Ductility = 6
Period (seconds)
Kh / K = 5%
Nor
mal
ized
Stre
ngth
Rat
io 3.29
0.60 sec
0
1
2
3
4
0.0 0.6 1.2 1.8 2.4 3.0 0.0 0.6 1.2 1.8 2.4 3.0
Ductility = 2 Ductility = 4 Ductility = 6
Period (seconds)
Kh / K = 10%
Nor
mal
ized
Stre
ngth
Rat
io
3.08
0.48 sec
Fig. 4. Normalized strength ratio spectra for the Hitachi Station: stiffness degrading hysteretic model with 5% (left) and 10% (right) hardening. Key: The spectra relative tosingle earthquake are used as benchmark.
678 L. Di Sarno / Engineering Structures 56 (2013) 673–681

Author's personal copy
0.0
1.0
2.0
3.0
4.0
0.0 0.6 1.2 1.8 2.4 3.0
Ductility = 2 Ductility = 6
Period (seconds)
Inel
astic
Drif
t Rat
io Kh / K = 5%
0.0
1.0
2.0
3.0
4.0
0.0 0.6 1.2 1.8 2.4 3.0
Ductility = 2 Ductility = 6
Period (seconds)
Inel
astic
Drif
t Rat
io
Kh / K = 5%
0.0
1.0
2.0
3.0
4.0
0.0 0.6 1.2 1.8 2.4 3.0
Ductility = 2 Ductility = 6
Period (seconds)
Inel
astic
Drif
t Rat
io Kh / K = 10%
0.0
1.0
2.0
3.0
4.0
0.0 0.6 1.2 1.8 2.4 3.0
Ductility = 2 Ductility = 6
Period (seconds)
Inel
astic
Drif
t Rat
io Kh / K = 10%
Fig. 5. Inelastic drift ratio spectra for ductility 2 and 6: Funehiki (left) and Hitachi (right) Stations for 5% (top) and 10% (bottom) hardening in the hysteretic model. Key: Theinelastic spectra relative to single earthquake are used as benchmark.
0.0
2.0
4.0
6.0
0.0 0.6 1.2 1.8 2.4 3.0
Single Multiple
Period (seconds)
Forc
e R
educ
tion
Fact
or
Ductility = 2 Kh / K = 5%
Elastic
µ = 2
0.0
2.0
4.0
6.0
0.0 0.6 1.2 1.8 2.4 3.0
Single Multiple
Period (seconds)
Ductility = 2 Kh / K = 5%
Forc
e R
educ
tion
Fact
or
Elastic
µ = 2
Fig. 6. Force reduction factors (ductility 2): for Funehiki (left) and Hitachi (right) Stations.
0.0
0.5
1.0
1.5
2.0
Ductility 2 Ductility 4 Ductility 6
Period (seconds)
Forc
e R
educ
tion
Fact
or R
atio
Kh / K = 5%
Unsafe
Safe
0.0
0.5
1.0
1.5
2.0
0.0 0.6 1.2 1.8 2.4 3.0 0.0 0.6 1.2 1.8 2.4 3.0
Ductility 2 Ductility 4 Ductility 6
Period (seconds)
Kh / K = 5%
Forc
e R
educ
tion
Fact
or R
atio
Unsafe
Safe
Fig. 7. Force reduction factor ratios: for Funehiki (left) and Hitachi (right) Stations. Key: The values relative to single earthquake are used as benchmark.
L. Di Sarno / Engineering Structures 56 (2013) 673–681 679

Author's personal copy
earthquake ground motions, namely FKS010-1 and FKS010-2,which hit the structure before the third event, that has the highestPGAs, occurs. The inelastic response analysis of the sample frameshows that of particular interest for the reliable seismic perfor-mance assessment is the damage that may occur in the structurewhen subjected to multiple earthquakes. For example, whenassessing the response of the RC frame under the recordMYG004-1 (with a PGA = 0.113 g) it is found that the structuralmembers experience cracking only. If the sequence of three recordsfor the Tsukidate Station (MYG004) is considered, the roof driftscaused by the multiple earthquakes are not significantly influencedby the deformations imposed by the first record MYG004-1. Thesecond seismic event has a PGA of 0.230 g and causes the forma-tion of a plastic hinge at the top section in the central column, atthe second level (see Fig. 8). However, the analyses for the singlerecord MYG004-2 shows that the estimation of the damage patterncan be misleading when compared to the failure modes due tomultiple earthquakes. The plastic hinge formed at the end of theseismic sequence in Fig. 8 was not detected considering the effectsof the single record MYG004-2 as pictorially displayed in the samefigure. Similar results were also derived for Hitachi Station. Theplastic hinges in the column and beam of the first level (seeFig. 8) were non-detected by considering only the IBR003-2 record.The effective cumulative structural damage should thus be reliablyassessed by considering the structure subjected to multiple earth-quake records. Further analyses have also demonstrated that per-manent (residual) displacements can be significantlyunderestimated when seismic performance assessment does notaccount for realistic multiple events, especially when the earth-quake hazard at a site may be influenced by multiple seismogenic
sources. Unfortunately, codes of practice and design guidelinesworldwide do not provide any provision. It is recommended thatfuture studies should, however, focus on the use of appropriatehysteretic models to account for the stiffness degradation, strengthdeterioration and pinching effects as also proved by the results ofthe frame analysis carried out herein. Fig. 9 shows, for example,the lateral response of the second floor of the sample frame whensubjected to the sequence relative to the Hitachi Station. It is dem-onstrated that stiffness degradation, strength deterioration andmoderate pinching effects should be employed to evaluate reliablyinelastic response parameters, e.g. inelastic peak (transient) andpermanent (residual) displacements.
5. Conclusions
This technical note was aimed at investigating the effects ofmultiple earthquakes on structures. Inelastic constant ductilityacceleration, displacement and force reduction factor spectra werederived for a set of strong motions registered at five stations duringthe 2011 Tohoku (Japan) earthquake and embracing different mag-nitudes and source-to-site distances. Comprehensive parametricresponse spectra were evaluated with degrading (stiffness and/orstrength) and non-degrading hysteretic models to account reliablyfor the response of reinforced concrete (RC) structure when sub-jected to high inelastic demand as in the case of multiple largeearthquakes. The structural assessment of a case study RC framewas also performed employing the set of ground motions usedfor the response spectra. Normalized strength spectra for seismicsequence have shown that the force demand on structures canbe thrice that relative to a single event. Such demand is, however,
-30
-20
-10
0
10
20
30
0 20 40 60Time (seconds)
Roo
f Lat
eral
Dis
plac
emen
t (m
m)
MYG004-1 MYG004-2 MYG004-3
PGA = 0.113g PGA = 0.230g PGA = 0.110g
Damage Pattern
-30
-20
-10
0
10
20
30
80 100 0 20 40 60 80 100Time (seconds)
Roo
f Dis
plac
emen
t (m
m)
IBR003-2
PGA = 0.278g PGA = 0.532g PGA = 0.100g
IBR003-1 IBR003-3
Damage Pattern
Fig. 8. Roof displacement response for the sequence of three records for Tsukidate (left) and Hitachi (right) Stations. The time intervals of each record in the seismic sequencehave been modified for computation reasons.
-30
-20
-10
0
10
20
30
0 20 40 60
Time (seconds)
Roo
f Lat
eral
Dis
plac
emen
t (m
m)
Roo
f Lat
eral
Dis
plac
emen
t (m
m)
-30
-20
-10
0
10
20
30
80 100 0 20 40 60 80 100
Time (seconds)
NO Pinching Moderate Pinching
w/o Degradation Stiffness-Only Strength-Only Stiffness & Strength w/o Degradation Stiffness-Only Strength-Only Stiffness & Strength
Fig. 9. Roof displacement time history response for Hitachi Station for the set of three records: hysteretic degrading models without (left) and with moderate (right) pinchingeffects. Key: The time intervals the seismic records have been modified for computation reasons.
680 L. Di Sarno / Engineering Structures 56 (2013) 673–681

Author's personal copy
significantly influenced by the ductility levels, especially for peri-ods greater than 1.0 s. Consistently higher inelastic displacementshave also been computed for multiple earthquakes. The RC frameanalysis corroborate the results derived with the inelastic responsespectra. The outcomes of the present study not only confirm thatmultiple earthquakes warrant extensive and urgent studies, butalso give indications of the levels of lack of conservatism in thesafety of conventionally-designed structures when subjected tomultiple earthquakes. It is emphasized to use adequate hystereticdegrading models for the reliable inelastic structural performanceevaluation, especially of RC structures.
Finally, it is recommended that modern codes of practice, espe-cially those for the assessment of existing RC frames designed forgravity loads only, should consider, e.g. in a simplified manner bymodifying the strength and/or deformation capacity of the struc-tural components, the effects of stiffness and strength degradationdue to the sequential earthquake sequences. Such modificationsmay be expressed as a function of the seismogenic source dis-tances. There are currently numerous conceptual inconsistenciesbetween the uniform hazard spectrum approaches and the perfor-mance-based design framework; such inconsistencies becomeeven more evident when considering the envisioned design alter-native for multiple-thrust events in areas prone to large magnitudeearthquakes. The present paper is a preliminary attempt towardsthe solution of such inconsistencies.
Acknowledgments
This work was financially supported by the Italian Consortiumof Laboratories RELUIS (Project 2010–2013 – Task 1.1.2 – Rein-forced and Precast Concrete Structures). Any opinions, findingsand conclusions or recommendations expressed in this paper arethose of the author and do not necessarily reflect those of the Con-sortium RELUIS. The author would also like to express his gratitudeto the anonymous reviewers who provided insightful commentsthat have contributed to improve significantly the quality of themanuscript.
References
[1] ASCE (American Society of Civil Engineers). Seismic rehabilitation of existingbuildings – ASCE/SEI 41. Reston, Virginia, USA; 2007.
[2] ASCE (American Society of Civil Engineers). Minimum design loads forbuildings and other structures – ASCE/SEI 7. Reston, Virginia, USA; 2010.
[3] Amadio C, Fragiacomo M, Rajgelj S. The effects of repeated earthquake groundmotions on the non-linear response of SDOF systems. Earthquake Eng StructDynam 2003;32(2):291–308.
[4] Aschheim M, Black E. Effects of prior earthquake damage on response of simplestiffness-degrading structures. Earthquake Spectra 1999;15(1):1–24.
[5] CEN (Comité Européen de Normalisation). Eurocode 8. Design of structures forearthquake resistance. Part 1: General rules. Specific rules, seismic actions andrules for buildings. CEN, Brussels, Belgium; 2006.
[6] CEN (Comité Européen de Normalisation). Eurocode 8. Design of structures forearthquake resistance. Part 3: Strengthening and repair of buildings. CEN,Brussels, Belgium; 2006.
[7] Di Sarno L, Elnashai AS, Manfredi G. Assessment of RC columns subjected tohorizontal and vertical ground motions recorded during the 2009 L’Aquila(Italy) earthquake. Eng Struct 2011;33(5):1514–35.
[8] Di Sarno L, Yenidogan C, Erdik M. Field evidence and numerical investigation ofthe Mw = 7.1 October 23 Van, Tabanli and the Mw > 5.7 November Earthquakesof 2011. Bull Earthquake Eng 2013. http://dx.doi.org/10.1007/s10518-012-9417-0.
[9] Di Sarno L, Manfredi G. Experimental tests on full-scale RC unretrofitted frameand retrofitted with buckling restrained braces. Earthquake Eng Struct Dynam2012;41(2):315–33.
[10] Elnashai AS, Bommer JJ, Martinez-Pereira A. Engineering implications ofstrong-motion records from recent. In: Proceedings of the 11th Europeanconference on earthquake engineering, CD-ROM; 1998.
[11] Elnashai AS, Di Sarno L. Fundamentals of earthquake engineering. Chichester(UK): Wiley & Sons; 2008.
[12] Fragiacomo M, Amadio C, Macorini L. Seismic response of steel frames underrepeated earthquake ground motions. Eng Struct 2004;26(13):2021–35.
[13] Genshu T, Yongfeng Z. Seismic force modification factors for modified-Cloughhysteretic model. Eng Struct 2007;29(11):3053–70.
[14] Hatzigeorgious G. Ductility demand spectra for multiple near- and far-faultearthquakes. Soil Dynam Earthquake Eng 2010;30(4):170–83.
[15] Hatzigeorgious G. Behavior factors for nonlinear structures subjected tomultiple earthquakes. Comput Struct 2010;88(5–6):309–21.
[16] Hatzigeorgious G, Beskos D. Inelastic displacement ratios for SDOF structuressubjected to repeated earthquakes. Eng Struct 2009;31(11):2744–55.
[17] Li Q, Ellingwood B. Performance evaluation and damage assessment of steelframe buildings under main shock-aftershock earthquake sequences.Earthquake Eng Struct Dynam 2007;36(3):405–27.
[18] Mahin SA. Effects of duration and aftershocks on inelastic design earthquakes.In: Proceedings of the 7th world conference on earthquake engineering, vol. 5;1980. p. 677–80.
[19] Miranda E, Ruiz-Garcia J. Influence of stiffness degradation on strengthdemands of structures built on soft soil sites. Eng Struct 2002;24(10):1271–81.
[20] Newmark NM, Hall WJ. Earthquake spectra and design, EERI MonographSeries. Oakland, California: EERI; 1982.
[21] Reinhorn AM, Roh H, Sivaselvan M, Kunnath SK, Valles RE, Madan A, et al.IDARC2D version 7.0: program for the inelastic damage analysis of structures.Technical report MCEER-09-0006. University of Buffalo, State University ofNew York; 2009.
[22] Takewaki I, Murakami S, Fujita K, Yoshitomi S, Tsuji M. The 2011 off the Pacificcoast of Tohoku earthquake and response of high-rise buildings under long-period ground motions. Soil Dynam Earthquake Eng 2011;31(11):1511–28.
L. Di Sarno / Engineering Structures 56 (2013) 673–681 681