Damage mechanics analysis of inelastic behaviour of fiber ...
189
DOCTORAL THESIS Luleå University of Technology Department of Applied Physics and Mechanical Engineering Division of Polymer Engineering 2005:50|:02-5|: - -- 05⁄50 -- 2005:50 Damage mechanics analysis of inelastic behavior of fiber composites Peter Lundmark
-
Upload
khangminh22 -
Category
Documents
-
view
0 -
download
0
Transcript of Damage mechanics analysis of inelastic behaviour of fiber ...
DOCTORA L T H E S I SDOCTORA L T H E S I S
Luleå University of TechnologyDepartment of Applied Physics and Mechanical Engineering
Division of Polymer Engineering
2005:50|: 02-5|: - -- 05⁄50 --
2005:50
Damage mechanics analysis of inelastic behavior of fiber composites
Peter Lundmark
Damage mechanics analysis of inelastic behaviour of fiber composites
Peter Lundmark
Division of Polymer Engineering Department of Applied Physics and Mechanical Engineering
Luleå University of Technology, S-971 87 Luleå, Sweden
Luleå, November 2005

i
ABSTRACT
Composite laminates under service loading undergo complex combinations of thermal and mechanical loading, leading to microdamage accumulation in the plies. The first mode of damage is usually intralaminar cracking with the crack plane transverse to the laminate middle-plane, spanning the whole width of the laminate. The density of cracks in a ply depends on layer orientation with respect to the load direction, temperature change, number of cycles in fatigue, laminate lay-up, ply thickness and, certainly, material fracture toughness. Relative displacements of crack surfaces during loading reduce the average strain and stress in the damaged layer, thus reducing elastic properties of the laminate. In this work, a theoretical framework which allows determining the whole set of 2-D thermo-mechanical constants of a damaged laminate as a function of crack density in different layers is presented. In this approach closed form expressions, which contain thermo-elastic ply properties, laminate lay-up and crack density as the input information are obtained. The methodology is validated and the possible error introduced by the non-interactive crack assumption (between cracks in neighbouring plies) is estimated by comparing with 3-D FEM solution for a cross-ply laminate with two orthogonal systems of ply-cracks. Experimental data and comparison with other models are used for further verification. The combined effect of mechanical and thermal loading on damage development is investigated experimentally, by subjecting CF/EP [02,904]s specimens to tensile testing while being cooled down in a climate chamber. The different crack types found were categorised and FE-calculations have been performed varying the lay-ups and the material systems (GF/EP and CF/EP) in order to investigate how each crack type affects the elastic modulus of the laminate. The crack-interaction (within a ply) is investigated using FEM and an interaction function that can be used to find the COD for interacting cracks is developed. It can be used for all material and lay-ups. The model developed is also used for prediction of the reduction in stiffness of SMC containing both matrix cracks and bundle cracks.

iii
PREFACE The work of this thesis was performed at the Division of Polymer Engineering at Luleå University of Technology during the period from January 2002 to December 2005. The work has been financed by the Swedish National Graduate School in Space Technology. I wish to express my gratitude to my supervisor and boss Professor Janis Varna for his big contribution to this work. I also would like to thank my colleagues Dr. Roberts Joffe for helping me with laboratory equipment and my brother in arm David Mattsson for being such a good friend. To you and all my other colleagues: thank you for these years, it has been a pleasure to get to know you. I also would like to mention Hans Hansson and my friends at SICOMP AB in Öjebyn for letting me use one of your offices. Finally I would like to thank my family, especially my wife Amanda for standing by me and supporting me and my son Josef for being a big source of inspiration for me. Luleå, November 2005
Peter Lundmark

v
LIST OF PAPERS
I Lundmark, P. and Varna, J. Constitutive relationships for damaged laminate in in-plane loading. Int. J. Dam. Mech., 2005 14(3):235-259.
II Lundmark, P. and Varna, J. Crack face sliding effect on stiffness of
laminates with ply cracks, Accepted to Comp. Sci. Tech, in press.
III Lundmark, P. and Varna, J. Damage evolution and characterization of crack types in CF/EP laminates loaded at low temperatures, submitted to Eng. Fract. Mech.
IV Lundmark, P. and Varna, J. Stiffness reduction in laminates at high
crack density: effect of crack interaction. Submitted to Int. J. Dam. Mech.
V Lundmark, P. Katerelos, D. G. Varna, J and Galiotis C. Raman
spectroscopy assessment of matrix cracking results in GFRP laminates. To be submitted to Comp. Sci. Tech.
VI Oldenbo, M. Lundmark, P. and Varna, J. Stiffness reduction in SMC
composites with evolving damage. To be submitted to Comp. Sci. Tech.

vii
CONTENTS page
ABSTRACT i PREFACE iii LIST OF PAPERS v CONTENTS vii INTRODUCTION 1 PAPER I 25 PAPER II 55 PAPER III 83 PAPER IV 103 PAPER V 125 PAPER VI 147


Lundmark; Introduction
1
Introduction

Lundmark; Introduction
3
Introduction
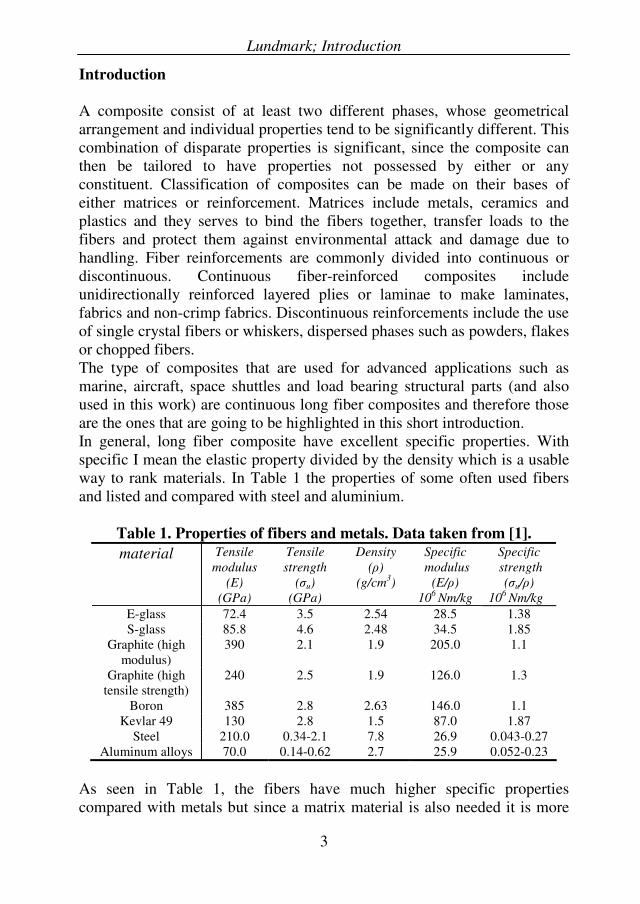
A composite consist of at least two different phases, whose geometrical arrangement and individual properties tend to be significantly different. This combination of disparate properties is significant, since the composite can then be tailored to have properties not possessed by either or any constituent. Classification of composites can be made on their bases of either matrices or reinforcement. Matrices include metals, ceramics and plastics and they serves to bind the fibers together, transfer loads to the fibers and protect them against environmental attack and damage due to handling. Fiber reinforcements are commonly divided into continuous or discontinuous. Continuous fiber-reinforced composites include unidirectionally reinforced layered plies or laminae to make laminates, fabrics and non-crimp fabrics. Discontinuous reinforcements include the use of single crystal fibers or whiskers, dispersed phases such as powders, flakes or chopped fibers. The type of composites that are used for advanced applications such as marine, aircraft, space shuttles and load bearing structural parts (and also used in this work) are continuous long fiber composites and therefore those are the ones that are going to be highlighted in this short introduction. In general, long fiber composite have excellent specific properties. With specific I mean the elastic property divided by the density which is a usable way to rank materials. In Table 1 the properties of some often used fibers and listed and compared with steel and aluminium.
Table 1. Properties of fibers and metals. Data taken from [1]. material Tensile
modulus (E)
(GPa)
Tensile strength
(σu) (GPa)
Density (ρ)
(g/cm3)
Specific modulus
(E/ρ) 106 Nm/kg
Specific strength
(σu/ρ) 106 Nm/kg
E-glass 72.4 3.5 2.54 28.5 1.38 S-glass 85.8 4.6 2.48 34.5 1.85
Graphite (high modulus)
390 2.1 1.9 205.0 1.1
Graphite (high tensile strength)
240 2.5 1.9 126.0 1.3
Boron 385 2.8 2.63 146.0 1.1 Kevlar 49 130 2.8 1.5 87.0 1.87
Steel 210.0 0.34-2.1 7.8 26.9 0.043-0.27 Aluminum alloys 70.0 0.14-0.62 2.7 25.9 0.052-0.23
As seen in Table 1, the fibers have much higher specific properties compared with metals but since a matrix material is also needed it is more
Lundmark; Introduction
4
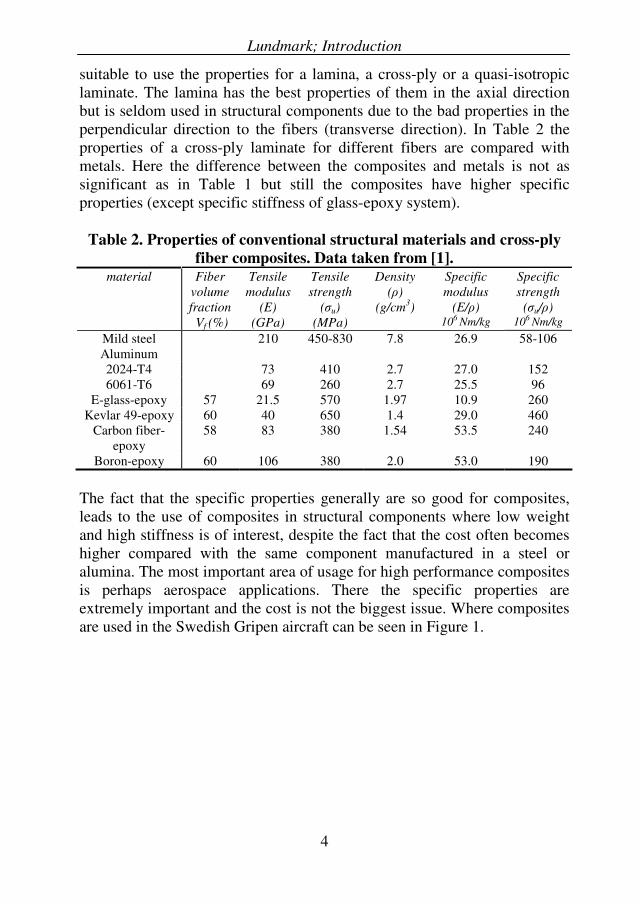
suitable to use the properties for a lamina, a cross-ply or a quasi-isotropic laminate. The lamina has the best properties of them in the axial direction but is seldom used in structural components due to the bad properties in the perpendicular direction to the fibers (transverse direction). In Table 2 the properties of a cross-ply laminate for different fibers are compared with metals. Here the difference between the composites and metals is not as significant as in Table 1 but still the composites have higher specific properties (except specific stiffness of glass-epoxy system).
Table 2. Properties of conventional structural materials and cross-ply fiber composites. Data taken from [1].
material Fiber volume fraction Vf (%)
Tensile modulus
(E) (GPa)
Tensile strength
(σu) (MPa)
Density (ρ)
(g/cm3)
Specific modulus
(E/ρ) 106 Nm/kg
Specific strength
(σu/ρ) 106 Nm/kg
Mild steel 210 450-830 7.8 26.9 58-106 Aluminum 2024-T4 73 410 2.7 27.0 152 6061-T6 69 260 2.7 25.5 96
E-glass-epoxy 57 21.5 570 1.97 10.9 260 Kevlar 49-epoxy 60 40 650 1.4 29.0 460
Carbon fiber-epoxy
58 83 380 1.54 53.5 240
Boron-epoxy 60 106 380 2.0 53.0 190
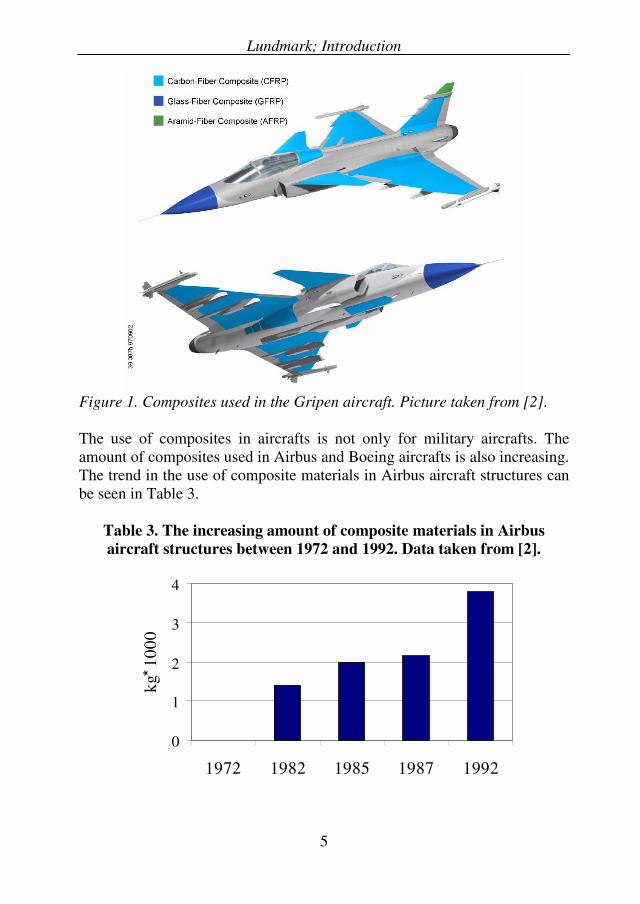
The fact that the specific properties generally are so good for composites, leads to the use of composites in structural components where low weight and high stiffness is of interest, despite the fact that the cost often becomes higher compared with the same component manufactured in a steel or alumina. The most important area of usage for high performance composites is perhaps aerospace applications. There the specific properties are extremely important and the cost is not the biggest issue. Where composites are used in the Swedish Gripen aircraft can be seen in Figure 1.
Lundmark; Introduction
5
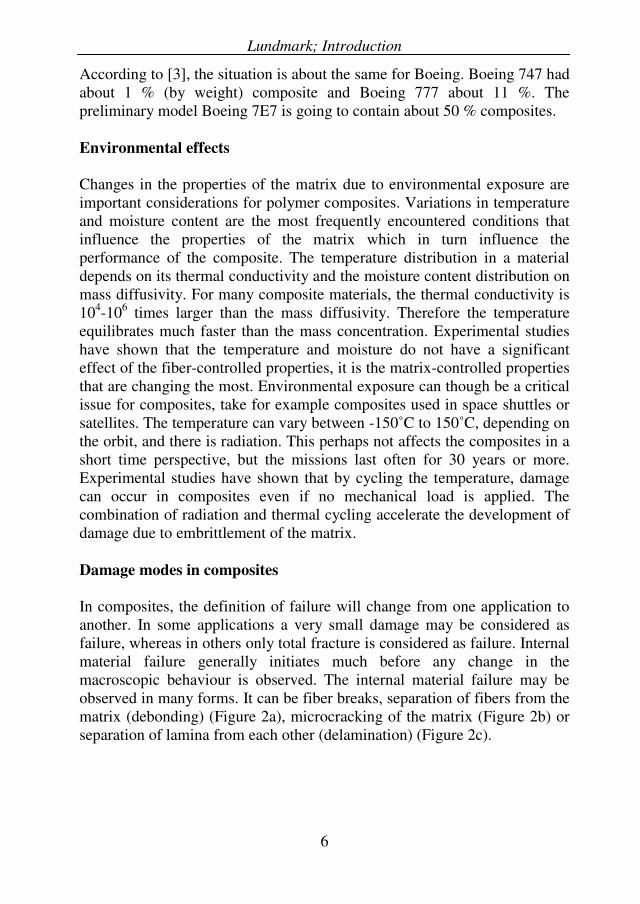
Figure 1. Composites used in the Gripen aircraft. Picture taken from [2]. The use of composites in aircrafts is not only for military aircrafts. The amount of composites used in Airbus and Boeing aircrafts is also increasing. The trend in the use of composite materials in Airbus aircraft structures can be seen in Table 3.
Table 3. The increasing amount of composite materials in Airbus aircraft structures between 1972 and 1992. Data taken from [2].
0
1
2
3
4
1972 1982 1985 1987 1992
kg* 1
000
Lundmark; Introduction
6
According to [3], the situation is about the same for Boeing. Boeing 747 had about 1 % (by weight) composite and Boeing 777 about 11 %. The preliminary model Boeing 7E7 is going to contain about 50 % composites. Environmental effects
Changes in the properties of the matrix due to environmental exposure are important considerations for polymer composites. Variations in temperature and moisture content are the most frequently encountered conditions that influence the properties of the matrix which in turn influence the performance of the composite. The temperature distribution in a material depends on its thermal conductivity and the moisture content distribution on mass diffusivity. For many composite materials, the thermal conductivity is 104-106 times larger than the mass diffusivity. Therefore the temperature equilibrates much faster than the mass concentration. Experimental studies have shown that the temperature and moisture do not have a significant effect of the fiber-controlled properties, it is the matrix-controlled properties that are changing the most. Environmental exposure can though be a critical issue for composites, take for example composites used in space shuttles or satellites. The temperature can vary between -150˚C to 150˚C, depending on the orbit, and there is radiation. This perhaps not affects the composites in a short time perspective, but the missions last often for 30 years or more. Experimental studies have shown that by cycling the temperature, damage can occur in composites even if no mechanical load is applied. The combination of radiation and thermal cycling accelerate the development of damage due to embrittlement of the matrix. Damage modes in composites
In composites, the definition of failure will change from one application to another. In some applications a very small damage may be considered as failure, whereas in others only total fracture is considered as failure. Internal material failure generally initiates much before any change in the macroscopic behaviour is observed. The internal material failure may be observed in many forms. It can be fiber breaks, separation of fibers from the matrix (debonding) (Figure 2a), microcracking of the matrix (Figure 2b) or separation of lamina from each other (delamination) (Figure 2c).

Lundmark; Introduction
7
(a) (b)
(c) Figure 2. Example of damage modes in composites. The effect of internal damage on macroscopic material response is observed only when the frequency of internal damage is sufficiently high. In many cases the macroscopic material response changes well before the macroscopic failure. Introduction to microcracking
The damage mode considered in this thesis is microcracking, also called matrix cracking, transverse cracking or intralaminar cracking. Most composites are subjected to variable mechanical and environmental conditions during fabrication, storage and service. Residual stresses are always present below the fabrication temperature. These are due to differential coefficients of thermal expansion (CTEs) between the reinforcement and the matrix. Another type of residual stresses on micro-level is related to chemical matrix shrinkage during curing. Either applied or residual stresses (or their combinations) may exceed local strength characteristics, such as matrix tensile strength or fiber/matrix interfacial strength. As a result, many composites develop internal damage which often affects the properties of the composite. The net effect of internal damage is reduction of the thermo-mechanical properties. Damage also increases
Lundmark; Introduction
8
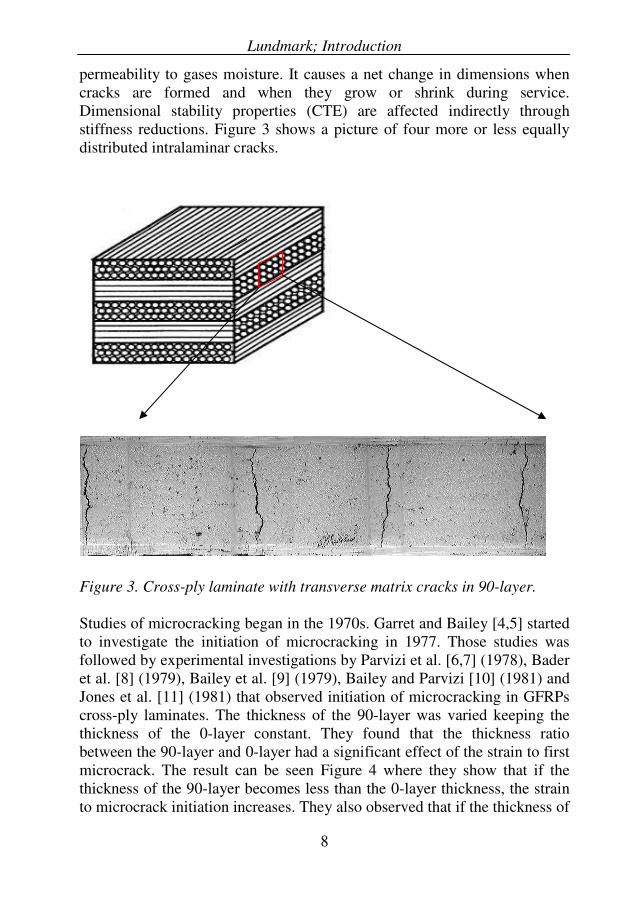
permeability to gases moisture. It causes a net change in dimensions when cracks are formed and when they grow or shrink during service. Dimensional stability properties (CTE) are affected indirectly through stiffness reductions. Figure 3 shows a picture of four more or less equally distributed intralaminar cracks.
Figure 3. Cross-ply laminate with transverse matrix cracks in 90-layer.
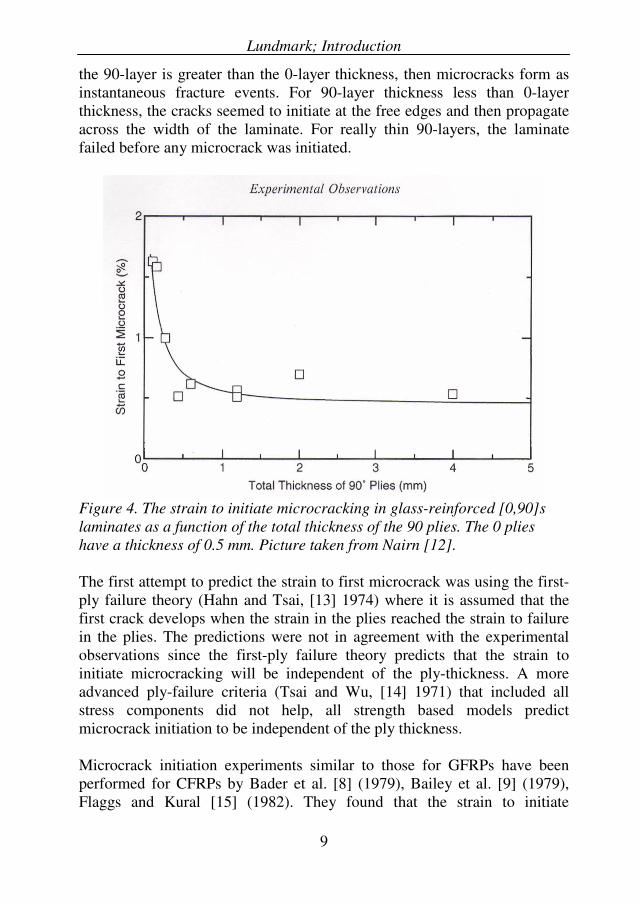
Studies of microcracking began in the 1970s. Garret and Bailey [4,5] started to investigate the initiation of microcracking in 1977. Those studies was followed by experimental investigations by Parvizi et al. [6,7] (1978), Bader et al. [8] (1979), Bailey et al. [9] (1979), Bailey and Parvizi [10] (1981) and Jones et al. [11] (1981) that observed initiation of microcracking in GFRPs cross-ply laminates. The thickness of the 90-layer was varied keeping the thickness of the 0-layer constant. They found that the thickness ratio between the 90-layer and 0-layer had a significant effect of the strain to first microcrack. The result can be seen Figure 4 where they show that if the thickness of the 90-layer becomes less than the 0-layer thickness, the strain to microcrack initiation increases. They also observed that if the thickness of
Lundmark; Introduction
9
the 90-layer is greater than the 0-layer thickness, then microcracks form as instantaneous fracture events. For 90-layer thickness less than 0-layer thickness, the cracks seemed to initiate at the free edges and then propagate across the width of the laminate. For really thin 90-layers, the laminate failed before any microcrack was initiated.
Figure 4. The strain to initiate microcracking in glass-reinforced [0,90]s laminates as a function of the total thickness of the 90 plies. The 0 plies have a thickness of 0.5 mm. Picture taken from Nairn [12]. The first attempt to predict the strain to first microcrack was using the first-ply failure theory (Hahn and Tsai, [13] 1974) where it is assumed that the first crack develops when the strain in the plies reached the strain to failure in the plies. The predictions were not in agreement with the experimental observations since the first-ply failure theory predicts that the strain to initiate microcracking will be independent of the ply-thickness. A more advanced ply-failure criteria (Tsai and Wu, [14] 1971) that included all stress components did not help, all strength based models predict microcrack initiation to be independent of the ply thickness. Microcrack initiation experiments similar to those for GFRPs have been performed for CFRPs by Bader et al. [8] (1979), Bailey et al. [9] (1979), Flaggs and Kural [15] (1982). They found that the strain to initiate
Lundmark; Introduction
10
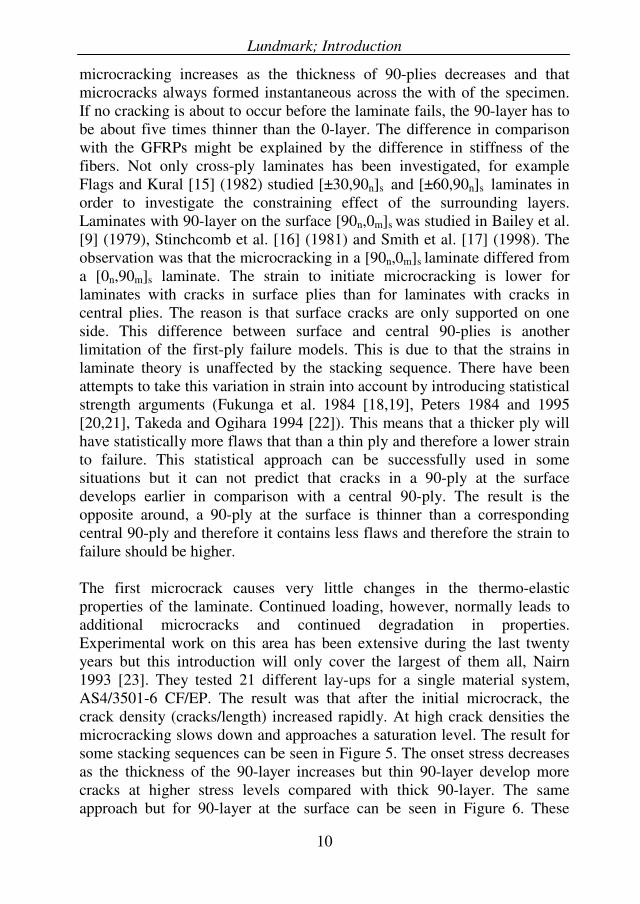
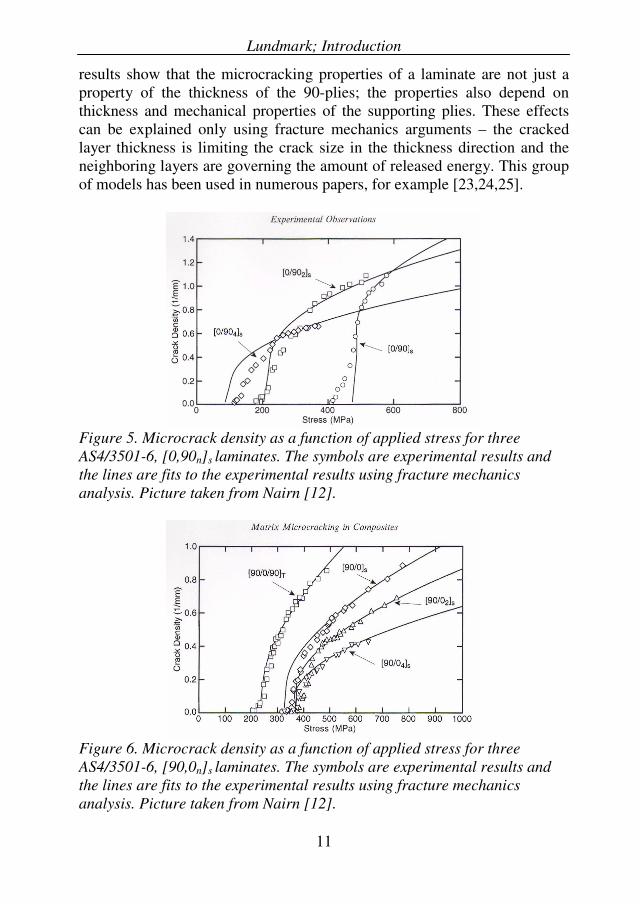
microcracking increases as the thickness of 90-plies decreases and that microcracks always formed instantaneous across the with of the specimen. If no cracking is about to occur before the laminate fails, the 90-layer has to be about five times thinner than the 0-layer. The difference in comparison with the GFRPs might be explained by the difference in stiffness of the fibers. Not only cross-ply laminates has been investigated, for example Flags and Kural [15] (1982) studied [±30,90n]s and [±60,90n]s laminates in order to investigate the constraining effect of the surrounding layers. Laminates with 90-layer on the surface [90n,0m]s was studied in Bailey et al. [9] (1979), Stinchcomb et al. [16] (1981) and Smith et al. [17] (1998). The observation was that the microcracking in a [90n,0m]s laminate differed from a [0n,90m]s laminate. The strain to initiate microcracking is lower for laminates with cracks in surface plies than for laminates with cracks in central plies. The reason is that surface cracks are only supported on one side. This difference between surface and central 90-plies is another limitation of the first-ply failure models. This is due to that the strains in laminate theory is unaffected by the stacking sequence. There have been attempts to take this variation in strain into account by introducing statistical strength arguments (Fukunga et al. 1984 [18,19], Peters 1984 and 1995 [20,21], Takeda and Ogihara 1994 [22]). This means that a thicker ply will have statistically more flaws that than a thin ply and therefore a lower strain to failure. This statistical approach can be successfully used in some situations but it can not predict that cracks in a 90-ply at the surface develops earlier in comparison with a central 90-ply. The result is the opposite around, a 90-ply at the surface is thinner than a corresponding central 90-ply and therefore it contains less flaws and therefore the strain to failure should be higher. The first microcrack causes very little changes in the thermo-elastic properties of the laminate. Continued loading, however, normally leads to additional microcracks and continued degradation in properties. Experimental work on this area has been extensive during the last twenty years but this introduction will only cover the largest of them all, Nairn 1993 [23]. They tested 21 different lay-ups for a single material system, AS4/3501-6 CF/EP. The result was that after the initial microcrack, the crack density (cracks/length) increased rapidly. At high crack densities the microcracking slows down and approaches a saturation level. The result for some stacking sequences can be seen in Figure 5. The onset stress decreases as the thickness of the 90-layer increases but thin 90-layer develop more cracks at higher stress levels compared with thick 90-layer. The same approach but for 90-layer at the surface can be seen in Figure 6. These
Lundmark; Introduction
11
results show that the microcracking properties of a laminate are not just a property of the thickness of the 90-plies; the properties also depend on thickness and mechanical properties of the supporting plies. These effects can be explained only using fracture mechanics arguments – the cracked layer thickness is limiting the crack size in the thickness direction and the neighboring layers are governing the amount of released energy. This group of models has been used in numerous papers, for example [23,24,25].
Figure 5. Microcrack density as a function of applied stress for three AS4/3501-6, [0,90n]s laminates. The symbols are experimental results and the lines are fits to the experimental results using fracture mechanics analysis. Picture taken from Nairn [12].
Figure 6. Microcrack density as a function of applied stress for three AS4/3501-6, [90,0n]s laminates. The symbols are experimental results and the lines are fits to the experimental results using fracture mechanics analysis. Picture taken from Nairn [12].
Lundmark; Introduction
12
At high stress levels, other damage modes start to occur. For example, the tip of a microcrack at the interface might provide a site for initiation of delamination between the plies. Delamination from the tips can occur in almost any laminate but its likelihood increases as the thickness of the 90-layer increases. If the 90-layer is thick enough, delamination can initiate at the first crack. Once delaminations begin to form, they propagate on continued loading while additional microcracking slows down or stops. If the applied strain is high enough, the Poisson effect can lead to microcracking (splits) in the 0-ply. Such splits are more common for GFRPs compared with CFRPs because GFRPs can be loaded to higher strains before final failure. Modeling the change in thermo-elastic properties due to microcracking
Several attempts to predict the thermo-elastic properties of damaged laminates have been performed during the last twenty years. The simplest way to do it is assuming that a cracked layer is unable to carry any load, called ply-discount model. This is done by changing the stiffness matrix of the damaged layer to zero. There is a further development of the model, called modified ply-discount model where only the transverse stiffness of a cracked layer is put to zero. Theses models do not depend on the crack density and therefore they are more suitable at high crack densities. The modified ply-discount model is more accurate than the original ply-discount model but both of them overestimate the reduction in properties compared with experimental data even at high crack densities. More complex models have been developed for over 20 years. In the beginning it was cross-ply laminates with cracks in 90-layer that were studied. Reifsnider and coauthors [26] developed in early 1980s a simple shear lag model to evaluate the stiffness reduction due to microcracks. The analysis is based on the following assumptions:
a) The normal stress in external load direction is constant over ply thickness
b) Shear stresses develop only within a boundary layer of unknown thickness in between plies.
c) Cracks remain sufficiently far apart so that their mutual interaction can be neglected.
Crack interaction was included in shear lag models in [17,18]. This simple analysis has yielded reasonable good predictions of stiffness reduction but it
Lundmark; Introduction
13
is not sufficiently accurate. In particular, the thickness of the boundary layer has to be assumed (fitting parameter) and the transverse normal stresses can not be estimated. Talreja developed in 1985 a continuum damage mechanics approach to predict the properties of damage laminates [27]. The disadvantage was that it involved parameters that had to be experimentally determined for each material and lay-up. Hashin developed in 1985 a variational approach to the problem with stiffness reduction [28]. It involved only one assumption: normal ply stresses in load direction are constant over ply thickness. The model is more complex than the shear lag but the resulting expressions are easy to use. It can be used to predict the axial modulus, Poisson’s ratio and shear modulus. Hashin developed in 1988 [29] the first analytical model that could predict the reduction in thermal expansion coefficient due to microcracks. More sophisticated variational models were developed in [30,31]. In practical applications, cross-plies are seldom used, laminates with several orientations angles are used and therefore constitutive models have to be able to predict the elastic properties due to cracks in different layers. A two-dimensional shear-lag analysis is a simplest way to describe a doubly periodic matrix cracking in cross-ply laminates. It is used in [32], where parabolic shape of the crack face is assumed to model the crack profile. It means that no distinction has been made between crack shape in the internal and the external layers. Model for general in-plane loading is derived for [0m,90n]s laminates averaging the equilibrium equations and obtaining second order differential equations in a usual way. Hashin [33] generalized his model [26] to the case when cracks are in both 0- and 90-layers of a cross-ply laminate. Solution for an orthogonally cracked cross-ply laminate under tension was found constructing a simple admissible stress field in the context of the principle of minimum complementary energy. The chosen stress field satisfies equilibrium equations and all boundary and interface conditions in tractions. The assumed constant in-plane normal stress distribution over each layer thickness leads to linear and parabolic through-the-thickness distributions of out-of-plane shear and normal stresses, respectively. Expressions for damaged laminate E-modulus and Poisson’s ratio were derived. This model does not involve any fitting parameters and is simple to use. Since Hashin’s model renders a lower bound of the stiffness, its accuracy could be improved by more refined assumptions regarding the thickness coordinate dependence of stresses. The assumptions
Lundmark; Introduction
14
used are oversimplified and give too low stiffness of the damaged laminate. McCartney [34] applied his model, which is based on the same stress distribution assumptions as Hashin’s model [28] but the governing equations are obtained from Reissner’s principle, to doubly-cracked cross-ply laminates assuming that the in-plane normal stress dependence on the two in-plane coordinates is given by two independent functions. Model of similar accuracy as Hashin’s and McCartney’s models was developed in [35] to analyze stiffness of doubly-cracked cross-ply laminates. In addition to the assumptions of a linear shear stress distribution across of each layer, which is the same as in Hashin’s model, authors assume linear distribution of out-of-plane displacements. The most accurate local stress state comparable with a very fine FE solution and, therefore, also accurate stiffness prediction can be obtained using semi-analytical McCartney [36] and Schoeppner and Pagano [24] model. In the McCartney model each layer in the laminate is divided in a certain number of thin sub-layers and in each sub-layer the stress assumptions are as in Hashin’s variational model [28]. All displacement and stress continuity conditions at sub-layer interfaces are satisfied as are the stress-strain relationships, except one, which is satisfied in an average sense. It has been shown that this “satisfying in average” is identical to minimization of the Reissner energy functional in the used approximation of the stress-strain state. The Schoeppner-Pagano model [24], which is also based on Reissner’s principle, considers a system of hollow concentric sub-cylinders with a large radius instead of laminate divided in sub-layers. Each layer is divided in a number of cylinders. In order to simulate interface cracks these cylinders may also be connected in parallel. Shape functions for each sub-cylinder in this model are different than in McCartney’s model but the results converge with increasing number of sub-layers (sub-cylinders) [37]. However, the calculation routines in these models are extremely complex which limits the application. Neither of these models can be directly used for laminates containing several systems of cracks. However, considering these crack systems as non-interacting one can first introduce crack system in 90-layer only and back-calculate the effective stiffness of the damaged layer from the damaged laminate stiffness. Then the intralaminar cracks are introduced in the 0-layer only and similar problem as described above is solved in a system of coordinates rotated by 90°. Finally the effective properties of all damaged layers may be used in laminate theory to calculate the stiffness of laminate with cracks in both layers. The Schoeppner and Pagano model has been used in this way to predict the reduction of thermal expansion
Lundmark; Introduction
15
coefficients of cross-ply laminates with cracks in both 0- and 90-layers in [38]. Generally speaking, the continuum damage mechanics (CDM) approaches ([27], [39], [40],) may be used to describe the stiffness of laminates with intralaminar cracks in off-axis plies of any orientation. The damage is represented by internal state variables (ISV) and the laminate constitutive equations are expressed in general forms containing ISV and a certain number of material constants. These constants must be determined for each considered laminate configuration either experimentally measuring stiffness for a laminate with a certain crack density or using FE analysis for the same reason. This limitation is partially removed in synergistic damage mechanics suggested by Talreja [41] which incorporates micromechanics information to determine the material constants. For the same [± , 902]s class of laminates as in theoretical assessment [41], Varna et al. [42] used experimentally measured crack opening displacement (COD) to identify the constraint parameter in CDM and to make stiffness predictions. For these measurements a special device was designed and measurements were performed using optical microscopy on loaded specimens [43]. The same technique was later applied to measure COD for cracks in off- axis plies of [0/± 4/01/2]s laminates and to perform CDM predictions [44]. An extensive FE parametric analysis in plane stress formulation was performed by Joffe et al. [25] to identify the main geometrical and stiffness parameters affecting the COD. It was found that average COD normalized with respect to the far field stress in the layer and the layer thickness is a very robust parameter: variation of shear moduli and Poisson’s ratios has a negligible effect on the normalized COD. Only the stiffness and thickness ratios of the cracked to uncracked neighboring layers have a significant effect. Based on numerical results the numerical COD values were fitted by power law. The main conclusion was that increasing stiffness and thickness of the constraint layer leads to significant reduction of the average normalized COD. This power law for COD was used in the synergistic CDM predictions of stiffness reduction in [± ,904]s laminates [45] with cracks in 90-layers only. Recently it was demonstrated using micromechanics that all material parameters in CDM for this lay-up depend only on the material properties of the layer, not on the laminate lay-up [46]. This finding was not proven for laminates with cracked layers other than 90° because analytical micromechanics solution for a general case does not exist. Gudmundson and co-workers [47,48] considered laminates with general lay-up and used homogenization technique to derive expressions for stiffness and thermal expansion coefficient of laminates with cracks in layers of 3-D
Lundmark; Introduction
16
laminates. These expressions in an exact form correlate damaged laminate thermo-elastic properties with parameters characterizing crack behavior: the average COD and average crack face sliding. These parameters follow from the solution of the local boundary value problem and their determination is a very complex task. Gudmundson and co-workers suggested to neglect the effect of neighboring layers on crack face displacements and to determine them using the known solution for a periodic system of cracks in an infinite homogeneous transversely isotropic medium (90-layer). The application of their methodology by other researchers has been rather limited due to the fairly complex form of the presented solutions. Objective Today the composite structures are designed in that way that cracks never will develop. In many applications this is a conservative criterion. For example, if CFRPs is considered, the reduction in stiffness is not that severe due to transverse cracking. If some extent of transverse cracking would be allowed (i.e. allowing higher strains) the dimensions could be decreased and thereby also the weight. If the cracks are going to be considered in the design, the knowledge of how they affect the properties of the composite is extremely important. Several such models exist (see introduction) but they all have their disadvantages. If they are simple to use they only can deal with cross-ply laminates. Those are excellent for academic studies but seldom used in real applications. Models that are more general are often very complicated to use or need experimental data as input parameters. Therefore the objective of this thesis was to develop a model that is easy to use and that can predict the degradation of all in-plane thermo-elastic properties of a general laminate. Short summary of papers
Paper I In Paper I an approach, similar to that performed by Gudmundson [47], is presented in the framework of the laminate theory. The largest advantage is the transparency of derivations and the simplicity of application. Stiffness or compliance matrices and thermal expansion coefficients of an arbitrary symmetric laminate with damage in certain layers are presented in an explicit form. Derivation of constitutive relationships follows the same route as in classical laminate theory. As an input from homogenization theory the relationships between volume averaged and boundary surface
Lundmark; Introduction
17
averaged quantities are used. The differences between undamaged and damaged laminate cases are indicated in each step of derivation. The damaged laminate stiffness and thermal expansion coefficients are calculated from the undamaged laminate stiffness and the crack face displacements normalized with respect to the far field stress in the layer. In contrast to Gudmundson’s approach [47,48], the normalized COD and crack face sliding are considered as dependent on the position of the cracked layer (outside or inside cracks) and on the constraint of the surrounding layers in terms of their stiffness and thickness. These dependences are analyzed using FEM calculated crack opening displacement profiles in generalized plane strain formulation and presenting the results in the form of power laws. The result are rather different than in [47,48]. In a special case of balanced laminates with cracks in 90-layer only, expressions for thermo-elastic properties are presented in an explicit and compact form.
Paper II
In Paper II we analyze the second parameter in the constitutive law, the normalized average crack face sliding displacement (CSD). The constraint effects on CSD are analyzed using [S,90n]s and [90n,S]s laminates with transverse cracks in 90-layer. S denotes an orthotropic sublaminate. Analysis is performed using FEM and the dependence of CSD on governing parameters is approximated by a simple power law. It is assumed that the obtained expressions for COD and CSD have sufficient accuracy and are sufficiently robust to be used in the developed constitutive relationships for general laminates with damage. Simulations are performed for cross-ply laminates with cracks in 90-layer or in both layers of a cross-ply laminate and the results are compared with other models, the available experimental data and FEM results.
Paper III
In Paper III the combined effect of mechanical and thermal loading on damage development was investigated experimentally, by subjecting AS4/8552 [02,904]s specimens to tensile testing while being cooled down in a climate chamber. The specimen edges and surfaces of cuts parallel to the loading direction were examined in a microscope in order to determine the crack density in the 90-layer corresponding to different applied mechanical stress levels. Comparison has been made to tensile tests at room temperature
Lundmark; Introduction
18
to see if the damage pattern and the crack density are affected by the testing temperature. The different crack types found were categorised and FE-calculations were performed varying the lay-ups and the material system (GF/EP and CF/EP) in order to investigate how each crack type affects the elastic modulus of the laminate. The idea is to replace the complex crack shapes observed at low temperatures by effective “normal” cracks with an “effective” COD for each crack type. The model developed in Paper I was used to back calculate the “effective” crack opening displacement (COD) of an effective “normal” crack for each given damage pattern and laminate configuration. The stiffness reduction due to mechanical and thermal loading was experimentally investigated and compared with model prediction using the introduced crack efficiency factor.
Paper IV
The objective of Paper IV was to investigate the effect of crack interaction on COD using FEM and to describe the identified dependence on crack density in a simple and accurate form by crack density dependent “interaction function”. It is used to correct the COD values for crack interaction. Predictions are compared with direct FEM calculations and with experimental results. The analysis is limited by COD only, because a) the largest crack density leading to interaction is usually observed in layers transverse to the uniaxial load where sliding has small influence; b) the experimental data are very limited for cases where sliding is of importance; c) certain features related to the sliding are still unclear (friction, asperities, nonlinear material response to shear etc).
Paper V
In Paper V the crack development in off-axis layers of a model GF/EP composite and its effect on the elastic modulus of a GF/EP cross-ply [0/90/0]T laminate and a [0/45/0]T laminate is examined. Additionally, macroscopic residual thermal strains appearing as the result of the thermal tensile stress relaxation in cracked of-axis layer have been analyzed. The experimental data are provided using laser Raman spectroscopy. The experimental technique involves Raman spectroscopy for the recording of strain redistribution within the plies as a result of the crack onset and growth in the off-axis plies. Raman spectroscopy, due to the provided high spatial resolution, has been proved a powerful tool in experimental stress and strain
Lundmark; Introduction
19
measurements. Due to the glass fibers poor Raman signal, Aramid fibers were embedded within the 0° plies and near the 0/ interface and used as Raman-sensors as described in details in previous work. Finally, the micromechanical strain mapping results are used to derive the macromechanical properties: the longitudinal modulus of elasticity and the magnitude and the form of the residual strains caused by cracking.
Paper VI In Paper VI the damage evolution description in the SMC composite is based on observations and data obtained using model composites with prescribed orientation of bundles. [0,90,0], [0,±45,0, ±45,0] [0,±60,0, ±60,0] and a [0,±75,0, ±75,0] bundle structure laminates were used to determine the damage evolution law in terms of crack density as a function of maximum strain history and bundle orientation angle. An attempt was made to include the angle dependence in a quadratic failure criterion which accounts for interaction between transverse and shear stresses in the bundle. It was shown that the intrabundle crack formation in bundles with an arbitrary orientation can not be described by this type of criterion. The stiffness degradation modeling was based on laminate analogy, replacing the bundle structure of the SMC composite by quasi-isotropic layered composite were all bundle orientations are represented equally. Analyzing undamaged layers and layers with matrix cracks the bundle structure is smeared out and the layer properties are calculated using the average fibre content in Hashin’s concentric cylinder assembly model [49,50]. Considering intrabundle cracks a layer with certain bundle orientation is replaced by a three sub-layer structure where the bundle material sub-layer in the middle is surrounded by matrix material. Then, the model developed in for stiffness determination of general damaged laminates with intralaminar cracks in layers is used. The simulated elastic modulus reduction as a function of strain is compared with test data and predictions based on several modifications of the ply-discount model. The adequacy of the model and differences between results are discussed.

Lundmark; Introduction
20
References
1. Agarwal, B.D. and Broutman, L.J. “Analysis and performance of fiber composites”, New York: John Wiley & Sons inc., 1990.
2. Nyman, T. ”Dimensionering av kompositstrukturer inom flyg”. Oral presentation at Sicomp, Göteborg 5 feb. 2004.
3. Soleiman, M. “Carbon Fibers Needs and Technical Requirements”.Carbon Fiber 2004 Conference Hamburg, Germany October 19, 2004.
4. Garrett, K.W. and Bailey, J.E. 1977. “Multiple tranverse fracture in 90 degree cross-ply laminate of a glass-reinforced polyester”, J. Matert. Sci., 12(1):157-168.
5. Garrett, K.W. and Bailey, J.E. 1977. “Effect of resin failure strain on the tensile properties of glass fibre-reinforced polyester cross-ply laminates”, J. Mater. Sci., 12(11):2189:2194.
6. Parvizi, A. and Bailey, J.E. 1978. “On multiple transverse cracking in glass fibre epoxy cross-ply laminates”, J. Mat. Sci., 13(10):2131-2136.
7. Parvizi, A., Garrett, K.W. and Bailey, J.E. 1978. J. Mater. Sci., 12:195-201.
8. Bader, M.G., Bailey, J.E., Curtis, P.T. and Parvizi, A. 1979. In “Procedings of International Conference on Mechanical Behaviour of Materials”, Cambridge, UK, pp.227-239
9. Bailey, J.E., Curtis, P.T. and Parvizi, A. 1979. “On the transverse cracking and longitudinal splitting behaviour of glass and carbon fibre reinforced epoxy cross ply laminates and the effect of poisson and thermally generated strain”, Proceedings of The Royal Society of London, Series A: Mathematical and Physical Sciences, 366(1727):599-623.
10. Bailey, J.E. and Parvizi, A. 1981. “On the fiber debonding effects and the mechanism of transverse-ply failure in cross-ply laminates of glass fiber/thermoset composites”. J. Mater. Sci., 16(3):649-659.
11. F.R Jones, A.R. Wheatley and J.E. Bailey., in “Composite structures”, ed. I.H. Marshall, Applied Science Publishers, Barking, UK, 1981, pp.415-429.
12. Nairn, J. 2000. “Matrix microcracking in composites”. In: Kelly A, Zweben C, Talreja R, Manson J-A, editors. Compr.Comp.Mater., Poly.Matrix Comp., Amsterdam: Elsevier, 2:403-432.
13. Hahn, H.T and Tsai, S.W. 1974. “On the behaviour of composite laminates after initial failures”, J. Comp. Mater., 8:288-305.
14. Tsai, S.W and Wu, E.M. 1971. “General theory of strength for anisotropic materials”, J Comp. Mater, 5:58-80.
Lundmark; Introduction
21
15. Flaggs, D.L. and Kural, M.H. 1982. ”Experimental determination of the in situ transverse lamina strengh in graphite/epoxy laminates”, J. Comp. Mater., 16:103-116.
16. Stinchcomb, W.W., Reifsnider, K.L., Yeung, P. and Masters, J. 1981. ASTM STP, 723:64-84.
17. Smith, P.A. Boniface, L. and Glass, N.F.C. 1998. “Comparison of transverse cracking phenomena in (0/90)s and (90/0)s CFRP laminates” , Appl. Comp. Mater., 5:11-23.
18. Fukunga, H. Chou, T.W., Peters, P.W.M. and Schulte, K. 1984. “Probalistic failure strength analyses of graphite/epoxy cross-ply laminates”, J. Comp. Mater., 18(4):339-356.
19. Fukunga, H. Chou, T.W., Peters, P.W.M. and Schulte, K. 1984. “Probalitic initial failure strength of hybrid and non-hybrid laminates”, J. Mater. Sci., 19(11):3546-3553.
20. Peters, P.W.M. 1984. “Strength distribution of 90 degree plies in 0/90/0 graphite-epoxy laminates”, J. Comp. Mater., 18(6):545-556.
21. Peters, P.W.M. 1995. “Fiber/matrix bond strength of CFRP deduced from the strength transverse to the fibers”, J. Adhesion, 53(1-2):79-101.
22. Takeda, N. and Ogihara, S. 1994. “In situ observation and probabilistic prediction of microscopic failure processes in CFRP cross-ply laminates”, Comp. Sci. Tech., 52(2):183-195.
23. Nairn, J.A., Hu, S. and Bark, J.S. 1993. “Critical evaluation of theories for predicating microcracking in composite laminates”, J. Mater. Sci., 28(18):5099-5111.
24. McCartney, L.N. 1995. “A recursive method of calculating stress transfer in multiple- ply cross-ply laminates subject to biaxial loading”, NPL report DMMA(A)150.
25. Joffe, R., Krasnikovs, A. and Varna, J. 2001. “COD-based simulation of transverse cracking and stiffness reduction in [S/90n]s laminates”, Comp. Sci. Tech., 61:637-656.
26. Highsmith, A.L. and Rei0fsnider K.L. 1982. Stiffness-reduction mechanisms in composite laminates, Damage in Composite Materials, ASTM STP 115:103-117.
27. Talreja, R. 1985. Transverse cracking and stiffness reduction in composite laminates, J. Comp. Mater, 19:355-375.
28. Hashin, Z. 1985. “Analysis of cracked laminates: a variational approach”, Mech. Mater., North-Holland, 4:121-136.
29. Hashin, Z. 1988. “Thermal Expansion Coefficients of Cracked Laminates”, Comp. Sci. Tech., 31:247-260.
Lundmark; Introduction
22
30. Varna, J. and Berglund, L.A. 1991. ”Multiple transverse cracking and stiffness reduction in cross-ply laminates”. J. Comp. Tech., 13:97-106.
31. Varna, J. and Berglund L.A. 1994. “Thermo-elastic properties of composite laminates with transverse cracks”. J. Comp. Tech., 16:77-87.
32. Henaff-Gardin, C., Lafarie-Frenot, M.C. and Gamby, D. 1996. “Doubly periodic matrix cracking in composite laminates Part 1: General in-plane loading”. Comp. Struct., 36:113-130.
33. Hashin, Z. 1987. “Analysis of Orthogonally Cracked Laminates Under Tension”, J. Appl. Mech., 54:872-879.
34. McCartney, L.N. 1992. “Theory of stress transfer in 0-90-0 crossply laminate containing a parallel array of transverse cracks”, J. Mech. Phys. Solids, 40:27-68.
35. Abdelrahman, W.G. and Nayfeh, A.H. 1999. “Stress transfer and stiffness reduction in orthogonally cracked laminates”, Mech. Mater., 31:303-316.
36. McCartney, L.N. 1995. “A recursive method of calculating stress transfer in multiple- ply cross-ply laminates subject to biaxial loading”, NPL report DMMA(A)150.
37. McCartney, L.N. and Schoeppner, G.A. and Becker, W. 2000. “Comparison of models for transverse ply cracks in composite laminates”, Comp. Sci. Tech., 60:2347-2359.
38. Kim, R.Y., Crasto, A.S. and Schoeppner, G.A. 2000. “Dimensional stability of composite in space thermal environment”, Comp. Sci. Tech., 60:2601-2608.
39. Allen, D.H., Harris, C.E. and Groves, S.E. 1987. “A thermomechanical constitutive theory for elastic composites with distributed damage. Part II: application to matrix cracking in laminated composites”, Int. J. Solids Struct., 23:1319-1338.
40. Ladeveze, P.1990. “A damage mechanics for composite materials”, In: Integration of theory and application in applied mechanics. Dordrecht: Kluver, 13-24.
41. Talreja, R. 1996. “A synergistic damage mechanics approach to durability of composite material systems”, In: Cardon A, Fukuda H, Reifsnider K, editors. Progress in durability analysis of composite systems. Rotterdam: A.A. Balkema, 117- 129.
42. Varna, J., Akshantala, N.V. and Talreja, R. 1999. “Crack opening displacement and the associated response of laminates with varying constraints”, Int. J. Dam. Mech., 8:174-193.
Lundmark; Introduction
23
43. Varna, J., Berglund, L.A., Talreja, R. and Jakovics, A. 1993. “A study of the crack opening displacement of transverse cracks in cross-ply laminates”, Int. J. Dam. Mech., 2:272-289.
44. Varna, J., Joffe, R., Akshantala, N.V. and Talreja, R. 1999. “Damage in composite laminates with off-axis plies”, Comp. Sci. Tech., 59:2139-2147.
45. Varna, J., Joffe, R. and Talreja, R. 2001. “A synergistic damage mechanics analysis of transverse cracking in [± ,904]s laminates”, Comp. Sci. Tech., 61:657-665.
46. Varna, J., Krasnikovs, A., Kumar, R. and Talreja R. 2004. “A Synergistic damage mechanics approach to viscoelastic response of cracked cross-ply laminates”, Int. J. Dam. Mech.,13(4):301-334..
47. Gudmundson, P. and Östlund, S. 1992. “First order analysis of stiffness reduction due to matrix cracking”, J. Comp. Mater., 26:1009-1030.
48. Gudmundson, P. and Zang, W. 1993. “A universal model for thermoelastic properties of macro cracked composite laminates”, Int. J. Solids Struct., 30:3211-3231.
49. Hashin, Z. and Rosen, B.W. 1964. “The elastic moduli of fiber-reinforced materials”. J. Appl. Mech., 31(2):223-232.
50. Hashin, Z. 1983. “Analysis of Composite Materials – a survey”. J. Appl. Mech., 50:481-505.


Lundmark; PAPER I
25
PAPER I

Lundmark, PAPER I
27
Constitutive Relationships for Laminates with Ply Cracks in In-plane Loading
P. LUNDMARK AND J. VARNA*Luleå University of Technology
SE-97187 Luleå, Sweden
* Corresponding author
Published in International Journal of damage Mechanics, 2005,14(3):235-259.
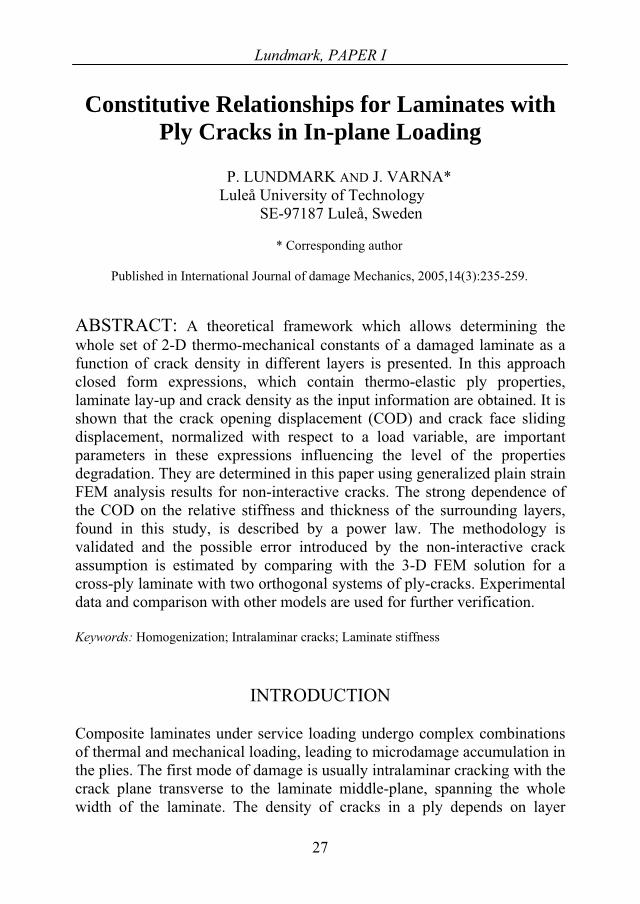
ABSTRACT: A theoretical framework which allows determining the whole set of 2-D thermo-mechanical constants of a damaged laminate as a function of crack density in different layers is presented. In this approach closed form expressions, which contain thermo-elastic ply properties, laminate lay-up and crack density as the input information are obtained. It is shown that the crack opening displacement (COD) and crack face sliding displacement, normalized with respect to a load variable, are important parameters in these expressions influencing the level of the properties degradation. They are determined in this paper using generalized plain strain FEM analysis results for non-interactive cracks. The strong dependence of the COD on the relative stiffness and thickness of the surrounding layers, found in this study, is described by a power law. The methodology is validated and the possible error introduced by the non-interactive crack assumption is estimated by comparing with the 3-D FEM solution for a cross-ply laminate with two orthogonal systems of ply-cracks. Experimental data and comparison with other models are used for further verification.
Keywords: Homogenization; Intralaminar cracks; Laminate stiffness
INTRODUCTION
Composite laminates under service loading undergo complex combinations of thermal and mechanical loading, leading to microdamage accumulation in the plies. The first mode of damage is usually intralaminar cracking with the crack plane transverse to the laminate middle-plane, spanning the whole width of the laminate. The density of cracks in a ply depends on layer
Lundmark, PAPER I
28
orientation with respect to the load direction, temperature change, number of cycles in fatigue, laminate lay-up, ply thickness and, certainly, material fracture toughness. Relative displacements of crack surfaces during loading reduce the average strain and stress in the damaged layer, thus reducing the laminate stiffness. Many papers have been written on this subject, covering a broad range from micromechanics based to continuum damage mechanics based models (see review for example in Nairn and Hu [1], Nairn [2] and Talreja [3]). Most of the research has, however, been focused on cross-ply laminates which are excellent for academic studies of phenomena but are seldom used in practical applications. Laminates with a general lay-up containing cracks in several layers of different orientation are, therefore, a challenge for any constitutive model. A two-dimensional shear-lag analysis is a simplest way to describe a doubly periodic matrix cracking in cross-ply laminates. It is used in [4], where parabolic shape of the crack face is assumed to model the crack profile. It means that no distinction has been made between crack shape in the internal and the external layers. Model for general in-plane loading is derived for [0m,90n]s laminates averaging the equilibrium equations and obtaining second order differential equations in a usual way. Unfortunately, there is no comparison with experimental data or with other models in this paper.Hashin [5] generalized his model [6] to the case when cracks are in both 0- and 90-layers of a cross-ply laminate. Solution for an orthogonally cracked cross-ply laminate under tension was found constructing a simple admissible stress field in the context of the principle of minimum complementary energy. The chosen stress field satisfies equilibrium equations and all boundary and interface conditions in tractions. The assumed constant in-plane normal stress distribution over each layer thickness leads to linear and parabolic through-the-thickness distributions of out-of-plane shear and normal stresses, respectively. The principle of minimum complementary energy (which for approximate stress distributions is equivalent satisfying the displacement continuity equations in average) is used to calculate the stress distributions. Expressions for damaged laminate E-modulus and Poisson’s ratio were derived. This model does not involve any fitting parameters and is simple to use. Since Hashin’s model renders a lower bound of the stiffness, its accuracy could be improved by more refined assumptions regarding the thickness coordinate dependence of stresses. The assumptions used are oversimplified and give too low stiffness of the damaged laminate. McCartney [7] applied his model, which is based on the same stress distribution assumptions as Hashin’s model [5] but the governing equations
Lundmark, PAPER I
29
are obtained from Reissner’s principle, to doubly-cracked cross-ply laminates assuming that the in-plane normal stress dependence on the two in-plane coordinates is given by two independent functions.Model of similar accuracy as Hashin’s and McCartney’s models was developed in [8] to analyze stiffness of doubly-cracked cross-ply laminates. In addition to the assumptions of a linear shear stress distribution across of each layer, which is the same as in Hashin’s model, authors assume linear distribution of out-of-plane displacements. These assumptions allow for exact satisfaction of all displacement and traction interface and boundary conditions. Since in derivations only the stress-strain relationships averaged over the layer thickness are used, the constitutive relationships are not satisfied point-wise. The governing equations are a system of two 4th order partial differential equations with constant coefficients. Unfortunately, predictions and comparison with test data and other models are presented only for the case of one crack system. The most accurate local stress state comparable with a very fine FE solution and, therefore, also accurate stiffness prediction can be obtained using semi-analytical McCartney [9] and Schoeppner and Pagano [10] model. In the McCartney model each layer in the laminate is divided in a certain number of thin sub-layers and in each sub-layer the stress assumptions are as in Hashin’s variational model [6]. All displacement and stress continuity conditions at sub-layer interfaces are satisfied as are the stress-strain relationships, except one, which is satisfied in an average sense. It has been shown that this “satisfying in average” is identical to minimization of the Reissner energy functional in the used approximation of the stress-strain state. The Schoeppner-Pagano model [10], which is also based on Reissner’s principle, considers a system of hollow concentric sub-cylinders with a large radius instead of laminate divided in sub-layers. Each layer is divided in a number of cylinders. In order to simulate interface cracks these cylinders may also be connected in parallel. Shape functions for each sub-cylinder in this model are different than in McCartney’s model but the results converge with increasing number of sub-layers (sub-cylinders) [11]. However, the calculation routines in these models are extremely complex which limits the application. Neither of these models can be directly used for laminates containing several systems of cracks. However, considering these crack systems as non-interacting one can first introduce crack system in 90-layer only and back-calculate the effective stiffness of the damaged layer from the damaged laminate stiffness. Then the intralaminar cracks are introduced in the 0-layer only and similar problem as described above is solved in a system of coordinates rotated by 90°. Finally the effective properties of all
Lundmark, PAPER I
30
damaged layers may be used in laminate theory to calculate the stiffness of laminate with cracks in both layers. The Schoeppner-Pagano model has been used in this way to predict the reduction of thermal expansion coefficients of cross-ply laminates with cracks in both 0- and 90-layers in [12].Generally speaking, the continuum damage mechanics (CDM) approaches ([3], [13], [14],) may be used to describe the stiffness of laminates with intralaminar cracks in off-axis plies of any orientation. The damage is represented by internal state variables (ISV) and the laminate constitutive equations are expressed in general forms containing ISV and a certain number of material constants. These constants must be determined for each considered laminate configuration either experimentally measuring stiffness for a laminate with a certain crack density or using FE analysis for the same reason. This limitation is partially removed in synergistic damage mechanics suggested by Talreja [15] which incorporates micromechanics information to determine the material constants. For the same [± , 902]sclass of laminates as in theoretical assessment [15] Varna et al. [16] used experimentally measured crack opening displacement (COD) to identify the constraint parameter in CDM and to make stiffness predictions. For these measurements a special device was designed and measurements were performed using optical microscopy on loaded specimens [17]. The same technique was later applied to measure COD for cracks in off- axis plies of [0/± 4/01/2]s laminates and to perform CDM predictions [18].An extensive FE parametric analysis in plane stress formulation was performed by Joffe et al. [19] to identify the main geometrical and stiffness parameters affecting the COD. It was found that average COD normalized with respect to the far field stress in the layer and the layer thickness is a very robust parameter: variation of shear moduli and Poisson’s ratios has a negligible effect on the normalized COD. Only the stiffness and thickness ratios of the cracked to uncracked neighboring layers have a significant effect. Based on numerical results the numerical COD values were fitted by power law. The main conclusion was that increasing stiffness and thickness of the constraint layer leads to significant reduction of the average normalized COD. This power law for COD was used in the synergistic CDM predictions of stiffness reduction in [± ,904]s laminates [20] with cracks in 90-layers only. Recently it was demonstrated using micromechanics that all material parameters in CDM for this lay-up depend only on the material properties of the layer, not on the laminate lay-up [21]. This finding was not proven for laminates with cracked layers other than 90° because analytical micromechanics solution for a general case does not exist.
Lundmark, PAPER I
31
Gudmundson and co-workers [22,23] considered laminates with general lay-up and used homogenization technique to derive expressions for stiffness and thermal expansion coefficient of laminates with cracks in layers of 3-D laminates. These expressions in an exact form correlate damaged laminate thermo-elastic properties with parameters characterizing crack behavior: the average COD and crack face sliding. These parameters follow from the solution of the local boundary value problem and their determination is a very complex task. Gudmundson and co-workers suggested to neglect the effect of neighboring layers on crack face displacements and to determine them using the known solution for a periodic system of cracks in an infinite homogeneous transversely isotropic medium (90-layer). The application of their methodology by other researchers has been rather limited due to the fairly complex form of the presented solutions.
In the present paper an attempt, similar to that performed by Gudmundson, is presented in the framework of the laminate theory. The largest advantage is the transparency of derivations and the simplicity of application. Stiffness or compliance matrices and thermal expansion coefficients of an arbitrary symmetric laminate with damage in certain layers are presented in an explicit form. Derivation of constitutive relationships follows the same route as in classical laminate theory. As an input from homogenization theory the relationships between volume averaged and boundary surface averaged quantities are used. The differences between undamaged and damaged laminate cases are indicated in each step of derivation. The damaged laminate stiffness and thermal expansion coefficients are calculated from the undamaged laminate stiffness and the crack face displacements normalized with respect to the far field stress in the layer. Incontrast to Gudmundson’s approach [22,23], the normalized COD and crack face sliding are considered as dependent on the position of the cracked layer (outside or inside cracks) and on the constraint of the surrounding layers in terms of their stiffness and thickness. These dependences are analyzed using FEM calculated crack opening displacement profiles in generalized plane strain formulation and presenting the results in the form of power laws. In a special case of balanced laminates with cracks in 90-layer only, expressions for thermo-elastic properties are presented in an explicit and compact form.
Lundmark, PAPER I
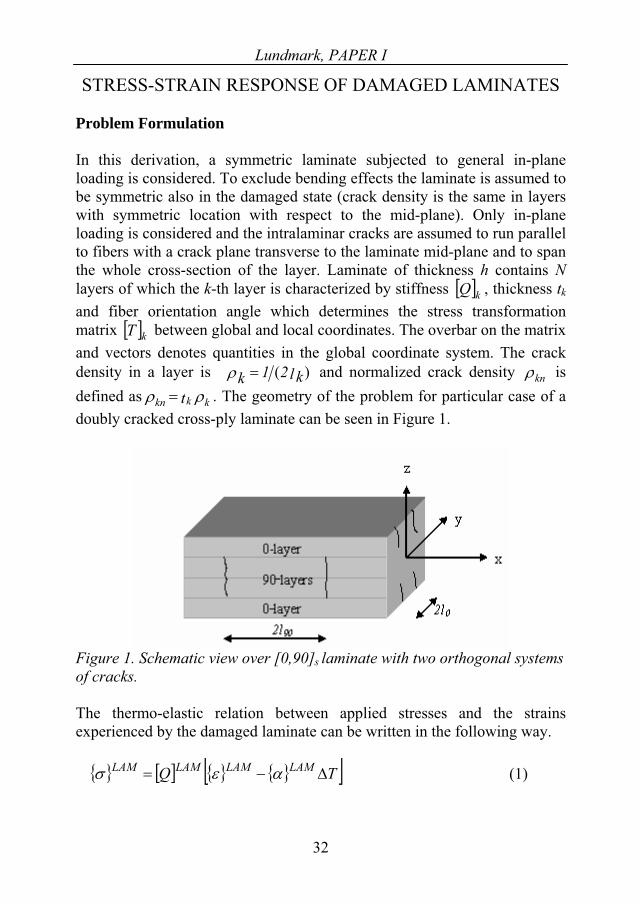
STRESS-STRAIN RESPONSE OF DAMAGED LAMINATES
Problem Formulation
In this derivation, a symmetric laminate subjected to general in-plane loading is considered. To exclude bending effects the laminate is assumed to be symmetric also in the damaged state (crack density is the same in layers with symmetric location with respect to the mid-plane). Only in-plane loading is considered and the intralaminar cracks are assumed to run parallel to fibers with a crack plane transverse to the laminate mid-plane and to span the whole cross-section of the layer. Laminate of thickness h contains Nlayers of which the k-th layer is characterized by stiffness Q k
T k
, thickness tk
and fiber orientation angle which determines the stress transformation matrix between global and local coordinates. The overbar on the matrix and vectors denotes quantities in the global coordinate system. The crack density in a layer is )( l k21k and normalized crack density kn is defined as kkkn t . The geometry of the problem for particular case of a doubly cracked cross-ply laminate can be seen in Figure 1.
Figure 1. Schematic view over [0,90]s laminate with two orthogonal systems of cracks.
The thermo-elastic relation between applied stresses and the strains experienced by the damaged laminate can be written in the following way.
TQ LAMLAMLAMLAM (1)
32

Lundmark, PAPER I
where refTTT (2)
In Equation (1) and LAM LAM are macroscopic stress and strain vectors applied at the boundary of the representative volume element (RVE), and are the unknown stiffness matrix and thermal expansion coefficient vector of the damaged laminate to be determined.
Q LAM LAM
Homogenization Relationships
Introducing volume averaged stresses and strains as in [24] and using superscript a to denote average quantities, we have,
Vij
aij V
1 dVV
ijaij dV
V1 (3)
Here V is the volume of averaging, which may be one layer or the whole laminate volume, as needed. The average stress-strain relationships for a k-th layer in the global coordinate system are
TQ kakk
ak (4)
Using divergence theorem it may be shown [24,25] that stresses applied to the laminate boundary are equal to the stresses averaged over the volume of the whole laminate. Expressing the volume integral as a sum of integrals over volume of individual layers, we obtain
htk
N
k
ak
aLAM
1 (5)
Using the divergence theorem it can also be shown [24,25] that the volume average strains in each layer are equal to boundary averaged strains defined as
33
Lundmark, PAPER I
dSnunuV ijji
Sij 2
11 (6)
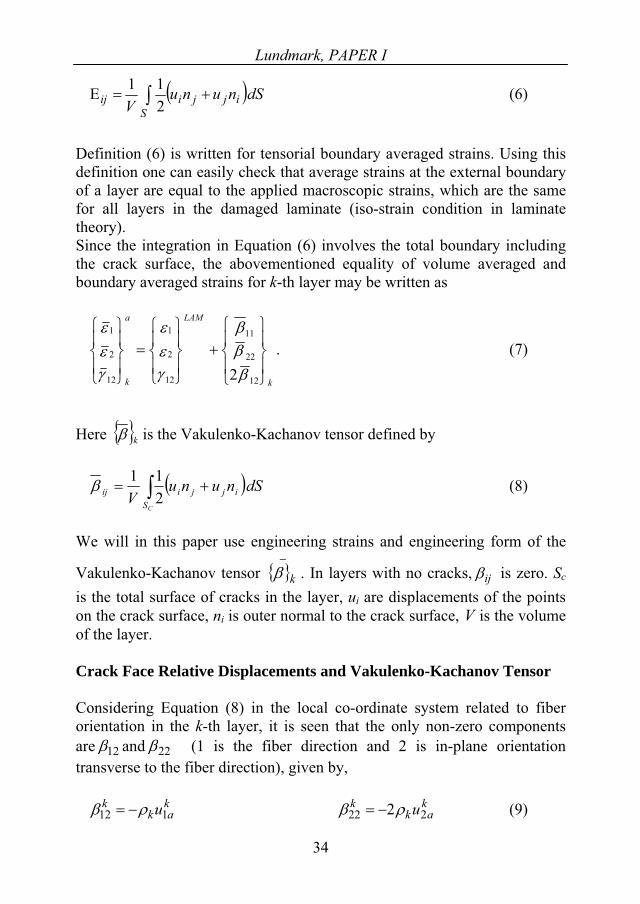
Definition (6) is written for tensorial boundary averaged strains. Using this definition one can easily check that average strains at the external boundary of a layer are equal to the applied macroscopic strains, which are the same for all layers in the damaged laminate (iso-strain condition in laminate theory).Since the integration in Equation (6) involves the total boundary including the crack surface, the abovementioned equality of volume averaged and boundary averaged strains for k-th layer may be written as
k
LAMa
k 2 12
22
11
12
2
1
12
2
1
. (7)
Here is the Vakulenko-Kachanov tensor defined by k
dSnunuV ijji
Sij
C211 (8)
We will in this paper use engineering strains and engineering form of the
Vakulenko-Kachanov tensor . In layers with no cracks,k ij is zero. Sc
is the total surface of cracks in the layer, ui are displacements of the points on the crack surface, ni is outer normal to the crack surface, V is the volume of the layer.
Crack Face Relative Displacements and Vakulenko-Kachanov Tensor
Considering Equation (8) in the local co-ordinate system related to fiber orientation in the k-th layer, it is seen that the only non-zero components are 12 and 22 (1 is the fiber direction and 2 is in-plane orientation transverse to the fiber direction), given by,
(9) kaku1
k12
kak
k u222 2
34
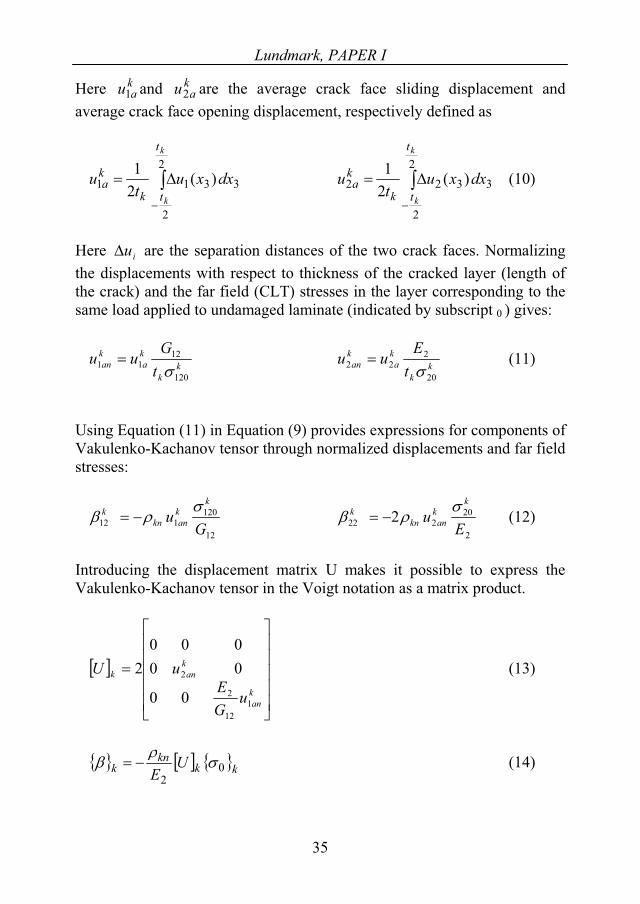
Lundmark, PAPER I
Here and are the average crack face sliding displacement and average crack face opening displacement, respectively defined as
ku1kau2a
2
2
311 )(21
k
k
t
tk
ka dxxu
tu 3
2
2
3322 )(21
k
k
t
tk
ka dxxu
tu (10)
Here are the separation distances of the two crack faces. Normalizing the displacements with respect to thickness of the cracked layer (length of the crack) and the far field (CLT) stresses in the layer corresponding to the same load applied to undamaged laminate (indicated by subscript
iu
0 ) gives:
k120
12
k
ka
kan t
Guu 11 kk
ka
kan t
Euu20
222 (11)
Using Equation (11) in Equation (9) provides expressions for components of Vakulenko-Kachanov tensor through normalized displacements and far field stresses:
12
120k
112 Gu k
anknk
2
20222 2
Eu
kkankn
k (12)
Introducing the displacement matrix U makes it possible to express the Vakulenko-Kachanov tensor in the Voigt notation as a matrix product.
kan
kank
uGE
uU
112
2
2
00
00000
2 (13)
kkn
k UE 0
2k (14)
35
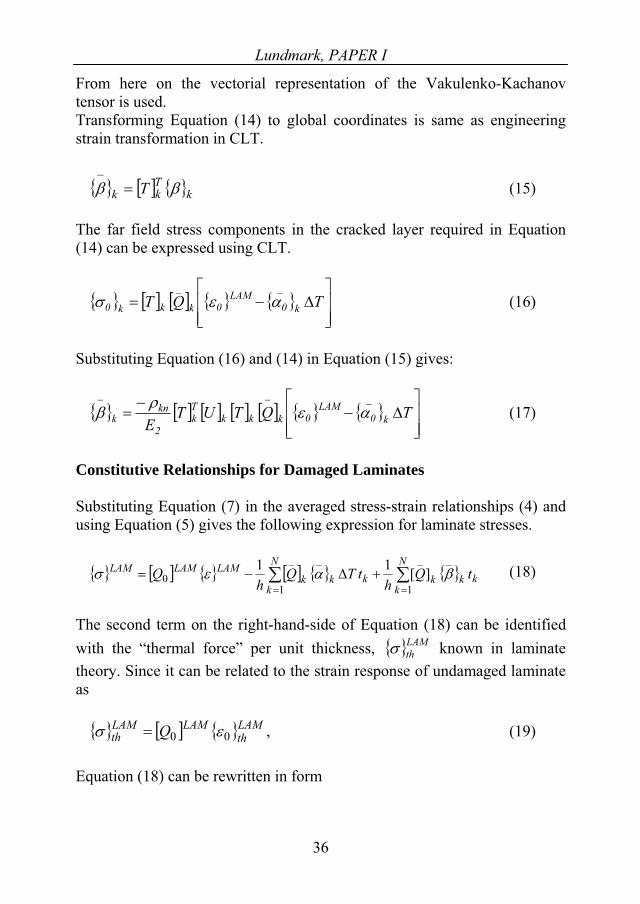
Lundmark, PAPER I
From here on the vectorial representation of the Vakulenko-Kachanov tensor is used. Transforming Equation (14) to global coordinates is same as engineering strain transformation in CLT.
(15) Tkk T k
The far field stress components in the cracked layer required in Equation (14) can be expressed using CLT.
(16)TQT k0LAM
0kkk0
__
Substituting Equation (16) and (14) in Equation (15) gives:
TQTUTE k0
LAM0kkk
Tk
2
knk
_ (17)
Constitutive Relationships for Damaged Laminates
Substituting Equation (7) in the averaged stress-strain relationships (4) and using Equation (5) gives the following expression for laminate stresses.
N
kkkk
N
kkkk
LAMLAMLAM tQh
tTQh
Q1
__
1
__
0 ][11 (18)
The second term on the right-hand-side of Equation (18) can be identified with the “thermal force” per unit thickness, LAM
th known in laminate theory. Since it can be related to the strain response of undamaged laminate as
, (19) LAMth
LAMLAMth Q 00
Equation (18) can be rewritten in form
36

Lundmark, PAPER I
N
kkkk
LAMth
LAMLAMLAM tQh
Q1
00 ][1 (20)
Here is the stiffness matrix of the undamaged laminate calculated
as in the classical laminate theory (CLT).
Q0LAM
LAM0 is the strain in the
undamaged laminate corresponding to the same applied load.
Substituting Equation (17) in Equation (20) gives the final form for damaged laminate thermo-mechanical stress – strain response:
kk0LAM
0kkkTk
N
1kkkn
2
LAMth0
LAMLAM0
LAM
tTQTUTQhE
1
Q
(21)
Stiffness and Compliance Matrices of the Damaged Laminate
Assuming only mechanical loading ( T = 0) in Equation (21) and using
(22) LAMLAMLAM S00
gives
kLAMLAM
kkkTk
N
kkkn
LAMLAMLAM
tSQTUTQhE
Q
012
0
1 (23)
Expressing laminate stress from Equation (23) gives:
LAMLAMk
LAMkkk
Tk
N
kkkn
LAM QtSQTUTQhE
I 0
1
012
1][ (24)
where [ is the identity matrix. ]I
37

Lundmark, PAPER I
Comparing Equation (24) with Equation (1), with 0T , the stiffness matrix and corresponding compliance matrix for the damaged laminate are found to be
LAMk
LAMkkk
Tk
N
kkkn
LAM QtSQTUTQhE
IQ 0
1
012
1][ (25)
kLAM
kkkTk
N
kkkn
LAMLAM tSQTUTQhE
ISS 012
01][ (26)
These expressions may be used to calculate the degradation of mechanical properties for the damaged laminate.
Thermal Expansion Coefficients of the Damaged Laminate
If the reductions in thermal properties are of interest a derivation based on thermal loading only has to be done. Applying thermal loads only, the global laminate stresses are equal to zero, and Equation (20) allows determining the thermal expansion strains of the damaged laminate.
kk
N
kk
LAMLAMth
LAM tQh
S1
001 (27)
Applying Equation (17) in (27), the following relationship can be obtained.
kkkkkTk
N
kkkn
LAM
kLAMthkkk
Tk
N
kkkn
LAMLAMth
LAM
tQTUTQThE
S
tQTUTQhE
S
120
012
00
1
1(28)
By dividing Equation (28) by T, the final expression for the thermal expansion coefficient for the damaged laminate is obtained.
kkknN
k
kLAMN
kkkn
kLAM Dht
Dht
I1
01
(29)
38
Lundmark, PAPER I
where
kkkTkk
LAMk QTUTQ
ESD
20
1 (30)
Thermo-Elastic Properties of Laminates with Cracks in 90-layers
In balanced and symmetric laminates with cracks in 90-layers only the matrix relationships for stiffness and thermal expansion coefficients may be simplified and expressed in explicit form. We consider a particular case often used in research when the 90-layer with crack density n
t s 90
is in the middle of the laminate. The set of layers surrounding the 90-layer on either side may be considered as a sublaminate with thermo-elastic properties calculated using CLT and denoted by upper index s . Using 90-layer properties in the local system and denoting thickness of the sublaminate and 90-layer by and , respectively, we obtain, after tedious work, the following relationships for engineering constants of the damaged laminate.
t
annxyx
x
ukgQEE
23012220 11
1 (31)
annyx
xy
xy
yxy
y
ukgQEE
230
0
012
2012
22
0
11
1 (32)
annxy
annyx
yx
xy
xy
ukgQ
ukgQ
2301222
230
01222
0 11
1
(33)
39
Lundmark, PAPER I
annyx
xy
xy
yx
annyx
yx
yx
yx
ukgQ
ukgQ
230
0
012
2012
22
230
01222
0
11
1
(34)
annx
yx
x
x ukgQ 230
10122022
01 (35)
annyx
xy
xy
yx
y
yx
y
y ukgQ 230
0
012
012
0
10122022
0 11 (36)
where
sxxs
yys
sxyss
xys
SSS
SSSg
tttt
tt
2
22 9011
9012903 (37)
ttttt
tt
tEt
ssyy
sxx
ssxy
sxx
s
ssx SSS
SS
SSE
k 119090
21290
90
22902
2
2221
41 (38)
In Equations (37) and (38) are elements of the compliance matrices. In particular case of cross-ply laminate, the sublaminate is the 0-layer, and,
Sij
, S , , (39) SS sxx 11 Ss
yy 22 SSsxy 12 EEs
x 1
40
Lundmark, PAPER I
FINITE ELEMENT CALCULATIONS
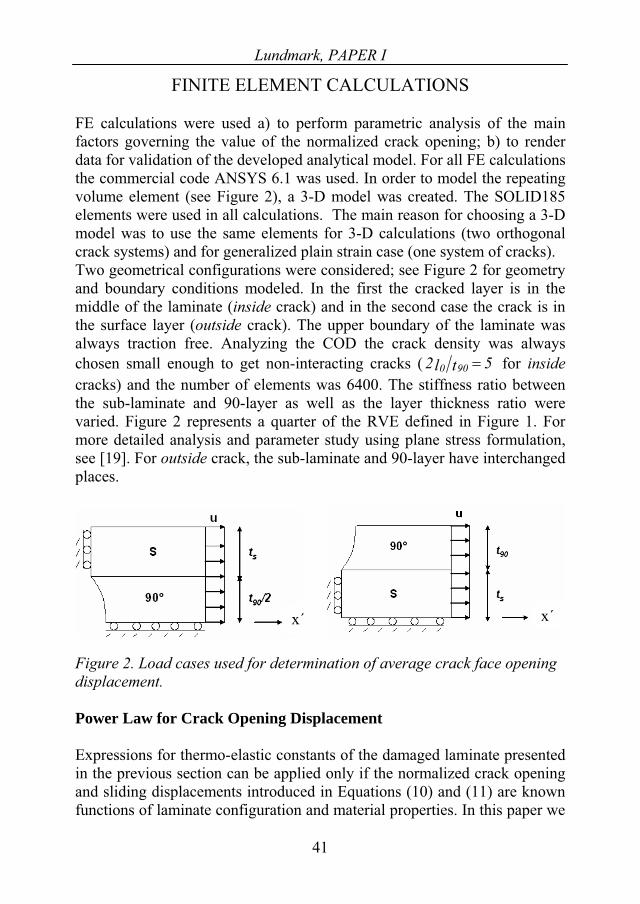
FE calculations were used a) to perform parametric analysis of the main factors governing the value of the normalized crack opening; b) to render data for validation of the developed analytical model. For all FE calculations the commercial code ANSYS 6.1 was used. In order to model the repeating volume element (see Figure 2), a 3-D model was created. The SOLID185 elements were used in all calculations. The main reason for choosing a 3-D model was to use the same elements for 3-D calculations (two orthogonal crack systems) and for generalized plain strain case (one system of cracks). Two geometrical configurations were considered; see Figure 2 for geometry and boundary conditions modeled. In the first the cracked layer is in the middle of the laminate (inside crack) and in the second case the crack is in the surface layer (outside crack). The upper boundary of the laminate was always traction free. Analyzing the COD the crack density was always chosen small enough to get non-interacting cracks ( 5t90l2 0 for insidecracks) and the number of elements was 6400. The stiffness ratio between the sub-laminate and 90-layer as well as the layer thickness ratio were varied. Figure 2 represents a quarter of the RVE defined in Figure 1. For more detailed analysis and parameter study using plane stress formulation, see [19]. For outside crack, the sub-laminate and 90-layer have interchanged places.
x´x´
Figure 2. Load cases used for determination of average crack face openingdisplacement.
Power Law for Crack Opening Displacement
Expressions for thermo-elastic constants of the damaged laminate presented in the previous section can be applied only if the normalized crack opening and sliding displacements introduced in Equations (10) and (11) are known functions of laminate configuration and material properties. In this paper we
41
Lundmark, PAPER I
consider only laminates and properties with negligible sliding leaving the sliding effects for a separate paper. It has to be emphasized that the Equations (10) and (11) are defined in the coordinate system where the cracked layer has a 90-degrees orientation with respect to x´. Hence, an appropriate model to study the normalized COD is a cross-ply type symmetric laminate containing cracked 90-layer which is supported by a sublaminate. A series of FEM-calculations were performed and the displacement in direction x´ for the nodes at the crack surface was used to calculate the average value of the crack face displacement, u2a. That value was then normalized with respect to thickness of the cracked layer and the far field stress in the layer transverse to the crack plane according to Equation (11).Results were fitted by a power law as follows.
n
52.0
sx
an EEBAu 2
2 (40)
The obtained constants in the two power laws for inside and outside cracks respectively can be seen below.
For inside crack:
A
s
st
ttB
22
1652.03075.0 90
7037.02
0626.02
030667.0 902
90
ss tt
tt
n (41)
For outside crack:
2.1A
s
st
ttB
22
1901.05942.0 90
2576.02
4437.02
13073.0 902
90
ss tt
tt
n (42)
42
Lundmark, PAPER I
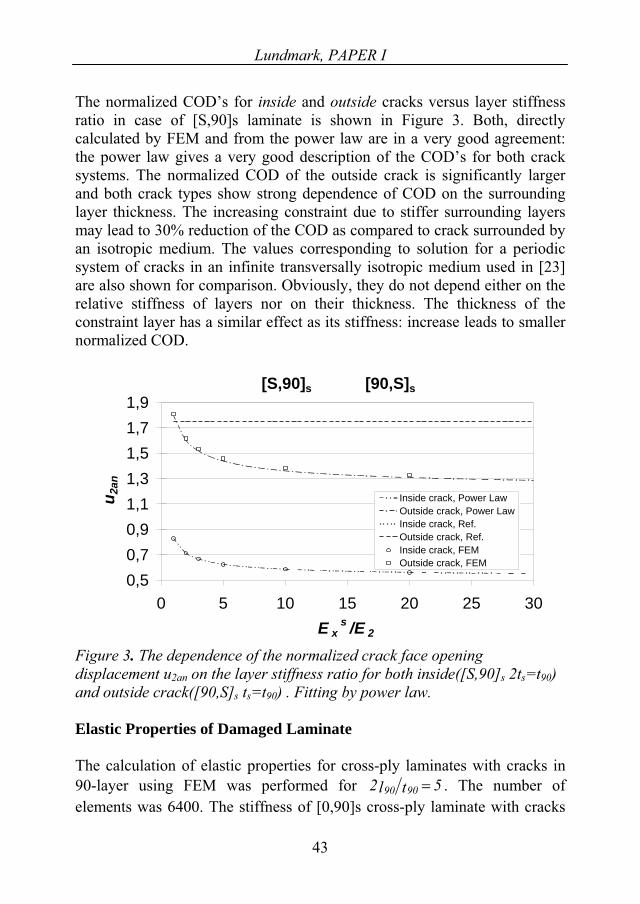
The normalized COD’s for inside and outside cracks versus layer stiffness ratio in case of [S,90]s laminate is shown in Figure 3. Both, directly calculated by FEM and from the power law are in a very good agreement: the power law gives a very good description of the COD’s for both crack systems. The normalized COD of the outside crack is significantly larger and both crack types show strong dependence of COD on the surrounding layer thickness. The increasing constraint due to stiffer surrounding layers may lead to 30% reduction of the COD as compared to crack surrounded by an isotropic medium. The values corresponding to solution for a periodic system of cracks in an infinite transversally isotropic medium used in [23] are also shown for comparison. Obviously, they do not depend either on the relative stiffness of layers nor on their thickness. The thickness of the constraint layer has a similar effect as its stiffness: increase leads to smaller normalized COD.
[S,90]s [90,S]s
0,50,70,91,11,31,51,71,9
0 5 10 15 20 25 30E x
s /E 2
u 2an
Inside crack, Power LawOutside crack, Power LawInside crack, Ref.Outside crack, Ref.Inside crack, FEMOutside crack, FEM
Figure 3. The dependence of the normalized crack face opening displacement u2an on the layer stiffness ratio for both inside([S,90]s 2ts=t90)and outside crack([90,S]s ts=t90) . Fitting by power law.
Elastic Properties of Damaged Laminate
The calculation of elastic properties for cross-ply laminates with cracks in 90-layer using FEM was performed for 5tl 90902 . The number of elements was 6400. The stiffness of [0,90]s cross-ply laminate with cracks
43

Lundmark, PAPER I
44
in both 90 and 0-layer was calculated assuming the same crack density in both layers and the number of elements was same in x,z- and y,z-plane. The total number of elements used was 36000 and for one particular case it was 80000. The number of elements in the mesh was varied to find the most suitable mesh, taking both the calculation time and accuracy into consideration.
RESULTS AND DISCUSSION
The expressions in matrix form for damaged laminate stiffness (Equation (25)) and thermal expansion coefficients (Equations (29) and (30)) were used along with power law Expressions (40), (41) and (42) in predictions for damaged cross-ply laminates. Predictions for laminates with cracks in 90-layer only are validated comparing with results from direct FEM calculations and further verified comparing with experimental data obtained in our laboratory [19,20,26]. Comparison is made for different types of glass fiber/epoxy and carbon fiber/epoxy systems and different laminate lay-ups. The five materials used are defined in Table 1. Since no stiffness data for laminates with two orthogonal systems of cracks are available comparison in this case is made with Hashin’s model and with 3-D FEM calculations with a very fine mesh. Experimental data from [12] for reduction of thermal expansion coefficients of cross-ply laminates containing cracks in 90-layer and for laminates with two crack systems are used.
Table 1. Material properties for materials used in calculations and validations.
materials E1(GPa)
E2(GPa)
G12(GPa)
12 1 (10-6
1/ºC)
2(10-6
1/ºC)
Laminathickness
(mm)GF/EP-1 46.50 22.82 8.60 0.30 10.00 20.00 0.150GF/EP-2 41.70 13.00 3.40 0.30 - - 0.150GF/EP-3 44.73 12.76 3.50 0.30 - - 0.138GF/EP-4 44.73 12.76 3.50 0.30 - - 0.148CF/EP 138.00 10.30 5.50 0.30 0.43 25.87 0.125
Validation of the Analytical Approach Using FEM
First laminates with one crack system only were considered. The goal was a) to validate the developed general expressions for calculation of all
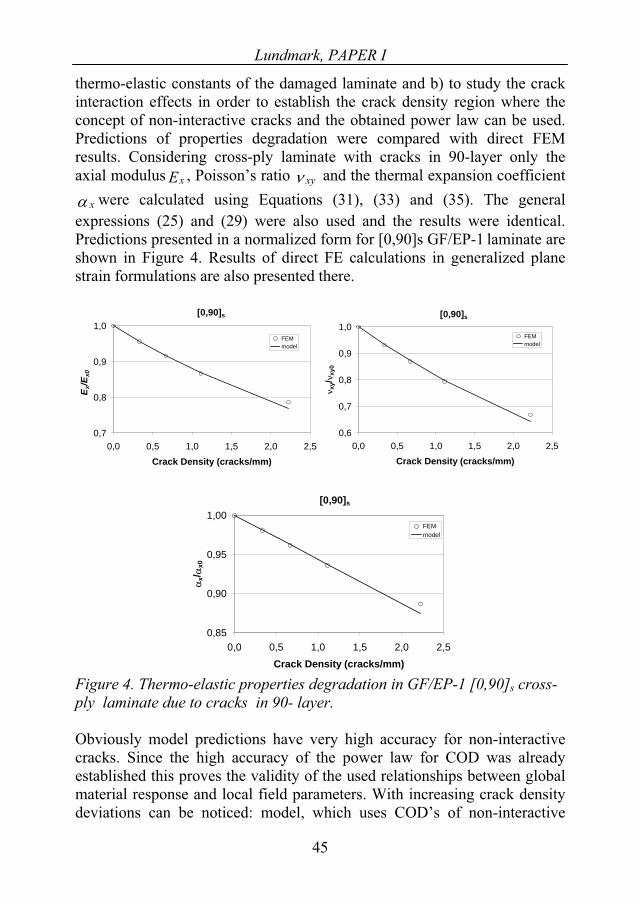
Lundmark, PAPER I
thermo-elastic constants of the damaged laminate and b) to study the crack interaction effects in order to establish the crack density region where the concept of non-interactive cracks and the obtained power law can be used. Predictions of properties degradation were compared with direct FEM results. Considering cross-ply laminate with cracks in 90-layer only the axial modulus , Poisson’s ratio Ex xy and the thermal expansion coefficient
x were calculated using Equations (31), (33) and (35). The general expressions (25) and (29) were also used and the results were identical. Predictions presented in a normalized form for [0,90]s GF/EP-1 laminate are shown in Figure 4. Results of direct FE calculations in generalized plane strain formulations are also presented there.
[0,90]s
0,7
0,8
0,9
1,0
0,0 0,5 1,0 1,5 2,0 2,5Crack Density (cracks/mm)
E x/E
x0
FEMmodel
[0,90]s
0,6
0,7
0,8
0,9
1,0
0,0 0,5 1,0 1,5 2,0 2,5Crack Density (cracks/mm)
xy/
xy0
FEMmodel
[0,90]s
0,85
0,90
0,95
1,00
0,0 0,5 1,0 1,5 2,0 2,5Crack Density (cracks/mm)
x/x0
FEMmodel
Figure 4. Thermo-elastic properties degradation in GF/EP-1 [0,90]s cross-ply laminate due to cracks in 90- layer.
Obviously model predictions have very high accuracy for non-interactive cracks. Since the high accuracy of the power law for COD was already established this proves the validity of the used relationships between global material response and local field parameters. With increasing crack density deviations can be noticed: model, which uses COD’s of non-interactive
45
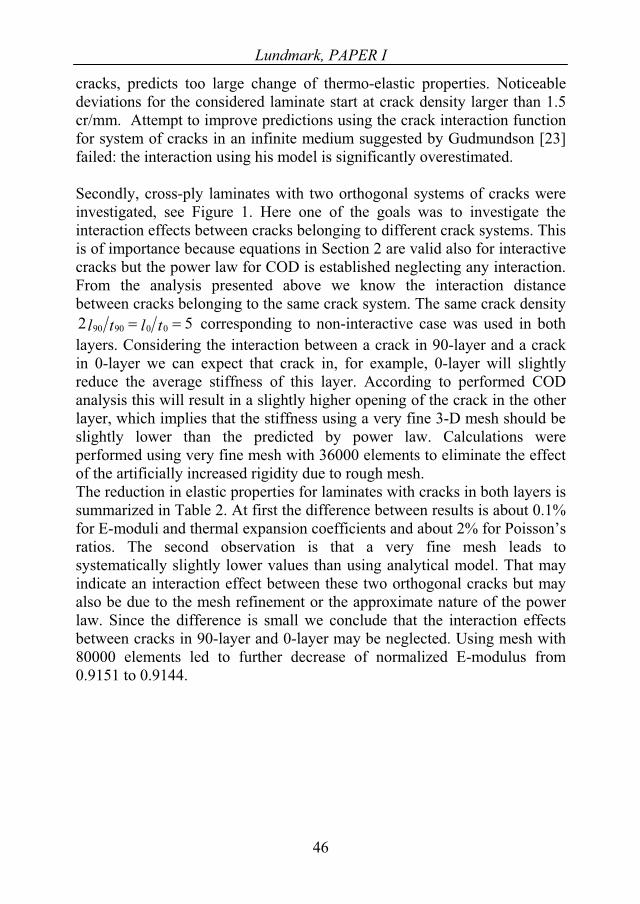
Lundmark, PAPER I
cracks, predicts too large change of thermo-elastic properties. Noticeable deviations for the considered laminate start at crack density larger than 1.5 cr/mm. Attempt to improve predictions using the crack interaction function for system of cracks in an infinite medium suggested by Gudmundson [23] failed: the interaction using his model is significantly overestimated.
Secondly, cross-ply laminates with two orthogonal systems of cracks were investigated, see Figure 1. Here one of the goals was to investigate the interaction effects between cracks belonging to different crack systems. This is of importance because equations in Section 2 are valid also for interactive cracks but the power law for COD is established neglecting any interaction. From the analysis presented above we know the interaction distance between cracks belonging to the same crack system. The same crack density
52 009090 tltl corresponding to non-interactive case was used in both layers. Considering the interaction between a crack in 90-layer and a crack in 0-layer we can expect that crack in, for example, 0-layer will slightly reduce the average stiffness of this layer. According to performed COD analysis this will result in a slightly higher opening of the crack in the other layer, which implies that the stiffness using a very fine 3-D mesh should be slightly lower than the predicted by power law. Calculations were performed using very fine mesh with 36000 elements to eliminate the effect of the artificially increased rigidity due to rough mesh. The reduction in elastic properties for laminates with cracks in both layers is summarized in Table 2. At first the difference between results is about 0.1% for E-moduli and thermal expansion coefficients and about 2% for Poisson’s ratios. The second observation is that a very fine mesh leads to systematically slightly lower values than using analytical model. That may indicate an interaction effect between these two orthogonal cracks but may also be due to the mesh refinement or the approximate nature of the power law. Since the difference is small we conclude that the interaction effects between cracks in 90-layer and 0-layer may be neglected. Using mesh with 80000 elements led to further decrease of normalized E-modulus from 0.9151 to 0.9144.
46

Lundmark, PAPER I
Table 2. Comparison between FEM and the present model for GF/EP-1 [0,90]s cross-ply laminate with cracks in both 0- and 90- layer.
FEM modelEx/Ex0 0.9151 0.9162Ey/Ey0 0.9076 0.9072vxy/vxy0 0.7982 0.8195vyx/vyx0 0.7935 0.8114
x/ x0 0.9557 0.9576y/ y0 0.9521 0.9534
Comparison between the developed model and Hashin’s variational model [5] is based on results for GF/EP-2 [0,90]s laminate with the same number of cracks in both layers presented in Figure 5.
[0,90]s
0,80
0,85
0,90
0,95
1,00
0,0 0,2 0,4 0,6 0,8 1,0 1,2Crack Density (cracks/mm)
E x/E
x0
modelmodel, Hashin (1987)
[0,90]s
0,6
0,7
0,8
0,9
1,0
0,0 0,2 0,4 0,6 0,8 1,0 1,2Crack Density (cracks/mm)
xy/
xy0 model
model, Hashin (1987)
Figure 5. Elastic properties degradation in GF/EP-2 [0,90]s cross-ply laminate due to cracks in 0- and 90-layer.
The Young’s modulus predicted by Hashin’s model is significantly lower than our model which we believe is more accurate. The too low modulus predicted by Hashin’s model is a consequence of the used very simple stress approximations in combination with the principle of complementary energy which gives lower bound to the exact solution. Hashin’s predicted Poisson’s ratio is incorrect because of his wrong definition of the average transverse strain in corresponding expression for Poisson’s ratio: the average value over the 90-layer should be taken instead of the whole laminate including the 0-layer.
Validation of the Model using Experimental Data
The model is also compared with experimental data for different lay-ups and materials. Considering stiffness of laminates with cracks in 90-layer only, shown in Figures 6 to 8, we see that the predictions are in good agreement
47
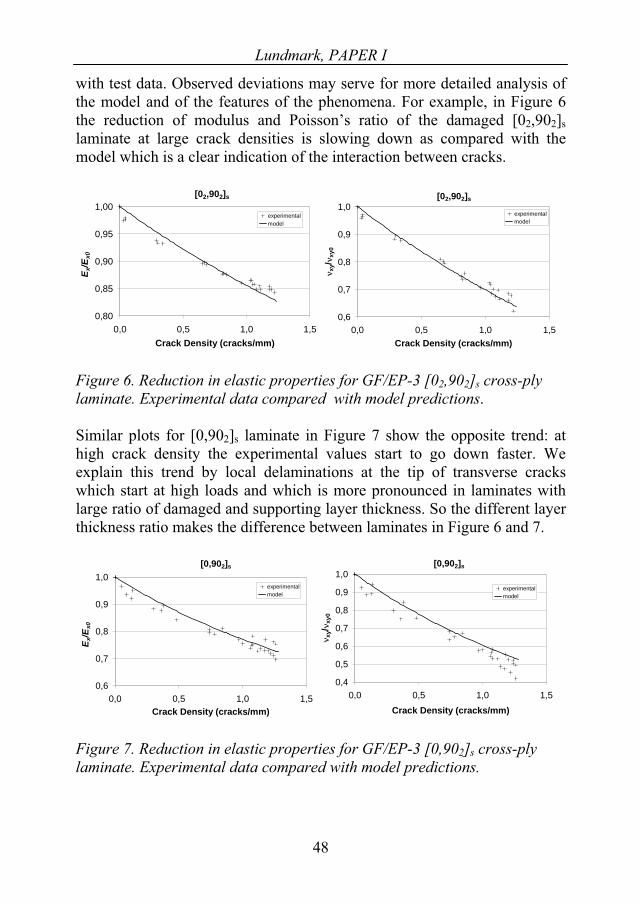
Lundmark, PAPER I
with test data. Observed deviations may serve for more detailed analysis of the model and of the features of the phenomena. For example, in Figure 6 the reduction of modulus and Poisson’s ratio of the damaged [02,902]slaminate at large crack densities is slowing down as compared with the model which is a clear indication of the interaction between cracks.
[02,902]s
0,80
0,85
0,90
0,95
1,00
0,0 0,5 1,0 1,5Crack Density (cracks/mm)
E x/E
x0
experimentalmodel
[02,902]s
0,6
0,7
0,8
0,9
1,0
0,0 0,5 1,0 1,5Crack Density (cracks/mm)
xy/
xy0
experimentalmodel
Figure 6. Reduction in elastic properties for GF/EP-3 [02,902]s cross-ply laminate. Experimental data compared with model predictions.
Similar plots for [0,902]s laminate in Figure 7 show the opposite trend: at high crack density the experimental values start to go down faster. We explain this trend by local delaminations at the tip of transverse cracks which start at high loads and which is more pronounced in laminates with large ratio of damaged and supporting layer thickness. So the different layer thickness ratio makes the difference between laminates in Figure 6 and 7.
[0,902]s
0,6
0,7
0,8
0,9
1,0
0,0 0,5 1,0 1,5Crack Density (cracks/mm)
E x/E
x0
experimentalmodel
[0,902]s
0,4
0,5
0,6
0,7
0,8
0,9
1,0
0,0 0,5 1,0 1,5Crack Density (cracks/mm)
xy/
xy0
experimentalmodel
Figure 7. Reduction in elastic properties for GF/EP-3 [0,902]s cross-ply laminate. Experimental data compared with model predictions.
48
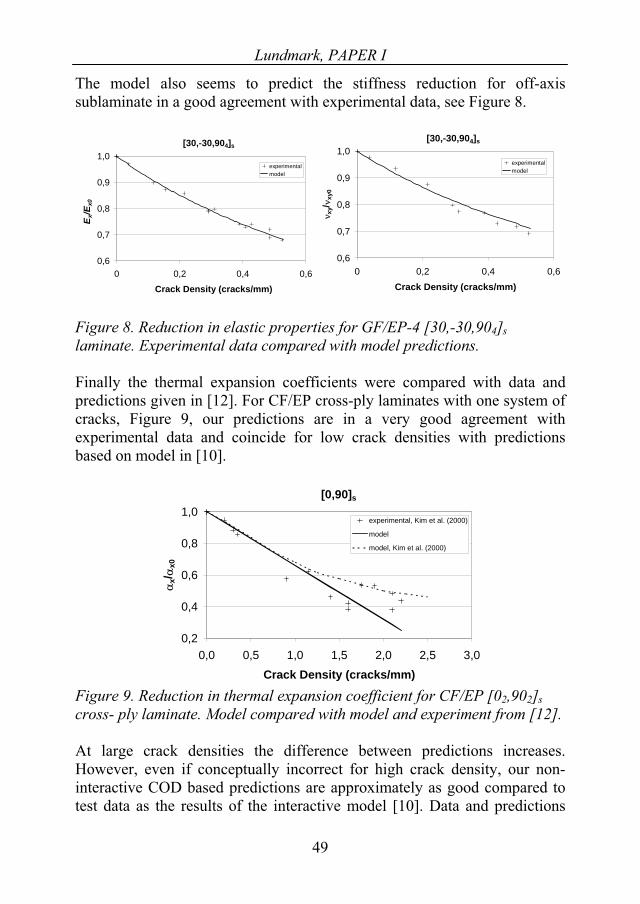
Lundmark, PAPER I
The model also seems to predict the stiffness reduction for off-axis sublaminate in a good agreement with experimental data, see Figure 8.
[30,-30,904]s
0,6
0,7
0,8
0,9
1,0
0 0,2 0,4 0,6
Crack Density (cracks/mm)
E x/E
x0
experimentalmodel
[30,-30,904]s
0,6
0,7
0,8
0,9
1,0
0 0,2 0,4 0,6Crack Density (cracks/mm)
xy/
xy0
experimentalmodel
Figure 8. Reduction in elastic properties for GF/EP-4 [30,-30,904]slaminate. Experimental data compared with model predictions.
Finally the thermal expansion coefficients were compared with data and predictions given in [12]. For CF/EP cross-ply laminates with one system of cracks, Figure 9, our predictions are in a very good agreement with experimental data and coincide for low crack densities with predictions based on model in [10].
[0,90]s
0,2
0,4
0,6
0,8
1,0
0,0 0,5 1,0 1,5 2,0 2,5 3,0Crack Density (cracks/mm)
x/x0
experimental, Kim et al. (2000)
model
model, Kim et al. (2000)
Figure 9. Reduction in thermal expansion coefficient for CF/EP [02,902]scross- ply laminate. Model compared with model and experiment from [12].
At large crack densities the difference between predictions increases. However, even if conceptually incorrect for high crack density, our non-interactive COD based predictions are approximately as good compared to test data as the results of the interactive model [10]. Data and predictions
49
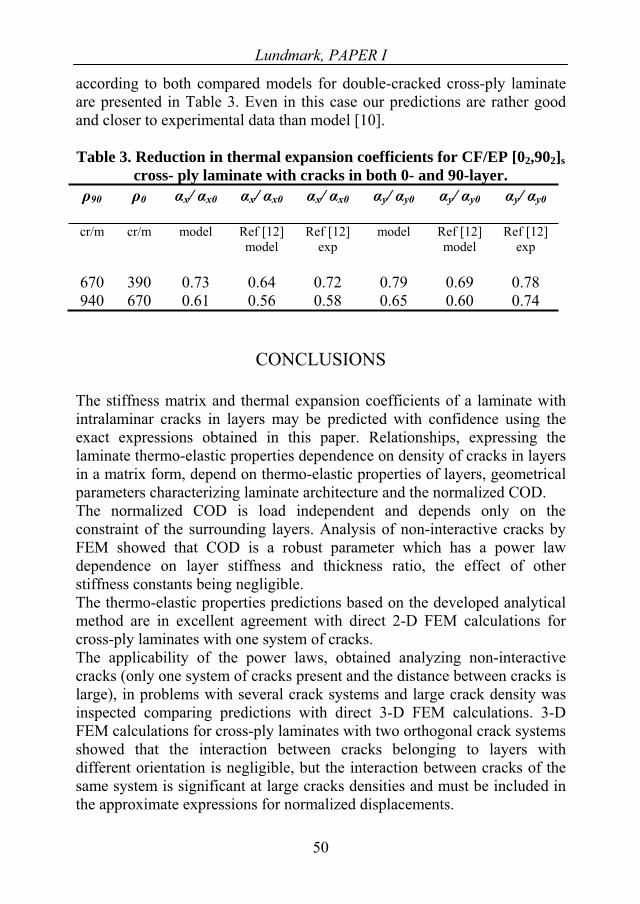
Lundmark, PAPER I
50
according to both compared models for double-cracked cross-ply laminate are presented in Table 3. Even in this case our predictions are rather good and closer to experimental data than model [10].
Table 3. Reduction in thermal expansion coefficients for CF/EP [02,902]scross- ply laminate with cracks in both 0- and 90-layer.
90 0 x/ x0 x/ x0 x/ x0 y/ y0 y/ y0 y/ y0
cr/m cr/m model Ref [12] model
Ref [12] exp
model Ref [12] model
Ref [12] exp
670 390 0.73 0.64 0.72 0.79 0.69 0.78940 670 0.61 0.56 0.58 0.65 0.60 0.74
CONCLUSIONS
The stiffness matrix and thermal expansion coefficients of a laminate with intralaminar cracks in layers may be predicted with confidence using the exact expressions obtained in this paper. Relationships, expressing the laminate thermo-elastic properties dependence on density of cracks in layers in a matrix form, depend on thermo-elastic properties of layers, geometrical parameters characterizing laminate architecture and the normalized COD. The normalized COD is load independent and depends only on the constraint of the surrounding layers. Analysis of non-interactive cracks by FEM showed that COD is a robust parameter which has a power law dependence on layer stiffness and thickness ratio, the effect of other stiffness constants being negligible. The thermo-elastic properties predictions based on the developed analytical method are in excellent agreement with direct 2-D FEM calculations for cross-ply laminates with one system of cracks. The applicability of the power laws, obtained analyzing non-interactive cracks (only one system of cracks present and the distance between cracks is large), in problems with several crack systems and large crack density was inspected comparing predictions with direct 3-D FEM calculations. 3-D FEM calculations for cross-ply laminates with two orthogonal crack systems showed that the interaction between cracks belonging to layers with different orientation is negligible, but the interaction between cracks of the same system is significant at large cracks densities and must be included in the approximate expressions for normalized displacements.
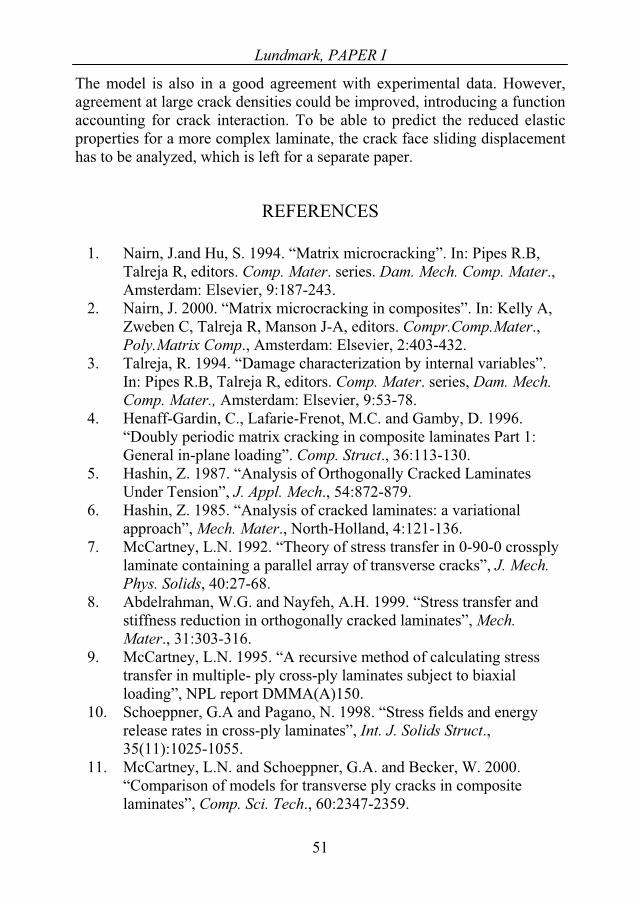
Lundmark, PAPER I
51
The model is also in a good agreement with experimental data. However, agreement at large crack densities could be improved, introducing a function accounting for crack interaction. To be able to predict the reduced elastic properties for a more complex laminate, the crack face sliding displacement has to be analyzed, which is left for a separate paper.
REFERENCES
1. Nairn, J.and Hu, S. 1994. “Matrix microcracking”. In: Pipes R.B, Talreja R, editors. Comp. Mater. series. Dam. Mech. Comp. Mater.,Amsterdam: Elsevier, 9:187-243.
2. Nairn, J. 2000. “Matrix microcracking in composites”. In: Kelly A, Zweben C, Talreja R, Manson J-A, editors. Compr.Comp.Mater.,Poly.Matrix Comp., Amsterdam: Elsevier, 2:403-432.
3. Talreja, R. 1994. “Damage characterization by internal variables”. In: Pipes R.B, Talreja R, editors. Comp. Mater. series, Dam. Mech. Comp. Mater., Amsterdam: Elsevier, 9:53-78.
4. Henaff-Gardin, C., Lafarie-Frenot, M.C. and Gamby, D. 1996. “Doubly periodic matrix cracking in composite laminates Part 1: General in-plane loading”. Comp. Struct., 36:113-130.
5. Hashin, Z. 1987. “Analysis of Orthogonally Cracked Laminates Under Tension”, J. Appl. Mech., 54:872-879.
6. Hashin, Z. 1985. “Analysis of cracked laminates: a variational approach”, Mech. Mater., North-Holland, 4:121-136.
7. McCartney, L.N. 1992. “Theory of stress transfer in 0-90-0 crossply laminate containing a parallel array of transverse cracks”, J. Mech. Phys. Solids, 40:27-68.
8. Abdelrahman, W.G. and Nayfeh, A.H. 1999. “Stress transfer and stiffness reduction in orthogonally cracked laminates”, Mech. Mater., 31:303-316.
9. McCartney, L.N. 1995. “A recursive method of calculating stress transfer in multiple- ply cross-ply laminates subject to biaxial loading”, NPL report DMMA(A)150.
10. Schoeppner, G.A and Pagano, N. 1998. “Stress fields and energy release rates in cross-ply laminates”, Int. J. Solids Struct.,35(11):1025-1055.
11. McCartney, L.N. and Schoeppner, G.A. and Becker, W. 2000. “Comparison of models for transverse ply cracks in composite laminates”, Comp. Sci. Tech., 60:2347-2359.
Lundmark, PAPER I
52
12. Kim, R.Y., Crasto, A.S. and Schoeppner, G.A. 2000. “Dimensional stability of composite in space thermal environment”, Comp. Sci. Tech., 60:2601-2608.
13. Allen, D.H., Harris, C.E. and Groves, S.E. 1987. “A thermomechanical constitutive theory for elastic composites with distributed damage. Part II: application to matrix cracking in laminated composites”, Int. J. Solids Struct., 23:1319-1338.
14. Ladeveze, P.1990. “A damage mechanics for composite materials”, In: Integration of theory and application in applied mechanics. Dordrecht: Kluver, 13-24.
15. Talreja, R. 1996. “A synergistic damage mechanics approach to durability of composite material systems”, In: Cardon A, Fukuda H, Reifsnider K, editors. Progress in durability analysis of composite systems. Rotterdam: A.A. Balkema, 117- 129.
16. Varna, J., Akshantala, N.V. and Talreja, R. 1999. “Crack opening displacement and the associated response of laminates with varying constraints”, Int. J. Dam. Mech., 8:174-193.
17. Varna, J., Berglund, L.A., Talreja, R. and Jakovics, A. 1993. “A study of the crack opening displacement of transverse cracks in cross-ply laminates”, Int. J. Dam. Mech., 2:272-289.
18. Varna, J., Joffe, R., Akshantala, N.V. and Talreja, R. 1999. “Damage in composite laminates with off-axis plies”, Comp. Sci. Tech.,59:2139-2147.
19. Joffe, R., Krasnikovs, A. and Varna, J. 2001. “COD-based simulation of transverse cracking and stiffness reduction in [S/90n]s laminates”, Comp. Sci. Tech., 61:637-656.
20. Varna, J., Joffe, R. and Talreja, R. 2001. “A synergistic damage mechanics analysis of transverse cracking in [± ,904]s laminates”, Comp. Sci. Tech., 61:657-665.
21. Varna, J., Krasnikovs, A., Kumar, R. and Talreja R. 2003. “A Synergistic damage mechanics approach to viscoelastic response of cracked cross-ply laminates”, Int. J. Dam. Mech., 2003, in press.
22. Gudmundson, P. and Östlund, S. 1992. “First order analysis of stiffness reduction due to matrix cracking”, J. Comp. Mater.,26:1009-1030.
23. Gudmundson, P. and Zang, W. 1993. “A universal model for thermoelastic properties of macro cracked composite laminates”, Int.J. Solids Struct., 30:3211-3231.
24. Allen, D.H. and Yoon, C. 1998. “Homogenization techniques for thermo-viscoelastic solids containing cracks”, Int. J. Solids Struct.,35:4035-4053.
Lundmark, PAPER I
53
25. Varna, J. 2002. “Effective properties of damaged laminated composites reinforced with continues UD fibers”, Proceedings of the 10th European Conference on Composite Materials, Brugge, Belgium, paper 270.
26. Varna, J. and Krasnikovs, A. 1998. “Transverse Cracks in Cross-ply Laminates. Part 2. Stiffness Degradation”, Mech. Comp. Mater.,34(2):153-170


Lundmark; Paper II
55
PAPER II

Lundmark; Paper II
57
Crack face sliding effect on stiffness of laminates with ply cracks
Peter Lundmark1, Janis Varna2
Div of Polymer Engineering, Luleå University of TechnologySE-97187 Luleå, Sweden
[email protected] [email protected] Corresponding author, Fax: +46 920 491084
Accepted in Composite Science and Technology, in press
AbstractThe rate of stiffness reduction in damaged laminates with increasing transverse crack density in plies depends on two micromechanical parameters: normalized crack face opening displacement (COD) and crack face sliding displacement (CSD). A FE-based parametric study shows that the only properties that affect the CSD are the thickness ratio and the in-plane shear stiffness ratio of the damaged and neighbouring undamaged layers. The dependence is described by a power function with respect to the above mentioned properties. This relationship and the previously obtained power law for COD [20] are used in the damaged laminate constitutive relationships [20], which are closed form exact expressions for general symmetric laminates in in-plane loading. The model is validated analyzing reduction in shear modulus of [Sn,90m]slaminates and comparing with direct FE-calculations. The results are excellent in case of cracks in one layer only. For laminates with two orthogonal systems of cracks, the power law underestimates the CSD. To account for interaction between both systems of cracks, which is of importance for crack face sliding, the power law is modified using the effective shear modulus of the cracked neighbouring layer.
Keywords: Homogenization; Intralaminar cracks; Laminate stiffness, Sliding displacements
1 Introduction
In laminated composites, many different kinds of micro-damage modes may evolve without leading to final failure. The most common damage mode and the one examined in this work are intralaminar cracks in layers. They can occur when the material is subjected to mechanical or thermal loading and cause degradation of thermo-elastic properties.

Lundmark; Paper II
Numerous approaches and analytical models have been developed to study the reduction of the Elastic modulus and Poisson’s ratio due to intralaminar cracks. The broad spectrum of the analysis techniques used cover simplified stress analyses using modifications of the shear lag assumptions, variational bounding methods and numerical procedures. Unfortunately most of the developed predictive tools are applicable only for the simplest laminate configuration: cross-ply laminate. The in-plane shear modulus of the damaged laminate is considered only in a few investigations.
Hashin [1] investigated the in-plane shear modulus reduction of cross-ply laminates with cracks in inside 90-layer using a variational approach. In his model an admissible stress field is constructed which satisfies equilibrium as well as the boundary and interface conditions in tractions. The in-plane shear stress distribution across each ply was assumed uniform and the only unknown function describing the shear stress in-plane distribution was determined using the principle of minimum complementary energy. Using the calculated stress distribution the lower bounds for the shear modulus of the laminate was obtained. Exactly the same expression for shear modulus reduction was obtained using two entirely different approaches [2-6]: a) Tan et al. [2,3] obtained expressions for axial modulus, Poisson’s ratio and shear modulus of the cross-ply laminate with 90-cracks integrating the equilibrium and constitutive expressions over the ply thickness and obtaining a second order differential equations for stress distributions; b) Tsai et al [4,5] and Abdelrahman et al [6] reduced the 3-D elasticity problem to 2-D problem in terms of displacements [4] or stresses [6] averaged over the ply thickness and solved analytically the obtained set of differential equations with constant coefficients. The results of all these models coincide due to assumed linear through the thickness dependence of the out-of-plane shear stresses. Henaff-Gardin et al [7] analyzed the double-cracked cross-ply laminates in a similar manner as in [4] just using simpler shear lag model with parabolic opening displacement and uniform sliding displacement distributions. Since the free crack surface conditions were satisfied only in average, they could find the shear stress distribution analytically. Tsai et al [4] developed a methodology for shear modulus determination using an experimental setup where a pre-damaged tensile specimen is subjected to in-plane tangential displacement in the middle part. Then the shear modulus was calculated using a Timoshenko beam approximation of the specimen deformation. Herakovich et al [8] used for displacements in a layer of a cross-ply laminate with cracks in 90-layer a second order Legendre expansion with respect to the out-of-plane coordinate . The set of governing equations for the 9 unknown functions of z
58
Lundmark; Paper II
in-plane coordinates was obtained multiplying equilibrium equations by and integrating, and solved using finite differences. Comparison with FEM results showed that the approximate model gives consistently too small stiffness reduction. Hua Yu et al [9] used approach [4] to analyze the stiffness matrix of unbalanced [
zn
m/90n]s laminates with cracks in 90-layers by partition the initial coupled problem in two uncoupled subproblems, the first of them being exactly the same as in [4].
Tsai et al [5] considered also shear response of cross-ply laminates with cracks in both 90- and 0-layer. In this case the set of 2-D equations was solved numerically using finite differences. They suggested that an expression based on “superposition of solutions” may give good accuracy.
Fan et al [10], using the expressions for a compliance of a solid with microcracks derived by Horii et al [11], presented the constitutive equations for a layer with cracks. These expressions apart from lamina properties contain also so-called “in-situ damage effective functions -IDEF” which depend on crack density in the lamina and on the neighbouring layer constraint. In order to determine IDEF they introduced “an equivalent constraint model”, which assumes that the constraint of the lay-ups above and below the analyzed lamina can be described by two sublaminates with properties calculated using laminate theory (CLT). Thereby the actual laminate was replaced by a cross-ply. The stress state in the repeating unit of the cross-ply laminate and the IDEF’s were calculated using standard shear lag model with linear distribution of out-of-plane shear stresses. Then the constitutive relationships for damaged layers were used in the framework of the CLT to obtain the stiffness matrix of the damaged laminate. Since the micromechanical local stress model coincides with the presented in [4,5], the predictions of the shear modulus for the cross-ply laminate with cracks in 90-layer only, which is the only case discussed in [10], also have to coincide or be very similar. This approach was further refined in Zang et al in [12] where the local stress problem was solved using an improved shear lag model which assumes non-zero 0-layer intralaminar shear stress only in a zone in the vicinity of the transverse crack tip. The only problem is that the size of this zone becomes a fitting parameter.
The same micromechanics model was used also by Kashtalyan et al in [13] where in the “equivalent constraint model” the effective properties of the constraint layer were adjusted for damage when analyzing the local stresses in another layer. This leads to an iterative procedure when cracks are present in both 0- and 90-layer of the cross-ply laminate. It was shown that a) the results are quite different when the shear stress localization model is used; b) the interaction of cracks in two layers leads to considerable
59
Lundmark; Paper II
60
additional reduction of the laminate shear modulus. It should be noted that the methodology, which was developed and used for cross-ply laminates, could be rather easy generalized to more general lay-ups. Local delaminations at the tip of transverse cracks were included in the analysis by the same authors in [14] were also a rather detailed analysis of the state of art on this subject is presented.
Gudmundson et al. [15,16] considered laminates with general lay-up and used homogenization technique to derive expressions for stiffness and thermal expansion coefficient tensors of laminate with cracks in layers in 3-D laminate. These expressions in an exact form correlate damaged laminate thermo-elastic properties with parameters characterizing crack behavior: the average COD and crack face sliding. These parameters have to be obtained solving the local boundary value problem and their determination is a very complex task. Gudmundson suggested to neglect the effect of neighboring layers on crack face displacements and to determine them using the known solution for a periodic system of cracks in an infinite homogeneous transversely isotropic medium (90-layer). Nuismer et al [2] showed that the idea of replacing the cracked lamina with an effective medium which comes from Dvorak et al [17] results in significant overestimation of the changes in damaged laminate compliances.
Varna and Lundmark [18,19,20] developed an approach similar as Gudmundson but presented in the framework of the laminate theory. The advantage is the transparency of derivations and simplicity of application. Stiffness, compliance matrices and thermal expansion coefficients of an arbitrary symmetric laminate with cracks in certain layers are presented in an explicit form. Derivation of constitutive relationships for the damaged laminate follows the same routes as in the CLT. These relationships, which for consistency are briefly repeated in the presented paper, contain only material properties, geometrical characteristics of the laminate and two very robust parameters of the crack: average crack face opening (COD) and sliding displacement (CSD) normalized with respect to applied strain. In [20,21] the first parameter - normalized average crack face opening displacement (COD) was analyzed using FEM and found that it depends only on the constraining ply and cracked ply stiffness ratio and thickness ratio. This relationship was approximated by a power law. The application of these results in the constitutive law may be considered as a specific form of implementation of the equivalent constraint approach introduced in [10,13].
In the present paper we analyze the second parameter in the constitutive law- the normalized average crack face sliding displacement (CSD). The constraint effects on CSD are analyzing using [S,90n]s and [90n,S]s
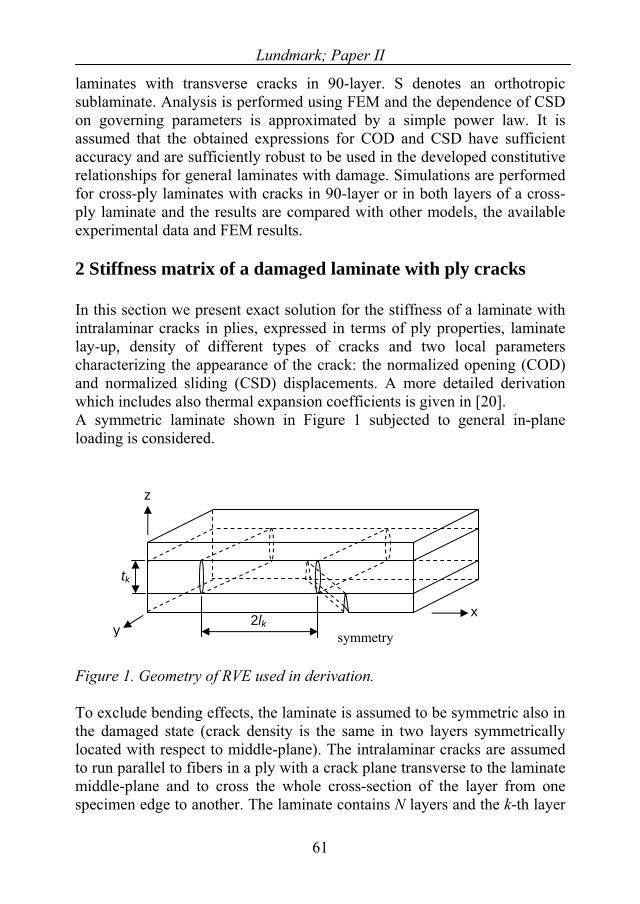
Lundmark; Paper II
laminates with transverse cracks in 90-layer. S denotes an orthotropic sublaminate. Analysis is performed using FEM and the dependence of CSD on governing parameters is approximated by a simple power law. It is assumed that the obtained expressions for COD and CSD have sufficient accuracy and are sufficiently robust to be used in the developed constitutive relationships for general laminates with damage. Simulations are performed for cross-ply laminates with cracks in 90-layer or in both layers of a cross-ply laminate and the results are compared with other models, the available experimental data and FEM results.
2 Stiffness matrix of a damaged laminate with ply cracks
In this section we present exact solution for the stiffness of a laminate with intralaminar cracks in plies, expressed in terms of ply properties, laminate lay-up, density of different types of cracks and two local parameters characterizing the appearance of the crack: the normalized opening (COD) and normalized sliding (CSD) displacements. A more detailed derivation which includes also thermal expansion coefficients is given in [20]. A symmetric laminate shown in Figure 1 subjected to general in-plane loading is considered.
61
Figure 1. Geometry of RVE used in derivation.
To exclude bending effects, the laminate is assumed to be symmetric also in the damaged state (crack density is the same in two layers symmetrically located with respect to middle-plane). The intralaminar cracks are assumed to run parallel to fibers in a ply with a crack plane transverse to the laminate middle-plane and to cross the whole cross-section of the layer from one specimen edge to another. The laminate contains N layers and the k-th layer
yx
z
2lk
tk
symmetry
Lundmark; Paper II
is characterized by stiffness in the local coordinates Q kk , thickness t andfiber orientation angle k which determines the stress transformation matrix between global and local coordinates T k . The subscript k denotes the k-th ply and h is the total thickness of the laminate. The line above the matrix and vector entities denotes the global coordinate system x,y,z. The crack density in a layer is kk l21 and normalized crack density kn is defined as kkkn t . The drawing in Figure 1 represents a part of the upper half of the representative volume element (RVE) (symmetry about z = 0). On the macrolevel the elastic relationship between applied stresses and the strains experienced by the damaged laminate can be written in the following way.
(1)LAMLAM Q LAM
LAM and LAM are macroscopic stress and strain vectors applied at the boundary of the representative volume element (RVE), LAMQ is the unknown stiffness matrix of the damaged laminate to be determined. We introduce volume averaged stresses and strains in the following way
Vij
aij V
1 dVV
ijaij dV
V1 (2)
The superscript a denotes the volume average. The averaged stress-strain relationships of the k-th layer in global coordinates are
. (3) __
kak Q
_ak
The applied laminate stresses are equal to the volume average stresses in the laminate [22]. They can be expressed using rule of mixtures over the volume-averaged stresses in the layers.
N
kk
akk
N
kk
ak
LAM tQh
th 11
11 (4)
It can be shown [22] that the volume average strains in each layer can be expressed by the strains applied to the layer and the boundary averaged
62
Lundmark; Paper II
strains of the crack surface, . Since the strains applied to the layer are equal to the applied laminate strain (iso-strain condition in the CLT)
k
. (5)LAMak
_
k
kHere is a Voigt form of the Vakulenko-Kachanov tensor [22] defined in following way.
dSnunuV ijji
Sij
C211 (6)
In layers without cracks, ij is zero. Sc is the total surface of cracks in the layer, ui are displacements of the points on crack surface, ni is outer normal to the crack surface, V is the volume of the layer. Using Equation (5) in Equation (4) gives the following expression.
N
kkkk
LAMLAMLAM tQh
Q1
__
0 ][1 (7)
Here is the stiffness matrix of the undamaged laminate calculated as in the CLT.
LAM0Q
The Valulenko–Kachanov tensor (Equation (6)) can first be analyzed in the symmetry axes of the layer and then transformed to the global system. It is easy to see that the only non-zero terms are 12 and 22 which can be written in the following form [20].
12
120112 G
uk
kankn
k
2
20222 2
Eu
kkankn
k (8)
Here and are the average crack face sliding displacement and average crack face opening displacement, respectively, normalized with respect to thickness of the cracked layer and the far field (CLT) stresses in the layer corresponding to the same load applied to undamaged laminate (indicated by subscript
ku1kanu2an
0 ).
63
Lundmark; Paper II
k120
12
k
ka
kan t
Guu 11 kk
ka
kan t
Euu20
222 (9)
where
2
2
311 )(21
k
k
t
tk
ka dxxu
tu 3
2
2
3322 )(21
k
k
t
tk
ka dxxu
tu (10)
Here is the difference in displacements for the both crack faces. iuBy introducing displacement matrix [U] as in Equation (11),
kan
kank
uGE
uU
112
2
2
00
00000
2 (11)
we can express the Vakulenko-Kachanov tensor in the Voigt notation as a matrix product.
kkn
k UE 0
2k (12)
The far field stress components in the cracked layer can be expressed through the applied stress using CLT. Transformation of k to global coordinates is exactly the same as for strain in CLT. Substituting in Equation (7) we obtain:
kLAMLAM
kkkTk
N
kkkn
LAMLAMLAM
tSQTUTQhE
Q
0
_
1
_
2
0
1 (13)
From Equation (13), the stiffness matrix of the damaged laminate can be found.
64
Lundmark; Paper II
LAMk
LAMkkk
Tk
N
kkkn
LAM QtSQTUTQhE
IQ 0
1
0
_
1
_
2
1][ (14)
where [ is the identity matrix. ]I
Expressions for engineering constants may be obtained from equation (14) or from the compliance matrix, see [20]. Simple expressions for Young’s moduli and Poisson’s ratios of [S,90n]s laminate with cracks in 90-layer are given in [20] . Expression for of [S,90GQ xy
LAM66 n]s and [90n,S]s
laminates with cracks in 90-layer may be deduced from Equation (14) and written in the following form
anns
sxycr
crxy
xy
utGtG
tGGG
112
120 2
1
1 (15)
Thus Equation (15) is valid for both “inside cracks” ( 290ttcr , see Figure 2a) and for “outside cracks” ( ttcr 90 , see Figure 2b). We call a crack an inside crack if the cracked layer does not have a free surface and outside crack if it has a free surface. Certainly, u defined by Equations (9) and (10) may be different for both types of cracks.
an1
For a cross-ply laminate with cracks in 90-layer only (the sublaminate is the 0-layer), the shear modulus can be expressed as
ans
nxy
xy
utt
tGG
190
900
21
1 (16)
Equation (14) is a simple algebraic equation containing, additionally to crack density, only material-, geometrical properties and the normalized average crack face opening (COD) and sliding displacement (CSD). In the particular case described by Equation (15) only the CSD enters the expression for shear modulus.
65
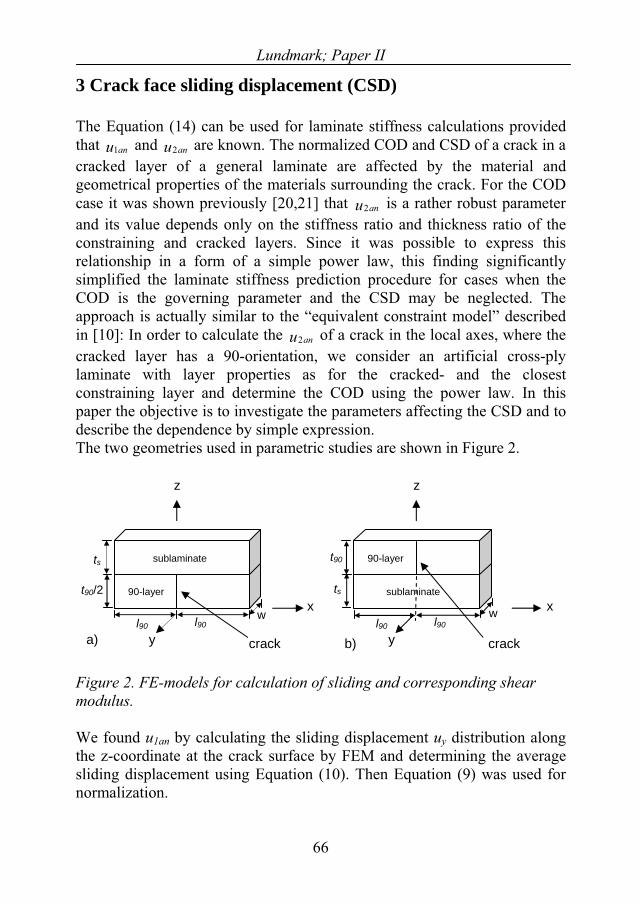
Lundmark; Paper II
3 Crack face sliding displacement (CSD)
The Equation (14) can be used for laminate stiffness calculations provided that u and u are known. The normalized COD and CSD of a crack in a cracked layer of a general laminate are affected by the material and geometrical properties of the materials surrounding the crack. For the COD case it was shown previously [20,21] that is a rather robust parameter and its value depends only on the stiffness ratio and thickness ratio of the constraining and cracked layers. Since it was possible to express this relationship in a form of a simple power law, this finding significantly simplified the laminate stiffness prediction procedure for cases when the COD is the governing parameter and the CSD may be neglected. The approach is actually similar to the “equivalent constraint model” described in [10]: In order to calculate the u of a crack in the local axes, where the cracked layer has a 90-orientation, we consider an artificial cross-ply laminate with layer properties as for the cracked- and the closest constraining layer and determine the COD using the power law. In this paper the objective is to investigate the parameters affecting the CSD and to describe the dependence by simple expression.
an1 an2
u an2
an2
The two geometries used in parametric studies are shown in Figure 2.
66
Figure 2. FE-models for calculation of sliding and corresponding shear modulus.
We found u1an by calculating the sliding displacement uy distribution along the z-coordinate at the crack surface by FEM and determining the average sliding displacement using Equation (10). Then Equation (9) was used for normalization.
x
y
z
wl90l90
t90
ts
90-layer
sublaminate
crack
x
y
z
wl90l90
ts
t90/2
sublaminate
90-layer
crack a) b)
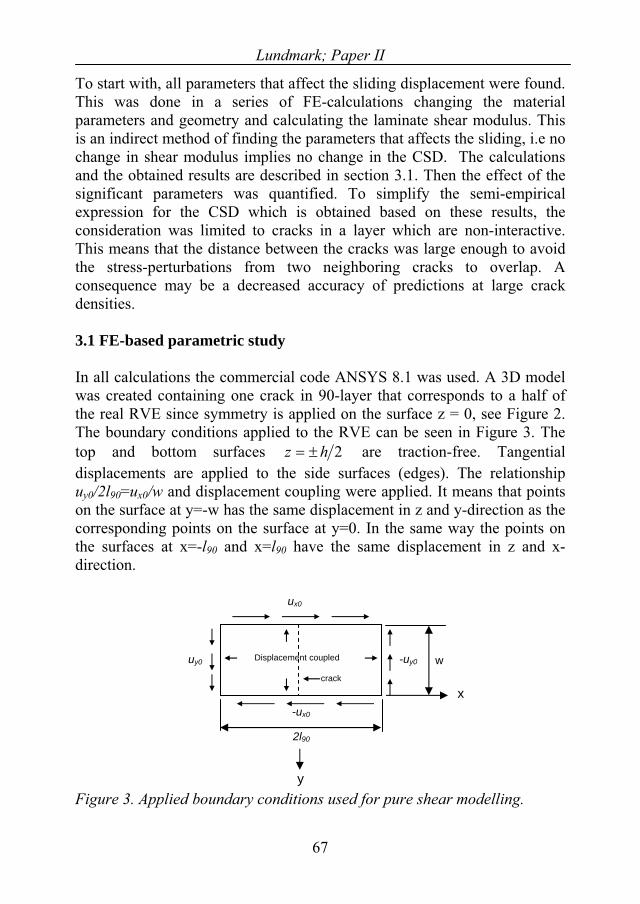
Lundmark; Paper II
To start with, all parameters that affect the sliding displacement were found. This was done in a series of FE-calculations changing the material parameters and geometry and calculating the laminate shear modulus. This is an indirect method of finding the parameters that affects the sliding, i.e no change in shear modulus implies no change in the CSD. The calculations and the obtained results are described in section 3.1. Then the effect of the significant parameters was quantified. To simplify the semi-empirical expression for the CSD which is obtained based on these results, the consideration was limited to cracks in a layer which are non-interactive. This means that the distance between the cracks was large enough to avoid the stress-perturbations from two neighboring cracks to overlap. A consequence may be a decreased accuracy of predictions at large crack densities.
3.1 FE-based parametric study
In all calculations the commercial code ANSYS 8.1 was used. A 3D model was created containing one crack in 90-layer that corresponds to a half of the real RVE since symmetry is applied on the surface z = 0, see Figure 2. The boundary conditions applied to the RVE can be seen in Figure 3. The top and bottom surfaces 2hz are traction-free. Tangential displacements are applied to the side surfaces (edges). The relationship uy0/2l90=ux0/w and displacement coupling were applied. It means that points on the surface at y=-w has the same displacement in z and y-direction as the corresponding points on the surface at y=0. In the same way the points on the surfaces at x=-l90 and x=l90 have the same displacement in z and x-direction.
67
ux0
uy0
x
y
-ux0
-uy0
Figure 3. Applied boundary conditions used for pure shear modelling.
Displacement coupled
crack
w
2l90
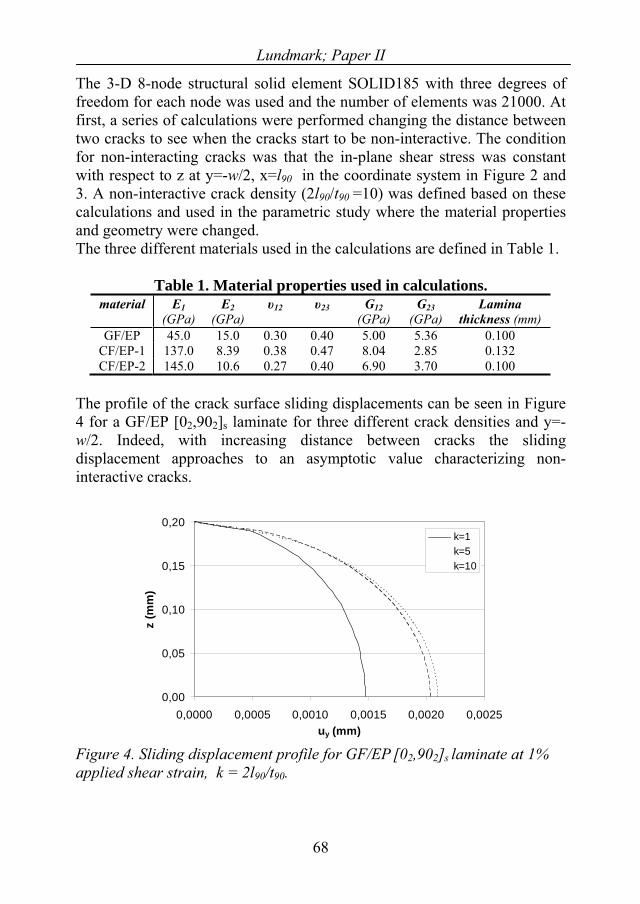
Lundmark; Paper II
The 3-D 8-node structural solid element SOLID185 with three degrees of freedom for each node was used and the number of elements was 21000. At first, a series of calculations were performed changing the distance between two cracks to see when the cracks start to be non-interactive. The condition for non-interacting cracks was that the in-plane shear stress was constant with respect to z at y=-w/2, x=l90 in the coordinate system in Figure 2 and 3. A non-interactive crack density (2l90/t90 =10) was defined based on these calculations and used in the parametric study where the material properties and geometry were changed. The three different materials used in the calculations are defined in Table 1.
Table 1. Material properties used in calculations. material E1
(GPa) E2
(GPa) 12 23 G12
(GPa) G23
(GPa) Lamina
thickness (mm) GF/EP 45.0 15.0 0.30 0.40 5.00 5.36 0.100
CF/EP-1 137.0 8.39 0.38 0.47 8.04 2.85 0.132 CF/EP-2 145.0 10.6 0.27 0.40 6.90 3.70 0.100
The profile of the crack surface sliding displacements can be seen in Figure 4 for a GF/EP [02,902]s laminate for three different crack densities and y=-w/2. Indeed, with increasing distance between cracks the sliding displacement approaches to an asymptotic value characterizing non-interactive cracks.
0,00
0,05
0,10
0,15
0,20
0,0000 0,0005 0,0010 0,0015 0,0020 0,0025uy (mm)
z (m
m)
k=1k=5k=10
Figure 4. Sliding displacement profile for GF/EP [02,902]s laminate at 1% applied shear strain, k = 2l90/t90.
68
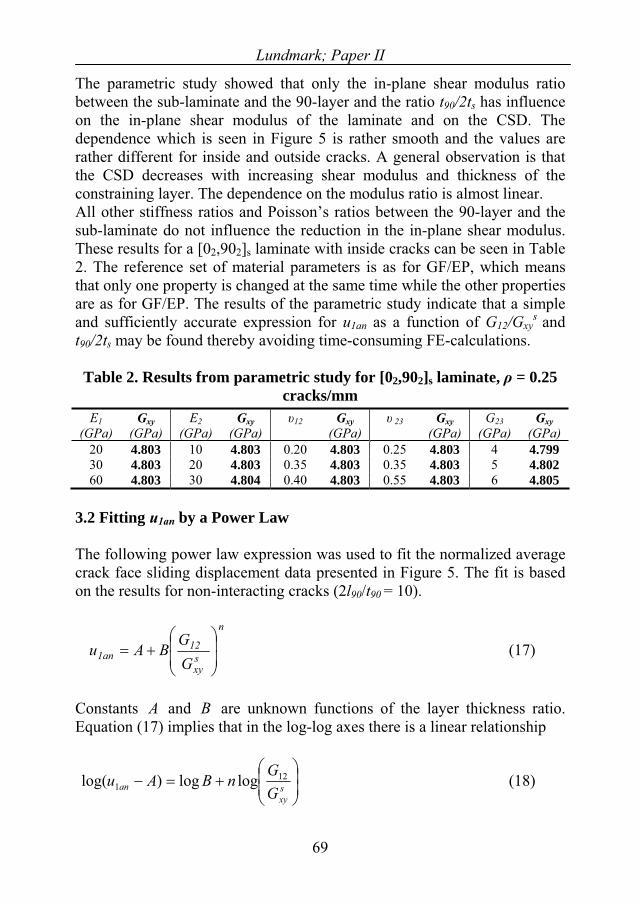
Lundmark; Paper II
The parametric study showed that only the in-plane shear modulus ratio between the sub-laminate and the 90-layer and the ratio t90/2ts has influence on the in-plane shear modulus of the laminate and on the CSD. The dependence which is seen in Figure 5 is rather smooth and the values are rather different for inside and outside cracks. A general observation is that the CSD decreases with increasing shear modulus and thickness of the constraining layer. The dependence on the modulus ratio is almost linear. All other stiffness ratios and Poisson’s ratios between the 90-layer and the sub-laminate do not influence the reduction in the in-plane shear modulus. These results for a [02,902]s laminate with inside cracks can be seen in Table 2. The reference set of material parameters is as for GF/EP, which means that only one property is changed at the same time while the other properties are as for GF/EP. The results of the parametric study indicate that a simple and sufficiently accurate expression for u1an as a function of G12/Gxy
s andt90/2ts may be found thereby avoiding time-consuming FE-calculations.
Table 2. Results from parametric study for [02,902]s laminate, = 0.25 cracks/mm
E1(GPa)
E2
69
3.2 Fitting u1an by a Power Law
The following power law expression was used to fit the normalized average crack face sliding displacement data presented in Figure 5. The fit is based on the results for non-interacting cracks (2l90/t90 = 10).
n
sxy
12an1 G
GBAu (17)
Constants A and B are unknown functions of the layer thickness ratio. Equation (17) implies that in the log-log axes there is a linear relationship
sxy
an GGnBAu 12
1 loglog)log( (18)
Gxy(GPa) (GPa)
Gxy(GPa)
12 Gxy(GPa)
23 G23Gxy Gxy(GPa) (GPa) (GPa)
20 4.803 10 4.803 0.20 4.803 0.25 4.803 4 4.799 30 4.803 20 4.803 0.35 4.803 0.35 4.803 5 4.802 60 4.803 30 4.804 0.40 4.803 0.55 4.803 6 4.805
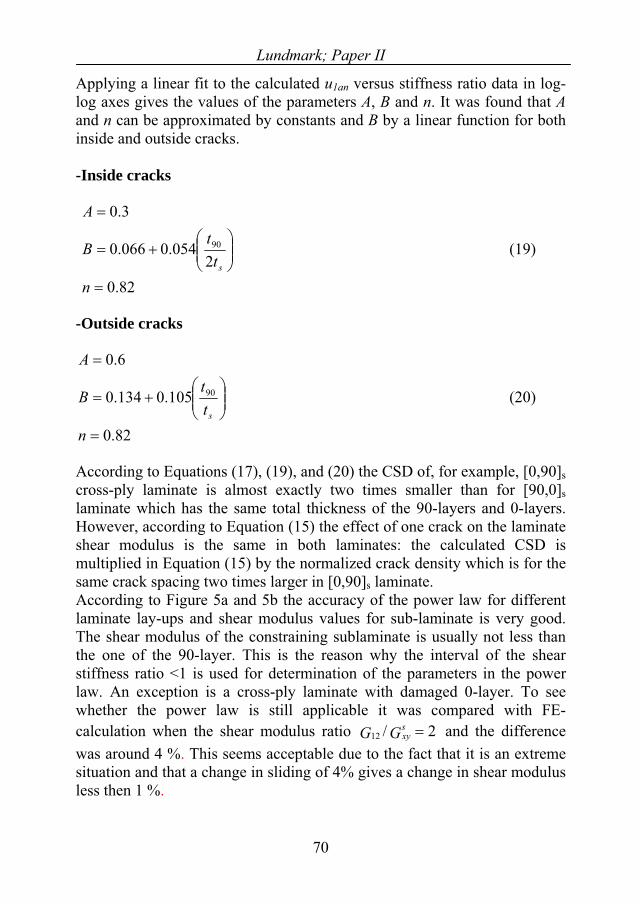
Lundmark; Paper II
Applying a linear fit to the calculated u1an versus stiffness ratio data in log-log axes gives the values of the parameters A, B and n. It was found that Aand n can be approximated by constants and B by a linear function for both inside and outside cracks.
-Inside cracks
82.02
054.0066.0
3.0
90
nt
tB
A
s
(19)
-Outside cracks
82.0
105.0134.0
6.0
90
ntt
B
A
s
(20)
According to Equations (17), (19), and (20) the CSD of, for example, [0,90]scross-ply laminate is almost exactly two times smaller than for [90,0]slaminate which has the same total thickness of the 90-layers and 0-layers. However, according to Equation (15) the effect of one crack on the laminate shear modulus is the same in both laminates: the calculated CSD is multiplied in Equation (15) by the normalized crack density which is for the same crack spacing two times larger in [0,90]s laminate. According to Figure 5a and 5b the accuracy of the power law for different laminate lay-ups and shear modulus values for sub-laminate is very good. The shear modulus of the constraining sublaminate is usually not less than the one of the 90-layer. This is the reason why the interval of the shear stiffness ratio <1 is used for determination of the parameters in the power law. An exception is a cross-ply laminate with damaged 0-layer. To see whether the power law is still applicable it was compared with FE-calculation when the shear modulus ratio and the difference was around 4 %. This seems acceptable due to the fact that it is an extreme situation and that a change in sliding of 4% gives a change in shear modulus less then 1 %.
2/12 GG sxy
70
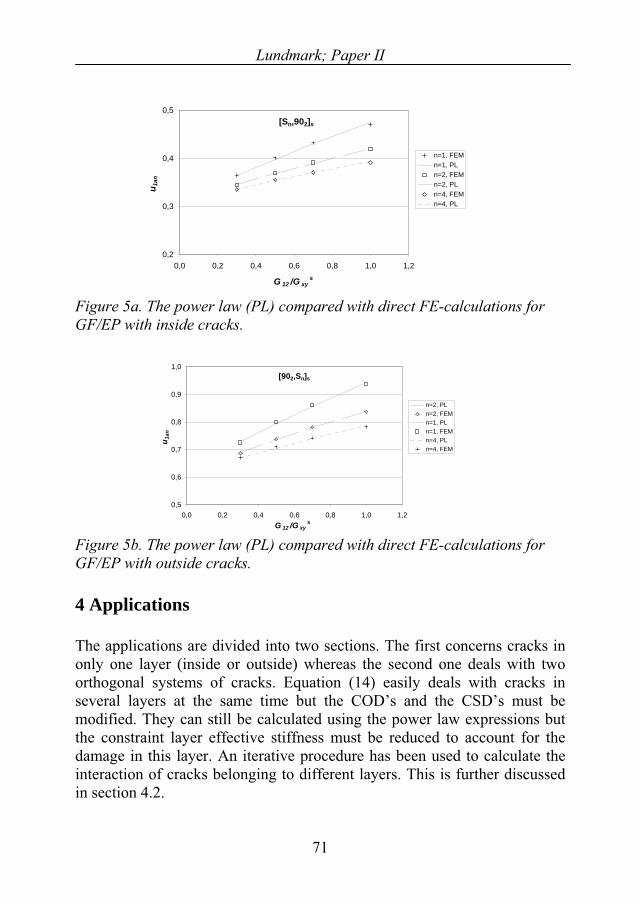
Lundmark; Paper II
[Sn,902]s
0,2
0,3
0,4
0,5
0,0 0,2 0,4 0,6 0,8 1,0 1,2
G 12 /G xys
u 1an
n=1, FEMn=1, PLn=2, FEMn=2, PLn=4, FEMn=4, PL
Figure 5a. The power law (PL) compared with direct FE-calculations for GF/EP with inside cracks.
[902,Sn]s
0,5
0,6
0,7
0,8
0,9
1,0
0,0 0,2 0,4 0,6 0,8 1,0 1,2G 12 /G xy
s
u 1an
n=2, PLn=2, FEMn=1, PLn=1, FEMn=4, PLn=4, FEM
Figure 5b. The power law (PL) compared with direct FE-calculations for GF/EP with outside cracks.
4 Applications
The applications are divided into two sections. The first concerns cracks in only one layer (inside or outside) whereas the second one deals with two orthogonal systems of cracks. Equation (14) easily deals with cracks in several layers at the same time but the COD’s and the CSD’s must be modified. They can still be calculated using the power law expressions but the constraint layer effective stiffness must be reduced to account for the damage in this layer. An iterative procedure has been used to calculate the interaction of cracks belonging to different layers. This is further discussed in section 4.2.
71
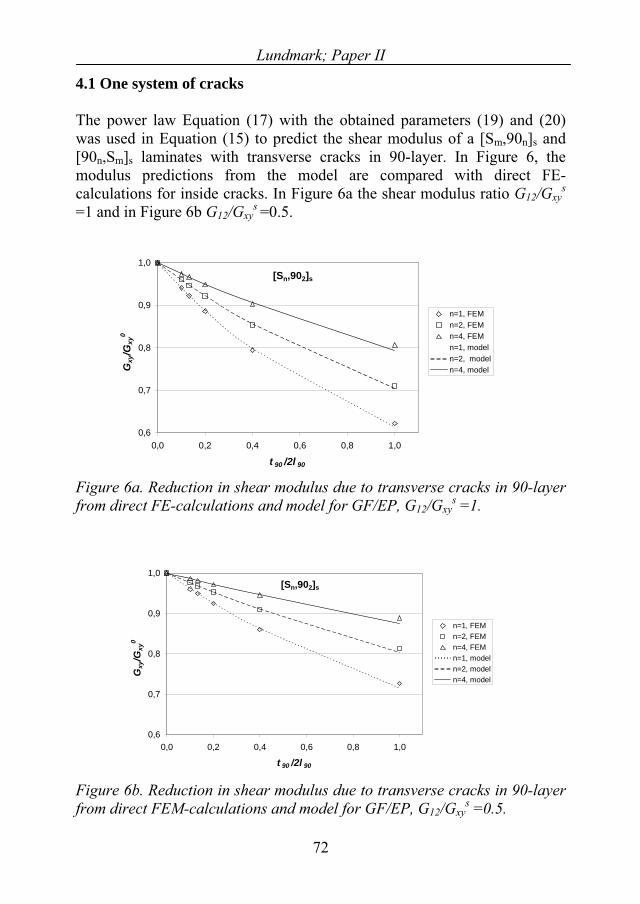
Lundmark; Paper II
4.1 One system of cracks
The power law Equation (17) with the obtained parameters (19) and (20) was used in Equation (15) to predict the shear modulus of a [Sm,90n]s and [90n,Sm]s laminates with transverse cracks in 90-layer. In Figure 6, the modulus predictions from the model are compared with direct FE-calculations for inside cracks. In Figure 6a the shear modulus ratio G12/Gxy
s
=1 and in Figure 6b G12/Gxys =0.5.
[Sn,902]s
0,6
0,7
0,8
0,9
1,0
0,0 0,2 0,4 0,6 0,8 1,0
t 90 /2l 90
Gxy
/Gxy
0
n=1, FEMn=2, FEMn=4, FEMn=1, modeln=2, modeln=4, model
Figure 6a. Reduction in shear modulus due to transverse cracks in 90-layer from direct FE-calculations and model for GF/EP, G12/Gxy
s =1.
[Sn,902]s
0,6
0,7
0,8
0,9
1,0
0,0 0,2 0,4 0,6 0,8 1,0
t 90 /2l 90
Gxy
/Gxy
0
n=1, FEMn=2, FEMn=4, FEMn=1, modeln=2, modeln=4, model
Figure 6b. Reduction in shear modulus due to transverse cracks in 90-layer from direct FEM-calculations and model for GF/EP, G12/Gxy
s =0.5.
72
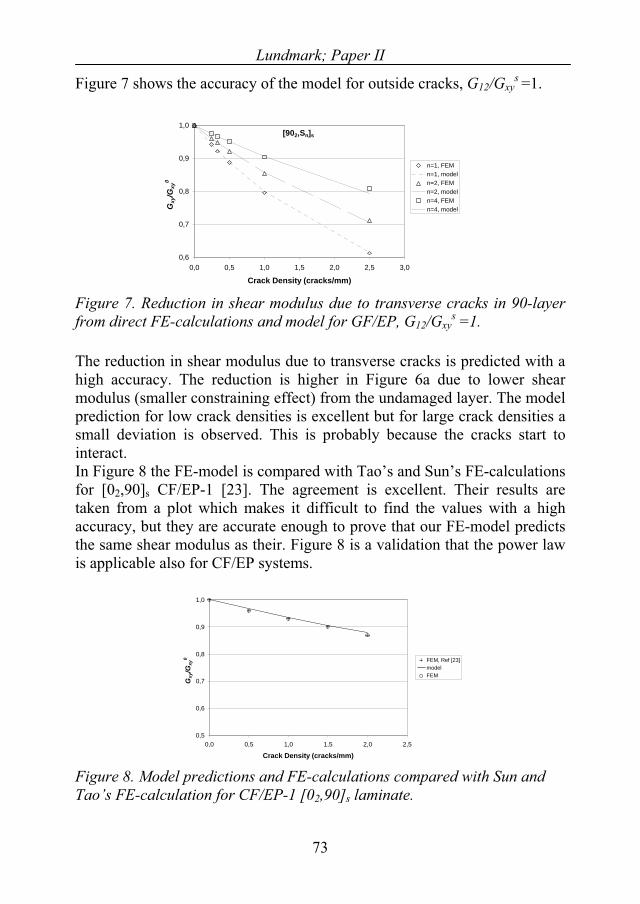
Lundmark; Paper II
Figure 7 shows the accuracy of the model for outside cracks, G12/Gxys =1.
[902,Sn]s
0,6
0,7
0,8
0,9
1,0
0,0 0,5 1,0 1,5 2,0 2,5 3,0
Crack Density (cracks/mm)
Gxy
/Gxy
0n=1, FEMn=1, modeln=2, FEMn=2, modeln=4, FEMn=4, model
Figure 7. Reduction in shear modulus due to transverse cracks in 90-layer from direct FE-calculations and model for GF/EP, G12/Gxy
s =1.
The reduction in shear modulus due to transverse cracks is predicted with a high accuracy. The reduction is higher in Figure 6a due to lower shear modulus (smaller constraining effect) from the undamaged layer. The model prediction for low crack densities is excellent but for large crack densities a small deviation is observed. This is probably because the cracks start to interact. In Figure 8 the FE-model is compared with Tao’s and Sun’s FE-calculations for [02,90]s CF/EP-1 [23]. The agreement is excellent. Their results are taken from a plot which makes it difficult to find the values with a high accuracy, but they are accurate enough to prove that our FE-model predicts the same shear modulus as their. Figure 8 is a validation that the power law is applicable also for CF/EP systems.
0,5
0,6
0,7
0,8
0,9
1,0
0,0 0,5 1,0 1,5 2,0 2,5
Crack Density (cracks/mm)
Gxy
/Gxy
0 FEM, Ref [23]modelFEM
Figure 8. Model predictions and FE-calculations compared with Sun and Tao’s FE-calculation for CF/EP-1 [02,90]s laminate.
73
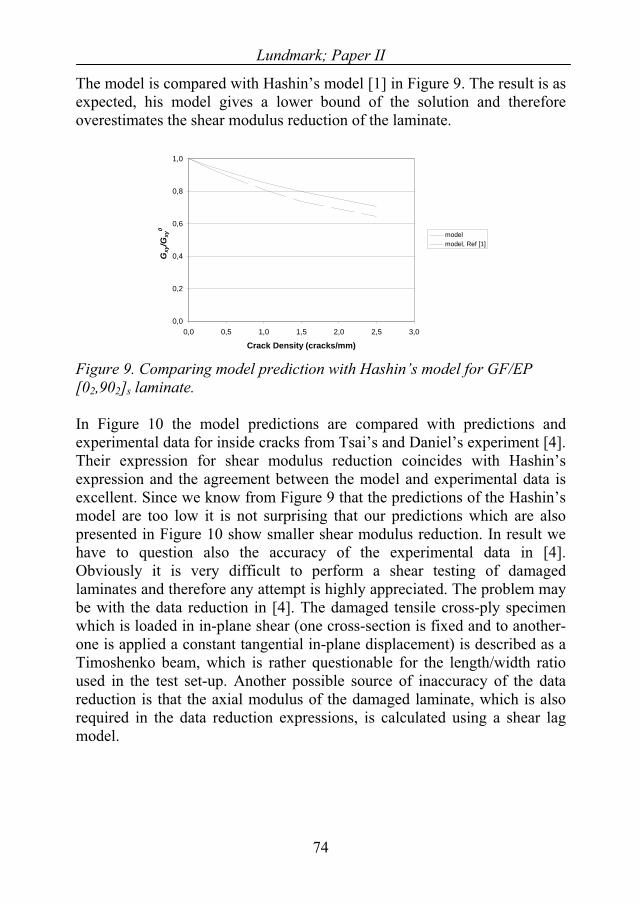
Lundmark; Paper II
The model is compared with Hashin’s model [1] in Figure 9. The result is as expected, his model gives a lower bound of the solution and therefore overestimates the shear modulus reduction of the laminate.
0,0
0,2
0,4
0,6
0,8
1,0
0,0 0,5 1,0 1,5 2,0 2,5 3,0
Crack Density (cracks/mm)
Gxy
/Gxy
0
modelmodel, Ref [1]
Figure 9. Comparing model prediction with Hashin’s model for GF/EP [02,902]s laminate.
In Figure 10 the model predictions are compared with predictions and experimental data for inside cracks from Tsai’s and Daniel’s experiment [4]. Their expression for shear modulus reduction coincides with Hashin’s expression and the agreement between the model and experimental data is excellent. Since we know from Figure 9 that the predictions of the Hashin’s model are too low it is not surprising that our predictions which are also presented in Figure 10 show smaller shear modulus reduction. In result we have to question also the accuracy of the experimental data in [4]. Obviously it is very difficult to perform a shear testing of damaged laminates and therefore any attempt is highly appreciated. The problem may be with the data reduction in [4]. The damaged tensile cross-ply specimen which is loaded in in-plane shear (one cross-section is fixed and to another-one is applied a constant tangential in-plane displacement) is described as a Timoshenko beam, which is rather questionable for the length/width ratio used in the test set-up. Another possible source of inaccuracy of the data reduction is that the axial modulus of the damaged laminate, which is also required in the data reduction expressions, is calculated using a shear lag model.
74
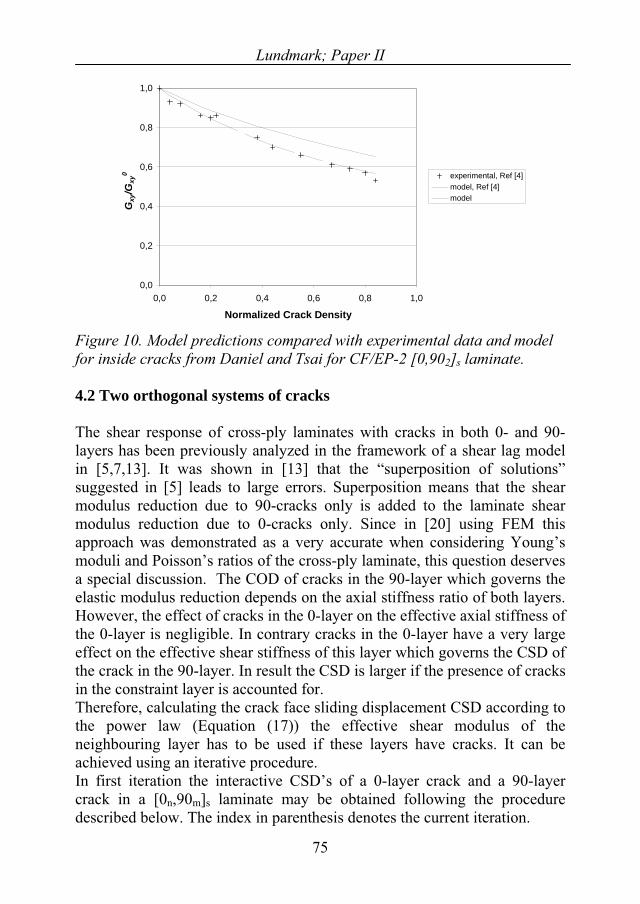
Lundmark; Paper II
0,0
0,2
0,4
0,6
0,8
1,0
0,0 0,2 0,4 0,6 0,8 1,0
Normalized Crack Density
Gxy
/Gxy
0 experimental, Ref [4]model, Ref [4]model
Figure 10. Model predictions compared with experimental data and model for inside cracks from Daniel and Tsai for CF/EP-2 [0,902]s laminate.
4.2 Two orthogonal systems of cracks
The shear response of cross-ply laminates with cracks in both 0- and 90-layers has been previously analyzed in the framework of a shear lag model in [5,7,13]. It was shown in [13] that the “superposition of solutions” suggested in [5] leads to large errors. Superposition means that the shear modulus reduction due to 90-cracks only is added to the laminate shear modulus reduction due to 0-cracks only. Since in [20] using FEM this approach was demonstrated as a very accurate when considering Young’s moduli and Poisson’s ratios of the cross-ply laminate, this question deserves a special discussion. The COD of cracks in the 90-layer which governs the elastic modulus reduction depends on the axial stiffness ratio of both layers. However, the effect of cracks in the 0-layer on the effective axial stiffness of the 0-layer is negligible. In contrary cracks in the 0-layer have a very large effect on the effective shear stiffness of this layer which governs the CSD of the crack in the 90-layer. In result the CSD is larger if the presence of cracks in the constraint layer is accounted for. Therefore, calculating the crack face sliding displacement CSD according to the power law (Equation (17)) the effective shear modulus of the neighbouring layer has to be used if these layers have cracks. It can be achieved using an iterative procedure. In first iteration the interactive CSD’s of a 0-layer crack and a 90-layer crack in a [0n,90m]s laminate may be obtained following the procedure described below. The index in parenthesis denotes the current iteration.
75
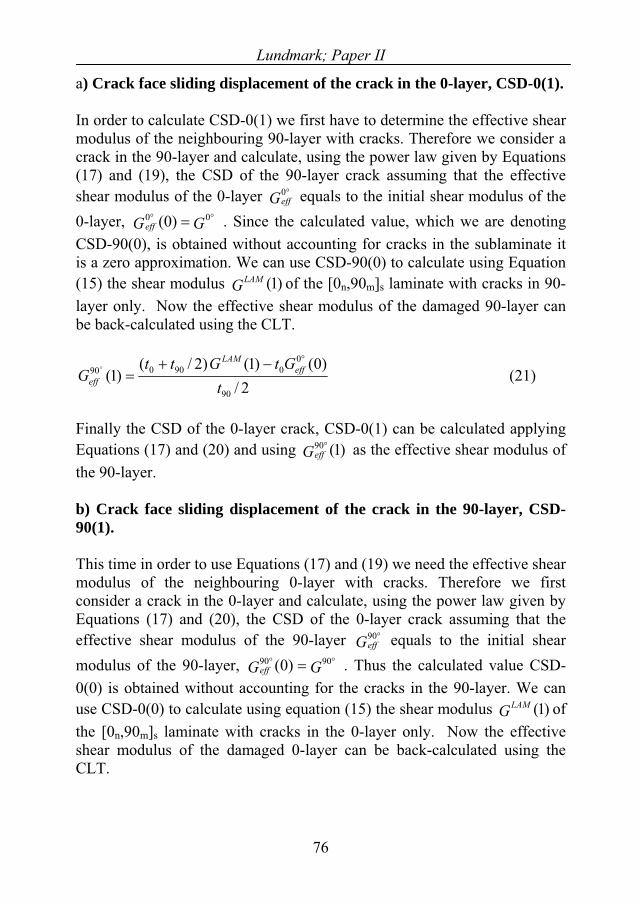
Lundmark; Paper II
a) Crack face sliding displacement of the crack in the 0-layer, CSD-0(1).
In order to calculate CSD-0(1) we first have to determine the effective shear modulus of the neighbouring 90-layer with cracks. Therefore we consider a crack in the 90-layer and calculate, using the power law given by Equations (17) and (19), the CSD of the 90-layer crack assuming that the effective shear modulus of the 0-layer G equals to the initial shear modulus of the 0-layer, . Since the calculated value, which we are denoting CSD-90(0), is obtained without accounting for cracks in the sublaminate it is a zero approximation. We can use CSD-90(0) to calculate using Equation (15) the shear modulus of the [0
eff0
GGeff0 )0( 0
)1(GLAMn,90m]s laminate with cracks in 90-
layer only. Now the effective shear modulus of the damaged 90-layer can be back-calculated using the CLT.
2/)0()1()2/(
)1(90
0090090
tGtGtt
G effLAM
eff (21)
Finally the CSD of the 0-layer crack, CSD-0(1) can be calculated applying Equations (17) and (20) and using as the effective shear modulus of the 90-layer.
)1(90Geff
b) Crack face sliding displacement of the crack in the 90-layer, CSD-90(1).
This time in order to use Equations (17) and (19) we need the effective shear modulus of the neighbouring 0-layer with cracks. Therefore we first consider a crack in the 0-layer and calculate, using the power law given by Equations (17) and (20), the CSD of the 0-layer crack assuming that the effective shear modulus of the 90-layer G equals to the initial shear modulus of the 90-layer, . Thus the calculated value CSD-0(0) is obtained without accounting for the cracks in the 90-layer. We can use CSD-0(0) to calculate using equation (15) the shear modulus ofthe [0
eff90
GGeff9090 )0(
)1(GLAM
n,90m]s laminate with cracks in the 0-layer only. Now the effective shear modulus of the damaged 0-layer can be back-calculated using the CLT.
76
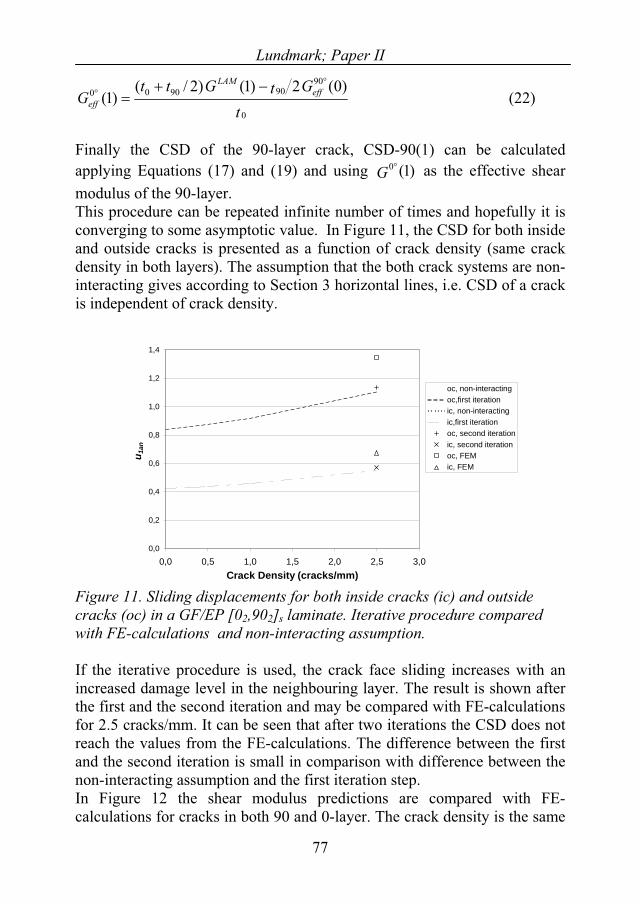
Lundmark; Paper II
tGtGtt
G effLAM
eff0
90909000 )0(2)1()2/(
)1( (22)
Finally the CSD of the 90-layer crack, CSD-90(1) can be calculated applying Equations (17) and (19) and using G as the effective shear modulus of the 90-layer.
)1(0
This procedure can be repeated infinite number of times and hopefully it is converging to some asymptotic value. In Figure 11, the CSD for both inside and outside cracks is presented as a function of crack density (same crack density in both layers). The assumption that the both crack systems are non-interacting gives according to Section 3 horizontal lines, i.e. CSD of a crack is independent of crack density.
0,0
0,2
0,4
0,6
0,8
1,0
1,2
1,4
0,0 0,5 1,0 1,5 2,0 2,5 3,0Crack Density (cracks/mm)
u 1an
oc, non-interactingoc,first iterationic, non-interactingic,first iterationoc, second iterationic, second iterationoc, FEMic, FEM
Figure 11. Sliding displacements for both inside cracks (ic) and outside cracks (oc) in a GF/EP [02,902]s laminate. Iterative procedure compared with FE-calculations and non-interacting assumption.
If the iterative procedure is used, the crack face sliding increases with an increased damage level in the neighbouring layer. The result is shown after the first and the second iteration and may be compared with FE-calculations for 2.5 cracks/mm. It can be seen that after two iterations the CSD does not reach the values from the FE-calculations. The difference between the first and the second iteration is small in comparison with difference between the non-interacting assumption and the first iteration step.In Figure 12 the shear modulus predictions are compared with FE-calculations for cracks in both 90 and 0-layer. The crack density is the same
77
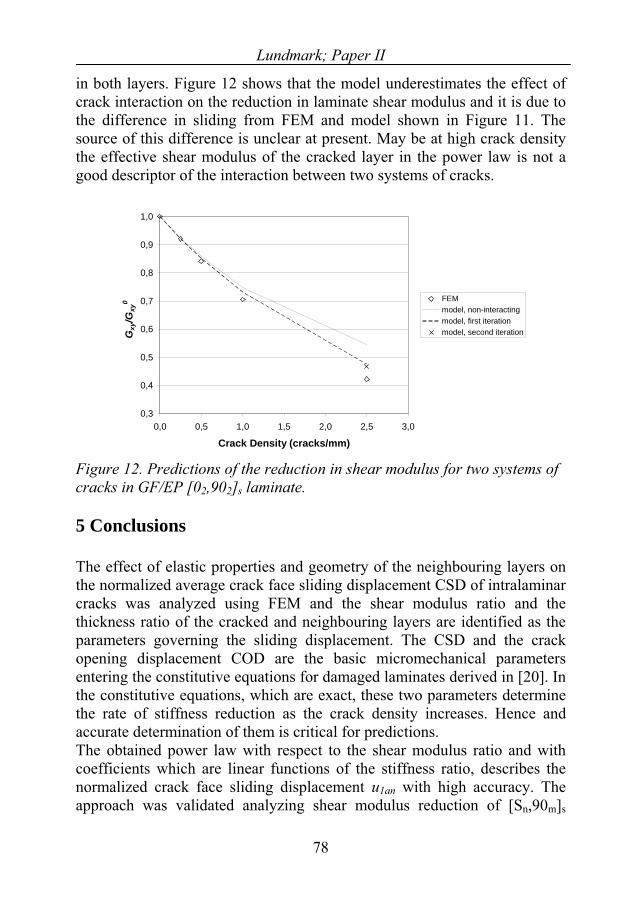
Lundmark; Paper II
in both layers. Figure 12 shows that the model underestimates the effect of crack interaction on the reduction in laminate shear modulus and it is due to the difference in sliding from FEM and model shown in Figure 11. The source of this difference is unclear at present. May be at high crack density the effective shear modulus of the cracked layer in the power law is not a good descriptor of the interaction between two systems of cracks.
0,3
0,4
0,5
0,6
0,7
0,8
0,9
1,0
0,0 0,5 1,0 1,5 2,0 2,5 3,0
Crack Density (cracks/mm)
Gxy
/Gxy
0 FEMmodel, non-interactingmodel, first iterationmodel, second iteration
Figure 12. Predictions of the reduction in shear modulus for two systems of cracks in GF/EP [02,902]s laminate.
5 Conclusions
The effect of elastic properties and geometry of the neighbouring layers on the normalized average crack face sliding displacement CSD of intralaminar cracks was analyzed using FEM and the shear modulus ratio and the thickness ratio of the cracked and neighbouring layers are identified as the parameters governing the sliding displacement. The CSD and the crack opening displacement COD are the basic micromechanical parameters entering the constitutive equations for damaged laminates derived in [20]. In the constitutive equations, which are exact, these two parameters determine the rate of stiffness reduction as the crack density increases. Hence and accurate determination of them is critical for predictions. The obtained power law with respect to the shear modulus ratio and with coefficients which are linear functions of the stiffness ratio, describes the normalized crack face sliding displacement u1an with high accuracy. The approach was validated analyzing shear modulus reduction of [Sn,90m]s
78
Lundmark; Paper II
79
laminates and comparing with FEM results. It was also demonstrated that the model developed by Hashin for shear modulus of cross-ply laminates with cracks in 90-layer predicts too large stiffness reduction, which is consistent with the principle of minimum complementary energy using in derivation. Several other approximate models [2-6] lead to identical expression as Hashin’s model and, hence, their predictions have the same problem. Since the experimental data in [4] are in a perfect agreement with these models these test data (or may be the data reduction method) must be considered with a caution and they should not be used for validation of models. For cross-ply laminates with two orthogonal systems of cracks, the model predictions are compared with FE-calculation. The model underestimates the reduction in shear modulus. It was found that the interaction between the two crack systems is not affecting the crack opening displacement but it is significantly affecting the sliding displacement. The interaction may be accounted for by modifying the power law using the effective shear modulus of the neighbouring layer instead of the initial shear modulus. Nevertheless, the predictions in the high crack density region still require improvement.
Acknowledgements
The authors would like to thank the Swedish National Graduate School of Space Technology for financial support.
6 References
1. Hashin Z. Analysis of cracked laminates: a variational approach.Mech of Mater, North-Holland 1985;4:121-136.
2. Nuismer RJ, Tan SC. Constitutive relations of a cracked composite lamina. J Comp Mater, 1988;22:306-321.
3. Tan SC, Nuismer RJ. A theory for progressive matrix cracking in composite laminates, J Comp Mater, 1989;23:1029-1047.
4. Tsai CL, Daniel IM. The behaviour of cracked cross-ply composite laminates under shear loading. Int J Sol Struct. 1992;29(24):3251-3267.
5. Tsai CL, Daniel IM, Lee JW. Progressive matrix cracking of crossply composite laminates under biaxial loading. In: Microcracking-Induced Damage in Composites, Ed G.J. Dvorak and D.C. Lagoudas. Proc. Of ASME: 1990 Winter Annual Meeting. AMD-vol.111, MD-vol. 22. pp.9-18. ASME, New York.
Lundmark; Paper II
80
6. Abdelrahman WG, Nayfeh AH. Stress Transfer and stiffness reduction in orthogonally cracked laminates, Mech of Mater, 1999; 31:303-316.
7. Henaff-Gardin C, Lafarie-Frenot MC, Gamby D. Doubly periodic matrix cracking in composite laminates Part 1: General in-plane loading, Comp Struct, 1996;36:113-130.
8. Herakovich CT, Aboudi J, Lee SW, Strauss EA. Damage in composite laminates: effects of transverse cracks, Mech of Mater, 1988; 7: 91-107.
9. Hua Yu, Wang Xingguo, Li Zhengneng, He Qingzhi, Property degradation of anisotropic composite laminates with matrix cracking. Part I: Development of constitutive relations for ( m/90n)scracked laminates by stiffness partition, J Reinf Plast and Comp, 1996;15:1146-1160.
10. Jinghong Fan, Junqian Zhang, In-situ damage evolution and micro/macro transition for laminated composites, Comp Sci Technol, 1993;47:107-118.
11. Horii H, Nemat-Nasser S. Overall moduli of solids with microcracks: Load induced anisotropy. J Mech Phys Solids, 1980;31:155-177.
12. Zhang J, Fan J, Soutis C. Analysis of multiple matrix cracking in [± m/90n]s composite laminates. Part 1. In-plane stiffness properties, Composites, 1992;23(5): 291-304.
13. Kashtalyan M, Soutis C. Stiffness degradation in cross-ply laminates damaged by transverse cracking and splitting, Composites Part A: 2000;31:335-351.
14. Kashtalyan M, Soutis C. Mechanisms of internal damage and their effect on the behavior and properties of cross-ply composite laminates, Int Appl Mech, 2002;38(6): 641-657.
15. Gudmundson P, Östlund S. First order analysis of stiffness reduction due to matrix cracking. J Comp Mater 1992;26:1009-30.
16. Gudmundson P, Zang W. A universal model for thermoelastic properties of macro cracked composite laminates. Int J Sol Struct 1993;30:3211-31.
17. Dvorak GJ, Laws N, Hejazi M. Analysis of progressive matrix cracking in composite laminates I. Thermoelastic properties of a ply with cracks, J Comp Mater, 1985;19: 216-234.
18. Varna, J. Effective properties of damaged laminated composites reinforced with continues UD fibers. Proceedings of the 10th
European Conference on Composite Materials, Brugge, Belgium, paper 270, 2002.

Lundmark; Paper II
81
19. Lundmark P, Varna J. Modeling thermo-mechanical properties of damaged laminates. Key Eng Mater, 2003;251-252:381-387.
20. Lundmark P, Varna, J. Constitutive relationships for damaged laminate in in-plane loading. Int J Dam Mech, 2005, in press.
21. Joffe R, Krasnikovs A, Varna J. COD-based simulation of transverse cracking and stiffness reduction in [S/90n]s laminates. Comp Sci Technol, 2001;61:637-656.
22. Allen, DH, Yoon, C. Homogenization techniques for thermo-viscoelastic solids containing cracks. Int J Sol Struct, 1998;35(31-32):4035- 4053.
23. Tao JX, Sun CT. Effect of matrix cracking on stiffness of composite laminates. Mech Comp Mater and Struct, 1996;3:225-239.


Lundmark; Paper III
83
PAPER III

Lundmark; Paper III
85
Damage evolution and characterisation of crack types in CF/EP laminates loaded at low temperatures
P. LUNDMARK1 AND J. VARNA2*Luleå University of Technology
SE-97187 Luleå, Sweden1 tel:+46920491770, fax:+46491084, [email protected]
2 tel:+46920491649, fax:+46491084, [email protected]
Submitted to Engineering Fracture Mechanics
AbstractTensile testing of CF/EP AS4/8552 cross-ply laminates at room (RT) and cryogenic (around -150˚C) temperatures has been performed to study the effect of the temperature on the damage (intralaminar cracking) evolution. Microscopy studies of the specimen edges showed a significant difference in damage pattern for the two different temperatures. At the low temperature (LT), more complex crack types that could not be found in specimens tested at the RT were obtained. The effect of these crack types on the tensile modulus of the laminate was studied by FEM. In stiffness modelling each of them was replaced by an “effective” normal (straight) crack with “effective” crack opening displacement (COD) leading to the same reduction in laminate stiffness. A crack efficiency factor was introduced to characterize the significance of complex crack shapes for stiffness reduction. The reduction of tensile modulus for a laminate damaged at low temperature was measured and compared with model predictions.
Keywords: cryogenic; microcracking; laminate, tensile test; stiffness reduction
* Corresponding author
Lundmark; Paper III
86
1. Introduction
In general, carbon fiber reinforced plastics (CFRPs) have excellent specific stiffness and strength, low thermal conductivity and high dimensional stability. These properties make them to excellent candidates for space applications where low temperatures can be reached and a low weight is desirable. They are for example often used in fuel tanks, antennas and support elements. The space environment differs in many aspects to the conditions at the earth. The temperature can vary in cycles from -150 to 150˚C (depending on the orbit), there are different types of radiation and vacuum. This perhaps not affects the CFRPs in a short time perspective, but the missions last often for 30 years or more. In that long time, the space environment can accelerate the well known microcrack formation that is considered to be the first damage mode in CFRP laminates. These intralaminar cracks develop at rather low stress levels in comparison with the final failure and are increasing in number as the applied load increases until a saturation level is reached. For CFRPs, the cracks do not reduce the tensile stiffness that much due to the stiff load bearing fibers but the coefficients of thermal expansion (CTE), shear modulus and Poisson’s ratio are reduced in a higher extent. Methods to predict the elastic properties of the damaged laminates have been extensively studied during the past 20 years. Most of the early models was only concerning cross-ply laminates with cracks in 90-layer only but more recently, models that can estimate the properties for general symmetric laminates with several systems of cracks, which often is the case, has been developed [1-4]. It is not only the thermo-elastic properties that are of interest for space structures, these cracks can in conjunction with the inter-ply delaminations originating from the tips of these cracks result in an intersecting network of passages that can allow penetration of fuel. Modelling of permeation is studied in [5] and is of interest for construction of the fuel tanks. Stress or strain levels at which these cracks originate and their further evolution is an even more complex task to model [6-9]. This is of big importance since most of the models for prediction of the thermo-elastic properties need the crack density as input parameter. None of the models can be used as a universal model that deals with all kinds of laminates and loadings. The statistical nature of composites together with the time and temperature dependent material properties makes the modelling work extremely difficult. Several experimental studies [10-14] have shown that thermal cycling without applying any mechanical loads can be enough for crack development. The primary reason for this is the thermal stresses caused by the mismatch in CTE for the different layers. Secondary reasons are
Lundmark; Paper III
87
degradation of the fiber-matrix interface and the embrittlement of the matrix. In [10], equivalent thermal or mechanical cyclic loads were applied to different laminates in order to investigate if there was any difference in crack development for the two loading cases. They found that the ultimate crack density (at saturation) at the edges was the same for both mechanical fatigue and thermal cycling for CF/EP cross-ply laminates. Numerous studies have shown that this saturation level is independent of the loading amplitude, of the mean applied stress and the frequency. For cross-ply laminates, the thermal cycling showed much faster kinetics compared with the mechanical fatigue but that might be related to the difference in test frequency. How temperature-changes and radiations are affecting CFRPs is studied in [14] by Tompkins. He showed that the thermal stability was higher in a thermal cycling environment for woven fabric in comparison with cross-ply laminate fabricated from unidirectional plies. It was shown [14] that the material properties highly affect the crack development. The differences in damage accumulation in cross-ply laminates due to thermal cycling were compared for high modulus brittle epoxy system, a high modulus toughened system and a low modulus brittle epoxy system. After 500 cycles, the low modulus brittle epoxy system had less than one crack per cm, the high modulus toughened system had around 5 cracks/cm and the high modulus brittle epoxy system had almost 10 cracks/cm. The synergistic effects of thermal cycling and radiation were also investigated and the damage accumulation for thermally cycled specimens was compared with specimens that were exposed to irradiation followed by thermal cycling. The result showed a significant increase in crack density for all materials tested. This is attributed to radiation-induced embrittlement of the matrix. The tensile stiffness and strength was measured for the two types (thermal cycling or radiation followed by thermal cycling) of specimens and the reduction in properties was significantly higher for the specimens that were exposed to radiation and thermal cycling. Since a 30 year mission corresponds to 175.000 90-minutes cycles, a real time testing is impractical. Tompkins [14] therefore developed an accelerated testing technique to verify material life assessment and prediction methodologies. The temperature effect on the damage accumulation in quasi-isotropic CFRP when thermal cycling is not considered is studied in [15] and the properties of a UD-layer for three different temperatures were obtained experimentally. Not unexpected, the measurements showed that the matrix-dependent properties are the ones that are changing the most. They also compared how the three different testing temperatures affected the crack density. The result was that the crack density was highest in the tensile tests at the lowest temperature. However, that was not the case for the
Lundmark; Paper III
delamination area at the layer interfaces. They also applied a three-dimensional finite element method to investigate the relationship between the stresses and damage behaviour at various temperatures. In the present work the combined effect of mechanical and thermal loading on damage development was investigated experimentally, by subjecting AS4/8552 [02,904]s specimens to tensile testing while being cooled down in a climate chamber. The specimen edges and surfaces of cuts parallel to the loading direction were examined in a microscope in order to determine the crack density in the 90-layer corresponding to different applied mechanical stress levels. Comparison has been made to tensile tests at room temperature to see if the damage pattern and the crack density are affected by the testing temperature. The different crack types found were categorised and FE-calculations have been performed varying the lay-ups and the material systems (GF/EP and CF/EP) in order to investigate how each crack type affects the elastic modulus of the laminate. The idea is to replace the complex crack shapes observed at low temperatures by effective “normal” cracks with an “effective” COD for each crack type. The model developed in [4] was used to back calculate the “effective” crack opening displacement (COD) of an effective “normal” crack for each given damage pattern and laminate configuration. The stiffness reduction due to mechanical and thermal loading was experimentally investigated and compared with model prediction using the introduced crack efficiency factor.
2. Experimental procedures
A composite laminate of dimensions 3024 cm with lay-up [02,904]s was manufactured using AS4/8552 CF/EP prepreg tape. Eleven specimens with dimensions mm were cut out and tabs were glued to the ends in order to minimize stress concentrations at the grips during tensile testing. The specimen edges were polished, using diamond suspension with 3 mparticles in the last step. To start with, 5 specimens were used for damage evolution in room temperature (RT). Five different stress levels were reached for each specimen and both edges were examined in a microscope after each of them. No strains were measured, only force and distance between the grips. The cross-head speed was set to 0.025 mm/s. Five of the remaining specimens were used for damage evolution at the lower temperature (LT). A small climate chamber was built using two concentric cylindrical tubes, see Fig. 1, in order to avoid that the liquid nitrogen (LN) and the specimens were in contact. The domain between the two cylindrical
10230
88
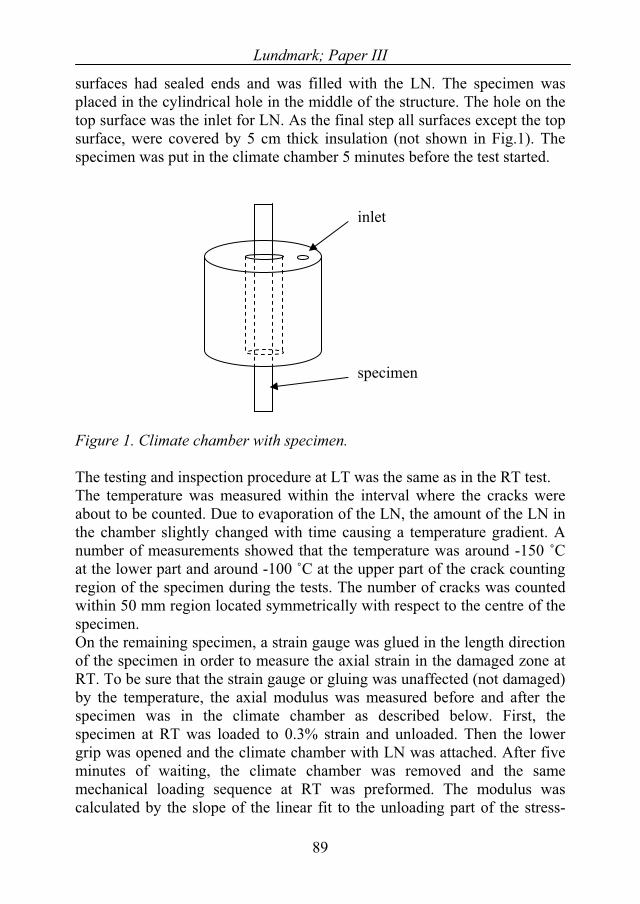
Lundmark; Paper III
surfaces had sealed ends and was filled with the LN. The specimen was placed in the cylindrical hole in the middle of the structure. The hole on the top surface was the inlet for LN. As the final step all surfaces except the top surface, were covered by 5 cm thick insulation (not shown in Fig.1). The specimen was put in the climate chamber 5 minutes before the test started.
inlet
specimen
Figure 1. Climate chamber with specimen.
The testing and inspection procedure at LT was the same as in the RT test. The temperature was measured within the interval where the cracks were about to be counted. Due to evaporation of the LN, the amount of the LN in the chamber slightly changed with time causing a temperature gradient. A number of measurements showed that the temperature was around -150 ˚Cat the lower part and around -100 ˚C at the upper part of the crack counting region of the specimen during the tests. The number of cracks was counted within 50 mm region located symmetrically with respect to the centre of the specimen.On the remaining specimen, a strain gauge was glued in the length direction of the specimen in order to measure the axial strain in the damaged zone at RT. To be sure that the strain gauge or gluing was unaffected (not damaged) by the temperature, the axial modulus was measured before and after the specimen was in the climate chamber as described below. First, the specimen at RT was loaded to 0.3% strain and unloaded. Then the lower grip was opened and the climate chamber with LN was attached. After five minutes of waiting, the climate chamber was removed and the same mechanical loading sequence at RT was preformed. The modulus was calculated by the slope of the linear fit to the unloading part of the stress-
89
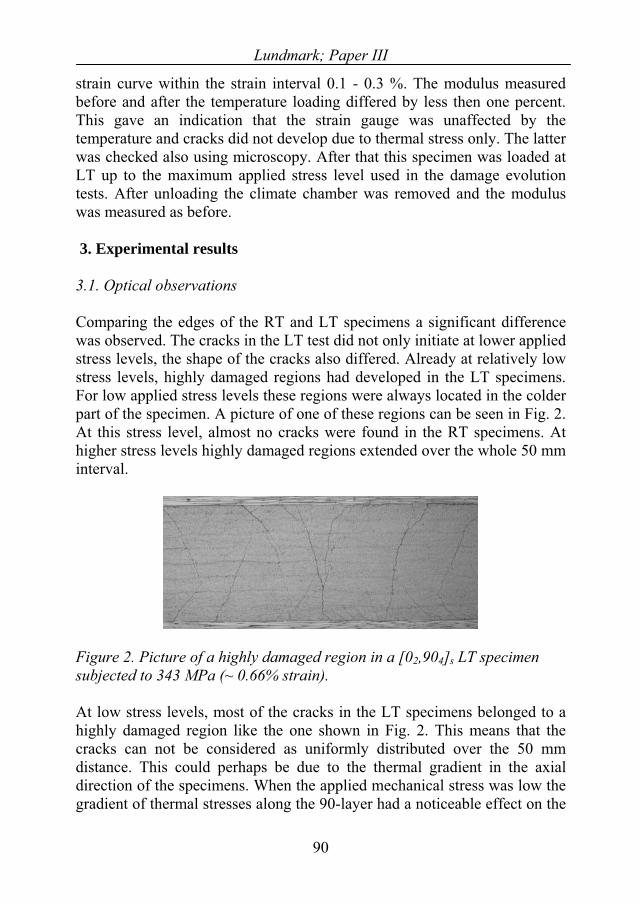
Lundmark; Paper III
strain curve within the strain interval 0.1 - 0.3 %. The modulus measured before and after the temperature loading differed by less then one percent. This gave an indication that the strain gauge was unaffected by the temperature and cracks did not develop due to thermal stress only. The latter was checked also using microscopy. After that this specimen was loaded at LT up to the maximum applied stress level used in the damage evolution tests. After unloading the climate chamber was removed and the modulus was measured as before.
3. Experimental results
3.1. Optical observations
Comparing the edges of the RT and LT specimens a significant difference was observed. The cracks in the LT test did not only initiate at lower applied stress levels, the shape of the cracks also differed. Already at relatively low stress levels, highly damaged regions had developed in the LT specimens. For low applied stress levels these regions were always located in the colder part of the specimen. A picture of one of these regions can be seen in Fig. 2. At this stress level, almost no cracks were found in the RT specimens. At higher stress levels highly damaged regions extended over the whole 50 mm interval.
Figure 2. Picture of a highly damaged region in a [02,904]s LT specimen subjected to 343 MPa (~ 0.66% strain).
At low stress levels, most of the cracks in the LT specimens belonged to a highly damaged region like the one shown in Fig. 2. This means that the cracks can not be considered as uniformly distributed over the 50 mm distance. This could perhaps be due to the thermal gradient in the axial direction of the specimens. When the applied mechanical stress was low the gradient of thermal stresses along the 90-layer had a noticeable effect on the
90

Lundmark; Paper III
total stress variation in the 90-layer and could lead to earlier damage development in the coldest part. At higher applied mechanical stress the constant (mechanical) part of the 90-layer stress becomes larger and the effect of the variation of the thermal stresses on the total stress in the 90-layer becomes less important. Indeed, at higher applied stress levels, cracks developed in the previously not damaged parts of the specimen while the existing cracks seemed to remain intact and were just slowly extending (branching, local delamination etc.). Independent of the applied load the distance between cracks in this region was not large enough for the stresses to reach the critical value for new large crack initiation. For schematic pictures of observed crack types, see Fig. 3. With normal crack we mean a single straight crack that does not has delta cracks in the tip region. Delta cracks in LT specimens occurred also at much lower stress levels than for the RT specimens. Crack of type A is a normal crack with delta cracks going in approximately 45 degrees. Crack of type B is as a type A crack but with two normal (may be curved) cracks on both sides ( ). Crack type C is as type B but the effect of damage in the middle between the outer cracks is negligible. Crack type D is as type B but the damage in the middle is a normal crack.
tw 90
91
igure 3. Different crack types observed. Fww
crack type C crack
type D
a
a
w
normal crack
cracktype A
cracktype B
t0
t90
0˚ layer
90˚ layer
partial crack
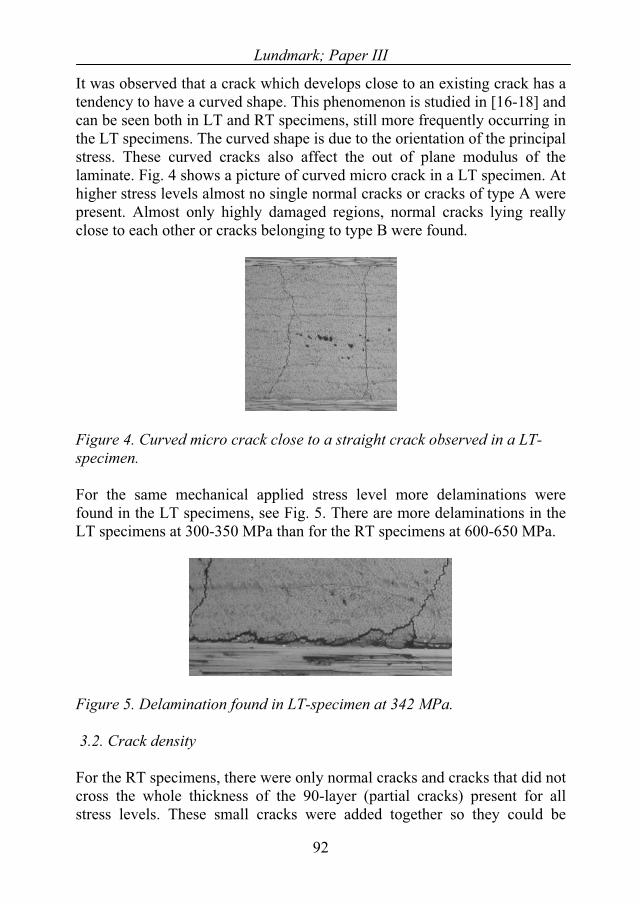
Lundmark; Paper III
It was observed that a crack which develops close to an existing crack has a tendency to have a curved shape. This phenomenon is studied in [16-18] and can be seen both in LT and RT specimens, still more frequently occurring in the LT specimens. The curved shape is due to the orientation of the principal stress. These curved cracks also affect the out of plane modulus of the laminate. Fig. 4 shows a picture of curved micro crack in a LT specimen. At higher stress levels almost no single normal cracks or cracks of type A were present. Almost only highly damaged regions, normal cracks lying really close to each other or cracks belonging to type B were found.
igure 4. Curved micro crack close to a straight crack observed in a LT-
or the same mechanical applied stress level more delaminations were
Fspecimen.
Ffound in the LT specimens, see Fig. 5. There are more delaminations in the LT specimens at 300-350 MPa than for the RT specimens at 600-650 MPa.
igure 5. Delamination found in LT-specimen at 342 MPa.
or the RT specimens, there were only normal cracks and cracks that did not
F
3.2. Crack density
Fcross the whole thickness of the 90-layer (partial cracks) present for all stress levels. These small cracks were added together so they could be
92
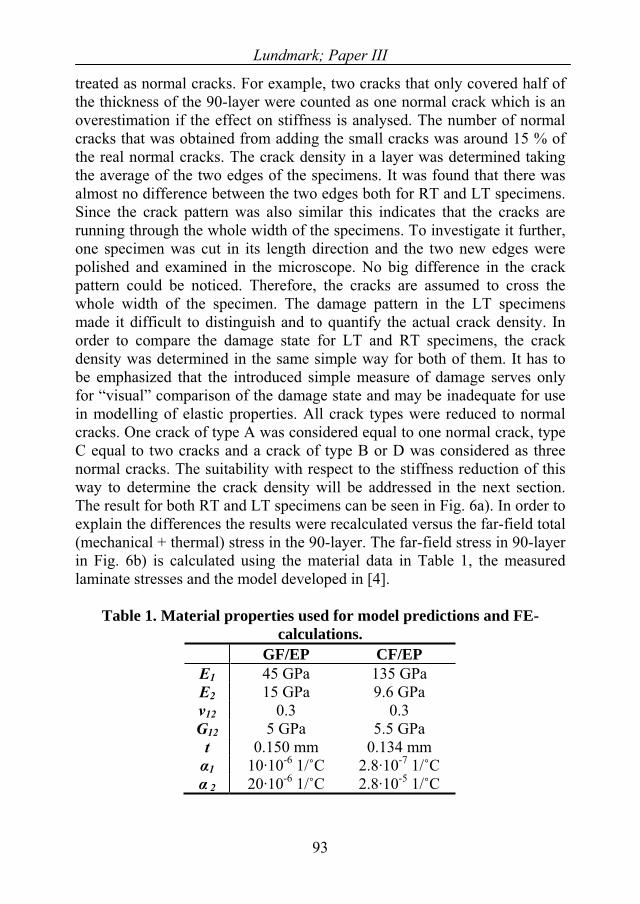
Lundmark; Paper III
93
treated as normal cracks. For example, two cracks that only covered half of the thickness of the 90-layer were counted as one normal crack which is an overestimation if the effect on stiffness is analysed. The number of normal cracks that was obtained from adding the small cracks was around 15 % of the real normal cracks. The crack density in a layer was determined taking the average of the two edges of the specimens. It was found that there was almost no difference between the two edges both for RT and LT specimens. Since the crack pattern was also similar this indicates that the cracks are running through the whole width of the specimens. To investigate it further, one specimen was cut in its length direction and the two new edges were polished and examined in the microscope. No big difference in the crack pattern could be noticed. Therefore, the cracks are assumed to cross the whole width of the specimen. The damage pattern in the LT specimens made it difficult to distinguish and to quantify the actual crack density. In order to compare the damage state for LT and RT specimens, the crack density was determined in the same simple way for both of them. It has to be emphasized that the introduced simple measure of damage serves only for “visual” comparison of the damage state and may be inadequate for use in modelling of elastic properties. All crack types were reduced to normal cracks. One crack of type A was considered equal to one normal crack, type C equal to two cracks and a crack of type B or D was considered as three normal cracks. The suitability with respect to the stiffness reduction of this way to determine the crack density will be addressed in the next section. The result for both RT and LT specimens can be seen in Fig. 6a). In order to explain the differences the results were recalculated versus the far-field total (mechanical + thermal) stress in the 90-layer. The far-field stress in 90-layer in Fig. 6b) is calculated using the material data in Table 1, the measured laminate stresses and the model developed in [4].
Table 1. Material properties used for model predictions and FE-
GF/EP CF/EP calculations.
E1 45 GPa 135 GPa E2 15 GPa 9.6 GPa
12 0.3 0.3G12 5 GPa 5.5 GPa
t 0.150 mm 0 .134 mm1 1 20·10-6 1/˚C .8·10-7 1/˚C 2 20·10-6 1/˚C 2.8·10-5 1/˚C
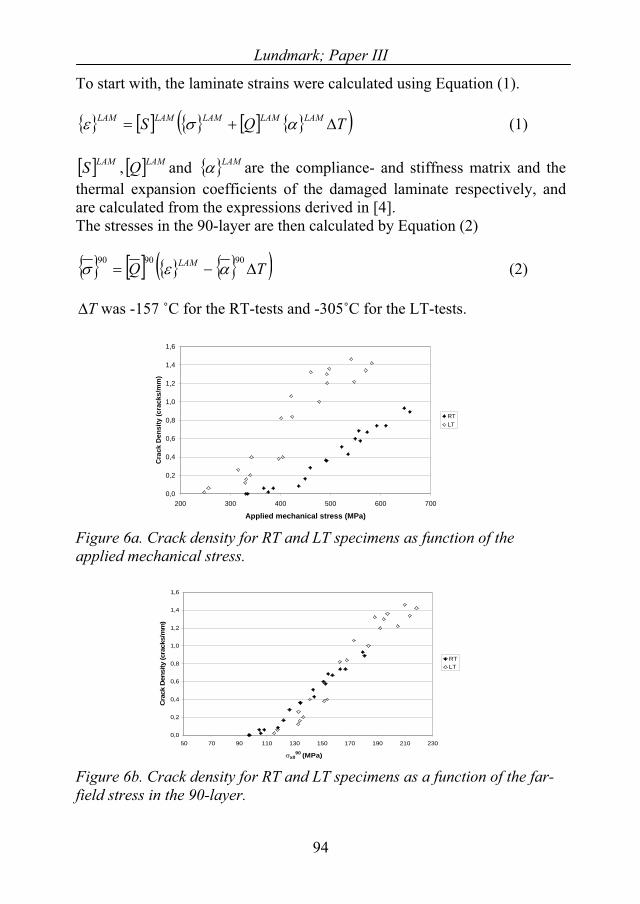
Lundmark; Paper III
To start with, the laminate strains were calculated using Equation (1).
TQS LAMLAMLAMLAMLAM (1)
LAM are the compliance- and stiffness matrix and the therma expansion coeffic
quation (2)
LAMS , Q and LAM
l ients of the damaged laminate respectively, and are calculated from the expressions derived in [4]. The stresses in the 90-layer are then calculated by E
94
TQ LAM 909090 (2)
T was -157 ˚C for the RT-tests and -305˚C for the LT-tests.
0,0
0,2
0,4
0,6
0,8
1,0
1,2
1,4
1,6
200 300 400 500 600 700
Applied mechanical stress (MPa)
Cra
ck D
ensi
ty (c
rack
s/m
m)
RTLT
Figure 6a. Crack density for RT and LT specimens as function of the applied mechanical stress.
0,0
0,2
0,4
0,6
0,8
1,0
1,2
1,4
1,6
50 70 90 110 130 150 170 190 210 230
x090 (MPa)
Cra
ck D
ensi
ty (c
rack
s/m
m)
RTLT
Figure 6b. Crack density for RT and LT specimens as a function of the far-field stress in the 90-layer.
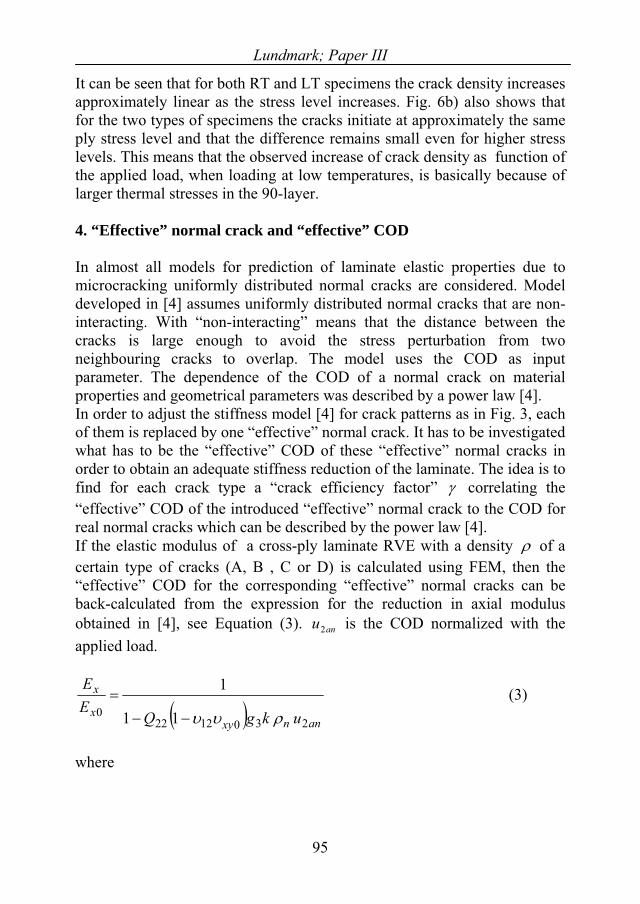
Lundmark; Paper III
It can be seen that for both RT and LT specimens the crack density increases
. “Effective” normal crack and “effective” COD
almost all models for prediction of laminate elastic properties due to
h
approximately linear as the stress level increases. Fig. 6b) also shows that for the two types of specimens the cracks initiate at approximately the same ply stress level and that the difference remains small even for higher stress levels. This means that the observed increase of crack density as function of the applied load, when loading at low temperatures, is basically because of larger thermal stresses in the 90-layer.
4
Inmicrocracking uniformly distributed normal cracks are considered. Model developed in [4] assumes uniformly distributed normal cracks that are non-interacting. With “non-interacting” means that the distance between the cracks is large enough to avoid the stress perturbation from two neighbouring cracks to overlap. The model uses the COD as input parameter. The dependence of the COD of a normal crack on material properties and geometrical parameters was described by a power law [4].In order to adjust the stiffness model [4] for crack patterns as in Fig. 3, eacof them is replaced by one “effective” normal crack. It has to be investigated what has to be the “effective” COD of these “effective” normal cracks in order to obtain an adequate stiffness reduction of the laminate. The idea is to find for each crack type a “crack efficiency factor” correlating the “effective” COD of the introduced “effective” normal crack to the COD for real normal cracks which can be described by the power law [4]. If the elastic modulus of a cross-ply laminate RVE with a density of acertain type of cracks (A, B , C or D) is calculated using FEM, then the “effective” COD for the corresponding “effective” normal cracks can be back-calculated from the expression for the reduction in axial modulus obtained in [4], see Equation (3). anu2 is the COD normalized with the applied load.
annxyx
x
ukgQEE
23012220 11
1 (3)
herew
95

Lundmark; Paper III
1190
22011
9012012
120
903
2
22
StStS
tStSS
tt
g (4)
01190
2290
11
2
01290
12
9011
022
01
902
22
2
2
14
1
tStStS
tStS
tS
tStE
tEk
(5)
Back calculating the normalized average opening displacement from Equation (3) gives the expression that is used in following together with the FE-calculations to determine the “effective” COD.
n
0xy 22Q
E1
xy
x
an kgQEx
Eu
30
1222
0
2 1
1 (6)
Here and are elastic constants of the undamaged laminate, is lamina stiffness matrix element in local coordinate system and , ,
0xE
E2 12
are engineering constants of the lamina. are elements in the compliance matrix of the lamina in local coordinate system, t and are defined in Fig. 7.
ijS
90 0t
n 90 is the density of the “effective” normal cracks multiplied by t . The
reduction in axial modulus E
Ex
x0 , needed in order to use Equation (6), was
obtained in the FE-calculations for each crack type and for different laminate lay-ups. The geometry used for modelling normal cracks is defined in Fig. 7. For the other crack types, the additional crack surfaces were added.
96
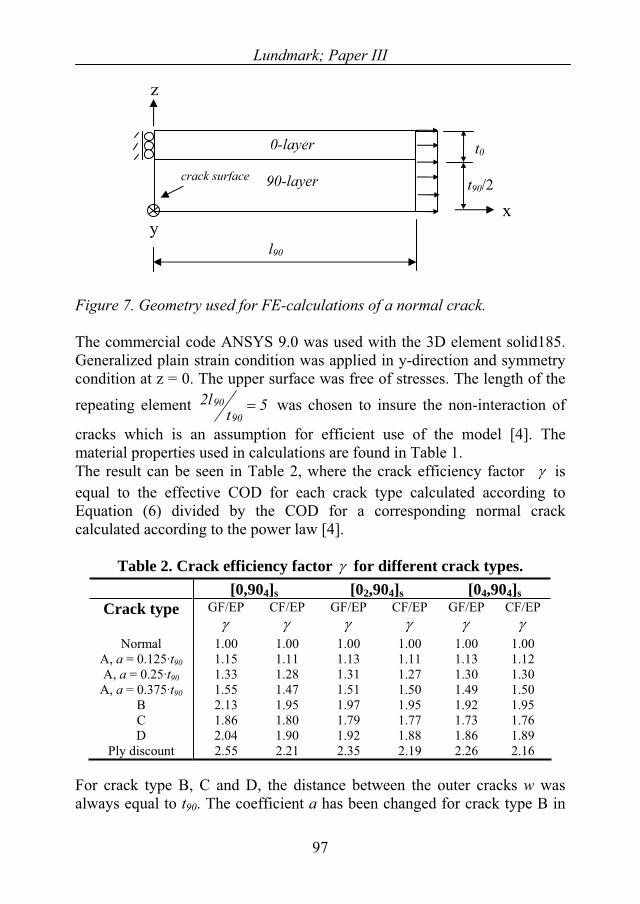
Lundmark; Paper III
z
crack sur
97
Figure 7. Geometry used for FE-calculations of a normal crack.
The commercial code ANSYS 9.0 was used with the 3D element solid185. Generalized plain strain condition was applied in y-direction and symmetry condition at z = 0. The upper surface was free of stresses. The length of the
repeating element 5tl2
9090 was chosen to insure the non-interaction of
cracks which is an assumption for efficient use of the model [4]. The material properties used in calculations are found in Table 1. The result can be seen in Table 2, where the crack efficiency factor is equal to the effective COD for each crack type calculated according to Equation (6) divided by the COD for a corresponding normal crack calculated according to the power law [4].
Table 2. Crack efficiency factor for different crack types. [0,904]s [02,904]s [04,904]s
Crack type GF/EP CF/EP GF/EP CF/EP GF/EP CF/EP
Normal 1.00 1.00 1.00 1.00 1.00 1.00 A, a = 0.125·t90 1.15 1.11 1.13 1.11 1.13 1.12 A, a = 0.25·t90 1.33 1.28 1.31 1.27 1.30 1.30
A, a = 0.375·t90 1.55 1.47 1.51 1.50 1.49 1.50 B 2.13 1.95 1.97 1.95 1.92 1.95 C 1.86 1.80 1.79 1.77 1.73 1.76 D 2.04 1.90 1.92 1.88 1.86 1.89
Ply discount 2.55 2.21 2.35 2.19 2.26 2.16
For crack type B, C and D, the distance between the outer cracks w was always equal to t90. The coefficient a has been changed for crack type B in
xy
l90
t90/2
t00-layer
90-layerface
Lundmark; Paper III
the same way as for crack type A without any affect on . From Table 2 the conclusion can be drawn that neither the material nor the lay-up is effecting the efficiency factor for crack type A, the only important parameter is the geometrical constant a. For crack type B, C and D, the dependence of a,material and lay-up can be neglected except for the non-practical [0,904]s
GF/EP laminate. In “Ply discount” the cracked area ( 90tw ) in type B, C and D cracks is replaced by a material with zero stiffness matrix which is the same as no material at all. It can be seen that the ply discount model overestimates the crack efficiency factor by 10-15% which means that even a highly damaged region still carry some load. One should have in mind that in CF laminates a change of COD by 10 % corresponds to a change in modulus of less than 1 %. The -factor is close to 2 for type B, C and D cracks. This means that in the context of stiffness determination of damaged laminates each crack belonging to these types should be considered as two normal cracks. Type A crack may be considered as normal crack only if the delta crack is small, a < 0.125·t90.In order to validate these conclusions stiffness reduction measurements of a specimen containing different types of cracks were performed experimentally and also predicted using the stiffness reduction model [4] and the crack efficiency factors from Table 2. The part of the edge of the specimen that was underneath the strain gauge region was examined in the microscope in order to investigate the damage state. One type D crack was found, one of type A (a = 0.375) and three of type C. The measured stiffness reduction was 890EE 0
xx . .Stiffness reduction due to evenly distributed equal cracks can be calculated using Equation (3). In this case the product of normalized crack density and COD can be expressed as
uNLtuX ann 290
2 an
Lu an2
(7)
Here is the distance under the gauge, is the number of cracks in this region and is normalized crack opening displacement which for non-interactive cracks may be calculated according to the power law given in [4]. If there are different crack types in the region L, Equation (7) has to be written in the following way.
N
98
Lundmark; Paper III
ian
ii uL
tCODLtX 2
9090i (8)
For the observed damage state, see Table 2,
966.877.1*388.147.1i
i(9)
Now Equation (8) turns to
u an2
an2
Lt9X 90 (10)
which means that the damage state is effectively equal to 9 normal cracks with normal u . Assuming that these normal cracks are non-interactive we can use the power law for . We obtain u an2 830E0
x .Ex which is much more than the experimental. Looking closer to data we see that the density of “effective” normal cracks is 1.29 cr/mm which means that the distance between cracks is 0.78 mmwhereas the crack size equals to mm071t90 . . These numbers prove that cracks are very close and the power law is not applicable. Since analytical expressions that describe the interaction effect on COD are not available at present, we used this geometrical configuration with 9 cracks in FE model where the interaction is automatically accounted for. The FE-calculation shows that we have to use u which is 55 % of the value for non-interactive cracks.
an2
Using this value in Equation (3) and Equation (10) we obtain 880E0x .Ex
which is in an excellent agreement with the measured stiffness reduction. Thus indeed the 9 uniformly distributed normal cracks are affecting the modulus in the same way as the corresponding damage pattern observed in test.
5. Conclusions
The damage evolution in CF/EP AS4/8552 cross-ply laminates subjected to tensile loading was studied. Optical observations showed that a less regular damage pattern had developed in the low temperature tested specimens in comparison with the room temperature tested specimens. At the same mechanical applied load the crack density for the low temperature tested
99
Lundmark; Paper III
100
specimens was higher than for the room temperature tested specimens. Taking the thermal stresses into account showed that there was no statistically significant difference between the two types of specimens if the crack density was plotted as a function of the total far-field stress in the 90-layer. This means that the observed increase of crack density as function of the applied load, when loading at low temperatures, is basically because of larger thermal stresses in the 90-layer. A methodology has been developed to replace cracks with complex geometry by simple cracks with “efficiency factors” for their crack opening displacement. Model developed in [4] with introduced cracks efficiency factors shows good prediction of the reduced modulus of the damaged specimen with complex damage pattern. .Acknowledgements
The authors would like to thank the Swedish National Graduate School in Space Technology for financing the studies.
References
[1] Gudmundson P, Zang W. A universal model for thermoelastic properties of macro cracked composite laminates. Int J Sol Struct, 1993;30:3211-31.
[2] Talreja R. A synergistic damage mechanics approach to durability of composite material systems”, In: Cardon A, Fukuda H, Reifsnider K, editors. Progress in durability analysis of composite systems. Rotterdam: A.A. Balkema, 1996:117- 129
[3] Zhang J, Herrmann K.P. Stiffness degradation induced by multilayer intralaminar cracking in composite laminates. Comp Part A, 1999;30:683-706
[4] Lundmark P, Varna, J. Constitutive relationships for damaged laminate in in-plane loading. Int J Dam Mech, 2005;14:235-259.
[5] Roy S, Benjamin M. Modeling of permeation and damage in graphite/epoxy laminates for cryogenic fuel storage. Comp Sci Tech, 2004;64:2051-2065
Lundmark; Paper III
101
[6] Joffe R, Krasnikovs A, Varna J. COD-based simulation of transverse cracking and stiffness reduction in [S/90n]s laminates. Comp Sci Tech, 2001;61:637-656.
[7] Shojiro Ochiai, Peters P.W.M, Schulte K, Kozo Osamura. Monte-Carlo simulation of multiple fracture in the transverse ply of cross-ply graphite-epoxy laminates. J Mater Sci, 1991;26:5433-5444.
[8] Wang A.S.D, Chou P.C, Lei S.C. A stochastic Model for the Growth of Matrix Cracks in Composite Laminates. J Comp Mater, 1984;18:239-254.
[9] Siulie Liu, Nairn J.A. The Formation and Propagation of Matrix Microcracks in Cross-Ply Laminates during Static Loading. J Reinf Plast, 1992;2:158-178.
[10] Henaff-Gardin C, Lafarie-Frenot M.C. Specificity of matrix cracking development in CFRP laminates under mechanical or thermal loadings. Int J Fatigue, 2002;24:171-177
[11] Kim RY, Crastro A.S, Schoeppner G.A. Dimensional stability of composite in a space thermal environment. Comp Sci Tech, 2000;60:2601-2608
[12] Herakovich C.T, Hyer M.W. Damage-induced property changes in composites subjected to cyclic thermal loading. Eng Fracture Mech, 1986;25:779-791
[13] Kobayashi S, Terada K, Ogihara S, Takeda N. Damage-mechanics analysis of matrix cracking in cross-ply CFRP laminates under thermal fatigue. Comp Sci Tech, 2001;61:1735-1742.
[14] Tompkins S.S. Effect of thermal cycling on composite materials for space structures. NASA Langley Research Center, 1989.
[15] Hyoung Soo Kim, Wen-Xue Wang, Yoshihiro Takao. Evaluation by FEM of temperature-dependent damage behavior in quasi-isotropic carbon/epoxy laminates. Adv Comp Mater, 1999;8:247-257.
[16] Groves S.E, Harris C.E, Highsmith A.L, Allen D.H, Norvell R.G. AN experimental and analytical treatment of matrix cracking in cross-ply

Lundmark; Paper III
102
stiffness loss in cross-ply laminates with curved matrix cracks. J Comp Mater, 1988;22:71-80.
[17] Allen D.H, Harris C.E, Groves S.E, Norvell R.G. Characterization of stiffness loss in cross-ply laminates with curved matrix cracks. J Comp Mater, 1988;22:71-80.
[18] Hu S, Bark J.S, Nairn J.A. On the phenomenon of curved microcracks in [(S)/90n]s laminates: their shapes, initiation angles and locations. Comp Sci Tech, 1993;47:321-329.

Lundmark; Paper IV
103
PAPER IV

Lundmark; Paper IV
105
Stiffness reduction in laminates at high crack density: effect of crack interaction
Peter Lundmark1, Janis Varna2
Luleå University of Technology, SE-97187 Luleå, Sweden [email protected] [email protected] 2 Corresponding author, Fax: +46 920 491084
Submitted to International Journal of Damage Mechanics
ABSTRACT: The previously developed closed form model for thermo-elastic properties of laminates with intralaminar cracks [13] contains crack surface opening and sliding as main microscale parameters. The dependence of these parameters on various material and geometrical characteristics which was described by power laws is valid only for non-interactive cracks corresponding to low crack density. The effect of crack interaction on the crack opening displacement (COD) is discussed in this paper. The effect on COD is described by the introduced “interaction function” which is determined using FE analysis. For the sake of simplicity, its weak dependence on geometrical and material parameters is neglected and it is presented as a function of crack density only. In result the previous model can be used to predict stiffness reduction in the high crack density region if the crack opening is corrected by the interaction function. The results are validated comparing with tests and FE simulations.
Keywords: Intralaminar cracks; Damage mechanisms; Stiffness degradation, Interaction
INTRODUCTION
In laminated composites the most common damage mode and the one examined in this work is intralaminar cracking in layers. It can occur when the material is subjected to mechanical or thermal loading and cause degradation of thermo-elastic properties. Opening and sliding of crack surfaces during loading reduce the average strain and stress in the damaged layer, thus reducing the laminate stiffness. Many papers have been written on this subject, covering a broad range from micromechanics based to continuum damage mechanics based models (see review for example in [1-
Lundmark; Paper IV
106
3]). For the purpose of this paper the available approaches can be divided in two groups. The first group is focused on approximate determination of the local stress solution between two cracks. The solution is used to calculate average strain over the representative element which is required to determine certain thermo-elastic constant. The most famous in this group are shear lag models and variational models, where the models developed by Hashin [4] have to be distinguished due to the simplicity and consistency. The most exact solutions which involve complex numerical routines are presented in [5,6]. Usually only some elastic parameters and not the whole stiffness and thermal expansion coefficient matrix are obtained and analysis is limited by cross-ply laminates. More complex geometries have been analyzed by introducing effective properties of the damaged layer and calculating them using the “equivalent constraint model” [7,8]. The local stress problem in these studies was solved using a modified shear lag model in which the size of the zone with non-zero shear stress is a fitting parameter. Local delaminations at the tip of transverse cracks were included in this type of analysis in [9]. The second group of approaches is lifting up the role of the crack face relative displacements: if the opening or sliding at the same applied load is larger the stiffness degradation is larger. Expressions for stiffness and thermal expansion coefficient tensors of 3-D laminate with cracks in layers were obtained in [10,11]. The macro properties are in an exact form correlated with parameters characterizing the crack: the average opening and crack face sliding. They suggested to neglect the effect of neighboring layers on crack face displacements and to use the known solution for a periodic system of cracks in an infinite homogeneous transversely isotropic medium (90-layer). However, Nuismer et al [12] showed that replacing the cracked lamina in laminate with effective medium results in significant overestimation of the changes in damaged laminate compliances. The approach by Varna and Lundmark [13,14] is similar but presented in the framework of the laminate theory. The advantage is the transparency of derivations and simplicity of application. Stiffness and thermal expansion coefficients of an arbitrary symmetric laminate with cracks in certain layers are presented in an exact and explicit form. These relationships contain only material properties, geometrical characteristics of the laminate and two very robust microscale parameters of the crack: average crack face opening (COD) and sliding displacement (CSD) normalized with respect to the applied stress. It was found that the COD and CSD, see [13,14], depend only on the constraining ply, cracked ply stiffness ratio and thickness ratio. These relationships were approximated by power laws.
Lundmark; Paper IV
107
Certainly, there is a strong correlation between the local stress based and displacement based models. It was shown in [15,16] that the normalized averaged crack opening displacement is uniquely related to the stress perturbation averaged over the 90-layer. Thus, the stress models of the first group can be used to produce the input COD and CSD for the second group to calculate the whole set of thermo-elastic constants. The problem with the COD and CSD based approach in [13,14] is that the power laws for these quantities are derived considering non-interactive cracks. When the crack density increases the stress perturbations caused by two cracks start to interact and the opening and sliding displacements may be significantly smaller [17]. Thus the above model based on the non-interactive cracks overestimates the stiffness degradation at large crack density.The objective of the present paper is to investigate the effect of crack interaction on COD using FEM and to describe the identified dependence on crack density in a simple and accurate form by crack density dependent “interaction function”. It is used to correct the COD values for crack interaction. Predictions are compared with direct FEM calculations and with experimental results. The analysis is limited by COD only, because a) the largest crack density leading to interaction is usually observed in layers transverse to the uniaxial load where sliding has small influence; b) the experimental data are very limited for cases where sliding is of importance; c) certain features related to the sliding are still unclear (friction, asperities, nonlinear material response to shear etc).
STIFFNESS MATRIX OF A DAMAGED LAMINATE WITH INTRALAMINAR CRACKS
Exact and closed form expressions for stiffness matrix and thermal expansion coefficients for a general symmetric laminate with intralaminar cracks in plies were derived in [13] and [14]. These expressions contain as input parameters thermo-elastic ply properties, details of laminate lay-up and density of cracks in each cracked layer. The microscale details in the macroscale solution are presented through two local parameters: the normalized average opening (COD) and normalized average sliding (CSD) displacement of the crack surface. Both COD and CSD depend on the details of the crack geometry (small delta cracks and local delamination at the tip of the main crack) and on the distance between cracks (if cracks are close enough to interact), represented by crack density.
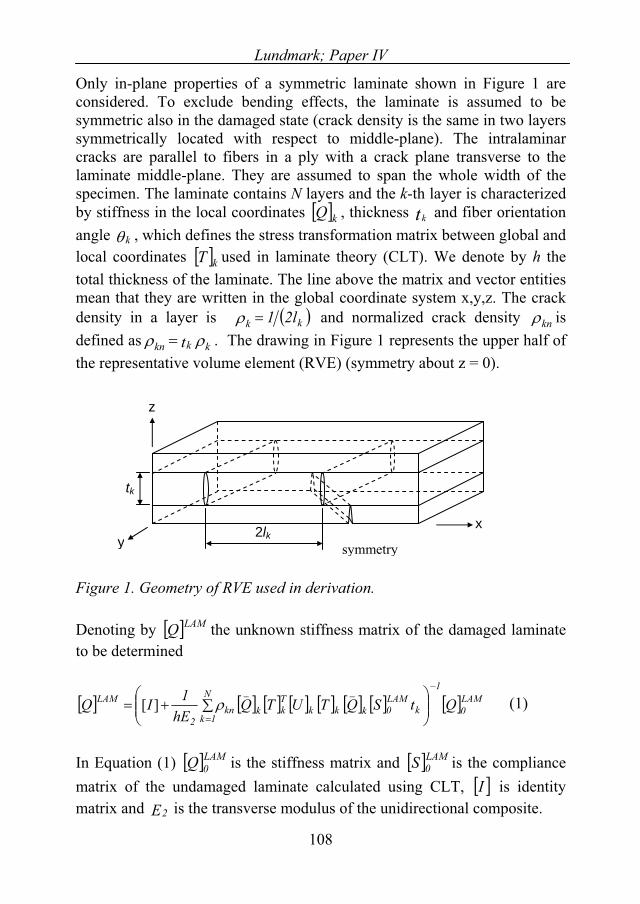
Lundmark; Paper IV
Only in-plane properties of a symmetric laminate shown in Figure 1 are considered. To exclude bending effects, the laminate is assumed to be symmetric also in the damaged state (crack density is the same in two layers symmetrically located with respect to middle-plane). The intralaminar cracks are parallel to fibers in a ply with a crack plane transverse to the laminate middle-plane. They are assumed to span the whole width of the specimen. The laminate contains N layers and the k-th layer is characterized by stiffness in the local coordinates Q k , thickness t and fiber orientation angle
k
k
k
, which defines the stress transformation matrix between global and local coordinates used in laminate theory (CLT). We denote by h the total thickness of the laminate. The line above the matrix and vector entities mean that they are written in the global coordinate system x,y,z. The crack density in a layer is
T
kk l21 and normalized crack density kn is defined as kkkn t . The drawing in Figure 1 represents the upper half of the representative volume element (RVE) (symmetry about z = 0).
108
Figure 1. Geometry of RVE used in derivation.
Denoting by Q LAM the unknown stiffness matrix of the damaged laminate to be determined
LAM0
1
kLAM0kkk
Tk
N
1kkkn
2
LAM QtSQTUTQhE
1IQ__
][ (1)
In Equation (1) is the stiffness matrix and LAM0Q LAM
0S is the compliance matrix of the undamaged laminate calculated using CLT, I
E2
is identity matrix and is the transverse modulus of the unidirectional composite.
xy
z
2lk
tk
symmetry
Lundmark; Paper IV
The expression for damaged laminate thermal expansion coefficients is a LAM
kkknN
1k
kLAM0
N
1kkkn
kLAM DhtD
htI (2)
where
kkkTkk
2
LAM0k QTUTQ
E1SD (3)
Equations (1) to (3) were obtained using volume averages and the relationships between volume averaged quantities and boundary averages (including crack surfaces). The procedure, see [13] for details, is similar as in CLT: applied stresses are expressed through volume averaged stresses in layers which using averaged Hooke’s law are replaced by strains. The latter are uniquely related to the applied strain and the total surface displacement of cracks. In Equations (1) to (3), the U k matrix represents the normalized crack opening and sliding displacements of a crack in a layer symmetry axes and it is defined in Equation (4).
kan1u k
an2
kan1
12
2
kan2k
uGE
uU
00
00000
2 (4)
Here and are the average crack face sliding displacement and average crack face opening displacement, respectively, normalized with respect to thickness of the cracked layer and to the far field (CLT) stresses in the layer corresponding to the same load applied to undamaged laminate (subscript
u
0 ) as shown below.
k120
12
k
ka1
kan1 t
Guu k20k
2ka2
kan2 t
Euu (5)
109
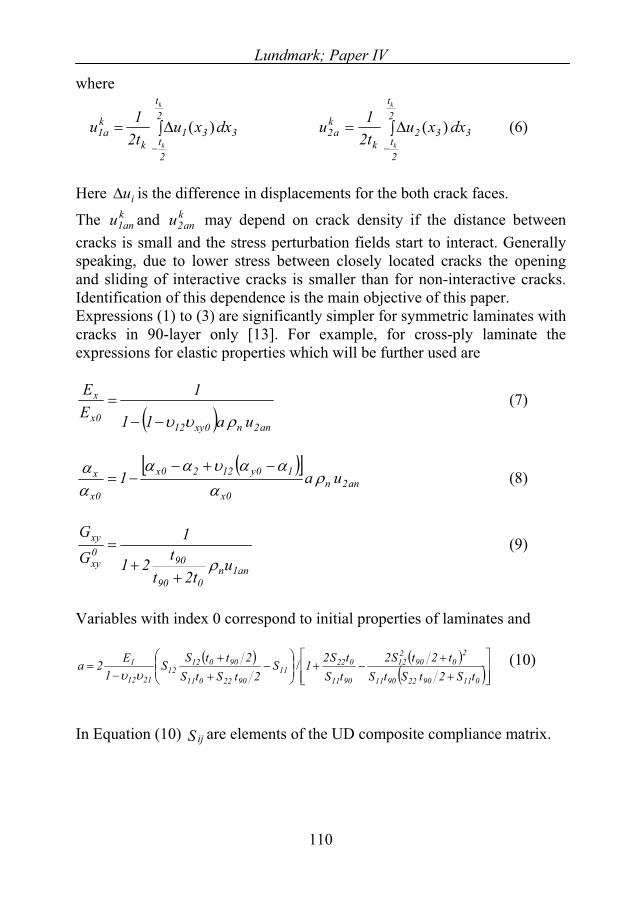
Lundmark; Paper IV
where
2t
2t
31k
ka1
k
k
dxxut21u )( 3
2t
2t
332k
ka2
k
k
dxxut21u )( (6)
Here is the difference in displacements for the both crack faces. iuk1u k
an2uThe and may depend on crack density if the distance between cracks is small and the stress perturbation fields start to interact. Generally speaking, due to lower stress between closely located cracks the opening and sliding of interactive cracks is smaller than for non-interactive cracks. Identification of this dependence is the main objective of this paper.
an
Expressions (1) to (3) are significantly simpler for symmetric laminates with cracks in 90-layer only [13]. For example, for cross-ply laminate the expressions for elastic properties which will be further used are
an2n0xy120x
x
ua11
1EE (7)
an2n0x
10y1220x
0x
x ua1 (8)
an1n090
900xy
xy
ut2t
t21
1GG
(9)
Variables with index 0 correspond to initial properties of laminates and
01190229011
2090
212
9011
02211
9022011
9001212
2112
1
tS2tStSt2tS2
tStS21S
2tStS2ttSS
1E2a / (10)
In Equation (10) are elements of the UD composite compliance matrix. S ij
110
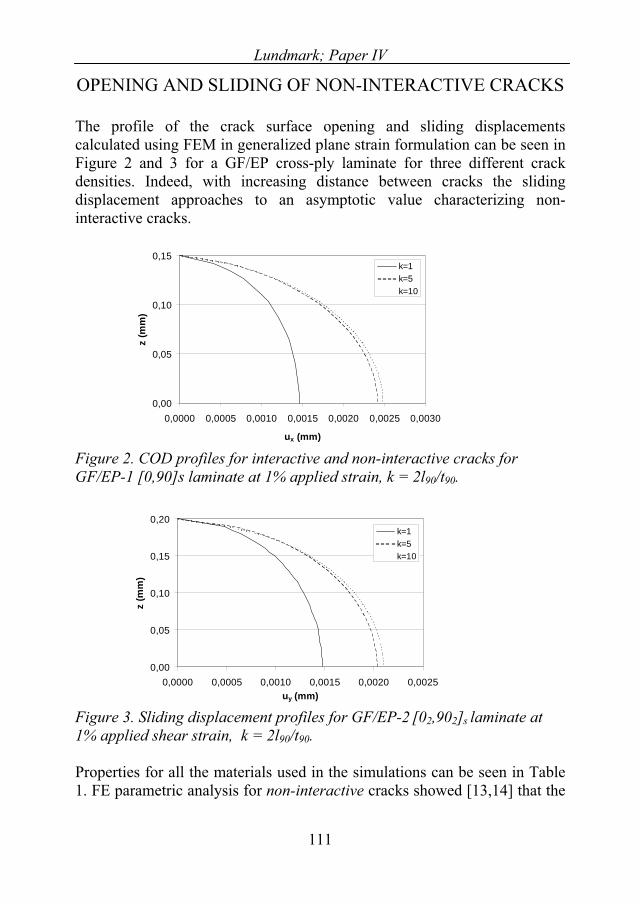
Lundmark; Paper IV
OPENING AND SLIDING OF NON-INTERACTIVE CRACKS
The profile of the crack surface opening and sliding displacements calculated using FEM in generalized plane strain formulation can be seen in Figure 2 and 3 for a GF/EP cross-ply laminate for three different crack densities. Indeed, with increasing distance between cracks the sliding displacement approaches to an asymptotic value characterizing non-interactive cracks.
0,00
0,05
0,10
0,15
0,0000 0,0005 0,0010 0,0015 0,0020 0,0025 0,0030
ux (mm)
z (m
m)
k=1k=5k=10
Figure 2. COD profiles for interactive and non-interactive cracks for GF/EP-1 [0,90]s laminate at 1% applied strain, k = 2l90/t90.
0,00
0,05
0,10
0,15
0,20
0,0000 0,0005 0,0010 0,0015 0,0020 0,0025uy (mm)
z (m
m)
k=1k=5k=10
Figure 3. Sliding displacement profiles for GF/EP-2 [02,902]s laminate at 1% applied shear strain, k = 2l90/t90.
Properties for all the materials used in the simulations can be seen in Table 1. FE parametric analysis for non-interactive cracks showed [13,14] that the
111
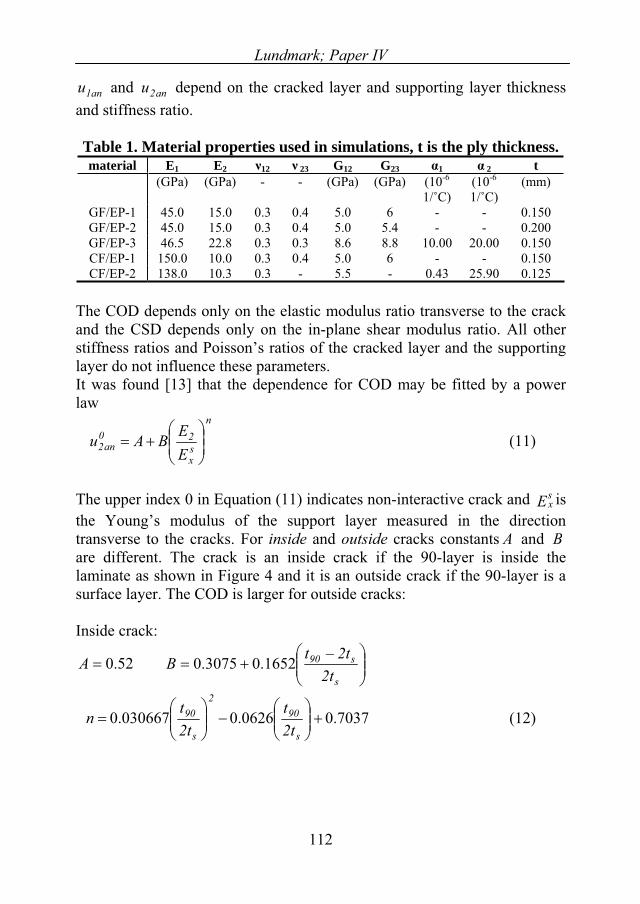
Lundmark; Paper IV
an1u an2u and depend on the cracked layer and supporting layer thickness and stiffness ratio.
Table 1. Material properties used in simulations, t is the ply thickness. material E1 E2 12 23 G12 G23 1 2 t
(GPa) (GPa) - - (GPa) (GPa) (10-6
1/˚C)(10-6
1/˚C)(mm)
GF/EP-1 45.0 15.0 0.3 0.4 5.0 6 - - 0.150 GF/EP-2 45.0 15.0 0.3 0.4 5.0 5.4 - - 0.200 GF/EP-3 46.5 22.8 0.3 0.3 8.6 8.8 10.00 20.00 0.150 CF/EP-1 150.0 10.0 0.3 0.4 5.0 6 - - 0.150 CF/EP-2 138.0 10.3 0.3 - 5.5 - 0.43 25.90 0.125
The COD depends only on the elastic modulus ratio transverse to the crack and the CSD depends only on the in-plane shear modulus ratio. All other stiffness ratios and Poisson’s ratios of the cracked layer and the supporting layer do not influence these parameters. It was found [13] that the dependence for COD may be fitted by a power law
n
Esx
A
sx
20an2 E
EBAu (11)
The upper index 0 in Equation (11) indicates non-interactive crack and is the Young’s modulus of the support layer measured in the direction transverse to the cracks. For inside and outside cracks constants and Bare different. The crack is an inside crack if the 90-layer is inside the laminate as shown in Figure 4 and it is an outside crack if the 90-layer is a surface layer. The COD is larger for outside cracks:
Inside crack:
0.52As
s90
t2t2tB 0.16520.3075
0.70370.06260.030667s
902
s
90
t2t
t2tn (12)
112
Lundmark; Paper IV
Outside crack:
1.2A
s
s90
t2t2tB 0.19010.5942
0.25760.44370.13073s
902
s
90
t2t
t2tn (13)
In Equations (12) and (13), t is the thickness of the support layer.s
113
Figure 4. Cross-ply laminate with cracks in 90-layer.
The sliding displacements of the crack faces were analyzed in [14] and the following power law expression was obtained
n
sxy
120an1 G
GBAu (14)
A and n can be considered as constants, B are a function of the layer thickness ratio.
Inside cracks: 0.3As
90
t2tB 0.0540.066 0.82n
0.6
(15)
Outside cracks: As
90
ttB 0.1050.134 0.82n
l90
(16)
x
y
z
wl90
t0
t90/2
0-layer
crack
90-layer
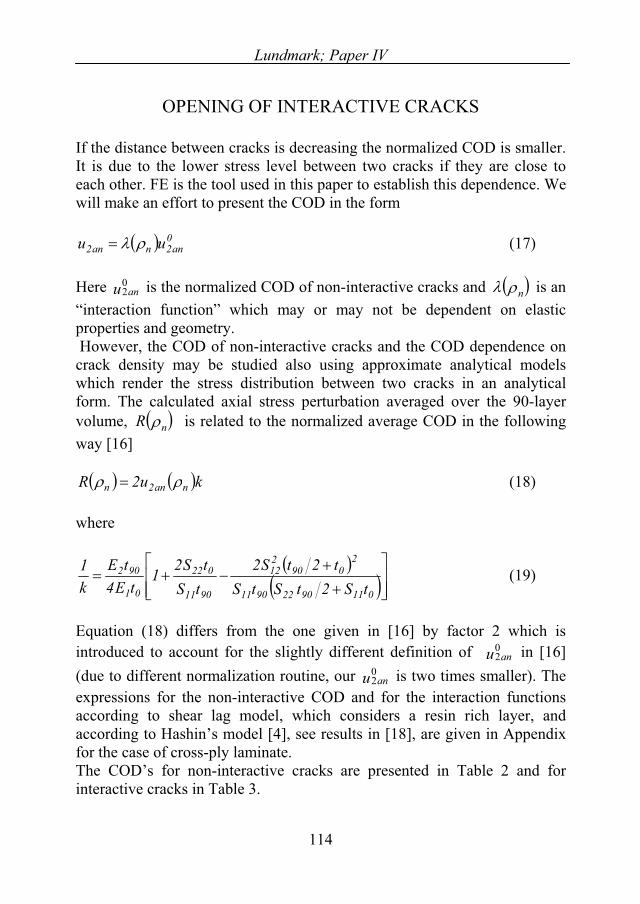
Lundmark; Paper IV
OPENING OF INTERACTIVE CRACKS
If the distance between cracks is decreasing the normalized COD is smaller. It is due to the lower stress level between two cracks if they are close to each other. FE is the tool used in this paper to establish this dependence. We will make an effort to present the COD in the form
nan2u 0an2u
u an02
(17)
Here is the normalized COD of non-interactive cracks and n
n
is an “interaction function” which may or may not be dependent on elastic properties and geometry. However, the COD of non-interactive cracks and the COD dependence on crack density may be studied also using approximate analytical models which render the stress distribution between two cracks in an analytical form. The calculated axial stress perturbation averaged over the 90-layer volume, is related to the normalized average COD in the following way [16]
R
ku2R nan2n (18)
where
01190229011
2090
212
9011
022
01
902
tS2tStSt2tS2
tStS21
tE4tE
k1 (19)
Equation (18) differs from the one given in [16] by factor 2 which is introduced to account for the slightly different definition of u in [16] (due to different normalization routine, our u is two times smaller). The expressions for the non-interactive COD and for the interaction functions according to shear lag model, which considers a resin rich layer, and according to Hashin’s model [4], see results in [18], are given in Appendix for the case of cross-ply laminate.
an02
an02
The COD’s for non-interactive cracks are presented in Table 2 and for interactive cracks in Table 3.
114
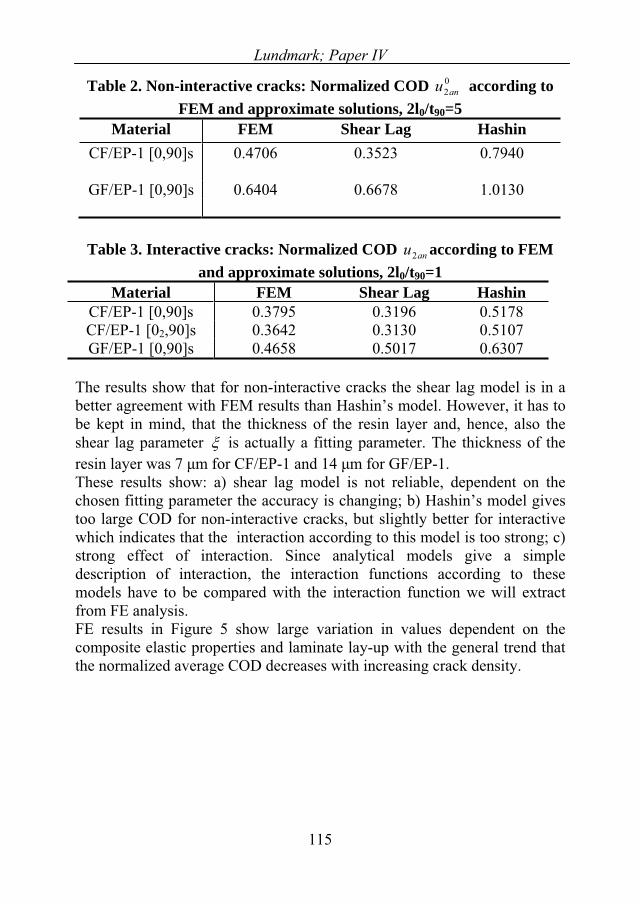
Lundmark; Paper IV
Table 2. Non-interactive cracks: Normalized COD u according to FEM and approximate solutions, 2l
02an
0/t90=5Material FEM Shear Lag Hashin
CF/EP-1 [0,90]s 0.4706 0.3523 0.7940
GF/EP-1 [0,90]s 0.6404 0.6678 1.0130
Table 3. Interactive cracks: Normalized COD u according to FEM and approximate solutions, 2l
an2
0/t90=1Material FEM Shear Lag Hashin
CF/EP-1 [0,90]s 0.3795 0.3196 0.5178CF/EP-1 [02,90]s 0.3642 0.3130 0.5107GF/EP-1 [0,90]s 0.4658 0.5017 0.6307
The results show that for non-interactive cracks the shear lag model is in a better agreement with FEM results than Hashin’s model. However, it has to be kept in mind, that the thickness of the resin layer and, hence, also the shear lag parameter is actually a fitting parameter. The thickness of the resin layer was 7 m for CF/EP-1 and 14 m for GF/EP-1. These results show: a) shear lag model is not reliable, dependent on the chosen fitting parameter the accuracy is changing; b) Hashin’s model gives too large COD for non-interactive cracks, but slightly better for interactive which indicates that the interaction according to this model is too strong; c) strong effect of interaction. Since analytical models give a simple description of interaction, the interaction functions according to these models have to be compared with the interaction function we will extract from FE analysis. FE results in Figure 5 show large variation in values dependent on the composite elastic properties and laminate lay-up with the general trend that the normalized average COD decreases with increasing crack density.
115

Lundmark; Paper IV
0
0,1
0,2
0,3
0,4
0,5
0,6
0,7
0,0 1,0 2,0 3,0 4,0Normalized Crack Density, n
u 2an
CF/EP [0,90]sCF/EP [02,90]sCF/EP [03,90]sGF/EP [0,90]sGF/EP [02,90]sGF/EP [03,90]s
Figure 5. The dependence on crack density for GF/EP-1 and CF/EP-1 composites with varying layer thickness ratio calculated using FEM.
anu2
02an
By normalizing the results in Figure 5 with respect to the COD of non-interactive cracks, , given by Equations (11)-(13) we can calculate the crack interaction function
u according to Equation (17).
Even if there are small differences in the values dependent on properties and lay-up, see Figure 6, we will try to describe the relationship by a single master curve.
0,0
0,2
0,4
0,6
0,8
1,0
1,2
0,0 1,0 2,0 3,0 4,0Normalized Crack Density, n
Inte
ract
ion
Func
tion,
CF/EP [0,90]sCF/EP [02,90]sCF/EP [03,90]sGF/EP [0,90]sGF/EP [02,90]sGF/EP [03,90]s
Figure 6. The interaction function dependence on crack density for GF/EP-1 and CF/EP-1 composites with varying layer thickness ratio calculated using FEM.
116
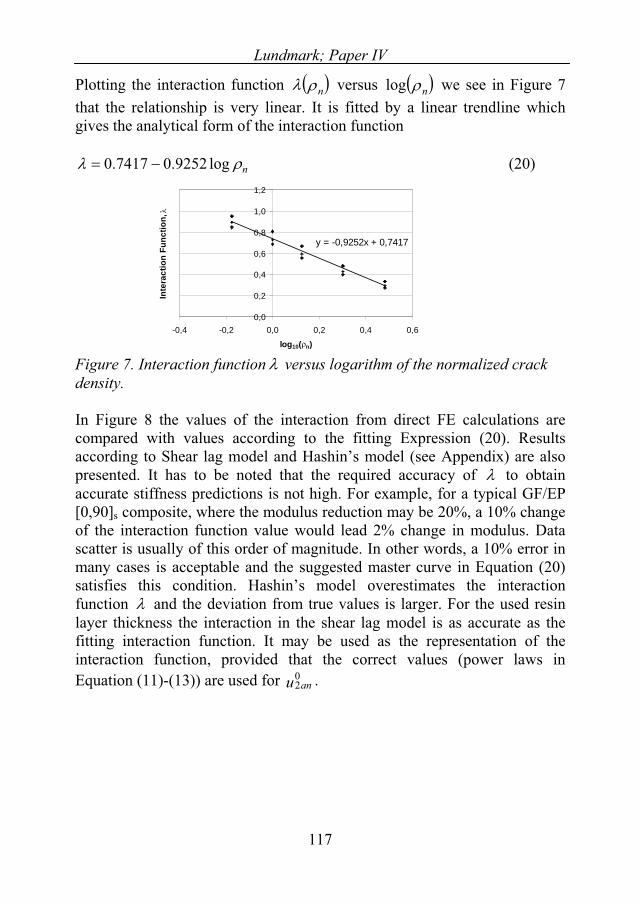
Lundmark; Paper IV
Plotting the interaction function n versus nlog we see in Figure 7 that the relationship is very linear. It is fitted by a linear trendline which gives the analytical form of the interaction function
nlog0.92520.7417 (20)
y = -0,9252x + 0,7417
0,0
0,2
0,4
0,6
0,8
1,0
1,2
-0,4 -0,2 0,0 0,2 0,4 0,6
log10( n)
Inte
ract
ion
Func
tion,
Figure 7. Interaction function versus logarithm of the normalized crack density.
In Figure 8 the values of the interaction from direct FE calculations are compared with values according to the fitting Expression (20). Results according to Shear lag model and Hashin’s model (see Appendix) are also presented. It has to be noted that the required accuracy of to obtain accurate stiffness predictions is not high. For example, for a typical GF/EP [0,90]s composite, where the modulus reduction may be 20%, a 10% change of the interaction function value would lead 2% change in modulus. Data scatter is usually of this order of magnitude. In other words, a 10% error in many cases is acceptable and the suggested master curve in Equation (20) satisfies this condition. Hashin’s model overestimates the interaction function and the deviation from true values is larger. For the used resin layer thickness the interaction in the shear lag model is as accurate as the fitting interaction function. It may be used as the representation of the interaction function, provided that the correct values (power laws in Equation (11)-(13)) are used for u .an
02
117
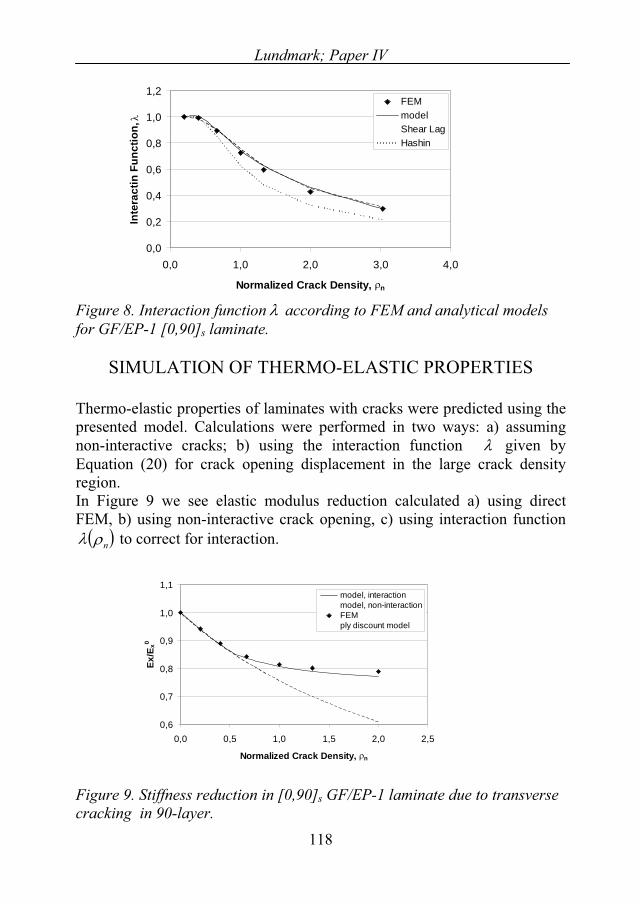
Lundmark; Paper IV
0,0
0,2
0,4
0,6
0,8
1,0
1,2
0,0 1,0 2,0 3,0 4,0
Normalized Crack Density, n
Inte
ract
in F
unct
ion,
FEMmodelShear LagHashin
Figure 8. Interaction function according to FEM and analytical models for GF/EP-1 [0,90]s laminate.
SIMULATION OF THERMO-ELASTIC PROPERTIES
Thermo-elastic properties of laminates with cracks were predicted using the presented model. Calculations were performed in two ways: a) assuming non-interactive cracks; b) using the interaction function given by Equation (20) for crack opening displacement in the large crack density region.In Figure 9 we see elastic modulus reduction calculated a) using direct FEM, b) using non-interactive crack opening, c) using interaction function
n to correct for interaction.
0,6
0,7
0,8
0,9
1,0
1,1
0,0 0,5 1,0 1,5 2,0 2,5
Normalized Crack Density, n
Ex/E
x0
model, interactionmodel, non-interactionFEMply discount model
Figure 9. Stiffness reduction in [0,90]s GF/EP-1 laminate due to transverse cracking in 90-layer.
118
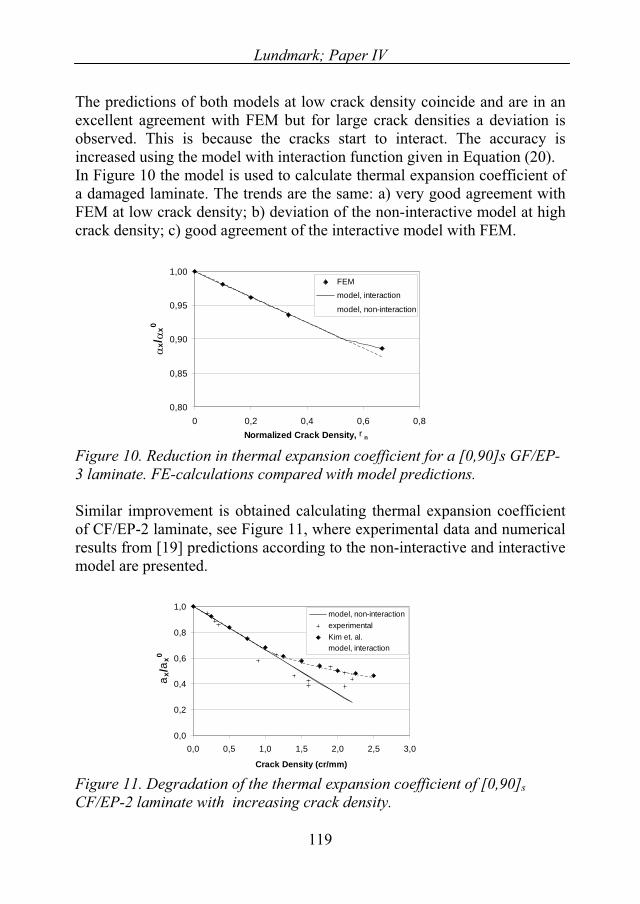
Lundmark; Paper IV
The predictions of both models at low crack density coincide and are in an excellent agreement with FEM but for large crack densities a deviation is observed. This is because the cracks start to interact. The accuracy is increased using the model with interaction function given in Equation (20).In Figure 10 the model is used to calculate thermal expansion coefficient of a damaged laminate. The trends are the same: a) very good agreement with FEM at low crack density; b) deviation of the non-interactive model at high crack density; c) good agreement of the interactive model with FEM.
0,80
0,85
0,90
0,95
1,00
0 0,2 0,4 0,6 0,8Normalized Crack Density, r n
x/x0
FEM
model, interaction
model, non-interaction
Figure 10. Reduction in thermal expansion coefficient for a [0,90]s GF/EP-3 laminate. FE-calculations compared with model predictions.
Similar improvement is obtained calculating thermal expansion coefficient of CF/EP-2 laminate, see Figure 11, where experimental data and numerical results from [19] predictions according to the non-interactive and interactive model are presented.
0,0
0,2
0,4
0,6
0,8
1,0
0,0 0,5 1,0 1,5 2,0 2,5 3,0
Crack Density (cr/mm)
a x/a
x0
model, non-interaction experimentalKim et. al.model, interaction
Figure 11. Degradation of the thermal expansion coefficient of [0,90]sCF/EP-2 laminate with increasing crack density.
119
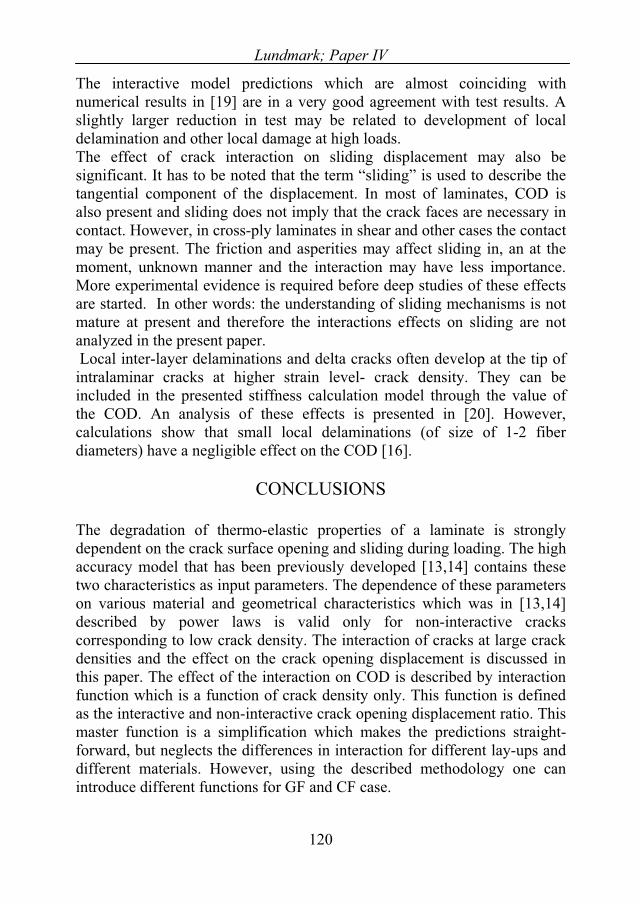
Lundmark; Paper IV
120
The interactive model predictions which are almost coinciding with numerical results in [19] are in a very good agreement with test results. A slightly larger reduction in test may be related to development of local delamination and other local damage at high loads. The effect of crack interaction on sliding displacement may also be significant. It has to be noted that the term “sliding” is used to describe the tangential component of the displacement. In most of laminates, COD is also present and sliding does not imply that the crack faces are necessary in contact. However, in cross-ply laminates in shear and other cases the contact may be present. The friction and asperities may affect sliding in, an at the moment, unknown manner and the interaction may have less importance. More experimental evidence is required before deep studies of these effects are started. In other words: the understanding of sliding mechanisms is not mature at present and therefore the interactions effects on sliding are not analyzed in the present paper. Local inter-layer delaminations and delta cracks often develop at the tip of intralaminar cracks at higher strain level- crack density. They can be included in the presented stiffness calculation model through the value of the COD. An analysis of these effects is presented in [20]. However, calculations show that small local delaminations (of size of 1-2 fiber diameters) have a negligible effect on the COD [16].
CONCLUSIONS
The degradation of thermo-elastic properties of a laminate is strongly dependent on the crack surface opening and sliding during loading. The high accuracy model that has been previously developed [13,14] contains these two characteristics as input parameters. The dependence of these parameters on various material and geometrical characteristics which was in [13,14] described by power laws is valid only for non-interactive cracks corresponding to low crack density. The interaction of cracks at large crack densities and the effect on the crack opening displacement is discussed in this paper. The effect of the interaction on COD is described by interaction function which is a function of crack density only. This function is defined as the interactive and non-interactive crack opening displacement ratio. This master function is a simplification which makes the predictions straight-forward, but neglects the differences in interaction for different lay-ups and different materials. However, using the described methodology one can introduce different functions for GF and CF case.
Lundmark; Paper IV
121
Simulations of Young’s modulus and thermal expansion coefficient degradation performed for cross-ply laminates using the model corrected for crack interaction, are in better agreement with experimental data as well as with FEM than the non-interactive crack model [13]. Approximate analytical models (shear lag and Hashin’s) depend on a fitting parameter or do not describe the interaction in a proper way and therefore the analytical crack density dependence according to these models can not be used as the required interaction function.Similar study has to be performed regarding the effect of interaction on sliding displacement. There the interaction between cracks belonging to the same system and also with cracks in neighbouring layers must be analyzed.
ACKNOWLEDGEMENTS
The authors would like to thank The Swedish National Graduate School of Space Technology for financial support.
REFERENCES
1. Nairn, J. and Hu, S. 1994. “Matrix microcracking . In: Pipes R.B, Talreja R, editors. Comp. Mater. series, vol. 9. Dam. Mech. Comp. Mater. Amsterdam: Elsevier, 187-243.
2. Nairn, J. 2000. “Matrix microcracking in composites”, In: Kelly A, Zweben C, Talreja R, Manson J-A, editors. Compr. Comp. Mater.,vol. 2. Poly. Matrix Comp., Amsterdam: Elsevier, 403-432.
3. Talreja, R. 1994. Damage characterization by internal variables. In: Pipes R.B, Talreja R, editors. Comp. Mater. series, vol. 9. Dam.Mech. Comp. Mater., Amsterdam: Elsevier, 53-78.
4. Hashin Z. 1985. Analysis of cracked laminates: A Variational Approach, Mech. Mater., North-Holland,4:121-136.
5. Schoeppner, G.A and Pagano, N. 1998. Stress fields and energy release rates in cross-ply laminates, Int. J. Solids Struct.,35(11):1025-1055.
6. McCartney, L.N. Schoeppner, G.A. and Becker, W. 2000. Comparison of models for transverse ply cracks in composite laminates, Comp. Sci. Tech., 60:2347-2359.
7. Zhang, J., Fan J. and Soutis, C. 1992. Analysis of multiple matrix cracking in [± m/90n]s composite laminates. Part 1. In-plane stiffness properties, Composites, 23(5): 291-304.
Lundmark; Paper IV
122
8. Kashtalyan, M. and Soutis, C. 2000. Stiffness degradation in cross-ply laminates damaged by transverse cracking and splitting, Composites Part A, 31:335-351.
9. Kashtalyan, M. and Soutis, C. 2002. Mechanisms of internal damage and their effect on the behavior and properties of cross-ply composite laminates, Int. J. Appl. Mech., 38(6): 641-657.
10. Gudmundson, P. and Östlund, S. 1992. First order analysis of stiffness reduction due to matrix cracking. J. Comp. Mater.,26:1009-30.
11. Gudmundson, P. and Zang, W. 1993. A universal model for thermoelastic properties of macro cracked composite laminates. Int.J. Sol. Struct., 30:3211-31.
12. Nuismer, RJ. and Tan, SC. 1988. Constitutive relations of a cracked composite lamina. J. Comp. Mater., 22:306-321.
13. Lundmark, P. and Varna, J. 2005. Constitutive relationships for damaged laminate in in-plane loading. Int. J. Dam. Mech.,14(3):235-259.
14. Lundmark, P. and Varna, J. 2005. Crack face sliding effect on stiffness of laminates with ply cracks, Accepted to Comp. Sci. Tech.
15. Joffe, R., Krasnikovs, A. and Varna, J. 2001. COD-based simulation of transverse cracking and stiffness reduction in [S/90n]s laminates.Comp. Sci. Tech., 61:637-656.
16. Varna, J., Krasnikovs, A., Kumar, R. and Talreja, R. 2004. A Synergistic damage mechanics approach to viscoelastic response of cracked cross-ply laminates, Int. J. Dam. Mech., 13: 301-334.
17. Varna, J. and Krasnikovs, A. 1998. Transverse Cracks in Cross-ply Laminates. Part 2. Stiffness Degradation. Mech. Comp. Mater.,34(2):153-170.
18. Joffe, R. and Varna, J. 1999. Analytical modeling of stiffness reduction in symmetric and balanced laminates due to cracks in 90° layers, Comp. Sci. Tech., 59:1641-1652.
19. Kim, R.Y., Crasto, A.S. and Schoeppner, G.A. 2000. Dimensional stability of composite in space thermal environment, Comp. Sci. Tech., 60:2601-2608.
20. Lundmark, P. and Varna, J. 2005, Damage evolution and characterization of crack types in CF/EP laminates loaded at low temperatures, submitted to Eng. Fract. Mech.
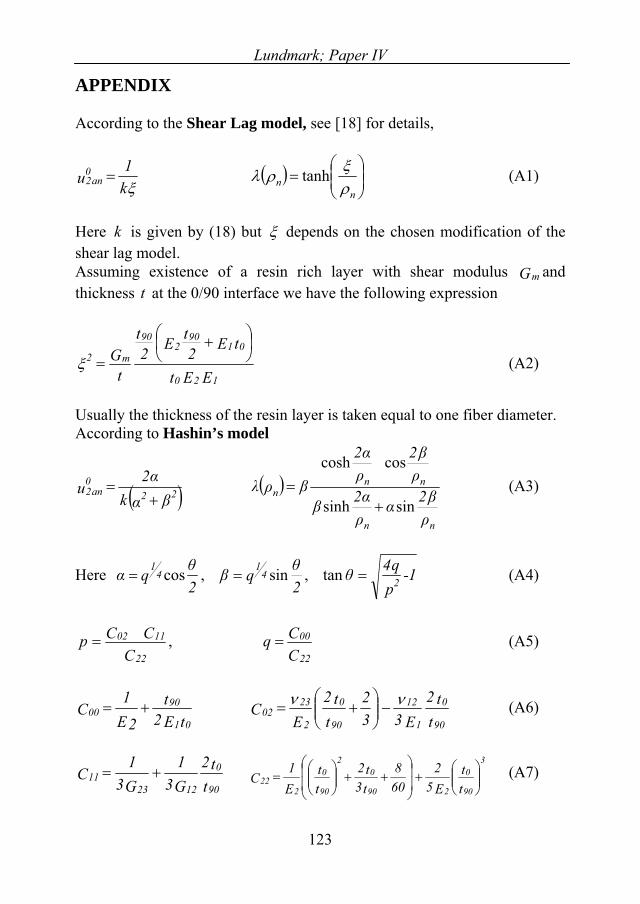
Lundmark; Paper IV
APPENDIX
According to the Shear Lag model, see [18] for details,
k1
u0an2
nn tanh (A1)
Here is given by (18) but k depends on the chosen modification of the shear lag model. Assuming existence of a resin rich layer with shear modulus G andthickness at the 0/90 interface we have the following expression
m
t
EEt
tE2tE2
t
tG
120
0190
290
m2 (A2)
Usually the thickness of the resin layer is taken equal to one fiber diameter. According to Hashin’s model
2k2
u 20
an2 22
22
nn
nnn
sinsinh
coscosh (A3)
, 1-pq42tan (A4)Here
2
123
q 41 cos ,
2q 4
1 sin
CCp 02 C
22
11 , CCq
22
00 (A5)
t01
90
E2t
E2
1C00
tt2
E332
tt2
EC
90
0
1
12
90
0
2
2302 (A6)
t2
G31
G31
C1223
11t90
0
tt
E52
608
t3t2
tt
E1
C90
03
290
0
90
02
222
(A7)


Lundmark; PAPER V
125
PAPER V

Lundmark; PAPER V
127
RAMAN SPECTROSCOPY ASSESSMENT OF MATRIX CRACKING RESULTS IN GFRP LAMINATES
P. Lundmark1, D. G. Katerelos2, J. Varna1 and C. Galiotis2, 3
1Department of Applied Physics and Mechanical Engineering Luleå University of Technology
SE 971 87, Luleå, Sweden 2Foundation Of Research and Technology Hellas
Institute of Chemical Engineering and High Temperature Processes Stadiou str. Platani, Patras, P.O. Box 1414, GR-265 04, Greece
3Materials Science Department University of Patras
Rio University Campus, Patras, GR-265 04, Greece [email protected]
To be submitted to Composite Science and Technology
ABSTRACT
Raman spectroscopy technique, based on local strain measurements within laminates with cracks, was used to investigate the degradation of the elastic modulus and the development of residual strains in cross-ply and [0/45/0]TGF/EP laminates. Due to the glass fibers poor Raman signal a technique, already introduced in the case of cross-ply laminates, that incorporates embedded Aramid fibers as Raman sensors was used for mapping of the locally arising strains within the 0° ply due to the cracks in off-axis ply. The damage evolution with increasing load level was quantified counting the strain peaks in the sensor fiber. The elastic modulus and the residual strain were derived from the cracking related changes of the measured distance between two strain peaks corresponding to two initial cracks. The elastic modulus reduction and the residual strain development are described by closed form model. The predictions have an excellent accuracy in the case of cross-ply laminates. For laminates with cracked off-axis plies the elastic modulus reduction predictions are very accurate, whereas the residual strain measured in test is much higher than the predicted. Since both phenomena in an elastic formulation are governed by the same parameters (crack face opening and sliding), the discrepancy can not be explained in the framework of elasticity. Development of inelastic strains due to shear stress component in the off-axis layer is suggested as the possible cause.

Lundmark; PAPER V
128
Introduction
Complex combinations of thermal and mechanical loading during service life lead to microdamage accumulation in plies of laminated composites. The first mode of damage is usually intralaminar (transverse) cracking in off-axis plies. The crack plane is commonly transverse to the laminate middle-plane. These cracks in 90-layers are spanning the whole width of the specimen whereas in off-axis layers they are often growing with time in the fiber direction in a stable manner. The density of cracks in a ply depends on layer orientation with respect to the load direction, temperature change, number of cycles in fatigue, laminate lay-up, ply thickness and, certainly, material fracture toughness. The opening and sliding of crack surfaces during loading reduce the average strain and stress in the damaged layer, thus reducing the laminate thermo-elastic properties. Another phenomenon which has not been much analyzed is related to the dimensional stability of the damaged laminate. The thermal stress relaxation with increasing crack density in the cracked layer leads to macroscopic expansion of the laminate which is called thermal residual strain. Since the origin of the residual strain is the same as for stiffness reduction (crack face displacements) both may be characterized by the same methods. Many papers have been written on the subject of properties degradation, covering a broad range from micromechanics based to continuum damage mechanics based models (see review for example in [1-3]). Most of them are focused on development of an approximate local stress distribution model between two cracks. This solution is used to determine certain thermo-elastic constant. The most often used are shear lag models and variational models, where the models developed by Hashin [4] have to be distinguished due to the simplicity and consistency. The most exact solutions which involve complex numerical routines are presented in [5, 6]. Usually only some elastic parameters and not the whole stiffness and thermal expansion coefficient matrix are obtained and analysis is limited by cross-ply laminates. More general laminates have been analyzed by using the suggested “equivalent constraint model” [7-8] to calculate the effective properties of the damaged layer. The local stress problem in these studies was solved using a modified shear lag model in which the size of the zone with non-zero shear stress is a fitting parameter. The crack face relative displacements as the parameters governing the stiffness reduction are used in [9-10]. They suggested to neglect the effect of neighbouring layers on crack face displacements and to use the known solution for a periodic system of cracks in an infinite homogeneous
Lundmark; PAPER V
129
transversely isotropic medium (90-layer) which as has been proven in [11] is a rough approximation. The approach by Varna and Lundmark [11-13] presents the stiffness and thermal expansion coefficients of an arbitrary symmetric laminate with cracks in certain layers in an exact and explicit form and accounts also for crack interaction. These relationships contain only material properties, geometrical characteristics of the laminate and two very robust microscale parameters of the crack: average crack face opening (COD) and sliding displacement (CSD) normalized with respect to the applied stress.
In the present paper the crack development in off-axis layers of a model GF/EP composite and its effect on the elastic modulus of a GF/EP cross-ply [0/90/0]T laminate and a [0/45/0]T laminate is examined. Additionally, macroscopic residual thermal strains appearing as the result of the thermal tensile stress relaxation in cracked of-axis layer have been analyzed. The experimental data are provided using laser Raman spectroscopy. The experimental technique involves Raman spectroscopy for the recording of strain redistribution within the plies as a result of the crack onset and growth in the off-axis plies. Raman spectroscopy, due to the provided high spatial resolution, has been proved a powerful tool in experimental stress and strain measurements [14-18]. Due to the glass fibers poor Raman signal, Aramid fibres were embedded within the 0° plies and near the 0/ interface and used as Raman-sensors as described in details in previous work [15-18]. Finally, the micromechanical strain mapping results are used to derive the macromechanical properties: the longitudinal modulus of elasticity and the magnitude and the form of the residual strains caused by cracking. Theoretically these effects are analysed using the model [11-13]. It is shown that both stiffness reduction and the residual strains in cross-ply laminates may be with a high accuracy described by the used elastic model. In the laminate with the 45-layer with cracks the elastic modulus reduction is described properly but the residual strain measured experimentally is significantly larger than the predicted. Since both elastic modulus and the residual strain reduction (both described by elastic stress redistribution) depend on the same parameters the inability of the model to describe the residual stress in this case is related to behaviour different then just elasticity: viscoplastic and viscoelastic effects. Permanent strains additionally to the described thermal residual strains are developing as the result of the nonlinear shear response of the off-axis layer.
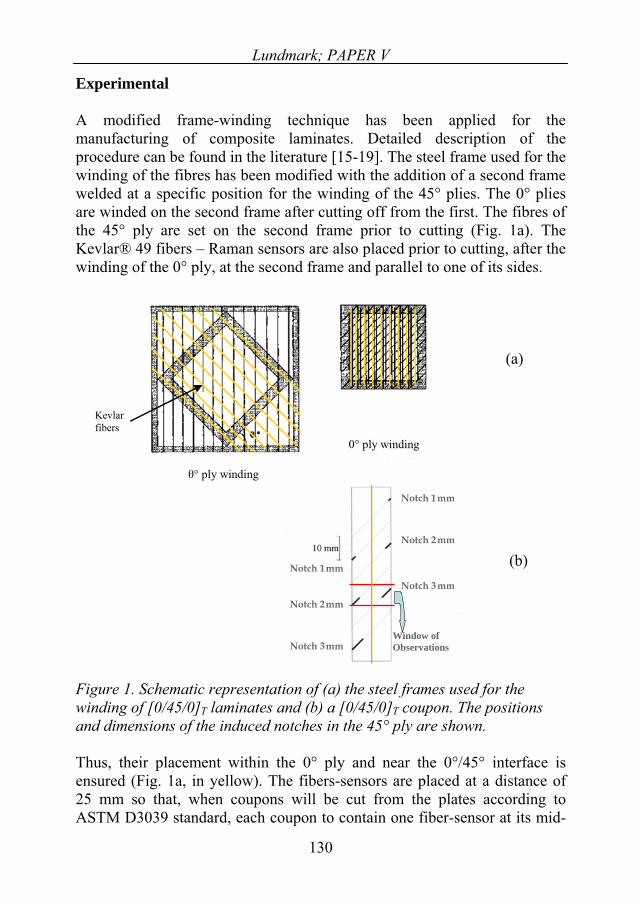
Lundmark; PAPER V
Experimental
A modified frame-winding technique has been applied for the manufacturing of composite laminates. Detailed description of the procedure can be found in the literature [15-19]. The steel frame used for the winding of the fibres has been modified with the addition of a second frame welded at a specific position for the winding of the 45° plies. The 0° plies are winded on the second frame after cutting off from the first. The fibres of the 45° ply are set on the second frame prior to cutting (Fig. 1a). The Kevlar® 49 fibers – Raman sensors are also placed prior to cutting, after the winding of the 0° ply, at the second frame and parallel to one of its sides.
130
(a)
(b) (b)
Notch 1 mm
Notch 2 mm
Notch 3 mm
Notch 1 mm
Notch 2 mm
Notch 3 mm
Window ofObservations
Notch 1 mm
Notch 2 mm
Notch 3 mm
Notch 1 mm
Notch 2 mm
Notch 3 mm
Window ofObservations
° ply winding
0° ply winding
° ply winding
0° ply winding
Kevlar fibers
Figure 1. Schematic representation of (a) the steel frames used for the winding of [0/45/0]T laminates and (b) a [0/45/0]T coupon. The positions and dimensions of the induced notches in the 45° ply are shown.
Thus, their placement within the 0° ply and near the 0°/45° interface is ensured (Fig. 1a, in yellow). The fibers-sensors are placed at a distance of 25 mm so that, when coupons will be cut from the plates according to ASTM D3039 standard, each coupon to contain one fiber-sensor at its mid-
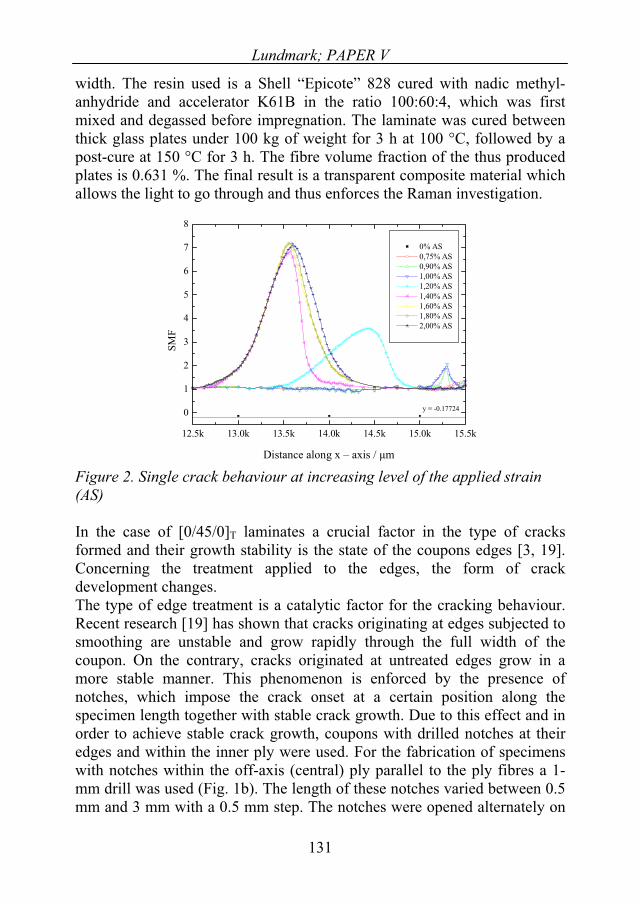
Lundmark; PAPER V
width. The resin used is a Shell “Epicote” 828 cured with nadic methyl-anhydride and accelerator K61B in the ratio 100:60:4, which was first mixed and degassed before impregnation. The laminate was cured between thick glass plates under 100 kg of weight for 3 h at 100 °C, followed by a post-cure at 150 °C for 3 h. The fibre volume fraction of the thus produced plates is 0.631 %. The final result is a transparent composite material which allows the light to go through and thus enforces the Raman investigation.
12.5k 13.0k 13.5k 14.0k 14.5k 15.0k 15.5k
0
1
2
3
4
5
6
7
8
y = -0.17724
- x / m
0% AS 0,75% AS 0,90% AS 1,00% AS 1,20% AS 1,40% AS 1,60% AS 1,80% AS 2,00% AS
SMF
Distance along x – axis / m
SMF
Figure 2. Single crack behaviour at increasing level of the applied strain (AS)
In the case of [0/45/0]T laminates a crucial factor in the type of cracks formed and their growth stability is the state of the coupons edges [3, 19]. Concerning the treatment applied to the edges, the form of crack development changes. The type of edge treatment is a catalytic factor for the cracking behaviour. Recent research [19] has shown that cracks originating at edges subjected to smoothing are unstable and grow rapidly through the full width of the coupon. On the contrary, cracks originated at untreated edges grow in a more stable manner. This phenomenon is enforced by the presence of notches, which impose the crack onset at a certain position along the specimen length together with stable crack growth. Due to this effect and in order to achieve stable crack growth, coupons with drilled notches at their edges and within the inner ply were used. For the fabrication of specimens with notches within the off-axis (central) ply parallel to the ply fibres a 1-mm drill was used (Fig. 1b). The length of these notches varied between 0.5 mm and 3 mm with a 0.5 mm step. The notches were opened alternately on
131
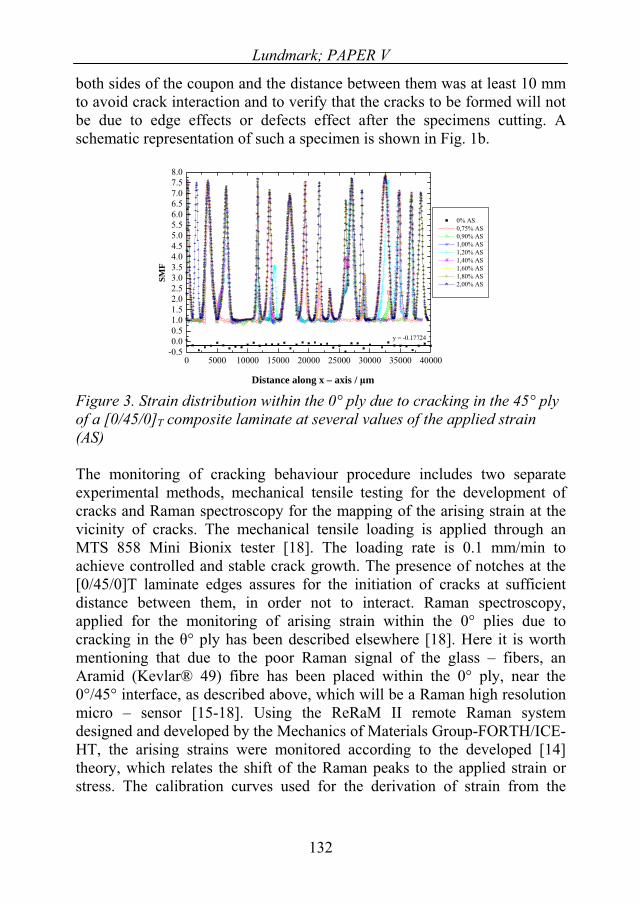
Lundmark; PAPER V
both sides of the coupon and the distance between them was at least 10 mm to avoid crack interaction and to verify that the cracks to be formed will not be due to edge effects or defects effect after the specimens cutting. A schematic representation of such a specimen is shown in Fig. 1b.
0 5000 10000 15000 20000 25000 30000 35000 40000-0.50.00.51.01.52.02.53.03.54.04.55.05.56.06.57.07.58.0
y = -0.17724
- x / m
0% AS 0,75% AS 0,90% AS 1,00% AS 1,20% AS 1,40% AS 1,60% AS 1,80% AS 2,00% ASSM
F
Distance along x – axis / m
Figure 3. Strain distribution within the 0° ply due to cracking in the 45° ply of a [0/45/0]T composite laminate at several values of the applied strain (AS)
The monitoring of cracking behaviour procedure includes two separate experimental methods, mechanical tensile testing for the development of cracks and Raman spectroscopy for the mapping of the arising strain at the vicinity of cracks. The mechanical tensile loading is applied through an MTS 858 Mini Bionix tester [18]. The loading rate is 0.1 mm/min to achieve controlled and stable crack growth. The presence of notches at the [0/45/0]T laminate edges assures for the initiation of cracks at sufficient distance between them, in order not to interact. Raman spectroscopy, applied for the monitoring of arising strain within the 0° plies due to cracking in the ° ply has been described elsewhere [18]. Here it is worth mentioning that due to the poor Raman signal of the glass – fibers, an Aramid (Kevlar® 49) fibre has been placed within the 0° ply, near the 0°/45° interface, as described above, which will be a Raman high resolution micro – sensor [15-18]. Using the ReRaM II remote Raman system designed and developed by the Mechanics of Materials Group-FORTH/ICE-HT, the arising strains were monitored according to the developed [14] theory, which relates the shift of the Raman peaks to the applied strain or stress. The calibration curves used for the derivation of strain from the
132
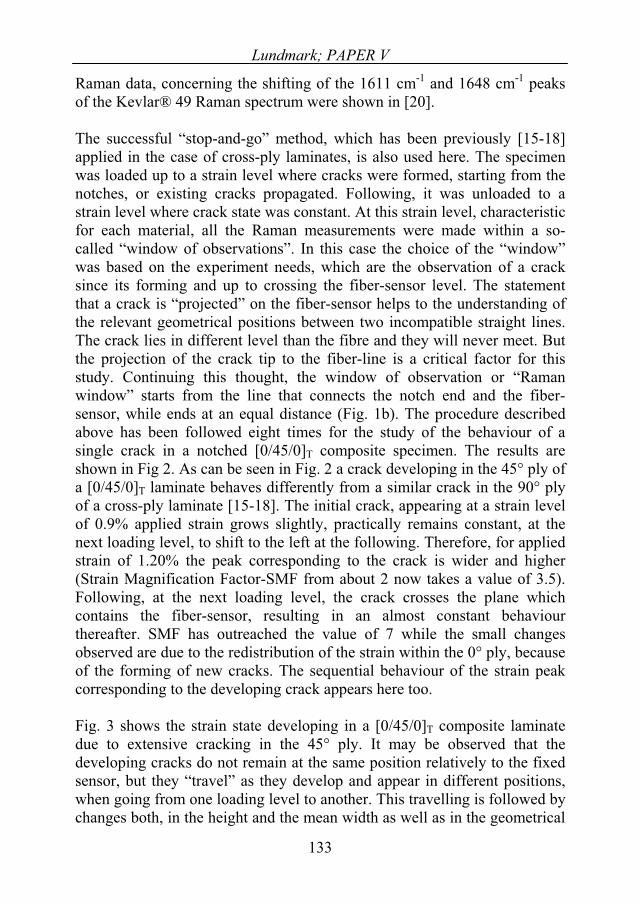
Lundmark; PAPER V
133
Raman data, concerning the shifting of the 1611 cm-1 and 1648 cm-1 peaks of the Kevlar® 49 Raman spectrum were shown in [20].
The successful “stop-and-go” method, which has been previously [15-18] applied in the case of cross-ply laminates, is also used here. The specimen was loaded up to a strain level where cracks were formed, starting from the notches, or existing cracks propagated. Following, it was unloaded to a strain level where crack state was constant. At this strain level, characteristic for each material, all the Raman measurements were made within a so-called “window of observations”. In this case the choice of the “window” was based on the experiment needs, which are the observation of a crack since its forming and up to crossing the fiber-sensor level. The statement that a crack is “projected” on the fiber-sensor helps to the understanding of the relevant geometrical positions between two incompatible straight lines. The crack lies in different level than the fibre and they will never meet. But the projection of the crack tip to the fiber-line is a critical factor for this study. Continuing this thought, the window of observation or “Raman window” starts from the line that connects the notch end and the fiber-sensor, while ends at an equal distance (Fig. 1b). The procedure described above has been followed eight times for the study of the behaviour of a single crack in a notched [0/45/0]T composite specimen. The results are shown in Fig 2. As can be seen in Fig. 2 a crack developing in the 45° ply of a [0/45/0]T laminate behaves differently from a similar crack in the 90° ply of a cross-ply laminate [15-18]. The initial crack, appearing at a strain level of 0.9% applied strain grows slightly, practically remains constant, at the next loading level, to shift to the left at the following. Therefore, for applied strain of 1.20% the peak corresponding to the crack is wider and higher (Strain Magnification Factor-SMF from about 2 now takes a value of 3.5). Following, at the next loading level, the crack crosses the plane which contains the fiber-sensor, resulting in an almost constant behaviour thereafter. SMF has outreached the value of 7 while the small changes observed are due to the redistribution of the strain within the 0° ply, because of the forming of new cracks. The sequential behaviour of the strain peak corresponding to the developing crack appears here too.
Fig. 3 shows the strain state developing in a [0/45/0]T composite laminate due to extensive cracking in the 45° ply. It may be observed that the developing cracks do not remain at the same position relatively to the fixed sensor, but they “travel” as they develop and appear in different positions, when going from one loading level to another. This travelling is followed by changes both, in the height and the mean width as well as in the geometrical
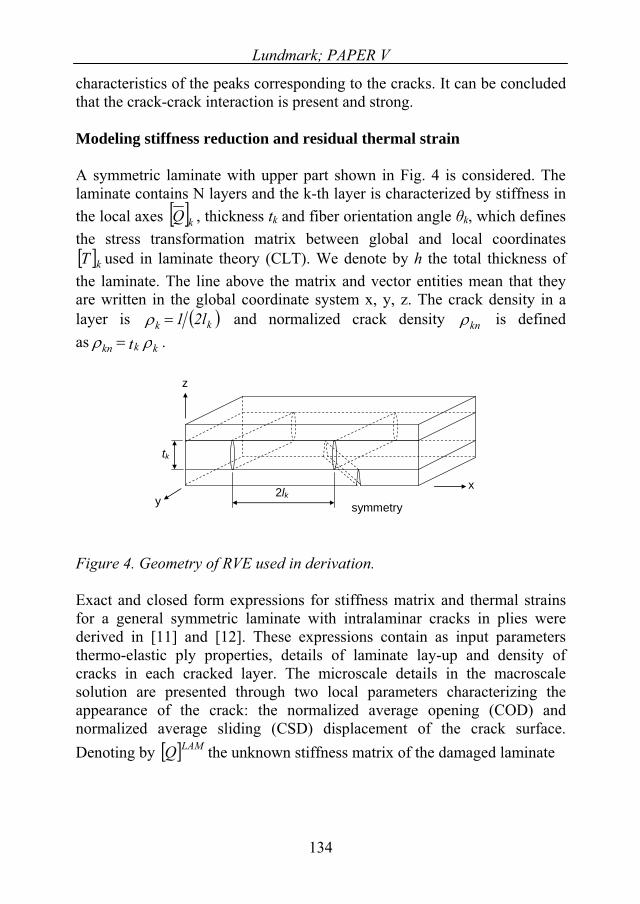
Lundmark; PAPER V
characteristics of the peaks corresponding to the cracks. It can be concluded that the crack-crack interaction is present and strong.
Modeling stiffness reduction and residual thermal strain
A symmetric laminate with upper part shown in Fig. 4 is considered. The laminate contains N layers and the k-th layer is characterized by stiffness in the local axes kQ
kT
, thickness tk and fiber orientation angle k, which defines the stress transformation matrix between global and local coordinates
used in laminate theory (CLT). We denote by h the total thickness of the laminate. The line above the matrix and vector entities mean that they are written in the global coordinate system x, y, z. The crack density in a layer is klk 21 and normalized crack density kn is defined as kktkn .
xy
z
2lk
tk
symmetry
Figure 4. Geometry of RVE used in derivation.
Exact and closed form expressions for stiffness matrix and thermal strains for a general symmetric laminate with intralaminar cracks in plies were derived in [11] and [12]. These expressions contain as input parameters thermo-elastic ply properties, details of laminate lay-up and density of cracks in each cracked layer. The microscale details in the macroscale solution are presented through two local parameters characterizing the appearance of the crack: the normalized average opening (COD) and normalized average sliding (CSD) displacement of the crack surface. Denoting by Q LAM the unknown stiffness matrix of the damaged laminate
134

Lundmark; PAPER V
LAM0
1
kLAM0kkk
Tk
N
1kkkn
2
LAM QtSQTUTQhE
1IQ__
][ (1)
In Equation (1), is the stiffness matrix and LAM0Q LAM
0S
E2
is the compliance of the undamaged laminate calculated using CLT, [I] is identity matrix and
is the transverse modulus of the unidirectional composite. Due to crack development the tensile thermal stresses in the 90-layer are relaxing and the laminate becomes larger. The corresponding strain which is called “residual thermal strain” is the difference between the thermal strain in undamaged and damaged state. According to [11]
TQTUTQht
E1S k
LAMth0kkk
Tkkn
N
1k
k
2
LAM0
res (2)
In Equation (2), is the thermal strain experiencing by the undamaged laminate calculated using laminate theory (CLT)
LAMth0
th0LAM0
LAMth Q LAM ,
htQT i
iiLAMth , refTTT (3)
In Equations (1) and (2) the kU matrix represents the COD and CSD of a crack in a layer symmetry axes
k1u k
an2
an20
an2
kan1
12
2
kan2k
uGE
uU
00
00000
2 (4)
The and u are constant as long as the crack density is low (non-interactive cracks). But they decrease at high crack density. The interaction effect on the normalized crack opening is described by crack interaction function and u is related to COD of non-interactive cracks, u byrelationship
an
135
Lundmark; PAPER V
nan2u 0an2u
n
(5)
The upper index 0 in (5) indicates non-interactive crack. Using FE parametric analysis the crack interaction function was identified in [13]
log0.92520.7417 (6)
For non-interactive cracks the and depend on the cracked layer and supporting layer thickness and stiffness ratio.
kan1u k
an2u
n
Esx
0.52
sx
20an2 E
EBAu (7)
In Equation (7) is the Young’s modulus of the support layer measured in the direction transverse to the cracks. For cracks in layers which are not a surface layers [11]
As
s90
t2t2tB 0.16520.3075
0.70370.06260.030667s
902
s
90
t2t
t2tn (8)
In Equation (8) ts is thickness of the support layer. The non-interactive sliding displacements of the crack faces, see [12], are
n
sxy
120an1 G
GBAu (9)
136
0.3As
90
t2tB 0.0540.066 0.82n (10)
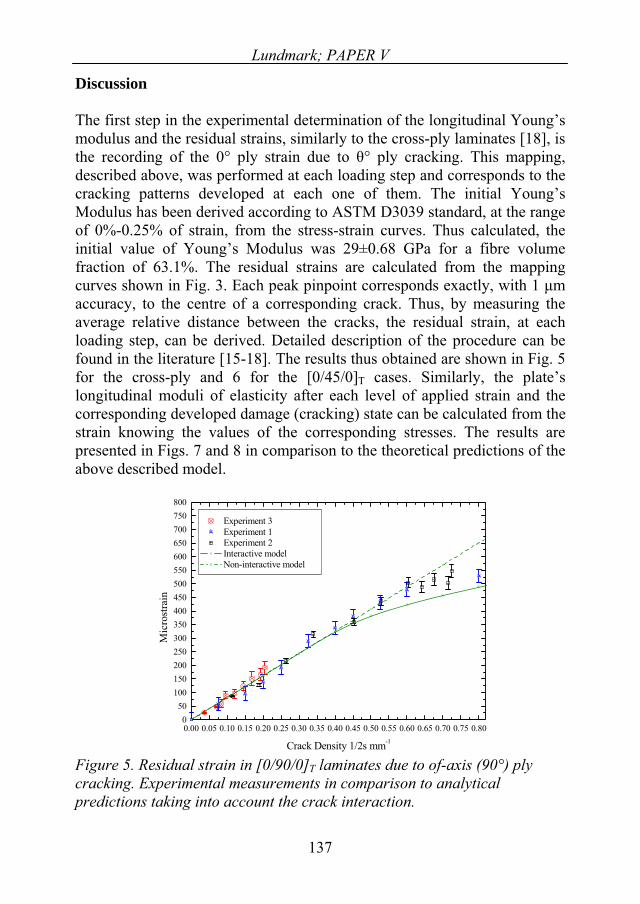
Lundmark; PAPER V
Discussion
The first step in the experimental determination of the longitudinal Young’s modulus and the residual strains, similarly to the cross-ply laminates [18], is the recording of the 0° ply strain due to ° ply cracking. This mapping, described above, was performed at each loading step and corresponds to the cracking patterns developed at each one of them. The initial Young’s Modulus has been derived according to ASTM D3039 standard, at the range of 0%-0.25% of strain, from the stress-strain curves. Thus calculated, the initial value of Young’s Modulus was 29±0.68 GPa for a fibre volume fraction of 63.1%. The residual strains are calculated from the mapping curves shown in Fig. 3. Each peak pinpoint corresponds exactly, with 1 maccuracy, to the centre of a corresponding crack. Thus, by measuring the average relative distance between the cracks, the residual strain, at each loading step, can be derived. Detailed description of the procedure can be found in the literature [15-18]. The results thus obtained are shown in Fig. 5 for the cross-ply and 6 for the [0/45/0]T cases. Similarly, the plate’s longitudinal moduli of elasticity after each level of applied strain and the corresponding developed damage (cracking) state can be calculated from the strain knowing the values of the corresponding stresses. The results are presented in Figs. 7 and 8 in comparison to the theoretical predictions of the above described model.
0.00 0.05 0.10 0.15 0.20 0.25 0.30 0.35 0.40 0.45 0.50 0.55 0.60 0.65 0.70 0.75 0.800
50100150200250300350400450500550600650700750800
Mic
rost
rain
Crack Density 1/2s mm-1
Experiment 3 Experiment 1 Experiment 2 Interactive model Non-interactive model
Figure 5. Residual strain in [0/90/0]T laminates due to of-axis (90°) ply cracking. Experimental measurements in comparison to analytical predictions taking into account the crack interaction.
137
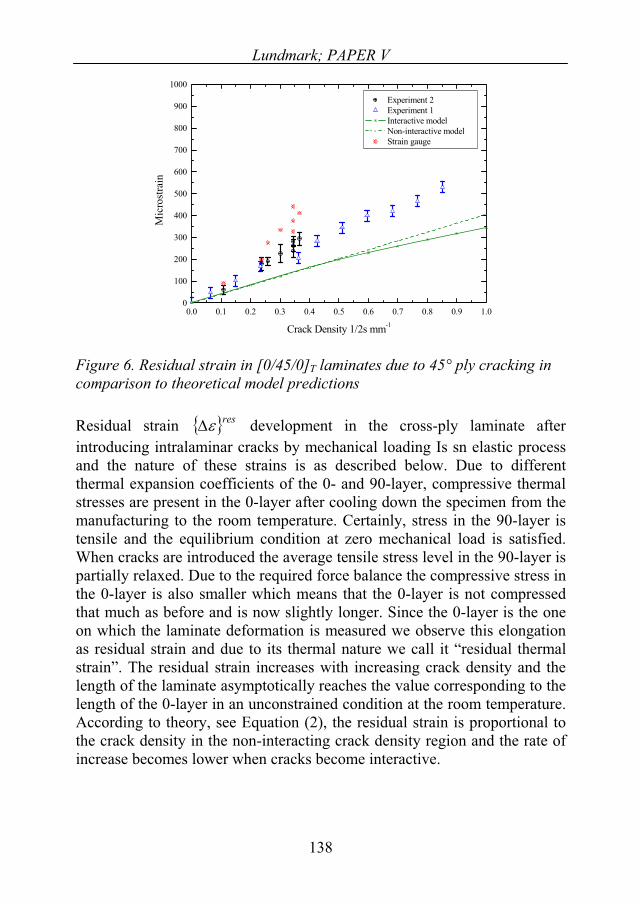
Lundmark; PAPER V
0.0 0.1 0.2 0.3 0.4 0.5 0.6 0.7 0.8 0.9 1.00
100
200
300
400
500
600
700
800
900
1000
Mic
rost
rain
Crack Density 1/2s mm-1
Experiment 2 Experiment 1 Interactive model Non-interactive model Strain gauge
Figure 6. Residual strain in [0/45/0]T laminates due to 45° ply cracking in comparison to theoretical model predictions
Residual strain development in the cross-ply laminate after introducing intralaminar cracks by mechanical loading Is sn elastic process and the nature of these strains is as described below. Due to different thermal expansion coefficients of the 0- and 90-layer, compressive thermal stresses are present in the 0-layer after cooling down the specimen from the manufacturing to the room temperature. Certainly, stress in the 90-layer is tensile and the equilibrium condition at zero mechanical load is satisfied. When cracks are introduced the average tensile stress level in the 90-layer is partially relaxed. Due to the required force balance the compressive stress in the 0-layer is also smaller which means that the 0-layer is not compressed that much as before and is now slightly longer. Since the 0-layer is the one on which the laminate deformation is measured we observe this elongation as residual strain and due to its thermal nature we call it “residual thermal strain”. The residual strain increases with increasing crack density and the length of the laminate asymptotically reaches the value corresponding to the length of the 0-layer in an unconstrained condition at the room temperature. According to theory, see Equation (2), the residual strain is proportional to the crack density in the non-interacting crack density region and the rate of increase becomes lower when cracks become interactive.
res
138

Lundmark; PAPER V
0.00 0.05 0.10 0.15 0.20 0.25 0.30 0.35 0.40 0.45 0.50 0.55 0.60 0.65 0.70 0.75 0.800.80
0.82
0.84
0.86
0.88
0.90
0.92
0.94
0.96
0.98
1.00
1.02
E/E 0
Crack Density 1/2s mm-1
Experiment 3 Experiment 2 Experiment 1 Interactive model Strain gauge Non-interactive model
Figure 7 Longitudinal Young’s Modulus change of [0/90/0]T laminates at various cracking levels of the 90° ply. Comparison with theoretical predictions.
Results presented in Fig 5 confirm these expectations: the measured residual strain curve is rather linear in the beginning and deviates from linearity at high crack density. Predictions according to the model are in a perfect agreement with experiment. The slope is predicted correctly and the interaction is also described with a sufficient accuracy. The slope of the residual strain curve depends on the COD which was also used in elastic modulus prediction, see Fig 7.
The elastic modulus predictions according to the model presented above are compared with test results for cross-ply laminates in Fig. 7. The experimental data show certain discrepancies between the values obtained using strain gauge and the values from the Raman technique (RT). A general trend is that the RT shows smaller and smoother stiffness reduction than the strain gauge. The model gives a very accurate description of the initial slope of the stiffness reduction which confirms the accuracy of the COD of non-interactive cracks, see Equation (7), used in calculations. At crack density of about 0.45 cr/mm deviation can be seen between test and predictions based on non-interactive model. The non-interactive model predicts almost linear decrease of the elastic modulus whereas test results show a decreasing effect of new appearing cracks in stiffness reduction. The reason for this behaviour is interaction of the local stress states related to cracks and lower stress between cracks which reduce the importance of each
139

Lundmark; PAPER V
new crack. In terms of COD’s a new crack in a high crack density region has smaller opening than an “isolated” crack and its effect on stiffness is smaller. The model which accounts for the reduced COD in the high crack density region (interaction model) is in a very good agreement with the test over the whole data region.
The good agreement with test describing both phenomena shows that both processes are of ELASTIC nature which is a pre-assumption of the model. The interaction may be slightly overestimated by the model (the measured residual strain is slightly higher than predicted) which may be a weak indication that some inelastic processes to create additional residual strains are involved at high crack density.
The stiffness reduction in the symmetric but unbalanced [0/45/0]T laminate is shown in Fig. 8. The experimental behaviour is quite similar as before and follows the same trends and mechanisms as in the case of cross-ply laminates discussed above. The reduction of modulus is rather linear in the beginning and some interaction effects are observable at high crack density. In this case strain gauge underestimates the reduction of the elastic modulus. The difference with the cross-ply case is that now crack face sliding is affecting stiffness reduction additionally to COD. The sliding effect is included in the used model and the sliding displacement is described by a power law with respect to elastic properties, see Equation (9). The boundary conditions in tensile test with unbalanced laminate are rather uncertain. This type of specimen is prone to rotate when tensile stress is applied. One extreme condition would be that the gripping device of the specimen edges allows free rotation of the specimen. Then the measured stress versus strain ratio indeed defines the elastic modulus. Another extreme is that the specimen ends are clamped and the testing machine does not allow for any rotation. In this case the apparent elastic modulus defined by stress-strain ratio is in fact the element of the stiffness matrix, which is slightly larger than the elastic modulus and changes during cracking in a slightly different way. Realizing that the real boundary conditions are somewhere in-between the both extremes we perform predictions of the apparent modulus for both cases expecting that the experimental behaviour will be between these curves. Indeed the experimental values are between both predictions being closer to free specimen case which indicates that the clamping effects are small. Both the slope at low crack density and the crack interaction at high crack density are described with a high accuracy. This proves that the COD and sliding displacement CSD are correctly described
LAM11Q
140
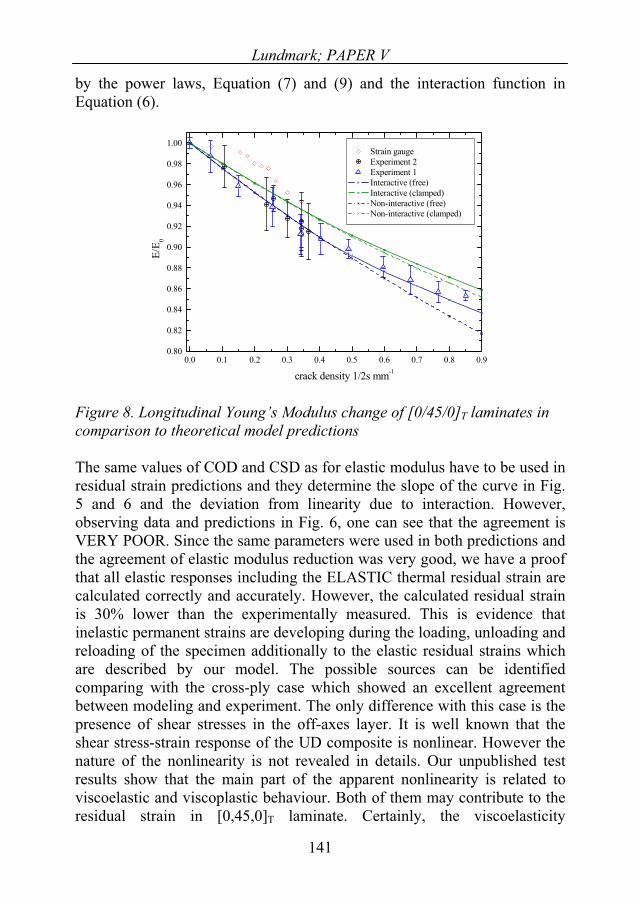
Lundmark; PAPER V
by the power laws, Equation (7) and (9) and the interaction function in Equation (6).
0.0 0.1 0.2 0.3 0.4 0.5 0.6 0.7 0.8 0.90.80
0.82
0.84
0.86
0.88
0.90
0.92
0.94
0.96
0.98
1.00E/
E 0
crack density 1/2s mm-1
Strain gauge Experiment 2 Experiment 1 Interactive (free) Interactive (clamped) Non-interactive (free) Non-interactive (clamped)
Figure 8. Longitudinal Young’s Modulus change of [0/45/0]T laminates in comparison to theoretical model predictions
The same values of COD and CSD as for elastic modulus have to be used in residual strain predictions and they determine the slope of the curve in Fig. 5 and 6 and the deviation from linearity due to interaction. However, observing data and predictions in Fig. 6, one can see that the agreement is VERY POOR. Since the same parameters were used in both predictions and the agreement of elastic modulus reduction was very good, we have a proof that all elastic responses including the ELASTIC thermal residual strain are calculated correctly and accurately. However, the calculated residual strain is 30% lower than the experimentally measured. This is evidence that inelastic permanent strains are developing during the loading, unloading and reloading of the specimen additionally to the elastic residual strains which are described by our model. The possible sources can be identified comparing with the cross-ply case which showed an excellent agreement between modeling and experiment. The only difference with this case is the presence of shear stresses in the off-axes layer. It is well known that the shear stress-strain response of the UD composite is nonlinear. However the nature of the nonlinearity is not revealed in details. Our unpublished test results show that the main part of the apparent nonlinearity is related to viscoelastic and viscoplastic behaviour. Both of them may contribute to the residual strain in [0,45,0]T laminate. Certainly, the viscoelasticity
141
Lundmark; PAPER V
142
contribution is transient, because all viscoelastic effects are fading out with time and the specimen is fully recovering. However, since the residual strain measurements were very close to the instant of damage introduction, specimens may not have time for whole recovery. In fact, stress records during measurements show a limited amount of relaxation indicating the above effect. Viscoplastic strains in off-axis and angle ply composites have been previously observed and analyzed in [21].
Conclusions
* The "Raman technology" renders a powerful tool for local strain mapping necessary for fundamental studies of the properties degradation in laminated composites due to micro-damage where high accuracy is required. Generally speaking the results are more reliable than the ones obtained using strain gauges. This is due to the high spatial resolution provided by RT, which implies to the potential of “micro”-measurements within a transparent material or at any opaque surface. In this manner micromechanical measurements can be made and macroscopic quantities can be derived with a significant accuracy. * The development of intralaminar cracks in off-axis layers was observed and quantified. GF/EP [0/90/0]T and [0/45/0]T laminates were studied. The damage evolution with increasing load level was quantified counting the strain peaks in the sensor fiber. The longitudinal elastic moduli and the residual strain were derived from the cracking related changes of the measured distance between strain peaks corresponding to cracks and knowing the corresponding stresses and the initial elastic moduli. This procedure has been followed in both tested composite laminates. * The observed phenomena are simulated using the model developed in [11-13]. Elastic modulus reduction in both laminates and the residual strain reduction in cross-ply laminate are predicted with an exceptional accuracy. The measured residual strains in [0/45/0]T laminate are significantly larger than the predicted. Since both the elastic modulus of the damaged laminate and the residual strains depend on the same local parameters related to the crack (opening and sliding), the inability of the model to predict the residual strain is a clear evidence that residual strains of inelastic nature are developing in the off-axis layer in addition to the elastic thermal strains caused by thermal stress release due to cracking. * As the possible origin for the observed additional inelastic strains we suggest viscoplastic permanent shear strain developing in result of the shear stress component. Since there was no time for recovery in the testing procedure, viscoelastic effects could also affect the result.
Lundmark; PAPER V
143
Acknowledgments
The authors wish to acknowledge Dr Steve L. Ogin and Mr. Reg D. Whattingham at the University of Surrey for their invaluable contribution in the specimen manufacturing process as well as in the development of the whole project. Also, a grateful acknowledgement must be expressed to the research project (Network of Excellence, NoE) NANOFUN-POLY for partially funding the present collaboration. The authors would also like to thank the Swedish National Graduate School of Space Technology for financial support.
References
1. Nairn, J. and Hu, S., “Matrix microcracking,” In: Pipes R.B, Talreja R, eds. Composite Materials series, vol. 9. Damage Mechanics of Composite Materials, Amsterdam: Elsevier, 187-243 403-432 (2000).
2. Nairn, J., “Matrix microcracking in composites”, In: Kelly A, Zweben C, Talreja R, Manson J-A, eds. Comprehensive Composite Materials, vol. 2. Polymer Matrix Composites, Amsterdam: Elsevier, 403-432 (2000).
3. Talreja, R., “Damage characterization by internal variables”. In: Pipes R.B, Talreja R, eds. Composite Materials series, vol. 9. Damage Mechanics of Composite Materials, Amsterdam: Elsevier, 53-78 (1994).
4. Hashin, Z., “Analysis of cracked laminates: a variational approach”, Mech. Mater, 4,121-136 (1985).
5. Schoeppner, G. A., and Pagano, N., “Stress fields and energy release rates in cross-ply laminates”, Int. J. Solids Struct., 35(11), 1025-1055 (1998).
6. McCartney, L. N., Schoeppner, G. A. and Becker, W., “Comparison of models for transverse ply cracks in composite laminates”, Comp. Sci. Tech., 60, 2347-2359 (2000).
7. Zhang J., Fan J. and Soutis C., “Analysis of multiple matrix cracking in [± m/90n]s composite laminates. Part 1. In-plane stiffness properties”, Composites, 23(5), 291-304 (1992).
Lundmark; PAPER V
144
8. Kashtalyan, M. and Soutis, C., “Stiffness degradation in cross-ply laminates damaged by transverse cracking and splitting”, Composites Part A, 31, 335-351 (2000).
9. Gudmundson, P. and Östlund, S., “First order analysis of stiffness reduction due to matrix cracking”, J Comp Mater, 26, 1009-1030 (1992).
10. Gudmundson, P. and Zang, W., “A universal model for thermoelastic properties of macro cracked composite laminates”, Int J Sol Struct, 30, 3211-3231 (1993).
11. Lundmark, P. and Varna, J., “Constitutive relationships for damaged laminate in in-plane loading”, Int J Dam Mech, 14(3), 235-259 (2005).
12. Lundmark, P. and Varna, J., “Crack face sliding effect on stiffness of laminates with ply cracks”, Comp Sci Tech, Accepted for publication (2005).
13. Lundmark, P. and Varna, J., “Stiffness reduction in laminates at high crack density: effect of crack interaction”, Int. J Dam Mech, Submitted (2005).
14. Paipetis A.S., Vlattas C. and Galiotis C., “Remote laser Raman microscopy (ReRaM); Part 1 Design and testing of a confocal microprobe”. Jrnl Raman Spectr, 27, 519 – 526 (1996).
15. Arjyal B.P., Galiotis C., Ogin S.L. and Whattingham, R.D., “Residual strain and Young’s modulus determination in cross-ply composites using an embedded Aramid fibre strain sensor”, Composites Part A, 29A, 1363 – 1369 (1998).
16. Katerelos, D. G., Parthenios, J. and Galiotis, C., “Strain Redistribution in Composite Laminates Resulting from Off – Axis Ply Cracking”, In: E. E. Gdoutos and Z. Margioli - Riga eds, Recent Advances in Composite Materials – In Honor of S. A. Paipetis, Kluwer Publishers, 139 – 150 (2003).
Lundmark; PAPER V
145
17. Katerelos, D. G. and Galiotis, C., “Axial Strain Redistribution resulting from Off-Axis Ply Cracking in Polymer Composites”, App Phys Lett, 85, 3752-3754(2004)
18. Katerelos, D. G., McCartney, L. N. and Galiotis, C., “Local Strain re-distribution and Stiffness Degradation in Cross-Ply Polymer Composites under Tension”, Acta Mater, 53, 3335-3343 (2005)
19. Crocker, L. E., Ogin, S. L., Smith, P. A. and Hill, P. S., “Intra-laminar fracture in angle-ply laminates,” Composites Part A, 28A, 839-846(1997).
20. Parthenios, J., Katerelos, D. G., Psarras, G. C. and Galiotis C., ”Aramid fibres; a multifunctional sensor for monitoring stress/strain fields and damage development in composite materials”, Eng Fract Mech, 69, 1067-1078 (2002).
21. Megnis M. and Varna, J., “Nonlinear Viscoelastic, Viscoplastic Characterization of Unidirectional GF/EP Composite”, Mech Time-dependent Mater, 7, 269-290 (2003).


Lundmark; PAPER VI
147
PAPER VI

Lundmark; PAPER VI
Modelling of stiffness reduction in SMC composites with evolving damage
M. Oldenbo1, 2 , P. Lundmark2 and J. Varna2,
1) Volvo Car Corporation, Exterior Engineering, dept 93610, PV3C2 SE-405 31 Göteborg, Sweden
2) Luleå University of Technology, Division of Polymer Engineering SE-971 87 Luleå, Sweden
To be submitted to Composite Science and Technology
AbstractThe development of damage in SMC composites is analysed using [0, ,0, ,0] model laminates with bundle structure and varying bundle orientation with respect to the applied load. Intrabundle cracks along the fibres and matrix cracks transverse to the applied load were identified as the most frequent damage mechanisms. The intrabundle crack evolution in bundles of different orientation was used for damage simulation in SMC composites. The damage effect on stiffness was evaluated using laminate analogy: SMC composite is replaced by quasi-isotropic laminate with through-the-thickness matrix cracks in sublaminates and with cracks in bundles. Stiffness reduction is simulated using a previously developed model for laminates with damage in arbitrary layers, which describes the reduction in terms of crack face displacements. The predicted elastic modulus reduction in SMC composites is significantly smaller than the measured. In this context the limitations of the assumptions made using the laminate analogy for the damaged SMC composite are discussed.
1. Introduction
It is common to describe the damage evolution in short fibre composites in tensile loading using a damage parameter linked to stiffness reduction [1,2,3,4]. The degree of damage is presented as a function of maximum stress (or strain) applied. The damage growth in sheet moulding compound (SMC) composite, measured as modulus reduction, is a complex process of evolving micro-cracking in a highly heterogeneous material. SMC is a short
Corresponding author. Address: Division of Polymer Engineering, Lulea University of Technology, SE-971 87 LULEA, SWEDEN. Tel.: +46-920-49-16-49; Fax.: +46-920-49-10-84; E-mail: [email protected]
149
Lundmark; PAPER VI
150
fibre composite with fibre bundles incorporating 180-400 fibres of length 25 mm [5,6,7]. SMC’s are considered as short fibre composites because of the bundle mesostructure: bundles act as thick and short fibres. Hour and Sehitoglu [8] linked the non-linear stress-strain behaviour of SMC to the formation of multiple cracks and increasing crack density with growing applied stress. Transversely oriented fibre bundles have been reported as initiating sites for cracks in SMC [7,9]. In general, crack initiation in composites may occur by fibre/matrix debonding in bundles, matrix/filler debonding and at bundle ends [8,10,11]. Final failure in SMC composite is considered to occur when various small damage entities distributed in the material join and form macro-cracks [8]. Cracks in in-plane isotropic SMC and short fibre composites loaded in uniaxial tension develop mainly transverse to the loading direction, see [9,12,13,14]. However, for materials with bundle structure, high degree of fibre orientation and with a high fibre content, cracks have been reported to tend to follow the main fibre direction, see the studies by Wang et al. [10,15] on fatigue damage evolution in short fibre composites. Development of large matrix cracks due to difference in stiffness between bundles and matrix coupled with shear stress has been discussed [13].
Jiao et al. [16] and Suzuki et al. [17] have concluded that the damage modes in standard SMC (Std-SMC) composite can be determined by the assessment of the acoustic emission (AE) wave frequency. Cracking in these materials is more likely to propagate in regions where the matrix dominates or where fibres are aligned in normal direction to the applied load. From AE analysis two basic initiation mechanisms could be determined: (a) Interfacial debonding of CaCO3 particles at moderate loading and (b) debonding between the fibres and resin, at higher loading. Interfacial debonding of CaCO3 in the Std-SMC material at low loading level was observed using in-situ microscopy [9], as well. The stiffness reduction has been modelled using laminate analogy by Kabelka et al.[18]. In their approach the fibre bundles were modelled as unidirectional (UD) plies followed by orientation averaging of the fibre orientation distribution. The model predicted failure in bundles dependent on the orientation with respect to the applied unidirectional load using failure criteria for UD-plies. These criteria contain transverse tensile strength and in-plane shear strength of the bundles as parameters.
In the present paper we analyse the potential and the limitations of the laminate approach to predict the damage evolution in SMC composites and to calculate the associated stiffness reduction. Identified damage modes being analysed are intrabundle cracks running parallel to fibre direction in bundles and matrix cracks in layers with a plane transverse to the loading
Lundmark; PAPER VI
direction. The applied damage evolution description in the SMC composite is based on observations and data obtained using model composites with prescribed orientation of bundles. A [0,90,0], [0,±45,0, ±45,0], [0,±60,0, ±60,0] and a [0,±75,0, ±75,0] bundle structure laminates were used to determine the damage evolution law in terms of crack density as a function of maximum strain history and bundle orientation angle. An attempt is made to include the angle dependence in a quadratic failure criterion which accounts for interaction between transverse and shear stresses in the bundle. It is shown that the intrabundle crack formation in bundles with an arbitrary orientation can not be described by this type of criterion.
The stiffness degradation modelling is based on laminate analogy, replacing the bundle structure of the SMC composite by quasi-isotropic layered composite were all bundle orientations are represented equally. To Analyse the undamaged layers and layers with matrix cracks the bundle structure is first smeared out and the layer's linear elastic properties are calculated using the average fibre content in Hashin’s model [19,20]. Considering intrabundle cracks a layer with certain bundle orientation is replaced by a three sub-layer structure where the bundle material sub-layer in the middle is surrounded by matrix material. Then, the model developed in [21,23] for stiffness determination of general damaged laminates with intralaminar cracks in layers is used. The simulated elastic modulus reduction as a function of strain is compared with test data and predictions based on several modifications of the ply-discount model. The adequacy of the model and differences between results are discussed.
2. Material
To produce laminates with bundle meso-structure and [0, ,0] , [0, ,0, ,0] lay-ups, first unidirectional (UD) SMC prepreg was produced from premixed SMC paste and glass fibre roving corresponding to Std-SMC formulation (delivered from Reichhold AS, Norway). In doing this, a layer of SMC-paste was added to a bed of oriented fibres. The recipe of the paste is given in Table 1. Roving R07 glass fibres from Owens Corning were used. The angle of orientation of bundles in the plies was 0 or ± degrees, =90, 75, 60 or 45 degrees. Plastic sheets in the bottom and sealing at the edges (Tacky tape distributed by Schnee-Morehead) were used to hold the prepreg together during manufacturing. After production, the prepreg was left for a maturing process for 5-10 days, during which the thickener which was added just before preparation of the prepreg acts to create viscosity increasing temporary bondings between polyester chains.
151
Lundmark; PAPER VI
This is in agreement with regular SMC prepreg production. The volume fraction of fibres in the laminates was to some extent controlled by weighting the amount of fibres and paste used in the prepreg. This method is not accurate because of the flow during moulding. More exact values were obtained by burning off the matrix, followed by removal of the CaCO3-filler with diluted HCl acid.
Table 1. Recipe of the SMC paste (based on supplier's data). Components Weight percent
Unsaturated polyester resin 23%Low Profile additives 13%
Calcium Carbonate filler 60%Inhibitor 1.3%Hardener 0.6%
Release agent 1.3%Thickener 0.8%
A tool to make plates was produced from two large aluminium plates and 2.5 mm steel shims to build a quadric cavity with a side of 250 mm. Hot moulding at 140-160 °C was followed by curing in the same operation for 3 minutes. A hydraulic press (distributed by Pasadena hydraulics, inc) with a maximum capacity of 18 tons and 300°C was used. A high-temperature resistant plastic film was used to hinder the moulded plate from sticking to the tool. Laminates of type [0,± ,0] and [0, ,0, ,0] were produced by charging the tool with a suitable stack of UD prepreg. Std-SMC plates (SMC 606 from Reichhold AS, Norway) were delivered in size of 2.5 x 300 x 300 mm. This SMC composite contains the same matrix as the produced laminates and 30 weight percent glass fibres from the same Roving type as was used for the laminates. Since tensile testing of samples from the plates showed that x and y directions in the plates had similar E-modulus, the plates were in following considered as in-plane isotropic. Since the E-modulus of Std-SMC paste was needed to calculate the effective UD properties using the micromechanics model [19,20], 2 mm plates made of paste of a similar formulation (Std-SMC) from Mecelec et Recyclage, France were tested.
152
Lundmark; PAPER VI
3. Experimental
3.1. Material morphology and volume fractions
Specimens of size 2.5 x 10 x 100 mm were cut from plates of a [0, ,0] , [0, ,0,
D
b bR
fb
,0] laminate and from random SMC (SMC-R). These specimens were edge-polished using sandpapers of size, in descending order: 120, 320, 600, 800, 1200 and 4000. Final polishing was done with diamond spray of 9, 6 and 3 m particle size. Volume fractions, bundle height and width were measured using image analysis software “Analysis” (distributed by SIS – Soft Imaging System). Average fibre diameter, ,average bundle width, , average bundle width/height ratio, , and average fibre bundle cross section area, , were obtained measuring on at least 20 bundles. The volume fraction of fibres in the bundle, V , was calculated from:
f
w
bA
b
ff
fb A2
DN
V
2
fN N
fN
fV f
(1)
where is the number of fibres in the bundle. is calculated from the linear density (grams per km roving) found in the supplier's data sheet [
f
22]for roving R07, the observed fibre diameter, , and the observed number of bundles in the roving. The observed number of bundles in the roving is 32. is then calculated to be 180.
fD
The average volume fraction of fibres in the laminates and in the SMC-R, , was calculated based on fibre weight fraction,W using the density of
the fibre and other constituents:
ff
c W
c
fV (2)
Here is the density of the composite and f is the density of the fibres. Density of the constituents is taken from [9]. for the laminates was fW
153
Lundmark; PAPER VI
obtained by burning off the matrix and for SMC-R by using the supplier's data. After burning off the matrix, the inorganic filler in the matrix was removed using diluted HCl acid. Volume fraction of bundles in the laminates and in SMC-R, V , was calculated from:
b
fb
f
VV
bV (3)
The thickness of the layers in the [0,± ,0] and in the [0, ,0, ,0]laminates was calculated assuming constant in all layers of the laminates and using the weight fractions of the fibres from 0 and layers, WrespectivelyW . The weight of the layer was obtained by careful separation of the fibre layers after burning off the matrix and removing the filler. The thickness of the layer, , is calculated as:
fV
0f
f
h
laminatef
f hWW
h (4)
3.2. Crack density
Specimens of size 2.5 x 20 x 200 mm for damage analysis were produced by cutting them out from the produced laminate plates. Rough polishing (320 paper) of the specimens' edges was performed before preloading them. To introduce damage, specimens were preloaded in a screw driven tensile testing machine (Instron 4411) to three strain levels: 5.0
154
%, 75.0 %and 0.1 %. Each specimen was used only at one preloading level. For optical microscopy analysis of the damage state inside the specimen, the ends of the original sample in the clamping region were discarded and the middle part of the specimen was cut parallel to the loading direction in to two specimens of size 2.5 x 10 x 100 mm. Polishing was similar as for samples for volume fraction analysis (see above). An optical Microscope (Zeiss Axioscope FS) with a digital video camera attached to it was used for counting the cracks in the samples. The image was reproduced using a PC and the software Mvpilot32 v3.01 (distributed by Matrix Vision). To increase the accuracy of crack counting, the specimens were during microscopy loaded to 10 MPa in tension using the Minimat tester
Lundmark; PAPER VI
(distributed by Polymer Laboratories, Thermal Sciences Division). This load which contributed to crack opening and the blue ink distributed to the specimens with methanol made the cracks more visible.
3.3. Stiffness reduction and matrix stiffness measurements
Specimens of size 2.5 x 20 x 200 mm were produced by cutting them out from the plates. Three material configurations were tested: SMC-R, [0,90,0] laminate and [0,±60,0] laminate. Six specimens were used for each material configuration. First, the undamaged material elastic modulus was measured. Then the specimens were loaded to a certain damage state, defined by the maximum strain history, and the modulus was afterwards measured again. Two strain levels (damage states) were considered using three specimens for each of them. Strain levels were set at 1 = 0.25%, 1 = 0.75% and
1 =1.0%, for the E-modulus measurements at respective damage states. Tensile test cross-head speed was 2 mm/min, and the strain rate logged using this crosshead speed was 2.7 x 10⁻⁴ s-1 in average. A hydraulic tensile testing machine (Instron 1272) was used in these tests.
E-modulus of the matrix (the continuous phase containing cured SMC-paste) which is needed to calculate UD properties of the homogenized composite was measured in bending using specimens of size 2 x 20 x 100 mm consisting only of moulded SMC paste. A screw driven tensile testing machine (MTS Alliance RF/100) was used.
4. Experimental Results
4.1. Material morphology and volume fractions
The fibre diameter, , was found to be 14.1 m with a standard deviation of 1.3 m. Based on the fibre diameter and the measured bundle cross-section area, the volume fraction of fibres in the bundles was calculated. The results for bundles in laminates (index
fD
L ) and transverse bundles in SMC-R (index ), with standard deviation given in parentheses, are: SMC
)10
)
.0(41.0
17.0(58.0SMCfb
Lfb
V
V (5)
155
Lundmark; PAPER VI
The volume fraction of fibres in the bundle around 0.5 has previously been reported in [18] which is in good agreement with our result. SMC panels are produced with a charge covering normally about 50% of the tool surface, in order to remove air in the prepreg during the flow of the material when filling up the cavity. The bundles are dispersed during the material flow. When producing laminates, the flow in the tool was minimized to preserve the fibre orientation. Due to differences in moulding condition and fibre bundle length and alignment, the SMC has lower volume fraction of fibres in the bundles compared to the laminates. The higher spread of volume fraction of fibres in continuous fibre laminates is explained by the long length of its bundles. Depending on how far from the end of the bundle, the measuring point is located, the shear flow will have different ability to infiltrate the bundle with matrix, because the force to keep it unchanged is different. The same volume fractions of fibres in the bundles would be preferred for the coming comparisons. The statistics indicate a wide spectrum of volume fractions, i.e. the difference in mean value may be less critical.
The average bundle width, , and the average bundle width/height ratio, , for SMC-R and laminates with standard deviation given in parentheses are:
bw
bR
m
)2.3
)9.
b h
wmw
SMCb
Lb
)300(1100
)300(900 (6)
(7.8
4(3.10SMCb
Lb
RR
(7)
The bundle cross section is well described by an elliptic shape, but due to the high ratio between width and height, a rectangular shape would also be adequate. The measured fibre weight- and volume fractions in the layers of the analyzed laminates are seen in Table 2. The calculated volume fractions of bundles, V and the calculated thickness, , of laminate and layer are seen in Table 2 as well.
156
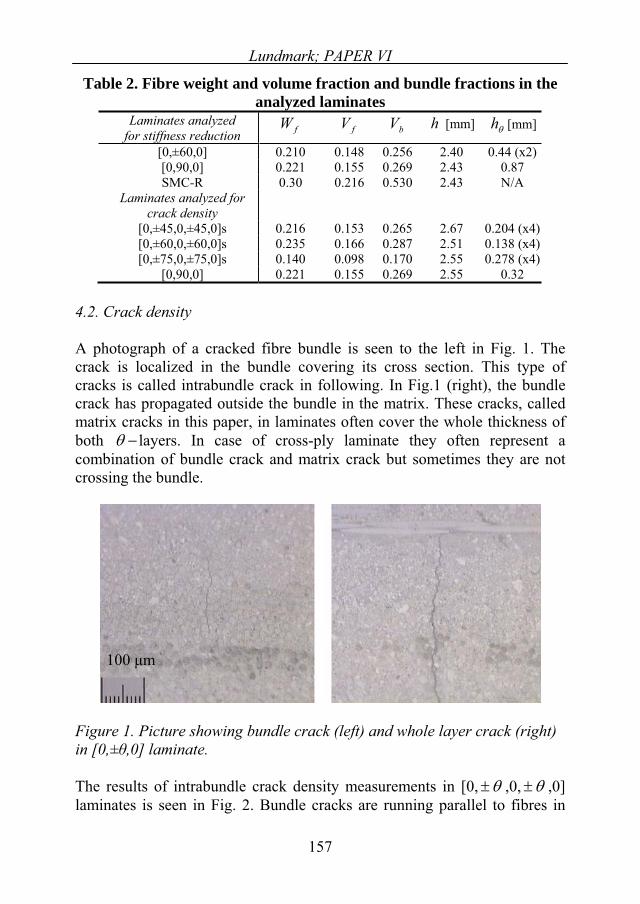
Lundmark; PAPER VI
Table 2. Fibre weight and volume fraction and bundle fractions in the analyzed laminates
Laminates analyzed for stiffness reduction fW fV bV h h[mm] [mm]
[0,±60,0] 0.210 0.148 0.256 2.40 0.44 (x2) [0,90,0] 0.221 0.155 0.269 2.43 0.87 SMC-R 0.30 0.216 0.530 2.43 N/A
Laminates analyzed for crack density
[0,±45,0,±45,0]s 0.216 0.153 0.265 2.67 0.204 (x4) [0,±60,0,±60,0]s 0.235 0.166 0.287 2.51 0.138 (x4) [0,±75,0,±75,0]s 0.140 0.098 0.170 2.55 0.278 (x4)
[0,90,0] 0.221 0.155 0.269 2.55 0.32
4.2. Crack density
A photograph of a cracked fibre bundle is seen to the left in Fig. 1. The crack is localized in the bundle covering its cross section. This type of cracks is called intrabundle crack in following. In Fig.1 (right), the bundle crack has propagated outside the bundle in the matrix. These cracks, called matrix cracks in this paper, in laminates often cover the whole thickness of both layers. In case of cross-ply laminate they often represent a combination of bundle crack and matrix crack but sometimes they are not crossing the bundle.
100 m
Figure 1. Picture showing bundle crack (left) and whole layer crack (right) in [0,± ,0] laminate.
The results of intrabundle crack density measurements in [0, ,0, ,0]laminates is seen in Fig. 2. Bundle cracks are running parallel to fibres in
157
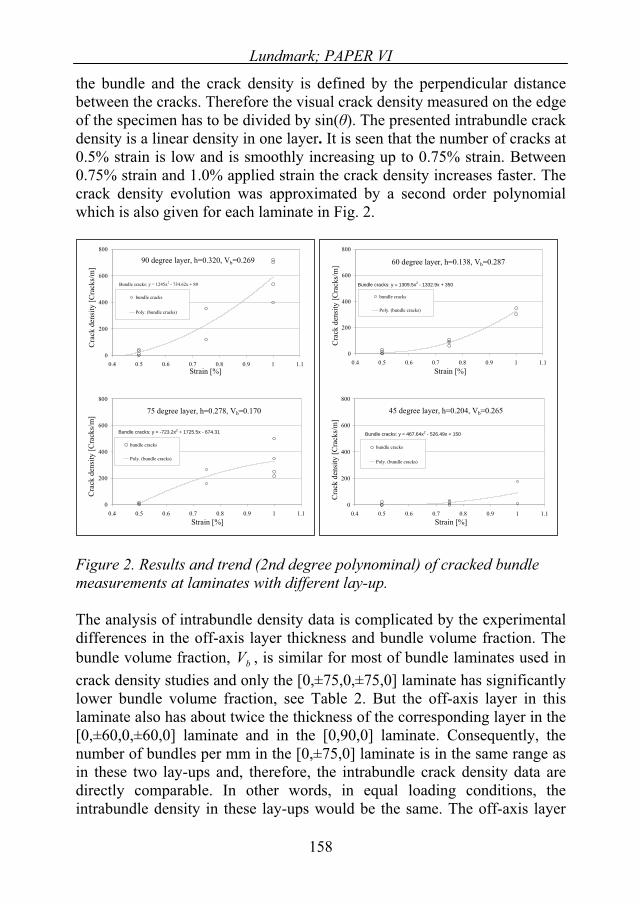
Lundmark; PAPER VI
the bundle and the crack density is defined by the perpendicular distance between the cracks. Therefore the visual crack density measured on the edge of the specimen has to be divided by sin( ). The presented intrabundle crack density is a linear density in one layer. It is seen that the number of cracks at 0.5% strain is low and is smoothly increasing up to 0.75% strain. Between 0.75% strain and 1.0% applied strain the crack density increases faster. The crack density evolution was approximated by a second order polynomial which is also given for each laminate in Fig. 2.
158
Figure 2. Results and trend (2nd degree polynominal) of cracked bundle measurements at laminates with different lay-up.
The analysis of intrabundle density data is complicated by the experimental differences in the off-axis layer thickness and bundle volume fraction. The bundle volume fraction, V , is similar for most of bundle laminates used in crack density studies and only the [0,±75,0,±75,0] laminate has significantly lower bundle volume fraction, see Table 2. But the off-axis layer in this laminate also has about twice the thickness of the corresponding layer in the [0,±60,0,±60,0] laminate and in the [0,90,0] laminate. Consequently, the number of bundles per mm in the [0,±75,0] laminate is in the same range as in these two lay-ups and, therefore, the intrabundle crack density data are directly comparable. In other words, in equal loading conditions, the intrabundle density in these lay-ups would be the same. The off-axis layer
b
90 degree layer, h=0.320, Vb=0.269
Bundle cracks: y = 1245x2 - 734.62x + 80
0
200
400
600
800
0.4 0.5 0.6 0.7 0.8 0.9 1 1.1Strain [%]
Cra
ck d
ensi
ty [C
rack
s/m
]
bundle cracks
Poly. (bundle cracks)
75 degree layer, h=0.278, Vb=0.170
Bundle cracks: y = -723.2x2 + 1725.5x - 674.31
0
200
400
600
800
0.4 0.5 0.6 0.7 0.8 0.9 1 1.1Strain [%]
Cra
ck d
ensi
ty [C
rack
s/m
]
bundle cracks
Poly. (bundle cracks)
60 degree layer, h=0.138, Vb=0.287
Bundle cracks: y = 1309.5x2 - 1332.9x + 350
0
200
400
600
800
0.4 0.5 0.6 0.7 0.8 0.9 1 1.1Strain [%]
Cra
ck d
ensi
ty [C
rack
s/m
]
bundle cracks
Poly. (bundle cracks)
45 degree layer, h=0.204, Vb=0.265
Bundle cracks: y = 467.64x2 - 526.49x + 150
0
200
400
600
800
0.4 0.5 0.6 0.7 0.8 0.9 1 1.1Strain [%]
Cra
ck d
ensi
ty [C
rack
s/m
]
bundle cracks
Poly. (bundle cracks)

Lundmark; PAPER VI
thickness in the [0,±45,0,±45,0] laminate is almost 30% higher than in the [0,±60,0,±60,0] and in the [0,90,0] laminates used for damage analysis. Since the bundle volume fraction in these laminates is very similar, we conclude that there are more bundles per mm in the 45-layer. In equal loading conditions it would lead to more intralaminar cracks per mm. The experimental crack density shows the following trends: the intrabundle crack density is the highest in 90-bundles and the crack density decreases with decreasing orientation angle. The lowest crack density at the same applied strain is in 45-bundles. The main reason is the different stress in bundles of different orientation: the transverse stress is decreasing and the shear stress is increasing with decreasing orientation angle. The results indicate that the tensile stress (or strain) component transverse to the fibre bundles is the main driving force for intrabundle crack formation. This component at fixed applied strain level is much larger in bundles with 90-orientation. Since the intrabundle crack density in the [0,±45,0,±45,0] laminate is the lowest of all lay-ups, but shear stress in the bundle axes is the highest, we conclude that shear stress (strain) contributes less to damage formation. Most of the matrix cracks are covering the whole thickness of the
sublaminate. A smaller amount of matrix cracks is over only one of the layer and they are in following statistics counted as 0.5 matrix cracks.
The matrix crack density is presented in Fig. 3. The largest matrix crack density is in the -sublaminate which is the thickest. The density in
and 90 sublaminates is almost equal. The matrix crack density is the lowest in sublaminates.
7560
45
Matrix cracks ,
0
100
200
300
400
500
600
0,5 0,6 0,7 0,8 0,9 1,0 1,1
Applied strain (%)
Cra
ck d
ensit
y (c
r/m
) 45607590
Figure 3. Matrix cracks in damage evolution specimens as a function of applied strain.
159
Lundmark; PAPER VI
There are no clear reasons for these trends, but variation in laminate thickness and volume fractions of bundles are reasonable explanations. Since the matrix crack plane is transverse to the load, the arguments used previously to describe the intrabundle crack density are not valid here. The number of bundles per mm is irrelevant unless these bundle cracks may initiate matrix cracks. The orientation of bundles and the presence of shear stress in bundle local axes seems also be irrelevant. One possible reason for the highest matrix crack density in 75 sublaminates may be the much higher thickness of this sublaminate: it has been proven before [24], that transverse cracks in thick layers occur at lower strain. However, this fracture mechanics related phenomenon can not explain the very low matrix crack density in sublaminates. It seems that the number of matrix cracks is somehow related to the number of bundle cracks which is low in sublaminates. Unfortunately the existence or absence of correlation between both crack types is not reported in any statistical investigation known to authors. In most cases matrix cracks go through the bundles but the opposite is also seen.
4545
5. Micromechanics modelling of damage evolution and stiffness reduction
5.1. Damage evolution description
Damage evolution modelling is a very complex problem and here we use several simplifying assumptions and experimental data obtained using laminates with bundle structure, see results in Section 4. A simple model forintrabundle crack evolution can be derived combining damage evolution curve for 90-orientation bundles with a mixed mode failure criterion as described below. We assume that the intrabundle crack density in a layer with a certain bundle orientation depends on the strain in transverse direction to the bundle and on the level of in-plane shear strain. Thinking in terms of a strain based failure criteria which includes interaction between transverse and shear strain, the condition for bundle cracking can be written as
12
u12
122
u22
22 (8)
160
Lundmark; PAPER VI
Since the strength distribution of bundles has a statistical nature, intrabundle cracks do not appear all at once as it would be in the ply discount model. The first crack comes in the weakest bundle and the number of cracks increases with the applied strain. Hence, for the first crack the values of u22
and u12 are lower than for the following ones. Realizing the statistical nature of strength parameters in Equation (8) we assume here that the ratio between shear and transverse strength remains constant for all cracking events
.constk2
u12
u22 (9)
Introducing the effective strain as
212
u22
222eff k (10)
the criterion in Equation (8) can be rewritten in form
eff (11)
By Equation (11) we postulate that intrabundle cracking is governed by the effective stress and therefore the intrabundle crack density actually depends on the effective strain, eff . It means that the next crack event takes place when the effective strain in the bundle reaches a value equal to the transverse strength of the weakest of the still survived bundles. The effective strain defined by Equation (10) is a simple way to describe the importance of interaction of transverse and shear loading for cracking in a bundle with an arbitrary orientation. The statistical nature of the strength distribution is reflected in the crack density versus effective strain curve, eff . We suggest that this relationship (master curve) is obtained from experimental damage evolution data in 90-bundles of the [0,90,0] laminate where the effective strain is equal to the transverse strain. For this orientation the shear strain component is zero. The transverse strain is assumed to be equal to the applied strain, which is a good approximation for bundles with width/height ratio given by Equation (7). The mean value of the bundle crack density in 90-layer is approximated by second degree polynomial and used to predict damage evolution in other laminates. In order to use it for laminates with
161
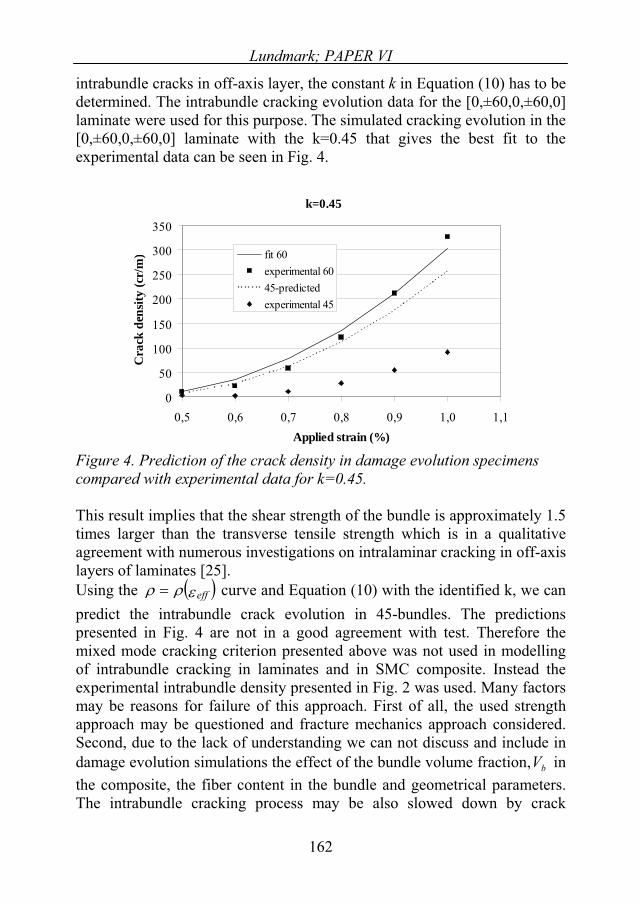
Lundmark; PAPER VI
intrabundle cracks in off-axis layer, the constant k in Equation (10) has to be determined. The intrabundle cracking evolution data for the [0,±60,0,±60,0] laminate were used for this purpose. The simulated cracking evolution in the [0,±60,0,±60,0] laminate with the k=0.45 that gives the best fit to the experimental data can be seen in Fig. 4.
k=0.45
0
50
100
150
200
250
300
350
0,5 0,6 0,7 0,8 0,9 1,0 1,1Applied strain (%)
Cra
ck d
ensi
ty (c
r/m
) fit 60experimental 6045-predictedexperimental 45
Figure 4. Prediction of the crack density in damage evolution specimens compared with experimental data for k=0.45.
This result implies that the shear strength of the bundle is approximately 1.5 times larger than the transverse tensile strength which is in a qualitative agreement with numerous investigations on intralaminar cracking in off-axis layers of laminates [25]. Using the eff curve and Equation (10) with the identified k, we can predict the intrabundle crack evolution in 45-bundles. The predictions presented in Fig. 4 are not in a good agreement with test. Therefore the mixed mode cracking criterion presented above was not used in modelling of intrabundle cracking in laminates and in SMC composite. Instead the experimental intrabundle density presented in Fig. 2 was used. Many factors may be reasons for failure of this approach. First of all, the used strength approach may be questioned and fracture mechanics approach considered. Second, due to the lack of understanding we can not discuss and include in damage evolution simulations the effect of the bundle volume fraction,V in the composite, the fiber content in the bundle and geometrical parameters. The intrabundle cracking process may be also slowed down by crack
b
162
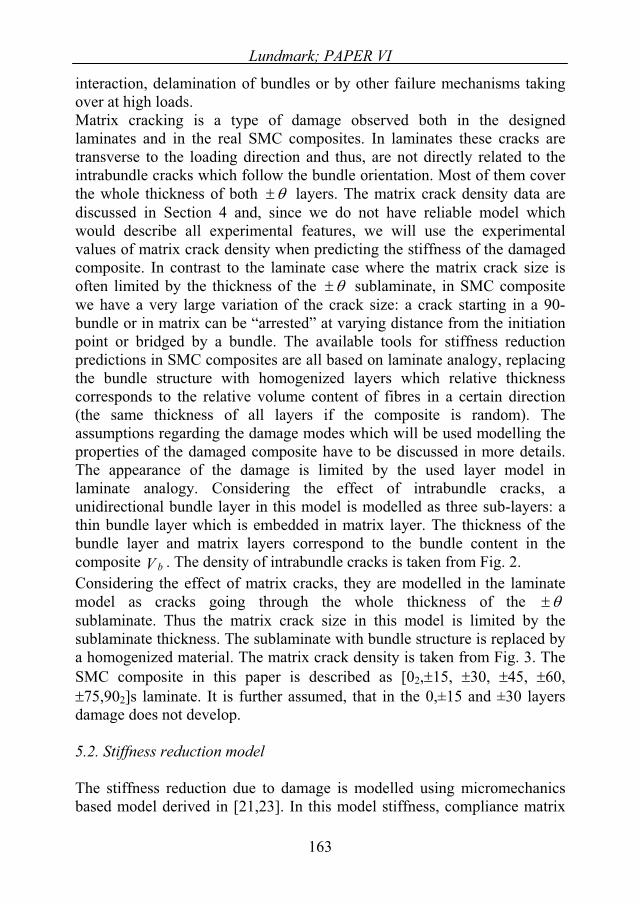
Lundmark; PAPER VI
interaction, delamination of bundles or by other failure mechanisms taking over at high loads. Matrix cracking is a type of damage observed both in the designed laminates and in the real SMC composites. In laminates these cracks are transverse to the loading direction and thus, are not directly related to the intrabundle cracks which follow the bundle orientation. Most of them cover the whole thickness of both layers. The matrix crack density data are discussed in Section 4 and, since we do not have reliable model which would describe all experimental features, we will use the experimental values of matrix crack density when predicting the stiffness of the damaged composite. In contrast to the laminate case where the matrix crack size is often limited by the thickness of the sublaminate, in SMC composite we have a very large variation of the crack size: a crack starting in a 90-bundle or in matrix can be “arrested” at varying distance from the initiation point or bridged by a bundle. The available tools for stiffness reduction predictions in SMC composites are all based on laminate analogy, replacing the bundle structure with homogenized layers which relative thickness corresponds to the relative volume content of fibres in a certain direction (the same thickness of all layers if the composite is random). The assumptions regarding the damage modes which will be used modelling the properties of the damaged composite have to be discussed in more details. The appearance of the damage is limited by the used layer model in laminate analogy. Considering the effect of intrabundle cracks, a unidirectional bundle layer in this model is modelled as three sub-layers: a thin bundle layer which is embedded in matrix layer. The thickness of the bundle layer and matrix layers correspond to the bundle content in the composite V . The density of intrabundle cracks is taken from Fig. 2. b
Considering the effect of matrix cracks, they are modelled in the laminate model as cracks going through the whole thickness of the sublaminate. Thus the matrix crack size in this model is limited by the sublaminate thickness. The sublaminate with bundle structure is replaced by a homogenized material. The matrix crack density is taken from Fig. 3. The SMC composite in this paper is described as [02, 15, 30, 45, 60,
75,902]s laminate. It is further assumed, that in the 0,±15 and ±30 layers damage does not develop.
5.2. Stiffness reduction model
The stiffness reduction due to damage is modelled using micromechanics based model derived in [21,23]. In this model stiffness, compliance matrix
163
Lundmark; PAPER VI
and thermal expansion coefficients of an arbitrary symmetric laminate with through the thickness cracks in layers are presented in an explicit form. Derivation of constitutive relationships is following the same routes as in classical laminate theory. The damaged laminate stiffness and thermal expansion coefficient matrices are calculated from the undamaged laminate matrices multiplying by a matrix which differs from the identity matrix by terms dependent on crack density in layers, stiffness matrix and orientation of these layers and includes a crack face displacement related matrix. The normalized crack face opening (COD) and sliding displacements (CSD) are considered as dependent on the constraint of the surrounding layers in terms of their stiffness and thickness. These dependences are analyzed in [21] and [23] using FEM-calculated crack face opening and sliding displacement profiles in generalized plane strain formulation. The obtained dependences are fitted by power laws.A symmetric laminate subjected to general in-plane loading is considered. The intralaminar cracks are assumed to run parallel to fibres with a crack plane transverse to the laminate middle-plane and to cross the whole widths of the layer. Laminate contains N layers and the k-th layer is characterized by stiffness , thickness and fibre orientation angle which determines the stress transformation matrix between global and local coordinates .The line above the matrix and vectors denotes entities in the global coordinate system. The crack density in a layer is
Q k
T k
hk
k and the normalized crack density
kn is defined as
kkhkn (12)
The expression for the stiffness matrix of the damaged laminate is
LAMk
LAMkkk
Tk
N
kkkn
LAM QhSQTUTQhE
IQ 0
1
0
_
1
_
2
1][ (13)
where is the laminate thickness, Eh 2 is the layer modulus transverse to the fibre direction, [S0]LAM and [Q0]LAM are the compliance and the stiffness matrices of the undamaged laminate. [U]k is a matrix which contains the normalized crack face opening and sliding displacements
164

Lundmark; PAPER VI
kan
kank
uGE
uU
112
2
2
00
00000
2 (14)
Here the normalized crack opening displacement is calculated using expression
n
s
2
52.0
an EE
BAu2 (15)
As
sk
hhh
B2
21652.03075.0
7037.02
0626.02
030667.02
s
k
s
k
hh
hh
n (16)
In Equation (15), is the elastic modulus of the material surrounding the cracked layer in the direction transverse to the crack plane, h in Equation (16) is the thickness of this material.
Es
s
The normalized crack face sliding displacement can be with a sufficient accuracy calculated using the following expression
n
sanGGBAu
12
121 (17)
82.0 2
054.0066.0 3.0 nh
hBA
s
k (18)
This model will be applied to calculate the stiffness reduction due to following damage mechanisms:
a) intrabundle cracks parallel to bundle direction with density which follows from curves in Fig. 2. The -layer with cracked bundles is represented as a symmetric three sub-layer laminate with the bundle material layer in the middle, see Fig. 5.
165
Lundmark; PAPER VI
Rest of layers
Matrix Homogenized layer
Bundle material
166
Matrix
Rest of layers
Figure 5. Model used to calculate stiffness in laminated composite with intrabundle cracks
The initial stiffness of the -layer is determined from the 3 sub-layer model using classical laminate theory (CLT). It is used to calculate the initial stiffness of the sublaminate. The intrabundle cracks in this model become intralaminar cracks in the middle sub-layer of the 3 sub-layer model. This representation is used to calculate the COD and CSD of intrabundle cracks using Equations (15)-(18). Then the effective stiffness of the sublaminate is calculated using Eqs. (12)-(15). Finally CLT is used to calculate the stiffness of the laminate ([0, ,0] or the one representing the SMC composite).
b) matrix cracks going through both layers with the crack plane transverse to the loading direction and with the crack density as presented in Fig.3. The layer properties are calculated using the average fibre content and Hashin’s micromechanics. Then both off-axis layers are replaced by one effective orthotropic sublaminate with initial properties from CLT. In this sublaminate through-the-thickness cracks with 90-orientation are introduced and the above model (Equations (12)-(18) ) is applied to the laminate under consideration.
To estimate the most extreme value of the stiffness reduction, ply discount model in two modifications will be applied. In the classical form the whole stiffness matrix of the damaged layer is assumed to be zero. In the modified version only the transverse modulus and shear modulus are assumed zero after the layer failure.
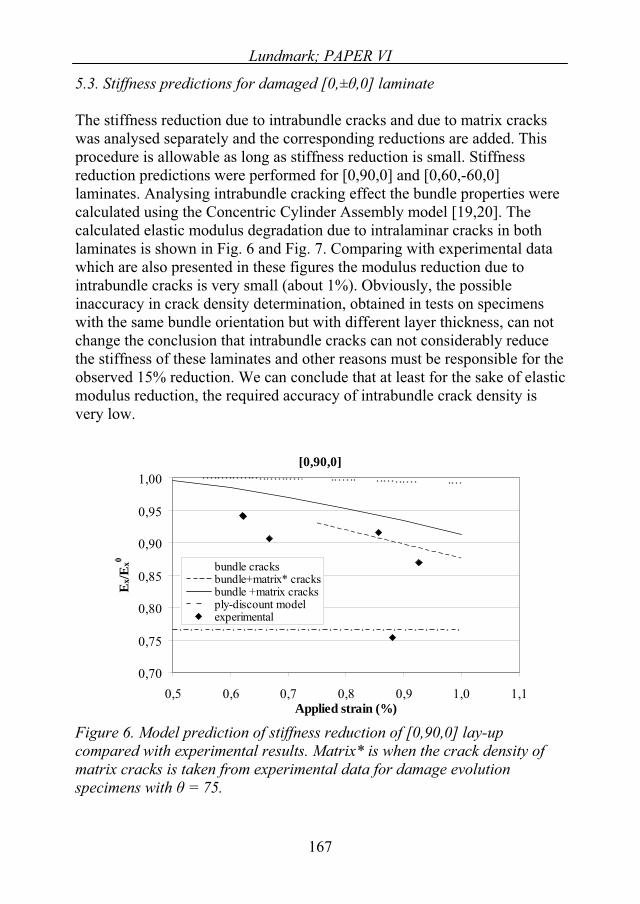
Lundmark; PAPER VI
5.3. Stiffness predictions for damaged [0,± ,0] laminate
he stiffness reduction due to intrabundle cracks and due to matrix cracks
ies were
ens
e
Twas analysed separately and the corresponding reductions are added. This procedure is allowable as long as stiffness reduction is small. Stiffness reduction predictions were performed for [0,90,0] and [0,60,-60,0] laminates. Analysing intrabundle cracking effect the bundle propertcalculated using the Concentric Cylinder Assembly model [19,20]. The calculated elastic modulus degradation due to intralaminar cracks in bothlaminates is shown in Fig. 6 and Fig. 7. Comparing with experimental datawhich are also presented in these figures the modulus reduction due to intrabundle cracks is very small (about 1%). Obviously, the possible inaccuracy in crack density determination, obtained in tests on specimwith the same bundle orientation but with different layer thickness, can notchange the conclusion that intrabundle cracks can not considerably reduce the stiffness of these laminates and other reasons must be responsible for thobserved 15% reduction. We can conclude that at least for the sake of elastic modulus reduction, the required accuracy of intrabundle crack density is very low.
[0,90,0]
0,70
0,75
0,80
0,85
0,90
0,95
1,00
0,5 0,6 0,7 0,8 0,9 1,0 1,1Applied strain (%)
Ex/E
x0
bundle cracksbundle+matrix* cracksbundle +matrix cracksply-discount modelexperimental
Figure 6. Model prediction of stiffness reduction of [0,90,0] lay-up ity of compared with experimental results. Matrix* is when the crack dens
matrix cracks is taken from experimental data for damage evolution specimens with = 75.
167
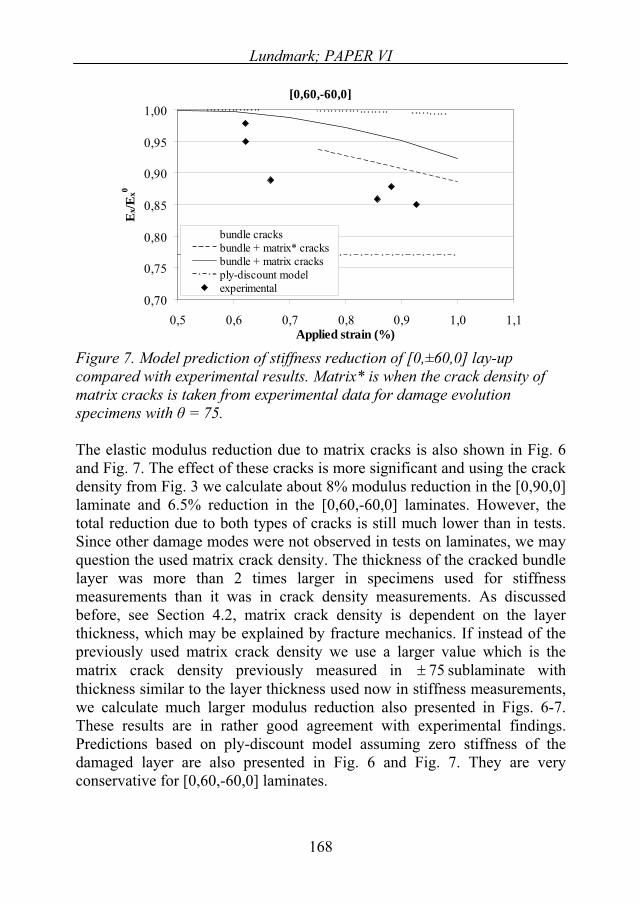
Lundmark; PAPER VI
[0,60,-60,0]
0,70
0,75
0,80
0,85
0,90
0,95
1,00
0,5 0,6 0,7 0,8 0,9 1,0 1,1Applied strain (%)
Ex/E
x0
bundle cracksbundle + matrix* cracksbundle + matrix cracksply-discount modelexperimental
Figure 7. Model prediction of stiffness reduction of [0,±60,0] lay-up y of
he elastic modulus reduction due to matrix cracks is also shown in Fig. 6
compared with experimental results. Matrix* is when the crack densitmatrix cracks is taken from experimental data for damage evolution specimens with = 75.
Tand Fig. 7. The effect of these cracks is more significant and using the crack density from Fig. 3 we calculate about 8% modulus reduction in the [0,90,0] laminate and 6.5% reduction in the [0,60,-60,0] laminates. However, the total reduction due to both types of cracks is still much lower than in tests. Since other damage modes were not observed in tests on laminates, we may question the used matrix crack density. The thickness of the cracked bundle layer was more than 2 times larger in specimens used for stiffness measurements than it was in crack density measurements. As discussed before, see Section 4.2, matrix crack density is dependent on the layer thickness, which may be explained by fracture mechanics. If instead of the previously used matrix crack density we use a larger value which is the matrix crack density previously measured in 75 sublaminate with thickness similar to the layer thickness used now in s ess measurements, we calculate much larger modulus reduction also presented in Figs. 6-7. These results are in rather good agreement with experimental findings. Predictions based on ply-discount model assuming zero stiffness of the damaged layer are also presented in Fig. 6 and Fig. 7. They are very conservative for [0,60,-60,0] laminates.
tiffn
168
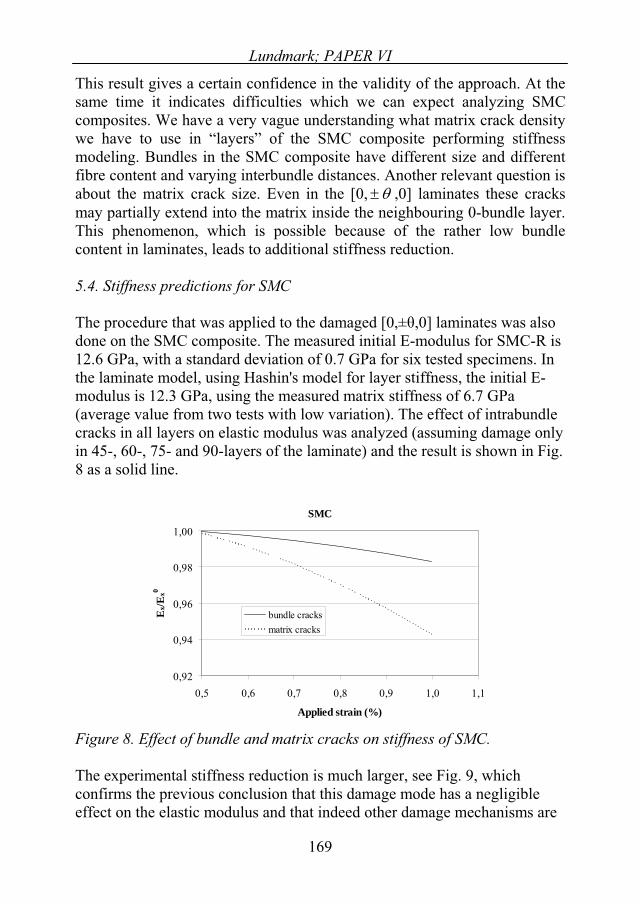
Lundmark; PAPER VI
This result gives a certain confidence in the validity of the approach. At the same time it indicates difficulties which we can expect analyzing SMC composites. We have a very vague understanding what matrix crack density we have to use in “layers” of the SMC composite performing stiffness modeling. Bundles in the SMC composite have different size and different fibre content and varying interbundle distances. Another relevant question is about the matrix crack size. Even in the [0, ,0] laminates these cracks may partially extend into the matrix inside the neighbouring 0-bundle layer. This phenomenon, which is possible because of the rather low bundle content in laminates, leads to additional stiffness reduction.
5.4. Stiffness predictions for SMC
The procedure that was applied to the damaged [0,± ,0] laminates was also done on the SMC composite. The measured initial E-modulus for SMC-R is 12.6 GPa, with a standard deviation of 0.7 GPa for six tested specimens. In the laminate model, using Hashin's model for layer stiffness, the initial E-modulus is 12.3 GPa, using the measured matrix stiffness of 6.7 GPa (average value from two tests with low variation). The effect of intrabundle cracks in all layers on elastic modulus was analyzed (assuming damage only in 45-, 60-, 75- and 90-layers of the laminate) and the result is shown in Fig. 8 as a solid line.
SMC
0,92
0,94
0,96
0,98
1,00
0,5 0,6 0,7 0,8 0,9 1,0 1,1
Applied strain (%)
Ex/E
x0
bundle cracksmatrix cracks
Figure 8. Effect of bundle and matrix cracks on stiffness of SMC.
The experimental stiffness reduction is much larger, see Fig. 9, which confirms the previous conclusion that this damage mode has a negligible effect on the elastic modulus and that indeed other damage mechanisms are
169
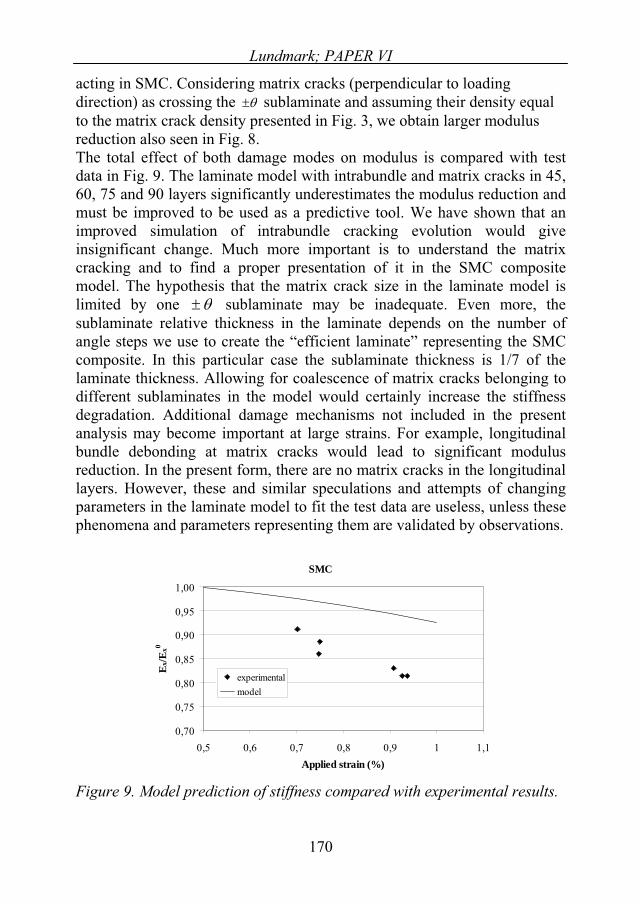
Lundmark; PAPER VI
acting in SMC. Considering matrix cracks (perpendicular to loading direction) as crossing the sublaminate and assuming their density equal to the matrix crack density presented in Fig. 3, we obtain larger modulus reduction also seen in Fig. 8.The total effect of both damage modes on modulus is compared with test data in Fig. 9. The laminate model with intrabundle and matrix cracks in 45, 60, 75 and 90 layers significantly underestimates the modulus reduction and must be improved to be used as a predictive tool. We have shown that an improved simulation of intrabundle cracking evolution would give insignificant change. Much more important is to understand the matrix cracking and to find a proper presentation of it in the SMC composite model. The hypothesis that the matrix crack size in the laminate model is limited by one sublaminate may be inadequate. Even more, the sublaminate relative thickness in the laminate depends on the number of angle steps we use to create the “efficient laminate” representing the SMC composite. In this particular case the sublaminate thickness is 1/7 of the laminate thickness. Allowing for coalescence of matrix cracks belonging to different sublaminates in the model would certainly increase the stiffness degradation. Additional damage mechanisms not included in the present analysis may become important at large strains. For example, longitudinal bundle debonding at matrix cracks would lead to significant modulus reduction. In the present form, there are no matrix cracks in the longitudinal layers. However, these and similar speculations and attempts of changing parameters in the laminate model to fit the test data are useless, unless these phenomena and parameters representing them are validated by observations.
SMC
0,70
0,75
0,80
0,85
0,90
0,95
1,00
0,5 0,6 0,7 0,8 0,9 1 1,1Applied strain (%)
Ex/E
x0
experimentalmodel
Figure 9. Model prediction of stiffness compared with experimental results.
170
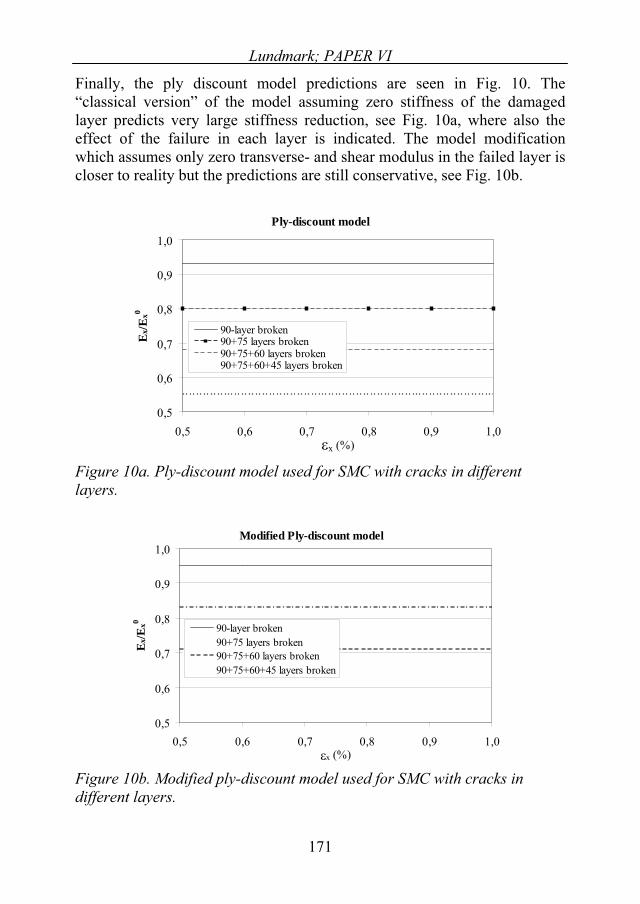
Lundmark; PAPER VI
Finally, the ply discount model predictions are seen in Fig. 10. The “classical version” of the model assuming zero stiffness of the damaged layer predicts very large stiffness reduction, see Fig. 10a, where also the effect of the failure in each layer is indicated. The model modification which assumes only zero transverse- and shear modulus in the failed layer is closer to reality but the predictions are still conservative, see Fig. 10b.
Ply-discount model
0,5
0,6
0,7
0,8
0,9
1,0
0,5 0,6 0,7 0,8 0,9 1,0x
Ex/E
x0
90-layer broken90+75 layers broken90+75+60 layers broken90+75+60+45 layers broken
Figure 10a. Ply-discount model used for SMC with cracks in different layers.
Modified Ply-discount model
0,5
0,6
0,7
0,8
0,9
1,0
0,5 0,6 0,7 0,8 0,9 1,0x (%)
Ex/E
x0
90-layer broken90+75 layers broken90+75+60 layers broken90+75+60+45 layers broken
Figure 10b. Modified ply-discount model used for SMC with cracks in different layers.
171

Lundmark; PAPER VI
6. Conclusions
I. Damage evolution in SMC composite was characterized using [0, ,0, ,0] model composites with bundle structure and varying the bundle orientation. Using optical microscopy intrabundle cracks running parallel to fibres in bundles and matrix cracks transverse to the loading were identified as the most frequent damage mechanisms. The damage evolution with increasing applied strain was quantified.
II. It was seen that the intrabundle crack density is mainly governed by the stress component transverse to the bundle axis. Therefore the intrabundle crack density is the highest in bundles with 90-orientation and lowest in bundles with 45-orientation. Predictions of the intrabundle crack effect on stiffness showed that they have only marginal effect on the elastic modulus reduction in the loading direction.
III. The matrix cracks are much more significant for stiffness reduction. The two main factors determining the crack density in sublaminates are the thickness of this sublaminate and the bundle orientation in it. The observed larger crack density for larger thickness may be attributed to fracture mechanics aspects of crack formation. The number of matrix cracks in the 45 sublaminate was much smaller than in 90-sublaminate with approximately the same thickness. This fact indicates that there is at present unknown relationship between the number of intrabundle cracks in the layer and the number of matrix cracks. The effect of the average fibre content and the bundle content in the composite is also unclear at this point.
IV. Analysing the stiffness of the damaged SMC composite using laminate analogy with introduced intrabundle cracks and matrix cracks in layers the composite was represented by a [02, 15, 30,
45, 60, 75,902]s laminate. The elastic properties of layers in this model were obtained by homogenizing over the bundle structure. Applying to this “effective laminate” a previously developed stiffness reduction model with high accuracy we found that intrabundle cracks have very marginal effect of stiffness. It is
172
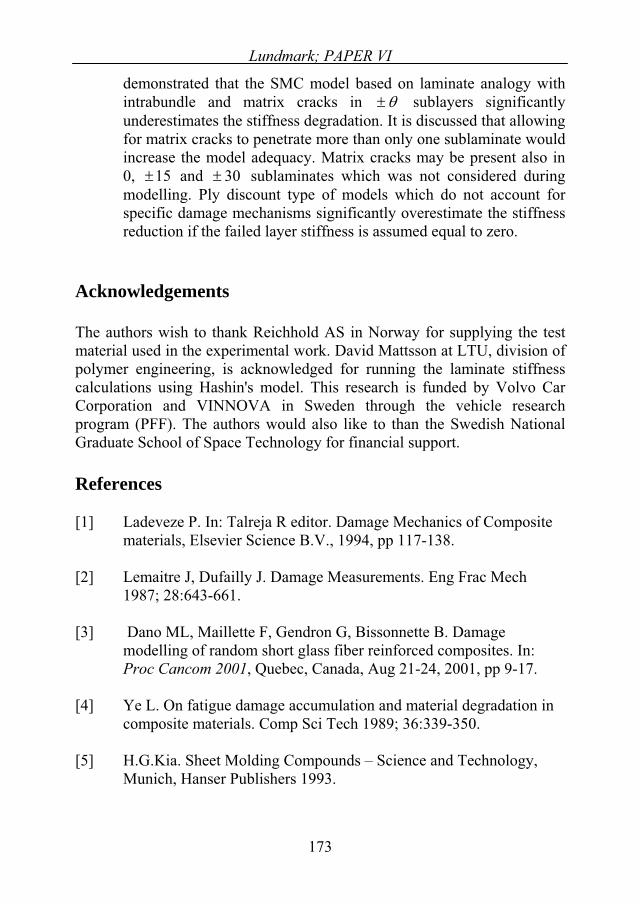
Lundmark; PAPER VI
demonstrated that the SMC model based on laminate analogy with intrabundle and matrix cracks in sublayers significantly underestimates the stiffness degradation. It is discussed that allowing for matrix cracks to penetrate more than only one sublaminate would increase the model adequacy. Matrix cracks may be present also in 0, and sublaminates which was not considered during modelling. Ply discount type of models which do not account for specific damage mechanisms significantly overestimate the stiffness reduction if the failed layer stiffness is assumed equal to zero.
15 30
Acknowledgements
The authors wish to thank Reichhold AS in Norway for supplying the test material used in the experimental work. David Mattsson at LTU, division of polymer engineering, is acknowledged for running the laminate stiffness calculations using Hashin's model. This research is funded by Volvo Car Corporation and VINNOVA in Sweden through the vehicle research program (PFF). The authors would also like to than the Swedish National Graduate School of Space Technology for financial support.
References
[1] Ladeveze P. In: Talreja R editor. Damage Mechanics of Composite materials, Elsevier Science B.V., 1994, pp 117-138.
[2] Lemaitre J, Dufailly J. Damage Measurements. Eng Frac Mech 1987; 28:643-661.
[3] Dano ML, Maillette F, Gendron G, Bissonnette B. Damage modelling of random short glass fiber reinforced composites. In: Proc Cancom 2001, Quebec, Canada, Aug 21-24, 2001, pp 9-17.
[4] Ye L. On fatigue damage accumulation and material degradation in composite materials. Comp Sci Tech 1989; 36:339-350.
[5] H.G.Kia. Sheet Molding Compounds – Science and Technology, Munich, Hanser Publishers 1993.
173
Lundmark; PAPER VI
174
[6] S.P. Fernberg and L.A. Berglund. Bridging law and toughness characterisation CSM and SMC composites. Comp Sci Tech 2002; 61:2445-2454.
[7] D. Hull, An introduction to composite materials, Cambridge solid state science 1981.
[8] Hour KY, Sehitoglu H. Damage development in a short fibre composite. J Comp Mat 1993;27:782-805
[9] Oldenbo M, Fernberg SP, Berglund LA, Mechanical behaviour of SMC composites with toughening and low density additives. Comp A 2003; 34:875-885.
[10] Wang SS, Chim ESM. Fatigue damage and degradation in random short-fiber SMC composite. J Comp Mat 1983; 17:114-134.
[11] Fitoussi J, Guo G, Baptiste D. A statistical micromechanical model of anisotropic damage for SMC composites. Comp Sci Tech 1998; 58:759-763.
[12] Dano ML, Gendron G, Mir H. Mechanics of damage and degradation in random short glass fiber reinforced composites. J Thermopl Comp Mat 2002; 15:169-177.
[13] Von Bernstoff B, Ehrenstein GW. Failure mechanisms in SMC subjected to alternating stresses. J Mat Sci 1990; 25:4087-4097.
[14] Aymerich F, Priolo P. Characterization of a SMC material for bumper applications. Key Eng Mat 1998; 144:179-190.
[15] Wang SS, Suemasu H, Chim ESM. Analysis of fatigue damage evolution and associated anisotropic elastic property degradation in random short-fiber composite. Eng Frac Mech 1986; 25:829-844.
[16] Jiao GQ, Zheng ST, Suzuki M, Iwamoto M. Damage evaluation of sheet moulding compound composite by acoustic emission. Theoretical Appl Frac Mech 1990; 14:135-140.
Lundmark; PAPER VI
175
[17] Suzuki M, Jiao GQ. A study on damage growth of short fiber SMC composites in the case of quasi-static and tensile loading. VIInternational Congress on Experimental Mechanics. Vol. I, Portland, Oregon; USA; 6-10 June 1988. pp 344-349.
[18] Kabelka J, Hoffmann L, Ehrenstein GW, Damage process modeling on SMC. J Appl Pol Sci 1996; 62:181-198.
[19] Hashin Z, Rosen BW. The elastic moduli of fiber-reinforced materials. J Appl Mech 1964; 31:223-232.
[20] Hashin Z. Analysis of Composite Materials – a Survey. J Appl Mech 1983; 50:481-505.
[21] Lundmark P, Varna J. Constitutive relationships for damaged laminates in in-plane loading. Int J Dam Mech 2005; 14:235-259
[22] Data Sheet: SMC Roving R07EX1, Owens Corning, 2002.
[23] Lundmark P, Varna J. Sliding effect in shear-loaded laminates with transverse cracks in 90-layer. Accepted to Comp Sci Tech, 2005.
[24] Flaggs D.L. and M.H. Kural, Experimental determination of the in-situ transverse lamina strength in graphite/epoxy laminates, J Comp Mat 1982; 16: 103-115.
[25] Varna J, Joffe R, Akshantala NV and R Talreja, Damage in composite laminates with off-axis plies, Comp Sci Tech 1999; 59:2139-2147.