Analyzing Polemics Evolution from Twitter Streams Using ...
11
Analyzing Polemics Evolution from Twitter Streams Using Author-Based Social Networks Arnaud Quirin 1 , Roc´ ıo Abascal-Mena 2 , Florence S ` edes 3 1 Institut de Recherche en Informatique (IRIT), Universit ´ e Paul Sabatier de Toulouse, France 2 Universidad Aut´ onoma Metropolitana - Cuajimalpa, Mexico 3 Institut de Recherche en Informatique (IRIT), Universit ´ e Paul Sabatier de Toulouse, France [email protected], [email protected], [email protected] Abstract. The construction of social network graphs from online networks data has become nowadays a common track to analyze these data. Typical research questions in this domain are related to profile building, interest’s recommendation, and trending topics prediction. However, few work has been devoted to the analysis of the evolution of very short and unpredictable events, called polemics. Also, experts do not use tools coming from social network graphs analysis and classical graph theory for this analysis. In this way, this article shows that such analysis lead to a colossal amount of data collected from public social sources like Twitter. The main problem is collecting enough evidences about a non-predictable event, which requires capturing a complete history before and during the course of this event, and processing them. To cope with this problem, while waiting for an event, we captured social data without filtering it, which required more than a TB of disk space. Then, we conduct a time-related social network analysis. The first one is dedicated to the study of the evolution of the actor interactions, using time-series built from a total of 33 graph theory metrics. A Big Data pipeline allows us to validate these techniques on a complex dataset of 284 millions of tweets, analyzing 56 days of the Volkswagen scandal [12]. Keywords. Author-based social networks, social network analysis, topic evolution, Twitter microblogging website. 1 Introduction Nowadays, online social networks are a quite popular resource for connected people to express what is happening in the world and share their opinions about it. Defending specific opinions or positions often generates never-ending debates, sometimes attacks between disputants, especially for controversial topics. So, polemics arise naturally on large online media such as forums, social networks or microblogging websites. In our case, polemics is defined as the exchange occurring when different users speak about a specific and controversial topic in a short period of time. There are characterized by an aggressive attack on or refutation of the opinions or principles of another. There are also viewed as the art or practice of disputation or controversy [20]. During a polemic, the main theme of the discussion will not be reused over time. This is for us a key difference in comparison to a bursting or a trending topic, for which the same topic will attract new comments later, such as a famous actor or a large concert event. Analyzing such social data becomes a crucial aspect. Social networks create new opportunities for companies to interact with their customers through online campaigns and mining these Computación y Sistemas, Vol. 22, No. 1, 2018, pp. 35–45 ISSN 1405-5546 doi: 10.13053/CyS-22-1-2762
-
Upload
khangminh22 -
Category
Documents
-
view
4 -
download
0
Transcript of Analyzing Polemics Evolution from Twitter Streams Using ...

Analyzing Polemics Evolution from Twitter Streams UsingAuthor-Based Social Networks
Arnaud Quirin1, Rocıo Abascal-Mena2, Florence Sedes3
1 Institut de Recherche en Informatique (IRIT),Universite Paul Sabatier de Toulouse,
France
2 Universidad Autonoma Metropolitana - Cuajimalpa,Mexico
3 Institut de Recherche en Informatique (IRIT),Universite Paul Sabatier de Toulouse,
France
[email protected], [email protected], [email protected]
Abstract. The construction of social network graphsfrom online networks data has become nowadaysa common track to analyze these data. Typicalresearch questions in this domain are related to profilebuilding, interest’s recommendation, and trending topicsprediction. However, few work has been devotedto the analysis of the evolution of very short andunpredictable events, called polemics. Also, expertsdo not use tools coming from social network graphsanalysis and classical graph theory for this analysis. Inthis way, this article shows that such analysis lead toa colossal amount of data collected from public socialsources like Twitter. The main problem is collectingenough evidences about a non-predictable event, whichrequires capturing a complete history before and duringthe course of this event, and processing them. Tocope with this problem, while waiting for an event, wecaptured social data without filtering it, which requiredmore than a TB of disk space. Then, we conducta time-related social network analysis. The first oneis dedicated to the study of the evolution of the actorinteractions, using time-series built from a total of 33graph theory metrics. A Big Data pipeline allows us tovalidate these techniques on a complex dataset of 284millions of tweets, analyzing 56 days of the Volkswagenscandal [12].
Keywords. Author-based social networks, socialnetwork analysis, topic evolution, Twitter microbloggingwebsite.
1 Introduction
Nowadays, online social networks are a quitepopular resource for connected people to expresswhat is happening in the world and share theiropinions about it. Defending specific opinions orpositions often generates never-ending debates,sometimes attacks between disputants, especiallyfor controversial topics. So, polemics arisenaturally on large online media such as forums,social networks or microblogging websites. Inour case, polemics is defined as the exchangeoccurring when different users speak about aspecific and controversial topic in a short periodof time. There are characterized by an aggressiveattack on or refutation of the opinions or principlesof another. There are also viewed as the art orpractice of disputation or controversy [20]. Duringa polemic, the main theme of the discussion will notbe reused over time. This is for us a key differencein comparison to a bursting or a trending topic, forwhich the same topic will attract new commentslater, such as a famous actor or a large concertevent.
Analyzing such social data becomes a crucialaspect. Social networks create new opportunitiesfor companies to interact with their customersthrough online campaigns and mining these
Computación y Sistemas, Vol. 22, No. 1, 2018, pp. 35–45ISSN 1405-5546
doi: 10.13053/CyS-22-1-2762
data is increasingly common to support digitalmarketing initiatives as well as a variety of businessintelligence applications [18]. Social data canprovide a sharp view into trends in user interestsand behaviors, thus to guide governments andbusinesses to make “better” decisions.
Currently, social networks analysis techniquesare viewed as a typical tool to get insights aboutsocial data. However, up to our knowledge, fewattention has been dedicated to the applicabilityof this method to short-timed events, such as thepolemics.
In the current contribution, we propose atechnique based on classical Social NetworkAnalysis (SNA), to analyze author interactionsduring the timeline of a polemic. Our objective is toanswer the following research question: how canwe detect and predict common behaviors betweendifferent users taking part into a polemic, even ifthey have a different vocabulary? In this paper,we will be particularly interested by the questionof whether or not a predefined set of users orkeywords should be followed to detect a polemicin the tweets.
For this purpose, we collected data from tworeal time Twitter streams, before, during and aftera global and impacting event, the Volkswagenscandal occurred at the end of September 2015[12]. We mine them to understand the events andthen drivers which propagate the polemic, from itsearly starting point to its maximum peak and toits exhaustion. Due to the considerable amount ofdata, up to 1.5 TB, we relied on a Big Data pipelineto process them.
The structure of the current paper is as follows:in the next section, we review the current SNAtechniques to mine a large amount of data, as wellas the techniques used to study social behaviorin Twitter. The third section details our maincontribution, with the necessary steps to download,process and clean such amount of data. Inthe fourth section, we check which stream ofdata is most relevant to collect polemical tweets.The fifth section presents the Volkswagen casestudy. Finally, some concluding remarks and futureperspectives are pointed out in the last section.
2 Related Works
Mining polemics in Twitter, sometimes also calledtrending, hot [11], or bursting [3], topics in theliterature, is an increasing research question sincefew years. Typically, most propositions focus onthe detection of events. Atypical behaviors suchas natural disasters have been detected in Twitterusing probabilistic models [28, 29, 33]. Di Eugenioet al. [7], employed Natural Language Processing(NLP), and classifiers to detect life events suchas marriage, graduation, or birth in Twitter. Localevents can also have been detected in real timeby a clustering algorithm [3]. Guo et al., [11],proposed a frequent pattern recognition methodto track trending topics in Twitter streams. Mustoet al., [21], build hate maps based on a semanticanalysis of Twitter streams to identify risk zones inItaly. In the later case, Big Data techniques havebeen used to filter and process large amounts ofdata.
However, we found few papers going through theanalysis and the interpretation of Twitter streamscovering short events, which still seems to be afresh research topic. We could cite Lipizzi et al.,[18], who analyzed the structure of conversationsin Twitter following the launch of two commercialproducts. They only analyzed a three-day periodbut they show how concept maps, together witha time-slicing technique, help to study structuraldifferences between the conversations. Wu etal., [36] proposed a propagation model to trackpopular news in Twitter. This model can be usedto predict the final number of retweets of a pieceof information. In conclusion, we found no paperanalyzing short events with SNA techniques, whichis an established tool when dealing with largeamount of data. In this case, SNA techniqueshave emerged since a long time as tools incomputational sociology to model and analyze anincreasing amount of social phenomena. One oftheir main features is their ability to scale to verylarge and complex electronic datasets [5]. SNAapplied to large networks can help to representthe data, measure local and global properties ofthe network and have effectiveness visualizationtechniques in order to analyze data. However,it seems that the interpretation of the evolution
Computación y Sistemas, Vol. 22, No. 1, 2018, pp. 35–45ISSN 1405-5546doi: 10.13053/CyS-22-1-2762
Arnaud Quirin, Rocío Abascal-Mena, Florence Sédes36

of large-scale events through time is often easierwith new visualization techniques. For instance,Dork et al., [6] proposed Topic Streams, a kindof stacked area chart displaying the evolution oftopics in Twitter. We propose, also, a valuablecontribution in this domain with our social networkbased analysis.
3 Methodology
In this section, we describe our completemethodology from the data collection of the Twitterstreams and their preprocessing using a Big Datapipeline to the construction of time-related socialnetworks.
3.1 Background
Twitter is a microblogging website allowing usersto share short messages, up to 140 characters,called tweets. The main characteristic of Twitteris this short length, forcing users to summarizetheir opinions in a quick and essential way. Tweetscan wrap specific elements, namely the hashtags,which are words preceded by the symbol ’#’(called a pad). With them, it is possible to linkconversations to a common topic, and search andfilter them. Social media engagement statisticsfor 2017 show a staggering of 319 millions ofmonthly active Twitter users worldwide from 1stquarter 2010 to 4th quarter 2016 [27]. Social mediahas played an increasingly important role in socialparticipation by encouraging message exchangeand converting Twitter into a large space of debate.
3.2 Data Collection
Data have been collected using two real-time,public and free streams of tweets provided byTwitter. The first one, called statuses/sample[32], is a never-ending stream collecting 1% ofall tweets published globally. The second one,called statuses/filter [31], is a never-ending streamcollecting only the tweets containing a given set ofkeywords specified by the user. Twitter will deliverall the tweets matching the criteria, providing thattheir amount never exceeds the 1% of the tweetspublished globally.
The advantage of the filter stream is that wecan collect freely all the tweets relevant to a setof keywords: however, as this set has to be definedbefore connecting to the stream, it is not possibleto predict which set of keywords is relevant beforea polemic actually occurs.
All the data, for our research, was collectedcontinuously starting from September 11, 2015.From this, 1563 GB of data have been collected(in this case, the sample stream represents a 73% of the total). To ease the collection, storage andprocessing of this huge amount of data, an ApacheHadoop 1[26], pipeline has been used, based onFlume 2 to collect the tweets and the HadoopDistributed File System (HDFS), to store them.This pipeline is run on two nodes, each equippedwith 10 bi-core 1.6GHz AMD Opteron and 16 GB ofmemory. Sequential computation is performed ona cluster with 10 x 64-core 1.6GHz AMD OpteronCPUs with 512 GB of memory. Apache Hadoopand Flume are both free technologies from theApache Software Foundation.
3.3 Selected Fields
Table 1 shows the relevant fields we have selectedto perform our current study among the onesavailable from Twitter. Note that an additionalfield, namely lang, can be used to filter the tweetsaccording to their language, but is computedautomatically by Twitter, thus we did not use it here.
Table 1. List of relevant tweet fields
Field Descriptiontext Text of the tweetcreated at Publication datescreen name Authorentitites.user mentions List of user mentions
1The Apache Hadoop software library is a framework thatallows for the distributed processing of large data sets acrossclusters of computers using simple programming models.Available at: http://hadoop.apache.org/
2A distributed, reliable, and available service for efficientlycollecting, aggregating, and moving large amounts of streamingevent data. Available at: https://flume.apache.org/
Computación y Sistemas, Vol. 22, No. 1, 2018, pp. 35–45ISSN 1405-5546
doi: 10.13053/CyS-22-1-2762
Analyzing Polemics Evolution from Twitter Streams Using Author-Based Social Networks 37
3.4 Preprocessing
After the download of the tweets from their streamsand the extraction of their relevant fields, we keeponly the tweets containing a given keyword. Forthe sake of space, we study in this paper onlythe tweets containing volkswagen (independentlyof the case), for the sample stream. In the sec. 4.1we show that taking the other stream would bestatistically equivalent. We have filtered the tweetsby following these steps:
1. Converting stopwords and punctuation towhite spaces,
2. Eliminating any URLs (http, https, ftp, etc.),
3. Removing the mentions and the RT keyword,
4. Removing non-ASCII characters,
5. Converting the text in lowercase,
6. Tokenizing it, this means to convert the stringto a list of tokens based on white spaces.
As an example, the preprocessing step convertsthe following tweet: “RT: Great! This is a BeautifulDay @harry! http://webpage.com/” to the followinglist of three tokens: great, beautiful, and day.
4 Determining the Right Stream ofTweets to Use
In this section, we analyze which stream of tweetsis better to collect a relevant set of polemicaltweets. In the first study, we compared the sampleand the filter streams to determine if predefininga keyword before the data collection is relevant.In the second study, we demonstrate that workingwith a whole stream of data is more useful thanwith individual users. This is crucial to answer ourresearch question, as anticipating which users willpublish during a polemic regardless of the theme.
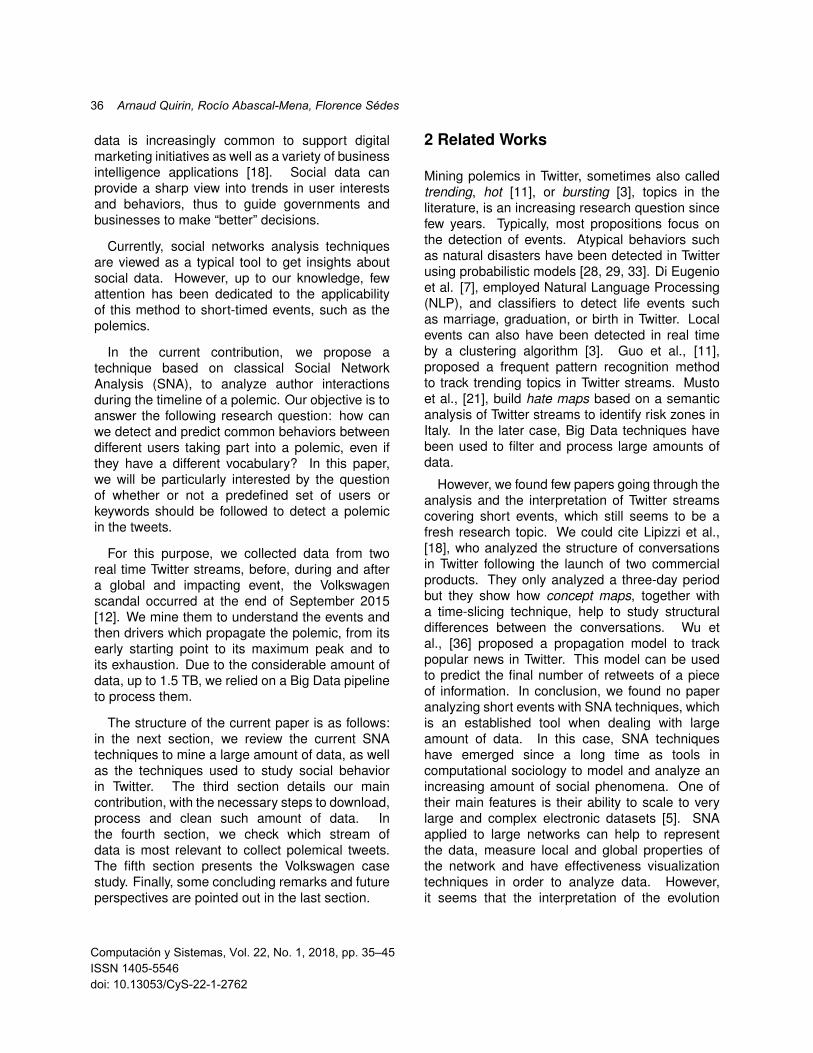
Fig. 1. Count of the number of collected tweetsfor the sample (in blue) and for the filtered (in red)streams, for different keywords: mecca, mecque (inFrench), refugiados (in Spanish), refugee (in English),and volkswagen. The count for the filtered stream hasbeen divided by 100 to reflect the fact that only 1% of thesample stream is available
4.1 Comparison of Both Streams
In Fig. 1, we compare the raw number of tweetscollected by the sample stream containing agiven keyword, with the raw number of tweetscollected by the filtered stream containing thesame keyword. We selected four keywords indifferent language: mecca (in English), mecque(in French), refugiados (refugee, in English), andvolkswagen. To reflect the fact that Twitter gives usonly 1% of the sample stream publicly, we dividedthe number of filtered tweets by 100. On thesedatasets, it is clear to see that both streams of dataare perfectly aligned, even though there are somelittle deviations due to the discretization.
This is an important assessment for us, becausewe can hypothesize both streams are consistent.If it would not be the case, probably the filteredstream would be a better source of data becauseit is not limited. However, due to the fact we can
Computación y Sistemas, Vol. 22, No. 1, 2018, pp. 35–45ISSN 1405-5546doi: 10.13053/CyS-22-1-2762
Arnaud Quirin, Rocío Abascal-Mena, Florence Sédes38
only collect a filtered stream after deciding whichkeywords are relevant during the configuration ofthe Twitter API, it would be very hard to use thissource to monitor the messages sent before or justafter the origin of the polemic. Having consistentstreams means that a passive collector of tweetscan not only provide a reliable source of datato compute relevant statistical metrics (at leastbased on the frequency), but we can plug it inmuch before the origin of the polemic, avoidingany loss of data. From now on, we considerthat any frequency-based statistics conducted onthe filtered stream, corresponding to all the tweetscontaining a given keyword, is still valid (by a scalarfactor), for the sample stream.
We can observe two quick surges in the caseof Mecca. It corresponds to the horrified reactionof people after a crane collapsed killing 111 people[2], the 11th of September 2015, and the stampedeincident, in the 2015 Hajj, killing at least 1470people [10], the 24th of September 2015. Inthe case of the refugees, we spotted a morecontinuous stream of tweets, as the news storieswere uninterrupted about this topic during all themonth of September 2015.
In Twitter, from the Volkswagen scandal case,we found numerous surges corresponding tothe never-ending bounces that this internationalevent generated. They correspond to theinitial announcement by the US EnvironmentalProtection Agency (EPA), to recall a large amountof cars (18/9/2015, see the bottom right of Fig. 1),the announcement by Volkswagen that 11 millionsdiesel cars worldwide have the same ”defeatdevice” (22/9/2015), the resignation of VolkswagenCEO Martin Winterkorn (23/9/2015), and thenomination of the new Volkswagen CEO MatthiasMuller (25/9/2015), [19].
4.2 Is it Necessary to Follow Single Users?
Currently, most studies based on Twitter considersingle users as their units of analysis [35, 17,15, 22, 13, 37, 16]. This allows to performprecise profiling on them, but this method mightnot be suitable to analyze unpredictable events.For instance, this method requires that a specificset of users to follow is predetermined before
the event occurs, which is impossible to do inpractice. Perhaps collecting a whole stream ofdata anticipating the event is better in this case.However, moving from a single-user analysis toa stream-analysis would mean shifting to a newparadigm of analysis. We study in this sectionits pertinence. To characterize the polemics andextract interesting features from them, we havestudied if it is relevant to follow and access thetweets of single users, which would be possibleusing another part of the Twitter API. Or, instead,by taking the filtered stream to discriminate thetweets only by their keywords. Note that thedownload of the tweets from single users is alengthy process, and Twitter limits its API to onlythe last 3200 tweets for each user [30].
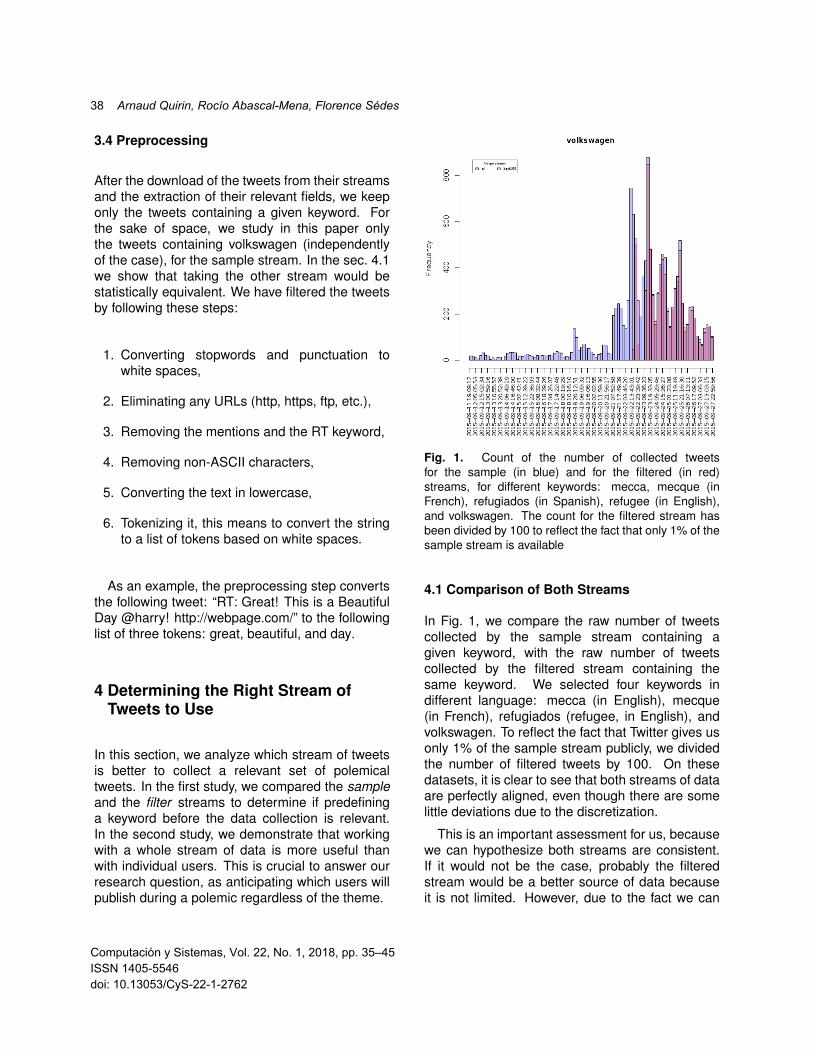
Fig. 2. For a given period P and for thevolkswagen-filtered stream, number of unique usersauthoring at least one tweet inside P (in blue), andnumber of common users authoring at least one tweetboth in period P and in the next one (in red). Exact valuesof both counts are shown in the top of each bar
So, we took a stream of tweets containing only agiven keyword (volkswagen), and sliced it in severalperiods of 24 hours covering the duration of thepolemic (see Fig. 2), so that no time-zone effectcould have biased the results. For each of these
Computación y Sistemas, Vol. 22, No. 1, 2018, pp. 35–45ISSN 1405-5546
doi: 10.13053/CyS-22-1-2762
Analyzing Polemics Evolution from Twitter Streams Using Author-Based Social Networks 39
periods P, we computed the number of uniqueusers who had published at least one tweet insideP (in blue) and the number of common users whohad published at least one tweet both in period Pand in the next one (in red). We observed that thenumber of common users are marginal comparedto the total number of users involved in a reactionfor this particular polemic (the maximum is at a3.8%), so consequently it seems that very fewusers participate in two consecutive days about aparticular event. This could be explained by thefact users, once their opinions are given (in Twitterat least, to specifically react to a new story, topost a caricature, etc), do not continuously feed thedebate. We conclude that it is not useful to followpredefined set of users and collect their tweets overtime.
We suggest, however, that it is still useful tofollow the evolution of the polemics over time byobserving short timed reactions of given usersin the flow of the collected data, but that suchinformation cannot be gathered easily by lookinginside the whole content of these user timelines.In fact, it seems easier to detect these users fromwhat they are publishing in the complete stream oftweets or by observing their behavior in the filteredstream. These sentinels, small group of usersgenerating the first tweets just before the polemicis inflating on the online network, are then moreeasily spotted. This is why we decided to configureour stream collector architecture, presented in theprevious sections of this article, to retrieve thekeywords and not the tweets of the users.
5 Case Study: Evolution ofAuthor-Based Social Networks in theVolkswagen Polemic
From this preprocessed data, we generate author-based social networks, in which the author of thetweet is represented for each node of the network.This is inspired from a previous work of Abascal-Mena et al. [1].
As we have a dataset for each day, we cangenerate as many author-based social networksand study the evolution of a polemic from twodifferent points of view. Both constructions use
their own way of selecting the nodes and the edgesto be included in the networks, and their ownvisualization techniques, because of the type ofinformation we want to emphasize.
5.1 Design of Author-Based Social Networks
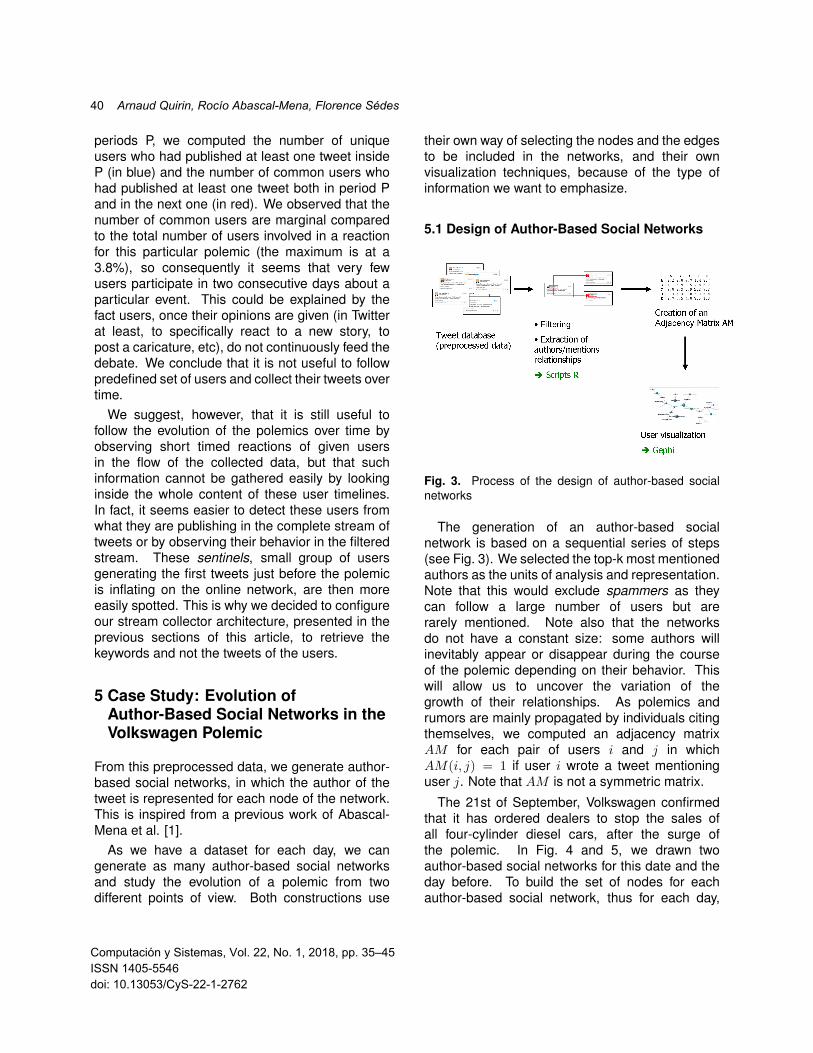
Fig. 3. Process of the design of author-based socialnetworks
The generation of an author-based socialnetwork is based on a sequential series of steps(see Fig. 3). We selected the top-k most mentionedauthors as the units of analysis and representation.Note that this would exclude spammers as theycan follow a large number of users but arerarely mentioned. Note also that the networksdo not have a constant size: some authors willinevitably appear or disappear during the courseof the polemic depending on their behavior. Thiswill allow us to uncover the variation of thegrowth of their relationships. As polemics andrumors are mainly propagated by individuals citingthemselves, we computed an adjacency matrixAM for each pair of users i and j in whichAM(i, j) = 1 if user i wrote a tweet mentioninguser j. Note that AM is not a symmetric matrix.
The 21st of September, Volkswagen confirmedthat it has ordered dealers to stop the sales ofall four-cylinder diesel cars, after the surge ofthe polemic. In Fig. 4 and 5, we drawn twoauthor-based social networks for this date and theday before. To build the set of nodes for eachauthor-based social network, thus for each day,
Computación y Sistemas, Vol. 22, No. 1, 2018, pp. 35–45ISSN 1405-5546doi: 10.13053/CyS-22-1-2762
Arnaud Quirin, Rocío Abascal-Mena, Florence Sédes40
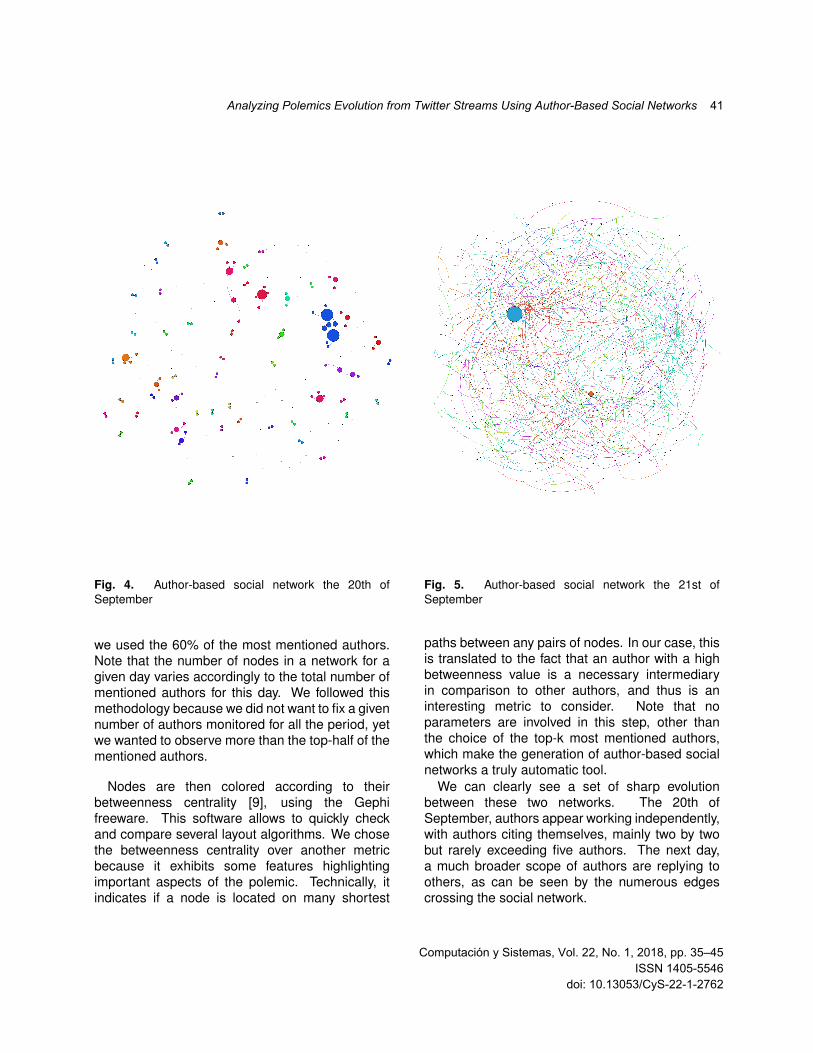
Fig. 4. Author-based social network the 20th ofSeptember
we used the 60% of the most mentioned authors.Note that the number of nodes in a network for agiven day varies accordingly to the total number ofmentioned authors for this day. We followed thismethodology because we did not want to fix a givennumber of authors monitored for all the period, yetwe wanted to observe more than the top-half of thementioned authors.
Nodes are then colored according to theirbetweenness centrality [9], using the Gephifreeware. This software allows to quickly checkand compare several layout algorithms. We chosethe betweenness centrality over another metricbecause it exhibits some features highlightingimportant aspects of the polemic. Technically, itindicates if a node is located on many shortest
Fig. 5. Author-based social network the 21st ofSeptember
paths between any pairs of nodes. In our case, thisis translated to the fact that an author with a highbetweenness value is a necessary intermediaryin comparison to other authors, and thus is aninteresting metric to consider. Note that noparameters are involved in this step, other thanthe choice of the top-k most mentioned authors,which make the generation of author-based socialnetworks a truly automatic tool.
We can clearly see a set of sharp evolutionbetween these two networks. The 20th ofSeptember, authors appear working independently,with authors citing themselves, mainly two by twobut rarely exceeding five authors. The next day,a much broader scope of authors are replying toothers, as can be seen by the numerous edgescrossing the social network.
Computación y Sistemas, Vol. 22, No. 1, 2018, pp. 35–45ISSN 1405-5546
doi: 10.13053/CyS-22-1-2762
Analyzing Polemics Evolution from Twitter Streams Using Author-Based Social Networks 41
To obtain a better insight about this phenome-non, we computed specific network-based metricsto detect specific features, such as local maxima,and relate them to the original polemic. Forinstance, specific network-based metrics couldincorporate a spam-detection algorithm whichwould combine classical spam detection by textanalysis and scores computed from the friendsof a given user. This kind of analysis would nothave been possible without the use of graph-basedrepresentations. One of the best candidate wefound that could be a good indicator to detectpolemic in the real world was the number ofcommunities, as we will see in the next section.
5.2 Evolution of Author-Based Social Networks
In order to get more insights from theseauthors-based social networks, one way to do itwould be to convert them into time-series, enablingtheir analysis with more traditional tools suchas signal processing, or social signal processingwhich is still an emerging topic [25, 34]. This way,further processing of the signals, to detect localmaxima, duration of the maxima and the gaps,can easily be performed automatically. We areparticularly interested of any metric highlightingthe most important heartbeats of the polemic,which occurred the 22nd of September with theinitial recognition by Volkswagen of the presenceof defeat devices, and the 23rd of September withthe resignation of CEO Martin Winterkorn.
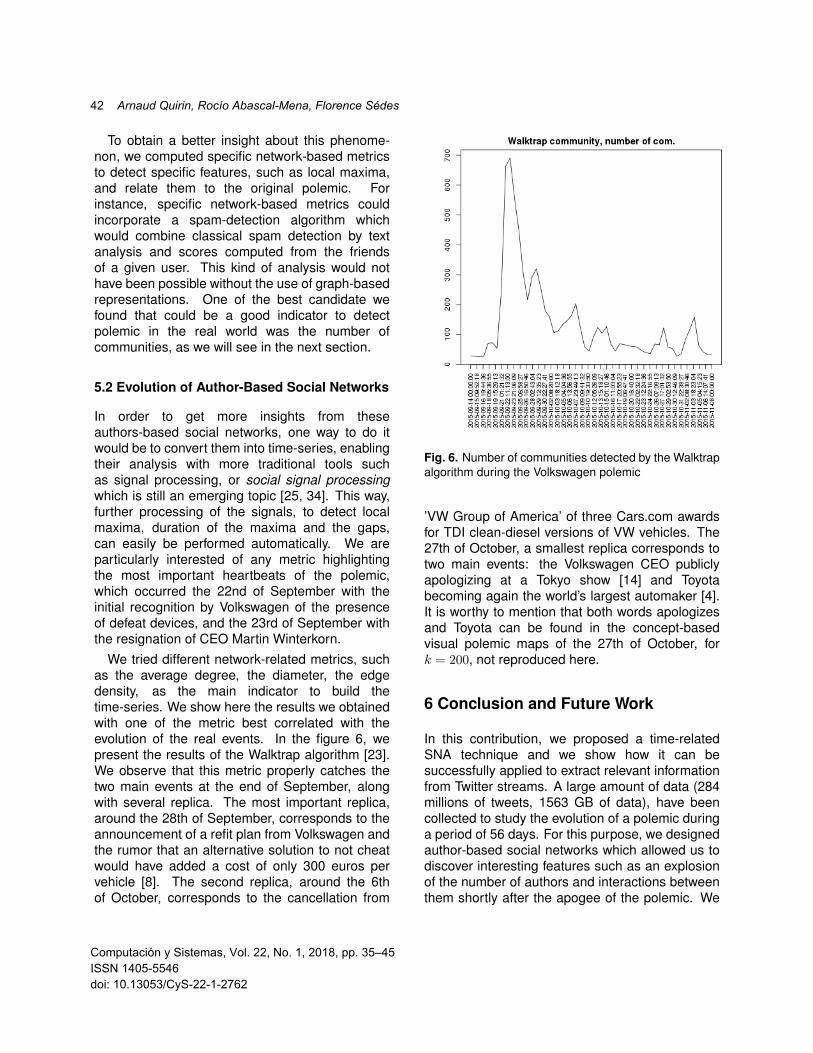
We tried different network-related metrics, suchas the average degree, the diameter, the edgedensity, as the main indicator to build thetime-series. We show here the results we obtainedwith one of the metric best correlated with theevolution of the real events. In the figure 6, wepresent the results of the Walktrap algorithm [23].We observe that this metric properly catches thetwo main events at the end of September, alongwith several replica. The most important replica,around the 28th of September, corresponds to theannouncement of a refit plan from Volkswagen andthe rumor that an alternative solution to not cheatwould have added a cost of only 300 euros pervehicle [8]. The second replica, around the 6thof October, corresponds to the cancellation from
Fig. 6. Number of communities detected by the Walktrapalgorithm during the Volkswagen polemic
’VW Group of America’ of three Cars.com awardsfor TDI clean-diesel versions of VW vehicles. The27th of October, a smallest replica corresponds totwo main events: the Volkswagen CEO publiclyapologizing at a Tokyo show [14] and Toyotabecoming again the world’s largest automaker [4].It is worthy to mention that both words apologizesand Toyota can be found in the concept-basedvisual polemic maps of the 27th of October, fork = 200, not reproduced here.
6 Conclusion and Future Work
In this contribution, we proposed a time-relatedSNA technique and we show how it can besuccessfully applied to extract relevant informationfrom Twitter streams. A large amount of data (284millions of tweets, 1563 GB of data), have beencollected to study the evolution of a polemic duringa period of 56 days. For this purpose, we designedauthor-based social networks which allowed us todiscover interesting features such as an explosionof the number of authors and interactions betweenthem shortly after the apogee of the polemic. We
Computación y Sistemas, Vol. 22, No. 1, 2018, pp. 35–45ISSN 1405-5546doi: 10.13053/CyS-22-1-2762
Arnaud Quirin, Rocío Abascal-Mena, Florence Sédes42
further used these networks as a base to buildtime-series using classical graph theory metrics.They clearly exhibit some recognizable patternssuch as peaks when the press had something newto tell and users reacted to it. Finally, we shownthat it is not useful to follow predefined set of usersand collect their tweets over time.
Our methodology is scalable and did not sufferfrom massive load of data. It is worthy to note thatthe processing of the data is fully automatic andrequire very few parameters, which is simply thenumber of nodes (top-k most mentioned authors),we keep in the final representation. Many parts ofthe technique is generic (such as the co-citationmetric we used) and can be customized for otheruse.
However, we are still in the edge of a world ofresearch questions still unresolved. We plan todiscover if our representation has any predictabilitypower: is it possible to predict when a polemic willreach a peak, given the history of the time-series?This may depends on time-series of other events,as well as the weight of these events (importance).Could these values be combined with the otherTwitter fields, such as the profile of the authors(number of published tweets, friends count, etc.)to improve the accuracy of this prediction? Thiscould have a particular value for social marketingcompanies. How to filter or remove spammers?Probably, how they interact with their friends andthe variance of the user profile creation datescould be a clue for this question. Monitoring inparallel other social networks is also an interestingtopic. Finally, we plan to apply on the topof these networks Graph-Based Data Mining(GBDM), techniques [24], to get even more insightsfrom this pile of data.
Acknowledgements
The author of the paper, Arnaud Quirin, is fundedby the Xunta de Galicia, including funding fromthe operative program FSE Galicia 2007-2013,under the grant agreement IN809A 19/2015.Experiments presented in this paper were carriedout using the OSIRIM platform that is administeredby IRIT and supported by CNRS, the RegionMidi-Pyrenees, the French Government, and
ERDF (http://osirim.irit.fr/site/en). We thank alsothe responsibles of the Hadoop Cluster of theBlagnac IUT School to make their architectureavailable for this project. Finally, we thank our tworeviewers for their interesting suggestions allowingus to improve the quality of this paper.
References
1. Abascal-Mena, R., Lema, R., & Sedes, F.(2014). From tweet to graph: Social networkanalysis for semantic information extraction. IEEEInternational Conference on Research Challengesin Information Science (RCIS 2014), Marrakesh(Morocco), pp. 1–10.
2. Batrawy, A. (2015). Pilgrims Traumatized,Asking How Mecca Crane Could Collapse.https://tinyurl.com/kxbxqnv. [Online; accessed8/3/2017].
3. Boettcher, A. & Lee, D. (2012). Eventradar: Areal-time local event detection scheme using twitterstream. Green Computing and Communications(GreenCom), 2012 IEEE International Conferenceon, IEEE, Besancon (France), pp. 358–367.
4. Box, T. (2015). Toyota once again world’slargest automaker. https://tinyurl.com/mj7rvw5.[Online; accessed 8/3/2017].
5. Butts, C. T. (2008). Social network analysis: Amethodological introduction. Asian Journal of SocialPsychology, Vol. 11, No. 1, pp. 13–41.
6. Dork, M., Gruen, D., Williamson, C., &Carpendale, S. (2010). A visual backchannel forlarge-scale events. Visualization and ComputerGraphics, IEEE Transactions on, Vol. 16, No. 6,pp. 1129–1138.
7. Eugenio, B. D., Green, N., & Subba, R. (2013).Detecting life events in feeds from twitter. 2013 IEEESeventh International Conference on SemanticComputing, IEEE, Irvine (CA), pp. 274–277.
8. Europe, A. N. (2015). Bosch warned VW aboutillegal software use in diesel cars, report says.https://tinyurl.com/nnylduq. [Online; accessed8/3/2017].
9. Freeman, L. C. (1977). A set of measuresof centrality based on betweenness. Sociometry,Vol. 40, No. 1, pp. 35–41.
10. Gambrell, J. (2015). Saudi crush was deadliesthajj tragedy ever. https://tinyurl.com/l43mgfu.[Online; accessed 8/3/2017].
Computación y Sistemas, Vol. 22, No. 1, 2018, pp. 35–45ISSN 1405-5546
doi: 10.13053/CyS-22-1-2762
Analyzing Polemics Evolution from Twitter Streams Using Author-Based Social Networks 43
11. Guo, J., Zhang, P., & Guo, L. (2012). Mininghot topics from twitter streams. Procedia ComputerScience, Vol. 9, pp. 2008–2011.
12. Hotten, R. (2015). Volkswagen: The scandalexplained. http://www.bbc.com/news/
business-34324772.
13. Huang, X., Yang, Y., Hu, Y., Shen, F., & Shao, J.(2016). Dynamic user attribute discovery on socialmedia. Asia-Pacific Web Conference, Springer,pp. 256–267.
14. Kageyama, Y. (2015). Volkswagen chief execu-tive apologizes for emissions scandal at Tokyoauto show. https://tinyurl.com/m4ghw4g. [On-line; accessed 8/3/2017].
15. Kim, E. D.-j., Keng, B. J.-l., & Padmanabhan,K. (2016). Systems and methods for dynamicallydetermining influencers in a social data networkusing weighted analysis. US Patent 9,262,537.
16. Kooti, F., Moro, E., & Lerman, K. (2016).Twitter session analytics: Profiling users’ short-termbehavioral changes. International Conference onSocial Informatics, Springer, pp. 71–86.
17. Lampos, V., Aletras, N., Geyti, J. K., Zou, B.,& Cox, I. J. (2016). Inferring the socioeconomicstatus of social media users based on behaviourand language. European Conference on InformationRetrieval, Springer, pp. 689–695.
18. Lipizzi, C., Iandoli, L., & Marquez, J. E. R.(2015). Extracting and evaluating conversationalpatterns in social media: A socio-semantic analysisof customers’ reactions to the launch of newproducts using twitter streams. International Journalof Information Management, Vol. 35, No. 4,pp. 490–503.
19. Mays, K. (2015). VW Diesel Crisis: Timelineof Events. https://tinyurl.com/lwg4ret. [Online;accessed 8/3/2017].
20. Merriam-Webster (2017). Merriam-WebsterDictionary. https://www.merriam-webster.
com/dictionary/polemic/. [Online; accessed15/3/2017].
21. Musto, C., Semeraro, G., Lops, P., & de Gemmis,M. (2015). Crowdpulse: A framework for real-timesemantic analysis of social streams. InformationSystems, Vol. 54, No. C, pp. 127–146.
22. Piao, G. & Breslin, J. G. (2016). Exploringdynamics and semantics of user interests foruser modeling on twitter for link recommendations.
Proceedings of the 12th International Conference onSemantic Systems, ACM, pp. 81–88.
23. Pons, P. & Latapy, M. (2006). Computingcommunities in large networks using random walks.Journal of Graph Algorithms and Applications,Vol. 10, No. 2, pp. 191–218.
24. Quirin, A., Cordon, O., Vargas-Quesada, B., &de Moya-Anegon, F. (2010). Graph-based datamining: A new tool for the analysis and comparisonof scientific domains represented as scientograms.Journal of Informetrics, Vol. 4, No. 3, pp. 291–312.
25. Shuman, D., Narang, S. K., Frossard, P., Ortega,A., & Vandergheynst, P. (2013). The emergingfield of signal processing on graphs: Extendinghigh-dimensional data analysis to networks and ot-her irregular domains. Signal Processing Magazine,IEEE, Vol. 30, No. 3, pp. 83–98.
26. Shvachko, K., Kuang, H., Radia, S., & Chansler,R. (2010). The hadoop distributed file system.Proceedings of the 26th IEEE Symposium on MassStorage Systems and Technologies (MSST 2010),IEEE, Incline Village, NV, pp. 1–10.
27. Statista (2017). Social networks. https://www.
statista.com/topics/1164/social-networks/.[Online; accessed 8/3/2017].
28. Takahashi, B., Tandoc, E. C., & Carmichael, C.(2015). Communicating on twitter during a disaster:An analysis of tweets during typhoon haiyan in thephilippines. Computers in Human Behavior, Vol. 50,pp. 392–398.
29. Takahashi, T., Tomioka, R., & Yamanishi, K.(2014). Discovering emerging topics in socialstreams via link-anomaly detection. Knowledge andData Engineering, IEEE Transactions on, Vol. 26,No. 1, pp. 120–130.
30. Twitter (2015). GET statuses/user timeline.https://dev.twitter.com/rest/reference/
get/statuses/user_timeline. [Online; accessed8/3/2017].
31. Twitter (2015). Statuses/filter. https://dev.
twitter.com/streaming/reference/post/
statuses/filter. [Online; accessed 8/3/2017].
32. Twitter (2015). Statuses/sample. https:
//dev.twitter.com/streaming/reference/get/
statuses/sample. [Online; accessed 8/3/2017].
33. Vigliotti, M. G. & Hankin, C. (2015). Discovery ofanomalous behaviour in temporal networks. SocialNetworks, Vol. 41, pp. 18–25.
Computación y Sistemas, Vol. 22, No. 1, 2018, pp. 35–45ISSN 1405-5546doi: 10.13053/CyS-22-1-2762
Arnaud Quirin, Rocío Abascal-Mena, Florence Sédes44
34. Vinciarelli, A., Pantic, M., & Bourlard, H. (2009).Social signal processing: Survey of an emergingdomain. Image and Vision Computing, Vol. 27,No. 12, pp. 1743–1759.
35. Wei, W., Joseph, K., Liu, H., & Carley, K. M.(2016). Exploring characteristics of suspendedusers and network stability on twitter. SocialNetwork Analysis and Mining, Vol. 6, No. 1, pp. 51.
36. Wu, B. & Shen, H. (2015). Analyzing and predicting
news popularity on twitter. International Journal ofInformation Management, Vol. 35, No. 6, pp. 702–711.
37. Zarrinkalam, F., Fani, H., Bagheri, E., &Kahani, M. (2016). Inferring implicit topical interestson twitter. European Conference on InformationRetrieval, Springer, pp. 479–491.
Article received on 27/03/2017; accepted on 30/06/2017.Corresponding author is Arnaud Quirin.
Computación y Sistemas, Vol. 22, No. 1, 2018, pp. 35–45ISSN 1405-5546
doi: 10.13053/CyS-22-1-2762
Analyzing Polemics Evolution from Twitter Streams Using Author-Based Social Networks 45